
University of Cape Town
184
THE IMPACT OF ADVERTISING CONTROLLABLE ELEMENTS ON CONSUMERS’ ATTITUDE TOWARDS THE ADVERTISEMENT, BRAND AND PURCHASE INTENTION SUHAILA ARSHAD (ARSSUH001) Thesis submitted in fulfilment of the requirements for the degree of Master of Commerce in Marketing at the University of Cape Town SUPERVISOR: NKOSIVILE MADINGA School of Management Studies University of Cape Town University of Cape Town
-
Upload
khangminh22 -
Category
Documents
-
view
1 -
download
0
Transcript of University of Cape Town

THE IMPACT OF ADVERTISING CONTROLLABLE ELEMENTS ON
CONSUMERS’ ATTITUDE TOWARDS THE ADVERTISEMENT, BRAND AND
PURCHASE INTENTION
SUHAILA ARSHAD
(ARSSUH001)
Thesis submitted in fulfilment of the requirements for the degree
of Master of Commerce in Marketing at the University of Cape Town
SUPERVISOR: NKOSIVILE MADINGA
School of Management Studies
University of Cape Town
Universi
ty of
Cape T
own

The copyright of this thesis vests in the author. No quotation from it or information derived from it is to be published without full acknowledgement of the source. The thesis is to be used for private study or non-commercial research purposes only.
Published by the University of Cape Town (UCT) in terms of the non-exclusive license granted to UCT by the author.
Universi
ty of
Cape T
own

DECLARATION
1. This dissertation has been submitted to Turnitin (or equivalent similarity and originality
checking software) and I confirm that my supervisor has seen my report and any concerns
revealed by such have been resolved with my supervisor.
2. I certify that I have received Ethics approval (if applicable) from the Commerce Ethics
Committee.
3. This work has not been previously submitted in whole, or in part, for the award of any
degree in this or any other university. It is my own work. Each significant contribution to,
and quotation in, this dissertation from the work, or works of other people has been
attributed, and has been cited and referenced.
Student number ARSSUH001
Student name Suhaila Arshad
Signature of Student
Date: 07 October 2020

LETTER FROM THE LANGUAGE EDITOR
Signature Removed

ACKNOWLEDGEMENT
My deepest appreciation to my supervisor, Mr Nkosivile Madinga, whose knowledge,
comments and feedback guided and enriched the substance of my study.
A heartfelt thank you to Dr Eugine Maziriri of the Free State University for his expert
assistance and advice pertaining to the Structural Equation Modelling analysis in this study.
I also wish to express gratitude to my mother, husband, sisters and friends for the support
shown to me in numerous ways throughout the process of this study. The words of
encouragement, comfort, patience and generosity extended were very much appreciated. Thank
you also to all the participants who responded to this study.

DEDICATION
I dedicate this thesis
to my late father and
my children; Haziq, Alyssa and Arianna.

i
ABSTRACT
Downstream fuel retailing among the major players in South Africa is highly competitive, and
further compounded by the emergence of new players and changing customer orientation under
the current price regulation environment. Marketing of fuel by way of expanding geographical
coverage and the distribution network is no longer sustainable. Advertising benefits fuel
companies by communicating their value proposition for brand differentiation, swaying
consumer perception of fuel as a low involvement commodity with no difference in quality,
and ultimately influencing their attitudes and behaviour. Fuel companies can take advantage of
the advertising elements that have direct bearing – and are within their control – to make
impactful advertisements to attract customers. Thus, this study investigates the influence of
advertising controllable elements – namely, source and message – on attitude towards the
advertisement, as well as attitude towards the brand and subsequently on purchase intention. A
sample of 201 respondents was selected using convenience sampling method. The data was
collected using an online self-administered questionnaire. Data analysis was performed using
the Statistical Package for Social Sciences (SPSS) version 26.0. The relationship between the
independent and the dependent variables was then examined using Structural Equation
Modelling (SEM) with Analysis of Moment Structures (AMOS) version 26.0. The study
findings established that attitude towards the advertisement is positively and significantly
influenced by source credibility, source likeability and emotional message. Rational message
has a positive impact on attitude towards the advertisement, albeit insignificant. Meanwhile,
only source credibility and rational message have positive significant effects on attitude
towards the brand. The impact of source likeability on brand attitude although positive, is not
significant. Contrariwise, emotional message has neither influence nor significant effect on
attitude towards the brand. Moreover, the study findings showed that while attitude towards
the advertisement positively influences brand attitude, it does not influence purchase intention.
The purchase intention for fuel is nonetheless influenced by attitude towards the brand. This
study offers useful insights that can be used to create an impactful fuel advertisement,
leveraging on source attributes and message appeals to influence consumers’ attitudinal as well
as behavioural intention.
Keywords: fuel advertising, advertising controllable elements, attitude towards advertisement,
attitude towards brand, purchase intention

ii
TABLE OF CONTENTS
CHAPTER ONE ...................................................................................................................... 1
1.1 INTRODUCTION ........................................................................................................... 1
1.2 RESEARCH AIM, QUESTIONS AND OBJECTIVES ............................................... 4
1.2.1 RESEARCH AIM ................................................................................................................. 4
1.2.2 RESEARCH QUESTIONS ..................................................................................................... 4
1.2.3 RESEARCH OBJECTIVES .................................................................................................... 5
1.3 LITERATURE REVIEW AND HYPOTHESES DEVELOPMENT .......................... 5
1.3.1 THE CONCEPT OF ADVERTISING ........................................................................................ 5
1.3.2 ADVERTISING ELEMENTS .................................................................................................. 6
1.3.3 ATTITUDE ........................................................................................................................ 7
1.3.4 PURCHASE INTENTION ...................................................................................................... 9
1.3.5 OVERVIEW OF SOUTH AFRICA OIL INDUSTRY ..................................................................... 9
1.3.6 CONCEPTUAL FRAMEWORK ............................................................................................ 10
1.4 RESEARCH DESIGN AND METHODOLOGY ....................................................... 11
1.4.1 RESEARCH DESIGN ......................................................................................................... 11
1.4.2 RESEARCH PARADIGM .................................................................................................... 12
1.4.3 RESEARCH APPROACH .................................................................................................... 12
1.4.4 SAMPLING DESIGN ......................................................................................................... 12
1.4.5 TARGET POPULATION ..................................................................................................... 13
1.4.6 SAMPLE SIZE .................................................................................................................. 13
1.4.7 SAMPLING METHOD........................................................................................................ 13
1.4.8 DATA COLLECTION METHOD ........................................................................................... 13
1.4.9 THE MEASUREMENT INSTRUMENT ................................................................................... 14
1.4.10 RELIABILITY AND VALIDITY OF MEASUREMENT INSTRUMENT ............................................. 14
1.4.11 DATA ANALYSIS .............................................................................................................. 15
1.5 CONTRIBUTION OF RESEARCH ............................................................................ 15
1.6 LIMITATIONS OF THE STUDY ................................................................................ 16
1.7 ETHICAL CONSIDERATION .................................................................................... 16
1.8 STRUCTURE OF THE THESIS .................................................................................. 17
1.9 CHAPTER SUMMARY................................................................................................ 18

iii
CHAPTER 2 ........................................................................................................................... 19
2.1 INTRODUCTION ......................................................................................................... 19
2.2 MARKETING COMMUNICATION .......................................................................... 19
2.3 ADVERTISING DEFINED .......................................................................................... 22
2.3.1 BENEFITS OF ADVERTISEMENTS ...................................................................................... 25
2.3.2 LIMITATIONS OF ADVERTISEMENTS.................................................................................. 25
2.4 ADVERTISING ELEMENTS ...................................................................................... 26
2.4.1 ADVERTISING SOURCE .................................................................................................... 27
2.4.2 ADVERTISING MESSAGE .................................................................................................. 31
2.4.3 ADVERTISING CHANNEL .................................................................................................. 35
2.5 ATTITUDE .................................................................................................................... 38
2.5.1 ATTITUDE TOWARDS THE ADVERTISEMENT (ATA) ............................................................ 39
2.5.2 ATTITUDE TOWARDS THE BRAND (ATB) .......................................................................... 41
2.6 PURCHASE INTENTION............................................................................................ 43
2.7 OVERVIEW OF SOUTH AFRICA OIL INDUSTRY ............................................... 44
2.7.1 FUEL RETAILING INDUSTRY IN SOUTH AFRICA ................................................................. 45
2.7.2 PARADIGM SHIFT IN FUEL MARKETING ............................................................................ 47
2.7.3 ADVERTISING IN FUEL INDUSTRY ..................................................................................... 47
2.8 CHAPTER SUMMARY................................................................................................ 49
CHAPTER 3 ........................................................................................................................... 50
3.1 INTRODUCTION ......................................................................................................... 50
3.2 RESEARCH PARADIGM ............................................................................................ 50
3.2.1. CONSTRUCTIVISM OR INTERPRETIVISM ............................................................................ 51
3.2.2. TRANSFORMATIVE .......................................................................................................... 51
3.2.3. PRAGMATISM ................................................................................................................. 51
3.2.4. POSITIVISM .................................................................................................................... 52
3.3 RESEARCH DESIGN ................................................................................................... 52
3.3.1. EXPLORATORY RESEARCH .............................................................................................. 53
3.3.2. CAUSAL RESEARCH ........................................................................................................ 54
3.3.3. DESCRIPTIVE RESEARCH ................................................................................................ 54
3.4 RESEARCH APPROACH............................................................................................ 55
3.4.1 QUALITATIVE APPROACH ................................................................................................ 56
3.4.2. QUANTITATIVE APPROACH .............................................................................................. 57
3.4.3 MIXED METHOD APPROACH............................................................................................ 57

iv
3.5 SAMPLING DESIGN AND PROCEDURE ................................................................ 58
3.5.1 TARGET POPULATION ..................................................................................................... 58
3.5.2 SAMPLING METHOD........................................................................................................ 59
3.5.3 SAMPLE SIZE ................................................................................................................. 62
3.6 DATA COLLECTION METHOD ............................................................................... 63
3.6.1 STRUCTURE OF THE QUESTIONNAIRE .............................................................................. 63
3.6.2 MEASUREMENT AND SCALE EMPLOYED IN THE QUESTIONNAIRE ....................................... 65
3.6.3 LAYOUT OF THE QUESTIONNAIRE .................................................................................... 67
3.6.4 PRE AND PILOT TESTING THE QUESTIONNAIRE ................................................................. 68
3.6.5 ADMINISTRATION OF THE QUESTIONNAIRE ...................................................................... 69
3.7 MANAGEMENT OR PREPARATION OF DATA.................................................... 70
3.7.1 DATA CLEANING AND EDITING ........................................................................................ 70
3.7.2 DATA CODING ................................................................................................................ 70
3.7.3 TABULATION .................................................................................................................. 71
3.8 STATISTICAL ANALYSIS ......................................................................................... 71
3.8.1 FREQUENCY DISTRIBUTION ANALYSIS .............................................................................. 71
3.8.2 DESCRIPTIVE STATISTICS ANALYSIS .................................................................................. 72
3.8.3 RELIABILITY AND VALIDITY OF MEASUREMENT INSTRUMENT ANALYSIS .............................. 74
3.8.4 STRUCTURAL EQUATION MODELLING (SEM) .................................................................. 76
3.9 INTERPRETATION OF DATA .................................................................................. 80
3.10 ETHICAL CONSIDERATION .................................................................................... 80
3.11 CHAPTER SUMMARY................................................................................................ 80
CHAPTER 4 ........................................................................................................................... 82
4.1. INTRODUCTION ......................................................................................................... 82
4.2. PILOT TEST RESULTS ............................................................................................... 82
4.3. DATA GATHERING PROCESS ................................................................................. 84
4.4. PRELIMINARY DATA ANALYSIS ........................................................................... 84
4.4.1. DATA CLEANING AND EDITING ........................................................................................ 84
4.4.2. DATA CODING ................................................................................................................ 85
4.4.3. TABULATION OF VARIABLES ............................................................................................ 86
4.5. DEMOGRAPHIC AND OTHER CONTEXTUAL INFORMATION...................... 87
4.5.1. SAMPLE DESCRIPTION .................................................................................................... 88
4.5.2. CHANNEL UTILISATION / TIME SPEND .............................................................................. 90
4.5.3. FUEL ADVERTISEMENT EXPOSED TO AND THE MEDIUM THAT CARRY THE FUEL AD ............. 93
4.5.4. FUEL BRAND CHOICE ..................................................................................................... 95

v
4.6. DESCRIPTIVE STATISTICAL ANALYSIS ............................................................. 97
4.7. RELIABILITY AND VALIDITY ANALYSIS ......................................................... 100
4.7.1. RELIABILITY ANALYSIS .................................................................................................. 101
4.7.2. VALIDITY ANALYSIS ....................................................................................................... 102
4.8. STRUCTURAL EQUATION MODELLING ........................................................... 103
4.8.1. MEASUREMENT MODEL / CONFIRMATORY FACTOR ANALYSIS (CFA) SPECIFICATION ...... 103
4.8.2. MEASUREMENT MODEL IDENTIFICATION ....................................................................... 105
4.8.3. MEASUREMENT MODEL ESTIMATION ............................................................................. 105
4.8.4. FIT INDICES FOR THE MEASUREMENT MODEL ................................................................ 105
4.8.5. SEM MODEL FIT ANALYSIS ............................................................................................ 106
4.8.6. THE STRUCTURAL MODEL PATH ANALYSIS ...................................................................... 107
4.8.7. HYPOTHESES TESTING .................................................................................................. 109
4.9. CHAPTER SUMMARY.............................................................................................. 113
CHAPTER 5 ......................................................................................................................... 115
5.1 INTRODUCTION ....................................................................................................... 115
5.2 OVERVIEW OF STUDY ............................................................................................ 115
5.3 MAIN FINDINGS OF THE STUDY .......................................................................... 117
5.4 CONTRIBUTION OF THE STUDY ......................................................................... 122
5.4.1 THEORETICAL OR CONCEPTUAL CONTRIBUTION ............................................................ 122
5.4.2 MANAGERIAL OR PRACTICAL CONTRIBUTION ................................................................. 123
5.5 RECOMMENDATIONS ............................................................................................ 124
5.6 LIMITATIONS AND FUTURE RESEARCH .......................................................... 128
5.7 CONCLUDING REMARKS ...................................................................................... 129
BIBLIOGRAPHY ................................................................................................................ 131
ANNEXURE A ..................................................................................................................... 155
ANNEXURE B ..................................................................................................................... 156
ANNEXURE C ..................................................................................................................... 157
ANNEXURE D ..................................................................................................................... 159
ANNEXURE E ..................................................................................................................... 162

vi
ANNEXURE F ..................................................................................................................... 164
ANNEXURE G ..................................................................................................................... 165
ANNEXURE H ..................................................................................................................... 166
ANNEXURE I ...................................................................................................................... 167
ANNEXURE J ...................................................................................................................... 168
ANNEXURE K ..................................................................................................................... 169
ANNEXURE L ..................................................................................................................... 170

vii
LIST OF TABLES
Table 2.1 Models of the response process related to advertising ............................................ 24
Table 2.2 The message strategies in relation to components of attitudes ................................ 31
Table 2.3 South Africa advertising expenditure by media ...................................................... 36
Table 3.1 Different research designs ....................................................................................... 53
Table 3.2 Difference between qualitative, quantitative and mixed approaches....................... 55
Table 3.3 Sampling methods and techniques ........................................................................... 60
Table 3.4 Dimensions used in questionnaire ........................................................................... 64
Table 3.5 Descriptive statistics for types of scales .................................................................. 65
Table 3.6 Questionnaire structure, format, scales and layout .................................................. 67
Table 3.7 Indices for model evaluation.................................................................................... 78
Table 4.1 Summary of pilot test results ................................................................................... 83
Table 4.2 Coding information .................................................................................................. 85
Table 4.3 Frequency table for the scaled response data (non-categorical) .............................. 86
Table 4.4 Descriptive statistical analysis results...................................................................... 98
Table 4.5 Accuracy statistics analysis for the model ............................................................. 100
Table 4.6 Inter-construct correlation matrix .......................................................................... 103
Table 4.7 Measurement model fit indices .............................................................................. 105
Table 4.8 SEM model fit indices ........................................................................................... 107
Table 4.9 Results of structural equation modelling analysis ................................................. 109
Table 5.1 Results of the hypothesised relationships .............................................................. 118

viii
LIST OF FIGURES
Figure 1.1 Conceptual framework ........................................................................................... 11
Figure 2.1 The communication process ................................................................................... 20
Figure 2.2 Elements of the promotional or marketing communication mix ............................ 22
Figure 2.3 Levels of relationship with brands ......................................................................... 42
Figure 3.1 Interconnection of research approach and method ................................................. 55
Figure 4.1 Respondents age group ........................................................................................... 88
Figure 4.2 Type of vehicle driven by respondents ................................................................... 89
Figure 4.3 Type of vehicle driven by respondents according to age group ............................. 90
Figure 4.4 Time spend on traditional channels e.g. television / radio per day ........................ 91
Figure 4.5 Length of time spend on traditional channels by age group ................................... 91
Figure 4.6 Time spend on online channels and social media per day...................................... 92
Figure 4.7 Length of time spend on online channels by age group ......................................... 93
Figure 4.8 Fuel ad exposed to in the last 6 months and the medium that carry the ad ............ 94
Figure 4.9 Fuel brand respondents currently using .................................................................. 95
Figure 4.10 Fuel brand choice by age group............................................................................ 96
Figure 4.11 Fuel ad exposed to versus fuel brand currently using .......................................... 97
Figure 4.12 Overall measurement model / CFA model ......................................................... 104
Figure 4.13 SEM path model structure .................................................................................. 108

1
CHAPTER ONE
INTRODUCTION AND BACKGROUND TO THE STUDY
1.1 INTRODUCTION
In the modern competitive business environment, advertisements have become one of the most
significant commercial activities. Companies, brands, and organisations spend a large part of
their budget to create and run advertisements to promote their business and goods (Lin, 2011).
Adverts are useful for the representation of a corporate identity, a commodity’s image, product
positioning and promotion to attract consumers and influence their purchase intention (Belch
& Belch, 2017). A major concern for marketing scholars in recent decades has been
understanding and determining the impact of advertisements on consumers’ attitude towards
the advertised product or brand (Raluca & Ioan, 2010). The idea behind this is that the positive
or negative evaluation of the advertisement is linked to the brand being advertised. Therefore,
there is a possibility of a causal relationship between the attitude towards an advertisement and
behaviour towards the product, service or brand promoted in the advertisement.
All the components or elements of advertising are crucial in ensuring a successful advert that
can affect consumers’ attitude towards the advertisement and the advertised brand (Rodgers &
Thorson, 2019). Advert attitude and brand attitude reflect persuasive psychological influences,
and act as important indices for measuring advertising effects (Lin, 2011). Consequently,
attitude towards the advertisement and attitude towards the brand create a certain influential
power on purchase intention (Lee, Lee & Yang, 2017; Sallam & Algammash, 2016). Despite
all advertising components being important, companies can only focus on the controllable
elements, namely source, and advertising appeals (Belch & Belch, 2017). Therefore, a
company must choose the right spokesperson or source to deliver a compelling message
through appropriate media or channels to ensure an effective advertising and promotional
campaign (Belch & Belch, 2017).
Advertisers are constantly seeking strategies aimed at drawing attention to their products and
services and distinguishing their brand from competing brands (Singh & Banerjee, 2018).
According to Spry, Pappu and Cornwell (2011), advertisement recall and acknowledgement,
attitude towards the advertisement, and brand assessments may depend on certain factors (such

2
as source credibility). Source credibility is a term widely used to indicate the particular qualities
of a communicator that influence the recipient’s assent to a message (Singh & Banerjee, 2018).
In addition, advertising credibility is considered to be the consumers’ overall perception
towards the reliability, truthfulness, dependability, trustworthiness and legitimacy (Sebastian
& Pandowo, 2016). Source credibility is a prognosticator of attitude towards the advertisement,
attitude towards the brand, and purchase intention (Amos, Holmes & Strutton, 2008). Apart
from credibility, likeability is another source characteristic that has a considerable effect on the
way the message is processed by consumers. Yilmaz, Telci, Bodur and Iscioglu (2011) posit
that a likeable source generates increased attention to the ad and positive feelings towards the
brand, which then translates into purchase likelihood. Source likeability is normally associated
with physical appearance, behaviour and other personal traits that exude attractiveness,
similarity and familiarity (Amos et al., 2008; Bhatt, Jayswal & Patel, 2013; Lin, 2011; Nguyen
& Nguyen, 2017; Yilmaz et al., 2011).
Over many decades, the success of advertisements has become a matter of endless debate
(MacKenzie, Lutz & Belch, 1986). While advertisers are continually pursing greater
effectiveness in marketing communication, more care needs to be taken in selecting the type
of advertising appeals (Akbari, 2015). Lin (2011) indicates that advertising appeals have an
influence on consumer attitude and behaviour. To get the consumers to receive a message,
brands and companies need to bring some driving force into the message. Advertising appeal
reflects an attraction that awakens the desires of the consumers (Lin, 2011). Kotler (2003)
divides advertising appeal into rational and emotional appeals. “Advertisers use rational
appeals in the advertisements to persuade viewers who chose to follow central route, that is,
those who are cognitive processors; and emotional appeals for those viewers who are more
dependent on peripheral cues to form an attitude about the product or service advertised in the
advertisement” (Keshari & Jain, 2016:70). The emotional and rational appeals are expected to
trigger different responses from consumers and significantly affect their purchase intention.
The success of these appeals depends on how consumers interpret information contained in the
advertisement (Keshari & Jain, 2016). Nevertheless, marketers are very interested to know how
customers process the information found in the advertisement and how they perceive it, since
it directly influences consumers’ responses.
Numerous studies have appraised the influence of advertising source on consumers’ attitude
towards the advertisement (Bhatt et al., 2013; Fleck, Korchia & Le Roy, 2012; Lin, 2011;

3
Sallam, 2011; Singh & Banerjee, 2018; Yilmaz et al., 2011) and attitude towards the brand
(Bhatt et al., 2013; Nguyen & Nguyen, 2017; Sallam, 2011; Singh & Banerjee, 2018; Vien,
Yun & Fai, 2017; Wu & Wang, 2010; Yilmaz et al., 2011). Nevertheless, the comparison
between source credibility and source likeability to ascertain which one is more influential in
creating favourable attitude towards the advertisement and advertised brand is inadequately
researched. Despite source credibility and source likeability being commonly considered by
advertisers, they have yet to establish which one is more prominent (Bhatt et al., 2013; Singh
& Banerjee, 2018; Yilmaz et al., 2011). Similarly, the majority of previous studies have
focused on the impact of advertising appeals on consumers’ attitude towards the advertisement
(Hornik & Miniero, 2010; Keshari & Jain, 2016; Lui, Cheng & Li, 2009) and brand attitude
(Feiz, Fakharyan, Jalilvand & Hashemi, 2013; Keshari & Jain, 2016). However, limited studies
have compared the rational and emotional appeal, and determined which one is more effective
in influencing advert attitude and brand attitude. Although both the rational and emotional
appeals have been regularly utilized by advertisers, marketers however have not established
which one is more effective (Keshari & Jain, 2016; Pashna, Esfidani & Jafari, 2019).
This study attempts to examine the impact of source credibility alongside source likeability on
attitude towards the advertisement and attitude towards the brand. Moreover, the study
endeavours to investigate the effect of rational – as well as emotional – appeals on advert
attitude and brand attitude. In addition, this study attempts to empirically test the influence of
the ensued advert and brand attitude on consumer purchase intention. Furthermore, it is
interesting that few studies have examined the interactive relationship between different source
characteristics, various types of advertising appeals, attitude towards the advertisement and
attitude towards the brand within an integrated model (Feiz et al., 2013). The findings of this
study are expected to provide brands and marketing practitioners with insights into the
preference of consumers when it comes to source attributes, and whether they rely on emotional
or rational (or both) systems to process information in the advertisement. Although previous
studies have established relationships between the three variables (attitude towards the
advertisement, attitude towards the brand, and purchase intention), such relationships have
been considered to be casual in nature (Sallam & Algammash, 2016). Furthermore, previous
studies have been conducted in matured countries, and not developing economies such as South
Africa (Akbari, 2015; Keshari & Jain, 2016; Lin, 2011; Okazaki, Mueller & Taylor, 2010).

4
The new way of advertising is very challenging, especially in the fuel retailing industry, where
products are treated as a basic commodity, the quality of products is perceived to be the same
and the price is regulated (Dugar, 2013). The intricacy of advertising in this industry makes it
an interesting topic for research as fuel companies need to differentiate their products as well
as services to attract customers and influence purchase intention (Sartorius, Eitzen & Hart,
2007). This research provides useful insights pertaining to the effect of advertising controllable
elements on attitudinal responses, and purchase likelihood for fuel products and services within
a single study. Marketers and advertisers need to know the impact of these controllable
elements on consumer attitudes and purchase intention, so as not to focus solely on a particular
element – at the expense of another.
1.2 RESEARCH AIM, QUESTIONS AND OBJECTIVES
The following research aim, questions and objectives have been formulated for this study to
address the problem at hand:
1.2.1 Research aim
The aim of this study is to investigate the impact of controllable elements in advertising on
attitude towards the advertisement, attitude towards the brand and, subsequently, purchase
intention.
1.2.2 Research questions
The ensuing research questions were framed to address the research aim for this study:
What is the impact of source credibility and likeability on attitude towards the
advertisement and attitude towards the brand?
What is the impact of rational and emotional appeals in message on attitude towards the
advertisement and advertised brand?
What is the impact of attitude towards the advertisement and attitude towards the brand on
purchase intention?

5
1.2.3 Research objectives
The following objectives were formed to address the research questions for the study:
to investigate and compare the impact of source credibility alongside likeability on attitude
towards the advertisement and attitude towards the brand
to examine and compare the impact of rational and emotional appeals in message on
attitude towards the advertisement and advertised brand
to assess the effect of attitude towards the advertisement on attitude towards the brand
to study and compare the influence of attitude towards the advertisement and attitude
towards the brand on purchase intention
1.3 LITERATURE REVIEW AND HYPOTHESES DEVELOPMENT
To achieve the aim of this study, it is of great importance to have established a comprehensive
literature review on which to base this study. This section provides a literature review on
marketing communication underpinning the concept of advertising, the controllable elements
in advertising, attitude towards the advertisement, attitude towards the brand, purchase
intention and fuel retailing sector in South Africa.
1.3.1 The concept of advertising
Advertising is the most popular form of marketing communication, due to the fact that it is the
most utilised marketing communication tool (Belch & Belch, 2017; Clow & Baack, 2016;
Keshari & Jain, 2016; Kotler & Armstrong, 2014). Advertising is considered to be an important
communication tool, particularly for organisations, companies and brands targeting mass
markets (Keshari & Jain, 2016). Juska (2017) defines advertising as a form of persuasive
communication created for a specific purpose, targeted at a particular audience and requiring
payment for messages delivered through a proprietary medium. According to Belch and Belch
(2017), advertising can create unique, favourable images and associations, especially for
products or services that are difficult to differentiate on the basis of functional attributes.
Advertisements can create awareness, increase intention to buy, and transform passive buyers
into customers (Akkaya, Akyol & Simsek, 2017). Studies have shown that advertising can
affect consumers’ attitudes and purchase intention by way of perception and acceptance

6
(Chaoying, Jian & Ille, 2011; Kashif & Rashid, 2016). Advertisements is described as having
controllable and non-controllable elements in relation to the communication model (Belch &
Belch, 2017). This study will focus on controllable elements in advertising, which are discussed
in the following section.
1.3.2 Advertising elements
Rodgers and Thorson (2019) suggest that advertising elements consist of advertising message
appeals and sources of the advertisement. McGuire’s persuasion matrix model describes how
each independent and dependent variable of these communication components interact to
successfully influence a consumer into a purchase (Belch & Belch, 2017; Fennis & Stroebe,
2015). The source and message elements of advertising that are controllable by advertisers
formed the constructs of this study, as elaborated on below.
1.3.2.1 Source
Belch and Belch (2017) define source as the individual or organisation involved in delivering
a marketing message, either indirectly or directly to a group of people. According to Yilmaz,
Telci, Bodur and Iscioglu (2011), advertiser source can be classified into two categories:
namely, source credibility and source likeability. Source credibility and likeability have a
significant effect on the manner the advertised messages are processed by consumers (Yilmaz
et al., 2011). There is considerable evidence that source credibility and likeability exert positive
effects on purchase intention through enhancing both attitude towards the advertisement and
attitude towards the brand (Bhatt et al., 2013; Sallam, 2011; Singh & Banerjee, 2018; Visentin,
Pizzi & Pichierri, 2019). Against this background, the following hypotheses were formulated:
H1: Source credibility has a significant positive effect on attitude towards the advertisement.
H2: Source credibility has a significant positive effect on attitude towards the brand.
H3: Source likeability has a significant positive effect on attitude towards the advertisement.
H4: Source likeability has a significant positive effect on attitude towards the brand.

7
1.3.2.2 Message
Ruchi (2012) describes message as the integral part of an advertisement that attempts to convey
the intent of the advertiser to the target audience through visuals and/or verbals.
Advertisements need to elicit rational and emotional appeals in their messaging approach to
attract consumers’ attention and influence their behaviour (Jovanovic, Vlastelica & Kostic,
2016). Rational appeals are informative or logical and focus on the attributes of a product or
service that benefit consumers (Lin, 2011). On the other hand, emotional appeals target the
psychological, social and symbolic needs of consumers to trigger positive or negative feelings
that encourage certain behaviour (Lin, 2011). Numerous scholars have concluded that both
rational and emotional appeals have a significant positive influence on consumers’ attitude
towards the advertisement and brand (Lee & Hong, 2016; Ness, Johnson, Ault, Taylor, Griffith,
Connelly, Dunbar & Jensen, 2017; Sadeghi, Fakharyan, Dadkhah, Kodadadian, Vosta & Jafari,
2015; Zhang, Sun, Liu & Knight, 2014). Along with what the previous literature found, the
following hypotheses were formulated:
H5: Rational appeal has a positive and significant relationship with attitude towards the
advertisement.
H6: Rational appeal has a positive and significant relationship with attitude towards the
brand.
H7: Emotional appeal has a positive and significant relationship with attitude towards the
advertisement.
H8: Emotional appeal has a positive and significant relationship with attitude towards the
brand.
1.3.3 Attitude
Attitude is described as a mental position taken toward a person, topic, or an event that
influences the holder’s perceptions, feelings, learning processes and subsequent behaviour
(Clow & Baack, 2016). The three components that form attitude are cognitive, affective and
conative (or behavioural) (Clow & Baack, 2016; Zikmund, Carr & Griffin, 2013). The
consumers’ attitudes reflect their personal values or beliefs about an object, thus influencing
their behaviour (Sallam & Algammash, 2016). Marketing practitioners and advertisers view
attitude as a vital indicator of consumers’ positive or negative evaluation of an object or brand,

8
which may subsequently affect their purchase intention (Belch & Belch, 2017). Advertising is
one of the promotional mixes used to create favourable attitudes towards the advertisement as
well as the advertised brand, by leveraging on the controllable elements.
1.3.3.1 Attitude towards the advertisement
Attitude towards the advertisement (or referred to as advert attitude) is defined as consumers’
favourable or unfavourable responses to a particular advertisement based on various
advertisement factors – it is the emotional change after viewing the advertisement (Lee, Lee
& Yang, 2017). Numerous researchers have investigated advert attitude, highlighting the
impact of attitude towards the advertisement on attitude towards the brand and purchase
intention (Sallam & Algammash, 2016; Singh & Banerjee, 2018; Yan, Hyllegard & Blaesi,
2012). Furthermore, advert attitude has been discussed to simultaneously influence attitude
towards the brand and purchase intention (Lee et al., 2017). Against this background, the
following hypotheses were formulated:
H9: The attitude towards the advertisement has a positive and significant impact on attitude
towards the brand.
H10: The attitude towards the advertisement has a positive and significant impact on purchase
intention.
1.3.3.2 Attitude towards the brand
Brand attitude is defined as consumers’ favourable or unfavourable responses to a particular
brand, which is affected by aroused beliefs and associations that form reputation towards the
brand (Foroudi, 2019). Consumer brand attitude is a process of perception and acceptance,
influenced by the advertising appeal and how a person handles information (Chaoying, Jian &
Ille, 2011). Numerous studies have examined brand attitude, underlining the impact of
consumers’ attitude towards the brand on their purchase intention (Lee et al., 2017; Sallam &
Algammash, 2016; Singh & Banerjee, 2018; Yan et al., 2012). Premised on this reasoning, the
researcher proposes the next hypothesis:
H11: The attitude towards the brand has a positive and significant influence on purchase
intention.

9
1.3.4 Purchase intention
Purchase intention is described as the likelihood that consumers will buy a particular brand
versus competing products (Akbari, 2015). Prevailing studies that examined the relationship
among attitude towards the advertisement, attitude towards the brand and purchase intention
reported positive linkages, which are crucial insights for marketing practitioners (Abdul Wahid
& Ahmed, 2011; Ganesan, Sridhar & Priyadharsani, 2017; Kaushal & Rakesh, 2016; Lee et
al., 2017; Sallam & Algammash, 2016).
1.3.5 Overview of South Africa oil industry
The oil industry in South Africa consists of upstream, midstream and downstream activities.
While South Africa imports most of its crude oil requirements from Africa and Middle East,
the country is also a significant exporter of petroleum products to its neighbouring African
countries (SAPIA, 2016; SAPIA, 2019). The oil industry is one of the major contributors to
the economy and employment in this country (SAPIA, 2019). Petrol and diesel are the two
major petroleum products sold in South Africa – apart from fuel oil, jet fuel, bitumen,
illuminating paraffin and liquefied petroleum gas (LPG). Among all these petroleum products,
the petrol price is regulated by the South Africa government based on import parity price
formula (SAPIA, 2019). However, this may change with the impending liberalisation.
1.3.5.1 Fuel retailing in South Africa
The major players in the South African oil industry are Engen Petroleum, Shell South Africa,
Chevron South Africa, BP Southern Africa, Total South Africa, Sasol Oil and Petro SA
(SAPIA, 2020). These companies are also integrated members of the South African Petroleum
Industry Association (SAPIA). The oil companies in South Africa sell about 50% of petrol,
diesel and other liquid fuels to the retail market through petrol stations on their own direct
distribution network, branded-marketers/integrated wholesalers or independent wholesalers
(SAPIA, 2016). There are approximately 4 600 petrol stations with over 6 000 licences issued
in South Africa (SAPIA, 2016). Engen Petroleum is the industry leader with more than 25%
market share and the largest service station footprint of over 1 000 sites in South Africa
(“Engen remains SA’s…”, 2017; Phembani, 2019).

10
1.3.5.2 Paradigm shift in fuel marketing
Fuel price deregulation is one of the many initiatives proposed by National Treasury to
stimulate economic growth (de Villiers, 2019; National Treasury, 2019). This may spur the
competition among wholesalers and retailers, and create a price war (Sartorius, Eitzen & Hart,
2007). Although the matter is still being debated, the dynamics of the fuel industry in South
Africa continues to evolve with the emergence of new players to an existing crowded market,
as well as changing consumer behaviour (Boyle, 2019; “Four trends shaping…”, 2016;
WhoOwnsWhom, 2019). This has led to fuel companies and retailers turning their forecourts
into convenient transitory stops by also providing a variety of non-fuel products and services.
1.3.5.3 Advertising in the fuel industry
The notion of marketing in the fuel industry by way of expanding geographical coverage and
the distribution network is no longer sustainable. The intensifying competition among the
many fuel retailers, changing consumers’ orientation and rapid challenges ahead (in the event
of price deregulation) compel fuel companies to turn to other non-fuel products and offerings
as points of differentiation. Advertising can benefit the fuel companies by way of brand
building and marketing, promoting their value proposition to influence consumer perception
of fuel from a low involvement commodity to high involvement brand, emphasising customer
experience, as well as a value-addition to attract consumers to frequent their forecourts and
encourage brand loyalty (Attri & Pahwa, 2012; Dugar, 2007; Dugar, 2013).
1.3.6 Conceptual Framework
Founded on the preliminary literature provided, the following conceptual framework was
proposed for the study:

11
H8
H7
H6
H5
H4
H3
H2
H1
H4
H10
H11
H9
Figure 1.1 Conceptual framework
Sources: Adapted from (Ganesan, Sridhar & Priyadharsani, 2017; Lin, 2011; Yilmaz, Iscioglu
& Bodur, 2011)
1.4 RESEARCH DESIGN AND METHODOLOGY
This section provides a brief explanation of the research methodology undertaken in the study.
The research methodology particularly covers research design, paradigm and approach
employed, sampling design followed, measurement and scales implemented, the data
collection method used, as well as the data analysis procedures applied.
1.4.1 Research design
Research design is described as a framework of the research project, which guides the data
collection and analysis (Bryman, Bell, Hirschsohn, Dos Santos, Du Toit, Masenge, Vann Aardt
& Wagner, 2017; Creswell, 2014). According to Sreejesh, Mohapatra and Anusree (2014) as
well as Malhotra (2010), research design can be classed into three broad categories, namely:
exploratory, descriptive and causal. Exploratory research is flexible in nature – intended to gain
insights of a situation – and the findings are tentative, which may require further research
(Sekaran & Bougie, 2016). On the contrary, both descriptive and causal are structured and
conclusive in nature, where specific hypotheses are tested to examine relationships (Sekaran
Source
Credibility
Source
Likeability
Attitude Towards
the Advertisement
Purchase
Intention
Rational
Message
Emotional
Message
Attitude Towards
the Brand
12
& Bougie, 2016). Descriptive research describes what is happening in the market, while causal
research determines the cause and effect relationship between variables (Sekaran & Bougie,
2016). The current study adopted descriptive research design, which allowed for collection of
rich data in large amounts to test the hypotheses.
1.4.2 Research paradigm
Research paradigm represents a set of fundamental beliefs and assumptions as to how the world
is perceived, which then serve as guidelines to conduct study and resolve research problems
(Jonker & Pennink, 2010; Makombe, 2017). Research paradigms are classified into four
categories, namely, positivism, constructivism/interpretivism, transformative and pragmatism
(Creswell, 2014). This study employed the positivist approach, where the findings were
compared to the stated hypotheses.
1.4.3 Research approach
Research approach can be classified into three different tactics, namely, qualitative,
quantitative, and mixed method (Bryman et al., 2017; Creswell, 2014; Gay, Airasian & Mills,
2012; Wilson, 2018). The qualitative approach uses non-numerical data – like narrative and
visuals – to gain insights into a particular phenomenon of interest (Gay et al., 2012). On the
contrary, quantitative approach relies on numerical data to describe, explain, predict or control
phenomena of interest (Gay et al., 2012). Mixed method or mixed-mode integrates the
qualitative and quantitative approaches in a single study (Mitchell, 2018; Wilson, 2018). This
study adopted a quantitative approach, which entailed the collection of numerical data and
exhibited deductive relationship between theory and research (Bryman et al., 2017; Mitchell,
2018).
1.4.4 Sampling design
The sampling design is a framework used in establishing the participants that should be selected
for the study (Sreejesh et al., 2014). This section provides a synopsis of the study’s target
population, sample size and methods.

13
1.4.5 Target population
Target population is the population of interest, from where information will be obtained for the
study (Wilson, 2018). The target population for this study are motorists in South Africa who
have valid driving licenses, drive cars or other forms of road vehicles, and previously bought
fuel for their vehicles. Based on data from National Traffic Information System (eNaTIS), there
are 12 729 325 live vehicle population in South Africa as at 31 January 2020 which require
fuel purchases (eNaTIS, 2020). The motorists also must have been exposed to any fuel
advertisement in the last six months.
1.4.6 Sample size
In accordance with the historical evidence approach, a sample size of 201 motorists is
considered comparable to other similar studies of this nature (Akbari, 2015; Balakrishan,
Dahnil & Yi, 2014; Sallam, 2011; Visentin et al., 2019; Zhang et al., 2014), and sufficiently
large for multivariate statistics analysis (Anderson & Gerbing, 1988; Gorsuch, 1983;
Hoogland, 2001; Hoogland & Boomsma, 1998; Kline, 2011; Muthen & Muthen, 2002;
Tabachnick & Fidell, 2001; Tinsley & Tinsley, 1987).
1.4.7 Sampling method
Sampling is the process of selecting a segment of the population for investigation (Sreejesh et
al., 2014). The sampling method can be clustered into two categories, namely probability and
non-probability sampling (Wilson, 2018). Probability sampling uses a random selection where
every member of the target population has an equal chance of being chosen (Bryman et al.,
2017; Wilson, 2018). On the other hand, non-probability sampling is not random, and some
members of the population are more likely to be selected than others (Bryman et al., 2017;
Wilson, 2018). For this study, the non-probability sampling method, specifically convenience
sampling, was applied due to its practicalities and accessibility to the researcher.
1.4.8 Data collection method
Data collection methods are procedures utilised to gather data from participants (Sreejesh et
al., 2014; Wahyuni, 2012). This study employed a self-administered survey method, developed

14
using Qualtrics. The web-based electronic structured questionnaires were pre-tested with 26
respondents to test their understanding using a debriefing approach, and their feedback was
incorporated to improve the survey. Next, the survey was piloted on a convenience sample of
50 South African motorists to ascertain its reliability. All the constructs reported mean values
above 3.500, which indicated a level of agreement with regards to the influence of the
controllable elements on attitudes and purchase intention. The scale is also considered reliable,
with an overall Cronbach alpha coefficient value of 0.819. Thereafter, the survey was finally
launched and the link was published on social media portals, where the researcher expected the
majority of qualifying participants to be present. This approach for data collection offers a host
of benefits in terms of time and cost effectiveness, easily personalisation, as well as wider reach
(Wilson, 2018). The researcher also shared the link at strategic locations in Cape Town with
high concentrations of motorists (e.g. mall and forecourts).
1.4.9 The measurement instrument
The measurement instrument is a tool used to measure the variables in study for indicators
(Gay et. al, 2012). The survey instrument allowed participants to express different degrees of
agreement or disagreement in response to statements about the variables stated in the
hypotheses. All variables were assessed using a five-point Likert Scale ranging from ‘Strongly
disagree’ (1) to ‘Strongly agree’ (5). The questionnaires were developed in reference to
previous related studies as stated in Table 3.3 under Chapter 3 (Abdul Wahid & Ahmed, 2011;
Akbari, 2015; Bhatt & Patel, 2013; Ganesan et al., 2017; Lin, 2011; Jovanovic et al., 2016;
Kamran & Siddiqui, 2019; Nguyen & Nguyen, 2017; Sadeghi et al., 2015; Sallam &
Algammash, 2016; Singh & Banerjee, 2018; Spears & Singh, 2004; Visentin, Pizzi & Pichierri,
2019; Yilmaz, Iscioglu & Bodur, 2011; Zhang, Sun, Liu & Knight, 2014) where modifications
were made to the scales and wording of the items to fit the context and purpose of this study.
1.4.10 Reliability and validity of measurement instrument
Reliability refers to the consistency of the survey questionnaires measuring a particular concept
(Bryman, 2012). The measuring instrument was deemed reliable based on three different
methods, which returned values higher than the recommended indicator for adequate internal
consistency – namely 0.6 for Cronbach alpha coefficients (Ebrahimzadeh, Moradi, Vahedi,
Kachooei & Birjandinejad, 2015; Hume, Ball & Salmon, 2006; Malhotra, 2010; McMinn, van

15
Sluijs & Harvey, 2009; Sim & Wright, 2000), 0.7 for composite reliability (Chin, 1988;
Nunnally, 1978) and 0.4 for average variance extracted (Fraering & Minor, 2006). Validity
relates to whether or not an indicator (or set of indicators) that is devised to gauge a concept
really measures that concept (Bryman, 2012). This was established by way of content validity,
convergent validity and discriminant validity for the study (Aldalaigan & Buttle, 2002; Brown
& Cudeck, 1993; Fraering & Minor, 2006; Nunnally & Bernstein, 1994; Neuman, 2006)
1.4.11 Data analysis
Data analysis involves management, analysis and interpretation of the data collected for the
study (Bryman, 2012). The management of data involved cleaning, editing, coding and
tabulation prior to analysis. The cleaned data was analysed using Statistical Package for Social
Sciences (SPSS) and Analysis of Moment Structures (AMOS) versions 26.0. The study is
multivariate in nature, where the following statistical methods were applied on the empirical
data sets, and inferences made thereafter based on the results;
Frequency analysis
Descriptive statistical analysis
Reliability and validity analysis
Structural equation modelling
Hypotheses testing
1.5 CONTRIBUTION OF RESEARCH
The findings of this study offer valuable insights to both marketing executives and scholars on
the intricacies of advertising in the fuel industry. Marketers of fuel companies will benefit by
taking cognisance of the advertising elements that directly impact the attitude towards the
advert and brand, and subsequently exert positive influence on motorists’ purchase intentions.
They will also be able to ascertain whether the adverts implemented have positively impacted
the company. These insights can be used to develop effectual adverts that build meaningful
and lasting relationships. This will be of utmost importance in the event of price deregulation,
as competition will be more intense. For academia, the study helps to fill the gap and
complement previous similar research in the advertising field, particularly in the context of the

16
fuel retail industry. In addition, it provides insights on the effectiveness of fuel advertising in
developing economies like South Africa.
1.6 LIMITATIONS OF THE STUDY
The quantitative approach, which is scientific in nature, may not be able to answer all questions
or capture the full richness of the participants and the environments under study (Gay et al.,
2012). The measurement instrument also will always have some degree of error as the variables
in study are often proxies for the real behaviour with no adequate picture of how the
participants truly act (Gay et al, 2012). While convenience sampling may provide ease of
access to participants, its limitations in terms of generalisation and representation of the
population need to be acknowledged (Bryman, 2012). This study was conducted in the specific
context of advertisements by fuel retailers in the South Africa market. Thus, it is undependable
to generalise the findings of this study to cover a broader context or a different industry.
Furthermore, this research did not take into consideration whether the motorists are obliged to
fuel at certain garage due to their employer/company fuel card or loyalty programme
partnership.
1.7 ETHICAL CONSIDERATION
Ethical consideration is important in safeguarding the respondents' rights, obtaining their
informed consent and compliance to the institutional assessment procedure for ethical
authorisation before conducting fieldwork. The current study was governed by the University
of Cape Town provision that studies concerning human participation require the ethics
committee's approval before a study can be carried out. The study was approved by the
University of Cape Town Commerce Research Ethics Committee and ethics permission was
obtained with clearance number REF: REC 2019/012/004 (Annexure A). The partakers were
informed that their participation is voluntary and that they may choose to withdraw at any stage
without any consequences. They were also informed that their responses are confidential and
no identifiable information was requested.

17
1.8 STRUCTURE OF THE THESIS
This thesis comprises five chapters, each with several sections and sub-headings. The contents
of each chapter are outlined next.
Chapter 1 consists of Introduction and Background to the study. The chapter commences with
an overview of the study, as well as the problem statement. This is followed by the research
aim, questions, and objectives that guided the investigation. The theoretical aspects of the
study, including formulation of hypotheses and proposed conceptual framework, were
reflected. The research design and methodology considerations were briefly explained,
together with contribution as well as the limitations of this study. The ethical consideration and
structure of the entire thesis are also stipulated in this chapter.
Chapter 2 provides a Literature Review on the concepts of marketing communication
underpinning advertising, the controllable elements in advertising, attitudes specifically
towards the advert as well as brand, and purchase intention. An overview of South Africa oil
industry and fuel retail sector are provided, so as to understand the landscape within which the
fuel companies operate.
Chapter 3 explains the Research Methodology considerations regarding the underlying
philosophy and procedural paradigm for this study. The chapter commences with a brief
description of marketing research, before proceeding to present a detailed overview of the
research design, paradigm and approach, including the chosen methodologies for the study.
This chapter unfolds the empirical fieldwork covering the sampling design, pre- as well as pilot
testing of the questionnaire instrument, survey research implementation, and overall data
gathering. The chapter also addresses reliability and validity assessment of the measuring
instrument. The data analysis, which includes statistical procedures and Structural Equation
Modelling used in this study, are also described.
Chapter 4 reports on the Results and Discussions of the findings derived from the statistical
analysis procedures. The findings of the research are tabulated, statistically analysed,
interpreted and presented in this chapter. The research hypotheses formulated are corroborated,
and the proposed conceptual model tested by employing structural equation modelling.

18
Chapter 5 reviews the entire study and presents the Conclusions and Recommendations drawn
to support the empirical objectives formulated at the inception of this research. The chapter
ends with a discussion of the limitations of this study, guidelines for further research and final
concluding remarks.
1.9 CHAPTER SUMMARY
The fuel retailing sector in South Africa is highly competitive despite regulated pricing, fuel
being treated as a commodity, quality perceived to be the same, and the prospect of
deregulation. Thus, it has become important for fuel companies to differentiate and promote
their products and services, through effective advertising, to attract customers and influence
their purchase intention. This can be done by understanding the influence of advertising
controllable elements – specifically source and message – on consumers’ attitude towards the
advertisement, brand and purchase intention, in order to produce an impactful advert.
This chapter serves as an introduction to the study documented in this thesis. It sets the scene
for the full thesis by providing a background to the study, framing the problem, and describing
the objectives and methodology undertaken to carry out the research, while not neglecting the
ethical considerations. Moreover, the study alludes to the contribution and limitations of this
study for future research reference. The next chapter provides a literature review on the concept
of marketing communication, advertising, the controllable elements of advertising (namely
source, message, channel), attitudes towards the advertisement, attitude towards the brand,
purchase intention and the fuel retailing sector in South Africa.

19
CHAPTER 2
LITERATURE REVIEW
2.1 INTRODUCTION
Marketing of fuel has transformed from merely focusing on strengthening distribution
networks by way of opening and adding more outlets, to the era of branding, positioning and
differentiation (Dugar, 2007). The fuel retail sector in South Africa is facing a competitiveness
threat caused by an overtraded market with too many fuel stations, and a changing environment
and customer orientation (Sartorius et al., 2007). The industry is also facing the possibility of
liberalisation or price deregulation in future. Moreover, fuel is perceived as an undifferentiated
low-involvement commodity (Dugar, 2007). The importance of advertising under these
settings is paramount, as the marketing activities undertaken by oil companies gain more
traction and focus through differentiation, constant value addition, customer relation
management, segmentation, targeting and positioning (Dugar, 2007). Advertising is the new
mantra in fuel marketing, leveraging on the use of all possible communication elements and
techniques to influence consumers’ attitudes as well as purchase behaviour (Dugar, 2007).
This chapter presents a discussion on the influence of advertising through its controllable
elements on South African consumers’ attitudes and purchase intention for fuel brands. The
chapter begins with marketing communication as the backbone of advertising. Next, the
theoretical background of advertising and its controllable elements respectively are discussed,
followed by the deliberation on attitude, specifically attitude towards the advertisement (advert
attitude) and attitude towards the brand (brand attitude), as well as purchase intention that form
the variables under study. An overview of the South African oil industry is presented thereafter,
focusing on the fuel retail sector, the changing environment causing a paradigm shift in fuel
marketing, and the importance of advertising under these circumstances, before the final
section brings the chapter to a close and hints at the next chapter.
2.2 MARKETING COMMUNICATION
Communication has been numerously defined as the passing of information, the exchange of
ideas or a two-way process of establishing a commonness of thought between two parties

20
(Belch & Belch, 2017). The components that form the communication process include
participants (sender/source, receiver), transmission devices or tools (message, channel),
functions and processes (encoding, decoding, response, feedback) as well as noise (any
extraneous factors that distorts the process and prevent effective communication) (Belch &
Belch, 2017; Clow & Baack, 2016; Yeshin, 2012). These components are illustrated in the
communication process model in Figure 2.1 below. Communication is a vital component of
marketing. Thus, having an understanding of the basic process of communication is
fundamental to appreciate and employ its functionality in a marketing line of work (Yeshin,
2012).
Figure 2.1 The communication process
Sources: (Adapted from Belch & Belch, 2017; Clow & Baack, 2016; Yeshin, 2012)
Kotler and Keller (2015) define marketing communication as the means by which firms attempt
to inform, persuade and remind their customers directly or indirectly of products and brands
they sell. Marketing communication is the promotion element of the marketing mix, which
includes product, price and place (Belch & Belch, 2017; Clow & Baack, 2016). Belch and
Belch (2017) define promotion as the coordination of all seller-initiated efforts to set up
channels of information and persuasion in order to sell goods and services or promote an idea.
It is a form of propaganda with economic objectives to influence the target audience to respond
favorably to a company and their products or brand (Todorova, 2015). Over the years,
marketing has transitioned from being merely transactional to building and sustaining long-
term relationships with individual customers (Yeshin, 2012). This has also led every facet of
=
= = = =
= = Noise
Sender / Source
Message Channel
Receiver Encoding Decoding
Resp
on
se Feed
bac
k

21
marketing communication to evolve, influenced by wider environmental factors such as media
development, budgetary demands and consumer attitude (Egan, 2007).
The idea of integration by Schultz, Tannenbaum and Lauterborn in the early 1990s led to the
development of the integrated marketing communications (IMC) concept (Schultz & Schultz,
2004; Yeshin, 2012). This was also proliferated by the emerging trends in marketing
communications, such as integration of media platforms, explosion of the digital arena, the
shift in channel power, the increase in global competition and brand parity, as well as the
emphasis on customer engagement, accountability and measurable results (Clow & Baack,
2016). Belch and Belch (2017) echo Schultz’s definition of IMC as a strategic business process
used to plan, develop, execute and evaluate co-ordinated, measurable, persuasive brand
communication programmes over time with consumers, customers, prospects, and other
targeted, relevant external and internal audiences. The underlying principle of IMC is to deliver
a clear, concise, unified and consistent message within every piece of communication across
different media (Juska, 2017).
IMC underlines the importance of co-ordinating a varied promotional or marketing
communication mix in Figure 2.2; advertising, direct marketing, personal selling, sales
promotion and public relations in a unified way so that a synergistic communication effect is
created (Kotler & Armstrong, 2014). Yeshin (2012) accentuates it is imperative that each and
every communication tactic serves to reinforce the work of the other parts of the
communication programme to achieve maximum impact. Successful marketing
communication relies on deciding the right promotion mix, taking into consideration the
advantages and disadvantages of the different tools to determine which to use, how to combine,
as well as the budget allocation among them (Todorova, 2015).

22
Figure 2.2 Elements of the promotional or marketing communication mix
Source: (Kotler & Armstrong, 2014)
Advertising has become the most efficient way for companies to broadcast product information
to consumers (Wang, Chen & Chu, 2012). It is still considered dominant among the marketing
communication mix due to its pervasiveness (Blech & Belch, 2017). Advertising underpins the
area of interest for this study and is elaborated on in the following section.
2.3 ADVERTISING DEFINED
Juska (2017) defines advertising as a form of persuasive communication created for a specific
purpose, targeted at a particular audience and requiring payment for messages delivered
through a proprietary medium. O’Guinn, Allen, Semenik and Scheinbaum (2014) emphasise
that three essential criteria must be met for a communication to be classified as advertising; it
must be paid for, delivered to audience via mass media and the communication must be
attempting persuasion. Belch and Belch (2017) define advertising as any paid form of non-
personal communication about an organisation, product, service or idea by an identified
sponsor. The non-personal component means that advertising involves mass media that can
transmit a message to large groups of individuals (often at the same time), with generally no
opportunity for immediate feedback from the message recipient (Belch & Belch, 2017).
Advertising can create unique, favourable images and associations, especially for products or
Marketing
communication
mix
Advertising
Sales
promotion
Direct
marketing
Publicity /
public
relations
Personal
selling

23
services that are difficult to differentiate on the basis of functional attributes (Belch & Belch,
2017). Bird (2004) explains that advertising has four main purposes; to attract attention, to
inform, to persuade and to remind. Advertising can raise awareness, increase intent to buy and
transform passive buyers into customers (Akkaya et al., 2017). Companies spend a large share
of their marketing budget on advertising to produce and run promotions that convey
information about their corporation and products (Clow & Baack, 2016; Tehria, 2016).
Advertising can be classified based on purpose, geographic area, target audience and medium.
The advertising by purpose classification includes primary versus selective-demand
advertising, direct versus delayed response advertising, and corporate versus brand advertising
(Belch & Belch, 2017; O’Guinn et al., 2014). The geographical area class is further segregated
into global, international, national, regional and local advertising (Belch & Belch, 2017;
O’Guinn et al., 2014). There are five broad groupings of target audiences in advertising;
household consumers, business-to-business, members of trade channel, professionals, and
government officials and employees (Belch & Belch, 2017; O’Guinn et al., 2014). Advertisers
have an array of media available to them to deliver their message. These media can be
categorised based on their distribution channel for example; broadcast (television, radio), print
(newspapers, magazines, specialty, direct mail), interactive (internet, social media, video
games, kiosks), support or alternative media (outdoor, directories, point-of-purchase displays,
film and program brand placement, event sponsorship) (Belch & Belch, 2017; Clow & Baack,
2016; O’Guinn et al., 2014; Todorova, 2015).
William McGuire’s information processing model of advertising effects suggests that a
receiver goes through a series of steps in being persuaded (exposure, attention, comprehension,
acceptance, retention and purchase behaviour), which constitutes a response hierarchy (Belch
& Belch, 2017; Bird, 2004). These steps correspond to the sequence (awareness, knowledge,
liking, preference, conviction and purchase) in hierarchy of effects model by Robert Lavidge
and Gary Steiner, which has become the foundation for setting and measuring advertising
objectives (Belch & Belch, 2017). The hierarchy of effects model features similarities with
theories regarding attitudes and attitudinal change, covering concepts of cognitive, affective
and conative elements (Clow & Baack, 2016). The basic premise of these two models
(illustrated in Table 2.1) is that advertising effects occur over a period of time. Each stage is a
dependent variable that must be attained and may serve as an objective of the communication
process. Likewise, each stage can be measured, providing the advertiser with feedback

24
regarding the effectiveness of various strategies designed to move the consumer to purchase.
Successful adverts should result in changes in consumers’ cognitions and affections, as well as
their conations (Yilmaz et al., 2011).
Table 2.1 Models of the response process related to advertising
Stages Element / Component Models
Hierarchy of effects Information processing
Cognitive
Mental images,
understanding and
interpretation of person,
object or issue
Awareness Exposure / Presentation
Attention
Knowledge Comprehension
Affective
Feelings or emotions a
person has about an
object, topic or idea
Liking Acceptance / Yielding
Preference
Conviction Retention
Conative Intentions, actions or
behaviours Purchase Purchase behavior
Source: (Belch & Belch, 2017; Clow & Baack, 2016)
The hierarchy of effects and information processing models support the strong theory of
advertising which is universally accepted as the basis for commercial activity. The strong
theory suggests that advertising can influence target audiences’ knowledge, beliefs, attitudes
and behaviour (Bird, 2004; Fennis & Stroebe, 2015). In contrast, the weak theory of advertising
assumes a consumer’s purchasing behaviours are more driven by habit than exposure to
advertising (Belch & Belch, 2017; Bird, 2004). The weak theory implies that while advertising
can increase awareness and knowledge, it is not powerful enough to counter strong beliefs and
change attitudes (Bird, 2004). This study rides on the strong theory to investigate the influence
of fuel advertisement on consumer attitudes and purchase intention, by leveraging advertising
elements that are within the advertiser’s control. The advertising elements are discussed in
detail after the following sections on benefits and limitation of advertisements.

25
2.3.1 Benefits of advertisements
The benefits consumers perceive from advertising can be looked at from utilitarian (or
functional) and emotional gains (Shimp & Andrews, 2017; Zhang et al., 2014). Zhang, Sun,
Liu and Knight (2014) relate utilitarian benefits to Moslow’s hierarchy of needs with regards
to consumers’ basic motivation levels, such as their physiological, informational and safety
needs, which involve a desire for problem-solving or avoidance. The basic role of advertising,
as a tool of marketing communication, is to inform potential consumers about the products of
the advertiser and to provide necessary information so that they are able to compare them with
products of the competition, Advertising also creates awareness in potential consumers that
these products are adequate for purchasing, reminds consumers about the products, and finally
leads to a purchase in favour of the product which is being advertised (Jovanovic et al., 2016).
In addition to utilitarian benefits, advertising provides emotional benefits that relate to the
aesthetic, pleasurable and hedonic values that ads can provide (Zhang et al., 2014). Emotional
benefits usually relate to consumers’ underlying needs for stimulation, personal expression,
social approval and self-esteem (Zhang et al., 2014).
2.3.2 Limitations of advertisements
There are inherent limitations of advertising that companies need to be mindful when
marketing their products or services. Belch and Belch (2017) describe advertising as a one-
way, non-personal form of mass communication. Therefore, advertisers would not be able to
receive feedback immediately nor address any queries or doubts from the target audience
simultaneously. Also, since advertising is a form of a mass communication, it would not be
very cost-effective if the target audience is very small – for example in the case of industrial
products. In addition, being a one-way communication, advertising is quite inflexible where
the message cannot be modified to match the response of the target audience. Advertising is
not feasible as a promotional tool in the case of unbranded and undifferentiated products, to
sell an inferior product or to save a dying brand (Bird, 2004). Lin (2011) describes advertising
as general, informative and persuasive in nature, therefore it is not suited to convey a technical
message. The message conveyed through advertising is less believable compared to, for
example, electronic word-of-mouth (Wu & Wang, 2010). This may be due to the fact that
product features are normally exaggerated, and weaknesses or side effects are not fully
disclosed. Another common limitation in advertising is the inability to eradicate clutter. Clow

26
& Baack (2016) define clutter as noise or anything that distorts delivery of the message at any
stage in the communication process. The average person encounters more than six hundred
advertisements per day, delivered by an expanding variety of media (Clow & Baack, 2016).
This causes ad-wars among companies and ad-avoidance by consumers, which companies need
to address to fight for the audience’s attention.
2.4 ADVERTISING ELEMENTS
The earliest form of advertising originated from ancient civilisations – the Romans, Greeks,
Egyptians and Mesopotamians used outdoor advertising as a medium (Fennis & Stroebe,
2015). Advertising catapulted to new heights with the rise of newspapers as a mass medium at
the back of the industrial revolution (Tungate, 2007). Since then, advertising has weathered the
depression and war period, and thrived during the creativity and designer revolution that led to
the new era of IMC – all this amidst consumer empowerment as well as rapid advances in
technology (O’Guinn et al., 2014).
Despite the many changes in marketing and advertising landscapes over the last decades,
advertisers realised the value of strategically integrating the various communications or
promotional mix rather than having them operate autonomously (Clow & Baack, 2016). In
addition, there are a number of variables related to the various elements in the communication
model that may influence effective and persuasive interaction (Bird, 2004). Belch and Belch
(2017) describe advertising as having controllable and non-controllable elements in relation to
the communication model. The controllable elements or independent variables have been
identified as source, message, and channel or medium, that interact with receivers’ response
process (Belch & Belch, 2017; Steyn, Ewing, van Heerden, Pitt & Windisch, 2011), as seen in
Figure 2.1. On the other hand, non-controllable elements or dependent variables are the steps
receivers go through in being persuaded (Belch & Belch, 2017; Steyn et al., 2011) as depicted
under information processing model in Figure 2.3.
This study will focus on the controllable elements in the communication model, specifically
sender/source, message and channel – which are discussed in the following section. This is
based on the premise that these elements are within the advertisers’ full control in developing
an effective advertising and promotional campaign. Advertisers can choose the spokesperson
27
or source who delivers the message, the type of message appeal used, and the channel or
medium that carry the message. While they can select their target audience, advertisers are not
fully in control of the receiver. Belch and Belch (2017) highlight that the decisions about each
independent variable or controllable element influence the stages of the response hierarchy,
hence it is vital that advertisers do not enhance one stage at the expense of another.
2.4.1 Advertising source
As part of the four key elements of the communication process (i.e., source, message, channel,
and receiver), sources refers to where the message originates (Wu et al., 2016). According to
Belch and Belch (2017), source is the individual or organisation involved in communicating a
marketing message, either directly or indirectly to a group of people. Fennis and Stroebe (2015)
define a direct source as a spokesperson delivering a message or demonstrating a product. In
contrast, an indirect source is associated with the product or service despite not delivering the
message (Fennis & Stroebe, 2015). Steyn, Wallstrom and Pitt (2010), describe source effects
as the influences that the origin (or beliefs concerning the origin) of the advertising message
have on subsequent processing and evaluation of it by the consumer.
Source can be a corporation, the brand behind a product/service or individuals like senior
management of a company, celebrities, experts, or typical persons (Fennis & Stroebe, 2015;
Lin, 2011; Sallam, 2011). A highly visible and personable chief executive officer of a company
is an example of senior management source for an advertisement (Yan, Ogle & Hyllegard,
2010). Celebrities from the entertainment industry, athletes, and social media or marketing
influencers can be used to endorse the advertised products and appear in advertisements (Fleck
et al., 2012; Raluca & Ioan, 2010). They are normally seen as being exceptionally dynamic
people with amiable and appealing qualities, such as cool, exciting and spirited (Singh &
Banerjee, 2018; Srivastava & Sharma, 2016). An expert source has the professional knowledge
gained through learning, training and experience, which render their advice or judgement as
correct and reliable (Lin, 2011). Typical persons can be hired models or consumers who share
their own experiences and testimonials of using the products and services (Clow & Baack,
2016). Petrol companies in India signed up celebrities to endorse their fuel post liberalisation
to boost advertising (Dugar, 2007). Fuel companies in South Africa such as Shell, Engen and
Total have also adopted the same approach featuring celebrities (e.g. F1 drivers, sportsmen,

28
influencers), senior management, as well as typical persons (e.g. staff, customers) to endorse
their petrol or appear in their advertisements.
Advertisers seek to enhance the quality of message by relying on the source’s attributes or
characteristics, which was said to have profound influence on individuals’ attitudes after advert
exposure (Wu, Huang, Li, Bortree, Yang, Xiao and Wang, 2016). The attributes or
characteristics of a spokesperson include credibility, power, expertise, trustworthiness,
likeability, attractiveness and similarity (Belch & Belch, 2017; Clow & Baack, 2016). Most
sources do not score highly on all the attributes, yet they need to score highly on multiple
characteristics to be viewed as believable and acceptable. According to Yilmaz, Iscioglu and
Bodur (2011) source can be classified into two major categories, namely source credibility and
source likeability, with the remaining attributes becoming their dimensions or yardsticks. The
following sections discuss the source credibility and likeability:
2.4.1.1 Source credibility
Source credibility advocates the communicator’s specific and positive qualities that adhere to
the recipient’s acceptance and belief of a message (Bhatt et al., 2013; Fleck et al., 2012; Singh
& Banerjee, 2018). Credibility refers to the extent of which the receiver sees the source as
having relevant knowledge, skill or experience, and trusts the source to give unbiased, objective
information (Belch & Belch, 2017; Bird, 2004). Source credibility is described as either a
categorical variable (where individuals are presented as having high or low credibility) or a
construct with multiple dimensions (Bhatt et al., 2013). This study adopts the latter approach,
on the basis that commonly used single-item measures lack reliability and validity, and single-
item scales do not contribute to understanding likeability as a multidimensional concept
(Nguyen, Ekinci, Simkin & Melewar, 2015).
The two most enduring dimensions to explain credibility – be it corporation or person – which
formed the focus of this study, are expertise and trustworthiness (Sallam, 2011; Wu et al., 2016;
Yilmaz et al., 2011). The source credibility model signified that the effectiveness of a message
depends on the perceived level of expertise and trustworthiness of the sender (Amos et al.,
2008; Erdogon, 1999; Fleck et al., 2012; Hovland & Weiss, 1951; Ohanian, 1990). Expertise
refers to the receiver’s perception of the source’s qualifications, knowledge and experience to
provide a credible statement (Bird, 2004). Lin (2011) defines an expert as a person who is an

29
authority in his/her own professional field. Information from a sender with a high level of
expertise is assumed to be more credible as the receiver of the information has no reasons to
doubt the correctness given the knowledge and competence of the sender (Ismagilova, Slade,
Rana & Dwivedi, 2020). Trustworthiness represents the degree of confidence or the level of
acceptance consumers place in the spokesperson’s message (Clow & Baack, 2016). A
trustworthy reviewer is considered more credible as they show a high degree of objectivity and
sincerity, thus the receiver has no reason to question the validity of the information provided
(Ismagilova et al., 2020). Amos, Holmes and Strutton (2008) suggest that when considered
jointly, expertise and trustworthiness are presumed to embody the source credibility construct.
Source credibility can be conceptualized as a “weight” that can enhance the value of
information in a message (Sallam, 2011). Information from a credible source influences beliefs,
opinions, attitudes, and/or behaviour by way of an internalisation process, which occurs when
the receiver adopts the opinion of the of the credible communicator as he or she believes
information from this source is accurate (Belch & Belch, 2017; Bhatt et al., 2013). Source
credibility influences message processing and persuasion mainly when recipients are not
particularly motivated to process the message – which is normally the case with advertising
messages (Fennis & Stroebe, 2015). Furthermore, a highly credible communicator is
particularly important when message recipients have a negative position toward the company,
product, service or issue being promoted, since the credible source is likely to inhibit
counterarguments (Belch & Belch, 2017). Source credibility has prominent effects on attitudes
towards the advertisement, brand attitudes and purchase intentions, (Amos et al., 2008; Bhatt
et al., 2013; Singh & Banerjee, 2018; Wu et al., 2016).
2.4.1.2 Source likeability
Source likeability, as a persuasion tactic and a scheme of self-presentation (Nguyen et al.,
2015), is generally described as the ability to create a pleasant and enjoyable perception
(Yilmaz et al., 2011). Nguyen, Ekinci, Simkin and Melewar (2015) also portray source
likeability as a multidimensional construct with cognitive and affective components.
Likeability is defined as the recipient’s feeling of affection towards the source, attributed to the
source’s physical appearance, behaviour and other personal traits (Amos et. al, 2008; Lin,
2011; Bhatt et al., 2013; Nguyen & Nguyen, 2017). Some studies treated likeability as

30
analogous to attractiveness, friendliness, similarity and familiarity (Amos et al., 2008; Bhatt et
al., 2013; Nguyen & Nguyen, 2017; Yilmaz, 2011;).
Attractiveness is generally associated with a person’s physical appearance, such as height,
weight and facial beauty, which are the first expressions perceived by another (Bhatt et al.,
2013). According to Belch and Belch (2017), advertisers often draw attention to their ads by
featuring a physically attractive person who serves as a passive or decorative model rather than
as a communicator. Some researchers opine that attractiveness transcends physical attributes:
it also requires personality, art talents, mental skills, athletic ability and lifestyle (Amos et al.,
2008; Nguyen & Nguyen, 2017). Similarity is a supposed resemblance between the source and
the receiver of the message, which is measurable if the source and receiver have similar needs,
goals interest and lifestyle (Bhatt et al., 2013). People will be more easily influenced when they
find the similarity between them and the message source (Nguyen & Nguyen, 2017).
Familiarity means the feeling of similarity by means of emotions and contact with a source
through exposure (Bhatt et al., 2013; Nguyen & Nguyen, 2017). Kunkel, Walker and Hodge
(2019) deem likeability as an overall/aggregate evaluation of liking a person amid the physical
appearance, similarity and familiarity. Therefore, likeability is chosen as another construct
besides credibility to measure source in this study. Other characteristics used to measure
likeability include friendliness, approachability, agreeableness, sincerity, warmness and
charisma (Nguyen et al., 2015; Yilmaz et al., 2011).
Source likeability leads to persuasion through a process of identification, whereby the receiver
is motivated to seek some type of relationship with the source and thus adopts similar beliefs,
attitudes, preferences or behaviour (Belch & Belch, 2017; Bhatt et al., 2013). Unlike
internalisation, identification does not usually integrate information from a likeable source into
the receiver’s belief system. The receiver may maintain the attitudinal position or behaviour
only as long as it is supported by the source or the source remain likeable (Belch & Belch,
2017). Evidence shows that likeable sources score higher on attitude change than neutral
sources, and likeability of a spokesperson in an ad correlates positively with attitudes towards
advertisement, brand attitude and willingness to purchase (Yilmaz et al., 2011). Moreover,
researchers posit that likeability concerns all phases; pre-, during and post-purchase and
consumption (Nguyen et al., 2015).

31
2.4.2 Advertising message
Message is the integral part of an advertisement that attempts to convey the intent of the
advertiser to the target audience through visuals and/or verbals (Ruchi, 2012). O’Guinn, Allen,
Semenik and Scheinbaum (2014) describe the intent or goals of the advertiser and how those
goals will be achieved as the message strategy. Clow and Baack (2016) posit message strategy
into three broad categories; cognitive, affective and conative approaches, which correspond to
the components of attitudes as discussed previously in Section 2.3. These message strategies
are summarised in Table 2.2 below.
Table 2.2 The message strategies in relation to components of attitudes
Component /
hierarchy of effects Uses Instrument
stages
Cognitive
Affective
Conative
___________________________________________________________________________
Source: (Clow & Baack, 2016)
Purchase
Incite consumer response /
encourage action
The goal is to make sale
Support other promotional
effort e.g. coupon
redemption, cash back
rebate
Awareness
Knowledge
Presents rational
arguments or pieces of
information to consumers
Require cognitive
processing
Describe the product’s
attributes or benefits
Generic
Pre-emptive
Unique selling value
proposition
Hyperbole
Comparative
Liking
Preference
Conviction
Evoke feelings or
emotions and match those
feelings with the product,
service or company
Enhance the likeability of
the product, recall of the
appeal or comprehension
of the advertisement
Resonance
Emotional

32
An advertisement that directly promotes the product’s attributes or benefits without any claim
of superiority transmits a generic message, which works best for a brand leader firm or one that
dominates the industry (Clow & Baack, 2016). On the other hand, a pre-emptive message
claims superiority by highlighting a product’s specific attribute or benefit with the intent of
preventing competitors from making a similar statement (Clow & Baack, 2016). A message
with a unique selling proposition has an explicit, testable claim of uniqueness or superiority
that can be supported or substantiated in some manner (O’Guinn et al., 2014). On the other
hand, hyperbole is an untestable claim based on some attribute or benefit, and often uses
puffery terms like “best” or “greatest” (Clow & Baack, 2016). A comparative advertisement
allows an advertiser to directly or indirectly compare a product to the competition using some
product attribute or benefit (Belch & Belch, 2017; O’Guinn et al., 2014). Clow and Baack
(2016) define resonance advertising as connecting a brand with a consumer’s experience in
order to develop stronger ties between the product and the consumer, while the emotional
affective approach attempts to elicit powerful emotions that lead to product recall and choice.
Conative advertisements are intended to trigger action for making sales.
Akbari (2015) refers to message strategy as the appeal, or general overall approach adopted by
the advertisement. Advertising appeals are part of a creative strategy of advertising that forms
the theme of a certain advertised message to attract the attention of potential consumers,
efficiently influence their awareness, beliefs and attitude towards the advertised product, and
consequentially, the purchase intention (Javanovic et al., 2016). Appeals need to be unique and
need to give a positive impression about the product to the target audience (Akbari, 2015).
Advertising appeals are the driving power that can influence the way consumers view
themselves and how buying certain products can be of value to them (Lin, 2011; Sadeghi et al.,
2015). Different appeals evoke some emotional reaction and desire in the target audience
towards a product or services (Akbari, 2015). Among the advertising appeals featured
throughout the years are rational, emotional, humourous, fearful, musical, sexual and scarcity
(Clow & Baack, 2016). Despite the numerous advertising approaches, Kotler and Keller (2015)
classify advertising appeal into two categories; rational and emotional(based on the underlying
benefits consumers gain from paying attention to the advertisement or purchasing a
product/services.
This study perpetuates the classification to focus only on the rational and emotional appeals.
The selection of these two appeals are twofold: firstly, they are the most used tactics in

33
advertising and secondly, the assumption that consumers make their purchasing decisions
based on rational or emotional motives, and that those beliefs and attitudes which influence the
purchase intentions contain a cognitive (rational) and an affective (emotional) component
(Akbari, 2015; Jovanovic et al., 2016; Lin, 2011; Sadeghi et. al, 2015; Zhang et al., 2014).
Moreover, Belch and Belch (2017) opine that effective advertising requires combining
practical reasons for purchasing a product with emotional values, indicating the prominence of
both rational and emotional appeals. These appeals also correspond to the functional and
emotional benefits that consumers gain from advertisements, as discussed earlier in Section
2.3.1. There is consensus in investigations that the type of appeal must be consistent with the
product for maximum effectiveness – rational appeal is more effective for a useful product in
practice, and emotional appeal is appropriate for experimental products or those that confirm a
value (Borborjafari, Khorshid & Rastegar, 2016). Likewise, Jovanovic, Vlastelica and Kostic
(2016) indicate that rational appeal alone sometimes is not adequate for certain products,
especially those perceived as not that differentiated from the products of their competitors in
functionality, olfactory or technical characteristics – which is the case for the fuel industry.
Most fuel companies highlight their product attributes, services and offerings under rational
messages, while injecting customer experience, and “local is lekker” sentiment as part of
emotional elements. The succeeding sections deliberate the rational and emotional appeals:
2.4.2.1 Rational appeal
Lin (2011) defines rational appeals as functional, informative or logical, and focus on the
attributes of a product or service that benefit consumers. Zhang, Sun, Liu and Knight (2014)
describe rational appeal as a straightforward presentation of factual information, characterized
by objectivity. Advertising messages that feature rational appeal will emphasise the product or
service characteristics, as well as concrete benefits that consumers would get if they opt for the
advertised product or service such as quality, performance, value, economy and reliability
(Jovanovic et. al, 2016; Kotler & Armstrong, 2014). Borborjafari, Khorshid and Rastegar
(2016) indicate that rational appeal is suitable for goods where the purchaser is interested to
know its technical details and operation. By reason of its informative nature, companies use
rational appeal when they wish to persuade potential consumers that the advertised product is
superior in certain characteristics or advantages it offers, compared to the one made by their
competitors (Jovanovic et. al., 2016; Kazmi & Batra, 2009). Rational appeals in advertising
can be classified into one of the following categories: feature appeal, competitive advantage

34
appeal, favourable price advantage appeal, news appeal and product popularity appeal (Belch
& Belch, 2017; Jovanovic et al., 2016; Akbari, 2015; Kazmi & Batra, 2009).
In relation to the response models discussed in Section 2.3, a message with rational appeal
follows the hierarchy of effects stages (Clow & Baack, 2016), and is particularly appropriate
when the communication objective is awareness or comprehension of a product, service or an
issue, since facts trigger information processing (Noble, Pomering & Johnson, 2014). Clow
and Baack (2016) suggest that an ad oriented to the knowledge stage transmits basic product
information, while in the preference stage, the message shifts to presenting logical reasons that
favour the brand – such as superior gas mileage of a particular fuel. Studies have shown that
individuals with a high need for cognition remember the information better, and use their
thinking in processing and evaluation of advertising information more than those with a low
need for cognition, which fits the rational appeal strategy (Borborjafari et al., 2016; McKay-
Nesbitt, Manchanda, Smith & Huhmann, 2011; Ruiz & Sicilia, 2004). Generally, rational
appeal succeeds when potential customers have a particular interest in the product or brand,
exhibit high levels of involvement and are willing to pay attention to the advertisement. If this
does not happen, people tend to ignore rational appeal ads (Clow & Baack, 2016). McKay-
Nesbitt, Manchanda, Smith and Huhmann (2011) indicate that younger adults better like and
recall rational as opposed to emotional appeal. Conversely, gender doesn’t have significant
bearing response to messages with rational appeal, as the focus is on the presentation of
information and expectation that the audience will elaborate on the factual content (Noble et
al., 2014). A rational advertisement should lead to stronger conviction about a product’s
benefits, so that the consumer eventually makes the purchase (Clow & Baack, 2016).
2.4.2.2 Emotional appeal
Emotional appeal, on the other hand, associates with emotions and feelings which can be
further differentiated in terms of valence: positive (e.g., joy, warmth, happiness, pride) or
negative (e.g., fear, guilt, worry) to encourage certain behaviour (McKay-Nesbitt et al., 2011;
Zhang et al., 2014). Positive emotional appeals in an advertising message focus on benefits and
advantages for the consumers of using the advertised product, while the negative emotional
appeals emphasize danger, and negative consequences that can occur if the consumers do not
use the advertised product (Jovanovic et al., 2016; Padhy, 2011). A number of needs and
connected feelings can be used as a basis for emotional appeals in advertising (Kazmi & Batra,

35
2009). Emotional appeals target the psychological or social needs of the consumer to cause
positive or negative emotions that could lead to purchasing (Kotler & Armstrong, 2014; Lin,
2011). Psychological or personal needs can be in the form of happiness, love, joy, security,
safety, pride, excitement, attraction, pleasure, accomplishment, confidence and ambition
(Jovanovic et al., 2016). While social and symbolic feelings could include respect, status,
recognition, involvement, sense of belonging, affiliation, shame and rejection (Jovanovic et al.,
2016).
Emotional appeal is based on three ideas; first, consumers ignore most advertisements, second,
rational appeals go unnoticed unless the consumer is in the market for a particular product at
the time it is advertised, third and most important, emotional advertising can capture a viewer’s
attention and create an emotional attachment between the consumer and the brand (Clow &
Baack, 2016). Emotions can be more important than attributes, functions or features of the
advertised product (Sharma & Singh, 2006). Emotional appeal, whether “cold’’ or “warm’’
can be effective, where a warm appeal stimulates the purchasing intent, and the cold one
positively influences the change in attitude, persuasion and consequential behaviour in
purchasing (Jovanovic et al., 2016; Lovric, 2016). Most creatives view emotional advertising
as the key to brand loyalty (Clow & Baack, 2016). The use of emotional appeals in the case of
products which are not that differentiated harness a unique emotional proposition instead of a
unique selling proposition (Jovanovic, et al., 2016; Kazmi & Batra, 2009). McKay-Nesbitt,
Manchanda, Smith and Huhmann (2011) indicate that older adults better like and recall
emotional than rational appeals. Studies have shown that males and females are likely to
respond to emotional message appeals differently, with females being more aware of their
emotional state and place greater emphasis on insights gained from their emotions (Kemp,
Kennett-Hensel & Kees, 2013; Noble et al., 2014). Clow and Baack (2016) posit that music,
visual as well as peripheral cues are important components of emotional appeals, and can be
incorporated to make an advertisement more dramatic to capture viewers’ attention.
2.4.3 Advertising channel
The final controllable element of the communication process in advertising is the channel.
Rodgers and Thorson (2019) define advertising channel as the medium used to deliver message
to the target audience. Communication theorist Marshall McLuhan’s thesis, “The medium is
the message”, implies that the medium communicates an image which is independent of any
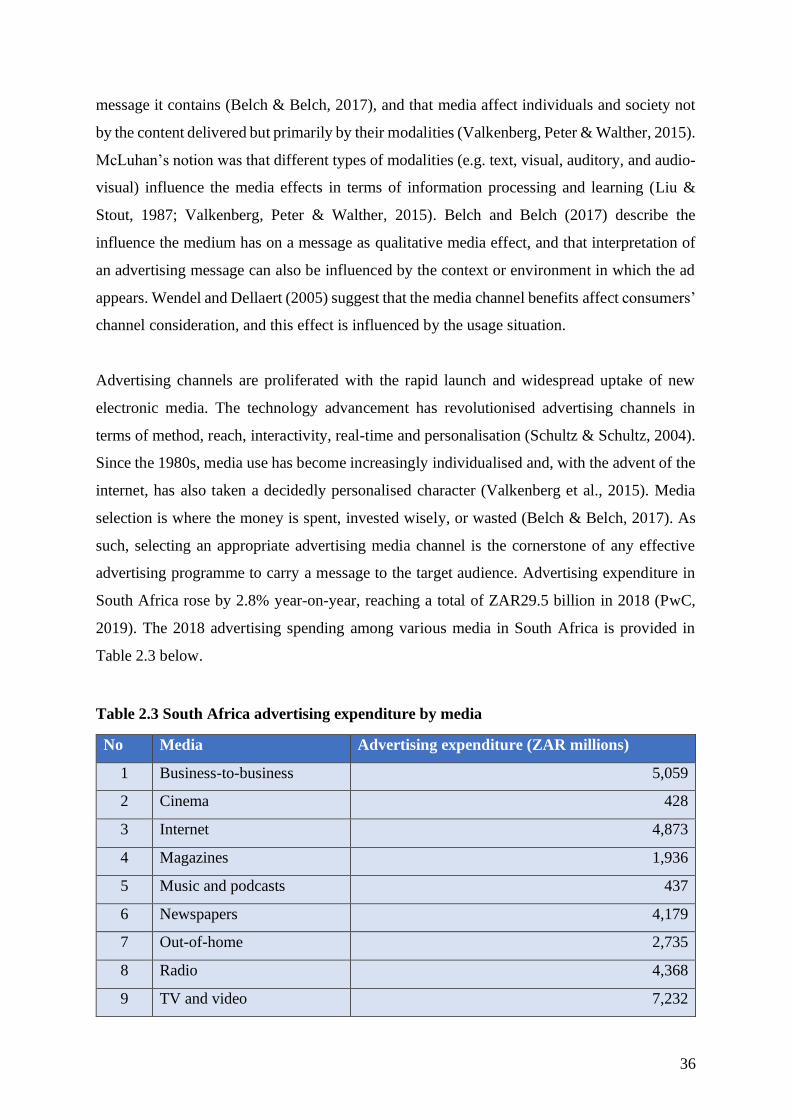
36
message it contains (Belch & Belch, 2017), and that media affect individuals and society not
by the content delivered but primarily by their modalities (Valkenberg, Peter & Walther, 2015).
McLuhan’s notion was that different types of modalities (e.g. text, visual, auditory, and audio-
visual) influence the media effects in terms of information processing and learning (Liu &
Stout, 1987; Valkenberg, Peter & Walther, 2015). Belch and Belch (2017) describe the
influence the medium has on a message as qualitative media effect, and that interpretation of
an advertising message can also be influenced by the context or environment in which the ad
appears. Wendel and Dellaert (2005) suggest that the media channel benefits affect consumers’
channel consideration, and this effect is influenced by the usage situation.
Advertising channels are proliferated with the rapid launch and widespread uptake of new
electronic media. The technology advancement has revolutionised advertising channels in
terms of method, reach, interactivity, real-time and personalisation (Schultz & Schultz, 2004).
Since the 1980s, media use has become increasingly individualised and, with the advent of the
internet, has also taken a decidedly personalised character (Valkenberg et al., 2015). Media
selection is where the money is spent, invested wisely, or wasted (Belch & Belch, 2017). As
such, selecting an appropriate advertising media channel is the cornerstone of any effective
advertising programme to carry a message to the target audience. Advertising expenditure in
South Africa rose by 2.8% year-on-year, reaching a total of ZAR29.5 billion in 2018 (PwC,
2019). The 2018 advertising spending among various media in South Africa is provided in
Table 2.3 below.
Table 2.3 South Africa advertising expenditure by media
No Media Advertising expenditure (ZAR millions)
1 Business-to-business 5,059
2 Cinema 428
3 Internet 4,873
4 Magazines 1,936
5 Music and podcasts 437
6 Newspapers 4,179
7 Out-of-home 2,735
8 Radio 4,368
9 TV and video 7,232

37
10 Video games 70
11 E-sports 38
Total 29,509
Source: (PwC, 2019)
Due to a growing number of advertising media – as well as increase in prices for advertising
time and space, and virtually stagnant advertising budgets within firms – it is becoming
increasingly important for companies to make decisions about the allocation of their
advertising spend across different media channels (Clow & Baack, 2016; Danaher & Rossiter,
2011; Schreiner, Rese & Baier, 2019). Therefore, it is crucial to investigate the effectiveness
of advertising messages, and in particular of personalised advertising across different media
channels in order to derive recommendations for companies on how to best approach
customers, as stronger demands for results and accountability emerged (Clow & Baack, 2016;
Schreiner et al., 2019).
Communication channels differ in their trustworthiness, authenticity and many other attributes
(Danaher & Rossiter, 2011). Clow and Baack (2016) suggest that when choosing a particular
media, marketers should consider the number of consumers the media reaches, the frequency
they are exposed to the channel, opportunity to see, media expenditure, continuity and the
impact of advertising campaigns (e.g. rating, impression) on such media. Danaher and Rossiter
(2011) also suggested it is possible that the channels’ evaluations depend on the demographic
status of the respondent, especially for the newer channels. Advertising channels can be
classified into various categories; offline versus online (Naik & Peters, 2009), traditional versus
new/online media (Danaher & Dagger, 2013) and personal versus non-personal (Belch &
Belch, 2017). The major fuel companies in South Africa have embraced multiple channels
under these categories in their advertising strategy. The traditional and online channels
categorisation is applied in this study to gather information about the medium that carry the
fuel ad recalled by participants. Although channel only serves as a moderating variable in this
study, the benefits and limitations of both traditional and online channels are presented in
Annexure E and F respectively to provide wholeness to the investigation.

38
2.5 ATTITUDE
An attitude is a mental position taken toward a topic, person, or an event that influences the
holder’s feelings, perceptions, learning processes and subsequent behaviour (Clow & Baack,
2016; O’Guinn et al., 2014). Attitudes consists of three components; cognitive, affective, and
conative or behavioural (Clow & Baack, 2016; Zikmund et al., 2013). The cognitive
component represents one’s awareness of, and knowledge about, an object. The affective
component reflects an individual’s general feelings or emotions toward an object. The
behavioural component includes buying intentions and behavioural expectations, and reflects
a predisposition to action. Attitudes are important to marketers/advertisers because they
theoretically summarise a consumer’s evaluation of an object (or brand, or company) and
represent positive or negative feelings and behavioural tendencies (Belch & Belch, 2017).
Attitudes reflect the consumer’s personal values or beliefs about an object. The values underpin
the attitudes, which make it a relatively stable and enduring predisposition for consumers to
behave in a particular way (Sallam & Algammash, 2016). Attitudes can drive purchase
decisions. A consumer holding a positive attitude toward a brand becomes more likely to buy
it (Goldsmith, Lafferty & Newell, 2000). Someone who enjoys an advertisement will also be
more inclined to purchase the product.
Most marketing managers hold the intuitive belief that changing consumers’ or prospects’
attitudes toward a product is a major marketing goal, as collective attitude change translates to
aggregate sales volume changes. Advertising and promotions are used to create favourable
attitudes towards new products/services or brands, reinforce existing favourable attitudes,
and/or change negative attitudes (Belch & Belch, 2017; O’Guinn et al., 2014). The source
characteristics, message strategy and applicable broadcasting channel can be targeted at
respective components of attitudinal change to resonate with the receiver. For example,
messages with rational appeal provide cognitive linkage to stimulate awareness, while
messages featuring emotional appeal evoke the affective component. Attitudes are hypothetical
constructs; which means the variables can be measured indirectly, even though they are not
directly observable. Numerous methods for measuring attitudes have been developed, such as
ranking, rating, sorting, and choice techniques (Zikmund et al., 2013). This study examined
consumers’ and prospects’ attitudes towards fuel advert and brand using hypothetical
constructs based on rating (measuring the influence of the controllable elements in advertising
39
effectiveness and impact on their fuel purchase intention). The attitude towards the
advertisement and attitude towards the brand are discussed separately below.
2.5.1 Attitude towards the advertisement (ATA)
Attitude towards the advertisement is defined as the predisposition to respond in a favourable
or unfavourable manner to a particular advertising stimulus during certain exposure situation
(Lee et al., 2017; Sallam & Algammash, 2016). Lin (2011) defined advertising attitude as a
continuously reactive orientation learned from a certain object, where such orientation
represents an individual’s personal standards such as like and dislike, and/or right and wrong.
An attitude is regarded as having two components; belief about a topic or a phenomenon
followed by an evaluative factor (Usman, 2019). Belief is the knowledge and feelings from
frequent observation, and attitude is a conclusion of belief to be true or false, positive or
negative, favourable or unfavourable (O’Guinn et al., 2014; Usman, 2019). Attitude towards
advertisement is a process of turning belief into attitude, which then triggers the behaviour after
consumers’ exposure to the ad (Usman, 2019).
A good advertisement can change one’s perception, as proven by a New York advertising
agency, who have managed to associate the public’s perception of diamonds with romance,
and a symbol of commitment and everlasting love (Sallam & Algammash, 2016). Usman
(2019) highlighted numerous studies that show perceptions towards advertising are somehow
influenced by demographic variables, such as:
• the middle- and lower- classes having more positive attitudes than the upper classes
(Initiative Media & BBC World, 2002)
• adults being more negative than youth (Grusell, 2007)
• youth having more positive attitudes towards ads than adults (Lysonski & Pollay; 1990;
Zhou et al., 2002)
• men being more negative than women (Grusell, 2007)
• female students having more negative attitudes towards advertising than male students
(Petroshius, 1986; Andrews, 1989)
• education level influencing negatively towards ads (Grusell, 2007)

40
Researchers have identified determinants of attitude towards the advertisement as:
• attitude toward ads in general
• attitude towards the advertiser
• assessment of the ads’ execution (message format)
• the mood evoked by the ads
• the viewers’ perceptions of the credibility and believability of the ads
• the extent to which the ads affects viewers’ encouragement and trigger their reaction
(Owhal, 2015; Raluca & Ioan, 2010)
Therefore, advertisers can influence consumers’ attitudes towards the advertisement by
leveraging on the advertising controllable elements (source and message, as discussed earlier)
to achieve maximum impact and return on investment. For example, messages in adverts may
affect the relationship between attitude towards the advertisement and attitude towards the
brand, specifically when consumers are not familiar with the advertised brand due to a lack of
prior knowledge on which to base their brand attitude evaluation (Ganesan et al., 2017; Sallam
& Algammash, 2016). Apart from the influence of advertising elements, Raluca and Ioan
(2010) also indicate that intimate use products, household products and long-term use products
most often influence advert attitude, despite insignificant differences among statistical
averages with other product/service categories. Fuel can be considered as a long-term product
based on the usage and importance in transporting/moving people around.
Numerous studies have also shown that advert attitude has a positive effect on brand attitude,
as well as purchase intentions (Lee et al., 2017; Raluca & Ioan, 2010; Sallam & Algammash,
2016; Singh & Banerjee, 2018; Yan et al., 2012). Raluca and Ioan (2010) suggest that advert
attitude affects brand attitude both directly and indirectly by shaping brand cognitions. Attitude
towards the advertisement often contributes to attitude towards the brand under both high and
low involvement on the part of the consumer, where, under low involvement conditions, the
feelings evoked by the ad are a major contributor to ad liking, while under high involvement
conditions, feelings and the ad’s usefulness jointly contribute to ad liking (Raluca & Ioan,
2010). While brand familiarity affects the relationship between advert attitude and brand
attitude differently, the impact of attitude towards the advertisement on purchase intention is
not only direct, but also applicable to both known and unknown brands, especially under
conditions of low involvement when affective responses are evoked (Goldsmith et al., 2000;

41
Sallam & Algammash, 2016). There can also be an indirect relationship between advert attitude
and purchase intention via brand attitude. It is affirmative that favourable advert attitude leads
to positive brand attitude, which subsequently triggers purchase intention (Abdul Wahid &
Ahmed, 2011; Sallam & Algammash, 2016).
2.5.2 Attitude towards the brand (ATB)
Attitude towards the brand is the customer’s belief in attributes of the brand (Ganesan et al.,
2017). Foroudi (2019) defines brand attitude as consumers’ favourable or unfavourable
responses to a particular brand, which is impacted by aroused associations and beliefs that
create reputation towards the brand. Consumer brand attitude is viewed as a process of
perception and acceptance (Chaoying et al., 2011). It is a summary of evaluation that reflects
preferences for various products and services (O’Guinn et al., 2014). Spears and Singh (2004)
suggest that attitude towards the brand is different from feelings elicited by the brand, but a
relatively enduring, unidimensional summary evaluation of the brand that presumably
energises behaviour. Brands are valuable, acting as marketers of the companies’ offering in
influencing consumer preferences, as well as being assets in a financial sense (Veloutsou,
2015). Brand image and user experience with the brand create attitude towards the brand, which
in turn help the customer to select a specific brand during purchase over competitors (Ganesan
et al., 2017).
The consumer-brand relationship can be seen as an indicator of brand engagement, as the
required emotional state and the interactivity with the brand have been captured through the
dimensions of brand relationship, emotional connection and communication with the brand
(Veloutsou, 2015). Consumers usually experience three stages of relationship with brands
before an emotional bond is developed (Belch & Belch, 2017). These stages are illustrated in
Figure 2.3 below.

42
Figure 2.3 Levels of relationship with brands
Source: (Belch & Belch, 2017)
The first stage indicates how consumers think about the brands in respect to product benefits.
This occurs, for the most part, through a rational learning process and can be measured by how
well advertising communicates product information. Consumers at this stage are not very brand
loyal and brand switching is common. At the next stage, the consumer’s judgment of a brand
has moved beyond the attributes or delivery of product/service benefits and assigns a
personality to the brand. The brand personality is formed based on the overt and covert cues in
advertising. The strongest relationship and goal of all marketers is the emotional attachment
consumers have with the brand, which can instil brand loyalty. Veloutsou (2015) suggests that
brand relationship mediates the link among brand evaluation, trust, satisfaction and loyalty.
The more a customer interacts with a brand, the more likely it is to affect the user’s attitude
towards the brand (Sheth, 2013). Veloutsou (2015) denotes that consumer–brand relationships
exist in various contexts, especially in well-defined groups of consumers and sub-cultures.
Some of the examples quoted by Veloutsou (2015) include; gay men supporting their
community members through positive emotions and reciprocity towards brands perceived as
allies, while in negative relationships with other brands (enemies), children developing strong
links with brands between middle childhood and early adolescence, and these childhood
memories influencing lifelong brand relationships.
When consumers evaluate alternatives using their evoked set and the company’s brand
becomes the part of the set being considered, the advertisement succeeds (Clow & Baack,
2016). Ganesan, Sridhar and Priyadharsani (2017) posit brand familiarity, brand credibility and
brand choice are the components that not only determine attitude towards the brand, but also
Emotions
Personality
Product Benefits

43
mediate the relationship between advert attitude and brand attitude. Since the relationship
between advert attitude and brand attitude has been discussed in an earlier section, it will not
be elaborated further here, focusing instead on the relationship between attitude towards the
brand and purchase intention. Attitudes toward a brand often affect consumers’ purchase
intention. A positive attitude toward a particular brand motivates consumers to make a purchase
against competing brands – likewise, a negative attitude will have an adverse effect on
consumers’ decision to purchase (Lee et al., 2017; Sallam & Algammash, 2016; Singh &
Banerjee, 2018; Yan et al., 2012).
2.6 PURCHASE INTENTION
At some point in the buying process, the consumer must stop searching for evaluating
information and make a purchase decision. Purchase intention or predisposition to buy a certain
brand is an outcome of the alternative evaluation stage (Belch & Belch, 2017). Akbari (2015)
defines purchase intention as the likelihood that consumers will buy a particular brand versus
competing products in future. Purchase intentions are generally based on matching of purchase
motives with attributes or characteristics of brands under consideration, and include personal
sub-processes such as motivation, perception, attitude formation and integration (Belch &
Belch, 2017). Intention and attitude differ; whereas attitude is a summary of evaluations,
intention is an individual’s conscious plan to exert effort to purchase a brand (Spears & Singh,
2004). Belch and Belch (2017) also caution that a purchase intention is not the same as an
actual purchase or behaviour. As such, attitude threshold needed for a subject to indicate a
favourable intent should be much lower than the threshold needed for behaviour (Spears &
Singh, 2004). Notwithstanding, purchase intent is closer to actual behaviour than attitudes, and
thus closer to the desired sales (O’Guinn et al., 2014).
The consumer’s level of involvement in the purchasing decision is another factor which bears
on the influence exerted by the advert and brand attitude (Raluca & Ioan, 2010). Belch and
Belch (2017) also highlight the impact of consumers’ level of involvement on their purchase
intention from a time perspective – often there is a time delay between the formation of a
purchase intention and the actual purchase. The time duration between the formation of
purchase intention and the actual purchase – particularly for highly involved and complex
purchases such as automobiles, personal computers and consumer durables – is longer (Belch

44
& Belch, 2017). In contrast, for nondurable, low-involvement items – such as consumer
package goods –t the time between the decision and the actual purchase may be shorter, while
nondurable, convenience items sometimes take place almost simultaneously with the purchase
(Belch & Belch, 2017).
Purchase intention can be used as a dependent variable for evaluating effectiveness on various
spheres and levels. It can be used to explain the purpose of running an advertisement (Kim &
Han, 2014), likewise to describe the purchase of products or services resultant from a match
between an advertisement and consumer (Chu, Kamal & Kim, 2013; Md Husin, Ismail & Ab
Rahman, 2016). It is also used to evaluate the impact of advertising (Khandelwal & Bajpai,
2013; Dehghani & Turner, 2015; Tehria, 2016), to determine the factors that trigger a purchase
(Mirabi, Akbariyah & Tahmasebifard, 2015; Shaouf, Lu & Li, 2016) as well as repurchase
(Kim, Galliers, Shin, Ryoo & Kim, 2012; Kumar & Gupta, 2016). Thus, purchase intention is
considered as an imperative dependent variable for appraising effectiveness on various levels
(Lee et al., 2017). This study examined the impact of advert and brand attitude on consumers’
purchase intent, riding on the reported positive linkages by other prevailing studies (Abdul
Wahid & Ahmed; 2011; Ganesan et al., 2017; Kaushal & Rakesh, 2016; Lee et al., 2017;
Sallam & Algammash, 2016).
2.7 OVERVIEW OF SOUTH AFRICA OIL INDUSTRY
The oil industry in South Africa is divided into three major activities; upstream, midstream and
downstream. The value chain of the petroleum industry is illustrated in Annexure G. Upstream
activities involve the exploration and initial production of crude oil; midstream covers the
transportation, processing, storage and distribution; while downstream activities include the
refining, transportation and marketing of end-user products (South African Petroleum Industry
Association [SAPIA], 2020). South Africa has no crude oil reserves of its own, and imports
about 60% of its crude oil requirements from the Middle East (e.g. Saudi Arabia, United Arab
Emirates, Qatar) and Africa (e.g. Nigeria, Angola, Ghana) (SAPIA, 2016). The breakdown on
sources of crude oil import by is provided in Annexure H. The country is also a significant
exporter of petroleum products, especially to neighbouring African countries like Botswana,
Namibia, Lesotho and Swaziland (SAPIA, 2016; SAPIA, 2018). The South African petroleum
industry accounts for R405 billion in turnover, R145 billion in duties and levies, R4 628 in

45
capital expenditure, R6 billion in annual payroll, 8.5% of national Gross Domestic Product
(GDP) and provides over 750 000 direct and indirect jobs, which account to almost 5% of the
total formal employment in this country (SAPIA, 2018).
Currently South Africa produces 5% of its fuel needs from gas, 59% from coal, 16% from local
crude oil refineries and the remaining balance from nuclear as well as renewable energy
(WhoOwnsWhom, 2019). South Africa has the second largest refining capacity in Africa after
Egypt, with more than 700 000 barrels per day combined (SAPIA, 2016). The supply of
petroleum products in the country comes mostly from domestic refineries – four on the coast
and two inland. The capacity and location of the refineries that make up the supply side is
provided in Annexure I (SAPIA, 2018). Petroleum products are moved from refineries by
pipelines, rail, sea and road to approximately 200 depots, 4 600 service stations and 100 000
direct consumers who are mostly farmers (SAPIA, 2020). The industry is complex in the sense
that not only its components comprise of activities that contribute to the economy, these
components also link and drive several other sectors’ economic contribution.
The major petroleum products that are sold in South Africa are petrol, diesel, jet fuel,
illuminating paraffin, fuel oil, bitumen and liquefied petroleum gas (LPG), with petrol and
diesel the major liquid fuels used as per Annexure J. The Department of Energy (DoE)
estimates that approximately 70% of petrol and diesel is consumed by the transport sector, and
in that sector, 98% of the energy consumed is derived from liquid petroleum fuels
(WhoOwnsWhom, 2019). The South Africa government regulates wholesale margins and
controls the retail price of petrol based on an import parity price formula. The domestic price
therefore is influenced by international crude oil prices, supply and demand for petroleum
products in international markets, as well as fluctuations in the rand/dollar exchange rate. (DoE,
2020). The diesel retail price on the other hand, is not regulated, although its retail margin is
estimated to be similar to the regulated retail margin on petrol (SAPIA, 2020).
2.7.1 Fuel retailing industry in South Africa
Sartorius et al. (2007) also describe the fuel retail sector as highly competitive, with low profit
margins and high stock turnover. The major players in the South African oil industry are Engen
Petroleum Limited, Shell South Africa, Chevron South Africa, BP Southern Africa, Total
South Africa, Sasol Oil and Petro SA (SAPIA, 2020). These companies are also integrated
members of SAPIA, as listed in Annexure K. They own refineries, and operate storage

46
terminals and distribution facilities throughout the country. The major oil companies in South
Africa sell about 50% of petrol, diesel and other liquid fuels to the retail market through petrol
stations on their own direct distribution network, branded-marketers/integrated wholesalers or
independent wholesalers (SAPIA, 2016). There are over 6 000 licenses issued and
approximately 4 600 service stations in South Africa (Esterhuizen, 2011; SAPIA, 2016). Engen
is the country’s largest fuel retailer and market leader, with an estimated market share of 26%
and approximately 1 039 service stations in South Africa (Engen, 2018).
The retail stations sell about 950 million litres of petrol and 830 million litres of diesel a month
(Esterhuizen, 2011; SAPIA, 2016). At the same time, customers often buy more than just fuel
when visiting a fuel retail station, and customer convenience appears to be driving the industry
(Sartorius et al., 2007). While fuel sales account to 50% of revenues, many oil companies and
service station owners rely on non-fuel offerings – such as convenience stores, food courts, and
car washes – or partner with retail and fast food brands to boost profit (Bello & Cavero, 2008;
Sartorius et al., 2007; WhoOwnsWhom, 2019). The major oil companies’ network and
offerings are provided in Annexure L.
Fuel is a commodity product and aspects like quality of fuel are essentially a hygiene factor,
not a differentiator (“South Africa’s petrol stations…”, 2020). Dugar (2013) echoes this
perception based on the following; fuels are deemed to be a commodity, with prices regulated
by the government, and consumers perceive the quality to be the same regardless of brand
name. Most consumers have no understanding of the fuel quality of the brands available, and
expect that they will get a product of appropriate standard at every fuel station. As such, fuel
is considered to be a product with low-involvement from customers. What is not a commodity
is the customer experience and the choice that consumers have – here the stakes are high to
attract the patronage of customers who are prepared to go out of their way to use a specific
brand because of the experience and perceived value they get at a particular fuel station (“South
Africa’s petrol stations…”, 2020).
Besides location, other factors that can influence customers’ experience and increase repeat
customers are quality and speed of service, general cleanliness and appearance, staff (skills,
knowledge, attitude), as well as rewards and value for money (Srivasta, Kumar & Bisht, 2019;
Sartorius et al., 2007; “South Africa’s petrol stations…”, 2020). Sartorius, Eitzen and Hart
posit that all these factors are even more important within a South African context, where price

47
is regulated and fuel stations need to differentiate themselves by a means other than fuel price
in order to maintain and increase market share. While Engen is the market leader with the
highest market share and footprint, there is no outright leader when it comes to customer
satisfaction. All the fuel station brands perform on par in terms of overall customer satisfaction
scores, with the exception of Caltex, which is below par (“South Africa’s petrol stations…”,
2020). This indicates that while fuel station brands deliver a high-quality experience for
customers, it is largely an undifferentiated experience. An ‘on par’ score refers to the fact that
there is no statistical difference compared with the rest of the industry (“South Africa’s petrol
stations…”, 2020).
2.7.2 Paradigm shift in fuel marketing
The idea of fuel price deregulation was proposed by the National Treasury as one of the various
initiatives to invigorate economic growth (National Treasury, 2019). Although a deregulated
environment may lead to lower fuel prices, it would however heighten competition among
wholesalers and retailers in determining their own pricing to attract customers (Sartorius et al.,
2007). While the matter is still being debated, the dynamics of fuel industry in South Africa
continue to evolve. As it is, the fuel retail market is already crowded with the major players,
wholesalers and private independent fuel retailers. In addition, the industry is seeing emerging
petroleum retail brands such as Quest Petroleum, Elegant Fuel, MBT Petroleum and Viva Oil
(WhoOwnsWhom, 2019). Consumers’ orientation in terms of perception and buying behaviour
is also changing. Customers expect on-the-go shopping, healthy food options and a
differentiated experience (Adhi et al., 2019; Boyle, 2019). They look for technology to
personalise, enhance and simplify their shopping experience (Boyle, 2019; Adhi et al., 2019).
The case of visionary companies in America turning fuel retail stations into more convenient
transitory stops or even final destinations by providing a variety of services through a ‘village
hub’ type service station is perhaps something that oil companies in South Africa could emulate
(Sartorius et al., 2007).
2.7.3 Advertising in fuel industry
According to Atkin (2019), the five biggest fossil fuel corporations in America spent a
combined $3.6 billion on advertisements from 1986 to 2015. These advertisements have served
to sell the public ideas rather than products, especially that fossil fuels are good and necessary;
48
and that the companies extracting and burning them are effectively fighting environmental
problems like air pollution and climate change (Atkin, 2019). BP, Chevron, ConocoPhillips,
Exxon and Shell have historically used advertising as a key part of their multi-pronged strategy
to oppose climate legislation in the United States (Atkin, 2019; Brulle, Aronczyk &
Carmichael, 2020). Geoffery Supran, a Harvard University researcher who co-authored a peer-
reviewed analysis of ExxonMobil's 40-year history of climate change communications, said
the fossil fuel industry's ad campaigns are state of the art propaganda developed in partnership
with public relations experts and based on almost a century of collaborative experience (Atkin,
2019). He was also quoted saying “oil companies run ads for one reason, and one reason only:
because they work” (Atkin, 2019).
Apart from advertising, fuel companies’ previous focus was primarily on expanding their
geographical coverage and strengthening their distribution network, by adding more forecourts
to their network in the name of marketing (Dugar, 2007). This is justifiable based on prevailing
factors such as the nature of the commodity, demand outweighing supply, administered pricing
mechanisms and a protected market (Dugar, 2007). Nowadays, this is no longer sustainable,
with intensifying competition among fuel retailers, consumers’ changing orientation, and rapid
challenges in the event of price deregulation. Petrol selling companies in India adopted more
aggressive marketing after liberalisation (price deregulation) due to an increase in competition
at the back of globalisation, privatisation, the entry of private players and a change in consumer
orientation (Dugar, 2013). Liberalisation also intensified the Spanish fuel sector when open
competition was introduced (Bello & Cavero, 2007). These experiences could serve as an
indication of what lies ahead for South African fuel companies in the event of price
deregulation.
Advertising can benefit fuel companies in numerous ways; brand building and marketing,
communicating their value proposition in terms of products, services and offerings to
differentiate their brands; influencing the consumer perception of fuel as a low involvement
commodity to high involvement brands; and emphasising customer experience and value-
addition to attract consumers to forecourts beyond the location factor, thereby inculcating
brand loyalty (Attri et al., 2012; Dugar 2007; Dugar, 2013). Advertising costs make up 0.50%
of gross profit, which is undertaken by the oil companies and recouped through the marketing
margin (Sartorius et al. 2007).

49
2.8 CHAPTER SUMMARY
Common perceptions among consumers are that fuel is an undifferentiated low commodity and
quality is the same (Dugar, 2007; Dugar, 2013). The South African fuel retail sector operates
in a highly competitive environment characterised by low profit margins and high stock
turnover, despite the regulated environment (Sartorius et al., 2007). As a result, fuel companies
and service stations turn to non-fuel product offerings and services to boost their profit. Fuel
retailers in South Africa include major brands such as Engen, Caltex, Shell, BP, Total, Sasol
and other independent players. The onus is on the oil companies to differentiate and promote
their product through effective advertising that can influence consumers’ purchase intention,
especially if the market is liberalised in future. Notwithstanding the other factors that influence
consumers’ choice of fuel, advertising is key is changing customer belief, perception and
attitude. By gaining insights on what resonates with consumers in terms of source and
advertising message appeal, the fuel companies can create an impactful advert to influence
consumers’ attitude towards the advertisement, advertised brand and subsequently their
purchase intention. They can also better allocate their resources and make calculated decisions
pertaining to these controllable elements in line with their marketing strategy. The next chapter
elaborates on the research design, sampling strategy and methods undertaken to test the
conceptual framework of this study.

50
CHAPTER 3
RESEARCH DESIGN AND METHODOLOGY
3.1 INTRODUCTION
Businesses can attain and maintain a competitive advantage over their rivals through creative
use of market information. The information is gathered through marketing research, which
helps to refine ideas in strategy development and decision making by providing relevant,
accurate and timely information (Burns, Veeck & Bush, 2017). Malhotra (2010) defines
marketing research as the systematic process of gathering, recording and analysing information
to dissect a problem that requires a solution. Marketers view information as valuable input and
an asset to strategic and tactical planning of the business. This notion is reinforced by the
evidence-based management theory, which proposes that managerial decisions and
organisational practises should be supported with research instead of personal preference or
unsystematic experience (Bryman, Bell, Hirschsohn, Dos Santos, Du Toit, Masenge, Van
Aardt & Wagner, 2017). The primary objective of this study is to investigate the influence of
advertising controllable elements, specifically, source and message appeals on South African
consumers’ attitudes towards the advertisement, attitudes toward the brand and their purchase
intention for fuel.
Based on the literature review that was provided in the previous chapter, a proposed model
incorporating constructs relevant to the study was developed and subsequently tested. This
chapter outlines the research methodology used to collect and analyse data for the study,
including justification for the chosen methods. The chapter begins with a discussion on the
underlying concepts of the research paradigm, the design and the approach which guided this
research. This is followed by an explanation on the sampling procedure and data collection
process, as well as the techniques applied to analyse the data. Lastly, a recap of this chapter
with hints of the next chapter is provided.
3.2 RESEARCH PARADIGM
Research paradigm represents a set of fundamental beliefs and assumptions as to how the world
is perceived, which then serves as a guideline to conduct study and resolve research problems
51
(Alghamdi & Li, 2013; Makombe, 2017). The selection of paradigm determines the motivation,
intent and expectations for the research (Mackenzie & Knipe, 2006). Research paradigms are
classified into four main categories, namely, constructivism/interpretivism; transformative;
pragmatism and positivism (Alghamdi & Li, 2013; Creswell, 2014). These paradigms are
discussed in the following section:
3.2.1. Constructivism or interpretivism
Constructivism or interpretivism is subjective – individuals form understanding of the world
based on their own background, assumptions and experiences (Creswell, 2014; Wahyuni,
2012). Bryman, Bell, Hirschsohn, Dos Santos, Du Toit, Masenge, Van Aardt and Wagner
(2017) highlight the need to respect the differences between people and objects of the natural
sciences. The objectives of an interpretivist study are both emic and idiographic, resulting in a
narrative form of analysis with highly detailed accounts and specifics of a particular social
reality being studied (Wahyuni, 2012). Interpretivism paradigm is supported by observation
and interpretation using meaning (versus measurement) methodologies – such as interviews –
to collect data and make inferences for some abstract pattern (Antwi & Hamza, 2015).
3.2.2. Transformative
A transformative worldview is centred on the needs of individuals or groups in society that
may be marginalised (Creswell, 2014). This type of paradigm advocates critical analysis,
collaboration, as well as participation, and it utilises mixed methods to provide a more
comprehensive understanding of the social reality through the use of multiple lenses and
perspectives (Mackenzie & Knipe, 2006; Sweetman, Badiee & Creswell, 2010). The goal of a
transformative study is to help resolve gross power imbalances in the society such as injustice,
oppression, alienation, domination, and inequality, and move towards a fairer, democratic,
equitable and sustainable civilisation (Makombe, 2017; Taylor & Medina, 2019).
3.2.3. Pragmatism
Pragmatism is not compelled to any one system of philosophy and reality (Mackenzie & Knipe,
2006). Pragmatists believe that objectivist and subjectivist perspectives can be combined to
study social phenomena (Creswell, 2014; Wahyuni, 2012). Pragmatism allows freedom in the

52
selection of methods, procedures and techniques that best satisfy the needs and purposes of the
study (Alghamdi & Li, 2013).
3.2.4. Positivism
According to Bryman, Bell, Hirschsohn, Dos Santos, Du Toit, Masenge, Van Aardt and
Wagner (2017), positivism is an epistemological approach that advocates using scientific
methods to study and understand social reality in the same way as the natural reality. Positivism
involves problem identification, theoretical hypotheses proposition, and verification of these
hypotheses using methods such as investigation or experimentation (Makombe, 2017).
Positivistic study aims to derive an explanation that ultimately enables prediction and control
of events (Mackenzie & Knipe, 2006). Positivism is objective and promotes a statistical
generalisation to relate findings to a larger population (Creswell, 2014; Wahyuni, 2012).
This study adopted a positivist approach where the findings are compared to the stated
hypotheses. This study sought to investigate the influence of advertising controllable elements
on advert attitude, brand attitude and purchase intentions. The positivism paradigm is deemed
appropriate for this study because the objective of this research is to test the hypotheses.
Furthermore, this paradigm is heavily utilised in consumer research (Chang, 2017; Grix, 2018).
The research was undertaken in a value-free and etic approach, where the researcher
maintained an objective or neutral stance, and is independent of the data (Wahyuni, 2012).
3.3 RESEARCH DESIGN
Research design can be described as a framework of the research project, which guides data
collection and data analysis (Bryman et al., 2017; Creswell, 2014). Research design is the
master plan or detailed blueprint that stipulates the methods to be followed in executing the
study to meet its objectives (Aaker, Kumar, Day & Leone, 2011; Zikmund et al., 2013).
According to Malhotra (2010) as well as Sreejesh, Mohapatra and Anusree (2014), research
design can be classified into three broad categories, namely, exploratory, causal and descriptive
designs. These designs are illustrated in Table 3.1.
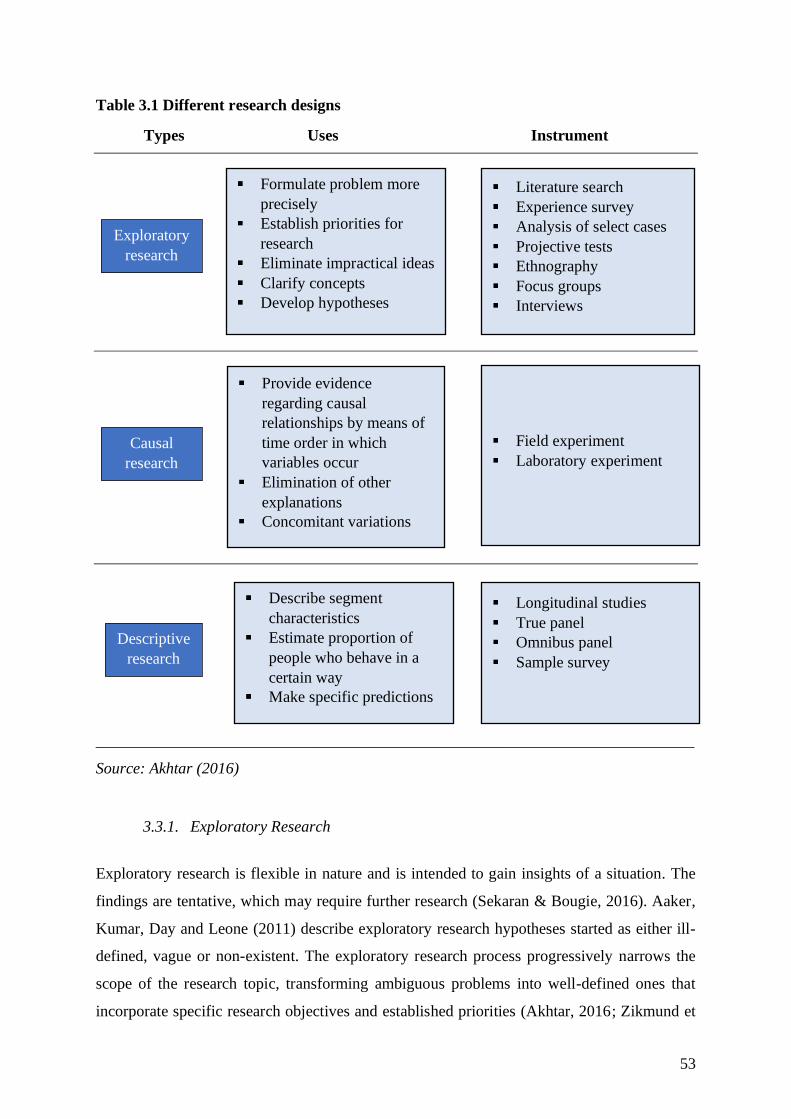
53
Table 3.1 Different research designs
Types Uses Instrument
___________________________________________________________________________
Source: Akhtar (2016)
3.3.1. Exploratory Research
Exploratory research is flexible in nature and is intended to gain insights of a situation. The
findings are tentative, which may require further research (Sekaran & Bougie, 2016). Aaker,
Kumar, Day and Leone (2011) describe exploratory research hypotheses started as either ill-
defined, vague or non-existent. The exploratory research process progressively narrows the
scope of the research topic, transforming ambiguous problems into well-defined ones that
incorporate specific research objectives and established priorities (Akhtar, 2016; Zikmund et
Descriptive
research
Describe segment
characteristics
Estimate proportion of
people who behave in a
certain way
Make specific predictions
Longitudinal studies
True panel
Omnibus panel
Sample survey
Exploratory
research
Formulate problem more
precisely
Establish priorities for
research
Eliminate impractical ideas
Clarify concepts
Develop hypotheses
Literature search
Experience survey
Analysis of select cases
Projective tests
Ethnography
Focus groups
Interviews
Causal
research
Provide evidence
regarding causal
relationships by means of
time order in which
variables occur
Elimination of other
explanations
Concomitant variations
Field experiment
Laboratory experiment

54
al., 2013). Akhtar (2016) suggests that hypotheses are developed after eliminating impractical
ideas and the concepts have been clarified. This type of research employs techniques such as
literature search, observations, experience survey, case study analysis, projective tests,
ethnography, focus groups and in-depth interviews which are part of qualitative research
methods (Aaker et al., 2011; Akhtar, 2016).
3.3.2. Causal Research
Causal research investigates the cause and effect relationship between variables, where the
research problem has been narrowly defined (Sekaran & Bougie, 2016). Zikmund, Carr and
Griffin (2013) indicate that casual research is structured, systematically planned and provides
statistically conclusive data. Akhtar (2016) suggests the causal relationships are demonstrated
by means of time order in which variables occur. Causal research eliminates other explanations
and allow for concomitant variations (Akhtar, 2016). This type of research tends to rely on
field and laboratory experimentation, and entails more specific hypotheses involving causal
relationships (Aaker et al., 2011; Akhtar, 2016).
3.3.3. Descriptive Research
Descriptive research describes characteristics of objects (e.g. organisations, persons,
products/brands), events or situations (Sekaran & Bougie, 2016). Zikmund, Carr and Griffin
(2013) highlight that descriptive research is often used to reveal the nature of consumer
behaviour. It estimates the proportion of people who behave in a certain way and makes
specific predictions (Akhtar, 2016). Descriptive research – which mostly uses longitudinal
studies, true or omnibus panels, as well as sample survey data – is differentiated by tentative
and speculative hypotheses to test relations that fall short of specifying causal relationships
(Aaker et al., 2011; Akhtar, 2016).
This study adopted descriptive design, which allows for the collection of primary data in large
amounts to build information that answers the research questions or hypotheses. It focused on
examining whether relationships exist between two variables in the hypotheses, based on the
occurrence of a specific conditions to ascertain the extent of differences in opinions, attitudes
and needs among the target population (Zikmund et al., 2013).

55
3.4 RESEARCH APPROACH
Creswell (2014) defines research approach as the plans and procedures that outline the steps
from broad assumptions to detailed methods of data collection, analysis and interpretation. The
selection of research approach is dependent on the nature of the research problem, linking the
intersection of research design, paradigm and specific method to response to the research
questions as illustrated in Figure 3.1 below. Numerous publications recognised three different
approaches in conducting research, namely, qualitative, quantitative, and a mixed method
research approach (Bryman et al., 2017; Creswell, 2014; Gay et al., 2012; Wilson, 2018).
Figure 3.1 Interconnection of research approach and method
Source: Adapted from (Creswell, 2014)
The features of each research approach is summarised in Table 3.2 below and elaborated
thereafter.
Table 3.2 Difference between qualitative, quantitative and mixed approaches
Factors/
Characteristics
Qualitative
approach
Quantitative
approach
Mixed
approaches
Research objectives Discovery and
identification of new
ideas, thoughts,
feelings; preliminary
insights on, and
Validation of facts,
estimates,
relationships,
predictions
Discovery and
identification of new
ideas, thoughts, feelings;
preliminary insights on,
and understanding of,
ideas and objects;
Paradigm Design
• Positivism
• Constructivism -
interpretivism
• Transformative
• Pragmatism
Research Approach
• Qualitative
• Quantitative
• Mixed Method
• Exploratory
• Causal
• Descriptive
Research Method
• Data collection
• Data analysis
• Interpretation
• Validation

56
understanding of,
ideas and objects
Validation of facts;
estimates; relationships;
and predictions
Types of research Normally
exploratory designs
Descriptive and
causal designs
Exploratory, descriptive
and causal designs
Types of questions Open-ended, semi-
structured, deep
probing
Mostly structured,
close-ended
Both open and closed
ended questions.
Types of execution Relatively short time
frames
Usually significantly
longer time frames
Usually significantly
longer time frames
Representativeness Small samples,
limited to the
sampled respondents
Large samples,
normally good
representation of
target populations
Large samples, normally
good representation of
target populations
Types of analysis Debriefing,
subjective, content,
interpretive, semiotic
analyses
Statistical
descriptive, causal
predictions and
relationships
Combination; depending
on the research types and
questions
Researcher skills Interpersonal
communications,
observations,
interpretive skills
Scientific, statistical
procedure translation
skills, subjective
interpretive skills
Interpersonal
communications,
observations, interpretive
skills, scientific,
statistical procedure
translation skills,
subjective interpretive
skills
Generalisability of
results
Very limited; only
preliminary insights
and understanding
Usually very good;
inferences about
facts, estimates of
relationships
Usually very good as it
provides insights and
estimates relationships
Source: (Hair, Black, Babin & Anderson, 2010)
3.4.1 Qualitative approach
A qualitative approach uses non-numerical data like narrative, open-ended, semi-structured,
deep, probing questions and visuals to gain insights into – and understand – a particular object
or phenomenon of interest (Gay et al., 2012; Hair et al., 2010). The constructionist-
interpretivist – along with transformative – paradigm supports the qualitative approach (Antwi
& Hamza, 2015; Creswell, 2014), and normally adopts exploratory design (Hair et al., 2010).
Qualitative approach employs an inductive methodology that focuses on the meaning
individuals or groups place on a social or human problem, including the complexity associated

57
with the problem (Creswell, 2014). It is conducted in a relatively short time frame with a small
group of sampled respondents (Hair et al., 2010). Hair, Black, Babin and Anderson (2010)
describe qualitative analysis as subjective and requiring debriefing, in addition to interpretation
of content and semiotics. Qualitative approach necessitates the researcher to have interpersonal
communications, observations and interpretive skills (Hair et al., 2010). Hair, Black, Babin and
Anderson (2010) also caution against generalising the result from qualitative approach as it is
very limited and offers only preliminary insights and understanding.
3.4.2. Quantitative approach
On the contrary, a quantitative approach relies on numerical data and closed-ended, structured
questions to describe, estimate, predict or control phenomena of interest (Gay et al., 2012; Hair
et al., 2010). The objectivist ontology and empiricist epistemology contained in the positivist
paradigm underpins quantitative approach (Antwi & Hamza, 2015), utilising causal – as well
as descriptive – designs (Hair et al., 2010). It emphasises deductive tactic to validate facts,
examine correlational relationships between variables, protect against biasness, control
alternative explanations and being able to generalise and replicate the findings (Creswell,
2014). A quantitative approach usually requires longer time frames and involves a large sample
of target population (Hair et al., 2010). The quantitative analysis emphasises statistical,
descriptive, causal predictions and relationships, therefore it is important for the researcher to
be equipped with scientific, statistical procedure translation and subjective interpretive skills
(Hair et al., 2010). Ultimately, the results from a quantitative approach can be generalised to
larger population based on inferences from facts to describe the relationships (Hair et al., 2010).
3.4.3 Mixed method approach
A mixed method or mixed-mode integrates the qualitative and quantitative approaches at
different stages of inquiry, connecting the two forms of data sets – open-ended and closed-
ended – in a single study (Mitchell, 2018; Wilson, 2018). Mixed method studies advocate
transformative (Sweetman et al., 2010) or pragmatic (Creswell, 2014) paradigm as basis for its
philosophical assumptions. It constitutes more than one type of research design among
exploratory, descriptive and causal designs; involves large samples, which give rise to longer
time frames required (Hair et al., 2010). According to Creswell (2014), the combination of
qualitative and quantitative approaches provides a more comprehensive analysis, as well as

58
understanding of a research problems than either approach could achieve on its own. The
researcher needs to be highly competent in both soft and technical skills to implement this
approach (Hair et al., 2010). Hair, Black, Babin and Anderson (2010) also indicate that the
results from mixed method study is usually very insightful and makes generalisation plausible.
This study undertook a quantitative approach, which tested the hypotheses (Creswell, 2014).
Subsequently, it involved the collection of numerical data to validate the relations between
theory and research deductively, using statistical analysis and interpretation to avoid biasness
(Bryman et al., 2017; Mitchell, 2018).
3.5 SAMPLING DESIGN AND PROCEDURE
Aaker, Kumar, Day and Leone (2011) define sampling as the process of appraising parameters
of a larger group (or dubbed as population) by reaching out to only a subset of that population.
This subset (otherwise called a sample) is a group of events, individuals or items that represents
the characteristics of the population from which the sample is drawn (Gay et al., 2012).
Sampling is adopted due to funding and time constraints, besides the impossible task to get
census from every member of the population (Aaker et al., 2011). The sampling design is a
framework used to determine the sample participants that should be selected for the study
(Sreejesh et al., 2014). The sampling procedure involves defining the target population of the
study, identifying the sample frame, selecting a suitable sampling technique, and determining
the sample size (Tustin et al., 2005). The following section describes the target population,
sampling method and sample size for this study.
3.5.1 Target population
Target population is a specified group of interest, from where information is obtained for the
study (Wilson, 2018), and consists of units like people, firms, cities, nations, regions, etc.
(Bryman et al., 2017). Aaker, Kumar, Day and Leone (2011) highlight certain rules for
consideration in defining target population, such as research objectives, reproducibility and
convenience. The target population for this study is South African residents who are minimum
18 years old (which is the legal driving age in the country) and drive any form of road vehicles
that necessitate fuel purchases. According to National Traffic Information System (eNaTIS),
there are 12 729 325 live vehicle population in South Africa as at 31 January 2020 (eNaTIS,

59
2020). In addition to having valid driving license and drive any form of road vehicle, the
respondents also have been exposed to any fuel brand advertisement in the last six months.
3.5.2 Sampling method
Sampling method is the mechanism for selecting the required sample to gain information about
a target population (Aaker et al., 2011). Sharma (2017) highlights certain factors to be
considered in choosing a sampling method, such as objectives of the study, size and nature of
the population, precision in desired result (including generalisation) as well financial
implications. The sampling method can be classed into two categories, namely probability and
non-probability sampling (Wilson, 2018).
Probability sampling uses a random selection where every member of the target population has
an equal chance of being chosen (Bryman et al., 2017; Wilson, 2018). According to Sharma
(2017), probability sampling is also known as random sampling, and although requiring more
work, it is much more accurate. The advantages of using probability sampling are the sample’s
representativeness, which allows variation due to a sample being used instead of a census of
population and a more explicit identification of possible biasness (Aaker et al., 2011). Simple
random sampling, systematic sampling, stratified sampling, cluster sampling and multistage
designs are among the various techniques available in probability sampling (Zikmund et al.,
2013).
On the other hand, non-probability sampling is not random, where some members of the
population are more likely to be selected than others (Bryman et al., 2017; Wilson, 2018).
Sharma (2017) claims that non-probability sampling is entirely based on judgment. Non-
probability sampling typically is used in situations such as exploratory stages of a research
project, dealing with a homogenous population, pretesting a questionnaire, when a researcher
lacks statistical knowledge and when operational ease is required (Aaker et al., 2011). Non-
probability sampling techniques include convenience sampling, judgement sampling, quota
sampling and snowball sampling (Zikmund et al., 2013). Table 3.3 illustrates the sampling
methods with their associated sampling techniques, and the advantages and disadvantages they
offer the researcher.

60
Table 3.3 Sampling methods and techniques
Sampling Method : Probability Sampling
Techniques Description Advantages Disadvantages
Simple
random
sampling
Each population
member has an equal
chance of being
selected, using
lottery/envelope
method or random
number table method
Unbiased / fair
selection
Minimal knowledge
of population is
needed
High
internal/external
validity
Easy to analyse data
Representative of
population
Requires
sampling frame
High cost
Large errors
compared to
stratified
sampling for
same sample size
Systematic
sampling
Sampling is done by
identifying the first
member randomly, and
then using a periodic
process to select every
nth member thereafter
from the sampling
frame
Moderate usage and
cost
Spreads the sample
more evenly over the
population
Easy to draw and
analyse sample
High
internal/external
validity
Hidden patterns
in data could
affect sample's
representativeness
If sampling
interval is related
to periodic
ordering of the
population, may
introduce
increased
variability
Stratified
sampling
The population is
divided into subgroups
or strata based on
shared attributes, and
then members are
randomly selected
from each strata
Strata reinforce
representativeness
Comparisons can be
made between strata
Reduces variability
from systematic
sampling
Results can be
generalised
Requires accurate
information on
proportions of
each strata
Stratified lists are
costly to prepare
Cluster
sampling
The population is
divided into subgroups
or clusters. A random
sample of clusters is
selected and all
members of the
Low cost
Frequently used
Practical when
dealing with large
population
Cluster selected
might not be
representative of
population
Likely to produce
more sampling
errors

61
clusters are
interviewed
Less dependent on
lists of distinct
sampling units
Multistage
sampling
Progressively smaller
areas are selected in
each stage by some
combination of the first
four techniques
Frequently used,
especially in
nationwide surveys
Depends on
techniques combined
High cost
Depends on
techniques
combined
Sampling Method : Non-probability Sampling
Techniques Description Advantages Disadvantages
Convenience
sampling
Sampling units are
selected based on
availability and
convenience of the
researcher
Cost and time
effective
Extensively used
No need for list of
population
Bias and
variability cannot
be measured or
controlled
Unrepresentative
samples – cannot
be generalised
Judgement
sampling
The sampling units are
selected based on their
appropriateness for the
target population of
interest and meet
specific objectives of
study
Moderate cost
Average use
Fast and convenient
Unrepresentative
of population –
inappropriate to
generalise beyond
sample
Quota
sampling
Sampling units are
classified based on
pertinent attributes, the
desired proportion to
sample from each class
is determined and fixed
as quotas for selection
Moderate cost
Very extensively
used
Similar to stratified
sampling but no need
for list of population
Unrepresentative
of population –
inappropriate to
generalise beyond
sample
Snowball
sampling
Initial sampling units
randomly selected,
additional sampling
units are obtained by
referrals from initial
sampling units
Low cost
Can collect samples
very quickly
Useful in locating
members of rare
populations
High biasness
Unrepresentative
samples – cannot
be generalised
Difficult to get
samples if no one
willing to
cooperate
Sources: Adapted from (Acharya, Prakash, Saxena & Nigam, 2013; Sharma, 2017; Zikmund
et. al, 2013)

62
This study employed the convenience technique of non-probability sampling method,
leveraging on its benefits of accessibility and practicality to the researcher (Bryman et al.,
2017). A convenience sample does not require a list of all the population elements (Acharya et
al., 2013). The population members were selected on the basis of proximity, ease of access and
willingness to contribute to the study. The convenience sampling technique is also
straightforward, requires less time to design and execute, and is inexpensive compared to
probability sample of the same size (Aaker et al., 2011).
3.5.3 Sample Size
Sample size (N) of the target population can be determined through the use of statistical
methods (Wilson, 2018) or ad hoc methods such as rule of thumbs and comparable studies
(Aaker et al., 2011). Bryman, Bell, Hirschsohn, Dos Santos, Du Toit, Masenge, Van Aardt and
Wagner (2017) caution that invariably a compromise will have to be made between the
constraints of time and cost, the need for precision and other considerations when deciding on
the sample size. The sampling method, be it probability or non-probability sampling, also
determines the choice of a sample size. Probability sampling procedures employ statistical
methods for sample size determination (Hair et al., 2008:274). On the other hand, non-
probability sampling procedure employs subjective methods such as historical evidence
approach, utilising comparable sample size used by others when studying similar constructs
(Churchill Jr, Brown & Suter, 2010:366).
In addition, the sample size consideration needs to take into account the minimum data
requirement for Structural Equation Modelling (SEM) and Confirmatory Factor Analysis
(CFA). According to Mundfrom, Shaw and Ke (2005), the minimum necessary sample size in
factor analysis is related to the number of variables, the number of factors, the number of
variables per factor, and the size of the communalities. While it is generally accepted that larger
samples are better (Comrey & Lee, 1992; Cudeck & O’Dell, 1994; Kline, 1994; MacCallum et
al., 1999; Velicer, Peacock, & Jackson, 1982), there is evidence that simple SEM models can
be meaningfully tested even if the sample size is quite small (Hoyle, 1999; Hoyle & Kenny,
1999). Some researchers consider 150 responses as the minimum sample size for conducting
SEM (Gorsuch, 1983; Tinsley & Tinsley, 1987; Anderson & Gerbing, 1988; Kline, 1994; Ding
et al., 1995; Tabachnick & Fidell, 2001; Muthen & Muthen, 2002), while others use an even
63
larger sample size N = 200 to perform the analysis (Boomsma & Hoogland, 2001; Hoogland
& Boomsma, 1998; Kline, 2011).
Drawing from the guidelines above, a final sample size of 200 was deemed appropriate. The
selected sample size is suitable for SEM analysis and comparative to similar studies that
utilised the following sample sizes; 150 participants (Sallam, 2011), 160 participants (Akbari,
2015), 175 participants (Zhang et al., 2014), 183 participants (Tran & Corner, 2016); 200
participants (Kamran & Siddiqui, 2019), 200 participants (Balakrishan et al., 2014) and 242
participants (Visentin et al., 2019).
3.6 DATA COLLECTION METHOD
Data collection methods are procedures utilised to gather data from the participants (Sreejesh
et al., 2014; Wahyuni, 2012). The data for this study was collected using a survey method in
the form of self-administered, web-based electronic questionnaires. Gay, Airasian and Mills
(2012) define a questionnaire as a collection of formalised questions designed to capture a wide
variety of information on many topics and subjects, to be answered by a selected group of
participants. This method is in line with the descriptive research design and quantitative
approach that necessitates the collection of mass data at one time, along with the versatility of
employment in virtually any setting, offering respondents convenience to complete the survey
at their own time and speed (Aaker et al., 2011). The online survey method, however, lacks
depth in examining comprehensively the subjects being studied as no one was present to assist
respondents if they were having difficulty answering a question (Bryman et al., 2017).
Malhotra (2010) states that the overall design of a questionnaire can influence participants’
willingness to participate in a study. As such, the following sections elucidate on the aspects
of the questionnaire structure, measurement and scale, layout, pre and pilot testing, and actual
administration.
3.6.1 Structure of the questionnaire
A questionnaire can incorporate unstructured (open-ended) and/or structured (closed-ended)
questions (Aaker et. al, 2011). Open-ended questions allow respondents to answer on their own
terms, enable unusual responses, and tap into their levels of knowledge and understanding of
issues. They are useful for exploring new areas and generating fixed-choice format answers

64
(Bryman et al., 2017). Although open-ended questions can provide in-depth discoveries, it is
more expensive and time consuming to administer, code as well as analyse the data (Zikmund
et al., 2013). Closed-ended questions provide respondents specific, limited-alternative
responses to choose the ones closest to their own viewpoints. They are inexpensive, easy to
complete or process the answers, enhance comparability (i.e. relationship between variables),
and reduce variability (Bryman et al., 2017). Nonetheless, there is loss of spontaneity in
respondents’ answers, as well as difficult to cover all possibilities and make the fixed answers
mutually exclusive (Zikmund et al., 2013).
This study utilised a combination of dichotomous, multichotomous and multi-item structured
or closed-ended questions. Zikmund, Carr and Griffin (2013) highlight that for dichotomous
and multichotomous questions, respondents can choose their answers from a predetermined
number of two or multiple responses respectively. Most of the dimensions used to measure
these constructs are in reference to previous related studies, as cited under literature review,
where modifications were made to wordings of the statements and scales to fit the context and
purpose of this study. Table 3.4 indicates the dimensions used to measure each construct, as
well as the various authors from whom the dimensions were adapted. The specific statements
employed in the questionnaire are provided in Annexure D.
Table 3.4 Dimensions used in questionnaire
Dimension Author(s) & Year
Source Credibility (SC)
Well-known, expert, trustworthy,
experienced, reliable
Bhatt et al. (2013); Nguyen & Nguyen
(2017); Raluca & Ioan (2010); Singh &
Banerjee (2018); Visentin et al. (2019);
Yilmaz et al. (2011)
Source Likeability (SL)
Friendly, charismatic, sincere, appealing /
attractive, familiar
Nguyen & Nguyen (2017); Nguyen et al.
(2013); Vien et al. (2017); Yilmaz et al.
(2011)
Rational Message (RM)
Product quality, product benefits Akbari (2015); Ganesan et al. (2017);
Jovanovic et al. (2016); Lin (2011); Sadeghi
et al. (2015); Zhang et al. (2014)
Other non-fuel products, services,
convenience
Self-created
Emotional Message (EM)

65
Love, relationship, sense of belonging,
humour, happiness, excitement
Akbari (2015); Ganesan et al. (2017);
Jovanovic et al. (2016); Kamran & Siddiqui
(2019); Lin (2011); Mogaji et al. (2018);
Sadeghi et al. (2015); Zhang et al. (2014)
Pride of local / national brand Self-created
Attitude Towards the Advertisement (ATA)
Good, enough interest to hold my
attention, believable, positive impression,
can recall ad and company easily
Abdul Wahid & Ahmed (2011); Owhal
(2015); Sallam & Algammash (2016); Singh
& Banerjee (2018); Yilmaz et al. (2011)
Attitude Towards the Brand (ATB)
Interested in the brand, think the brand is
good, favourable opinion of the brand,
trust the brand, would recommend the
brand
Abdul Wahid & Ahmed (2011); Ganesan et
al. (2017); Sallam & Algammash (2016);
Singh & Banerjee (2018); Spears & Singh
(2004); Visentin et al. (2019); Yilmaz et al.
(2011);
Purchase Intention (PI)
Probably make a purchase, likely to make
a purchase, definitely going to make a
purchase, would like to have more info,
neither influenced by the ad nor the brand
Abdul Wahid & Ahmed (2011); Sallam &
Algammash (2016); Singh & Banerjee
(2018); Spears & Singh (2004);
3.6.2 Measurement and scale employed in the questionnaire
Aaker, Kumar, Day and Leone (2011) define measurement as a standardised process of
assigning numbers or other symbols to certain characteristics of the objects of interest,
according to some pre-specified rules. Measurement allows for fine differences in magnitude
relating to the concept in question to be quantified, act as a consistent yardstick for making
such distinctions and gauging differences, and provides a basis for more precise estimates of
the relationship between concepts (Bryman et al., 2017). Scale is a continuum on which objects
are located according to the amount of the measured characteristics they possess (Aaaker et al.,
2011). Zikmund, Carr and Griffin (2013) indicate that the type of scales used for measurement
(whether nominal, ordinal, interval or ratio) would determine the form of statistical analysis.
The appropriate descriptive statistics for each type of scale are summarised in Table 3.5 below.
Table 3.5 Descriptive statistics for types of scales
Type of
Scale
Description Numerical
Operation
Descriptive
Statistics
Nominal A scale in which the
numbers or letters
Counting Frequency in
each category

66
assigned to objects serve
as labels for identification
or classification
Dichotomous “Yes” or
“No”
Percentage in
each category
Mode
Ordinal A scale that arranges
objects or alternatives
according to their
magnitude in an ordered
relationship
Comparative, rank order,
itemised category, paired
comparison
Rank ordering Median
Range
Percentile
ranking
Interval A scale that both arranges
objects according to their
magnitudes and
distinguishes this ordered
arrangement in units of
equal intervals
Likert, Thurstone, Stapel,
associative, semantic-
differential
Arithmetic
operations that
preserves order
and relative
magnitudes
Mean
Standard
deviation
Variance
Ratio A scale that has absolute
rather than relative
quantities and an absolute
zero where there is an
absence of a given
attribute
Certain scales with special
instructions
Arithmetic operations
on actual quantities
Geometric mean
Coefficient of
variation
Source: (Aaker et al., 2011; Zikmund et al., 2013)
In this study, the questionnaire consisted of nominal and interval scale items. The items in the
nominal scale were assigned to mutually exclusive labelled categories, while interval scale
items were used to demonstrate the correlation between the two constructs (Aaker et al., 2011).
The constructs in interval scale were measured using a five-point Likert Scale – with items
ranging from ‘Strongly Disagree’ (1) to ‘Strongly Agree’ (5). Likert-type scale questions
require respondents to indicate their level of agreement or disagreement with a variety of
statements related to the object, which then are summed over all statements to provide a total
score (Aaker et al., 2011).

67
3.6.3 Layout of the questionnaire
Once the questions were developed, it was important to determine the sequence and flow of
questions, as well as layout of the questionnaire. According to Bryman, Bell, Hirschsohn, Dos
Santos, Du Toit, Masenge, Van Aaardt and Wagner (2017), the presentation of closed-ended
questions and the layout are important considerations for self-administered questionnaires. A
well laid-out questionnaire will make it interesting and easy for respondents to go through the
questions, enhance participation and minimise error (Zikmund et al., 2013).
The layout of the questionnaire commenced with a preamble. This preamble featured
information such as identity of the researcher, purpose of the study, request for assistance in
providing data, and the estimated time required to complete the questionnaire. The preamble
also assured that participation is voluntary, and that all responses will be kept confidential and
secured. In this study, the questionnaire was divided into ten sections based on the types of
information required, including screening questions to confirm respondent’s eligibility to
participate (i.e. minimum 18 years old, the legal driving age in South Africa) and whether they
had been exposed to a fuel advertisement in the last six months. Section A consisted of seven
questions which were designed to solicit information regarding the respondents’ age group, the
type of vehicle they drive, the number of hours per day they spend watching television,
listening to radio, using online or social media, the fuel advertisement they were exposed to in
the last six months, the medium that carried that advertisement and the fuel brand they are
currently using. Section B to Section I comprised of five specific statements to measure the
influence of source credibility, source likeability, rational message, emotional message,
attitude towards the advertisement, attitude towards the brand and purchase intention constructs
based on the possible dimensions adapted from work of various authors in Table 3.4. The
structure, format, scales and layout employed in this study are outlined in Table 3.6 below,
while the questionnaire is provided in Annexure D.
Table 3.6 Questionnaire structure, format, scales and layout
Sec*/ Qst* Abbrev* Nature of Question /
Construct
Structure Scaling
Format: Dichotomous (Two responses – Yes / No)
Screen S1 AQLF Minimum Age 18 years old and
above
Close-
ended
Nominal

68
Screen S2 EXFA Exposure to any Fuel Ad in the
last 6 month
Close-
ended
Nominal
Format: Multichotomous (Multiple responses / by categories)
Sec A / 1 AGRP Age Group Close-
ended
Nominal
Sec A / 2 TOV Type of Vehicle Close-
ended
Nominal
Sec A / 3 TSTR Time Spend watch TV / listen
to Radio per day
Close-
ended
Nominal
Sec A / 4 TSOS Time Spend Online / Social
media per day
Close-
ended
Nominal
Sec A / 5 FBAE Fuel Brand Ad Exposed to Close-
ended
Nominal
Sec A / 6 MCAD Medium that Carried the Fuel
Brand Ad
Close-
ended
Nominal
Sec A / 7 FBCU Fuel Brand Currently Using Close-
ended
Nominal
Format: Multiple-items / Likert-type-scale – Strongly Disagree (1) to Strongly Agree (5)
Sec B/1-5 SC1 – SC5 Source Credibility Close-
ended
Interval
Sec C/1-5 SL1 – SL5 Source Likeability Close-
ended
Interval
Sec D/1-5 RM1 – RM5 Rational Message Close-
ended
Interval
Sec E/1-5 EM1 – EM5 Emotional Message Close-
ended
Interval
Sec F/1-5 ATA1 – ATA5 Attitude Towards the Advert Close-
ended
Interval
Sec G/1-5 ATB1 – ATB5 Attitude Towards the Brand Close-
ended
Interval
Sec H/1-5 PI1 – PI5 Purchase Intention Close-
ended
Interval
Notes: Sec* = Section, Qst* = Question, Abbrev* = Abbreviation
3.6.4 Pre and pilot testing the questionnaire
Pre-testing involves testing specific questions or the whole questionnaire on a small sample of
respondents (Aaker et al., 2011). The purpose of pre-testing is to ensure that the questionnaire
meets the researcher’s expectations in terms of data to be collected. Furthermore, it is to
identify and remove any deficiencies, as well as enhance the questionnaire (Guy et al., 2012).
Aaker, Kumar, Day and Leone (2011) highlight that every aspect of the questions or

69
questionnaire – namely variation, meaning, task difficulty, flow, skip patterns, length,
respondent interest and attention – should be pre-tested. The respondents used in the pre-testing
exercise are normally selected on a convenience basis, and should be similar in makeup to
members of the population that ultimately will be sampled (Zikmund et al., 2013). Pre-testing
can use either a debriefing or protocol approach (Aaker et al., 2011). In debriefing, respondents
are only informed it was a pre-test after they have completed the questionnaire. They are then
asked to explain the meaning of each question and whether they encounter any problems when
answering the questionnaire. Protocol approach on the other hand, requires respondents to write
comments on the questionnaire while they are answering it. Problems identified during
pretesting should be corrected, after which the questionnaire should again be pre-tested using
a different set of respondents (Zikmund et al., 2013).
In this study, the questionnaire was pre-tested with 26 respondents from a comparable
population using a debriefing approach. Their responses were excluded from the actual sample
used for data analysis to avoid biasness (Bryman et al., 2017). The respondents did not indicate
any difficulty in understanding or answering the questions. Other feedback included proposed
enhancement to the sequence of questions for smooth and coherent flow, which was then
adjusted in the final questionnaire.
Subsequently, the questionnaire was subjected to pilot testing on a conveniently selected
sample of 50 respondents from the target population. A pilot test is a trial run, albeit on a
smaller scale, before launching the full-fledged survey (Memon et al. 2017). The purpose of
this pilot testing is to assess reliability and validity of the instrument (Babbie & Mouton, 2010).
While pilot testing is important as part of good research design, it does not guarantee success
in the full-fledged study, though it does increase the likelihood (van Teijlingen & Hundley,
2001). The results from the pilot testing are presented under Section 4.2 of this study.
3.6.5 Administration of the questionnaire
The web-based electronic questionnaire was designed using Qualtrics, and the link was shared
on social media portals (Facebook), as well as major oil companies operating in South Africa,
where the majority of qualifying participants were expected to be present. This approach for
data collection offers a host of benefits in terms of time and cost effectiveness, is easily
personalised and has wider reach (Wilson, 2018). Another approach adopted by the researcher
70
is through distribution of the link at strategic locations in Cape Town, e.g. mall and forecourts
with high a concentration of motorists. Cape Town, the largest metro and capital city of
Western Cape province (where the researcher is based) offered ease of access, as well as being
among the top three provinces with the highest population of motorists (eNaTIS, 2020).
3.7 MANAGEMENT OR PREPARATION OF DATA
The management or preparation of data needs to be done once the survey responses have been
collected, and before any data analysis and interpretation can take place (Cooper & Schindler,
2010). The degree to which the data was prepared and converted into a form suitable for
analysis determines the quality of results obtained from the statistical analysis and subsequent
interpretation (Aaker et al., 2011). The data processing steps include cleaning and editing,
coding, as well as tabulation, which are explained briefly hereafter.
3.7.1 Data cleaning and editing
Data cleaning involves consistency checks, dealing with values that are out of range and
treatment of missing responses (Malhotra, 2010). Zikmund, Carr and Griffin (2013) suggest
several options available for handling missing responses, such as substitution of an imputed
response, substitution of a neutral value such as the mean, pairwise deletion or case-wise
deletion. Data editing entails identifying omissions, ambiguities, inconsistencies, lack of
cooperation and ineligible respondents (Aaker et al., 2011). Its purpose is to ensure the
completeness, consistency and readability of data (Zikmund et al., 2013).
3.7.2 Data coding
Coding includes deciding how the responses are captured using a numerical score or other
character symbol (Aaker et al., 2011). The coding categories should be independent,
exhaustive, mutually exclusive and provide for all possible responses (Zikmund et al., 2013).
The process of coding entails transforming participants’ responses into numbers or codes that
represent the answers they choose.

71
3.7.3 Tabulation
Tabulation refers to the orderly arrangement of data in a table or other summary format that
exhibit the count of responses for each category assigned to a variable (Zikmund et al., 2013).
Besides aiding in data cleaning aspects – such as identifying the degree of omissions,
ambiguities, and errors in responses – the key benefits of tabulation are determining the
empirical distribution of the variable in question and calculating the descriptive statistics at a
later stage (Aaker et al., 2011). Malhotra (2010) explains that tables can take on various forms
such as univariate tabulation, bivariate tabulation and multivariate tabulation. The next section
examines the statistical analysis procedures that were applied in this study.
3.8 STATISTICAL ANALYSIS
Version 26.0 of the SPSS (Statistical Package for the Social Sciences) and AMOS (Analysis
of a Moment Structures) packages were used to analyse the data collected. The purpose of data
analysis is to produce information from raw data that will help to address the problem at hand
(Aaker et al., 2011). The type of measurement scale used in the study dictates the form of
statistical analysis performed (Zikmund et al., 2013). Since this study adopted nominal and
interval measurement scales, the statistical analysis methods used on the data sets include
frequency, reliability, descriptive (measures of central tendency, measures of variability,
measures of shape, measures of relationship) and structural equation modelling. Each of these
statistical analysis can be described as follows:
3.8.1 Frequency distribution analysis
Frequency distribution reports the number of responses that each question received and is
applicable to nominal as well as ordinal values (Aaker et al., 2011). The count (N) represents
the number of raw responses to each category for any type of variable, while percentage (%) is
the proportion of those who answered a question in a certain way, multiplied by a hundred
(100) (Bryman et al., 2017; Gay et al., 2012). The results can be illustrated in the form of a
frequency table or diagrams such as histograms, bars and pie charts (Aaker et al., 2011; Bryman
et al., 2017; Zikmund et al., 2013). Aaker et al. (2011) and Zikmund et al. (2013) also suggest
cross-tabulation, where frequency distribution of observations on two or more sets of nominal
variables are joined to examine the differences among groups. In this study, the observations

72
for the categorical data, including from the cross-tabulation method, were presented in the form
of diagrams. The non-categorical data was tabulated in the form of frequency tables.
3.8.2 Descriptive statistics analysis
Descriptive statistics, combined with frequency distribution analysis for interval and ratio
variables can provide meaningful figures by summarising information in a dataset (Aaker et
al., 2011). These descriptive statistics include measures of central tendency (mode, median,
mean), measures of variability (range, variance, standard deviation), measures of shape
(skewness, kurtosis) and measures of relationships (correlation) (Aaker et al, 2011; Bryman et
al., 2017; Gay et al. 2012). The measures are described as follows:
Measures of central tendency – Measures of central tendency are indices that represent a
typical score among a group of scores and summarise the distribution of values (Aaker et
al., 2011; Bryman et al., 2017; Gay et al., 2012). Bryman, Bell, Hirschsohn, Dos Santos,
Du Toit, Masenge, Van Aardt and Wagner (2017) describe mode as the value that occurs
most frequently in a distribution and can be employed to all types of variables. The median
is the mid-point in a distribution after the data has been ranked from the smallest to the
largest value and split into halves (Gay et al., 2012). The median is not affected by outliers
and is applicable for interval, ratio and ordinal variables (Bryman et al., 2017). The mean
is the arithmetic average of the scores, calculated by adding up all the scores and dividing
that total by the number of scores (Aaker et al., 2011). The mean is suitable to describe
interval and ratio variables, and is the most frequently used measure of central tendency
(Bryman et al., 2017; Gay et al., 2012). It is also the selected measure of central tendency
for this study, and the computed result is reported under section 4.4.
Measures of variability – Measures of variability show how spread out a group of scores
are, where the three most frequently used measures entail the range, quartile deviation and
variance (Bryman et al., 2017; Gay et al., 2012). Gay, Airasian and Mills (2012) define
the range as the difference between the highest and lowest score in a distribution, and is
determined by subtraction. Bryman, Bell, Hirschsohn, Dos Santos, Du Toit, Masenge, Van
Aardt and Wagner (2017) highlight that the range is applicable for interval or ratio
variables, and can be influenced by outliers. The quartile deviation is described as one half
of the difference between the upper quartile (the 75th percentile) and lower quartile (the

73
25th percentile) in a distribution (Gay et al., 2012). The variance measures how far each
observation is from the mean, and is computed as the sum of the square of the difference
between each value in a distribution and the mean, divided by the number of observations
(Bryman et al., 2017). The standard deviation is the most frequently used and a stable
variability index. It can be used with interval and ratio data, and is the square root of the
variance of a set of scores (Gay et al., 2012). The standard deviation method is employed
as a measure of variability for this study and is reported under section 4.4.
Measures of shape – Measures of shape describe the pattern or distribution of the data as
opposed to the normal distribution using skewness and kurtosis values (Malhotra, 2010).
Skewness denotes that a distribution ‘leans’ one way or the other and has an asymmetric
tail (Cain, Zhang & Yuan, 2017). Distribution with positive skewness has a longer right
tail in the positive direction, and the mode is lower than median and mean (Cain et al.,
2017; Ho & Yu, 2015). The negative skewness has a longer left tail in the negative
direction, and the mode is higher than median and mean (Cain et al., 2017; Ho & Yu, 2015).
Cain, Zhang and Yuan (2017) associate kurtosis with the shoulder, tail and peaked-ness of
a data distribution. The normal distribution is defined as having a kurtosis of 3 (Cain et al.,
2017; Ho & Yu, 2015). Ho and Yu (2015) describe positive kurtosis (>3) as leptokurtic
(more peaked-ness, heavy tails, weak shoulders), and negative kurtosis (<3) as platykurtic
(less peaked-ness, weaker tails, heavy shoulders). The findings for the skewness and
kurtosis are reported under section 4.4. of this study.
Measures of relationship - Measures of relationship indicate the strength of the relationship
between two variables (Aaker et al., 2011). This degree of relation is expressed as a
correlation coefficient and is computed using two sets of scores from a single group of
participants (Gay et al., 2012). Bryman, Bell, Hirschsohn, Dos Santos, Du Toit, Masenge,
Van Aardt and Wagner (2017) named the following techniques to measure the relationship
between two variables; phi coefficient ø (for dichotomous variables), Spearman’s rho-p
(for ordinal variables, or when one variable is ordinal and the other is an interval or ratio
variable) and Pearson’s correlation coefficient r (for interval or ratio variables). The
Pearson r is the most appropriate measure of correlation for this study as the sets of data
to be correlated are expressed as interval scales. The correlation coefficient, ranging from
-1.00 to +1.00 indicates the direction and size of the relation between variables (Gay et al.,
2012). In addition, the corrected item-total correlation test is performed to determine if any

74
item in the construct with value below 0.5 may impact the reliability of the overall scale
(Francis & White, 2002; Kim & Stoel, 2004), and therefore needs to be discarded. The
computed results are reported under section 4.4.
3.8.3 Reliability and validity of measurement instrument analysis
Reliability refers to the consistency of the survey questionnaires to measure a particular
concept (Bryman, 2012). The two (2) dimensions underlying the concept of reliability are
repeatability and internal consistency (Zikmund et al., 2013). Reliability is a necessary
condition for validity, however a reliable instrument may not be valid (Aaker et al., 2011).
Construct reliability of the research measures in this study was examined by the computation
of four different methods, namely Cronbach’s alpha reliability test (Cronbach α), average
inter-item correlations, composite reliability test (CR) and average value extracted (AVE) test.
A short description of each test is provided below.
Cronbach’s alpha reliability test (Cronbach α) – The Cronbach’s alpha test calculates the
average of all possible split-half reliability coefficients (Aaker et al., 2011; Bryman et al.,
2017; Zikmund et al., 2013). Bryman, Bell, Hirschsohn, Dos Santos, Du Toit, Masenge,
Van Aardt and Wagner (2017) suggest the alpha correlation coefficient varies between zero
(no correlation, therefore no internal consistency) and one (perfect correlation, thus
complete internal consistency). The reliability of a construct is supported if Cronbach’s
alpha is 0.6 or higher (Hume et al., 2006; Malhotra, 2010; McMinn et al., 2009; Sim
&Wright, 2000).
Average inter-item correlation – Determines if different individual questions in a
questionnaire meant to measure the same general construct or idea give consistent,
appropriate results or similar scores (Phelan & Wren, 2006; Trochim, 2020). Clark and
Watson (1995) recommended average inter-item correlation in the range of 0.15 to 0.50,
with 0.15 – 0.20 for broad higher order construct and higher mean intercorrelation (0.40 –
0.50) for a narrower construct. In addition, Schiavolin, Ferroli, Acerbi, Brock, Cusin,
Schiariti, Visintini and Broggi (2015) suggest inter-item correlation values higher than 0.4
as indicator of a good reliable scale.

75
Composite reliability test (CR) – Measures the overall reliability of a set of items loaded
on a latent construct. CR is a less biased estimate of reliability than Cronbach’s alpha.
Value ranges between zero and one, and values greater than 0.70 reflect good reliability
(Chin, 1988; Fornell & Larcker, 1981; Nunnally, 1978). Values between 0.60 and 0.70 are
also acceptable if other indicators of the construct’s validity are good (Hair et al., 2010).
Average variance extracted test (AVE) – Measures the level of variance captured by a
construct against the level due to measurement error. Values above 0.7 are considered very
good, whereas, the level of 0.4 is acceptable (Fraering & Minor, 2006).
Validity is concerned with whether or not an indicator (or set of indicators) devised to gauge a
concept really measures that concept (Bryman et al., 2017; Zikmund et al., 2013). There were
two approaches used to establish validity, namely, content and construct validity.
Content validity – Also known as face validity, describes how well the content of the
measure matches the conceptual definition of the phenomena under study (Nunnally,1978).
Establishing content validity is essentially an intuitive process, intended to eliminate errors
related to sampling, measurement or analysis of the variables (Aaker et al., 2011; Bryman
et al., 2017; Zikmund et al., 2013). Burns and Grove (2010) posited that content validity
could be obtained from three sources, namely literature review, experts in the field and
representatives of the population. The content of the measurement instrument was adapted
from other studies discovered through the literature review. In addition, the questionnaire
was also subjected to pre- and pilot testing, as discussed in Section 3.6.4.
Construct validity – The ability of a measure to provide empirical evidence consistent with
a theory based on the concepts and established during the statistical analysis of the data. It
can be considered only after convergent and discriminant validity have been established
(Aaker et al., 2011; Bryman et al., 2017; Zikmund et al., 2013). The convergent and
discriminant validity are described below:
o Convergent validity – The degree of confidence that a trait is well measured by its
indicators, where each item correlates strongly with its assumed theoretical construct.
The values range between zero and one, and a value of 0.5 and higher is recommended
(Aldalaigan & Buttle, 2002; Barclays et al., 1995; Fornell & Larcker, 1981).
76
o Discriminant validity – The degree to which a construct is truly distinct from other
constructs, where measures of different traits are unrelated, and do not correlate
strongly. Discriminant validity exists when each measurement item correlates weakly
with all other constructs, except for the one to which it is theoretically associated. Thus,
correlations with a value below 0.8 are recommended (Fraering & Minor, 2006).
3.8.4 Structural Equation Modelling (SEM)
Hoyle (2014) describes Structural Equation Modelling (SEM) as a multivariate data analysis
technique that tests hypotheses about relations among observed and latent variables. The
observed variables are indicator variables that are measured during the data collection process,
and used to define or infer the latent variables (Hoyle, 2014; Kline, 2011; Raykov &
Marcoulides, 2012). In contrast, latent variables are typically referred to as theoretical or
hypothetical constructs, which allude to the abstract and unobservable concepts specified in
the theories (Hoyle, 2014; Kline, 2011; Raykov & Marcoulides, 2012). Schumacker and
Lomax (2010) suggest the variables, whether observed or latent, can also be defined as
independent (exogenous) variables that predict others, or dependent (endogenous) variables
being predicted.
Hoyle (2014) highlights SEM’s capacity to estimate and test relations between latent variables
as its most compelling characteristic. In SEM, a series of regression equations are used to
elaborate on hypothesised relationships among constructs, which are later modelled
diagrammatically, thereby providing a pictorial representation of a specific theory (Byrne,
2010). Albeit a natural extension of regression models, SEM is more complex as it involves a
simultaneous analysis of many layers of variables to determine the goodness-of-fit (Byrne,
2010). The goal of SEM analysis is to determine the extent to which the theoretical model is
supported by sample data (Schumacker & Lomax, 2010). Byrne (2010) suggests that if the
goodness-of-fit is adequate, the model argues for the plausibility of postulated relations among
the variables, otherwise the tenability of such relations is rejected.
The SEM model comprises two sub-models; the measurement model and structural model
(Byrne, 2010; Fan et al., 2016). A measurement model tests the relations between observed
and latent variables (Byrne, 2010; Hoyle, 2014; Kline, 2011), while the structural model

77
assesses all the hypothetical dependencies based on path analysis (Byrne, 2010; Hoyle, 2014;
Kline 2011). In this study, the conceptual model was developed ‘a priori’, thus only
Confirmatory Factor Analysis (CFA) was used to represent the measurement model. The CFA
process determines whether the hypothesised model provides a good fit to the data, or in other
words, if a relationship between the observed variables and their underlying latent or
unobserved constructs does exist (Child, 1990). There are five common logical steps
undertaken in performing SEM; model specification, model identification, model estimation,
model evaluation and model modification (Byrne 2010; Hoyle, 2014; Kline 2011; Fan et al.,
2016). These stages are elaborated next.
Model specification is defining the hypothesised relationships among the variables, and can
be depicted in three general formats; a schematic diagram using graphical symbols, a set of
equations or a matrix notation (Kline, 2011). The graphical presentation – termed as path
diagram – made it easy to identify which variables are in the model, whether they are latent
or observed, and the type of relations between them (Hoyle, 2014). By convention, squares
or rectangles represent observed variables, circles or ellipses represent unobserved latent
factors, single-headed arrows represent the impact of one variable on another, and double-
headed arrows represent covariances or correlations between pairs of variables (Byrne,
2010). The equations can be defined either as measurement equations or structural
equations, while the matrix notation enables identification of specific parameters in a model
(Hoyle, 2014). Kline (2011) emphasises the importance of a correct model specification as
it determines the results from later steps.
Model identification is to derive a single, unique estimate of every free parameter (Hoyle,
2014; Kline, 2011). Fan, Chen, Shirkey, John, Wu, Park and Shao (2016) describe model
identification as examining if the model is under-identified, just-identified, or over-
identified. An under-identified model is one in which it is not possible to uniquely estimate
all the model’s parameters, and whenever there is more unknown than known information
(Hoyle, 2014; Kline, 2011). A just-identified model is identified, has the same number of
known and unknown information, and the degrees of freedom equal to zero (Hoyle, 2014;
Kline, 2011). An over-identified model is identified, has more known information than
unknown information, with degrees of freedom more than zero (Hoyle, 2014; Kline, 2011).
The model coefficients can be only estimated in a just-identified or an over-identified
model (Fan et al., 2016).

78
Model estimation involves appraising numerical values for the unknown information or
free parameters, such as path coefficients, factor loadings, variances and covariances of
latent variables (Hoyle, 2014). The main focus of the estimation process is to produce
parameter values that minimise the discrepancy or residual between the sample covariance
matrix and the population covariance matrix inferred by the model (Byrne, 2010). Some
popular estimation techniques used in SEM include the maximum likelihood, least squares
family and Bayesian method (Hoyle, 2014; Kline, 2011).
Model evaluation assesses model performance or fit, with measurable indices computed
for the overall goodness of fit (Kline, 2011). According to Fan et al. (2016), SEM
evaluation is based on the fit indices for the test of a single path coefficient (i.e., p value
and standard error) and the overall model fit (i.e., χ 2, RMSEA). Generally, a model is
considered a good fit if the value of the chi-square test is insignificant, and a combination
of at least one incremental fit index (e.g. CFI, GFI, TLI) and one badness of fit index (e.g.
RMSEA, SRMR) meet the predetermined criteria (Fan et al., 2016; Schermelleh-Engel et
al., 2003). While there are no well-established guidelines of what minimal conditions
constitute an adequate fit, there are some rules of thumb criteria for goodness-of-fit indices
which are presented in Table 3.7.
Table 3.7 Indices for model evaluation
Indices Description
Chi-square test (χ 2 )
tests the hypothesis for any discrepancy between model-
implied covariance matrix and the original covariance matrix
non-significant discrepancy is preferred
optimal fitting would be ideal with p > 0.05
very sensitive to sample size and not comparable among
different SEMs
Comparative fit index
(CFI)
represents the amount of variance that has been accounted
for in a covariance matrix
ranges from 0.0 to 1.0
a higher CFI value indicates a better model fit
in practice, the CFI should be close to 0.95 or higher
CFI is less affected by sample size than the χ 2 test
Goodness-of-fit index
(GFI)
range from 0 to 1.0, with the best fit at 1.0
GFI is affected by sample size, hence it is no longer
recommended

79
Adjusted goodness-of-
fit index (AGFI)
adjust for a bias resulting from model complexity
range between 0 to 1.0
0.90 is indicative of good fit, AGFI > 0.85 an acceptable fit
Normed fit index (NFI) acceptable NFI should be 0.90 or higher
highly sensitive to the sample size thus no longer used to
assess model fit
Incremental fit index
(IFI)
adjusts the NFI for sample size and degrees of freedom
over 0.9 is a good fit, but the index can exceed 1.0
Tucker-Lewis index
(TLI)
a non-normed fit index (NNFI) that partly overcomes the
disadvantages of NFI
proposes a fit index independent of sample size
a TLI of > 0.90 is considered acceptable
Root mean square error
of approximation
(RMSEA)
RMSEA is a “badness of fit” index where 0 indicates the
perfect fit and higher values indicate the lack of fit
useful for detecting model misspecification and less sensitive
to sample size than the χ 2 test
a good fit should be less than 0.05 while acceptable RMSEA
should be less than 0.08
Standardized root mean
square residual
(SRMR)
SRMR is similar to RMSEA
a model good fit should be less than 0.05 while acceptable
SRMR should be less than 0.10
Akaike information
criterion (AIC) and
Bayesian information
criterion (BIC)
relative measures from the perspectives of model selection
rather than the null hypothesis test
AIC offers a relative estimation of the information lost when
the given model is used to generate data
BIC is an estimation of how parsimonious a model is among
several candidate models
AIC and BIC are not useful in testing the null hypothesis but
are useful for selecting the model with the least overfitting
Sources: (Fan et al., 2016; Schermelleh-Engel et al., 2003)
Model modification entails adjusting a specified, identified and estimated model to improve
model fit (Fan et al., 2016). Hoyle (2014) suggests that a model requires modification if it
either has an adequate fit to the data with excessive parameters (over-parameterization), or
does not have an adequate fit to the data (under-parameterization). In the earlier case, the
initial model needs to be simplified by enforcing constraints on (or removing) free
parameters to achieve a more compact model (Chou & Bentler, 2002; Hoyle, 2014). In the
latter case, the initial model needs to be adjusted by releasing constraints on (or freeing)
fixed parameters to acquire better fit to the data (Chou & Bentler, 2002; Hoyle, 2014). The
80
two modification methods are called “backward search” and “forward search” respectively
(Chou & Bentler, 2002; Hoyle, 2014).
3.9 INTERPRETATION OF DATA
The interpretation of data uses the results from statistical analysis. Interpretation involves
making inferences about the real world and drawing conclusions about the data’s managerial
implications (Zikmund et al., 2013).
3.10 ETHICAL CONSIDERATION
The study was approved by the University of Cape Town Commerce Research Ethics
Committee and ethics permission was obtained with clearance number REF: REC
2019/012/004 (Annexure A). The purpose of the study was clearly explained to all participants
and their consent was obtained before proceeding with the survey. This was an anonymous
study survey and participation was voluntary. Participants were not requested to supply any
identifiable information. Privacy and anonymity of respondents were kept confidential
throughout the study. The participants have rights to withdraw from the study at any stage if
they wish to do so. Adequate information and assurances were provided to allow participants
to understand the implications of partaking in the study. This enabled them to make a fully
informed and considered decision of whether or not to participate, without any coercion. The
data collected is stored on a password protected computer and UCT institutional data
repository, namely ZivaHub. The results of this study are used for academic purposes only and
a summary of findings can be provided on request.
3.11 CHAPTER SUMMARY
The main objective of this study is to examine the effect of advertising controllable elements
– namely source and message – on South African consumers’ attitude towards the
advertisement, attitude toward the brand and purchase intention for fuel. Given the nature of
the study, a positivist and descriptive research design using a quantitative approach was
adopted. This study employed the convenience technique of non-probability sampling method
on a random sample of South African residents who are minimum 18 years old, which is the

81
legal driving age in the country. The study targeted people who have previously bought fuel
for their vehicles. The required data was collected using a web-based, self-administered
questionnaire that comprised scales drawn from previously published studies, and these
responses were measured on a five-point Likert scale. The questionnaire also included
questions designed to gather demographical information such as respondents’ age group and
contextual data required for the study. The captured data was analysed using SPSS and AMOS
version 26.0 for Windows. The statistical analysis performed included frequencies, descriptive
statistics, reliability and validity, as well as structural equation modelling. The next chapter,
Chapter 4, presents and discusses the findings resulting from the analysis of the captured data
for both pilot and main study. Data is reported as meaningful information, in the form of tables
and charts with respective interpretations given in each case.
82
CHAPTER 4
RESULTS AND DISCUSSIONS
4.1. INTRODUCTION
This chapter presents a discussion and interpretation of the results obtained from the fieldwork
phase of the study. The chapter commences with a discussion on results from the pilot testing,
followed by the procedures undertaken to prepare the data – which include cleaning and
editing, coding and tabulation of the scaled responses. Next, the demographic and other
contextual information of the respondents are presented in the form of charts to give insights
of the main sample composition. This is followed by discussion on descriptive statistics results
to frame and put the overall research results in context. The reliability and validity analysis is
a mandatory procedure prior to applying any form of multivariate analysis to provide fidelity
and quality assurance of the data. The structural modelling analysis was performed to
determine the statistical relationships between variables or constructs of interest in order to test
the hypotheses. The procedure commenced with the specification of a measurement model
through Confirmatory Factor Analysis and evaluation of model fit indices. Thereafter, the
structural model was developed using path analysis to test the hypotheses. SPSS and AMOS,
Versions 26.0 for Windows, were used to perform the analysis. The data analysis was
conducted in two stages: the first stage involved analysing the results of the pilot testing of the
questionnaire, and the second stage involved analysing the main survey’s findings. The next
section will discuss the data analysis procedures involved in the pilot phase.
4.2. PILOT TEST RESULTS
Succeeding the pre-testing stage, the measurement instrument was piloted on a convenience
sample of 50 South African motorists to verify the internal consistency reliability of the
measurement instrument. In addition, the pilot testing established that the questions were
properly formulated or worded, and understood by the participants. The pilot test results are
summarised and presented in Table 4.1 below.

83
Table 4.1 Summary of pilot test results
Items Number
of
variables
Mean Standard
deviation
N Cronbach
Alpha
Average inter-
item correlation
SC1-SC5 5 3.6880 0.75502 50 0.877 0.643
SL1-SL5 5 3.8320 0.60792 50 0.856 0.539
RM1-RM5 5 3.9200 0.64270 50 0.809 0.468
EM1-EM5 5 3.6800 0.75485 50 0.894 0.633
ATA1-ATA5 5 3.8200 0.58589 50 0.855 0.555
ATB1-ATB5 5 4.0480 0.69466 50 0.917 0.692
PI1-PI5 5 3.6400 0.62727 50 0.640 0.295
Overall Cronbach’s alpha coefficient values of the entire scale = 0.819
Note: SC=Source Credibility; SL=Source Likeability; RM=Rational Message; EM=Emotional Message,
A=Attitude Towards the Advertisement, ATB=Attitude Towards the Brand, PI=Purchase Intention
Cronbach alpha coefficient values for the seven constructs range between 0.640 and 0.917,
thereby exceeding the 0.6 acceptable threshold (Malhotra, 2010:319). The five-point Likert
scale returned a Cronbach alpha of 0.877 for source credibility, 0.856 for source likeability,
0.809 for rational message, 0.894 for emotional message, 0.855 for attitude towards the
advertisement, 0.917 for attitude towards the brand and 0.640 for purchase intention. The pilot
study retains an overall Cronbach’s alpha coefficient value of 0.819, hence demonstrating a
satisfactory evident of the scales’ reliability.
The descriptive statistical analysis results for all the constructs are as follows; source credibility
(Mean=3.6880, SD=0.75502), source likeability (Mean=3.8320, SD=0.60792), rational
message (Mean=3.9200, SD=0.64270), emotional message (Mean=3.6800, SD=0.75485),
attitude towards the advertisement (Mean=3.8200, SD=0.58589), attitude towards the brand
(Mean=4.0480, SD=0.69466) and purchase intention (Mean=3.6400, SD=0.62727). All the
reported mean values above 3.500, signified a level of agreement among the respondents with
regards to the influence of the controllable elements on their attitudes and purchase intention.
Although most of the inter-item correlation means fell outside of the recommended range of
0.15 and 0.50 (Clark & Watson, 1995:316), these are consistent with the principles where
higher coefficient alpha lead to higher average inter-item correlations (Peterson, 1994:390),
demonstrating a stronger relationship among the items in a construct (Pallant, 2010:100) and

84
considered to have good reliability as the values are more than 0.40 (Schiavolin et al.
2015:442).
4.3. DATA GATHERING PROCESS
A self-administered electronic survey was dispensed on a random sample of South African
residents who are minimum 18 years old, which is the legal driving age in the country. The
study targeted people who have previously bought fuel for their vehicles and have been
exposed to any fuel advertisement in the last six months. The participants were informed that
their participation is voluntary and that they may choose to withdraw at any stage without any
consequences. They were also informed that their responses are confidential and no identifiable
information was requested.
4.4. PRELIMINARY DATA ANALYSIS
As described in section 3.8.1, the management or preparation of data involves three steps; data
cleaning and editing, coding and tabulation to make it viable for statistical analysis. These steps
are discussed next.
4.4.1. Data cleaning and editing
The editing and cleaning of data are important to ensure eligibility, completeness and
consistency in responses. There were 397 responses received. This data was exported into an
Excel spreadsheet for review. Assessment of the data revealed that only 298 respondents met
the requirements in terms of minimum age and exposure to fuel advertisement in the last six
months. They also drive a form of road vehicle or made fuel purchases. Further checking was
done to detect and eliminate any missing responses and values that are not defined or fall out
of range for a particular variable using a simple algorithm. The study adopted case-wise
deletion where all questionnaire responses from a respondent is removed if responses to one or
more questions are missing from that respondent, which left a sample of 201 usable data. The
usable data makes up a sample realisation rate of 51%, and the 201 responses obtained were
subsequently subjected to data analysis. This approach ensured a complete and same set of

85
observations, as well as a certain minimum standard of quality on the data that has been
collected.
4.4.2. Data coding
During this step, similar codes were assigned to similar responses in specific categories that
are mutually exclusive as per the questionnaire. The coding information is presented in Table
4.2.
Table 4.2 Coding information
Questio
n / Item
Code Target Variable /
Construct
measured
Value assigned to responses
Screening questions to determine participants eligibility
1 S1 Age identification Under 18 years old (1), 18 years old and above (2)
2 S2 Exposed to any
fuel ad in last 6
months
Yes (1), No (2)
Section A: Age group and related information
1 A1 Age group 18-25 (1), 26-30 (2), 31-35 (3), 36-40 (4), 41-45 (5),
Above 45 (6), Prefer not to answer (7)
2 A2 Type of vehicle
drive
Motorcycles (1), Passenger cars (2), Sport utility
vehicles (3), Utility vehicles, trucks, buses, trailer
(4), Prefer not to answer (5), Not applicable (6)
3 A3 Length of time
spend on TV/Radio
1 to 2 hour(s) (1), 3 to 4 hours (2), 4 to 5 hours (3),
More than 5 hours (4), Prefer not to answer (5)
4 A4 Length of time
spend online /
social media
1 to 2 hour(s) (1), 3 to 4 hours (2), 4 to 5 hours (3),
More than 5 hours (4), Prefer not to answer (5)
5 A5 Fuel brand ad
exposed to in last 6
months
BP (1), Caltex (2), Engen (3), Sasol (4), Shell (5),
Total (6), Others (7)
6 A6 Medium carry the
fuel ad
TV (1), Radio (2), Print (newspapers/magazine (3),
Billboard and banner (4), Internet (website/display
ads/search engine) (5), Social Media (6), Mobile
App (7), YouTube (8)
7 A7 Fuel brand
currently used
BP (1), Caltex (2), Engen (3), Sasol (4), Shell (5),
Total (6), Others (7), Prefer not to answer (8)

86
Section B - J: Determinants of source credibility, source likeability, rational message,
emotional message on consumers attitude towards the advertisement, attitude towards the
brand and purchase intention
1 – 5 SC1 - SC5 Source Credibility Strongly disagree (1), Disagree (2), Neither
disagree nor agree (3), Agree (4), Strongly agree (5)
1 – 5 SL1 - SL5 Source Likeability Strongly disagree (1), Disagree (2), Neither
disagree nor agree (3), Agree (4), Strongly agree (5)
1 – 5 RM1 - RM5 Rational Message Strongly disagree (1), Disagree (2), Neither
disagree nor agree (3), Agree (4), Strongly agree (5)
1 – 5 EM1 - EM5 Emotional Message Strongly disagree (1), Disagree (2), Neither
disagree nor agree (3), Agree (4), Strongly agree (5)
1 – 5 ATA1 -
ATA5
Attitude Towards
the Advertisement
Strongly disagree (1), Disagree (2), Neither
disagree nor agree (3), Agree (4), Strongly agree (5)
1 – 5 ATB1 -
ATB5
Attitude Towards
the Brand
Strongly disagree (1), Disagree (2), Neither
disagree nor agree (3), Agree (4), Strongly agree (5)
1 – 5 PI1 - PI5 Purchase Intention Strongly disagree (1), Disagree (2), Neither
disagree nor agree (3), Agree (4), Strongly agree (5)
4.4.3. Tabulation of variables
After coding and cleaning the data, the researcher deemed it is necessary to organise the data
into pre-determinable categories. The frequencies of the scaled responses for each item in the
survey questionnaire are organised based on intended constructs. Table 4.3 reports on
frequencies of the scaled responses for each construct in the measuring instrument. The total
number of valid (N) for each item is captured in the reporting.
Table 4.3 Frequency table for the scaled response data (non-categorical)
Scale item Strongly
disagree Disagree
Neither
disagree nor
agree
Agree Strongly
agree
1 2 3 4 5
Construct 1: Source Credibility
SC1 18 50 47 58 28
SC2 6 39 21 100 35
SC3 3 7 25 108 58
SC4 4 8 30 119 40
SC5 2 8 25 115 51
Construct 2: Source Likeability
SL1 3 27 18 115 38

87
SL2 3 23 55 90 30
SL3 2 8 31 110 50
SL4 3 13 42 110 33
SL5 2 11 48 108 32
Construct 3: Rational Message
RM1 5 12 29 105 50
RM2 3 9 23 112 54
RM3 3 29 67 66 36
RM4 2 10 29 104 56
RM5 1 9 33 94 64
Construct 4: Emotional Message
EM1 7 25 71 63 35
EM2 3 14 49 89 46
EM3 2 14 41 104 40
EM4 2 19 59 78 43
EM5 4 14 52 75 56
Construct 5: Attitude Towards the Advertisement
ATA1 2 31 18 104 46
ATA2 3 17 28 114 39
ATA3 3 10 50 94 44
ATA4 2 7 41 107 44
ATA5 2 15 31 96 57
Construct 6: Attitude Towards the Brand
ATB1 3 10 27 96 65
ATB2 1 3 29 92 76
ATB3 1 5 35 94 66
ATB4 1 4 26 93 77
ATB5 4 6 28 81 82
Construct 7: Purchase Intention
PI1 2 8 22 99 70
PI2 3 9 23 107 59
PI3 2 13 42 80 64
PI4 9 41 69 59 23
PI5 19 56 37 53 36
4.5. DEMOGRAPHIC AND OTHER CONTEXTUAL INFORMATION
This section summarises the study’s sample in detail and provides contextual information about
the respondents’ fuel advertisement as well as fuel brand consumptions. The frequencies and

88
percentages recorded in this section relate to categorical data obtained from section A of the
questionnaire. The sample description is provided in the following sub-sections.
4.5.1. Sample description
Of the 397 responses received, 201 returned questionnaires were usable, which yields a
response rate of 51%. The demographic data of the main study is presented next.
The participants of this study were grouped into six age categories. The majority of respondents
were above 45 years old of age (35%, n=70), followed by 41 to 45 years old category (20%,
n=41), 36 to 40 years old category (16%, n=32), 31 to 35 years old category (11%, n=22), 26
to 30 years old category (9%, n=18) and 18 to 25 years old category (8%, n=16). There were 2
respondents who preferred not to disclose their age which make up 1% of the total sample. The
sample’s age distribution is illustrated in Figure 4.1.
Figure 4.1 Respondents age group
The participants were also asked on the type of vehicle they use, where 71% (n=143) of them
drive passenger cars. The sport utility vehicles form the second group of vehicle with most
respondents (22%, n=45). The respondents who drive utility vehicles/trucks/buses/trailers
make up 2% (n=4) of the sample, followed by motorcycles (1%, n=3), and 2% of respondents
have chosen not to divulge the type of vehicle they drive (n=3). While another 2% (n=4)
respondents answered “Not applicable”, despite the fact that they do purchase fuels based on
18 to 25
8%26 to 30
9%
31 to 35
11%
36 to 40
16%
41 to 45
20%
Above 45
35%
Prefer not to answer
1%
AGE GROUP

89
their response for the fuel brand they are currently using. The breakdown of participants based
on their type of vehicle is exhibited in Figure 4.2.
Figure 4.2 Type of vehicle driven by respondents
A cross tabulation on these two sets of data provide insights of the type of vehicle use in
accordance with age group category, as presented in Figure 4.3. The data showed that passenger
cars are well represented by all the age groups, while motorcycles are mostly driven by
respondents within age brackets of 18 to 30 years old. Respondents who drive sport utility
vehicles are mostly above 45 years old.
Motorcycles
1%
Passenger Cars
71%
Sport Utility
Vehicles
22%
Utility Vehicle, Trucks,
Buses, Trailers
2%
Prefer not to answer
2%
Not applicable
2%
TYPE OF VEHICLE DRIVEN
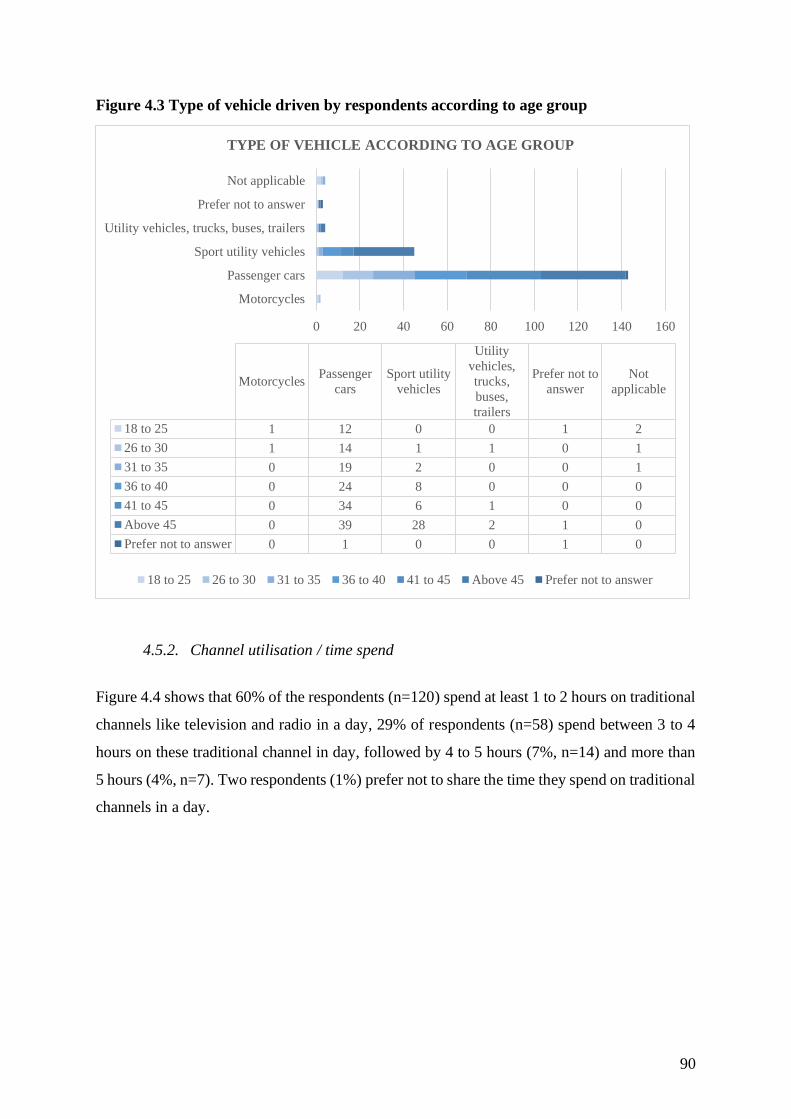
90
Figure 4.3 Type of vehicle driven by respondents according to age group
4.5.2. Channel utilisation / time spend
Figure 4.4 shows that 60% of the respondents (n=120) spend at least 1 to 2 hours on traditional
channels like television and radio in a day, 29% of respondents (n=58) spend between 3 to 4
hours on these traditional channel in day, followed by 4 to 5 hours (7%, n=14) and more than
5 hours (4%, n=7). Two respondents (1%) prefer not to share the time they spend on traditional
channels in a day.
0 20 40 60 80 100 120 140 160
Motorcycles
Passenger cars
Sport utility vehicles
Utility vehicles, trucks, buses, trailers
Prefer not to answer
Not applicable
MotorcyclesPassenger
cars
Sport utility
vehicles
Utility
vehicles,
trucks,
buses,
trailers
Prefer not to
answer
Not
applicable
18 to 25 1 12 0 0 1 2
26 to 30 1 14 1 1 0 1
31 to 35 0 19 2 0 0 1
36 to 40 0 24 8 0 0 0
41 to 45 0 34 6 1 0 0
Above 45 0 39 28 2 1 0
Prefer not to answer 0 1 0 0 1 0
TYPE OF VEHICLE ACCORDING TO AGE GROUP
18 to 25 26 to 30 31 to 35 36 to 40 41 to 45 Above 45 Prefer not to answer

91
Figure 4.4 Time spend on traditional channels e.g. television / radio per day
A further analysis indicates that all age group spend between 1 to 4 hours in a day on television
or radio. Respondents in the younger age group tend to spend less time on traditional channels
compared to those above 35 years old, as exhibited in Figure 4.5.
Figure 4.5 Length of time spend on traditional channels by age group
1 to 2 hour(s)
60%
3 to 4 hours
29%
4 to 5 hours
7%
More than 5
hours
3%Prefer not to
answer…
LENGTH OF TIME SPEND ON TV/RADIO PER DAY
0 10 20 30 40 50 60 70 80
18 - 25
26 - 30
31 - 35
36- 40
41 - 45
Above 45
Prefer not to answer
18 - 25 26 - 30 31 - 35 36- 40 41 - 45 Above 45Prefer not
to answer
1 - 2 hour(s) 11 13 12 19 19 44 2
3 - 4 hours 4 2 10 9 14 19 0
4 - 5 hours 0 3 0 2 5 4 0
More than 5 hours 0 0 0 2 2 3 0
Prefer not to answer 1 0 0 0 1 0 0
LENGTH TIME ON RADIO / TV BY AGE GROUP
1 - 2 hour(s) 3 - 4 hours 4 - 5 hours More than 5 hours Prefer not to answer

92
Figure 4.6 reported that 41% of the respondents (n=83) spend 1 to 2 hours in a day on online
channels, including social media. While this number is lower, it also showed that the majority
of respondents tend to spend more time on online channels, evident by the higher number for
the remaining categories, compared to the same in traditional channels. 34% of respondents
(n=69) spend between 3 to 4 hours in day on online channels, followed by 11% respondents
(n=22) spending 4 to 5 hours and 13% (n=26) for more than 5 hours respectively. One
respondent (1%) preferred not to share this information.
Figure 4.6 Time spend on online channels and social media per day
Figure 4.7 illustrates how respondents embrace online channels with representation from all
age and time categories. The responses are more distributed compared to the results from
traditional channels.
1 to 2 hour(s)
41%
3 to 4 hours
34%
4 to 5 hours
11%
More than 5
hours
13%
Prefer not to
answer
1%
LENGTH OF TIME SPEND ONLINE / SOCIAL MEDIA
PER DAY

93
Figure 4.7 Length of time spend on online channels by age group
4.5.3. Fuel advertisement exposed to and the medium that carry the fuel ad
Figure 4.8 is based on the cross-tabulation of data for questions A5 (the fuel brand advert
respondents have been exposed to in the last six months) and A6 (the medium that carry the
fuel ad) to provide more meaningful insights. The results showed that majority of the
respondents were exposed to fuel advert by Engen brand (70%, n=141). The Engen fuel advert
was widely viewed on television (38%), followed by social media (19%), billboards and
banners (18%), radio (12%), internet (5%), print (4%), mobile application (2%) and YouTube
(2%). The second highest fuel brand advert exposed to is the Shell brand (14%, n=29). The
Shell fuel advert on billboards and banners received the highest response (45%), followed by
television (34%), print (7%), internet (3%), social media (3%), radio (3%) and YouTube (3%).
BP was the third highest fuel brand respondents were exposed to in the last six months (5%,
n=10). The BP fuel ad was noticed on billboards and banners (40%), internet (20%), radio
(10%), print (10%), social media (10%) and mobile application (10%). The fourth highest fuel
0 10 20 30 40 50 60 70 80
18 - 25
26 - 30
31 - 35
36- 40
41 - 45
Above 45
Prefer not to answer
18 - 25 26 - 30 31 - 35 36- 40 41 - 45 Above 45Prefer not
to answer
1 - 2 hour(s) 1 3 7 15 15 40 2
3 - 4 hours 9 7 7 7 16 23 0
4 - 5 hours 3 5 2 4 3 5 0
More than 5 hours 3 3 6 5 7 2 0
Prefer not to answer 0 0 0 1 0 0 0
LENGTH TIME ONLINE / SOCIAL MEDIA BY AGE GROUP
1 - 2 hour(s) 3 - 4 hours 4 - 5 hours More than 5 hours Prefer not to answer

94
advert was by the Caltex brand (5%, n=9). The Caltex fuel ad was seen on television (33%),
billboards and banners (33%), social media (22%) and internet (11%). Total fuel ad was the
fifth highest observed (3%, n=7) with radio being the highest medium (43%), followed by
television (14%), billboards and banners (14%), social media (14%) and mobile application
(14%). Sasol fuel ad was in the sixth spot with 1% (n=3) where each respondent viewed it on
television, social media and YouTube respectively. Lastly, the fuel ads from Others category
received two responses, which make up 1% of total sample. These fuel ads were observed on
television (50%) and social media (50%).
Figure 4.8 Fuel ad exposed to in the last 6 months and the medium that carry the ad
0 10 20 30 40 50 60 70 80
TV
Radio
Print (newspapers/ magazines)
Billboard and banners
Internet (website/display ads/search engine)
Social Media
Mobile App
YouTube
TV Radio
(newspaper
s/
magazines)
Billboard
and
banners
Internet
(website/di
splay
ads/search
engine)
Social
Media
Mobile
AppYouTube
BP 0 1 1 4 2 1 1 0
Caltex 3 0 0 3 1 2 0 0
Engen 53 17 5 26 7 27 3 3
Sasol 1 0 0 0 0 1 0 1
Shell 10 1 2 13 1 1 0 1
Total 1 3 0 1 0 1 1 0
Others 1 0 0 0 0 1 0 0
FUEL AD EXPOSED TO IN THE LAST SIX MONTHS AND THE
MEDIUM THAT CARRY THE AD
BP Caltex Engen Sasol Shell Total Others

95
4.5.4. Fuel brand choice
The majority of respondents use Engen brand for their fuel (68%, n=136), followed by Shell
(9%, n=19), BP (9%, n=18), Caltex (7%, n=15), Others category (4%, n=7), Sasol (1%, n=2)
and Total (1%, n=2). 1% of respondents (n=2) prefer not to share the fuel brand they are
currently using. This data is illustrated in Figure 4.9.
Figure 4.9 Fuel brand respondents currently using
Out of the 68% of Engen users, 73% (n=101) are 36 years old and above. Most of the
respondents who opted for Shell brand are from 18 to 25 years old age group. In contrast,
respondents who use BP brand are mostly from above 45 years old category. The breakdown
of fuel brand choice by age group is presented in Figure 4.10.
BP
9% Caltex
7%
Engen
68%
Sasol
1%
Shell
9%
Total
1%
Others
4%
Prefer not to
answer
1%
FUEL BRAND CURRENTLY USE

96
Figure 4.10 Fuel brand choice by age group
While the Engen fuel advert received the highest response rate in terms of exposure, only 119
out of the 141 respondents who recalled the ad are actually using the brand for their fuel. The
remaining 17 respondents who use Engen as their fuel brand recalled other fuel adverts. Only
15 out of 29 respondents who recalled Shell fuel ad, are actually using the brand. BP has 8 out
of 10 respondents who viewed its fuel ad are using the brand. 5 out of 9 respondents who
recalled Caltex fuel ad are users of this fuel brand. While 7 respondents remembered Total fuel
ad, none of these respondents are actually using the brand. Only 1 out of 3 respondents who
recalled Sasol fuel ad is using the brand. 2 out of 7 respondents who recollected fuel ad by
other brands are also using fuel from other brands. These outcomes are represented in Figure
4.11 below.
0 20 40 60 80 100 120 140 160
BP
Caltex
Engen
Sasol
Shell
Total
Others
Prefer not to answer
BP Caltex Engen Sasol Shell Total OthersPrefer not
to answer
18 to 25 3 0 5 0 7 0 1 0
26 to 30 1 0 13 0 2 0 2 0
31 to 35 3 1 15 0 2 0 1 0
36 to 40 2 5 22 1 2 0 0 0
41 to 45 2 4 31 0 2 0 0 2
Above 45 7 5 48 1 4 2 3 0
Prefer not to answer 0 0 2 0 0 0 0 0
FUEL BRAND CURRENTLY USING ACCORDING TO AGE GROUP
18 to 25 26 to 30 31 to 35 36 to 40 41 to 45 Above 45 Prefer not to answer

97
Figure 4.11 Fuel ad exposed to versus fuel brand currently using
4.6. DESCRIPTIVE STATISTICAL ANALYSIS
The descriptive statistics results shown in Table 4.4 exhibit summary measures of the mean,
standard deviation, skewness and kurtosis that reflect the central tendency, variability and
distribution of the scaled responses in the dataset. The scaled responses were measured on a
five-point Likert scale that ranged from 1 = Strongly disagree to 5 = Strongly agree.
0 20 40 60 80 100 120 140 160
BP
Caltex
Engen
Sasol
Shell
Total
Others
Prefer not to answer
BP Caltex Engen Sasol Shell Total OthersPrefer not
to answer
BP 8 0 2 0 0 0 0 0
Caltex 0 5 1 0 2 1 0 0
Engen 7 9 119 1 2 1 2 0
Sasol 0 0 2 1 0 0 0 0
Shell 2 1 7 0 15 0 3 1
Total 1 0 5 0 0 0 0 1
Others 0 0 0 0 0 0 2 0
FUEL AD EXPOSED TO VS. FUEL BRAND CURRENTLY USING
BP Caltex Engen Sasol Shell Total Others

98
Table 4.4 Descriptive statistical analysis results
Research
Construct
Descriptive statistics
Mean
value
Scale
mean
SD
value
Scale
SD
Scale
Skewness
Scale
Kurtosis
Corrected
item-total
correlation
SC SC1 3.14 3.7423 1.200 0.75515 -0.738 1.254 0.449
SC2 3.59 1.078 0.699
SC3 4.05 0.829 0.748
SC4 3.91 0.826 0.760
SC5 4.02 0.793 0.760
SL SL1 3.79 3.7871 0.953 0.68471 -0.739 1.460 0.605
SL2 3.60 0.928 0.714
SL3 3.99 0.809 0.718
SL4 3.78 0.850 0.656
SL5 3.78 0.814 0.571
RM RM1 3.91 3.8995 0.923 0.62036 -0.621 1.908 0.435
RM2 4.02 0.836 0.507
RM3 3.51 0.996 0.451
RM4 4.00 0.846 0.572
RM5 4.05 0.841 0.536
EM EM1 3.47 3.7234 1.030 0.77891 -0.511 0.787 0.640
EM2 3.80 0.922 0.687
EM3 3.83 0.863 0.834
EM4 3.70 0.944 0.781
EM5 3.82 0.984 0.632
ATA ATA1 3.80 3.8667 0.995 0.75956 -0.689 0.959 0.734
ATA2 3.84 0.886 0.787
ATA3 3.83 0.880 0.758
ATA4 3.92 0.805 0.819
ATA5 3.95 0.910 0.692
ATB ATB1 4.04 4.1343 0.890 0.74731 -0.778 0.719 0.812
ATB2 4.19 0.771 0.844
ATB3 4.09 0.801 0.844
ATB4 4.20 0.775 0.852
ATB5 4.15 0.910 0.861
PI PI1 4.13 3.7015 0.833 0.58621 -0.213 0.758 0.578
PI2 4.04 0.850 0.606
PI3 3.95 0.937 0.488
PI4 3.23 1.043 0.261
PI5 3.15 1.273 -0.142Note: SC=Source Credibility; SL=Source Likeability; RM=Rational Message; EM=Emotional Message,
ATA=Attitude Towards the Advertisement, ATB=Attitude Towards the Brand, PI=Purchase Intention,
SD=Standard Deviation

99
Theoretically, higher means are associated with a greater degree of agreement. All the seven
constructs reported scale mean values above the mid-point (3.50). The highest reported scale
mean values were computed along attitude towards the brand (4.1343), followed by rational
message (3.8995), attitude towards the advertisement (3.8667), source likeability (3.7871),
source credibility (3.7423), emotional message (3.7234) and purchase intention (3.7015).
These results proved that both source and message in fuel ads influence consumers’ attitude
towards the advertisement and advertised brand. In addition, rational message received the
highest response or pull factor among all the controllable elements. On the whole, the
consumers seemed to have a positive attitude towards the fuel advert and fuel brand, affecting
positive behaviour towards intention to purchase.
Standard deviation was used to measure the spread of data from the mean. The highest standard
deviation manifested on emotional message (0.77891) indicate a greater data spread around the
arithmetic mean for that construct. The lowest standard deviation recorded on purchase
intention (0.58621) revealed data points tend to be closely clustered around the arithmetic
mean.
The dataset for source credibility, source likeability, rational message, emotional message,
advert attitude, brand attitude, as well as purchase intention, appeared to be negatively and
moderately skewed. In addition, the kurtosis values indicate that the dataset was platykurtic,
with shorter and thinner tails than the normal distribution.
The corrected item-total correlation value was used to establish whether or not an item can be
considered logically contributory in an overall scale. If an item yields corrected item-total
correlation below 0.5 (Francis & White, 2002; Kim & Stoel, 2004), the overall internal
consistency of the scale is weakened. As such, six items were excluded due to the low corrected
item-total correlations; SC1 (0.449), RM1 (0.435), RM3 (0.451), PI3 (0.488), PI4 (0.261) and
PI5 (-0.142). The remaining 29 items were subsequently subjected to reliability and validity
analysis, and deliberated in the next section.

100
4.7. RELIABILITY AND VALIDITY ANALYSIS
The statistical measures of accuracy tests shown in Table 4.5 specify the different measures
that were used to assess the reliability and validity of the constructs for the study.
Table 4.5 Accuracy statistics analysis for the model
Research Construct Cronbach’s Test Factor
Loading
CR AVE
Item-Total α Value
SC SC2 0.699 0.869 0.708 0.900 0.700
SC3 0.748 0.878
SC4 0.760 0.867
SC5 0.760 0.875
SL SL1 0.605 0.845 0.669 0.850 0.530
SL2 0.714 0.768
SL3 0.718 0.807
SL4 0.656 0.722
SL5 0.571 0.656
RM RM4 0.572 0.740 0.737 0.770 0.620
RM5 0.536 0.839
EM EM1 0.640 0.882 0.691 0.890 0.610
EM2 0.687 0.762
EM3 0.834 0.916
EM4 0.781 0.832
EM5 0.632 0.685
ATA ATA1 0.734 0.904 0.786 0.900 0.660
ATA2 0.787 0.845
ATA3 0.758 0.810
ATA4 0.819 0.878
ATA5 0.692 0.722
ATB ATB1 0.812 0.942 0.849 0.940 0.770
ATB2 0.844 0.875
ATB3 0.844 0.872
ATB4 0.852 0.884
ATB5 0.861 0.895
PI PI1 0.578 0.618 1.000 0.930 0.870
PI2 0.606 0.860 Note: SC=Source Credibility; SL=Source Likeability; RM=Rational Message; EM=Emotional Message,
ATA=Attitude Towards the Advertisement, ATB=Attitude Towards the Brand, PI=Purchase Intention, CR=
Composite Reliablity, AVE= Average Variance Extracted

101
4.7.1. Reliability analysis
Construct reliability of the research measures was examined by the computation of three
different methods, namely Cronbach’s alpha reliability test (Cronbach α), the composite
reliability test (CR) and the average value extracted (AVE) test.
4.7.1.1 Cronbach’s coefficient alpha test
The Cronbach’s coefficient alpha was used to assess the internal consistency of each construct
employed in the study. According to Malhotra (2010), the reliability of a measure is supported
if Cronbach’s alpha is 0.6 or higher. The results provided in Table 4.5 range from the lowest
Cronbach’s alpha (0.618) to the highest (0.942). The Cronbach’s alpha scores indicated that
each construct demonstrated acceptable to excellent internal reliability (Ebrahimzadeh et al.,
2015; Hume et al., 2006; McMinn et al., 2009; Sim & Wright, 2000). Since Cronbach’s alpha
values of the constructs exceeded the threshold level 0.60, this shows that all the variables were
reasonably reliable.
4.7.1.2 Composite reliability (CR)
The results of composite reliability are shown in Table 4.5. The results yielded CR indexes
between 0.770 and 0.940. The exhibited CR level exceeded the estimated criteria of greater
than 0.70, which is recommended as adequate for internal consistency of the constructs (Chin,
1998; Nunnally, 1978), thus finding satisfactory support for the scale composite reliability.
4.7.1.3 Average variance extracted (AVE)
The AVE estimates in Table 4.5 reflected that the overall amount of variance in the indicators
was accounted for by the latent construct (Neuman, 2006). All AVE values were above 0.4,
thus acceptable (Fraering & Minor, 2006). AVE values indicated indexes between 0.530 and
0.870. These results provided evidence for acceptable levels of research scale reliability.

102
4.7.2. Validity analysis
The validity of the latent constructs, including corresponding measurements, were examined
using content validity, along with construct validity (convergent plus discriminant), and are
discussed in this section.
4.7.2.1 Content validity
Burns and Grove (2010:335) established that content validity could be obtained from three
sources, namely, literature review, experts in the field and representatives of the population.
The content of the dimensions related to the constructs (source credibility, source likeability,
rational message, emotional message, advert attitude, brand attitude and purchase intention) is
retrieved from the current literature under Chapter 2, thus, the content validity is achieved. The
constructs were also pre- and statistically pilot tested, as discussed in Section 3.6.4 and 4.2
respectively for reaffirmation of their validity.
4.7.2.2 Convergent validity
Item loadings for each corresponding research construct were above the recommended value
of 0.5 (Aldalaigan & Buttle, 2002). As shown in Table 4.5, the item loadings ranged between
0.656 and 1.000, which means that the instruments loaded well on their respective constructs.
RM2 did not meet the recommended threshold and was removed from its construct. The results
also indicate an acceptable individual item convergent validity, as more than 50% of each
item’s variance was shared with a respective construct. The results imply that all items
converged well on the construct they were supposed to measure and hence, confirmed the
existence of convergent validity.
4.7.2.3 Discriminant validity
One of the methods used to check the discriminant validity of the research constructs is the
evaluation of whether the correlations among latent constructs were less than 1.0. As indicated
in Table 4.6, the inter-correlation values for all paired latent variables are less than 1.0, therefore
indicating the existence of discriminant validity. In addition, the results show weak to moderate
relationships for all paired latent variables. Respectively, the variables did not present any

103
problems of multicollinearity, such as a high correlation value greater than 0.89 (Brown &
Cudeck, 1993). All correlations were below 0.8 and were therefore in conformity with the
recommended threshold, hence indicating discriminant validity (Fraering & Minor, 2006). The
study also used AVE as an alternative method to check discriminant validity related to the
correlation matrix (Nunnally & Bernstein, 1994).
Table 4.6 Inter-construct correlation matrix
ATA ATB PI SC SL RM EM
ATA 1
ATB .637** 1
PI .348** .480** 1
SC .370** .340** .302** 1
SL .392** .352** .323** .561** 1
RM .364** .360** .387** .504** .515** 1
EM .370** .301** .276** .332** .566** .551** 1
Note: SC=Source Credibility; SL=Source Likeability; RM=Rational Message; EM=Emotional Message,
ATA=Attitude Towards the Advert, ATB=Attitude Towards the Brand, PI=Purchase Intention
* Scores: 1= Srongly Disagree; 2= Disagree; 3=Neutral; 4=Agree; 5 Strongly Agree
Significance level <0.05; ** significance level <0.01; *** significance level <0.001
The inter-construct correlations ranged between -0.431 (showing signs of discriminant
validity) and 0.637 (indicating a fair level of convergent validity). Based on the inter-construct
correlation matrix, discriminant validity existed as a result of highly dissimilar constructs.
4.8. STRUCTURAL EQUATION MODELLING
This section outlines the process undertaken to conduct structural equation modelling.
4.8.1. Measurement model / Confirmatory Factor Analysis (CFA) specification
Figure 4.12 is a diagrammatic representation of the CFA model. Latent variables are signified
by the circular or oval shape, while observed variables are represented by the rectangular
shapes. Adjacent to the observed variables are measurement errors, which are represented by
circular shapes as well. The bi-directional arrows connote the relationship between latent
variables. This CFA model serves two purposes; firstly, to determine whether a relationship

104
between the observed variables and their underlying latent (unobserved) constructs exist and
second, to provide evidence that all items are properly aligned with the correct latent variables
within the construct being measured.
Figure 4.12 Overall measurement model / CFA model

105
4.8.2. Measurement model identification
The CFA model in this study is an over-identified model as it shows positive degrees of
freedom based on output drawn from the AMOS. There were 406 distinct sample moments and
77 parameters to be estimated, which leaves 329 degrees of freedom (df), and a chi-square
value of 461.001 with a probability level equal to p=0.000.
4.8.3. Measurement model estimation
This study adopted the maximum likelihood estimates (MLE) technique to estimate the
parameters. The measurement model was evaluated for problematic estimates such as negative
error variances and standardised factor loading above 1.0 or below -1.0 (Hair et al., 2010:706).
There were no negative error variances or factor loadings above 1.0 or below -1.0 observed. In
addition, Table 4.5 shows that factor loading on each item of the seven constructs were all
above the recommended 0.5 level. Overall, the minimum iteration was achieved, thereby
providing assurance that the estimation process yielded an admissible solution and eliminated
any concern about multicollinearity effects.
4.8.4. Fit indices for the measurement model
The measurement model was assessed for model fit using the indices explained under Section
3.8.4 of this study, namely the chi-square, the comparative fit index (CFI), the Tucker-Lewis
index (TLI), the incremental fit index (IFI), the standardised root mean residual (SRMR) and
the root mean square of approximation (RMSEA). Table 4.7 summarises the measurement
model fit indices that were computed for this study, including their recommended thresholds.
Table 4.7 Measurement model fit indices
Measure Recommended level Default model value Decision
Chi-square
Chi square/Degree
of Freedom
(CMIN/DF)
Low values
2.0 ≤ χ2/df ≤ 5.0 is tolerable yet
values less than 3.0 are ideal
461.001
1.401 Accepted
Comparative fit
index
(CFI)
≥0.90 0.966 Accepted

106
Tucker-Lewis
index
(TLI)
≥0.90 0.961 Accepted
Increment fit index
(IFI) ≥0.90 0.966 Accepted
Standardised root
mean
residual
(SRMR)
≤0.05 0.039 Accepted
Root mean square
error
of approximation
(RMSEA)
≤0.08 0.045 Accepted
The results in Table 4.7 show acceptable goodness-of-fit of the model as mentioned in Section
3.8.4 of Chapter 3. The chi square value of 461.001 with 329 degree of freedom indicates
acceptable model fit. The other fit indices, namely CFI=0.966, TLI=0.961, IFI=0.966,
SRMR=0.039 and RMSEA=0.045, demonstrated a satisfactory fit between the measurement
model and the data. All these measures confirm a robust and acceptable model fit (Schreiber
et al., 2006:330).
Since the acceptable Confirmatory Factor Analysis measurement model fit was secured, the
study proceeded to the next stages of the analysis of the SEM model fit and the structural model
path analysis.
4.8.5. SEM model fit analysis
The measurement of model fit of this study was done using the following indices; chi-square
value over degree of freedom (CMIN/DF), the comparative fit index (CFI), the Tucker-Lewis
index (TLI), the incremental fit index (IFI) and the root mean square of approximation
(RMSEA) as specified in Section 3.8.4 of Chapter 3. Table 4.8 reports the structural equation
model fit results.

107
Table 4.8 SEM model fit indices
Fit Indices Acceptable threshold Study test results Decision
Chi-square/Degree of freedom
(CMIN/DF) ≤3.0 2.048 Accepted
Comparative fit index
(CFI) ≥0.90 0.908 Accepted
Tucker-Lewis index
(TLI) ≥0.90 0.897 Accepted
Increment fit index (IFI) ≥0.90 0.909 Accepted
Root mean square error
of approximation
(RMSEA)
≤0.08 0.072 Accepted
Despite the slightly lower TLI value of 0.897, this model is considered a good fit as the value
of the chi-square test (2.048 (df=339), p<0.000) is ideal, and a combination of at least one
incremental fit index (CFI=0.908 or IFI=0.909) and one badness of fit index (RMSEA=0.072)
met the predetermined criteria (Fan et al., 2016; Schermelleh-Engel et al., 2003). Therefore, it
can be concluded that the data confirms and fits acceptability of the model.
4.8.6. The structural model path analysis
The structural model path analysis involves the estimation of presumed causal relations among
observed variables (Garson 2008:2). In SEM, relationships between variables are referred to
as path coefficients and are depicted by single-headed arrows. The path diagram for the model
structure is reflected in Figure 4.13. Much like the CFA model, the circle or oval shapes
represent the latent variables while measurement items are represented by rectangles. Adjacent
to measurement items in circular shapes are measurement errors and the unidirectional arrows
between latent variables are used to convey the causal relations.

108
Figure 4.13 SEM path model structure

109
Table 4.9 Results of structural equation modelling analysis
Path/ proposed
hypothesis
relationship
Hypothesis Path
coefficient
estimate
P Value Results
ATA <---SC H1 0.240 0.002 Positive and significant
ATB <---SC H2 0.116 0.066 Positive and significant
ATA <---SL H3 0.197 0.012 Positive and significant
ATB <---SL H4 0.043 0.502 Positive and insignificant
ATA <---RM H5 0.064 0.378 Positive and insignificant
ATB <---RM H6 0.154 0.012 Positive and significant
ATA <---EM H7 0.192 0.011 Positive and significant
ATB <---EM H8 -0.053 0.394 Negative and insignificant
ATB <--ATA H9 0.603 0.001*** Positive and significant
PI <--ATA H10 -0.079 0.376 Negative and insignificant
PI <--ATB H11 0.610 0.001*** Positive and significant
Note: SC=Source Credibility; SL=Source Likeability; RM=Rational Message; EM=Emotional Message,
ATA=Attitude Towards the Advertisement, ATB=Attitude Towards the Brand, PI=Purchase Intention
* Significance level <0.05; ** significance level <0.01; *** significance level <0.001
4.8.7. Hypotheses testing
This section provides results of the preliminary formulated hypotheses developed out of the
research hypotheses and objectives as specified in Chapter 1. The study’s hypotheses were
tested in order to evaluate the relationships between latent variables. Table 4.9 represents the
results elicited following the hypotheses test. They are discussed hereafter.
4.8.7.1 Discussion of hypothesis 1
With reference to the first hypothesis (H1), the study hypothesised that source credibility has
a positive and a significant impact on attitude towards the advertisement. The path coefficient
value for hypothesis 1 is 0.240, which is an indication of a strong association and relationship
between source credibility and attitude towards the advertisement. The P value indicates a
0.002 level of confidence, which, therefore, means that the hypothesis is positive and
significant. Thus, hypothesis 1 is supported. These results are in line with other similar studies
which pointed out that source credibility exerts significant effects on attitude towards the
advertisement. (Bhatt et al., 2013; Raluca & Ioan, 2010; Yilmaz et al., 2011).

110
4.8.7.2 Discussion of hypothesis 2
The second hypothesis (H2) states that ‘source credibility has a significant positive effect on
attitude towards the brand’. Based on the results of the final model testing, the relationship
between source credibility and attitude towards the brand shows a path coefficient value of
0.116 at P value 0.066. This evidence demonstrates that hypothesis 2 is supported. These
findings reinforce the results obtained in previous studies that established source credibility
has a significant positive effect consumer’s attitude towards the brand (Bhatt et al, 2013; Singh
& Banerjee, 2018; Wu & Wang, 2011).
4.8.7.3 Discussion of hypothesis 3
The third hypothesis (H3) asserts that ‘source likeability has a significant positive effect on
attitude towards the advertisement’. The final structure model presents the relationship between
source likeability and attitude towards the advertisement with a coefficient value of 0.197, at
P value 0.012. Therefore, hypothesis 3 is supported. The results obtained in this study are in
accord with Yilmaz, Telci, Bodur and Iscioglu (2011), who also examined the effect of source
likeability on advert attitude. Moreover, their study revealed that source likeability seems to
have a stronger effect on attitude towards the advertisement than source credibility in situations
where processing (involvement) motivation and product category knowledge are not at
matching levels.
4.8.7.4 Discussion of hypothesis 4
With reference to the fourth hypothesis (H4), the study hypothesised that source likeability has
a significant positive effect on attitude towards the brand. The path coefficient value for
hypothesis 4 is 0.043, with P value at 0.502 level of confidence, which, consequently, means
that the relationship is positive, yet insignificant. Although the positive relationship is in
agreement with previous studies (Vien et al., 2017; Yilmaz et al., 2011), the magnitude of
impact is non-significant in accordance with findings by Yilmaz, Telci, Bodu and Iscioglu
(2011) for low involvement and low product category knowledge. Thus, hypothesis 4 is only
partially supported.

111
4.8.7.5 Discussion of hypothesis 5
Hypothesis 5 (H5) suggests that ‘rational appeal has a positive and significant relationship with
attitude towards the advertisement’. Based on the results of the final model testing, the
relationship between rational appeal and attitude towards the advertisement shows a path
coefficient value of 0.064 at P value 0.378. The results obtained in this study indicate that while
rational appeal has a positive influence on attitude towards the advertisement – similar to
previous studies (Akbari, 2015; Lin, 2011; Sadeghi et al. 2015) – the enormity of such
association is insignificant. Therefore, these findings have yielded partial validation of
hypothesis 5. Generally, advertisements by fuel companies have served to sell the public on
ideas rather than product (Atkin, 2019). The notions that fossil fuels are good and needed,
differentiated customer experience at forecourts, and environmental and social responsibility
initiatives by the companies underlines the messaging in fuel advertisements. This may explain
the lack of meaningful functional information on product attributes and benefits that could
significantly influence advert attitude.
4.8.7.6 Discussion of hypothesis 6
The sixth hypothesis (H6) asserts that ‘rational appeal has a positive and significant
relationship with brand attitude’. The final structure model presents the relationship between
rational appeal and attitude towards the brand with a coefficient value of 0.154 at P value 0.012
level of confidence. Hence, hypothesis 6 is supported. It is also essential to mention that these
findings corroborate the results obtained in the works of Akbari (2015) as well as Sadeghi,
Fakharyan, Dadkhah, Khodadadian, Vosta and Jafari (2015), who elucidated that rational
appeal has a positive and significant relationship with brand attitude.
4.8.7.7 Discussion of hypothesis 7
Hypothesis 7 (H7) contends that ‘emotional appeal has a positive and significant relationship
with attitude towards the advertisement’. The results of the final model testing indicate a path
coefficient value of 0.192 at P value 0.011, which depict affirmative association between
emotional appeal and attitude towards the advertisement. This evidence determines that
hypothesis 7 is supported. These findings reinforce the results obtained in the studies of Akbari
(2015) as well as Mogaji, Czarnecka and Danbury (2018) who established that emotional

112
appeal has a significant positive effect on advert attitude. Moreover, Sasol’s famous "Glug
Glug" commercial showing the performance of Sasol fuel through innocent eyes tops the list
of the most-liked TV ads over the past 35 years (Maggs, 2019), is a testament of the power of
emotional appeal.
4.8.7.8 Discussion of hypothesis 8
In regard to the eighth hypothesis (H8), the study posited that emotional appeal has a positive
and significant relationship with brand attitude. The results of the final model testing reveal a
path coefficient value of -0.053 at P value 0.394, which insinuates a negative and non-
significant relationship between emotional appeal and attitude towards the brand. These are in
contrast to other studies that showed emotional appeal has a significant and positive influence
on attitude towards the brand (Matilla, 1999; Sadeghi et al., 2015). Hence, hypothesis 8 is
rejected.
4.8.7.9 Discussion of hypothesis 9
The ninth hypothesis (H9) asserts that ‘attitude towards the advertisement has a positive effect
on attitude towards the brand’. The final structure model implies a positive and significant
relationship between these two constructs, with a coefficient value of 0.603 at P value 0.001.
Therefore, hypothesis 9 is supported. These findings uphold the direct and positive linear
relationship model between advert attitude and brand attitude (Mitchell & Olson, 1981; Shimp,
1981). The results obtained in this study are also in accord with other studies, which found
similar effects of attitude towards the advertisement on attitude towards the brand (Abdul
Wahid & Ahmed, 2011; Lee et al., 2017; Sallam & Algammash, 2016).
4.8.7.10 Discussion on hypothesis 10
In relation to the tenth hypothesis (H10), the study hypothesised that attitude towards the
advertisement has a positive effect on purchase intention. The results of the final model testing
reveal a path coefficient value of -0.079 at P value 0.376, which illustrates the non-significant
and adverse effect advert attitude has on purchase intention. These findings are in contrast with
the studies by Abdul Wahid and Ahmed (2010), Lee, Lee and Yang (2017) as well as Sallam

113
and Algammash (2016) who ascertain direct positive and significant relationship between the
two constructs. Consequently, hypothesis 10 is rejected.
4.8.7.11 Discussion on hypothesis 11
Hypothesis eleven (H11) contends that ‘attitude towards the brand has a positive influence on
purchase intention’. Based on the results of the final model testing, the association between
brand attitude and purchase intention shows a path coefficient value of 0.610 at P value 0.001
which denotes a positive and significant relationship. Hence, hypothesis 11 is supported. These
findings reinforce the results obtained in other studies, which established significant and
positive relationship between brand attitude and purchase intention (Abdul Wahid & Ahmed,
2011; Lee et al., 2017; Sallam & Algammash, 2016).
4.9. CHAPTER SUMMARY
This chapter reports the findings of the study and provides a discussion relating to the outcomes
of the pilot study, including the reliability and validity, which infers that the scale used was
both reliable and valid. The preliminary data analysis, which involved coding, data cleaning
and tabulation, is subsequently discussed. Descriptive statistics, including mean, standard
deviation and frequency distributions were calculated to summarise the sample data
description. Frequencies for the non-categorical data were presented in table format, while
categorical data that makes up demographic and contextual information of the main sample is
presented in charts. Next, reliability of the measurement instrument was substantiated using
Cronbach’s coefficient alpha, composite reliability and average variance extracted methods.
Validity assessment was achieved through content, convergent and discriminant methods to
ensure the sufficiency of the data set for conducting stringent statistical tests such as structural
equation modelling. Pearson’s correlation analysis was carried out to ascertain that there are
significant relationships between the constructs in the scale. Existence of significant
relationships between the constructs in the inter-construct correlation matrix serves to
corroborate the nomological validity of the study. Following these tests, some observable
indicators were dropped from respective constructs i.e. source credibility (SC1), rational
message (RM1, RM2, RM3) and purchase intentions (PI, P2, P3) for not meeting the
recommended acceptable values.

114
In relation to testing of the measurement model, the data proved to be both reliable and valid
using correlation coefficient values, CR values and AVE value. In addition, an examination of
the model fit indices – namely the chi-square, CFI, TLI, IFI, SRMR, RMSEA– confirmed the
CFA model fit surpassed the acceptable goodness-of-fit. Assessment of the SEM model fit
using CMIN/DF, CFI, TLI, IFI and RMSEA also exhibit values above acceptable thresholds.
These results indicate that the specified structural model exhibits a good representation of the
data and suitable for path analysis. This led to the following hypotheses H1, H2, H3, H6, H7,
H9 and H11 accepted, whereas Hypotheses H4 and H5 are partially accepted. On the other
hand, hypotheses H8 and H10 rejected and their alternatives being concluded.
In the next chapter, the major findings of the study are presented with a view to draw
conclusions for the study. The findings are interpreted in light of the initial objectives that were
set out at the beginning of the study, with a view to determine the extent to which they are
achieved. Thereafter, the research implications and limitations are discussed. The contribution
made by this research is also alluded to in the next chapter.

115
CHAPTER 5
CONCLUSIONS AND RECOMMENDATIONS
5.1 INTRODUCTION
The regulated market, plus paradigm shift in fuel retailing, give rise to a challenging and
competitive environment for fuel companies in South Africa. Given the number of major
players and new entrants, the fight for market share is ferocious and will further intensify with
the prospect of liberalisation. Fuel companies need to influence customers to choose their
brand, non-fuel products and services through an impactful advert, capitalising on the identified
advertising controllable elements. In the previous chapter, the impact of these elements on
attitudes, and subsequently purchase intention, were tested, followed by presentation of the
results. This chapter commences with an overview of the study. Next, the chapter examines
whether the objectives of this study were achieved, before drawing the conclusions and
implications from the main findings. Thereafter, the contribution, recommendations and
limitations of the study, including opportunities for future research, are discussed. The
concluding remark winds up this chapter and denotes the completion of this study.
5.2 OVERVIEW OF STUDY
The purpose of this study was to investigate the influence of advertising controllable elements
on attitude towards advertisement, attitude towards brand and purchase intention of South
African motorists. In order to achieve this – and to provide context of the variables under study
– related literature reviews were discussed. The research methodology that guided this
investigation was then deliberated. Ultimately, the discussion on results, conclusions and
recommendations established whether the objectives stated were achieved.
Chapter 1 provides a background and laid out the groundwork of this research. The problem
statement under Section 1.2 highlighted the gap that exists in present studies pertaining to the
impact of advertising elements on advert attitude, brand attitude and purchase intention for
fuel, under competitive and regulated environments in developing countries such as South
Africa. The aim, questions and objectives of this study were framed in Section 1.3 to address

116
the problem statement. The relevant literature review concerning marketing communication,
advertising, attitudes, purchase intention, the petroleum industry and its fuel retail sector –
including the operating landscape – were briefly discussed in Section 1.4 to 1.7 (including sub-
sections) respectively, to provide the context that led to the formulation of eleven hypotheses
to be validated. These hypotheses formed the conceptual framework proposed for this research
under Section 1.8. This is followed by a brief outline of the research design and methodology
procedures in Section 1.9, which specified how the components of the study were conducted.
Section 1.10 underlined the contribution, while Section 1.11 explicated the limitations of this
research. Moreover, the ethical consideration was stipulated under Section 1.12, before the
thesis chapters were delineated in Section 1.13.
Chapter 2 further elucidates the literature review mentioned in the previous chapter. Section
2.2 discussed marketing communication as the foundation of advertising. The definition of
advertising, related models that describe the response process, benefits and limitations were
deliberated in Section 2.3. The advertising controllable elements – namely source, message
and channel – were introduced in Section 2.4. The elements’ attributes – specifically source
credibility, source likeability, rational message, and emotional message as antecedent of
consumer attitudes – were the variables in study and discussed under respective sub-sections.
Meanwhile, channel serves as a moderating variable to gather information about the medium
that carries the fuel ad being recalled, as well as the length of time participants spend on
respective channel categories. The philosophy of attitude was reviewed under Section 2.5,
particularly attitude towards the advertisement and attitude towards the brand, which
constituted the dependent variables in this study. Section 2.6 contained discussion on purchase
intention, which is another dependent variable of interest. Section 2.7 looked into the oil
industry in South Africa, specifically the downstream fuel retail sector – including its operating
landscape, where a paradigm shift in fuel marketing signified the importance of advertising
under regulated and competitive environment. The notion that fuel adverts can influence
attitudes and purchase intention, by leveraging on controllable elements to appeal to each stage
of responses, is the epitome of this study, particularly with fuel branded as a commodity and
low involvement product, albeit in a regulated yet competitive environment.
Chapter 3 outlines the research design and methodology undertaken for this study. Positioned
within the positivist research paradigm (Section 3.2), this study adopted deductive reasoning
to frame the investigation. As a result, the research was able to specify theory and thereby draw

117
relevant statistical conclusions by rigorous testing of the hypotheses. Logically, a descriptive
research design was followed (Section 3.3) by applying a quantitative research approach, which
was explained in Section 3.4. The chapter provides a detailed account of the sampling strategy
for the study (Section 3.5). In particular, a non-probability, convenience sampling method was
applied to gather input from eligible motorists in South Africa. The questionnaire design
process was discussed at length in Section 3.6 of this study. Pre- and pilot testing were
conducted to assess the validity and reliability of the adapted measurement scale, which was
drawn from previous literatures. Thereafter, minor modifications were implemented on the
self-administered questionnaire, and the final survey was commissioned using Qualtrics online
platform. The collected data underwent a preparation process (Section 3.7), which resulted in
a final 201 usable responses for statistical analysis. The statistical methods used for analysing
the data were deliberated in Section 3.8. These methods include frequency distributions
(Section 3.8.1), descriptive statistical analysis (Section 3.8.2), reliability and validity analysis
(Section 3.8.3) and Structural Equation Modelling (Section 3.8.4). The chapter concludes with
allusions to data interpretation (Section 3.9) and ethical consideration (Section 3.10)
respectively.
Chapter 4 reports findings from the investigation. The results presented in this chapter are in
accordance to the theoretical objectives formulated for the study.
5.3 MAIN FINDINGS OF THE STUDY
This section discusses the main findings of this study in line with the objectives formulated in
Chapter 1:
to investigate and compare the impact of source credibility and likeability on attitude
towards the advertisement and attitude towards the brand
to examine and compare the impact of rational and emotional appeals in message on
attitude towards the advertisement and advertised brand
to assess the effect of attitude towards the advertisement on attitude towards the brand
to study and compare the influence of attitude towards the advertisement and attitude
towards the brand on purchase intention

118
In accordance to the literature review, source credibility, source likeability, rational message,
and emotional message were identified as having influence on attitude towards the
advertisement and brand attitude. In addition, the literature review also indicated that attitude
towards the advertisement and attitude towards the brand subsequently impact purchase
intention. In total, these seven constructs constitute the measurement instrument used for the
investigation. This measurement instrument surpassed the reliability tests (Cronbach’s alpha,
average inter-item correlation, CR, AVE) as well as validity analysis (content, convergent and
discriminant) to be considered mutually reliable and valid. With scale means above 3.5 being
recorded on the descriptive statistical analysis results for source credibility, source likeability,
rational message and emotional message, it appears that consumers hold positive attitudinal
and behavioural intentions towards fuel advert and brand. The inter-item correlation analysis
revealed that there is weak to moderate association between each of the constructs in the scale.
Moreover, the inter-item correlation analysis procedure determined that there was no
multicollinearity problem in the study.
In order to assess the conceptual framework, Structural Equation Modelling was performed to
examine the relationship between hypothesised constructs. This was done through
confirmatory factor analysis, with fit indices (chi-square, CFI, TLI, IFI, SRMR and RMSEA)
computed to assess the measurement model fit. Thereafter, a structural model was employed
to evaluate causal relationships between constructs, along with model fit testing (CMIN/DF,
CFI, TLI, IFI and RMSEA). With exception of the chi-square values which is typically
sensitive to sample size, the other fit indices demonstrated satisfactory fit for both the
measurement model and structural model. The main findings are presented in Table 5.1, as
shown by the hypotheses testing.
Table 5.1 Results of the hypothesised relationships
Hypothesis Decision
rejected/supported
H1 Source credibility has a significant positive effect on attitude
towards the advertisement
Supported
H2 Source credibility has a significant positive effect on attitude
towards the brand
Supported

119
H3 Source likeability has a significant positive effect on attitude
towards the advertisement
Supported
H4 Source likeability has a significant positive effect on attitude
towards the brand
Supported, but weak
H5 Rational appeal has a positive and significant relationship
with attitude towards the advertisement
Supported but weak
H6 Rational appeal has a positive and significant relationship
with brand attitude
Supported
H7 Emotional appeal has a positive and significant relationship
with attitude towards the advertisement
Supported
H8 Emotional appeal has a positive and significant relationship
with brand attitude
Rejected, and
insignificant
H9 The attitude towards the advertisement has a positive and
significant effect on attitude towards the brand
Supported
H10 The attitude towards the advertisement has a positive and
significant effect on purchase intention
Rejected, and
insignificant
H11 The attitude towards the brand has a positive and significant
influence on purchase intention
Supported
In light of the findings, the following conclusions and implications may be drawn.
Source credibility and source likeability positively influence advert attitude and brand
attitude. Motorists are more likely to have favorable attitudes towards the fuel ads viewed
and the advertised brand when they perceive the source to be credible and likeable.
Moreover, source credibility has a significant impact on attitude towards the advertisement
and attitude towards the brand compared to source likeability, when it comes to fuel
adverts.
Rational message appeal has a positive relationship with both advert and brand attitude.
However, the degree of association is more significant on attitude towards the brand
compared to attitude towards the advertisement. These results can be attributed to the
nature of fuel retailing business and advertisements. Panda, Panda and Mishra (2013) posit
that it is challenging to create a rational platform for buying a commodity when the
120
cognitive arguments are not effective. This is caused by the difficulty to distinguish a
product from another, especially in a highly competitive and matured market (Panda et al.,
2013). Rather than focusing on the product attributes, fuel ads usually highlight ideas that
appeal to consumers’ affective side. The lack of functional information in fuel
advertisements may have contributed to the insignificant impact rational appeal has on
advert attitude. On the other hand, the rational appeal gives credence to fuel and non-fuel
products or services by highlighting the value they offer, which significantly influences
attitude towards the brand.
Panda, Panda and Mishra (2013) suggest that emotional appeals can help lift the
commodity from its level of sameness and position it differently in customers’ minds.
Conversely, this study revealed that emotional appeal only positively and significantly
impacts advert attitude but has no bearing on brand attitude. The significant impact
emotional appeal has on attitude towards the advertisement may result merely because the
ad evokes an emotive response, such as feelings of joy, love, pride, sorrow or nostalgia,
without any conscious processing of informational elements that could affect the same in
attitude towards the brand (Shimp, 1981). The findings from this study are consistent with
prior theoretical notions that emotional response has a significant impact on attitude
towards the advertisement, which in turn influences attitude towards the brand (Liu &
Stout, 1987; Mitchell, 1983; Shimp; 1981). Emotional message is shown to influence
consumers’ reaction to advertisements by captivating and enhancing their attention in
order to affect brand attitude (Liu & Stout, 1987; Shimp, 1981). Moreover, emotional
appeal performs better in a low-involvement commodity (Akbari, 2015; Dens & De
Pelsmacker, 2010; Panda et al., 2013), as the case with fuel and non-fuel products.
South African motorists were indeed affected by the fuel advertisements they were
exposed to. This influenced them to form a significant positive attitude towards the brand.
From an advertising perspective, attitude towards the advertisement is the prior variable
to be considered for new brands before attitude towards the brand (Ganesan et al., 2017).
The attractiveness of a fuel advert impresses customers and thus creates a positive brand
image and attitude, especially for new brands. For existing brands, it reinforces the gravity
of the effect and serves as a reminder of a brand’s unique value proposition. Mitchell
(1983) empirically examined the influence of attitude towards the advertisement on brand
attitude and concluded that the advert attitude effect would in fact persist over time. The

121
effect remains accessible in consumers’ minds, and brand recognition and recall
subsequently influences brand choice behavior.
Purchase intention for fuel is influenced by attitude towards brand, but not attitude towards
advert. This could be attributed to the fact that the existing fuel brands in South Africa are
already well-known to customers, and they have developed brand attitude derived from
own knowledge and experience with these brands, thereby influencing their purchase
intention. Additionally, fuel ads by-and-large are quite subtle in nature, rather than calls to
action – they have underlying ideas and create association, thereby remaining in
consumers’ minds. This could explain the insignificant, nonexistent impact attitude
towards advertisement has on purchase intention. Shimp (1981) suggests two alternative
mechanisms leading to the brand choice behavior or purchase intent. In the first,
consumers' beliefs and evaluations are influenced by processing an advertisement or ad
campaign – attitude towards the brand is engendered, and the choice of whether or not to
purchase the brand is contingent on how favorable the attitude towards the brand is.
Alternatively, there is the affect-referral path through which attitude towards the
advertisement is transferred to attitude towards the brand, which in turn determines the
buying intent. Data from this study indicates that the persuasion route followed the latter
mechanism. As such, the link between attitude towards the advertisement and purchase
intention can still be achieved using brand attitude as an intermediary.
Apart from the main findings, the responses received for the categorical sections provide
interesting and useful insights, which are shared as follows:
The sample population was well presented in all age categories. The largest group of the
respondents are above 45 years old and drive passenger car or sport utility vehicles. The
majority of respondents between 31 to 44 years old drive passenger cars, while those who
drive motorcycles are in the 18 to 30 years’ group. For private vehicles, age factor may
influence the type of vehicle they drive, which in turn reflects their fuel consumption.
The majority of the respondents spend between 1 – 4 hours a day on traditional channels.
The numbers are higher compared to online channels for the same amount of time.
Therefore, traditional channels remain a prominent medium to broadcast fuel ads to

122
consumers. The traditional channels in which respondents recalled the fuel ad were
television, radio, print, billboards and banners.
Despite traditional channels having the lead, South African fuel companies embraced
online channels as a formidable medium to carry their fuel advertisements. Fuel ads on
social media received the highest recall among all the platforms under online channels.
Fuel ads by Engen received the highest recollection. It is also the brand used by the majority
of the respondents, which is not a surprise since Engen is the market leader in South Africa.
Interestingly, the data in Figure 4.11 revealed that the fuel ads the respondents recalled may
not be the same as the fuel brand they are using. This supports one of the main findings,
which showed that attitude towards the advertisement has no influence and no significant
impact on purchase intention. They recalled the fuel ad as it evoked some cognitive or
emotive elements, however it is not enough to influence their fuel brand choice.
5.4 CONTRIBUTION OF THE STUDY
The contribution of this study can be viewed from the theoretical and practical perspectives.
5.4.1 Theoretical or conceptual contribution
Theoretically or at conceptual level, this research advances the body of knowledge by
developing a new model for fuel advertisement, drawing from the underlying influences of
certain elements in advertising. While numerous studies cited under literature review have
appraised the influence of source and message appeals on consumers’ attitudes and behavioural
intention, none were conducted on low involvement commodity such as fuel. This study
contributes to the knowledge base by empirically testing the impact of advertising controllable
elements, specifically source and message appeals on the attitudes and, subsequently purchase
intention of South African motorists for fuel products and services. The study also provides
awareness on the different level of impact between distinctive source characteristics
(credibility/likeability) and types of advertising appeals (rational/emotional) on attitudes
towards the advertisement along with advertised brand, as well as behavioural intention within
a single integrated model. Moreover, unlike previous studies that were conducted in matured

123
countries, this research provides insights on the effectiveness of fuel advertising in developing
economies such as South Africa.
The use of robust structural equation modelling by means of maximum likelihood estimation
technique is proven to be a more coherent approach to concurrently test the theoretic-driven
propositions in marketing modelling. Moreover, generating path estimation for the specified
model provides greater flexibility than the use of precedent first-generation techniques to
interchange between theory and data. Previous studies have examined several sets of constructs
but have yet to date attempted to integrate these into a comprehensible framework, moving
from antecedent variables, intermediate variables and finally concluding with outcome
variable. With the use of rich, primary data obtained through online sampling of South African
motorists, it was possible to test the fit of the research model to the data, thereby confirming
the goodness of individual relationships as well as the overall model. As a result, the research
does not merely address the relationship between source, message appeals, attitudes, and
purchase intention, but simultaneously integrates them in a holistic model that determines the
efficacy of the fuel ads. Succinctly, the research offers a comprehensive yet parsimonious
model, besides simple to understand and practical to apply, which could prove useful for an
academic understanding of the subject.
5.4.2 Managerial or practical contribution
In terms of managerial contribution, the study presents a model that can be used to create an
impactful advertisement which touch customers, and influence their attitudinal and behavioural
intention. By way of marketing, fuel companies tend to focus more on expanding their
geographical coverage or distribution network and less on advertising. Unlike other
commodities, fuel advertisements have been lacking or rarely produced, whilst enduring
consumer perception of fuel as a low involvement commodity with no difference in quality.
Fuel companies need to develop impactful advertisements to successfully differentiate their
business, effectively capture prospects and customers’ attention, generate leads, initiate and
increase sales, as well as inspire loyalty, while remain conscious of the cost. By understanding
which advertising elements within their control have the biggest positive influence on attitude
towards the advertisement, brand, and subsequently purchase intention, marketers of fuel
companies can focus on specific elements to create an impactful advert. The aim is to stand out
and be the preferred fuel brand in a crowded and regulated marketplace. Better allocation in

124
terms of resources among the elements also can be achieved, which improve budgeting and
optimise return on investment.
The findings of this study are expected to provide brands and marketing practitioners with
insights into the preference of consumers when it comes to source attributes (credibility or
likeability), and whether they rely on rational or emotional (or both) systems to process
information in fuel advertisement. This area of research has not been pursued previously,
particularly within the context of South African fuel market. Moreover, acknowledging the
direct and different level of effect source credibility, source likeability, rational as well as
emotional appeals have on consumers’ attitudes and ensued purchase intention, could provide
marketers sound information for decision-making, thereby enabling them to better understand
the value judgements and expectations of South African motorists. The conclusions drawn
from this research and upon which the implications are based, provide significant albeit small
contribution to pool of knowledge regarding consumers’ view of fuel advertisement.
Henceforth, the research offers practical suggestions to marketers and managers to optimise
their fuel ads strategy by employing the recommendations in next section.
5.5 RECOMMENDATIONS
One of the major challenges fuel companies face is how best to create an advertisement that
ensure their organisations stands out in this regulated and competitive market environment.
Marketers therefore need to develop strategies for fuel adverts that not only position the brand
in a positive light and remain atop customers’ mind, but also influence their fuel choice
behaviour. Such strategies may include focusing on advertising elements within their control
to develop an impactful fuel advert. Therefore, based on the findings, this section outlines
several recommendations pertaining to the use of advertising controllable elements to make an
effective advert. Recommendations emanating from this study are aligned with the research
objectives formulated to appeal to marketers of fuel companies for consideration and adoption.
Feature a credible and likeable source in their advertisement
The credibility of an advertisement and consumers’ preference for a brand depends on their
overall perception; and whether they view the ad and advertised brand to be reliable, truthful,
dependable, trustworthy and legitimate. By featuring a credible and likeable source in the fuel

125
advert, it brings credence to the communication, enhances the value of information in the
message, and charms the viewers. From the responses received, for fuel products and services,
source credibility is viewed more favourably based on the following traits; trustworthiness,
reliability, experience and expertise, in comparison to a well-known personality. A likeable
source is considered highly based on sincerity, friendliness, attractiveness/appeal, familiarity,
and charisma. These attributes or characteristics bring to light the persona that appeals to
customers. The source’s positive qualities and charisma influence consumers’ belief and
acceptance of a message. The consumers see the source as having relevant knowledge, skill or
experience, and trust the source to give unbiased, objective information that fulfils the
cognitive side of attitude. The congeniality traits attract the affective side of attitude. Although
a credible source is viewed more favorably than a likeable source when it comes to fuel
products and services, the likeability attribute is still vital when considering the substantial
influence it has on advert attitude, and consequently the influence advert attitude has on brand
attitude. Therefore, both credibility and likeability are important determinants of an ads’
success, which need to be given due consideration when choosing a source for the fuel
advertisement.
Combine rational and emotional appeal in the message
The message in fuel adverts needs to contain both rational and emotional appeals to resonate
with the different component of attitudes and make an impact. As evident from the main
findings, attitude towards advertisement is significantly induced by emotional appeal, while
rational appeal benefits the brand attitude. Insights from the categorical sections indicate that
consumers are highly in favour of rational message, emphasising the fuel products’ benefits,
services offered and convenience aspect, followed by quality of fuel products as well other
non-fuel products available. Messages that contain emotional appeal relating to happiness,
humour, local/national brand and excitement received higher agreement compared to love,
relationship and sense of belonging.
The rational appeal with information on fuel products plus services – targeted at the cognitive
component of attitude for consumers to be able to evaluate and come up with a decision – is
important to highlight a brand’s value proposition. Nonetheless, it is imperative to ensure the
right amount of information is being showcased, as not to overload the message, causing it to

126
lose its impact. The information on the products and services attributes, as well as benefits over
competing brands (for example, quality, speed, value for money), must be precise. Since fuel
is perceived to be a commodity and low involvement product, the attachment consumers feel
towards a brand is more of practicality rather than psychology. Advertisements are mostly
ignored, and rational appeal usually goes unnoticed. For those reasons, emotional appeal is a
prerequisite to captivate viewers’ attention, resonating with the affective component of their
attitude that creates a liking to the advert and develops a connection to the brand. Thus, the
emotional appeal is essential to establish positive and significant attitude towards the
advertisement that subsequently positively and significantly impacts the advertised brand.
Produce more direct-action ads of the core products to influence fuel brand choice in
addition to the indirect-action approach
Advertising can be developed to focus on the organisation, products or services. As an
extension of the public relation function in shaping corporate image, institutional advertising
is aimed at cultivating favourable consumer attitudes towards the organisation by highlighting
the innovation, achievement, development and initiatives undertaken under corporate social
responsibility. However, the intent is more on developing goodwill and confidence in the
advertiser and convincing consumers of the integrity of the company, rather than to generate
demand. Product or service advertising, on the other hand, focus on creating demand and
generating sales by highlighting the company’s value proposition to counteract similar
products/services offered by competitors. This type of advertising can be in the form of direct-
action, indirect-action, or a combination of both. Direct-action advertising prompts consumers
to take immediate action by offering some benefits or rewards to make the purchase. Its effect
can be statistically computed from the responses received. Indirect-action advertising is similar
to institutional advertising – where the goal is to build and maintain reputation, as well as
develop a relationship with consumers to obtain better result in the long-term. The expectation
is that the positive perception would lead to positive attitude, which subsequently influences
purchase intention. The effect of indirect action advertising, however, can only be felt but
cannot be accurately measured. A combination of direct and indirect-action approach builds a
brand image, along with responsive schemes to encourage consumers to react instantly in
favour of purchase decision.

127
In general, the advertisements by fuel companies adopt an indirect action approach and are
quite subtle in nature when it comes to fuel products or services offered at their forecourts. The
underlying content in fuel ads usually sells ideas rather than the core products. This messaging
focuses on customer experience or highlights social and environmental efforts. The intent is to
position the fuel companies as responsible and caring organisations in consumers’ minds,
which in turn creates favourable attitude and behaviour towards the products. It is also to create
a mental association with consumers in order to remain at the top of their mind for
understanding in the long run. Fuel companies do run direct action adverts occasionally, but
these are focused more on promoting assortments from their convenience stores, rather than on
core products, or in conjunction with an event or launch.
In order to develop an advert attitude that not only positively and significantly influences brand
attitude but also purchase intention, fuel companies should adopt a proactive two-pronged
advertising strategy that combines both a direct and indirect-action approach. Since fuel
companies cannot compete on price for petrol due to the regulated market, the goal is to sell
more volume to increase sales and gain lead in market share. On the other hand, it is an open
market for diesel and other fuel products. Direct-action ads that feature and promote fuel
products can be invigorated over and above promotional ads on convenience assortments to
increase revenues. This can be coupled with specific and frequent marketing campaigns that
encourage consumers to fuel up to maximum to earn certain benefits or rewards. At the same
time, the indirect-action approach and institutional advertising should still be maintained to
create and sustain mental association with consumers. As part of the implementation, both
types of adverts should feature a credible and likeable source in delivering a message
interweaved with rational as well as emotional appeals to touch all three different components
of attitudes.
Broadcast the fuel ads on both traditional and online channels to gain maximum
impact
Data on channels as moderating variables revealed that the majority of the respondents still
spend between 1 – 4 hours a day on traditional channels, proving this medium is still effective
to carry the fuel ads. In addition, most of the fuel ads recalled by the respondents were on
traditional channels like television, billboards and banners, as well radio. The recollection of
fuel ads on online channels is much lower than traditional channels, and fuel ads on social

128
media received the highest recall compared to internet (website/search engine), YouTube and
mobile applications. Nevertheless, the number of respondents who spend more than 4 hours a
day is higher on online channels, compared to traditional channels. This could be attributed to
the mobility factor, as online channels are accessible from any location throughout the day.
Moreover, respondents who are 35 years old and below tend to spend more time on online
channels. Fuel companies can use these insights for their channel strategy, selecting the
appropriate platform based on its strength to reach mass and specific target customers.
5.6 LIMITATIONS AND FUTURE RESEARCH
Despite producing meaningful results, this study, like most studies, is not without limitations,
which may present several future research opportunities.
Firstly, this study only utilised a quantitative research method. Future research may benefit
from a mixed-method approach, utilising both quantitative and qualitative research techniques
to gain a deeper insight or more in-depth understanding of the impact of advertising
controllable elements on advert and brand attitude, as well as purchase intention. Moreover,
the variables in study only served as proxies for real behaviour with no adequate picture of how
the participants truly act, which to some extent may impact the accuracy of the measurement
instrument.
Secondly, the sample was drawn using a non-probability convenience sampling method –which
does provide ease of access to participants, but may have resulted in sampling biases.
Therefore, care should be taken in generalising the findings of this study to the wider target
population of South African motorists. Also, the sample size of 201 participants may be
deemed too small, and not representative of the population. Henceforth, external validity could
be enhanced by selecting a larger sample size.
Thirdly, this study was conducted in the specific context of fuel advertisements within the
South African market. Thus, it is undependable to generalise the findings of this study to cover
a broader context or different industry. A similar study can be duplicated to different industries
or populations of other countries to determine whether there are similarities and/or differences
in the main findings from this study.
129
Fourthly, this research investigates motorists’ fuel purchase intention from the context of fuel
advertisement i.e., the impact of source and message appeals in the advert they were exposed
to, on their attitudes towards the advertisement, advertised brand and subsequently purchase
intention. Whether the motorists are forced to fuel at certain garage because of their
employer/company fuel card or loyalty programme partnership was not under consideration of
this research. It could be undertaken for future studies.
Lastly, it should be noted that the aforementioned limitations do not necessarily negate the
contributions of this study, but open up avenues for future research.
5.7 CONCLUDING REMARKS
In conclusion, the controllable advertising elements – namely source credibility, source
likeability, rational message and emotional message – have a positive impact on attitude
towards the advertisement and the advertised brand, which consequently positively influence
purchase intention. The magnitude of impact that respective elements have on attitudes and
purchase intention, however, varies. Source credibility has a more significant impact on advert
and brand attitude compared to source likeability. While source likeability has a substantial
effect on attitudes towards the advertisement, the influence it has on brand attitude is
immaterial. Nonetheless, source likeability is still vital due the strong influence it has on
attitude towards the advertisement. From a message perspective, rational appeal positively and
significantly influences brand attitude, while emotional appeal has a positive and enormous
effect on advert attitude. In a nutshell, the specific attributes of source and message are essential
to the success of an advert by targeting the relevant component of attitudes. Ultimately, the
findings showed that when it comes to fuel products and services, purchase intention is
positively and significantly influenced by brand attitude, rather than advert attitude.
Alternatively, the absence of a direct relationship between attitude towards the advertisement
and purchase intention can be mitigated using brand attitude as an intermediary based on the
positive and strong impact it has on buying decision.
This study examined the impact of advertising controllable elements on attitude towards the
advertisement, attitude towards the brand, and purchase intention with regards to fuel products
and services. Taking cognisance of the findings, fuel companies can incorporate these elements

130
into their advertisements to get maximum impact and return on investment. The advertising
strategy must adopt a two-pronged; indirect and direct-approach so as to not only create mental
association with the consumers, but also elicit purchase. Additionally, with the advancement
in digital technology, advertisers have numerous options for channel or medium selection to
broadcast the ad. While online channels seem to gain momentum, the role of traditional
channels should not be discounted. The appropriate choice of channel as vehicle to carry the
ad is important in ensuring that it reach the intended audience.

131
BIBLIOGRAPHY
Aaker, D.A.A., Kumar, V., Day, G.S. & Leone, R.P. 2011. Marketing Research (International
Student Version). 10th ed. John Wiley & Sons (Asia) Pte. Ltd.
Abdul Wahid, N. & Ahmed, M. 2011. The effect of attitude toward advertisement on Yemeni
female consumers’ attitude toward brand and purchase intention. Global Business and
Management Research. 3(1): 21-29.
Acharya, A.S., Prakash, A., Saxena, P. & Nigam, A. 2013. Sampling: why and how of it?
Indian Journal of Medical Specialities. 4 (2): 330-333. DOI: 10.7713/ijms.2013.0032,
Adhi, P., Burns,T., Davis, A., Lal, S. & Mutell, B. 2019. A transformation in store. McKinsey
& Company. 3 May. Available: https://www.mckinsey.com/business-
functions/operations/our-insights/a-transformation-in-store#
Akbari, M. .2015. Different impacts of advertising appeals on advertising attitude for high and
low involvement products. Global Business Review. 16(3): 478-493.
Akhtar, M.I. (Dr.). 2016. Research Design. Available at SSRN:
https://ssrn.com/abstract=2862445 or DOI: http://dx.doi.org/10.2139/ssrn.2862445.
Akkaya, D.T., Akyol, A. & Simsek, G.G. 2017. The effect of consumer perceptions on their
attitude, behaviour and purchase intention in social media advertising. Marmara
Universitesi Iktisadi ve Idari Bilimler Dergisi. 39(II):361-388.
Aldalaigan, A. H. & Buttle, F. A. 2002. SYSTRA-SQ. A new measure of bank service quality.
Industrial Journal of Service Industry Management. 13(3): 362-381.
Alghamdi, A.H. & Li. L. 2013. Adapting design-based research as a research methodology in
educational setting. International Journal of Education and Research. 1(10):1-12.

132
Amos, C., Holmes, G. & Strutton, D. 2008. Exploring the relationship between celebrity
endorser effects and advertising effectiveness. International Journal of
Advertising. 27(2): 209-234. DOI: 10.1080/02650487.2008.11073052
Anderson, J.C. & Gerbing, D.W. 1988. Structural equation modeling in practice: A review and
recommended two-step approach. Psychological Bulletin. 103(3): 411-423.
Antwi, S.K. & Hamza, K. 2015. Qualitative and quantitative research paradigms in business.
European Journal of Business and Management. 7(3): 217-225.
Atkin, E. 2019. Introducing: The Fossil Fuel Ad Anthology. Available:
https://heated.world/p/introducing-the-fossil-fuel-ad-anthology [2020, January 25].
Attri, R. & Pahwa, M.S. 2012. Learning for public sector oil marketing companies in India to
manage business in turbulent times. Management Research Journal. 6:29-36. Available
at SSRN: https://ssrn.com/abstract=2138659
Babbie, E. & Mouton, J. 2010. The Practice of Social Research. 10th ed. South Africa. Oxford
University Press, Southern Africa.
Balakrishnan, B.K.P.D, Dahnil, M.I. & Yi, W.J. 2014. The impact of social media marketing
medium toward purchase intention and brand loyalty among Generation Y. Procedia -
Social and Behavioral Sciences. 148:177-185. DOI:
https://doi.org/10.1016/j.sbspro.2014.07.032
Barclay, D.W., Higgins, C. & Thompson, R. 1995. The Partial Least Squares (PLS) approach
to causal modeling: personal computer adaptation and use as an illustration,
Technology Studies. 2(2):285-309.
Belch, G. & Belch, M. 2017. Advertising and promotion: an integrated marketing
communications and perspective. 11th ed. New York. McGraw-Hill Higher Education.
Bello, A. & Cavero, S. 2008. The Spanish retail petroleum market: new patterns of competition
since the liberalization of the industry. Energy Policy. 36(2): 612-626. Elsevier.

133
Bhatt, N., Jayswal, R.M. & Patel, J.D. 2013. Impact of celebrity endorser’s source credibility
on attitude towards advertisements and brands. South Asian Journal of Management.
20(4): 75-95.
Bird, S. 2004. Marketing Communications (Chapter 12). Koekemoer, L. (Ed.). South Africa.
Juta and Co. Ltd.
Boomsma, A., & Hoogland, J. J. 2001. The robustness of LISREL modeling revisited. In
Structural equation modeling: present and future. Cudeck, R., du Toit, S. & Sörbom,
D. (Eds.). 139-168. Chicago. Scientific Software International.
Borborjafari, M., Khorshid, S. & Rastegar, A. 2016. Evaluating the relationship of rational
advertising appeals, cognitive information processing styles of consumers and
advertising effectiveness. International Business Management. 10(15): 2928-2934.
Boyle, J. 2019. #BizTrends2019: 4 key trends that will continue to shape convenience retail in
2019. BizCommunity. 8 January. Available:
https://www.bizcommunity.com/Article/196/731/185940.html.
Brown, M.W. & Cudeck, R. 1993. Alternative ways of assessing model fit. Testing structural
equation models. Bollen, K.A. & Long, J.S. (Eds.). Newbury Park, California. Sage.
Brulle, R.J., Aronczyk, M. & Carmichael, J. 2020. Corporate promotion and climate change:
an analysis of key variables affecting advertising spending by major oil corporations,
1986–2015. Climatic Change. 159: 87–10. DOI: https://doi.org/10.1007/s10584-019-
02582-8
Bryman, A. 2012. Social Research Methods. 4th ed. Oxford, UK: Oxford University Press.
Bryman, A., & Bell, E. 2017. Research Methodology: Business and Management Contexts. 7th
ed. Hirschsohn, P., Dos Santos, A., Du Toit, J., Masenge, A., Van Aardt, I. & Wagner,
C. (Eds.). South Africa. Oxford University Press Southern Africa (Pty) Limited.

134
Burns, N. & Grove, S.K. 2010. Understanding Nursing Research - eBook: Building an
Evidence-Based Practice. 5th ed. United States of America. Elsevier Saunders.
Burns, A.C, Veeck, A. & Bush. R.F. 2017. Marketing Research. 8th ed. Boston. Pearson
Education.
Byrne, B. M. 2010. Multivariate Applications Series. Structural Equation Modeling with
AMOS: Basic Concepts, Applications and Programming. 2nd ed. Routledge/Taylor &
Francis Group.
Cain, M.K., Zhang, Z. & Yuan, K. 2017. Univariate and multivariate skewness and kurtosis
for measuring nonnormality: Prevalence, influence and estimation. Behavior Research
Methods. 49:1716–1735. DOI: https://doi.org/10.3758/s13428-016-0814-1.
Churchill Jr, G.A., Brown, T.J. & Suter, T.A. 2010. Basic Marketing Research. 7th ed.
Australia. South-Western Cengage Learning.
Chou, C. & Bentler, P.M. 2002. Model modification in structural equation modeling by
imposing constraints. Computational Statistics & Data Analysis. 41(2): 271-287. DOI:
https://doi.org/10.1016/S0167-9473(02)00097-X
Clark, L.A. & Watson, D. 1995. Constructing validity: Basic issues in objective scale
development. Psychological Assessment. 7(3): 309-319.
Clow, K.E. & Baack, D.E. 2016. Integrated Advertising, Promotion, and Marketing
Communications, Global Edition. 7th Edition. Pearson Education Limited.
Chang, C. 2017. Methodological Issues in advertising research: Current Status, Shifts, and
Trends. Journal of Advertising. 46(1): 2-20. DOI: 10.1080/00913367.2016.1274924.
Chaoying, T., Jian, S. & Ille, F.R., 2011. Information handling styles, advertising and brand
attitude: A Chinese brand case study. International Journal of China Marketing.
1(2):45.

135
Child, D. 1990. The Essentials of Factor Analysis. 2nd ed. Cassell Educational.
Chin, W.W. 1998. The partial least squares approach to structural equation modeling. Modern
Methods for Business Research. 295(2): 295-336.
Chu, S., Kamal, S. & Kim, Y. 2013. Understanding consumers' responses toward social media
advertising and purchase intention toward luxury products. Journal of Global Fashion
Marketing. 4(3): 158-174. DOI: 10.1080/20932685.2013.790709.
Comrey, A.L. & Lee, H.B. 1992. Interpretation and Application of Factor Analytic Results, A
First Course on Factor Analysis. 2nd Edition. Hillsdale.
Cooper, D. R. & Schindler, P. S. 2010. Business Research Methods. 11th ed. McGraw-Hill
Education.
Creswell, J.W. 2014. Research Design: Qualitative, Quantitative and Mixed Methods
Approaches. 4th ed. Thousand Oaks, California. Sage Publications.
Cudeck, R. & O'Dell, L. L. 1994. Applications of standard error estimates in unrestricted factor
analysis: Significance tests for factor loadings and correlations. Psychological Bulletin.
115(3): 475–487. DOI: https://doi.org/10.1037/0033-2909.115.3.475.
Danaher P.J. 2017. Advertising effectiveness and media exposure. In: Wierenga B., van der
Lans R. (Eds.) Handbook of Marketing Decision Models. International Series in
Operations Research & Management Science. 254. Springer, Cham.
Danaher, P. J., & Dagger, T. S. 2013. Comparing the relative effectiveness of advertising
channels: A case study of a multimedia blitz campaign. Journal of Marketing Research.
50(4): 517–534. DOI: https://doi.org/10.1509/jmr.12.0241.
Danaher, P.J., and Rossiter, J.R. (2011). Comparing Perceptions of Marketing Communication
Channels. European Journal of Marketing. 45(1/2): 6-42.

136
Dehghani, M. & Tumer, M. 2015. A research on effectiveness of Facebook advertising on
enhancing purchase intention of consumers. Computers in Human Behavior. 49: 597-
600.
Dens, N. & Pelsmacker, P.D. (2010). Consumer response to different advertising appeals for
new products: The moderating influence of branding strategy and product category
involvement. Journal of Brand Management.18: 50–65. DOI:10.1057/bm.2010.22
Department of Energy [DoE] Website. 2020. Fuel Price Structure. South Africa. Available at:
http://www.energy.gov.za/files/petroleum_frame.html
de Villiers, J. 2019. Treasury wants to deregulate the petrol price - but an analyst believes this
will not bring cheaper fuel, only more price volatility. Business Insider. 28 August.
Available at: https://www.businessinsider.co.za/national-treasury-fuel-price-petrol-
deregulationeconomicgrowth.20198#:~:text=In%20a%20policy%20document%2C%
20the,increase%20price%20volatility%20for%20consumers
Ding, L., Velicer, W.F. & Harlow, L.L. 1995. Effects of estimation methods, number of
indicators per factor, and improper solutions on structural equation modeling fit indices,
structural equation modelling. A Multidisciplinary Journal. 2(2), pp: 119-143. DOI:
10.1080/10705519509540000.
Dugar, A. 2007. Marketing of petrol in India – transformation of an undifferentiated low
involvement commodity into high involvement brands. Innovative Marketing. 3(4).
Dugar, A. 2013. Measuring consumers’ preferences and attitudes towards branded petrol: An
initial investigation of the branded petrol market. Global Business Review. 14(1): 137-
154.
Ebrahimzadeh, M. H., Moradi, A., Vahedi, E., Kachooei, A. R., & Birjandinejad, A. 2015.
Validity and reliability of the Persian version of shortened disabilities of the arm,
shoulder and hand questionnaire (Quick-DASH). International Journal of Preventive
Medicine. 6(59). DOI: https://doi.org/10.4103/2008-7802.160336

137
Egan, J. 2007. Marketing Communication. Thomson Learning. London.
eNaTiS - National Traffic Information System. 2020 South Africa Licensed Vehicle Population
as at 31 January 2020. Available at: http://www.enatis.com/index.php/statistics/13-
live-vehicle-population/714-vehicle- population-statistics-for-december-2019january-
2020 [Accessed 7 Apr. 2020].
Engen Petroleum Limited (Engen). 2018. Engen Integrated Report 2018.
Engen remains SA’s Number One. 2017. Engineering News. 28 September. Available at
https://www.engineeringnews.co.za/article/engen-remains-sas-number-one-2017-09-
28/rep_id:4136
Erdogan, B.Z. 1999. Celebrity endorsement: A literature review. Journal of Marketing
Management. 15(4): 291-314. DOI: 10.1362/026725799784870379.
Esterhuizen, I. 2011. Retail fuel sector changing dramatically. Engineering News. 6 May.
Available at: https://www.engineeringnews.co.za/print-version/dramatic-change-in-
retail-sector-2011-04-18
Fan, Y., Chen, J., Shirkey, G., John, R., Wu, S.R., Park, H. & Shao, C. 2016. Applications of
structural equation modeling (SEM) in ecological Studies: An Updated Review.
Ecological Processes. 5(19): 1-12. DOI 10.1186/s13717-016-0063-3
Francis, J.E. & White, L. 2002. PIRQUAL: a scale for measuring customer expectations and
perceptions of quality in internet retailing. Evans, K. and Scheer, L. (Eds.). American
Marketing Association / Winter 2002. 13: 263 – 269.
Feiz, D., Fakharyan, M., Reza Jalilvand, M. & Hashemi, M. 2013. Examining the effect of TV
advertising appeals on brand attitudes and advertising efforts in Iran. Journal of Islamic
Marketing. 4(1): 101-125. DOI: https://doi.org/10.1108/17590831311306372
Fennis, B.M. & Stroebe, W. 2016. The Psychology of Advertising. 2nd ed. Routledge.

138
Fleck, N., Korchia, M. & Le Roy, I. 2012. Celebrities in advertising: Looking for congruence
or likability. Psychology & Marketing. 29(9): 651-662.
Fraering, M. & Minor, M.S. 2006. Sense of community: An exploratory study of US consumers
of financial services. International Journal of Bank Marketing. 24(5): 284-306. DOI:
https://doi.org/10.1108/02652320610681738
Fornell C. & Larcker, D.F. 1981. Structural equation models with unobservable variables and
measurement error: Algebra and statistics. Journal of Marketing Research. 18(3): 382-
388. DOI: 10.1177/002224378101800313
Four trends shaping the fuel retail sector in SA. 2016. Engineering News. 19 April. Available:
https://www.engineeringnews.co.za/article/four-trends-shaping-the-fuel-retail-sector-
in-sa-2016-04-19/rep_id:4136
Foroudi, P. 2019. Influence of brand signature, brand awareness, brand attitude, brand
reputation on hotel industry’s brand performance. International Journal of Hospitality
Management. 76: 271–285.
Ganesan, P., Sridhar, M., & Priyadharsani, S. 2017. Reciprocal relationship and the mediating
role between dimensions of attitudes towards advertisement (Aad), brand attitude (Abr)
and purchase intention (PI) – A case study of ready-to-eat food products. Journal of
Contemporary Management Research. 11(2): 25-53.
Gay, L., Airasian, P. & Mills, G. 2012. Educational Research: Competencies for Analysis and
Applications. 10th ed. Harlow, Essex: Pearson.
Goldsmith, R., Lafferty, B. & Newell, S. 2000. The influence of corporate credibility on
consumer attitudes and purchase intent. Corporate Reputation Review. 3:304–318.
DOI: https://doi.org/10.1057/palgrave.crr.1540122
Gorsuch, R. L. 1983. Three methods for analyzing limited time-series (n of 1) data. Behavioral
Assessment. 5(2): 141–154.

139
Grix, J. 2018. The Foundations of Research. 3rd ed. United Kingdom. Macmillan International
Higher Education.
Hoogland, J. J., & Boomsma, A. 1998. Robustness studies in covariance structure modeling:
An overview and a meta-analysis. Sociological Methods & Research. 26(3): 329–367.
DOI: https://doi.org/10.1177/0049124198026003003
Hair, J.F., Lukas, B.A., Miller, K.E., Bush, R.P. & Ortinau, D.J. 2008. Marketing Research.
2nd ed. Boston, Mass. McGraw-Hill Irwin.
Hair, J.F., Black, W.C., Babin, B.J. & Anderson, R.E. 2010. Multivariate data analysis: a global
perspective. 7th ed. Upper Saddle River, N.J. Pearson.
Ho A.D. & Yu, C. C. 2015. Descriptive statistics for modern test score distributions: skewness,
kurtosis, discreteness and ceiling effects. Educational and Psychological Measurement.
75(3): 365-388. DOI: 10.1177/0013164414548576
Hornik, J. and Miniero, G. 2010. Ad message appeal effectiveness: a meta-analysis.
Bocconi University Business Economics Magazine. XXVIII(4). Available online at:
http://digital.casalini.it/10.1400/199970
Hovland, C. I. & Weiss, W. 1951. The influence of source credibility on communication
effectiveness. Public Opinion Quarterly. 15(4): 635–650. DOI:
https://doi.org/10.1086/266350
Hoyle, R. H. (Ed.). 1999. Statistical Strategies for Small Sample Research. Thousand Oaks,
CA. Sage.
Hoyle, R.H. 2014. Handbook of Structural Equation Modeling. New York. The Guilford Press.
Hoyle, R. H., & Kenny, D. A. 1999. Statistical power and tests of mediation, in statistical
strategies for small sample research. Hoyle, R. H. (Ed.). Newbury Park, CA. Sage
Publications.

140
Hume, C., Ball, K. & Salmon, J. 2006. Development and reliability of a self-report
questionnaire to examine children's perceptions of the physical activity environment at
home and in the neighbourhood. International Journal Behavior Nutr Phys Act. 3(16).
DOI: https://doi.org/10.1186/1479-5868-3-16
Ismagilovaa, E., Slade E., Rana, N. P. & Dwivedic, Y. K. 2020. The effect of characteristics
of source credibility on consumer behaviour: A meta-analysis. Journal of Retailing and
Consumer Services. 53. DOI: https://doi.org/10.1016/j.jretconser.2019.01.005
Jonker, J. & Pennink, B. 2010. The Essence of Research Methodology: A Concise Guide for
Master and PhD Students in Management Science. Berlin. Springer.
Jovanovic, P., Vlastelica, T. & Kostic, S.C. 2016. Impact of advertising appeals on purchase
intention. Management Philip Morris International & University of Belgrade. DOI:
10.7595/management.fon.2016.0025
Juska, J. M. 2017. Integrated Marketing Communication: Advertising and Promotion in a
Digital World. Routledge.
Kamran , Q. & Siddiqui, D. A. 2019. The impact of emotional advertising on consumer buying
behavior for home appliance products in Pakistan. Business and Management
Horizons. 7(1): 23-48.
Kashif, A. & Rashid, R. 2016. Impact of transformational advertisement on customer attitude,
perception and purchase intention. Journal of Organisational Studies and Innovation.
3(4).
Kaushal, S. K. & Rakesh, K. 2016. Influence of attitude towards advertisement on purchase
intention: exploring the mediating role of attitude towards brand using SEM Approach.
The IUP Journal of Marketing Management. XV(4): 44-59.
Kazmi, S.H.H & Batra, S.K. 2009. Advertising and Sales Promotion. India. Excel Books.
141
Kemp, E. Kennett-Hensel, P.A. & Kees, J. 2013. Pulling on the heartstrings: examining the
effects of emotions and gender in persuasive appeals. Journal of Advertising. 42(1): 69-
79. DOI: 10.1080/00913367.2012.749084.
Keshari, P., & Jain, S. 2016. Effect of age and gender on consumer response to advertising
appeals. Paradigm. 20(1): 69–82. DOI: https://doi.org/10.1177/0971890716637702
Khandelwal, U., & Bajpai, N. 2013. Measuring consumer attitude through marketing
dimensions: A comparative study between metro and non-metro cities. Jindal Journal
of Business Research. 2(2): 85–103. DOI: https://doi.org/10.1177/2278682115595895.
Kim, S. & Stoel, L. 2004. Dimensional hierarchy of retail website quality. Information &
Management. 41: 619–633.
Kim, C., Galliers, R.D., Shin, N., Ryoo, J. & Kim, J. 2012. Factors influencing internet
shopping value and customer repurchase intention. Electronic Commerce Research and
Applications. 11(4): 374-387. DOI: https://doi.org/10.1016/j.elerap.2012.04.002
Kim, Y.J. & Han, J. 2014. Why smartphone advertising attracts customers: A model of Web
advertising, flow, and personalization. Computers in Human Behavior. 35:586. DOI:
https://doi.org/10.1016/j.chb.2014.01.015
Kline P. 1994. An Easy Guide to Factor Analysis. London. Routledge.
Kline, R.B. 2011. Principles and Practice of Structural Equation Modelling: Methodology in
the Social Sciences. New York. Guilford Publications.
Kotler, P. 2003. Marketing Insights from A to Z: 80 Concepts Every Manager Needs to Know.
John Wiley & Sons.
Kotler, P. & Armstrong, G. 2014. Principles of Marketing. 15th ed. Pearson.
Kotler, P & Keller, K.L. 2015. Marketing Management. 15th ed. Pearson Education.

142
Kumar, V. & Gupta, S. 2016. Conceptualizing the evolution and future of advertising. Journal
of Advertising. 45(3): 302-317. DOI: 10.1080/00913367.2016.1199335.
Kunkel, T., Walker, M. & Hodge, C.M. 2019. The influence of advertising appeals on
consumer perceptions of athlete endorser brand image. European Sport Management
Quarterly. 19(3): 373-395. DOI: 10.1080/16184742.2018.1530688.
Lee, E., Lee, S. & Yang, C. 2017. The influences of advertisement attitude and brand attitude
on purchase intention of smartphone advertising. Industrial Management & Data
Systems. 117(6): 1011-1036.
Lee, J. & Hong, I.B. 2016. Predicting positive user responses to social media advertising: The
roles of emotional appeal, informativeness and creativity. International Journal of
Information Management. 36(3): 360-373.
Lin, L. Y. 2011. The impact of advertising appeals and advertising spokespersons on
advertising attitudes and purchase intentions. African Journal of Business
Management. [online] 5(21): 8446-8457. Available:
https://www.academicjournals.org/AJBM [Accessed 7 Apr. 2019].
Liu, Scott S. & Stout, Patricia A. 1987. Effects of message modality and appeal on
advertising acceptance. Psychology and Marketing. 4(3): 167–87.
Liu, F., Cheng, H. & Li, J. 2009, Consumer responses to sex appeal advertising: A cross‐
cultural study. International Marketing Review. 26(4/5): 501-520. DOI:
https://doi.org/10.1108/02651330910972002
Lovric, B. 2016. Soft Power. Journal of Chinese Cinemas. 10(1):30-34. DOI:
10.1080/17508061.2016.1139798.
MacCallum, R. C., Widaman, K. F., Zhang, S., & Hong, S. 1999. Sample size in factor analysis.
Psychological Methods. 4(1): 84–99. DOI: https://doi.org/10.1037/1082-989X.4.1.84

143
Mackenzie, N., & Knipe, S. 2006. Research dilemmas: Paradigms, methods and methodology.
Issues In Educational Research. 16(2): 193-205. Available at:
http://www.iier.org.au/iier16/mackenzie.html
MacKenzie, S. B., Lutz, R. J., & Belch, G. E. 1986. The role of attitude toward the ad as a
mediator of advertising effectiveness: A test of competing explanations. Journal of
Marketing Research. 23(2): 130–143. DOI:
https://doi.org/10.1177/002224378602300205
Maggs, J. 2019. Adfocus - Watch: SA’s favourite ads from 1984–2018, a list of SA’s favourite
commercials over time shows that the more emotionally engaging the ad, the more
memorable it becomes, making the brand more easily recalled and likely to be chosen.
BusinessLIVE. 5 December. Available: https://www.businesslive.co.za/redzone/news-
insights/2019-12-05-sas-favourite-ads-1984-2018/
Makombe, G. 2017. An expose of the relationship between paradigm, method and design in
research. The Qualitative Report. 22(12): 3363-3382. Retrieved from
http://nsuworks.nova.edu/tqr/vol22/iss12/18
Malhotra, N. 2010. Marketing Research: An Applied Orientation. 6th ed. Boston, New York.
Pearson.
McKay-Nesbitt, J., Manchanda, R.V., Smith, M.C. & Huhmann, B.A. 2011. Effects of age,
need for cognition and affective intensity on advertising effectiveness. Journal of
Business Research. 64(1): 12-17.
McMinn, A.M., van Sluijs, E.M., Harvey, N.C., Cooper, C., Inskip, H.M., Godfrey, K.M. &
Griffin, S.J. 2009. Validation of a maternal questionnaire on correlates of physical
activity in preschool children. International Journal Behavior Nutr Phys Act 6. 81.
DOI: https://doi.org/10.1186/1479-5868-6-81
Memon, M.A., Ting, H., Ramayah, T., Chuah, F. & Cheah, J. 2017. A review of the
methodological misconceptions and guidelines related to the application of structural

144
equation modeling: A Malaysian scenario. Journal of Applied Structural Equation
Modeling. 1(1): i-xiii.
Md Husin, M., Ismail, N. & Ab Rahman, A. 2016. The roles of mass media, word of mouth
and subjective norm in family takaful purchase intention. Journal of Islamic Marketing.
7(1): 59-73. DOI: https://doi.org/10.1108/JIMA-03-2015-0020
Mirabi, V., Akbariyah, H. & Tahmasebifard. 2015. A study of factors affecting on customers
purchase intention case study: the agencies of bono brand tile in Tehran. Journal of
Multidisciplinary Engineering Science and Technology (JMEST). 2(1): 267-273.
Mitchell, A. 2018. A review of mixed methods, pragmatism and abduction techniques. The
Electronic Journal of Business Research Methods. 16(3): 103-116. Available online at
www.ejbrm.com
Mitchell, A. A. (1983). Cognitive processes initiated by exposure to advertising. In R. J. Harris
(Ed.). Information processing research in advertising. 13-42. Hillsdale, NJ: Eribaum.
Mitchell, A.A. & Olson, J.C. 1981. Are product attribute beliefs the only mediator of
advertising effects on brand attitude. Journal of Marketing Research. 18(3): 318–332.
Mogaji, E., Czarnecka, B. & Danbury, A. 2018. Emotional appeals in UK business-to-business
financial services advertisements. International Journal of Bank Marketing. 36(1): 208-
227. DOI: https://doi.org/10.1108/IJBM-09-2016-0127
Mundfrom, D. J., Shaw, D. G., & Ke, T. L. 2005. Minimum sample size recommendations for
conducting factor analyses. International Journal of Testing. 5(2): 159-168.
Muthen, L.K. & Muthén, B.O. 2002. How to use a Monte Carlo study to decide on sample size
and determine power, structural equation modeling. A Multidisciplinary Journal. 9(4):
599-620. DOI: 10.1207/S15328007SEM0904_8.
145
Naik, P.A. and Peters, K. 2009. A Hierarchical Marketing Communications Model of Online
and Offline Media Synergies. Journal of Interactive Marketing. 23(4): 288-
299. DOI: https://doi.org/10.1016/j.intmar.2009.07.005
National Treasury, Republic of South Africa (National Treasury). 2019. Economic
Transformation, Inclusive Growth, and Competitiveness: Towards an Economic
Strategy for South Africa. [Online] Available:
http://www.treasury.gov.za/comm_media/press/2019/Towards%20an%20Economic%
20Strategy%20for%20SA.pdf
Ness, A., Johnson, G., Ault, M., Taylor, W., Griffith, J., Connelly, S., Dunbar, N. & Jensen,
M. 2017. Reactions to ideological websites: The impact of emotional appeals,
credibility and pre-existing attitudes. Computers in Human Behavior. 72: 496-511.
Neuman, W. L. 2006. Social Research Methods Qualitative and Quantitative Approaches. 6th
ed. Boston: Allyn and Bacon.
Nguyen, B., Ekinci, Y., Simkin, L. & Melewar, T. C. 2015. The brand likeability scale: An
exploratory study of likeability in firm-level brands. International Journal of Market
Research. 57(5): 777–800. DOI: https://doi.org/10.2501/IJMR-2015-063
Nguyen, M.H. & Nguyen, H.L. 2017. The effects of celebrity endorsement on customer’s
attitude toward brand and purchase intention. International Journal of Economics and
Finance. 9(1). ISSN 1916-971X E-ISSN 1916-9728.
Noble, G., Pomering, A. & W. Johnson, L. 2014. Gender and message appeal: Their influence
in a pro-environmental social advertising context. Journal of Social Marketing. 4(1): 4-
21. DOI: https://doi.org/10.1108/JSOCM-12-2012-0049
O'Guinn, T, Allen, C., Semenik, R.J. & Scheinbaum, A.C. 2014. Advertising and Integrated
Brand Promotion. 7th ed. Cengage Learning.
Nunally, J.C. 1978. Psychometrics Theory. New York. McGraw-Hill.

146
Nunnally, J. & Bernstein, I.H. 1994. Psychometric Theory. 972. McGraw-Hill Companies.
Ohanian, R. 1990. Construction and validation of a scale to measure celebrity endorsers'
perceived expertise, trustworthiness and attractiveness. Journal of Advertising. 19(3):
39-52. DOI: 10.1080/00913367.1990.10673191.
Owhal, S.B. 2015. Influence of advertisement believability, persuasiveness and buying
behavior on consumer attitude towards advertisement of mobile cellular services.
Journal of Commerce and Management Thought. 6(3): 528-546. DOI: 10.5958/0976-
478X.2015.00033.6.
Okazaki, S., Mueller, B. & Taylor, C.R. 2010. Measuring soft-sell versus hard-sell advertising
appeals. Journal of Advertising. 39(2): 5-20. DOI: 10.2753/JOA0091-3367390201.
Padhy, M.K. 2011. Indigenous brand advertising: The future branding strategy. Pragyaan.
Journal of Mass Communication. 9(1): 25-34.
Pallant, J. 2010. SPSS survival manual: a step by step guide to data analysis using SPSS for
Windows (Version 10). Buckingham. Open University Press.
Panda, T., Panda, T.K. & Mishra, K. 2013. Does emotional appeal work in
advertising? The rationality behind using emotional appeal to create favorable
brand attitude. The IUP Journal of Brand Management. X(2): 7-23. Available at
SSRN: https://ssrn.com/abstract=2345126
Pashna, M., Esfidani, M. R., & Jafari, S. M. 2019. The role of user involvement, user
involvement types, product category involvement and advertising appeals in social
media advertising effectiveness: A middle east context (Iran). Journal of Creative
Communications. 14(2): 85–117. DOI: https://doi.org/10.1177/0973258619851987
Peterson, R.A. 1994. A meta-analysis of Cronbach’s coefficient alpha. Journal of Consumer
Research. 21(2): 381–391. DOI: https://doi.org/10.1086/209405

147
Phelan, C. & Wren, J. 2005. Exploring reliability in academic assessment. UNI Office of
Academic Assessment (2005-06). Retrieved from
https://chfasoa.uni.edu/reliabilityandvalidity.htm on April 24, 2020
Phembani Group (Phembani). 2019. Potfolio. Available:
https://www.phembani.com/index.php/portfolio/engen-limited/
PricewaterhouseCoopers (PwC). 2019. Insights from the Entertainment & Media Outlook:
2019 – 2023: An African Perspective. 10th ed. Available:
https://www.pwc.co.za/en/assets/pdf/entertainment-and-media-outlook-2019-
2023.pdf
Raluca, C. & Ioan, P. 2010. The impact of consumers’ attitude toward advertising on product
attitude. Interdisciplinary Management Research. 6: 727-737.
Raykov, T. & Marcoulides, G.A. 2012. A First Course in Structural Equation Modeling. 2th
ed. United States of America. Routledge.
Rodgers, S. & Thorson, E. 2019. Advertising Theory. 2nd ed. Routledge.
Ruchi, G. 2012. Advertising Principles and Practice. S.Chand Publishing.
Ruiz, S. & Sicilia, M. 2004. The impact of cognitive and/or affective processing styles on
consumer response to advertising appeals. Journal of Business Research. 57(6): 657-
664. DOI: https://doi.org/10.1016/S0148-2963(02)00309-0
Sadeghi, M., Fakharyan, M., Dadkhah, R., Khodadadian, M.R., Vosta, S.N., & Jafari, M. 2015.
Investigating the effect of rational and emotional advertising appeals of Hamrahe Aval
mobile operator on attitude towards advertising and brand attitude (Case study: Student
users of mobile in the area of Tehran. International Journal of Asian Social Science,
Asian Economic and Social Society. 5(4): 233-244.

148
Sallam, M.M.A. 2011. The impact of source credibility on Saudi consumer’s attitude toward
print advertisement: The moderating role of brand familiarity. International Journal of
Marketing Studies. [online] 3(4).
Sallam, M. & Algammash, F. 2016. The effect of attitude toward advertisement on attitude
toward brand and purchase intention. International Journal of Economics, Commerce
and Management. IV(2).
Schermelleh-Engel, K,. Moosbrugger, H. & Muller, H. 2003. Evaluating the fit of structural
equation models: Tests of significance and descriptive goodness-of-fit measures.
Methods of Psychological Research. 8(2): 23-74.
Schumacker, R.E. & Lomax, R.G. 2010. Structural Equation Modeling. 3rd ed. New York.
Routledge.
Shaouf, A., Lu, K. & Li, X. 2016. The effect of web advertising visual design on online
purchase intention: An examination across gender. Computers in Human Behavior. 60:
622-634. DOI: https://doi.org/10.1016/j.chb.2016.02.090
Shimp, T. A. 1981. Attitude toward the ad as a mediator of consumer brand choice. Journal
of Advertising. 10:9-15.
South African Petroleum Industry Association [SAPIA]. 2016. KPMG: Economic Impact
Study Report. September 2016. Available at http://www.sapia.org.za/Publications
South African Petroleum Industry Association [SAPIA]. 2018. 2018 Annual Report.
South African Petroleum Industry Association [SAPIA]. 2020. http://www.sapia.org.za/
Sartorius, K., Eitzen, C. & Hart, J. 2007. An examination of the variables influencing the fuel
retail Industry. Acta Commercii 2007. 218-235.
Schreiner, T., Rese, A. & Baier, D. 2019. Multichannel personalization: Identifying consumer
preferences for product recommendations in advertisements across different media

149
channels. Journal of Retailing and Consumer Services. 48:87-99. DOI:
https://doi.org/10.1016/j.jretconser.2019.02.010
Schultz, D. & Schultz, H. 2004. IMC, The Next Generation: Five Steps for Delivering Value
and Measuring Returns Using Marketing Communication. New York. McGraw-Hill.
Sebastian, S.D.R. & Pandowo, M. 2016. The impact of credibility, informative, and hedonic /
pleasure on youth consumers’ attitude towards advertising: Study of mobile
advertising. Jurnal EMBA 1077. 4(1): 1077-1085
Sekaran, U. & Bougie, R. 2016. Research Methods for Business: A Skill Building Approach.
7th ed. John Wiley & Sons Ltd.
Sharma, G. 2017. Pros & Cons of Different Sampling Techniques. International Journal of
Applied Research. 3(7): 749 – 752.
Schiavolin, S., Quintas, R., Ferroli, P., Acerbi, F., Brock, S., Cusin, A., Schiariti, M. Visintini,
S. Broggi, M., Leonardi, M. & Raggi, A. 2015. Quality of life measures in Italian
neurosurgical patients: Validity of the EUROHIS-QOL 8-item index. Quality of Life
Research. 24(2): 441-444. Retrieved September 5, 2020, from
http://www.jstor.org/stable/44849042
Sheth, S. N. 2013. Social media, a new revolution in the field of marketing: The effect of
information sharing, peer pressure, entertainment and emotional connection on the
attitude towards the brand and in turn the purchase intention from the brand. (Master's
thesis). Retrieved from https://scholarcommons.sc.edu/etd/2544
Shimp, T. & Andrews, J. 2017. Advertising, Promotion, and Other Aspects of Integrated
Marketing Communications. 10th ed. Boston. Cengage Learning.
Sim, J. & Wright, C. 2000. Research in Health Care: Concepts, Designs and Methods. United
Kingdom. Stanley Thomes.

150
Singh, R.P. & Banerjee, N. 2018. Exploring the influence of celebrity credibility on brand
attitude, advertisement attitude and purchase intention. Global Business Review. 19(6):
1622-1639.
South Africa’s petrol stations with the best customer ratings. 2020. BusinessTech. 4 July.
Available: https://businesstech.co.za/news/business/411683/south-africas-petrol-
stations-with-the-best-customer-ratings/
Spears, N. & Singh, S.N. 2004. Measuring attitude toward the brand and purchase intentions.
Journal of Current Issues & Research in Advertising. 26(2): 53-66. DOI:
10.1080/10641734.2004.10505164.
Spry, A., Pappu, R. & Cornwell, T.B. 2011. Celebrity endorsement, brand credibility and brand
equity. European Journal of Marketing. 6: 882-909. DOI:
https://doi.org/10.1108/03090561111119958
Sreejesh, S., Mohapatra, S., Anusree, M.R. 2014. Business Research Design: Exploratory,
Descriptive and Causal Designs. In: Business Research Methods. Springer, Cham. 25-
103.
Srivastava, K. & Sharma, N.K. 2016. Consumer perception of brand personality: An empirical
evidence from India. Global Business Review. 17(2): 375–388. DOI:
https://doi.org/10.1177/0972150915619814
Srivasta, J.D., Kumar, N. & Bisht, H. 2019. Blockchain for loyalty rewards program
management. Journal of The Gujarat Research Society. 21(7): 92 -100. Available:
http://gujaratresearchsociety.in/index.php/JGRS/article/view/406/332
Stafford, M.R. & Day, E. 1995. Retail services advertising: The effects of appeal, medium and
service. Journal of Advertising, 24(1): p57+.
Steyn, P., Wallström, Å. & Pitt, L. 2010. Consumer-generated content and source effects in
financial services advertising: An experimental study. Journal of Financial Services
Marketing. 15: 49–61. DOI: https://doi.org/10.1057/fsm.2010.3.

151
Steyn, P., Ewing, M.T., van Heerden, G., Pitt, L.F. & Windisch, L. 2011. From whence it came.
International Journal of Advertising. 30 (1): 133-160. DOI: 10.2501/IJA-30-1-133-
160.
Sweetman, D., Badiee, M., & Creswell, J. W. 2010. Use of the transformative framework in
mixed methods studies. Qualitative Inquiry. 16(6): 441-454. DOI:
https://doi.org/10.1177/1077800410364610
Tabachnick, B.G. & Fidell, L.S. 2001. Using Multivariate Statistics. 4th ed. Allyn and Bacon.
Taherdoost, H. 2016.Validity and reliability of the research instrument; How to test the
validation of a questionnaire/survey in a Research. International Journal of Academic
Research in Management (IJARM). 5(3): 28-36.
Taylor, P.C. & Medina, M.N. 2019. Teaching and learning transformative research. Research
as Transformative Learning for Sustainable Futures (Chapter 3). 39-57. DOI:
https://doi.org/10.1163/9789004393349_003
Tehria, S. 2016. A Study of measuring effectiveness of advertising in Influencing consumer
buying behaviour. International Journal of Applied Research. 2(1): 115-120.
Available: http://www.allresearchjournal.com/archives/2016/vol2issue1/PartB/3-4-
178-880.pdf
Tinsley, H. E. A. & Tinsley, D. J. 1987. Uses of factor analysis in counseling Psychology
Research. Journal of Counseling Psychology. 34(4): 414–424. DOI:
https://doi.org/10.1037/0022-0167.34.4.414
Todorova, G. 2015. Marketing Communication Mix. Trakia Journal of Sciences. 13
Suppl. 1: 368-374.
Trochim, W. 2020. Types of Reliability. Research Methods Knowledge Base, Web Center for
Social Research Methods. http://www.socialresearchmethods.net/kb/reltypes.php.
Retrieved from http://www.socialresearchmethods.net/kb/reltypes.php on April 24,
2020.

152
Tungate, M. 2007. Adland: A Global History of Advertising. 2007. Kogan Page Limited. UK.
Tustin,D.H., Ligthelm, A., Martins, J.H. & Van Wyk, H. 2005. Marketing Research in
Practice. 1st ed. South Africa, University of South Africa: Unisa Press.
Usman, M. 2019. Does constant advertising change consumer attitude? Journal of Business
and Retail Management Research (JBRMR). 13(4): 265 – 275.
Valkenburg, P.M., Peter, J. & Walther, J.B. 2015. Media effects: Theory and research.
Annual Review of Psychology. 67: 315-338. DOI: https://doi.org/10.1146/annurev-
psych-122414-033608
van Teijlingen, E. & Hundley, V. 2001. The importance of pilot studies. Social Research
Update. 35. University of Surrey. United Kingdom. URL:
http://hdl.handle.net/2164/157
Velicer, W.F., Peacock, A.C. & Jackson, D.N. 1982. A comparison of component and factor
patterns: A Monte Carlo approach. Multivariate Behavioral Research. 17(3): 371-388.
DOI: 10.1207/s15327906mbr1703_5.
Veloutsou, C. 2015, Brand evaluation, satisfaction and trust as predictors of brand loyalty: The
mediator-moderator effect of brand relationships. Journal of Consumer Marketing,
32(6): 405-421. DOI: https://doi.org/10.1108/JCM-02-2014-0878
Visentin, M., Pizzi, G. & Pichierri, M. 2019. Fake news, real problems for brands: The
impact of content truthfulness and source credibility on consumers’ behavioral
intentions toward the advertised brands. Journal of Interactive Marketing. 45: 99-112.
Vien, C.V., Yun, C.T. & Fai, P.L. 2017. The effect of celebrity endorsement on brand attitude
and purchase intention. Journal of Global Business and Social Entrepreneurship
(GBSE). 1(4): 141–150. eISSN 24621714.

153
Wahyuni, D. 2012. The research design maze: Understanding paradigms, cases, methods and
methodologies. Journal of Applied Management Accounting Research. 10(1): 69-80.
Available at SSRN: https://ssrn.com/abstract=2103082
Wang, J.S., Cheng, Y.F. & Chu, Y.L. 2012. Effect of celebrity endorsements on consumer
purchase intentions: Advertising effect and advertising appeal as mediators. Wiley
Online Library. 23(5): 357-367.
Wendel, S. & Dellaert, B.G.C. 2005. Situation variation in consumers’ media channel
consideration. Journal of the Academy of Marketing Science. 33(4): 575–584. DOI:
https://doi.org/10.1177/0092070305277447
WhoOwnsWhom. 2019. The Petroleum Industry in South Africa. African Business
Information. South Africa.
Wilson, A. 2018. Marketing research: delivering customer Insights. 4th ed. Macmillan
International Higher Education.
Wu, P.C.S. & Wang, Y. 2011. The influences of electronic word‐of‐mouth message appeal and
message source credibility on brand attitude. Asia Pacific Journal of Marketing and
Logistics. 23(4): 448-472. DOI: https://doi.org/10.1108/13555851111165020
Wu, M., Huang, Y., Li, R., Bortree, D. S., Yang, F., Xiao, A., & Wang, R. 2016. A tale of two
sources in native advertising: Examining the effects of source credibility and priming
on content organizations and media evaluations. American Behavioral Scientist. 12:
1492–1509. DOI: https://doi.org/10.1177/0002764216660139
Yan, R., Ogle. J.P. & Hyllegard, K.H. 2010. The impact of message appeal and message source
on Gen Y consumers' attitudes and purchase intentions toward American Apparel.
Journal of Marketing Communications. 16(4): 203-224. DOI:
10.1080/13527260902863221.

154
Yan, R., Hyllegard, K. & Blaesi, L.F. 2012. Marketing eco-fashion: The influence of brand
name and message explicitness. Journal of Marketing Communications. 18(2): 151-
168. DOI: 10.1080/13527266.2010.490420
Yeshin, T. 2012. Integrated Marketing Communication: The Holistic Approach. England.
Routledge.
Yilmaz, C., Eser Telci, E., Bodur, M. & Eker Iscioglu, T. 2011. Source characteristics and
advertising effectiveness: The roles of message processing motivation and product
category knowledge. International Journal of Advertising. 30(5): 889-914.
Zhang, H., Sun, J., Liu, F. & Knight, J.G. 2014. Be rational or be emotional: Advertising
appeals, service types and consumer responses. European Journal of Marketing.
48(11/12): 2105-2126, https://doi.org/10.1108/EJM-10-2012-0613
Zikmund, W.G., Carr, J.C. & Griffin, M. 2013. Business Research Methods, 9th ed. United
States of America. Cengage Learning

155
ANNEXURE A
ETHICS APPROVAL LETTER
Signature Removed

156
ANNEXURE B
COVER LETTER
Faculty of Commerce,
School of Management Studies,
Section of Marketing
Dear Sir/Madam,
This survey is conducted in fulfilment of a Master of Commerce degree (MCom) in Marketing
for which I am currently enrolled at University of Cape Town. The purpose of the questionnaire
is to determine the impact of advertising controllable elements on consumers’ attitude towards
advertisement, brand and purchase intention in the fuel retailing segment in South Africa. This
research has been approved by the Commerce Faculty Ethics in Research Committee.
Please complete all questions in the enclosed questionnaire. I assure you that the information
you provide will be treated with the strictest confidentiality. The responses will be used for
academic purposes only. The questionnaire will take approximately 15 minutes to complete.
Thank you for your contribution to this study.
Sincerely,
Suhaila Arshad
MCom student at University of Cape Town
Cell number: 076 204 7519
E-mail: [email protected]
Supervisor: Mr. Nkosivile Madinga

157
ANNEXURE C
CONSENT FORM
Faculty of Commerce,
School of Management Studies
Title of the study
‘THE IMPACT OF ADVERTISING CONTROLLABLE ELEMENTS ON CONSUMERS’
ATTITUDE TOWARDS ADVERT, BRAND AND PURCHASE INTENTION’
Research conducted by:
Suhaila Arshad (ARSSUH001)
Email: [email protected]
Dear Participant,
You are invited to take part in an academic research study conducted by Suhaila Arshad,
Masters of Commerce (MCom) student from the School of Management Studies at the
University of Cape Town (UCT).
The purpose of this study is to investigate the impact of advertising controllable elements on
consumers’ attitude towards advertisement, brand and purchase intention in the fuel retailing
segment in South Africa. This research has been approved by the Commerce Faculty Ethics in
Research Committee.
Please note the following:

158
You will not be requested to supply any identifiable information, ensuring anonymity of
your responses. The answers you give will be treated as strictly confidential and secured
accordingly.
Your participation in this study is very important to us. You may, however, choose not to
participate and you may also stop participating at any time without any negative
consequences.
Please answer the questions in the attached questionnaire as completely and honestly as
possible. This should not take more than 15 minutes of your time.
The results of the study will be used for academic purposes only and may be published in
an academic journal. We will provide you with a summary of our findings on request.
Please contact my supervisor, Nkosivile Madinga on [email protected] if you
have any questions or comments regarding the study.
By clicking begin the survey at the end of this page, you are confirming that:
You have read and understand the information provided above.
You give your consent to participate in the study on a voluntary basis.

159
ANNEXURE D
QUESTIONNAIRE
SCREENING QUESTIONS
This section is to ensure the respondents are eligible to participate in the survey.
S1 Before we begin, we would like to make sure you qualify for our study. Please indicate
your age:
Under 18 years old 18 years old and above
S2 Have you been exposed to any fuel brand advertisement in the last 6 months?
Yes No
SECTION A: DEMOGRAPHICAL FACTORS
This section seeks some background information about the participant. It is important to obtain
this information, as this will have a bearing on the results of the survey. For all the questions
below please put a cross (X) over the number indicating your choice.
A1 Age: 18-25 1 26-30 2 31-35 3 36-40 4
41-45 5 Above 45 6 Prefer not to answer 7
A2 Type of
Vehicle
Motorcycles 1 Passenger
Cars
2 Sport
Utility
Vehicles
3 Utility Vehicle,
Trucks, Buses,
Trailers
4
Prefer not
to answer
5 Not
applicable
6
A3 Length of time watching
television / listening to
radio in a day
1-2 hour 1 3-4 hour 2 4-5 hour 3 > 5 hours 4
Prefer not to answer 5
A4 Length of time online or
on social media in a day
1-2 hour 1 3-4 hour 2 4-5 hour 3 > 5 hours 4
Prefer not to answer 5
A5 Fuel brand
advertisement you
have been exposed to
in the last 6 months
BP 1 Caltex 2 Engen 3 Sasol 4 Shell 5
Total 6 Others 7

160
A6 The medium
which carry the
advertisement
TV 1 Radio 2 Print
(newspapers /
magazines)
3 Billboard
and
Banner
4 Internet
(website /
display ads
/ search
engine)
5
Social
Media
6 Mobile
App
7 YouTube 8
A7 Fuel brand you
are currently
using
BP 1 Caltex 2 Engen 3 Sasol 4 Shell 5
Total 6 Others 7 Prefer not
to answer
8
Please indicate the extent to which you agree or disagree with the statements by ticking (✓) on
the corresponding number between 1 (strongly disagree) and 5 (strongly agree)
Str
on
gly
Dis
agre
e
Dis
agre
e
Nei
ther
Dis
agre
e
Nor
Agre
e
Agre
e
Str
on
gly
Agre
e
Section B: Source Credibility
B1 An ad which employs a well-known source (e.g. celebrities,
sports person, F1 drivers, influencers) affect me more.
1 2 3 4 5
B2 An ad which uses an expert source influence me more. 1 2 3 4 5
B3 An ad which uses a trustworthy source affect me more. 1 2 3 4 5
B4 An ad that uses an experienced source influence me more. 1 2 3 4 5
B5 An ad that uses a reliable source influence me more. 1 2 3 4 5
Section C: Source Likeability
C1 An ad which employs a friendly source influence me more. 1 2 3 4 5
C2 An ad which uses a charismatic source affect me more. 1 2 3 4 5
C3 An ad which uses a sincere source influence me more. 1 2 3 4 5
C4 An ad that employs an appealing source affect me more. 1 2 3 4 5
C5 An ad that uses a familiar source influence me more. 1 2 3 4 5
Section D: Rational Message
D1 An ad that emphasises the quality of the fuel influence me
more.
1 2 3 4 5
D2 An ad that call attention to the benefits of the fuel influence
me more.
1 2 3 4 5

161
D3 An ad that highlights other non-fuel products available
influence me more.
1 2 3 4 5
D4 An ad that put emphasis on services offered influence me
more.
1 2 3 4 5
D5 An ad that make a feature of convenient influence me more. 1 2 3 4 5
Section E: Emotional Message
E1 Emotion of love, relationship and sense of belonging in an
ad influence me more.
1 2 3 4 5
E2 Emotion of humour in an ad influence me more. 1 2 3 4 5
E3 Emotion of happiness in an ad influence me more. 1 2 3 4 5
E4 Emotion of excitement in an ad influence me more. 1 2 3 4 5
E5 Emotion of local/national brand in an ad influence me more. 1 2 3 4 5
Section F: Attitude towards the Advert
H1 The ad is good. 1 2 3 4 5
H2 The ad creates enough interest to hold my attention. 1 2 3 4 5
H3 The ad is believable. 1 2 3 4 5
H4 The ad creates positive impression in my mind. 1 2 3 4 5
H5 I can recall the ad and the company easily. 1 2 3 4 5
Section G: Attitude towards the Brand
I1 I’m interested in this brand. 1 2 3 4 5
I2 I think the brand is very good. 1 2 3 4 5
I3 My opinion of the brand is very favourable. 1 2 3 4 5
I4 I trust this brand. 1 2 3 4 5
I5 I would recommend this brand. 1 2 3 4 5
Section H: Purchase Intention
J1 I will probably make a purchase. 1 2 3 4 5
J2 I am likely to make a purchase. 1 2 3 4 5
J3 I am definitely going to make a purchase. 1 2 3 4 5
J4 I would like to have more information. 1 2 3 4 5
J5 My purchase of fuel is neither influenced by the ad nor the
brand.
1 2 3 4 5

162
ANNEXURE E
TRADITIONAL CHANNELS ATTRIBUTES
Medium Benefits Limitations
Television • Mass coverage
• High reach
• High prestige
• Low cost per contact / exposure
• High intrusion value / attention
getting
• Quality creative opportunities
• Favourable image – impact of sight,
sound and motion
• Segmentation through cable
• High cost
• Low recall
• Channel surfing during ads
• DVRs skipping ads
• Short message life
• Rigid/inflexible - cannot
change once aired
• High level of clutter
Radio • High frequency
• Low cost
• Recall promoted
• Narrower target markets
• Ad music can match audience
• High segmentation potential
• Flexibility in making ads
• Modify ads to local conditions
• Intimacy with DJs
• Mobile – listen anywhere
• Creative opportunities with sound
and music
• Audio only
• Short exposure time
• Rigid/inflexible - cannot
change once aired
• Low attention getting
• Difficult to reach national
audiences
• Target duplication with
several stations using the
same format
• Information overload
• Fleeting message
• Clutter
Newspapers • Geographic selectivity
• High flexibility
• High credibility
• Strong audience interest
• Longer copy
• Poor buying procedures
• Short life span
• Poor quality reproduction
• Internet competition
• Aging readership

163
• Cumulative volume discounts
• Coupons and special-response
features
• Clutter
Magazines • High market segmentation
• Targeted audience by magazine
• Direct-response-techniques
• High colour quality
• Long-life
• Read during leisure – longer
attention to ads
• Availability of special features
• Declining readership
• Long lead time
• Little flexibility
• High cost
• Clutter
Direct mail • High selectivity
• Reader controls exposure
• High information content
• Opportunities for repeat exposures
• High cost / contact
• Poor image (junk mail)
• Clutter
Out-of-
home /
Outdoor
• Selected key geographic areas
• Accessible for local ads
• Low cost per impression
• Broad reach
• High frequency and repetition on
major commuter routes
• Large visuals possible hence easily
noticed
• Digital capabilities
• Short exposure time
• Brief messages
• Little segmentation possible
• Poor image
• Local restrictions
• Clutter
Sources: (Belch & Belch, 2017; Clow & Baack, 2016; O’Guinn et al., 2006)

164
ANNEXURE F
ONLINE CHANNELS ATTRIBUTES
Channel Advantages Disadvantages
Internet • Target market selectivity
• Tracking
• Deliverability and flexibility
• Interactivity
• Cost
• Integration
• Available 24-hours a day
• Customer can ignore ads
• Ad fatigue – too many options
• Technical issue e.g. viewing
problem
• Security and privacy issue
• Maintenance cost due to
constantly evolving environment
• Worldwide competition through
globalisation
Mobile • Highly personal
• Always on mode
• Allow immediate viewing
• High segmentation potential
• Have built-in payment system
• Available at the point of inspiration
• Myriad screen sizes, operating
systems and browsers that may
impact ads viewing
• Limited inputting of information
• Security and privacy issues
Social
media
• High engagement with online
community
• Potential to go viral
• Interactivity
• Facilitates two-way conversation /
ability to garner feedback
• High segmentation potential
• Tracking
• Low cost
• Possibility of bad messages to
spread as quickly as good ones
• Require constant involvement
with the audience
• Security
Sources: (Clow & Baack, 2016)

165
ANNEXURE G
PETROLEUM INDUSTRY VALUE CHAIN
Source: (DoE, 2019)

166
ANNEXURE H
SOURCES OF CRUDE OIL FOR SAPIA MEMBERS: 2008 TO 2018
Country of Origin
2008 2009 2010 2011 2012 2013 2014 2015 2016 2017 2018
Angola 3 598 3 817 3 409 1 948 3 356 2 444 2 614 3 348 4 000 3 420 2 352
Cote d’lvoire 0 0 88 0 0 0 0 0 0 0 90
Ghana 0 0 0 0 259 746 756 0 0 125 1 149
Nigeria 2 517 3 963 3 594 3 755 4 310 4 336 6 658 7 291 6 131 4 083 6 745
Qatar 0 0 0 266 242 0 202 832 682 0 133
Saudi Arabia 6 265 6 968 4 584 4 793 8 437 9 723 8 120 4 895 7 939 8 170 8 780
Togo 0 0 0 0 0 0 0 0 0 297 157
United Arab Emirates 855 553 1 018 598 538 307 924 1 337 673 107 794
Total 22 090 21 067 25 040 19 254 17 834 18 940 18 658 21 279 19 233 20 666 16 770
Sources: (SAPIA, 2018

167
ANNEXURE I
SOUTH AFRICA REFINERY OWNERSHIP AND CRUDE THROUGHPUT
Name Crude throughput Ownership Product
CHEVREF 100 000 bbl/d Chevron South Africa
Crude oil refiners
ENREF 135 000 bbl/d Engen Petroleum
NATREF 108 000 bbl/d Sasol (64%) /
Total South Africa (36%)
SAPREF 180 000 bbl/d Shell South Africa (50%) /
BP Southern Africa (50%)
Sasol
Secunda
150 000 bbl/d Sasol Coal-to-Liquid (CTL)
Gas-to-Liquid (GTL)
PetroSA 45 000 bbl/d PetroSA Natural Gas to liquid
fuels
Source: (SAPIA, 2018)
MAP SHOWING LOCATION OF REFINERIES IN SOUTH AFRICA
Source: (SAPIA, 2018)

168
ANNEXURE J
CONSUMPTION OF PETROLEUM PRODUCTS IN SOUTH AFRICA
Millions of litres
Year Petrol Diesel Paraffin Jet Fuel Fuel Oil LPG
2007 11 558 9 755 696 2 402 465 636
2008 11069 9 762 532 2 376 555 613
2009* 11 321 9 437 551 2 349 724 554
2010* 11 455 10 170 545 2 308 468 612
2011* 11 963 11 225 581 2 434 477 717
2012* 11 714 11 262 470 2 367 568 656
2013* 11 153 11 890 530 2 223 523 485
2014* 11 344 13 169 558 2 197 487 398
2015* 12 072 14 178 573 2 441 591 588
2016* 10 160 10 846 558 2 121 562 557
2017** 11 174 12 147 648 2 713 523 551
2018** 11 142 12 539 702 2 346 552 504
Sources: (SAPIA, 2018)
*Paraffin includes power paraffin and illuminating paraffin,
**2018 data sourced on 26 April 20

169
ANNEXURE K
SAPIA MEMBERSHIP AS AT 31 DECEMBER 2018
Integrated Members Non-integrated Members
Fuel Wholesalers LPG Wholesalers
Astron Energy (Pty) Ltd Afric Oil (Pty) Ltd Afrox Ltd
BP Southern Africa (Pty)
Ltd
Elegant Fuel (Pty) Ltd Avedia Energy(Pty) Ltd
Engen Petroleum Ltd Gulfstream Energy (Pty) Ltd Camel Fuels (Pty) Ltd
PetroSA Ltd Imbizo Petroleum Traders
(Pty) Ltd
Easigas (Pty) Ltd
Sasol Oil (Pty) Ltd FFS Refiners (Pty) Ltd Indigas (Pty) Ltd
Shell Downstream South
Africa (Pty) Ltd
Makwande Energy Trading
(Pty) Ltd
Totalgaz Southern Africa
(Pty) Ltd
Total South Africa (Pty) Ltd MBT Petroleum (Pty) Ltd Wasaa Gasses (Pty) Ltd
Puma Energy (Pty) Ltd
Royale Energy Ltd
SA Bunkering & Trading
(Pty) Ltd
Source: (SAPIA, 2018)

170
ANNEXURE L
MAJOR FUEL COMPANIES NETWORK AND OFFERINGS
Sources: (Company Websites and Publications)