University of Cape Town - CORE
96
Division of Biomedical Engineering Department of Human Biology Faculty of Health Sciences University of Cape Town Assessing eHealth knowledge diffusion within the public health sector in Kenya using social network analysis in partial fulfilment of the requirements for the degree: MPhil in Health Innovation Dr Ryan Nyotu Gitau (GTXRYA001) Supervised by Prof. Tania Douglas Date: November 2019 University of Cape Town brought to you by CORE View metadata, citation and similar papers at core.ac.uk provided by Cape Town University OpenUCT
-
Upload
khangminh22 -
Category
Documents
-
view
0 -
download
0
Transcript of University of Cape Town - CORE

Division of Biomedical Engineering
Department of Human Biology
Faculty of Health Sciences
University of Cape Town
Assessing eHealth knowledge diffusion within the public health
sector in Kenya using social network analysis
in partial fulfilment of the requirements for the degree: MPhil in Health Innovation
Dr Ryan Nyotu Gitau (GTXRYA001)
Supervised by Prof. Tania Douglas
Date: November 2019
Univers
ity of
Cap
e Tow
n
brought to you by COREView metadata, citation and similar papers at core.ac.uk
provided by Cape Town University OpenUCT

The copyright of this thesis vests in the author. No quotation from it or information derived from it is to be published without full acknowledgement of the source. The thesis is to be used for private study or non-commercial research purposes only.
Published by the University of Cape Town (UCT) in terms of the non-exclusive license granted to UCT by the author.
Univers
ity of
Cap
e Tow
n

II | P a g e
Declaration
I, Dr Ryan Nyotu Gitau, hereby declare that the work on which this dissertation/thesis is
based is my original work (except where acknowledgements indicate otherwise) and that
neither the whole work nor any part of it has been, is being, or is to be submitted for
another degree in this or any other university.
I empower the university to reproduce for the purpose of research either the whole or any
portion of the contents in any manner whatsoever.
Name: Signature
Dr Ryan Nyotu Gitau
15th July 2020.

III | P a g e
Abstract
High disease morbidity coupled with limited healthcare personnel places the health sector in
Kenya under strain, leaving parts of the population with limited access to health services.
Electronic health (eHealth), the utilisation of information and communication technologies in
healthcare, is an innovation with the potential to improve access to health services. Several
examples exist of eHealth projects being undertaken in Kenya. However, eHealth solutions
have been poorly adopted in the public healthcare sector, which has partly been blamed on
lack of knowledge amongst healthcare providers and patients.
The aim of this study was to examine how knowledge is exchanged between the stakeholders
currently active within the eHealth implementation space in the Kenyan public sector. The
results of the study would aid in identifying communication breakdowns and ways of
increasing information flow with regard to eHealth, and ultimately would aid strategies to
help improve the uptake of eHealth within the public sector.
A mixed methods study was undertaken that combined quantitative social network analysis
and qualitative analysis of semi-structured interviews conducted with stakeholders involved
in implementation of eHealth projects in Kenya. Publications on implementation of eHealth
projects in Kenya from 2001 to 2018 were used to obtain data on relevant organisations.
Social network analysis was used to identify prominent actors. Individuals working within such
organisations were invited to participate in semi-structured interviews. Further social
network analysis was applied to data gathered through the interviews.
Foreign universities and foreign not-for-profit organisations were the most commonly
identified organisations in the networks generated. The tacit nature of knowledge within
networks, low research capacity and output, information guarding, geographical distance
between collaborating organisations, and low cohesion were some of the factors found to
inhibit knowledge diffusion within the eHealth implementation space in Kenya. The search
for capacity and funding were found to contribute to network structure. eHealth knowledge
management strategies should be given attention, for enhanced exchange of knowledge
within the public health sector in Kenya.

IV | P a g e
Acknowledgments
There are many people without whom this dissertation would not have seen the light of day.
I would first like to thank my supervisor Professor Tania Douglas for the patience, support,
belief and guidance you have accorded me throughout this research project. I am particularly
grateful to you for introducing me to the science of knowledge and networks. Working under
your mentorship has provided me with legitimation of the belief that it is possible for
innovations from Africa to scale across the continent and the world at large.
I would then like to thank the Mandela Rhodes Foundation for giving me the opportunity to
study and conduct research at the University of Cape Town, for providing a community of like-
minded young Africans with whom we can dream and build towards a better tomorrow.
Thank you to the Kenyan eHealth implementers who agreed to participate in this study and
all the support you provided. Your time is greatly appreciated.
I would also like to thank the Health Innovation group for providing a safe space for growth
and enriching discourse. May this network keep growing from one level to the next!
To my brother Letian, thank you for receiving me as you did, creating a home away from
home. To Mum, Dad, Njeri, Seine and Waweru, your constant prayers and words of
encouragement provide me with the energy and courage to keep on moving.
To Ngakuya, thank you for at 100 years you are still setting an example of how to live fearlessly
and with integrity. Thank you Cucu Maria Nyotu for the sacrifices you have made so that I
may have this opportunity.
Lastly, to my wife Dr Njeri Ndung’u. You are the best team-mate I could ever have hoped for.
I still remember that it is you who first pointed out that UCT has a course in Health Innovation.
Thank you for the sacrifice you have taken for me to do this work. Thank you for your belief
in me and for your patience. You have shown me love through deeds and I will not forget that
this dissertation would not have been possible without you.
V | P a g e
Table of contents
Declaration ......................................................................................................... II
Abstract ............................................................................................................. III
Acknowledgments............................................................................................ IV
Table of contents .............................................................................................. V
List of figures and tables………………………………………………………………………………VII
List of acronyms………………………………………………………………………………………. VIII
1. Introduction ................................................................................................ 1
1.1. Aim and Objectives .................................................................................. 3
1.2. Project scope ............................................................................................ 4
1.3. Overview of dissertation .......................................................................... 4
2. Literature review ......................................................................................... 6
2.1. eHealth in Kenya ...................................................................................... 6
2.1.1. Implementation and evaluation of eHealth projects ........................... 7
2.2. Knowledge diffusion ................................................................................. 8
2.3. Social Network Analysis ........................................................................... 9
2.4. Summary ................................................................................................ 10
3. Methodology ............................................................................................. 12
3.1. Study design ........................................................................................... 12
3.2. Ethics ...................................................................................................... 13
3.3. Social network analysis .......................................................................... 13
3.3.1. Stakeholders ........................................................................................ 14
3.3.2. Networks ............................................................................................. 15
3.4. Semi structured interviews .................................................................... 17
3.4.1. Stakeholders ........................................................................................ 20
3.4.2. Thematic analysis ................................................................................ 20

VI | P a g e
4. Results ....................................................................................................... 22
4.1. Publication networks.............................................................................. 22
4.1.1. MHealth publication network ............................................................. 24
4.1.2. Health information systems publication network .............................. 28
4.1.3. Telemedicine publication network ..................................................... 31
4.1.4. Publication network for other forms of eHealth ................................ 33
4.1.5. Summary of results from publication network ................................... 36
4.2. Analysis of data obtained from interviews ............................................ 36
4.2.1. Interview-based eHealth network ...................................................... 37
4.3. Thematic analysis of interviews ............................................................. 45
4.3.1. Participant knowledge ........................................................................ 46
4.3.1.1. Knowledge translation ..................................................................... 48
4.3.2. Nature of the network ........................................................................ 50
4.3.2.1. Capacity ............................................................................................ 50
4.3.2.2. Funding ............................................................................................. 52
4.3.3. Challenges and Opportunities ............................................................. 53
4.3.3.1. Challenges ........................................................................................ 53
4.3.3.2. Opportunities ................................................................................... 55
4.3.4. Summary of interview results ............................................................. 57
5. Discussion and Conclusion ........................................................................ 59
5.1. Study limitations and suggestions for future work ................................ 64
5.2. Conclusion .............................................................................................. 64
References ....................................................................................................... 66
Appendix 1: Abbreviations ............................................................................... 74

VII | P a g e
List of tables and figures
Figure 1: Study design flowchart ............................................................................................. 13
Figure 2: An illustration of how different nodes were presented after analysis .................... 17
Figure 3: Visualisation of the mHealth publication network. .................................................. 25
Figure 4: Visualisation of the health information systems ...................................................... 29
Figure 5: Visualisation of the telemedicine publication network ............................................ 32
Figure 6: Visualisation of the publication network ................................................................. 34
Figure 7: Visualisation of the interview-based network.. ........................................................ 39
Figure 8: Word cloud representation of different areas of specialization for the interview
participants .............................................................................................................................. 45
Table 1: Organisations sorted according to strategic areas of technology implementation
and organisation type……………………………………………………………………………………………………… 23
Table 2: Distribution of organisations according to strategic area of implementation and
region of registration. .............................................................................................................. 23
Table 3: Top 20 mHealth organisations ranked according to degree centrality . ................... 26
Table 4: Top 20 MHealth organisations ranked according to betweenness centrality ........... 26
Table 5: Top 20 MHealth organisations ranked according to closeness centrality. ................ 27
Table 6: Top 20 health information systems organisations ranked according to degree
centrality .................................................................................................................................. 29
Table 7: Top 20 health information systems organisations ranked according to closeness
centrality .................................................................................................................................. 30
Table 8: Top 20 health information systems organisations ranked according to betweenness
centrality. ................................................................................................................................. 31
Table 9: Top 15 telemedicine organisations ranked according to degree and closeness
centrality. ................................................................................................................................. 33
Table 10: Top 20 organisations ranked according to degree centrality. ................................. 35
Table 11: Top 20 organisations ranked according to closeness centrality .............................. 35
Table 12: Organisations by type in the interview-based networks ......................................... 37
Table 13: Distribution of organisations sorted by geographical region of origin in the
network as identified from the analysis of the semi-structured interviews. .......................... 38
Table 14: Top 20 eHealth organisations based on interviews.. ............................................... 40
Table 15: Top 20 eHealth organisations based on interviews.. ............................................... 42
Table 16: Top 20 eHealth organisations in the interview-based network.. ............................ 44
Table 17: Table showing areas of interest, themes and subthemes identified from the
thematic analaysis of the semi-structured interviews. ........................................................... 46

VIII | P a g e
List of acronyms
eHealth Electronic health
GOK Government of Kenya
HIS Health information systems
ICT Information and Communication Technologies
KDHS Kenya Demographic and Health Survey
KEHIA Kenya Health Informatics Association
KEMRI Kenya Medical Research Institute
KNBS Kenya National Bureau of Statistics
KNH Kenyatta National Hospital
mHealth Mobile health
MOH Ministry of Health
NGO Non-Governmental Organisation
SNA Social Network analysis
UON University of Nairobi
WHO WORLD Health Organisation

1 | P a g e
1. Introduction
The population of Kenya is 46.7 million people and is poised to grow at a rate of one million
people per year (KDHS, 2014; KNBS, 2019). This rapid population growth is a cause of strain
on the health sector, which has to contend with high maternal mortality of 362 per 100,000
live births and a high under-five mortality of 39 per 1000 live births (KDHS, 2014). There is
also a concomitant increase in the prevalence of preventable, non-communicable diseases
even among the lower social economic groups, with stroke and ischemic heart disease being
among the top 10 causes of death. It is estimated that non-communicable diseases now
account for almost 27% of deaths and 50 % of total hospital admissions in Kenya (KDHS, 2014;
KNBS, 2016). The ratio of practicing health workers to population is also low. As of 2015, the
ratio of practicing doctors, dentists and nurses was 1.5 doctors, 0.2 dentists and 8.3 nurses
per 10,000 population, which is low when compared against the World Health Organisation
(WHO) minimum recommendations of 36 doctors and 25 nurses per 10,000 population (GOK,
2015a; WHO, 2015; WHO, 2016b).
The healthcare sector in Kenya has been undergoing many changes since it was decentralised,
in August 2013, creating 47 autonomously running healthcare administrative systems called
counties (GOK, 2010). This was done primarily to bring essential services closer to the
population. Decentralisation presented an administrative and logistical challenge due to what
was perceived as a shortage of competent healthcare managers to work within the new
administrative units (Whimp, 2012). It had been previously noted that novel and innovative
approaches would be critically needed in order to prevent, or reduce the time needed to
recover from, the anticipated disruption that would arise from this gap in management
(Whimp, 2012).
eHealth is such an innovation. eHealth is broadly defined as the utilisation of information and
communication technologies in healthcare. Relevant technologies include telemedicine,
mobile devices (mHealth), and health information systems, among others (WHO, 2016a).
(WHO, 2006). eHealth is capable of providing support to healthcare systems, health
practitioners and patients by acting as a tool to bridge the ever-widening health worker to
patient gap (Betjeman, Soghoian & Foran, 2013). There are already examples of it being used

2 | P a g e
to increase adherence to drugs, to aid health workers’ communication with patients, to
promote health education initiatives, as well as to aid in the management of disaster or
emergency situations, especially in developing countries (Betjeman, Soghoian & Foran, 2013;
Blaya, Fraser & Holt, 2010; Owolabi et al., 2018).
The uptake of eHealth in developing countries has been slow (Holmner et al., 2012). Poor
support of eHealth activities by government, due to reasons like competition for resources
with other existing projects and a lack of evidence of cost effectiveness, has been mentioned
as a cause of such poor uptake (Betjeman, Soghoian & Foran, 2013; GOK, 2017b; Holmner et
al., 2012). A lack of appropriate eHealth policies has been highlighted as a significant
challenge, with some researchers arguing that governments that develop such policies are
more likely to adopt eHealth technologies (Holmner et al., 2012 citing; Lang & Mertes, 2011).
Many developing countries have only recently started to formulate their national eHealth
policies. Without localised and contextual information, they risk adopting policies from
developed countries in a ‘one size fits all’ approach that would be detrimental to the
development of functional and context-appropriate eHealth policies (Mars & Scott, 2010).
The Kenya National eHealth Policy (2016-2030), which was launched in 2017, highlighted poor
infrastructure, low literacy levels, inadequate technical expertise, unreliable power supply,
limited funding and lack of government involvement in eHealth projects as some of the key
challenges the country needs to address in order to better capitalise on the benefits of
eHealth (GOK, 2017b).
The WHO (2006) believes that if it is to achieve its strategic focus of using eHealth to
strengthen health systems among its member states, there is a need to investigate, document
and analyse the impact of eHealth. There is a paucity of information on assessment of eHealth
technologies in developing countries like Kenya. Njoroge et al. (2017), in a systematic review
assessing different eHealth initiatives in the country, found that not only were there few such
projects that were successfully scaled into the public sector, there was also a geographically
uneven distribution of such initiatives with little to no evaluation of most projects. Njoroge et
al. found that eHealth projects have been marked by fragmentation and duplication, which
points to a divergence of thought, values, and approaches amongst the stakeholders. This is
problematic as proper implementation of eHealth will require a collaborative partnering

3 | P a g e
among stakeholders who possess different resources, knowledge and contextual experiences
(Nielsen & Mengiste, 2014).
Adoption of a technology requires a transfer of knowledge between different stakeholders
(Klarl, 2009b). Knowledge can take several forms within a network. These include tacit
(embodied) knowledge, which is described as a form of knowledge gained by learning or
experience; in contrast, explicit (codified) knowledge is readily accessible as it exists away
from the generator of the knowledge, for example in print form (Reagans & McEvily, 2003;
Su, Yang & Zhang, 2017). Strong networks are required in order to facilitate knowledge
transfer (Hansen, 1999). Social network analysis is a tool that can be used to map out the
relationships between stakeholders in a network. It is described as a highly graphical and
structured way of conducting research that focuses on the relationships between all the
players in a sector in order to more appropriately understand how information flows within
the network (Luke & Harris, 2007; Serrat, 2017). It has been used in public health to describe
social support and capital within different health networks, to understand organisational
networks and to help visualise the transmission of disease and information (Luke & Harris,
2007; Valente & Pitts, 2017). Social network analysis tools can generate information on the
state of the interactions and therefore knowledge flows among stakeholders and delineate
their roles in the innovation adoption network as well as their capacity to receive and utilise
such knowledge. Such information on the stakeholders involved in eHealth implementation
in Kenya would be beneficial to the health system. At this early point of changes within the
health sector in Kenya, such insights will aid in identifying communication breakdowns and
ways of increasing information flow with regard to eHealth, and ultimately will aid strategies
to help improve the uptake of eHealth within the public sector.
1.1. Aim and Objectives
The aim of this study was to examine how knowledge is exchanged between the stakeholders
currently active within the eHealth implementation space in the Kenyan public sector.
The specific objectives to be carried out in the study were:
• To identify and characterise the stakeholders involved in the implementation of
eHealth in the public sector.

4 | P a g e
• To show the structure of relationships between the stakeholders of the currently
implemented eHealth projects within the public sector in Kenya.
• To examine the flow of eHealth knowledge in Kenya by identifying the barriers
between stakeholders and the potential for improved knowledge flow.
1.2. Project scope
Stakeholders in this study are defined as any individuals or organisations involved in the
design, distribution, implementation, utilisation, evaluation or regulation (Ballejos &
Montagna, 2008) of eHealth solutions in Kenya. Different stakeholders are described based
on the role they hold during development and implementation of eHealth projects. The
definitions provided by Ballejos & Montagna for different categories of stakeholders are used.
End user is a term used to describe those stakeholders who are beneficiaries, i.e. those who
gain from the implementation of a project, be it through functional, financial or political
rewards, or operators, i.e. those who interact and use the system and its outputs, regardless
of whether or not they gain from such an interaction. Implementers is a term used to describe
the decision makers (those in charge of eHealth projects), experts and consultants (those
whose technical knowledge is sought during the implementation phase) and developers
(those who play a direct role in the development of the systems).
This study combined quantitative social network analysis techniques with qualitative research
methods. The social network analysis allowed for the structure of the relationships to be
drawn out and described using network metrics and diagrams. This allowed for the
identification and characterisation of the stakeholders active within the sector. Thematic
analysis of the semi-structured interviews provided insights on the knowledge present within
the sector and the context within which it flows.
1.3. Overview of dissertation
Chapter 2 reviews the literature relevant to the study. Chapter 3 describes the methodology,
namely extracting network data on eHealth project implementation in Kenya and also
conducting and analysing semi-structured interviews with eHealth implementers. Chapter 4

5 | P a g e
presents the results of the study. Chapter 5 provides a discussion of the results and makes
suggestions for the direction future work can take.

6 | P a g e
2. Literature review
This literature review focusses on eHealth as a tool that is already being used across the
African continent. The chapter also considers social network analysis as a tool that can be
used to provide insights on stakeholder interactions in health systems.
2.1. eHealth in Kenya
The WHO defines eHealth as the utilisation of information and communication technologies
in healthcare. This refers to technologies like telemedicine, mHealth applications and health
information systems, among others (WHO, 2006). Increasing healthcare costs and the
widening doctor-to-patient ratio in many countries has caused a shift towards increased
implementation of digital health solutions (Ragaban, 2016). This is evidenced by the fact that
as of 2012, eHealth has had an almost pan-African presence with South Sudan being the only
country that did not have eHealth projects (Scott, Mars & Hebert, 2012). Scott et al. (2012)
showed widespread utilisation of eHealth in different areas of specialty like radiology,
cardiology, dermatology, ophthalmology. Across the African continent, different eHealth
technologies like mHealth, defined as the use of mobile devices for healthcare (WHO, 2011),
have been used to improve medical adherence, health worker communication, health
education initiatives as well as in cases of disaster and emergency management (Betjeman,
Soghoian & Foran, 2013).
The first e-health project in Kenya was launched in 2001 and since then many advances have
taken place with 69 projects having been launched in Kenya as identified by Njoroge et al.
(2017). The government of Kenya, having identified the value and potential of eHealth to the
Kenyan healthcare sector, launched the Kenya National eHealth Policy (2016-2030) in 2017.
This policy sought to streamline and guide the implementation of different eHealth projects
around the country by starting the process of creating a framework to ensure provision of
networked care in a professional and equitable manner (GOK, 2017b). This is important as a
market analysis of the Kenyan healthcare sector found that access to healthcare services and
products was not equal (Davis et al., 2019). This inequality has also been identified in the
implementation of eHealth projects in the country with Njoroge et al. (2017). reporting that
little effort had been put into reaching the marginalised regions of the country, with 24 of 69

7 | P a g e
projects reviewed in the study being implemented in Nairobi while some counties did not
even have one eHealth project. Other studies have also found limited application of eHealth
in the western rural part of the country with a lack of basic tools, like computers and reliable
internet connections among others, needed for appropriate eHealth technology (Ouma &
Herselman, 2008). Despite such infrastructural impediments, good potential has been
suggested for the uptake of mHealth, even in marginalised zones, with Kazi et al. (2017)
reporting that over 82% of respondents seeking antenatal care and immunizations in clinics
in rural and marginalised parts of Kenya had access to a mobile phone and 92% of them saying
they would like to receive text messages with health content weekly.
2.1.1. Implementation and evaluation of eHealth projects
Several eHealth projects have been implemented in Kenya but knowledge on their success,
challenges, benefits to patients and cost effectiveness is limited. The lack of such data has
been highlighted as one of the top four reasons standing in the way of eHealth project
implementation (Kay, Santos & Takane, 2011).
A systematic review conducted to describe the eHealth initiatives implemented from 2001-
2015 in Kenya showed that evaluation of projects was as an area that was found to be wanting
(Njoroge et al., 2017). Of the 69 projects documented, only 28 had been evaluated after
implementation, with only two of the projects scaled nationally being evaluated (ibid).
Evaluation techniques are required that are not only able to focus on the technical and cost
aspects of eHealth, but also on the social and cultural factors affecting proper
implementation. Of the 28 projects identified by Njoroge et al. (2017), eight projects were
assessed using randomised control trials that focussed mostly on whether the eHealth
modality implemented had any positive effect, with even fewer cases providing a cost
effectiveness brief. Other methods used to evaluate the projects identified were non-
randomised intervention studies, cross sectional studies, cohort studies, feasibility and
acceptability studies. (Njoroge et al., 2017).
Understanding the implementation challenges faced in eHealth projects will assist in the
development of evaluation methods that are standardised to ensure high quality is
maintained across the implemented projects. In the context of eHealth, this means that there

8 | P a g e
is a need for documenting what infrastructure is present versus what is needed, assessing the
awareness levels of both the public and the healthcare practitioners, and understanding
stakeholder engagement, while highlighting the challenges and benefits of eHealth to the end
user (Odhiambo, 2015). The exchange of knowledge between stakeholders is a goal of
stakeholder engagement.
2.2. Knowledge diffusion
Generating and acquiring knowledge has been described as a critical requirement for
innovation and growth to occur within a country (Cowan & Jonard, 2004; Singh, 2005).
Knowledge diffusion refers to how knowledge, in whichever form, is able to spread within a
network (Klarl, 2009a). For there to be increased adoption of a technology, the information
and knowledge present and available to implementing stakeholders such as those in
academia (knowledge generators) and within innovation circles (early adopters), needs to be
able to be transferred to the end user stakeholders such as those involved in its distribution
and utilisation (Klarl, 2009b). Strong networks are required to facilitate the transfer of this
type of information, and relationships between stakeholders have been identified as a factor
that can affect how knowledge flows between them (Hansen, 1999). The type of knowledge
also has a bearing on how efficiently knowledge will flow (Su, Yang & Zhang, 2017). It is more
likely for actors who are familiar with each other to pass knowledge to each other by
leveraging both the strength of their relationship and the cohesion of their network (Reagans
& McEvily, 2003). Complex knowledge requires more resources (like time and money) to
transfer and therefore one would not be willing to transfer the knowledge without adequate
motivation like incentives or friendships (Su, Yang & Zhang, 2017).
Effective implementation of eHealth will require a collaborative partnering among
stakeholders who possess different resources, knowledge and contextual experiences
(Nielsen & Mengiste, 2014), and thus will require effective flow of knowledge between these
stakeholders. An assessment of knowledge diffusion would be aided through understanding
of the structure of the network and relationships between stakeholders.

9 | P a g e
2.3. Social Network Analysis
Social network analysis (SNA) is a method that provides a means to understand the dynamics
and inner workings of a system by bringing to the fore the interactions between individual
stakeholders within a network (Ragaban, 2016). By utilising social network analysis,
researchers are able to graphically map out both formal and informal relationships, thereby
providing insights into what parts of the system promote and inhibit the flow of knowledge
by showing how the different stakeholders interact (Wasserman & Faust, 1994).
Early SNA work within the health sector was able to create visual representations of how ties
like sharing needles among intravenous drug users contribute to the transmission of
contagious diseases (Eames & Keeling, 2002 as referenced by; Luke & Harris, 2007). Studying
the structure of social networks also allows for the visualisation of how information on a new
innovation spreads within a network; proximity to sources of information has been found to
have a positive effect on how fast public health initiatives and innovation like family planning
are taken up and used (Luke & Harris, 2007).
SNA has been used in public health to describe social support and capital within different
health networks. Network analysis techniques are able to show how individuals in a network
relate with each other to draw resources from their social circles and how this has an effect
on health behaviours like smoking, mental health, morbidity and even mortality for different
groups of people (Luke & Harris, 2007). SNA has also been used to show that past interactions
between public health organisations within a network had an influence on future
collaborations and funding between organisations (ibid). Recent work on SNA has seen it
being used to describe how international aid organisations come together to work and
achieve their objective of improving child health outcomes and how their position,
relationships and activities within the network affect their ability to receive and transmit
knowledge and material resources (Han, Koenig-Archibugi & Opsahl, 2018).
SNA methods have utility in assessing how organisations interact with each other to produce
their desired outcomes. An African context example of this is the utilisation of SNA to explore
and describe the relationships, and the outcomes of such relationships, within the medical
device development landscape in South Africa (Chimhundu, de Jager & Douglas, 2015; de

10 | P a g e
Jager, Chimhundu & Douglas, 2017). These studies relied on co-authorship of publications to
indicate collaboration between the stakeholders. By assessing collaboration, de Jager,
Chimhundu & Douglas (2017) were not only able to identify who the main stakeholders were
in medical device development, but were also able to show their importance in the
information exchange process and how this evolved over a period of time. Despite the many
advantages of using co-authorship as a proxy for collaboration there are several limitations
like the emphasis on the academic sector (i.e. basic or scientific knowledge production) and
neglect of collaborations that are not represented in publications like applied or technological
knowledge production (de Jager, Chimhundu & Douglas, 2017).
SNA has also been utilised to assess the “connectedness” of connected health, which is a term
used to refer to “a new socio-technical model for healthcare management which exploits the
use of information technology (IT) for clinical or wellness decision-making tasks” (Carroll &
Richardson, 2017). These authors conducted an exploratory literature review which aimed to
show the suitability of SNA to model a healthcare network within which such technology will
be used and concluded that SNA is suited to describing the dynamic nature of healthcare
service delivery as opposed to other methods like process improvement models which usually
focus on individual static parts of the system.
In assessing the development of eHealth in Lithuania from the stakeholder point of view, SNA
was used to investigate whether the legitimate interests of the stakeholders (the policy
makers, the implementers and users of eHealth) were well represented (Jankauskienė, 2014).
The researchers sought to assess the role of the stakeholders, and to describe the main long
term and short-term obstacles for innovation and sustainability, in the delivery of the
healthcare services. The analysis was also used to highlight the nature of cooperation while
describing the dynamics that govern these relationships.
2.4. Summary
Several challenges like a lack of evaluation of the projects, fewer projects being implemented
in marginalised areas and fragmentation when it comes to implementation have been
outlined as limiting the success of eHealth (Njoroge et al., 2017). These challenges have
however not been analysed in great depth. Poor eHealth uptake has largely been blamed on

11 | P a g e
lack of knowledge on the value of eHealth by both the government and end user (Kay, Santos
& Takane, 2011). As effective eHealth implementation would require coordinated efforts
across all stakeholders, assessing how knowledge flows between them may provide new
insights as to how to leverage the current network to increase efficient implementation of
eHealth projects. Social network analysis provides a tool for the assessment of knowledge
flow across stakeholder networks.

12 | P a g e
3. Methodology
This study describes the stakeholders (actors) playing a role in eHealth in the public sector in
Kenya and the knowledge flow among them. The actors and their activities were identified
and the interactions that influence knowledge diffusion within the networks were examined.
The objectives were achieved through social network analysis, using data collected from
available published literature and from interviews with stakeholders.
3.1. Study design
A mixed methods study was conducted that combined quantitative and qualitative research
methods. Quantitative social network analysis (SNA) methods were used to describe the
nature of the relationships between the actors (Schipper & Spekkink, 2015). The actors were
organisations active in eHealth in Kenya. Semi-structured interviews were conducted with
members of relevant organisations and transcribed and verified. Thematic analysis of the
semi-structured interviews was then used as it is useful for the identification, coding and
visualisation of important points from the point of view of the actors in a network of interest
(Bazeley & Jackson, 2013; Joffe, 2012). These qualitative data were used to describe the
context and content of the knowledge flowing between the actors.
A whole network research design was used to extract detailed information about the
structure of the eHealth knowledge network across the country. This is an approach in which
all the identified organisations and their relationships with regard to knowledge diffusion are
examined (Borgatti, Everett & Johnson, 2018).
Figure 1 shows the study design. It shows that two networks, i.e. publication and interview-
based networks, were drawn. Publication-only social network analysis focusses more on
academic stakeholders rather than industry stakeholders because the former are the
organisations that publish more often (Chimhundu, de Jager & Douglas, 2015). Thus
interviews with stakeholders identified in the publication network were used to identity
further relevant stakeholders, through snowball sampling, which is advantageous in
identifying hard to reach stakeholders within a network (Atkinson & Flint, 2001).. A second
network was drawn, showing the stakeholders thus identified.

13 | P a g e
3.2. Ethics
Ethics approval was sought and obtained from the Faculty of Health Sciences at the University
of Cape Town (reference number HREC REF 760/2018) and the Ethics and Scientific Research
Committee from AMREF Health Africa in Kenya (reference number ESRC P604/2019).
Approval was also obtained from the National Council for Science Technology and Innovation
in Kenya, which is the government body that approves research to be done in the public sector
(reference number NACOSTI/P/19/68013/30012).
3.3. Social network analysis
Publications on eHealth in Kenya were used to identify projects and actors for the SNA. The
systematic review conducted by Njoroge et al. (2017), which produced a list of publications
on eHealth projects implemented in Kenya from 2001 to 2015, was used as a starting point
for the SNA. The criteria used in the review, were used to identify publications available after
the period studied by Njoroge et al., i.e. from 2015 to March 31st, 2018. A search was
conducted in PubMed, Web of Science and Google Scholar repositories. The same search
terms used in the systematic review were used as shown below:
Figure 1: Study design flowchart

14 | P a g e
“Kenya AND eHealth OR mHealth OR Health information systems OR telemedicine OR
telemed OR text messaging OR SMS OR e-learning OR electronic health record OR electronic
health”
A search of national newspaper articles, websites and government publications was also done
for grey literature. The content of the publications was reviewed to determine whether the
project was implemented in Kenya. Any publications that did not fulfil these criteria were
excluded. Authors who collaborated on the publications or implementation projects were
considered representatives of the organisations to which they were affiliated. Organisations
were therefore considered to be collaborating on the implementation of eHealth projects in
Kenya if they had co-authored a paper together or if the publications overtly said that there
was a partnership between the organisations during any phase of development and
implementation of an eHealth project in the country.
3.3.1. Stakeholders
Data on organisations extracted from the literature were represented as adjacency matrices
(Borgatti, Everett & Freeman, 2002) and analysed using Microsoft Excel (2013). This was done
in order to address the first objective that sought to identify and characterise the stakeholders
involved in the implementation of eHealth projects in the country.
The identified organisations were first categorised into four groups based on the type of
eHealth technology being implemented. Based on the four strategic areas of implementation
previously described as active within the Kenyan eHealth space (Njoroge et al., 2017), the
following categories of eHealth were used in this study: mHealth, health information systems,
telemedicine, and other eHealth types. The latter included any other type of eHealth
technology that was not associated with the above categories, for example eLearning
platforms, eResearch and the internet of things (IoT) in health care.
The organisations were then organised and sorted according to regions based on their
country of origin. This was done by accessing the websites of identified organisations and
identifying the country where the organisation was first incorporated and based. The
organisations were then also organised by type of organisation for example organisations
linked to government, universities, not-for-profit organisations, for-profit organisations,

15 | P a g e
research organisations and hospitals. This information was gathered by examining how the
organisations self-describe themselves on the ‘about’ section of their website, for example as
a for-profit organisation.
3.3.2. Networks
UCINET was used to extract network metrics while the visualisation was achieved using the
network visualisation tool NetDraw (Borgatti, Everett & Freeman, 2002).
The social network data represented as adjacency matrices were imported into the UCINET
matrix editor where they were saved and named as UCINET network data files. Data
describing the attributes of the identified organisations were also entered and saved as
network attribute files. The attributes that were used to analyse and visualise the network
were the following:
• Identity - This was represented as an abbreviation of the organisation name as
coded in the adjacency matrix.
• Category - This refers to information on the type of organisation and the
location of their incorporation and was coded using numbers.
The data were then analysed using network metrics. In network analysis the actors are
referred to as nodes and the relationships between them as ties (Hanneman & Riddle, 2005).
Various network metrics were calculated, based on network characteristics, or node
characteristics. The features of nodes, for example their position within the network, may
accord an advantage when it comes to access to and provision of knowledge within the
network (Borgatti, Everett & Johnson, 2018). The network metrics calculated are described
below.
• Network density
This metric provides information on how closely connected different types of actors are to
each other within a network. It considers the total number of actual ties present between the
nodes relative to the maximum number of ties that could potentially be present between all
the nodes. A network structure with a high network density (close to 1) indicates that most
nodes within a network are connected to one another while one approaching 0 indicates that

16 | P a g e
most actors in the network are not connected to each other (Patterson et al., 2013). This is
important because it affects the cost, in terms of time and resources spent, and efficiency of
knowledge transfer. For efficient diffusion of knowledge, certain factors like being closely
acquainted with the source of the knowledge (strong ties) or existing in a structure with
strong third party ties, will foster cooperation (Reagans & McEvily, 2003; Su, Yang & Zhang,
2017). Network density is calculated by dividing the ties present by the total number of
possible ties (Hanneman & Riddle, 2005).
• Degree centrality
Degree centrality refers to the number of ties a particular node has within a network. It
indicates the likelihood that a node will receive information flowing through the network
(Borgatti, Everett & Johnson, 2018). It can also provide information about the importance and
role of a particular node within the structure (Hanneman & Riddle, 2005). A node with a high
degree will be associated with increased importance within the entire network.
• Betweenness centrality
This metric describes the importance of a node with regard to controlling the flow of
knowledge within the network. A node with a high betweenness score has high influence over
the flow of information in the network. Betweenness centrality is calculated by assessing how
many times a node lies along the path between any two other nodes in the network (Borgatti,
Everett & Johnson, 2018).
• Closeness centrality
When assessing knowledge flows, closeness centrality describes the distance of a node to all
others. This means that nodes that have a high closeness score are close to the source of new
knowledge irrespective of where in the network the knowledge comes from. It is calculated
by summing up the shortest distance from one node to each of the other nodes in the network
(Borgatti, Everett & Johnson, 2018).
Centrality values were normalised by dividing the values obtained in each network by the
maximum possible value for each centrality measure and expressing it as a percentage
(Wasserman & Faust, 1994). This was done to allow for comparison of the results between
the networks despite the difference in total number of actors for each.

17 | P a g e
NetDraw was used to visualise the data as shown in Figure 2: An illustration of how different
nodes (organisations) are presented in a network. Ties or edges, drawn as lines between
nodes, represents connections between nodes. Nodes are distinguished by shape (denotes
type of organisation) size (the larger the node, the more ties it has) and colour (Kenyan
actors vs foreign). The thickness of edges can be used to show increased tie strength
between two nodes.. Node sizes were set based on the individual node degree centrality
while the strength of connections or ties between nodes was illustrated by the thickness of
the connecting lines.
Figure 2: An illustration of how different nodes (organisations) are presented in a network. Ties or edges, drawn as lines
between nodes, represents connections between nodes. Nodes are distinguished by shape (denotes type of organisation) size
(the larger the node, the more ties it has) and colour (Kenyan actors vs foreign). The thickness of edges can be used to show
increased tie strength between two nodes.
3.4. Semi structured interviews
Qualitative interviews provided a flexible and time efficient method to capture the thoughts
and perceptions of different eHealth stakeholders with varying levels of experience and
expertise in a private setting. This allowed for free and flowing descriptions (Newcomer et al.,
2015) of the opportunities and challenges in the eHealth sector in Kenya. The interviews
allowed the participants to describe their challenges in their own words and from their own

18 | P a g e
point of view without the need to sanitise their feelings; interviews are also useful in
extracting information on what services different organisations offer, their attitudes and
behaviours and on how such behaviours can be changed, improved, or modified (Newcomer
et al.,2015). In assessing knowledge diffusion using SNA, one expected outcome is the
generation of new insights into the participant interactions that influence knowledge flows
within the sector, with a view to improving such interactions.
Qualitative interviews were conducted with stakeholders from different organisations that
have been involved in developing and implementing eHealth projects within the public health
sector in Kenya. Participants for the qualitative interviews were identified using the social
network analysis on existing literature on eHealth projects implemented in Kenya. The top
five organisations were ranked according to the group centrality scores for the four strategic
areas of implementation. This meant that some organisations featured more than once as
they were active in more than one strategic area of implementation. For the purpose of
identifying stakeholders for interviews, the organisations were ranked according to how
many times they appeared in the ranked lists. The top ranked organisations were then
contacted via email and face-to-face interactions and asked to identify individuals who were
actively engaged with eHealth work from within the organisation. Informed consent was then
sought from the identified individuals who were invited to take part in the study.
The initial interview questions collected information on demographics, geography and on
how long the organisation had been active within the eHealth sector. The interviews also
sought to extract information on knowledge diffusion i.e. what sort of eHealth knowledge
each participant had, how and from where they acquired it, and how it had been spread to
other stakeholders within the network. The respondents were then asked to describe their
experiences and views during the implementation phases, addressing the following three
areas:
• The nature of the journey of working as an implementer of eHealth in the Kenyan
public health sector.
• The techniques considered and implemented for training end users and other
implementing partners on, for example, adoption of a new technology, as well as the
associated experiences.

19 | P a g e
• The locations in the network where technical support is sought, for example for
conducting impact assessments of the implemented projects.
The information sought, plays a role in determining the type of interaction that is required
between the participants in order for knowledge transfer to occur between organisations
(Klarl, 2009a). The interviews sought to elicit whom the participants seek as sources of
knowledge and their capacity to transmit and receive relevant information. This is important
as it has been shown that the nature of the knowledge and the ability of the participants to
receive and transmit the knowledge has an effect on the efficiency of knowledge diffusion
(Mu, Tang & MacLachlan, 2010; Su, Yang & Zhang, 2017). The interviews also looked to
identify the context and format in which this knowledge is transferred from one participant
to the other. The frequency of the interactions and subjective importance placed on the
interactions was also assessed (Borgatti, Everett & Johnson, 2018).
Snowball sampling was used to identify additional participants. An advantage of the snowball
sampling technique is that it is effective in identifying participants who are difficult to reach
either because they are active on the ground or have positions in high places with regard to
societal power dynamics for example high ranking government officials (Atkinson & Flint,
2001).
Name generators were incorporated into the interviews. A name generator is a question that
extracts information about the network by asking the participants to name and describe
others with whom they have relationships thereby facilitating the gathering and extraction of
information on different network types (Shakya, Christakis & Fowler, 2017). Name generators
have been shown to be the most effective method of extracting information on a specific
network (Bien, Marbach & Neyer, 1991). They have been used in different network analysis
studies conducted in low to medium income countries to identify different forms of
relationships among participants (Perkins, Subramanian & Christakis, 2015).
Name generators are important as they provide a context linking the individual participants
interviewed to the network structure elucidated (Shakya, Christakis & Fowler, 2017). From
the questions, the ties described provide a basis to generate the network structure while the
specific question creates the specific context within which the ties operate (Ibid).
20 | P a g e
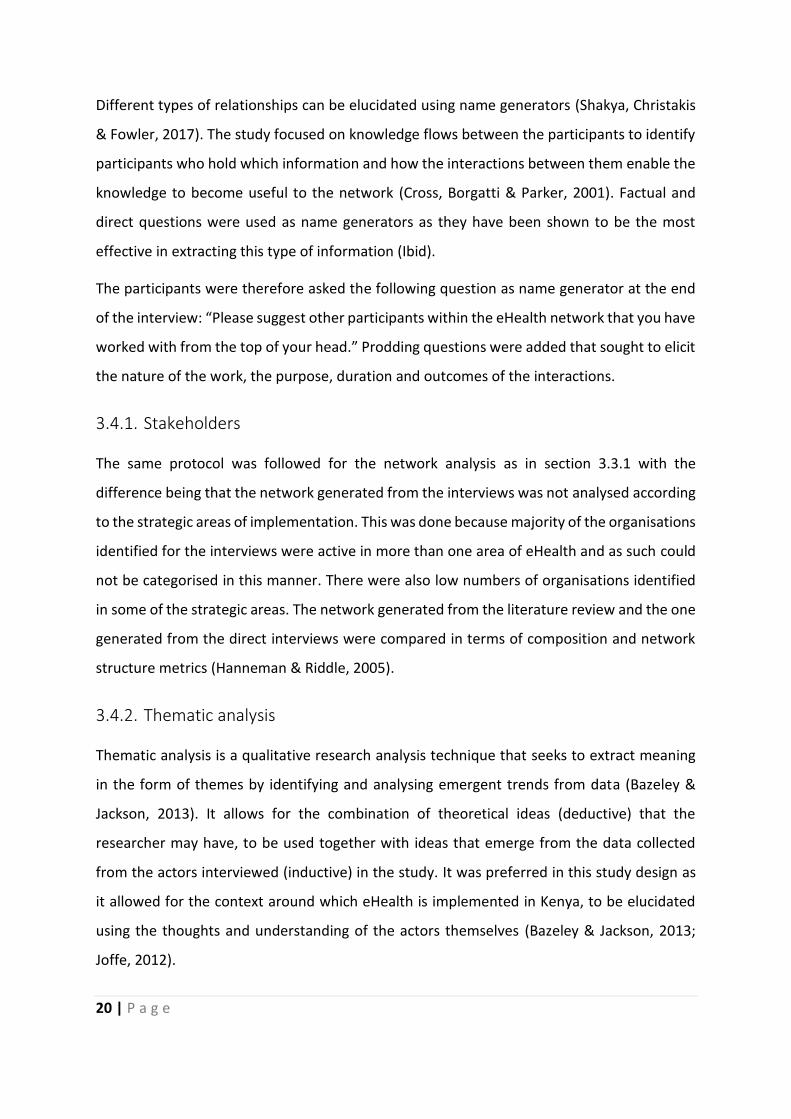
Different types of relationships can be elucidated using name generators (Shakya, Christakis
& Fowler, 2017). The study focused on knowledge flows between the participants to identify
participants who hold which information and how the interactions between them enable the
knowledge to become useful to the network (Cross, Borgatti & Parker, 2001). Factual and
direct questions were used as name generators as they have been shown to be the most
effective in extracting this type of information (Ibid).
The participants were therefore asked the following question as name generator at the end
of the interview: “Please suggest other participants within the eHealth network that you have
worked with from the top of your head.” Prodding questions were added that sought to elicit
the nature of the work, the purpose, duration and outcomes of the interactions.
3.4.1. Stakeholders
The same protocol was followed for the network analysis as in section 3.3.1 with the
difference being that the network generated from the interviews was not analysed according
to the strategic areas of implementation. This was done because majority of the organisations
identified for the interviews were active in more than one area of eHealth and as such could
not be categorised in this manner. There were also low numbers of organisations identified
in some of the strategic areas. The network generated from the literature review and the one
generated from the direct interviews were compared in terms of composition and network
structure metrics (Hanneman & Riddle, 2005).
3.4.2. Thematic analysis
Thematic analysis is a qualitative research analysis technique that seeks to extract meaning
in the form of themes by identifying and analysing emergent trends from data (Bazeley &
Jackson, 2013). It allows for the combination of theoretical ideas (deductive) that the
researcher may have, to be used together with ideas that emerge from the data collected
from the actors interviewed (inductive) in the study. It was preferred in this study design as
it allowed for the context around which eHealth is implemented in Kenya, to be elucidated
using the thoughts and understanding of the actors themselves (Bazeley & Jackson, 2013;
Joffe, 2012).

21 | P a g e
NVivo software (Bazeley & Jackson, 2013) was used for analysis of the information collected
from the interviews, thus allowing for coding of data based on different themes. Thematic
coding facilitated the analysis of the types of network relationships that have been shown to
be of interest when assessing knowledge flow, i.e. the collaboration network (De Lange,
Agneessens & Waege, 2004). Cross & Sproull (2004) demonstrated that by seeking
information from others within a network, a stakeholder can gain knowledge in form of
solutions, metadata, legitimisation, problem reformulation and validation.
Each interview transcript was assessed and any part of it that had to do with an area of
interest, guided by the study research question, was highlighted and saved under a general
label. This phase resulted in the organisation and tagging of parts of the data into codes prior
to analysis of emerging themes. The codes were then assessed in order to identify meaning
from them generate different themes and subthemes. These were then reassessed against
the research question and transcripts to make sure they were aligned. The end result of this
was reorganisation of themes and subthemes with some being combined to form new themes
or some being reduced to be subthemes under other themes.
The results of the qualitative analysis were linked to the results of the network analysis for a
clearer description of how and why knowledge diffusion occurs within the network
(Jankauskienė, 2014).
Word queries and other tools available on NVIVO 12 were used to aid in visualisation of the
available data (Bazeley & Jackson, 2013).

22 | P a g e
4. Results
This chapter is divided into two broad sections: one dealing with analysis of the data obtained
from publications and the other dealing with analysis of the data collected from the semi-
structured interviews.
4.1. Publication networks
A total of 123 projects were identified in the literature that fit the criteria described in section
3.3. Sixty-nine had been identified from the systematic review on eHealth projects in Kenya
(Njoroge et al., 2017), while 36 new projects were identified from publications identified from
PubMed, 20 from Web of Science and Google Scholar repositories and 11 from general Google
searches, searches of government databases and eHealth company websites. Duplicate
publications were removed. The remaining publications were assessed based on the projects
they addressed. In some cases, different publications were found to be reporting on different
aspects or different stages of the same project. Nine such publications were identified.
Stakeholders (organisations) were identified from 127 retained projects.
Table 1 shows the results of data collected from the publications. A total of 230 organisations
were identified within the eHealth sector in Kenya. When analysed according to the strategic
areas of implementation, mHealth was the most active with 170 organisations identified,
followed by Health information systems (61), then other forms of eHealth (40) and finally
telemedicine (15). Academia and not-for-profit organisations made up the bulk of
organisations identified in all networks identified from publications. When the Kenyan
organisations were viewed in isolation, local for-profit organisations and not-for-profit
entities were found to make up the bulk of the organisations. Table 2 shows the organisations
identified by the area of implementation and the region of registration of the organisations.
Most organisations active within the sector were found to be based in either Kenya or the
United States of America.
A network was drawn for each of the four eHealth areas. The size of the nodes is determined
by the degree centrality of the node with the edge weighted to illustrate the tie strength
between the organisations (how many times the different organisations have worked
together).

23 | P a g e
Table 1: Organisations sorted according to strategic areas of technology implementation and organisation type. HIS - health
information systems
Abbreviations Organisational type mHealth HIS Other eHealth Telemedicine
G Government (county or central) 7 3 2 1
IG Foreign government 1 1 0 0
LU Local university (within Kenya) 4 3 5 0
FU Foreign university 48 17 8 3
FNPO Foreign not-for-profit organisation 43 15 7 3
LNPO Local not-for-profit organisation 15 5 5 1
IRO Foreign research organisation 6 1 0 0
LRO Local research organisation 2 1 0 0
LH Local hospitals 10 4 5 4
IH Foreign hospital 7 2 0 0
IPC Foreign for-profit 12 3 3 1
LPC Local private company 15 6 5 2
Total 170 61 40 15
Table 2: Distribution of organisations according to strategic area of implementation and region of registration. HIS – health.
Information systems
Region mHealth HIS Other eHealth Telemedicine
Asia 6 1 0 0
Europe 31 10 0 1
Africa region excluding Kenya 7 0 0 1
Kenya 51 22 21 7
Americas 75 28 19 6

24 | P a g e
4.1.1. MHealth publication network
One hundred and seventy organisations were identified as active within the mHealth
network. Foreign universities (48) and foreign not-for-profit organisations (43) made up most
organisations identified within this network. North America was the most active region with
75 organisations represented. Fifty-one Kenyan organisations were identified, 31 from the
European region, 7 from other African countries and 6 from the Asia pacific region. Of the 51
Kenyan organisations, most (30 out of 51) were local private companies (15) and not-for-
profit-organisations (15). A network density that is approaching 0 indicates that actors in a
network are loosely connected (Patterson et al., 2013). The mHealth network had a network
density 0.0416 which indicates that the actors within the network were not closely connected
to each other.
Figure 3 shows the collaborative network for organisations dealing with mHealth solutions in
Kenya. The Ministry of Health, Kenya Medical Research Institute (KEMRI), the University of
Nairobi (UON), Moi University and AMPATH were the locally based organisations that were
found to have been involved in many projects while having many collaborating partners.
There were also isolated organisations that were not found to have collaborating partners
but were active within the eHealth space. This is presented on the left-hand side of Figure 3
as disconnected nodes.

25 | P a g e
Figure 3: The mHealth publication network from 2001 to March 2018. Nodes are scaled to degree centrality and the edges
have been weighted to the number of times organisations have collaborated. Abbreviations are provided in Appendix 1.
Table 3 shows the top 20 organisations sorted from the largest to the smallest with regard to
degree centrality. Abbreviations are provided in Appendix 1. The Ministry of Health (MOH)
had the highest degree centrality (0.3491) followed by KEMRI, United States Agency for
International Development (USAID), the University of Nairobi and the University of
Washington. Within the top 20, foreign universities and foreign not-for-profit organisations
made up the bulk of organisations identified. This can be interpreted as the Ministry of Health
being the node with the largest capacity to transmit information to all other nodes within the
network. Table 4 shows the top 20 organisations ranked by their betweenness centrality
scores. Universities and not-for-profit organisations made up the majority of the
organisations in this rank.

26 | P a g e
Table 3: Top 20 mHealth organisations ranked according to degree centrality in descending order. Abbreviations are
provided in Appendix 1.
Rank Org Abbreviation Degree Normalised Rank Org Abbreviation Degree Normalised
1 MOH 0.3491 11 CU 0.1065
2 KEMRI 0.2544 12 AGA-N 0.1006
3 USAID 0.2308 13 MIT 0.0947
4 UON 0.2249 14 JHU 0.0947
5 UW 0.2130 15 KNH 0.0888
6 AMPATH 0.1775 16 FHI 0.0888
7 GU 0.1775 17 HU 0.0828
8 MU 0.1716 18 UoBC 0.0828
9 IU 0.1598 19 ICRH 0.0769
10 WB 0.1538 20 Ghent 0.0769
Table 4: Top 20 MHealth organisations ranked according to betweenness centrality in descending order. Abbreviations are
provided in Appendix 1.
Rank Org Abbreviation Category Betweenness Rank Org Abbreviation Category Betweenness
1 MOH 1 0.2473 11 LSTM 4 0.0483
2 UON 3 0.1337 12 WB 5 0.0394
3 KEMRI 8 0.1281 13 JHU 4 0.0342
4 UW 4 0.1008 14 CU 4 0.0332
5 GU 4 0.0865 15 WITS 4 0.0294
6 USAID 5 0.0826 16 AMPATH 6 0.0293
7 UoBC 4 0.0732 17 MU 3 0.0194
8 AMREF 6 0.0586 18 UNDP 5 0.0176
9 AGA-N 9 0.0520 19 IU 4 0.0145
10 SAF 13 0.0486 20 KNH 9 0.0140

27 | P a g e
The MOH, UON and KEMRI, the University of Washington and Georgetown University were
the highest ranked in terms of their betweenness centrality scores. This implies that these
organisations are best placed to affect and change how information flows within the
network.
Table 5 shows the normalised closeness centrality scores. Foreign universities and foreign
not-for-profit organisations made up the bulk of the organisations in this top 20 rank. The
closeness centrality ranks show that the MOH, the University of Nairobi, KEMRI,
Georgetown University and the University of Washington were the highest ranked. This
implies that these organisations are closest to new knowledge irrespective of where in the
network this knowledge is generated.
Table 5: Top 20 MHealth organisations ranked according to closeness centrality in descending order. Abbreviations are
provided in Appendix 1.
Rank Org Abbreviations Category Closeness Rank Org Abbreviations Category Closeness
1 MOH 1 0.3521 11 MSK 5 0.2996
2 UON 3 0.3380 12 FHI 6 0.2986
3 KEMRI 8 0.3301 13 UoBC 4 0.2986
4 GU 4 0.3294 14 ICRH 5 0.2929
5 UW 4 0.3263 15 Ghent 4 0.2929
6 USAID 5 0.3231 16 AMPATH 6 0.2919
7 JHU 4 0.3183 17 MU 3 0.2919
8 KNH 9 0.3107 18 IU 4 0.2914
9 WB 5 0.3067 19 CU 4 0.2914
10 EGPAF 5 0.3034 20 BMDF 5 0.2914

28 | P a g e
4.1.2. Health information systems publication network
Sixty-one organisations were identified as active collaborators in health Information systems.
Foreign universities and foreign not-for-profit organisations made up the majority of the
organisations identified.
North American and Kenyan organisations made up the bulk of organisations identified.
Figure 4 presents the health information system network. This network had a network density
of 0.1617 meaning that in this network the players were more connected to each other as
compared to the mHealth network (Patterson et al., 2013).
The MOH, KEMRI, UON, Moi University, Moi Teaching and Referral Hospital (MTRH) and
AMPATH were found to be among the more prominent locally based organisations involved
in many projects while having many collaborating partners.
Error! Reference source not found.Table 6 shows the top 20 organisations sorted from the
largest to the smallest with regard to degree centrality. The MOH had the highest degree
centrality (0.95) followed by Indiana University (IU), AMPATH, Regenstrief Institute Inc. and
USAID. Foreign not-for-profit organisations and foreign universities made up the majority of
the top 20 organisations identified. These organisations can be interpreted to have the largest
capacity to transmit information to all other nodes within the network (Wasserman & Faust,
1994).

29 | P a g e
Figure 4: The health information systems publication network from 2001 to March 2018. Nodes are scaled to degree centrality and the edges have been weighted to the number of times organisations have collaborated. Abbreviations are provided in Appendix 1.
Table 6 :Top 20 health information systems organisations ranked according to degree centrality in descending order. Abbreviations are provided in Appendix 1
Rank Abbreviation Category Degree
Degree
(Normalised) Rank Abbreviation Category Degree
Degree
(Normalised)
1 MOH 1 57 0.9500 11 VA HSR&D 2 16 0.2667
2 IU 4 31 0.5167 12 JAICA 5 16 0.2667
3 AMPATH 6 30 0.5000 13 UT 4 16 0.2667
4 RII 5 30 0.5000 14 MRHC 9 16 0.2667
5 USAID 5 24 0.4000 15 Yale 4 16 0.2667
6 KEMRI 8 24 0.4000 16 UB 5 16 0.2667
7 UW 4 23 0.3833 17 UoD 4 16 0.2667
8 MU 3 21 0.3500 18 BASMU 5 16 0.2667
9 MTRH 9 20 0.3333 19 I-TECH 5 15 0.2500
10 UON 3 18 0.3000 20 EGPAF 5 14 0.2333

30 | P a g e
Table 7 shows the ranked closeness centrality scores for organisations found to be active
within the HIS technology space. Foreign not-for-profit organisations and foreign universities
made up the majority of the top 20 organisations as ranked by closeness centrality. These
organisations can be viewed to be the ones most proximal to new knowledge or information
irrespective of where it is generated within the whole network.
Table 7: Top 20 health information systems organisations ranked according to closeness centrality in descending order.
Abbreviations are provided for in Appendix 1
Rank Abbreviations Category Closeness Rank Abbreviations Category Closeness
1 MOH 1 0.6316 11 UON 3 0.4651
2 IU 4 0.5263 12 MTRH 9 0.4615
3 AMPATH 6 0.5217 13 VA HSR&D 2 0.4615
4 RII 5 0.5217 14 CU 4 0.4615
5 KEMRI 8 0.5128 15 JAICA 5 0.4615
6 UW 4 0.4959 16 UT 4 0.4615
7 USAID 5 0.4800 17 MRHC 9 0.4615
8 I-TECH 5 0.4724 18 Yale 4 0.4615
9 EGPAF 5 0.4688 19 UB 5 0.4615
10 MU 3 0.4651 20 UoD 4 0.4615
Table 8 shows the ranked betweenness centrality of organisations active within the network.
The MOH was had the highest closeness centrality score. There were only 13 organisations
which had recordable betweenness score with foreign not-for-profit organisations, local
universities and foreign universities making up the bulk of these. These organisations are
therefore more likely to receive information and knowledge before any other organisations
therefore have a greater opportunity to affect how information flows along the entire
network.

31 | P a g e
Table 8: Top 20 health information systems organisations ranked according to betweenness centrality in descending order.
Abbreviations are provided in Appendix 1.
Rank Abbreviations Category Betweenness Rank Abbreviations Category Betweenness
1 MOH 1 0.4136 8 RII 5 0.0273
2 KEMRI 8 0.1838 9 UW 4 0.0267
3 USAID 5 0.0732 10 MU 3 0.0099
4 IU 4 0.0468 11 UON 3 0.0051
5 I-TECH 5 0.0317 12 EGPAF 5 0.0018
6 CDC-USA 7 0.0292 13 SU 3 0.0017
7 AMPATH 6 0.0273 14 MTRH 9 0.0000
4.1.3. Telemedicine publication network
Fifteen organisations were identified as active in telemedicine from the review of literature.
Local hospitals and foreign based universities made up the bulk of the active organisations.
Seven of the organisations identified were Kenyan, 6 from the Americas, 1 from other African
countries and 1 from the European region.
This network comprised of four distinct components, one of which is a single component and
another which comprises two nodes. had a network density of 0.333 with 70 ties. There was
an almost equal representation of local and foreign nodes in the network with two distinct
sub-networks as visualised in Table 9. The ranking of the organisations from the degree and
closeness centrality scores were found to be identical thus allowing for the results to be
presented together in. The organisations ranked most highly included foreign universities,
foreign not-for-profit organisations, and local hospitals. It was not possible to calculate the
betweenness centrality for this network structure due the disjointed nature of the network.

32 | P a g e
Figure 5: The telemedicine publication network from 2001 to March 2018. Nodes have been scaled to degree and the edges
have been weighted to the number of times organisations have collaborated together. Abbreviations are provided in
Appendix 1.

33 | P a g e
Table 9: Top 15 telemedicine organisations ranked in descending order according to degree and closeness centrality. Abbreviations are provided in Appendix 1.
Rank Abbreviations Category Degree Closeness
1 UoP 4 0.5000 0.5600
2 MOH 1 0.5000 0.5600
3 SAF 13 0.5000 0.5600
4 PENN 4 0.5000 0.5600
5 UNIDO 5 0.5000 0.6667
6 NCIIA 5 0.5000 0.6667
7 CYEC 6 0.5000 0.6667
8 LU 4 0.5000 0.6667
9 AGA-N 9 0.2143 0.6667
10 AGA-M 9 0.2143 0.6667
11 AGA-D 9 0.2143 0.6667
12 AGA-K 9 0.2143 0.6667
13 AMD 12 0.0714 0.5000
14 PCCHF 5 0.0714 0.5185
15 MCARE 13 0.0000 0.5185
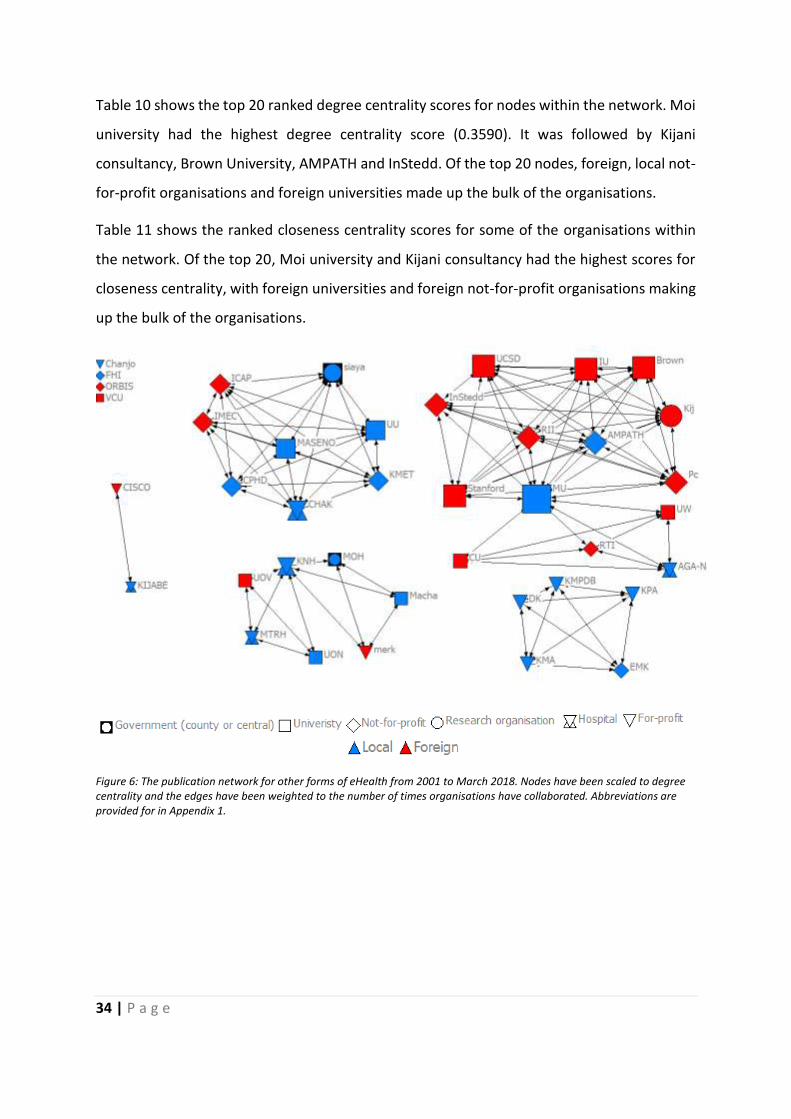
4.1.4. Publication network for other forms of eHealth
Forty organisations not fitting into the other eHealth categories were identified as active
collaborators. Universities and not-for-profit organisations made up the bulk of the
organisations identified. When assessed by regions the only regions represented were Kenya
(21) and North America. Figure 6 shows the network of actors whose areas of activity were
found to be clearly distinct from the three other types of eHealth (mHealth, health
information systems and telemedicine). The network density was found to be 0.1372. There
were isolated organisations that were not found to have collaborating partners but were
active within this eHealth space. This is presented on the left-hand side of Figure 6 as
disconnected nodes.
34 | P a g e
Table 10 shows the top 20 ranked degree centrality scores for nodes within the network. Moi
university had the highest degree centrality score (0.3590). It was followed by Kijani
consultancy, Brown University, AMPATH and InStedd. Of the top 20 nodes, foreign, local not-
for-profit organisations and foreign universities made up the bulk of the organisations.
Table 11 shows the ranked closeness centrality scores for some of the organisations within
the network. Of the top 20, Moi university and Kijani consultancy had the highest scores for
closeness centrality, with foreign universities and foreign not-for-profit organisations making
up the bulk of the organisations.
Figure 6: The publication network for other forms of eHealth from 2001 to March 2018. Nodes have been scaled to degree centrality and the edges have been weighted to the number of times organisations have collaborated. Abbreviations are provided for in Appendix 1.

35 | P a g e
Table 10: Top 20 organisations ranked according to degree centrality in descending order. Abbreviations are provided in Appendix 1.
Rank Abbreviation Category Degree Rank Abbreviation Category Degree
1 MU 3 0.3590 11 MASENO 3 0.1795
2 Kijani 7 0.2308 12 CHAK 9 0.1795
3 Brown 4 0.2308 13 Siaya County 1 0.1795
4 AMPATH 6 0.2308 14 IMEC 5 0.1795
5 InStedd 5 0.2308 15 UU 3 0.1795
6 RII 5 0.2308 16 KMET 6 0.1795
7 Pc 5 0.2308 17 ICAP 5 0.1795
8 Stanford 4 0.2308 18 CPHD 6 0.1795
9 UCSD 4 0.2308 19 KNH 9 0.1538
10 IU 4 0.2308 20 AGA-N 9 0.1282
Table 11: Top 20 organisations ranked according to closeness centrality in descending order. Abbreviations are provided in Appendix 1.
Rank Abbreviation Category Closeness Rank Abbreviation Category Closeness
1 MU 3 0.4286 11 CU 4 0.3900
2 Kijani 7 0.4105 12 UW 4 0.3900
3 Brown 4 0.4105 13 AGA-N 9 0.3900
4 AMPATH 6 0.4105 14 RTI 5 0.3900
5 InStedd 5 0.4105 15 MASENO 3 0.3786
6 RII 5 0.4105 16 CHAK 9 0.3786
7 Pc 5 0.4105 17 Siaya 1 0.3786
8 Stanford 4 0.4105 18 IMEC 5 0.3786
9 UCSD 4 0.4105 19 UU 3 0.3786
10 IU 4 0.4105 20 KMET 6 0.3786

36 | P a g e
The betweenness centrality could only be computed for two nodes as a result of the disjointed
nature of the network. The two nodes represented one local university - Moi University -
which had a score of 0.0486 and one local hospital, Kenyatta National Hospital which had a
betweenness centrality score of 0.0121.
4.1.5. Summary of results from publication network
Based on the publication data, the mHealth network was identified as having the largest
number of collaborating organisations. Kenyan and North American based organisations were
found to be the most active for most networks with foreign universities and foreign not-for-
profit organisations featuring significantly. All networks were found to have low cohesion
measures as indicated by the low network density scores obtained. This means that actors in
the publication networks were not closely connected to each other regardless of the area of
eHealth with the health information systems network being having the highest cohesion. The
MOH had participated in implementation in all four of the strategic areas and had many ties
with many different organisations.
4.2. Analysis of data obtained from interviews
Active organisations within the eHealth implementation space were identified from the social
network analysis. Individual participants involved directly in the eHealth implementation
work were then identified through phone calls to the organisations or face to face networking
during technical conferences. Emails were then sent out to six prospective participants
requesting their participation in the study. Snowball sampling was done after conducting the
first round of interviews; this allowed for 12 other participants dealing with eHealth
implementation within their respective organisations to be identified. Eighteen emails
invitations for participation in the study were sent out in total. Twelve positive responses
were received.
A total of 12 interviews were conducted with an average duration of 48 minutes per
interview. The participant organisations included the MOH, local for-profit and not-for-profit
entities involved in the implementation of eHealth, government research organisations,
academia among others. Most of the participants worked within the Health Information

37 | P a g e
system implementation space as shown in Figure 8 where informatics was the most popular
area of specialization.
The results are presented in two sub-sections; one dealing with the characterisation of
stakeholders and data obtained from the analysis of the interview-based network and the
other section dealing with the results of the thematic analysis of the semi-structured
interviews.
4.2.1. Interview-based eHealth network
Ninety-five organisations were identified in the interview-based network. Foreign-based
universities and not-for-profit organisations were the most common with foreign
organisations making up almost half of all organisations in this network as shown in Table 12.
Most organisations active within the sector were found to be based in either Kenya or the
United States of America as shown in Table 13.
Table 12: Organisations by type in the interview-based networks
Abbreviation Organisation type Number of organisations
FNPO Foreign not-for-profit organisation 21
FU Foreign University 15
G Government (county or central) 13
LU Local University (within Kenya) 9
LNPO Local not-for-profit organisation 9
LPC Local for-profit organisation 9
LH Local hospital 7
IPC International for-profit organisation 7
IG International government 2
IRO International research organisation 2
LRO Local research organisation 1
IH International Hospital 0

38 | P a g e
Table 13: Distribution of organisations sorted by geographical region of origin in the network as identified from the analysis
of the semi-structured interviews.
Region Number of organisations
Kenya 48
North America 28
Europe 10
Africa excluding Kenya 6
Asia-Pacific 3
Figure 7 shows the collaborative network for eHealth in Kenya as identified from the semi-
structured interviews. Health information systems was the most common type of technology
implemented.
The eHealth network had a network density 0.0618 which indicates that most actors in the
network were not closely connected to each other.
Among the collaborating organisations, there was a more even distribution in the numbers of
foreign organisations and local organisations identified as compared to the publication
networks where there were more foreign organisations. The MOH, UON and Moi University
are locally based organisations that were found to have been involved in many projects and
having many collaborating partners.

39 | P a g e
Figure 7: The interview-based network. Nodes have been scaled to degree centrality and the edges have been weighted to
the number of times organisations have collaborated together. Abbreviations are provided in Appendix 1.
Table 14 shows the top 20 organisations sorted from the largest to the smallest with regard
to degree centrality. The MOH had the highest degree centrality (0.3491) followed by Moi
University, University of Nairobi, and USAID. This can be interpreted as the MOH being the
node with the largest capacity to transmit information to all other nodes within the network.
Of the top 20, local for-profit organisations, local universities, local not-for-profit
organisations made up the bulk of the organisations.

40 | P a g e
Table 14: Top 20 eHealth organisations based on interviews, ranked in descending order according to degree centrality
scores. Abbreviations are provided in Appendix 1.
Rank Abbreviations Category Degree Rank Abbreviations Category Degree
1 MOH 1 0.8191 11 CDC-USA 7 0.1596
2 MU 3 0.2979 12 WHO 5 0.1489
3 UON 3 0.2553 13 AS 13 0.1489
4 USAID 5 0.2553 14 AMREF 6 0.1383
5 ARA 6 0.2340 15 AMPATH 6 0.1383
6 UBUNTUA 13 0.2234 16 UW 4 0.0957
7 SI 13 0.2128 17 KEMRI 8 0.0957
8 MTRH 9 0.1809 18 MASENO 3 0.0957
9 Intellisoft 13 0.1702 19 Kisumu 1 0.0957
10 MH 13 0.1596 20 KABYA U 3 0.0957

41 | P a g e
Table 15 shows the highest ranked betweenness centrality of organisations active within this
network. The MOH ranks as the organisation with the highest betweenness centrality score
(0.5620). This means they have the greatest influence on how information flows through the
network. Of the top 20 highest ranked actors, local for-profit organisations, foreign not-for-
profit organisations and local not-for-profit organisations made up the bulk of the
organisations.
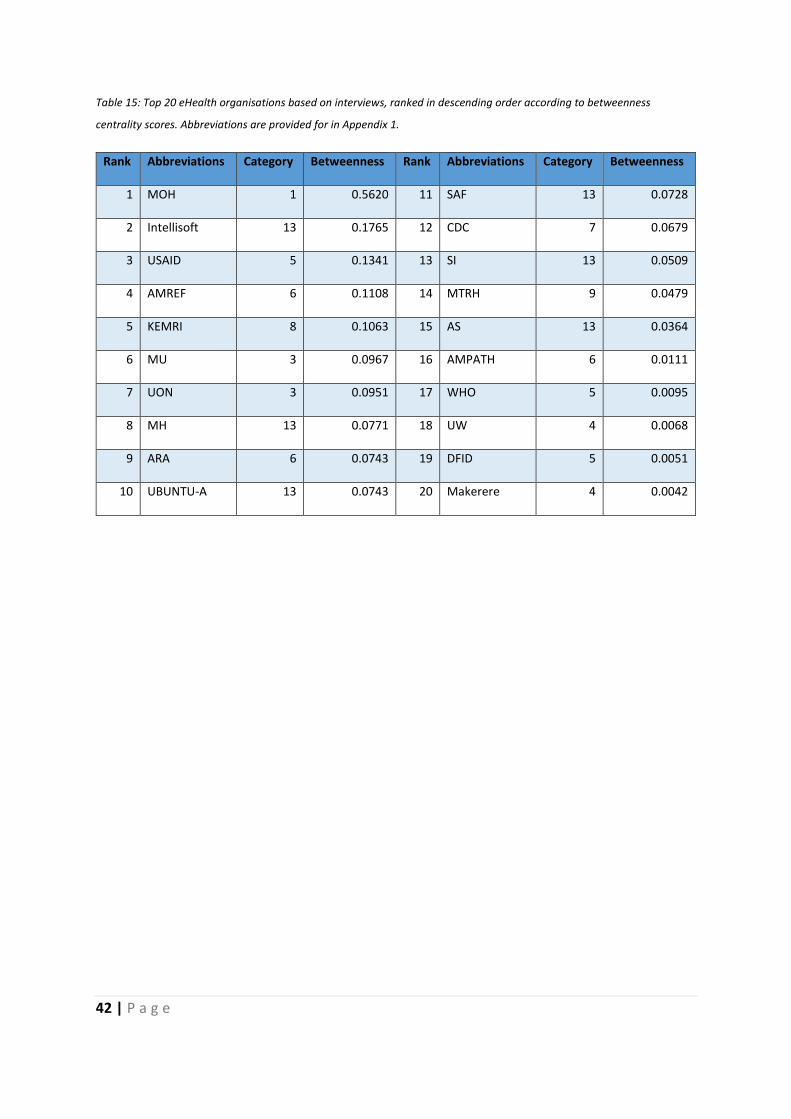
42 | P a g e
Table 15: Top 20 eHealth organisations based on interviews, ranked in descending order according to betweenness
centrality scores. Abbreviations are provided for in Appendix 1.
Rank Abbreviations Category Betweenness Rank Abbreviations Category Betweenness
1 MOH 1 0.5620 11 SAF 13 0.0728
2 Intellisoft 13 0.1765 12 CDC 7 0.0679
3 USAID 5 0.1341 13 SI 13 0.0509
4 AMREF 6 0.1108 14 MTRH 9 0.0479
5 KEMRI 8 0.1063 15 AS 13 0.0364
6 MU 3 0.0967 16 AMPATH 6 0.0111
7 UON 3 0.0951 17 WHO 5 0.0095
8 MH 13 0.0771 18 UW 4 0.0068
9 ARA 6 0.0743 19 DFID 5 0.0051
10 UBUNTU-A 13 0.0743 20 Makerere 4 0.0042

43 | P a g e
Table 16 presents the actors having the highest closeness centrality. The MOH is the highest
ranked organisation according to closeness centrality score. Of the top 20 organisations, local
for-profit organisations, foreign not-for-profit organisations and local not-for-profit
organisations made up the bulk of the organisations identified. These organisations can be
said to be closest to new knowledge irrespective of where in the network this knowledge is
generated.

44 | P a g e
Table 16: Top 20 eHealth organisations in the interview-based network, ranked in descending order according to closeness
centrality scores. Abbreviations are provided for in Appendix 1.
Rank Abbreviations Category Closeness Rank Abbreviations Category Closeness
1 MOH 1 0.6309 11 MTRH 9 0.4434
2 USAID 5 0.4921 12 CDC-USA 7 0.4352
3 AMREF 6 0.4896 13 MH 13 0.4273
4 Intellisoft 13 0.4796 14 WHO 5 0.4253
5 MU 3 0.4653 15 UW 4 0.4234
6 SI 13 0.4608 16 DFID 5 0.4196
7 UON 3 0.4585 17 UoM 4 0.4178
8 ARA 6 0.4541 18 WELTEL 6 0.4178
9 UBUNTUA 13 0.4541 19 MEASURE 5 0.4178
10 AS 13 0.4476 20 AMPATH 6 0.4141

45 | P a g e
4.3. Thematic analysis of interviews
The 12 participants interviewed were invited to speak freely about their experiences working
on implementing different eHealth projects. Figure 8 shows the fields in which the
participants were active. The average duration that participants had been active in the
eHealth space in Kenya was 12.3 years.
Figure 8: Word cloud representation of different areas of specialization for the interview participants
The Interview transcripts were analysed, guided by the research question based on three
areas of interest, namely participant knowledge, the nature of the network, and the
challenges and opportunities in the network. Table 17 shows the final codes and emergent
themes that are discussed in the next section.
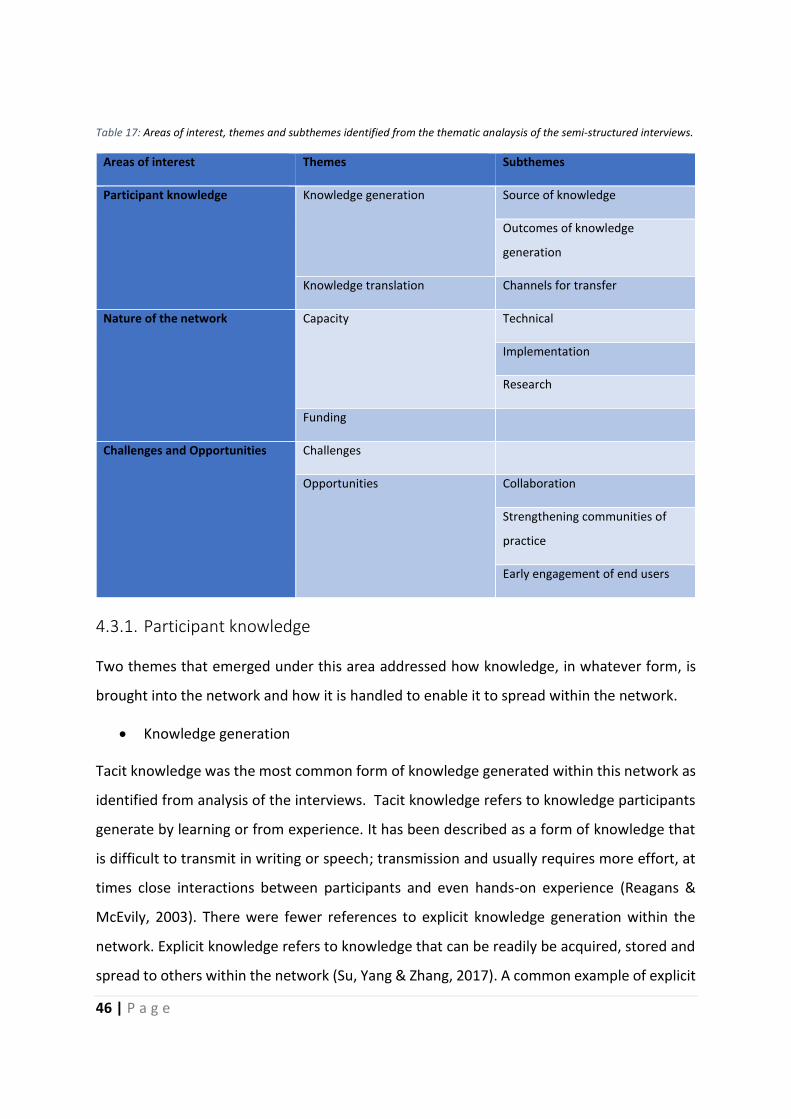
46 | P a g e
Table 17: Areas of interest, themes and subthemes identified from the thematic analaysis of the semi-structured interviews.
Areas of interest Themes Subthemes
Participant knowledge Knowledge generation Source of knowledge
Outcomes of knowledge
generation
Knowledge translation Channels for transfer
Nature of the network Capacity Technical
Implementation
Research
Funding
Challenges and Opportunities Challenges
Opportunities Collaboration
Strengthening communities of
practice
Early engagement of end users
4.3.1. Participant knowledge
Two themes that emerged under this area addressed how knowledge, in whatever form, is
brought into the network and how it is handled to enable it to spread within the network.
• Knowledge generation
Tacit knowledge was the most common form of knowledge generated within this network as
identified from analysis of the interviews. Tacit knowledge refers to knowledge participants
generate by learning or from experience. It has been described as a form of knowledge that
is difficult to transmit in writing or speech; transmission and usually requires more effort, at
times close interactions between participants and even hands-on experience (Reagans &
McEvily, 2003). There were fewer references to explicit knowledge generation within the
network. Explicit knowledge refers to knowledge that can be readily be acquired, stored and
spread to others within the network (Su, Yang & Zhang, 2017). A common example of explicit

47 | P a g e
knowledge referenced in the interviews was when one participant described going through
publications, newspaper articles and other forms of grey literature as being an important part
of the process of identifying partners to work with in the network.
• Sources of knowledge
A subtheme that emerged addressed how the participants gained knowledge that allowed
them to work as implementers of different eHealth technologies or different activities they
undertook that resulted in creating new knowledge. Technical working groups were described
as an effective way to generate explicit knowledge. For tacit knowledge this was through
activities like going back to tertiary education institutions to follow a master’s or PhD
programme, conducting research in the area or by directly working on the development and
implementation of different projects.
• Outcomes of knowledge generation
Another subtheme that emerged addressed the consequences of knowledge generation. An
example of this for tacit knowledge can be seen in a scenario described by one participant
where working pro bono on a project later created an employment opportunity in another
organisation that allowed them to earn a living and even provided an opportunity for them
to further their education. “It was my interest, not what I was paid for, and eventually I was
transformed into being a trainer on the system to utilise it to its highest capacity…. so, I was
promoted to become a staff trainer for the entire university and then 2 years later… recruited
me into the computer career institute whose aim was to help staff being recruited get through
this training that I was doing, and I went to start the programme.”
One participant described how, after they held focus groups with their intended end users,
they gained insights that helped them design the mHealth solution in a way that was culturally
and socially acceptable thus aiding the uptake of the solution and contributing to the overall
success of the project. “It was at the time around 2005 when free access to ARVS were being
rolled… We decided to hold a focus group with our intended end users as part of the
development phase and they told us… ‘we don’t want reminders. I know am meant to take
medication…’ We asked them for suggestions, and they agreed that from the health facility
we send a text message to the patient asking them how you are. From their end, due to

48 | P a g e
confidentiality… they expressed clearly that they did not want messages on HIV on [their]
phone… So [these] are some of the things I learnt when designing your solution remembering
to be user centred… if we had not done our focus group discussions, we would not have known
what they wanted in specifics like the duration of text messages…”
4.3.1.1. Knowledge translation
Translation of knowledge refers to how knowledge generated can be packaged in a form that
is accessible to others for example in terms of development of products with commercial
value or conversion into policies (van de Burgwal, van der Waal & Claassen, 2018).
Generation of explicit knowledge was a common consequence of tacit knowledge generation
and identified as important. An example from the interviews was the publication of research
papers with one user using the expression “All you can do is publish the experience” as they
described a project that failed due to poor end user engagement prior to implementation
despite attracting funding and human resource support. Another participant described that
by working on the development of a health information system that had interoperability at
its centre, they gained valuable experience that allowed them to engage government and
other stakeholders in the development of interoperability frameworks thereby converting the
tacit knowledge they had gained into explicit knowledge that could be accessible to many in
the network.
A common method used for packaging tacit knowledge for utilisation by others in the
network, was the creation of consultancy companies that ended up providing much needed
capacity to create regulations and guidelines like the Kenya eHealth policy and producing
journal publications. They said the following “We have been involved in the interoperability
by helping MOH define eHEALTH interoperability policies and strategies and to rejuvenate the
various stakeholders into a technical working group.”
Two participants described activities that created solutions that have been patented and are
commercially available. This was described as a labour and cost intensive exercise “We
engaged…who helped us to develop financial models on how to make this sustainable. We
also engaged with…who sent us students from…who interviewed public and private sector and
gave us an inside report on the state of digital health that helped us understand how to price
49 | P a g e
and penetrate the market. From this we were able to show…can be sold to third parties and
that there was a lot of demand.”
Another participant described a situation where knowledge generated during the design
phase of a project was packaged and converted into a successful mHealth application that
was later converted into a not-for-profit organisation that was eventually able to conduct two
randomised controlled trials that have since been published.
An example of explicit knowledge being converted from one form to another was seen when
one participant described how their business model has been converted into a case study
published in a reputable international publication. Both explicit and tacit knowledge was also
translated into teaching curricula available through local academic organisations that are
used to increase capacity within the sector.
Another subtheme that emerged addressed channels used to spread the knowledge in the
course of knowledge translation. The main activities referenced were the dissemination and
acquisition of knowledge through conferences, journals, e-learning platforms, community of
practice online groups and websites. One participant said “Currently the best way to get
information on digital health in Kenya is through a KEHIA (Kenya Health Informatics
Association) email list. It is run locally… It has a lot of content about what is happening in
eHealth in Kenya and globally.” There was also reference to a “HIS interagency coordinating
committee” whose function is “is important in bringing together stakeholders so that they
learn what the government priorities are and what gaps have been identified and how to
address these,” according to one participant.
An example for tacit knowledge can be seen when one participant described a current project
where an organisation that had generated knowledge around the implementation of projects
was passing it on to other organisations within the same sector “working with other
universities located where implementation of projects is being built enables us to provide
direct support. This is by working with local universities to build their capacity to train the
peripheral organisations.” Another example was the use of Whatsapp groups that allowed
implementing partners on the ground to raise any issues with teams based in the larger cities
so that they could be addressed in a timely manner. One participant described this as an
efficient way to work with partners to ensure technical problems are quickly solved. They said

50 | P a g e
“After training we create Whatsapp groups with their teams so that in the implementations
they can post any challenges or frustrations, so we support them. Most of the facilities’
breakdowns are knowledge-based maybe due to a breakdown in knowledge transfer. Within
our teams we have roles assigned to support each partner. So, with all these different groups
we have our techies embedded and within the techies we have one responsible for each team
and figuring out who is to solve that. They also know who to call. We found this works better
because you get to learn the problems of the ground rapidly which provides uninterrupted
service delivery.”
Quick coding sprints (that usually last one month and have programmers aiming to achieve
specific objectives and hand them in for review) (Herden et al., 2014) and hackathons (usually
last a day and have different stakeholders involved in software development working
together intensively) (Halvari et al., 2019) have also been used to help spread knowledge to
others in the network. Internships were also a common method described, especially in the
consultancy and software development firms actively engaged in developing and
implementing eHealth solutions within the country.
Several participants bemoaned situations where tacit knowledge generated is not utilised
within the network due to a lack of evaluation of projects. One participant described this by
saying “…eHealth is a little bit interesting, as some people will come in with fully developed
projects and try to deploy [a project] without knowing whether it will work for this group and
after the project ends you do not get to see any feedback on how it worked.”
4.3.2. Nature of the network
This section focusses on references made to networks formed by the stakeholders while also
highlighting some of the reasons that brought them together. Increasing capacity and funding
patterns were identified as common themes that emerged.
4.3.2.1. Capacity
Participants referred to instances or reasons for leveraging the network to increase their own
capacity. Different subthemes emerged depending on whether participants used their
network relations to increase their technical capacity for example software development

51 | P a g e
capacity, their research capacity or implementation capacity. Seeking technical capacity was
found to be the most referenced, followed by seeking implementation partners and finally
increasing their research capacity.
• Technical capacity
Many participants referred to seeking or proving technical capacity as one of the reasons they
came together to work on a project. One of the stakeholders in academia described a project
that was set up for this reason. “We will have this project…which is basically providing
technical assistance…as there is a lack of technical and software development and software
systems, network competence, so through this project we are able to provide these skills.”
There were several advantages identified in leveraging the network for technical assistance.
One participant cited the coming together of different organisations to increase capacity as a
means of increasing sustainability of their organisation. “If we have a large project beyond
our capacity in terms of number and skill sets, we recruit consultants. That’s why we work with
organisations like the…It helps the organisation to stay lean.” Another advantage of seeking
technical assistance from organisations like universities was that it provided an opportunity
to provide exposure to industry for both lecturers and students within such organisations.
“…we are a small organisation so we have to link up with the large organisations ...the reason
we do this is for example if we need software developers is to go to this universities that have
computer science courses...We also know that universities need to expose their students to
the industry so what we do is allow for attachments where every season we have students
who are on attachments.”
One participant described seeking out locally available technical capacity as more efficient
and beneficial to the eHealth in the long term. “…one of the reasons for some solutions taking
long is because of the wide physical distances between the stakeholders for example if some
developers are based out of the country… this creates a situation where small issues that could
have taken a few hours to solve can take several days as maybe one team is asleep while the
others need input. But now we are looking for local capacity to make the process more
efficient. With regard to sustainability, if a solution works, once we implement the solution
and the foreign researchers and their development network leave, will the local county be able
to maintain the international network in case an issue arises?”

52 | P a g e
• Implementation capacity
Increasing an organisation’s ability to implement projects was also identified as a reason for
collaboration: “…we started collaborations again with…because they have reach in all the 47
counties and also to other countries...” or “we are not the guys in the facilities even though
we have developed the systems… there are people that are funded to support the facilities…
we implement through the partners… they have 62 facilities”
Another participant said “working with other universities located where implementation of
projects is being built, enables us to provide direct support. This is by working with local
universities to build their capacity to train the peripheral organisations.”
• Research capacity
Organisations without research departments were able to conduct research to guide the
project implementation process by working with organisations with this capacity. “We also
have students from…working on their PhDs focusing on our systems that we build thereby
supplementing our staff.” This was however not as common a form of capacity being sought
as technical and implementation capacity.
4.3.2.2. Funding
Another theme that emerged as important in guiding the network structure was funding.
Participants implied that most of the work in their sector was heavily dependent on foreign
funding. “It is heavily donor dependent like in the… county work we have a service contract
funded by….working with the head of NCDs in the county” Another said “…that is the starting
point of my interaction with…as the US organisations basically help with health systems
strengthening by providing technical support and financing with the direction being provided
by the strategies of the MOH.”
Funding not only contributed to what sort of projects were being implemented but was also
crucial to the survival and existence of organisations working in this space. One participant
said the following as they described how their organisation has grown over time; “…the
growth or the scale up has been really opportunistic, guided by funding opportunities but also
biased by our settings of interest…” Another said the following “90% of the research here at

53 | P a g e
[organisation] is funded by foreigners, and when research is funded by foreigners all the data
collected goes back to the donor countries.”
Funding also had an effect on how organisations would organise themselves within the
network. Organisations that received funding were central to the project implementation
process as they would be the ones to enrol other organisations or stakeholders to aid in their
execution of tasks. One participant described the following situation as they explained the
genesis of their involvement in a project; “…the university was subcontracted by an NGO
called…that created a project called …this got us more into engagement with the ministry and
later going to the implementation spaces and this really opened up the space…” Another also
described a situation where smaller organisations come together in order to qualify for grant
financing. “…if you apply for a grant when you are very small, you won’t get funding by
yourself. So, you create a network that will allow you to compete for funding in a more
complementary fashion.
Funding also provided an incentive for information exchange with one participant describing
the importance of being part of the available online information exchange platforms like the
KEHIA email list by saying that it “…disseminates a lot of information in case someone wants
to know what is happening about events and funding.”
4.3.3. Challenges and Opportunities
This section presents the challenges and opportunities related to knowledge flow in the
network.
4.3.3.1. Challenges
Access to information was described as a challenge faced by stakeholders in the sector with
one participant stating “…it is dependent on informal communications like calls and random
meet ups. It feels like luck at times, being at the right place at the right time and talking to the
right person.”
Another participant described the process of finding partners who can provide assistance or
finding potential employees to add to a team as being tedious, requiring one to spend extra
effort to learn what is happening in the sector. They said the following; “The way it works is

54 | P a g e
that you have to participate actively within their conferences, seminars and research
gathering. You have to be proactively interacting with academia. …there are no marketing
platforms available; you have to be involved in teaching and stuff so people get to know about
the company and that’s how [a client] will come to them. Look for organisations by scanning
people who are young and follow them when they are young. Like start up conferences…So
we will go and make sure that people know about [the organisation] and that we know about
them. EHealth workshops help identify organisations that can help.”
Knowledge flow, with regard to health system needs, between the end users (i.e.
beneficiaries and operators of eHealth solutions) and the implementers (i.e. developers,
experts or consultants) was also found to be wanting with several participants associating it
with poor project uptake. One participant suggested this as a reason for project failure; “We
went and met the team leader of eHealth (functional beneficiary) …hospital, she listened for
2.5 hours and told us point blank, ‘I like you ICT people (developers), but you have created your
own problems and solved them yourselves. Whatever you are telling us you are not solving
our problems. Come we show you our needs and help us solve them.'” Another participant
opined that poor scaling of projects can be attributed to poor knowledge exchange among
the implementers themselves by saying “…there is the pilotitis issue of running many different
pilots just to see what projects will be scaled yet Kenya has many innovation hubs…”
Low research output within the sector due low funding for research, long proposal approval
processes and reduced capacity to conduct research contributed to the poor access to
knowledge according to several participants. Even where research was conducted it was
described as a process that either took very long to complete or was not accessible to those
who need it: “…MOH is active and counties are not as active especially because most counties
are still experimenting with devolution and only now starting to set up research offices. With
a research office you have responsibility of the knowledge generated within a county. Students
will do work in universities, but it is not linked and reported back to counties as there is no
ownership and support of research to solve their own issues. The large research bodies can
publish in many international journals that do not ever reach the counties….”
The eHealth landscape was described as still being in its early development phase. The
community of practice in terms of technical, implementation and research capacity is small

55 | P a g e
with few formal channels of knowledge transfer and several divergent definitions of concepts
like interoperability.
Human factors like poor attitudes towards technology, bias, competition and distrust were
said to shape the knowledge sharing culture between stakeholders contributing to the low
access and exchange of information between stakeholders. One interviewer described it this
way: “Unfortunately organisations within the eHealth network tend to be guarded when it
comes to some information... The sector is not quite open to diffusion of information because
we do not know when information will be used as a market advantage against you when you
share it. So, information is heavily controlled within the sector.”
4.3.3.2. Opportunities
Collaboration between local organisations implementing projects at the devolved
government units and universities that have greater capacity and experience was described
as having shown potential to increase the knowledge flow within the network. One
participant described this collaboration as having improved the capacity of the counties to
monitor and evaluate projects that have been implemented at this level and to develop their
own projects. Collaboration also provided new channels for donor agencies to directly fund
projects at the level of local organisations: “By building those relationships to an extent that
the county comes to the local university for other things like monitoring and evaluation,
systems evaluation and even moving to other areas to do with implementation…some
counties have started to use it to aid the development of data repositories and we are starting
to see it spreading to other counties... Some have requested for disease registries like for sickle
cell and so on and so forth. The donors are really impressed by it to a point we are even looking
to roll it out to other countries like Lesotho, Swaziland and Nigeria and Ethiopia. It seems
donors have been looking for another way to reach the counties… how to make other public
institutions interact with government in a sustainable manner by increasing local capacity as
opposed to central government capacity. It is now even moving into other things, like working
with local private organisations in counties to foster a form of working relationships because
the current model, which is one of a foreign-based donor-funded NGOs coming in to
implement projects, then at the end of the project they close up and leave and no capacity is
56 | P a g e
left on the ground, is not creating many sustainable projects.”
Early end user engagement was another approach that was highlighted as having the chance
to increase the knowledge flow between stakeholders in the network. By engaging end users
this way, implementers have been able to improve ownership of projects at ground level and
even modify attitudes towards eHealth.
Blended training modules, hackathons, boot camps, and master’s degree programmes with
theoretical and practical modules for development and implementation of projects were
some of the successful solutions that were used to attempt to increase the human capacity
within the field of informatics, which is useful in eHealth.
Creating strong communities of practice was suggested as sure way to improve knowledge
flow within the sector. Creating formal channels of knowledge exchange, strengthening
implementer associations like KEHIA and providing financial, legal and human resource
capacity to protect intellectual property were some of the solutions suggested to increase
trust between stakeholders. By working together, stakeholders could better engage with law
makers and funders and therefore improve on the ability of the network to regulate
development and implementation activities. They would also be able to curate the varied
curricula being used in human resource training.
Technical working groups, stakeholder meet-ups and regular conferences were also said to
have been successful in the past in bringing players together to help update players in the
sector. Other successful methods referenced were online chat platforms like Whatsapp
groups and other online community of practice groups which allowed for knowledge gaps
between stakeholders to be bridged by leveraging technical capacity from anywhere in the
world. One participant described proper engagement in such communities as being more
critical to successful implementation of the projects than the technology itself. “For me the
success …is less about the technology as it’s not 100% perfect. Audits show there is room for
improvements. It’s more about the people driven by a sense of honesty and commitment to
even share their own knowledge. You will engage with the guy who leads the terminology
group - an expert within his own right ... always amazed at how he readily shares information
other people would hold back. There is a culture of truly sharing.”
57 | P a g e
Encouraging knowledge translation practices like adding value to data at the point of
collection by analysing it and presenting it in a format that can be utilised to inform decisions,
converting successful implementations into case studies and creating business models that
promote sustainability, were put forward as means of increasing the interaction and
knowledge flow between stakeholders. The conversion of successful and failed projects into
case studies was described as contributing to attracting skilled labour, investment, and
support to the network. By packaging knowledge in innovative new forms for example like
the formation of for-profit and not-for-profit organisations, stakeholders have been able to
increase funds available in the network and therefore create employment opportunities that
ultimately increase the community of practice. These benefits have not only been felt within
the local public health sector but also within the other sectors in Kenya and other countries
on the continent.
4.3.4. Summary of interview results
With regard to participant knowledge, the main themes that emerged had to do with how
knowledge was generated within the network with the subthemes focusing on where the
knowledge was obtained from and the outcome of the knowledge generation activities.
Knowledge translation refers to how knowledge generated was handled and converted into
a form that is available for utilisation by other stakeholders in the network. Tacit knowledge
generated did not always result in knowledge translation through the network. There were
more translation and transfer activities referenced than generation activities for explicit
knowledge.
The network structure was guided by organisations coming together in order to increase their
own implementation, research and technical capacity. The sector was described as donor
dependent meaning that funding played a significant role in determining the network
structure. Access to information, low research output, and human factors like negative
attitudes towards technology were identified as some of the challenges faced in the sector.
There were success stories that provided opportunities for improving knowledge flow moving
forward, for example, the success of county government and university collaborations,

58 | P a g e
increased examples of end user engagement early in development improving ownership of
projects, and the reported increase in blended training modules to increase capacity.

59 | P a g e
5. Discussion and Conclusion
5.1. Discussion
By using data from the review of literature and the qualitative interviews, the study sought
to examine the diffusion of eHealth knowledge in the Kenyan public health sector by
visualising the collaboration network structure and describing the flow of knowledge, its
challenges, and the opportunities to improve it from the point of view of eHealth actors.
One limitation described in previous SNA studies, whose networks were generated from
publications only, was that this approach was biased towards publication-oriented
organisations like universities while leaving out other organisations like industry players
(Chimhundu, de Jager & Douglas, 2015; de Jager, Chimhundu & Douglas, 2017). This study
generated two networks: a publication and an interview-based network.
The two types of networks generated were found to have similar stakeholder composition. In
the analysis of stakeholders by type, the study found that local and foreign-based government
stakeholders, universities, for-profit and not-for-profit organisations, research organisations
and hospitals were active within the eHealth implementation space in Kenya. Most of the
organisations identified were based either in Kenya or North America for both networks
generated. A similar picture is seen in other low to middle income countries where the
following types of stakeholders were identified by Hyder et al. (2010): “beneficiaries, central
government agencies, MOH, local governments, financiers, civil society organisations, and
health governing boards, provider organisations, professional organisations and health
workers, unions, suppliers”. One of the reasons that can be linked to also explain the
The publication and interview-based networks also showed similar network metrics. The
MOH, USAID, Moi University and the University of Nairobi were found to be among
organisations that had high degree centrality scores for the mHealth and health information
systems publication-based network and the interview-based networks. Differences between
the two networks were found when individual organisations were assessed. An example of
this is that more local government agencies, other than the MOH, were identified in the
interview-based networks than were identified from the publication-based network. There
were also isolated instances where local for-profit companies had a low degree centrality

60 | P a g e
score in the publication networks but had a higher score in the interview-based networks.
Findings from the interviews that show low research capacity as a challenge faced in the
sector, would explain low publication rates, and as such certain organisations may not be
present in publication-only networks.
Cohesion within the eHealth space was low, meaning most actors were not connected to each
other; this was the case for both the publication networks and interview-based network.
Networks with low cohesion scores have impeded knowledge flows (Wasserman & Faust,
1994; Vuori, Helander & Mäenpää, 2019). Protection of knowledge, and therefore prevention
of knowledge flow, was attributed to concerns about maintaining a market advantage in the
interviews.
Low network cohesion has also been associated with young networks where actors are not
yet familiar with each other (Patterson et al., 2013). The interview analysis suggests that the
eHealth development landscape in Kenya is in its early development phase, with low human
capacity and few formal channels of knowledge transfer. When organisations are not familiar
with each other this can be a hindrance to the creation of trust. There were also instances
described in the interviews where trust had been fostered by stakeholders having worked
together and with positive results; this resonates with the literature (Tiwari, 2015).
Interview analysis showed that poor flow of knowledge from the end users to the
implementers during the development phase and back to the users after development was a
challenge. Patient groups did not feature as stakeholders in the interviews. It is common for
patient groups not to be viewed as stakeholders by other actors in the network, yet it is legally
and socially appropriate for them to be part of the development process for technology that
they will use voluntarily or involuntarily (Eysenbach, 2008, as referenced by van Limburg et
al., 2011). This provides an example of an individual-level barrier to knowledge sharing within
the network which is dependent on the behaviour and deeds of individuals who are involved
in the network (Riege, 2005). The effects of such a barrier can have severe effects on project
success. Several participants described their own experiences that showed end user
engagement as critical for increasing uptake and ownership of eHealth projects with several
describing the success or failure of projects as having been dependent on early end user
engagement.
61 | P a g e
Another example of individual-level barriers identified was that knowledge shared was mainly
explicit rather than tacit knowledge (Riege, 2005). This study found there were more
references to tacit knowledge generation activities than there were for translation and
transfer activities of such knowledge. For explicit knowledge, there was a predominance of
transfer activities over generation activities, which could be linked to low levels of project
evaluation. Several participants expressed concern that once projects end, researchers
working with foreign organisations can leave with knowledge generated only being available
through publication, leaving low capacity in the implementation space. This type of barrier
presents a challenge to user access to and utilisation of knowledge.
Findings from the interview analysis showed that funding played an important role in how the
network was structured. In the characterisation of stakeholders for publication networks,
foreign-based universities and not-for-profit organisations made up the majority of the
organisations present. The interviews showed that some of the funding for early project
implementation came through the PEPFAR project or from USA-based donor agencies. Other
studies examining the Kenya eHealth landscape have shown that when programmes rely on
donor funding there are many different foreign and local organisations involved in the
implementation of eHealth, creating a lack of ownership of projects by the MOH, which in
turn leads to increased fragmentation and repetition (Njoroge et al., 2017). This has also been
described in other African countries where it poses a challenge to the efficient management
of the limited funds available (Sy, 2018). This is a network-specific barrier to knowledge
transfer which may be exacerbated by the geographical distance between stakeholders active
within the sector (Vuori, Helander & Mäenpää, 2019). The effect of this type of barrier was
illustrated in the interviews, with one participant decrying the difficulty of coordinating the
rectification of an acute problem during implementation, when the developers and
implementers were on different continents. A study assessing the state eHealth in Senegal
described a situation where due to a lack of communication and coordination, independently
funded developers created systems that have already been developed by other stakeholders
leading to duplication of projects (Sy, 2018). One suggestion given to solve this problem was
for not-for-profit organisations to work together with the Ministry of Health to streamline
approval of new projects so that it does not result in duplication (ibid). Such measures would,

62 | P a g e
however, be difficult in a network with low network cohesion due to the impeded flow of
knowledge (Wasserman & Faust, 1994).
Regarding the centrality measures, the MOH had the highest degree, betweenness and
closeness centrality scores. Findings from the interview analysis showed that funding
contributed to how organisations interacted therefore influencing the structure of the
network. Since most funding was programme-based, the MOH would be at the centre of the
network. One participant asserted that nothing happens in the eHealth sector without the
knowledge of the Ministry. The network metrics confirm that the MOH had the most
connections with the most actors, was closest to all knowledge regardless of where in the
network it was generated, and also had the largest opportunity to regulate information flows
within the network. Organisational knowledge barriers within the MOH would therefore
influence the whole network. Participants in the interview described a recent restructuring of
the MOH in March of 2019. The benefits expected were that this would facilitate more
efficient execution of its objectives especially in the implementation, monitoring and
evaluation of digital heath in Kenya. Such measures have been described as important in
preventing and dealing with organisation-based knowledge barriers (Riege, 2005).
Han, Koenig-Archibugi & Opsahl (2018) argue that high centrality in donor-funding driven
networks, places governments in a good position where they can more efficiently receive
diverse information from different sources creating the potential to select effective policies
while being able to resist the untested ones. This is can be particularly advantageous early in
the development phase of a technology field, especially since such knowledge can be more
beneficial to the larger network than a direct transfer of money and material resources (Han,
Koenig-Archibugi & Opsahl, 2018).
Such benefits have not been experienced by county governments. The few county
government health units that were identified from both networks in this study had low
degree, betweenness and closeness centrality scores. This means that they are not well
connected to the other stakeholders, do not receive the available knowledge efficiently and
have little influence on its control. Even though eHealth projects have been identified in most
counties in Kenya, urbanised counties have been found to dominate (Njoroge et al., 2017).
The interviews also pointed out that there was a challenge of capacity at county level to

63 | P a g e
manage the implementation of such projects. This shows that knowledge was not freely
flowing through the network but was localised in some parts of the network. One participant
noted that obtaining information in the network was dependent on luck and personal
relationships. This is not unique to this network and has been described in other networks
like the venture capital communities where such localised interactions lead to investments
been made in regions that had direct ties with the investors (Singh, 2005 citing Sorenson &
Stuart, 2001). This type of knowledge divide is a network-specific knowledge barrier and
increases with a decrease in cohesion in a network (Singh, 2005; Vuori, Helander & Mäenpää,
2019).
Opportunities to improve knowledge flow were also identified in the study. By increasing the
density of the collaboration networks, knowledge can flow more efficiently through the
network (Singh, 2005). Most of the counties identified in the network analysis had ties
connecting them to local universities that had higher centrality measures, such as the
University of Nairobi and Moi University. Participants in the study described a project that
had some success in increasing capacity at county government level through collaboration
with universities in those counties. In linking academic stakeholders with other stakeholders
active within the devolved administrative areas, there is an opportunity to improve
knowledge flows to fringe organisational units in the country. This type of knowledge network
fits into innovation models like the triple helix model where universities serve as potential
links between actors that can facilitate more efficient flow of knowledge within the entire
network (Mascarenhas, Ferreira & Marques, 2018). The process to facilitate the availability
of knowledge generated to other actors within a network has, however, been described as
complex, requiring coordination, correct knowledge management practices, and increased
capacity and commitment by all actors (van de Burgwal, van der Waal & Claassen, 2018; Vuori,
Helander & Mäenpää, 2019).
By combining quantitative social network analysis and qualitative analysis, the research
project was able to identify, characterise and visualise the structure of the relationships
between the stakeholders involved in the implementation of eHealth in the public sector (first
and second objectives). By assessing collaboration between the stakeholders, barriers in
knowledge flow were described and points of advantage and strength were identified (third

64 | P a g e
objective). The high centrality of the MOH is a point of strength. The importance of
strengthening counties within the decentralized public health system has been highlighted.
5.2. Study limitations and suggestions for future work
Time and resource restrictions meant the range of organisations included in the qualitative
interviews was limited, meaning that some views, especially that of organisations with low
degree centrality scores, were not captured. Future research should include such
organisations to aid in the development of solutions that are aligned to eHealth knowledge
management strategies. Future work could also look more deeply into the barriers and
opportunities to knowledge flow by assessing unsuccessful implementations and what has
influenced them over time.
Greater understanding of barriers and opportunities could also serve to facilitate the
development of more working partnerships with viable commercial models for eHealth
implementation that can reduce the overdependence on donor funding for the successful
implementation of eHealth projects in Kenya.
5.3. Conclusion
The eHealth network in Kenya is a young vibrant and growing one with varied participants
working in different strategic areas of eHealth implementation. The network was shown to
have many knowledge generation activities. The challenge was that much of the knowledge
generated is in tacit form in a network with low cohesion. The formal channels that have been
identified for knowledge transfer, have been shown in the literature to be better suited for
transfer of explicit knowledge (Su, Yang & Zhang, 2017). eHealth knowledge diffusion is
inhibited, creating a situation where stakeholders do not know what other stakeholders are
doing are not able to include end user views into their development plans. If eHealth in Kenya
is to achieve its function of assisting the health sector in improving the quality of life of
Kenyans, there should be a conscious effort to develop more informal knowledge
collaboration networks for the transfer of tacit knowledge. The high centrality of the MOH in
all eHealth networks in Kenya provides an opportunity in that the MOH can readily play the

65 | P a g e
role of coordinating local and foreign stakeholders to build collaboration networks that
capture and expand knowledge and capacity at county and national level.

66 | P a g e
References
Atkinson, R. & Flint, J. 2001. Accessing Hidden and Hard-to-Reach Populations: Snowball
Research Strategies. Social Research Update. 33(1):1-4.
Ballejos, L.C. & Montagna, J.M. 2008. Method for Stakeholder Identification in
Interorganizational Environments. Requirements engineering. 13(4):281-297.
Bazeley, P. & Jackson, K. 2013. Qualitative Data Analysis with Nvivo. Sage Publications
Limited.
Betjeman, T.J., Soghoian, S.E. & Foran, M.P. 2013. Mhealth in Sub-Saharan Africa.
International Journal of Telemedicine And Applications. 2013:6.
Bien, W., Marbach, J. & Neyer, F. 1991. Using Egocentered Networks in Survey Research. A
Methodological Preview on an Application of Social Network Analysis in the Area of Family
Research. Social Networks. 13(1):75-90.
Blaya, J.A., Fraser, H.S. & Holt, B. 2010. E-Health Technologies Show Promise in Developing
Countries. Health Affairs. 29(2):244-251.
Borgatti, S.P., Everett, M.G. & Freeman, L.C. 2002. Ucinet for Windows: Software for Social
Network Analysis. Havard Analystic Technologies. Lexington, Kentucky.
Borgatti, S.P., Everett, M.G. & Johnson, J.C. 2018. Analyzing Social Networks. Sage.
Carroll, N. & Richardson, I. 2017. Mapping a Careflow Network to Assess the Connectedness
of Connected Health. Health Informatics Journal. 25(1):106-125.
Chimhundu, C., de Jager, K. & Douglas, T. 2015. Sectoral Collaboration Networks for
Cardiovascular Medical Device Development in South Africa. Scientometrics. 105(3):1721-
1741.
Cowan, R. & Jonard, N. 2004. Network Structure and the Diffusion of Knowledge. Journal of
Economic Dynamics and Control. 28(8):1557-1575.

67 | P a g e
Cross, R. & Sproull, L. 2004. More Than an Answer: Information Relationships for Actionable
Knowledge. Organization Science. 15(4):446-462.
Cross, R., Borgatti, S.P. & Parker, A. 2001. Beyond Answers: Dimensions of the Advice
Network. Social Networks. 23(3):215-235.
Davis, E.C., Menser, T., Cerda Juarez, A., Tomaszewski, L.E. & Kash, B.A. 2019. Examining
Healthcare Systems: A Market Analysis for Kenya. European Journal of Training and
Development. 43(1/2):2-20.
de Jager, K., Chimhundu, C. & Douglas, T.S. 2017. The Medical Device Development
Landscape in South Africa: Institutions, Sectors and Collaboration. South African Journal of
Science. 113(5-6):1-8.
De Lange, D., Agneessens, F. & Waege, H. 2004. Asking Social Network Questions: A Quality
Assessment of Different Measures. Metodoloski Zvezki. 1(2):351.
Eames, K.T. & Keeling, M.J. 2002. Modeling Dynamic and Network Heterogeneities in the
Spread of Sexually Transmitted Diseases. Proceedings of The National Academy of Sciences.
99(20):13330-13335.
Eysenbach, G. 2008. Medicine 2.0: Social Networking, Collaboration, Participation,
Apomediation, and Openness. Journal Of Medical Internet Research. 10(3):e22.
GOK. 2010. Constitution of Kenya. Nairobi: Kenya Gazzette. Government Printer.
GOK. 2015a. Kenya Health Workforce Report: The Status of Healthcare Professionals in
Kenya, 2015. Kenya Gazette: GOK.
GOK. 2015b. The Kenya Health Enterprise Architecture, Kenya Gazette: Ministry of Health.
GOK. 2016. Standards and Guidelines for Electronic Medical Record Systems in Kenya, Kenya
Gazette: Ministry of Public Health and Sanitation.
GOK. 2017a. The Kenya Standards and Guidelines for Mhealth Systems. Kenya Gazzette:
Ministry of Health.

68 | P a g e
GOK. 2017b. Kenya National Ehealth Policy 2016-2030. Kenya Gazette. Ministry of Health
Halvari, S., Suominen, A., Jussila, J., Jonsson, V. & Bäckman, J. Eds. 2019. Conceptualization
of Hackathon for Innovation Management. The International Society for Professional
Innovation Management conference proceedings, P: 1-17.
Han, L., Koenig-Archibugi, M. & Opsahl, T. 2018. The Social Network of International Health
Aid. Social Science & Medicine. 206:67-74.
Hanneman, R.A. & Riddle, M. 2005. Introduction to Social Network Methods. University of
California Riverside.
Hansen, M.T. 1999. The Search-Transfer Problem: The Role of Weak Ties in Sharing
Knowledge across Organization Subunits. Administrative Science Quarterly. 44(1):82-111.
Harrell, M.C. & Bradley, M.A. 2009. Data Collection Methods. Semi-Structured Interviews
and Focus Groups. Rand National Defence Research institute. Santa Monica, Carlifornia.
Herden, A., Andrade, P., Albuquerque, A. & Farias, P. Eds. 2014. Agile Pdd: One Approach to
Software Development Using Bpmn. 11th Conference Applied Computing. Porto, Portugal.
Holmner, Å., Rocklöv, J., Ng, N. & Nilsson, M. 2012. Climate Change and Ehealth: A
Promising Strategy for Health Sector Mitigation and Adaptation. Global Health Action.
5(1):18428.
Hyder, A., Syed, S., Puvanachandra, P., Bloom, G., Sundaram, S., Mahmood, S., Iqbal, M.,
Hongwen, Z. et al. 2010. Stakeholder Analysis for Health Research: Case Studies from Low-
and Middle-Income Countries. Public Health. 124(3):159-166.
Jankauskienė, D. Ed. 2014. Integrated Transformations of E-Health Development-the
Perspective of Stakeholder Networks. 2nd International Conference on Innovation and
Entrepreneurship. Bangok: Academic Conferences and Publishing International Limited. 346-
349.

69 | P a g e
Joffe, H. 2012. "Thematic Analysis". In Qualitative Research Methods in Mental Health and
Psychotherapy: A Guide for Students and Practitioners. D.a.A.R.T. Harper, Ed.: John Wiley &
Sons. 209-233.
Kay, M., Santos, J. & Takane, M. 2011. Mhealth: New Horizons for Health through Mobile
Technologies. World Health Organization. 64(7):66-71.
Kazi, A.M., Carmichael, J.-L., Hapanna, G.W., Wangoo, P.G., Karanja, S., Wanyama, D.,
Muhula, S.O., Kyomuhangi, L.B. et al. 2017. Assessing Mobile Phone Access and Perceptions
for Texting-Based Mhealth Interventions among Expectant Mothers and Child Caregivers in
Remote Regions of Northern Kenya: A Survey-Based Descriptive Study. Journal of Medical
Internet Research; Public Health and Surveillance. 3(1).
KDHS. 2014. Health Survey 2014: Key Indicators. Kenya National Bureau of Statistics (KNBS)
and ICF Macro. Nairobi, Kenya.
Klarl, T. 2009a. Knowledge Diffusion and Knowledge Transfer: Two Sides of the Medal. ZEW-
Centre for European Economic Research Discussion Paper. (09-080).
Klarl, T. 2009b. Knowledge Diffusion Processes: Theoretical and Empirical Considerations,
PhD. thesis, Augsburg: University of Augsburg.
KNBS. 2016. Kenya Stepwise Survey for Non-Communicatble Disease Risk Factors 2015.
Kenya Gazette: KNBS.
KNBS. 2019. Kenya Population and Housing Census. Volume 1: Polulation by County and
Sub-county. Kenya Gazette.
Lang, A. & Mertes, A. 2011. E-Health Policy and Deployment Activities in Europe.
Telemedicine and e-Health. 17(4):262-268. DOI:10.1089/tmj.2010.0174.
Luke, D.A. & Harris, J.K. 2007. Network Analysis in Public Health: History, Methods, and
Applications. Annual Review of Public Health. 28:69-93.

70 | P a g e
Mars, M. & Scott, R.E. 2010. Global E-Health Policy: A Work in Progress. Health Affairs.
29(2):237-243.
Mascarenhas, C., Ferreira, J.J. & Marques, C. 2018. University–Industry Cooperation: A
Systematic Literature Review and Research Agenda. Science and Public Policy. 45(5):708-
718.
Mu, J., Tang, F. & MacLachlan, D.L. 2010. Absorptive and Disseminative Capacity: Knowledge
Transfer in Intra-Organization Networks. Expert Systems with Applications. 37(1):31-38.
Murphy, E., Dingwall, R., Greatbatch, D., Parker, S. & Watson, P. 1998. Qualitative Research
Methods in Health Technology Assessment: A Review of the Literature. Health Technology
Assessment. 2(16):iii-ix, 1-274.
Newcomer, K.E., Hatry, H.P. and Wholey, J.S., 2015. Conducting semi-structured
interviews. Handbook of practical program evaluation, 492.
Nielsen, J.A. & Mengiste, S.A. 2014. Analysing the Diffusion and Adoption of Mobile It across
Social Worlds. Health Informatics Journal. 20(2):87-103.
Njoroge, M., Zurovac, D., Ogara, E.A., Chuma, J. & Kirigia, D. 2017. Assessing the Feasibility
of Ehealth and Mhealth: A Systematic Review and Analysis of Initiatives Implemented in
Kenya. BioMed Central Research Notes. 10(1):90.
Odhiambo, M.E. 2015. A Framework for Implementation of E-Health in Kenya Public
Hospitals. Strathmore University.
Ouma, S. & Herselman, M. 2008. E-Health in Rural Areas: Case of Developing Countries.
International Journal of Biological and Life Sciences. 4(4):194-200.
Owolabi, B.S., Odugbemi, T.O., Odeyemi, K.A. & Onigbogi, O.O. 2018. Mhealth: Knowledge
and Use among Doctors and Nurses in Public Secondary Health-Care Facilities of Lagos,
Nigeria. Journal of Clinical Sciences. 15(1):27.

71 | P a g e
Patterson, P.D., Pfeiffer, A.J., Weaver, M.D., Krackhardt, D., Arnold, R.M., Yealy, D.M. &
Lave, J.R. 2013. Network Analysis of Team Communication in a Busy Emergency
Department. BioMed Central Health Services Research. 13(1):109.
Perkins, J.M., Subramanian, S. & Christakis, N.A. 2015. Social Networks and Health: A
Systematic Review of Sociocentric Network Studies in Low-and Middle-Income Countries.
Social Science & Medicine. 125:60-78.
Ragaban, N. 2016. Ehealth Strategy Development and Implementation: Interrelated Factors
Impacting the Implementation of a National Ehealth Strategy. ResearchSpace. Auckland.
Reagans, R. & McEvily, B. 2003. Network Structure and Knowledge Transfer: The Effects of
Cohesion and Range. Administrative Science Quarterly. 48(2):240-267.
Riege, A. 2005. Three-Dozen Knowledge-Sharing Barriers Managers Must Consider. Journal
Of Knowledge Management. 9(3):18-35.
Schipper, D. & Spekkink, W. 2015. Balancing the Quantitative and Qualitative Aspects of
Social Network Analysis to Study Complex Social Systems. Complexity, Governance &
Networks. 2(1):5-22.
Scott, R., Mars, M. & Hebert, M. 2012. How Global Is ‘E-Health’and ‘Knowledge Translation’?
In Technology Enabled Knowledge Translation for Ehealth. Springer. 339-357.
Serrat, O. 2017. Social Network Analysis. In Knowledge Solutions. Springer. 39-43.
Shakya, H.B., Christakis, N.A. & Fowler, J.H. 2017. An Exploratory Comparison of Name
Generator Content: Data from Rural India. Social Networks. 48:157-168.
Singh, J. 2005. Collaborative Networks as Determinants of Knowledge Diffusion Patterns.
Management Science. 51(5):756-770.
Sorenson, O. & Stuart, T.E. 2001. Syndication Networks and the Spatial Distribution of
Venture Capital Investments. American Journal of Sociology. 106(6):1546-1588.

72 | P a g e
Su, J., Yang, Y. & Zhang, N. 2017. Measurement of Knowledge Diffusion Efficiency for the
Weighted Knowledge Collaboration Networks. Kybernetes. 46(4):672-692.
Sy, A. 2018. Current Status of E-Health in Senegal and Perspectives for Development.
International Journal of Computer (IJC). 28(1):154-159.
Tiwari, S.R. 2015. Knowledge Integration in Government–Industry Project Network.
Knowledge and Process Management. 22(1):11-21.
Valente, T.W. & Pitts, S.R. 2017. An Appraisal of Social Network Theory and Analysis as
Applied to Public Health: Challenges and Opportunities. Annual Review of Public Health.
38:103-118.
van de Burgwal, L., van der Waal, M. & Claassen, E. 2018. Leveraging Academic Knowledge
in the Innovation Ecosystem.
van Limburg, M., van Gemert-Pijnen, J.E., Nijland, N., Ossebaard, H.C., Hendrix, R.M. &
Seydel, E.R. 2011. Why Business Modeling Is Crucial in the Development of Ehealth
Technologies. Journal of Medical Internet Research. 13(4):e124.
Vuori, V., Helander, N. & Mäenpää, S. 2019. Network Level Knowledge Sharing: Leveraging
Riege’s Model of Knowledge Barriers. Knowledge Management Research and Practice.
17(3):253-263.
Wasserman, S. & Faust, K. 1994. Social Network Analysis: Methods and Applications.
Cambridge university press.
Whimp, K. 2012. Devolution without Disruption : Pathways to a Successful New Kenya.
Nairobi, Kenya: The World Bank.
WHO. 2006. Building Foundations for E-Health: Progress of Member States. A Report of the
Global Observatory for Ehealth. Geneva: G.W.H. Organisation. Available:
http://www.who.int/iris/handle/10665/43599. (Accessed: 18th October 2019).

73 | P a g e
WHO. 2011. Mhealth: New Horizons for Health through Mobile Technologies: Second Global
Survey on Ehealth. WHO Library Cataloguing-in-Publication Data.
WHO. 2015. Kenya: Who Statistical Profile. Country statistics and global health estimates by
WHO and UN partners (Last updated: January 2015).
WHO. 2016a. Global diffusion of eHealth: making universal health coverage achievable.
Report of the third global survey on eHealth. Global Observatory for eHealth, Geneva: World
Health Organization.
WHO. 2016b. Kenya: Country Indicators. Kenya: WHO. Available:
https://www.who.int/countries/ken/en/ (Accessed: 18th October 2019).

74 | P a g e
Appendix 1: Abbreviations of organisation names
MHealth
Name of Organisation ABREVIATIONS
Organisation type
and location
AMPATH AMPATH Local not-for-profit
Colombia University CU Foreign university
University Of North Carolina UNC Foreign university
World Bank WB Foreign not-for-profit
George Town University GU Foreign university
University of California UCSD Foreign university
United States Agency for International Development USAID Foreign not-for-profit
Massachusetts General Hospital MGH Local hospital
Moi University MU Local university
Indiana University IU Foreign university
Massachusetts Institute of Technology MIT Foreign university
Harvard University HU Foreign university
Mbarara University of Science and Technology MUST Foreign university
University of Nairobi UON Local university
University of Manitoba UOM Foreign university
St. Pauls Hospital University of British Colombia SPHUOBC Foreign hospital
York University YU Foreign university
University of Washington UW Foreign university
McMaster University MCMU Foreign university
Public Health Agency of Canada PHAC
Foreign research
organisation
British Colombia Centre For Disease Control BCCDC
Foreign research
organisation
Karolinska Institute KI Foreign not-for-profit
AMREF Health Africa AMREF Local not-for-profit
University of British Colombia UOBC Foreign university
Weltel WELTEL Local not-for-profit
University of Ottawa UOO Foreign university
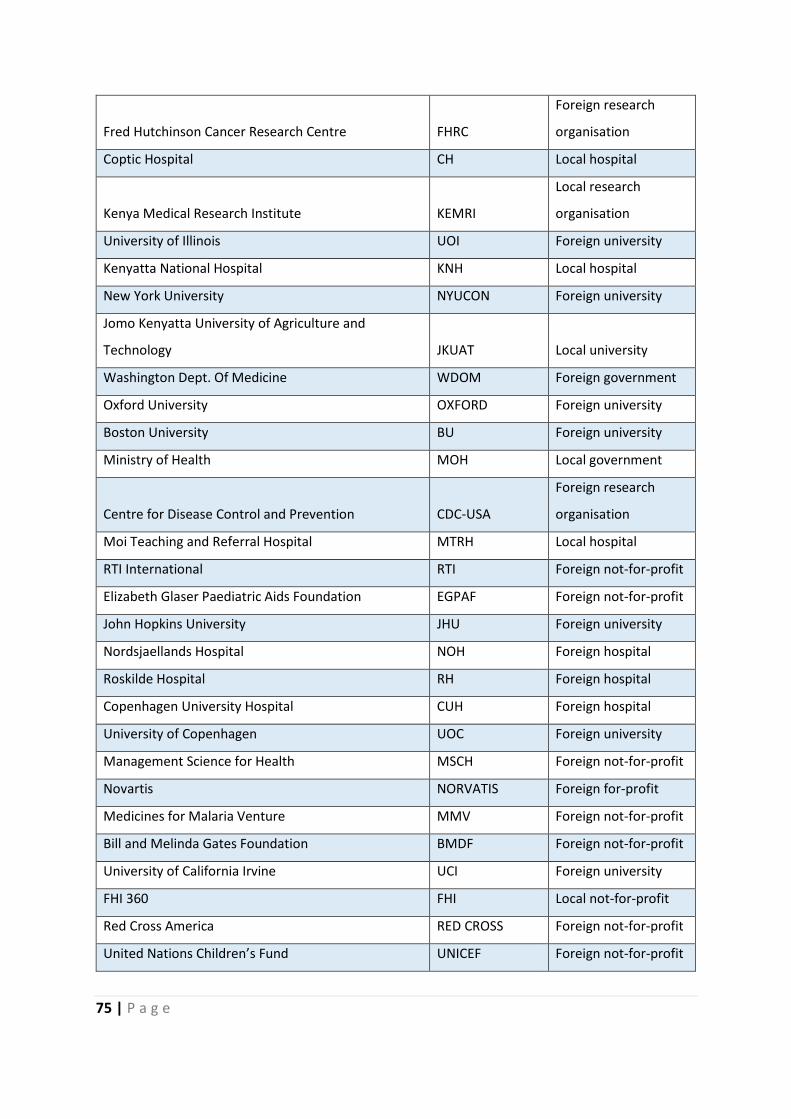
75 | P a g e
Fred Hutchinson Cancer Research Centre FHRC
Foreign research
organisation
Coptic Hospital CH Local hospital
Kenya Medical Research Institute KEMRI
Local research
organisation
University of Illinois UOI Foreign university
Kenyatta National Hospital KNH Local hospital
New York University NYUCON Foreign university
Jomo Kenyatta University of Agriculture and
Technology JKUAT Local university
Washington Dept. Of Medicine WDOM Foreign government
Oxford University OXFORD Foreign university
Boston University BU Foreign university
Ministry of Health MOH Local government
Centre for Disease Control and Prevention CDC-USA
Foreign research
organisation
Moi Teaching and Referral Hospital MTRH Local hospital
RTI International RTI Foreign not-for-profit
Elizabeth Glaser Paediatric Aids Foundation EGPAF Foreign not-for-profit
John Hopkins University JHU Foreign university
Nordsjaellands Hospital NOH Foreign hospital
Roskilde Hospital RH Foreign hospital
Copenhagen University Hospital CUH Foreign hospital
University of Copenhagen UOC Foreign university
Management Science for Health MSCH Foreign not-for-profit
Novartis NORVATIS Foreign for-profit
Medicines for Malaria Venture MMV Foreign not-for-profit
Bill and Melinda Gates Foundation BMDF Foreign not-for-profit
University of California Irvine UCI Foreign university
FHI 360 FHI Local not-for-profit
Red Cross America RED CROSS Foreign not-for-profit
United Nations Children’s Fund UNICEF Foreign not-for-profit

76 | P a g e
Kit Royal Tropical Institute KIT Foreign for-profit
Med Africa MEDA Local for-profit
Freedom from Fistula Foundation FFF Foreign not-for-profit
Jamaa Mission Hospital JMH Local hospital
MPesa Foundation MF Local not-for-profit
ZMQ Development ZMQ Foreign not-for-profit
Humanist Institute for Cooperation with Developing
Countries HIVOS Foreign not-for-profit
Knowledge Performance Now Health KPN Foreign for-profit
Liverpool Voluntary Counselling and Testing Health LVCT Local not-for-profit
Safaricom SAF Local for-profit
Non-Communicable Disease Alliance of Kenya NCDAK Local not-for-profit
Africa Institute for Health and Development AIHD Local not-for-profit
Danya International Inc. DII Foreign not-for-profit
Applied Innovations and Development Partners AIDP Foreign not-for-profit
Mbagathi District Hospital MDH Local hospital
University of Amsterdam UOA Foreign university
IAfya IAFYA Local for-profit
International Federation of Pharmaceutical
Manufacturers and Associations IFPMA Foreign not-for-profit
Global Business Coalition On HIV, Tb, Malaria GBC Foreign not-for-profit
Sproxil SPROXIL Foreign for-profit
Kenya Pharmacy and Poisons Board PPB Local government
Orange Kenya ORANGE Local for-profit
M-Pedigree M-PED Local not-for-profit
NetHope Inc. NETHOPE Foreign not-for-profit
Sana Health SANA Foreign not-for-profit
World Vision International WV Foreign not-for-profit
UAP Insurance UAP Local for-profit
Changamka Micro health Limited CML Local for-profit
United Nations Development Programme UNDP Foreign not-for-profit
Britam Holdings Limited BRITAM Local for-profit

77 | P a g e
Intrahealth International IH Foreign not-for-profit
Kilifi County KC Local government
University of California San Francisco UCSF Foreign university
Kisumu Provincial Hospital KPH Local hospital
Pathfinder International PI Foreign not-for-profit
Visa Inc. VISA Foreign for-profit
Narok County Government NCG Local government
Vecna Charitable Trust VCT Foreign for-profit
University of Pennsylvania UOP Foreign university
Population Council PC Foreign not-for-profit
Innovative Support to Emergency Diseases and
Disasters INSTEDD Foreign not-for-profit
Saving Lives at Birth SLB Foreign not-for-profit
Grand Challenges Canada GCC Foreign not-for-profit
United Nations High Commissioner for Refugees UNHCR Foreign not-for-profit
Regenstrief Institute Inc. RII Foreign not-for-profit
VA HSR AND D CENTRE On Implementing Evidence
Based Medicine VA HSR&D Foreign not-for-profit
Open Data Kit Community ODK Foreign for-profit
Population Services International PS Foreign not-for-profit
Marie Stoppes International MSK Foreign not-for-profit
National Aids & STI Control Programme NASCOP Local government
Kenya Long Distance Drivers and Allied Workers
Union KLDAWU Local not-for-profit
International Corridor for Migration ICM Local not-for-profit
North star Alliance NA Local for-profit
Medic Mobile MM Foreign not-for-profit
African Palliative Care Association APCA Foreign not-for-profit
Kisumu Medical and Education Trust KMET Local not-for-profit
Plan International PLI Foreign not-for-profit
FIO Cooperation FN Foreign for-profit
Japan International Cooperation Agency JAICA Foreign not-for-profit

78 | P a g e
Japan Science Technology Agency JSTA Foreign not-for-profit
Nagasaki University NU Foreign university
Kenya Medical Supplies Agency KEMSA Local government
London School of Tropical Medicine LSTM Foreign university
University of Utah UU Foreign university
University Of North Carolina UNC Foreign university
Brigham And Women Hospital BWH Foreign hospital
Pharm Access Foundation PAF Foreign not-for-profit
Jacaranda Health JH Local hospital
University of Leeds UL Foreign university
Mwapo Health Development Group MWAPO Local not-for-profit
Duke University DU Foreign university
University of Florida UOFL Foreign university
British Colombia Women’s Hospital BCWH Foreign hospital
Human Science Research Council Sa HSRCASA Foreign not-for-profit
University of Witwatersrand WITS Foreign university
Path PATH Foreign not-for-profit
National University of Ireland NUI Foreign university
University of Heidelberg UH Foreign university
Health E-Net Limited H-NET Local for-profit
Strathmore University SU Local university
Burnet Institute BI
Foreign research
organisation
International Centre for Reproductive Health ICRH Foreign not-for-profit
Ghent University GHENT Foreign university
Latrobe University LU Foreign university
University Of San Francisco USF Foreign university
Aga Khan University Hospital Nairobi AGA-N Local hospital
Africa Population and Health Research Centre APHRC
Local research
organisation
University of California Berkley UCB Foreign university
University of Cape Town UCT Foreign university

79 | P a g e
Mobile ODT MODT Foreign for-profit
Nairobi County N Local government
SOS Children’s Villages International SOS Local not-for-profit
Family Health Options FHO Local not-for-profit
Icahn University ICA Foreign university
Emory University EMORY Foreign university
University of Memphis UOME Foreign university
University of Michigan MICHIGAN Foreign university
Realtime Associates RA Foreign for-profit
World Health Organisation WHO Foreign not-for-profit
University of Kwa Zulu Natal UKZN Foreign university
City University Of New York CUNY Foreign university
New York Psychiatry Institute NYPI Foreign university
University of Strathclyde SCLYDE Foreign university
University College London UCL Foreign university
National Institute for Health Research Biomedical
Research Centre NIHR
Foreign research
organisation
Gartnavel University Hospital GUH Foreign hospital
Kitale Hospital KITALE Local hospital
Telkom Kenya TELKOM Foreign for-profit
Baobab circle BAOBAB Local for-profit
Flare Kenya FLARE Local for-profit
Johnson And Johnson JJ Foreign for-profit
Isikcure ISIK Local for-profit
Boehringer Ingelheim BI Foreign for-profit
Ashoka ASHOKA Foreign not-for-profit
Mydawa MY DAWA Local for-profit
Ion Kenya ION Local for-profit
Health Information Systems
Name of Organisation Abbreviations
Organisation type
and location

80 | P a g e
AMPATH AMPATH Local not-for-profit
United States Agency for International Development USAID Foreign not-for-profit
Moi University MU Local university
Indiana University IU Foreign University
University of Nairobi UON Local university
Ministry of Health MOH Local government
Moi Teaching and Referral Hospital MTRH Local hospital
Regenstrief Institute Inc. RII Foreign not-for-profit
VA HSR AND D CENTRE On Implementing Evidence
Based Medicine VA HSR&D Foreign government
University of Washington UW Foreign University
Kenya Medical Research Institute KEMRI
Local research
organisation
World Bank WB Foreign not-for-profit
Amref Health Africa AMREF Local not-for-profit
Safaricom SAF Local for-profit
Kenya Medical Supplies Agency KEMSA Local government
Colombia University CU Foreign University
Japan International Cooperation Agency JAICA Foreign not-for-profit
University of Toronto UT Foreign University
Mosoriot Rural Health Centre MRHC Local hospital
Yale University YALE Foreign University
Uamuzi Bora UB Foreign not-for-profit
University of Durham UOD Foreign University
British Antarctic Survey Medical Unit BASMU Foreign not-for-profit
ABT Associates Company ABT Foreign not-for-profit
University of Oslo OSLO-U Foreign University
Savanah Informatics SI Local for-profit
Rockefeller Foundation RF Foreign not-for-profit
Clinton Health Access Initiative CHAI Foreign not-for-profit
HP East Africa HP.EA Foreign for-profit
Strathmore University SU Local university

81 | P a g e
Kajiado District Hospital KDH Local hospital
Société Europeanness des Satellites SES Foreign for-profit
MicroClinic Technology Limited MTL Foreign not-for-profit
Ogra Foundation OF Foreign not-for-profit
International Training and Education Centre for
Health I-TECH Foreign not-for-profit
Elizabeth Glaser Paediatric Aids Foundation EGPAF Foreign not-for-profit
Centre for Disease Control and Prevention CDC-USA
Foreign research
organisation
University of California San Francisco UCSF Foreign University
Linkoping University LPU Foreign University
University of Amsterdam UOA Foreign University
Icahn University ICA Foreign University
Family Aids Care & Education Services FACES Local not-for-profit
Doctors Without Borders MSF Foreign not-for-profit
Lake hub Kisumu LHK Local not-for-profit
Africa Field Epidemiology Network AFENET Local not-for-profit
Brown University BROWN Foreign University
Vimak Company Limited VIMAK Local for-profit
University of Oxford OXFORD Foreign University
Intellisoft Limited INTELLISOFT Local for-profit
Innovative Canadians For Change
ICFOREIGN
UNIVERSITYC Foreign not-for-profit
University of Alberta UAL Foreign University
Ryerson University RYU Foreign University
Kenyatta National Hospital KNH Local hospital
National Aids & STI Control Programme NASCOP Local government
FIO Cooperation FN Foreign for-profit
Iridium Interactive IRIDI Local for-profit
Savannah Informatics SI Local for-profit
University of Kansas UOK Foreign hospital
University of Missouri UOMI Foreign University
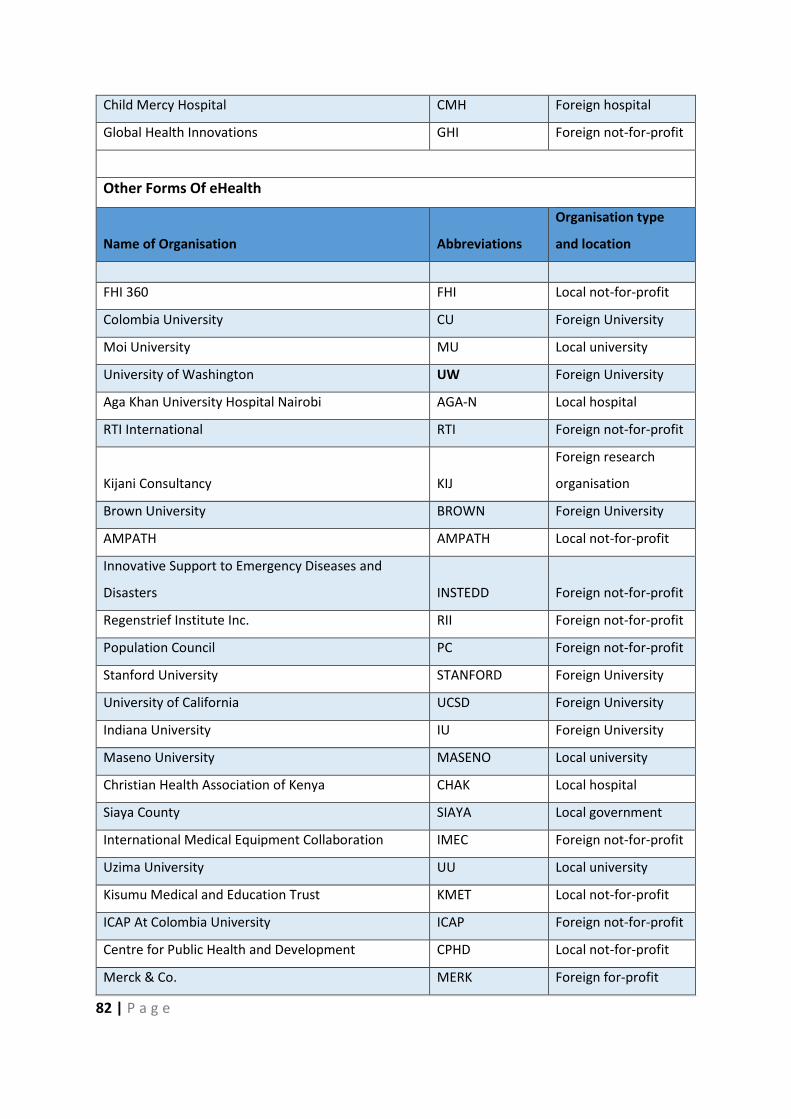
82 | P a g e
Child Mercy Hospital CMH Foreign hospital
Global Health Innovations GHI Foreign not-for-profit
Other Forms Of eHealth
Name of Organisation Abbreviations
Organisation type
and location
FHI 360 FHI Local not-for-profit
Colombia University CU Foreign University
Moi University MU Local university
University of Washington UW Foreign University
Aga Khan University Hospital Nairobi AGA-N Local hospital
RTI International RTI Foreign not-for-profit
Kijani Consultancy KIJ
Foreign research
organisation
Brown University BROWN Foreign University
AMPATH AMPATH Local not-for-profit
Innovative Support to Emergency Diseases and
Disasters INSTEDD Foreign not-for-profit
Regenstrief Institute Inc. RII Foreign not-for-profit
Population Council PC Foreign not-for-profit
Stanford University STANFORD Foreign University
University of California UCSD Foreign University
Indiana University IU Foreign University
Maseno University MASENO Local university
Christian Health Association of Kenya CHAK Local hospital
Siaya County SIAYA Local government
International Medical Equipment Collaboration IMEC Foreign not-for-profit
Uzima University UU Local university
Kisumu Medical and Education Trust KMET Local not-for-profit
ICAP At Colombia University ICAP Foreign not-for-profit
Centre for Public Health and Development CPHD Local not-for-profit
Merck & Co. MERK Foreign for-profit

83 | P a g e
Machakos Hospital MACHA Local university
Kenyatta National Hospital KNH Local hospital
Ministry of Health MOH Local government
Kenya Medical and Dentists Board KMPDB Local for-profit
Kenya Medical Association KMA Local for-profit
Kenya Paediatrics Association KPA Local for-profit
Emergency Medicine Kenya EMK Local not-for-profit
Daktari Kenya DK Local for-profit
Chanjo Plus CHANJO Local for-profit
Virginia Commonwealth University VCU Foreign University
University of Nairobi UON Local university
University of Victoria UOV Foreign University
Moi Teaching and Referral Hospital MTRH Local hospital
Orbis International ORBIS Foreign not-for-profit
Cisco Systems CISCO Foreign for-profit
Kijabe Mission Hospital KIJABE Local hospital
Telemedicine
Name of Organisation Abbreviations
Organisation type
and location
Aga Khan University Hospital Nairobi AGA-N Local Hospital
Aga Khan University Hospital Mombasa AGA-M Local Hospital
Aga Khan University Hospital Dar es salaam AGA-D Foreign Hospital
Aga Khan University Hospital Kisumu AGA-K Local Hospital
University of Pennsylvania UOP Foreign University
Ministry of Health MOH Local government
Safaricom SAF Local for-profit
Penn State University PENN Foreign University
United Nations Industrial Development Organisation UNIDO Foreign not-for-profit
National Collegiate for Inventors and Innovators
Alliance NCIIA Foreign not-for-profit
Child and Youth Empowerment Centre CYEC Local not-for-profit

84 | P a g e
Lehigh University LU Foreign University
mCare MCARE Local for-profit
AMD Global Telemedicine, Inc. AMD Foreign for-profit
Paul Chester Children's Hope Foundation PCCHF Foreign not-for-profit
Interview
Name of Organisation Abbreviations
Organisation type
and location
Amref Health Africa AMREF Local not-for-profit
University of Nairobi UON Local university
University of Manitoba UOM Foreign University
Weltel WELTEL Local not-for-profit
Philips PHILIPS Foreign for-profit
Strathmore University SU Local university
Intellisoft Limited INTELLISOFT Local for-profit
Ministry of Health MOH Local government
Moi University MU Local university
Medic Mobile MM Foreign not-for-profit
mHealth Kenya MH Local for-profit
Safaricom Limited SAF Local for-profit
Nailab NAILAB Local not-for-profit
Afya Research Africa ARA Local not-for-profit
Ubuntu Africa UBUNTUA Local for-profit
Michigan School of Law MSL Foreign University
United States Agency for International Development USAID Foreign not-for-profit
Measure Evaluation MEASURE Foreign not-for-profit
Turkana County Government TURKANA Local government
Department for International Development DFID Foreign not-for-profit
University of Santa Clara SANTA CLARA Foreign University
Duke University DU Foreign University
Google GOOGLE Foreign for-profit
National Aids Control Council NACC Local government

85 | P a g e
Cochrane Library COCHRANE Foreign not-for-profit
Joanna Briggs Institute JBI Foreign not-for-profit
University of Adelaide UAD Foreign University
Us Government USG Foreign government
Savanah Informatics SI Local for-profit
World Health Organisation WHO Foreign not-for-profit
United Nations Children's Fund UNICEF Foreign not-for-profit
John Snow Inc. JSI Foreign for-profit
Kenya Medical Supplies Agency KEMSA Local government
University of Oslo OSLO-U Foreign University
East African Community Ministry of Health E-MOH Foreign government
Swedish International Development Agency SIDA Foreign not-for-profit
AMPATH AMPATH Local not-for-profit
Uasin Gishu County UASIN Local government
Baringo County BARINGO Local government
Jomo Kenyatta University of Agriculture and
Technology JKUAT Local university
National Institute for Medical Research NIMRI
Foreign research
organisation
Makerere University MAKERERE Foreign University
Africa Centre For Systematic Reviews and Knowledge
Translation ACSRKT Foreign not-for-profit
Mombasa PGH CPGH Local hospital
Centre for Disease Control and Prevention CDC-USA
Foreign research
organisation
University of Washington UW Foreign University
International Training and Education Centre for
Health I-TECH Foreign not-for-profit
Palladium Group PALLADIUM Foreign for-profit
Pharmacy and Poisons Board PPB Local government
German Society for International Development GIZ Foreign not-for-profit
Nairobi County N Local government

86 | P a g e
Africa Institute for Health Development AIHD Local not-for-profit
Aga Khan University Hospital Nairobi AGA-N Local hospital
National Aids & STI Control Programme NASCOP Local government
Elizabeth Glaser Paediatric Aids Foundation EGPAF Foreign not-for-profit
Family Aids Care & Education Services FACES Local not-for-profit
Christian Health Association of Kenya CHAK Local hospital
ICAP At Colombia University ICAP Foreign not-for-profit
Kenyatta University KU Local university
University of California San Francisco UCSF Foreign University
Aura Safira AS Local for-profit
Pensoft PENSOFT Local for-profit
Funsoft FUNSOFT Local for-profit
World Bank WB Foreign not-for-profit
Moi Teaching and Referral Hospital MTRH Local hospital
Vanderbilt University VU Foreign University
Indiana University IU Foreign University
Purdue University PU Foreign University
Regenstrief Institute Inc. RII Foreign not-for-profit
Kenya Health Informatics Associations KEHIA Local not-for-profit
Kenya Medical Research Institute KEMRI
Local research
organisation
Ministry Of ICT MOICT Local government
ABT Associates ABT Foreign not-for-profit
Maseno University MASENO Local university
Kisumu County KISUMU Local government
University of Kabyanga KABYA U Local university
Kericho County KERICHO Local government
Rongo University RONGO Local university
Migori County MIGORI Local government
Masinde Muliro University MASINDE Local university
Kakamega County KAKAMEGA Local government
Astra Zeneca ASTRA-Z Foreign for-profit

87 | P a g e
Tech Care for All TC4A Foreign for-profit
CarePay CAREPAY Foreign for-profit
Afya Jijini AJ Foreign not-for-profit
Jhpiego JHPIEGO Foreign not-for-profit
Centre for International Development CICD Foreign not-for-profit
Kijabe Mission Hospital KIJABE Local hospital
St. Joseph Hospital SJH Local hospital
Centre for Health Solutions CHS Local not-for-profit
Intrahealth International INTRAH Foreign not-for-profit
University of Bergen BERGEN Foreign University
University of Gondar GONDAR Foreign University
University of Rwanda RWANDA Foreign University
Kenyatta National Hospital KNH Local hospital
Dalberg Research Limited DALBERG Foreign for-profit
Totohealth TOTO Local for-profit
GSMA GSMA Foreign not-for-profit