KHAYELITSHA - MITCHELLS PLAIN - City of Cape Town
198
1 | Page
-
Upload
khangminh22 -
Category
Documents
-
view
3 -
download
0
Transcript of KHAYELITSHA - MITCHELLS PLAIN - City of Cape Town

1 | P a g e

2 | P a g e
CONTENTS
1 INTRODUCTION ................................................................................................................... 10
Background ................................................................................................................. 10
Structure of the District SDF Suite of Documents .................................................... 10
Baseline and Analysis Report .................................................................................... 10
Key Informants and Limitations of the Baseline and Analysis Report .................. 13
A. STATE OF THE POPULATION ............................................................................................ 14
2 DEMOGRAPHICS ................................................................................................................ 15
Overview ...................................................................................................................... 15
Population ................................................................................................................... 16
Households .................................................................................................................. 23
Employment ................................................................................................................ 26
Income ......................................................................................................................... 29
B. STATE OF THE ENVIRONMENT .............................................................................................. 0
3 NATURAL AND HERITAGE ENVIRONMENT .......................................................................... 1
Status Quo, Trends and Patterns ................................................................................ 1
Key Development Pressure and Opportunities ...................................................... 21
Spatial Implications for District Plan ......................................................................... 24
C. STATE OF THE BUILT ENVIRONMENT ................................................................................ 28
4. LAND USE AND DEVELOPMENT TRENDS ........................................................................... 29
Residential.................................................................................................................... 31
Industrial ....................................................................................................................... 32
Retail and Office ......................................................................................................... 33
Mixed Use ..................................................................................................................... 33
Home-Based Enterprises ............................................................................................ 34
Agricultural Land and Smallholdings ....................................................................... 34
Monwabisi & Mnandi Coastal Areas ....................................................................... 34
Supportive Land Uses ................................................................................................. 34
Development Pressures.............................................................................................. 35
Vacant land ................................................................................................................ 35
Key Opportunities and Constraints .......................................................................... 38
4 TRANSPORT AND ACCESSIBILTY ........................................................................................ 39
Introduction ................................................................................................................. 39
Strategic Parameters & Informants .......................................................................... 40

3 | P a g e
State of Public Transport ............................................................................................ 42
State of Road Infrastructure ...................................................................................... 52
State of Freight ............................................................................................................ 55
Travel Patterns ............................................................................................................. 57
Key Opportunities and Constraints .......................................................................... 66
5 INFRASTRUCTURE ................................................................................................................. 67
Electricity ...................................................................................................................... 67
Water ............................................................................................................................ 73
Stormwater and Sanitation ....................................................................................... 76
Solid waste ................................................................................................................... 80
Key Opportunities and Constraints .......................................................................... 82
6 HUMAN SETTLEMENTS ......................................................................................................... 83
Housing Overview ....................................................................................................... 83
Housing Demand ........................................................................................................ 90
Housing Supply ............................................................................................................ 92
Key Opportunities and Constraints .......................................................................... 95
7 PUBLIC FACILITIES ................................................................................................................ 98
State of Supply and Demand ................................................................................... 98
Key Observations ...................................................................................................... 110
Key Opportunities and Constraints ........................................................................ 110
D. STATE OF THE ECONOMY................................................................................................. 112
4 THE ECONOMY ................................................................................................................. 113
Macro-Economy ....................................................................................................... 113
District Analysis .......................................................................................................... 118
The Informal Economy ............................................................................................. 125
5 PROPERTY MARKET ........................................................................................................... 129
Measuring Property Market Performance ............................................................. 129
Key Observations and Trends ................................................................................. 130
KEY OPPORTUNITIES AND CONSTRAINTS ................................................................ 145
E. SYNTHESIS ......................................................................................................................... 147
6 RISKS ................................................................................................................................... 148
Guiding Policy on Risk Management .................................................................... 148
Risks in Khayelitsha, Mitchells Plain & Greater Blue Downs ................................. 150
Key Opportunities and Constraints ........................................................................ 165

4 | P a g e
List of figures
Figure 1.1: District SDF Review process summary ...................................................................... 10
Figure 1.2: Building integrated communities (TOD Strategic Framework, 2016) .................. 11
Figure 2.1: Overview of Khayelitsha, Mitchells Plain & Greater Blue Downs District key
demographic statistics (Census, 2001; Census, 2011; CCT estimates, 2018 & HIS Markit, 2019)
......................................................................................................................................................... 15
Figure 2.2: District versus metropolitan population growth trends (formal, informal and
backyard settlements), 2001–2018 (Census, 2001 & 2011 & CCT roof count, 2018) ........... 17
Figure 2.3: Khayelitsha, Mitchells Plain & Greater Blue Downs District gross population
density (persons/km2) distribution across populated areas, 2018 .......................................... 19
Figure 2.4: Kahyelitsha, Mitchells Plain & Greater Blue Downs District population change
across populated areas, 2011–2018 ........................................................................................... 20
Figure 2.5: Khayelitsha, Mitchells Plain & Greater Blue Downs age distribution, 2011 (Census,
2011) ............................................................................................................................................... 22
Figure 2.6: Khayelitsha, Mitchells Plain & Greater Blue Downs change in age distribution,
2001–2011 ....................................................................................................................................... 22
Figure 2.7: Khayelitsha, Mitchells Plain & Greater Blue Downs District household change
across populated areas, 2011–2018 (Census, 2011 & CCT roof count, 2018) ...................... 25
Figure 2.8: Khayelitsha, Mitchells Plain & Greater Blue Downs District employment status 27
Figure 2.9: Khayelitsha, Mitchells Plain & Greater Blue Downs District unemployment rate
spatial distribution across populated areas, 2011 (2011 Census) .......................................... 28
Figure 2.10: Khayelitsha, Mitchells Plain & Greater Blue Downs District average monthly . 29
Figure 2.11: Metropolitan change in income inequality over time, as represented by the
Gini Coefficient (HIS Markit, 2019) .............................................................................................. 30
Figure 2.12: Metropolitan change in the Human Development Index over time (HIS Markit,
2019) ............................................................................................................................................... 30
Figure 2.13: Khayelitsha, Mitchells Plain & Greater Blue Downs District median household
income spatial distribution across populated areas, 2011 (Census, 2011) ............................. 0
Figure 3.1: Distribution of underlying geology across the Khayelitsha, Mitchells Plain &
Greater Blue Downs District ........................................................................................................... 2
Figure 3.2: Hydrology of the Khayelitsha, Mitchells Plain & Greater Blue Downs District .... 11
Figure 3.3: Composite map of the Khayelitsha, Mitchells Plain & Greater Blue Downs District
bio-physical environment ............................................................................................................ 19
Figure 3.4: Composite map of the agricultural potential and (officially demarcated)
cultural/heritage resources in the Khayelitsha, Mitchells Plain & Greater Blue Downs District
......................................................................................................................................................... 20
Figure 4.1: Khayelitsha, Mitchells Plain & Greater Blue Downs District building plan
approvals according to land use type, 2015–2018 (CCT Development Management
Department, 2019) ........................................................................................................................ 30
Figure 4.2: Proposed projects of the Southern Corridor Human Settlements Programme in
relation to informal settlements .................................................................................................. 32
Figure 4.3: Vacant land distribution across the Khayelitsha, Mitchells Plain & Greater Blue
Downs District................................................................................................................................. 37
Figure 4.1: Transit oriented development concept illustrated at various scales .................. 39

5 | P a g e
Figure 4.2: Blue Downs Integration Zone transport concept .................................................. 41
Figure 4.3: Metro South-East Integration Zone, showing prioritized local areas ................... 41
Figure 4.4: Existing and future high-order public transport services in the Khayelitsha,
Mitchells Plain & Greater Blue Downs District ............................................................................ 43
Figure 4.5: Existing and planned cycle routes across the Khayelitsha, Mitchells Plain &
Greater Blue Downs District ......................................................................................................... 44
Figure 4.6: Intensity of boardings and alightings for road-based public transport .............. 45
Figure 4.7: Planned IPTN Phase 2A MyCiti BRT trunk routes ..................................................... 47
Figure 4.8: Scoring of transport-accessible precincts in relation to the higher-order public
transport network .......................................................................................................................... 50
Figure 4.9: Composite map of existing public transport and related infrastructure in the
Khayelitsha, Mitchells Plain & Greater Blue Downs District...................................................... 51
Figure 4.10: Existing road network and planned public right-of-way upgrades or new roads
in the Khayelitsha, Mitchells Plain & Greater Blue Downs District ........................................... 54
Figure 4.11: Main freight vehicle movement routes in the Khayelitsha, Mitchells Plain &
Greater Blue Downs Distric .......................................................................................................... 56
Figure 4.12: Trip generators versus trip attractors across the Khayelitsha, Mitchells Plain &
Greater Blue Downs District, 2013 (EMME Travel Demand Modelling, 2013) ........................ 58
Figure 4.13: Origin-destination mapping of peak morning commuter trips for all modes of
transport in relation to the Khayelitsha, Mitchells Plain & Greater Blue Downs District, 2013
......................................................................................................................................................... 59
Figure 4.14: Origin-destination mapping of peak morning commuter trips by public
transport in relation to the Khayelitsha, Mitchells Plain & Greater Blue Downs District, 2013
......................................................................................................................................................... 60
Figure 4.15: Origin-destination mapping of peak morning commuter trips by private car in
relation to the Khayelitsha, Mitchells Plain & Greater Blue Downs District, 2013 ................. 61
Figure 4.16: Transit Oriented Development Comprehensive Land Use Model ideal
distribution of trip-attracting and trip-producing land uses, 2032.......................................... 65
Figure 5.1: Khayelitsha, Mitchells Plain & Greater Blue Downs District bulk electricity
infrastructure: slight and severe lack of capacity, 2016 (MTIIF, 2017) ................................... 69
Figure 5.2: Khayelitsha, Mitchells Plain & Greater Blue Downs District bulk electricity
infrastructure: spare and adequate capacity, 2016 (MTIIF, 2017) ......................................... 70
Figure 5.3: Substation loading across the metropolitan area, 2018 ...................................... 71
Figure 5.4: Proposed electricity infrastructure projects, 2019–2024 ........................................ 72
Figure 5.5: Khayelitsha, Mitchells Plain & Greater Blue Downs District bulk water
infrastructure: spare and adequate capacity, 2015 (MTIIF, 2017) ......................................... 75
Figure 5.6: Khayelitsha, Mitchells Plain & Greater Blue Downs District bulk wastewater
infrastructure – slight and severe lack of capacity, 2015 (MTIIF, 2017).................................. 78
Figure 5.7: Khayelitsha, Mitchells Plain & Greater Blue Downs District bulk wastewater and
stormwater infrastructure – spare and adequate capacity, 2015 (MTIIF, 2017) .................. 79
Figure 6.1: Building integrated communities (TOD Strategic Framework, 2016) .................. 83
Figure 6.2: Khayelitsha, Mitchells Plain & Greater Blue Downs District housing typology ... 84
Figure 6.3: Khayelitsha, Mitchells Plain & Greater Blue Downs District distribution of dwelling
typologies (2011 Census) ............................................................................................................. 85
Figure 6.4: Khayelitsha, Mitchells Plain & Greater Blue Downs District informal dwelling
distribution by (CCT Informal Structure Count, 2018) ............................................................... 86

6 | P a g e
Figure 6.5: Khayelitsha, Mitchells Plain & Greater Blue Downs District distribution of .......... 88
Figure 6.6: Khayelitsha, Mitchells Plain & Greater Blue Downs District spatial distribution of
household tenure status (2011 Census) ..................................................................................... 89
Figure 6.7: Khayelitsha, Mitchells Plain & Greater Blue Downs District housing supply and
demand trends, 2013–2018 (CCT Housing Needs Registry) .................................................... 91
Figure 6.8: Khayelitsha, Mitchells Plain & Greater Blue Downs housing delivery over time by
number and typology, 2013/14–2017/18 (CCT Human Settlements Department, 2019) ... 93
Figure 6.9: Khayelitsha, Mitchells Plain & Greater Blue Downs District housing delivery ..... 94
Figure 6.10: Status of Human Settlements projects in the Khayelitsha, Mitchells Plain &
Greater Blue Downs District ......................................................................................................... 96
Figure 56: Conceptual Hierarchy of Community Facility Nodes/Civic Clusters ................... 98
Figure 57: Distribution of Community Facilities in Khayelitsha Mitchell’s Plain Greater Blue
Downs District............................................................................................................................... 100
Figure 39: Figure 39: Facility Need in Khayelitsha Mitchell’s Plain Greater Blue Downs District
.............................................................................................................................................................
Figure 4.1: Average annual Gross Domestic Product (GDP) growth in South Africa vs. Cape
Town, 2009-2018 (IHS Markit, 2019) ........................................................................................... 113
Figure 4.2: Consumer Price Index (CPI), Producer Price Index (PPI) and repurchase rate
trends against the Reserve Bank inflation rate target, 2009–2018 (Statistics South Africa
2018–2019 & SARB, 2018–2019) .................................................................................................. 114
Figure 4.3: Building Confidence Index (BCI) trends in Cape Town, 2009–2018 (Bureau for
Economic Research (BER), 2018 & FNB/BER BCI, 2018) ......................................................... 115
Figure 4.4: Cape Town new building completions and vacancy rates for office and
industrial space, 2009–2018 (Transport Business Support Department & South African
Property Owners’ Association (SAPOA), 2019) ....................................................................... 116
Figure 4.5: Cape Town Gross Value Added (GVA) and capitalisation rate (cap rate) trends,
2011–2018 (IHS Markit, 2019 & South African Property Owners Association (SAPOA), 2019)
....................................................................................................................................................... 117
Figure 9.6: Gross geographic product (GGP) contribution by district at current prices, 2018
(IHS Markit, 2019) ...............................................................................................................................
Figure 9.7: Employment contribution by district, 2018 (IHS Markit, 2019) ..................................
Figure 4.8: Average annual economic growth rates by district, 2009– 2018 (IHS Markit, 2019)
....................................................................................................................................................... 119
Figure 4.9: Economic performance comparison across Districts, 2018 (IHS Markit, 2019) 119
Figure 4.10: Gross Value Added (GVA) contribution across districts by sector, 2018 (IHS
Markit, 2019) ................................................................................................................................. 120
Figure 4.11: Employment contribution to Cape Town across districts by sector, 2018 (IHS
Markit, 2019) ................................................................................................................................. 121
Figure 4.12: Gini Coefficient comparison across districts, 2009, 2014 & 2018 (HIS Markit, 2019)
....................................................................................................................................................... 124
Figure 4.13: Number of households per annual income category by District, 2018 (HIS
Markit, 2019) ................................................................................................................................. 125
Figure 9.14: Formal versus informal employment in Cape Town, 2015–2019 (Stats SA
Quarterly Labour Force Survey: Q2,, 2019) ....................................................................................
Figure 4.15: Industry distribution of informal sector employees in Cape Town, 2019 (Stats SA
Quarterly Labour Force Survey: Q2, 2019) ............................................................................... 127

7 | P a g e
Figure 5.1: Change in Khayelitsha, Mitchells Plain & Greater Blue Downs District average
capitalisation rates per non-residential market segment, 2012–2018 (CCT Non-Residential
Market Research, 2018) ............................................................................................................. 130
Figure 5.2: Change in Khayelitsha, Mitchells Plain & Greater Blue Downs District average
vacancy rates per non-residential market segment, 2012–2018 (CCT Non-Residential
Market Research, 2018) ............................................................................................................. 131
Figure 5.3: Khayelitsha, Mitchells Plain & Greater Blue Downs average capitalisation rates
per 4 ha grid: industrial property market ................................................................................. 132
Figure 5.4: Khayelitsha, Mitchells Plain & Greater Blue Downs average capitalisation rates
per 4 ha grid: street-front retail property market .................................................................... 134
Figure 5.5: Khayelitsha, Mitchells Plain & Greater Blue Downs average capitalisation rates
per 4 ha grid: office property market ...................................................................................... 136
Figure 5.6: Khayelitsha, Mitchells Plain & Greater Blue Downs District change in average
non-residential property values per 1 ha grid, 2012–2018 ..................................................... 139
Figure 5.7: Khayelitsha, Mitchells Plain & Greater Blue Downs District: number of residential
sales per suburb, 2009-2018 ....................................................................................................... 141
Figure 5.8 Khayelitsha, Mitchells Plain & Greater Blue Downs District: average residential
property value by suburb, 2018 (R/m2) .................................................................................... 142
Figure 5.9: Khayelitsha, Mitchells Plain & Greater Blue Downs District change in average
residential property values per 4 ha grid, 2012–2018 ............................................................. 144
Figure 6.1: Relative elevation above sea level (m) of the Khayelitsha, Mitchells Plain &
Greater Blue Downs District ....................................................................................................... 153
Figure 6.2: Khayelitsha, Mitchells Plain & Greater Blue Downs District risks – built environment
....................................................................................................................................................... 158
Figure 6.3: Consolidated map of exposure to all climate hazards for the mid-future period
(2021–2050) across the Khayelitsha, Mitchells Plain & ........................................................... 162
Figure 6.4: Present-day resilience to climate hazards across the Khayelitsha, Mitchells Plain
& Greater Blue Downs District ................................................................................................... 163
Figure 6.5: Risk of climate hazards relative to resilience across the Khayelitsha, Mitchells
Plain & Greater Blue Downs District .......................................................................................... 164
List of tables
Table 2.1: District versus metropolitan population trends (formal, informal and backyard
settlements), 2001–2018 (Census, 2001 & 2011 & CCT estimates, 2018) ................................ 16
Table 2.2: Khayelitsha, Mitchells Plain & Greater Blue Downs District age distribution, 2001–
2011 (Census, 2001 & 2011) ......................................................................................................... 21
Table 2.3: District versus metropolitan distribution of highest adult (aged 20+ years)
education levels, 2011 (Census, 2011) ....................................................................................... 23
Table 2.4: District versus metropolitan population and household growth trends, 2001–2018
(Census, 2001 & 2011 & CCT roof count, 2018) ....................................................................... 23
Table 2.5: Khayelitsha, Mitchells Plain & Greater Blue Downs District .................................... 26

8 | P a g e
Table 3.1: Conservation status of Cape Flats Dune Strandveld in the Khayelitsha, Mitchells
Plain, Greater Blue Downs District (CCT State of Environment Report, 2018 & CCT 2009
Biodiversity Network Report for historical figures) ....................................................................... 6
Table 3.2: Status of major rivers in the Khayelitsha, Mitchells Plain & Greater Blue Downs
District (State of the Environment Report, 2018) ......................................................................... 9
Table 3.3: Environmental Spatial Implications ........................................................................... 25
Table 4.1: Largest residential developments in the Khayelitsha, Mitchells Plain & Greater
Blue Downs District, 2014–2019 (CCT Human Settlements Department, 2019) .................... 31
Table 4.2: Categories and their respective criteria used in the analysis of vacant land in
the Khayelitsha, Mitchells Plain & Greater Blue Downs District ............................................... 35
Table 4.1: Overview of public transport interchanges and minibus taxi ranks in the
Khayelitsha, Mitchells Plain & greater Blue Downs District ...................................................... 46
Table 4.2: Peak morning travel patterns from and to the Khayelitsha, Mitchells Plain &
Greater Blue Downs (KMPBD) District ......................................................................................... 62
Table 5.1: Classification of electrical substation supply areas by level of existing capacity
(MTIIF, 2017) .................................................................................................................................... 67
Table 5.2: Classification of bulk water supply areas by level of existing capacity (MTIIF, 2017)
......................................................................................................................................................... 73
Table 5.3: Classification of bulk wastewater management areas by level of existing
capacity (MTIIF, 2017)................................................................................................................... 76
Table 5.4: Classification of bulk solid waste infrastructure by level of existing capacity .... 80
Table 17: 2020 Top Areas of Need Khayelitsha Mitchell’s Plain Greater Blue Downs District
....................................................................................................................................................... 101
Table 18: 2040 Top Areas of Need Khayelitsha Mitchell’s Plain Greater Blue Downs District
....................................................................................................................................................... 102
Table 4.1: Top five sectors by location quotient in each district (detailed SIC), 2018 (HIS
Markit, 2019) ................................................................................................................................. 121
Table 4.2: Human Development Index (HDI) 2009, 2014 and 2018 (HIS Markit, 2019) ....... 123
Table 5.1: Khayelitsha, Mitchells Plain & Greater Blue Downs District property market
indicators, 2012–2018 (City of Cape Town Non-Residential Market Research, 2018) ...... 130
Table 5.2: Highest affordable property prices for respective monthly household incomes
....................................................................................................................................................... 140
Table 6.1: Policy statements pertaining to risk (CTMSDF, 2018) ............................................ 149
Table 6.2: Cape Town Disaster Risk Management Plan evaluation of hazards ................. 149
Table 6.3: Overview and implications of risk: wind-blown sand ........................................... 150
Table 6.4: Overview and implications of risk: coastal erosion .............................................. 151
Table 6.5: Overview and implications of risk: flooding........................................................... 152
Table 6.6: Overview and implications of risk: cemeteries, waste disposal sites and waste
water treatment works ............................................................................................................... 154
Table 6.7: Overview and implications of risk: noise contours ................................................ 154
Table 6.8: Overview and implications of risk: lack of infrastructure capacity .................... 155
Table 6.9: Overview and implications of risk: structural fires in informal settlements ......... 155
Table 6.10: Overview and implications of risk: structural fire in formal settlements ........... 156
Table 6.11: Overview and implications of risk: heat and heat island effect ...................... 156
Table 6.12: Overview and implications of risk: unmanaged land occupation and
unregulated development ........................................................................................................ 157

9 | P a g e
Table 6.13: Weighting of climate change hazard vulnerability factors .............................. 160
Table 6.14: Implications of climate hazards and risk for development ............................... 165

10 | P a g e
1 INTRODUCTION
Background
This District SDF is a review of the 2012 District Spatial Plan (DSP) and provides up-to-date
spatial planning guidance for one (1) of eight (8) planning districts in Cape Town. This
process follows the City’s commitment to review the District SDFs periodically on a 10-year
basis, or when a need arises, due to, inter alia, changing trends in the natural environment,
built environment, population/composition and/or in the legislative environment.
Structure of the District SDF Suite of Documents
At this stage, the District SDF suite of documents and the respective main subordinate
categories are illustrated in Figure 1.1 below. The current document is the Status Quo/
Baseline and Analysis Report (BaAR).
Figure 1.1: District SDF Review process summary
Baseline and Analysis Report
The purpose of the BaAR is to identify the development parameters that will inform the
spatial plans intended to manage the future growth of the planning districts in a manner
that is sustainable, resilient, equitable and contextually appropriate.
VOL 1 - Baseline and Analysis Report:
1. State of the Population
2. State of the Environment
3. State of the Built Environment
4. State of the Economy and Property Market
5. Risks
VOL 2 - SDF Technical Report
1. Legal context
2. Spatial objectives
3. District Development Guidelines
4. Sub-district development guidelines
VOL 3 -Implementation Plan
1. Urban upgrading and restructuring
2. Priortisation framework
3. Mechanisms and incentives4. Monitoring and evaluation
VOL 4-Technical Annexures

11 | P a g e
The formulation of the BaAR uses a spatial layering approach to extract the constraints
and opportunities for the respective structuring elements under investigation in each
district. This is required to identify appropriate spatial interventions to mitigate against
constraints and enhance opportunities in order to build integrated and resilient
communities. The intent is to enable environments that support the natural, social,
physical, and economic integration of people into the existing urban fabric and establish
quality living environments for all, as illustrated in Figure 1.2 below.
Figure 1.2: Building integrated communities (TOD Strategic Framework, 2016)
The narratives for the respective layers in the Baseline and Analysis Report have been
structured using the following approach, by answering the three main questions below:
1. What is there and what are the trends? This entails a brief description of the status
quo, showing the trends since 2012, i.e. projects built, pressures, constraints and the
opportunities.
2. What does this mean and what are the implications? This entails an indication of the
implications of the above constraints or opportunities for spatial planning (District
SDF), i.e. the location of available physical space and where more is needed; and
where land use guidelines, policies or interventions (e.g. physical projects) are
needed.
3. How is this linked to other elements/layers? This entails a synthesis, yet to be
completed, that explores the interrelationship between the constraints and the
opportunities as they relate to the various layers analysed and as they all work
together to form the basis for plan making. It uses an analysis-informs-plan making
approach.

12 | P a g e
Structure of the Baseline and Analysis Report
As explained above, under Paragraph 1.8, the Baseline and Analysis Report is divided into
the following main sections that aim to respond to at least the following questions for the
respective sections:
State of the Population:
a. What is the current socio-economic profile of the population?
b. What is current and forecasted growth of the population per district? This is
required to identify the projected impact of future growth on the natural and
urban environment, and how best to plan for said growth.
State of the Environment:
c. This will serve as the baseline for the EMF for the District;
d. Are there areas of ecological and environmental significance which must be
conserved/protected from urban development, and where are they located?
e. Are there areas of cultural significance which must be conserved and protected
from inappropriate development which negatively impacts the heritage
qualities and value of the area, and where are they located (i.e. the HPOZ and
proposed HPOZ)?
f. What are the bio-physical features of the district that may constrain any form of
future development (i.e. rivers, wetland, topography etc.)?
g. Which areas require appropriate interface development guidelines to mitigate
negative impact?
h. Which areas are appropriate for environmental and heritage exemptions or
designations (in terms of NEMA and NHRA)?
State of the Built Environment:
i. What and where are the current development trends and pressures in the
district?
j. What is the current state of supply and demand for transport and urban
infrastructure, social and recreational facilities and housing to enable more
integrated and resilient communities?
k. What areas currently have capacity for intensification of land use and which
areas require upgrades to the current transport, social, recreational, urban
infrastructure to enable further intensification of land use?
l. What is the current state of transport accessibility and mobility in each district of
the city (internally and externally)? This will help identify areas appropriate for
intensification (densification and diversification).
m. What is the extent of underutilised vacant land in the district?
State of the Economy:
n. What is the state of employment/unemployment?
o. What are the best-performing industries, that offer competitive advantages?
p. What are the best-performing property markets in the district and which areas
offer the most property market potential?

13 | P a g e
Risk and Resilience:
q. What are the risks to the future sustainability of the City and its citizens? What and
where are the setback or proximity parameters that may impact on future
development?
r. How can spatial development promote social inclusion, physical connectivity
and equitable travel to optimise carbon emission reductions?
s. What is the level of vulnerability and resilience of current areas in the district?
Key Informants and Limitations of the Baseline and Analysis
Report
Whilst every attempt has been and will be made to ensure the information in the BaAR
document is accurate, it cannot be guaranteed that it is up to date at all times. This is
because the information is subject to the availability of information, the time period for
when it is available and valid and the credibility of the source (refer to Annexure C for a
list of said sources). Given the aforementioned and the fact that the District SDF and its
implementation period is only for ten years the approach has not been to ensure that
every statistic is 100% accurate and undeniably the most recent. However, the authors
have opted to rather use the general trends relating to the statistics and not the absolute
numbers and will draw the main issues and opportunities for the formulation of proposals
and guidelines.

14 | P a g e
A. STATE OF THE
POPULATION

15 | P a g e
2 DEMOGRAPHICS
Overview
At 29.92% in 2018, the Khayelitsha, Mitchells Plain & Greater Blue Downs District comprises
the significant majority of the overall metropolitan population. Between 2001 and 2016,
the district population grew by 44.28% from 872 425 to 1 218 681 (Figure 2.1). Despite the
district’s large population, its annual average population growth rate of 2.99% between
2001 and 2018 sits marginally below the metropolitan average of 3.06%. The district has
also seen a slight decrease in annual average population growth over time, with growth
being slightly more pronounced in the 2001–2011 than 2011–2016 period.
Figure 2.1: Overview of Khayelitsha, Mitchells Plain & Greater Blue Downs District key demographic statistics
(Census, 2001; Census, 2011; CCT estimates, 2018 & HIS Markit, 2019)
Mirroring metropolitan trends, the district’s annual average household growth rate of
4.58% between 2001 and 2018 is significantly greater than that of population. This is linked
to an overall trend of decreasing household size (Figure 2.1). However, as with population
growth, this is a trend that appears to have weakened in the district over time. Therefore,
while there has likely been a growth in housing demand due to households splitting into
smaller units, this is not as large a pressure in Khayelitsha, Mitchells Plain & Greater Blue
Downs as it might be in other districts.

16 | P a g e
Between 2001 and 2011 the unemployment rate in the district decreased drastically, from
45.16% to 33.33% (Figure 2.1). Part of this is attributable to the slight decrease in the labour
force participation rate from 68.36% to 64.47%, which indicates an increase in the
proportion of not economically active people. Even so, this represents a significant
improvement in access to and ability of people to create employment opportunities in
the district. In terms of income, as of 2018, Khayelitsha, Mitchells Plain & Greater Blue Downs
has a Gini Coefficient of 0.58. This suggests a lesser degree of income inequality in the
district relative to the metropolitan area as a whole, with a Gini Coefficient of 0.62.
However, this is largely as a result of the widespread nature of poverty in the district, with
exceptionally few households earning a monthly income in the higher brackets (Figure
2.1). The highest unemployment rates as well as the lowest median household incomes
largely correlate with areas of high informality, namely:
Crossroads, Philippi and Weltevredend Valley (Philippi Sub-District);
Ikwezi Park, Victoria Mxenge, Nonqubela, the north-eastern edge of
Denel/Swartklip, Endlovini (Monwabisi and Khayelitsha T2-V2b) Enkanini (east of
Kuyasa), Umrhabulo Triangle and Faure (Site B, Site C, TR Section and Greater
Khayelitsha Sub-Districts); and
Mfuleni (Mfuleni Sub-District)
Population
District Trends
As of 2018, the population of the Khayelitsha, Mitchells Plain & Greater Blue Downs District
is estimated at 1 316 494 (Table 2.1). It comprises 29.92% of the city’s total population – the
largest proportion by a significant margin. Despite its majority share of metropolitan
population, the district’s population growth has been almost equal to that of the overall
metropolitan area (Figure 2.2). Between 2001 and 2018, the district’s population grew by
50.09% (from 872 425 to 1 316 494), equating to an average of 2.99% per annum (Table
2.1). In the same period, the metropolitan population grew by 52.08% (from 2 893 249 to 4
400 240), equating to an annual average rate of 3.06%. Furthermore, the annual average
population growth rate of the district has remained relatively consistent over time,
changing only marginally from 2.75% (2001–2011) to 2.62% (2011–2018) (Table 2.1).
Table 2.1: District versus metropolitan population trends (formal, informal and backyard settlements), 2001–
2018 (Census, 2001 & 2011 & CCT estimates, 2018)
Planning district 2001
Annual
average
change
2001-2011
2011
Annual
average
change
2011-2018
2018
Annual
average
change
2001-2018
Khayelitsha -
Mitchells Plain -
Greater Blue
Downs
872 425 2.75% 1 112 650 2.62% 1 316 494 2.99%
Cape Town 2 893 399 2.93% 3 740 026 2.52% 4 400 240 3.06%

17 | P a g e
Figure 2.2: District versus metropolitan population growth trends (formal, informal and backyard settlements),
2001–2018 (Census, 2001 & 2011 & CCT roof count, 2018)
Spatial Distribution
Within the district, the N2 Highway forms a distinct barrier between areas of high
population and population density to the south and low population and population
density to the north (Figure 2.3). The district population is concentrated most intensely in
areas within the Philippi, Mitchells Plain, Khayelitsha and Site B, Site C, TR Section Sub-
Districts. These areas include:
Browns Farms (2018 population: 72 200, 6.09%);
Philippi East (2018 population: 48 452, 4.09%);
Lentegeur (2018 population: 40 965, 3.46%);
Tafelsig (2018 population: 62 024, 5.23%);
Ikwezi Park (2018 population: 56 763, 4.79%);
Nonqubela (2018 population: 43 834, 3.70%).
Of the above areas, the large populations of Browns Farms, Ikwezi Park and Nonqubela
correlate with the presence of significant informal settlements.
The most sparsely populated areas are generally found within the Greater Blue Downs and
Penhill & Surrounds Sub-Districts. One exception to this broad spatial pattern is Mfuleni. With
a 2018 population of 61 242, it accounts for 5.17% of the total district population – its third
most populated area.
As a whole, the district has very low population densities (Figure 2.3). As of 2018, average
gross population density of populated areas in the district stands at merely 12 218
persons/km2 (122.18 persons/ha). The distribution of gross population density across the
district generally mirrors that of population. Highly populated areas largely present the
highest population densities, as seen in those located in the Philippi, Mitchells Plain,
Khayelitsha and Site B, Site C, TR Section Sub-Districts. The most densely populated areas
also broadly correlate with the presence of informal settlements, with the highest
population densities found in:
2 500 000
2 700 000
2 900 000
3 100 000
3 300 000
3 500 000
3 700 000
3 900 000
4 100 000
4 300 000
4 500 000
800 000
900 000
1 000 000
1 100 000
1 200 000
1 300 000
1 400 000
2001 2011 2018
Me
tro
po
lita
n p
op
ula
tio
n
KM
PB
D p
op
ula
tio
n
Year
Khayelitsha-Mitchells Plain-Greater Blue Downs Cape Town

18 | P a g e
Kosovo Informal Settlement (54 085 persons/km2 or 540.85 persons/ha – within
Weltevreden Valley);
Gqobasi Informal Settlement (46 397 persons/km2 or 463.97 persons/ha) – north-
western corner of Crossroads);
Bongani TR Section (35 840 persons/km2 or 358.40 persons/ha – north-eastern edge
of Swartklip)
Victoria Mxenge (36 926 person/km2 or 369.26 persons/ha);
Village V4 North (32 527 persons/km2 or 325.27 persons/ha – southern portion of
Victoria Mxenge);
Nonqubela (315.76 persons/ha);
Endlovini Informal Settlement (35 886 persons/km2 or 358.86 persons/ha – south of
Harare); and
Silver Town (31 718 persons/km2 or 317.18 persons/ha – north of Mandela Park).
The opposite also holds true, with the most sparsely populated areas generally home to
some of the lowest population densities, as is the case with those that fall within the Penhill
& Surrounds Sub-District and especially the Greater Blue Downs Sub-District (Figure 2.3). This
is indicative of its as of yet unrealised potential as a major growth corridor in the district,
linking the Metro South-East to the Northern Suburbs.
Between 2011 and 2018, approximately 2/3 of areas in the district saw only marginal
growth in population, which ranged between 0% and 5% (Figure 2.4). This sits significantly
below the overall district population growth rate of 18.32% over the same time span
between 2011 and 2018 (Table 2.1).
More significant population growth in the 2011–2018 period occurred in the following
areas (Figure 2.4):
Hagley 1 (44.80%)
Stratford Green (46.43%)
Sweet Home (47.18%)
Endlovini Informal Settlement (48.67%) (south of Harare)
Delro (67.65%)
Finally, the following areas have seen exceptionally high population growth between 2011
and 2018 (Figure 2.4):
The Connifers (143.29%)
Philippi East (427.63%)
Fountain Village (549.04%)
Faure (780.95%)

19 | P a g e
Figure 2.3: Khayelitsha, Mitchells Plain & Greater Blue Downs District gross population density (persons/km2) distribution across populated areas, 2018
(CCT roof count, 2018)

20 | P a g e
Figure 2.4: Kahyelitsha, Mitchells Plain & Greater Blue Downs District population change across populated areas, 2011–2018
(Census, 2011 & CCT roof count, 2018)

21 | P a g e
Of note, however, is that medium to high population growth in the district did not occur in
areas with already high populations or population densities (Figure 2.3 & Figure 2.4). Sweet
Home, Endlovini, Philippi East and Faure have historically been unpopulated or scarcely
populated, with recent population growth linked strongly to the emergence of informal
settlements. Informal settlement growth in Endlovini and Faure is of especially large
concern, as it is respectively driving increasingly deeper into the False Bay dune system
and Driftsands Nature Reserve/Khayelitsha wetland system. By contrast, the population
growth experienced in Stratford Green, Delro, Fountain Village and The Connifers has
been the result of formal greenfield residential development in the Greater Blue Downs
Sub-District. Gqobasi Informal was the one area that saw a significant population decline
of -9.22% between 2011 and 2018.
Population Structure
2.2.3.1 Age Distribution
As measured in 2011, the population of Khayelitsha, Mitchells Plain & Greater Blue Downs
District has the highest proportions of children (14 and younger) (28.38%) and youth (aged
15–34) (41.15%) in the metropolitan area (Table 2.2). However, the prominence of young
people in the district becomes far more significant when considering that approximately
1/3 of all the city’s children (34.02%) as well as youth (32.38%) are located in the district. In
contrast, the district is home to the lowest percentage of aged persons (65 and older)
across the city – 2.29%, compared to the metropolitan average of 5.55% (Table 2.2).
Table 2.2: Khayelitsha, Mitchells Plain & Greater Blue Downs District age distribution, 2001–2011 (Census, 2001
& 2011)
Between 2001 and 2011, the proportion of working-aged people persons (aged 15–54) in
the district remained relatively constant (Table 2.2). The proportions of children and aged
persons have a direct bearing on the dependency ratio of the district, which is a measure
of the number of people in the “dependent age groups” in relation to the number of
working-aged people (expressed per 100). This gives a rough estimate of the level of
dependency in a society, be it in terms of income, social, physical or logistical needs. In
the Khayelitsha, Mitchells Plain & Greater Blue Downs District, the 2011 dependency ratio
Pla
nn
ing
dis
tric
t
Ye
ar 0 - 14 15 - 64 65 +
Dependency
ratio
Index of
ageing Number % Number % Number %
KM
PB
D 2001 263 899 30.25 594 578 68.15 13 947 1.60 46.73 5.28
2011 315 819 28.38 771 411 69.33 25 428 2.29 44.24 8.05
Ca
pe
To
wn
2001 771 210 26.65 1 978 005 68.36 144 227 4.98 46.28 18.70
2011 928 302 24.82 2 604 201 69.63 207 474 5.55 42.90 22.35

22 | P a g e
of 44.24 (the fourth highest of the eight districts) indicates that for just over every two
people between the age of 15 and 64, there is one child (14 or younger) or aged person
(65 or older) that may be dependent on them (Table 2.2). As indicated above, the most
significant contributor to this dependency ratio is the high number of children in the district,
given the below-average proportion of aged persons.
Despite the high proportion of children, the index of ageing increased from 5.28 in 2001 to
8.05 in 2011 (Table 2.2). This means that in 2011 there were more aged persons in relation
to children (expressed per 100) than in 2001. As illustrated in Figure 2.6, this modest change
emerged out of a marginal decrease in the child population accompanied by a marginal
increase in the aged population in the district.
Figure 2.5: Khayelitsha, Mitchells Plain & Greater Blue Downs age distribution, 2011 (Census, 2011)
Figure 2.6: Khayelitsha, Mitchells Plain & Greater Blue Downs change in age distribution, 2001–2011
(Census, 2001 & 2011)
0%
10%
20%
30%
40%
50%
60%
70%
80%
0-14 15-64 65+
Pe
rce
nta
ge
of d
istr
ict
po
pu
latio
n
Age category
2001
2011

23 | P a g e
2.2.3.2 Education
Measured at 29.03% in 2011, the rate of adult matric completion in the Khayelitsha,
Mitchells Plain & Greater Blue Downs District is broadly comparable with other districts and
the metropolitan average of 30.17% (Table 2.3). However, the district is home to by far the
largest percentage of people to have not completed their secondary education,
accounting for almost 2/3 (65.67%) of its adult population, versus a metropolitan average
of just over 1/2 (51.35%). The district also has the lowest rate of higher education by a
significant margin. Only 5.06% of the total adult population has attained some form of
higher of education, versus a metropolitan average of 16.17% and the largest proportion
of 35.73% in the Southern Peninsula. For further comparison, the second lowest proportion
of higher education completion is nearly double this, at 9.60% in the Cape Flats. This has a
direct impact on the nature of the economic activity in which adults from Khayelitsha,
Mitchells Plain & Greater Blue Downs can participate, limited largely to semi-skilled work
and thereby impeding economic and spatial integration with other districts.
Table 2.3: District versus metropolitan distribution of highest adult (aged 20+ years) education levels, 2011
(Census, 2011)
No Schooling
Partial primary to
partial secondary
schooling
Matric Higher
education
Number % Number % Number % Number %
Khayelitsha-
Mitchells Plain-
Greater Blue
Downs
16 254 2.34% 439 965 63.34% 201 642 29.03% 35136 5.06%
Cape Town 42 969 1.76% 1 255 404 51.35% 737 658 30.17% 395 436 16.17%
Households
District Trends
Table 2.4: District versus metropolitan population and household growth trends, 2001–2018 (Census, 2001 &
2011 & CCT roof count, 2018)
Statistic Planning
district 2001
Annual
average
change
2001-2011
2011
Annual
average
change
2011-2018
2018
Annual
average
change
2001-2018
Population KMPBD 872 425 2.75% 1 112 650 2.62% 1 316 494 2.99%
Cape Town 2 893 399 2.93% 3 740 026 2.52% 4 400 240 3.06%
Households KMPBD 215 860 4.24% 307 439 3.55% 383 844 4.58%
Cape Town 776 781 3.76% 1 068 573 3.29% 1 315 015 4.08%
Average household size
KMPBD 4.04 - 3.62 - 3.43 -
Cape Town 3.72 - 3.50 - 3.35 -

24 | P a g e
As of 2018, the number of households in the Khayelitsha, Mitchells Plain & Greater Blue
Downs District is estimated at 383 844 (Table 2.4). As with population, the district accounts
for by far the largest share of the 1 315 015 metropolitan households at 29.19%.
Between 2001 and 2018, household growth in the district has consistently been greater
than that of population (Table 2.4). In this period, the number of households in the district
has increased at an annual average rate of 4.58% – significantly greater than that of
population at 2.99%. This is linked to an overall trend of decreasing household size, from
an average of 4.04 persons in 2001 to 3.43 in 2018. The above dynamic reflects
metropolitan trends, wherein the challenge presented by growing population is
exacerbated by increasing numbers of households and the decrease in average size of
households.
However, within the district, the rate of household growth displays a similar moderately
decreasing trend to that of population. Between 2001 and 2011, the number of
households in the Khayelitsha, Mitchells Plain & Greater Blue Downs grew at an average
annual rate of 4.24%, which subsequently decreased to 3.55% between 2011 and 2018. As
the decline in household growth rate has been more pronounced than that of population,
the disparity between the two appears to be narrowing, suggesting that fewer households
are splitting into smaller units.
Spatial Distribution
Within the Khayelitsha, Mitchells Plain & Greater Blue Downs District, the spatial distribution
of households and household density largely and intuitively mirrors that of population
(Figure 2.3). As with gross population density (2018 average of 12 218 persons/km2 or 122.18
persons/ha), gross household density across populated areas is generally very low,
averaging at 30.61 du/ha. Very few areas in the district have the necessary household
densities to adequately sustain clusters of social facilities, viable public transport systems
and economic activity. Where higher household densities do occur, they are generally
coupled with the presence of significant informal settlements.
The correlation between population and household numbers also presents itself in
household growth rates between 2011 and 2018 (Figure 2.4 & Figure 2.7). However, there
are two notable exceptions in which household growth greatly outpaced population
growth, namely Philippi East and Faure. Where population grew by an already
exceptional 427.62% in Philippi East, households grew by 732.84% – almost double that. In
the same time, population grew by 780.95% in Faure, while households increased by a
staggering 2300%. As previously discussed, both of these areas have seen significant
informal settlement growth in recent years. However, it must be noted that the high
population and household growth rate recorded in Faure is more directly tied to its
historically very low population. Therefore, even a small increase in the population and
household numbers would translate to a large percentage growth.

25 | P a g e
Figure 2.7: Khayelitsha, Mitchells Plain & Greater Blue Downs District household change across populated areas, 2011–2018 (Census, 2011 & CCT roof count, 2018)

26 | P a g e
Employment
District Trends
As of 2011, 69.33 % (771 417 people) of the Khayelitsha, Mitchells Plain & Greater Blue
Downs District’s 1 112 650 residents are of working age (15–64 years old) (Table 2.5). Of the
working-age population, 2/3 (64.47%) make up the labour force of 497 301 – a labour force
participation rate comparable to most of the other seven districts (Table 2.5 & Figure 2.8).
The remaining 1/3 (35.53%) is classified as “not economically active”. Of those not
participating in economic activity, only 3.93% identify as discouraged work-seekers. The
remainder (“other economically inactive”), abstain from work for a variety of reasons,
ranging from full-time studies, duties as a homemaker/parent, disability or simply old age.
As of 2011, under half (42.98%) of the district’s working-age population is employed – the
lowest labour absorption rate among all districts (Table 2.5 & Figure 2.8). Consequently,
21.49% of its working-age population (greater than any other district) is unemployed. This
becomes significantly more problematic when one considers these 165 747 unemployed
persons as a percentage of the labour force – those actively looking for work or
participating in the economy. In this context, the strict unemployment rate of the district
stands at 33.33% – well above the metropolitan average of 23.88% (Table 2.5). Therefore,
as of 2011, precisely one out of every three people in the district looking for employment
is unable to find work.
However, the 2011 unemployment figure of 33.33% is the result of an exceptional decrease
of almost 1/3 from that of 45.16% in 2001 (Table 2.5). Part of this is attributable to the slight
decrease in the labour force participation rate from 68.36% to 64.47% in the same period,
which indicates an increase in the proportion of not economically active people. Even so,
this represents a significant improvement in access to and ability of people to create
employment opportunities in the district.
Table 2.5: Khayelitsha, Mitchells Plain & Greater Blue Downs District
labour force Indicators 2001–2011 (Census, 2001 & 2011)
Labour Force Indicators 2001 2011
Population aged 15 to 64 years 494 627 771 417
Labour Force 338 140 497 301
Employed 185 443 331 554
Unemployed 152 697 165 747
Not Economically Active 156 487 274 116
Discouraged Work-seekers - 30 294
Other not economically active - 243 822
Rates %
Unemployment rate 45.16% 33.33%
Labour absorption rate 37.49% 42.98%
Labour force participation rate 68.36% 64.47%

27 | P a g e
Figure 2.8: Khayelitsha, Mitchells Plain & Greater Blue Downs District employment status
of working-ages persons (15–64), 2011 (Census, 2011)
Spatial Distribution
High unemployment rates are widespread throughout the district, reaching their peaks at
75.00% in Faure and 60.97% in Boys Town in 2011 (Figure 2.9). However, as of the same year,
there is also significant variation recorded in unemployment between areas. Generally,
unemployment displays the lowest ranges in areas located within the sub-districts of
Mitchells Plain (10–30%) and Greater Blue Downs (10–20%). By contrast, areas in the
Khayelitsha and Mfuleni Sub-Districts have a dominant unemployment range well above
the district average of 33.33%. Unemployment is even more pronounced within the sub-
districts of Site B, Site C, TR Section and Philippi, where several areas have unemployment
rates reaching 40–50%.
21.49%Labour force
64.47%
Economically
inactive Employed
Unemployed
Discouraged Work-
seeker
Other economically
inactive

28 | P a g e
Figure 2.9: Khayelitsha, Mitchells Plain & Greater Blue Downs District unemployment rate spatial distribution across populated areas, 2011 (2011 Census)

29 | P a g e
Income
District Trends
As of 2011, The Khayelitsha, Mitchells Plain & Greater Blue Downs District has a fairly even
distribution of households among the lowest four income brackets, such that almost 2/3
(63.98%) of total households live on an average income of less than R6 400 per month
(Figure 2.10). Among these, 16.80% of households have no income at all. By extreme
contrast, only 2.58% of households in the district earn an average monthly income greater
than R25 000, with merely 0.44% of households earning within the top two income brackets.
Between these two extremes, a combined 16.62% of households lives from more moderate
average monthly incomes ranging between R6 400 and R25 000.
Figure 2.10: Khayelitsha, Mitchells Plain & Greater Blue Downs District average monthly
household income distribution, 2011 (2011 Census)
As with the majority of Cape Town’s eight districts, Khayelitsha, Mitchells Plain & Greater
Blue Downs has seen a steady rise in income inequality between 2009 and 2018, mirroring
the overall metropolitan trend (Figure 2.11). As of 2018, the district has a Gini Coefficient
of 0.58 – more economically unequal than the Southern Peninsula and Northern District,
on par with Tygerberg and Table Bay and less economically unequal than Blaauwberg,
the Cape Flats or Helderberg. It is also below the metropolitan level of income inequality,
measuring at an overall Gini Coefficient of 0.62. This is largely as a result of the widespread
nature of poverty in the district, with exceptionally few households earning a monthly
income in the higher brackets, as noted above.
16.80%
25.52%
22.14%
16.32%
10.62%
6.00%
2.14%
0.25%
0.19%2.58%
No income R 1 - R 1 600 R 1 601 - R 3 200
R 3 201 - R 6 400 R 6 401 - R 12 800 R 12 801 - R 25 600
R 25 601 - R 51 200 R 51 201 - R 102 400 R 102 401 or more
Unspecified

30 | P a g e
Figure 2.11: Metropolitan change in income inequality over time, as represented by the Gini Coefficient (HIS
Markit, 2019)
Mirroring widespread metropolitan trends, the Khayelitsha, Mitchells Plain & Greater Blue
Downs District Human Development Index (HDI) has been increasing over time, most
markedly between 2009 and 2014 (Figure 2.12). In spite of this trend, the district HDI of 0.66,
as measured in 2018, is the lowest of all districts, sitting well below the metropolitan
average of 0.74. By contrast, the highest HDI was recorded in the Table Bay District at 0.81.
Figure 2.12: Metropolitan change in the Human Development Index over time (HIS Markit, 2019)
Spatial Distribution
As suggested by the above overview, income throughout the district is generally extremely
low. However, like with unemployment distribution, there do exist finer nuances between
areas (Figure 2.13). As of 2011, the poorest households are generally situated in Crossroads,
Philippi, Weltevreden Valley, Ikwezi Park, Mfuleni and the outer areas of Khayelitsha, the
0.50
0.52
0.54
0.56
0.58
0.60
0.62
0.64
Cape Town Table Bay Blaauwberg Northern Tygerberg Helderberg KMPBD Cape Flats South
Peninsula
Gin
i C
oe
ffic
ien
t
District
2009 2014 2018
0.50
0.55
0.60
0.65
0.70
0.75
0.80
0.85
HD
I
DIstrict
2009 2014 2018

31 | P a g e
majority of which live on a median monthly household income of R800 – R1 600. The three
areas of absolute lowest median monthly household income are Faure (R0 – R400) and
Boys Town and Klipfontein Glebe (R401 – R800). These areas coincide with those with high
unemployment as well as informal settlements.
The inner core of Khayelitsha is home to slightly wealthier households, mostly earning a
median monthly household income between R1 600 and R3 200. These areas also have
the greatest concentration of freestanding, fully owned homes in the district (see Chapter
7: Human Settlements).
Markedly higher income levels are observed in the Mitchells Plain and Greater Blue Downs
Sub-Districts, with households in the latter emerging slightly wealthier than the former. Most
areas in Mitchells Plain have a median monthly household income between R3 200 and
R12 600, while the majority of areas comprising Greater Blue Downs survive on a median
monthly household income between R6 400 and R12 000. Greater Blue Downs is also home
to the wealthiest area in the district: De Wijnlanden, the only area with a median monthly
household income between R25 600 and R51 200. Generally speaking, the two sub-districts
of Mitchells Plain and Greater Blue Downs are also those with higher levels of employment.
This, together with higher income levels, underpins the significantly greater degree of
bond-financed housing in these areas (See Chapter 7: Human Settlements).

0 | P a g e
Figure 2.13: Khayelitsha, Mitchells Plain & Greater Blue Downs District median household income spatial distribution across populated areas, 2011 (Census, 2011)

0 | P a g e
B. STATE OF THE
ENVIRONMENT

1 | P a g e
3 NATURAL AND HERITAGE ENVIRONMENT
The following section outlines the key environmental and heritage trends and spatial
implications that have been identified for the Khayelitsha, Mitchells Plain & Greater Blue
Downs District based on the Strategic Environmental Assessment, the City of Cape Town’s
State of the Environment Reports, the attributes for the district and other relevant policy
documentation.
Status Quo, Trends and Patterns
Geology, Topography and Soils
3.1.1.1 Geology
The geology of the area consists of bedrock of slightly metamorphosed sedimentary rocks
which underlies most of Khayelitsha/Mitchells Plain (Figure 3.1). Between present ground
level and the bedrock, a number of layers of sandy sediments occur in various forms, some
of which have been cemented into calcarious sandstone or sandy limestone. The most
modern deposits are loose, reworked and mobilised by wind, some of them occurring as
uncemented sand in dunes stabilized by vegetation. Key landform features linked to the
underlying geology and related processes include the limestone cliffs at Monwabisi and
Wolfgat and the remnant dune systems – both coastal (Kuils River, Macassar, Monwabisi,
Mnandi, Wolfgat and Strandfontein Cape Flats) and inland (Swartklip, and within
Rocklands, Westridge and Eastridge in Mitchells Plain).
3.1.1.2 Topography
(a) Limestone cliffs
During the Holocene period (18 000 – 16 000 years ago) the sea level began to rise and
started eroding the coast northwards from the mouth of False Bay. Unique cliffs began to
form as a result of the erosive force of the water. These cliffs can be seen at Wolfgat. The
northern remnant is best seen in the south-eastern corner of the Cape Flats1. The limestone
cliffs found on the False Bay coastline at Wolfgat are recognized for their uniqueness,
which has made them a rare landscape feature worthy of protection.
(b) Dune systems
The topography of the area has been altered significantly over the years. Rapid urban
development has led to the obliteration of the subtle but clearly undulating systems of
dunes. The remnants of these systems are however, clearly evident. These can be divided
into three broad dune systems:

2 | P a g e
Figure 3.1: Distribution of underlying geology across the Khayelitsha, Mitchells Plain & Greater Blue Downs District

3 | P a g e
1. Embryonic dunes
A basic “pioneering” dune system, usually along the coastline and just above the
high water mark2. The earliest stage of dune formation, occurring as small mounds
to low hummocks at the coast, often colonized or initiated by isolated plants3.
2. Parabolic dunes
A tongue of advancing sand with a rounded nose that migrates with the direction
of the wind. Parabolics also produce two trailing edges (the two “legs” of “hairpin
parabolics”). They can be unvegetated, but are generally stabilised by vegetation
on dune sides.4
3. Dune sand overlying bedrock: sandstone, limestone, granite
Undifferentiated dunes which lack any structure, but cover bedrock. According to
CCT (2004: 13) these are “undifferentiated dunes that lack structure but cover
bedrock”. Since these dune systems, by definition, are described as unstructured
accumulations of sand, the management implications are much less restrictive.
However, dunes that have formed over limestone are viewed in a different light as
they tend to support important vegetation types. These are considered sensitive to
development.
3.1.1.3 Soils
There are no areas within the district that contain soil of high agricultural potential.
However, the Philippi Horticultural Area, west of the district (situated within the Cape Flats
District), is successfully farmed.
Geohydrology
The Sandveld Group deposits constitute what is known as the Cape Flats Aquifer. The
aquifer is regionally unconfined and internally is essentially free of lateral hydraulic or
geological boundaries that may influence regional behaviour. The aquifer is not hydro-
geologically linked to any other aquifer, except the talus/scree material along the foot of
the mountains in the west. The aquifer pinches out against “impermeable” boundaries in
the east, west and north, while the southern boundary is defined by the coastline
extending along False Bay between Muizenberg and Macassar. The aquifer is recharged
principally from precipitation within the catchment. Groundwater flow in the Cape Flats is
either to the west to Table Bay or south to False Bay. The water in the main part of the
aquifer has a fairly low salinity, but is relatively hard. There is a build-up of salts in some
pockets of the aquifer due to very high evaporation rates.
The aquifer has been significantly affected by urban development, but is still regarded as
a viable supplementary water source for Cape Town. In the City of Cape Town Integrated
Water Resource Planning Study 10, the aquifer was one of several options investigated to
supplement bulk water supply. The key findings of the assessment of the aquifer’s potential
are summarized below:

4 | P a g e
The aquifer has an estimated sustainable yield of 18 million m3/annum and can be
utilised throughout the year.
The location of the Swartklip waste disposal site and the Mitchells Plain waste water
treatment works has increased the possibility of pollution of the aquifer water. It is,
however, possible to design the layout of the well-field to minimize the pollution
potential. The scheme would involve the drilling of 41 production and 20
observation boreholes as well as a water treatment works, buffer reservoir and
pump station.
The recommended well-field design would involve locating most of the high-
yielding boreholes in parks, school grounds and open public spaces in the high-
yielding zones, but would avoid the waste site and Mitchells Plain water treatment
works. The boreholes in the eastern zone would have to be located in the north-
eastern corner of the high-yielding zone so that the boreholes would be upstream
of the old and the existing Swartklip waste disposal site.
The possibility of pollution from these sources would thus be mostly negated. The
boreholes in the western zone would be located to the east, west and north of the
Mitchell’s Plain waste water treatment works. The boreholes would be located as
far as possible (at least 500 m) from the Philippi Horticultural Area to reduce the
impact of pumping on the area.
The possibility of seawater intrusion is limited because of the distance of the well-
field from the coast.
The water from the aquifer is extremely hard, but there are means to address this
problem. Softening, filtration and disinfection will be necessary.
The main source of recharge for the aquifer is precipitation within the catchment
basin, which is normally between 500 and 800 mm per year. Recharge was
calculated in 1980 when the Cape Flats were dominated by a dune-scape
invaded by Rooikrans and Port Jackson. The recharge estimates have not been
recalculated following urbanisation of the Cape Flats.
The impact that urbanisation has on recharge is expected to be positive due to
concentrated rivulets of storm water from roofs and paving, which can percolate
into the aquifer. Light rainfall events, which normally would not have resulted in
recharge events, add to the recharge of the aquifer due to the more concentrated
runoff. The removal of alien vegetation, which utilises a lot of water, and its
replacement with either irrigated gardens or barren open space also facilitates
recharge. Subsequent to clearing and the housing development in the Blue Downs
area, the water table has risen to such an extent that it is problematic.11
An initial consideration of the potential environmental and social impacts
associated with water abstraction indicated that there are unlikely to be any
impacts that cannot be addressed. However, should consideration be given to
utilising the aquifer water, a full environmental impact assessment will be required.

5 | P a g e
Biodiversity
3.1.3.1 Vegetation
Cape Town falls within a unique and globally significant biodiversity hotspot. From an
anthropocentric perspective, the city’s biodiversity is a valuable part of its heritage and is
an important driver of tourism, economic growth and social upliftment. The main national
vegetation type occurring in this area is Cape Flats Dune Strandveld (Table 3.1), which is
listed as Endangered and of which only 8% is conserved. Strandveld plays an important
role in terms of corridors for animals, ensuring connectivity between the coast and inland.
Approximately 76% of this vegetation has been transformed.
3.1.3.2 Fauna
There is a wide variety of avifauna in the area and those of conservation interest include
the Bank Cormorant and Cape Cormorants (Endangered) and Crown Cormorants (Near-
Threatened). There is also a heronry in the Khayelitsha wetlands and a Kelp Gull breeding
area at the Wolfgat Nature Reserve. Only two threatened amphibian species are
suspected to occur, including the Western Leopard Toad (Endangered). This species is
suspected to occur along the eastern edge of the district and there are unconfirmed
records from the Khayelitsha wetlands. The near-threatened Cape Rain Frog is also likely
to occur in the northern areas of the district. It is not associated with wetlands and could
be found in areas with remnants of natural vegetation. With respect to threatened reptiles,
the vulnerable Cape Sand Snake is also suspected to occur in Strandveld vegetation in
the area.
There are two butterfly species of conservation importance in the area, namely the False
Bay Unique Ranger (Critically Endangered), found in seeps associated with the Cape Flats
Dune Strandveld, and the Barber’s Cape Flats Ranger (Critically Endangered), found in
dune slack wetlands which have Cottonwool Grass.
3.1.3.3 Conservation Areas
There are a number of protected conservation areas in the district and they are discussed
below.
(a) The Driftsands Nature Reserve
Driftsands is a 900 ha reserve, surrounded by informal settlements and state-subsidised
housing development. It contains some of the last remnants of lowland Fynbos. Of the
remaining 11%, a mere 3% is formally protected. In addition to the rare plants, scientists
have also identified at least seven birds (including the African Marsh Harrier, Whiskered
Tern and Marsh Owl), one reptile (the Cape Sand Snake) and two amphibians (the Cape
Cacao and the Leopard Toad) that occur on the reserve.

6 | P a g e
Table 3.1: Conservation status of Cape Flats Dune Strandveld in the Khayelitsha, Mitchells Plain, Greater Blue Downs District (CCT State of Environment Report, 2018 &
CCT 2009 Biodiversity Network Report for historical figures)
Vegetation
type
Historic area in Cape Town (ha) Area of remaining vegetation
(ha) %
Remaining
of historical
area
% Historical area
proclaimed/
managed
Ecosystem status 2009
Biodiversity
Network Report
2018 State of
Environment
Report
2009
Biodiversity
Network Report
2018 State of
Environment
Report
Cape Flats
Dune
Strandveld
40 000 40 000 19 100 18 315 44.4 23.8 Endangered

7 | P a g e
At Driftsands Nature Reserve, CapeNature’s “urban” reserve, the grand vision for its use by
surrounding communities continues to be pursued. Collaboration between the
CapeNature and the Department of Social Services will see Driftsands being used as a
venue for ongoing youth counselling, with the aim of including the natural environment as
part of the counselling process. A suitable site for an initiation village, where the traditional
Xhosa initiation rites can be performed, has been established through public participation.
Another initiative that is well on track is the development of a cultural emporium that will
be a hub for local artists and crafters to market their products to tourists. Other ideas for
Driftsands include an organic vegetable garden, a medicinal plant nursery and the
expansion of environmental education programmes.
(b) The Wolfgat Nature Reserve
This 248 ha area along the False Bay coast between the Mnandi and Monwabisi recreation
resorts has been proclaimed as a local nature reserve. The reserve was originally
recognised due to its unique natural vegetation, dunes and spectacular coastal limestone
cliffs along Baden Powell Drive. It also boasts an abundance of space for outdoor
recreation and nature-based education. The indigenous vegetation consists of Cape Flats
Dune Strandveld (Endangered), which contains over 150 plant species. A major threat to
the reserve is the invasive alien Rooikrans tree (Acacia cyclops). This species has spread
across large parts of the coastline, smothering and killing local vegetation and severely
disrupting coastal ecosystems. The nature reserve also supports a great diversity of fauna,
including approximately 100 recorded bird species. A total of 15 mammal species have
been observed or are likely to occur in the area.
(c) Khayelitsha Wetlands Park
The Khayelitsha Wetlands Park is a 45 ha park, supporting and conserving a range of
species. The wetland is of important conservation value and is populated by many birds,
including herons, and is a nesting site for a diversity of migrant birds. This makes it an
important hub for ecotourism and the environmental education of local residents and
visitors. There is a playground for children, skate park and African mosaic murals for added
interest. The opportunities presented by this urban wetland park include the establishment
of habitat diversity, environmental education, ecotourism, economic benefits, visual relief
in an urban environment, recreation and social benefits.
(d) Macassar Dunes Conservation Area
The Macassar Dunes Conservation Area is a rich and varied natural area on the False Bay
coast. The sand dunes of Macassar are protected as a conservation area, as it contains
some of the best remnants of Cape Town’s unique Strandveld vegetation. With its dense,
evergreen shrubs and thickets, this endangered vegetation type is home to a wide range
of plant and animal species. Cape Flats Dune Strandveld grows along the slopes of the
dunes. Within the Macassar Dunes Conservation Area, one will also find a forest of White

8 | P a g e
Milkwood trees (Endangered). More than 80 different bird species can also be found in
the conservation area. Some include the Southern Double-Collared Sunbird, Black-
Shouldered Kite, Spotted Eagle Owl, African Black Oyster Catcher, Kelp Gull, Cape Bulbul
and Cape Spurfowl.
The Macassar dunes provide essential ecosystem services, such as shielding from high
winds and wind-blown sand, freshwater production and protection from storm damage.
It is essential that the biodiversity of the area is conserved so that it can continue to provide
these benefits to surrounding communities and visitors for years to come.
The conservation area has a fascinating cultural history as well. For many centuries, the
Khoisan people living along the coast harvested their food and medicinal plants here.
Also, in the 1600s, the first Muslim community in South Africa was founded here. The Sheikh
Yusuf shrine at Macassar is the most important Muslim shrine in Cape Town. It rests on the
summit of a vegetated sand dune close to Faure, near Macassar Beach. Over Easter
weekends thousands of Muslims camp behind the Macassar sand dunes to pay tribute to
the memory of the Sheikh.
(e) Welmoed (Penhill) Conservation Area
The Welmoed (Penhill) Conservation Area is one of 16 Biodiversity Agreement Sites that
are owned by the City of Cape Town and managed by the City Parks Department. The
Welmoed Conservation Area is 56.90 ha in size and comprises Cape Flats Sand Fynbos
(Critically Endangered), Swartland Shale Renosterveld (Critically Endangered) and Boland
Granite Fynbos (Vulnerable). It consists of more than 150 plant species, of which more than
14 species are of conservation concern as per the South African Red List categories. In
addition to the plant diversity that occurs on this site, there is also a significant number of
small mammals, reptiles, amphibians, birds and invertebrates that have been recorded.
Hydrology
The Khayelitsha, Mitchells Plain & Greater Blue Downs District has a diverse hydrological
environment (Figure 3.2). Due to the district’s large areas of shale and sand, it has lower
volumes of surface runoff and hence fewer water bodies such as wetlands, reservoirs and
dams than other regions within the metropolitan area. A notable exception are the
wetlands of the Kuils River floodplain. At the same time, this abundance of shale- and
sand-based soils translates to a generally very high water table.
3.1.4.1 Rivers and Estuaries
The Kuils River is the only major river that passes through the district (Figure 3.2 & Table 3.2).
It forms the backbone of the Kuils River Corridor, which connects CapeNature’s Driftsands
Nature Reserve with Macassar Dunes and the coast. The central low-lying areas of
Khayelitsha contain a series of interconnected wetlands (vleis), which form part of the Kuils
River floodplains. Over the years, the catchment has become urbanised and the terrain

9 | P a g e
levelled. Large stretches of the river have been canalised to minimise flooding. The
topography in the urbanised part of the catchment now has very gentle gradients, which
slope inwards towards an artificial drainage system that runs down the centre of
Khayelitsha. The river remains part of the stormwater management and some of the
stormwater collected in the eastern areas of the township is drained into the river.
The Eerste River estuary meets the ocean at Macassar Beach on the False Bay coastline.
The Eerste River is joined by the Kuils River approximately 4 km upstream of the estuary. The
estuary is typified by a broad back ponding area with a highly mobile estuary mouth. The
mouth is not canalised or fixed and is highly influenced by the prevailing coastal dynamics
of a wind-driven sand system as well as altered flow due to urban and farming impacts on
the greater catchment area. There is a large sewage treatment facility (Macassar
Wastewater Treatment Works) located adjacent to the back ponding area and
discharges final treated effluent directly into the estuary.
The flow of the river at the mouth is persistent as a net seawards flow. This is partly due to
the wastewater discharge contribution, which has the effect of keeping the mouth
generally open. Due to the fact that this system has a significant component of treated
sewage effluent, the natural estuarine characteristics have been significantly altered. The
objectives for managing such a system should therefore focus on the protection of
infrastructure while allowing beach and dune processes to function as naturally as
possible.
Table 3.2: Status of major rivers in the Khayelitsha, Mitchells Plain & Greater Blue Downs District (State of the
Environment Report, 2018)
River River
health*
Most notable problems
Kuils
River
Bad Canalisation
Release of treated effluent from urban areas and run-off
Littering
Infestation with alien vegetation
Infestation with alien fish in lower reaches
3.1.4.2 Wetlands1&2
The Kuils River has a substantial wetland system associated with it in the north eastern
section of the district (Figure 3.2). There is an extensive stormwater management system in
the area and many stormwater ponds were created, as remnant wetlands began to fill
up with stormwater after dunes had been levelled. Thus, many stormwater ponds now
replace wetlands that used to occur in the district. Although polluted, these have
recreational potential in association with parks and open space.
The Khayelitsha wetlands were once seasonal, but have become perennial due to inputs
from waste water works. Urban agriculture can be considered in areas between the 1:50-
year flood lines and the permanently wet areas, provided fertilisation and irrigation are
1 Source: Draft Environmental Management Framework for Khayelitsha and Mitchells Plain Urban Renewal
Programme, August 2005 2 Source: State of the Environment Report, 2018

10 | P a g e
well controlled to minimise nutrient input into the wetlands. The area between the 1:2 and
1:50-year flood lines can be incorporated into the planning of open space and could be
utilised for a variety of recreational, amenity, and productive land uses. These flood-prone
areas are not suitable for housing.
The main flood-prone areas within the wetland area are the informal settlement upstream
of Spine Road to the west of the river, the Silvertown area of Khayelitsha, the 9th South
African Infantry military base on the north-western banks of the river and the 9th South
African Infantry sewage works.
The Khayelitsha Wetlands Management Study identifies the wetlands (together with
Westbank, Driftsands and the Macassar dunes) as an amenity node. Thus, there is a need
to maximise the fitness for use of the water for at least intermediate contact recreation
and reduce nutrients to minimise risk of algal blooms. Stricter standards for and control of
sewage effluent as well as improved sanitation and storm water management will be
necessary to achieve this goal.
3.1.4.3 Groundwater 3&4
The district is underlain by the Cape Flats Aquifer, which covers an area of more than 400
km2 and extends from False Bay in the south to Tygerberg Hills and Milnerton in the
northeast and northwest, respectively (Figure 3.2). The aquifer is regionally unconfined and
internally is essentially free of lateral hydraulic or geological boundaries which may
influence regional behaviour. The aquifer is not hydro-geologically linked to any other
aquifer, except the talus/scree material along boundaries in the east, west and north,
while the southern boundary is defined by the coastline extending along False Bay
between Muizenberg and Macassar. The aquifer is recharged principally from
precipitation within the catchment. Groundwater flow in the Cape Flats is either to the
west to Table Bay or south to False Bay.
The drainage patterns are determined by the surface elevations. The major south-flowing
surface drainage features are the Kuils River, Lotus River and Diep River (all in adjacent
districts). The Kuils River joins the Eerste River (which flows from the Jonkershoek Mountains)
~3.5 km inland from the coast. Where the two rivers meet an area of wetland and marsh
is developed in Khayelitsha, known as the Kuils River Wetlands. The Eerste River then flows
towards the southeast and discharges at the ocean.
The water in the main part of the aquifer has a fairly low salinity but is relatively hard. There
is a build-up of salts in some pockets of the aquifer due to very high evaporation rates. The
aquifer has been significantly affected by urban development but is still regarded as a
viable supplementary water source for Cape Town. Aquifer water would need to be
softened, filtered and disinfected prior to use.
3 Source: CSIR Report, March 1995 4 Source: Indego Report

11 | P a g e
Figure 3.2: Hydrology of the Khayelitsha, Mitchells Plain & Greater Blue Downs District

12 | P a g e
The Cape Flats Aquifer is an important source of irrigation water for vegetable farming in
the Philippi Horticultural Area (located to the west in the adjacent Cape Flats District). The
recent drought that was experienced in Cape Town has placed pressure on finding
additional resources to provide in the demand of water. The Cape Flats aquifer was one
of the areas identified as part of the water augmentation scheme and detailed aerial
mapping was done to find suitable extraction points. Potential locations for boreholes
have been identified – school grounds, parks and public open space play an important
role in enabling the aquifer to be used in the future.
Coastal Areas and Dunes5
3.1.5.1 Coast
The coast in this district is relatively intact, which makes it less vulnerable to the effects of
storms or sea level rise. However, it is a dynamic and exposed coastline and any structures
in the coastal area are vulnerable to extensive damage from wind and sand – and thus
have very high maintenance costs. Access and security problems have hampered the
realisation of the coast’s considerable recreational potential.
Coastal nodes have been identified for intensification at Mnandi and Monwabisi with
forms of development that support their function as a point of attraction without
detracting from it. These nodes make responsible use of the social and economic benefits
of the coast, certain public spaces, historical and biophysical assets. It may include a
range of functions from businesses (shops, services and restaurants), social facilities
(including recreation and resorts) and residential development.
3.1.5.2 Dunes
Macassar contains the tallest and most extensive remaining parabolic dunes on the Cape
Flats. They offer exceptional views of the nearby Helderberg, Hottentots Holland and
Kogelberg Mountains and the Cape Peninsula. Prior to the development of Khayelitsha,
the length of the dune system was 8 km. With urbanisation, the length of the dune has
been significantly reduced and most of the last of this remnant dune system can be found
between Baden Powell Drive in the west and the Eerste River estuary in the east. The dune
system has created a major physiographic corridor between the sea and the areas closer
to Macassar Road. Its width varies between 3 km along Baden Powell drive and 1.5 km
between Sheik Joseph’s tomb and the coast. In spite of ongoing urbanisation, the
Macassar dune system is still recognized as a significant feature of the Cape Flats
landscape and can be seen from over 20 km away.
5 Source: City of Cape Town Coastal Management Programme, 2015

13 | P a g e
Two other remnant dunes which are of particular interest in terms of their effect on the
landscape are the Lookout Hill dune, which gives panoramic views over Khayelitsha and
the peninsula, and the Rocklands and Dagbreek dunes, which give views over Mitchells
Plain. The dunes break the flat monotony of the Cape Flats and, if well managed, provide
opportunities for both ecotourism and environmental education. However, when the
dunes are not integrated into the urban fabric, they can become a security problem, as
noted in the following sections.
Further to the above the dunes at the Khayelitsha wetlands, although they have been
severely disturbed and reduced in extent, should be retained as a buffer around the
wetland, whilst smaller dunes which occur within the wetland itself should be preserved.
The natural Rocklands dune area is the last existing dune, and is part of the Cape Tourism
route. This route starts at Baden Powell drive and extends to Mnandi beach.
Agriculture and Mineral Resources 678
3.1.6.1 Agriculture
There are no areas with soil of high agricultural potential in the district. However, the
Philippi Horticultural Area, located on its western boundary in the Cape Flats District, is
successfully farmed. Furthermore, according to the draft EMF for Khayelitsha and Mitchell’s
Plain Urban Renewal Programme, August 2005, urban agriculture is an area of great
potential. Although the soils in the Khayelitsha area are nutrient-poor, trench gardening
can lower the input costs and incorporate recycling. The Kuils River Metropolitan Open
Space System (MOSS) Study supports this form of agriculture in appropriate areas. The
Khayelitsha Wetlands Management Study (1999) recommends the initiation of urban
agriculture (e.g. market gardening) in the riparian zone between the 1:50-year flood lines
and the permanently wet areas. Infrastructure for irrigation and careful control of
pesticides and fertilisers would be required in order to maintain the water quality of the
river. A zone of grass swales and other devices to trap pollutants and nutrients from the
food gardens may be required. An area of about 25 ha east of the 9th South African
Infantry sewage works could provide an area for short-term stock grazing. However, the
study recommends that over time, cattle and goat grazing in Khayelitsha be phased out,
as they cause significant erosion and water quality problems. Livestock grazing is not
appropriate in Strandveld remnants, which would not historically have supported resident
herds all year-round.
6 Source: Draft Environmental Management Framework for Khayelitsha and Mitchells Plain Urban Renewal
Programme, August 2005 7 Kuils River Metropolitan Open Space System Study 8 Khayelitsha Wetlands Management Study, 1999

14 | P a g e
3.1.6.2 Mining
The district has significant sand resources which occur in three main areas, namely Philippi
(on its north-western edge), Macassar (on its south-eastern edge) and Kuils River (towards
the north-eastern edge). Philippi is the traditional sand mining area of Cape Town.
Problems are experienced with illegal sand mining and mining in inappropriate areas,
where there are conflicts with biodiversity as well as residential areas. The sand is used for
fill, mortar and, to a lesser extent, plaster and concrete.
Building sand is also found within the Wolfgat Nature Reserve and along the Strandfontein
coastline. There are also several “illegal” sand mines. Illegal sand mining has further taken
place in the Monwabisi dunes, south-west of the formal sand mining area in the Macassar
dunes. There is ongoing pressure to mine these dunes. Smaller amounts of sand are
regularly removed illegally from remnant dunes in the area. This poses a danger for the
neighbouring communities’ children, who are tempted to play in the dune areas and are
vulnerable to suffocation from unstable collapsing dune faces. This activity also
undermines the potential to derive other benefits from the remaining dunes.
Air Quality
The right to clean air is a basic human right. The quality of air is a key factor affecting the
health of a city as air pollution represents a major health risk to residents. The three main
types of air pollutants measured and reported on by the City of Cape Town are as follows:
1. Nitrogen dioxide (NO2)
2. Sulphur dioxide (SO2)
3. Particulate matter (PM10)
In general, NO2 levels have decreased over the past 12 years. They are generally within
the guidelines standard. SO2 levels have maintained low trends over the past 12 years,
keeping within the guideline standards with discrepancies occurring every few years.
However, PM10 levels are more problematic and have considerably increased at most sites
over the years. The Khayelitsha, Mitchells Plain & Greater Blue Downs District has higher PM
levels from cooking fires and burning of waste, which is exacerbated by the high wind
exposure in the urban area.
Green Infrastructure
Green Infrastructure can be defined as a strategically planned, designed and managed
network of natural open spaces and “engineered” ecological systems which provide
ecological, community and infrastructure services. In addition to further motivating for the
protection of existing natural assets such as biodiversity and the coast, green infrastructure
recognises the role and importance of a range of urban green spaces or parts of the
urban system, including but not limited to gardens, trees, parks and storm water infiltration
areas.

15 | P a g e
The City is in the process of identifying and mapping a green infrastructure network (GIN),
identifying and ranking green infrastructure services, the opportunities they present and
benefits they provide.
Metropolitan open space is a key component of green infrastructure. Cape Town’s
recreational open spaces are mapped in Figure x (Chapter 4). Furthermore, a
metropolitan open space network was prepared for the 2018 CTMSDF and will be
reviewed through the GIN.
GREEN INFRATRUCTURE MAP TO BE INCLUDED WHEN AVAILABLE
Heritage and Cultural Resources
3.1.9.1 Historical Development
The historical narrative of the establishment and development of Cape Town as a
settlement, and into the city it is today, is reflected in its diverse cultural heritage and the
wide range of heritage resources that form a sense of identity that should be preserved
and conserved for future generations.
The Khayelitsha, Mitchells Plain & Greater Blue Downs District has many similarities to the
Cape Flats District in that its historic development can be seen as a product of Apartheid
town planning. Mitchells Plain was established as a township in 1971 by the City of Cape
Town to accommodate people racially classified as “coloured” under the Apartheid
regime who were evicted and forcibly removed from District Six. Pockets of smallholdings
remain, especially along the Kuils River corridor and also towards the boundary with
Stellenbosch. Khayelitsha was subsequently established in the 1980s on the drift sands to
the east of Michells Plain.
3.1.9.2 Archaeological Heritage Resources
This district is an extension of the Cape Flats and similarly, there is a relatively small
archaeological signature, possibly as a result of it being hot, dry and windswept in summer
and wet and marshy in winter. Isolated stone artefacts and a human burial indicate that
this area was frequented by indigenous people for many millennia prior to the
establishment of the settlement at the Cape. It has been said that, at the time of the
construction of the Strandfontein Pavilion in the 1960s, a number of Later Stone Age burials
were disturbed in the dunes.
However, palaeontological remains have been found in the coastal dunes at Wolfgat
Nature Reserve. These largely appear to be carnivore lairs and contain fossilized animal
bone.

16 | P a g e
3.1.9.3 Cultural Landscapes: Living Heritage
The Rocklands Community Hall in the Mitchells Plain Sub-District was declared a Provincial
Heritage Site in 2019. Apart from this, there are no formally protected cultural heritage sites
in this district.
One of the challenges in heritage management in the district is the identification of
Apartheid struggle sites and other sites where the heritage significance is intangible and
not reflected in the physical fabric of the space. A secondary challenge has been the
identification of sites of living heritage and cultural practices. Consequently, very few
places of cultural and heritage significance in the district have been officially mapped or
demarcated by the City, which constrains its ability to manage those spaces effectively.
Living heritage practices should therefore be acknowledged, incorporated in and
recognised as part of the district’s cultural landscape and managed accordingly.
The Khayelitsha, Mitchells Plain & Greater Blue Downs District is characterized by high-
density, low-income housing interspersed with pockets of undeveloped natural land
(endangered and vulnerable ecosystems). Undeveloped land in this district fulfils a critical
social role as sites of traditional practices relating to coming-of-age ceremonies and
traditional healing, which form part of daily life in communities. As many of these practices
require seclusion (visual and physical), it is necessary in the forward planning of the city to
identify these spaces and ensure that provision is made for their protection.
Some of the traditional practices referred to above include the following:
(a) Male circumcision and initiation practices
Male initiation and circumcision practices play a vital role among Xhosa-speaking
communities in the Western Cape. Due to the District’s urban nature, people do not own
any land to practice this cultural ritual. The tendency in Khayelitsha is for communities to
use any open space they can find irrespective of land use and ownership.
The minimum requirements for an initiation site are:
Reasonable distance from residential areas;
Not visible to people, in particular women (i.e. in a vegetated area); and
In an area not utilised or accessed by women during the initiation time.
Sites utilised for initiation vary. However, the following sites have been used for initiation
purposes:
Greenpoint circumcision site (Spine road off-ramp from the N2)
Town 2 (behind the Magistrate’s Court in the KBD)
A’s to C’s (land adjacent to Lookout Hill)
Site B (portion of Greenpoint)
Makhaza: Section 42 (behind dairy and Nade’s shop)

17 | P a g e
(b) Traditional healing
Common practices of traditional healers include:
Gathering medicine (Macassar dunes, wetlands)
Cleansing ritual (require secluded land)
Male initiation ceremonies
(c) Keeping of livestock
Animals (cattle, sheep, goats, horses, donkeys, pigs) are used for cultural rituals and
economic practices. Grazing and keeping of livestock occurs on all vacant land
irrespective of ownership and land use.
(d) Burial sites
It is cultural practice to bury and not cremate the dead. The cemetery is thus culturally
significant and will need to be expanded.
(e) Various uses of the sand dune areas
The sand dunes are used for the harvesting of wood and medicinal plants. Lookout Hill,
located on Bonga Road, is one on the last remaining sand dunes in the area, providing a
view of the coast and across the Cape Flats scenic routes.
3.1.9.4 Scenic Drives
The development of a Scenic Drives Network aims to link the diverse parts of the Cape
Town metropolitan area through the promotion of the scenic qualities and tourism
potential along the existing road network. The following criteria are used to identify a
scenic route:
Outstanding scenic qualities in terms of views (cultural or natural landscapes)
Scenic qualities with a strong sense of place
Range of scenic qualities
High natural or cultural landscape qualities
Links between major scenic, historical (or recreational) points of interest
Two main categories of Scenic Route were identified:
S1: Routes fulfilling requirements of both “scenic” and “drive: limited access routes
through areas of scenic value (largely natural/rural, with high scenic qualities)
S2: Routes fulfilling the requirements of “scenic”, but not “drive”: Routes that
traverse scenic areas, but which are frequently accessed (largely urban, but with
high scenic qualities)
The Khayelitsha, Mitchells Plain & Greater Blue Downs District has one Scenic Route: Baden
Powell Drive. It is the longest Scenic Route in Cape Town, functioning as the link between

18 | P a g e
the urbanised areas of Muizenberg and Stellenbosch. At the same time, the route
originates at the Table Mountain range and extends along the False Bay coastline, passing
through areas of pristine natural vegetation with views across the bay. As such, it is
categorised as an S1 Route, fulfilling both “scenic” and “drive” functions.

19 | P a g e
Figure 3.3: Composite map of the Khayelitsha, Mitchells Plain & Greater Blue Downs District bio-physical environment

20 | P a g e
Figure 3.4: Composite map of the agricultural potential and (officially demarcated) cultural/heritage resources in the Khayelitsha, Mitchells Plain & Greater Blue Downs
District

21 | P a g e
Key Development Pressure and Opportunities
Development Pressures and Constraints
3.2.1.1 Biodiversity
Illegal harvesting of medicinal or other plants, including firewood.
Natural fire regimes have been altered in the district due to an increased incidence
of fires resulting from human activity and negligence. Fires thus occur more
frequently than the historic interval of approximately 15 years. There is urgent need
to prevent more frequent fires from occurring in Strandveld vegetation, as these will
eliminate some species that have not evolved to adapt to such regimes.
Hunting (snares and hunting with dogs).
Loss and fragmentation of remnant natural habitat due to urban development
pressure.
Encroachment of invasive alien vegetation and fauna as well as development on
rivers and wetlands.
Illegal sand mining, especially in or near critical biodiversity areas.
3.2.1.2 Hydrology
Demand for open space for cattle and goats – both of which have negative
impacts on rivers and wetlands.
Pollution of rivers and the aquifer.
Development in areas identified as being potential aquifer water extraction points.
Development pressures – specifically housing and associated services and
infrastructure.
Past land use activities (i.e. the landfill site and cemetery) that have polluted the
aquifer and limited areas where water can be extracted.
Potential for future changes in ground water and aquifer water quality and quantity
due to climate change, in combination with increased hardening of surfaces due
to development (potential for higher water table and possible ingress of sea water).
Encroachment of informal settlements into storm water management areas,
including detention ponds
3.2.1.3 Coastal Areas and Dunes
Demand for more recreational areas on and access to the coast.
Development pressures and demand for settlement/housing on the coast.
Security issues (dunes overlooking residential areas). High crime rates constrain the
potential for tourism development in the area.
Encroachment of informal housing into dune areas as is happening in the dunes
northwest of Monwabisi (‘Monwabisi village’) and the eastern edge of the
Dagbreek dune (‘Dagbreek informal settlement’) and north west of Baden Powell
Drive (Ekanini, which will be formalised).
Illegal sand mining.

22 | P a g e
Lack of capacity and resources to manage dunes and absence of an integrated
dune management plan.
Encroachment of development into coastal dune systems (e.g. the planned
developments at Mnandi and Monwabisi).
Inappropriate development along coast resulting in dune destruction (e.g.
Monwabisi) and high maintenance costs associated with removing windblown
sand.
Costs (social and financial) of vandalism and crime constrain full utilisation of coast
and its resources.
High maintenance and management costs of inappropriately designed and
located infrastructure (e.g. Monwabisi).
The existing tidal pool and breakwater at Monwabisi create dangerous swimming
conditions.
Pollution of the southern portion of the Macassar dunes from the outflows of the
pump station that is located in the dune area north east of the Monwabisi resort.
3.2.1.4 Agricultural and Mineral Resources
Pressure to open more sand mining areas due to the demand for building sand
(e.g. application to mine Dagbreek dune).
Opportunity losses for future land use in the sand mining areas as mining is going so
deep (into the water table) that post-mining land use options will be extremely
limited.
Presence of building sand in areas that are highly sensitive in terms of coastal
dynamics and/or biodiversity, making it undesirable to mine this resource.
3.2.1.5 Heritage and Cultural Resources
The development of natural heritage such as the Swartklip site as well as the coast.
The Philippi East area has remnant clumps or avenues of large gum trees which also
have heritage significance.
Along the coast, there is evidence of Strandloper middens, and a paleaontological
site occurs near Wolfgat Nature reserve (although vandalism and natural erosion
have largely removed any evidence of the site).
There are many contemporary heritage areas associated with struggle sites or
meeting places (usually located in schools or halls) which have no protection status
and which are vulnerable to alteration or loss.
Many of the undeveloped open spaces are used for cultural practices, such as
initiation. There are no formally recognised initiation sites.
Lack of awareness of what constitutes an archaeological and/or palaeontological
resource/site is likely to lead to accidental (or possibly intentional) destruction of
possible sites. Many of the resources are likely to have been buried and only
movement of dune sand or excavation activities (e.g. mining) are likely to reveal
possible resources.
There is a high risk of historical and cultural sites being overlooked in the rapid
development process

23 | P a g e
Integrated Opportunities
Conservation of core environmental features and assets (including POS, beaches, rivers,
wetlands, biodiversity etc.) will yield the following integrated benefits for the future growth
of the city and its residents:
3.2.2.1 Economic Development
Job creation and GDP growth through many different types of tourism possible in
the area.
Strategic and detailed planning for the Swartklip site (owned by ACSA) and the
coastal nodes (Monwabisi, Mnandi, Kapteinsklip). Development of these areas
should be geared to retention of their biodiversity value and creation of socio-
economic opportunities.
The coastal resort nodes of Monwabisi, Mnandi and Kapteinsklip (future) should aim
to link the communities with the coast, but be designed in such a way as to
maintain the east west coastal “green” corridor, which is critical for climate change
adaptation and coastal protection.
Sustainable harvesting of medicinal plants, selected flowers and fruits.
The river and stormwater corridors present significant opportunities for multi-
functional uses, including parks, recreation, and sport and, in some areas, urban
agriculture. There is potential for managed and sustainable harvesting of wetland
plant species (refer to the Metropolitan Open Space System reports).
Protection and management of the Khayelitsha wetland park.
Maximise cultivation and harvesting of indigenous plants for craft, medicinal and
building purposes should be investigated. A medicinal garden has been proposed
in the area west of Spine Road extension.
There is significant potential for smaller-scale urban agriculture within Mitchells Plain,
and particularly Khayelitsha
Opportunity to use the sand resource must be realised in all areas where
development is to take place (i.e. if there is sufficient sand that can be used)
3.2.2.2 Resilience
Preservation of critical biodiversity and open space improves the city’s ability to
adapt to the impacts of climate change and mitigate risks associated with natural
and unnatural disasters, by increasing our ecological footprint, diversifying natural
resources, providing protection from storm surges and coastal erosion, etc.
The Cape Flats Aquifer forms part of the water augmentation scheme as a potential
source of water for Cape Town. This ground water source is critical for water
security, especial in the context of more frequent droughts and a generally hotter,
drier future climate in the Western Cape. The Cape Flats aquifer
Rivers and wetlands provide flood control.

24 | P a g e
3.2.2.3 Social Development
Creating a sense of place and belonging by preserving and enhancing the city’s
cultural identity.
Outdoor and recreational spaces (i.e. POS, parks, beaches, vleis etc.) promote
social contact and interaction.
Environmental and heritage education (as is currently taking place in the Wolfgat
Nature Reserve and Macassar dunes areas).
Archaeological, paleontological research.
Spatial Implications for District Plan
Table 3.3 below documents the key spatial implications for the District SDF in order to
mitigate any potential negative impact on the natural and cultural environment and
enhance the opportunities associated with conservation of natural and cultural resources.

25 | P a g e
Table 3.3: Environmental Spatial Implications
NATURAL/CULTURAL
RESOURCE SPATIAL IMPLICATION
A. Biodiversity
1. Conservation and appropriate sustainable utilisation of key biodiversity resources. A balance needs to
be achieved between preservation in some areas and in others, conservation with sustainable use – e.g.
harvesting of plants, ecotourism activities, particularly hiking and specialist ecotourism e.g. botanical or
birding tours.
2. Retention and sustainable utilisation of ‘green’ corridors such as the coastal corridor linking Strandfontein
to Monwabisi.
3. Ensuring developments face onto green corridors or conservation areas – for both security and amenity
purposes.
4. Maintenance of indigenous vegetation types and habitat, particularly in green corridors. Topographical
diversity must also be retained wherever possible to provide more varied habitats and provide wind
shelter.
5. Conservation of specific vegetation remnants for endangered species. The Khayelitsha Wetlands
support a multispecies heronry in its eastern section. It is used by migrant birds as a nesting site between
September and January (Egrets, Herons, Ibises, African Spoonbills and Reed Cormorants).
6. Consideration of habitat requirements of key species when designing developments in Greenfield areas
such as Mnandi and the Swartklip site.
B. Rivers, Wetlands and
Ground Water
1. Creation of viable river corridors with suitable buffer zones.
2. Restoration of river systems wherever possible, particularly through recreation of natural river systems
which have both flood control and water cleansing functions (as opposed to canalised systems).
3. Prevention of inappropriate land uses next to or within the Kuils River, its floodplains and wetlands and
any tributaries as well as over the aquifer.
4. Prevention of illegal dumping and littering, particularly in areas where dumped material can enter storm
water or river systems.
5. Prevention of further encroachment of informal settlements into stormwater management areas and
wherever possible, relocation of settlements that are currently located in flood zones

26 | P a g e
C. Coastal Areas & Dunes
1. To manage, protect and sustainably utilise landforms that are of particular value, either scenically, or
due to their ecosystem or other functions.
2. To restore landforms to either their previous state, or an agreed appropriate land use
3. Identification, conservation and sustainable utilisation of key dune systems. These include the dunes in
the Wolfgat Nature Reserve, the Swartklip site, and the remaining dunes that have some conservation
and socio-economic value in Mitchell’s Plain
4. Retention, wherever possible of dune corridors – i.e. dune systems or systems that are linked to other
ecological or river corridors
5. Retention and protection of the coastal cliffs at Wolfgat.
6. Wherever possible, relocation of coastal infrastructure and services into areas less vulnerable to coastal
erosion and/or inundation.
7. Design and management of new coastal nodes (and any other coastal infrastructure). This will be
particularly important at Mnandi and Monwabisi.
8. Retention of a functional ecological coastal corridor (including through the new coastal nodes) to
maximise retention of biodiversity and faunal corridors and maintain opportunities for ecotourism.
9. Increase the safety and security of the coastal zone and amenities to encourage sustainable utilisation
throughout the year.
10. Provide facilities for safe bathing.
D. Heritage and Cultural
Landscapes
1. Recognise and acknowledge living heritage practices and ensure the identification and protection of
cultural landscapes associated with living heritage
2. Promote heritage and environmental education using archaeological and palaeontological heritage
(information and sites where relevant) as illustration of eg effects of climate change, sea-level rise
(coastal cliffs).

27 | P a g e
E. Mining and Agriculture
1. Extraction of sand in all areas where this is possible, taking the natural (biodiversity) and socio-economic
conditions and status into account.
2. Prevention of illegal sand mining.
3. Adherence to EMPR conditions (rehabilitation plans for mining) – so as to enable desired post mining
land use.

28 | P a g e
C. STATE OF THE
BUILT
ENVIRONMENT

29 | P a g e
4. LAND USE AND DEVELOPMENT TRENDS
As discussed in Section 1.11 District Overview, Khayelitsha, Mitchells Plain & Greater Blue
Downs is characterised primarily by sprawling, low-density, dormitory residential
neighbourhoods, designed and built in service of Apartheid racial segregation. As such,
the district has very limited non-residential land uses (e.g. retail, commercial, office, social
facilities and recreational) in comparison with the rest of the city. The district also has three
industrial areas found in Blackheath, Eersterivier and Philippi, with some being more sought
after than others in terms of development take-up.
Amidst this largely mono-functional development, large portions of “vacant” land are
found across the district, zoned for agricultural purposes or as open space. However, these
areas often coincide with the City’s biodiversity network, including protected areas, water
bodies and critical biodiversity areas. The most prominent pockets of remaining
agricultural smallholdings are located along the Kuils River corridor as well as towards the
boundary with Stellenbosch.
The following sections provide an overview of the key development trends per land use in
the Khayelitsha-Mitchells Plain-Greater Blue Downs district. It is by no means meant to be
an exhaustive list, but rather indicative of the status quo as well as emerging trends in the
broader district.

30 | P a g e
Figure 4.1: Khayelitsha, Mitchells Plain & Greater Blue Downs District building plan approvals according to land use type, 2015–2018 (CCT Development Management
Department, 2019)

31 | P a g e
Residential
The district has seen a vast increase in residential development over the past five years,
particularly in the form of GAP and subsidised housing typologies catering for low- to
medium-income groups. There has been a trend of shifting towards more medium- to
high-density developments. Incremental residential zonings (Single Residential 2) are
predominantly found within Crossroads, Philippi, Mfuleni, Wesbank, Happy Valley and
Khayelitsha.
The largest residential developments in the district over the past five years are outlined in
Table 4.1 below:
Table 4.1: Largest residential developments in the Khayelitsha, Mitchells Plain & Greater Blue Downs District,
2014–2019 (CCT Human Settlements Department, 2019)
Development
name Sub-District Housing typology Status Yield
Forest Village Greater Blue
Downs Subsidy Constructed
4 698 BNG
122 GAP
Watergate
Village Mitchells Plain GAP Constructed 260 GAP
Bardale
Village
Greater Blue
Downs GAP
Constructed (8
phases)
Phase 1: 694 GAP
Phase 2: 565 GAP
Phase 3: 219 SR & 7
sectional title
Phase 7: 420 GAP
Penhill
Greater Blue
Downs
(Blackheath)
Development
authorisation
granted
8 000 sites
Enkanini Khayelitsha Subsidy
Development
application in
progress
To be finalised
Happy Valley
Greater Blue
Downs
(Blackheath)
Subsidy Constructed
Belladonna
Greater Blue
Downs
(Blackheath)
GAP Constructed
Fountainhead
Greater Blue
Downs
(Blackheath)
GAP & Subsidy Constructed
Aloe Ridge Mfuleni BNG
Development
application in
process
1 368 BNG
In addition to the above, the Southern Corridor Human Settlement Programme focuses on
the implementation of the N2 Phase 1 and 2 projects and upgrading of 27 linked informal
settlements in the vicinity, which would benefit more than 50 000 households. The intention
of the programme is to function as a joint initiative between the Western Cape Provincial
Government and the City of Cape Town, which would include approximately 24 principal

32 | P a g e
projects. Figure 4.2Figure 4.1 below indicates the locations of proposed projects that form
part of the Southern Corridor Human Settlements Programme in relation to the location of
informal settlements. It is noteworthy to mention that the district includes agglomerations
of some of the largest of informal settlements within the city, including, but not limited to,
Monwood, Kosovo, Marikana, Philippi TRA, Monwabisi, Enkanini, Green Point, Bosasa, QQ-
, RR- and BM-Sections and Burundi.
Figure 4.2: Proposed projects of the Southern Corridor Human Settlements Programme in relation to informal
settlements
With the inclusion of second dwellings in Single Residential zoning as an additional use
right, the process for obtaining such rights has been made significantly faster, in some
instances only necessitating the submission of a building plan. The DAMS building plan
data indicates that between 2012 and 2017, approximately 270 building plans have been
submitted for second dwelling units. It should be noted that this is only an indication of
formal submissions and does not provide an indication of the status or scale of informal
and illegal constructions.
Industrial
There currently exist a several industrial nodes across the district, found in the
Blackheath/Saxenburg, Philippi and Eersterivier areas. Smaller industrial pockets are also
found in Khayelitsha (Spine Road and Ntlazane Road) and Blue Downs.
The Saxenburg and Blackheath industrial areas have been performing well over the past
few years, as can be seen from the building plan data mapped in Figure 4.1. It can be

33 | P a g e
assumed that this is a result of their close proximity and accessibility to national freeways
like the N1, N2 and R300. Furthermore, they are located slightly outside the heavily
congested metropolitan centre, which makes these areas more attractive for many
companies and entrepreneurs that do not need to be located within the city centre due
to their nature of business, but still accessible in order to do business conveniently.
Other industrial activities are those associated with the Lafarge quarry and the adjacent
defunct Eersterivier industrial area. The Lafarge quarry is very space-intensive and will still
be operational for the next 40 years. However, it does not generate significant
employment opportunities as with other similar types of industries. Furthermore, the
Eersterivier industrial area to the south of the Lafarge quarry was rezoned in the late 1990s
and the De Wijnlanden residential development was established on a portion thereof. The
remainder was retained as industrial land and subdivided for that purpose, but due to no
market uptake it was rezoned in 2018 for the purpose of mixed-use development,
including residential, community, commercial/retail, open space and related
infrastructure.
There has not been a large take-up of industrial land in Philippi. Furthermore, there is an
apparent trend towards the provision of warehousing over more significant employment-
generating industrial activity.
Retail and Office
There are very limited established commercial/retail developments within the district and
the increase in retail developments has also been slow. It is noteworthy to highlight that a
large retail development with a gross lettable area (GLA) of 25 000 m2 was approved in
Blue Downs in 2013 (corner of Hindle Road and Saxdown Road), but that this approval has
never been acted upon.
The Khayelitsha CBD has not grown extensively and most of the land surrounding it is still
vacant. Only Smaller retail developments such as the Site C Plaza and Harare Shopping
Centre, which mainly serve their surrounding neighbourhoods, have been established
since 2012. However, there have been initiatives from the private sector to intensify mixed
uses adjacent to the Khayelitsha railway station in the form of residential mixed with retail
opportunities. Similarly, Philippi has seen limited growth with the extension to the Philippi
Shopping Centre and the new Philippi Plaza, while Mitchells Plain has seen the
development of Watergate Shopping Centre on the corner of the R300 and AZ Berman
Drive and additions to the Promenade.
Mixed Use
Applications that have been submitted for mixed-use development in the district have
been predominantly small in scale and mostly comprise of retail on ground floor with
residential accommodation above. There has not been a vast increase in mixed-use
development in specific areas, but the trend has been to develop these uses primarily
along main roads and movement corridors.

34 | P a g e
Home-Based Enterprises
The factors discussed above have resulted in a high unemployment rate and limited
employment opportunities in the district, which has forced residents to find alternative
sources of income. This is evident in the number of land use applications for house shops,
liquor shops and early childhood development centres (ECDs). In addition to these, many
property owners are submitting building plans for second dwelling units, which serves the
dire need for additional housing opportunities whilst also creating additional rental income
for property owners.
Agricultural Land and Smallholdings
The only areas in the district that has been actively, though not extensively, used for
farming are located along its north-eastern edge, namely Jacobsdal, Penhill and
Stellenbosch Farms. There have been enquiries from property developers for the potential
rezoning of some of these properties for the purpose of light industrial uses.
Furthermore, Penhill also includes a smallholding area, located along Van Riebeeck Road
and the Stellenbosch Municipal boundary. There have been a few applications for
subdividing these smallholdings into smaller portions. The Penhill area has a development
guideline which sets the minimum erf size at 2000 m2 in order to protect its rural character,
with a distinction between development areas closer to Van Riebeeck road and those
closer to the edge of the city.
Monwabisi & Mnandi Coastal Areas9
The district has two identified coastal nodes, namely Monwabisi and Mnandi, which have
historically been underserved. The Draft Coastal Economic and Spatial Framework for
Cape Town has identified these as areas potentially developable as destination places,
with a high volume of visitorship (recreation and tourism) through greater intensification
within the existing coastal urban areas rather than transforming pristine coastal areas. The
development of public transport infrastructure has also been highlighted as a key
intervention in order to unlock the accessibility of these nodes.
Supportive Land Uses
There is a number of tourist-related features, including coastal nodes, nature reserves and
local home enterprises, that is not attracting sufficient investment or gaining enough
traction to promote and support the district’s local destination places. The requests for the
accommodation of telecommunication infrastructure (typically freestanding base
telecommunication stations) are increasing, and the pressure on the development
9 Cape Town Draft Coastal Economic and Spatial Framework, November 2017

35 | P a g e
management offices to process these applications is high. Other supportive land use
requests include home-based ECDs of varying scales, which primarily provide a source of
income to unemployed community members.
Development Pressures
The areas that are currently experiencing the greatest amount of development pressures
linked to limited capacity in terms of availability of land, services and infrastructure are
listed below:
Khayelitsha: Residential, retail for employment and initiation sites
Mfuleni: Residential (formalisation of informal settlements), employment
opportunities and initiation sites
Blue Downs: Employment opportunities and development of the Blue Downs Rail
Link
Mitchells Plain: Employment opportunities and youth development initiatives
Philippi: Residential and employment opportunities,
Vacant land
Figure 4.3 depicts all vacant land opportunities in the Khayelitsha, Mitchells Plain & Greater
Blue Downs District. Vacant land has been grouped into four categories using criteria as
outlined in Table 4.2. It must also be noted that land falling within the Critical Natural Assets
and Discouraged Growth Spatial Transformation Areas (STAs), as designated in the
CTMSDF, have been excluded from Figure 4.3
Most vacant land in the district is located either as part of nature reserves along river
corridors or agricultural land. Properties shaded in blue and grey are land zoned for
community or recreational use, and should ideally be reserved as such in order to
accommodate existing communities and anticipated growth/intensification in residential
development. However, there are some larger-scaled properties which can potentially
accommodate additional mixed-use development (non-residential and residential land
uses combined), other than only community or recreation. For example, the Swartklip site
has been identified as a potential site for a mix of land uses and also to integrate the
eastern and western halves of the district, which are currently being divided by this site.
The development of this site would require extensive consultation between government
and private sector, as the land currently is in private ownership. The majority of the red
shaded sites are land parcels that has already been identified for human settlement
development.
Table 4.2: Categories and their respective criteria used in the analysis of vacant land in the Khayelitsha,
Mitchells Plain & Greater Blue Downs District
Code Category Description

36 | P a g e
1 Underutilised vacant land:
Vacant Land without any of the following attributes:
reservations,
public projects (human settlements; social facilities etc.)
building plan approvals
rezoning land use approvals.
2 Potentially-utilised vacant land:
Vacant Land with any of the following attributes:
reservations,
pending building plan approvals,
any public projects in pipeline stage,
3
Utilised Vacant Land:
(vacant land under
development or a registered
intent to be developed)
Vacant Land with any of the following attributes:
any public projects in planning or construction stage,
existing building plan approvals,
rezoning land use approvals
4
Vacant Land Reserved and/or
Zoned for Community or
Recreational use:
This will include vacant land currently zoned OS1, OS2, OS3, CO1,
CO2.
[Only applicable layers that did not fall within the utilised (3) of
potentially-utilised (2) categories]
5 Vacant Land Zoned for
Transport Use:
This will include vacant land currently zoned TR1, TR2 and Utility.
[Only applicable layers that did not fall within the utilised (3) of
potentially-utilised (2) categories]

37 | P a g e
Figure 4.3: Vacant land distribution across the Khayelitsha, Mitchells Plain & Greater Blue Downs District

38 | P a g e
Key Opportunities and Constraints
Opportunities
The area is attractive for lower- to medium-income groups in the form of
subsidised and market-related housing.
The Blue Downs Rail Link and associated planned transport infrastructure creates
an opportunity to improve the public transport and improve mobility for residents.
There are significant parcels of vacant land that could be optimally used for
upliftment in the area.
Private investor confidence is still prevalent in the number of housing
developments (especially in the Greater Blue Downs Area) and this should be
further facilitated, supported and directed.
Capacity for viable and at-scale economic and job creation opportunities.
Provide proposals to support small businesses.
Growth Nodes: Two Urban Hubs idenitified in the MSE IZ is located in this district
namely Philippi East and Mitchell’s Plain Town Centre. There are numerous smaller
nodes including Khayelitsha CBD. The City’s ECAMP platform monitors
performance and potential of the following nodes including Khayelitsha,
Mitchell’s Plain and Philippi East and North.
Constraints
Large-scale development of residential opportunities without sufficient support
services such as community facilitates and infrastructure.
Lack of capacity at the Zandvliet Waste Water Treatment Works in order to
accommodate the growing need in the catchment area.
The anticipated Blue Downs Rail Link has already been on the planning horizon
for decades and the current projections indicate its earliest completion in 2025–
2030. This makes it difficult to facilitate the current investor confidence in
proposed nodes in the hope that their potential will be realised through public
transport infrastructure in 10–15 years’ time.
Lack of employment opportunities for residents.
Some informal settlements are located in flood-prone areas. This is exacerbated
by a lack of planning for the formalisation of these settlements and/or the
relocation of their residents.
Safety and security are problematic in many of these areas as they are located
within gangster territories.

39 | P a g e
4 TRANSPORT AND ACCESSIBILTY
Introduction10
This chapter provides an overview and analysis of the status quo of the mobility and
accessibility networks within the Khayelitsha, Mitchells Plain, Greater Blue Downs District.
There is a strong focus on transport as an informant of the CTMSDF, based on the principles
of the Transit Oriented Development (TOD) Strategic Framework. This is in line with
international planning trends, recognising the need for spatial planning tools to support
public transport and non-motorised transport options, as well as reduce the need to travel.
The CTMSDF now needs to be translated “down” in scale to a district level. This section
therefore focuses on the application of TOD to a district/corridor level. Figure 4.1 below is
useful in this regard, illustrating TOD at various scales.
Figure 4.1: Transit oriented development concept illustrated at various scales
(TOD Strategic Framework, 2016: 24)
10 Cape Town Transit Oriented Development Strategic Framework, 2016

40 | P a g e
At a metropolitan scale, there is a need to balance and shorten trips through:
1. Maximising the residential opportunities in and around the Cape Town CBD;
2. Maximising the work and other non-residential opportunities (e.g. education,
recreation, etc.) in the Metro South-East; and
3. Enabling greater internal trip generation (i.e. balancing trip producers and
attractors) in Atlantis, the greater Somerset West area and the far south of the city.
At a corridor scale, TOD requires the generation of bi-directional flow (to replace the current
“tidal” commuter patterns), reduced travel distances to public transport and higher seat
renewal (multiple origins and destinations along the route). Among other functions, the
revised District SDF will identify which corridors in the district should be reinforced through
appropriate land use proposals.
Strategic Parameters & Informants
Based upon various strategic intents and objectives, the City of Cape Town has developed
a host of strategies which aim to guide the delivery of an efficient transport system and
outline the primary framework within which the system develops. Further strategies address
other transport needs such as non-motorised transport, universal accessibility, parking,
operations, etc. These strategies are highlighted in the sections below.
District-Specific Transport Strategies
4.2.1.1 Blue Downs Integration Zone
The Khayelitsha, Mitchells Plain & Greater Blue Downs District comprises a substantial portion
of this Integration Zone, which is a priority investment area for government facilities and
services and has been the subject of an ongoing planning process and investment strategy
(Figure 4.2). The revised District SDF will take cognisance of these plans, which contribute
towards integrating the district with adjacent areas to the west and north. This integration is
supported by the two major transport routes planned in this zone: the rail link between
Khayelitsha and Bellville (via Blackheath), and the MyCiTi BRT trunk route along Symphony
Way.
4.2.1.2 Metro South-East Integration Zone
The National Treasury enables metropolitan areas to identify and plan for corridors which
serve to integrate previously separated parts of the city, through enabling and encouraging
the spatial targeting of public investment into these areas. The Metro South-East Integration
Zone (MSE IZ) is a combined plan and investment strategy to enable human settlement,
social development, economic development and TOD. As above, a substantial portion
thereof falls within the Khayelitsha, Mitchells Plain & Greater Blue Downs District (Figure 4.3).
It is therefore an important informant of the revised District SDF. The priority local areas within
the integration zone are Philippi, Mitchells Plain CBD, Lentegeur, the Khayelitsha CBD and
industrial hive and the Denel site in addition to two coastal nodes.

41 | P a g e
Figure 4.2: Blue Downs Integration Zone transport concept
Figure 4.3: Metro South-East Integration Zone, showing prioritized local areas

42 | P a g e
State of Public Transport
Existing Infrastructure and Services
4.3.1.1 High Order Public Transport
(a) Rail
Transport in the southern part of the district is relatively well-provided for by passenger rail
with eight rail stations located in the area along the Khayelitsha and Mitchells Plain lines,
which split after Philippi Station (Figure 4.4). Several of these stations form significant
interchanges with road based public transport including Philippi, Mitchell’s Plain, Nolungile
and Nonkqubela Stations. The north-western portion of the district is served by the northern
line, linking Strand to Bellville and the Cape Town CBD. This includes a Business Express
service, which attracts choice users and can be accessed at Eersterivier station in the
district.
While the service has deteriorated since 2012, as a result of institutional failure, lack of
maintenance and investment and ongoing vandalism and crime, the system will endure,
and it is expected that service improvements will eventually attract back choice users, even
if this is only in the medium term. Hence, the rail network continues to be an important
structuring element in the District SDF.
(b) Bus rapid transit
An express bus rapid transit (BRT) service connects both Mitchells Plain and Khayelitsha to
the Cape Town CBD (Figure 4.4). This does not enjoy a dedicated lane at this stage. It was
provided to compensate for the reduced rail passenger services. Its future is thus dependent
on future demand.
4.3.1.2 Low Order Public Transport
(a) Non-motorised transport
Most of the non-motorised transport (NMT) infrastructure and activity in the district is
concentrated in low-income areas, along major routes which are safer (Figure 4.5). Despite
high levels of NMT activity due to lack of affordability of other modes of transport, mobility
is suppressed because of safety due to gang activity and crime. NMT connectivity across
the district is also hampered by large parcels of undeveloped land, the railway lines and
the N2 freeway. Furthermore, there are no NMT routes along the river courses through the
district, although the Kuils River transverses much of the district. There is currently a program
in place to identify where pedestrian bridges are needed to cross these barriers.

43 | P a g e
Figure 4.4: Existing and future high-order public transport services in the Khayelitsha, Mitchells Plain & Greater Blue Downs District

44 | P a g e
Figure 4.5: Existing and planned cycle routes across the Khayelitsha, Mitchells Plain & Greater Blue Downs District

45 | P a g e
(b) Minibus taxis and Golden Arrow Bus Service
Figure 4.6 below illustrates the main boarding and alighting activity of the main road-based
public transport services: minibus taxis (MBTs) and the Golden Arrow Bus Service (GABS). The
main road-based public transport networks are concentrated on higher-order routes. Jeff
Masemola Road, Bongo Drive, AZ Berman Drive, Delft Main Road and Govan Mbeki Road
are most significant in terms of high-frequency commuter-based services.
Figure 4.6: Intensity of boardings and alightings for road-based public transport
The public transport interchanges (PTIs) and MBT ranks that serve the district are outlined in
Table 4.1 below. The strong reliance on public transport is reflected by the fact that several
public transport facilities in the district are amongst the busiest in the city, including Mitchells
Plain PTI, Nolungile PTI, Nonkqubela PTI and Philippi Station – all facilitating more than 30 000
passenger trips per day.

46 | P a g e
Table 4.1: Overview of public transport interchanges and minibus taxi ranks in the Khayelitsha, Mitchells Plain &
greater Blue Downs District
No Name Formal/
Informal
Any plan for
upgrading
1 Khayelitsha (Harare) Minibus-taxi Rank
(Mitchells Plain Route) Informal
2 Khayelitsha (Kuyasa) Station Transport
Interchange Formal
3 Khayelitsha (Makhaza) Minibus-taxi Terminus Informal Construction phase
4 Khayelitsha (Nolungile Station) Transport
Interchange (Site C) Formal
Orio funded project
5 Khayelitsha (Nonqubela Station) Transport
Interchange (Site B) Formal
Scoping
6 Khayelitsha Station Transport Interchange Formal Orio funded project
7 Khayelitsha Vuyani Formal Orio funded project
8 Mandalay Minibus-taxi Terminus Informal
9 Mandela Park (Khayelitsha) Informal
10 Mfuleni Public Transport Interchange Formal Planning
11 Mitchell’s Plain (Lentegeur - Clocktower)
Minibus-Taxi Rank Informal
12 Mitchell’s Plain (Lentegeur Station) Transport
Interchange Formal
Upgrade
completed (2017)
13 Mitchell’s Plain (Montrose Park) Minibus-taxi
Rank Informal
14 Mitchell’s Plain (Tafelsig) Minibus-taxi Rank Informal
15 Mitchell’s Plain (Westgate Mall) Public Transport
Interchange Formal
16 Mitchell's Plain Promenade Mall Formal
17 Mitchell’s Plain Station Transport Interchange
Eastern Side N Formal
18 Mitchell’s Plain Station Transport Interchange
Eastern Side S Formal
19 Mitchell’s Plain Station Transport Interchange
Western Side Formal
20 Philippi Joburg Stores Minibus-Taxi Terminus Informal
21 Samora Machel Minibus-taxi Terminus Informal
22 Stock Road Formal
23 Blackheath Station Transport Interchange Formal
24 Devon Park Minibus-taxi Terminus Informal
25 Eerste River Shoprite Minibus-taxi Terminus Formal
26 Eerste River Station Transport Interchange Formal Upgrade
completed (2016)
27 Forest Heights Minibus-taxi Terminus Informal
28 Happy Valley Minibus-taxi Terminus Informal
29 Malibu Village Minibus-taxi Rank (Southbound) Formal
30 Melton Rose Station Transport Interchange Formal
31 Wesbank Minibus-taxi Terminus (Northbound) Formal scoping

47 | P a g e
Planned Public Transport Infrastructure
4.3.1.3 BRT Trunk and Feeder Routes
This district is planned to benefit the most from the planned MyCiTi BRT roll-out. As part of
Phase 2 of the City’s public transport network plan (IPTN), three MyCiTi trunk routes and a
number of feeder routes are proposed for the district. In Phase 2A, which is currently being
planned for implementation, trunk routes will run from Mitchells Plain and Khayelitsha into
Claremont and Wynberg (Figure 4.7). A Trunk route (T17) is also planned to run between
Khayelitsha and Century City via Milnerton. A district route (D12) is planned in a further
phase along Klipfontein Road, from Mitchell’s Plan to the Cape Town CBD via Mowbray.
The Phase 2A feeder routes are only indicative at this stage, but are planned to give greater
access to the trunk service. This service will substantially benefit the district. Stations are
planned for Stock Rd, Eisleben, Swartklip (Denel), Nolungile, Mitchell’s Plain CBD, and
Khayelitsha CBD.
Figure 4.7: Planned IPTN Phase 2A MyCiti BRT trunk routes
Rail
The main planned improvements to transport infrastructure in the district include the Blue
Downs Rail Link (BDRL). The Final Report of the Blue Downs Rail Link Stations study (2018: 1)
summarises the project as follows:

48 | P a g e
“The Blue Downs Rail Link project aims at creating a new railway connection in the
Blue Downs area, in the Eastern part of Cape Town. The project includes about 10
km of new line and three new railway stations: Mfuleni, Blue Downs and Wimbledon.”
The following conclusions (2018: 96) are relevant to the revised District SDF:
“A coordinated joint urban-and-transport approach at corridor scale is paramount for
the success of the BDRL.
First, the ridership of the railway line will remain low if the urban density is not increased
around the stations, mostly Wimbledon and Blue Downs, as Mfuleni is already densely
inhabited. Then, these new developments must be designed to allow easy access to the
stations, to save enough space for mobility functions (intermodal hubs, pedestrian ways
and spaces), to integrate economic activities and services that can benefit from and to
the train riders.
More, the activity and movements generated by the stations, as well as the increase of
accessibility offered by the train, are an opportunity to boost and structure the urban
development in the corridor. The train can be the reason why investments are made in
the corridor, but this must be planned, coordinated, promoted and properly targeted.
Urban development around the station is a financial challenge. The business analysis
shows that a significant involvement of public funding will be required. This must include
the construction of public facilities that are needed in the area. Incentives of different
kinds will be required in addition.
A specific structure appears necessary to implement the project with a proper
coordination of its different dimensions (railway line, urban transportation, urban
planning and developments). It will also be required for the future management of the
stations areas.
The Blue Downs rail link is a very promising project. It is also a hybrid object, implemented
in a context of limited economic dynamism. A strong political involvement at City and
national levels is necessary to succeed.”
Public Transport Interchanges
Nolungile, Khayelitsha, Vuyani and Makhaza PTIs are subject to an integrated planning
processes to ensure their proper functioning, not only as safe PTIs, but as well-managed
precincts including places for trade, social services, and quality NMT.
Level of Public Transport Accessibility
As part of the Transit Oriented Development Comprehensive Land Use Model (TODC), a
scoring of the various transport-accessible precincts (TAPs) around stations and stops in the
city was conducted (Figure 4.8). The overall score provides a measure of the level of
accessibility of the City’s current public transport network using the following indicators:
C1. Status of station: Existing or Proposed
C2. Status of network: Existing or Proposed

49 | P a g e
C3. Connectivity: Accumulative Travel time to the City’s top 10 employment
destinations
C4. Capacity: Capacity of stations to accommodate passenger volumes
C5. Modal Integration: Level of integration between modes of public transport
(Rail/BRT/PTI/Feeder)
C6. Intensity: Number of people within 500m of a station/core feeder stop
Note that this scoring methodology does not take into account the functionality of the
public transport services. The measure is purely a locational score. Based on these scorings,
the following patterns are highlighted for the district:
The TAPs related to the rail system have particularly high accessibility.
The Mitchells Plain CBD, Nolungile railway station and surrounding areas have the
largest cluster of high accessibility scores in the district.
The future T16 MyCiTi corridor will service the greater Blue Downs area well.

50 | P a g e
Figure 4.8: Scoring of transport-accessible precincts in relation to the higher-order public transport network

51 | P a g e
Figure 4.9: Composite map of existing public transport and related infrastructure in the Khayelitsha, Mitchells Plain & Greater Blue Downs District

52 | P a g e
State of Road Infrastructure
Overview of District Road Network
The road network in the district is characterised by clear road hierarchies and a strong
provision of mobility routes, most evident in Mitchell’s Plain and Khayelitsha. The most
significant routes in terms of the road hierarchy can be seen on Figure 4.10, which shows a
loose grid pattern, to which the adjacent neighbourhoods have limited access in order to
maintain the mobility of these routes. Being modern developments, the areas have all been
completely pre-planned, based on the principle of motorcar dominance, such that:
Road access is strictly hierarchical;
Neighbourhoods are cellular/insular, with limited access points and connections to
adjacent neighbourhoods;
Phased neighbourhood development of areas like Mfuleni has resulted in missed
opportunities for connector routes to connect adjacent areas;
Most higher-order streets do not have active frontages onto adjacent land uses,
making them dangerous to pedestrians when they are not busy;
The high mobility routes, which are actively used by volumes of pedestrians, result in
high incidents of pedestrian-related accidents; and
There are few opportunities for TOD, which has to be “retrofitted”.
4.4.1.1 Recent Road Projects
The following roads have been constructed over course of the past five years (Figure 4.10):
Link of Saxdown Road to Nooiensfontein Road (Blue Downs);
Dualling of Stock Road between the R300 and Sheffield Road; and
Connection of Walter Sisulu Rd east to Baden Powell Drive.
4.4.1.2 Current Road Projects
The following road projects are currently under in the planning or construction phase (Figure
4.10):
Planning is underway for the dualling of Hindle Road (R300 to Raymond Ackerman
Ave); and
The route alignment and conceptual design of the Spine Road extension within the
de-declared N7 reserve in the Blackheath area, as well as the elimination of the
Buttskop Road level crossing is complete. Depending on the availability of funding
and subject to a funding agreement with PRASA, the proposed grade separation
should be implemented in the short to medium term.
4.4.1.3 Historic Road Schemes to Be Reviewed
There are no historic municipal road schemes which need to be removed or amended. The
alignment of the Spine Road extension was recently amended through the Blackheath
area, between Albert Philander Road and Van Riebeeck Road.

53 | P a g e
Parking
Generally, there are no parking issues in the district because of low levels of private vehicle
ownership. It is not known to what extent the Development Management Scheme (DMS)
requirements with respect to parking inhibit potential but marginally viable developments.
Planned Road Infrastructure
As this district has some of the fastest growing areas in the metropolitan area, there is an
increasing demand for road capacity. This has been addressed in the following short- and
medium term road infrastructure projects (Figure 4.10).
4.4.1.4 Short-Term Projects
The following planned road infrastructure upgrades are required in the short term (the next
five years):
Link of Mew way with Saxdown Road (Class 2 road); and
Dualling of Bade Powell Drive with traffic lights.
4.4.1.5 Medium-Term Projects
Provision has been made for several new road connections, which have an impact on the
district, in the medium term (next ten years). These are as follows:
Extension of Morgenster Road through to Pama Road;
Extension of Sheffield Road west through the northern portion of the PHA; and
Extension of the R300 west across the PHA.

54 | P a g e
Figure 4.10: Existing road network and planned public right-of-way upgrades or new roads in the Khayelitsha,
Mitchells Plain & Greater Blue Downs District

55 | P a g e
State of Freight
The freight sector is critical to the efficient movement of goods in support of the economy
and the provision of services. At the same time, road-based freight movement can be a
hindrance to traffic flow, and trucks place a disproportionate maintenance burden on road
infrastructure. Furthermore, the impacts of freight-related accidents are severe.
Road-based freight movement in the city as a whole is illustrated in Figure 4.11 below. The
largest volumes of freight are on the national roads, with the N2 linking the district to the port
at Table Bay. Cape Town’s deep water port processes ±15 million tons of freight per annum,
with around 95% of freight movement on the land-side being road-based. The port, together
with over 30 industrial areas located in various parts of the City, contributes to a high number
of trucks on the municipal road network. By contrast, the district experiences relatively low
freight volumes apart from the N2, and to a lesser extent on the R300.
The City’s Freight Management Strategy addresses the planning and management of
freight operations within the city’s functional region. It recognises the need to shift the
modal split back towards rail where possible.

56 | P a g e
Figure 4.11: Main freight vehicle movement routes in the Khayelitsha, Mitchells Plain & Greater Blue Downs Distric

57 | P a g e
Travel Patterns
Current Travel Patterns
4.6.1.1 Travel Demand
The following trends in travel demand patterns can be observed across the district as a
whole (Figure 4.12):
The district is dominated by trip generators (i.e. residential development) in almost
every transport zone, except in the industrial areas to the north-east.
The intensity of trip generators is high from Philippi, Crossroads, Blue Downs, Mfuleni
and Khayelitsha (particularly Ikwezi Park).
Trip attractors (work and education opportunities) are spread thinly across the district,
but are highest in the Blackheath industrial area.
The result is a net outflow of commuters in the morning from the district on a daily
basis.
4.6.1.2 Travel Origin and Destination
The metropolitan origin-destination mapping of Figure 4.13–Figure 4.14 and Table 4.2
displays the following patterns:
This district generates the vast majority of trips out of the area in the morning, into the
Cape Town CBD and surrounds as well as to the northern areas.
The vast majority of these trips are by public transport.
Mitchells Plain generates a significant number of trips by privately owned vehicles,
and Blue Downs some, but Khayelitsha only a negligible number.
There is negligible movement into the area.

58 | P a g e
Figure 4.12: Trip generators versus trip attractors across the Khayelitsha, Mitchells Plain & Greater Blue Downs
District, 2013 (EMME Travel Demand Modelling, 2013)

59 | P a g e
Figure 4.13: Origin-destination mapping of peak morning commuter trips for all modes of transport in relation to
the Khayelitsha, Mitchells Plain & Greater Blue Downs District, 2013

60 | P a g e
Figure 4.14: Origin-destination mapping of peak morning commuter trips by public transport in relation to the
Khayelitsha, Mitchells Plain & Greater Blue Downs District, 2013

61 | P a g e
Figure 4.15: Origin-destination mapping of peak morning commuter trips by private car in relation to the
Khayelitsha, Mitchells Plain & Greater Blue Downs District, 2013

62 | P a g e
Table 4.2: Peak morning travel patterns from and to the Khayelitsha, Mitchells Plain & Greater Blue Downs
(KMPBD) District
Origin Destination NMT Private
car Taxi Bus BRT Train
Public
transport
(taxi,
bus, BRT
& train)
Total
KMPBD Table Bay 4 411 6 355 7 098 3 357 5 874 22 684 23 099
KMPBD Blaauwberg 0 351 2 133 1 967 1 030 396 5 526 5 877
KMPBD Northern 0 1 279 1 560 1 982 0 2 030 5 572 6 851
KMPBD Tygerberg 296 4 317 7 922 9 508 92 4 945 22 467 27 080
KMPBD Helderberg 452 1 744 2 538 4 611 0 2 741 9 890 12 086
KMPBD Cape Flats 767 2 379 3 095 4 939 1 2 779 10 814 13 960
KMPBD Southern 12 950 2 754 3 670 22 3 376 9 822 10 784
KMPBD All districts 1 531 11 431 26 357 33 775 4 502 22 141 86 775 99 737
KMPBD KMPBD 6 291 2 327 3 547 7 644 1 024 3 359 15 574 24 192
Table Bay KMPBD 0 292 109 54 55 326 544 836
Blaauwberg KMPBD 0 28 49 58 72 32 211 239
Northern KMPBD 0 294 80 100 0 442 622 916
Tygerberg KMPBD 214 795 1 743 820 3 613 3 179 4 188
Helderberg KMPBD 468 760 729 1 040 0 1 312 3 082 4 309
Cape Flats KMPBD 232 920 814 1 169 0 750 2 733 3 885
Southern KMPBD 0 396 77 101 2 511 690 1 087
All districts KMPBD 914 3485 3601 3342 132 3986 11061 15460
4.6.1.3 Cost of Travel
The nature of tidal movement across the city results in an inefficient use of public transport
and of the road-space – people traveling into the CBD in the morning, and out in the
afternoon. The has a significant cost, which can be broken down into the following:

63 | P a g e
(a) User costs
The newly-developed Urban Development Index (UDI) measured the cost of travel for
different income groups, different travel modes, and to their top five destinations11 in terms
of travel time, travel distance, and direct costs.
Modal choice is influenced by a range of factors: not simply direct costs, but indirect costs
such as safety (of the service itself), security (on the service, as well as accessing it), level of
flexibility (of the service), reliability (of the service), and the impact of congestion on the
service. The high rate of NMT as the primary mode of transport as evidenced in poorer areas
has less to do with short travel distances, and more to do with affordability.
Generally, this district scores poorly in terms of travel distance, time and costs for its residents.
In terms of distance, the southern and south-eastern parts of the district are furthest by public
transport from the top five destinations, equivalent in the distance from those destinations
to other far-flung areas such as Noordhoek, Kommetjie and even Simon’s Town.
Travel time to these top five destinations is very long from the northern areas of Mitchells
Plain and Khayelitsha by their main transport modes of private car and MBT (33–36 minutes).
Travel time from northern Mitchells Plain is even higher by bus as 55 minutes. A similar trend
in travel time is observed from southern Khayelitsha by its main transport modes of bus (111
minutes), MBT (34 minutes) and MyCiTi (53 minutes). This is reflected in high direct travel costs
as a percentage of income on public transport: approximately 22% for most low-income
users of the district, 40% for low-income users by private car from southern Mitchells Plain
and 23-24% for most medium-income users. The only positive indicators are found in the
Blackheath, where travel time by MBT to the closest of the top five destinations is a very low
7 minutes.
(b) Operational costs
There is a high cost to operate public transport in a sprawling urban environment. If the
travel demand patterns of the city remain at current variables, this will translate into a
deterioration of the recurrent annual operating deficit for the whole MyCiTi system by
approximately R1 billion (IPTN Business Plan, 2017). Up to 54% of the MyCiTi N2 Express Service
costs are being recovered12. Therefore, ridership levels need to be increased through
increasing the passenger population in order to improve its financial viability.
(c) Environmental and economic costs
The main costs of inefficient public transport (and the consequent ubiquity of private vehicle
use) to the physical environment and economy are as follows:
Serious constraints on economic growth and development (congestion currently
costs Cape Town R2.8 billion per year);
Air pollution; and
11 The top five commuting destinations were identified for each area based on employment and education patterns. 12 Ridership has been severely impacted on by three successive bus driver strikes in 2017, 2018, and late 2018/early 2019).

64 | P a g e
CO2 emissions and energy consumption.
Future Ideal Distribution of Trip Generators and Attractors (2032)
In modelling the future land use patterns which would generate the demand for trips to be
served by the IPTN, an “ideal” scenario, namely the Transit Oriented Development
Comprehensive Land Use Model (TODC), was run for 2032. The TODC response is to try to
balance trip attractors and trip producers in all areas, to theoretically eliminate/minimise
the need to travel by locating jobs and residences in the same area. Figure 4.16 below
shows this ideal future state to work towards, with growth in the right locations to minimise
travel time.
From a transport optimisation perspective, the large quantity of anticipated residential units
(trip producers) in some locations that are far from existing trip attractors needs to be
countered/matched by new non-residential land uses (trip attractors) in order to achieve
this goal. From a spatial planning perspective, this translates to a need for mixing/diversifying
land uses. The revised District SDF must therefore use this model as a guide and determine
how this is achievable.
The following changes for the district as whole are required:
It is recognised that the district will remain dominated by trip generators in almost
every transport zone.
The intensity of trip generators will remain high in the district, particularly from
Philippi, Crossroads and Khayelitsha.
Trip attractors will remain thinly spread across the district, but should increase
significantly in the Blackheath industrial area (an established work destination),
the proposed Aerotropolis on the Denel site, Eersterivier (where there is potential
due to available land), and around the Lentegeur hospital precinct.
The net outflow of commuters from the district on a daily basis will persist, but
should be reduced.

65 | P a g e
Figure 4.16: Transit Oriented Development Comprehensive Land Use Model ideal distribution of trip-attracting
and trip-producing land uses, 2032

66 | P a g e
Key Opportunities and Constraints
Opportunities
One of the district’s constraints could be its greatest opportunity. Currently car
ownership levels are low, resulting in lower private trip generation, and high public
transport trip generation. This modal split should be entrenched by providing quality
public transport at reasonable rates.
The IPTN will be exploring an incremental approach to the BRT roll-out, with the
possible inclusion of the current bus and MBT services. It will therefore explore the
opportunities for prioritizing these services in the road space, for example “queue-
jumping” at intersections.
The Catalytic Land Development Programme (CLDP) includes several sites from the
district, namely the Blue Downs CBD/station, Kuils River node, Khayelitsha
CBD/Industrial Park and Swartklip/Nolungile station (between Mitchell’s Plain and
Khayelitsha). These sites will benefit from priority planning attention, particularly
focused on attracting investment and stimulating private sector investment.
The planned rail and MyCiTi routes through the area will represent the largest type of
public transport interventions available presently in South Africa. The BDIZ planning
intervention is ensuring that this investment is capitalised on, through guiding land use
decisions.
Constraints
The district is characterized by long commuting distances, low seat renewal
(travellers getting on and off along the route) and little bi-directional flow (travellers
moving in both directions within the peak). The implication is that any form of public
transport improvements will be expensive to operate, with little prospect of cost-
recovery due to low levels of affordability.
This is the district most in need of spatial transformation, requiring significant
investment in trip attractors (jobs and education), and the creation of middle-class
residential opportunities to increase the number of internal trips.
Spatial Implications
As demonstrated in the 2032 TODC (Figure 4.16), the need for educational and job
opportunities in built-up areas is high – from a transport as well as a spatial integration
perspective. This is the challenge for the revised District SDF, as there is low investment
appetite in the district, and the current market trend is for the roll-out of more mono-
functional, low-density and low- to middle-income cluster residential developments in new
areas. Economic opportunities and community services should be located in close proximity
to transport interchanges to maximize TOD benefits.
As this is a socially vulnerable district, it may well be worthwhile aligning with the Resilience
Strategy process; some of its related pathfinding questions have relevance to the district:
How can we can we improve the design and co-location of public facilities to
achieve multiple resilience dividends?

67 | P a g e
How can we incentivise city residents to become more involved in resilient place
making?
How can partnerships in society be leveraged to contribute to reducing the stress of
traffic congestion?
5 INFRASTRUCTURE13
The sections below provide an overview of the current level of supply of bulk electrical,
water, sanitation and stormwater infrastructure in the district, as identified in the Medium-
Term Infrastructure Investment Framework, 2017 (MTIIF).
Electricity
Bulk electrical infrastructure includes the following components:
Existing main transmission substations (MTSs)
New MTSs
Existing 132/11 kV distribution substations
New 132/11 kV distribution substations
Existing 132 and 66 kV underground (UG) cables and overhead lines (OHLs)
New 132 kV UG cables
Most of the information used for the assessment of bulk electrical infrastructure capacity has
been sourced from 2014 peak loads at distribution stations. The information was processed
and each substation supply area classified according to its level of existing capacity. There
are currently 114 substation supply areas in the metropolitan area. Of these, 82 are within
the City of Cape Town's distribution area, while 38 are within Eskom's area of distribution.
Table 5.1 below outlines the definitions used to classify the capacity of a substation area.
The assessment was done using Transport Analysis Zones (TAZs), which have different
geographical delineations when compared to the substation supply areas.
Table 5.1: Classification of electrical substation supply areas by level of existing capacity (MTIIF, 2017)
Capacity status Definition
Severe lack of capacity Over 100% of firm substation capacity
Slight lack of capacity 90% to 100% of firm substation capacity
Adequate capacity 70% to 90% of firm substation capacity
Spare capacity Less than 70% of firm substation capacity
In the Khayelitsha, Mitchells Plain & Greater Blue Downs District, the following populated
areas are experiencing a severe lack of capacity (Figure 5.1):
The area south of Denel/Swartklip – mostly vacant, including the decommissioned
Khayelitsha landfill site
Central Khayelitsha, including southern Victoria Mxenge, Khaya, Eyethu, Graceland
and Ilitha Park – predominantly residential
13 Medium-Term Infrastructure Investment Framework, 2017 (MTIIF)

68 | P a g e
The south-eastern outer edge of Khayelitsha, namely Silvertown and Umrhabulo
Triangle, Enkanini and Monwabisi – residential, including informal settlements
Eersterivier, De Wijnlanden Estate and Penhill – residential
Welmoed Cemetary and Jacobsdal Smallholdings – rural and agricultural
Kuils River – largely residential
Blackheath – residential and industrial
Populated areas with a slight lack of capacity are concentrated generally along the N2,
including (Figure 5.1):
Northern Victoria Mxenge and Nonqubela – largely residential, including an informal
settlement, and including some commercial development
Ikwezi Park, eastern Philippi and Crossroads – primarily residential, including large
informal settlements in Philippi and adjacent to the N2 as well as minor industrial land
uses in Philippi
The following populated areas have adequate capacity (Figure 5.2):
Central and eastern Mitchells Plain, including Lentegeur, Portland, Beacon Valley,
the Mitchells Plain CBD and Tafelsig – largely residential, with notable commercial
and industrial land uses in the Mitchells Plain CBD
Harare, Kuyasa, Mandela Park and eastern Graceland – largely residential
The Khayelitsha CBD – commercial
The north-western portion of the Driftsands Nature Reserve, seeing formal and
informal residential development in close proximity to the Visitor’s Centre
Significant portions of the district have spare capacity (Figure 5.2):
The western edge of Mitchells Plain, including Woodlands, Westridge and Rocklands
– largely residential
The majority of the Greater Blue Downs and Mfuleni Sub-Districts (excluding Kuols
River, Blackheath and Eerste River) – predominantly residential, interspersed with
some commercial
A project to add additional major Eskom intake points in the district is planned. This is
highlighted in Figure 5.4 below.

69 | P a g e
Figure 5.1: Khayelitsha, Mitchells Plain & Greater Blue Downs District bulk electricity infrastructure: slight and severe lack of capacity, 2016 (MTIIF, 2017)

70 | P a g e
Figure 5.2: Khayelitsha, Mitchells Plain & Greater Blue Downs District bulk electricity infrastructure: spare and adequate capacity, 2016 (MTIIF, 2017)

71 | P a g e
Figure 5.3: Substation loading across the metropolitan area, 2018

72 | P a g e
Figure 5.4: Proposed electricity infrastructure projects, 2019–2024

73 | P a g e
Water
This district covers a large geographical area with high housing densities of low- to middle-
income residents and a large population. The region is relatively flat and serviced by the
110m reservoir system, creating supply flexibility. This area was aggressively pressure
managed during the drought. The high housing densities, coupled with the prevalence of
backyard dwellings, places a high demand on infrastructure. There are numerous infill
projects to accommodate informal dwellers and notable future developments include
Penhill, Forest Village, Blueberry Hill, iThemba, the formalisation of the Enkanini, Kosovo and
Taiwan informal settlements, the Mahama infill projects and the Highlands Drive and
Swartklip developments. With further development, water supply zones need to be
reconfigured and PRVs adjusted.
The information used for this baseline assessment relies on 2011 and 2015 data which was
processed for the MTIIF. The status of bulk water supply areas has been categorised
according to the definitions outlined in Table 5.2 below.
Table 5.2: Classification of bulk water supply areas by level of existing capacity (MTIIF, 2017)
Capacity status Definition
Severe lack of capacity 0 - 15 m residual pressure in the reticulation networks
< 36 hours x AADD reservoir storage
Slight lack of capacity 15 - 24 m residual pressure in the reticulation networks
36 - 48 hours x AADD reservoir storage
Adequate capacity 25 - 60 m residual pressure in the reticulation networks 48
– 72 hours x AADD reservoir storage
Spare capacity > 60 m residual pressure in the reticulation networks
> 72 hours x AADD reservoir storage
In the Khayelitsha, Mitchells Plain & Greater Blue Downs District, there are no areas with a
severe lack of capacity in the bulk water infrastructure system. Only several areas area are
currently experiencing a slight lack of capacity (Figure 5.5). These include:
A portion of Brown’s Farms, Weltevreden Valley, Colorado, the Kosovo informal
settlement and Heinz Park – residential
The southern edge of Harare – residential, now bordering the Endlovini informal
settlement to the south
Umrhabulo Triangle – residential
The vast majority of the district has adequate or spare capacity in the bulk water
infrastructure system (Figure 5.5). Spare capacities are found in a variety of populated
areas, including:
The N2-bordering edge of Crossroads – formal and informal residential
Large areas of Mitchells Plain, including Lentegeur, Beacon Valley, the Mitchells Plain
CBD and the interface bewteen Rocklands and Tafelsig – largely residential, with
notable commercial and industrial uses in the CBD
Central Khayelitsha, including Victoria Mxenge, Nonqubela, Khaya, Eyethu and
Silvertown – largely residential
Ekuphumuleni – the Khayelitsha CBD

74 | P a g e
Previously vacant land south of Harare, now home to the Endlovini informal
settlement
Southern Eersterivier and De Wijnlanden Estate – residential
In pursuit of water security, the City has looked into the viability of utilising the Cape Flats
Aquifer. To that end, five injection points are planned to recharge the aquifer with treated
effluent. Recharging is required to reinstate pore pressure to maintain the sea wall barrier.
There are treatment works planned at the extraction points, which will be realised over the
next 10 years. During the drought period, temporary desalination plants were established at
Strandfontein and Monwabisi. Furthermore, a permanent 50-70 million ℓ reuse plant is
planned in Zandvliet.

75 | P a g e
Figure 5.5: Khayelitsha, Mitchells Plain & Greater Blue Downs District bulk water infrastructure: spare and adequate capacity, 2015 (MTIIF, 2017)

76 | P a g e
Stormwater and Sanitation
Wastewater
Wastewater infrastructure includes the following components:
All wastewater treatment works (WWTWs)
Pump stations (≥50 ℓ/s duty flow)
Rising mains (≥250 mm diameter (nominal))
Gravity pipelines (≥250 mm diameter (nominal))
The information used for this baseline assessment relies on 2011 and 2015 data, which was
processed for the MTIIF. The status of bulk wastewater infrastructure has been categorised
according to the definitions outlined in Table 5.3 below.
Table 5.3: Classification of bulk wastewater management areas by level of existing capacity (MTIIF, 2017)
Capacity status Definition
Severe lack of capacity WWTW: Capacity exceeded (major drainage areas)
Gravity mains: < 15 % relative spare capacity
Slight lack of capacity WWTW: Capacity exceeded (minor drainage areas)
PS: Required pump flow 105% - 115% of current capacity
Gravity mains: 15% - 30% relative spare capacity
Adequate capacity WWTW: 95% - 100% of treatment capacity required
Gravity mains: 30% to 50% relative spare capacity
PS: Required pump flow 95% - 105% of current capacity
Spare capacity WWTW: < 95% of treatment capacity required
PS: Required pump flow < 95% of current capacity
The Zandvliet WWTW is currently at full operating capacity and completion of an 18 million
ℓ capacity upgrade to the works is expected in early 2024. This has limited development in
the Zandvliet catchment. The development of Kosovo, which was not previously identified
in the master plans, and Swartklip will require upgrades to the Mitchells Plain WWTW due to
limited capacity.
In the Khayelitsha, Mitchells Plain & Greater Blue Downs District, the following populated
areas have a severe lack of capacity in terms of bulk wastewater infrastructure (Figure 5.6):
The western and eastern edges of Philippi – primarily residential
Ikwezi Park – primarily residential
North-easdtern Mitchells Plain, including Lentgeur and Beacon Valley, as well as
Woodlands and the eastern edge of Tafelsig – primarily residential.
A slight lack of capacity of bulk waste water infrastructure is also concentrated in the
eastern portion of the district (Figure 5.6), namely
The majority of Philippi – primarily residential, with a significant informal component
and some industrial development
Central Mitchells Plain, straddling the railway line – primarily residential, with notable
commercial and industrial land use in the Mitchells Plain CBD
Harare – residential.

77 | P a g e
While no areas in the district have spare capacity in its bulk wastewater infrastructure, the
majority of the district has an adequate capacity (Figure 5.7). This includes the following
areas:
Weltevreden Valley
The western edge of Mitchells Plain
Ikwezi Park
Khayelitsha
The majority of Greater Blue Downs
Stormwater
The stormwater system of the CCT consists of a wide range of infrastructure components.
The CCT’s Management of Urban Stormwater Impacts Policy, 2009 defines the stormwater
system as:
“both the constructed and natural facilities, including pipes, culverts and
watercourses, whether over or under public or privately owned land, used or
required for the management, collection, conveyance, temporary storage, control,
monitoring, treatment, use and disposal of stormwater.”
The stormwater infrastructure applicable to this study therefore includes the following:
Piped networks (excluding provision for minor drainage system associated with road
provision)
Culverts
Open channels, lined and unlined, including watercourses
Detention and retention facilities
Energy dissipation structures
Water quality management facilities
Outfalls to watercourses or the sea
Storm surge and flood protection infrastructure
In the Khayelitsha, Mitchells Plain & Greater Blue Downs District, there are no known slight or
severe constraints to bulk storm water capacity (Figure 5.7). There is, however, a significant
backlog of attenuation facilities, the majority of which are concentrated in the following
areas:
Along the northern edge of Mitchells Plain
Straddling the railway like through Khayelitsha
In addition, the main backlogs of stormwater conduits are spatially distributed as follows:
Along Merrydale Avenue and to the west of Eisleben Road, Mitchells Plain
Along the southern and eastern portions of Swartklip and Spine Roads, respectively
The south-western edge of Mew Way, Khayelitsha
The land adjacent to the N2 corresponding with Site B, Site C & TR Section

78 | P a g e
Figure 5.6: Khayelitsha, Mitchells Plain & Greater Blue Downs District bulk wastewater infrastructure – slight and severe lack of capacity, 2015 (MTIIF, 2017)

79 | P a g e
Figure 5.7: Khayelitsha, Mitchells Plain & Greater Blue Downs District bulk wastewater and stormwater infrastructure – spare and adequate capacity, 2015 (MTIIF, 2017)

80 | P a g e
Solid waste
Bulk solid waste infrastructure considered for the purpose of this report consists of the
infrastructure required to provide current waste management services to existing and future
developments and new infrastructure associated with evolving legislative requirements. This
includes:
Landfills and associated mechanical plant
Refuse transfer stations
Drop-off facilities (garage waste, greens, building rubble, recyclables, household
hazardous waste)
Buy-back centres
Fleet (workshop, collection vehicles, cleansing vehicles)
Material recovery facilities
Alternative treatment technologies
The information used for the purposes of this report is based on data sourced from 2019. This
has been categorised in terms of the definitions and capacity statuses outlined in Table 5.4
below.
Table 5.4: Classification of bulk solid waste infrastructure by level of existing capacity
Solid waste
infrastructure type
Capacity status Comment
Landfills and
mechanical plant
The total banked airspace is
>10 years in the city, but less
than the international
benchmark of 15 years.
Excludes regional landfill site
of which the authority is under
consideration.
Landfill sites are not area bound. The city
only has 3 operational landfills. Due to
Limited capacity at landfills, based on
license conditions.
All landfills have a limited life, per their
specific license, and hence will close as the
said conditions are met.
Infrastructure, plant and equipment at all
landfill sites are sustainable managed and
compliant with License Authority regulated
audits.
The Regional landfill will receive most
household/business waste via RTSs.
RTSs The total transfer capacity
available currently meets the
demand capacity. Additional
RTSs are being planned and
included in the SWM IWM
Plan. RTSs are primarily
designed for the waste
compactor fleet servicing
household/businesses.
RTSs are strategically located throughout
the city and hence do not necessarily
coincide with the city area model. TRSs
service large catchments, structured in
terms of resource economic models.
Due to the sensitivity of obtaining
land/authority of these type of activities
closer to high demand areas, they are in
most instances built at landfill sites or on
main roads to improve accessibility.

81 | P a g e
More RTSs are however required as existing
centralized landfills are closing. At an RTS
the waste collected by refuse compactors
are downloaded, re-compacted,
containerized and then hauled to landfill
sites. These new required additional RTSs will
where practically possible be developed
on landfill sites (operational or closed) or be
strategically located on city owned land.
Drop-off facilities Currently the city has
adequate capacity in terms
of drop-off floor area. The
actual number of drop-offs
are significantly less than what
is required to improve
accessibility.
The need for drop-offs closer to
communities is a major challenge. The
current spread is a drop-off within 7km of
each household.
Due to many economic and social factors
communities find it difficult to effectively
utilize these facilities. To improve
accessibility and to decrease illegal
dumping the planned spread of drop-offs
should not be one within 3km of each
household, with even a higher density in
poorer communities.
It is extremely difficult to find suitable land
that is compliant with city policies and by-
laws, additional to the resistance from
adjacent or close-by property owners.
Pressure is on SWM to close existing facilities
as development is allowed closer to the
same.
Buy-back
centres/
recycling facilities
Nil There is a huge desire to develop buy-back
centres or recycling facilities, to be
operated by SMME’s, CBO’s, NGO’s or the
city in poorer communities throughout the
city.
Whilst the land requirement is <1000m², it is
difficult to secure city land within
communities that are compliant with city
policies and bylaws.
Support for these type of facilities is
increasingly provided by Councillors and
lately also from City Urban Renewal and
Sub-Councils.
Fleet - Collection
vehicles
Adequate number of
collection compactors
Replace and supplement Collection fleet in
accordance with city growth and service
requirements (different communities, local
conditions, different vehicle types). Ensure
collection fleet has an average
replacement age of < 7 years

82 | P a g e
Fleet - Workshop Adequate capacity City operates own dedicated workshop for
servicing at Hillstar. Emergency repairs &
maintenance, tyre services and overhauls
are outsourced.
Cleansing
vehicles
Lack in capacity of the
correct vehicles, heavy plant
and equipment
Replace and supplement Cleansing fleet in
accordance with city growth and service
requirements (different communities, local
conditions, different vehicle types). Ensure
cleansing fleet has an average
replacement age of less than the 5 years, 7
years and 12 years respectively.
The number of vehicles need to increase
significantly, also the type of vehicles in
use., such as mechanical cleaning
equipment, loaders and tippers.
MRFs Lack of capacity in the city Growth in recycling is hampered due to the
unavailability of MRFs.
The city has developed a MRF in
Kraaifontein and 2 more are planned for
development, at Coastal Park and at ARTS.
The city will supplement these larger MRFs
with mini-MRFs to increase capacity, to
improve accessibility by all and to create
SMME opportunities. Current larger drop-
offs are earmarked for this added function.
Alternative
treatment
technologies
No capacity In terms of legislative requirements, the city
is obliged to meet stringent diversion targets
for several waste types. Organic and food
waste diversion is a major challenge that
falls in this category for alternative
treatment technologies.
Best technologies, required infrastructure
and business requirements are being
investigated in an effort to identify the basic
requirements.
Where practically possible existing land at
landfills or RTSs will be used to host the new
integrated waste infrastructure.
Key Opportunities and Constraints
In terms of the assessment above, areas that have spare capacity signify opportunities,
while those with a severe lack of capacity are the most constrained areas. The information
contained in the MTIIF needs to be further updated and verified by line departments, which
should include new projects to address the existing backlogs in the district.

83 | P a g e
6 HUMAN SETTLEMENTS
The concept of integrated human settlements goes beyond providing housing, but rather
speaks to creating environments that support the social, physical, and economic
integration of housing developments into the existing urban fabric and establishing quality
living environments that are sustainable. This means that housing is merely one of the basic
infrastructure components required to build integrated and resilient communities. Housing
must be integrated within areas through housing mix, typologies, design and income, and
be close to transport routes supporting transit-oriented development. These principles are
illustrated in Figure 6.1 below.
Figure 6.1: Building integrated communities (TOD Strategic Framework, 2016)
Housing Overview
Housing Typologies
As of 2011, there are a total of 307 445 dwellings in the Khayelitsha, Mitchells Plain & Greater
Blue Downs District. Of those, 61% (187 555) are formal in nature, while 39% (119 890) are
informal structures – the highest proportion among all districts by approximately 20% (Figure
6.2). Of these, almost ¾ (28.92% of total district households) are freestanding informal
dwellings, while the remaining ¼ (10.08% of total district households) are informally
constructed backyard dwellings. In light of its exceptionally large population, the district
comprises of a staggering 61.82% of all freestanding informal dwellings in the Cape Town
metropolitan area.

84 | P a g e
Figure 6.2: Khayelitsha, Mitchells Plain & Greater Blue Downs District housing typology
distribution (2011 Census)
The 187 555 formal dwellings in the district are comprised overwhelmingly of freestanding
houses, accounting for approximately half (49.00%) of total district dwellings (Figure 6.2). This
is coupled with smaller numbers of semi-detached houses (8.21%), formal backyard
dwellings (1.13%) and apartments (0.98%). Other housing typologies make up only a
negligible percentage of total dwellings.
In terms of spatial distribution, freestanding structures dominate the formal residential fabric
in the vast majority of areas across the district (Figure 6.3). This is a significant contributor to
the overall low household densities in these areas. One exception to this trend is the Mitchells
Plain Sub-District. Here, one observes a mixture of semi-detached and freestanding houses
(often in the favour of the former) and account for almost all semi-detached dwellings in
the entire district. Formal backyard structures are sparsely, but relatively evenly spread
across the Khayelitsha, Site B, Site C & TR Section, Mitchells Plain and Philippi Sub-Districts,
while the meagre number of apartments in the district are concentrated primarily in Philippi
East.
49.00%
8.21%
0.98%1.13%
28.92%
10.08%
Formal61%
Informal39%
Freestanding house
Traditional dwelling
Semi-detached house
Cluster house in complex
Townhouse (semi-detachedhouse in a complex)Apartment
Formal backwayrd dwelling(house/flat/room)Room/flatlet part of a largerdwellingCaravan/tent
Other
Informal dwelling
Informal backyard dwelling

85 | P a g e
Figure 6.3: Khayelitsha, Mitchells Plain & Greater Blue Downs District distribution of dwelling typologies (2011 Census)

86 | P a g e
Figure 6.4: Khayelitsha, Mitchells Plain & Greater Blue Downs District informal dwelling distribution by (CCT Informal Structure Count, 2018)

87 | P a g e
Freestanding informal dwellings are widespread throughout the district (Figure 6.4). Such
settlements are most highly concentrated within (and in some cases comprise) the following
areas, where they generally make up the significant majority of residential structures:
Philippi Sub-District
o Sweet Home
o Browns Farms (western Philippi)
o Philippi SP1 (eastern Philippi)
o Kosovo (Weltevreden Valley)
o Boys Town (Croasroads)
Coastal Sub-District
o Monwabisi (Endlovini Informal Settlement, south of Harare)
Site B, Site C & TR Section Sub-District
o Ikwezi Park
o Victoria Mxenge
o Nonqubela
Khayelitsha Sub-District
o Bongani TR Section (north-eastern edge of Denel/Swartklip)
o Khayelitsha T3-V2 (Enkanini Informal Settlement, east of Kuyasa)
o Silvertown and Khayelitsha SP (east of Eyethu and Mandela Park)
Driftsands Sub-District
o Blue Downs SP2 (Faure)
Mfuleni Sub-District
o Mfuleni; the edges of Driftsands Nature Reserve
Especially pertinent are the informal settlements located within Mfuleni, Faure, Ikwezi Park,
Silver Town, Khayelitsha SP, Khayelitsha T3-V2, Khayelitsha T2-V2b and Monwabisi. The
continued expansion of these settlements poses a significant threat to the integrity of the
Driftsands Nature Reserve, the Kuils River, Khayelitsha wetland system and the parabolic
dune systems along the False Bay coastline, all of which home to critically endangered
Cape Flats Dune Strandveld vegetation and ecosystems. Similarly, the unchecked growth
of informality in Sweet Home and western Philippi has potentially significant implications for
the management and protection of the Philippi Horticultural Area.
Lastly, as of 2011, the highest number of informal backyard dwellings is located in Happy
Valley (Greater Blue Downs Sub-District), accounting for 38.49% of all households. This is an
outlier within the Greater Blue Downs Sub-District, however, where informal backyard
dwellings amount to merely 0–10% of total dwellings in the vast majority of sub-places. On
the whole, informal backyard dwellings are concentrated most strongly within the Philippi
Sub-District, accounting for 25%–30% of all households in the sub-places of Browns Farms,
Weltevreden Valley North 1, Heinz Park and Philippi East. The second highest concentrations
of informal backyard dwellings are generally found in areas on the outer edge of the
Khayelitsha Sub-District, namely Khayelitsha T3-V4 (east of Mandela Park, accounting for
32.50% of total households) and Trevor Vilakazi, Harare, Khayelitsha T3-V3 and Khayelitsha
T3-V5 (Umrhabulo Triangle), accounting for 21–25% of total households.

88 | P a g e
Tenure Status
At 57.69%, the Khayelitsha, Mitchells Plain & Greater Blue Downs District displays the second
highest rate of home ownership in the city (as measured in 2011), trailing behind the
Northern District by a very narrow margin. In effect, just over ½ of the households in the
district own their homes (Figure 6.5). This is made up largely of paid off home ownership at
41.26% – significantly above the metropolitan average of 33.24%. Conversely, the district has
the lowest rate of bond-secured home ownership at 16.43%. In light of the exceptionally
low incomes earned by households in the district (see State of the Population), the former
indicates the ubiquitous necessity of state-subsidised housing provision in the district, while
the latter speaks to the financial inability of most households in the district to secure a
housing bond.
Figure 6.5: Khayelitsha, Mitchells Plain & Greater Blue Downs District distribution of
household tenure status (2011 Census)
From the above, it follows that the district has the lowest percentage of unowned homes in
the metropolitan area, accounting for just under half (42.31%) of households (Figure 6.5).
Among these, only 17.19% of homes are rented – the lowest rental rate in the city by a wide
margin. The metropolitan average percentage of rented homes sits at 29.88% and the
district with the next highest rental rate is the Northern District at 29.52% – nearly double that
of Khayelitsha, Mitchells Plain & Greater Blue Downs. The above disparity is a direct
representation of the lack of affordable rental and social housing opportunities in the
district. Conversely, at 21.50%, the district is home to the largest percentage of homes
occupied rent-free by a comparatively wide margin. Such a dynamic is representative of
the ubiquity of informality in the area.
41.26%
16.43%
17.19%
21.50%
3.63%
Owned (57.69%)
Not owned (42.31%)
Owned and fully paid off
Owned but not yet paid off
Rented
Occupied rent-free
Other

89 | P a g e
Figure 6.6: Khayelitsha, Mitchells Plain & Greater Blue Downs District spatial distribution of household tenure status (2011 Census)

90 | P a g e
With relative presence across the district as a whole, full home ownership is concentrated
mainly in the Philippi, Mitchells Plain, Site B, Site C & TR Section and Khayelitsha Sub-Districts,
where it accounts for up to 50%–70% of households in some areas (Figure 6.6). In addition to
other characteristics, these areas have seen the bulk of state-subsidised housing provision
and are also home to the majority of informal settlements. Far more spatially polarised is the
distribution of bond-secured ownership. These households are found almost exclusively in
Mitchells Plain and Greater Blue Downs, where household incomes are generally higher.
Homes occupied rent-free display almost the inverse distribution, corresponding closely with
informal settlement patterns and areas of lowest incomes. Lastly, excluding areas of
informality, rental is fairly evenly distributed across the district, accounting for the tenure
status of merely10%–20% of households in most areas.
Housing Demand
Housing demand in the Khayelitsha, Mitchells Plain & Greater Blue Downs District is assessed
using a proxy of the number of informal structures in the district, as well as the number of
people that have registered with the City’s Housing Needs Register.14 However, there are
limitations to the housing demand data cited in this section, as outlined below:
Records marked as “Assisted” – this is not a true reflection on supply per financial
year as records are not regularly updated. For this reason, there is a difference
between the figures (per financial year) for “Assisted” records and “Total Supply”.
Furthermore, “Assisted” records primarily refer to the supply of BNG, PHP and CRU
housing opportunities as not all housing products supplied are currently captured
on the Housing Needs Register.
Records marked as “Waiting” – this only refers to persons who came forward to
express their housing need and not necessarily person who will qualify for a state
subsidized housing opportunity. The qualification verification process will only occur
once a person is selected for a housing opportunity.
As of the end of 2018, there are a total of 98 943 freestanding informal dwellings in the
district, an increase of 10.14% (10 035) from 88 908 freestanding informal dwellings in 2011.
According to the above proxy, this represents a net increase in housing demand. While still
home to the highest number of freestanding informal dwellings, the district now comprises
just over half (53.47%) of all freestanding informal dwellings in the city, a significant decrease
from 61.82% in 2011. This implies relative growth in housing demand in other districts in the
metropolitan area.
As discussed in Section 7.1.1 Housing Typologies, the highest concentrations of freestanding
informal dwellings are found in the areas within Philippi; Site B, Site C & TR Section; the outer
edges of Khayelitsha and Coastal; Driftsands and Mfuleni. Within these sub-districts, the
highest numbers of freestanding informal dwellings (and by implication, housing demand)
are found in:
Browns Farms (8 700)
14 Note that people who have registered their need for housing might also be living in informal settlements in
the area. Additionally, the proxy of freestanding informal dwellings omits the potential additional housing
demand represented by those living in in formal backyard dwellings.

91 | P a g e
Philippi (11 518 dwellings)
Ikwezi Park (9 042 dwellings)
Khayelitsha T3-V2 (8 909 dwellings)
Somewhat more moderate numbers are found in:
Khayelitsha T2-V2b (6 788 dwellings)
Nonqubela (6375 dwellings)
Kosovo Informal (6 156 dwellings)
Mfuleni (5 404 dwellings)
Despite generally below-average district population and household growth rates between
2011 and 2018, and high growth rates in areas of small base populations and household
numbers (see Chapter 2 Demographics), the exceptionally high population growth rates
observed in the areas of Blue Downs SP2 (780.95%), Philippi SP1 (427.63%), Sweet Home
(47.18%) and Khayelitsha T2-V2b (48.67%) – all of which occupied primarily by informal
settlements – represents growing unmet housing demand. (However, as has been noted,
the large percentage growth rates observed in Blue Downs SP2, Philippi SP1 Sweet Home
are largely attributable to their small base populations in 2011.) By contrast, the moderate
to high population growth rates observed between 2011 and 2018 in Hagley (44.80%),
Stratford Green (46.43%), Delro (67.65%), The Connifers (143.29%) and Fountain Village
(549.04%) represents an increase in housing supply, as they are linked to greenfield formal
housing projects.
Figure 6.7: Khayelitsha, Mitchells Plain & Greater Blue Downs District housing supply and demand trends, 2013–
2018 (CCT Housing Needs Registry)
66,36470,820
75,139
82,594
90,90595,989
,0
20,000
40,000
60,000
80,000
100,000
120,000
Prior June
2013
2013/14 2014/15 2015/16 2016/17 2017/18
Cumalitive
Backlog per
year
New Registered
Applicants
Housing Supply
Needs Backlog
prior to 2013

92 | P a g e
Further illustrating housing demand patterns, the district housing needs backlog stood at a
staggering 66 364 people prior to 2013, based on figures from the City’s Housing Needs
Register (Figure 6.7). Between 2013 and 2018, an additional 33 826 people had registered,
accounting for 34.79% of all people who have registered their need across the City during
that time period.15 When considering the supply of housing opportunities (see Section 7.3
Housing Supply), this translates into an average growth in housing demand of 8% per annum
– more than double the average housing delivery rate of 3% per annum. Consequently, by
the end of 2018, the district had an even greater cumulative housing needs backlog of
95 989.
Ultimately, the housing demand as measured by the number of freestanding informal
dwellings in 2018 (98 943) and as measured using the Housing Needs Registry in 2018 (95 989)
are relatively similar and in alignment. This provides a semi-accurate overall indication of
the level of housing demand in the district.
Housing Supply
This section outlines the current state of housing supply in the district. However, the data
cited is subject to the following limitations:
UISP – persons who are beneficiaries within an Upgrading of Informal Settlements
Project are not necessarily registered on the City’s Housing Needs Register as this is
not a mandatory provision as per the prescripts of the National Human Settlements
Policy. The idea is to upgrade the identified Informal Settlements regardless of a
person’s eligibility criteria. A person’s eligibility criteria are, however, taken into
account during the transfer of ownership of a services site and/or top-structure.
GAP – person who are beneficiaries within the GAP market are not necessarily
registered on the City’s Housing Needs Register. Eligible persons apply directly to
the developer to purchase the property and will apply directly to the Western
Cape Department of Human Settlement for the Financed Linked Individual Subsidy
Programme (FLISP) subsidy.
Land Restitution/ Institutional - persons who are beneficiaries within this housing
programme are not necessarily registered on the City’s Housing Needs Register.
Social and rent to buy - persons who are beneficiaries within this housing
programme are not necessarily registered on the City’s Housing Needs Register as
this housing programme caters for households with an income up to R15 000 per
month. Prospective tenants apply directly to the respective Social Housing
Institutions for rental vacancies.
15 Note that anyone is able to register their need for housing on the Housing Needs Register; however, many of
the people registered might not qualify for housing, or might have experienced a change in circumstances
and need since registering. Therefore, this information needs to be interpreted and used with caution, as a
background check of beneficiaries registered on the database is only done at project inception.

93 | P a g e
Constructed and Delivered
Between 2013/14 and 2017/18, a total of 14 130 state-funded housing opportunities were
created in the Khayelitsha, Mitchells Plain & Greater Blue Downs District (Figure 6.8).16 This
accounted for 37.79% of all state housing delivery in the metropolitan area in that time
frame and reflects the fact that the district accounts for 34.79% of all new registrations on
the City’s Housing Needs Register (see Section 7.2 Housing Demand).
The significant majority of the delivery of housing opportunities was driven by People’s
Housing Projects (PHPs), which comprised 37.83% (5 345) of all housing opportunities created
in the district (Figure 6.9). These projects entail the management of housing construction by
a registered community-led and registered team on behalf of beneficiaries by way of a
Business Plain, appointing their own contractor, with financial assistance from the Urban
Sustainability Development Grant (USDG) and in compliance with minimum PHP regulations.
The implementation of PHPs saw an especially noteworthy spike in 2016/17 (Figure 6.8).
During this time 2 314 top structures were constructed, the majority of which were part of
the Bardale projects.
Figure 6.8: Khayelitsha, Mitchells Plain & Greater Blue Downs housing delivery over time by number and
typology, 2013/14–2017/18 (CCT Human Settlements Department, 2019)
16 While government is a key provider of housing to households earning lower incomes – particularly those who
earn below R3 500 per month – the private sector also plays a crucial role in the provision of housing at all income
levels. The private sector delivery of housing has not been factored into this analysis.
,0
2,000
4,000
6,000
8,000
10,000
12,000
,0
,500
1,000
1,500
2,000
2,500
3,000
2013/14 2014/15 2015/16 2016/17 2017/18
Nu
mb
er o
f un
its (me
tro)
Nu
mb
er
of
un
its
(dis
tric
t)
Year
IRDP serviced site BNG top structure
UISP PHP
GAP Land Restitution/ Institutional
City-wide delivery

94 | P a g e
Figure 6.9: Khayelitsha, Mitchells Plain & Greater Blue Downs District housing delivery
distribution by type, 2013/2014–2017/2018 (CCT Human Settlements Department, 2019)
The next largest contribution was made by the Integrated Residential Development
Programme (IRDP), which supplies serviced plots to households earning an average monthly
income of R7 000 or less. Over the 2013/14–2017/18 period, serviced sites made up 25.85%
(3 653) of new housing opportunities in the district. Of note is the tremendous spike in the
provision of serviced sites during the 2047/18 year, yielding a total of 2 610 Figure 6.8 & Figure
6.9.)
Although driven by state capital, neither PHP or IRDP projects include state-constructed top
structures. Combined, these programmes accounted for over half (63.68%) of all new
residential opportunities (Figure 6.9). Most significant is the high number of PHPs,
representing a distinct drive on the part of local communities to play an active role in
addressing the district’s housing crisis.
At 19.77%, the incremental Upgrade of Informal Settlements Programme (UISP) made up
the next highest percentage of housing supply (Figure 6.9), yielding a total of 2 793
opportunities, most notably in Mfuleni, Bardale and Sweet Homes. However, the majority of
these constituted the provision of sites, not completed top structures.
Constituting only 9.45% of all new housing supply during this time, Breaking New Ground
(BNG) projects (catering to households earning an average monthly income below R3 500)
yielded 1 335 units (Figure 6.9). As with IRDP serviced sites, it is noteworthy to see that the
delivery of BNG housing was exceptionally low between 2013/14 and 2016/17, after which
it saw an enormous spike in 2017/18 with the delivery of 900 top structures (Figure 6.8), 851
of which were part of the Forest Village project. The delivery of BNG housing units was
complemented by a marginal supply of 212 GAP housing structures, accounting for merely
1.50% of new housing supply in the district (Figure 6.8 & Figure 6.9).
Of final note is the lack of any social housing/rental projects. This trend can be tied to the
exceptionally low household incomes as well high employment rate of the district,
representing a lack in stable and consistent household incomes to make rental stock a
viable typology.
25.85%
9.45%
19.77%
37.83%
1.50%5.61%
IRDP serviced site
BNG
UISP
PHP
GAP
Land restitution

95 | P a g e
Pipelined, Planned and in Construction
While the preceding section outlines the completed housing projects, Figure 6.10 below
outlines human settlements projects that are either under construction, planned (meaning
budget has been allocated to them) or pipelined (future developments that will be
planned next). The majority of projects in planning or construction are located in Blue
Downs, Eerste River, Mfuleni, Khayelitsha (Enkanini) and to a lesser extent in Mitchells Plain
and Philippi. Land that has been reserved for housing and is subject to further investigations
are located mostly in Eerste River/Mfuleni and Khayelitsha along Mew Way. The Southern
Corridor Human Settlement Programme would focus on the implementation of the N2 Phase
1 and 2 projects and upgrading of 27 linked informal settlements in the vicinity, which would
benefit more than 50 000 households.
Key Opportunities and Constraints
Generic constraints:
A key constraint with human settlements implementation across the City, has been
a lack of integrated planning of budget cycles, which impacts on the prioritisation
of projects by City Directorates. This has undermined the attempt to create
integrated communities in some areas of the City.
The development of integrated human settlements requires the use of well-located
land for government subsidised housing. Well-located land is expensive, in short
supply, and often more appropriate for infill development than the large-scale BNG
developments that are often on cheaper land.
Most of the government subsidised housing programmes implemented by the City
are nationally funded programmes, which come with strict conditions and legal
parameters. These human settlements programme parameters constrain the
development of affordable housing that meets the spatial goals of the City –
particularly the densification and diversification of typologies.
Capacity constraints regarding the social facilitation of human settlements
developments can impact negatively on the outcomes of projects.
Land invasion has increased, and represents a significant challenge to the City. Land
invasion sterilises land which was otherwise earmarked for human settlements, or
other social or economic activity. It represents a challenge to the City’s human
settlements project pipeline through redirecting resources. It also results in community
conflict between those who have invaded land, and those who are waiting for long
periods of time on the Housing Needs Register.
In situ upgrading of information settlements is a challenge, as firstly the land might
not be suitable for development (e.g. area that is prone to flooding, environmentally
sensitive areas etc.), and secondly, some areas of the City might be too dense so
that de-densification becomes necessary in order to enable formalisation of areas.

96 | P a g e
Figure 6.10: Status of Human Settlements projects in the Khayelitsha, Mitchells Plain & Greater Blue Downs District

97 | P a g e
Local Constraints
Housing demand in Khayelitsha, Mitchells Plain & Greater Blue Downs is outstripping
supply, as is evidenced by the increase in those living in informal settlements. This
trend, together with a proportional increase in household numbers, as well as an
increase in households earning no income suggest that government housing
interventions need to be targeted.
The population of the district is relatively young with many of the young adults which
would want to enter the housing market within the medium to longer terms.
The high unemployment rate in this district is putting further pressure on the
government to provide subsidised housing to poorer communities and much denser
populated areas.
Population growth is experienced in the informal settlements of Sweet Home,
Khayelitsha T2-V2b, Philippi SP1 and Blue Downs SP2. These areas are incredibly
dense, which makes utilising in situ upgrading through the Upgrading of Informal
Settlement Programme a challenge
There is an existing threat of land invasion and encroachment into the Driftsands,
Swartklip and Coastal areas due to high demand. The City should therefore
concentrate on enabling formalisation by the local community, and encourage the
development of an affordable property market in the area.
Limited developable land for greenfield developments.
Expectations for the number of freestanding government subsidized housing from
beneficiaries are constantly increasing.
Opportunities
Medium and higher density housing typologies must be encouraged
Mixed land uses with opportunities for employment creation should be encouraged.
Alternative and mixed housing typologies and mechanisms to be investigated.

98 | P a g e
7 PUBLIC FACILITIES
State of Supply and Demand
The following analysis and proposals on Community Facilities are informed by the updated
Community Facility Guidelines and Standards for Facility Provision reviewed in 2020. Each
facility has a set of planning standards for providing facilities which have been articulated
by line departments, work-shopped and agreed to with key stakeholders. The facilities
guidelines and standards were incorporated into a modelling exercise that sought to
understand sufficiency or insufficiency in the distribution of community facilities and build a
hierarchy of civic clusters (a network of nodes with community facilities) across the City
illustrated in Figure 37.
The results from the modelling exercise should be used as a data driven support tool to
inform strategic planning, budgeting, decision making and implementation as such they do
not replace the facilities identified and prioritized by line departments and the Community
Services and Health Infrastructure Plan.
Figure 11: Conceptual Hierarchy of Community Facility Nodes/Civic Clusters
Existing facilities
Figure 38 illustrates the distribution of existing facilities and highlights sufficiency/insufficiency
in the form of a heat map, neighborhoods that fall within areas shaded red, orange are the
most underserved areas in the district. The Khayelitsha Mitchell’s Plain Greater Blue Downs
District is one of the fastest-growing districts in the City with a high demand for housing. as

99 | P a g e
very limited access to public transport. The district has a growing population and historically
lags behind in terms of investment in community facilities, as such the available facilities are
overburdened. There is little to no available land for development and in particular
community facilities as land is under pressure from development and land invasion which
makes planning and providing the required community facilities extremely difficult.

100 | P a g e
Figure 12: Distribution of Community Facilities in Khayelitsha Mitchell’s Plain Greater Blue Downs District

101 | P a g e
Needs analysis
Table 9 and 10 shows results generated from a modelling exercise that was undertaken to
identify nodes/ service catchment areas of need and the type of facilities required in the
district in order to meet the needs of the population in 2020 and 2040 taking into account
sector specific assumptions, guidelines and standards for facility provision.
Table 5: 2020 Top Areas of Need Khayelitsha Mitchell’s Plain Greater Blue Downs District
Facility
Type
Area/Node Population Demand Facilities Required - Equivalent
to
No. of Facilities/ No. of unserved
population/ha of land required
Community
Centres
Makhaza
Victoria Mxenge
Harare
1 271 971 7.2
Education Primary School
Bongweni
Secondary School
Bongweni
Tafelsig
170 643 (PS learners)
99 015(SS learners)
-47 572(number of PS learners)
-36 281(number of SS learners)
Community
Libraries
Community Libraries
Colorado Park
Nomzamo
Victoria Mxenge
Town 2
Intersection
Mfuleni
Regional Libraries
Blue Downs CBD
Bongweni
Mitchells Plain
CBD
Khayelitsha CBD
1 271 971
1 451 944
6.9
7.2
Primary
Health
Victoria Mxenge
Harare
1 201 342 0.5
Parks Community Parks
Bongweni
Nyanga
Regional Parks
Blue Downs CBD
1 271 971
1 342 039
-61.6 ha
-34.4 ha
Sports
Grounds
Colorado Park
Victoria Mxenge
Harare
Mfuleni
Tafelsig
1 271 971 -161.3 ha
*Positive values indicate an over provision; Negative values indicate a shortfall relative to the
standards

102 | P a g e
Table 6: 2040 Top Areas of Need Khayelitsha Mitchell’s Plain Greater Blue Downs District
Facility
Type
Area/Node Population Demand Facilities - Equivalent No. of
Facilities/No. of unserved
population/ha of land required
Community
Centres
Makhaza
Victoria Mxenge
Harare
1 717 531 12
Education Primary School
Bongweni
Secondary School
Macassar
Harare
Tafelsig
Makhaza
Bongweni
225 244 (PS learners)
132 492 (SS learners)
-96 809 (PS learners)
- 66 168 (SS learners)
Libraries Community Libraries
Macassar
Colorado Park
Nomzamo
Mfuleni
Victoria Mxenge
Regional Libraries
Khayelitsha CBD
Delft CBD
Mitchells Plain CBD
Blue Downs CBD
Bongweni
1 717 531
1 451 944
14.3
7.2
Health Primary Health
Victoria Mxenge
Harare
1 606 682 5.2
Parks Neighborhood Parks
Bongweni
Community Parks
Macassar
Harare
Regional Parks
Blue Downs CBD
Bongweni
Mitchells Plain CBD
1 496 656
1 717 531
1 847 546
- 167.1 ha
-94 ha
-53.6
Sports
Grounds
Colorado Park
Victoria Mxenge
Harare
Mfuleni
Tafelsig
1 731 923 -231.3
*Positive values indicate an over provision; Negative values indicate a shortfall relative to the
standards

103 | P a g e
Insufficiency break down
Map 2 unpacks the detail related to insufficiency, specifically reflecting facility insufficiency
or need in relation to the nodal hierarchy. It should be noted that this is based on the
modelling and interpretation of data (supply of facilities, population, facility standards,
distance) specifically for the following facilities: Community Parks, Regional Parks,
Community Library, Regional Library, Primary Health Care, Sports Grounds.

104 | P a g e
Figure 58: Figure 39: Facility Need in Khayelitsha Mitchell’s Plain Greater Blue Downs District

105 | P a g e
Integrated Precincts
Community Services and Health adopts a precinct planning approach in the implementation of
community facilities as a strategy. Precinct planning is underpinned by driving investment in strategic
locations which address greatest need as well as capitalise on other city infrastructure and
development, to maximise access and optimal functionality. It is also informed by addressing key
departmental strategies and programmes within the Directorate. In pursuit of these objectives,
backlog precincts (concentrations of facility backlogs) as well as optimisation precincts (opportunities
to consolidate and optimise facilities in development nodes identified in the City Spatial Development
Framework) have been identified.
The following precincts are applicable to Khayelitsha Mitchell’s Plain Greater Blue Downs District
Nam
e
PRECI
N
C
T
T
Y
P
E
PR
O
J
E
C
T
S
T
A
T
U
S
WORK
C
O
M
P
L
E
T
E
D
COMMUNITY SERVICES & HEALTH
INFRASTRUCTURE PLAN
SU
M
M
A
R
Y
S
T
A
T
E
M
E
N
T
S
ENK
A
N
I
N
I
Backlo
g
M Precinct planning has been
Enkanini is the largest
informal settlement in
the City, comprising an
estimated 10 000
structures. It is currently
very densely populated
and requires phased
development and
relocation of dwellings
in order to provide
services.
Planning or the redevelopment
of the settlement to
accommodate bulk
services and
infrastructure has been
undertaken by the
City’s Informal
Settlements
Department. The
implementation may
take close to 10 years
to complete and will be
undertaken in phases.
The City’s Informal Settlements
Department, together
with the Community
Urban Design and Architectural
Guidelines should be
undertaken to guide
future investment in
public facilities.

106 | P a g e
Services & Health
Directorate, Urban
Planning and
Mechanisms
Department and
Western Cape
Provincial Government
(Education) have
collaborated on the
planning for the
settlement and
prepared a medium to
long term plan for
implementation. The
planning for social
facilities and services
has been incorporated
and space allocation
made under
challenging
circumstances
regarding land
availability, which has
also presented the
opportunity for those
departments to pursue
new and innovative
models for delivery.
In the short term, phased
implementation of
facilities as and when
opportunities
associated with the
phased development
of the settlement
present themselves
should be pursued. For
example, the delivery
of Informal Settlement
Community Services &
Health Centres.
KHA
Y
E
L
I
T
S
H
A
S
I
T
E
B
Backlo
g
M •ORIO
c
u
r
r
e
n
t
l
y
a
p
p
o
i
n
t
e
d
b
y
M
U
R
Detailed precinct planning has
not yet been
undertaken for the
broader Site B area. It
includes the area from
Spine Road northwards
towards Pama road
and including the area
surrounding
Nonkqubela station. It
incorporates a corridor
of open space and
adjacent public
facilities (such as
schools) which can be
rationalized into more
efficient and effective
clusters of facilities.
The key facilities identified for
development include a
new sportsground,
multi-purpose centre, 2
community parks,
The existing CS&H cluster of
facilities adjacent to
the railway station
needs to be
reorganised to
accommodate a new
regional library and
clinic expansion.

107 | P a g e
P
t
o
d
o
a
P
I
F
•Trans
p
o
r
t
u
p
g
r
a
d
i
n
g
t
h
e
P
T
I
regional library and
clinic upgrade. These
facilities may not all be
accommodated in the
same facility cluster.
The development of the
Zakhele clinic would
address the need for
clinic upgrade. The
regional library
presents the
opportunity to
consolidate (and will
replace) the sub-
optimal existing
community libraries
(Kulani & Khayelitsha).
The cluster at Nonkqubela station
should be considered
for the new library,
which may require the
design and
development of a new,
multi-purpose and
multi-story building
within the existing
station precinct to
support the need for
expanded facilities and
services and in line with
TOD imperatives. A
development
framework was
prepared in 2012,
which proposes
consolidation of this
precinct and
expansion of public
facilities and services.
The sports complex
along Pama road
should be investigated
to consolidate
recreation related
facilities within this
area, clustering the
investments at an
accessible location.
Khay
e
l
i
t
s
h
a
S
i
t
e
C
Backlo
g
N Khayel
itsha
SDF
(1999)
Site C:
Urban
Frame
work
(2009)
Urban
renew
al
Devel
opme
nt
Frame
work
for
The broader Site C area is
characterized by high
density residential
areas, including formal
and informal dwellings.
Due to its location, land
for housing is in high
demand. It has been
settled at high densities
and land for facilities or
non-residential use is
extremely scarce. The
eastern part of the area
incorporates Nolungile
station, taxi rank and
Site C Plaza, a large
The opportunity exists to
enhance the
pedestrian linkages
along the MyCiti Phase
2A corridor linking with
the Site C Integrated
Recreation Facility.

108 | P a g e
KMP
(2006)
Denel
Swartk
lip Site
Redev
elopm
ent
Frame
work
(2006)
commercial
development and
transport interchange.
Swartklip, which has
been identified as a site
of large scale mixed
use development in the
future forms the
southern edge of the
area.
A Site C Urban Framework (2009)
was prepared which
identifies the need for
facilities consolidation
in the ‘western gateway
precinct’ which
comprises education,
sport and recreation, as
well as IRT and NMT
related interventions. It
proposes the citing of
the an IRT station
adjacent to the
recreation complex to
reinforce the area as
the gateway to site C.
Numerous facilities are required
to be developed in the
area to cater for the
existing population,
including expansion of
the existing clinic and a
community recreation
area/park. Design has
been undertaken for
the further
development of the
recreation facility at the
western gateway which
will optimise the use of
this facility by making it
multi-purpose,
accommodating
formal as well as formal
sport and recreational
activities.
In addition, a new clinic,
sportsground and
regional park are to be
accommodated in the
future development of
Swartklip. Future
planning is required in
preparation for
delivering these
facilities as part of that
development.
Mful
e
n
i
Backlo
g
N •
M
f
u
l
e
n
Mfuleni has an established urban
node/precinct. An
extensive precinct
planning process was
undertaken in 2014,
which culminated in
the finalised precinct
plan which was

109 | P a g e
i
U
r
b
a
n
N
o
d
e
P
r
e
c
i
n
c
t
P
l
a
n
c
o
m
p
l
e
t
e
d
,
2
0
1
5
endorsed by the
political structures
(Subcouncil) of the
City, as well as the
elected Project
Steering Committee
(PSC).
The key interventions identified
by the plan include: an
* urban park, taxi rank
upgrading, main road
widening, shared
parking, *clinic, *multi-
purpose centre, *new
civic building, *new
school, upgrading of
*sports fields, mixed use
retail, and additional
mixed use sites.
Priority facility developments
include the following. A
temporary expanded
clinic has been
constructed to alleviate
the high need in the
area, while planning
and design is underway
to develop a new
clinic. The urban park
has also been
constructed and is
operational.
The old clinic building is being
investigated for an
alternate Community
Services & Health
facility and may be
repurposed in the future
for a facility aimed at
youth development.
The library requires
expansion to address
existing demand and
the sports ground also
requires upgrading and
improvements that will
enhance its
functionality in serving
the variety of sporting
needs in the area.
Y – Specific to Branch / Yes its live / actively driving / We produce a product
M – Monitoring capacity / work on project / providing expertise and input as and when required
H – Holding / Project on hold, but still on our books
N – No / Completed projects
Table 5: Integrated Precincts Khayelitsha Mitchell’s Plain Greater Blue Downs District, 2020

110 | P a g e
Key Observations
This district has the highest population and unemployment rates as well as the lowest
income levels in the city, thus increasing the need for social and community facilities. The
majority of the facilities within the lower-income areas such as Mfuleni and Khayelitsha are
generally oversubscribed and poorly maintained.
Exacerbating the conditions above, open spaces and sports grounds within these areas are
also under pressure from settlement encroachment. The upgrade and rationalisation of
open spaces is needed to improve the functioning of the overall open space system.
Higher-order facilities such as community health are also required to service these
communities. Furthermore, the rapid growth of populations between 2011 and 2018,
coupled with the anticipated delivery of Human Settlements in Mfuleni, Khayelitsha, Penhill
and Blue Downs, will necessitate more community and recreational facilities. In particular,
there is a lack of district-scale facilities to serve the broader community, resulting in existing
small-scale facilities being oversubscribed to fulfil the needs of the broader area.
Key Opportunities and Constraints
Opportunities
There is an opportunity to optimise existing social facilities where possible (as opposed
to using resources in the construction of new facilities), such as sports complexes,
libraries, etc.
Civic precincts have been identified in Mfuleni and Blue Downs and their respective
opportunities are indicated below:
o Mfuleni Precinct
It is situated between Church Street and Main Road Mfuleni.
It functions as the main economic and civic node within the broader Mfuleni.
Other nearby facilities include a large sports ground, a hall, a mall with Shoprite
as its anchor tenant, a number of NGOs, a clinic, a primary and high school, a
taxi rank, industrial area and bus shelter, a library, municipal office and satellite
police station.
The much-needed upgrade of the existing sports ground can catalyse its
integration with the adjacent park.
There is currently a temporary clinic on site, with a PHC in the pipeline.
There is an existing library, which needs to be upgraded to increase its
capacity.
o Blue Downs Precinct
It is located on Eersriv Way, a prominent movement route in the Greater Blue
Downs Sub-District.

111 | P a g e
There is an existing sports ground, indoor pool and athletics track. The sports
ground, however, needs to be optimised.
There is also a magistrate’s court and mall.
There is a need for a new regional library, community park, and provincial
health clinic expansion.
Constraints
Large residential developments are planned without all the required social facilities.
Limited vacant land is available for the development of social facilities, and what
land there is, is subject to immense pressure from surrounding communities for
housing development. This in turn exacerbates the shortage of social facilities relative
to the district’s residential population.

112 | P a g e
D. STATE OF THE
ECONOMY

113 | P a g e
4 THE ECONOMY
Macro-Economy
Macro-Economic Indicators
Economic performance in Cape Town largely mirrors trends at the national level, though
often exceeding the national GDP. Between 2009 and 2018, Cape Town’s real GDP growth
has averaged at 2.09%, outperforming South Africa’s average Real GDP growth of 1.67%
during the same period. However, both figures still from part of an overall downward trend,
as illustrated in Figure 4.1. Deviations in these trends are observed from 2016, which may be
attributable to the recent drought conditions faced in the region.
Figure 4.1: Average annual Gross Domestic Product (GDP) growth in South Africa vs. Cape Town, 2009-2018 (IHS
Markit, 2019)
Cape Town’s appealing lifestyle and skilled labour makes it an attractive financial and
business service hub for global and national organisations. As a result, the finance and
business services sector has been the largest contributor to the growth of Cape Town’s
economy in the past ten years. This is likely to result in increasing demand for office space.
Although Cape Town’s office vacancy rate has remained the lowest among the five largest
municipalities17 (SAPOA, 2018) over the past five years, the negative effects of recent
political and economic events have, nevertheless, damaged consumer and investor
confidence. This has impacted negatively on an otherwise resilient office vacancy rate and
caused a moderate decline in the city’s rental growth rate.
17 The five largest municipalities being: City of Johannesburg, eThekwini, Nelson Mandela Bay, City of Tshwane and City of Cape Town
2009 2010 2011 2012 2013 2014 2015 2016 2017 2018
SA -1.54% 3.04% 3.28% 2.21% 2.49% 1.85% 1.19% 0.40% 1.41% 0.79%
CT -1.22% 2.66% 4.14% 2.99% 2.55% 2.20% 1.66% 1.69% 0.90% 1.25%
-2.0%
-1.0%
0.0%
1.0%
2.0%
3.0%
4.0%
5.0%
Gro
wth
Ra
te,
Pe
rce
nta
ge

114 | P a g e
Figure 4.2: Consumer Price Index (CPI), Producer Price Index (PPI) and repurchase rate trends against the
Reserve Bank inflation rate target, 2009–2018 (Statistics South Africa 2018–2019 & SARB, 2018–2019)
The consumer price index (CPI), inflation rate, and the producer price index (PPI) measure
the price fluctuations of goods and services in the economy. Within the ten-year period
observed in Figure 4.2 above, the CPI and the PPI varied slightly around the reserve bank
upper inflation target rate of 6%.
In 2016, inflation (6.33%) exceeded the upper limit of the target. This upward trend could
largely be explained by the price increases in housing rentals, recreation and cultural
activities. In response to the increase in inflation in 2016, the Reserve Bank increased the
repo rate to 7%. While the rate has been adjusted downward since 2016, in response to
lower levels of inflation, the repo rate (and, by extension, the prime lending rate) has
remained significantly higher than in the 2010–2015 period. As a result, property buyers have
found it more costly to take out mortgage bonds between 2016 and 2018 than in the five-
year period preceding that. Together with low levels of consumer confidence, this has
resulted in dampened activity in the property market.
Another factor impacting on the level of property market investment has been South
Africa’s credit rating downgrade at the beginning of 2017, which led to big international
fund managers selling out of South African bonds. This increased bond yields and continued
to discourage consumer spending. During this time, it appears that building developers
began losing confidence in South Africa’s property market.
,0
,1
,2
,3
,4
,5
,6
,7
,8
,9
,10
2009 2010 2011 2012 2013 2014 2015 2016 2017 2018
Pe
rce
nta
ge
Repurchase ('repo') rate Consumer Price Index (CPI)
Producer Price Index (PPI) Reserve Bank Inflation target range

115 | P a g e
Figure 4.3: Building Confidence Index (BCI) trends in Cape Town, 2009–2018 (Bureau for Economic Research
(BER), 2018 & FNB/BER BCI, 2018)
Figure 4.3 shows the First National Bank (FNB)/Bureau for Economic Research (BER)
composite Building Confidence Index (BCI) for the ten-year period from 2009 to 2018. The
BCI records the percentage of architects, quantity surveyors, contractors and
manufacturers of building material who are either satisfied with or wary of the prevailing
business conditions (BER, 2018).
The FNB/BER composite BCI declined by 15.3 points from 2015, where it peaked at 50.0 index
points, to reach 34.8 index points in 2018. This decline in 2018 can be attributed to the
weakened confidence of architects and quantity surveyors, as a result of an unstable
economic environment characterised by relatively high office and retail vacancy rates,
high interest and inflation rates as well as slow GDP growth (FNB, 2018).
Although the BCI has dropped significantly since 2015, Cape Town has continued to see
stable growth in building supply with the conversion of older office buildings to residential
use, cushioning the level of vacancies (Baker Street Properties, 2018). The weak economic
growth is, however, eventually likely to aggravate the weak employment growth which
could, in turn, see demand for building or office space declining (JLL, 2018).
Macro-Property Market
Figure 4.4 below displays the total floor area of new office building space and new industrial
building space added to building stock, against the observed variations in the office and
industrial vacancy rates, from 2015 to 2018. There is generally, although not exclusively, a
positive relationship between building completions and vacancy rates.
30.7 30.3
25.0
29.8
43.5
49.5 50.0
37.835.3 34.8
0
10
20
30
40
50
60
2009 2010 2011 2012 2013 2014 2015 2016 2017 2018
Ind
ex
Po
ints

116 | P a g e
Figure 4.4: Cape Town new building completions and vacancy rates for office and industrial space, 2009–2018
(Transport Business Support Department & South African Property Owners’ Association (SAPOA), 2019)
Between 2015 and 2016, the total floor area of new industrial space increased by 51% to
reach a high of 242 394 m2 in 2016, most likely to address the high demand for industrial
space, reflected in the low vacancy rate in the previous year.
Cape Town’s office vacancy rate remains the lowest among the five largest municipalities18
(SAPOA, 2018), however the slowdown in the office-to-residential conversion, which has
assisted in reducing office vacancies in Cape Town may reveal the weak demand for office
space (JLL, 2018). Figure 4.4 shows that the vacancy rate begins to decline as new office
building completions decreased (with 2018 as the exception). A significant drop in building
completions (80%) was recorded for 2017, which may be largely attributed to the negative
effects of the drought, as the water prices spiked making construction of buildings more
expensive.
18 The five largest municipalities being; City of Johannesburg, eThekwini, Nelson Mandela Bay, City of Tshwane and City of Cape Town.
0%
1%
2%
3%
4%
5%
6%
7%
8%
9%
,0
50,000
100,000
150,000
200,000
250,000
300,000
2015 2016 2017 2018
PercentageTotal floor area, m2
Total floor area of new Office space Total floor area of new Industrial space
Office Vacancy Rate Industrial Vacancy Rate

117 | P a g e
Figure 4.5: Cape Town Gross Value Added (GVA) and capitalisation rate (cap rate) trends, 2011–2018 (IHS Markit,
2019 & South African Property Owners Association (SAPOA), 2019)
Figure 4.5 shows the industrial, office and retail capitalisation rates as well as the Gross Value
Added (GVA) for the finance and business services; manufacturing, logistics and transport;
and whole sale and retail trade sectors. The GVA for industrial, office and retail space all
followed a steady, though decelerating, upward trend from 2011 to 2018.
A cap rate is one type of measurement used in evaluating an investment, indicating risk
and the potential rate of return for a prospective property. A low cap rates imply lower risk,
higher value and a high cap rates imply higher risk, lower value. In Figure 4.5, the cap rates
for office, industrial and retail property in Cape Town follow a similar trend between 2011
and 2015. From 2016 to 2017, the cap rates for all sub-segments increased despite a
momentary upturn in 2017. The increase in 2017 may largely be explained by stagnating
property prices, a consequence of Cape Town’s water crises and the credit ratings
downgrade.
0.0
2.0
4.0
6.0
8.0
10.0
12.0
,0
20000,000
40000,000
60000,000
80000,000
100000,000
120000,000
140000,000
2011 2012 2013 2014 2015 2016 2017 2018
GVA: Manufacturing, transport and logistics GVA: Finance, real estate and business services
GVA: Wholesale and retail trade Industrial capitalization rate
Office capitalization rate Retail capitalization rate

118 | P a g e
District Analysis
Economic Characteristics
The largest contributor to the gross geographic product (GGP) at current prices for Cape
Town in 2018 was the Table Bay District (28.9%), an area characterised by the intense
concentration of business and commercial activities (Figure 9.6). This area also comprises of
the main tourist areas of the city such as the CBD, the City Bowl and the Atlantic Seaboard
as well as the significant economic infrastructure of the port, the Cape Town International
Convention Centre and the V&A Waterfront. The Tygerberg District, with a share of 22.1%,
was the second largest district economy in 2018 and is largely dominated by finance,
insurance, real estate and business services (Figure 9.6).
The top three districts in terms of employment are Table Bay (30.9%), Tygerberg (22.2%),
followed by South Peninsula (12.4%). By contrast, the Khayelitsha, Mitchells Plain & Greater
Blue Downs District had the lowest employment share at 4.5% (71 800 jobs) in 2018 (Figure
9.7). This higlights the lack of employment opportunities as a result of low economic activity
occuring within the district, although there is a growing labour force living within this area.
Tygerb
erg;
22,1%
KMPBD; 5,4%
Helderberg;
5,2%
Northern;
7,7%
South Peninsula;
11,4%
Blaauwberg;
10,0%
Cape Flats;
9,3%
Table
Bay;
28,9%
KMPBD; 4,5%
Helderberg;
6,8%
Northern; 7,0%
South Peninsula;
12,4%
Blaauwberg;
8,7%Cape Flats;
7,4%Tygerb
erg;
22,2%
Table
Bay;
30,9%
Figure 4.6: Gross geographic product (GGP)
contribution by district at current prices, 2018 (IHS
Markit, 2019)
Figure 4.7: Employment contribution by district, 2018
(IHS Markit, 2019)

119 | P a g e
Economic Performance
Despite being one of the smallest contributors to GGP in the city (at 10.0%), the area
which recorded the fastest rate of economic growth in Cape Town between 2009
and 2018 was the Blaauwberg District (2.8%) – higher than the Metro average growth
rate of 1.9% (Figure 4.8). This can be attributed to the increasing commercial and
property development in the area, particularly in the industrial market. The South
Peninsula reported GGP growth of 1.2% over the ten-year period, lower that the Metro
average. The Helderberg District had the highest employment growth at 2.6%, closely
followed by Blaauwberg at 2.5%, both areas surpassing the Metro’s average
employment growth rate of 1.6% over the ten-year period.
Figure 4.8: Average annual economic growth rates by district, 2009– 2018 (IHS Markit, 2019)
Figure 4.9: Economic performance comparison across Districts, 2018 (IHS Markit, 2019)
Figure 4.9 plots the average economic growth on the horizontal axis and average
employment growth on the vertical axis. The size of the bubble is the relative size of
1.9%
2.8%
2.5%
1.2%
1.0%
1.6%
1.2%
2.7%
1.1%
1.6%
2.5%
1.4%
2.6%
2.2%
1.5%
1.1%
1.4%
1.7%
0.0% 0.5% 1.0% 1.5% 2.0% 2.5% 3.0%
City of Cape Town
Blaauwberg
Cape Flats
Helderberg
Mitchells Plain
Northern
South Peninsula
Table Bay
Tygerberg
Average Employment Growth Average GGP Growth
0.0%
0.5%
1.0%
1.5%
2.0%
2.5%
3.0%
0.0% 0.5% 1.0% 1.5% 2.0% 2.5% 3.0% 3.5%
Em
plo
ym
en
t G
row
th
GGP Growth
Blaauwberg
Cape Flats
Helderberg
Mitchells Plain
Northern
South Peninsula
Table Bay
Tygerberg
Size of bubble = GGP

120 | P a g e
the economy as measured by gross geographic product in 2018. The Blaauwberg
district grew relatively faster than Table Bay in terms of both GGP and employment
over the ten-year period, despite the relatively smaller size of its output and
employment levels when compared to Table Bay.
Sectoral trends
From Error! Reference source not found., it is clear that the Table Bay District is the main
contributor to the total Gross Value Added (GVA) of most sectors in Cape Town,
followed by Tygerberg. Table Bay’s contribution is especially pronounced in the
transport (34.7%) and trade sectors (30.6%). This is as a result of the district containing
the city’s port and also because it functions as the main retail hub in the city.19 While
Table Bay is the largest contributor to agricultural output (including fishing) in the city
(possibly due to the head office effect), Blaauwberg is also a strong contributor to
agricultural output within the city. The Khayelitsha, Mitchells Plain & Greater Blue
Downs District showed the lowest contribution to Cape Town’s GVA across most
sectors, largely attributable to this area’s economy being highly reliant on the
community services sector (public sector).
Figure 4.10: Gross Value Added (GVA) contribution across districts by sector, 2018 (IHS Markit, 2019)
19 The mining figures are for all districts are almost insignificant.
0% 10% 20% 30% 40% 50% 60% 70% 80% 90% 100%
Agriculture
Mining
Manufacturing
Electricity
Construction
Trade
Transport
Finance
Community services
Blaauwberg Cape Flats Helderberg Mitchells Plain
Northern South Peninsula Table Bay Tygerberg

121 | P a g e
Employment trends, for the most part mirror the output trends (Error! Reference source
not found.). However, the Tygerberg District is seemingly more labour-intensive than
Table Bay, thereby contributing more to employment than GVA.
Figure 4.11: Employment contribution to Cape Town across districts by sector, 2018 (IHS Markit, 2019)
Table 4.1: Top five sectors by location quotient in each district (detailed SIC)20, 2018 (HIS Markit, 2019)
Planning District Rank Sector Location
Quotient
Blaauwberg
1 Fishing, operation of fish farms 2,08
2 Electricity, gas, steam and hot water supply 1,71
3 Transport equipment 1,44
4 Hotels and restaurants 1,24
5 Fuel, petroleum, chemical and rubber products 1,22
Cape Flats
1 Education 1,33
2 Other business activities 1,26
3 Real estate activities 1,23
4 Other service activities 1,16
5 Finance and Insurance 1,12
20 Sectors with a gross value added (GVA) share of 0,5% to Cape Town’s economy were excluded from
the ranking of sectors by location quotient.
0% 10% 20% 30% 40% 50% 60% 70% 80% 90% 100%
Agriculture
Mining
Manufacturing
Electricity
Construction
Trade
Transport
Finance
Community services
Blaauwberg Cape Flats Helderberg Mitchells Plain
Northern South Peninsula Table Bay Tygerberg

122 | P a g e
Helderberg
1 Construction 1,56
2 Electricity, gas, steam and hot water supply 1,44
3 Hotels and restaurants 1,22
4 Fuel, petroleum, chemical and rubber products 1,20
5 Sale and repairs of motor vehicles, sale of fuel 1,20
Mitchells Plain
1 Education 2,02
2 Public administration and defence activities 1,31
3 Construction 1,27
4 Real estate activities 1,25
5 Health and social work 1,19
Northern
1 Electricity, gas, steam and hot water supply 1,63
2 Construction 1,22
3 Finance and Insurance 1,13
4 Metal products, machinery and household appliances 1,13
5 Sale and repairs of motor vehicles, sale of fuel 1,10
South Peninsula
1 Real estate activities 1,61
2 Public administration and defence activities 1,16
3 Education 1,12
4 Other service activities 1,11
5 Fishing, operation of fish farms 1,11
Table Bay
1 Air transport and transport supporting activities 1,28
2 Land and Water transport 1,20
3 Hotels and restaurants 1,18
4 Wood and wood products 1,18
5 Wholesale and commission trade 1,15
Tygerberg
1 Metal products, machinery and household appliances 1,27
2 Finance and Insurance 1,24
3 Furniture and other items NEC and recycling 1,21
4 Food, beverages and tobacco products 1,21
5 Textiles, clothing and leather goods 1,18

123 | P a g e
While Table Bay is the largest contributor to all of the city’s sectors, the different districts
still have unique comparative advantages. By comparing the relative share
constituted by an industry in the respective district economies to its share in the city-
wide economy, location quotient analysis provides an indication of a region’s
comparative industry advantages.
A location quotient value greater than one generally reflects a comparative
advantage industry for that district. The table ranks the top five industries by location
quotient and below is the top comparative advantage industry in each district:
o Blaauwberg: Fishing, operation of fish farms (2.08)
o Cape Flats: Education (1.33)
o Helderberg: Construction (1.56)
o Mitchells Plain: Education (2.02)
o Northern: Electricity, gas, steam and hot water supply (1.63)
o South Peninsula: Real estate activities (1.61)
o Table Bay: Air transport and transport supporting activities (1.28)
o Tygerberg: Metal products, machinery and household appliances (1.27)
It is important to note that a location quotient depends on the relative GVA share of
the sector within a district compared to that of overall Metro. As such, despite being
the largest industry in most districts, the finance and insurance industry does not
appear as the top comparative advantage of any of the districts. This is not to
underplay the industry’s importance as it is one of the metro’s comparative
advantage industries and is also ranked second in Tygerberg, with a location quotient
of 1.24; third in the Northern District where it is ranked with a location quotient of 1.13
and fifth in the Cape Flats with a location quotient of 1.12.
Development Indicators
The Human Development Index (HDI) is a composite indicator reflecting education
levels, health, and income. The HDI ranges from 0 (no human development) to 1 (high
level of human development) (United Nations, 2018). In 2018, the South Peninsula
(0.81), Table Bay (0.81) and the Northern District (0.80) had “very high human
development” (Table 4.2). Mitchells Plain was the only district with a “medium” level
of human development, indexing at 0.66. This demonstrates the unequal access to
education, health, employment as well as other resources within the Metro, largely
due to income gaps and location which limits access to opportunities.
Table 4.2: Human Development Index (HDI)21 2009, 2014 and 2018 (HIS Markit, 2019)
Planning districts Human Development Index (HDI)
21 According to the United Nations (2018), there are four human development groups which are very
high human development (0,800 and above); high human development (0,700 – 0,799); medium
human development (0,550 – 0,699) and low human development (below 0,550).

124 | P a g e
2009 2014 2018
Blaauwberg 0.75 0.78 0.79
Cape Flats 0.66 0.70 0.71
Helderberg 0.72 0.75 0.76
Mitchells Plain 0.61 0.65 0.66
Northern 0.76 0.79 0.80
South Peninsula 0.78 0.80 0.81
Table Bay 0.77 0.80 0.81
Tygerberg 0.70 0.73 0.74
Figure 4.12: Gini Coefficient comparison across districts, 2009, 2014 & 2018 (HIS Markit, 2019)
The Gini Coefficient is an income inequality measure. The coefficient ranges from 0,
which represents “absolute equality”, to 1, which represents “absolute inequality”
(Statistics South Africa, 2014). As of 2018, out of all the districts, the South Peninsula has
the lowest measure at 0.56 and Helderberg has the highest at 0.62. However, it is
concerning to observe an increase in income inequality over time throughout all eight
districts, mirroring the metropolitan trend (Figure 4.12). This shows that income
inequality is a major persistent and growing challenge within Cape Town.
0.61
0.580.57
0.60
0.55 0.550.56
0.58
0.55
0.61
0.58 0.58
0.60
0.560.56 0.56
0.570.57
0.62
0.59 0.59
0.62
0.580.57
0.56
0.58 0.58
0.50
0.52
0.54
0.56
0.58
0.60
0.62
0.64
Cape Town Blaauwberg Cape Flats Helderberg Mitchells
Plain
Northern South
Peninsula
Table Bay Tygerberg
2009 2014 2018

125 | P a g e
Figure 4.13: Number of households per annual income category by District, 2018 (HIS Markit, 2019)
As of 2018, there are a total of 1 315 015 households in Cape Town (see Chapter 2
Demographics), the majority of which is located in the Khayelitsha, Mitchells Plain &
Greater Blue Downs District (383 844), followed by Tygerberg (222 535). The
Khayelitsha, Mitchells Plain & Greater Blue Downs District comprises predominantly of
formal and informal residential areas; thus it is not surprising it has the highest number
of households. The majority of the population in this district (22,5%) has an annual
household income between R18 000 and R42 000, whilst other districts are home to a
higher number of households in upper income percentiles (R132 000 and above).
Tygerberg has the largest share of households (28,2%) with an annual income
between R132 000 and R360 000, while the Blaauwberg, Northern, Table Bay and
South Peninsula Districts all have their highest share of households in the R360 000 –
R1 200 000 category. A majority of the low to middle annual income levels are skewed
in districts, such as Khayelitsha, Mitchells Plain & Greater Blue Downs, with a high
number of households, less economic activity and a low HDI in comparison with other
districts, as compared to other districts. This further reinforces the concern of socio-
economic inequality within the city.
The Informal Economy
The “informal sector” commonly refers to the unregulated, non-formal portion of the
market economy. Statistics South Africa uses an employment-based definition for the
sector, defining it broadly as comprising of employees working in establishments
employing less than five employees who do not pay income tax, as well as own
account workers whose businesses are not registered for either income tax or value-
added tax (VAT). The term “informal economy” is preferred to “informal sector”, as it
reflects the broader scope of economic activities that take place informally. The
relatively low entry barriers to the informal economy, and its strong penetration in
,0
10,000
20,000
30,000
40,000
50,000
60,000
70,000
80,000
90,000
100,000
Blaauwberg Cape Flats Helderberg Mitchells
Plain
Northern South
Peninsula
Table Bay Tygerberg
R 0 - R 6 000 R 6 000 - R 18 000 R 18 000 - R 42 000 R 42 000 - R 72 000
R 72 000 - R 132 000 R 132 000 - R360 000 R 360 000 - 1 200 000 R 1 200 000 and above

126 | P a g e
impoverished areas, means that it has the potential economically include otherwise
marginalised members of society.
Size of Informal Economy
Between 2015 and 2019, the absolute number of jobs in the informal economy has
grown, as has the share of total jobs which are informal in nature (Figure 9.14). Statistics
South Africa estimates that, as of the second quarter of 2019, approximately 220 000
people are employed in the informal economy in Cape Town (Figure 9.14). This
constitutes 13.3% of Cape Town’s workforce, a significant amount. Importantly, the
benefit of the sector is predominantly in low-income communities, where it accounts
for an estimated 5% reduction in the poverty rate.22
Employment Distribution
22 GHS 2013
10%
13%
Figure 4.14: Formal versus informal employment in Cape Town, 2015–2019 (Stats SA Quarterly Labour Force
Survey: Q2,, 2019)
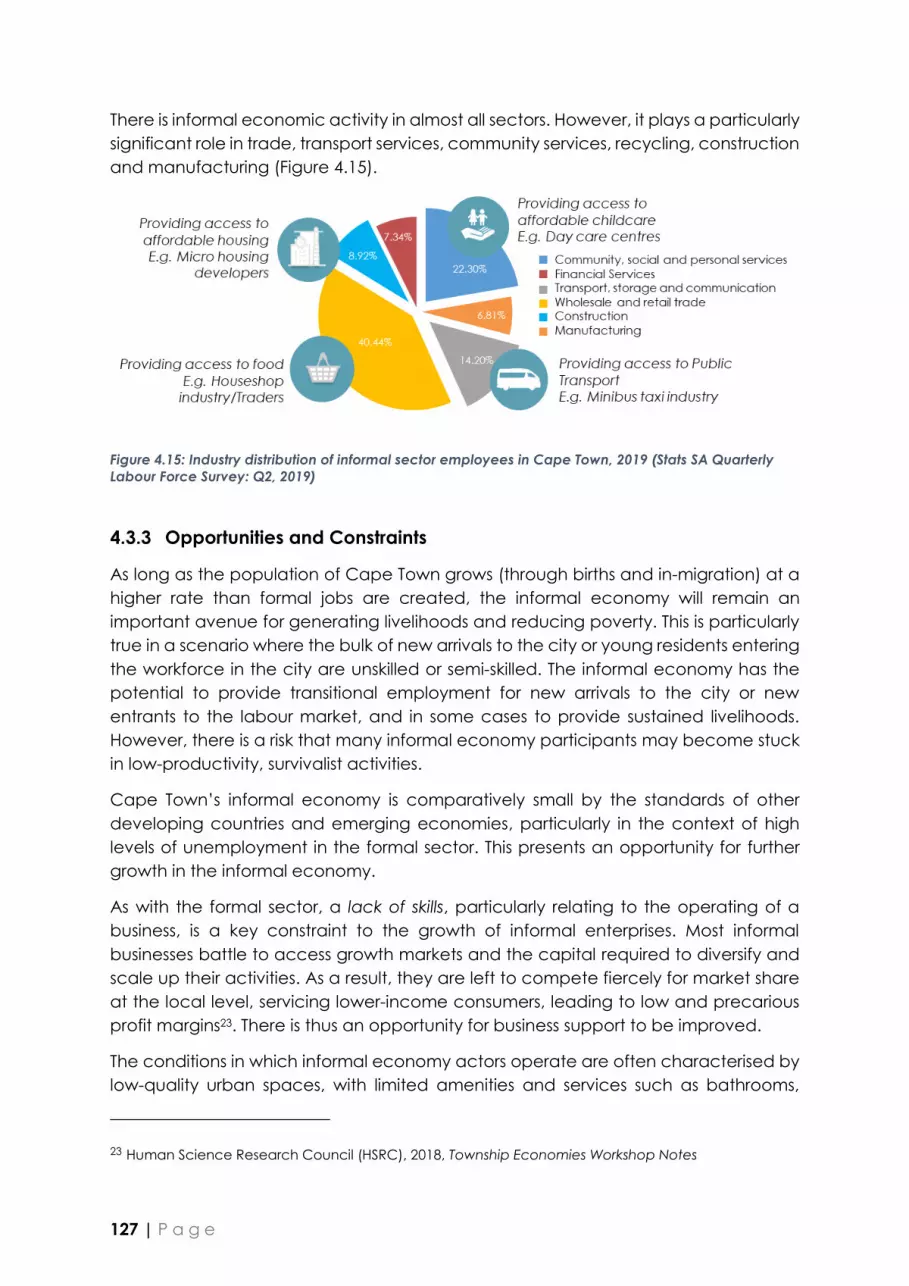
127 | P a g e
There is informal economic activity in almost all sectors. However, it plays a particularly
significant role in trade, transport services, community services, recycling, construction
and manufacturing (Figure 4.15).
Figure 4.15: Industry distribution of informal sector employees in Cape Town, 2019 (Stats SA Quarterly
Labour Force Survey: Q2, 2019)
Opportunities and Constraints
As long as the population of Cape Town grows (through births and in-migration) at a
higher rate than formal jobs are created, the informal economy will remain an
important avenue for generating livelihoods and reducing poverty. This is particularly
true in a scenario where the bulk of new arrivals to the city or young residents entering
the workforce in the city are unskilled or semi-skilled. The informal economy has the
potential to provide transitional employment for new arrivals to the city or new
entrants to the labour market, and in some cases to provide sustained livelihoods.
However, there is a risk that many informal economy participants may become stuck
in low-productivity, survivalist activities.
Cape Town’s informal economy is comparatively small by the standards of other
developing countries and emerging economies, particularly in the context of high
levels of unemployment in the formal sector. This presents an opportunity for further
growth in the informal economy.
As with the formal sector, a lack of skills, particularly relating to the operating of a
business, is a key constraint to the growth of informal enterprises. Most informal
businesses battle to access growth markets and the capital required to diversify and
scale up their activities. As a result, they are left to compete fiercely for market share
at the local level, servicing lower-income consumers, leading to low and precarious
profit margins23. There is thus an opportunity for business support to be improved.
The conditions in which informal economy actors operate are often characterised by
low-quality urban spaces, with limited amenities and services such as bathrooms,
23 Human Science Research Council (HSRC), 2018, Township Economies Workshop Notes

128 | P a g e
shelter and storage facilities. Informal businesses are generally more affected by crime
and insecurity, and the unregulated nature of the informal economy also increases
opportunities for exploitation. The regulations governing business licencing and other
regulatory requirements, such as land use and building approvals are designed for
formal businesses and often are not relevant to the realities of the informal sector. The
costs associated with regulatory compliance represent a disincentive to formalisation,
which may severely hamper the growth of informal enterprises.
A key challenge for the City in supporting informal sector development is the scarcity
of data about the size, location and activities of the informal economy. Lack of
information about the lived reality of those working informally and their priority needs
is also a challenge. For this reason, further studies are being undertaken to assist in the
preparation of the revised District SDF.

129 | P a g e
5 PROPERTY MARKET
Measuring Property Market Performance
Amongst other variables, Table 5.1 below depicts the change in average capitalisation
(cap) rates over time within the Khayelitsha, Mitchells Plain & Greater Blue Downs District.
As previously highlighted (see Section 9.1.2 Macro Property Market Performance), the cap
rate is one type of measurement used in evaluating an investment, indicating risk and the
potential rate of return for a prospective property. The cap rate is the ratio of stabilised
annual net operating income to purchase price. Thus, it measures income after deduction
for operating expenses and normal vacancy, but before deducting financing charges
and income taxes (Ambrose and Nourse, 1993: 221). A low cap rate implies lower risk and
higher value, while a high cap rate implies higher risk and lower value. The cap rate of a
given property is influenced by a variety of endogenous and exogenous factors and is
therefore considered to be a good indicator to assess property market performance.
These factors comprise of the following:
Market Value: "The estimated amount for which a property should exchange on
the date of valuation between a willing buyer and a willing seller in an arm's length
transaction after proper marketing wherein the parties had each acted
knowledgeably, prudently and without compulsion" (Blackledge, 2009).
Gross rental income: The total amount collected in rent and any related rental
property income before any expenses are deducted; you can include rent for
parking and other factors.
Net operating income (NOI): This is the annual income generated by an income-
producing property after deducting all operating expenses.
Operating expenses: Expenses needed to operate the property which includes
property taxes, rental property insurance, management fees, repairs, maintenance
and miscellaneous things like accounting and legal fees.
Occupancy rate: The ratio of rented space to the total amount of available space
and is typically used in multi-unit properties.
Growth
Operating expenses: Expenses needed to operate the property which includes
property taxes, rental property insurance, management fees, repairs, maintenance
and miscellaneous things like accounting and legal fees.
Supply vs. demand: This relates to how many properties are available in the area;
typically, the lower the inventory, the higher the demand, which tends to lead to
properties with lower cap rates.
Property type/Asset class: This is the type of property such as multifamily, apartment
building, industrial or commercial property and typically residential properties have
lower cap rates than commercial properties, because commercial properties tend
to have higher rents.
Rents that are above or below market
Length of the lease term
Financial strength/credit rating of the tenant

130 | P a g e
Key Observations and Trends
Non-residential
Table 5.1: Khayelitsha, Mitchells Plain & Greater Blue Downs District property market indicators, 2012–2018
(City of Cape Town Non-Residential Market Research, 2018)
Market Segment Year Average Cap
Rate (%)
Average
Operating
Costs
(R/m²/month)
Average
Gross market
Rental
(R/m²/month)
Average
Vacancy
Rate (%)
Industrial
2012 10.6% R5.17 R27.02 3.5%
2015 10.1% R6.44 R32.17 5.8%
2018 9.5% R10.09 R63.48 3.5%
Retail
2012 11.2% R10.65 R51.63 3.5%
2015 10.2% R13.20 R55.41 5.0%
2018 10.8% R23.36 R154.86 4.7%
Office
2012 11.8% R12.81 R51.97 5.0%
2015 11.4% R12.38 R54.82 9.6%
2018 11.3% R16.49 R94.75 6.3%
Figure 5.1: Change in Khayelitsha, Mitchells Plain & Greater Blue Downs District average capitalisation rates
per non-residential market segment, 2012–2018 (CCT Non-Residential Market Research, 2018)
0.0%
2.0%
4.0%
6.0%
8.0%
10.0%
12.0%
14.0%
2012 2015 2018
Ca
p R
ate
(%
)
Valuation Term
Average Cap Rates for the KMPGBD District
Industrial
Retail
Office

131 | P a g e
Figure 5.2: Change in Khayelitsha, Mitchells Plain & Greater Blue Downs District average vacancy rates per
non-residential market segment, 2012–2018 (CCT Non-Residential Market Research, 2018)
5.2.1.1 Industrial
In the Khayelitsha, Mitchells Plain & Greater Blue Downs District, the industrial sector is
generally performing better than other market segments. The average cap rate of the
sector decreased modestly, but consistently over the last three valuation terms, from 10.6%
in 2012 to 9.5% in 2018 (Figure 5.1). This is due in no small part to the low operating costs of
industrial property, relative to retail and office. As of 2018, the industrial sector also has the
lowest average vacancy rate, at 3.5% (Figure 5.2). Although the district did see a marked
spike in the average vacancy rate between 2012 and 2015, this again decreased to its
previous level between 2015 and 2018. This implies an increase in the supply of industrial
space, which was subsequently taken up by businesses. Such a trend is supported by the
rise in the property prices (as expressed by the median gross market rental price), which
increased marginally in the 2012–2015 period and subsequently increased by 1/3 in the
2015–2018 period (Table 5.1), representing a rise in demand as space is taken up.
0.0%
2.0%
4.0%
6.0%
8.0%
10.0%
12.0%
2012 2015 2018
Va
ca
nc
y R
ate
(%
)
Valuation Term
Average Vacancy Rates for the KMPGBD District
Industrial
Retail
Office
3.5% 5.8% 3.5%

132 | P a g e
Figure 5.3: Khayelitsha, Mitchells Plain & Greater Blue Downs average capitalisation rates per 4 ha grid:
industrial property market

133 | P a g e
In terms of local market performance, Blackheath Industria in the Greater Blue Downs Sub-
District currently has the lowest cap rates, ranging from 9%–10%, with lower rates on the
periphery of the area (Figure 5.3). This makes intuitive sense, as Blackheath Industria is also
the largest and most established industrial node in the district. This is followed by the
Hagley, Dreamworld, Mitchells Plain CBD and Philippi industrial areas, with cap rates
primarily in the range of 9.51%–10%. The highest cap rates for industrial property in the
district by a significant margin are found along in areas straddling the R300 freeway in
Webank and Delft, in the range of 11.51%–12%, representing a relatively high risk and low
performance in industrial development in the area.
5.2.1.2 Street-Front Retail
In comparison with other market sectors in the district, street-front retail is performing
marginally better than office, but worse than industrial by a somewhat larger margin. Its
average 2018 cap rate of 10.8% sits between that of office at 11.3% and of industrial at
9.5% (Figure 5.1). This is far above the metropolitan average of 8.64%. Interestingly, the
average cap rate of street-front retail decreased significantly between 2012 and 2015,
before rising close to its 2012 level again by 2018 (Figure 5.1). The 2015–2018 rise in the
average cap rate followed a marked increase in the average vacancy rate, from 3.50%
to 5%, in the 2012–2015 period, which subsequently remained at that level in the 2015–
2018 period (Figure 5.2). This indicates an increase in street-front retail stock that has gone
unoccupied and thus a relative decline in performance across the district. However, this
trend is not reflected in the median property value, which increased marginally between
2012 and 2015, only to increase by approximately 75% between 2015 and 2018 (Table 5.1).
Despite a significant overall increase in market value, there is still a high degree of risk
associated with retail properties, evidenced by exceptionally high cap rates in the range
of 11%–12% across the district (Figure 5.4). Better performing exceptions to this overriding
spatial trend are the Mitchells Plain CBD (in the range of 8.51%–10%), followed by Philippi,
specifically the intersections of New Eisleben Road with Sheffield and Govan Mbeki Roads
(primarily in the range of 9.51%–10%).
Amidst this overall poor performance, trade as an industry (which encompasses largely of
retail activity) is still a significant contributor to the economy of the district. It is the second
largest contributor to employment (21.6%) and the third largest contributor to GVA (16.6%).
It should further be noted that this section does not account for other larger-scale retail
typologies, such as neighbourhood and regional shopping centres, which have a
significant impact on the cumulative retail property market performance.

134 | P a g e
Figure 5.4: Khayelitsha, Mitchells Plain & Greater Blue Downs average capitalisation rates per 4 ha grid: street-
front retail property market

135 | P a g e
5.2.1.3 Office
Office is the worst performing of the district’s three non-residential property sectors. While
its average cap rate displays the same modest, yet consistently decreasing trend as the
industrial sector between 2012 and 2018, it still exhibits the highest current rate at 11.3%
(Figure 5.1). As of 2018, office also has the highest average vacancy rate at 6.3% (Figure
5.2). It saw the sharpest spike in vacancy rate between 2012 and 2015 of all three sectors,
which subsequently decreased significantly between 2015 and 2018. This points to an
increase in the supply of office property, of which most appears to have been taken up.
Consequently, the median office property value has remained almost unchanged in the
2012–2015 period, while increasing more significantly in the 2015–2018 period as a result of
demand responding to the supply of office space (Table 5.1).
Locally, the Mitchells Plain CBD contains the highest concentration of office space in the
district. Intuitively, it also displays the lowest cap rates by a slight margin, in the range of
10.51%–12% (Figure 5.5). All other office properties in the district (including those clusters
concentrated along New Eisleben Road, around the Khayelitsha CBD, in Ikwezi Park,
Blackheath and Eerste River) have consistently higher cap rates, primarily in the range of
11.51%–12%.

136 | P a g e
Figure 5.5: Khayelitsha, Mitchells Plain & Greater Blue Downs average capitalisation rates per 4 ha grid: office
property market

137 | P a g e
5.2.1.4 Change in Value
Significant increases in non-residential property values (>100%) between 2012 and 2018
are relatively widely spread throughout the district (Figure 5.6). Amidst this trend, however,
the most exceptional and concentrated non-residential property growth (>100%) has
particularly occurred in Faure. While this area does include the industrial property of Cape
Town Film Studios and iThemba Labs (with the lowest cap rates and lowest levels of risk
among industrial property in the district) the majority thereof is undeveloped and forms
part of the Kuils River corridor and Khayelitsha wetland system. As such, it is curious that it
would have seen such drastic and widespread increases in property value. A possible
explanation for this would be that property values within this area have historically not
been particularly high to begin with. Therefore, even a very marginal increase in property
value could easily equate to a doubling thereof.
In terms of other industrial nodes, the majority of Blackheath Industria has seen no change
in property value (Figure 5.6). However, property values on its northern edge generally
increased in the range of 30–60%, those on its eastern edge by 70–80% and the cluster on
its western edge in excess of 100% (Figure 5.6). This pattern is an indication of the outward
expansion of Blackheath Industria, which includes small pockets of office space on its
northern and eastern fringes and retail property on its western edge, further cementing its
status as one of the most prominent and growing economic areas in the district (Figure 5.4
& Figure 5.5).
The only other industrial area to have seen similar growth in property growth is Hagley,
where non-residential property values grew in excess of 100% (Figure 5.6). By contrast,
major parts of Philippi Industria saw either low growth in value (0–20%) or negative growth,
particularly in relation to informal settlement expansion and growing residential demand
(Figure 5.7). Similarly, the strip of industrial properties along the R300 in Wesbank and Delft
grew only marginally in value by 0–15%, reflecting their nature as the worst performing in
the district (Figure 5.3 & Figure 5.6).
The Mitchells Plain CBD industrial node saw more moderate growth in non-residential
property values in the range of 20–50% (Figure 5.3 & Figure 5.6). This growth has also been
linked to street-front retail and office property, making the Mitchells Plain CBD one of the
more diverse economic nodes in the District. (Figure 5.4, Figure 5.5 & Figure 5.6) Other
areas of exceptionally high (>100%) growth in non-residential property values in Mitchells
Plain coincide primarily with street-front retail, such as in Rocklands, the northern edge of
Beacon Valley (along AZ Berman Drive and Morgenster Road), Woodlands (south of
Colorado Park, along New Eisleben Road) and around the Lentegeur Railway Station
(Figure 5.4 & Figure 5.6).
Scattered areas of exceptionally high non-residential property value growth (>100%) in
Philippi are also largely linked to retail activity, such as at the interface with Crossroads.
Similar growth in values in Ikwezi Park, however, are tied to both retail and office properties
(Figure 5.4, Figure 5.5 & Figure 5.6).
Within Khayelitsha, exceptionally high non-residential property value growth (>100%) has
concentrated around the Khayelitsha CBD and on the southern edge of Khaya, including

138 | P a g e
a mix of retail and office space (Figure 5.4, Figure 5.5 & Figure 5.6). Other areas of such
growth include northern Khaya, Victoria Mxenge, Mandela Park, Umrhabulo Triangle,
Kuyasa and Harare (Figure 5.6). However, this growth in property values is tied to
undeveloped land more than existing economic activity and reflects the increasing
pressure on and demand for the vacant, underutilised land in Khayelitsha.
Within the Greater Blue Downs Sub-District, certain pockets of exceptionally high (>100%)
non-residential property value growth, such as around the Blue Downs CBD, Malibu Village
and Eerste River South, are also tied to undeveloped or underutilised land, representing a
significant rise in demand for these spaces (Figure 5.6). Other pockets of similar growth
coincide with small-scale retail activity, such as in Klein Vlei, Hillcrest Heights, Forest Heights
and along Forest Drive (Figure 5.4 & Figure 5.6). Interestingly, two of the most established
non-residential nodes within Greater Blue Downs – Mfuleni CBD (retail in nature) and Eerste
Rivier Railway Station (office and retail in nature) – have seen the most inconsistent
changes in property values, ranging from negative growth to growth in excess of 100%
(Figure 5.4, Figure 5.5 & Figure 5.6), suggesting inconsistent demand from businesses for
locating there.

139 | P a g e
Figure 5.6: Khayelitsha, Mitchells Plain & Greater Blue Downs District change in average non-residential
property values per 1 ha grid, 2012–2018

140 | P a g e
Residential
5.2.2.1 Sales
Between 2009 and 2018, the highest number of residential property sales in the district were
made in Philippi, amounting to 3 001 – 5 000 transactions in each of its smaller areas (Figure
5.7). However, Philippi also generally has residential property prices on the lowest end of
the spectrum (Figure 5.8). This reflects a high demand for housing in the area by
households in the very lowest income groups and also reflects the high degree of risk
associated with investment in the area. Similar, but less extreme, contrasts between a high
number of property sales and low property value are found in Ikwezi Park and Mfuleni,
where extremely low property values coincide with a moderate number of sales, (Figure
5.7 & Figure 5.8).
Mitchells Plain had the next highest number of residential property sales in the 2009–2018
period, particularly in Lentegeur, Portland (adjacent to the Mitchells Plain CBD), Tafelsig
and Rocklands, which all saw between 2 001 and 3 000 transactions (Figure 5.7).
Somewhat smaller numbers of sales (1 201–2 000) were recorded in Westridge, Eastridge
and Beacon Valley. Save for Tafelsig, the moderate number of residential property sales
within Mitchells Plain coincide with moderately high property values (Figure 5.7 & Figure
5.8). This positions Mitchells Plain’s residential property market as the overall healthiest in
the district, with a general alignment between demand and affordability.
Moderate to high residential property sales and prices further coincide in several suburbs
in Greater Blue Downs, such as Hagley, Silversands, Fountain Village and Eerste River
(Figure 5.7 & Figure 5.8). The moderate sales in these suburbs are likely linked to the uptake
of new residential development, aimed primarily at middle- to lower-income groups. The
remainder of the Greater Blue Downs Sub-District generally displays both low numbers of
property sales and low property values.
The suburbs of Ilitha Park and Graceland in Khayelitsha also display a confluence of
moderately high property sales and value (Figure 5.7 & Figure 5.8). However, the majority
of areas in Khayelitsha display a mismatch of either 1) low numbers of property sales of
moderate value (Victoria Mxenge and Nonqubela) or 2) moderate numbers of sales of
low value (Mandela Park, Kuyasa and Umrhabulo Triangle). As in Philippi, this is a clear
indicator of the high degree of poverty in the area, where moderate numbers of sales
mainly occur in those suburbs where property prices are at their lowest.
Table 5.2: Highest affordable property prices for respective monthly household incomes
Monthly household income Affordability (assuming a bond on a
13% interest rate)
R22 000 R560 000
R20 000 R510 000
R18 000 R460 000

141 | P a g e
Figure 5.7: Khayelitsha, Mitchells Plain & Greater Blue Downs District: number of residential sales per suburb,
2009-2018

142 | P a g e
Figure 5.8 Khayelitsha, Mitchells Plain & Greater Blue Downs District: average residential property value by
suburb, 2018 (R/m2)

143 | P a g e
5.2.2.2 Change in Value
In contrast with non-residential properties, the growth in value of residential properties
between 2012 and 2018 has been far more spatially distinct (Figure 5.9). The highest and
most concentrated growth has occurred in the residential suburbs of Philippi, in excess of
100%. Equally high residential growth rates are observed in Mfuleni (with expectedly lower
values in the non-residential Mfuleni CBD) and south-eastern Khayelitsha (Graceland,
Harare, Umrhabulo Triangle and Kuyasa). Within Philippi and Mfuleni especially, this is a
reflection of high population growth rates and a subsequent rise in demand for housing
(see Chapter 2 Demographics).
The second highest rates of residential property value growth have occurred in north-
western Khayelitsha, Hagley and Rustdal (north-east of Blackheath Industria), generally in
the range of 50–100%. After that, more moderate growth in residential property values has
been observed in south-eastern Blue Downs and Mitchells Plain (most notably along the
railway line), primarily in the range of 40–70%.

144 | P a g e
Figure 5.9: Khayelitsha, Mitchells Plain & Greater Blue Downs District change in average residential property
values per 4 ha grid, 2012–2018

145 | P a g e
KEY OPPORTUNITIES AND CONSTRAINTS
Opportunities
Blackheath Industria is a large, established and well-performing industrial node.
Property values on the periphery of Blackheath Industria are also increasing, linked
to growing street-front retail and office sectors. This diversification of economic
activity further strengthens Blackheath’s role as an important economic node in the
district, particularly Greater Blue Downs, that contributes significantly to economic
opportunities and could support higher-density residential development.
There is potential to further develop and invest in smaller, moderately well-
performing industrial nodes in Hagley, Dreamworld and the Mitchells Plain CBD.
The street-front retail sector is performing moderately in certain portions of Philippi,
with property values growing specifically at the intersections of New Eisleben Road
with Sheffield Road and Govan Mbeki Road. This creates a base from which to
reimagine the development of the area in light of the ailing industrial sector.
The viability of street-front retail in many parts of the district can be strengthened
through greater support of informal street-front retail activity.
The Mitchells Plain CBD has the highest concentration of office space in the district,
with the lowest degree of risk associated with investment in the sector. In
conjunction with the well-performing street-front retail sector and relatively well-
performing industrial sector, the area has the potential to further support a
spectrum of job opportunities and possible residential densification.
There is the potential for growth in street-front retail activity in other areas of
Mitchells Plain, including Rocklands, Beacon Valley (along AZ Berman Drive and
Morgenster Road), Woodlands (along New Eisleben Road) and around the
Lentegeur Railway Station.
Non-residential property values are increasing across Khayelitsha, linked largely to
vacant, underutilised land with significant potential for development.
There is growth in the property values associated with small-scale street-front retail
activity across Greater Blue Downs, including Klein Vlei, Hillcrest Heights, Forest
Heights and along Forest Drive.
The residential property market is performing well in Mitchells Plain, where moderate
residential property values coincide with moderate sales and increases in value,
particularly in areas straddling the railway line. This creates potential for higher-
density transit-oriented development that integrates with the railway line and future
MyCiti BRT route along AZ Berman Drive.
Eersterivier and other areas in Blue Downs are seeing a confluence of moderate
residential property sales and an increase in residential property value, indicating
the potential of the area to meet the housing demand of low- to medium-income
households.

146 | P a g e
Constraints
The potential of Philippi as an industrial node has decreased significantly over time
(as represented by the low to negative growth in industrial property values).
Unutilised industrially-zoned land has allowed for large informal settlements to grow,
which further adds to the risk of development in the area, forming a positive
feedback loop of decreasing investment and development confidence.
The street-front retail sector is underperforming across the district, with an average
cap rate of 10.8%, versus a metropolitan average of 8.64%. This risk in investment in
street-front retail is linked to, inter alia, high crime rates.
Despite the strong gross rental return per m2, investment in office space has a very
high degree of risk associated with it almost across the entire district.
Non-residential property values in the established economic nodes of the Mfuleni
CBD and Eersterivier Railway Station (office and retail in nature) have seen
inconsistent growth.
There is a high demand for housing in Philippi from people in the very lowest income
brackets.

147 | P a g e
E. SYNTHESIS SECTION STILL INCOMPLETE – THIS INFORMATION STILL NEEDS TO
BE UPDATED

148 | P a g e
6 RISKS
Urban developments are subject to a certain amount of risk, e.g. construction faults, traffic
accidents or exposure to hazardous substances. In the context of the District SDF, the focus
is on avoiding, mitigating or reducing the risk of disaster, by guiding development away
from known hazards or in a way that the risk of being exposed to disasters24 is lessened.
This chapter outlines the current and future risks to the Khayelitsha, Mitchells Plain &
Greater Blue Downs District and their associated levels of impact on the intensity and
location of future urban development in the area.
Guiding Policy on Risk Management
The IDP focus area “The Safe City” reflects on the management of disasters and risks. The
City emphasises integrated planning and governance in disaster risk management, and
the need to build the city’s resilience to risks (i.e. the ability to recover from disastrous
events). This is reflected in the policy statements of the CTMSDF (Table 6.1).
The City’s Disaster Risk Management Plan, embedded in the IDP, considers the City’s
response to disaster impacts, relief, rehabilitation, reconstruction, and preparedness
(Table 6.2).
The City’s Resilience Strategy, 2019 notes that chronic stresses such as unemployment,
congestion and poverty weaken the city’s ability to cope with shocks. All communities of
the city have a degree of vulnerability to risk. The Disaster Risk Management Plan identifies
70 hazards and risks that the City must respond to. Approximately 25 of these risks could
occur across the city, e.g. drought and rainfall reduction, service disruptions, traffic
accidents, the transportation of hazardous substances, terrorism or construction faults.
Stresses which increase vulnerability are disproportionately experienced by communities
experiencing inadequate shelter, poverty and unemployment and especially the urban
poor living in informal settlements. The servicing, disaster response and development of
vulnerable areas and informal settlements is a priority across the city for building resilience.
Spatial planning must ensure that new developments both avoid and do not exacerbate
risk and where historic urban development is exposed to risk and hazard, it is mitigated.
Similarly, the direction of spatial planning under a high-resilience framework ensures that
the built environment is developed to bring about low-carbon opportunities, and
meaningfully mitigate against climate change and buffer against increasing costs of fossil
24 The definition of a disaster is: “a progressive or sudden, widespread or localised, natural phenomena or human-caused
occurrence which –
(a) causes or threatens to cause -
(i) death, injury or disease;
(ii) damage to property, infrastructure or the environment; or
(iii) disruption of a community; and
(b) is of a magnitude that exceeds the ability of those affected by the disaster to cope with its effects using only their own
resources” (Disaster Management Act, 57 of 2002)

149 | P a g e
fuels. Doing so in the immediate future reduces the cost of implementing climate
adaptation measures in the long-term.
Table 6.1: Policy statements pertaining to risk (CTMSDF, 2018)
Sub-Strategy Appropriately Protect the Citizens of Cape Town from Risk Areas
Policy Statement What this Means/Requires
Policy 20
Enable resource-efficient development
The City can guide spatial development in a
way that encourages the public and private
sector to utilise sustainable practices and
technologies that assist in reducing carbon
emissions, reduce energy and water demand,
promote public transport, non-motorised
transport and support the recycling of water
and waste materials.
Policy 21
Direct urban growth away from risk areas
Hazardous areas are either already
determined through proclamations/ law or
specialist studies, or will be determined as part
of the EIA processes or pre-submission
consultations processes, where appropriate.
Policy 22
Discourage urban growth in areas at risk from
natural hazards/coastal processes which are
expected to be amplified by climate change
impacts.
Areas vulnerable to climate change and
natural hazards and risks have broadly
defined through specialist studies or will be
determined by future specialist studies.
Table 6.2: Cape Town Disaster Risk Management Plan evaluation of hazards25
Measurement Criteria for
each Hazard Assessed
Criteria’s
Assessment Rating
Inte
gra
tio
n o
f fa
cto
rs t
o d
ete
rmin
e t
he
Re
lativ
e
Pri
ori
ty
Hazards Relative
Priority Rating
Probability of
Occurrence
Very Likely
Likely
Possible
Unlikely
Maximum impact/
Severity &
Consequences
Extreme
Moderate Very High Priority
Insignificant High Priority
Vulnerability of
Community and/or
Environment and/or
Economy
Very Vulnerable Medium Priority
Vulnerable Lower Priority
Small Vulnerability
Manageability/Coping
Capacity by Responders
to offset Hazards Impact
and Vulnerabilities
Good
Adequate
Basic
Poor
25 Further description of the methodology and ratings prescribed is contained in the City of Cape Town Disaster Risk Management Plan

150 | P a g e
Risks in Khayelitsha, Mitchells Plain & Greater Blue Downs
Taking the aforementioned guiding policy into the account, the following section identifies
the types of risk and the level of exposure to risks at the district scale, referencing those
risks that impact on the permissible intensity and location of future urban development.
The hazard evaluation above is referenced where possible. In addition, the relevant
principles that apply when considering the allocation of development rights and possible
exceptions are identified.
Natural Risks
6.2.1.1 Sand Dune Migration/Wind-Blown Sand
The district is sandy and exposed to strong south-easterly winds, wind-blown sand and
sand migration both affects the liveability of and functionality of infrastructure in the
district. Along the coast, strong winds and salt water spray create harsh conditions.
Sand dune migration poses a risk to urban development and coastal infrastructure in
particular, impacting the use and maintenance of coastal infrastructure and properties.
Infrastructure at coastal resorts is affected affecting the recreational amenity of the coast
in this area. There is high seasonal demand for recreation at this stretch of the coast. Baden
Powell Drive is frequently rendered unusable by wind-blown sand, to the extent that
realignment of beach access must be considered.
Monwabisi Beach infrastructure and usability is similarly affected by wind-blown sand.
Coastal Erosion, the implications of which are outlined in Table 6.3 below.
Table 6.3: Overview and implications of risk: wind-blown sand
Rating of
Probability
Rating of
Maximum
Impact
Vulnerability
Rating
Coping
Capacity
DRM
Priority
Rating
Development Principles and
Exceptions
Likely Moderate Vulnerable Adequate High
Development of coastal
economic and social
opportunities must be
undertaken in a manner that
does not reduce, harm or
degrade our coastal
environment or its ability to
cope with climate risks in the
future.
For existing property in risk
areas initiatives that enable
adaptation and reduce risk
must be encouraged.
Alternative service delivery
mechanisms in risk areas
should be investigated in
order to reduce the impacts
of known hazards.

151 | P a g e
The dynamic nature of the False Bay Coast means that coastal erosion is a threat. The loss
of vegetation and urban development further compounds this threat. Wolfgat Nature
Reserve needs assessment for erosion of cliff faces (Table 6.4).
Table 6.4: Overview and implications of risk: coastal erosion
Rating of
Probability
Rating of
Maximum
Impact
Vulnerability
Rating
Coping
Capacity
DRM
Priority
Rating
Development Principles and
Exceptions
Likely Moderate Vulnerable Adequate Lower
Development of coastal
economic and social
opportunities must be
undertaken in a manner
that does not reduce,
harm or degrade our
coastal environment or its
ability to cope with
climate risks in the future.
For existing property in risk
areas initiatives that
enable adaptation and
reduce risk must be
encouraged.
Alternative service
delivery mechanisms in
risk areas should be
investigated in order to
reduce the impacts of
known hazards.
6.2.1.2 Flood Risk and Storm Surges
The presence of rivers, waterbodies, 1:100-year flood lines and indicative sea level rise
modelling reveals the areas with higher probability for flood and coastal inundation. (Note:
The Coastal Management line does not indicate all the properties that are exposed to
coastal risks.) In addition to the above, relative elevation reveals areas where the flow of
water will speed up or where water will collect. This indicates more need for storm water
management and precautionary development principles.

152 | P a g e
The Kuils River corridor cuts across the district, leading to seasonal flooding in low-lying and
flood-prone areas (Figure 6.1). Coastal resorts and development in low-lying areas and
flood zones are therefore vulnerable to the effects of storm surges, as is outlined in Table
6.5 below.
Table 6.5: Overview and implications of risk: flooding
Rating of
Probability
Rating of
Maximum
Impact
Vulnerability
Rating
Coping
Capacity
DRM
Priority
Rating
Development Principles and
Exceptions
Likely Moderate Very
Vulnerable Good High
Careful management of
development to avoid
developing in high flood
risk areas, to protect the
environmental integrity of
aquatic resources and to
ensure that permitted
development enhances
the aesthetics and
character of the adjacent
watercourses/wetlands.

153 | P a g e
Figure 6.1: Relative elevation above sea level (m) of the Khayelitsha, Mitchells Plain & Greater Blue Downs District

154 | P a g e
Built Environment Risks
6.2.2.1 Cemeteries, Solid Waste Disposal Sites and Waste Water Treatment Works
Exclusion buffers exist around landfill and waste disposal sites to protect surrounding
populations from hazards and nuisances. Historic sites also exclude certain types of
development for a period of time determined in the waste management regulations as
they present particular hazards in terms of structural stability. This is a challenge in the
district where there are large areas of historic waste sites. In the case of Swartklip, this
includes hazardous waste. Smaller sites and drop-off facilities present fewer nuisances and
hazards, but may have an impact on neighbouring property uses. Cemeteries act as
development moderators as their future use is limited. The area is short on cemetery space.
These factors are incorporated into Table 6.6 below.
Table 6.6: Overview and implications of risk: cemeteries, waste disposal sites and waste water treatment works
Rating of
Probability
Rating of
Maximum
Impact
Vulnerability
Rating
Coping
Capacity
DRM
Priority
Rating
Development Principles and
Exceptions
n/a n/a n/a n/a n/a
No inappropriate
development in waste
sites or buffer areas.
6.2.2.2 Cape Town International Airport Noise Contours
The Cape Town International Airport is located directly to the north-west of the district. The
runway currently operates with approximately 30 Air Traffic Movements (ATM) per hour.
Consequently, the noise from aircraft landing and alighting affects the district, particularly
the Denel/Swartklip area. Although the district is affected less than areas closer to the
airport, new development should consider how to reduce vulnerability to the noise
resulting from airport activities, as outlined in Table 6.7 below.
Table 6.7: Overview and implications of risk: noise contours
Rating of
Probability
Rating of
Maximum
Impact
Vulnerability
Rating
Coping
Capacity
DRM
Priority
Rating
Development Principles and
Exceptions
n/a n/a n/a n/a n/a
Regulations governed in
title deed restrictions
Reduce vulnerability
and exposure to
damaging noise levels.
6.2.2.3 Infrastructure Availability
The availability of infrastructure influences the type of development that can occur (Table
6.8). Higher infrastructure capacity can include a higher intensity of land use. Infratructure
needs to accommodate the growth and demand that will allow cost recovery and a
more efficient urban form. Aging and inadequate infrastructure poses different levels of
risk throughout the district (see Chapter 6: Infrastructure).

155 | P a g e
Table 6.8: Overview and implications of risk: lack of infrastructure capacity
Rating of
Probability
Rating of
Maximum
Impact
Vulnerability
Rating
Coping
Capacity
DRM
Priority
Rating
Development Principles and
Exceptions
n/a n/a n/a n/a n/a
Development shouldn’t
occur where bulk
infrastructure services
are stressed.
Infrastructure should
build in redundancy in
areas where
development in
prioritised.
6.2.2.4 Structural Fire: Informal Settlements
Informal settlements and backyard dwellings are often built at extremely high densities
and are unable to meet building standards for fire risk reduction. The reasons for informal
settlement fires and methods for reducing risk are complex and site-specific, requiring an
integrated response. From a spatial planning perspective, community planning initiatives
such as re-blocking and maintenance access routes for emergency services are
interventions that may reduce risk, as outlined in Table 6.9 below.
Table 6.9: Overview and implications of risk: structural fires in informal settlements
Rating of
Probability
Rating of
Maximum
Impact
Vulnerability
Rating
Coping
Capacity
DRM
Priority
Rating
Development Principles
and Exceptions
Very Likely Extreme Very
Vulnerable Adequate
Very
High
Access for fire services
needs to be
maintained
Working with informal
settlement
communities to
manage risks and
adapt buildings.
6.2.2.5 Structural Fire: Formal Settlements
Fire in formal settlements is a risk across the district, particularly when exposed to high
temperatures and strong winds (Table 6.10). The prevalence of older buildings in the district
and more vegetated suburbs also contributes to this risk. In general, however, a higher
degree of building standard compliance and clearer access routes for emergency mean
that there is less vulnerability than informal settlements experience.

156 | P a g e
Table 6.10: Overview and implications of risk: structural fire in formal settlements
Rating of
Probability
Rating of
Maximum
Impact
Vulnerability
Rating
Coping
Capacity
DRM
Priority
Rating
Development Principles
and Exceptions
Very Likely Extreme Vulnerable Adequate Very
High
Maintaining access for
fire services and
maintenance of water
access points.
Compliance with
buildings standards
and urban design to
reduce fire risk.
Encouraging
maintenance of trees
and vegetation in
private properties.
6.2.2.6 Heat and Heat Islands
All areas of the city are at risk from increased heat due to climate change, including
increased heat waves (defined as three or more days in a row of temperatures higher
than 32°C) and high-heat days (defined as a temperature of higher than 35°C). Dense
urban areas with low levels of green vegetation are most at risk of heat impacts and can
be several degrees hotter than those areas not subject to the heat island effect. Fire risk is
anticipated to increase over time due to increased temperatures, increased drying, and
higher wind speeds caused by climate change (Table 6.11).
Table 6.11: Overview and implications of risk: heat and heat island effect
Rating of
Probability
Rating of
Maximum
Impact
Vulnerability
Rating
Coping
Capacity
DRM
Priority
Rating
Development Principles and
Exceptions
Likely Moderate Vulnerable Adequate Lower
Careful management of
development to ensure
the equitable distribution
of green space, reduce
the loss of exiting green
vegetation, and ensure
that areas targeted for
densification include
sufficient green space
and public spaces and
facilities that are
designed for cooling.

157 | P a g e
6.2.2.7 Unmanaged Land Occupation/Unregulated Development
Occupation of City-owned and private land threatens the availability of land reserved for
other uses such as future human settlements or social service provision (Table 6.12). This
may also place households at risk of flood, fire or other risks, depending on the location of
the occupied land. Unregulated and dense development in informal settlements can
result in building forms and conditions that are vulnerable to risks of heat or fire and are
not able to access infrastructure and services.
Table 6.12: Overview and implications of risk: unmanaged land occupation and unregulated development
Rating of
Probability
Rating of
Maximum
Impact
Vulnerability
Rating
Coping
Capacity
DRM
Priority
Rating
Development Principles and
Exceptions
n/a n/a n/a n/a n/a
Refer to human settlements
policy and means to
address affordable housing
demand across the city.
Aim for effective land use
management and
enforcement across the
city.

158 | P a g e
Figure 6.2: Khayelitsha, Mitchells Plain & Greater Blue Downs District risks – built environment

159 | P a g e
Climate Change Risks
A climate hazard, vulnerability and risk study has been conducted for Cape Town,
breaking down the city’s risk as a component of a given hazard and the level of
vulnerability/resilience (hazard + vulnerability = risk). It has identified the following six key
climate change hazards to which the city must adapt:
Decrease in rainfall
Change in seasonality of rainfall
Increased mean, maximum, and minimum temperatures
Increased number of heat waves and very hot days
Increased wind strength
Sea-level rise increased and coastal erosion
It is important to note that many of the impacts of climate hazards that Cape Town
currently experiences and will experience into the future are due to high levels of
vulnerability and low levels of resilience, rather than due to particularly extreme climate
hazards or events.
6.2.3.1 Vulnerability and Impact
Vulnerability is linked to several factors, including physical and geographical vulnerability
(i.e. proximity to high risk areas such as the coast or flood-prone areas), social vulnerability
(i.e. low levels of resilience and adaptive capacity), the legacy of poor planning decisions
(i.e. infrastructure or services located in high risk areas), and the adaptive capacity of
local (and other spheres of) government (i.e. the ability of government to take action to
address risks).
These climate hazards are anticipated to have a range of negative impacts on the city,
including but not limited to the following impacts:
Drought and water scarcity due to decreased rainfall
Increased wildfire and urban fire risk due to increased heat and wind
Heat stress and other related health impacts including mental health impacts
Loss of biodiversity due to climatic changes that these systems are not adapted to
Coastal erosion and coastal storm damage due to sea level rise and a change in
coastal system dynamics
Flooding, due to high vulnerability and poor drainage, even within a context of
lower overall rainfall
Damage to City infrastructure due to flooding, sea level rise, heat, wind, or drought.
Food insecurity due to damage to agriculture, especially in key food-growing
regions outside of Cape Town which are projected to experience more severe
climatic changes
City-scale economic losses due to major events such as droughts
Loss of livelihoods associated with natural resources such as flower selling or urban
agriculture
Increased rural urban migration due to impacts on rural livelihoods, leading to
increased informality and backlogs in basic service provision

160 | P a g e
Increased resource costs due to scarcity e.g. water and food
Potential for civil unrest or protest action
The abovementioned study has also mapped the six key climate hazards,
vulnerability/resilience and the overall risk of the city. Hazard and risk mapping has been
done for the baseline period (1960–1991), the mid-future (2021–2050) and the far future
(2070–2099), while vulnerability/resilience mapping was based on current data. The
climate projections used are based on a low climate mitigation scenario and are in line
with the current global trend in which carbon emissions are increasing over time. For the
purposes of the district planning process, the mid-future assessment is presented below.
Figure 6.3 is a consolidated map of all climate hazards (harms) for the mid-future period,
including rainfall changes, temperature changes, heat islands, flood risk, coastal
inundation risk, and wind speed change. In mountainous areas, and other naturally
vegetated areas risk pertains largely to increased fire risk. Heat island effects are seen in
dense urban areas, while flood risks are seen in low-lying areas around water bodies.
Figure 6.4 maps a composite score for resilience in the present day to climate hazards. It
should be noted that resilience can be seen as the corollary to vulnerability. Therefore,
areas of high resilience will have relatively low vulnerability, and vice versa. These scores
are based on a weighted analysis of the social, economic, and environmental factors
listed in the table below:
Table 6.13: Weighting of climate change hazard vulnerability factors
Indicator Description Weighting
Crime Rate Total number of crimes by police precinct area 5
Electricity for Lighting Percentage of households with access to
electricity for lighting
4
Flushing Toilets Percentage of households with flush toilets (main
sewerage connection and septic tanks)
4
Median Household
Income
Median household income 5
Range of household
income within 3km
Measure of income disparity in different
neighbourhoods: maximum minus minimum
household income within a 3km radius
4
Higher Education Percentage of people over the age of 20 with
higher education
4
Employment
opportunities within 1km
Measure of employment opportunities , ranked
zoning areas by potential formal employment
areas assessed in a 1km radius
5
Employment variety
within 1 km
Measure of job diversity opportunities: distance
from multiple zoning areas related to employment
opportunities assessed within a 1km radius
5
Refuse collection Percentage of households without municipal
refuse collection services
3
Tap Water Percentage of households without access to tap
water
5
Toilet Facilities Percentage of households without access to toilet
facilities
5

161 | P a g e
Population Density Number of people living in the area relative to the
size of the area
4
Tap Water Inside Houses Percentage of Households with tap water inside
their house
4
Travel Time to Hospitals Estimated time to travel to the nearest hospital 3
Travel Time to Police
Stations
Estimated time to travel to the nearest police
station
3
Travel Time to nearest
Spring
Estimated time to travel to the nearest spring 1
Travel Time to CBD Estimated time to travel to the CBD 5
Employment Rate Percentage of people unemployed in the formal
sector
4
Weekly Solid Waste
Collection
Percentage of households with weekly solid waste
collection services
4
Jobs: Population Density Measure of job opportunities relative to
population densities
5
Figure 6.5 then assesses risk relative to resilience, based on Figure 6.3 and Figure 6.5. Areas
with a high exposure to harms and low resilience will have the highest risk rating, while
those with low exposure to harms and high resilience will have the lowest risk rating. The
Khayelitsha and Mitchells Plain District is home to many of the city’s most vulnerable
populations and in addition is exposed to various risks. Vulnerable areas and risk hotspots
indicate areas that will need to be prioritised for resilience building, public sector
interventions and support.

162 | P a g e
Figure 6.3: Consolidated map of exposure to all climate hazards for the mid-future period (2021–2050) across the Khayelitsha, Mitchells Plain &
Greater Blue Downs District

163 | P a g e
Figure 6.4: Present-day resilience to climate hazards across the Khayelitsha, Mitchells Plain & Greater Blue Downs District

164 | P a g e
Figure 6.5: Risk of climate hazards relative to resilience across the Khayelitsha, Mitchells Plain & Greater Blue Downs District

165 | P a g e
Key Opportunities and Constraints
Table 6.14 below identifies opportune (encouraged) and constrained (discouraged)
areas for development in the Khayelitsha, Mitchells Plain & Greater Blue Downs District,
informed by the preceding risk assessment.
Table 6.14: Implications of climate hazards and risk for development
Risk
DRM
Priority
Rating
Impact
Radius
Discouraged
Types of
Development
Encouraged
Types of Development
Landfill and
waste disposal
sites
n/a 800m
Residential
Development
within buffer
Non-Residential
development
Circular economy related
industry and commerce
Cemetery n/a Open space uses
Flood Risk, Storm
Surge exposure
and Coastal
Inundation Zones
High
Informed by
1:100-year
flood lines
coastal
urban edge
line26 All
exposed
and flatter
coastal
areas
Intensification of
urban
development
Green infrastructure
programmes to defend
nearby infrastructure
Non-motorised transport
Open space recreation
Feasible development to
support identified public
recreational nodes
Wind-blown
sand Lower
Dynamic
dune
systems
Rehabilitation and
stabilisation of degraded
dune systems
Managed retreat
Green Infrastructure
Defence of crucial
infrastructure
Coastal Erosion
Zones
Along entire
coast
All urban
development
Green Infrastructure
Feasible development to
support identified
recreational nodes
26 These are indicative and do not include all areas and properties at risk.