thesis_ebe_2008_field_k.pdf - University of Cape Town
172
The copyright of this thesis vests in the author. No quotation from it or information derived from it is to be published without full acknowledgement of the source. The thesis is to be used for private study or non- commercial research purposes only. Published by the University of Cape Town (UCT) in terms of the non-exclusive license granted to UCT by the author. University of Cape Town
-
Upload
khangminh22 -
Category
Documents
-
view
0 -
download
0
Transcript of thesis_ebe_2008_field_k.pdf - University of Cape Town

The copyright of this thesis vests in the author. No quotation from it or information derived from it is to be published without full acknowledgement of the source. The thesis is to be used for private study or non-commercial research purposes only.
Published by the University of Cape Town (UCT) in terms of the non-exclusive license granted to UCT by the author.
Univers
ity of
Cap
e Tow
n

Univers
ity of
Cap
e Tow
n
ATMOSPHERIC LEACHING OF A SAPROLYTIC NICKEL LATERITE
ORE IN CHLORIDE SOLUTIONS
KAREN LOUISE FIELD
Thesis presented in partial fulfilment of the requirements
For the degree of Master of Science in Hydrometallurgical Engineering
In the Department of Chemical Engineering
UNIVERSITY OF CAPE TOWN
May 2008

Univers
ity of
Cap
e Tow
n
Page i
Declaration
I hereby:
(a) grant the University free license to reproduce the above thesis in whole or in part, for the
purpose of research;
(b) declare that:
(i) the above thesis is my own unaided work, both in conception and execution,
and that apart from the normal guidance of my supervisors, I have received no
assistance apart from that stated below;
(ii) except as stated below, neither the substance nor any part of the thesis has
been submitted in the past, or is being, or is to be submitted for a degree in the
University or any other University;
(iii) I am now presenting the thesis for examination for the degree of MSc.
Signed: Date:

Univers
ity of
Cap
e Tow
n
Page ii
Abstract
ATMOSPHERIC LEACHING OF A SAPROLYTIC NICKEL LATERITE ORE
IN CHLORIDE SOLUTIONS Karen Louise Field
Anglo Research – a division of Anglo Operations Limited
P.O. Box 106, Crown Mines, 2025, South Africa
20 May 2008
A hydrometallurgical process using chloride solutions for recovery of nickel from a saprolytic
laterite ore was proposed by Jaguar Nickel Inc. The process claimed selective leaching of nickel
over iron and magnesium, the principal impurity elements accompanying nickel in laterite ores.
The selectivity was claimed to be a consequence of increased hydrogen ion activity, allowing for
economic acid consumption and limited destruction of the laterite lattice. In this study the claims
of the Atmospheric Chloride Acid Leach Process (hereafter referred to as the Jaguar Process)
were investigated on a saprolytic laterite ore. Atmospheric leaching tests were conducted in
order to test whether the claims hold for this different laterite ore. Manipulation of the hydrogen
ion activity was tested using a thermodynamic model to predict HCl activity. The acid activity in
the test solutions was estimated by a thermodynamic model prediction; however manipulation of
the acid activity was shown not to affect nickel selectivity. In fact, the initial rate of nickel
leaching was a stronger function of the acid concentration. The Jaguar Process conditions did
not yield selective leaching at typical operating concentrations even under conditions of
increased acid activity. Nickel contained in the serpentine mineral phase appeared to leach
more quickly than the nickel contained in the iron-hydroxide mineral phase. Initial leaching rates
were very fast and a mixed chemical reaction and diffusion mechanism may be controlling.
Leaching was not well described by shrinking particle models and an empirical model was
therefore developed.

Univers
ity of
Cap
e Tow
n
Page iii
Acknowledgements
I am most grateful for guidance and technical support received from the following talented
people:
Johann Steyl for complementing this study with thermodynamic modelling and
assistance in interpreting results;
Kathy Sole for general advice, supervisory support and manuscript reviewing;
Mike Nicol for critical assessment and guidance;
Peter Gaylard for supervisory support and encouragement;
Courtney Field for manuscript reviewing and on-going motivation;
Vulani Mafada and Keabetswe Ntshekang for helping with parts of the testwork;
Hanna Horsch, Solly Theron and Anelda van Staden from the AR Mineralogy
Department for providing mineralogical insights;
Kriba Reddy and the AR Analytical Department for providing all analytical requirements;
Jerry Pelo and the AR Ore Characterisation Department for all sample preparation, most
notably the ultrasonic screening; and
many thanks to Anglo Research for the opportunity to complete this Masters degree
programme and to Anglo Platinum for continuing the financial support.

Univers
ity of
Cap
e Tow
n
Page iv
Table of Contents
Declaration i
Abstract ii
Acknowledgements iii
Table of Contents iv
List of Tables vii
List of Figures viii
1.0 INTRODUCTION 1
1.1 Nickel Production Challenges 1
1.2 Nickel Laterite Ores 1
1.3 Laterite Ore Processing 3
1.4 Hydrochloric Acid as a Lixiviant 4
1.5 Scope and Objectives of this Study 6
2.0 LITERATURE REVIEW 9
2.1 Laterite Processing 9
2.1.1. Laterite leaching with ammonia and sulfuric acid 9
2.1.2. Laterite processing with hydrochloric acid 12
2.1.3. The Jaguar Process 14
2.2 Solution Thermodynamics: Species Activity 15
2.2.1. The meaning and use of pH 16
2.2.2. Activity coefficient modelling in aqueous ionic solutions 18
2.3 Activity and Leaching Behaviour 21
2.4 Leaching Kinetics 22
2.4.1. Mathematical models 22
2.4.2. Empirical analysis 23
2.4.3. Kinetic studies on laterite leaching 24
2.5 Summary 24
3.0 EXPERIMENTAL EQUIPMENT AND METHODS 26
3.1 Laterite Sample 26
3.2 Feed Solid Sample Preparation 27
3.3 Leaching Experimental Setup 28
3.4 Leaching Testwork Methods 30
3.4.1. Tests 01-09 30
3.4.2. Tests 10-19 31
3.5 Mass Balance Calculation Methods 31
3.6 Activity Measurement Experimental Setup 32
Univers
ity of
Cap
e Tow
n
Page v
3.7 Activity Measurement Method 34
3.7.1. Using the P-H Model 34
3.7.2. Activity measurements 34
3.7.3. Density measurements 35
3.8 Mineralogical Analysis 36
3.9 Kinetic Modelling 36
3.9.1. Choice of method 36
3.9.2. The differential method 37
3.10 Chemical Analysis 38
3.11 Statistical Analysis 38
4.0 RESULTS AND DISCUSSION 39
4.1 Results Summary 39
4.2 Bulk vs. in situ Filtered Samples 40
4.3 Acid Consumption 40
4.4 Solution vs. Solid Analyses 42
4.5 Ni Leaching after 2 min 45
4.6 Error and Repeatability 46
4.7 Objective 1: Leaching Selectivity 46
4.8 Objective 2: Fundamental Examination 49
4.8.1. Density measurement 49
4.8.2. The P-H Model for predicting activity 50
4.8.3. Mineralogical observations 55
4.8.4. Preliminary kinetic modelling 56
Effect of acid concentration 57
Effect of total chloride concentration 59
Effect of temperature 61
Effect of solids’ concentration 62
Effect of particle size 63
Effect of HCl activity 64
5.0 CONCLUSIONS AND RECOMMENDATIONS 67
5.1 Objective 1: Leaching Selectivity 67
5.2 Objective 2: Fundamental Examination 67
5.2.1. Solution thermodynamics 67
5.2.2. Laterite mineralogy 68
5.2.3. Leaching kinetics 68
6.0 REFERENCES 70
Univers
ity of
Cap
e Tow
n
Page vi
APPENDICES
A – Leach Test Sheets
B – pH Calibration and P-H Model Outputs
C – Density Measurement
D – Mineralogical Analyses
E – Kinetic Calculations

Univers
ity of
Cap
e Tow
n
Page vii
List of Tables
Table 2-1: Liquid-junction potentials at 25°C calculated by Bates [56] using the Henderson
equation ................................................................................................................... 18 Table 2-2: Literature values of hydration numbers at infinite dilution (after Steyl [22]).............. 20 Table 3-1: Main mineral phases of Barro Alto laterite ............................................................... 26 Table 3-2: Chemical analysis of Barro Alto laterite.................................................................... 26 Table 3-3: Experimental control methods.................................................................................. 29 Table 3-4: Summary of leach testwork performed .................................................................... 30 Table 4-1: Summary of metal extraction results........................................................................ 39 Table 4-2: Average differences between bulk and in situ samples for Ni and HCl analyses .... 40 Table 4-3: Average change in HCl concentration for two solids’ concentrations used.............. 42 Table 4-4: Variation in leaching after 2 min, based on average solution assays....................... 46 Table 4-5: Jaguar Nickel results – metal extraction as a function of initial acidity at 230 g/l
total Cl– , 4 h leach time and 100°C [21] .................................................................. 48 Table 4-6: HCl activity predicted by the P-H Model ................................................................... 53 Table 4-7: Ni distribution in Barro Alto WTO acido laterite........................................................ 55 Table 4-8: Destruction of the main mineral phases during leaching ......................................... 55 Table 4-9: Effect of solids’ concentration of Sample A at 95°C, 0.2 M HCl, 0 M MgCl2 ............ 62 Table 4-10: Effect of solids’ concentration of Sample A at 80°C, 0.2 M HCl, 0 M MgCl2 ............ 63 Table 4-11: Calculated and measured rate constants................................................................. 65

Univers
ity of
Cap
e Tow
n
Page viii
List of Figures
Figure 1-1: Chemical concentration profile at different depths in an idealised laterite
deposit (after Berezowsky [4] and Monhemius [8]) .................................................. 2 Figure 1-2: Deviation of proton activity from unity for solutions of HCl and MgCl2 (Jansz [17]) .. 5 Figure 2-1: Mean activity coefficient of HCl with NaCl or CaCl2 added (Majima and Awakura
[50], Muir [15]) ........................................................................................................ 15 Figure 2-2: Single-ion activities from the P-H Model as a function of HCl and MgCl2
molalities at 25°C (Steyl [22]) ................................................................................. 20 Figure 3-1: Particle size distribution of laterite feed samples .................................................... 27 Figure 3-2: Experimental setup for leaching testwork ............................................................... 28 Figure 3-3: Experimental setup to measure theoretical pH ....................................................... 33 Figure 3-4: Theoretical pH as predicted by the P-H Model as a function of HCl molarity ......... 35 Figure 4-1: Difference between acid consumption based on acid analysis and stoichiometry.. 41 Figure 4-2: Acid consumption per test....................................................................................... 42 Figure 4-3: Ni extraction for Tests 01-09................................................................................... 43 Figure 4-4: Ni extraction for Tests 10-19................................................................................... 43 Figure 4-5: Tests 08 (a) and 09 (b) showing solution analyses (open kinetic points) and
solid analyses (closed final points)......................................................................... 44 Figure 4-6: Tests 11a-e (a) and 14a-e (b) showing only solid analyses.................................... 45 Figure 4-7: Selectivity ratios under various leaching conditions ................................................ 47 Figure 4-8: Ni, Fe and Mg extraction for all tests....................................................................... 48 Figure 4-9: Density measurements (points) and fit of Eq. 4-1 (curves)..................................... 50 Figure 4-10: Standard pH measurements at different temperatures........................................... 51 Figure 4-11: Measured and predicted pH using the P-H Model .................................................. 52 Figure 4-12: Mean HCl activity at various conditions as predicted by the P-H Model (Data
labels show MgCl2 molar concentration) ................................................................ 54 Figure 4-13: Selectivity ratios as a function of HCl activity.......................................................... 54 Figure 4-14: Decrease in the main mineral phases during leaching ........................................... 56 Figure 4-15: Effect of H+ concentration on Ni extraction ............................................................. 57 Figure 4-16: Shrinking core and particle models fitted to data showing effect of HCl
concentration.......................................................................................................... 58 Figure 4-17: Plot to obtain reaction order and pseudo rate constant for effect of H+
concentration.......................................................................................................... 59 Figure 4-18: Effect of total Cl– concentration on Ni extraction..................................................... 60 Figure 4-19: Plot to obtain reaction order and pseudo rate constant for effect of Cl–
concentration.......................................................................................................... 60 Figure 4-20: Effect of temperature on Ni extraction .................................................................... 61 Figure 4-21: Plot to obtain Arrhenius parameters........................................................................ 62 Figure 4-22: Effect of particle size on Ni extraction ..................................................................... 63

Univers
ity of
Cap
e Tow
n
Page ix
Figure 4-23: Effect of HCl activity on Ni extraction ...................................................................... 64 Figure 4-24: Plot to obtain reaction order and pseudo rate constant for effect of HCl activity .... 65
Univers
ity of
Cap
e Tow
n
Introduction Page 1
ATMOSPHERIC LEACHING OF A SAPROLYTIC NICKEL LATERITE ORE
IN CHLORIDE SOLUTIONS
1.0 Introduction
1.1 Nickel Production Challenges
Nickel (Ni) is an important commodity, primarily as a component of stainless steel which
accounts for 67% of the volume of Ni used annually [1,2]. The 2003 Mining Annual Review
for nickel [1] outlined slow growth in the global economy for 2003, but despite this, reported a
6.4% increase in world nickel demand and a 7% increase in stainless steel production. The
trend of increasing stainless steel production has remained (related to industrial production
and global economic growth), although secondary nickel demand through scrap markets,
nickel hydride batteries, alloys and super alloys is strong. The industry is seen as a volatile
one [2] and a nickel shortfall was experienced in the 1960s [3], but in the late 1990s the
industry was stable with several new producers coming on-line, notably the Australian laterite
projects, Bulong, Murrin Murrin and Cawse, and the high grade Voisey’s Bay sulfide deposit
in Canada soon to be exploited. However, new production has failed to meet committed
capacity; and politics, legislation and social issues have led to delays in the Voisey’s Bay
development. The nickel industry was facing a significant challenge to fast-track new
producers or expansions in order to avoid a nickel shortfall.
Until recently, nickel was sourced predominantly from sulfide deposits which are currently
more cost-effective to process than oxide deposits (so-called laterites). However, due to the
depletion of sulfide reserves, lateritic nickel deposits now constitute the largest known
terrestrial source of nickel [4, 5, 6], and consequently much work is being done to improve
laterite processing.
1.2 Nickel Laterite Ores
Nickel is found either in sulfide deposits or oxide deposits. The nickel oxide deposits are
referred to as laterites and can generally be described as near-surface deposits of oxide
material consisting of heterogeneous mixtures of nickeliferous hydrated iron oxides, clays
and magnesium silicates formed by weathering on a geological timescale or ‘lateritisation’ of
olivines and serpentines. The term laterite is derived from the Latin word for brick earth [7].
Univers
ity of
Cap
e Tow
n
Introduction Page 2
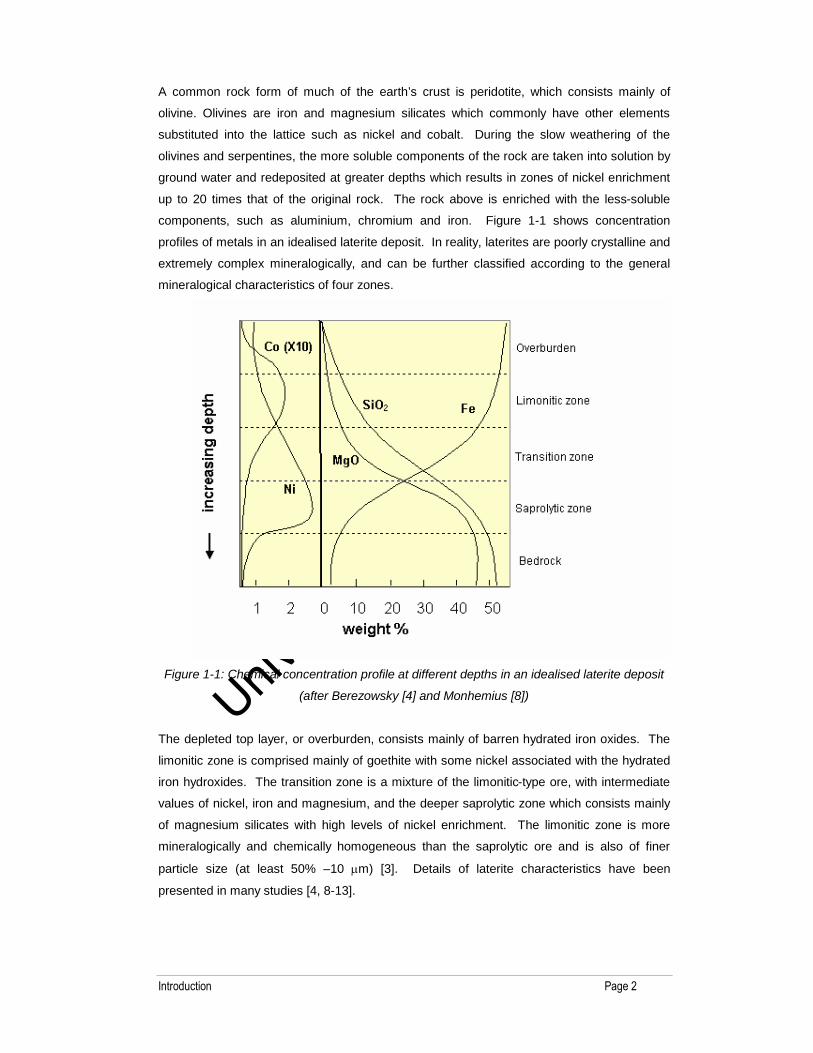
A common rock form of much of the earth’s crust is peridotite, which consists mainly of
olivine. Olivines are iron and magnesium silicates which commonly have other elements
substituted into the lattice such as nickel and cobalt. During the slow weathering of the
olivines and serpentines, the more soluble components of the rock are taken into solution by
ground water and redeposited at greater depths which results in zones of nickel enrichment
up to 20 times that of the original rock. The rock above is enriched with the less-soluble
components, such as aluminium, chromium and iron. Figure 1-1 shows concentration
profiles of metals in an idealised laterite deposit. In reality, laterites are poorly crystalline and
extremely complex mineralogically, and can be further classified according to the general
mineralogical characteristics of four zones.
Figure 1-1: Chemical concentration profile at different depths in an idealised laterite deposit
(after Berezowsky [4] and Monhemius [8])
The depleted top layer, or overburden, consists mainly of barren hydrated iron oxides. The
limonitic zone is comprised mainly of goethite with some nickel associated with the hydrated
iron hydroxides. The transition zone is a mixture of the limonitic-type ore, with intermediate
values of nickel, iron and magnesium, and the deeper saprolytic zone which consists mainly
of magnesium silicates with high levels of nickel enrichment. The limonitic zone is more
mineralogically and chemically homogeneous than the saprolytic ore and is also of finer
particle size (at least 50% –10 m) [3]. Details of laterite characteristics have been
presented in many studies [4, 8-13].
Univers
ity of
Cap
e Tow
n
Introduction Page 3
Ores are often blended to yield roughly constant nickel grade, however even blended laterite
ores of constant chemical composition can lead to significant variations in processing
behaviour, as was demonstrated by Canterford [14] in his study of samples of blended feed
to the Yabula refinery (Queensland, Australia). This variation in behaviour is directly related
to mineralogical variations. The feed at the Yabula plant contains nickel in almost all of the
minerals making up the ore, but the nickel content of each mineral varies widely. It was
found that nickel was more readily extracted from silicate (saprolyte) ores than from limonitic
ores and those samples with lower iron content generally gave scattered leaching results due
to the different reactivities of the nickel-bearing minerals. Thus even with the same chemical
composition, there are differences in behaviour. This will be true to a greater or lesser extent
for all laterite ores.
This study focuses on one laterite sample obtained from Barro Alto in South America. The
sample is categorised on site as “Western Type Ore (WTO) acido” which is a saprolytic ore.
1.3 Laterite Ore Processing
The primary hurdle in processing laterite ores is that no specific nickel-bearing mineral exists
which can be concentrated by existing technologies such as flotation, magnetic separation or
gravity concentration. The recovery of lateritic nickel takes place via two general routes: a
pyrometallurgical route (smelting) or a hydrometallurgical route (leaching) or sometimes a
combination of these. The most important factors in economic laterite processing are acid
consumption and energy requirements. Pyrometallurgical processing is most appropriate
when applied to saprolytic ores due to the presence of ideal slag-forming material (SiO2 and
MgO); low iron (allowing for realistic energy usage); and high nickel grade.
Hydrometallurgical processing is more suited to material with a low Mg/Fe ratio (increasing
magnesium increases acid consumption) and consequently low nickel grade. Although many
hydrometallurgical processes exist for the treatment of laterites, all with advantages and
disadvantages, no one standard process has been adopted. This is a reflection on the
unique mineralogical qualities of the oxide ore bodies.
The core of hydrometallurgical processes for laterite treatment is the leaching unit operation.
Excellent metal recovery is achievable through the application of a simple atmospheric leach;
however laterite ores are comprised mainly of magnesium and iron silicates and, once in the
leach solution, selective recovery of nickel then poses a problem. Due to its presence in so
many minerals, iron management is well developed in hydrometallurgy and pressure
leaching can be used to precipitate iron. Magnesium, however, is less easily managed as
increased magnesium leaching leads to excessive consumption of acid, rendering many
processes uneconomical. Current hydrometallurgical processes in use or proposed have

Univers
ity of
Cap
e Tow
n
Introduction Page 4
been developed to minimise the negative effect of these two major gangue elements.
Section 2.1 outlines and discusses selected hydrometallurgical laterite processes.
1.4 Hydrochloric Acid as a Lixiviant
Leaching is commonly carried out in sulfuric acid solutions. However, chloride solutions can
be advantageous due to:
weaker association of the proton with chloride ions compared to sulfate ions which
results in a more aggressive leaching medium;
increased leaching kinetics resulting in smaller leaching vessels (for a fixed ore
input) and lower operating temperatures making leaching under pressure
unnecessary;
operation under a wide range of oxidising conditions and acidity.
Disadvantages of chloride solutions which have stifled commercialisation of chloride-based
processes are:
the corrosive nature of the solutions and the corresponding materials of construction
constraints. However, advances have been made in this regard and corrosive
chloride solutions can now be safely handled so that their advantages may be
exploited;
the inability to use limestone as a neutralising agent [10] and
the difficulty with economically recycling HCl; some advances have been made with
metal chloride pyrohydrolysis [10], but this route remains energy-intensive and
therefore expensive to operate.
A large number of chloride leaching processes have been investigated and developed, most
of them limited to laboratory scale. The advantages of chloride systems, mentioned above,
result from the following solution chemical properties:
Stable metal chloro-complex formation, the stability of which is reflected in
thermodynamic stability constants. For most metals, the chloro-complex is more
stable than the corresponding sulfate complex [15], which could be indicative of the
need for milder leaching conditions and subsequently easier metal separations.
Increased metal chloride solubilities. All metal chlorides, except AgCl, are more
soluble than their corresponding metal sulfates and this property can lead to more
efficient separations. However, if the concentration of free chloride in a solution is
increased, metal chloro-complex solubility decreases due to the common ion effect.
This is used in the Falconbridge Matte Leach Process whereby NiCl2.2H2O is
precipitated by the addition of HCl to the solution [16].

Univers
ity of
Cap
e Tow
n
Introduction Page 5
Changed redox properties of some metal ions in chloride solutions. Chlorine can
oxidise all metals in a chloride environment. This forms the basis of platinum group
metal processing. Another application is the use of Cu(II) as an oxidising agent in
strong chloride solutions. The high stability of Cu(I) affects the Cu chemistry and
Cu(II) becomes a relatively strong oxidising agent, comparable to ferric ion [16].
The key parameter linked to the above is the species activity. Activity coefficients are
generally not unity in hydrometallurgical systems. Except for very dilute (ideal) solutions, the
activities of ions and salts differ significantly from their readily measurable concentrations. An
example of this effect in chloride solutions is shown in Figure 1-2, from which it can be seen
that the proton activity is enhanced at increased acid concentration in the presence of added
MgCl2. Increasing the temperature dampens this effect to a small degree. From the figure,
a 2 M HCl solution experiences an approximate three times increase in proton activity on
addition of 1 M MgCl2.
Figure 1-2: Deviation of proton activity from unity for solutions of HCl and MgCl2 (Jansz [17])
In concentrated solutions, thermodynamic properties are difficult to predict. However,
quantifying non-ideality is important as it governs chemical species equilibria and activities.
Univers
ity of
Cap
e Tow
n
Introduction Page 6
Activity coefficients vary from unity due to the interaction of solution species with each other
and the solvent. Thus if one has a knowledge of the species activity, one can anticipate
which species will predominate and how such species would influence kinetic processes, for
example, leaching.
Activity coefficient models allow for the prediction of species activity in real solutions. The
classical models for concentrated solutions are the Pitzer [18] and Meissner [19] models.
The former is based on an expression for the excess Gibbs energy of the solution, which
consists of an extended Debye-Hückel term and virial expansion terms, whilst the Meissner
model is a simpler (less parameterised) empirical model based on phenomenological ionic
strength dependence of the activity coefficient. The measurement and prediction of proton
activity is discussed further in Section 2.2.
One laterite process, using hydrochloric acid, was proposed by (what was then known as)
Jaguar Nickel Inc. [20, 21]. In context with other available technologies for nickel recovery
from laterite ores, the Jaguar Process showed potential advantages worthy of further
investigation.
The Jaguar Process utilised an atmospheric leach in HCl and MgCl2 which Jaguar Nickel
claimed offered a certain amount of selectivity between nickel and the major gangue
elements, magnesium and iron. According to Jaguar Nickel, the selectivity is based on the
thermodynamic properties of mixtures of HCl and MgCl2. MgCl2 has a high hydration
number, and due to the resultant reduced water activity, magnesium leaching is claimed to
be suppressed while nickel, which complexes more easily in solution, is leached. It is
proposed that iron in solution is hydrolysed due to the low water activity, provided chloride
levels are maintained low enough to avoid FeCl4– formation. A further claimed advantage is
reduced acid consumption resulting from the selective leaching, which comes as a
consequence of the use of strong brines to leach the laterite (as illustrated in Figure 1-2). [20,
21]
1.5 Scope and Objectives of this Study
Anglo American plc is involved in the development of alternative processing technologies at
its research facility, Anglo Research (AR), a division of Anglo Operations Limited. The
Technology Business Unit at AR was tasked to review alternative technologies for the
beneficiation of nickel laterites; this project initially involved some scouting test work, with the
overall objective to identify/develop an attractive alternative technology for treating laterite
ores. This study forms part of this larger undertaking.

Univers
ity of
Cap
e Tow
n
Introduction Page 7
The Jaguar Process was one of the processes under investigation by AR and the interesting
solution chemistry effects appeared to offer significant process advantages. However,
testwork information published was less than thorough and it was deemed necessary to
investigate the nature of leach solutions used in the Jaguar Process in order to further judge
the process claims.
This study focussed on the selectivity claim of the Jaguar Process leach and whether it could
be repeated. Due to the complexity of the solution characteristics, this study also aimed at
understanding the reasons behind the observed effects. This investigation comprised of two
objectives:
Objective 1: To establish if the selectivity achieved in the Jaguar Process was
repeatable on a different laterite ore.
Objective 2: To investigate fundamental reasons for the observed leaching
behaviour.
Objective 1 was investigated using atmospheric batch leach tests, limited to one type of
laterite ore. Various solution conditions were tested and the resultant selectivity calculated.
Objective 2 was investigated in three focus areas:
solution thermodynamics
laterite mineralogy
leaching kinetics
Jaguar Nickel used the thermodynamic properties of strong brine solutions to explain their
selective Ni leaching – manipulation of the water and hydrogen ion activities was seen as
key, although not explicitly measured, and the hydration number of MgCl2 was also seen as a
key solution property. The Jaguar Process included manipulation of Fe precipitation in the
leach, counter-current leaching, and other aspects not considered in this study. In this study,
hydrogen ion activity is investigated in order to obtain actual (real) pH values for the solution
conditions tested. In order to obtain accurate measurements, a solution chemistry model,
the Pitzer-Hydration (P-H) model, was developed at AR [22] to, besides thermodynamics,
incorporate hydration theory. This study makes use of the P-H Model but does not attempt
to evaluate the derivation thereof or review the supporting theory.
A mineralogical analysis was included in order to establish if leaching of different mineral
phases was important.
A preliminary kinetic study was conducted to establish what factors affect Ni leaching and
whether hydrogen ion activity or concentration has a greater effect.

Univers
ity of
Cap
e Tow
n
Introduction Page 8
These three focus areas contribute to a more fundamental understanding of the leaching
system, but also raised many areas for further study and by no means constitute an
exhaustive study – the aim of this study was to investigate repeatability of the Jaguar
Process and to look at the system in more detail than had been done before.
Downstream purification and separation of nickel and cobalt from the leach liquor is achieved
using unit operations such as solvent extraction and precipitation. Flett [23] has reviewed the
chemistry of Ni-Co separation and concludes that solvent extraction is the most
advantageous and many studies on solvent extraction in laterite processing have been done
[24-28]. Unit operations which incorporate reagent (acid) recycle are important for economic
viability. Although downstream processing forms a crucial part of the overall process
development, it does not form part of the current investigation.
Univers
ity of
Cap
e Tow
n
Literature Review Page 9
2.0 Literature Review
The leaching processes developed for treating laterite ores, numerous and mostly ore-
dependent, are briefly examined first. It is against this background of the search for more
cost-effective methods that the Jaguar Process was developed and is reviewed here. What
follows is a look at solution thermodynamics and the tools available for evaluating the
species activity of interest. Other studies linking species activities to leaching behaviour are
presented as well as an introduction to kinetic modelling methods.
2.1 Laterite Processing
By the late 1960s it was recognised that sulfide nickel deposits were being depleted, giving
oxide deposits greater attention as sources of nickel [4, 6, 13, 29]. Many hydrometallurgical
routes, sometimes combined with pre-roasting were developed and selected ones are
reviewed here. Boldt and Queneau [7] have reviewed these and other processing routes in
considerable detail. Kerfoot and Weir [30] reviewed the extractive metallurgy of nickel (and
cobalt) as did Han and Meng [31] who included leaching behaviour. For the 1996 Nickel
Commodity Meeting, Anthony and Flett [32] summarised the state of nickel extractive
metallurgy with Berezowsky [4] focussing on laterite processing. Several other reviews of
laterite processing have been published [6, 8, 9, 33].
Smelting of laterite ores produces either ferronickel alloy or matte which can be
subsequently processed, but this is best suited to saprolytic-type ores due to the presence
of suitable slag-forming minerals, such as silica, making up 50% of the saprolytic laterites.
A pyrometallurgical route is favoured for ores of high nickel grade, low iron grade and where
low cost electrical power is available [34]. Pyrometallurgical processes are not considered
further in this study and, consequently, the leaching routes covered apply mainly to limonitic
laterites.
2.1.1. Laterite leaching with ammonia and sulfuric acid
Hydrometallurgical laterite processing was developed for the limonitic ores that were too
high in iron and too low in nickel to be economically smelted to ferronickel.
The Caron process, developed in the 1920s and in operation at Nicaro, Cuba since the
1940s, involves pre-roasting of the limonitic ore to reduce the nickel and cobalt into the
metallic state. Subsequent leaching in an ammoniacal ammonium carbonate solution under
oxidising conditions results in the selective dissolution of Ni and Co as ammine complexes.
The roasting is the most critical step and a slow heating rate (5°C per minute) is essential.
The slow rate ensures the bulk of the Ni is reduced before amorphous magnesium silicate

Univers
ity of
Cap
e Tow
n
Literature Review Page 10
re-crystallises at about 750°C incorporating unreduced Ni, preventing its later leaching.
About 10% of the Fe is also reduced. The stable ammonium complex formation by Ni and
Co in the leach solution prevents hydrolysis under the high pH (about 10) conditions. The
Fe initially dissolves as ferrous ammine complexes, but is readily oxidised and precipitates
as ferric hydroxide reporting to the leach residue. Along with this selective leach advantage
further advantages are that leaching reagents can be recycled and that corrosion problems
in ammoniacal systems are minimal [8].
Certain improvements were made to the Caron process by Sherrit Gordon, Freeport and
others, and are reviewed elsewhere [8, 33, 35]. Enhanced Ni reduction is obtained by
chloride and sulfur addition, however this was not successful when implemented at the
Yabula refinery, a Caron-type process. BHP Biliton’s (Queensland Nickel’s at the time)
Yabula refinery, Australia, established in 1974, imports laterite ore from Indonesia and New
Caledonia since its original feed ore reserves were depleted. A novel ammoniacal solvent
extraction plant was later installed as well as a nickel oxide product reduction stage which
led to a larger suite of final nickel products [3]. Ammoniacal ammonium sulfate instead of
carbonate has also been used for the leach. However, the improvements still render the
process applicable to low Mg ore only due to Ni losses in magnesium silicate formation
during roasting and ammonium losses due to mixed magnesium ammonium carbonate
precipitation during leaching. Other disadvantages are that energy requirements for drying
and pre-roasting are high and overall metal recovery is low: 75-80% for Ni and 40-50% for
Co [8].
An alternative approach involves direct leaching of untreated limonitic ore with sulfuric acid
at high temperatures and pressures under conditions that also result in selective dissolution
of nickel and cobalt, while iron is rejected in the solid leach residues [8]. In pressure acid
leaching the metal oxides are dissolved to metal sulfates. Silicates dissolve, polymerise
and precipitate. The iron precipitates, regenerating acid and aluminium precipitation (as
alunites) which can be overlooked, contributes to the net acid consumption. Saprolytic ores
are uneconomic to process due to high acid consumption.
The first-generation pressure acid leach was developed and became operational in 1956 at
Moa Bay, Cuba, for recovery of Ni from a predominantly limonitic ore. The ore contained
low levels of Mg and was suitable to direct sulfuric acid attack. Under the autoclave
conditions at 250°C Fe is precipitated thus effecting good Fe removal. Ni and Co
recoveries exceeded 90% and the economics are further enhanced by a readily available
local source of acid. The disadvantages of the process include the limited application to
only limonites with low magnesium (so as to limit acid consumption), high sulfate effluent
liquor, and alunite scale problems (layers up to 20 cm thick) in the autoclave requiring
lengthy shut-downs for removal [8, 13].
Univers
ity of
Cap
e Tow
n
Literature Review Page 11
The AMAX process was developed to treat both horizons of a laterite ore-body. Even
though laterites are not neatly formed in separately mineable blocks, it is possible to
separate them based on their physical characteristics. Low Mg limonites are fine-grained
and very friable, whereas high Mg saprolytic ores are coarser and harder. A two-stage
leach is used. The limonitic fraction (up to 15% Mg) is leached at 270°C with 40-50 g/l
discharge free acid, while the saprolytic fraction acts as the neutralising agent in a second,
atmospheric leach stage. The saprolytic ore may need to be pre-reduced, but the lowest
energy consumption amongst competitive processes was claimed. Through the use of the
higher leach temperature (than Moa Bay-type processes) improved slurry sedimentation
and leach kinetics were observed [4]. Ni and Co are recovered by H2S precipitation. The
AMAX process was developed during several pilot campaigns during the 1970s and 1980s.
A disadvantage is that spent liquors are high in magnesium sulfate [36].
When comparing total capital and operating costs between a Caron-type process (reduction
roast-ammonia leach) and sulfuric acid pressure leaching, the Co price has a large effect
on enhancing the economics. Acid leaching was calculated in 1979 as being more
economical than the Caron process [34].
After 40 years of Moa Bay being the only plant producing Ni by pressure leaching [37], in
early 1999 the three second-generation acid leach “pioneers” in Western Australia were in
the process of ramp-up:
Cawse [38] had produced its first Ni cathode and Co intermediate product.
Bulong had produced its first Ni starter sheets, but was yet to produce any saleable
Ni cathodes.
Murrin Murrin (the largest of the three projects) experienced commissioning
problems but had produced its first mixed Ni-Co sulfide precipitate [39].
All make use of pressure acid leaching, but the recovery methods for Co and Ni differ. The
ore to be treated at these plants contained less Al than the Moa Bay laterite, so less alunite
scale was expected, but contained more Mg, so higher acid consumption was expected.
For the various ore categories tested at Murrin Murrin, sulfuric acid consumption was
around 400 kg/t to yield above 90% recovery for both Ni and Co [40]. Disadvantages of
these pressure acid leaching processes included corrosion issues due to high chloride
levels in the local groundwater requiring expensive titanium-lined autoclaves; and the high
viscosities of the ore slurries. Many commissioning problems were experienced, requiring
equipment redesign, and higher-than-anticipated acid consumption and scale problems
contributed to slow and difficult ramp up.
CVRD-Inco’s Goro process, developed for New Caledonian laterites, uses pressure sulfuric
acid leaching at 270°C. Ni and Co are recovered from the weak and impure pregnant leach
solution using solvent extraction. The main acid consumers in the leach are Al and Mg. A
Univers
ity of
Cap
e Tow
n
Literature Review Page 12
one ton per day demonstration plant was built on site in 1999 [5]. The full-scale plant is
currently under construction.
An alternative to the low recoveries and high energy cost of the ammoniacal route; the
engineering and high-sulfate effluent problems of the Moa Bay plant; and the disappointing
Western Australian high pressure acid leaching route, is atmospheric acid leaching. This
alternative has received minor attention but some studies have been done on limonitic ores
[29, 41, 42, 43].
Several studies have shown [29, 35, 42, 43] that complete extraction of nickel from limonitic
ores requires full dissolution of each nickel-bearing goethite grain and that the amount of Ni
extracted is directly related to the amount of Fe minerals dissolved. This was confirmed
when particle size was reduced and a much greater increase in Ni extraction was seen for
limonitic than for saprolytic ores [35]. Thus if a blended feed is to be used, the feed
preparation and solid-liquid separation stages must be designed on the basis of the goethite
content (the “rate-limiting” mineral). Generally, for economical (90%) Ni extraction in an
atmospheric leach, a large excess of acid is required to dissolve the Fe oxides.
One study on Greek limonitic laterites obtained 82% Ni recovery from a 95°C sulfuric acid
leach with 350 kg/t acid consumption in a three-stage counter-current setup and 850 kg/t in
a single pass leach [41].
Chander [29] studied extractability of Ni from limonitic ore from Sukinda, India, using
several inorganic and organic acids. The results showed a correlation between Ni
extraction and Fe dissolution for the various solutions tested. Similar results were obtained
by Rice and Strong [43]. The study focussed on kinetic considerations.
Das et al. [42] used SO2 as a reductant to enhance leaching of two laterite ores in solutions
of H2SO4, HCl and HClO4. The various rates of reductive dissolution of Fe oxides and
release of Ni were discussed in conjunction with the Eh/pH of the systems and the
complexation of the anion.
2.1.2. Laterite processing with hydrochloric acid
In 1981, the hydrometallurgical treatment of complex ores, especially using chloride-based
media, became a strong focus of research activity although pressurised sulfuric acid
leaching of nickel laterites appeared promising in terms of minimum use of fossil fuel [44].
Muir [15] extensively reviewed the basic principles of chloride hydrometallurgy.
Senanayake and Muir [45] reviewed chloride hydrometallurgy fundamentals and application
to metal sulfides.
Univers
ity of
Cap
e Tow
n
Literature Review Page 13
Only a few commercial plants have been built based on chloride processes, but successful
ones include the Falconbridge matte leach (not a laterite process) [46] and all platinum
group metal refining.
The advantages of chloride media are that leaching rates are generally rapid, no high-
energy pre-treatment is necessary and leaching under atmospheric conditions lessens
corrosion; however less selectivity (especially over Fe) is achieved and purification of the
leach liquor is more complicated. Although, the recovery of Co from the pregnant leach
liquor is easier through chloride-based solvent extraction than in a sulfate medium. The
ability to recycle acid is important, but if high Ni and Co recoveries are achieved, increased
acid consumption can be justified.
Reasons why chloride hydrometallurgy is not popular are the corrosive nature of the
chloride solutions, the volatility of HCl and Cl2 and the difficulty with recycling reagent.
Recovering HCl from solutions of metal chlorides is often not possible. The largest
application of HCl regeneration is in the steel picking industry which consists of
pyrohydrolysis, pre-concentration and HCl absorption [10]. HCl can be recovered via
pyrohydrolysis of FeCl3 or MgCl2 to form Fe2O3 or MgO. Pyrohydrolysis is carried out in a
spray roaster or fluidised bed at 600-800°C and, in the case of the steel pickle liquors, HCl
is produced by the following reaction:
2FeCl2 + 2H2O + ½ O2 Fe2O3 + 4HCl Eq. 2-1
Pyrohydrolysis has often been suggested in chloride Ni laterite processes for HCl recycle
[10, 20, 43, 47]. The Jaguar Process [20, 21] incorporated MgCl2 pyrohydrolysis and the
Goro process [5] incorporated NiCl2 pyrohydrolysis for the production of NiO for sale or
neutralisation and HCl for recycle within the solvent extraction circuit.
Ni-bearing lateritic overburden of chrome ore was leached in HCl and H2SO4 by Sukla et al.
[47]. Leaching in 3 M HCl at 100°C yielded 73% Ni extraction and 87% Fe extraction after
four hours. The kinetics of Fe extraction was said to be slower than Ni and after two hours
of leaching the Ni was 3% less than the ultimate extraction, while the Fe was 20% less.
However, the ultimate Fe leaching data point appears to be an outlier.
The atmospheric leach tests done by Das et al. (Section 2.1.1) included HCl as a lixiviant.
Over 90% Ni (and similar Fe and Mn) extraction was obtained with HCl strengths of 1.02 M
in their HCl-SO2-Cu(II) system.
During the early 1970s, Rice and Strong [43] at the University of Leeds published research
on HCl leaching of Ni laterites and proposed a flowsheet to treat limonitic laterites. Their
process claimed low energy requirement as no pre-roasting or drying was necessary, with
purification by solvent extraction. The separation of Mg and Fe from the leach liquor was
seen as the key step. Pyrohydrolysis was identified for HCl recycle and MgO and Fe2O3

Univers
ity of
Cap
e Tow
n
Literature Review Page 14
products for sale or recycle. Nine different laterites (limonitic and saprolytic) were leached,
but no other unit operations were tested. Leach liquor purification was proposed to be
through Fe and Co solvent extraction with Ni powder product formation by the Derry
Process (Ni(OH)2 formation with MgO neutralisation and subsequent H2 reduction) [43].
Work at the University of Leeds continued on this HCl route for Ni laterites and Rice
published a summary of the project from 1970-1986 [48]. Further work on the leach liquor
purification through solvent extraction was done, and in 1997, published by Gibson and Rice
[49]. The leaching testwork showed on average over 90% Ni extraction in two hours with
5.5 M HCl at temperatures between 70 and 90°C.
2.1.3. The Jaguar Process
A deposit that was to be exploited in Guatemala, Central America, is geologically immature.
The effect on the mineralogy is that zones are not fully laterised. Various scouting tests
were completed as part of process development. It was found that the high pressure acid
leaching route was not suitable due to the higher levels of Mg in the deposit in both the
limonitic and saprolytic zones. Atmospheric chloride leaching showed promise and more
investigation was done into magnesium chloride brine solution chemistry. The pertinent
issue was to attempt to selectively leach Ni and Co, if a hydrometallurgical route was to be
followed, which was the case as a smelter was not an option due to environmental and
social concerns.
Due to the immature nature of the deposit, more magnetite is present that has not been
altered to limonite, and nickel-enriched goethite coats the magnetite grains. It was claimed
that Ni can be easily leached from the grains without releasing the Fe and the leach
intensity need not be excessive. In almost all other studies (Section 2.1.1), the extraction of
lateritic Ni was found to be directly proportional to the dissolution of goethite and magnetite
which are independent of the proton activity of the system [29, 35, 42]. Although the HCl
route for Ni laterites was not novel, a selective leach on the Jaguar Nickel ore deposit would
indeed be unique and advantageous.
The Jaguar Process aimed at controlling impurities (Fe and Mg) through the manipulation of
the unique properties of chloride chemistry. HCl/MgCl2 brines were proposed to treat both
the limonitic and saprolytic laterite profiles. In concentrated Cl– solutions, base metal
species (with the exception of Ni) form stable chloro-complexes, water activity is low and
increased concentration of HCl and MgCl2 enhance the HCl and H+ activities. This
enhanced activity effect is shown in the work of Majima and Awakura [50] and Jansz [17].
Figure 2-1 shows how increasing acid concentration enhances HCl activity and even more
so if there are other chlorides present. Included in the introduction, Figure 1-2 focuses on
MgCl2 brines and predicts a strong effect of increasing MgCl2 concentration on increasing
single-ion (H+) activity. The effect is however slightly depressed at higher temperatures.

Univers
ity of
Cap
e Tow
n
Literature Review Page 15
Figure 2-1: Mean activity coefficient of HCl with NaCl or CaCl2 added (Majima and Awakura
[50], Muir [15])
The following properties of MgCl2 brines were supposedly exploited in the Jaguar Process:
High chloride concentration reduces water activity such that there is effectively no
capacity in solution to hold appreciable levels of ferric Fe (which has the lowest pH
of hydrolysis). Hydrolysis can occur at a lower apparent pH if the Cl– concentration
is not too high (which would result in a more stable FeCl4– complex in solution.
H+ activity is enhanced resulting in lower acid consumption as less HCl would be
required to obtain the equivalent “strength” if not used in a high MgCl2 brine, and
less acid neutralisation would be required during downstream Fe removal.
The combination of high H+ activity and low water activity results in low amounts of
free water and as MgCl2 has a high hydration number (14), Mg leaching would be
minimised by this and through the common ion effect.
Preliminary tests on the Jaguar ore showed that 80-93% Ni extraction was possible and that
selective leaching occurred. The ratio of Ni to Fe extraction was as high as 40 and the ratio
of Ni to Mg extraction was approximately doubled [21].
2.2 Solution Thermodynamics: Species Activity
Solutions in hydrometallurgy contain ionic species. Simple solutions containing few, strong
electrolytes, as well as very dilute solutions have been comprehensively modelled, but

Univers
ity of
Cap
e Tow
n
Literature Review Page 16
solutions of higher ionic strength and those containing many electrolytes have not. The
charged ionic species interact with coulombic forces and, even at low concentrations, the
interactions involve stronger forces at longer ranges than neutral molecules. Metal ions in
solution form various hydrolysis products or complex with ligands. It is this speciation which
must be established in order to be able to model hydrometallurgical systems at equilibrium.
Balomenos et al. [51] outline approaches available to model the chemical equilibrium of
electrolyte solutions. Essentially one needs knowledge of each species’ Gibbs Free Energy
as well as activity coefficients in order to accurately predict departure from ideality. Mean
ionic values of electrolyte parameters (activities, concentrations, chemical potential, activity
coefficients) must be used, as individual ions cannot be separately considered due to the
constraint of electroneutrality in solutions.
The mean activity coefficient is used to obtain the actual species activity, a, through the
equation:
a± = ±m±Eq. 2-2
where m± = mean concentration
± = mean activity coefficient (dimensionless)
The ubiquitous measure of hydrogen ion activity is, of course, pH. Equation 2-3 reflects the
definition of pH:
pH = -log(aH+) Eq. 2-3
In Equation 2-3, the single-ion activity (aH+) is used. This means that the only practical way
to determine the proton activity is through experiment (such as potentiometric pH or
conductivity measurement [52-55]); it cannot be derived directly from true thermodynamic
measurements but can be inferred from some extra-thermodynamic assumptions [17].
The most widely used activity coefficient models applicable to describing ionic solutions are
outlined below, leading up to the development of the P-H Model. It is not the intention to
critically review the development of the thermodynamic assumptions behind these models,
but rather to provide an introduction to their applicability. Details of the actual equations and
parameters in the models can be found in the references noted. Through Objective 2 of
this study, proton activity is investigated and thus an appreciation of how the activity is
measured or modelled is important.
2.2.1. The meaning and use of pH
There is no precise fundamental definition of pH, but it is essentially “the evaluation of a
quasi-thermodynamic constant from a measurement of the electromotive force (emf) of a
suitable galvanic cell” [56]. The meaning of experimental pH is largely related to the pH
number assigned to the calibration standards used. Although single-ion activity is strongly

Univers
ity of
Cap
e Tow
n
Literature Review Page 17
linked to chemical thermodynamics, extra-thermodynamic considerations are used to give
pH values substance [56].
As described in Equation 2-3, pH is dependent on proton activity and not on concentration,
as is often the simplifying assumption. There are a number of effects that have to be taken
into account when attempting to use a pH value for interpreting results, including the
following:
The internal buffer of the pH electrode must be constant at all times in order for the
Nernst Equation to hold.
The standard potential must remain unchanged when measuring pH. This will only
happen if the solution is dilute and contains simple solutes with acidity close to the
calibration standard used [56]. This is mostly not the case in hydrometallurgical
solutions and definitely not the case for the solutions in this study. Thus the
measured pH cannot be used to approximate hydrogen ion activity.
The potential difference as a result of a temperature gradient within the measuring
and reference electrodes, the Soret effect, is eliminated by calibrating at
temperature. The Soret effect is normally small relative to the other diffusion
effects, but can be used to separate isotopes by applying a temperature gradient to
a multi-component system [57].
A potential difference arising from the spontaneous tendency for the ions of the
concentrated electrolyte to pass into the more dilute solution is established. The
differing mobility of the anions and cations leads to the junction potential [58]. The
junction potential must be reduced as far as possible so as not to introduce error
into a pH reading. The evaluation of the junction potential is discussed below.
Often quoted, Harned, who did much work measuring activities of the electrolytes in
aqueous solutions, stated that “we are thus confronted with the interesting perplexity that it
is not possible to compute liquid junction potentials without a knowledge of individual ion
activities, and it is not possible to determine individual ion activities without an exact
knowledge of liquid junction potentials. For the solution of this difficult problem, it is
necessary to go outside the domain of exact thermodynamics” [56]. There are methods to
estimate the junction potential, but none evaluate the complete junction potential as per its
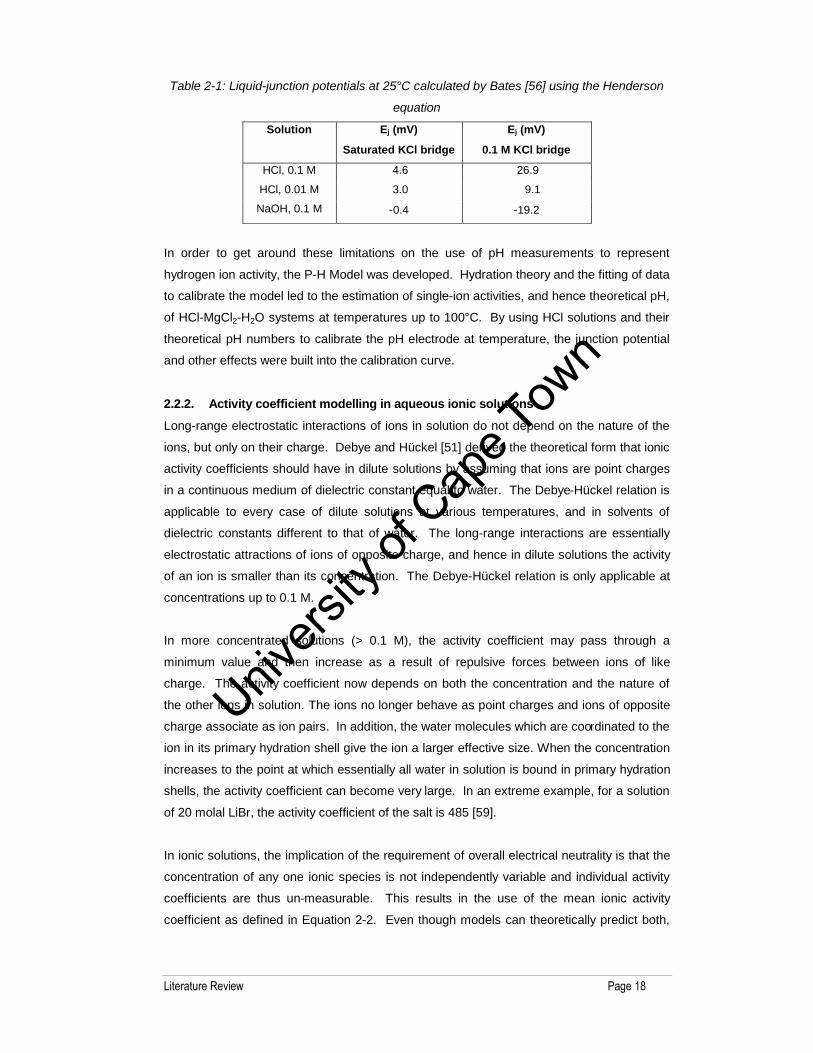
definition. Using the Henderson equation, the junction potentials, Ej, shown in Table 2-1
were estimated by Bates [56].
Table 2-1 shows that the use of saturated KCl does not eliminate the liquid-junction
potential and the magnitudes of the potentials are large for HCl due to the high limiting
equivalent conductance of the hydrogen ion compared to other cations (i.e., HCl is a strong
acid) and similarly for NaOH [58].
Univers
ity of
Cap
e Tow
n
Literature Review Page 18
Table 2-1: Liquid-junction potentials at 25°C calculated by Bates [56] using the Henderson
equation
Solution Ej (mV)
Saturated KCl bridge
Ej (mV)
0.1 M KCl bridge
HCl, 0.1 M 4.6 26.9
HCl, 0.01 M 3.0 9.1
NaOH, 0.1 M -0.4 -19.2
In order to get around these limitations on the use of pH measurements to represent
hydrogen ion activity, the P-H Model was developed. Hydration theory and the fitting of data
to calibrate the model led to the estimation of single-ion activities, and hence theoretical pH,
of HCl-MgCl2-H2O systems at temperatures up to 100°C. By using HCl solutions and their
theoretical pH numbers to calibrate the pH electrode at temperature, the junction potential
and other effects were built into the calibration curve.
2.2.2. Activity coefficient modelling in aqueous ionic solutions
Long-range electrostatic interactions of ions in solution do not depend on the nature of the
ions, but only on their charge. Debye and Hückel [51] derived the theoretical form that ionic
activity coefficients should have in dilute solutions by assuming that ions are point charges
in a continuous medium of dielectric constant equal to water. The Debye-Hückel relation is
applicable to every case of dilute solutions at various temperatures, and in solvents of
dielectric constants different to that of water. The long-range interactions are essentially
electrostatic attractions of ions of opposite charge, and hence in dilute solutions the activity
of an ion is smaller than its concentration. The Debye-Hückel relation is only applicable at
concentrations up to 0.1 M.
In more concentrated solutions (> 0.1 M), the activity coefficient may pass through a
minimum value and then increase as a result of repulsive forces between ions of like
charge. The activity coefficient now depends on both the concentration and the nature of
the other ions in solution. The ions no longer behave as point charges and ions of opposite
charge associate as ion pairs. In addition, the water molecules which are coordinated to the
ion in its primary hydration shell give the ion a larger effective size. When the concentration
increases to the point at which essentially all water in solution is bound in primary hydration
shells, the activity coefficient can become very large. In an extreme example, for a solution
of 20 molal LiBr, the activity coefficient of the salt is 485 [59].
In ionic solutions, the implication of the requirement of overall electrical neutrality is that the
concentration of any one ionic species is not independently variable and individual activity
coefficients are thus un-measurable. This results in the use of the mean ionic activity
coefficient as defined in Equation 2-2. Even though models can theoretically predict both,
Univers
ity of
Cap
e Tow
n
Literature Review Page 19
only the mean is measurable which can be used to confirm model outputs. The estimation
of single-ion activity coefficients is a theoretical exercise [56].
Pitzer established that an effective method for representing the properties of non-ideal
gases was to use a series in increasing powers of density or concentrations with the
coefficients, called virial coefficients, related to the number of molecules. It was further
established through solution theory that a formally similar treatment applies to solutes in a
solvent provided the intermolecular potentials are replaced by potentials of mean force in
that solvent. For electrolytes, the long-range coulombic forces are not included in this virial
series. Pitzer developed his virial coefficient equations (Pitzer Model) using the virial
coefficients (for binary, ternary, etc., interactions) to take the short-range inter-particle-
potential effects into account, and a Debye-Hückel term in order to describe the long-range
electrostatic forces [18].
Meissner approached activity coefficient prediction empirically, although his isotherms are
based on an extended Debye-Hückel equation. The Meissner equations involve the use of
a single characteristic constant for each cation-anion combination present. This constant is
unchanged by the presence of other electrolytes and is readily derived from experimental
measurements [19]. It thus presents a simpler (less parameterised) empirical model based
on the phenomenological ionic strength dependence of the activity coefficient.
Neither of these models can adequately describe proton (single-ion) activity in high
temperature H2O-HCl-MgCl2 systems. Steyl [22] summarised various researchers’ efforts
in modelling of chloride systems.
In order to evaluate hydrogen ion activity effects as predicted by Jaguar Nickel, a modified
model was required which could predict single-ion activity coefficients. The P-H Model was
hence developed and is based on the Pitzer framework, which was seen as being superior
in describing thermodynamic properties, especially for mixtures of different electrolytes.
Modified parameters were also required for the Hydration Model in order to more accurately
estimate MgCl2 hydration in strong brines.
As summarised by Steyl [22], Hydration Theory, credited to Stokes and Robinson [60],
involves the relation of the mean activity of the salt to the activity of the solvent. With
considerable experimental evidence suggesting the anion (Cl–) is not hydrated, Bates et al.
[61] extended the theory for the calculation of single un-associated chlorides. In order to
account for the change in hydration number with the concentration of the salt, Jansz [17]
further extended the theory. Using some assumptions, Jansz related the hydration number
to the water activity and in so doing, temperature effects were incorporated via the change
in water activity with temperature. Steyl further extended this approach by evaluating the
hydration number within a Pitzer framework at various temperatures. An equation fit

Univers
ity of
Cap
e Tow
n
Literature Review Page 20
formalised the effect of temperature on the hydration number for HCl and MgCl2. The
mathematical derivation of Jansz was adapted to calculate single-ion activities in mixtures
of uni-and bivalent chlorides.
Extrapolation of Steyl’s fit of hydration numbers as functions of water activity to unit water
activity yields the hydration at infinite dilution. These values compare well with literature
values (resulting from different methods) as can be seen in Table 2-2.
Table 2-2: Literature values of hydration numbers at infinite dilution (after Steyl [22])
Hydration Number HCl MgCl2
Steyl [22] 6.1 10.7
Stokes and Robinson [60] 8.0 13.7
Gluechauf [22] 4.7 6.5
Jansz [17] 6.4 12
Figure 2-2 shows the P-H Model outputs in terms of single-ion activities. As illustrated,
there are limited data for strong solutions of HCl and MgCl2.
Figure 2-2: Single-ion activities from the P-H Model as a function of HCl and MgCl2
molalities at 25°C (Steyl [22])
a) Activity of H+ b) Activity of Mg2+
Experimental values from: Bates et al. (+) [61] Jansz (●) [17] Senanayake and Muir (○) [62]
Another worker in this field, Senanayake, [63] reviewed the theory and practice of
measuring proton activity and pH in concentrated chloride solutions with specific reference
to oxide leaching. In order to estimate the single ion activity (theoretical pH) a hydration
number of 1 or 2 for the chloride ion was assigned and a constant ionic activity for the
a b

Univers
ity of
Cap
e Tow
n
Literature Review Page 21
hydrated chloride ion proposed. Liquid junction potential corrections were shown to be
important. It was concluded that glass electrodes can be used to measure pH in
concentrated chloride solutions provided appropriate corrections are made for liquid junction
potentials.
A glass electrode calibration using the P-H Model to assign pH to various strength HCl
solutions can be used to incorporate liquid junction potential into the pH reading.
Work has also been done Papangelakis and others [52-55] into high temperature modelling
of aqueous processes (mostly sulfuric acid pressure leaching of laterites) using a similar
approach of accurately describing the solution parameters under process conditions.
2.3 Activity and Leaching Behaviour
Majima and Awakura [50] noted that few studies have applied an activity concept to
hydrometallurgical systems. These researchers measured HCl and approximate H+ and Cl–
activities at 25°C in order to obtain a better understanding of the hydrometallurgical
reactions occurring in concentrated solutions. In order to get around the problem of the un-
measurable junction potential, which is affected by the geometry of the salt bridge between
the reference and measuring electrodes, it was estimated using the Henderson equation. It
was recommended that further work include the establishment of a method for accurate
measurement of ion activities.
Applying the measured activities to the non-oxidative leaching of galena and sphalerite,
Majima and Awakura found that leaching rates were better described by proton activity than
by using acid concentrations. Similarly for acid dissolution of cupric oxide and auto-
oxidation of Fe(II) in hydrochloric acid solutions; the researchers found linear relationships
[50].
Chander [29] found that the addition of NaCl and CaCl2 to H2SO4 leaching of limonitic
laterite increased the Ni extraction and correspondingly the Fe dissolution. The rate
constants for Ni extraction were plotted against acid activity for leaching in sulfuric acid and
hydrochloric acid. It is not clear how these single-ion activities were obtained, but the
relationships are linear.

Univers
ity of
Cap
e Tow
n
Literature Review Page 22
2.4 Leaching Kinetics
The laterite ores vary widely in composition and the nickel is contained in up to five or more
mineral phases. The kinetics of leaching will be dependent on the relative proportion of the
various minerals and their reactivities.
In general, the rate of a chemical reaction under conditions of constant volume is defined
as:
rA = dCA / dt Eq 2-4
where rA = rate of reaction of component A
CA = concentration of A
For a simple irreversible reaction, a rate expression can be written as
-rA = k.CAa Eq. 2-5
where k = temperature dependent rate constant
a = reaction order with respect to component A
Through proposal of a reaction scheme to describe the overall reaction, a corresponding
rate expression and integrated rate equation can be derived. This can only be done with a
thorough understanding of the system and knowledge of rate limiting steps, chemical
intermediates and the like. Equally useful are mathematical or empirical models which do
not require the exact mechanism to be known, but still can provide insight into factors
affecting leaching and be used for scale-up design purposes.
2.4.1. Mathematical models
The classic shrinking core and shrinking particle models developed in the benchmark book
by Levenspiel [65] are the most widely used by hydrometallurgists. Originally, the shrinking
core (and particle) models were only discussed in relation to gas-solids systems and a
steady state diffusion equation used to determine the concentration profile across the
particle [65]. Liddell [66] reviews and summarises some criteria developed by authors on
determining the error associated with using shrinking core models for liquid-solid systems.
The equations do not accurately account for leaching mechanism or particle shape and yet
many excellent fits have been made to leaching data. Shrinking core models are not
commonly applicable to leaching of ores with complex mineralogies, such as lattice-type
laterites. They are more suited to ores with one or perhaps two mineral phases, and not a
matrix of a few phases laterised to varying degrees, with the metal of interest occurring in
more than one mineral.
An extension of the shrinking core model, the crackling core model proposed by Park and
Levenspiel [67], was developed for gas-solid reactions where the reaction gas was
assumed to force the particles to develop a system of cracks which then allows easy
penetration by the reaction gas. Grains, generally assumed uniform in size, subsequently
Univers
ity of
Cap
e Tow
n
Literature Review Page 23
react via the shrinking core model. It is suggested that whenever an S-shaped conversion-
time curve is observed, this model should be considered. Good fits of iron ore reduction
data were obtained.
A model which incorporates the structural properties of solid particles named the
sporulation model was developed by Adrover et al. [68]. It is based on the assumption that
during the dissolution of the ore particles, reactive grains are released in the liquid phase.
Other models consider variable activation energy [69, 70], pore size distributions [71] and
migrational transport during pore diffusion [72].
Fluid-solid reaction models for porous particles were reviewed by Georgiou and
Papangelakis [53] in their search for an appropriate model to describe limonite leaching
under pressure with sulfuric acid. The homogeneous model considers particles to be an
ensemble of small lumps distributed uniformly throughout the solids phase. Leaching is
initially chemical reaction controlled until an inert product layer forms. The uniform pore
model assumes the solid consists of uniform, open and completely wetted cylindrical
capillaries and that no diffusional limitations occur. The random pore model similarly
assumes uniform pores, but with random intersections. The grain model visualises solid
particles as pellets consisting of individual dense grains compacted together. Each grain
reacts as a shrinking core and diffusion through the pores becomes rate limiting.
2.4.2. Empirical analysis
Empirical analysis of kinetic data is often more useful when the leaching mechanism is
complicated.
The integral method is applicable for kinetic data that may be scattered, but follows a
relatively simple mechanism. A simple reaction model must be chosen and integrated. If
relevant plots of the data are linear, then the assumed model was correct and kinetic
parameters may be obtained from the plot [73].
The differential method of fitting leaching data is applicable to systems following a complex
mechanism or where integration of the rate expression is difficult, but data should be
extensive and precise. The leaching rate can be written in the form of Equation 2-5 and
further rearranged into:
log (-rA) = log K + a.log CA Eq. 2.6
The experimental rate is calculated using the kinetic data. Plotting these against
concentrations on a log scale would give intercept equal to log K and slope of a, the
reaction order [73].
Univers
ity of
Cap
e Tow
n
Literature Review Page 24
2.4.3. Kinetic studies on laterite leaching
No kinetic studies have been published on atmospheric saprolytic laterite leaching
(saprolytic ore normally follows the smelting route). Limonitic leaching kinetics have been
reported and some studies are summarised.
Das et al. [42] proposed that the leaching of laterite, and chiefly the Fe oxide minerals,
takes place through surface dissolution of the Fe oxide particle. Thus they found the
shrinking core model (for spherical particles) most appropriate for leaching in acids with an
apparent activation energy of 65.5 kJ/mol. Kinetics in three different acids increased in the
following order: HClO4 < H2SO4 < HCl.
Chander [29] also found that Ni leaching was related to Fe leaching, with kinetics increasing
with acids in the following order: HClO4 < HNO3 < H2SO4 < HCl < H2C2O4.
Senanayake and Das [74] noted that a proper understanding of kinetics and reaction
mechanisms is important for development of selective leaching methods. Their study
examined the kinetics of limonitic laterites and synthetic iron oxides leaching in H2SO4 with
SO2. At constant SO2 concentrations, Fe leaching from the limonitic laterite was
approximately first order with respect to H+. Synthetic Fe oxide leaching also followed first-
order kinetics and the shrinking particle model. Ni selectivity over Fe was in the range 0.7-
0.9 with Ni leaching following a shrinking core model with diffusion through a product layer.
For synthetic Ni oxide, the crystal arrangement was seen to strongly affect the leaching rate
which followed chemical reaction control in sulfuric acid and ammoniacal solutions [31].
Leaching of electrolytic Ni in HCl and small amounts of thiourea was also found to be
chemical reaction controlled [75].
Georgiou and Papangelakis [53] found that although a shrinking core model fitted their data
of pressure sulfuric acid leaching of limonites well, it was not consistent with the physical
picture of limonite leaching. They settled on the grain model to describe the leaching with
diffusion of H2SO4 through the limonite pores as the rate limiting step.
2.5 Summary
In this study the claimed selectivity of the Jaguar Process is tested on a different laterite
ore. Batch leach tests with varying HCl concentrations, MgCl2 concentrations, temperature,
particle size and solids’ concentration are conducted. Glass electrode pH measurements in
chloride brines do not represent the hydrogen ion activity mainly due to the liquid junction
potential of the electrode system. In order to predict activity, the P-H Model is used.
Univers
ity of
Cap
e Tow
n
Literature Review Page 25
Leaching kinetics are described empirically, as saprolytic laterite ores would not be
expected to leach according to shrinking core, particle or other commonly used leaching
models. This is due to the differing reactivities of the mineral phases and variety of
minerals hosting Ni.

Univers
ity of
Cap
e Tow
n
Experimental Equipment and Methods Page 26
3.0 Experimental Equipment and Methods
3.1 Laterite Sample
Sample from Barro Alto, an Anglo American-owned mine in South America, was used after
mineralogical investigation deemed the sample to have the simplest mineralogy of available
samples. The absolute characteristics of the laterite sample were not of primary concern
when selecting the sample as the aim of the testwork was to compare the leaching
behaviour when changing solution chemistry, and not changing solid characteristics.
However, a sufficient Mg content was required in the sample (such as present in saprolytic
laterites) in order to show significant changes in leaching selectivity. In addition, the Jaguar
Nickel laterite, being geologically immature with less defined zones, is more saprolytic than
limonitic in Mg content and using a similar sample would lead to easier comparisons. Table
3-1 shows the main mineral phases present in the Barro Alto sample and Table 3-2 gives
the chemical analysis.
Table 3-1: Main mineral phases of Barro Alto laterite
Mineral Abundance
(%)
Serpentine/Altered Serpentine 74
Fe-hydroxides 8.0
Clay (smectitic: Montmonillonite, saponite) 4.1
Talc 3.2
Clinopyroxene/Clinoamphibole 4.5
Cr-spinel 2.4
Quartz 0.7
Chlorite 0.7
Olivine/Orthopyroxene 1.0
Fe-oxide (Hematite/Magnetite) 0.2
Mn-hydroxide 0.4
Other 1.1
Total 100
Table 3-2: Chemical analysis of Barro Alto laterite
Element Al Ca Co Cr Cu Fe Mg Mn Ni Si Zn
Concentration
(wt.%) 1.55 0.44 0.05 0.55 0.05 10.58 15.54 0.19 1.75 18.06 0.05

Univers
ity of
Cap
e Tow
n
Experimental Equipment and Methods Page 27
From Table 3-2 it can be seen that the elements of interest are Al, Fe, Mg, Ni (and Si). The
serpentine and altered serpentine phases contain the bulk of the Ni at mean concentrations
of 1.65 wt.% Ni [76]. Fe-hydroxide in the form of goethite is the next most abundant phase
and contains up to approximately 2.00 wt.% Ni [76]. This profile is typical of a saprolytic
laterite in that there is significant Ni enrichment and a higher percentage of serpentines,
leading to a higher Mg/Fe ratio than in limonitic laterites.
3.2 Feed Solid Sample Preparation
A 5 kg sample of Barro Alto WTO acido laterite, previously milled to 100% passing 1.7 mm
was spilt into two sub-samples, A and B, using a rotary splitter. Sample A was screened at
106 m and sample B at 38 m. The -38 m material was subjected to cloth screening at
10 m in an ultra-sonic bath to create a +10 m -38 m size fraction in order to eliminate
fines and produce as narrow a size fraction as possible.
Figure 3-1 shows a Malvern analysis of the final prepared Samples A and B. Sample A (-
106 m) was used as received. The D90 for each sample is shown as an additional
comparison.
0
2
4
6
8
10
12
1 10 100 1000
Particle size (µm)
Volu
me
(%)
Sample A Sample B
D90 = 41 µm
D90 = 88 µm
Figure 3-1: Particle size distribution of laterite feed samples

Univers
ity of
Cap
e Tow
n
Experimental Equipment and Methods Page 28
3.3 Leaching Experimental Setup
Batch atmospheric leach tests were carried out in a two-litre, jacketed, sealed glass vessel
with reflux condenser as shown in Figure 3-2.
Figure 3-2: Experimental setup for leaching testwork
No. Description
1 Oil bath (for vessel jacket heating) 2 Auto-titrator 3 Two-litre glass reactor 4 Baffles 5 Lid clamp 6 pH control electrode (linked to auto-titrator) 7 Impeller shaft seal 8 Overhead stirrer 9 Condenser
In order to establish the effect of one process variable at a time, various control methods
were put in place. Table 3-3 summarises the methods used to mitigate or eliminate variable
influence on the testwork results. The variables tested in this study were: temperature,
HCl concentration, MgCl2 concentration, particle size and solids’ concentration.
1
2 3
98
5
4
6
7

Univers
ity of
Cap
e Tow
n
Experimental Equipment and Methods Page 29
Table 3-3: Experimental control methods
Variable Control method
Temperature Water/oil jacket fed with pump from controlled heated bath
Particle size Particles screened to a narrow size fraction of +10 -38m
Solids’ composition Fully blended feed, simplest available mineralogy
Solution composition Low pulp density of 0.5% solids
The oil or water bath (oil was used for temperatures above 80°C) was set 2°C higher than
the desired reaction temperature to counteract heat losses, and was automatically
controlled to within 0.5°C. The temperature of the reactor contents was checked manually
before each experiment.
A Metrohm Syntrode® combined glass pH electrode was used to measure pH in the reactor
during tests. Constant acidity was maintained by using a low solids’ concentration.
Six polypropylene baffles 1 cm wide were fixed inside the reactor to aid mixing. A titanium
pitched-blade impeller 5 cm in diameter was attached to an overhead stirrer with variable
speed settings. All tests were conducted at 800 rpm. The impeller was sealed with a two-
piece water-filled polypropylene seal.
The glass reactor lid was fitted to the reactor by a wire clamp fitted over the ground glass
lips. Vacuum grease was used to ensure a good seal. The lid had sealable ports on top
which were used for the pH probe, kinetic sample removals, reflux condenser connection
and impeller.
Kinetic samples were removed from approximately one third of the slurry depth using a 50
ml syringe connected to 2 mm diameter tubing. The slurry was collected in a small beaker,
weighed and immediately filtered using a Buchner funnel and Whatman 542 hardened
ashless filter paper. Additional solution samples were drawn from Tests 10-19 (see below)
using Millipore 0.45 m Millex®-HV filter discs included in the tubing before the syringe to
obtain a clear solution sample filtered in situ. Filtrates were weighed and, when cooled to
20°C, pH, Eh and density were measured. Solids were washed with pH 2 water using a
wash ratio of two and dried in an oven at 60°C.
Room temperature pH measurements were made using a Metrohm Metrosensor 602
combined glass electrode; the Eh was measured using a Hamilton Oxytrode Pt electrode
and density was measured using an Anton Paar DMA35N density meter.
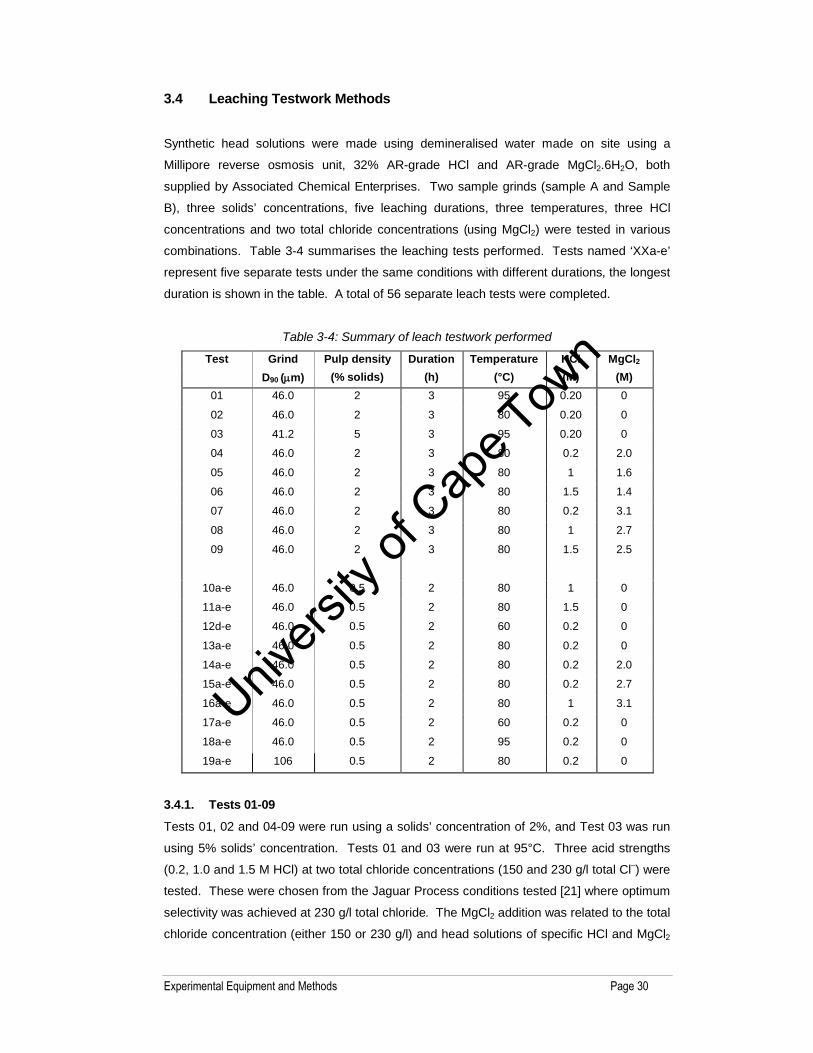
Univers
ity of
Cap
e Tow
n
Experimental Equipment and Methods Page 30
3.4 Leaching Testwork Methods
Synthetic head solutions were made using demineralised water made on site using a
Millipore reverse osmosis unit, 32% AR-grade HCl and AR-grade MgCl2.6H2O, both
supplied by Associated Chemical Enterprises. Two sample grinds (sample A and Sample
B), three solids’ concentrations, five leaching durations, three temperatures, three HCl
concentrations and two total chloride concentrations (using MgCl2) were tested in various
combinations. Table 3-4 summarises the leaching tests performed. Tests named ‘XXa-e’
represent five separate tests under the same conditions with different durations, the longest
duration is shown in the table. A total of 56 separate leach tests were completed.
Table 3-4: Summary of leach testwork performed
Test Grind Pulp density Duration Temperature HCl MgCl2 D90 (m) (% solids) (h) (°C) (M) (M)
01 46.0 2 3 95 0.20 0
02 46.0 2 3 80 0.20 0
03 41.2 5 3 95 0.20 0
04 46.0 2 3 80 0.2 2.0
05 46.0 2 3 80 1 1.6
06 46.0 2 3 80 1.5 1.4
07 46.0 2 3 80 0.2 3.1
08 46.0 2 3 80 1 2.7
09 46.0 2 3 80 1.5 2.5
10a-e 46.0 0.5 2 80 1 0
11a-e 46.0 0.5 2 80 1.5 0
12d-e 46.0 0.5 2 60 0.2 0
13a-e 46.0 0.5 2 80 0.2 0
14a-e 46.0 0.5 2 80 0.2 2.0
15a-e 46.0 0.5 2 80 0.2 2.7
16a-e 46.0 0.5 2 80 1 3.1
17a-e 46.0 0.5 2 60 0.2 0
18a-e 46.0 0.5 2 95 0.2 0
19a-e 106 0.5 2 80 0.2 0
3.4.1. Tests 01-09
Tests 01, 02 and 04-09 were run using a solids’ concentration of 2%, and Test 03 was run
using 5% solids’ concentration. Tests 01 and 03 were run at 95°C. Three acid strengths
(0.2, 1.0 and 1.5 M HCl) at two total chloride concentrations (150 and 230 g/l total Cl–) were
tested. These were chosen from the Jaguar Process conditions tested [21] where optimum
selectivity was achieved at 230 g/l total chloride. The MgCl2 addition was related to the total
chloride concentration (either 150 or 230 g/l) and head solutions of specific HCl and MgCl2

Univers
ity of
Cap
e Tow
n
Experimental Equipment and Methods Page 31
molarity were made up. A mass of this head solution was then used for each test. The pH
in the reactor was measured at the kinetic sampling intervals. Test duration was 180 min
with kinetic samples (only solutions submitted for analysis) taken at 2, 30, 60 and 120 min.
3.4.2. Tests 10-19
For these tests, each kinetic point was run as a separate test in order to get solids’ assay
information. This was a better method (statistically) than taking kinetic samples from one
test as any systematic errors were not carried through to each kinetic data point. In addition,
a low solids’ concentration could be used as only the final residue was analysed, whereas
kinetic samples would not yield enough solid mass for analysis. A lower solids’
concentration of 0.5% was used to improve on keeping the solution conditions constant.
Under these circumstances, solids’ assay information was seen as more reliable than
solution assays due to the small changes in solution composition. Stock solutions of head
liquor were made up as for Tests 01-09. Test durations were 10, 20, 30, 60 and 120 min.
After 2 min of leaching and prior to ending a test, solution samples filtered in situ were taken
in order to determine immediately leachable Ni (after 2 min) and to check if precipitation
was occurring during Buchner funnel filtration (end of test). These 2 min samples were also
used to confirm repeatability yielding 10 tests effectively repeated five times each.
3.5 Mass Balance Calculation Methods
The overall mass balance and metal balances for 11 elements (Al, Ca, Cl, Co, Cr, Fe, Mg,
Mn, Ni, Si and Zn) per test were calculated as the mass ratio of the incoming to the outgoing
mass. Incoming mass included the masses of solids, head liquor and wash water.
Outgoing masses included kinetic residue and filtrate, final residue and filtrate samples,
wash water, cake moisture and evaporation. All masses were weighed except for the cake
moisture and evaporation. Cake moisture was calculated as the difference between wet
and dry filter cake masses after washing and evaporation was calculated as the total
starting mass less kinetic sample slurry mass and final slurry mass.
Extraction of each metal was based on the calculated total mass of solids and calculated
total mass of solution at each sample time. The solids’ density obtained from kinetic
samples was used, with the final slurry mass to calculate a mass of solids at each time
interval. The starting solution mass less evaporation at each time interval and kinetic
solution removal gave the solution mass at each time, which was related to the volume at
room temperature (corresponding to the solution assays) using the densities measured at
each sample time interval.
Univers
ity of
Cap
e Tow
n
Experimental Equipment and Methods Page 32
Where solids’ analyses were not available (solution kinetic samples) kinetic extraction was
calculated using the final solid analysis and the kinetic solution analyses were then used as
a ratio to this final extraction. This was seen as more reliable than using the solution assays
to calculate the extractions as discussed in Section 4.4.
Acid consumption was calculated using the mass of acid added less the residual acid
(measured by titration). Calculated consumption per element assumed the following
simplified mineralogy:
All Ni is present as Ni(OH)2;
all Fe as FeO(OH);
all Mg as Mg(OH)2 and
all Al as Al2O3.
All other elements were assumed not to leach to any appreciable extent (results did confirm
this assumption). The stoichiometric amount of HCl required to leach the mass of element
leached (based on solids’ assays) was calculated. Problems with this method are
discussed in Section 4.3.
Leaching selectivity was defined as the ratio of Ni extraction to that of the specified gangue
element, that is, % Ni extraction / % Fe extraction and % Ni extraction / % Mg extraction.
Only extractions calculated from solids’ analyses were used.
3.6 Activity Measurement Experimental Setup
The measurement of proton activity using a split electrode system was conducted using the
setup illustrated in Figure 3-3.
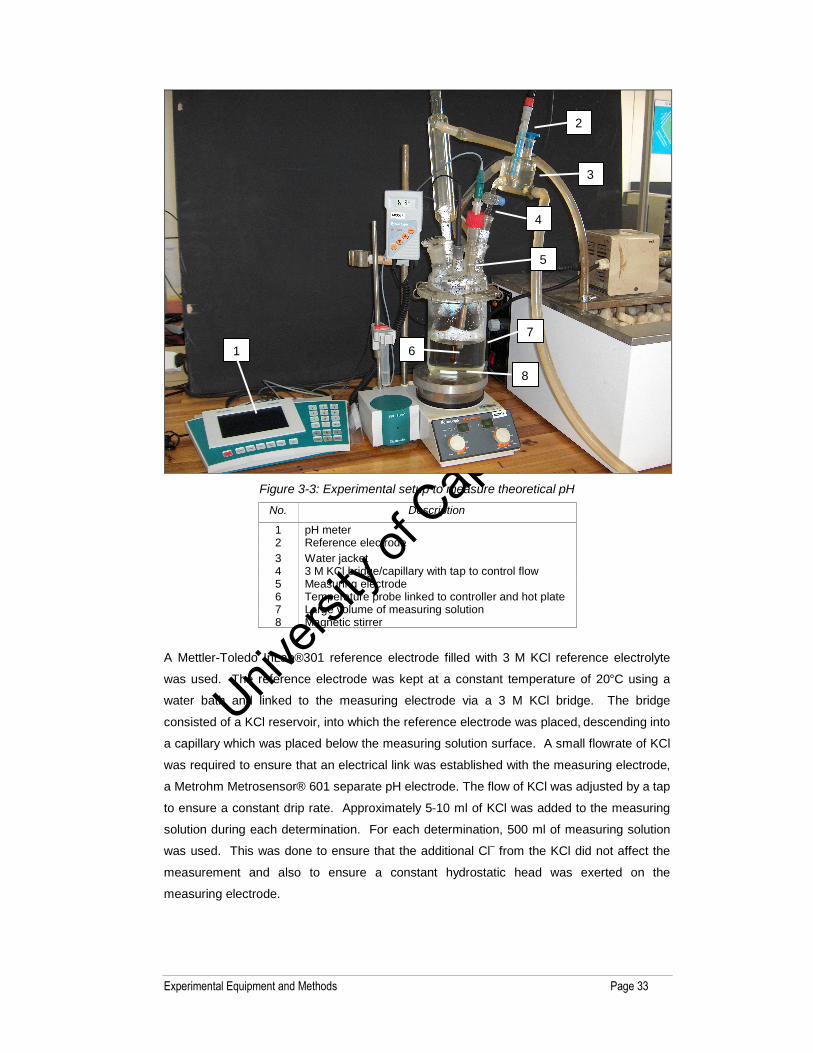
Univers
ity of
Cap
e Tow
n
Experimental Equipment and Methods Page 33
Figure 3-3: Experimental setup to measure theoretical pH
No. Description
1 pH meter 2 Reference electrode 3 Water jacket 4 3 M KCl bridge/capillary with tap to control flow 5 Measuring electrode 6 Temperature probe linked to controller and hot plate 7 Large volume of measuring solution 8 Magnetic stirrer
A Mettler-Toledo InLab®301 reference electrode filled with 3 M KCl reference electrolyte
was used. The reference electrode was kept at a constant temperature of 20°C using a
water bath and linked to the measuring electrode via a 3 M KCl bridge. The bridge
consisted of a KCl reservoir, into which the reference electrode was placed, descending into
a capillary which was placed below the measuring solution surface. A small flowrate of KCl
was required to ensure that an electrical link was established with the measuring electrode,
a Metrohm Metrosensor® 601 separate pH electrode. The flow of KCl was adjusted by a tap
to ensure a constant drip rate. Approximately 5-10 ml of KCl was added to the measuring
solution during each determination. For each determination, 500 ml of measuring solution
was used. This was done to ensure that the additional Cl– from the KCl did not affect the
measurement and also to ensure a constant hydrostatic head was exerted on the
measuring electrode.
1
2
4
3
5
6 7
8

Univers
ity of
Cap
e Tow
n
Experimental Equipment and Methods Page 34
Temperature was controlled to within 1°C of the setpoint by a Heidolph EKT3001 controller
linked to a Heidolph MR3001 K hot plate and magnetic stirrer. The temperature probe was
situated next to the measuring electrode. A small magnetic stirrer set at low speed was
used to aid heat transfer. A Metrohm 780 pH meter was used which could perform nine-
point calibrations.
3.7 Activity Measurement Method
3.7.1. Using the P-H Model
The P-H Model described in Section 2.2.2 was at the time untested. It was desired to
compare predicted activities with measured activities using the split electrode system:
P-H Model predictions of pH in the binary system H2O-HCl were used for calibration
at temperature in order to incorporate the liquid junction and other potentials into
the split electrode calibration.
P-H Model predictions, at the solution conditions tested, of proton (single-ion) and
acid (mean) activities were used.
The P-H Model gave, in theory, the best available estimate of the theoretical hydrogen ion
activity (pH) for the chloride system investigated in this study. This was important in order to
evaluate whether the proton activity is indeed increased with background chloride salt
addition and the cause of selective leaching as claimed by Jaguar Nickel.
3.7.2. Activity measurements
Hydrogen ion activities calculated using the P-H Model at various HCl concentrations and
temperatures were used to calibrate the split electrode system. The calibration data is
shown in Figure 3-4, represented by the curves. By using these data to calibrate the
electrode, all local effects, such as the liquid junction potential, are incorporated and the
best measurement of the theoretical pH is possible.

Univers
ity of
Cap
e Tow
n
Experimental Equipment and Methods Page 35
-0.5
-0.3
-0.1
0.1
0.3
0.5
0.7
0.9
1.1
1.3
0.0 0.5 1.0 1.5 2.0
HCl (M)
Theo
retic
al p
H
20 °C 60 °C 80 °C 100 °C
Figure 3-4: Theoretical pH as predicted by the P-H Model as a function of HCl molarity
The split pH electrode system was used to measure hydrogen ion activity. These
measurements were made in an attempt to validate the P-H Model. The electrode was
calibrated (at temperature) using the P-H Model predictions of pH for various HCl
molarities.
To check the temperature compensation of the P-H Model, the pH of the solutions
generated by the batch leach tests were measured at 20°C and also at the test temperature.
3.7.3. Density measurements
The P-H Model required a description of the relationship between molarity and molality in
the ternary system H2O-HCl-MgCl2. Thermodynamic models are based on mass
calculations (molality) as volume-based (molarity) calculations are temperature dependent.
Molality (m) is related to molarity (M) through the following relationship:
m = c / (- 0.001.c.M) Eq. 3-1
From Equation 3-1 it can be seen that density () is used to relate the two measures of
concentration. No high temperature measurements for the ternary system H2O-HCl-MgCl2
were found in literature. Thus, density measurements were made in order to correctly relate
solution molality and molarity. Synthetic solutions of molar concentrations ranging from 0-
2.5 M HCl and 0-2.5 M MgCl2 were made up. An oil bath was used to heat solutions to
three temperatures: 20, 60 and 95 ºC. Accurate volume pycnometers (consisting of 50 ml
glass flasks with capillary lids) were used and when solutions were at the target
temperatures, the masses were measured. Each pycnometer was calibrated at each

Univers
ity of
Cap
e Tow
n
Experimental Equipment and Methods Page 36
temperature with water to establish the exact volume. All measurements were made in
duplicate and masses weighed to three decimal places.
Using each parameter in turn, an equation was fitted to the data which could be used in the
P-H Model. This allowed the use of molality in the thermodynamic calculations (necessary
to decouple from the effects of temperature and pressure), but provided outputs in molarity
(more useful on a practical level).
3.8 Mineralogical Analysis
The following mineralogical investigations were done by the AR Mineralogy Department
from which all mineralogical inferences were made (these analyses also formed part of the
larger laterite research programme at AR):
X-ray diffraction analysis was done on the laterite sample to identify mineral phases
present.
Optical and Scanning Electron Microscope (SEM) petrography was performed in
order to qualitatively investigate the nature and extent of the lateritic weathering (not
discussed in this study).
Quantitative mineral abundance was determined (see Table 3-1).
Semi-quantitative Energy Dispersive Spectroscopy (EDS) point mineral analyses
were also done to identify the phases that host the Ni and to determine the Ni
concentration in each of these Ni-containing phases.
3.9 Kinetic Modelling
As discussed in Section 2.4, there are various methods of kinetic modelling. As the primary
aim of this study was to investigate leaching selectivity and activity effects, the bulk of the
testwork was not geared towards generating kinetic data. However, Tests 10-19 included
variation of parameters such that kinetic modelling could be done.
3.9.1. Choice of method
Section 4.8.4 includes examples showing the non-applicability of shrinking core/particle
models in this case. A fuller investigation would involve integrating over each particle size
and mineral type before completely rejecting these models. The differential method of
analysis was used which is useful when dealing with complex mechanisms as it involves
direct evaluation using the rate expression [73].

Univers
ity of
Cap
e Tow
n
Experimental Equipment and Methods Page 37
3.9.2. The differential method
It is proposed that the rate expression is of the following form and the initial rate of Ni
extraction given by:
-r = K.[H+]n.[Cl-]m.e(-E/RT) Eq. 3-2
where K = overall rate constant
n,m = respective reaction orders
E = activation energy
R = universal gas constant
Each parameter was evaluated in turn and Ni extraction (not concentration) data were used
to ensure constant volume conditions. Assuming all parameters except acid concentration
are constant, the rate expression can be re-written in log form incorporating a pseudo rate
constant, k1:
ln (-r) = ln (k1) + n.ln (H+) Eq. 3-3
From a straight line fit of ln (initial rate) vs. ln (acid concentration), the slope, n and intercept
ln (k1) were found. Similarly for changing chloride concentration and temperature, m and E
were found. For each set of parameters, K was then calculated using Equation 3-2. The
model can be tested against data that were not used in the development of the model.
The most widely used method of approximating the temperature-dependence in rate
equations uses Arrhenius’ Law where the rate constant k is described as:
k = Ae–E/RT Eq. 3-4
where A is the frequency factor and E is the activation energy of the reaction. This equation
fits most reactions well (especially simple ones) over wide temperature ranges and is
regarded as the best approximation of true temperature dependence [65]. If rate
measurements are used instead of the true rate constants, the measurements must be
made such that the only parameter changing between tests is the temperature [77]. This
was attempted in this study and the other parameters affecting rate (particle surface area
and solution compositions) were deemed to be reasonably constant as discussed in Section
4.3. Acid concentration did vary by more than 10% in some tests.
The activation energy E gives an indication of the reaction mechanism. Values of 40-80
kJ/mol typically indicate that the reaction rate is controlled by the rate of chemical reaction,
while values less than 20 kJ/mol indicate the rate is controlled by mass transfer in the
solution phase. Values in the 20-40 kJ/mol range indicate a mixed mechanism [65].
The HCl activity (as predicted by the P-H Model) was then used instead of HCl
concentration in order to investigate if the leaching rates were better described by the
activity data.

Univers
ity of
Cap
e Tow
n
Experimental Equipment and Methods Page 38
3.10 Chemical Analysis
Solution samples were diluted as required and analysed using a Spectro inductively coupled
plasma – optical emission spectrometer (ICP-OES). Larger dilution ratios were used for
solutions with a high magnesium background (>20 g/l) in order to prevent interferences on
the ICP peaks. Dry solid samples were fused, dissolved in acid and analysed against a
suitable calibration by ICP-OES. Chloride determinations were done by manual titration and
free acid determinations were done by titration with a Mettler-Toledo DL50 auto-titrator
using NaOH. All analyses were performed by the AR Analytical Services Department.
3.11 Statistical Analysis
All confidence limits were calculated at the 95% level (two-sided z = 1.96). To test
significance, t-tests were used. A t-test on the significance of the mean difference between
pairs of values was used to compare bulk vs. in situ filtered sample analyses and acid
consumption based on analyses vs. stoichiometry.

Univers
ity of
Cap
e Tow
n
Results and Discussion Page 39
4.0 Results and Discussion
4.1 Results Summary
A summary of the Ni accountabilities and metal extractions achieved for each set of conditions
is shown in Table 4-1. Refer to Appendix A for a full summary table, including all parameters,
and the test sheets for each test.
Table 4-1: Summary of metal extraction results
Test Main
variable
Ni
accountability
(%)
Ni ext.
(%)
Mg ext.
(%)
Fe ext.
(%)
01 temperature 95 71 47 33
02 – 97 73 49 31
03 % solids 93 51 33 9
04 MgCl2 110 76 43 26
05 HCl, MgCl2 96 98 89 92
06 HCl, MgCl2 109 98 92 95
07 MgCl2 93 77 39 35
08 HCl, MgCl2 107 98 88 93
09 HCl, MgCl2 90 98 89 93
10e HCl 102 98 91 89
11e HCl 122 99 92 92
12e temperature 94 57 28 25
13e – 99 92 83 70
14e HCl, MgCl2 96 96 86 85
15e HCl, MgCl2 96 98 88 93
16e HCl, MgCl2 101 97 86 89
17e temperature 97 51 23 21
18e temperature 91 79 65 47
19e grind 113 73 64 32
Ni leaching is achievable under various conditions, with nine test conditions yielding Ni
extractions of over 95%. For Tests 10-19, only the ultimate extractions are shown and not
those obtained at 10, 20, 30 and 60 min of leaching. See Figure 4-4 for these data. Ni
accountability is acceptable with an average of 96 ± 3% calculated for the 56 individual tests
completed.
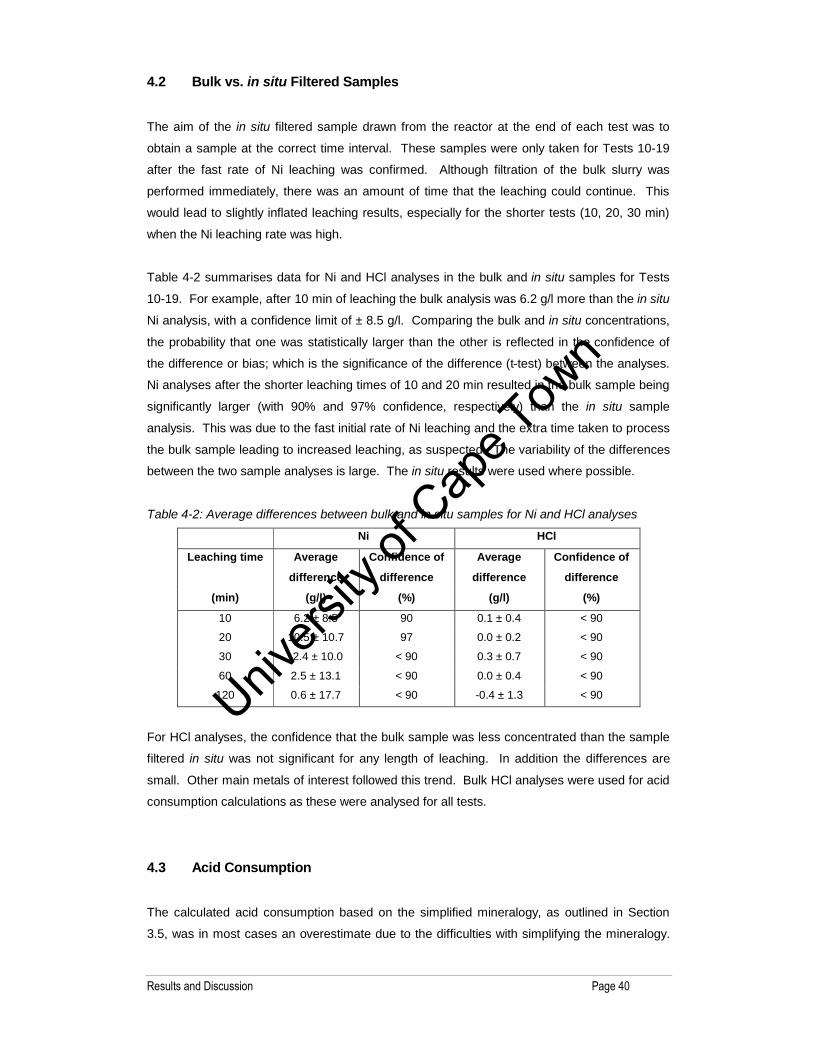
Univers
ity of
Cap
e Tow
n
Results and Discussion Page 40
4.2 Bulk vs. in situ Filtered Samples
The aim of the in situ filtered sample drawn from the reactor at the end of each test was to
obtain a sample at the correct time interval. These samples were only taken for Tests 10-19
after the fast rate of Ni leaching was confirmed. Although filtration of the bulk slurry was
performed immediately, there was an amount of time that the leaching could continue. This
would lead to slightly inflated leaching results, especially for the shorter tests (10, 20, 30 min)
when the Ni leaching rate was high.
Table 4-2 summarises data for Ni and HCl analyses in the bulk and in situ samples for Tests
10-19. For example, after 10 min of leaching the bulk analysis was 6.2 g/l more than the in situ
Ni analysis, with a confidence limit of ± 8.5 g/l. Comparing the bulk and in situ concentrations,
the probability that one was statistically larger than the other is reflected in the confidence of
the difference or bias; which is the significance of the difference (t-test) between the analyses.
Ni analyses after the shorter leaching times of 10 and 20 min resulted in the bulk sample being
significantly larger (with 90% and 97% confidence, respectively) than the in situ sample
analysis. This was due to the fast initial rate of Ni leaching and the extra time taken to process
the bulk sample leading to increased leaching, as suspected. The variability of the differences
between the two sample analyses is large. The in situ results were used where possible.
Table 4-2: Average differences between bulk and in situ samples for Ni and HCl analyses
Ni HCl
Leaching time Average
difference
Confidence of
difference
Average
difference
Confidence of
difference
(min) (g/l) (%) (g/l) (%)
10 6.2 ± 8.5 90 0.1 ± 0.4 < 90
20 10.5 ± 10.7 97 0.0 ± 0.2 < 90
30 -2.4 ± 10.0 < 90 0.3 ± 0.7 < 90
60 2.5 ± 13.1 < 90 0.0 ± 0.4 < 90
120 0.6 ± 17.7 < 90 -0.4 ± 1.3 < 90
For HCl analyses, the confidence that the bulk sample was less concentrated than the sample
filtered in situ was not significant for any length of leaching. In addition the differences are
small. Other main metals of interest followed this trend. Bulk HCl analyses were used for acid
consumption calculations as these were analysed for all tests.
4.3 Acid Consumption
The calculated acid consumption based on the simplified mineralogy, as outlined in Section
3.5, was in most cases an overestimate due to the difficulties with simplifying the mineralogy.
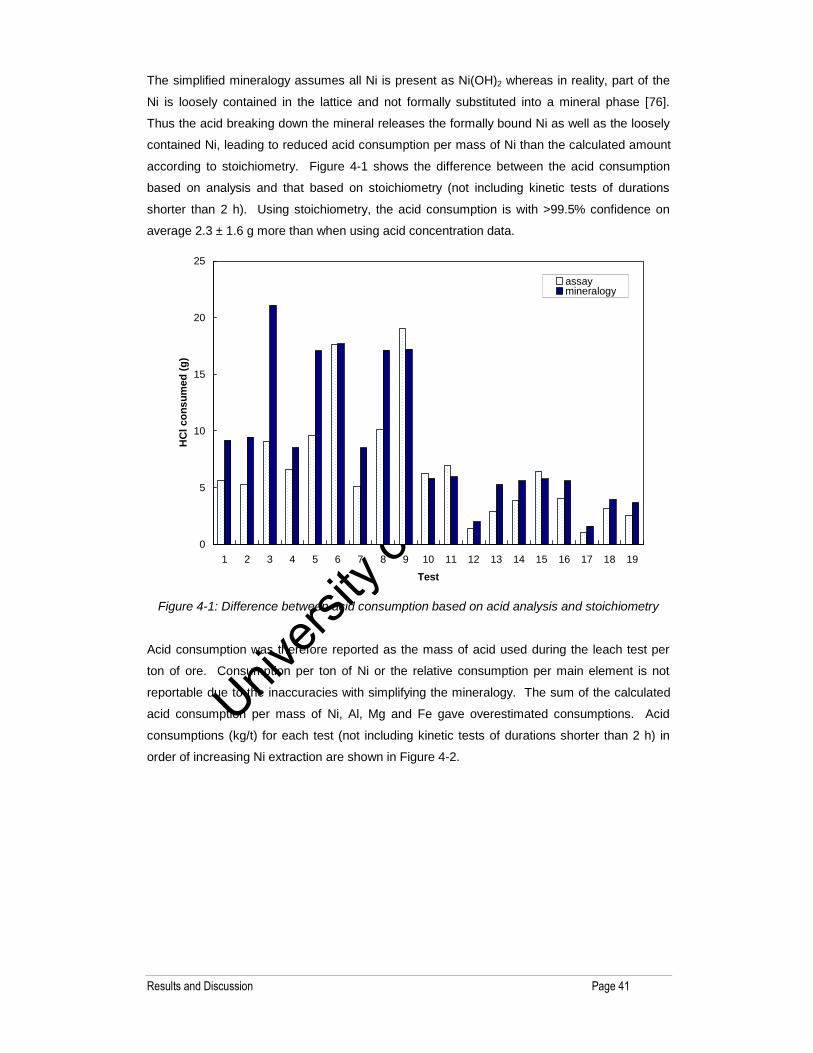
Univers
ity of
Cap
e Tow
n
Results and Discussion Page 41
The simplified mineralogy assumes all Ni is present as Ni(OH)2 whereas in reality, part of the
Ni is loosely contained in the lattice and not formally substituted into a mineral phase [76].
Thus the acid breaking down the mineral releases the formally bound Ni as well as the loosely
contained Ni, leading to reduced acid consumption per mass of Ni than the calculated amount
according to stoichiometry. Figure 4-1 shows the difference between the acid consumption
based on analysis and that based on stoichiometry (not including kinetic tests of durations
shorter than 2 h). Using stoichiometry, the acid consumption is with >99.5% confidence on
average 2.3 ± 1.6 g more than when using acid concentration data.
0
5
10
15
20
25
1 2 3 4 5 6 7 8 9 10 11 12 13 14 15 16 17 18 19
Test
HC
l con
sum
ed (g
)
assaymineralogy
Figure 4-1: Difference between acid consumption based on acid analysis and stoichiometry
Acid consumption was therefore reported as the mass of acid used during the leach test per
ton of ore. Consumption per ton of Ni or the relative consumption per main element is not
reportable due to the inaccuracies with simplifying the mineralogy. The sum of the calculated
acid consumption per mass of Ni, Al, Mg and Fe gave overestimated consumptions. Acid
consumptions (kg/t) for each test (not including kinetic tests of durations shorter than 2 h) in
order of increasing Ni extraction are shown in Figure 4-2.
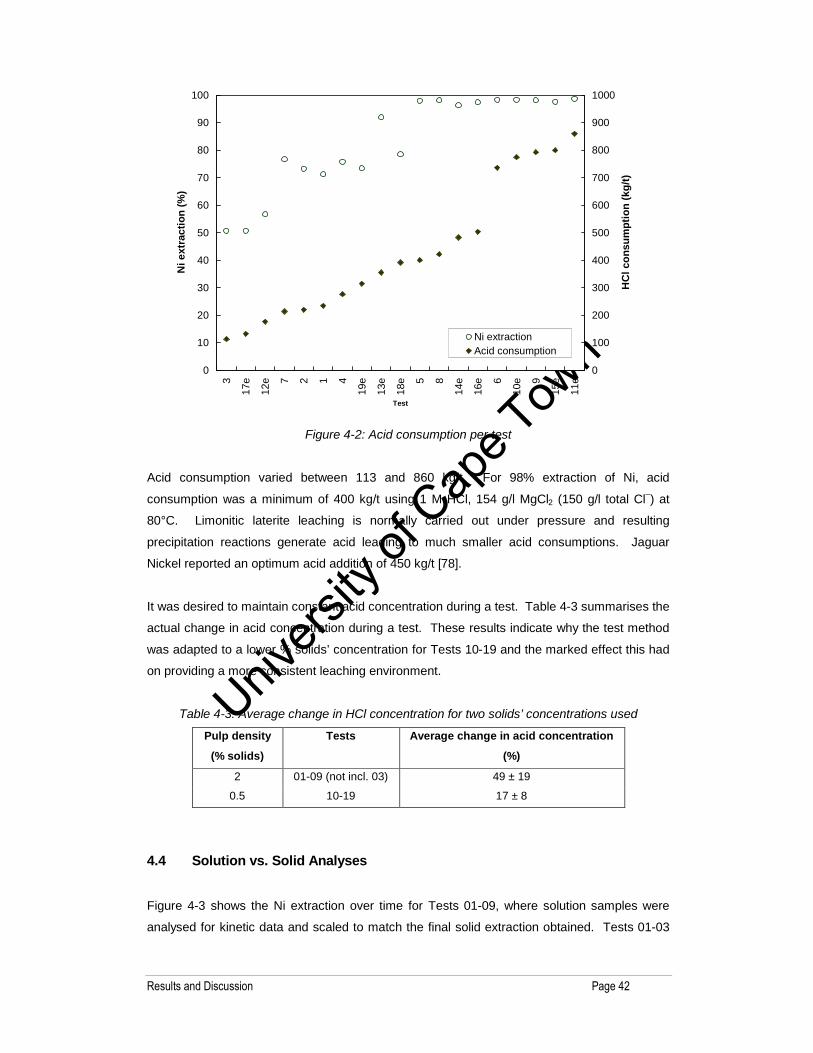
Univers
ity of
Cap
e Tow
n
Results and Discussion Page 42
0
10
20
30
40
50
60
70
80
90
100
3
17e
12e 7 2 1 4
19e
13e
18e 5 8
14e
16e 6
10e 9
15e
11e
Test
Ni e
xtra
ctio
n (%
)
0
100
200
300
400
500
600
700
800
900
1000
HC
l con
sum
ptio
n (k
g/t)
Ni extractionAcid consumption
Figure 4-2: Acid consumption per test
Acid consumption varied between 113 and 860 kg/t. For 98% extraction of Ni, acid
consumption was a minimum of 400 kg/t using 1 M HCl, 154 g/l MgCl2 (150 g/l total Cl–) at
80°C. Limonitic laterite leaching is normally carried out under pressure and resulting
precipitation reactions generate acid leading to much smaller acid consumptions. Jaguar
Nickel reported an optimum acid addition of 450 kg/t [78].
It was desired to maintain constant acid concentration during a test. Table 4-3 summarises the
actual change in acid concentration during a test. These results indicate why the test method
was adapted to a lower % solids’ concentration for Tests 10-19 and the marked effect this had
on providing a more consistent leaching environment.
Table 4-3: Average change in HCl concentration for two solids’ concentrations used
Pulp density
(% solids)
Tests Average change in acid concentration
(%)
2 01-09 (not incl. 03) 49 ± 19
0.5 10-19 17 ± 8
4.4 Solution vs. Solid Analyses
Figure 4-3 shows the Ni extraction over time for Tests 01-09, where solution samples were
analysed for kinetic data and scaled to match the final solid extraction obtained. Tests 01-03

Univers
ity of
Cap
e Tow
n
Results and Discussion Page 43
were baseline tests varying % solids’ concentration and temperature, Tests 04-06 had MgCl2 at
a total Cl– concentration of 150 g/l and Tests 07-09, 230 g/l. Figure 4-4 shows the Ni extraction
over time for Tests 10-19, where each point represents a separate test; a shorter leach time,
lower pulp density and only solids’ analyses were used. Tests 10, 11 and 13 varied HCl
concentration, Tests 12, 17 and 18 varied temperature, Test 19 varied particle size and Tests
14-16 varied MgCl2 and HCl concentrations.
0
10
20
30
40
50
60
70
80
90
100
0 50 100 150
Time (min)
Ni e
xtra
ctio
n (%
)
1 2 3 4 5 67 8 9
Figure 4-3: Ni extraction for Tests 01-09
0
10
20
30
40
50
60
70
80
90
100
0 20 40 60 80 100 120 140
Time (min)
Ni e
xtra
ctio
n (%
)
10 11 12 13 1415 16 17 18 19
Figure 4-4: Ni extraction for Tests 10-19
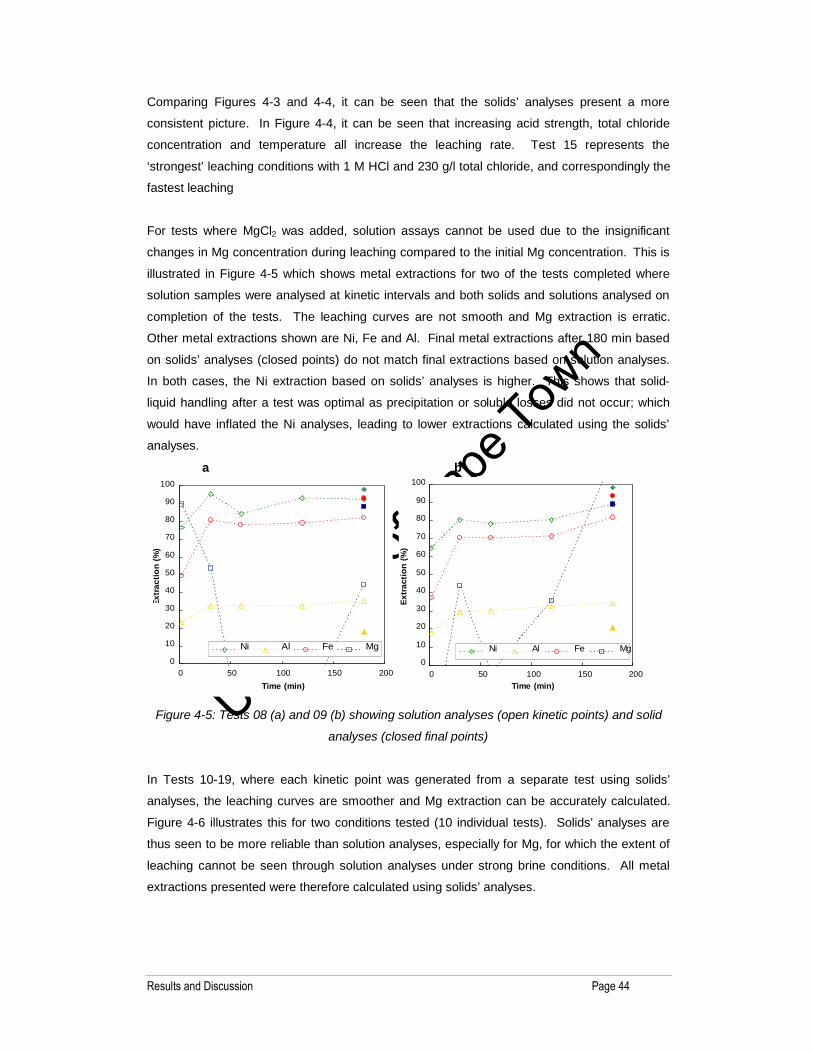
Univers
ity of
Cap
e Tow
n
Results and Discussion Page 44
Comparing Figures 4-3 and 4-4, it can be seen that the solids’ analyses present a more
consistent picture. In Figure 4-4, it can be seen that increasing acid strength, total chloride
concentration and temperature all increase the leaching rate. Test 15 represents the
‘strongest’ leaching conditions with 1 M HCl and 230 g/l total chloride, and correspondingly the
fastest leaching
For tests where MgCl2 was added, solution assays cannot be used due to the insignificant
changes in Mg concentration during leaching compared to the initial Mg concentration. This is
illustrated in Figure 4-5 which shows metal extractions for two of the tests completed where
solution samples were analysed at kinetic intervals and both solids and solutions analysed on
completion of the tests. The leaching curves are not smooth and Mg extraction is erratic.
Other metal extractions shown are Ni, Fe and Al. Final metal extractions after 180 min based
on solids’ analyses (closed points) do not match final extractions based on solution analyses.
In both cases, the Ni extraction based on solids’ analyses is higher. This shows that solid-
liquid handling after a test was optimal as precipitation or soluble losses did not occur; which
would have inflated the Ni analyses, leading to lower extractions calculated using the solids’
analyses.
a b
0
10
20
30
40
50
60
70
80
90
100
0 50 100 150 200Time (min)
Extr
actio
n (%
)
Ni Al Fe Mg0
10
20
30
40
50
60
70
80
90
100
0 50 100 150 200Time (min)
Extr
actio
n (%
)
Ni Al Fe Mg
Figure 4-5: Tests 08 (a) and 09 (b) showing solution analyses (open kinetic points) and solid
analyses (closed final points)
In Tests 10-19, where each kinetic point was generated from a separate test using solids’
analyses, the leaching curves are smoother and Mg extraction can be accurately calculated.
Figure 4-6 illustrates this for two conditions tested (10 individual tests). Solids’ analyses are
thus seen to be more reliable than solution analyses, especially for Mg, for which the extent of
leaching cannot be seen through solution analyses under strong brine conditions. All metal
extractions presented were therefore calculated using solids’ analyses.
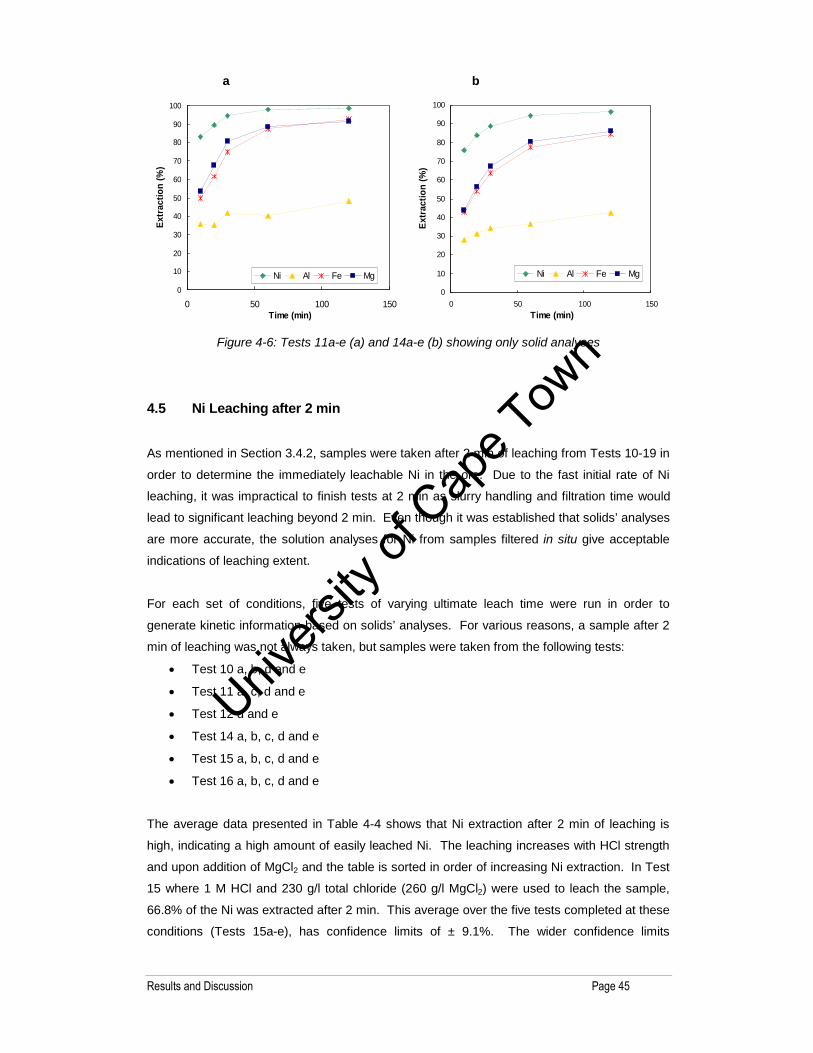
Univers
ity of
Cap
e Tow
n
Results and Discussion Page 45
a b
0
10
20
30
40
50
60
70
80
90
100
0 50 100 150Time (min)
Extr
actio
n (%
)
Ni Al Fe Mg
0
10
20
30
40
50
60
70
80
90
100
0 50 100 150Time (min)
Extr
actio
n (%
)
Ni Al Fe Mg
Figure 4-6: Tests 11a-e (a) and 14a-e (b) showing only solid analyses
4.5 Ni Leaching after 2 min
As mentioned in Section 3.4.2, samples were taken after 2 min of leaching from Tests 10-19 in
order to determine the immediately leachable Ni in the ore. Due to the fast initial rate of Ni
leaching, it was impractical to finish tests at 2 min as slurry handling and filtration time would
lead to significant leaching beyond 2 min. Even though it was established that solids’ analyses
are more accurate, the solution analyses for Ni from samples filtered in situ give acceptable
indications of leaching extent.
For each set of conditions, five tests of varying ultimate leach time were run in order to
generate kinetic information based on solids’ analyses. For various reasons, a sample after 2
min of leaching was not always taken, but samples were taken from the following tests:
Test 10 a, b, d and e
Test 11 a, c, d and e
Test 12 d and e
Test 14 a, b, c, d and e
Test 15 a, b, c, d and e
Test 16 a, b, c, d and e
The average data presented in Table 4-4 shows that Ni extraction after 2 min of leaching is
high, indicating a high amount of easily leached Ni. The leaching increases with HCl strength
and upon addition of MgCl2 and the table is sorted in order of increasing Ni extraction. In Test
15 where 1 M HCl and 230 g/l total chloride (260 g/l MgCl2) were used to leach the sample,
66.8% of the Ni was extracted after 2 min. This average over the five tests completed at these
conditions (Tests 15a-e), has confidence limits of ± 9.1%. The wider confidence limits
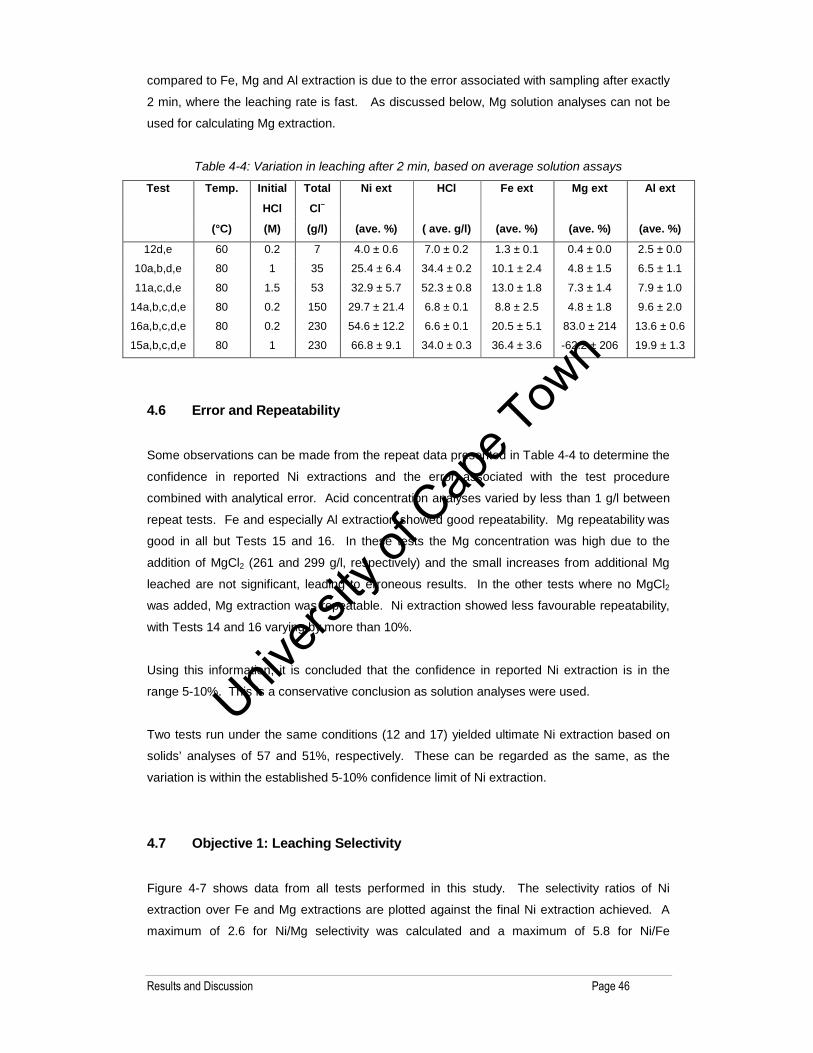
Univers
ity of
Cap
e Tow
n
Results and Discussion Page 46
compared to Fe, Mg and Al extraction is due to the error associated with sampling after exactly
2 min, where the leaching rate is fast. As discussed below, Mg solution analyses can not be
used for calculating Mg extraction.
Table 4-4: Variation in leaching after 2 min, based on average solution assays
Test Temp. Initial
HCl
Total
Cl–
Ni ext HCl Fe ext Mg ext Al ext
(°C) (M) (g/l) (ave. %) ( ave. g/l) (ave. %) (ave. %) (ave. %)
12d,e 60 0.2 7 4.0 ± 0.6 7.0 ± 0.2 1.3 ± 0.1 0.4 ± 0.0 2.5 ± 0.0
10a,b,d,e 80 1 35 25.4 ± 6.4 34.4 ± 0.2 10.1 ± 2.4 4.8 ± 1.5 6.5 ± 1.1
11a,c,d,e 80 1.5 53 32.9 ± 5.7 52.3 ± 0.8 13.0 ± 1.8 7.3 ± 1.4 7.9 ± 1.0
14a,b,c,d,e 80 0.2 150 29.7 ± 21.4 6.8 ± 0.1 8.8 ± 2.5 4.8 ± 1.8 9.6 ± 2.0
16a,b,c,d,e 80 0.2 230 54.6 ± 12.2 6.6 ± 0.1 20.5 ± 5.1 83.0 ± 214 13.6 ± 0.6
15a,b,c,d,e 80 1 230 66.8 ± 9.1 34.0 ± 0.3 36.4 ± 3.6 -62.2 ± 206 19.9 ± 1.3
4.6 Error and Repeatability
Some observations can be made from the repeat data presented in Table 4-4 to determine the
confidence in reported Ni extractions and the error associated with the test procedure
combined with analytical error. Acid concentration analyses varied by less than 1 g/l between
repeat tests. Fe and especially Al extraction showed good repeatability. Mg repeatability was
good in all but Tests 15 and 16. In these tests the Mg concentration was high due to the
addition of MgCl2 (261 and 299 g/l, respectively) and the small increases from additional Mg
leached are not significant, leading to erroneous results. In the other tests where no MgCl2
was added, Mg extraction was repeatable. Ni extraction showed less favourable repeatability,
with Tests 14 and 16 varying by more than 10%.
Using this information, it is concluded that the confidence in reported Ni extraction is in the
range 5-10%. This is a conservative conclusion as solution analyses were used.
Two tests run under the same conditions (12 and 17) yielded ultimate Ni extraction based on
solids’ analyses of 57 and 51%, respectively. These can be regarded as the same, as the
variation is within the established 5-10% confidence limit of Ni extraction.
4.7 Objective 1: Leaching Selectivity
Figure 4-7 shows data from all tests performed in this study. The selectivity ratios of Ni
extraction over Fe and Mg extractions are plotted against the final Ni extraction achieved. A
maximum of 2.6 for Ni/Mg selectivity was calculated and a maximum of 5.8 for Ni/Fe
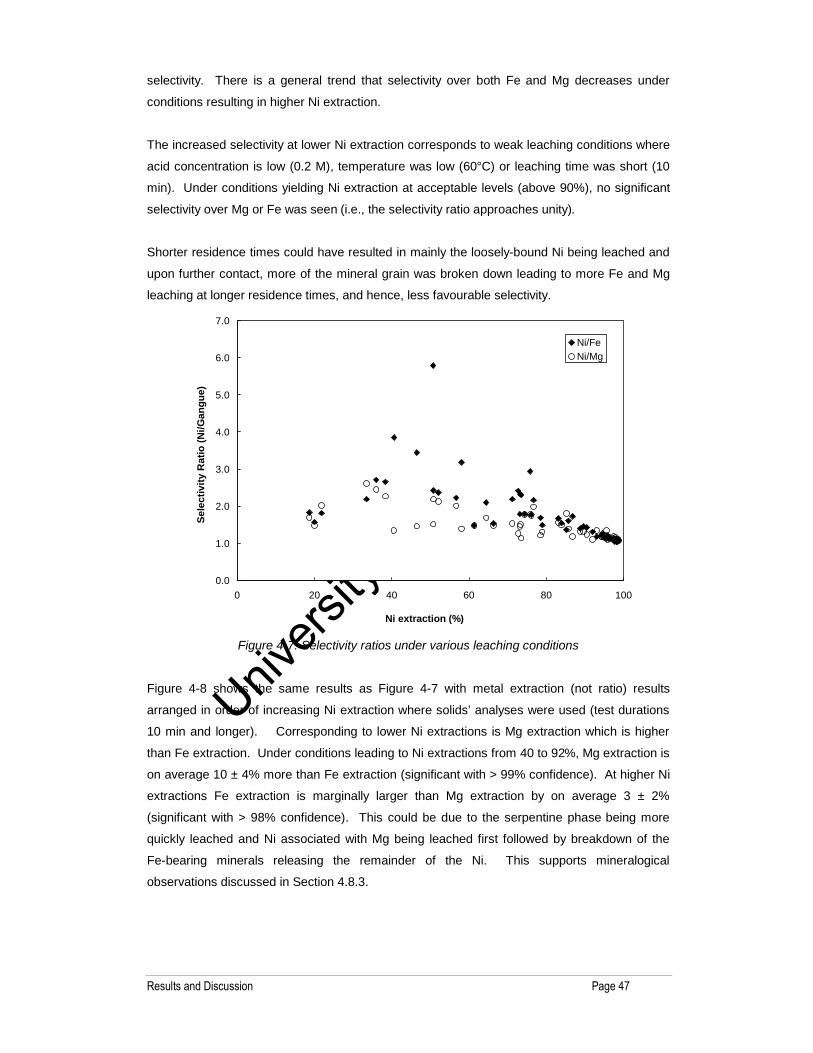
Univers
ity of
Cap
e Tow
n
Results and Discussion Page 47
selectivity. There is a general trend that selectivity over both Fe and Mg decreases under
conditions resulting in higher Ni extraction.
The increased selectivity at lower Ni extraction corresponds to weak leaching conditions where
acid concentration is low (0.2 M), temperature was low (60°C) or leaching time was short (10
min). Under conditions yielding Ni extraction at acceptable levels (above 90%), no significant
selectivity over Mg or Fe was seen (i.e., the selectivity ratio approaches unity).
Shorter residence times could have resulted in mainly the loosely-bound Ni being leached and
upon further contact, more of the mineral grain was broken down leading to more Fe and Mg
leaching at longer residence times, and hence, less favourable selectivity.
0.0
1.0
2.0
3.0
4.0
5.0
6.0
7.0
0 20 40 60 80 100
Ni extraction (%)
Sele
ctiv
ity R
atio
(Ni/G
angu
e)
Ni/FeNi/Mg
Figure 4-7: Selectivity ratios under various leaching conditions
Figure 4-8 shows the same results as Figure 4-7 with metal extraction (not ratio) results
arranged in order of increasing Ni extraction where solids’ analyses were used (test durations
10 min and longer). Corresponding to lower Ni extractions is Mg extraction which is higher
than Fe extraction. Under conditions leading to Ni extractions from 40 to 92%, Mg extraction is
on average 10 ± 4% more than Fe extraction (significant with > 99% confidence). At higher Ni
extractions Fe extraction is marginally larger than Mg extraction by on average 3 ± 2%
(significant with > 98% confidence). This could be due to the serpentine phase being more
quickly leached and Ni associated with Mg being leached first followed by breakdown of the
Fe-bearing minerals releasing the remainder of the Ni. This supports mineralogical
observations discussed in Section 4.8.3.

Univers
ity of
Cap
e Tow
n
Results and Discussion Page 48
0
10
20
30
40
50
60
70
80
90
100
17b
17a
17c
13a
17d
12d
19a
19b 3
17e
18a
12e
19c
13b
18b
13c 1
19d
18c 2
19e
10a 4
14a 7
18e
13d
11a
14b
16a
10b
18d
14c
11b
10c
13e
16b
14d
11c
16c
15a
10d
14e
16d
15b
16e
15e
11d
15c 5 8 9
10e 6
15d
11e
Test
Met
al e
xtra
ctio
n (%
)
Ni
Fe
Mg
Figure 4-8: Ni, Fe and Mg extraction for all tests
Comparing these data to those reported by Jaguar Nickel for their laterite testwork, some
differences are observed. Table 4-5 summarises graphed data presented by Jaguar Nickel
[21] which shows that at comparable Ni extractions, selectivity over Fe an order of magnitude
higher than in this study was observed. Selectivity over Mg is similar to that observed in the
current study. Selectivity decreased with increased Ni extraction, corresponding to stronger
leaching conditions, as in the current study. Higher acid strength was required to effect
acceptable Ni extraction (over 90%) than in the current study due to the increased limonitic
nature of the Jaguar Nickel laterite. Limonitic laterites are more difficult to leach than saprolytic
laterites due the more weathered lattice structure and decreased content of soluble
components.
Table 4-5: Jaguar Nickel results – metal extraction as a function of initial acidity at 230 g/l total
Cl– , 4 h leach time and 100°C [21]
[HCl] Ni extraction
(%)
Fe extraction
(%)
Mg extraction
(%)
Ni/Fe Ni/Mg
1 60 2 20 30 3
1.5 70 2 35 35 2
2 82 2 50 41 2
3 90 30 62 3 1
5 95 60 82 2 1
Jaguar Nickel claimed that selectivity over Fe is due to lowered water activity combined with
the high solubility of base metal chloride salts. Effectively the brine solution has insufficient

Univers
ity of
Cap
e Tow
n
Results and Discussion Page 49
capacity to hold high levels of ferric Fe in solution, since ferric Fe has the lowest pH of
hydrolysis of the ions present [21].
It can therefore be concluded that the selectivity effects reported by Jaguar Nickel are specific
to the ore studied, rather than generically applicable to saprolytic laterite ores.
4.8 Objective 2: Fundamental Examination
The P-H Model was used to investigate activity effects in the leaching solutions. As described
in Section 3.7.3, density measurements were required for use in the activity model. These
measurements are presented first, followed by the outcomes of the P-H Model and the
validation testwork.
4.8.1. Density measurement
No high temperature measurements for the ternary system H2O-HCl-MgCl2 were found in
literature. Thus, density measurements were made in order to correctly relate solution molality
and molarity for use in the P-H Model. Figure 4-9 shows the results of the density
measurements made in order to obtain an equation to describe the solution density of the
ternary system H2O-HCl-MgCl2 up to 2.5 M HCl or MgCl2. Literature values [73] were used for
water and binary mixtures. Less than 0.5% deviation from literature values for the single-
component mixtures was obtained. Refer to Appendix C.
An equation fit was developed using a curve-fitting programme (Table Curve 2D) to fit the
experimental data obtained. The density (kg/l) can be predicted using Equation 4-1 with
concentrations in molarities and temperature in degrees Celsius:
= (a +b(T-20)1.5 + c[HCl] + d[MgCl2])0.5 Eq. 4-1
where: a = 0.9953
b = -0.0001
c = 0.0341
d = 0.1546
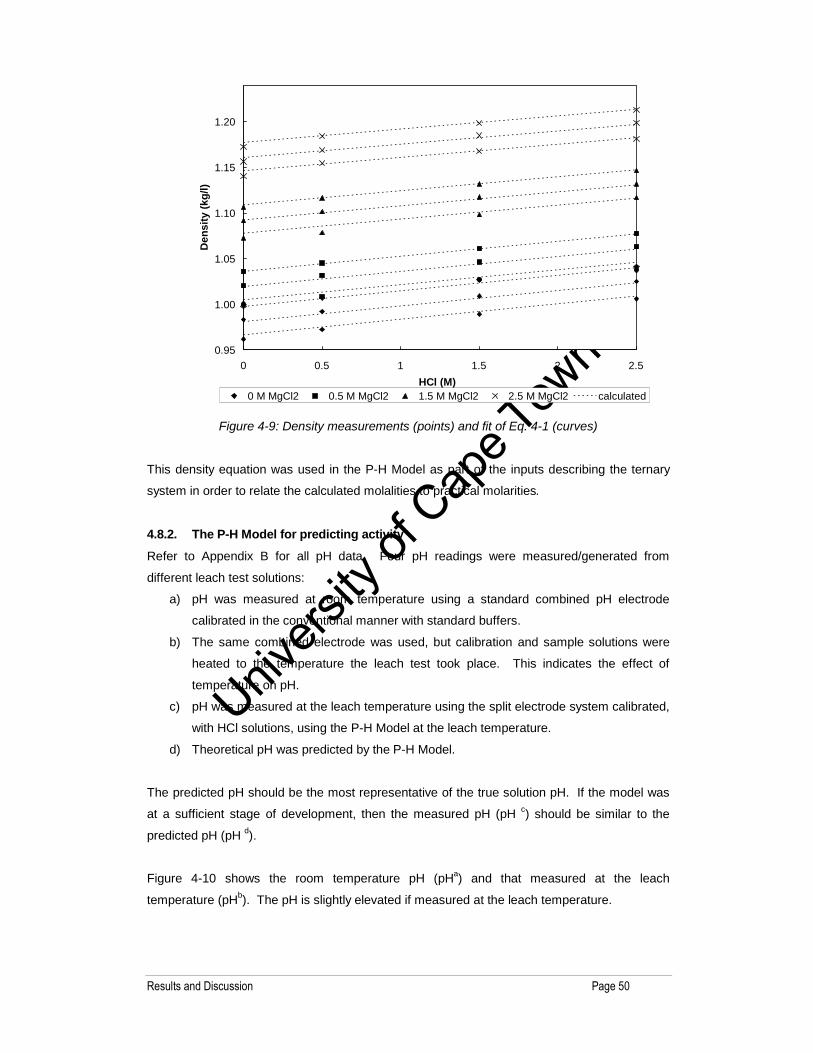
Univers
ity of
Cap
e Tow
n
Results and Discussion Page 50
0.95
1.00
1.05
1.10
1.15
1.20
0 0.5 1 1.5 2 2.5HCl (M)
Den
sity
(kg/
l)
0 M MgCl2 0.5 M MgCl2 1.5 M MgCl2 2.5 M MgCl2 calculated
Figure 4-9: Density measurements (points) and fit of Eq. 4-1 (curves)
This density equation was used in the P-H Model as part of the inputs describing the ternary
system in order to relate the calculated molalities to practical molarities.
4.8.2. The P-H Model for predicting activity
Refer to Appendix B for all pH data. Four pH readings were measured/generated from
different leach test solutions:
a) pH was measured at room temperature using a standard combined pH electrode
calibrated in the conventional manner with standard buffers.
b) The same combined electrode was used, but calibration and sample solutions were
heated to the temperature the leach test took place. This indicates the effect of
temperature on pH.
c) pH was measured at the leach temperature using the split electrode system calibrated,
with HCl solutions, using the P-H Model at the leach temperature.
d) Theoretical pH was predicted by the P-H Model.
The predicted pH should be the most representative of the true solution pH. If the model was
at a sufficient stage of development, then the measured pH (pH c) should be similar to the
predicted pH (pH d).
Figure 4-10 shows the room temperature pH (pHa) and that measured at the leach
temperature (pHb). The pH is slightly elevated if measured at the leach temperature.

Univers
ity of
Cap
e Tow
n
Results and Discussion Page 51
-1.5
-1.0
-0.5
0.0
0.5
1.0
1.5
-1.5 -1.0 -0.5 0.0 0.5 1.0 1.5pHa (20°C)
pHb (l
each
tem
pera
ture
)
Figure 4-10: Standard pH measurements at different temperatures
a – combined electrode, standard buffers, 20°C
b – combined electrode, standard buffers, at temperature
Figure 4-11 shows the measured (pHc) and predicted (pHd) pH. The points where there is
good agreement between measured and predicted pH correspond to solutions which had no
MgCl2 present. This means the P-H Model predictions for the ternary system need to be
refined, but that the binary system is well described. Thus, single-ion activity predictions could
not be used with a high level of confidence. Mean HCl activity can be predicted with more
confidence as no extra-thermodynamic assumptions are required and these data were used in
lieu of single ion data.
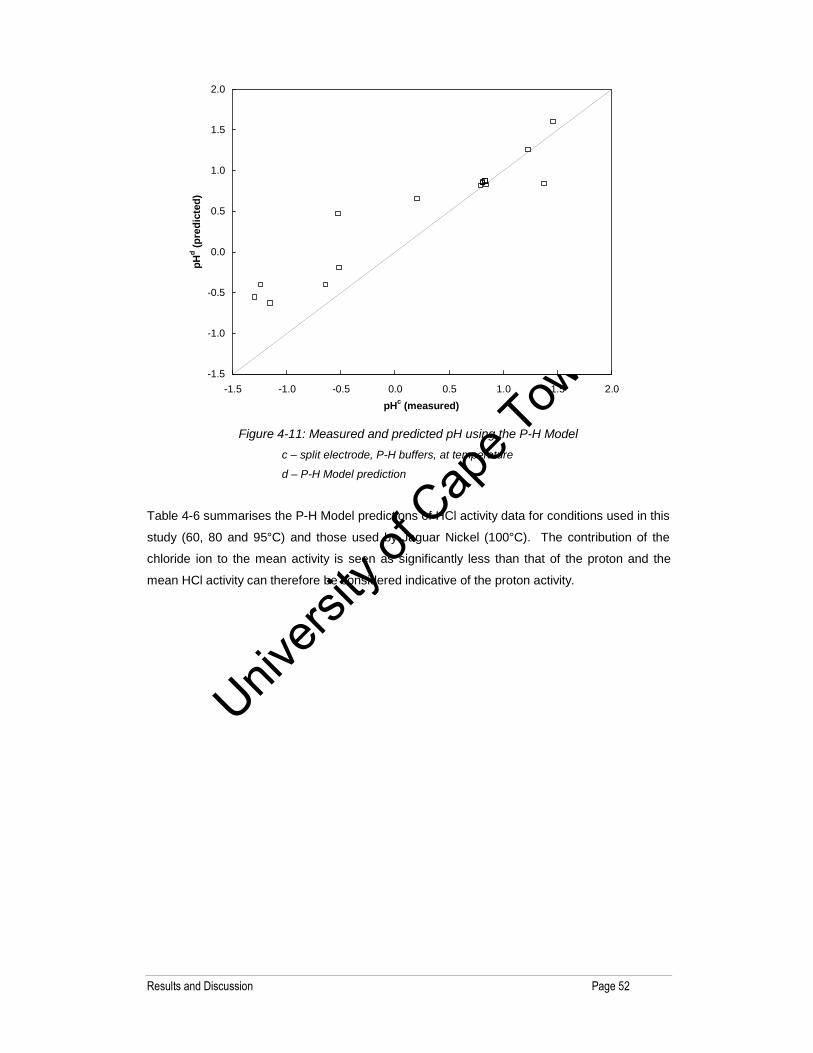
Univers
ity of
Cap
e Tow
n
Results and Discussion Page 52
-1.5
-1.0
-0.5
0.0
0.5
1.0
1.5
2.0
-1.5 -1.0 -0.5 0.0 0.5 1.0 1.5 2.0pHc (measured)
pHd (p
redi
cted
)
Figure 4-11: Measured and predicted pH using the P-H Model
c – split electrode, P-H buffers, at temperature
d – P-H Model prediction
Table 4-6 summarises the P-H Model predictions of HCl activity data for conditions used in this
study (60, 80 and 95°C) and those used by Jaguar Nickel (100°C). The contribution of the
chloride ion to the mean activity is seen as significantly less than that of the proton and the
mean HCl activity can therefore be considered indicative of the proton activity.

Univers
ity of
Cap
e Tow
n
Results and Discussion Page 53
Table 4-6: HCl activity predicted by the P-H Model
Temperature
(°C)
HCl
(M)
MgCl2
(M)
Stoichiometric mean
activity coefficient
60 0.20 0 0.74
80 0.20 0 0.73
80 0.20 2.0 3.40
80 0.20 3.1 9.49
80 1.0 0 0.72
80 1.0 1.6 2.81
80 1.0 2.7 7.83
80 1.5 0 0.77
80 1.5 1.4 2.49
80 1.5 2.5 6.94
95 0.2 0 0.71
100 1.0 2.7 5.21
100 1.5 2.5 4.70
100 2.0 2.2 4.24
100 3.0 1.7 3.46
100 5.0 0.7 2.28
Figure 4-12 shows the predictions of mean activity coefficients for HCl by the P-H Model (Table
4-6) graphically. The effect of HCl concentration, MgCl2 concentration and temperature on HCl
activity can be seen. There were five tests where no MgCl2 was added. These have data
labels of “0” and three of the tests at 0.2 M HCl, but different temperatures, fall on the same
point. Where no MgCl2 was added, the acid concentration was slightly less than the acid
activity as predicted by the P-H Model and shown in Figure 4-12. Using 0.2 M HCl, the effect
of increasing MgCl2 to 2 and then 3.1 M can be seen on the increasing HCl activity. Effectively,
a ‘stronger’ acid results on addition of 3.1 M MgCl2 to 0.2 M HCl than by using 1.5 M HCl. The
same is seen at higher HCl concentrations. As acid strength is increased, lower
concentrations of MgCl2 are required to effect the same increase in acid activity. Where
Jaguar Nickel used the same conditions as used in this study, the P-H predicted acid activities
are lower due to the effect of higher temperatures (100°C) used in the Jaguar Process.
All these effects are as predicted by theory, illustrated in Figure 1-2 and Figure 2-1.

Univers
ity of
Cap
e Tow
n
Results and Discussion Page 54
2.7
2.5
1.4
1.6
3.1
2.00
0
0
0.7
1.7
2.2
2.5
2.7
0
2
4
6
8
10
12
0 1 2 3 4 5 6HCl concentration (mol/l)
HC
l act
ivity
This study (80 ºC)Jaguar Nickel (100 ºC)
Unity line
Figure 4-12: Mean HCl activity at various conditions as predicted by the P-H Model (Data
labels show MgCl2 molar concentration)
Figure 4-13 shows selectivity ratio data from this study and those from Jaguar Nickel as a
function of the HCl activity. In both cases there appears to be no relationship between
increasing HCl activity and selectivity for Ni over either Fe or Mg.
0
1
2
3
4
5
6
7
0 2 4 6 8 10 12HCl activity
Sele
ctiv
ity ra
tio -
this
stu
dy
0
5
10
15
20
25
30
35
40
45
Sele
ctiv
ity ra
tio -
Jagu
ar
Ni/FeNi/MgJaguar Ni/MgJaguar Ni/Fe
Figure 4-13: Selectivity ratios as a function of HCl activity

Univers
ity of
Cap
e Tow
n
Results and Discussion Page 55
4.8.3. Mineralogical observations
Appendix D contains the mineralogical analyses. As shown in Table 3-1, the Barro Alto laterite
sample used in this study consisted mainly of serpentine/altered serpentine
[(Mg,Fe)3Si2O5(OH)4] at 74 wt.% and Fe-hydroxides [FeO(OH)±FeO(OH).xH2O] at 8 wt.%.
The semi-quantitative EDS point mineral analyses identified the mineral phases that host Ni
and the mean concentration of the Ni in each of these Ni-containing phases [76].
Table 4-7: Ni distribution in Barro Alto WTO acido laterite
Mineral Phases Mean Ni Concentration
wt.%
Ni Distribution
%
Serpentine/altered serpentine 1.65 72.6
Fe-hydroxides 2.00 9.5
Clay 2.25 5.5
Olivine 0.40 0.2
Mn-hydroxide 12.95 3.1
Other n.a. 9.1
Total 100.0
Table 4-7 shows that most of the nickel is hosted by the serpentine/altered serpentine phase,
but the Ni hosted in the Fe-hydroxide phase is present in slightly higher concentrations. The
minor Mn-hydroxide phase has significant enrichment of Ni.
The same semi-quantitative EDS point mineral analysis was done on selected leach test
residues focusing on the change in the two main mineral phases. Table 4-8 summarises the
mean Ni content in the phases after 10 min of leaching. The serpentine/altered serpentine
phase was identified as Mg-silicates after leaching. The average head grade of Ni was 1.68%.
Due to the lower abundance of Fe-hydroxides, the leaching of this phase led to insignificant
remaining points to determine mean Ni accurately and in some cases the phase was
completely destroyed.
Table 4-8: Destruction of the main mineral phases during leaching
Test Mean Ni content in
serpentine
after 10 min leach
% decrease Mean Ni content in
Fe-hydroxides
after 10 min leach
% decrease
10a 0.54 68 1.26 37
11a 0.34 80 0.80 60
14a 0.53 68 – –
15a 0.32 81 0.66 67
16a 0.18 89 – –

Univers
ity of
Cap
e Tow
n
Results and Discussion Page 56
There are too few data to accurately determine if the serpentine phase is preferentially leached
than the Fe-hydroxide phase, but after 10 min of leaching, the serpentine phase appears to be
more depleted of Ni than the Fe-hydroxide phase as shown by the % decrease in average Ni
content.
Quantitative Electron Microscopy Scan (QEMSCAN) analyses on three kinetic samples from
two tests showed the changes in mineral abundance. Interpretation of the data is complicated
due to the variety of leach products generated and the variety of laterisation in the head
sample. Figure 4-14 shows the serpentine phase being destroyed during leaching, but the Fe-
hydroxide phase remaining at constant abundance during the first 30 min of leaching in these
two tests. If this phase is being destroyed, other leached material may be appearing as Fe-
hydroxides resulting in an apparent constant abundance.
0
10
20
30
40
50
60
70
80
head 10 min 20min 30min
Min
eral
abu
ndan
ce (%
)
Test 10 Serpentine Test 16 SerpentineTest 10 Fe-hydroxides Test 16 Fe-hydroxides
Figure 4-14: Decrease in the main mineral phases during leaching
When investigating sulfuric acid pressure leaching of laterites, Rubisov et al. [54] investigated
blends of limonitic and saprolytic laterite ores. The saprolytic phase (mainly Mg minerals)
dissolved very quickly in sulfuric acid while the limonitic phase (mainly Fe minerals) leached
slower. In the kinetic modelling, instantaneous dissolution of the Ni associated with the Mg
was assumed, followed by dissolution of Ni associated with the Fe (goethite).
4.8.4. Preliminary kinetic modelling
The data from Tests 10-19 were used for this preliminary kinetic study as these tests were
performed under the most controlled conditions using 0.5% solids’ concentration and solids’
analyses were used for kinetic information. The effect of each parameter was investigated in

Univers
ity of
Cap
e Tow
n
Results and Discussion Page 57
turn and a simple empirical model was developed to describe the initial rate (0-20 min) of Ni
leaching.
Effect of acid concentration
Tests 10, 11 and 13 show the effect of increased acid concentration and the extraction curves
are presented in Figure 4-15.
0
10
20
30
40
50
60
70
80
90
100
0 20 40 60 80 100 120 140
Time (min)
Ni e
xtra
ctio
n (%
)
1.5 M1.0 M0.2 M
Figure 4-15: Effect of H+ concentration on Ni extraction
D90 40 % solids 0.5 Temp. 80°C [MgCl2] 0
Figure 4-16 shows a graphical fit of the shrinking core model for a) reaction controlling (also for
shrinking particle) and b) pore diffusion controlling scenarios. These models are not
representative of the system and this is expected due to the non-uniformity of both the
minerals and the particle sizes. However, some investigators have used shrinking core models
to explain laterite leaching data as reviewed in Section 2.4.3. In these cases the ore type was
limonitic which is more homogeneous and slower to leach. In this study the initial rate of Ni
leaching is fast.
Shrinking core models have been used extensively with much success in leaching systems.
However, there is no way to specifically predict the rate-controlling regime of a given system.
Pore diffusion and the nature of electrolytes and complex formation are being shown to
influence the application of the shrinking core models thus more studies are focussing on the
role of these [72].
Although some effort was taken to prepare a sample of as narrow a particle size range as
possible, the distribution of particle size was wide (Figure 3-1). Thus the shrinking particle

Univers
ity of
Cap
e Tow
n
Results and Discussion Page 58
model, which was developed for particles of a single size (either small or large), can not be
applied. Integration over all particle sizes would be necessary, but was beyond the scope of
this study.
0
0.1
0.2
0.3
0.4
0.5
0.6
0.7
0.8
0.9
1
0 20 40 60 80 100 120 140Time (min)
1-(1
-X)^
1/3
1.5 M 1.0 M 0.2 M
0
0.1
0.2
0.3
0.4
0.5
0.6
0.7
0.8
0.9
1
0 20 40 60 80 100 120 140Time (min)
1-3(
1-X)
^2/3
+2(1
-X)
1.5 M 1.0 M 0.2 M
a) Chemical reaction controls b) Pore diffusion controls
Figure 4-16: Shrinking core and particle models fitted to data showing effect of HCl
concentration
A similar change in slope after 30 min of leaching was seen by Das et al. [42] after 2 h of
leaching. The higher deviation from shrinking core kinetics was explained as being due to an
increasingly significant decrease in excess acid.
In order to model the initial rate (0-20 min) of Ni leaching, the differential approach was used
as discussed in Section 2.4.2. Appendix E contains tables of the kinetic calculation data. The
initial rate sharply differs from the rate measured from 20 min onwards in all leach tests. This
is likely to correspond to the initial leaching of easily-available nickel loosely bound in the lattice
and subsequent slower leaching of the other mineral phases. The kinetic parameters were
established from a plot of ln [H+] vs. ln [initial rate], shown in Figure 4-17.
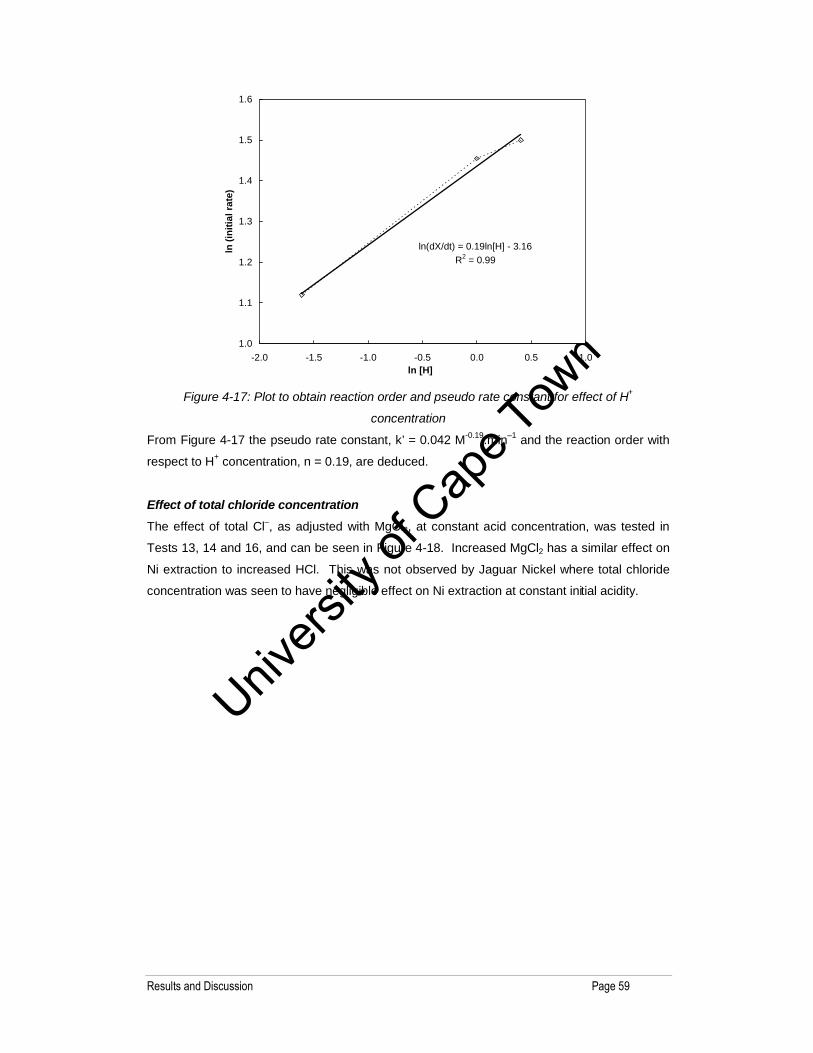
Univers
ity of
Cap
e Tow
n
Results and Discussion Page 59
ln(dX/dt) = 0.19ln[H] - 3.16R2 = 0.99
1.0
1.1
1.2
1.3
1.4
1.5
1.6
-2.0 -1.5 -1.0 -0.5 0.0 0.5 1.0ln [H]
ln (i
nitia
l rat
e)
Figure 4-17: Plot to obtain reaction order and pseudo rate constant for effect of H+
concentration
From Figure 4-17 the pseudo rate constant, k’ = 0.042 M-0.19.min–1 and the reaction order with
respect to H+ concentration, n = 0.19, are deduced.
Effect of total chloride concentration
The effect of total Cl–, as adjusted with MgCl2, at constant acid concentration, was tested in
Tests 13, 14 and 16, and can be seen in Figure 4-18. Increased MgCl2 has a similar effect on
Ni extraction to increased HCl. This was not observed by Jaguar Nickel where total chloride
concentration was seen to have negligible effect on Ni extraction at constant initial acidity.

Univers
ity of
Cap
e Tow
n
Results and Discussion Page 60
0
10
20
30
40
50
60
70
80
90
100
0 20 40 60 80 100 120 140
Time (min)
Ni e
xtra
ctio
n (%
)
230 g/l150 g/l7 g/l
Figure 4-18: Effect of total Cl– concentration on Ni extraction
D90 40 % solids 0.5 Temp. 80°C [HCl] 0.2 M
As above, Figure 4-19 was used to obtain the kinetic parameters for the effect of chloride
concentration on the initial rate of Ni leaching.
ln(dX/dt) = 0.12ln[Cl] - 3.3R2 = 0.98
1.0
1.1
1.2
1.3
1.4
1.5
1.6
-2.0 -1.5 -1.0 -0.5 0.0 0.5 1.0 1.5 2.0ln [Cl]
ln (i
nitia
l rat
e)
Figure 4-19: Plot to obtain reaction order and pseudo rate constant for effect of Cl–
concentration
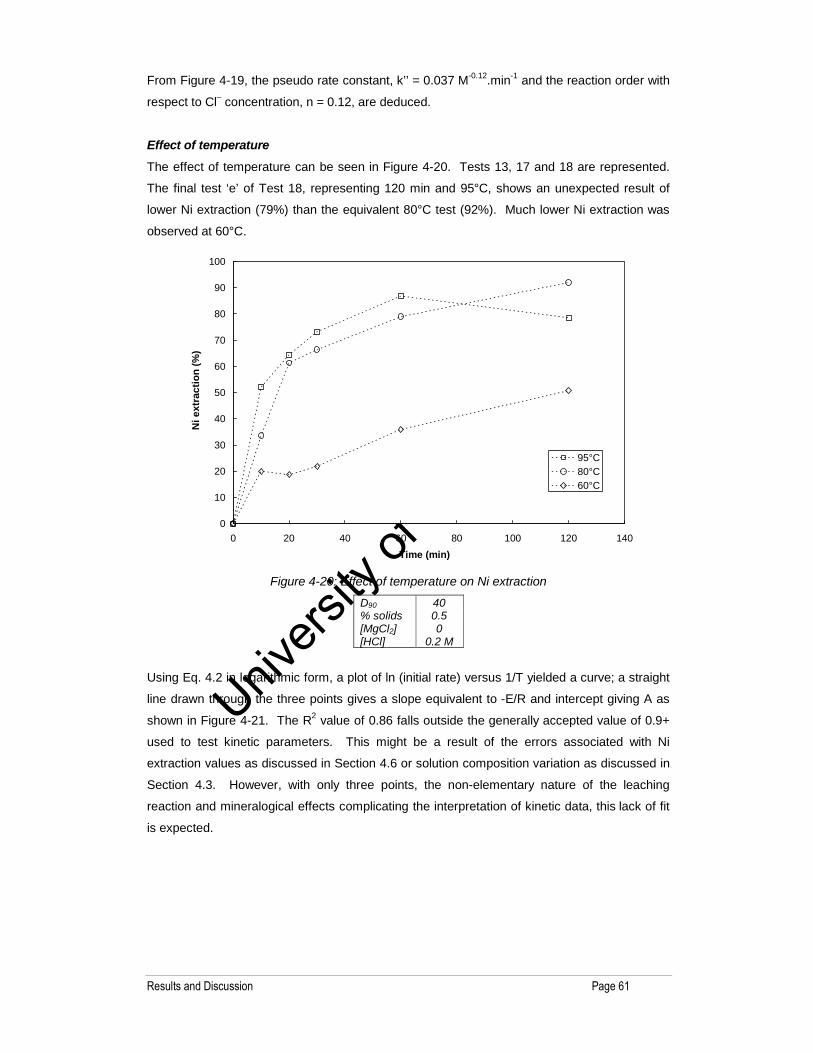
Univers
ity of
Cap
e Tow
n
Results and Discussion Page 61
From Figure 4-19, the pseudo rate constant, k’’ = 0.037 M-0.12.min-1 and the reaction order with
respect to Cl– concentration, n = 0.12, are deduced.
Effect of temperature
The effect of temperature can be seen in Figure 4-20. Tests 13, 17 and 18 are represented.
The final test ‘e’ of Test 18, representing 120 min and 95°C, shows an unexpected result of
lower Ni extraction (79%) than the equivalent 80°C test (92%). Much lower Ni extraction was
observed at 60°C.
0
10
20
30
40
50
60
70
80
90
100
0 20 40 60 80 100 120 140Time (min)
Ni e
xtra
ctio
n (%
)
95°C80°C60°C
Figure 4-20: Effect of temperature on Ni extraction
D90 40 % solids 0.5 [MgCl2] 0 [HCl] 0.2 M
Using Eq. 4.2 in logarithmic form, a plot of ln (initial rate) versus 1/T yielded a curve; a straight
line drawn through the three points gives a slope equivalent to -E/R and intercept giving A as
shown in Figure 4-21. The R2 value of 0.86 falls outside the generally accepted value of 0.9+
used to test kinetic parameters. This might be a result of the errors associated with Ni
extraction values as discussed in Section 4.6 or solution composition variation as discussed in
Section 4.3. However, with only three points, the non-elementary nature of the leaching
reaction and mineralogical effects complicating the interpretation of kinetic data, this lack of fit
is expected.

Univers
ity of
Cap
e Tow
n
Results and Discussion Page 62
ln(dX/dt) = -4548(1/T) + 9.10R2 = 0.86
-0.2
0.0
0.2
0.4
0.6
0.8
1.0
1.2
1.4
1.6
0.0027 0.0028 0.0028 0.0029 0.0029 0.0030 0.0030 0.00311/T
ln (i
nitia
l rat
e)
Figure 4-21: Plot to obtain Arrhenius parameters
The value obtained for E of 38 kJ/mol can not be used to indicate possible rate-determining
steps given the mineralogical observations that the Ni is contained in more than one mineral
phase likely with differing reactivities.
As the temperature increases, reaction mechanisms commonly move from the chemical
controlled region into the mixed region and ultimately into an entirely mass transfer controlled
region [65]. More data points would indicate if this is the case for this study, however such
detail is beyond the scope of this preliminary kinetic study.
Effect of solids’ concentration
Comparing tests where the only variable was the solids’ concentration, it can be seen that
increasing solids’ concentration decreases Ni extraction. The effect was seen at two different
temperatures: 95°C (Table 4-9) and 80°C (Table 4-10). This would be due to the consumption
of reagent (HCl) and leaching is seen to be suppressed due to the reagent running out. One
difference between the tests is the leaching time – this was longer for tests at higher solids’
concentrations. This is not seen as a problem as the longer leaching time was insignificant
compared to the effect of limited reagent, and still resulted in decreased leaching.
Table 4-9: Effect of solids’ concentration of Sample A at 95°C, 0.2 M HCl, 0 M MgCl2
Test 18 1 3
0.5% solids 2% solids 5% solids
Ni extraction (%) 79 71 51

Univers
ity of
Cap
e Tow
n
Results and Discussion Page 63
Table 4-10: Effect of solids’ concentration of Sample A at 80°C, 0.2 M HCl, 0 M MgCl2
Test 13 2
0.5% solids 2% solids
Ni extraction (%) 92 73
This result highlights the importance of conducting experiments under constant solution
conditions in order to obtain correct information. Decreased leaching in other systems has
before been misinterpreted as caused by particle surface passivation when in fact it is a result
of the depletion of the lixiviant.
As mentioned above the Ni extraction after 120 min at 95°C is unexpectedly low and following
the trend of the shorter tests conducted at 95°C, should be around 90%, and not 80% (See
Figure 4-20). Thus the extraction using 0.5% solids can be regarded as the same, namely
90%, at both temperatures.
Effect of particle size
The difference in Ni extraction between using Sample A (Test 19) and Sample B (Test 13) is
shown in Figure 4-22. A 19% increase in ultimate Ni extraction is observed at the finer particle
size. This indicates that a larger particle surface area increases extraction and the leaching
may be affected by mass transport in solution, however there are not enough data to
conclusively demonstrate this. The finer grind may have exposed certain mineral species that
led to increased Ni leaching.
0
10
20
30
40
50
60
70
80
90
100
0 20 40 60 80 100 120 140Time (min)
Ni e
xtra
ctio
n (%
)
42 μm106 μm
Figure 4-22: Effect of particle size on Ni extraction
% solids 0.5 temp. 80°C [HCl] 0.2 M [MgCl2] 0
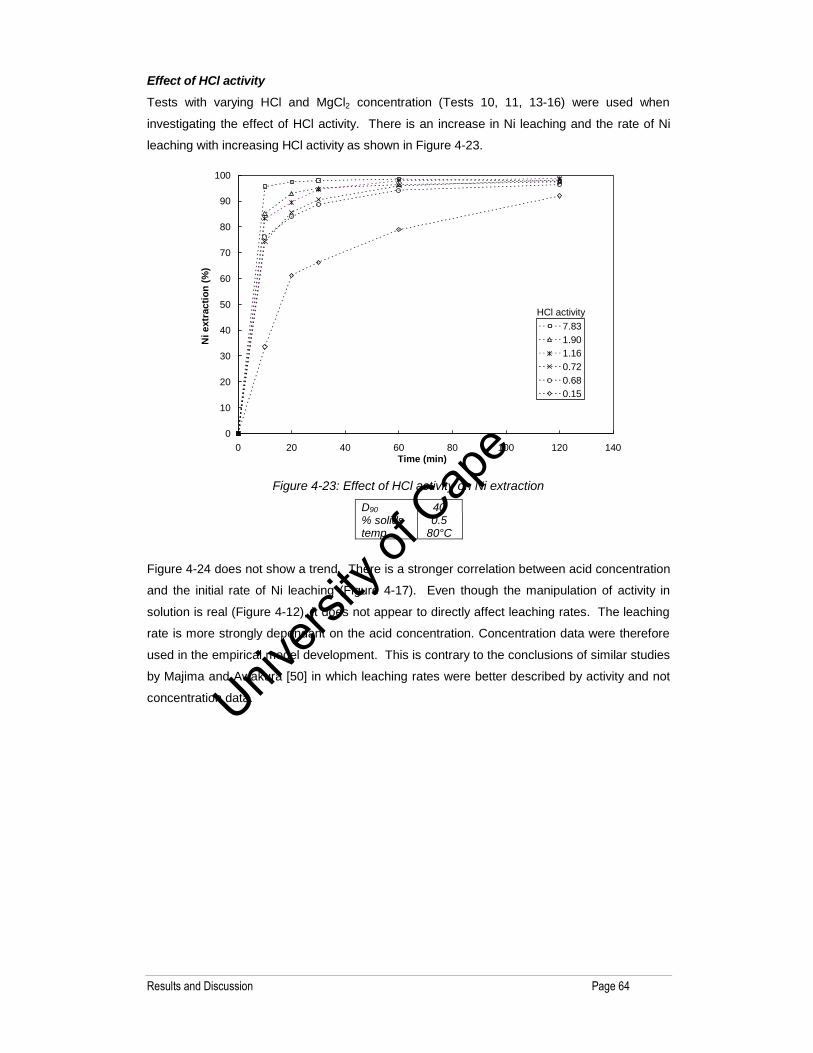
Univers
ity of
Cap
e Tow
n
Results and Discussion Page 64
Effect of HCl activity
Tests with varying HCl and MgCl2 concentration (Tests 10, 11, 13-16) were used when
investigating the effect of HCl activity. There is an increase in Ni leaching and the rate of Ni
leaching with increasing HCl activity as shown in Figure 4-23.
0
10
20
30
40
50
60
70
80
90
100
0 20 40 60 80 100 120 140Time (min)
Ni e
xtra
ctio
n (%
)
7.831.901.160.720.680.15
HCl activity
Figure 4-23: Effect of HCl activity on Ni extraction
D90 40 % solids 0.5 temp. 80°C
Figure 4-24 does not show a trend. There is a stronger correlation between acid concentration
and the initial rate of Ni leaching (Figure 4-17). Even though the manipulation of activity in
solution is real (Figure 4-12), it does not appear to directly affect leaching rates. The leaching
rate is more strongly dependant on the acid concentration. Concentration data were therefore
used in the empirical model development. This is contrary to the conclusions of similar studies
by Majima and Awakura [50] in which leaching rates were better described by activity and not
concentration data.
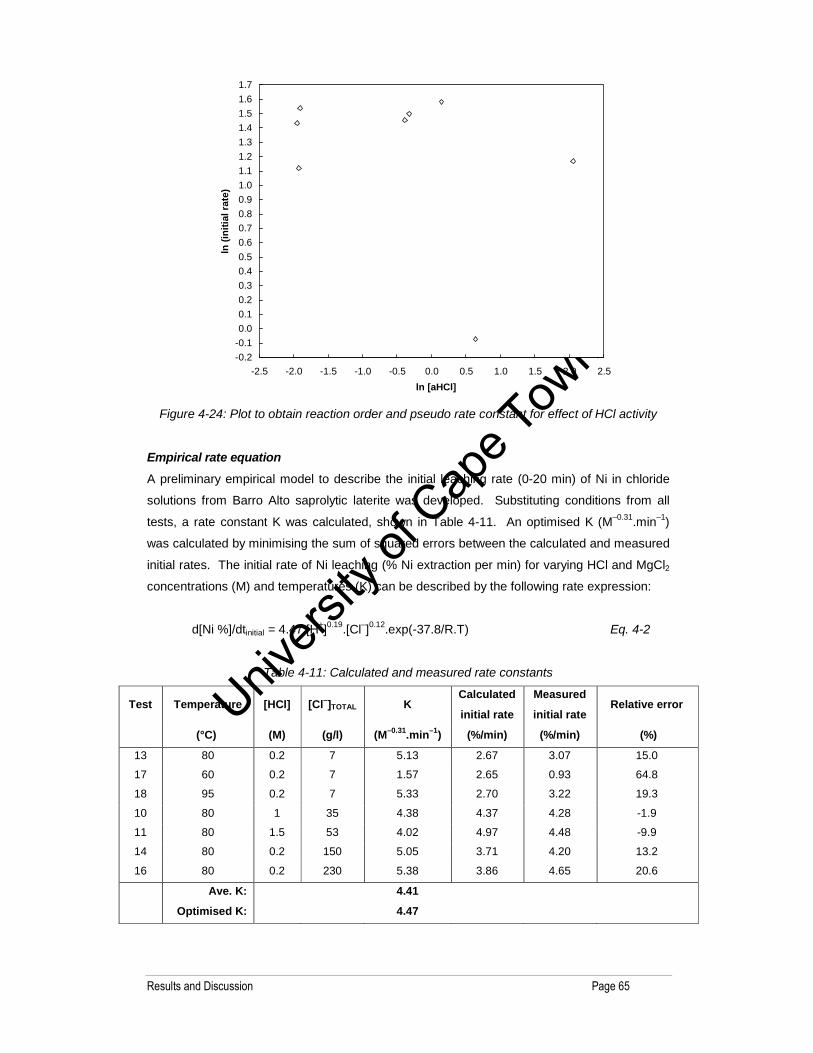
Univers
ity of
Cap
e Tow
n
Results and Discussion Page 65
-0.2-0.10.00.10.20.30.40.50.60.70.80.91.01.11.21.31.41.51.61.7
-2.5 -2.0 -1.5 -1.0 -0.5 0.0 0.5 1.0 1.5 2.0 2.5ln [aHCl]
ln (i
nitia
l rat
e)
Figure 4-24: Plot to obtain reaction order and pseudo rate constant for effect of HCl activity
Empirical rate equation
A preliminary empirical model to describe the initial leaching rate (0-20 min) of Ni in chloride
solutions from Barro Alto saprolytic laterite was developed. Substituting conditions from all
tests, a rate constant K was calculated, shown in Table 4-11. An optimised K (M–0.31.min–1)
was calculated by minimising the sum of squared errors between the calculated and measured
initial rates. The initial rate of Ni leaching (% Ni extraction per min) for varying HCl and MgCl2
concentrations (M) and temperatures (K) can be described by the following rate expression:
d[Ni %]/dtinitial = 4.47.[H+]0.19.[Cl–]0.12.exp(-37.8/R.T) Eq. 4-2
Table 4-11: Calculated and measured rate constants
Test Temperature [HCl] [Cl–]TOTAL K Calculated
initial rate
Measured
initial rate Relative error
(°C) (M) (g/l) (M–0.31.min–1) (%/min) (%/min) (%)
13 80 0.2 7 5.13 2.67 3.07 15.0
17 60 0.2 7 1.57 2.65 0.93 64.8
18 95 0.2 7 5.33 2.70 3.22 19.3
10 80 1 35 4.38 4.37 4.28 -1.9
11 80 1.5 53 4.02 4.97 4.48 -9.9
14 80 0.2 150 5.05 3.71 4.20 13.2
16 80 0.2 230 5.38 3.86 4.65 20.6
Ave. K: 4.41
Optimised K: 4.47
Univers
ity of
Cap
e Tow
n
Results and Discussion Page 66
It is clear that Test 17 (60°C, 0.2 M HCl) is governed by a different mechanism to the other
tests as the rate constant of 1.6 is very different from the average of 4.4. Figure 4-20 shows a
large difference in Ni leaching at 60°C compared to that at 80 and 95°C.
Considering Test 15, which was not used in the development of the rate expression, the
measured initial rate was 4.87%Ni/min. Using Equation 4-2, the calculated initial rate is
5.32%Ni/min (a relative error of 9%) and rate constant 4.04 M–0.31.min–1. This is considered
acceptable.
In this study, the calculated initial rate does not necessarily represent an accurate leaching rate
as the leaching is very fast with close to 90% Ni conversion achieved within 10 min in some
cases.

Univers
ity of
Cap
e Tow
n
Conclusions and Recommendations Page 67
5.0 Conclusions and Recommendations
5.1 Objective 1: Leaching Selectivity
The leach tests performed using the Jaguar Process conditions showed no appreciable
selectivity for nickel leaching over magnesium or iron leaching at economical nickel
recoveries. The Jaguar Process selectivity was thus not repeatable on the ore tested. The
selectivity seen by Jaguar Nickel may have been a result of the unique mineralogy of the
laterite body to be exploited. The Jaguar Nickel ore is geologically immature and Ni may
have been contained in minerals which broke down more easily than the main Fe and Mg-
bearing minerals.
It is concluded that in order to achieve selective leaching, the laterite mineralogy must be
investigated in conjunction with the manipulated solution conditions.
It is possible that the MgCl2 background in this study leads to total chloride levels that are
high enough to ensure Fe will form FeCl4–, thus not limiting Fe leaching as suggested by
Jaguar Nickel, and that this level of Mg does not saturate the solution enough (and is not
enough to result in a common ion effect) to sufficiently decrease the water activity to limit
Mg leaching.
Due to the difficulties with solution analyses in the high brine conditions, more repeatability
tests are recommended to firmly establish the confidence limits of Ni extraction.
5.2 Objective 2: Fundamental Examination
A better understanding of the system was achieved. The solution chemistry effects outlined
by Jaguar Nickel are real and confirmed by other investigators. However, the many
differences in results from this study and of the Jaguar Nickel study reinforce that laterite
leaching is complex and highly dependent on ore mineralogy. Direct comparisons between
leaching conditions on different ores is difficult.
5.2.1. Solution thermodynamics
The P-H Model was still in a developmental stage and the activity data used were seen as
provisional until model validation had taken place. The single-ion activities could not be
used, but mean HCl activity data from the P-H Model were used. The activity data trends
were consistent with theory. However, the HCl activity did not appear to affect leaching
selectivity or initial leaching rates as strongly as HCl concentration.
Univers
ity of
Cap
e Tow
n
Conclusions and Recommendations Page 68
The P-H Model has since been developed and validated using vapour pressure as well as
pH measurements to regress the mixing parameters of the HCl-MgCl2-H2O system.
Densities in the ternary system are now predicted using OLI Stream Analyser software. It is
recommended that further work make use of the improved model.
5.2.2. Laterite mineralogy
Mineralogical analyses indicated different leaching rates of the main mineral phases. Ni
contained in the serpentine mineral phase appears to leach more quickly than the Ni
contained in the Fe-hydroxide mineral phase. This is expected as the serpentine mineral is
less weathered than the Fe-hydroxide minerals. In addition, the main serpentine phase is
not uniform and consists of serpentine and altered serpentine, which would display differing
reactivities. It is important to note that many leach residue products are formed and
identified through quantitative mineral abundance investigations; it is difficult to distinguish
between original laterised material and newly-destroyed minerals. Mineralogical studies are
very useful and key to understanding leaching behaviour.
Mineralogical studies should remain a focus area.
5.2.3. Leaching kinetics
Initial leaching rates were very fast and leaching was not well described by shrinking core or
particle models. An empirical model was developed. The leaching kinetics appeared to be
influenced by temperature (K), HCl (M) and MgCl2 (M) concentrations in the following
manner (Equation 4-2):
initial rate (% Ni extraction/min) = 4.47(M–0.31.min–1).[H+]0.19[Cl–]0.12exp(-37.8/RT)
There is an indication that, contrary to published work on other oxides, Ni extraction kinetics
obtained in this study appear to be dependent on the HCl concentration and not on the HCl
activity.
In further work, more tests should be done to establish confidence in the kinetic study.
More than three variations of each parameter are necessary. One method should be used
for further leach tests for easier interpretation. Tests using 0.5% solids’ concentration
should be used in order to obtain the most accurate kinetic data.
The nickel leaching rate from the Barro Alto saprolytic-type ore used in this study was fast.
It is recommended that a slower-leaching ore be used in further work to better establish
factors affecting initial leaching rates. Due to the fast-leaching nature of the ore, the initial
rates were essentially the same and the establishment of a kinetic rate expression was
difficult. Alternatively, further studies should exclude evaluating the initial rate as its
relevance is questionable. An immediately leachable fraction could be established and
Univers
ity of
Cap
e Tow
n
Conclusions and Recommendations Page 69
subsequent leaching kinetics could be considered. Ideally, isolation of the mineral phases
and particles sizes would enable a more meaningful study.

Univers
ity of
Cap
e Tow
n
References Page 70
6.0 References
1. International Nickel Study Group, Nickel: Mining Annual Review 2003, Mining
Communications Ltd, 2003, p. 1.
2. Cutifani, M., Hall, S. and Upton, D. The Nickel Industry – A WMC Perspective,
Nickel ’96 Conference Proceedings, Kalgoorlie, 27-29 Nov 1996, pp. 3-9.
3. Reid, J. G., Queensland Nickel – Value Added Products from Technological
Advances, Proc. Australasian Institute of Mining and Metallurgy, vol. 300, no. 2, Dec
1995, pp. 53-57.
4. Berezowsky, R. M., Laterite – New Life of Limonites? Nickel: 1996 Commodity
Meeting, edited presentations, Minerals Industry International, Jan 1997, pp. 48-55.
5. Mihaylov, I., Krause, E., Colton, D. F., Okita, Y., Duterque, J.-P. and Perraud, J.-J.,
The Development of a Novel Hydrometallurgical Process for Nickel and Cobalt
Recovery from Goro Laterite Ore, CIM Bulletin, vol. 93, no. 1041, Jun 2000, pp.
124-130.
6. Reid, J. G., Laterite Ores – Nickel and Cobalt Resources for the Future, Grimsey E.
J. et al., (editors), Nickel '96: Mineral to Market, Kalgoorlie, Western Australia, 27-
29 Nov 1996, Carlton, Victoria: Australasian Institute of Mining and Metallurgy,
1996, pp. 11-16.
7. Boldt, J. R. Jr. and Queneau, P., The Winning of Nickel, Methuen & Co., Ltd., 1967,
pp. 10-13, 387-389.
8. Monhemius, A. J., Treatment of Laterite Ores of Nickel to Produce Ferronickel,
Matte or Precipitated Sulfide, Burkin, A. R. (editor), Extractive Metallurgy of Nickel,
John Wiley & Sons, 1987, pp. 51-75.
9. Canterford, J. H., The Treatment of Nickeliferous Laterites, Minerals Science
Engineering, vol. 7, no. 1, Jan 1975, pp. 3-17.
10. Van Weert, G. and Peek, E. M. L., Reagent Recovery in Chloride Hydrometallurgy –
Some Missing Links, Hydrometallurgy, vol. 29, 1992, pp. 513-526.
Univers
ity of
Cap
e Tow
n
References Page 71
11. Golightly, J. P., Nickeliferous Laterites: A General Description, Evans D. J. I.,
Shoemaker R. S. and Veltman H. (editors), International Laterite Symposium, New
Orleans, Louisiana, 19-21 Feb. 1979, New York: SME of AIME, 1979. pp. 3-23.
12. Burger, P. A., Origins and Characteristics of Lateritic Nickel Deposits, Grimsey E. J.
et al., (editors), Nickel '96: Mineral to Market, Kalgoorlie, Western Australia, 27-29
Nov 1996, Carlton, Victoria: Australasian Institute of Mining and Metallurgy, 1996,
pp. 179-183.
13. Goeller, L. A., Low, C. D. and Gale, D. C., The Recovery of Cobalt from Lateritic
Ore, International Conference on Cobalt: Metallurgy and Uses, Brussels, 10-13 Nov
1981, Proceedings: Vol. 1, ATB Metall. special issue, 1981, pp. 85-104.
14. Canterford, J. H., Mineralogical Aspects of the Extractive Metallurgy of Nickeliferous
Laterites, The Australasian Institute of Mining and Metallurgy Conference,
Australasian Institute of Mining and Metallurgy, Parkville,1978. (Australasian IMM
conference series, no. 7.), pp. 361-370.
15. Muir, D. M., Basic Principles of Chloride Hydrometallurgy, Peek, E. and Van Weert,
G. (editors), Chloride Metallurgy 2002, Vol. II, 32nd Annual CIM Hydrometallurgy
Meeting, CIM, Montreal, 2002, pp. 759-791.
16. Nicol, M. J., Paul, R. L., Fleming, C. A. and Coetzee C. F., Chloride
Hydrometallurgy – a Literature Survey, Mintek Confidential Communication C51M,
1982, pp. 3-23.
17. Jansz, J. J. C., Estimation of Ionic Activities in Chloride Systems at Ambient and
Elevated Temperatures, Hydrometallurgy, vol. 11, no.1, 1983, pp. 13-31.
18. Pitzer, K. S., Thermodynamics of Aqueous Electrolytes at Various Temperatures,
Pressures, and Compositions, Newman, S. N. (editor), Thermodynamics of
Aqueous Systems with Industrial Applications, ACS Symposium Series 133,
American Chemical Society, Washington, D.C., 1980, pp. 451-466.
19. Meissner, H.P., Prediction of Activity Coefficients of Strong Electrolytes in Aqueous
Systems, Newman, S. N. (editor), Thermodynamics of Aqueous Systems with
Industrial Applications, ACS Symposium Series 133, American Chemical Society,
Washington, D.C., 1980, pp. 495-512.
Univers
ity of
Cap
e Tow
n
References Page 72
20. Harris, G. B. and Magee, T. J., Beyond PAL: The Chesbar Option, AAL,
Nickel/Cobalt-9 ALTA, Perth, ALTA Metallurgical Services, 2003.
21. Harris, G. B., Magee, T. J, Lakshmanan, V. I. and Sridhar, R., The Jaguar Nickel
Sechol Laterite Project Atmospheric Chloride Leach Process, International Laterite
Nickel Symposium, The Minerals, Metals & Materials Society, Warrendale, 2004.
22. Steyl, J., Solution Thermodynamic Modelling for the Jaguar Process, Anglo
Research Memo, 2004.
23. Flett, D. S., Chemistry of Nickel-Cobalt Separation, Burkin, A. R. (editor), The
Extractive Metallurgy of Nickel, Chichester: John Wiley and Sons, 1987, pp. 76-97.
24. Bacon, G. and Mikaylov, I., Solvent Extraction as an Enabling Technology in the
Nickel Industry, Journal of the South African Institute of Mining and Metallurgy,
Nov/Dec 2002, vol. 102, no. 8, pp. 435-444.
25. Soldenhoff, K., Hayward, N. and Wilkins, D., Direct Solvent Extraction of Cobalt
and Nickel from Laterite-acid Pressure Leach Liquors, Mishra, B. (editor), EPD
Congress 1998, The Minerals, Metals & Materials Society, Warrendale, 1998, pp.
153-165.
26. Bautista, R. G., The Solvent Extraction of Nickel, Cobalt and their Associated
Metals, Reddy, R. G, and Weizenbach, R. N. (editors), The Paul E. Queneau
International Symposium, Extractive Metallurgy of Copper, Nickel and Cobalt, vol. I:
Fundamental Aspects, The Minerals, Metals & Materials Society, Warrendale,
1993, pp. 827-852.
27. Rice, N. M. and Gibson, R. W., Solvent Extraction with Cyanex 301 and 302 for the
Upgrading of Chloride Leach Liquors from Lateritic Nickel Ores, International
Solvent Extraction Conference 1996 Proceedings, Melborne, 1996, pp. 715-720.
28. Sole, K. C., Process Experience: Chemical and Industrial Applications, International
Solvent Extraction School ’99, Spain, 12-16 July 1999.
29. Chander, S., Atmospheric Leaching of Nickeliferous Laterites in Acidic Media,
Transactions of the Indian Institute of Metals, vol. 35, no. 4 (9) 1982, pp. 366-371.
30. Kerfoot, D. G. E. and Weir, D. R., The Hydro- and Electrometallurgy of Nickel and
Cobalt, Tyroler, G. P. and Landolt, C. A. (editors), Extractive Metallurgy of Nickel
Univers
ity of
Cap
e Tow
n
References Page 73
and Cobalt, The Metallurgical Society, Warrendale, 1988, pp. 241-265.
31. Han, K. N. and Meng, X., The Leaching Behaviour of Nickel and Cobalt from Metals
and Ores – a Review, Reddy, R. G. and Weizenbach, R. N. (editors), The Paul E.
Queneau International Symposium, Extractive Metallurgy of Copper, Nickel and
Cobalt, vol. I: Fundamental Aspects, The Minerals, Metals & Materials Society,
Warrendale, 1993, pp. 709-733.
32. Anthony, M. T. and Flett, D. S., Nickel Processing Technology: A Review, Nickel:
1996 Commodity Meeting, edited presentations, Minerals Industry International, Jan
1997, pp. 26-41.
33. Mackenzie, M., Nickel Laterite Processing – An Overview of Recent Developments,
Cognis Australia, 2001.
34. O’Kane, P. T., Energy Consumption and Economic Trends in the Production of
Nickel from Laterites, Evans D. J. I., Shoemaker R. S. and Veltman H. (editors),
International Laterite symposium, New Orleans, Louisiana, New York: SME of
AIME, 1979, pp. 503-523.
35. Weir, D. R. and Sefton, V. B., Development of Sherrit’s Commercial Nickel Refining
Process for Low and High Iron Laterites, Evans D. J. I., Shoemaker R. S. and
Veltman H. (editors), International Laterite symposium, New Orleans, Louisiana, 19-
21 Feb 1979, New York: SME of AIME, 1979, pp. 325-345.
36. Duyvensteyn, W. P. C., Wicker, G. R. and Doane, R. E., An Omnivorous Process
for Laterite Deposits, Evans D. J. I., Shoemaker R.S. and Veltman H. (editors),
International Laterite symposium, New Orleans, Louisiana, 19-21 Feb 1979. New
York: SME of AIME, 1979, pp. 553-570.
37. Parkinson, G., Leaching Metal…For All It’s Worth, Chemical Engineering, vol. 106,
no. 2, Nov 1999, pp. 28-31.
38. Kyle, J. H. and Furfaro, D., The Cawse Nickel/Cobalt Laterite Project Metallurgical
Process Development, Cooper, W. C. and Mihaylov, I. (editors), Nickel-Cobalt 97,
vol.1: Hydrometallurgy and Refining of Nickel and Cobalt, Montreal, Quebec:
Canadian Institute of Mining, Metallurgy and Petroleum, 1997, pp. 379-389.
39. O’Shea, J., Implications of Pressure Acid Leach Developments, ALTA 1999
Nickel/Cobalt Pressure Leaching and Hydrometallurgy Forum, Perth, Australia, 11-

Univers
ity of
Cap
e Tow
n
References Page 74
12 May 1999, Blackburn South, Victoria: ALTA Metallurgical Services, 1999, pp. 1-
17.
40. Motteram, G., Ryan, M. and Weizenbach, R., Application of the Pressure Acid
Leach Process to Western Australian Nickel/Cobalt Laterites, Cooper, W. C.,
Mihaylov I. (editors), Nickel-Cobalt 97, vol. 1: Hydrometallurgy and Refining of
Nickel and Cobalt. Montreal, Quebec: Canadian Institute of Mining, Metallurgy and
Petroleum, 1997, pp. 391-407.
41. Panagiotopoulos, N. and Kontopoulos, A., Atmospheric Pressure Sulfuric Acid
Leaching of Low-grade Hematitic Laterites, Tyroler, G. P. and Landolt, C. A.
(editors), Extractive Metallurgy of Nickel and Cobalt, The Metallurgical Society,
Warrendale, 1988.
42. Das, G. K., Anand, S., Das, R. P., Muir, D. M., Senanayake, G., Singh, P. and
Hefter, G., Acid Leaching of Nickel Laterites in the Presence of Sulfur Dioxide at
Atmospheric Pressure, Cooper W. C. and Mihaylov I. (editors), Nickel-Cobalt 97,
vol. 1: Hydrometallurgy and Refining of Nickel and Cobalt. Montreal, Quebec:
Canadian Institute of Mining, Metallurgy and Petroleum, 1997, pp. 471-487.
43. Rice, N. M. and Strong, L. W., The Leaching of Lateritic Nickel Ores in Hydrochloric
Acid, Canadian Metallurgical Quarterly, vol. 13, no.3, 1974, pp. 485-493.
44. Warren, G. W., Review of Developments in Hydrometallurgy – 1981, Journal of
Metals, no. 4, 1982, pp. 51-55.
45. Senanayake, G. and Muir, D. M., Chloride Processing of Metal Sulfides: Review of
Fundamentals and Applications, Young, C. A., Alfantazi, A. M., Anderson, C. G.,
Dreisinger, D. B., Harris, B. and James, A. (editors), Ian Ritchie Conference
Proceedings, Vancouver, vol. 1: Leaching and Solution Purification, The Minerals,
Metals & Materials Society, Warrendale, 2003, pp. 517-531.
46. Stensholt, E. O., Dotterund, O. M., Henriksen, E. E., Ramsdal, P. O., Stålesen, F.
and Thune, E., The Development and Practice of the Falconbridge Chlorine Leach
Process, CIM Bulletin, vol. 94, no. 1051, pp. 101-104.
47. Sukla, L. B., Kanungo, S. B. and Jena, P. K., Leaching of Nickel and Cobalt-
bearing Lateritic Overburden of Chrome Ore in Hydrochloric and Sulfuric Acids,
Transactions of the Indian Institute of Metals, vol. 42, no. 1, 1989, pp. 27-35.
Univers
ity of
Cap
e Tow
n
References Page 75
48. Rice, N. M., The Hydrochloric Acid Route for Nickel Laterites: A Brief History of an
Ongoing Project 1970-86, Leeds University Mining Association Journal, 1990, pp.
59-89.
49. Gibson, R. W. and Rice, N. M., A Hydrochloric Acid Process for Nickeliferous
Laterites, Cooper W. C., Mihaylov, I., (editors), Nickel-Cobalt 97, vol.1:
Hydrometallurgy and Refining of Nickel and Cobalt, Montreal, Quebec, Canadian
Institute of Mining, Metallurgy and Petroleum, 1997, pp. 247-261.
50. Majima, H. and Awakura, Y. Measurement of the Activity of Electrolytes and the
Application of Activity to Hydrometallurgical Studies, Metallurgical Transactions, vol.
12B, no. 3, 1981, pp. 141-147.
51. Balomenos, E., Panias, D. and Paspaliaris, I., Modelling Chemical Equilibrium of
Electrolyte Solutions, Mineral Processing and Extractive Metallurgy Review, vol. 27,
no. 1, 2006, pp. 1-60.
52. Baghalha, M. and Papangelakis, V.G., Pressure Acid Leaching of Laterites at
250°C: A Solution Chemical Model and its Applications, Metallurgical and Materials
Transactions B, vol. 29B, no. 10, 1998, pp. 945-952.
53. Georgiou, D. and Papangelakis, V. G., Sulfuric Acid Pressure Leaching of a
Limonitic Laterite: Chemistry and Kinetics, Hydrometallurgy, vol. 49, 1998, pp. 23-
46.
54. Rubisov, D. H., Kronwinkel, J. M. and Papangelakis, V. G., Sulfuric Acid Pressure
Leaching of Laterites – Universal Kinetics of Nickel Dissolution for Limonites and
Limonitic/Saprolytic Blends, Hydrometallurgy, vol. 58, 2000, pp. 1-11.
55. Liu, H. and Papangelakis, V. G., Chemical Modelling of High Temperature Aqueous
Processes, Hydrometallurgy, vol. 79, 2005, pp. 48-61.
56. Bates, R. G., Determination of pH – Theory and Practice, 2nd edition, John Wiley &
sons, New York, 1973, pp.1, 30-57, 365.
57. Welty, J. R., Wicks, C. E. and Wilson, R. E., Fundamentals of Momentum, Heat,
and Mass Transfer, 3rd edition, John Wiley & Sons, New York, 1984, p. 482.
58. Mesmer, R. E. and Holmes, H. F., pH, Definition and Measurement at High
Temperatures, Journal of Solution Chemistry, vol. 21, no. 8, 1992, pp. 725-744.
Univers
ity of
Cap
e Tow
n
References Page 76
59. Butler, J. N., Ionic Equilibrium – A Mathematical Approach, Addison-Wesley
Publishing Company Inc., Reading, 1964, pp. 428-457.
60. Stokes, R. H. and Robinson, R. A., Ionic Hydration and Activity in Electrolyte
Solutions, Journal of the American Chemical Society, vol. 70, 1948, pp. 1870-1878.
61. Bates, R. G., Staples, B. R. and Robinson, R. A., Ionic Hydration and Single-ion
Activities in Unassociated Chlorides at High Ionic Strengths, Analytical Chemistry,
vol. 42, no. 8, 1970, pp. 867-871.
62. Senanayake, G. and Muir, D. M., Studies on Liquid Junction Potentials in
Concentrated Chloride Solutions and Determination of Ionic Activities and Hydration
Numbers by the EMF Method, Electrochemica Alta, vol. 33, no. 1, 1988, pp. 3-9.
63. Senanayake, G. Review of Theory and Practice of Measuring Proton Activity and
pH in Concentrated Chloride Solutions and Application to Oxide Leaching, Minerals
Engineering, vol. 20, 2007, pp. 634-645.
64. Linke, W. F., Solubilities of Inorganic and Metal-Organic Compounds, 4th edition,
vol. 2, American Chemical Society, 1965, p. 480.
65. Levenspiel, O., Chemical Reaction Engineering, 2nd edition, John Wiley & sons,
New York, 1972, pp. 21-22, 29.
66. Liddell, K. C., Shrinking Core Models in Hydrometallurgy: What Students Are Not
Being Told About the Pseudo-Steady Approximation, Hydrometallurgy, vol. 79,
2005, pp. 62-68.
67. Park, J. Y. and Levenspiel, O., The Crackling Core Model for the Reaction of Solid
Particles, Chemical Engineering Science, vol. 30, 1975, pp. 1207-1214.
68. Adrover, A., Velardo, A., Giona, M., Cerbeli, S., Pagananelli, F. and Toro, L.,
Structural Modelling for the Dissolution of Non-Porous Ores: Dissolution with
Sporulation, Chemical Engineering Journal, vol. 99, 2004, pp. 89-104.
69. Brittan, M. I., Variable Activation Energy Model for Leaching Kinetics, International
Journal of Mineral Processing, vol. 2, 1975, pp. 321-331.

Univers
ity of
Cap
e Tow
n
References Page 77
70. Beolchini, F., Petrangeli Papini, M., Toro, L., Trifoni, M. and Vegliò, F., Acid
Leaching of Mangeniferous Ores by Sucrose: Kinetic Modelling and Related
Statistical Analysis, Minerals Engineering, vol. 14, no. 2, 2001, pp. 175-184.
71. Hashimoto, K. and Silveston, P. L., Approximation of Rate Expressions Involving
Pore Size Distributions, AIChE Journal, vol. 19, no. 2, 1973, pp. 368-369.
72. Pritzer, M. D., The Role of Migration in Shrinking Core Leaching Reactions
Controlled by Pore Transport, Metallurgical and Materials Transactions B, vol. 26B,
no. 10, 1995, pp. 901-910.
73. Perry, R. H. and Green, D. W. (editors), Perry’s Chemical Engineers’ Handbook, 6th
edition, McGraw-Hill, Inc., New York, 1984, pp. 4-18-21.
74. Senanayake, G. and Das, G. K., A Comparative Study of Leaching Kinetics of
Limonitic Laterite and Synthetic Iron Oxides in Sulfuric Acid containing Sulfur
Dioxide, Hydrometallurgy, vol. 72, 2004, pp. 59-72.
75. Jackson, E. and Lloyd, K. J., Enhanced Hydrochloric Acid Leaching of Nickel,
Minerals Engineering, vol. 13, no. 14-15, 2000, pp.1565-1572.
76. Theron, S. J., Mineralogical Analyses of Ni-laterite Samples from Barro Alto (Brazil):
Barro Alto WTO Acido Ore. AARL Technical Note No. 3, Project No. A49076, Jan
2005.
77. Peters, E. Particle Leaching Kinetics, Lecture notes presented by D. Dreisinger,
UCT course CHE558Z, July 2003.
78. Harris, G. B., Lakshmanan, V. I. and Sridhar, R., Process for the Recovery of Value
Metals from Material Containing Base Metal Oxides, United States Patent
Application, No. US 2004/0228783 A1, 2004, pp. 12.

Univers
ity of
Cap
e Tow
n
APPENDIX A
Leach Test Sheets
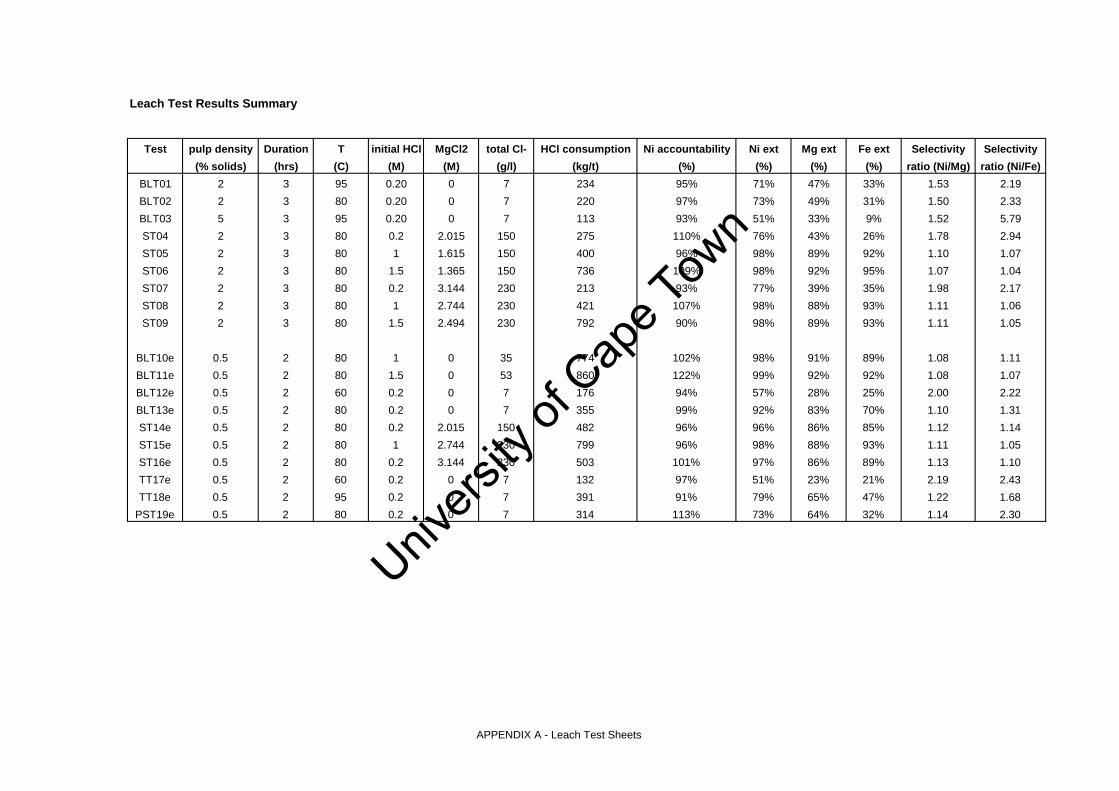
Univers
ity of
Cap
e Tow
n
Leach Test Results Summary
Test pulp density Duration T initial HCl MgCl2 total Cl- HCl consumption Ni accountability Ni ext Mg ext Fe ext Selectivity Selectivity(% solids) (hrs) (C) (M) (M) (g/l) (kg/t) (%) (%) (%) (%) ratio (Ni/Mg) ratio (Ni/Fe)
BLT01 2 3 95 0.20 0 7 234 95% 71% 47% 33% 1.53 2.19BLT02 2 3 80 0.20 0 7 220 97% 73% 49% 31% 1.50 2.33BLT03 5 3 95 0.20 0 7 113 93% 51% 33% 9% 1.52 5.79ST04 2 3 80 0.2 2.015 150 275 110% 76% 43% 26% 1.78 2.94ST05 2 3 80 1 1.615 150 400 96% 98% 89% 92% 1.10 1.07ST06 2 3 80 1.5 1.365 150 736 109% 98% 92% 95% 1.07 1.04ST07 2 3 80 0.2 3.144 230 213 93% 77% 39% 35% 1.98 2.17ST08 2 3 80 1 2.744 230 421 107% 98% 88% 93% 1.11 1.06ST09 2 3 80 1.5 2.494 230 792 90% 98% 89% 93% 1.11 1.05
BLT10e 0.5 2 80 1 0 35 774 102% 98% 91% 89% 1.08 1.11BLT11e 0.5 2 80 1.5 0 53 860 122% 99% 92% 92% 1.08 1.07BLT12e 0.5 2 60 0.2 0 7 176 94% 57% 28% 25% 2.00 2.22BLT13e 0.5 2 80 0.2 0 7 355 99% 92% 83% 70% 1.10 1.31ST14e 0.5 2 80 0.2 2.015 150 482 96% 96% 86% 85% 1.12 1.14ST15e 0.5 2 80 1 2.744 230 799 96% 98% 88% 93% 1.11 1.05ST16e 0.5 2 80 0.2 3.144 230 503 101% 97% 86% 89% 1.13 1.10TT17e 0.5 2 60 0.2 0 7 132 97% 51% 23% 21% 2.19 2.43TT18e 0.5 2 95 0.2 0 7 391 91% 79% 65% 47% 1.22 1.68
PST19e 0.5 2 80 0.2 0 7 314 113% 73% 64% 32% 1.14 2.30
APPENDIX A - Leach Test Sheets

Univers
ity of
Cap
e Tow
n
Test name: BLT01 Date: 26-Oct-04Comment: 95°C baseline, 2% solids
mass (g) volume (ml) density @20ºC (kg/l) nominal effective grind (D90) 46 microndry ore added: 24 8.5 2.832 initial pulp % solids: 2 2.0 T: 95 °C
stock solution added: 1176 1174.5 1.0013 initial HCl (g/l): 7.29 6.88 duration: 3 hrstotal slurry in: 1200.0 initial HCl (M): 0.20 0.19 agitation rate: 800 rpm
MgCl2 (g/l): 0 0 impeller: pitched blade, 5cmφ, Titotal Cl- (g/l): 7.00 7.63 vessel: 2litre, baffled, with reflux condenser
Sample time minute slurry removed sample T pH Density @20ºC ORP vs. Ag/AgCl Eh Notes
g (ºC) (kg/l) (mV) (mV)
BLT01-0 0 23.1 0.69 1.0013
BLT01-2 2 20.49 22.2 1.0021 595 794 brown residue
BLT01-30 30 20.01 22.1 1.0046 621 820 light green pls
BLT01-60 60 19.42 22 1.0051 619 818 clear wash
BLT01-120 120 18.77 22.1 1.0055 608 807
BLT01-180 180 1073.3 22.3 1.38 1.0060 597 796
Sample filtrate mass filtrate volwet residue mass before
wash
wet residue mass after
wash
dry residue mass wash mass in wash vol in wash mass
outwash density
@20ºC wash vol out titrant addition
calc. evaporation
g ml g g g g ml g kg/l ml cum. ml cum. ml
BLT01-2 18.92 18.88 0.25 0.37 23.5 23.5 22.29 0.9982 22.3 0.53
BLT01-30 17.71 17.63 0.62 0.32 38.26 38.3 38.3 0.9986 38.4 8.02
BLT01-60 17.57 17.48 0.71 0.3 19.95 20.0 19.38 0.9989 19.4 16.04
BLT01-120 16.71 16.62 0.27 0.29 22.68 22.7 22.26 0.9990 22.3 32.07
BLT01-180 1018.8 1012.72 34.98 43.15 16.37 253.93 254.4 220.2 0.999 220.4 48.11
ANALYSES
Residue (%) Al Ca Cl Co Cr Fe Mg Mn Ni Si ZnHead 1.53 0.79 0.13 0.05 0.49 9.3 18.8 0.22 1.68 18.8 0.05BLT01-180 1.69 0.96 0.19 0.05 0.62 8.58 13.7 0.05 0.66 22 0.05
Solution (mg/l) Al Ca Cl (g/l) Co Cr Fe HCl (g/l) Mg Mn Ni Si ZnBLT01-head liquor 2 2 7.63 2 1 2 6.88 2 2 2 2 2BLT01-2 13 27.6 6.4 2 1 85.8 6.12 113 3.88 49.9 48.6 18.3BLT01-30 38 28.6 7.34 3.17 3.45 369 3.79 975 21.2 189 197 8.61BLT01-60 40.5 27.5 12.4 4.06 3.89 396 2.94 1213 25.3 215 239 4.51BLT01-120 44.5 28.4 8.23 4.91 4.18 430 2.56 1421 31.2 227 269 4.64BLT01-180 48.8 30.5 7.63 5.03 4.66 464 2.44 1610 34 253 289 4.22BLT01-comp. wash 3.9 3.46 1.06 2 1 45 0.5 175 3.98 24.6 25 2.04
CALCULATIONS AND MASS BALANCE
H+ assay H+ measured pH H+ initial H+ residual HCl(free acid) (autotitrator) mol/l mol/l g
BLT01-0 mol/l 0.69 0.189 2.47BLT01-2 0.10 0.86 0.14BLT01-30 0.08 1.12 0.08BLT01-60 0.07 1.26 0.05BLT01-120 0.07 1.35 0.04BLT01-180 0.01 1.00 %change in acid conc: 64.5average 0.07 1.15 0.26
solids IN total g Al Ca Cl Co Cr Fe Mg Mn Ni Sifeed solids 24.00 0.37 0.19 0.03 0.01 0.12 2.23 4.51 0.05 0.40 4.50solution IN total g total ml Al Ca Cl Co Cr Fe Mg Mn Ni Sihead liquor 1176.00 1174.47 0.0 0.0 8.961 0.0 0.0 0.0 0.0 0.0 0.0 0.0wash water 358.32 359.04 - - - - - - - - - -total IN (g) 1558.32 0.37 0.19 8.99 0.014 0.12 2.24 4.51 0.06 0.40 4.50
solids OUT total g Al Ca Cl Co Cr Fe Mg Mn Ni SiBLT01-2 0.37 - - - - - - - - - -BLT01-30 0.32 - - - - - - - - - -BLT01-60 0.30 - - - - - - - - - -BLT01-120 0.29 - - - - - - - - - -final residue 16.37 0.28 0.16 0.03 0.01 0.10 1.40 2.24 0.01 0.11 3.60solution OUT total g total ml Al Ca Cl Co Cr Fe Mg Mn Ni SiBLT01-2 18.92 18.88 0.000 0.001 0.121 0.000 0.000 0.002 0.002 0.000 0.001 0.001BLT01-30 17.71 17.63 0.001 0.001 0.129 0.000 0.000 0.007 0.017 0.000 0.003 0.003BLT01-60 17.57 17.48 0.001 0.000 0.217 0.000 0.000 0.007 0.021 0.000 0.004 0.004BLT01-120 16.71 16.62 0.001 0.000 0.137 0.000 0.000 0.007 0.024 0.001 0.004 0.004final filtrate 1018.80 1012.72 0.049 0.031 7.727 0.005 0.005 0.470 1.630 0.034 0.256 0.293wash water 322.43 322.79 0.001 0.001 0.342 0.001 0.000 0.015 0.056 0.001 0.008 0.008cake moisture 27.35 27.38 0.000 0.000 0.029 0.000 0.000 0.001 0.005 0.000 0.001 0.001evaporation 48.01 48.11 - - - - - - - - - -total OUT (g) 1505.15 0.33 0.19 8.73 0.01 0.11 1.91 4.00 0.05 0.38 3.92
balance (out/in) 97% 89% 100% 97% 99% 91% 86% 89% 82% 95% 87%
extraction (solution) Al Ca Co Cr Fe Mg Mn Ni Si Zn
BLT01-2 4% 17% 20% 1% 5% 3% 9% 15% 1% 179%BLT01-30 12% 18% 31% 3% 19% 25% 47% 55% 5% 84%BLT01-60 13% 17% 39% 4% 21% 31% 56% 62% 6% 44%BLT01-120 14% 17% 47% 4% 22% 36% 68% 65% 7% 44%BLT01-180 15% 18% 47% 5% 23% 40% 73% 71% 7% 40%
extraction (solids) Al Ca Co Cr Fe Mg Mn Ni Si Zn
BLT01-180 19% 11% 27% 6% 33% 47% 83% 71% 14% 27%
extraction (ratio) Al Ca Co Cr Fe Mg Mn Ni Si Zn
BLT01-2 5% 10% 11% 1% 6% 3% 10% 14% 2% 116%BLT01-30 15% 10% 17% 5% 26% 28% 52% 53% 10% 55%BLT01-60 16% 10% 22% 5% 28% 35% 62% 60% 12% 29%BLT01-120 17% 10% 26% 6% 30% 41% 76% 64% 13% 29%BLT01-180 19% 11% 27% 6% 33% 47% 83% 71% 14% 27%
based on solids assayacid consumption g consumed kg/t ore Al Fe Mg Ni totalBLT01-180 5.61 234acid equivalent (g) 0.37 1.62 6.81 0.37 9.16acid equivalent (%) 4.0 17.7 74.3 4.0 100.0
17.6
calc. total solid massg
1158.41142.41126.4
calc. total soln volumeml
1173.91166.5
1158.41142.41126.4
calc. total soln volumeml
1173.91166.5
0.0
0.2
0.4
0.6
0.8
1.0
1.2
1.4
1.6
0 50 100 150
time (min)
pH
0%10%20%30%40%50%60%70%80%90%
100%
0 50 100 150 200
time (min)
extr
actio
n
Ni Mg Al Fe
Fe18%
Mg74%
Al4%Ni
4%
APPENDIX A - Leach Test Sheets

Univers
ity of
Cap
e Tow
n
Test name: BLT02 Date: 26-Oct-04Comment: 80°C baseline, 2% solids
mass (g) volume (ml) density @20ºC (kg/l) nominal effective grind (D90) 46 microndry ore added: 23.99 8.5 2.832 initial pulp % solids: 2 2.0 T: 80 °C
stock solution added: 1177.3 1175.8 1.0013 initial HCl (g/l): 7.29 6.88 duration: 3 hrstotal slurry in: 1201.3 initial HCl (M): 0.20 0.19 agitation rate: 800 rpm
MgCl2 (g/l): 0 0 impeller: pitched blade, 5cmφ, Titotal Cl- (g/l): 7.00 7.63 vessel: 2litre, baffled, with reflux condenser
Sample time minute slurry removed sample T pH Density @20ºC ORP vs. Ag/AgCl Eh Notes
g (ºC) (kg/l) (mV) (mV)
BLT02-0 10h15 0 23.1 0.69 1.0013
BLT02-2 2 20.83 21.8 1.0022 582 781 brown residue
BLT02-30 30 19.63 21.9 1.0034 630 829 light green pls
BLT02-60 60 23.64 22.1 1.0044 627 826 clear wash
BLT02-120 120 24.83 22.4 1.0049 629 828 50min heat-up time
BLT02-180 180 1079.94 24.4 1.22 1.0052 619 818
Sample filtrate mass filtrate volwet residue mass before
wash
wet residue mass after
wash
dry residue mass wash mass in wash vol in wash mass
outwash density
@20ºC wash vol out titrant addition
calc. evaporation
g ml g g g g ml g kg/l ml cum. ml cum. ml
BLT02-2 17.95 17.91 1.72 0.38 48.81 48.9 47.41 0.9984 47.5 0.36
BLT02-30 18.16 18.10 1.73 0.36 24.48 24.5 23.54 0.9987 23.6 5.41
BLT02-60 21.87 21.77 0.61 0.38 21.07 21.1 20.24 0.9988 20.3 10.83
BLT02-120 23.19 23.08 0.62 0.38 20.98 21.0 19.33 0.9987 19.4 21.66
BLT02-180 1025.8 1020.49 38.11 39.62 16.26 254.11 254.6 228.43 0.999 228.7 32.48
ANALYSES
Residue (%) Al Ca Cl Co Cr Fe Mg Mn Ni Si ZnHead 1.53 0.79 0.13 0.05 0.49 9.3 18.8 0.22 1.68 18.8 0.05BLT02-180 1.75 1.01 0.19 0.05 0.65 8.69 13.1 0.05 0.61 21.9 0.05
Solution (mg/l) Al Ca Cl (g/l) Co Cr Fe HCl (g/l) Mg Mn Ni Si ZnBLT02-head liquor 2 2 7.63 2 1 2 6.88 2 2 2 2 2BLT02-2 9.49 29.1 7.87 2 1 59.9 6.92 52.2 3.14 46.7 32.5 27.2BLT02-30 29 28.8 7.58 2 2.6 290 5.37 463 12.2 172 136 41.6BLT02-60 36.3 27.4 7.3 2.21 3.42 398 3.95 802 20.5 217 190 2.59BLT02-120 41.1 27.8 7.29 3.14 3.94 455 3.05 1106 28.2 238 238 2.41BLT02-180 45.1 29.4 7.77 3.73 4.48 490 2.76 1304 32.8 262 263 2.28BLT02-comp. wash 3.77 3.65 1.1 2 1 50.2 0.5 150 4.14 31.3 25.5 2
CALCULATIONS AND MASS BALANCE
H+ assay H+ measured pH H+ initial H+ residual HCl(free acid) (autotitrator) mol/l mol/l g
BLT02-0 mol/l 0.69 0.189 2.82BLT02-2 0.15 temp set at 95 1.59 0.03BLT02-30 0.11 1.66 0.02BLT02-60 0.08 2.07 0.01BLT02-120 0.08 2.21 0.01BLT02-180 0.08 1.00 %change in acid conc: 59.9average 0.10 1.88 0.21
solids IN total g Al Ca Cl Co Cr Fe Mg Mn Ni Sifeed solids 23.99 0.37 0.19 0.03 0.01 0.12 2.23 4.51 0.05 0.40 4.50solution IN total g total ml Al Ca Cl Co Cr Fe Mg Mn Ni Sihead liquor 1177.30 1175.77 0.0 0.0 8.971 0.0 0.0 0.0 0.0 0.0 0.0 0.0wash water 369.45 370.19 - - - - - - - - - -total IN (g) 1570.74 0.37 0.19 9.00 0.014 0.12 2.23 4.51 0.06 0.40 4.50
solids OUT total g Al Ca Cl Co Cr Fe Mg Mn Ni SiBLT02-2 0.38 - - - - - - - - - -BLT02-30 0.36 - - - - - - - - - -BLT02-60 0.38 - - - - - - - - - -BLT02-120 0.38 - - - - - - - - - -final residue 16.26 0.28 0.16 0.03 0.01 0.11 1.41 2.13 0.01 0.10 3.56solution OUT total g total ml Al Ca Cl Co Cr Fe Mg Mn Ni SiBLT02-2 17.95 17.91 0.000 0.001 0.141 0.000 0.000 0.001 0.001 0.000 0.001 0.001BLT02-30 18.16 18.10 0.001 0.001 0.137 0.000 0.000 0.005 0.008 0.000 0.003 0.002BLT02-60 21.87 21.77 0.001 0.001 0.159 0.000 0.000 0.009 0.017 0.000 0.005 0.004BLT02-120 23.19 23.08 0.001 0.001 0.168 0.000 0.000 0.011 0.026 0.001 0.005 0.005final filtrate 1025.80 1020.49 0.046 0.030 7.929 0.004 0.005 0.500 1.331 0.033 0.267 0.268wash water 338.95 339.36 0.001 0.001 0.373 0.001 0.000 0.017 0.051 0.001 0.011 0.009cake moisture 26.54 26.57 0.000 0.000 0.029 0.000 0.000 0.001 0.004 0.000 0.001 0.001evaporation 32.42 32.48 - - - - - - - - - -total OUT (g) 1522.64 0.33 0.20 8.97 0.01 0.11 1.96 3.57 0.04 0.39 3.85
balance (out/in) 97% 91% 103% 100% 90% 94% 88% 79% 81% 97% 86%
extraction (solution) Al Ca Co Cr Fe Mg Mn Ni Si Zn
BLT02-2 3% 18% 20% 1% 3% 1% 7% 14% 1% 267%BLT02-30 9% 18% 20% 3% 15% 12% 27% 50% 4% 406%BLT02-60 12% 17% 21% 3% 21% 21% 45% 63% 5% 25%BLT02-120 13% 17% 30% 4% 24% 28% 62% 68% 6% 23%BLT02-180 14% 18% 36% 4% 25% 33% 71% 75% 7% 22%
extraction (solids) Al Ca Co Cr Fe Mg Mn Ni Si Zn
BLT02-180 16% 6% 27% 2% 31% 49% 83% 73% 14% 27%
extraction (ratio) Al Ca Co Cr Fe Mg Mn Ni Si Zn
BLT02-2 3% 6% 14% 0% 4% 2% 8% 13% 2% 318%BLT02-30 10% 6% 14% 1% 19% 17% 31% 48% 7% 486%BLT02-60 13% 6% 16% 1% 26% 30% 52% 61% 10% 30%BLT02-120 15% 6% 22% 1% 29% 41% 72% 67% 13% 28%BLT02-180 16% 6% 27% 2% 31% 49% 83% 73% 14% 27%
based on solids assayacid consumption g consumed kg/t ore Al Fe Mg Ni totalBLT02-180 5.27 220acid equivalent (g) 0.33 1.60 7.14 0.38 9.46acid equivalent (%) 3.5 17.0 75.5 4.0 100.0
1166.51155.61144.8
calc. total soln volumeml
1176.91171.9
calc. total soln volumeml
1176.91171.9
17.6
calc. total solid massg
1166.51155.61144.8
0.0
0.5
1.0
1.5
2.0
2.5
0 50 100 150
time (min)
pH
0%10%20%30%40%50%60%70%80%90%
100%
0 50 100 150 200
time (min)
extr
actio
n
Ni Mg Al Fe
Fe17%
Mg75%
Al4%Ni
4%
APPENDIX A - Leach Test Sheets
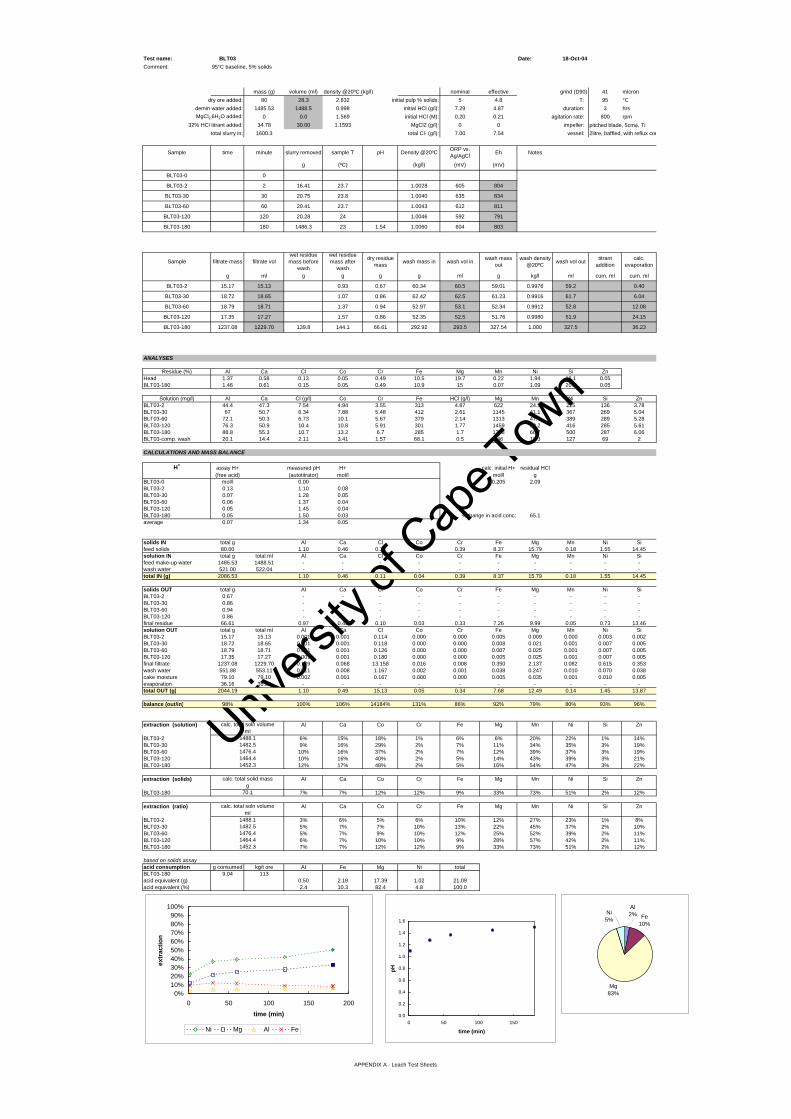
Univers
ity of
Cap
e Tow
n
Test name: BLT03 Date: 18-Oct-04Comment: 95°C baseline, 5% solids
mass (g) volume (ml) density @20ºC (kg/l) nominal effective grind (D90) 41 microndry ore added: 80 28.3 2.832 initial pulp % solids: 5 4.8 T: 95 °C
demin water added: 1485.53 1488.5 0.998 initial HCl (g/l): 7.29 4.87 duration: 3 hrsMgCl2.6H2O added: 0 0.0 1.569 initial HCl (M): 0.20 0.21 agitation rate: 800 rpm
32% HCl titrant added: 34.78 30.00 1.1593 MgCl2 (g/l): 0 0 impeller: pitched blade, 5cmφ, Titotal slurry in: 1600.3 total Cl- (g/l): 7.00 7.54 vessel: 2litre, baffled, with reflux condenser
Sample time minute slurry removed sample T pH Density @20ºC ORP vs. Ag/AgCl Eh Notes
g (ºC) (kg/l) (mV) (mV)
BLT03-0 0
BLT03-2 2 16.41 23.7 1.0028 605 804
BLT03-30 30 20.75 23.8 1.0040 635 834
BLT03-60 60 20.41 23.7 1.0043 612 811
BLT03-120 120 20.28 24 1.0046 592 791
BLT03-180 180 1486.3 23 1.54 1.0060 604 803
Sample filtrate mass filtrate volwet residue mass before
wash
wet residue mass after
wash
dry residue mass wash mass in wash vol in wash mass
outwash density
@20ºC wash vol out titrant addition
calc. evaporation
g ml g g g g ml g kg/l ml cum. ml cum. ml
BLT03-2 15.17 15.13 0.93 0.67 60.34 60.5 59.01 0.9976 59.2 0.40
BLT03-30 18.72 18.65 1.07 0.86 62.42 62.5 61.23 0.9916 61.7 6.04
BLT03-60 18.79 18.71 1.37 0.94 52.97 53.1 52.34 0.9912 52.8 12.08
BLT03-120 17.35 17.27 1.57 0.86 52.35 52.5 51.76 0.9980 51.9 24.15
BLT03-180 1237.08 1229.70 139.8 144.1 66.61 292.92 293.5 327.54 1.000 327.5 36.23
ANALYSES
Residue (%) Al Ca Cl Co Cr Fe Mg Mn Ni Si ZnHead 1.37 0.58 0.13 0.05 0.49 10.5 19.7 0.22 1.94 18.1 0.05BLT03-180 1.46 0.61 0.15 0.05 0.49 10.9 15 0.07 1.09 20.2 0.05
Solution (mg/l) Al Ca Cl (g/l) Co Cr Fe HCl (g/l) Mg Mn Ni Si ZnBLT03-2 44.4 47.3 7.54 4.94 3.55 313 4.87 622 24.5 225 136 3.78BLT03-30 67 50.7 6.34 7.88 5.48 412 2.61 1145 41.1 367 269 5.04BLT03-60 72.1 50.3 6.73 10.1 5.67 379 2.14 1313 47.6 389 289 5.28BLT03-120 76.3 50.9 10.4 10.8 5.91 301 1.77 1459 52.2 416 285 5.61BLT03-180 88.8 55.3 10.7 13.2 6.7 285 1.7 1738 66.7 500 287 6.06BLT03-comp. wash 20.1 14.4 2.11 3.41 1.57 68.1 0.5 446 18.3 127 69 2
CALCULATIONS AND MASS BALANCE
H+ assay H+ measured pH H+ calc. initial H+ residual HCl(free acid) (autotitrator) mol/l mol/l g
BLT03-0 mol/l 0.00 0.205 2.09BLT03-2 0.13 1.10 0.08BLT03-30 0.07 1.28 0.05BLT03-60 0.06 1.37 0.04BLT03-120 0.05 1.45 0.04BLT03-180 0.05 1.50 0.03 %change in acid conc: 65.1average 0.07 1.34 0.05
solids IN total g Al Ca Cl Co Cr Fe Mg Mn Ni Sifeed solids 80.00 1.10 0.46 0.11 0.04 0.39 8.37 15.79 0.18 1.55 14.45solution IN total g total ml Al Ca Cl Co Cr Fe Mg Mn Ni Sifeed make-up water 1485.53 1488.51 - - - - - - - - - -wash water 521.00 522.04 - - - - - - - - - -total IN (g) 2086.53 1.10 0.46 0.11 0.04 0.39 8.37 15.79 0.18 1.55 14.45
solids OUT total g Al Ca Cl Co Cr Fe Mg Mn Ni SiBLT03-2 0.67 - - - - - - - - - -BLT03-30 0.86 - - - - - - - - - -BLT03-60 0.94 - - - - - - - - - -BLT03-120 0.86 - - - - - - - - - -final residue 66.61 0.97 0.41 0.10 0.03 0.33 7.26 9.99 0.05 0.73 13.46solution OUT total g total ml Al Ca Cl Co Cr Fe Mg Mn Ni SiBLT03-2 15.17 15.13 0.001 0.001 0.114 0.000 0.000 0.005 0.009 0.000 0.003 0.002BLT03-30 18.72 18.65 0.001 0.001 0.118 0.000 0.000 0.008 0.021 0.001 0.007 0.005BLT03-60 18.79 18.71 0.001 0.001 0.126 0.000 0.000 0.007 0.025 0.001 0.007 0.005BLT03-120 17.35 17.27 0.001 0.001 0.180 0.000 0.000 0.005 0.025 0.001 0.007 0.005final filtrate 1237.08 1229.70 0.109 0.068 13.158 0.016 0.008 0.350 2.137 0.082 0.615 0.353wash water 551.88 553.11 0.011 0.008 1.167 0.002 0.001 0.038 0.247 0.010 0.070 0.038cake moisture 79.10 79.10 0.002 0.001 0.167 0.000 0.000 0.005 0.035 0.001 0.010 0.005evaporation 36.16 36.23 - - - - - - - - - -total OUT (g) 2044.19 1.10 0.49 15.13 0.05 0.34 7.68 12.49 0.14 1.45 13.87
balance (out/in) 98% 100% 106% 14184% 131% 86% 92% 79% 80% 93% 96%
extraction (solution) Al Ca Co Cr Fe Mg Mn Ni Si Zn
BLT03-2 6% 15% 18% 1% 6% 6% 20% 22% 1% 14%BLT03-30 9% 16% 29% 2% 7% 11% 34% 35% 3% 19%BLT03-60 10% 16% 37% 2% 7% 12% 39% 37% 3% 19%BLT03-120 10% 16% 40% 2% 5% 14% 43% 39% 3% 21%BLT03-180 12% 17% 48% 2% 5% 16% 54% 47% 3% 22%
extraction (solids) Al Ca Co Cr Fe Mg Mn Ni Si Zn
BLT03-180 7% 7% 12% 12% 9% 33% 73% 51% 2% 12%
extraction (ratio) Al Ca Co Cr Fe Mg Mn Ni Si Zn
BLT03-2 3% 6% 5% 6% 10% 12% 27% 23% 1% 8%BLT03-30 5% 7% 7% 10% 13% 22% 45% 37% 2% 10%BLT03-60 5% 7% 9% 10% 12% 25% 52% 39% 2% 11%BLT03-120 6% 7% 10% 10% 9% 28% 57% 42% 2% 11%BLT03-180 7% 7% 12% 12% 9% 33% 73% 51% 2% 12%
based on solids assayacid consumption g consumed kg/t ore Al Fe Mg Ni totalBLT03-180 9.04 113acid equivalent (g) 0.50 2.18 17.39 1.02 21.09acid equivalent (%) 2.4 10.3 82.4 4.8 100.0
1476.41464.41452.3
calc. total soln volumeml
1488.11482.5
calc. total soln volumeml
1488.11482.5
70.1
calc. total solid massg
1476.41464.41452.3
0.0
0.2
0.4
0.6
0.8
1.0
1.2
1.4
1.6
0 50 100 150
time (min)
pH
0%10%20%30%40%50%60%70%80%90%
100%
0 50 100 150 200
time (min)
extr
actio
n
Ni Mg Al Fe
Fe10%
Mg83%
Al2%Ni
5%
APPENDIX A - Leach Test Sheets
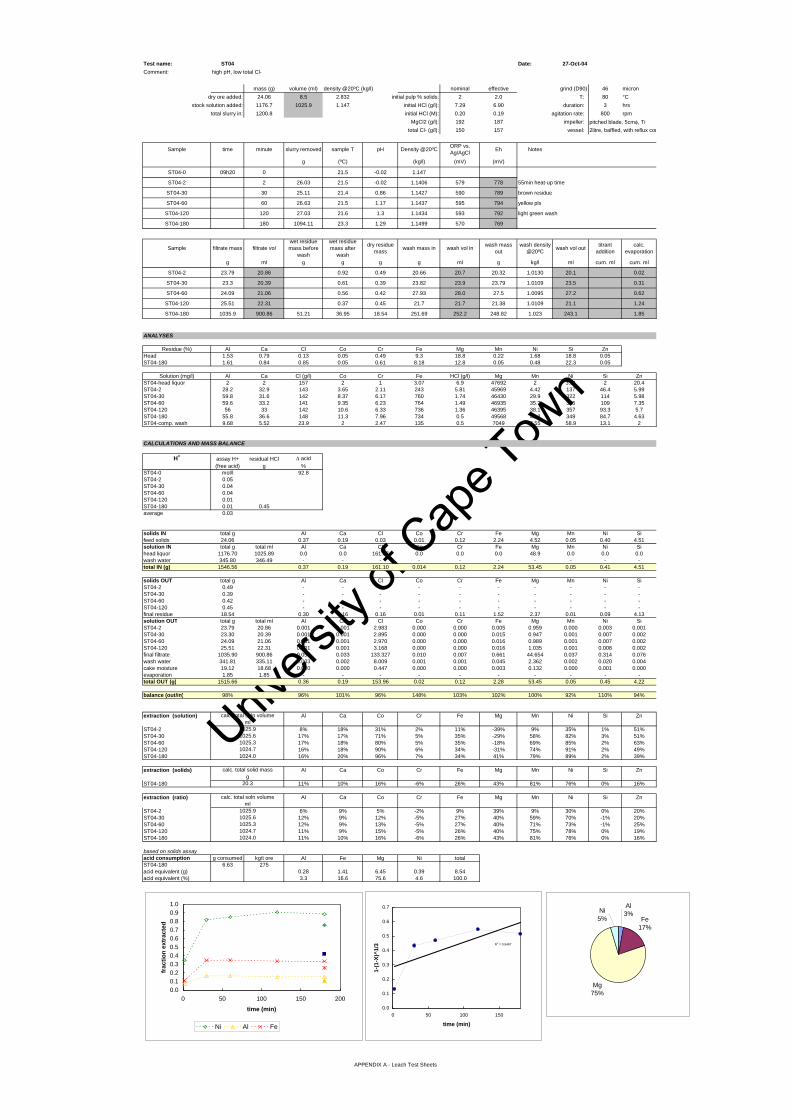
Univers
ity of
Cap
e Tow
n
Test name: ST04 Date: 27-Oct-04Comment: high pH, low total Cl-
mass (g) volume (ml) density @20ºC (kg/l) nominal effective grind (D90) 46 microndry ore added: 24.06 8.5 2.832 initial pulp % solids: 2 2.0 T: 80 °C
stock solution added: 1176.7 1025.9 1.147 initial HCl (g/l): 7.29 6.90 duration: 3 hrstotal slurry in: 1200.8 initial HCl (M): 0.20 0.19 agitation rate: 800 rpm
MgCl2 (g/l): 192 187 impeller: pitched blade, 5cmφ, Titotal Cl- (g/l): 150 157 vessel: 2litre, baffled, with reflux condenser
Sample time minute slurry removed sample T pH Density @20ºC ORP vs. Ag/AgCl Eh Notes
g (ºC) (kg/l) (mV) (mV)
ST04-0 09h20 0 21.5 -0.02 1.147
ST04-2 2 26.03 21.5 -0.02 1.1406 579 778 55min heat-up time
ST04-30 30 25.11 21.4 0.86 1.1427 590 789 brown residue
ST04-60 60 26.63 21.5 1.17 1.1437 595 794 yellow pls
ST04-120 120 27.03 21.6 1.3 1.1434 593 792 light green wash
ST04-180 180 1094.11 23.3 1.29 1.1499 570 769
Sample filtrate mass filtrate volwet residue mass before
wash
wet residue mass after
wash
dry residue mass wash mass in wash vol in wash mass
outwash density
@20ºC wash vol out titrant addition
calc. evaporation
g ml g g g g ml g kg/l ml cum. ml cum. ml
ST04-2 23.79 20.86 0.92 0.49 20.66 20.7 20.32 1.0130 20.1 0.02
ST04-30 23.3 20.39 0.61 0.39 23.82 23.9 23.79 1.0109 23.5 0.31
ST04-60 24.09 21.06 0.56 0.42 27.93 28.0 27.5 1.0095 27.2 0.62
ST04-120 25.51 22.31 0.37 0.45 21.7 21.7 21.38 1.0109 21.1 1.24
ST04-180 1035.9 900.86 51.21 36.95 18.54 251.69 252.2 248.82 1.023 243.1 1.85
ANALYSES
Residue (%) Al Ca Cl Co Cr Fe Mg Mn Ni Si ZnHead 1.53 0.79 0.13 0.05 0.49 9.3 18.8 0.22 1.68 18.8 0.05ST04-180 1.61 0.84 0.85 0.05 0.61 8.18 12.8 0.05 0.48 22.3 0.05
Solution (mg/l) Al Ca Cl (g/l) Co Cr Fe HCl (g/l) Mg Mn Ni Si ZnST04-head liquor 2 2 157 2 1 3.07 6.9 47692 2 3.51 2 20.4ST04-2 28.2 32.9 143 3.65 2.11 243 5.81 45969 4.42 137 46.4 5.99ST04-30 59.8 31.6 142 8.37 6.17 760 1.74 46430 29.9 322 114 5.98ST04-60 59.6 33.2 141 9.35 6.23 764 1.49 46935 35.7 335 109 7.35ST04-120 56 33 142 10.6 6.33 736 1.36 46395 38.1 357 93.3 5.7ST04-180 55.8 36.6 148 11.3 7.96 734 0.5 49568 40.8 349 84.7 4.63ST04-comp. wash 9.68 5.52 23.9 2 2.47 135 0.5 7049 6.55 58.9 13.1 2
CALCULATIONS AND MASS BALANCE
H+ assay H+ residual HCl ∆ acid(free acid) g %
ST04-0 mol/l 92.8ST04-2 0.05ST04-30 0.04ST04-60 0.04ST04-120 0.01ST04-180 0.01 0.45average 0.03
solids IN total g Al Ca Cl Co Cr Fe Mg Mn Ni Sifeed solids 24.06 0.37 0.19 0.03 0.01 0.12 2.24 4.52 0.05 0.40 4.51solution IN total g total ml Al Ca Cl Co Cr Fe Mg Mn Ni Sihead liquor 1176.70 1025.89 0.0 0.0 161.07 0.0 0.0 0.0 48.9 0.0 0.0 0.0wash water 345.80 346.49 - - - - - - - - - -total IN (g) 1546.56 0.37 0.19 161.10 0.014 0.12 2.24 53.45 0.05 0.41 4.51
solids OUT total g Al Ca Cl Co Cr Fe Mg Mn Ni SiST04-2 0.49 - - - - - - - - - -ST04-30 0.39 - - - - - - - - - -ST04-60 0.42 - - - - - - - - - -ST04-120 0.45 - - - - - - - - - -final residue 18.54 0.30 0.16 0.16 0.01 0.11 1.52 2.37 0.01 0.09 4.13solution OUT total g total ml Al Ca Cl Co Cr Fe Mg Mn Ni SiST04-2 23.79 20.86 0.001 0.001 2.983 0.000 0.000 0.005 0.959 0.000 0.003 0.001ST04-30 23.30 20.39 0.001 0.001 2.895 0.000 0.000 0.015 0.947 0.001 0.007 0.002ST04-60 24.09 21.06 0.001 0.001 2.970 0.000 0.000 0.016 0.989 0.001 0.007 0.002ST04-120 25.51 22.31 0.001 0.001 3.168 0.000 0.000 0.016 1.035 0.001 0.008 0.002final filtrate 1035.90 900.86 0.050 0.033 133.327 0.010 0.007 0.661 44.654 0.037 0.314 0.076wash water 341.81 335.11 0.003 0.002 8.009 0.001 0.001 0.045 2.362 0.002 0.020 0.004cake moisture 19.12 18.68 0.000 0.000 0.447 0.000 0.000 0.003 0.132 0.000 0.001 0.000evaporation 1.85 1.85 - - - - - - - - - -total OUT (g) 1515.66 0.36 0.19 153.96 0.02 0.12 2.28 53.45 0.05 0.45 4.22
balance (out/in) 98% 96% 101% 96% 148% 103% 102% 100% 92% 110% 94%
extraction (solution) Al Ca Co Cr Fe Mg Mn Ni Si Zn
ST04-2 8% 18% 31% 2% 11% -39% 9% 35% 1% 51%ST04-30 17% 17% 71% 5% 35% -29% 58% 82% 3% 51%ST04-60 17% 18% 80% 5% 35% -18% 69% 85% 2% 63%ST04-120 16% 18% 90% 6% 34% -31% 74% 91% 2% 49%ST04-180 16% 20% 96% 7% 34% 41% 79% 89% 2% 39%
extraction (solids) Al Ca Co Cr Fe Mg Mn Ni Si Zn
ST04-180 11% 10% 16% -6% 26% 43% 81% 76% 0% 16%
extraction (ratio) Al Ca Co Cr Fe Mg Mn Ni Si Zn
ST04-2 6% 9% 5% -2% 9% 39% 9% 30% 0% 20%ST04-30 12% 9% 12% -5% 27% 40% 59% 70% -1% 20%ST04-60 12% 9% 13% -5% 27% 40% 71% 73% -1% 25%ST04-120 11% 9% 15% -5% 26% 40% 75% 78% 0% 19%ST04-180 11% 10% 16% -6% 26% 43% 81% 76% 0% 16%
based on solids assayacid consumption g consumed kg/t ore Al Fe Mg Ni totalST04-180 6.63 275acid equivalent (g) 0.28 1.41 6.45 0.39 8.54acid equivalent (%) 3.3 16.6 75.6 4.6 100.0
20.3
calc. total solid massg
1025.31024.71024.0
calc. total soln volumeml
1025.91025.6
1025.31024.71024.0
calc. total soln volumeml
1025.91025.6
R2 = 0.5487
0.0
0.1
0.2
0.3
0.4
0.5
0.6
0.7
0 50 100 150
time (min)
1-(1
-X)^
1/3
0.00.10.20.30.40.50.60.70.80.91.0
0 50 100 150 200
time (min)
frac
tion
extr
acte
d
Ni Al Fe
Fe17%
Mg75%
Al3%Ni
5%
APPENDIX A - Leach Test Sheets
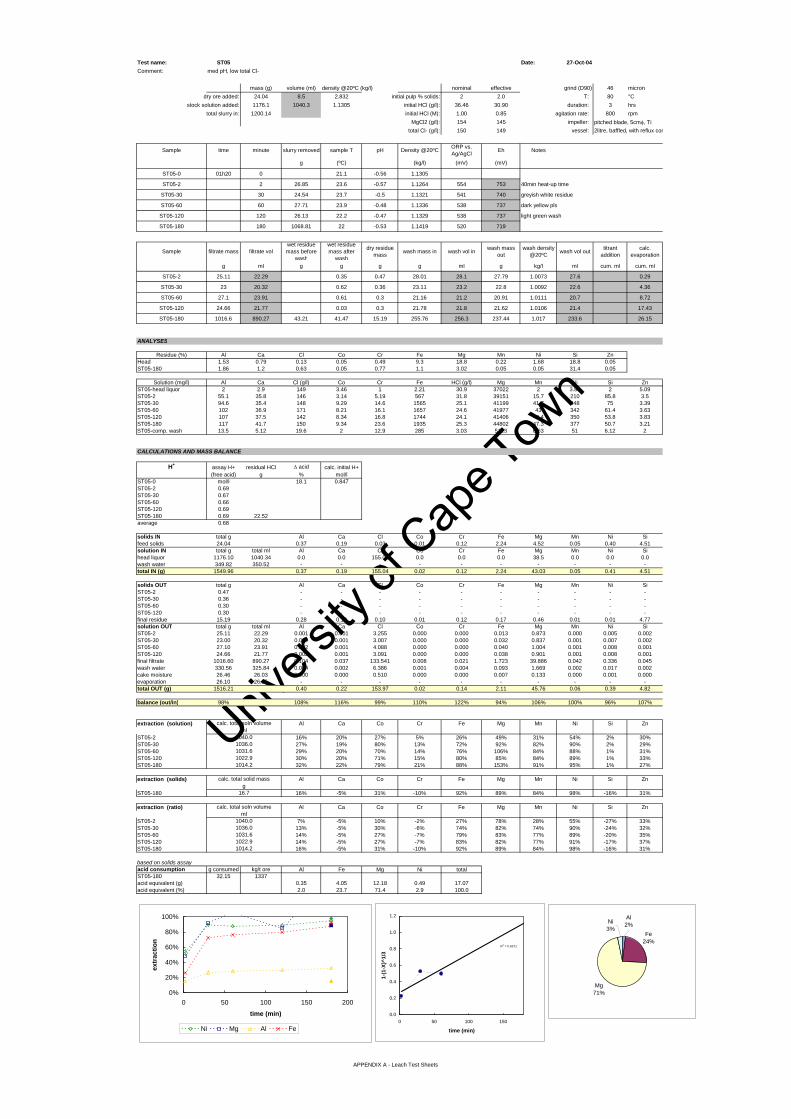
Univers
ity of
Cap
e Tow
n
Test name: ST05 Date: 27-Oct-04Comment: med pH, low total Cl-
mass (g) volume (ml) density @20ºC (kg/l) nominal effective grind (D90) 46 microndry ore added: 24.04 8.5 2.832 initial pulp % solids: 2 2.0 T: 80 °C
stock solution added: 1176.1 1040.3 1.1305 initial HCl (g/l): 36.46 30.90 duration: 3 hrstotal slurry in: 1200.14 initial HCl (M): 1.00 0.85 agitation rate: 800 rpm
MgCl2 (g/l): 154 145 impeller: pitched blade, 5cmφ, Titotal Cl- (g/l): 150 149 vessel: 2litre, baffled, with reflux condenser
Sample time minute slurry removed sample T pH Density @20ºC ORP vs. Ag/AgCl Eh Notes
g (ºC) (kg/l) (mV) (mV)
ST05-0 01h20 0 21.1 -0.56 1.1305
ST05-2 2 26.85 23.6 -0.57 1.1264 554 753 40min heat-up time
ST05-30 30 24.54 23.7 -0.5 1.1321 541 740 greyish white residue
ST05-60 60 27.71 23.9 -0.48 1.1336 538 737 dark yellow pls
ST05-120 120 26.13 22.2 -0.47 1.1329 538 737 light green wash
ST05-180 180 1068.81 22 -0.53 1.1419 520 719
Sample filtrate mass filtrate volwet residue mass before
wash
wet residue mass after
wash
dry residue mass wash mass in wash vol in wash mass
outwash density
@20ºC wash vol out titrant addition
calc. evaporation
g ml g g g g ml g kg/l ml cum. ml cum. ml
ST05-2 25.11 22.29 0.35 0.47 28.01 28.1 27.79 1.0073 27.6 0.29
ST05-30 23 20.32 0.62 0.36 23.11 23.2 22.8 1.0092 22.6 4.36
ST05-60 27.1 23.91 0.61 0.3 21.16 21.2 20.91 1.0111 20.7 8.72
ST05-120 24.66 21.77 0.03 0.3 21.78 21.8 21.62 1.0106 21.4 17.43
ST05-180 1016.6 890.27 43.21 41.47 15.19 255.76 256.3 237.44 1.017 233.6 26.15
ANALYSES
Residue (%) Al Ca Cl Co Cr Fe Mg Mn Ni Si ZnHead 1.53 0.79 0.13 0.05 0.49 9.3 18.8 0.22 1.68 18.8 0.05ST05-180 1.86 1.2 0.63 0.05 0.77 1.1 3.02 0.05 0.05 31.4 0.05
Solution (mg/l) Al Ca Cl (g/l) Co Cr Fe HCl (g/l) Mg Mn Ni Si ZnST05-head liquor 2 2.9 149 3.46 1 2.21 30.9 37022 2 3.83 2 5.09ST05-2 55.1 35.8 146 3.14 5.19 567 31.8 39151 15.7 210 85.8 3.5ST05-30 94.6 35.4 148 9.29 14.6 1565 25.1 41199 41.7 348 75 3.39ST05-60 102 36.9 171 8.21 16.1 1657 24.6 41977 43 342 61.4 3.63ST05-120 107 37.5 142 8.34 16.8 1744 24.1 41406 43.4 350 53.8 3.83ST05-180 117 41.7 150 9.34 23.6 1935 25.3 44802 47.3 377 50.7 3.21ST05-comp. wash 13.5 5.12 19.6 2 12.9 285 3.03 5123 6.63 51 6.12 2
CALCULATIONS AND MASS BALANCE
H+ assay H+ residual HCl ∆ acid calc. initial H+(free acid) g % mol/l
ST05-0 mol/l 18.1 0.847ST05-2 0.69ST05-30 0.67ST05-60 0.66ST05-120 0.69ST05-180 0.69 22.52average 0.68
solids IN total g Al Ca Cl Co Cr Fe Mg Mn Ni Sifeed solids 24.04 0.37 0.19 0.03 0.01 0.12 2.24 4.52 0.05 0.40 4.51solution IN total g total ml Al Ca Cl Co Cr Fe Mg Mn Ni Sihead liquor 1176.10 1040.34 0.0 0.0 155.01 0.0 0.0 0.0 38.5 0.0 0.0 0.0wash water 349.82 350.52 - - - - - - - - - -total IN (g) 1549.96 0.37 0.19 155.04 0.02 0.12 2.24 43.03 0.05 0.41 4.51
solids OUT total g Al Ca Cl Co Cr Fe Mg Mn Ni SiST05-2 0.47 - - - - - - - - - -ST05-30 0.36 - - - - - - - - - -ST05-60 0.30 - - - - - - - - - -ST05-120 0.30 - - - - - - - - - -final residue 15.19 0.28 0.18 0.10 0.01 0.12 0.17 0.46 0.01 0.01 4.77solution OUT total g total ml Al Ca Cl Co Cr Fe Mg Mn Ni SiST05-2 25.11 22.29 0.001 0.001 3.255 0.000 0.000 0.013 0.873 0.000 0.005 0.002ST05-30 23.00 20.32 0.002 0.001 3.007 0.000 0.000 0.032 0.837 0.001 0.007 0.002ST05-60 27.10 23.91 0.002 0.001 4.088 0.000 0.000 0.040 1.004 0.001 0.008 0.001ST05-120 24.66 21.77 0.002 0.001 3.091 0.000 0.000 0.038 0.901 0.001 0.008 0.001final filtrate 1016.60 890.27 0.104 0.037 133.541 0.008 0.021 1.723 39.886 0.042 0.336 0.045wash water 330.56 325.84 0.004 0.002 6.386 0.001 0.004 0.093 1.669 0.002 0.017 0.002cake moisture 26.46 26.03 0.000 0.000 0.510 0.000 0.000 0.007 0.133 0.000 0.001 0.000evaporation 26.10 26.15 - - - - - - - - - -total OUT (g) 1516.21 0.40 0.22 153.97 0.02 0.14 2.11 45.76 0.06 0.39 4.82
balance (out/in) 98% 108% 116% 99% 110% 122% 94% 106% 100% 96% 107%
extraction (solution) Al Ca Co Cr Fe Mg Mn Ni Si Zn
ST05-2 16% 20% 27% 5% 26% 49% 31% 54% 2% 30%ST05-30 27% 19% 80% 13% 72% 92% 82% 90% 2% 29%ST05-60 29% 20% 70% 14% 76% 106% 84% 88% 1% 31%ST05-120 30% 20% 71% 15% 80% 85% 84% 89% 1% 33%ST05-180 32% 22% 79% 21% 88% 153% 91% 95% 1% 27%
extraction (solids) Al Ca Co Cr Fe Mg Mn Ni Si Zn
ST05-180 16% -5% 31% -10% 92% 89% 84% 98% -16% 31%
extraction (ratio) Al Ca Co Cr Fe Mg Mn Ni Si Zn
ST05-2 7% -5% 10% -2% 27% 78% 28% 55% -27% 33%ST05-30 13% -5% 30% -6% 74% 82% 74% 90% -24% 32%ST05-60 14% -5% 27% -7% 79% 83% 77% 89% -20% 35%ST05-120 14% -5% 27% -7% 83% 82% 77% 91% -17% 37%ST05-180 16% -5% 31% -10% 92% 89% 84% 98% -16% 31%
based on solids assayacid consumption g consumed kg/t ore Al Fe Mg Ni totalST05-180 32.15 1337acid equivalent (g) 0.35 4.05 12.18 0.49 17.07acid equivalent (%) 2.0 23.7 71.4 2.9 100.0
1031.61022.91014.2
calc. total soln volumeml
1040.01036.0
calc. total soln volumeml
1040.01036.0
16.7
calc. total solid massg
1031.61022.91014.2
R2 = 0.6571
0.0
0.2
0.4
0.6
0.8
1.0
1.2
0 50 100 150
time (min)
1-(1
-X)^
1/3
0%
20%
40%
60%
80%
100%
0 50 100 150 200
time (min)
extr
actio
n
Ni Mg Al Fe
Fe24%
Mg71%
Al2%Ni
3%
APPENDIX A - Leach Test Sheets
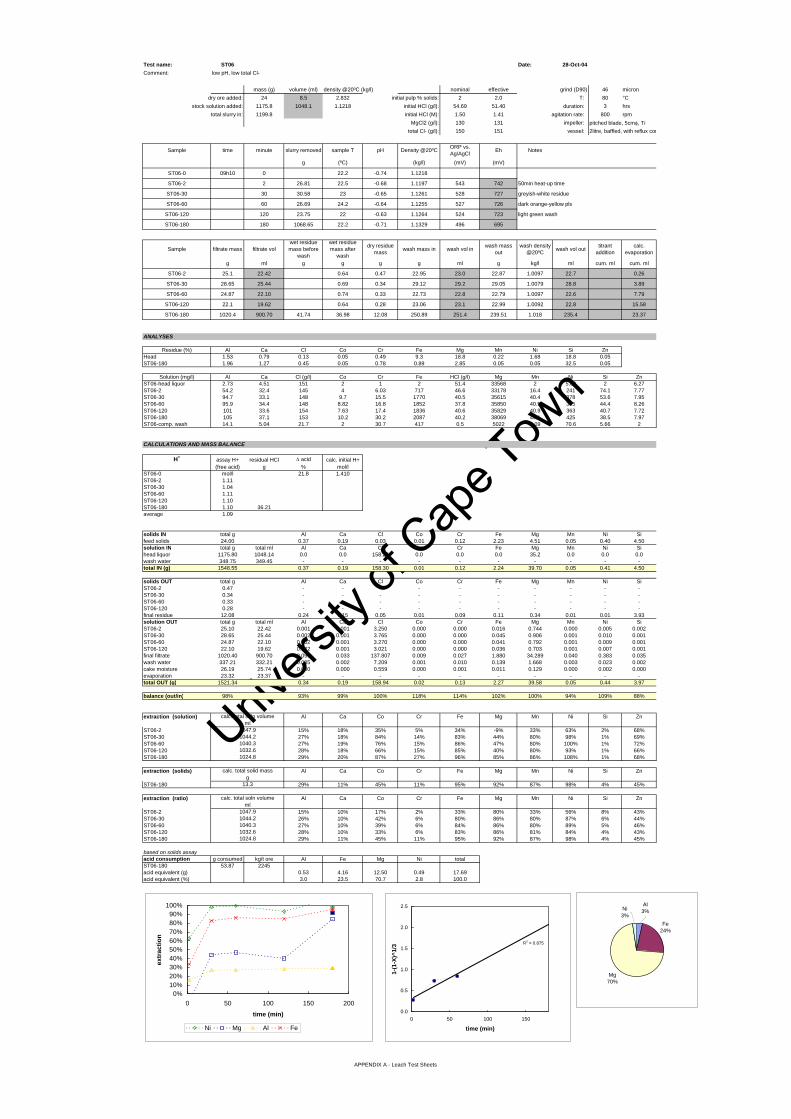
Univers
ity of
Cap
e Tow
n
Test name: ST06 Date: 28-Oct-04Comment: low pH, low total Cl-
mass (g) volume (ml) density @20ºC (kg/l) nominal effective grind (D90) 46 microndry ore added: 24 8.5 2.832 initial pulp % solids: 2 2.0 T: 80 °C
stock solution added: 1175.8 1048.1 1.1218 initial HCl (g/l): 54.69 51.40 duration: 3 hrstotal slurry in: 1199.8 initial HCl (M): 1.50 1.41 agitation rate: 800 rpm
MgCl2 (g/l): 130 131 impeller: pitched blade, 5cmφ, Titotal Cl- (g/l): 150 151 vessel: 2litre, baffled, with reflux condenser
Sample time minute slurry removed sample T pH Density @20ºC ORP vs. Ag/AgCl Eh Notes
g (ºC) (kg/l) (mV) (mV)
ST06-0 09h10 0 22.2 -0.74 1.1218
ST06-2 2 26.81 22.5 -0.68 1.1197 543 742 50min heat-up time
ST06-30 30 30.58 23 -0.65 1.1261 528 727 greyish-white residue
ST06-60 60 26.69 24.2 -0.64 1.1255 527 726 dark orange-yellow pls
ST06-120 120 23.75 22 -0.63 1.1264 524 723 light green wash
ST06-180 180 1068.65 22.2 -0.71 1.1329 496 695
Sample filtrate mass filtrate volwet residue mass before
wash
wet residue mass after
wash
dry residue mass wash mass in wash vol in wash mass
outwash density
@20ºC wash vol out titrant addition
calc. evaporation
g ml g g g g ml g kg/l ml cum. ml cum. ml
ST06-2 25.1 22.42 0.64 0.47 22.95 23.0 22.87 1.0097 22.7 0.26
ST06-30 28.65 25.44 0.69 0.34 29.12 29.2 29.05 1.0079 28.8 3.89
ST06-60 24.87 22.10 0.74 0.33 22.73 22.8 22.79 1.0097 22.6 7.79
ST06-120 22.1 19.62 0.64 0.28 23.06 23.1 22.99 1.0092 22.8 15.58
ST06-180 1020.4 900.70 41.74 36.98 12.08 250.89 251.4 239.51 1.018 235.4 23.37
ANALYSES
Residue (%) Al Ca Cl Co Cr Fe Mg Mn Ni Si ZnHead 1.53 0.79 0.13 0.05 0.49 9.3 18.8 0.22 1.68 18.8 0.05ST06-180 1.96 1.27 0.45 0.05 0.78 0.89 2.85 0.05 0.05 32.5 0.05
Solution (mg/l) Al Ca Cl (g/l) Co Cr Fe HCl (g/l) Mg Mn Ni Si ZnST06-head liquor 2.73 4.51 151 2 1 2 51.4 33568 2 5.63 2 6.27ST06-2 54.2 32.4 145 4 6.03 717 46.6 33178 16.4 241 74.1 7.77ST06-30 94.7 33.1 148 9.7 15.5 1770 40.5 35615 40.4 378 53.6 7.95ST06-60 95.9 34.4 148 8.82 16.8 1852 37.8 35850 40.5 385 44.4 8.26ST06-120 101 33.6 154 7.63 17.4 1836 40.6 35829 40.9 363 40.7 7.72ST06-180 105 37.1 153 10.2 30.2 2087 40.2 38069 44.1 425 38.5 7.97ST06-comp. wash 14.1 5.04 21.7 2 30.7 417 0.5 5022 8.09 70.6 5.66 2
CALCULATIONS AND MASS BALANCE
H+ assay H+ residual HCl ∆ acid calc. initial H+(free acid) g % mol/l
ST06-0 mol/l 21.8 1.410ST06-2 1.11ST06-30 1.04ST06-60 1.11ST06-120 1.10ST06-180 1.10 36.21average 1.09
solids IN total g Al Ca Cl Co Cr Fe Mg Mn Ni Sifeed solids 24.00 0.37 0.19 0.03 0.01 0.12 2.23 4.51 0.05 0.40 4.50solution IN total g total ml Al Ca Cl Co Cr Fe Mg Mn Ni Sihead liquor 1175.80 1048.14 0.0 0.0 158.27 0.0 0.0 0.0 35.2 0.0 0.0 0.0wash water 348.75 349.45 - - - - - - - - - -total IN (g) 1548.55 0.37 0.19 158.30 0.01 0.12 2.24 39.70 0.05 0.41 4.50
solids OUT total g Al Ca Cl Co Cr Fe Mg Mn Ni SiST06-2 0.47 - - - - - - - - - -ST06-30 0.34 - - - - - - - - - -ST06-60 0.33 - - - - - - - - - -ST06-120 0.28 - - - - - - - - - -final residue 12.08 0.24 0.15 0.05 0.01 0.09 0.11 0.34 0.01 0.01 3.93solution OUT total g total ml Al Ca Cl Co Cr Fe Mg Mn Ni SiST06-2 25.10 22.42 0.001 0.001 3.250 0.000 0.000 0.016 0.744 0.000 0.005 0.002ST06-30 28.65 25.44 0.002 0.001 3.765 0.000 0.000 0.045 0.906 0.001 0.010 0.001ST06-60 24.87 22.10 0.002 0.001 3.270 0.000 0.000 0.041 0.792 0.001 0.009 0.001ST06-120 22.10 19.62 0.002 0.001 3.021 0.000 0.000 0.036 0.703 0.001 0.007 0.001final filtrate 1020.40 900.70 0.095 0.033 137.807 0.009 0.027 1.880 34.289 0.040 0.383 0.035wash water 337.21 332.21 0.005 0.002 7.209 0.001 0.010 0.139 1.668 0.003 0.023 0.002cake moisture 26.19 25.74 0.000 0.000 0.559 0.000 0.001 0.011 0.129 0.000 0.002 0.000evaporation 23.32 23.37 - - - - - - - - - -total OUT (g) 1521.34 0.34 0.19 158.94 0.02 0.13 2.27 39.58 0.05 0.44 3.97
balance (out/in) 98% 93% 99% 100% 118% 114% 102% 100% 94% 109% 88%
extraction (solution) Al Ca Co Cr Fe Mg Mn Ni Si Zn
ST06-2 15% 18% 35% 5% 34% -9% 33% 63% 2% 68%ST06-30 27% 18% 84% 14% 83% 44% 80% 98% 1% 69%ST06-60 27% 19% 76% 15% 86% 47% 80% 100% 1% 72%ST06-120 28% 18% 66% 15% 85% 40% 80% 93% 1% 66%ST06-180 29% 20% 87% 27% 96% 85% 86% 108% 1% 68%
extraction (solids) Al Ca Co Cr Fe Mg Mn Ni Si Zn
ST06-180 29% 11% 45% 11% 95% 92% 87% 98% 4% 45%
extraction (ratio) Al Ca Co Cr Fe Mg Mn Ni Si Zn
ST06-2 15% 10% 17% 2% 33% 80% 33% 56% 8% 43%ST06-30 26% 10% 42% 6% 80% 86% 80% 87% 6% 44%ST06-60 27% 10% 39% 6% 84% 86% 80% 89% 5% 46%ST06-120 28% 10% 33% 6% 83% 86% 81% 84% 4% 43%ST06-180 29% 11% 45% 11% 95% 92% 87% 98% 4% 45%
based on solids assayacid consumption g consumed kg/t ore Al Fe Mg Ni totalST06-180 53.87 2245acid equivalent (g) 0.53 4.16 12.50 0.49 17.69acid equivalent (%) 3.0 23.5 70.7 2.8 100.0
13.3
calc. total solid massg
1040.31032.61024.8
calc. total soln volumeml
1047.91044.2
1040.31032.61024.8
calc. total soln volumeml
1047.91044.2
R2 = 0.875
0.0
0.5
1.0
1.5
2.0
2.5
0 50 100 150
time (min)
1-(1
-X)^
1/3
0%10%20%30%40%50%60%70%80%90%
100%
0 50 100 150 200
time (min)
extr
actio
n
Ni Mg Al Fe
Fe24%
Mg70%
Al3%Ni
3%
APPENDIX A - Leach Test Sheets
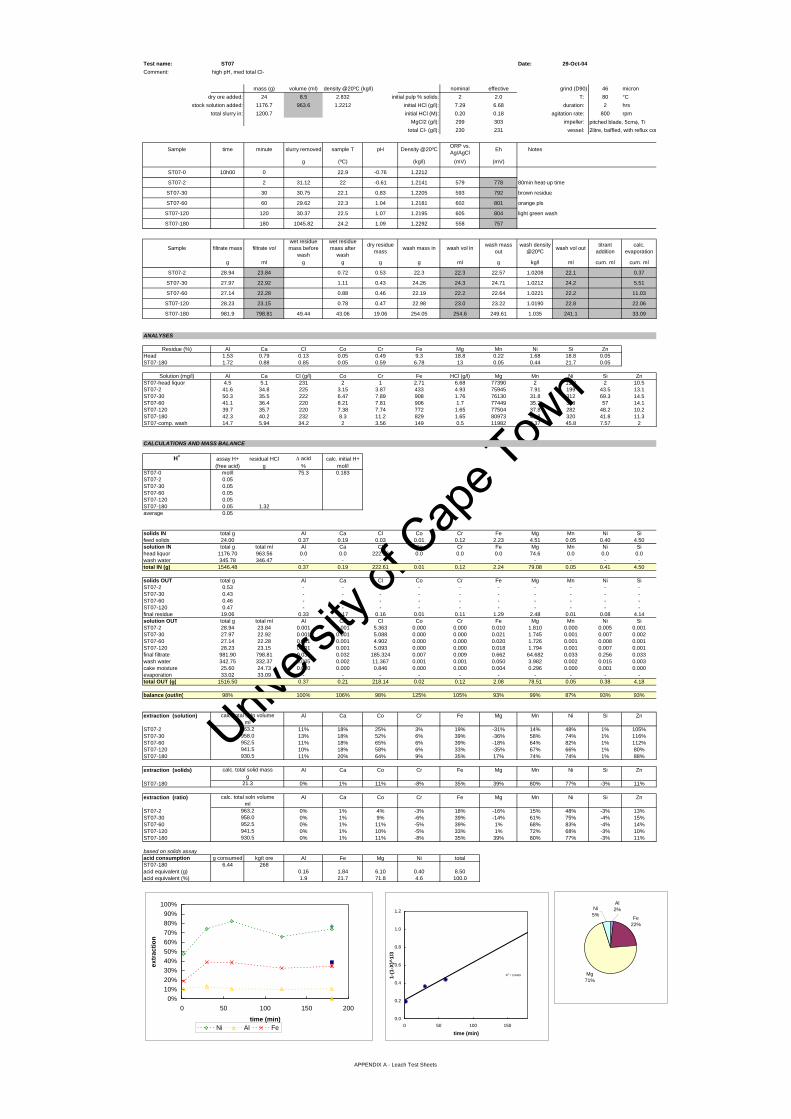
Univers
ity of
Cap
e Tow
n
Test name: ST07 Date: 29-Oct-04Comment: high pH, med total Cl-
mass (g) volume (ml) density @20ºC (kg/l) nominal effective grind (D90) 46 microndry ore added: 24 8.5 2.832 initial pulp % solids: 2 2.0 T: 80 °C
stock solution added: 1176.7 963.6 1.2212 initial HCl (g/l): 7.29 6.68 duration: 2 hrstotal slurry in: 1200.7 initial HCl (M): 0.20 0.18 agitation rate: 800 rpm
MgCl2 (g/l): 299 303 impeller: pitched blade, 5cmφ, Titotal Cl- (g/l): 230 231 vessel: 2litre, baffled, with reflux condenser
Sample time minute slurry removed sample T pH Density @20ºC ORP vs. Ag/AgCl Eh Notes
g (ºC) (kg/l) (mV) (mV)
ST07-0 10h00 0 22.9 -0.76 1.2212
ST07-2 2 31.12 22 -0.61 1.2141 579 778 80min heat-up time
ST07-30 30 30.75 22.1 0.83 1.2205 593 792 brown residue
ST07-60 60 29.62 22.3 1.04 1.2181 602 801 orange pls
ST07-120 120 30.37 22.5 1.07 1.2195 605 804 light green wash
ST07-180 180 1045.82 24.2 1.09 1.2292 558 757
Sample filtrate mass filtrate volwet residue mass before
wash
wet residue mass after
wash
dry residue mass wash mass in wash vol in wash mass
outwash density
@20ºC wash vol out titrant addition
calc. evaporation
g ml g g g g ml g kg/l ml cum. ml cum. ml
ST07-2 28.94 23.84 0.72 0.53 22.3 22.3 22.57 1.0208 22.1 0.37
ST07-30 27.97 22.92 1.11 0.43 24.26 24.3 24.71 1.0212 24.2 5.51
ST07-60 27.14 22.28 0.88 0.46 22.19 22.2 22.64 1.0221 22.2 11.03
ST07-120 28.23 23.15 0.78 0.47 22.98 23.0 23.22 1.0190 22.8 22.06
ST07-180 981.9 798.81 49.44 43.06 19.06 254.05 254.6 249.61 1.035 241.1 33.09
ANALYSES
Residue (%) Al Ca Cl Co Cr Fe Mg Mn Ni Si ZnHead 1.53 0.79 0.13 0.05 0.49 9.3 18.8 0.22 1.68 18.8 0.05ST07-180 1.72 0.88 0.85 0.05 0.59 6.78 13 0.05 0.44 21.7 0.05
Solution (mg/l) Al Ca Cl (g/l) Co Cr Fe HCl (g/l) Mg Mn Ni Si ZnST07-head liquor 4.5 5.1 231 2 1 2.71 6.68 77390 2 11.2 2 10.5ST07-2 41.6 34.8 225 3.15 3.87 433 4.93 75945 7.91 199 43.5 13.1ST07-30 50.3 35.5 222 6.47 7.89 908 1.76 76130 31.8 312 69.3 14.5ST07-60 41.1 36.4 220 8.21 7.81 906 1.7 77449 35.7 348 57 14.1ST07-120 39.7 35.7 220 7.38 7.74 772 1.65 77504 37.8 282 48.2 10.2ST07-180 42.3 40.2 232 8.3 11.2 829 1.65 80973 41.8 320 41.8 11.3ST07-comp. wash 14.7 5.94 34.2 2 3.56 149 0.5 11982 6.37 45.8 7.57 2
CALCULATIONS AND MASS BALANCE
H+ assay H+ residual HCl ∆ acid calc. initial H+(free acid) g % mol/l
ST07-0 mol/l 75.3 0.183ST07-2 0.05ST07-30 0.05ST07-60 0.05ST07-120 0.05ST07-180 0.05 1.32average 0.05
solids IN total g Al Ca Cl Co Cr Fe Mg Mn Ni Sifeed solids 24.00 0.37 0.19 0.03 0.01 0.12 2.23 4.51 0.05 0.40 4.50solution IN total g total ml Al Ca Cl Co Cr Fe Mg Mn Ni Sihead liquor 1176.70 963.56 0.0 0.0 222.58 0.0 0.0 0.0 74.6 0.0 0.0 0.0wash water 345.78 346.47 - - - - - - - - - -total IN (g) 1546.48 0.37 0.19 222.61 0.01 0.12 2.24 79.08 0.05 0.41 4.50
solids OUT total g Al Ca Cl Co Cr Fe Mg Mn Ni SiST07-2 0.53 - - - - - - - - - -ST07-30 0.43 - - - - - - - - - -ST07-60 0.46 - - - - - - - - - -ST07-120 0.47 - - - - - - - - - -final residue 19.06 0.33 0.17 0.16 0.01 0.11 1.29 2.48 0.01 0.08 4.14solution OUT total g total ml Al Ca Cl Co Cr Fe Mg Mn Ni SiST07-2 28.94 23.84 0.001 0.001 5.363 0.000 0.000 0.010 1.810 0.000 0.005 0.001ST07-30 27.97 22.92 0.001 0.001 5.088 0.000 0.000 0.021 1.745 0.001 0.007 0.002ST07-60 27.14 22.28 0.001 0.001 4.902 0.000 0.000 0.020 1.726 0.001 0.008 0.001ST07-120 28.23 23.15 0.001 0.001 5.093 0.000 0.000 0.018 1.794 0.001 0.007 0.001final filtrate 981.90 798.81 0.034 0.032 185.324 0.007 0.009 0.662 64.682 0.033 0.256 0.033wash water 342.75 332.37 0.005 0.002 11.367 0.001 0.001 0.050 3.982 0.002 0.015 0.003cake moisture 25.60 24.73 0.000 0.000 0.846 0.000 0.000 0.004 0.296 0.000 0.001 0.000evaporation 33.02 33.09 - - - - - - - - - -total OUT (g) 1516.50 0.37 0.21 218.14 0.02 0.12 2.08 78.51 0.05 0.38 4.18
balance (out/in) 98% 100% 106% 98% 125% 105% 93% 99% 87% 93% 93%
extraction (solution) Al Ca Co Cr Fe Mg Mn Ni Si Zn
ST07-2 11% 18% 25% 3% 19% -31% 14% 48% 1% 105%ST07-30 13% 18% 52% 6% 39% -36% 58% 74% 1% 116%ST07-60 11% 18% 65% 6% 39% -18% 64% 82% 1% 112%ST07-120 10% 18% 58% 6% 33% -35% 67% 66% 1% 80%ST07-180 11% 20% 64% 9% 35% 17% 74% 74% 1% 88%
extraction (solids) Al Ca Co Cr Fe Mg Mn Ni Si Zn
ST07-180 0% 1% 11% -8% 35% 39% 80% 77% -3% 11%
extraction (ratio) Al Ca Co Cr Fe Mg Mn Ni Si Zn
ST07-2 0% 1% 4% -3% 18% -16% 15% 48% -3% 13%ST07-30 0% 1% 9% -6% 39% -14% 61% 75% -4% 15%ST07-60 0% 1% 11% -5% 39% 1% 68% 83% -4% 14%ST07-120 0% 1% 10% -5% 33% 1% 72% 68% -3% 10%ST07-180 0% 1% 11% -8% 35% 39% 80% 77% -3% 11%
based on solids assayacid consumption g consumed kg/t ore Al Fe Mg Ni totalST07-180 6.44 268acid equivalent (g) 0.16 1.84 6.10 0.40 8.50acid equivalent (%) 1.9 21.7 71.8 4.6 100.0
952.5941.5930.5
calc. total soln volumeml
963.2958.0
calc. total soln volumeml
963.2958.0
21.3
calc. total solid massg
952.5941.5930.5
R2 = 0.9439
0.0
0.2
0.4
0.6
0.8
1.0
1.2
0 50 100 150
time (min)
1-(1
-X)^
1/3
0%10%20%30%40%50%60%70%80%90%
100%
0 50 100 150 200
time (min)
extr
actio
n
Ni Al Fe
Fe22%
Mg71%
Al2%Ni
5%
APPENDIX A - Leach Test Sheets
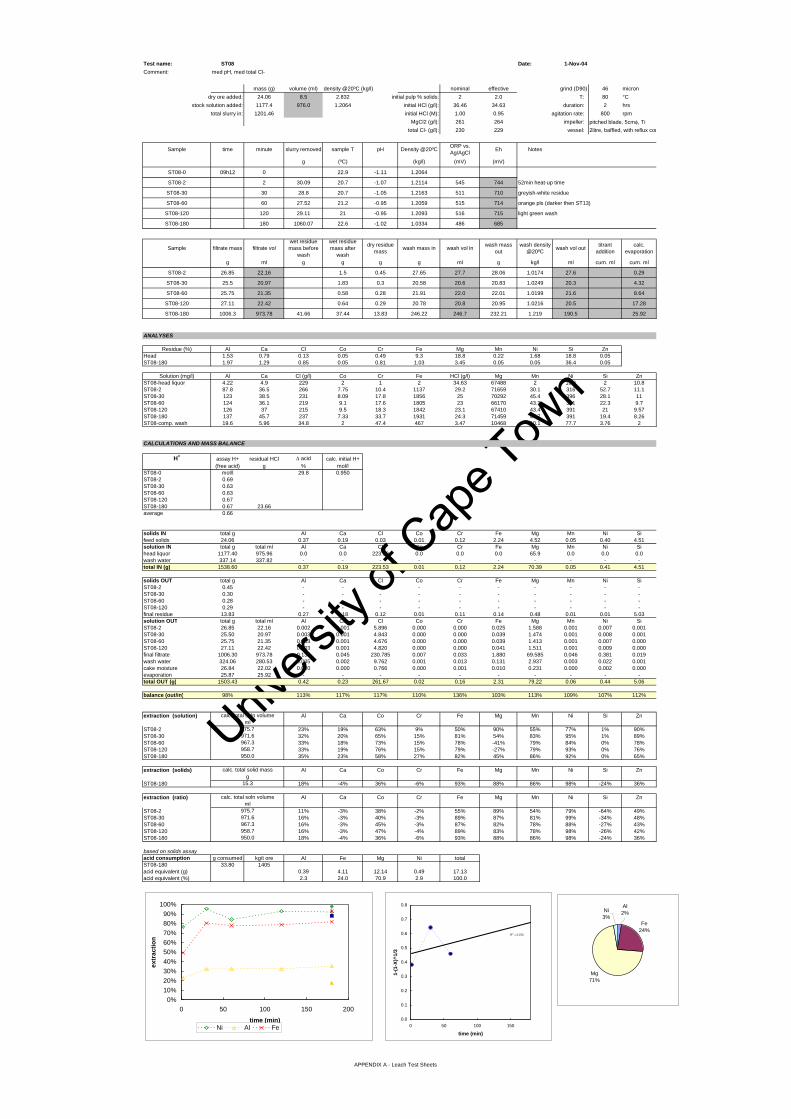
Univers
ity of
Cap
e Tow
n
Test name: ST08 Date: 1-Nov-04Comment: med pH, med total Cl-
mass (g) volume (ml) density @20ºC (kg/l) nominal effective grind (D90) 46 microndry ore added: 24.06 8.5 2.832 initial pulp % solids: 2 2.0 T: 80 °C
stock solution added: 1177.4 976.0 1.2064 initial HCl (g/l): 36.46 34.63 duration: 2 hrstotal slurry in: 1201.46 initial HCl (M): 1.00 0.95 agitation rate: 800 rpm
MgCl2 (g/l): 261 264 impeller: pitched blade, 5cmφ, Titotal Cl- (g/l): 230 229 vessel: 2litre, baffled, with reflux condenser
Sample time minute slurry removed sample T pH Density @20ºC ORP vs. Ag/AgCl Eh Notes
g (ºC) (kg/l) (mV) (mV)
ST08-0 09h12 0 22.9 -1.11 1.2064
ST08-2 2 30.09 20.7 -1.07 1.2114 545 744 52min heat-up time
ST08-30 30 28.8 20.7 -1.05 1.2163 511 710 greyish-white residue
ST08-60 60 27.52 21.2 -0.95 1.2059 515 714 orange pls (darker then ST13)
ST08-120 120 29.11 21 -0.95 1.2093 516 715 light green wash
ST08-180 180 1060.07 22.6 -1.02 1.0334 486 685
Sample filtrate mass filtrate volwet residue mass before
wash
wet residue mass after
wash
dry residue mass wash mass in wash vol in wash mass
outwash density
@20ºC wash vol out titrant addition
calc. evaporation
g ml g g g g ml g kg/l ml cum. ml cum. ml
ST08-2 26.85 22.16 1.5 0.45 27.65 27.7 28.06 1.0174 27.6 0.29
ST08-30 25.5 20.97 1.83 0.3 20.58 20.6 20.83 1.0249 20.3 4.32
ST08-60 25.75 21.35 0.58 0.28 21.91 22.0 22.01 1.0199 21.6 8.64
ST08-120 27.11 22.42 0.64 0.29 20.78 20.8 20.95 1.0216 20.5 17.28
ST08-180 1006.3 973.78 41.66 37.44 13.83 246.22 246.7 232.21 1.219 190.5 25.92
ANALYSES
Residue (%) Al Ca Cl Co Cr Fe Mg Mn Ni Si ZnHead 1.53 0.79 0.13 0.05 0.49 9.3 18.8 0.22 1.68 18.8 0.05ST08-180 1.97 1.29 0.85 0.05 0.81 1.03 3.45 0.05 0.05 36.4 0.05
Solution (mg/l) Al Ca Cl (g/l) Co Cr Fe HCl (g/l) Mg Mn Ni Si ZnST08-head liquor 4.22 4.9 229 2 1 2 34.63 67488 2 10.6 2 10.8ST08-2 87.8 36.5 266 7.75 10.4 1137 29.2 71659 30.1 316 52.7 11.1ST08-30 123 38.5 231 8.09 17.8 1856 25 70292 45.4 396 28.1 11ST08-60 124 36.1 219 9.1 17.6 1805 23 66170 43.3 351 22.3 9.7ST08-120 126 37 215 9.5 18.3 1842 23.1 67410 43.4 391 21 9.57ST08-180 137 45.7 237 7.33 33.7 1931 24.3 71459 47.7 391 19.4 8.26ST08-comp. wash 19.6 5.96 34.8 2 47.4 467 3.47 10468 10.1 77.7 3.76 2
CALCULATIONS AND MASS BALANCE
H+ assay H+ residual HCl ∆ acid calc. initial H+(free acid) g % mol/l
ST08-0 mol/l 29.8 0.950ST08-2 0.69ST08-30 0.63ST08-60 0.63ST08-120 0.67ST08-180 0.67 23.66average 0.66
solids IN total g Al Ca Cl Co Cr Fe Mg Mn Ni Sifeed solids 24.06 0.37 0.19 0.03 0.01 0.12 2.24 4.52 0.05 0.40 4.51solution IN total g total ml Al Ca Cl Co Cr Fe Mg Mn Ni Sihead liquor 1177.40 975.96 0.0 0.0 223.50 0.0 0.0 0.0 65.9 0.0 0.0 0.0wash water 337.14 337.82 - - - - - - - - - -total IN (g) 1538.60 0.37 0.19 223.53 0.01 0.12 2.24 70.39 0.05 0.41 4.51
solids OUT total g Al Ca Cl Co Cr Fe Mg Mn Ni SiST08-2 0.45 - - - - - - - - - -ST08-30 0.30 - - - - - - - - - -ST08-60 0.28 - - - - - - - - - -ST08-120 0.29 - - - - - - - - - -final residue 13.83 0.27 0.18 0.12 0.01 0.11 0.14 0.48 0.01 0.01 5.03solution OUT total g total ml Al Ca Cl Co Cr Fe Mg Mn Ni SiST08-2 26.85 22.16 0.002 0.001 5.896 0.000 0.000 0.025 1.588 0.001 0.007 0.001ST08-30 25.50 20.97 0.003 0.001 4.843 0.000 0.000 0.039 1.474 0.001 0.008 0.001ST08-60 25.75 21.35 0.003 0.001 4.676 0.000 0.000 0.039 1.413 0.001 0.007 0.000ST08-120 27.11 22.42 0.003 0.001 4.820 0.000 0.000 0.041 1.511 0.001 0.009 0.000final filtrate 1006.30 973.78 0.133 0.045 230.785 0.007 0.033 1.880 69.585 0.046 0.381 0.019wash water 324.06 280.53 0.005 0.002 9.762 0.001 0.013 0.131 2.937 0.003 0.022 0.001cake moisture 26.84 22.02 0.000 0.000 0.766 0.000 0.001 0.010 0.231 0.000 0.002 0.000evaporation 25.87 25.92 - - - - - - - - - -total OUT (g) 1503.43 0.42 0.23 261.67 0.02 0.16 2.31 79.22 0.06 0.44 5.06
balance (out/in) 98% 113% 117% 117% 110% 136% 103% 113% 109% 107% 112%
extraction (solution) Al Ca Co Cr Fe Mg Mn Ni Si Zn
ST08-2 23% 19% 63% 9% 50% 90% 55% 77% 1% 90%ST08-30 32% 20% 65% 15% 81% 54% 83% 95% 1% 89%ST08-60 33% 18% 73% 15% 78% -41% 79% 84% 0% 78%ST08-120 33% 19% 76% 15% 79% -27% 79% 93% 0% 76%ST08-180 35% 23% 58% 27% 82% 45% 86% 92% 0% 65%
extraction (solids) Al Ca Co Cr Fe Mg Mn Ni Si Zn
ST08-180 18% -4% 36% -6% 93% 88% 86% 98% -24% 36%
extraction (ratio) Al Ca Co Cr Fe Mg Mn Ni Si Zn
ST08-2 11% -3% 38% -2% 55% 89% 54% 79% -64% 49%ST08-30 16% -3% 40% -3% 89% 87% 81% 99% -34% 48%ST08-60 16% -3% 45% -3% 87% 82% 78% 88% -27% 43%ST08-120 16% -3% 47% -4% 89% 83% 78% 98% -26% 42%ST08-180 18% -4% 36% -6% 93% 88% 86% 98% -24% 36%
based on solids assayacid consumption g consumed kg/t ore Al Fe Mg Ni totalST08-180 33.80 1405acid equivalent (g) 0.39 4.11 12.14 0.49 17.13acid equivalent (%) 2.3 24.0 70.9 2.9 100.0
15.3
calc. total solid massg
967.3958.7950.0
calc. total soln volumeml
975.7971.6
967.3958.7950.0
calc. total soln volumeml
975.7971.6
R2 = 0.072
0.0
0.1
0.2
0.3
0.4
0.5
0.6
0.7
0.8
0 50 100 150
time (min)
1-(1
-X)^
1/3
0%10%20%30%40%50%60%70%80%90%
100%
0 50 100 150 200
time (min)
extr
actio
n
Ni Al Fe
Fe24%
Mg71%
Al2%Ni
3%
APPENDIX A - Leach Test Sheets

Univers
ity of
Cap
e Tow
n
Test name: ST09 Date: 1-Nov-04Comment: low pH, high total Cl-
mass (g) volume (ml) density @20ºC (kg/l) nominal effective grind (D90) 46 microndry ore added: 24.05 8.5 2.832 initial pulp % solids: 2 2.0 T: 80 °C
stock solution added: 1177.1 984.9 1.1952 initial HCl (g/l): 54.69 52.39 duration: 2 hrstotal slurry in: 1201.15 initial HCl (M): 1.50 1.44 agitation rate: 800 rpm
MgCl2 (g/l): 237 237 impeller: pitched blade, 5cmφ, Titotal Cl- (g/l): 230 226 vessel: 2litre, baffled, with reflux condenser
Sample time minute slurry removed sample T pH Density @20ºC ORP vs. Ag/AgCl Eh Notes
g (ºC) (kg/l) (mV) (mV)
ST09-0 13h12 0 22.8 -1.16 1.1952
ST09-2 2 25.9 20.9 -1.05 1.1851 552 751 47min heat-up time
ST09-30 30 30.95 22.6 -1.02 1.1921 508 707 greyish white residue
ST09-60 60 22.92 20.8 -0.98 1.1872 505 704 orange pls (darker than ST14)
ST09-120 120 31.9 21.2 -1.02 1.1924 503 702 light green wash
ST09-180 180 1086.36 22.7 -1.06 1.2021 463 662
Sample filtrate mass filtrate volwet residue mass before
wash
wet residue mass after
wash
dry residue mass wash mass in wash vol in wash mass
outwash density
@20ºC wash vol out titrant addition
calc. evaporation
g ml g g g g ml g kg/l ml cum. ml cum. ml
ST09-2 23.91 20.18 0.44 0.33 27.92 28.0 28.12 1.0149 27.7 0.03
ST09-30 29.02 24.34 0.75 0.31 22.5 22.5 22.48 1.0165 22.1 0.52
ST09-60 22.42 18.88 0.44 0.19 23.97 24.0 24.03 1.0176 23.6 1.04
ST09-120 29.79 24.98 0.69 0.3 23.21 23.3 23.48 1.0183 23.1 2.08
ST09-180 1032.1 858.58 41.75 35.91 13.29 241.9 242.4 208.03 1.029 202.1 3.13
ANALYSES
Residue (%) Al Ca Cl Co Cr Fe Mg Mn Ni Si ZnHead 1.53 0.79 0.13 0.05 0.49 9.3 18.8 0.22 1.68 18.8 0.05ST09-180 1.99 1.33 0.63 0.05 0.83 1 3.48 0.05 0.05 38.3 0.05
Solution (mg/l) Al Ca Cl (g/l) Co Cr Fe HCl (g/l) Mg Mn Ni Si ZnST09-head liquor 3.81 3.03 226 2 1 2 52.39 60466 2 9.48 2 10.3ST09-2 66.9 30.9 218 3.09 7.83 845 43.3 58422 22.2 264 40.7 6.37ST09-30 110 34.2 230 7.75 16.2 1603 37.7 62521 41.8 329 26.5 6.44ST09-60 112 33.7 259 6.05 16.3 1597 35.9 60335 40 319 22.5 6.09ST09-120 122 34.8 235 7.92 17.1 1623 37 62217 41.7 329 20.6 6.67ST09-180 128 42.2 262 8.31 38.3 1858 37.9 65896 46.1 365 19.7 6.86ST09-comp. wash 18.3 5.94 35.3 2 49 434 5.48 8792 9.99 71.4 3.79 2
CALCULATIONS AND MASS BALANCE
H+ assay H+ residual HCl ∆ acid calc. initial H+(free acid) g % mol/l
ST09-0 mol/l 27.7 1.437ST09-2 1.03ST09-30 0.98ST09-60 1.01ST09-120 1.04ST09-180 1.04 32.54average 1.02
solids IN total g Al Ca Cl Co Cr Fe Mg Mn Ni Sifeed solids 24.05 0.37 0.19 0.03 0.01 0.12 2.24 4.52 0.05 0.40 4.51solution IN total g total ml Al Ca Cl Co Cr Fe Mg Mn Ni Sihead liquor 1177.10 984.86 0.0 0.0 222.58 0.0 0.0 0.0 59.6 0.0 0.0 0.0wash water 339.50 340.18 - - - - - - - - - -total IN (g) 1540.65 0.37 0.19 222.61 0.01 0.12 2.24 64.07 0.05 0.41 4.51
solids OUT total g Al Ca Cl Co Cr Fe Mg Mn Ni SiST09-2 0.33 - - - - - - - - - -ST09-30 0.31 - - - - - - - - - -ST09-60 0.19 - - - - - - - - - -ST09-120 0.30 - - - - - - - - - -final residue 13.29 0.26 0.18 0.08 0.01 0.11 0.13 0.46 0.01 0.01 5.09solution OUT total g total ml Al Ca Cl Co Cr Fe Mg Mn Ni SiST09-2 23.91 20.18 0.001 0.001 4.398 0.000 0.000 0.017 1.179 0.000 0.005 0.001ST09-30 29.02 24.34 0.003 0.001 5.599 0.000 0.000 0.039 1.522 0.001 0.008 0.001ST09-60 22.42 18.88 0.002 0.001 4.891 0.000 0.000 0.030 1.139 0.001 0.006 0.000ST09-120 29.79 24.98 0.003 0.001 5.871 0.000 0.000 0.041 1.554 0.001 0.008 0.001final filtrate 1032.10 858.58 0.110 0.036 224.948 0.007 0.033 1.595 56.577 0.040 0.313 0.017wash water 306.14 298.62 0.005 0.002 10.541 0.001 0.015 0.130 2.625 0.003 0.021 0.001cake moisture 23.81 23.13 0.000 0.000 0.817 0.000 0.001 0.010 0.203 0.000 0.002 0.000evaporation 3.12 3.13 - - - - - - - - - -total OUT (g) 1484.73 0.39 0.22 257.15 0.01 0.16 1.99 65.26 0.05 0.37 5.11
balance (out/in) 96% 105% 113% 116% 107% 136% 89% 102% 96% 90% 113%
extraction (solution) Al Ca Co Cr Fe Mg Mn Ni Si Zn
ST09-2 18% 16% 25% 7% 37% -45% 41% 65% 1% 52%ST09-30 29% 18% 63% 14% 71% 44% 78% 80% 1% 53%ST09-60 30% 17% 49% 14% 70% -4% 74% 78% 0% 50%ST09-120 33% 18% 65% 14% 71% 35% 77% 80% 0% 55%ST09-180 34% 22% 68% 32% 82% 114% 86% 89% 0% 56%
extraction (solids) Al Ca Co Cr Fe Mg Mn Ni Si Zn
ST09-180 21% -3% 39% -4% 93% 89% 86% 98% -24% 39%
extraction (ratio) Al Ca Co Cr Fe Mg Mn Ni Si Zn
ST09-2 11% -2% 15% -1% 43% 79% 41% 71% -51% 36%ST09-30 18% -2% 36% -2% 81% 84% 78% 88% -33% 37%ST09-60 18% -2% 28% -2% 80% 81% 75% 86% -28% 35%ST09-120 20% -2% 37% -2% 82% 84% 78% 88% -26% 38%ST09-180 21% -3% 39% -4% 93% 89% 86% 98% -24% 39%
based on solids assayacid consumption g consumed kg/t ore Al Fe Mg Ni totalST09-180 51.60 2145acid equivalent (g) 0.42 4.12 12.18 0.49 17.21acid equivalent (%) 2.4 24.0 70.8 2.9 100.0
983.8982.8981.7
calc. total soln volumeml
984.8984.3
calc. total soln volumeml
984.8984.3
14.7
calc. total solid massg
983.8982.8981.7
R2 = 0.4921
0.0
0.2
0.4
0.6
0.8
1.0
1.2
0 50 100 150time (min)
1-(1
-X)^
1/3
0%10%20%30%40%50%60%70%80%90%
100%
0 50 100 150 200time (min)
extr
actio
n
Ni Al Fe
Fe24%
Mg71%
Al2%Ni
3%
APPENDIX A - Leach Test Sheets
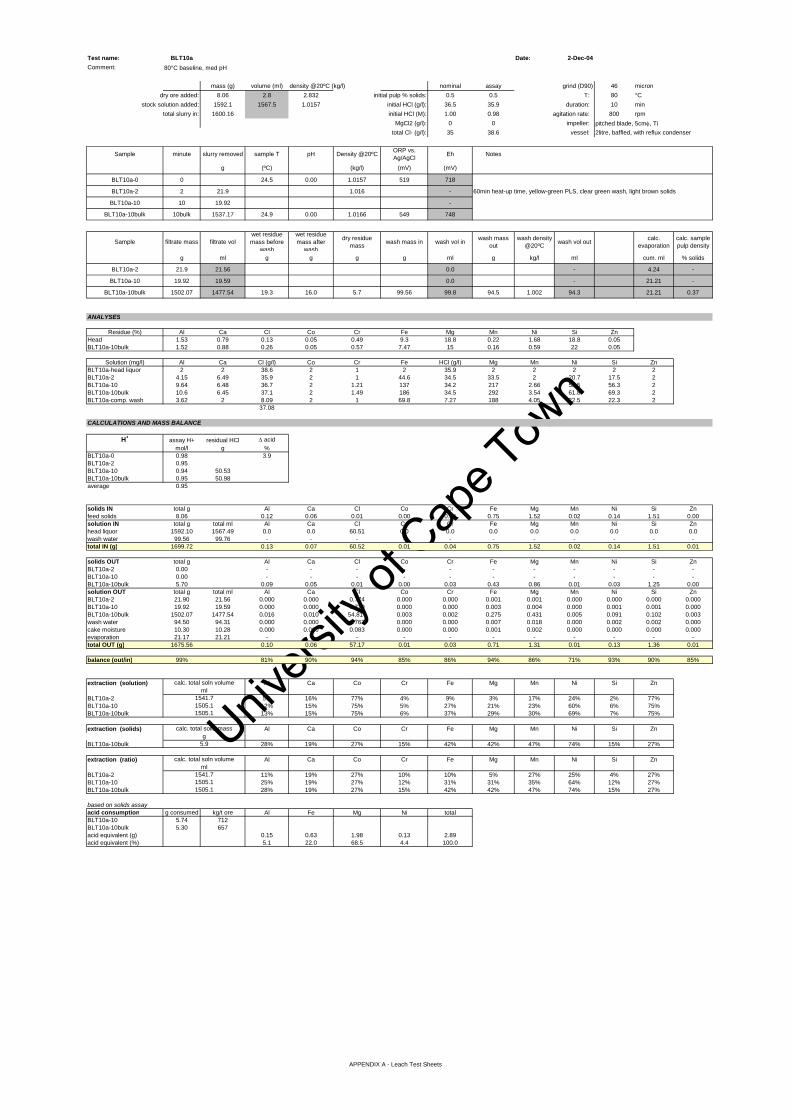
Univers
ity of
Cap
e Tow
n
Test name: BLT10a Date: 2-Dec-04Comment: 80°C baseline, med pH
mass (g) volume (ml) density @20ºC (kg/l) nominal assay grind (D90) 46 microndry ore added: 8.06 2.8 2.832 initial pulp % solids: 0.5 0.5 T: 80 °C
stock solution added: 1592.1 1567.5 1.0157 initial HCl (g/l): 36.5 35.9 duration: 10 mintotal slurry in: 1600.16 initial HCl (M): 1.00 0.98 agitation rate: 800 rpm
MgCl2 (g/l): 0 0 impeller: pitched blade, 5cmφ, Titotal Cl- (g/l): 35 38.6 vessel: 2litre, baffled, with reflux condenser
Sample minute slurry removed sample T pH Density @20ºC ORP vs. Ag/AgCl Eh Notes
g (ºC) (kg/l) (mV) (mV)
BLT10a-0 0 24.5 0.00 1.0157 519 718
BLT10a-2 2 21.9 1.016 - 60min heat-up time, yellow-green PLS, clear green wash, light brown solids
BLT10a-10 10 19.92 -
BLT10a-10bulk 10bulk 1537.17 24.9 0.00 1.0166 549 748
Sample filtrate mass filtrate volwet residue mass before
wash
wet residue mass after
wash
dry residue mass wash mass in wash vol in wash mass
outwash density
@20ºC wash vol out calc. evaporation
calc. sample pulp density
g ml g g g g ml g kg/l ml cum. ml % solids
BLT10a-2 21.9 21.56 0.0 - 4.24 -
BLT10a-10 19.92 19.59 0.0 - 21.21 -
BLT10a-10bulk 1502.07 1477.54 19.3 16.0 5.7 99.56 99.8 94.5 1.002 94.3 21.21 0.37
ANALYSES
Residue (%) Al Ca Cl Co Cr Fe Mg Mn Ni Si ZnHead 1.53 0.79 0.13 0.05 0.49 9.3 18.8 0.22 1.68 18.8 0.05BLT10a-10bulk 1.52 0.88 0.26 0.05 0.57 7.47 15 0.16 0.59 22 0.05
Solution (mg/l) Al Ca Cl (g/l) Co Cr Fe HCl (g/l) Mg Mn Ni Si ZnBLT10a-head liquor 2 2 38.6 2 1 2 35.9 2 2 2 2 2BLT10a-2 4.15 6.49 35.9 2 1 44.6 34.5 33.5 2 20.7 17.5 2BLT10a-10 9.64 6.48 36.7 2 1.21 137 34.2 217 2.66 53.5 56.3 2BLT10a-10bulk 10.6 6.45 37.1 2 1.49 186 34.5 292 3.54 61.8 69.3 2BLT10a-comp. wash 3.62 2 8.09 2 1 69.8 7.27 188 4.05 22.5 22.3 2
37.08
CALCULATIONS AND MASS BALANCE
H+ assay H+ residual HCl ∆ acidmol/l g %
BLT10a-0 0.98 3.9BLT10a-2 0.95BLT10a-10 0.94 50.53BLT10a-10bulk 0.95 50.98average 0.95
solids IN total g Al Ca Cl Co Cr Fe Mg Mn Ni Si Znfeed solids 8.06 0.12 0.06 0.01 0.00 0.04 0.75 1.52 0.02 0.14 1.51 0.00solution IN total g total ml Al Ca Cl Co Cr Fe Mg Mn Ni Si Znhead liquor 1592.10 1567.49 0.0 0.0 60.51 0.0 0.0 0.0 0.0 0.0 0.0 0.0 0.0wash water 99.56 99.76 - - - - - - - - - - -total IN (g) 1699.72 0.13 0.07 60.52 0.01 0.04 0.75 1.52 0.02 0.14 1.51 0.01
solids OUT total g Al Ca Cl Co Cr Fe Mg Mn Ni Si ZnBLT10a-2 0.00 - - - - - - - - - - -BLT10a-10 0.00 - - - - - - - - - - -BLT10a-10bulk 5.70 0.09 0.05 0.01 0.00 0.03 0.43 0.86 0.01 0.03 1.25 0.00solution OUT total g total ml Al Ca Cl Co Cr Fe Mg Mn Ni Si ZnBLT10a-2 21.90 21.56 0.000 0.000 0.774 0.000 0.000 0.001 0.001 0.000 0.000 0.000 0.000BLT10a-10 19.92 19.59 0.000 0.000 0.719 0.000 0.000 0.003 0.004 0.000 0.001 0.001 0.000BLT10a-10bulk 1502.07 1477.54 0.016 0.010 54.817 0.003 0.002 0.275 0.431 0.005 0.091 0.102 0.003wash water 94.50 94.31 0.000 0.000 0.763 0.000 0.000 0.007 0.018 0.000 0.002 0.002 0.000cake moisture 10.30 10.28 0.000 0.000 0.083 0.000 0.000 0.001 0.002 0.000 0.000 0.000 0.000evaporation 21.17 21.21 - - - - - - - - - - -total OUT (g) 1675.56 0.10 0.06 57.17 0.01 0.03 0.71 1.31 0.01 0.13 1.36 0.01
balance (out/in) 99% 81% 90% 94% 85% 86% 94% 86% 71% 93% 90% 85%
extraction (solution) Al Ca Co Cr Fe Mg Mn Ni Si Zn
BLT10a-2 5% 16% 77% 4% 9% 3% 17% 24% 2% 77%BLT10a-10 12% 15% 75% 5% 27% 21% 23% 60% 6% 75%BLT10a-10bulk 13% 15% 75% 6% 37% 29% 30% 69% 7% 75%
extraction (solids) Al Ca Co Cr Fe Mg Mn Ni Si Zn
BLT10a-10bulk 28% 19% 27% 15% 42% 42% 47% 74% 15% 27%
extraction (ratio) Al Ca Co Cr Fe Mg Mn Ni Si Zn
BLT10a-2 11% 19% 27% 10% 10% 5% 27% 25% 4% 27%BLT10a-10 25% 19% 27% 12% 31% 31% 35% 64% 12% 27%BLT10a-10bulk 28% 19% 27% 15% 42% 42% 47% 74% 15% 27%
based on solids assayacid consumption g consumed kg/t ore Al Fe Mg Ni totalBLT10a-10 5.74 712BLT10a-10bulk 5.30 657acid equivalent (g) 0.15 0.63 1.98 0.13 2.89acid equivalent (%) 5.1 22.0 68.5 4.4 100.0
5.9
calc. total solid massg
1505.1
calc. total soln volumeml
1541.71505.1
1505.1
calc. total soln volumeml
1541.71505.1
APPENDIX A - Leach Test Sheets

Univers
ity of
Cap
e Tow
n
Test name: BLT10b Date: 3-Dec-04Comment: 80°C baseline, med pH
mass (g) volume (ml) density @20ºC (kg/l) nominal effective grind (D90) 46 microndry ore added: 8.04 2.8 2.832 initial pulp % solids: 0.5 0.5 T: 80 °C
stock solution added: 1592.2 1567.6 1.0157 initial HCl (g/l): 36.5 34.9 duration: 10 mintotal slurry in: 1600.24 initial HCl (M): 1.00 0.96 agitation rate: 800 rpm
MgCl2 (g/l): 0 0 impeller: pitched blade, 5cmφ, Titotal Cl- (g/l): 35 37.2 vessel: 2litre, baffled, with reflux condenser
Sample minute slurry removed sample T pH Density @20ºC ORP vs. Ag/AgCl Eh Notes
g (ºC) (kg/l) (mV) (mV)BLT10b-0 0 24.5 0.00 1.0157 519 718BLT10b-2 2 17.43 24.4 1.0156 - 65min heat-up time, yellow-green PLS, clear green wash, light brown solids
BLT10b-20 20 26.75 -BLT10b-20bulk 20bulk 1538.91 24.9 0.00 1.0170 547 746
Sample filtrate mass filtrate volwet residue mass before
wash
wet residue mass after
wash
dry residue mass wash mass in wash vol in wash mass
outwash density
@20ºC wash vol out calc. evaporation
calc. sample pulp density
g ml g g g g ml g kg/l ml cum. ml % solidsBLT10b-2 17.43 17.16 0.0 - 1.72 -
BLT10b-20 26.75 26.30 0.0 - 17.18 -BLT10b-20bulk 1501.48 1476.38 18.4 13.0 4.94 99.63 99.8 96.99 1.0018 96.8 17.18 0.32
ANALYSES
Residue (%) Al Ca Cl Co Cr Fe Mg Mn Ni Si ZnHead 1.53 0.79 0.13 0.05 0.49 9.3 18.8 0.22 1.68 18.8 0.05BLT10b-20bulk 1.86 1.1 0.33 0.05 0.72 6.86 11.4 0.11 0.38 24.6 0.05
Solution (mg/l) Al Ca Cl (g/l) Co Cr Fe HCl (g/l) Mg Mn Ni Si ZnBLT10b-head liquor 2 2 37.2 2 1 2 34.9 2 2 2 2 2BLT10b-2 4.78 6.53 35.7 2 1 38.8 34.3 39.9 2 16.5 19.3 2BLT10b-20 14.6 6.59 36.9 2 1.96 189 33.6 435 5.67 54.8 96.9 2BLT10b-20bulk 13.9 7.07 37.1 2 2.17 201 33.7 487 6.36 56.2 107 2BLT10b-comp. wash 3.31 2 7.53 2 1 53.3 6.88 165 3.2 12.2 25.5 2
CALCULATIONS AND MASS BALANCE
H+ assay H+ residual HCl ∆ acidmol/l g %
BLT10b-0 0.96 3.4BLT10b-2 0.94BLT10b-20 0.92 49.61BLT10b-20bulk 0.92 49.75average 0.94
solids IN total g Al Ca Cl Co Cr Fe Mg Mn Ni Si Znfeed solids 8.04 0.12 0.06 0.01 0.00 0.04 0.75 1.51 0.02 0.13 1.51 0.00solution IN total g total ml Al Ca Cl Co Cr Fe Mg Mn Ni Si Znhead liquor 1592.20 1567.59 0.0 0.0 58.31 0.0 0.0 0.0 0.0 0.0 0.0 0.0 0.0wash water 99.63 99.83 - - - - - - - - - - -total IN (g) 1699.87 0.13 0.07 58.33 0.01 0.04 0.75 1.51 0.02 0.14 1.51 0.01
solids OUT total g Al Ca Cl Co Cr Fe Mg Mn Ni Si ZnBLT10b-2 0.00 - - - - - - - - - - -BLT10b-20 0.00 - - - - - - - - - - -BLT10b-20bulk 4.94 0.09 0.05 0.02 0.00 0.04 0.34 0.56 0.01 0.02 1.22 0.00solution OUT total g total ml Al Ca Cl Co Cr Fe Mg Mn Ni Si ZnBLT10b-2 17.43 17.16 0.000 0.000 0.613 0.000 0.000 0.001 0.001 0.000 0.000 0.000 0.000BLT10b-20 26.75 26.30 0.000 0.000 0.971 0.000 0.000 0.005 0.011 0.000 0.001 0.003 0.000BLT10b-20bulk 1501.48 1476.38 0.021 0.010 54.774 0.003 0.003 0.297 0.719 0.009 0.083 0.158 0.003wash water 96.99 96.82 0.000 0.000 0.729 0.000 0.000 0.005 0.016 0.000 0.001 0.002 0.000cake moisture 8.06 8.05 0.000 0.000 0.061 0.000 0.000 0.000 0.001 0.000 0.000 0.000 0.000evaporation 17.15 17.18 - - - - - - - - - - -total OUT (g) 1672.80 0.11 0.07 57.16 0.01 0.04 0.65 1.31 0.02 0.10 1.38 0.01
balance (out/in) 98% 90% 98% 98% 80% 96% 86% 87% 74% 76% 91% 80%
extraction (solution) Al Ca Co Cr Fe Mg Mn Ni Si Zn
BLT10b-2 6% 16% 77% 4% 8% 4% 18% 19% 2% 77%BLT10b-20 18% 16% 75% 8% 38% 43% 48% 61% 10% 75%BLT10b-20bulk 17% 17% 75% 8% 40% 48% 54% 63% 11% 75%
extraction (solids) Al Ca Co Cr Fe Mg Mn Ni Si Zn
BLT10b-20bulk 23% 12% 37% 6% 53% 62% 68% 86% 17% 37%
extraction (ratio) Al Ca Co Cr Fe Mg Mn Ni Si Zn
BLT10b-2 8% 11% 37% 3% 10% 5% 22% 25% 3% 37%BLT10b-20 24% 11% 37% 6% 50% 55% 61% 84% 15% 37%BLT10b-20bulk 23% 12% 37% 6% 53% 62% 68% 86% 17% 37%
based on solids assayacid consumption g consumed kg/t ore Al Fe Mg Ni totalBLT10b-20 5.10 635BLT10b-20bulk 4.95 616acid equivalent (g) 0.13 0.80 2.85 0.14 3.92acid equivalent (%) 3.2 20.5 72.6 3.7 100.0
1506.9
calc. total soln volumeml
1548.71506.9
1506.94
calc. total solid massg
5.1
calc. total soln volumeml
1548.711506.94
APPENDIX A - Leach Test Sheets
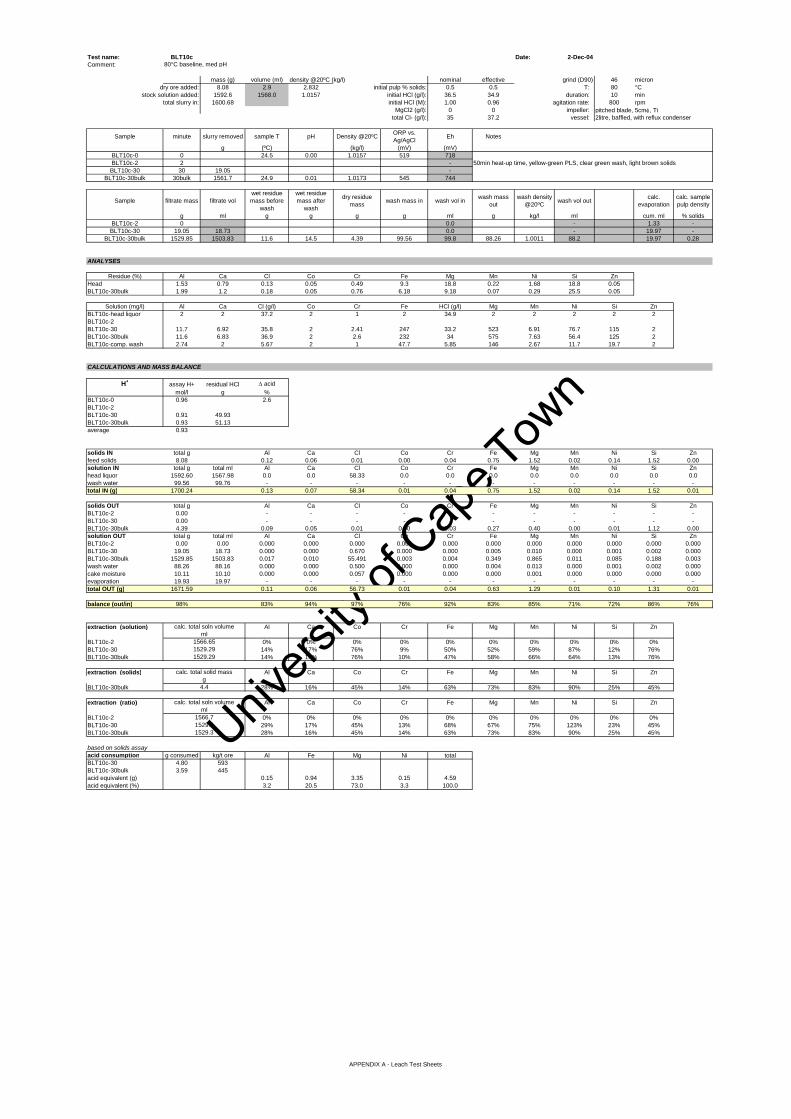
Univers
ity of
Cap
e Tow
n
Test name: BLT10c Date: 2-Dec-04Comment: 80°C baseline, med pH
mass (g) volume (ml) density @20ºC (kg/l) nominal effective grind (D90) 46 microndry ore added: 8.08 2.9 2.832 initial pulp % solids: 0.5 0.5 T: 80 °C
stock solution added: 1592.6 1568.0 1.0157 initial HCl (g/l): 36.5 34.9 duration: 10 mintotal slurry in: 1600.68 initial HCl (M): 1.00 0.96 agitation rate: 800 rpm
MgCl2 (g/l): 0 0 impeller: pitched blade, 5cmφ, Titotal Cl- (g/l): 35 37.2 vessel: 2litre, baffled, with reflux condenser
Sample minute slurry removed sample T pH Density @20ºC ORP vs. Ag/AgCl Eh Notes
g (ºC) (kg/l) (mV) (mV)BLT10c-0 0 24.5 0.00 1.0157 519 718BLT10c-2 2 - 50min heat-up time, yellow-green PLS, clear green wash, light brown solids
BLT10c-30 30 19.05 -BLT10c-30bulk 30bulk 1561.7 24.9 0.01 1.0173 545 744
Sample filtrate mass filtrate volwet residue mass before
wash
wet residue mass after
wash
dry residue mass wash mass in wash vol in wash mass
outwash density
@20ºC wash vol out calc. evaporation
calc. sample pulp density
g ml g g g g ml g kg/l ml cum. ml % solidsBLT10c-2 0 0.0 - 1.33 -
BLT10c-30 19.05 18.73 0.0 - 19.97 -BLT10c-30bulk 1529.85 1503.83 11.6 14.5 4.39 99.56 99.8 88.26 1.0011 88.2 19.97 0.28
ANALYSES
Residue (%) Al Ca Cl Co Cr Fe Mg Mn Ni Si ZnHead 1.53 0.79 0.13 0.05 0.49 9.3 18.8 0.22 1.68 18.8 0.05BLT10c-30bulk 1.99 1.2 0.18 0.05 0.76 6.18 9.18 0.07 0.29 25.5 0.05
Solution (mg/l) Al Ca Cl (g/l) Co Cr Fe HCl (g/l) Mg Mn Ni Si ZnBLT10c-head liquor 2 2 37.2 2 1 2 34.9 2 2 2 2 2BLT10c-2BLT10c-30 11.7 6.92 35.8 2 2.41 247 33.2 523 6.91 76.7 115 2BLT10c-30bulk 11.6 6.83 36.9 2 2.6 232 34 575 7.63 56.4 125 2BLT10c-comp. wash 2.74 2 5.67 2 1 47.7 5.85 146 2.67 11.7 19.7 2
CALCULATIONS AND MASS BALANCE
H+ assay H+ residual HCl ∆ acidmol/l g %
BLT10c-0 0.96 2.6BLT10c-2BLT10c-30 0.91 49.93BLT10c-30bulk 0.93 51.13average 0.93
solids IN total g Al Ca Cl Co Cr Fe Mg Mn Ni Si Znfeed solids 8.08 0.12 0.06 0.01 0.00 0.04 0.75 1.52 0.02 0.14 1.52 0.00solution IN total g total ml Al Ca Cl Co Cr Fe Mg Mn Ni Si Znhead liquor 1592.60 1567.98 0.0 0.0 58.33 0.0 0.0 0.0 0.0 0.0 0.0 0.0 0.0wash water 99.56 99.76 - - - - - - - - - - -total IN (g) 1700.24 0.13 0.07 58.34 0.01 0.04 0.75 1.52 0.02 0.14 1.52 0.01
solids OUT total g Al Ca Cl Co Cr Fe Mg Mn Ni Si ZnBLT10c-2 0.00 - - - - - - - - - - -BLT10c-30 0.00 - - - - - - - - - - -BLT10c-30bulk 4.39 0.09 0.05 0.01 0.00 0.03 0.27 0.40 0.00 0.01 1.12 0.00solution OUT total g total ml Al Ca Cl Co Cr Fe Mg Mn Ni Si ZnBLT10c-2 0.00 0.00 0.000 0.000 0.000 0.000 0.000 0.000 0.000 0.000 0.000 0.000 0.000BLT10c-30 19.05 18.73 0.000 0.000 0.670 0.000 0.000 0.005 0.010 0.000 0.001 0.002 0.000BLT10c-30bulk 1529.85 1503.83 0.017 0.010 55.491 0.003 0.004 0.349 0.865 0.011 0.085 0.188 0.003wash water 88.26 88.16 0.000 0.000 0.500 0.000 0.000 0.004 0.013 0.000 0.001 0.002 0.000cake moisture 10.11 10.10 0.000 0.000 0.057 0.000 0.000 0.000 0.001 0.000 0.000 0.000 0.000evaporation 19.93 19.97 - - - - - - - - - - -total OUT (g) 1671.59 0.11 0.06 56.73 0.01 0.04 0.63 1.29 0.01 0.10 1.31 0.01
balance (out/in) 98% 83% 94% 97% 76% 92% 83% 85% 71% 72% 86% 76%
extraction (solution) Al Ca Co Cr Fe Mg Mn Ni Si Zn
BLT10c-2 0% 0% 0% 0% 0% 0% 0% 0% 0% 0%BLT10c-30 14% 17% 76% 9% 50% 52% 59% 87% 12% 76%BLT10c-30bulk 14% 16% 76% 10% 47% 58% 66% 64% 13% 76%
extraction (solids) Al Ca Co Cr Fe Mg Mn Ni Si Zn
BLT10c-30bulk 28% 16% 45% 14% 63% 73% 83% 90% 25% 45%
extraction (ratio) Al Ca Co Cr Fe Mg Mn Ni Si Zn
BLT10c-2 0% 0% 0% 0% 0% 0% 0% 0% 0% 0%BLT10c-30 29% 17% 45% 13% 68% 67% 75% 123% 23% 45%BLT10c-30bulk 28% 16% 45% 14% 63% 73% 83% 90% 25% 45%
based on solids assayacid consumption g consumed kg/t ore Al Fe Mg Ni totalBLT10c-30 4.80 593BLT10c-30bulk 3.59 445acid equivalent (g) 0.15 0.94 3.35 0.15 4.59acid equivalent (%) 3.2 20.5 73.0 3.3 100.0
1529.31529.3
4.4
calc. total soln volumeml
1566.7
1529.291529.29
calc. total solid massg
calc. total soln volumeml
1566.65
APPENDIX A - Leach Test Sheets
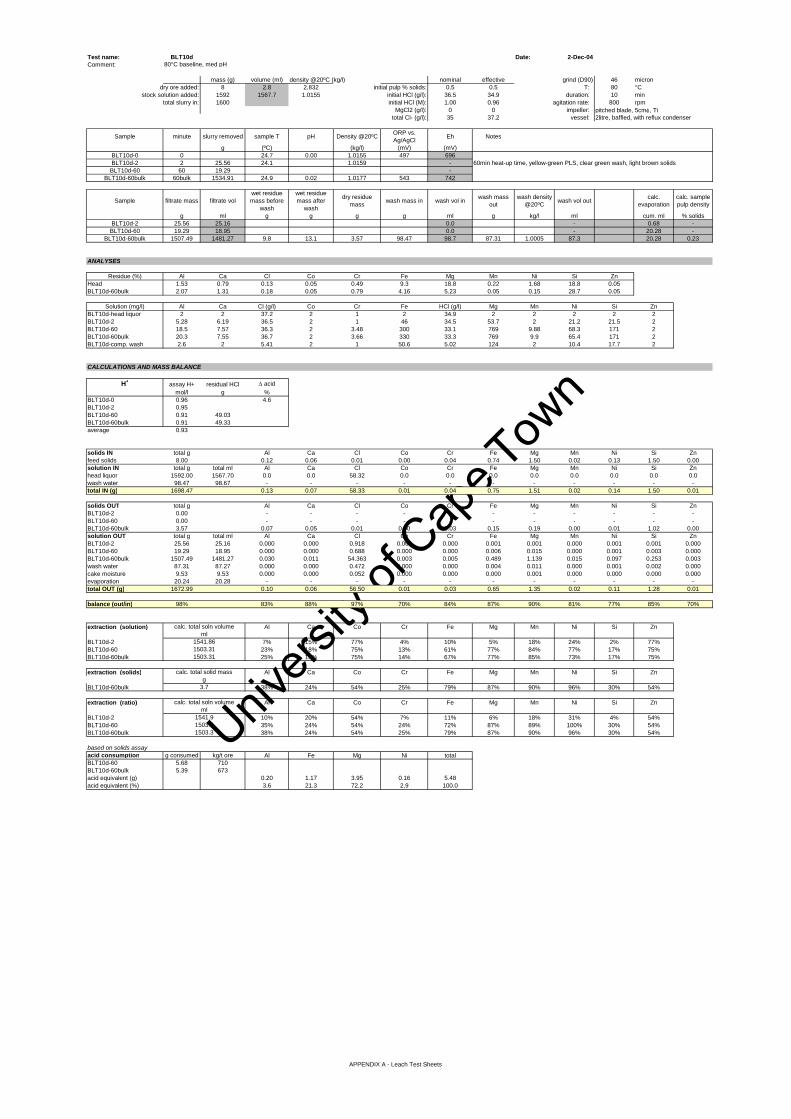
Univers
ity of
Cap
e Tow
n
Test name: BLT10d Date: 2-Dec-04Comment: 80°C baseline, med pH
mass (g) volume (ml) density @20ºC (kg/l) nominal effective grind (D90) 46 microndry ore added: 8 2.8 2.832 initial pulp % solids: 0.5 0.5 T: 80 °C
stock solution added: 1592 1567.7 1.0155 initial HCl (g/l): 36.5 34.9 duration: 10 mintotal slurry in: 1600 initial HCl (M): 1.00 0.96 agitation rate: 800 rpm
MgCl2 (g/l): 0 0 impeller: pitched blade, 5cmφ, Titotal Cl- (g/l): 35 37.2 vessel: 2litre, baffled, with reflux condenser
Sample minute slurry removed sample T pH Density @20ºC ORP vs. Ag/AgCl Eh Notes
g (ºC) (kg/l) (mV) (mV)BLT10d-0 0 24.7 0.00 1.0155 497 696BLT10d-2 2 25.56 24.1 1.0159 - 60min heat-up time, yellow-green PLS, clear green wash, light brown solids
BLT10d-60 60 19.29 -BLT10d-60bulk 60bulk 1534.91 24.9 0.02 1.0177 543 742
Sample filtrate mass filtrate volwet residue mass before
wash
wet residue mass after
wash
dry residue mass wash mass in wash vol in wash mass
outwash density
@20ºC wash vol out calc. evaporation
calc. sample pulp density
g ml g g g g ml g kg/l ml cum. ml % solidsBLT10d-2 25.56 25.16 0.0 - 0.68 -
BLT10d-60 19.29 18.95 0.0 - 20.28 -BLT10d-60bulk 1507.49 1481.27 9.8 13.1 3.57 98.47 98.7 87.31 1.0005 87.3 20.28 0.23
ANALYSES
Residue (%) Al Ca Cl Co Cr Fe Mg Mn Ni Si ZnHead 1.53 0.79 0.13 0.05 0.49 9.3 18.8 0.22 1.68 18.8 0.05BLT10d-60bulk 2.07 1.31 0.18 0.05 0.79 4.16 5.23 0.05 0.15 28.7 0.05
Solution (mg/l) Al Ca Cl (g/l) Co Cr Fe HCl (g/l) Mg Mn Ni Si ZnBLT10d-head liquor 2 2 37.2 2 1 2 34.9 2 2 2 2 2BLT10d-2 5.28 6.19 36.5 2 1 46 34.5 53.7 2 21.2 21.5 2BLT10d-60 18.5 7.57 36.3 2 3.48 300 33.1 769 9.88 68.3 171 2BLT10d-60bulk 20.3 7.55 36.7 2 3.66 330 33.3 769 9.9 65.4 171 2BLT10d-comp. wash 2.6 2 5.41 2 1 50.6 5.02 124 2 10.4 17.7 2
CALCULATIONS AND MASS BALANCE
H+ assay H+ residual HCl ∆ acidmol/l g %
BLT10d-0 0.96 4.6BLT10d-2 0.95BLT10d-60 0.91 49.03BLT10d-60bulk 0.91 49.33average 0.93
solids IN total g Al Ca Cl Co Cr Fe Mg Mn Ni Si Znfeed solids 8.00 0.12 0.06 0.01 0.00 0.04 0.74 1.50 0.02 0.13 1.50 0.00solution IN total g total ml Al Ca Cl Co Cr Fe Mg Mn Ni Si Znhead liquor 1592.00 1567.70 0.0 0.0 58.32 0.0 0.0 0.0 0.0 0.0 0.0 0.0 0.0wash water 98.47 98.67 - - - - - - - - - - -total IN (g) 1698.47 0.13 0.07 58.33 0.01 0.04 0.75 1.51 0.02 0.14 1.50 0.01
solids OUT total g Al Ca Cl Co Cr Fe Mg Mn Ni Si ZnBLT10d-2 0.00 - - - - - - - - - - -BLT10d-60 0.00 - - - - - - - - - - -BLT10d-60bulk 3.57 0.07 0.05 0.01 0.00 0.03 0.15 0.19 0.00 0.01 1.02 0.00solution OUT total g total ml Al Ca Cl Co Cr Fe Mg Mn Ni Si ZnBLT10d-2 25.56 25.16 0.000 0.000 0.918 0.000 0.000 0.001 0.001 0.000 0.001 0.001 0.000BLT10d-60 19.29 18.95 0.000 0.000 0.688 0.000 0.000 0.006 0.015 0.000 0.001 0.003 0.000BLT10d-60bulk 1507.49 1481.27 0.030 0.011 54.363 0.003 0.005 0.489 1.139 0.015 0.097 0.253 0.003wash water 87.31 87.27 0.000 0.000 0.472 0.000 0.000 0.004 0.011 0.000 0.001 0.002 0.000cake moisture 9.53 9.53 0.000 0.000 0.052 0.000 0.000 0.000 0.001 0.000 0.000 0.000 0.000evaporation 20.24 20.28 - - - - - - - - - - -total OUT (g) 1672.99 0.10 0.06 56.50 0.01 0.03 0.65 1.35 0.02 0.11 1.28 0.01
balance (out/in) 98% 83% 88% 97% 70% 84% 87% 90% 81% 77% 85% 70%
extraction (solution) Al Ca Co Cr Fe Mg Mn Ni Si Zn
BLT10d-2 7% 15% 77% 4% 10% 5% 18% 24% 2% 77%BLT10d-60 23% 18% 75% 13% 61% 77% 84% 77% 17% 75%BLT10d-60bulk 25% 18% 75% 14% 67% 77% 85% 73% 17% 75%
extraction (solids) Al Ca Co Cr Fe Mg Mn Ni Si Zn
BLT10d-60bulk 38% 24% 54% 25% 79% 87% 90% 96% 30% 54%
extraction (ratio) Al Ca Co Cr Fe Mg Mn Ni Si Zn
BLT10d-2 10% 20% 54% 7% 11% 6% 18% 31% 4% 54%BLT10d-60 35% 24% 54% 24% 72% 87% 89% 100% 30% 54%BLT10d-60bulk 38% 24% 54% 25% 79% 87% 90% 96% 30% 54%
based on solids assayacid consumption g consumed kg/t ore Al Fe Mg Ni totalBLT10d-60 5.68 710BLT10d-60bulk 5.39 673acid equivalent (g) 0.20 1.17 3.95 0.16 5.48acid equivalent (%) 3.6 21.3 72.2 2.9 100.0
1541.91503.31503.3
g3.7
calc. total soln volumeml
1541.861503.311503.31
calc. total solid mass
calc. total soln volumeml
APPENDIX A - Leach Test Sheets
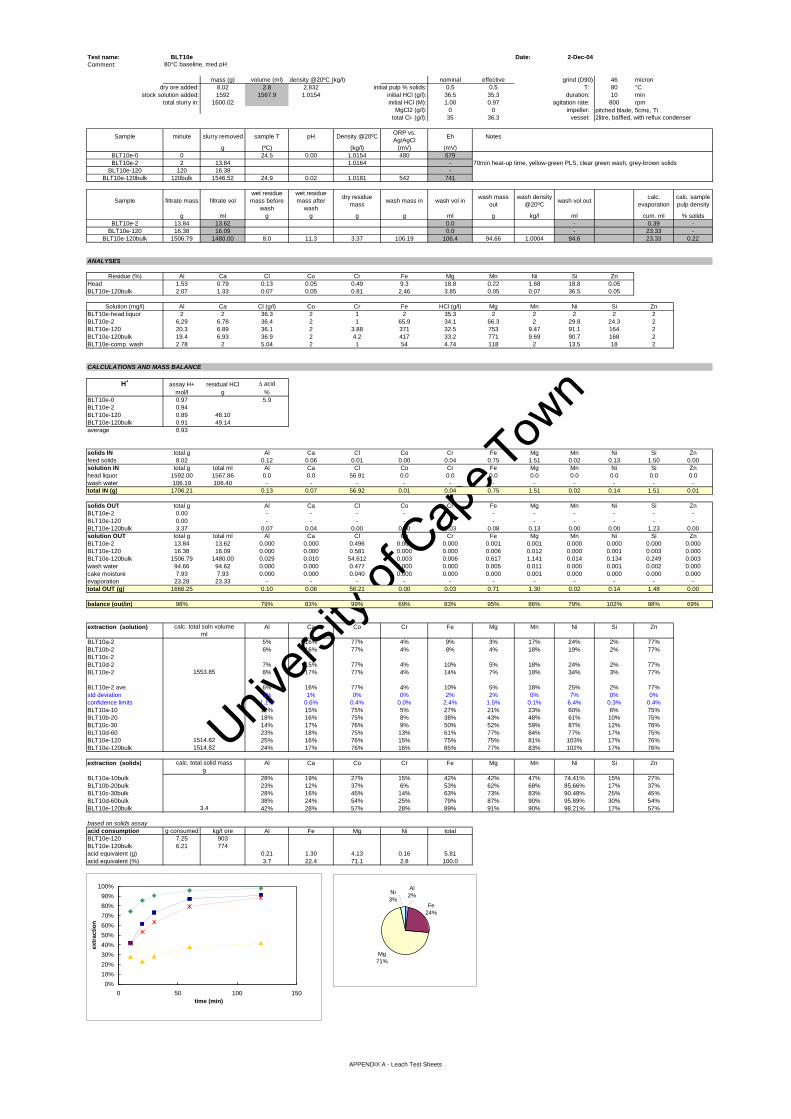
Univers
ity of
Cap
e Tow
n
Test name: BLT10e Date: 2-Dec-04Comment: 80°C baseline, med pH
mass (g) volume (ml) density @20ºC (kg/l) nominal effective grind (D90) 46 microndry ore added: 8.02 2.8 2.832 initial pulp % solids: 0.5 0.5 T: 80 °C
stock solution added: 1592 1567.9 1.0154 initial HCl (g/l): 36.5 35.3 duration: 10 mintotal slurry in: 1600.02 initial HCl (M): 1.00 0.97 agitation rate: 800 rpm
MgCl2 (g/l): 0 0 impeller: pitched blade, 5cmφ, Titotal Cl- (g/l): 35 36.3 vessel: 2litre, baffled, with reflux condenser
Sample minute slurry removed sample T pH Density @20ºC ORP vs. Ag/AgCl Eh Notes
g (ºC) (kg/l) (mV) (mV)BLT10e-0 0 24.5 0.00 1.0154 480 679BLT10e-2 2 13.84 1.0164 - 70min heat-up time, yellow-green PLS, clear green wash, grey-brown solids
BLT10e-120 120 16.38 -BLT10e-120bulk 120bulk 1546.52 24.9 0.02 1.0181 542 741
Sample filtrate mass filtrate volwet residue mass before
wash
wet residue mass after
wash
dry residue mass wash mass in wash vol in wash mass
outwash density
@20ºC wash vol out calc. evaporation
calc. sample pulp density
g ml g g g g ml g kg/l ml cum. ml % solidsBLT10e-2 13.84 13.62 0.0 - 0.39 -
BLT10e-120 16.38 16.09 0.0 - 23.33 -BLT10e-120bulk 1506.79 1480.00 8.0 11.3 3.37 106.19 106.4 94.66 1.0004 94.6 23.33 0.22
ANALYSES
Residue (%) Al Ca Cl Co Cr Fe Mg Mn Ni Si ZnHead 1.53 0.79 0.13 0.05 0.49 9.3 18.8 0.22 1.68 18.8 0.05BLT10e-120bulk 2.07 1.33 0.07 0.05 0.81 2.46 3.85 0.05 0.07 36.5 0.05
Solution (mg/l) Al Ca Cl (g/l) Co Cr Fe HCl (g/l) Mg Mn Ni Si ZnBLT10e-head liquor 2 2 36.3 2 1 2 35.3 2 2 2 2 2BLT10e-2 6.29 6.78 36.4 2 1 65.9 34.1 66.3 2 29.8 24.3 2BLT10e-120 20.3 6.89 36.1 2 3.88 371 32.5 753 9.47 91.1 164 2BLT10e-120bulk 19.4 6.93 36.9 2 4.2 417 33.2 771 9.69 90.7 168 2BLT10e-comp. wash 2.78 2 5.04 2 1 54 4.74 118 2 13.5 18 2
CALCULATIONS AND MASS BALANCE
H+ assay H+ residual HCl ∆ acidmol/l g %
BLT10e-0 0.97 5.9BLT10e-2 0.94BLT10e-120 0.89 48.10BLT10e-120bulk 0.91 49.14average 0.93
solids IN total g Al Ca Cl Co Cr Fe Mg Mn Ni Si Znfeed solids 8.02 0.12 0.06 0.01 0.00 0.04 0.75 1.51 0.02 0.13 1.50 0.00solution IN total g total ml Al Ca Cl Co Cr Fe Mg Mn Ni Si Znhead liquor 1592.00 1567.86 0.0 0.0 56.91 0.0 0.0 0.0 0.0 0.0 0.0 0.0 0.0wash water 106.19 106.40 - - - - - - - - - - -total IN (g) 1706.21 0.13 0.07 56.92 0.01 0.04 0.75 1.51 0.02 0.14 1.51 0.01
solids OUT total g Al Ca Cl Co Cr Fe Mg Mn Ni Si ZnBLT10e-2 0.00 - - - - - - - - - - -BLT10e-120 0.00 - - - - - - - - - - -BLT10e-120bulk 3.37 0.07 0.04 0.00 0.00 0.03 0.08 0.13 0.00 0.00 1.23 0.00solution OUT total g total ml Al Ca Cl Co Cr Fe Mg Mn Ni Si ZnBLT10e-2 13.84 13.62 0.000 0.000 0.496 0.000 0.000 0.001 0.001 0.000 0.000 0.000 0.000BLT10e-120 16.38 16.09 0.000 0.000 0.581 0.000 0.000 0.006 0.012 0.000 0.001 0.003 0.000BLT10e-120bulk 1506.79 1480.00 0.029 0.010 54.612 0.003 0.006 0.617 1.141 0.014 0.134 0.249 0.003wash water 94.66 94.62 0.000 0.000 0.477 0.000 0.000 0.005 0.011 0.000 0.001 0.002 0.000cake moisture 7.93 7.93 0.000 0.000 0.040 0.000 0.000 0.000 0.001 0.000 0.000 0.000 0.000evaporation 23.28 23.33 - - - - - - - - - - -total OUT (g) 1666.25 0.10 0.06 56.21 0.00 0.03 0.71 1.30 0.02 0.14 1.48 0.00
balance (out/in) 98% 79% 83% 99% 69% 83% 95% 86% 79% 102% 98% 69%
extraction (solution) Al Ca Co Cr Fe Mg Mn Ni Si Zn
BLT10a-2 5% 16% 77% 4% 9% 3% 17% 24% 2% 77%BLT10b-2 6% 16% 77% 4% 8% 4% 18% 19% 2% 77%BLT10c-2BLT10d-2 7% 15% 77% 4% 10% 5% 18% 24% 2% 77%BLT10e-2 8% 17% 77% 4% 14% 7% 18% 34% 3% 77%
BLT10e-2 ave. 6% 16% 77% 4% 10% 5% 18% 25% 2% 77%std deviation 1% 1% 0% 0% 2% 2% 0% 7% 0% 0%confidence limits 1.1% 0.6% 0.4% 0.0% 2.4% 1.5% 0.1% 6.4% 0.3% 0.4%BLT10a-10 12% 15% 75% 5% 27% 21% 23% 60% 6% 75%BLT10b-20 18% 16% 75% 8% 38% 43% 48% 61% 10% 75%BLT10c-30 14% 17% 76% 9% 50% 52% 59% 87% 12% 76%BLT10d-60 23% 18% 75% 13% 61% 77% 84% 77% 17% 75%BLT10e-120 25% 16% 76% 15% 75% 75% 81% 103% 17% 76%BLT10e-120bulk 24% 17% 76% 16% 85% 77% 83% 102% 17% 76%
extraction (solids) Al Ca Co Cr Fe Mg Mn Ni Si Zn
BLT10a-10bulk 28% 19% 27% 15% 42% 42% 47% 74.41% 15% 27%BLT10b-20bulk 23% 12% 37% 6% 53% 62% 68% 85.66% 17% 37%BLT10c-30bulk 28% 16% 45% 14% 63% 73% 83% 90.48% 25% 45%BLT10d-60bulk 38% 24% 54% 25% 79% 87% 90% 95.89% 30% 54%BLT10e-120bulk 42% 28% 57% 28% 89% 91% 90% 98.21% 17% 57%
based on solids assayacid consumption g consumed kg/t ore Al Fe Mg Ni totalBLT10e-120 7.25 903BLT10e-120bulk 6.21 774acid equivalent (g) 0.21 1.30 4.13 0.16 5.81acid equivalent (%) 3.7 22.4 71.1 2.8 100.0
calc. total solid massg
3.4
ml
1553.85
1514.821514.82
calc. total soln volume
0%10%20%30%40%50%60%70%80%90%
100%
0 50 100 150time (min)
extr
actio
n
Fe24%
Mg71%
Ni3%
Al2%
APPENDIX A - Leach Test Sheets

Univers
ity of
Cap
e Tow
n
Test name: BLT11a Date: 7-Dec-04Comment: 80°C baseline, low pH
mass (g) volume (ml) density @20ºC (kg/l) nominal effective grind (D90) 46 microndry ore added: 8.04 2.8 2.832 initial pulp % solids: 0.5 0.5 T: 80 °C
stock solution added: 1770.5 1728.2 1.0245 initial HCl (g/l): 54.7 54.0 duration: 10 mintotal slurry in: 1778.54 initial HCl (M): 1.50 1.48 agitation rate: 800 rpm
MgCl2 (g/l): 0 0 impeller: pitched blade, 5cmφ, Titotal Cl- (g/l): 53 56.5 vessel: 2litre, baffled, with reflux condenser
Sample minute slurry removed sample T pH Density @20ºC ORP vs. Ag/AgCl Eh Notes
g (ºC) (kg/l) (mV) (mV)
BLT11a-0 0 23.6 -0.22 1.0245 490 689
BLT11a-2 2 21.21 24.3 1.0249 - 65min heat-up time, yellow PLS, clear green wash, light brown solids
BLT11a-10 10 18.28 -
BLT11a-10bulk 10bulk 1721.09 25.4 -0.22 1.0254 539 738
Sample filtrate mass filtrate volwet residue mass before
wash
wet residue mass after
wash
dry residue mass wash mass in wash vol in wash mass
outwash density
@20ºC wash vol out calc. evaporation
calc. sample pulp density
g ml g g g g ml g kg/l ml cum. ml % solids
BLT11a-2 21.21 20.69 0.0 - 3.60 -
BLT11a-10 18.28 17.83 0.0 - 18.00 -
BLT11a-10bulk 1691.69 1649.79 11.7 15.3 5.06 100.56 100.8 88.02 1.0024 87.8 18.00 0.29
ANALYSES
Residue (%) Al Ca Cl Co Cr Fe Mg Mn Ni Si ZnHead 1.53 0.79 0.13 0.05 0.49 9.3 18.8 0.22 1.68 18.8 0.05BLT11a-10bulk 1.53 0.9 0.15 0.05 0.58 7.26 13.6 0.16 0.44 31.6 0.05
Solution (mg/l) Al Ca Cl (g/l) Co Cr Fe HCl (g/l) Mg Mn Ni Si ZnBLT11a-head liquor 2 2 56.5 2 1 2 54 2 2 2 2 2BLT11a-2 5.78 5.99 57 2 1 59.6 52.1 60.2 2 29.1 22.8 2BLT11a-10 11.6 6.15 54.5 2 1.59 150 51.6 292 3.43 58.1 66.9 2BLT11a-10bulk 12.9 5.99 55.4 2 1.88 197 51.8 362 4.35 74.2 80.2 2BLT11a-comp. wash 3.77 2 9.08 2 1 79 8.17 194 4.63 21.6 13.3 2
CALCULATIONS AND MASS BALANCE
H+ assay H+ residual HCl ∆ acidmol/l g %
BLT11a-0 1.48 4.1BLT11a-2 1.43BLT11a-10 1.42 85.13BLT11a-10bulk 1.42 85.46average 1.44
solids IN total g Al Ca Cl Co Cr Fe Mg Mn Ni Si Znfeed solids 8.04 0.12 0.06 0.01 0.00 0.04 0.75 1.51 0.02 0.13 1.51 0.00solution IN total g total ml Al Ca Cl Co Cr Fe Mg Mn Ni Si Znhead liquor 1770.50 1728.16 0.0 0.0 97.64 0.0 0.0 0.0 0.0 0.0 0.0 0.0 0.0wash water 100.56 100.76 - - - - - - - - - - -total IN (g) 1879.10 0.13 0.07 97.65 0.01 0.04 0.75 1.51 0.02 0.14 1.51 0.01
solids OUT total g Al Ca Cl Co Cr Fe Mg Mn Ni Si ZnBLT11a-2 0.00 - - - - - - - - - - -BLT11a-10 0.00 - - - - - - - - - - -BLT11a-10bulk 5.06 0.08 0.05 0.01 0.00 0.03 0.37 0.69 0.01 0.02 1.60 0.00solution OUT total g total ml Al Ca Cl Co Cr Fe Mg Mn Ni Si ZnBLT11a-2 21.21 20.69 0.000 0.000 1.180 0.000 0.000 0.001 0.001 0.000 0.001 0.000 0.000BLT11a-10 18.28 17.83 0.000 0.000 0.972 0.000 0.000 0.003 0.005 0.000 0.001 0.001 0.000BLT11a-10bulk 1691.69 1649.79 0.021 0.010 91.398 0.003 0.003 0.325 0.597 0.007 0.122 0.132 0.003wash water 88.02 87.81 0.000 0.000 0.797 0.000 0.000 0.007 0.017 0.000 0.002 0.001 0.000cake moisture 10.24 10.22 0.000 0.000 0.093 0.000 0.000 0.001 0.002 0.000 0.000 0.000 0.000evaporation 17.96 18.00 - - - - - - - - - - -total OUT (g) 1852.46 0.10 0.06 94.45 0.01 0.03 0.70 1.31 0.02 0.15 1.73 0.01
balance (out/in) 99% 79% 83% 97% 82% 80% 94% 87% 75% 107% 115% 82%
extraction (solution) Al Ca Co Cr Fe Mg Mn Ni Si Zn
BLT11a-2 8% 16% 85% 4% 14% 7% 19% 37% 3% 85%BLT11a-10 16% 16% 83% 7% 34% 32% 32% 72% 7% 83%BLT11a-10bulk 18% 16% 83% 8% 44% 40% 41% 92% 9% 83%
extraction (solids) Al Ca Co Cr Fe Mg Mn Ni Si Zn
BLT11a-10bulk 36% 27% 36% 23% 50% 53% 53% 83% -8% 36%
extraction (ratio) Al Ca Co Cr Fe Mg Mn Ni Si Zn
BLT11a-2 16% 27% 36% 12% 15% 9% 24% 33% -2% 36%BLT11a-10 32% 27% 36% 19% 38% 43% 42% 65% -7% 36%BLT11a-10bulk 36% 27% 36% 23% 50% 53% 53% 83% -8% 36%
based on solids assayacid consumption g consumed kg/t ore Al Fe Mg Ni totalBLT11a-10 8.19 1019BLT11a-10bulk 7.86 978acid equivalent (g) 0.18 0.75 2.47 0.14 3.54acid equivalent (%) 5.2 21.1 69.8 3.9 100.0
1671.6
calc. total soln volumeml
1703.91671.6
calc. total soln volumeml
1703.91671.6
5.2
calc. total solid massg
1671.6
APPENDIX A - Leach Test Sheets

Univers
ity of
Cap
e Tow
n
Test name: BLT11b Date: 7-Dec-04Comment: 80°C baseline, low pH
mass (g) volume (ml) density @20ºC (kg/l) nominal effective grind (D90) 46 microndry ore added: 8.05 2.8 2.832 initial pulp % solids: 0.5 0.5 T: 80 °C
stock solution added: 1592.4 1554.3 1.0245 initial HCl (g/l): 54.7 54.0 duration: 20 mintotal slurry in: 1600.45 initial HCl (M): 1.50 1.48 agitation rate: 800 rpm
MgCl2 (g/l): 0 0 impeller: pitched blade, 5cmφ, Titotal Cl- (g/l): 53 56.5 vessel: 2litre, baffled, with reflux condenser
Sample minute slurry removed sample T pH Density @20ºC ORP vs. Ag/AgCl Eh Notes
g (ºC) (kg/l) (mV) (mV)BLT11b-0 0 23.6 -0.22 1.0245 490 689BLT11b-2 2 - 55min heat-up time, yellow PLS, clear green wash, light brown solids
BLT11b-20 20 28.67 -BLT11b-20bulk 20bulk 1548.5 24.6 -0.22 1.0263 538 737
Sample filtrate mass filtrate volwet residue mass before
wash
wet residue mass after
wash
dry residue mass wash mass in wash vol in wash mass
outwash density
@20ºC wash vol out calc. evaporation
calc. sample pulp density
g ml g g g g ml g kg/l ml cum. ml % solidsBLT11b-2 0 0.0 - 2.33 -BLT11b-20 28.67 27.94 0.0 - 23.33 -
BLT11b-20bulk 1522.18 1483.17 11.5 10.5 4.44 102.55 102.8 92.68 1.0028 92.4 23.33 0.29
ANALYSES
Residue (%) Al Ca Cl Co Cr Fe Mg Mn Ni Si ZnHead 1.53 0.79 0.13 0.05 0.49 9.3 18.8 0.22 1.68 18.8 0.05BLT11b-20bulk 1.77 1.04 0.4 0.05 0.69 6.38 10.8 0.1 0.31 34.9 0.05
Solution (mg/l) Al Ca Cl (g/l) Co Cr Fe HCl (g/l) Mg Mn Ni Si ZnBLT11b-head liquor 2 2 56.5 2 1 2 54 2 2 2 2 2BLT11b-2BLT11b-20 16.2 6.79 55.7 2 2.64 265 51.5 497 6.34 80.2 108 2BLT11b-20bulk 18.3 6.82 56.4 2 2.66 297 51.3 536 6.96 91.5 114 2BLT11b-comp. wash 3.09 2 9.62 2 1 62.1 9.06 154 2.84 14.9 18.2 2
CALCULATIONS AND MASS BALANCE
H+ assay H+ residual HCl ∆ acidmol/l g %
BLT11b-0 1.48 5.0BLT11b-2BLT11b-20 1.41 76.38BLT11b-20bulk 1.41 76.09average 1.43
solids IN total g Al Ca Cl Co Cr Fe Mg Mn Ni Si Znfeed solids 8.05 0.12 0.06 0.01 0.00 0.04 0.75 1.51 0.02 0.13 1.51 0.00solution IN total g total ml Al Ca Cl Co Cr Fe Mg Mn Ni Si Znhead liquor 1592.40 1554.32 0.0 0.0 87.82 0.0 0.0 0.0 0.0 0.0 0.0 0.0 0.0wash water 102.55 102.76 - - - - - - - - - - -total IN (g) 1703.00 0.13 0.07 87.83 0.01 0.04 0.75 1.52 0.02 0.14 1.51 0.01
solids OUT total g Al Ca Cl Co Cr Fe Mg Mn Ni Si ZnBLT11b-2 0.00 - - - - - - - - - - -BLT11b-20 0.00 - - - - - - - - - - -BLT11b-20bulk 4.44 0.08 0.05 0.02 0.00 0.03 0.28 0.48 0.00 0.01 1.55 0.00solution OUT total g total ml Al Ca Cl Co Cr Fe Mg Mn Ni Si ZnBLT11b-2 0.00 0.00 0.000 0.000 0.000 0.000 0.000 0.000 0.000 0.000 0.000 0.000 0.000BLT11b-20 28.67 27.94 0.000 0.000 1.556 0.000 0.000 0.007 0.014 0.000 0.002 0.003 0.000BLT11b-20bulk 1522.18 1483.17 0.027 0.010 83.651 0.003 0.004 0.441 0.795 0.010 0.136 0.169 0.003wash water 92.68 92.42 0.000 0.000 0.889 0.000 0.000 0.006 0.014 0.000 0.001 0.002 0.000cake moisture 6.06 6.04 0.000 0.000 0.058 0.000 0.000 0.000 0.001 0.000 0.000 0.000 0.000evaporation 23.28 23.33 - - - - - - - - - - -total OUT (g) 1677.31 0.11 0.06 86.17 0.01 0.03 0.74 1.30 0.02 0.15 1.72 0.01
balance (out/in) 98% 84% 85% 98% 76% 86% 98% 86% 73% 111% 114% 76%
extraction (solution) Al Ca Co Cr Fe Mg Mn Ni Si Zn
BLT11b-2 0% 0% 0% 0% 0% 0% 0% 0% 0% 0%BLT11b-20 20% 16% 75% 10% 53% 49% 54% 89% 11% 75%BLT11b-20bulk 22% 16% 75% 10% 60% 53% 59% 102% 11% 75%
extraction (solids) Al Ca Co Cr Fe Mg Mn Ni Si Zn
BLT11b-20bulk 35% 26% 44% 20% 61% 68% 74% 90% -5% 44%
extraction (ratio) Al Ca Co Cr Fe Mg Mn Ni Si Zn
BLT11b-2 0% 0% 0% 0% 0% 0% 0% 0% 0% 0%BLT11b-20 31% 26% 44% 20% 55% 63% 68% 79% -4% 44%BLT11b-20bulk 35% 26% 44% 20% 61% 68% 74% 90% -5% 44%
based on solids assayacid consumption g consumed kg/t ore Al Fe Mg Ni totalBLT11b-20 7.55 938BLT11b-20bulk 7.85 975acid equivalent (g) 0.18 0.91 3.10 0.15 4.35acid equivalent (%) 4.2 21.0 71.4 3.5 100.0
calc. total soln volumeml
1551.991503.061503.06
calc. total solid massg
4.5
calc. total soln volumeml
1552.01503.11503.1
APPENDIX A - Leach Test Sheets

Univers
ity of
Cap
e Tow
n
Test name: BLT11c Date: 6-Dec-04Comment: 80°C baseline, low pH
mass (g) volume (ml) density @20ºC (kg/l) nominal effective grind (D90) 46 microndry ore added: 8.08 2.9 2.832 initial pulp % solids: 0.5 0.5 T: 80 °C
stock solution added: 1592.2 1555.2 1.0238 initial HCl (g/l): 54.7 51.6 duration: 30 mintotal slurry in: 1600.28 initial HCl (M): 1.50 1.42 agitation rate: 800 rpm
MgCl2 (g/l): 0 0 impeller: pitched blade, 5cmφ, Titotal Cl- (g/l): 53 54.6 vessel: 2litre, baffled, with reflux condenser
Sample minute slurry removed sample T pH Density @20ºC ORP vs. Ag/AgCl Eh Notes
g (ºC) (kg/l) (mV) (mV)BLT11c-0 0 24.7 -0.22 1.0238 470 669BLT11c-2 2 25.03 23.8 1.0245 - 55min heat-up time, yellow PLS, clear green wash, light brown solids
BLT11c-30 30 21.73 -BLT11c-30bulk 30bulk 1538.25 23.6 -0.22 1.0269 536 735
Sample filtrate mass filtrate volwet residue mass before
wash
wet residue mass after
wash
dry residue mass wash mass in wash vol in wash mass
outwash density
@20ºC wash vol out calc. evaporation
calc. sample pulp density
g ml g g g g ml g kg/l ml cum. ml % solidsBLT11c-2 25.03 24.43 0.0 - 1.02 -BLT11c-30 21.73 21.16 0.0 - 15.30 -
BLT11c-30bulk 1475.1 1436.46 11.7 21.0 3.77 113.59 113.8 99.35 1.0042 98.9 15.30 0.25
ANALYSES
Residue (%) Al Ca Cl Co Cr Fe Mg Mn Ni Si ZnHead 1.53 0.79 0.13 0.05 0.49 9.3 18.8 0.22 1.68 18.8 0.05BLT11c-30bulk 1.85 1.18 0.26 0.05 0.73 4.8 7.46 0.05 0.19 38.6 0.05
Solution (mg/l) Al Ca Cl (g/l) Co Cr Fe HCl (g/l) Mg Mn Ni Si ZnBLT11c-head liquor 2 2 54.6 2 1 2 51.6 2 2 2 2 2BLT11c-2 5.3 6.66 54.4 2 1 51.9 51.5 59.9 2 21.8 23.5 2BLT11c-30 16.2 7.31 53.5 2 3.15 276 49.3 623 8.08 67.5 130 2BLT11c-30bulk 16.3 7.16 66.7 2 5.35 307 51.8 665 8.82 64.5 135 2BLT11c-comp. wash 4.81 2 11.4 2 1.35 116 9.86 293 7.33 17.2 9.78 2
CALCULATIONS AND MASS BALANCE
H+ assay H+ residual HCl ∆ acidmol/l g %
BLT11c-0 1.42 -0.4BLT11c-2 1.41BLT11c-30 1.35 70.82BLT11c-30bulk 1.42 74.41average 1.40
solids IN total g Al Ca Cl Co Cr Fe Mg Mn Ni Si Znfeed solids 8.08 0.12 0.06 0.01 0.00 0.04 0.75 1.52 0.02 0.14 1.52 0.00solution IN total g total ml Al Ca Cl Co Cr Fe Mg Mn Ni Si Znhead liquor 1592.20 1555.19 0.0 0.0 84.91 0.0 0.0 0.0 0.0 0.0 0.0 0.0 0.0wash water 113.59 113.82 - - - - - - - - - - -total IN (g) 1713.87 0.13 0.07 84.92 0.01 0.04 0.75 1.52 0.02 0.14 1.52 0.01
solids OUT total g Al Ca Cl Co Cr Fe Mg Mn Ni Si ZnBLT11c-2 0.00 - - - - - - - - - - -BLT11c-30 0.00 - - - - - - - - - - -BLT11c-30bulk 3.77 0.07 0.04 0.01 0.00 0.03 0.18 0.28 0.00 0.01 1.46 0.00solution OUT total g total ml Al Ca Cl Co Cr Fe Mg Mn Ni Si ZnBLT11c-2 25.03 24.43 0.000 0.000 1.329 0.000 0.000 0.001 0.001 0.000 0.001 0.001 0.000BLT11c-30 21.73 21.16 0.000 0.000 1.132 0.000 0.000 0.006 0.013 0.000 0.001 0.003 0.000BLT11c-30bulk 1475.10 1436.46 0.023 0.010 95.812 0.003 0.008 0.441 0.955 0.013 0.093 0.194 0.003wash water 99.35 98.93 0.000 0.000 1.128 0.000 0.000 0.011 0.029 0.001 0.002 0.001 0.000cake moisture 17.23 17.16 0.000 0.000 0.196 0.000 0.000 0.002 0.005 0.000 0.000 0.000 0.000evaporation 15.27 15.30 - - - - - - - - - - -total OUT (g) 1657.48 0.09 0.06 99.61 0.01 0.04 0.64 1.29 0.02 0.10 1.65 0.01
balance (out/in) 97% 74% 83% 117% 71% 87% 85% 84% 75% 75% 109% 71%
extraction (solution) Al Ca Co Cr Fe Mg Mn Ni Si Zn
BLT11c-2 7% 16% 76% 4% 11% 6% 17% 25% 2% 76%BLT11c-30 20% 17% 74% 12% 55% 61% 68% 75% 13% 74%BLT11c-30bulk 20% 17% 74% 20% 61% 65% 74% 71% 13% 74%
extraction (solids) Al Ca Co Cr Fe Mg Mn Ni Si Zn
BLT11c-30bulk 42% 28% 52% 28% 75% 81% 89% 95% 1% 52%
extraction (ratio) Al Ca Co Cr Fe Mg Mn Ni Si Zn
BLT11c-2 14% 26% 52% 5% 13% 7% 20% 32% 0% 52%BLT11c-30 42% 29% 52% 16% 68% 76% 82% 99% 1% 52%BLT11c-30bulk 42% 28% 52% 28% 75% 81% 89% 95% 1% 52%
based on solids assayacid consumption g consumed kg/t ore Al Fe Mg Ni totalBLT11c-30 9.43 1167BLT11c-30bulk 5.84 723acid equivalent (g) 0.22 1.12 3.71 0.16 5.21acid equivalent (%) 4.2 21.5 71.3 3.1 100.0
calc. total soln volumeml
1529.741494.291494.29
calc. total solid massg
3.9
calc. total soln volumeml
1529.71494.31494.3
APPENDIX A - Leach Test Sheets
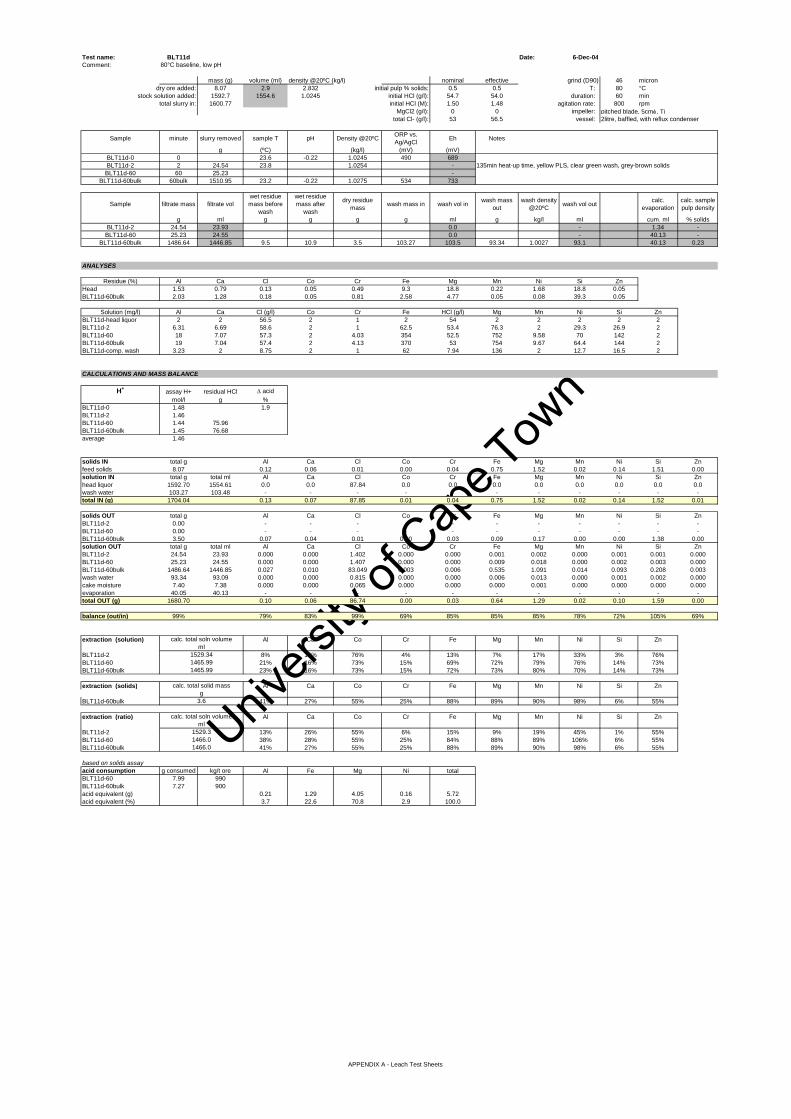
Univers
ity of
Cap
e Tow
n
Test name: BLT11d Date: 6-Dec-04Comment: 80°C baseline, low pH
mass (g) volume (ml) density @20ºC (kg/l) nominal effective grind (D90) 46 microndry ore added: 8.07 2.9 2.832 initial pulp % solids: 0.5 0.5 T: 80 °C
stock solution added: 1592.7 1554.6 1.0245 initial HCl (g/l): 54.7 54.0 duration: 60 mintotal slurry in: 1600.77 initial HCl (M): 1.50 1.48 agitation rate: 800 rpm
MgCl2 (g/l): 0 0 impeller: pitched blade, 5cmφ, Titotal Cl- (g/l): 53 56.5 vessel: 2litre, baffled, with reflux condenser
Sample minute slurry removed sample T pH Density @20ºC ORP vs. Ag/AgCl Eh Notes
g (ºC) (kg/l) (mV) (mV)BLT11d-0 0 23.6 -0.22 1.0245 490 689BLT11d-2 2 24.54 23.8 1.0254 - 135min heat-up time, yellow PLS, clear green wash, grey-brown solids
BLT11d-60 60 25.23 -BLT11d-60bulk 60bulk 1510.95 23.2 -0.22 1.0275 534 733
Sample filtrate mass filtrate volwet residue mass before
wash
wet residue mass after
wash
dry residue mass wash mass in wash vol in wash mass
outwash density
@20ºC wash vol out calc. evaporation
calc. sample pulp density
g ml g g g g ml g kg/l ml cum. ml % solidsBLT11d-2 24.54 23.93 0.0 - 1.34 -BLT11d-60 25.23 24.55 0.0 - 40.13 -
BLT11d-60bulk 1486.64 1446.85 9.5 10.9 3.5 103.27 103.5 93.34 1.0027 93.1 40.13 0.23
ANALYSES
Residue (%) Al Ca Cl Co Cr Fe Mg Mn Ni Si ZnHead 1.53 0.79 0.13 0.05 0.49 9.3 18.8 0.22 1.68 18.8 0.05BLT11d-60bulk 2.03 1.28 0.18 0.05 0.81 2.58 4.77 0.05 0.08 39.3 0.05
Solution (mg/l) Al Ca Cl (g/l) Co Cr Fe HCl (g/l) Mg Mn Ni Si ZnBLT11d-head liquor 2 2 56.5 2 1 2 54 2 2 2 2 2BLT11d-2 6.31 6.69 58.6 2 1 62.5 53.4 76.3 2 29.3 26.9 2BLT11d-60 18 7.07 57.3 2 4.03 354 52.5 752 9.58 70 142 2BLT11d-60bulk 19 7.04 57.4 2 4.13 370 53 754 9.67 64.4 144 2BLT11d-comp. wash 3.23 2 8.75 2 1 62 7.94 136 2 12.7 16.5 2
CALCULATIONS AND MASS BALANCE
H+ assay H+ residual HCl ∆ acidmol/l g %
BLT11d-0 1.48 1.9BLT11d-2 1.46BLT11d-60 1.44 75.96BLT11d-60bulk 1.45 76.68average 1.46
solids IN total g Al Ca Cl Co Cr Fe Mg Mn Ni Si Znfeed solids 8.07 0.12 0.06 0.01 0.00 0.04 0.75 1.52 0.02 0.14 1.51 0.00solution IN total g total ml Al Ca Cl Co Cr Fe Mg Mn Ni Si Znhead liquor 1592.70 1554.61 0.0 0.0 87.84 0.0 0.0 0.0 0.0 0.0 0.0 0.0 0.0wash water 103.27 103.48 - - - - - - - - - - -total IN (g) 1704.04 0.13 0.07 87.85 0.01 0.04 0.75 1.52 0.02 0.14 1.52 0.01
solids OUT total g Al Ca Cl Co Cr Fe Mg Mn Ni Si ZnBLT11d-2 0.00 - - - - - - - - - - -BLT11d-60 0.00 - - - - - - - - - - -BLT11d-60bulk 3.50 0.07 0.04 0.01 0.00 0.03 0.09 0.17 0.00 0.00 1.38 0.00solution OUT total g total ml Al Ca Cl Co Cr Fe Mg Mn Ni Si ZnBLT11d-2 24.54 23.93 0.000 0.000 1.402 0.000 0.000 0.001 0.002 0.000 0.001 0.001 0.000BLT11d-60 25.23 24.55 0.000 0.000 1.407 0.000 0.000 0.009 0.018 0.000 0.002 0.003 0.000BLT11d-60bulk 1486.64 1446.85 0.027 0.010 83.049 0.003 0.006 0.535 1.091 0.014 0.093 0.208 0.003wash water 93.34 93.09 0.000 0.000 0.815 0.000 0.000 0.006 0.013 0.000 0.001 0.002 0.000cake moisture 7.40 7.38 0.000 0.000 0.065 0.000 0.000 0.000 0.001 0.000 0.000 0.000 0.000evaporation 40.05 40.13 - - - - - - - - - - -total OUT (g) 1680.70 0.10 0.06 86.74 0.00 0.03 0.64 1.29 0.02 0.10 1.59 0.00
balance (out/in) 99% 79% 83% 99% 69% 85% 85% 85% 78% 72% 105% 69%
extraction (solution) Al Ca Co Cr Fe Mg Mn Ni Si Zn
BLT11d-2 8% 16% 76% 4% 13% 7% 17% 33% 3% 76%BLT11d-60 21% 16% 73% 15% 69% 72% 79% 76% 14% 73%BLT11d-60bulk 23% 16% 73% 15% 72% 73% 80% 70% 14% 73%
extraction (solids) Al Ca Co Cr Fe Mg Mn Ni Si Zn
BLT11d-60bulk 41% 27% 55% 25% 88% 89% 90% 98% 6% 55%
extraction (ratio) Al Ca Co Cr Fe Mg Mn Ni Si Zn
BLT11d-2 13% 26% 55% 6% 15% 9% 19% 45% 1% 55%BLT11d-60 38% 28% 55% 25% 84% 88% 89% 106% 6% 55%BLT11d-60bulk 41% 27% 55% 25% 88% 89% 90% 98% 6% 55%
based on solids assayacid consumption g consumed kg/t ore Al Fe Mg Ni totalBLT11d-60 7.99 990BLT11d-60bulk 7.27 900acid equivalent (g) 0.21 1.29 4.05 0.16 5.72acid equivalent (%) 3.7 22.6 70.8 2.9 100.0
calc. total soln volumeml
1529.341465.991465.99
calc. total solid massg
3.6
calc. total soln volumeml
1529.31466.01466.0
APPENDIX A - Leach Test Sheets
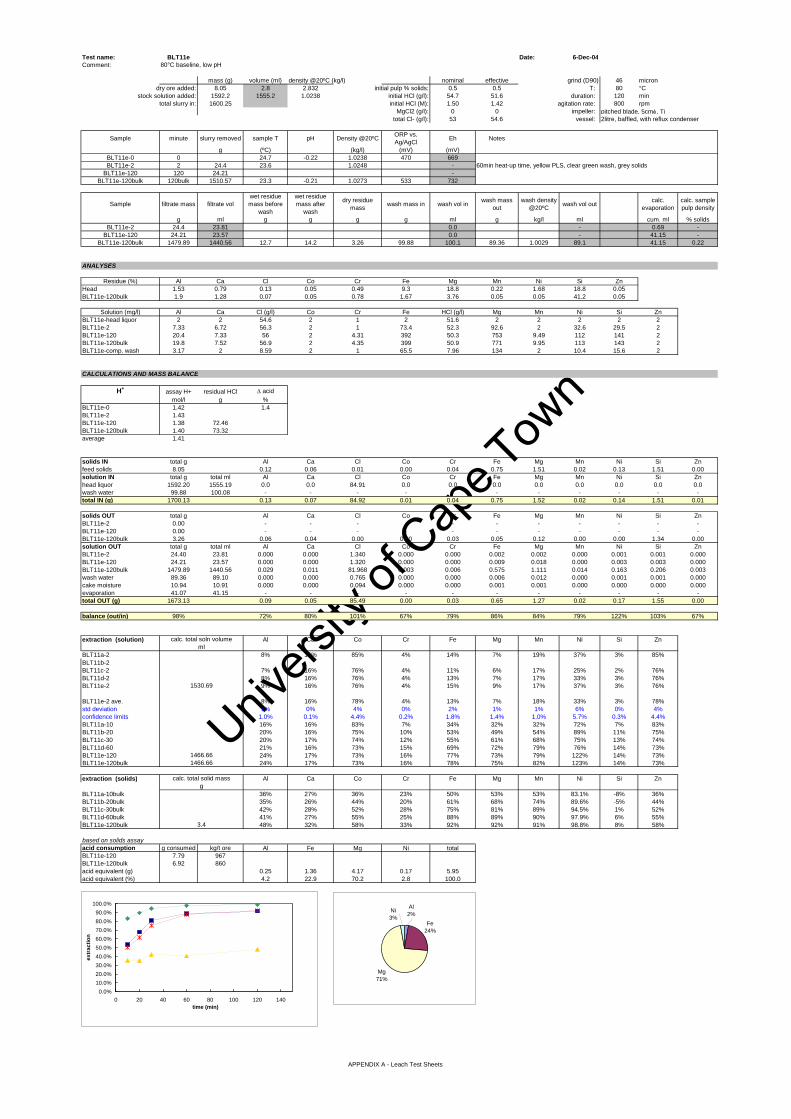
Univers
ity of
Cap
e Tow
n
Test name: BLT11e Date: 6-Dec-04Comment: 80°C baseline, low pH
mass (g) volume (ml) density @20ºC (kg/l) nominal effective grind (D90) 46 microndry ore added: 8.05 2.8 2.832 initial pulp % solids: 0.5 0.5 T: 80 °C
stock solution added: 1592.2 1555.2 1.0238 initial HCl (g/l): 54.7 51.6 duration: 120 mintotal slurry in: 1600.25 initial HCl (M): 1.50 1.42 agitation rate: 800 rpm
MgCl2 (g/l): 0 0 impeller: pitched blade, 5cmφ, Titotal Cl- (g/l): 53 54.6 vessel: 2litre, baffled, with reflux condenser
Sample minute slurry removed sample T pH Density @20ºC ORP vs. Ag/AgCl Eh Notes
g (ºC) (kg/l) (mV) (mV)BLT11e-0 0 24.7 -0.22 1.0238 470 669BLT11e-2 2 24.4 23.6 1.0248 - 60min heat-up time, yellow PLS, clear green wash, grey solids
BLT11e-120 120 24.21 -BLT11e-120bulk 120bulk 1510.57 23.3 -0.21 1.0273 533 732
Sample filtrate mass filtrate volwet residue mass before
wash
wet residue mass after
wash
dry residue mass wash mass in wash vol in wash mass
outwash density
@20ºC wash vol out calc. evaporation
calc. sample pulp density
g ml g g g g ml g kg/l ml cum. ml % solidsBLT11e-2 24.4 23.81 0.0 - 0.69 -
BLT11e-120 24.21 23.57 0.0 - 41.15 -BLT11e-120bulk 1479.89 1440.56 12.7 14.2 3.26 99.88 100.1 89.36 1.0029 89.1 41.15 0.22
ANALYSES
Residue (%) Al Ca Cl Co Cr Fe Mg Mn Ni Si ZnHead 1.53 0.79 0.13 0.05 0.49 9.3 18.8 0.22 1.68 18.8 0.05BLT11e-120bulk 1.9 1.28 0.07 0.05 0.78 1.67 3.76 0.05 0.05 41.2 0.05
Solution (mg/l) Al Ca Cl (g/l) Co Cr Fe HCl (g/l) Mg Mn Ni Si ZnBLT11e-head liquor 2 2 54.6 2 1 2 51.6 2 2 2 2 2BLT11e-2 7.33 6.72 56.3 2 1 73.4 52.3 92.6 2 32.6 29.5 2BLT11e-120 20.4 7.33 56 2 4.31 392 50.3 753 9.49 112 141 2BLT11e-120bulk 19.8 7.52 56.9 2 4.35 399 50.9 771 9.95 113 143 2BLT11e-comp. wash 3.17 2 8.59 2 1 65.5 7.96 134 2 10.4 15.6 2
CALCULATIONS AND MASS BALANCE
H+ assay H+ residual HCl ∆ acidmol/l g %
BLT11e-0 1.42 1.4BLT11e-2 1.43BLT11e-120 1.38 72.46BLT11e-120bulk 1.40 73.32average 1.41
solids IN total g Al Ca Cl Co Cr Fe Mg Mn Ni Si Znfeed solids 8.05 0.12 0.06 0.01 0.00 0.04 0.75 1.51 0.02 0.13 1.51 0.00solution IN total g total ml Al Ca Cl Co Cr Fe Mg Mn Ni Si Znhead liquor 1592.20 1555.19 0.0 0.0 84.91 0.0 0.0 0.0 0.0 0.0 0.0 0.0 0.0wash water 99.88 100.08 - - - - - - - - - - -total IN (g) 1700.13 0.13 0.07 84.92 0.01 0.04 0.75 1.52 0.02 0.14 1.51 0.01
solids OUT total g Al Ca Cl Co Cr Fe Mg Mn Ni Si ZnBLT11e-2 0.00 - - - - - - - - - - -BLT11e-120 0.00 - - - - - - - - - - -BLT11e-120bulk 3.26 0.06 0.04 0.00 0.00 0.03 0.05 0.12 0.00 0.00 1.34 0.00solution OUT total g total ml Al Ca Cl Co Cr Fe Mg Mn Ni Si ZnBLT11e-2 24.40 23.81 0.000 0.000 1.340 0.000 0.000 0.002 0.002 0.000 0.001 0.001 0.000BLT11e-120 24.21 23.57 0.000 0.000 1.320 0.000 0.000 0.009 0.018 0.000 0.003 0.003 0.000BLT11e-120bulk 1479.89 1440.56 0.029 0.011 81.968 0.003 0.006 0.575 1.111 0.014 0.163 0.206 0.003wash water 89.36 89.10 0.000 0.000 0.765 0.000 0.000 0.006 0.012 0.000 0.001 0.001 0.000cake moisture 10.94 10.91 0.000 0.000 0.094 0.000 0.000 0.001 0.001 0.000 0.000 0.000 0.000evaporation 41.07 41.15 - - - - - - - - - - -total OUT (g) 1673.13 0.09 0.05 85.49 0.00 0.03 0.65 1.27 0.02 0.17 1.55 0.00
balance (out/in) 98% 72% 80% 101% 67% 79% 86% 84% 79% 122% 103% 67%
extraction (solution) Al Ca Co Cr Fe Mg Mn Ni Si Zn
BLT11a-2 8% 16% 85% 4% 14% 7% 19% 37% 3% 85%BLT11b-2BLT11c-2 7% 16% 76% 4% 11% 6% 17% 25% 2% 76%BLT11d-2 8% 16% 76% 4% 13% 7% 17% 33% 3% 76%BLT11e-2 9% 16% 76% 4% 15% 9% 17% 37% 3% 76%
BLT11e-2 ave. 8% 16% 78% 4% 13% 7% 18% 33% 3% 78%std deviation 1% 0% 4% 0% 2% 1% 1% 6% 0% 4%confidence limits 1.0% 0.1% 4.4% 0.2% 1.8% 1.4% 1.0% 5.7% 0.3% 4.4%BLT11a-10 16% 16% 83% 7% 34% 32% 32% 72% 7% 83%BLT11b-20 20% 16% 75% 10% 53% 49% 54% 89% 11% 75%BLT11c-30 20% 17% 74% 12% 55% 61% 68% 75% 13% 74%BLT11d-60 21% 16% 73% 15% 69% 72% 79% 76% 14% 73%BLT11e-120 24% 17% 73% 16% 77% 73% 79% 122% 14% 73%BLT11e-120bulk 24% 17% 73% 16% 78% 75% 82% 123% 14% 73%
extraction (solids) Al Ca Co Cr Fe Mg Mn Ni Si Zn
BLT11a-10bulk 36% 27% 36% 23% 50% 53% 53% 83.1% -8% 36%BLT11b-20bulk 35% 26% 44% 20% 61% 68% 74% 89.6% -5% 44%BLT11c-30bulk 42% 28% 52% 28% 75% 81% 89% 94.5% 1% 52%BLT11d-60bulk 41% 27% 55% 25% 88% 89% 90% 97.9% 6% 55%BLT11e-120bulk 48% 32% 58% 33% 92% 92% 91% 98.8% 8% 58%
based on solids assayacid consumption g consumed kg/t ore Al Fe Mg Ni totalBLT11e-120 7.79 967BLT11e-120bulk 6.92 860acid equivalent (g) 0.25 1.36 4.17 0.17 5.95acid equivalent (%) 4.2 22.9 70.2 2.8 100.0
calc. total soln volume
calc. total solid massg
3.4
ml
1530.69
1466.661466.66
0.0%10.0%20.0%30.0%40.0%50.0%60.0%70.0%80.0%90.0%
100.0%
0 20 40 60 80 100 120 140time (min)
extr
actio
n
Fe24%
Mg71%
Ni3%
Al2%
APPENDIX A - Leach Test Sheets
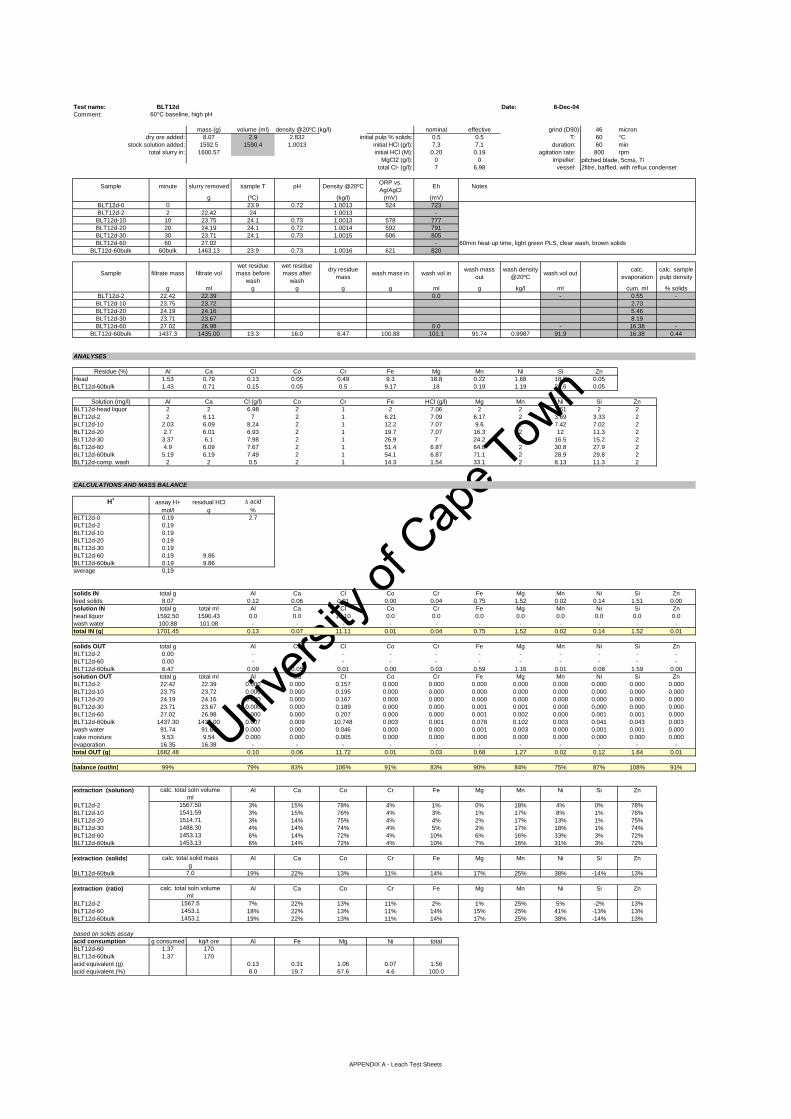
Univers
ity of
Cap
e Tow
n
Test name: BLT12d Date: 8-Dec-04Comment: 60°C baseline, high pH
mass (g) volume (ml) density @20ºC (kg/l) nominal effective grind (D90) 46 microndry ore added: 8.07 2.9 2.832 initial pulp % solids: 0.5 0.5 T: 60 °C
stock solution added: 1592.5 1590.4 1.0013 initial HCl (g/l): 7.3 7.1 duration: 60 mintotal slurry in: 1600.57 initial HCl (M): 0.20 0.19 agitation rate: 800 rpm
MgCl2 (g/l): 0 0 impeller: pitched blade, 5cmφ, Titotal Cl- (g/l): 7 6.98 vessel: 2litre, baffled, with reflux condenser
Sample minute slurry removed sample T pH Density @20ºC ORP vs. Ag/AgCl Eh Notes
g (ºC) (kg/l) (mV) (mV)BLT12d-0 0 23.9 0.72 1.0013 524 723BLT12d-2 2 22.42 24 1.0013 -
BLT12d-10 10 23.75 24.1 0.73 1.0013 578 777BLT12d-20 20 24.19 24.1 0.72 1.0014 592 791BLT12d-30 30 23.71 24.1 0.73 1.0015 606 805BLT12d-60 60 27.02 - 60min heat-up time, light green PLS, clear wash, brown solids
BLT12d-60bulk 60bulk 1463.13 23.9 0.73 1.0016 621 820
Sample filtrate mass filtrate volwet residue mass before
wash
wet residue mass after
wash
dry residue mass wash mass in wash vol in wash mass
outwash density
@20ºC wash vol out calc. evaporation
calc. sample pulp density
g ml g g g g ml g kg/l ml cum. ml % solidsBLT12d-2 22.42 22.39 0.0 - 0.55 -
BLT12d-10 23.75 23.72 2.73BLT12d-20 24.19 24.16 5.46BLT12d-30 23.71 23.67 8.19BLT12d-60 27.02 26.98 0.0 - 16.38 -
BLT12d-60bulk 1437.3 1435.00 13.3 16.0 6.47 100.88 101.1 91.74 0.9987 91.9 16.38 0.44
ANALYSES
Residue (%) Al Ca Cl Co Cr Fe Mg Mn Ni Si ZnHead 1.53 0.79 0.13 0.05 0.49 9.3 18.8 0.22 1.68 18.8 0.05BLT12d-60bulk 1.43 0.71 0.15 0.05 0.5 9.17 18 0.19 1.19 24.6 0.05
Solution (mg/l) Al Ca Cl (g/l) Co Cr Fe HCl (g/l) Mg Mn Ni Si ZnBLT12d-head liquor 2 2 6.98 2 1 2 7.06 2 2 2.61 2 2BLT12d-2 2 6.11 7 2 1 6.21 7.09 6.17 2 3.69 3.33 2BLT12d-10 2.03 6.09 8.24 2 1 12.2 7.07 9.6 2 7.42 7.02 2BLT12d-20 2.7 6.01 6.93 2 1 19.7 7.07 16.3 2 12 11.3 2BLT12d-30 3.37 6.1 7.98 2 1 26.9 7 24.2 2 16.5 15.2 2BLT12d-60 4.9 6.09 7.67 2 1 51.4 6.87 64.8 2 30.8 27.9 2BLT12d-60bulk 5.19 6.19 7.49 2 1 54.1 6.87 71.1 2 28.9 29.8 2BLT12d-comp. wash 2 2 0.5 2 1 14.3 1.54 33.1 2 8.13 11.3 2
CALCULATIONS AND MASS BALANCE
H+ assay H+ residual HCl ∆ acidmol/l g %
BLT12d-0 0.19 2.7BLT12d-2 0.19BLT12d-10 0.19BLT12d-20 0.19BLT12d-30 0.19BLT12d-60 0.19 9.86BLT12d-60bulk 0.19 9.86average 0.19
solids IN total g Al Ca Cl Co Cr Fe Mg Mn Ni Si Znfeed solids 8.07 0.12 0.06 0.01 0.00 0.04 0.75 1.52 0.02 0.14 1.51 0.00solution IN total g total ml Al Ca Cl Co Cr Fe Mg Mn Ni Si Znhead liquor 1592.50 1590.43 0.0 0.0 11.10 0.0 0.0 0.0 0.0 0.0 0.0 0.0 0.0wash water 100.88 101.08 - - - - - - - - - - -total IN (g) 1701.45 0.13 0.07 11.11 0.01 0.04 0.75 1.52 0.02 0.14 1.52 0.01
solids OUT total g Al Ca Cl Co Cr Fe Mg Mn Ni Si ZnBLT12d-2 0.00 - - - - - - - - - - -BLT12d-60 0.00 - - - - - - - - - - -BLT12d-60bulk 6.47 0.09 0.05 0.01 0.00 0.03 0.59 1.16 0.01 0.08 1.59 0.00solution OUT total g total ml Al Ca Cl Co Cr Fe Mg Mn Ni Si ZnBLT12d-2 22.42 22.39 0.000 0.000 0.157 0.000 0.000 0.000 0.000 0.000 0.000 0.000 0.000BLT12d-10 23.75 23.72 0.000 0.000 0.195 0.000 0.000 0.000 0.000 0.000 0.000 0.000 0.000BLT12d-20 24.19 24.16 0.000 0.000 0.167 0.000 0.000 0.000 0.000 0.000 0.000 0.000 0.000BLT12d-30 23.71 23.67 0.000 0.000 0.189 0.000 0.000 0.001 0.001 0.000 0.000 0.000 0.000BLT12d-60 27.02 26.98 0.000 0.000 0.207 0.000 0.000 0.001 0.002 0.000 0.001 0.001 0.000BLT12d-60bulk 1437.30 1435.00 0.007 0.009 10.748 0.003 0.001 0.078 0.102 0.003 0.041 0.043 0.003wash water 91.74 91.86 0.000 0.000 0.046 0.000 0.000 0.001 0.003 0.000 0.001 0.001 0.000cake moisture 9.53 9.54 0.000 0.000 0.005 0.000 0.000 0.000 0.000 0.000 0.000 0.000 0.000evaporation 16.35 16.38 - - - - - - - - - - -total OUT (g) 1682.48 0.10 0.06 11.72 0.01 0.03 0.68 1.27 0.02 0.12 1.64 0.01
balance (out/in) 99% 79% 83% 106% 91% 83% 90% 84% 75% 87% 108% 91%
extraction (solution) Al Ca Co Cr Fe Mg Mn Ni Si Zn
BLT12d-2 3% 15% 78% 4% 1% 0% 18% 4% 0% 78%BLT12d-10 3% 15% 76% 4% 3% 1% 17% 8% 1% 76%BLT12d-20 3% 14% 75% 4% 4% 2% 17% 13% 1% 75%BLT12d-30 4% 14% 74% 4% 5% 2% 17% 18% 1% 74%BLT12d-60 6% 14% 72% 4% 10% 6% 16% 33% 3% 72%BLT12d-60bulk 6% 14% 72% 4% 10% 7% 16% 31% 3% 72%
extraction (solids) Al Ca Co Cr Fe Mg Mn Ni Si Zn
BLT12d-60bulk 19% 22% 13% 11% 14% 17% 25% 38% -14% 13%
extraction (ratio) Al Ca Co Cr Fe Mg Mn Ni Si Zn
BLT12d-2 7% 22% 13% 11% 2% 1% 25% 5% -2% 13%BLT12d-60 18% 22% 13% 11% 14% 15% 25% 41% -13% 13%BLT12d-60bulk 19% 22% 13% 11% 14% 17% 25% 38% -14% 13%
based on solids assayacid consumption g consumed kg/t ore Al Fe Mg Ni totalBLT12d-60 1.37 170BLT12d-60bulk 1.37 170acid equivalent (g) 0.13 0.31 1.06 0.07 1.56acid equivalent (%) 8.0 19.7 67.6 4.6 100.0
1567.51453.11453.1
g7.0
calc. total soln volumeml
1453.13
calc. total solid mass
1541.591514.711488.30
calc. total soln volumeml
1567.50
1453.13
APPENDIX A - Leach Test Sheets

Univers
ity of
Cap
e Tow
n
Test name: BLT12e Date: 7-Dec-04Comment: 60°C baseline, high pH
mass (g) volume (ml) density @20ºC (kg/l) nominal effective grind (D90) 46 microndry ore added: 8.07 2.9 2.832 initial pulp % solids: 0.5 0.5 T: 60 °C
stock solution added: 1592.3 1590.1 1.0014 initial HCl (g/l): 7.3 7.0 duration: 120 mintotal slurry in: 1600.37 initial HCl (M): 0.20 0.19 agitation rate: 800 rpm
MgCl2 (g/l): 0 0 impeller: pitched blade, 5cmφ, Titotal Cl- (g/l): 7 6.85 vessel: 2litre, baffled, with reflux condenser
Sample minute slurry removed sample T pH Density @20ºC ORP vs. Ag/AgCl Eh Notes
g (ºC) (kg/l) (mV) (mV)BLT12e-0 0 23.9 0.72 1.0014 531 730BLT12e-2 2 22.96 23.9 1.0013 - 60min heat-up time, light green PLS, clear wash, brown solids
BLT12e-120 120 21.37 -BLT12e-120bulk 120bulk 1542.75 23.8 0.76 1.0019 616 815
Sample filtrate mass filtrate volwet residue mass before
wash
wet residue mass after
wash
dry residue mass wash mass in wash vol in wash mass
outwash density
@20ºC wash vol out calc. evaporation
calc. sample pulp density
g ml g g g g ml g kg/l ml cum. ml % solidsBLT12e-2 22.96 22.93 0.0 - 0.22 -
BLT12e-120 21.37 21.33 0.0 - 13.32 -BLT12e-120bulk 1507.38 1504.52 21.5 21.6 6.26 100.19 100.4 92.89 0.9989 93.0 13.32 0.41
ANALYSES
Residue (%) Al Ca Cl Co Cr Fe Mg Mn Ni Si ZnHead 1.53 0.79 0.13 0.05 0.49 9.3 18.8 0.22 1.68 18.8 0.05BLT12e-120bulk 1.58 0.83 0.18 0.05 0.54 8.69 16.9 0.17 0.91 26.1 0.05
Solution (mg/l) Al Ca Cl (g/l) Co Cr Fe HCl (g/l) Mg Mn Ni Si ZnBLT12e-head liquor 2 2 6.85 2 1 2 6.97 2 2 2.61 2 2BLT12e-2 2 6.4 6.85 2 1 5.9 6.93 6.23 2 3.2 3.22 2BLT12e-120 7.77 6.53 6.74 2 1 89.8 6.49 156 3.03 47.2 49.4 2BLT12e-120bulk 8.07 6.4 6.94 2 1 93.3 6.42 168 3.13 47.5 52.7 2BLT12e-comp. wash 2 2 0.5 2 1 22.1 1.77 53.8 2 12.3 16.5 2
CALCULATIONS AND MASS BALANCE
H+ assay H+ residual HCl ∆ acidmol/l g %
BLT12e-0 0.19 7.9BLT12e-2 0.19BLT12e-120 0.18 9.76BLT12e-120bulk 0.18 9.66average 0.18
solids IN total g Al Ca Cl Co Cr Fe Mg Mn Ni Si Znfeed solids 8.07 0.12 0.06 0.01 0.00 0.04 0.75 1.52 0.02 0.14 1.51 0.00solution IN total g total ml Al Ca Cl Co Cr Fe Mg Mn Ni Si Znhead liquor 1592.30 1590.07 0.0 0.0 10.89 0.0 0.0 0.0 0.0 0.0 0.0 0.0 0.0wash water 100.19 100.39 - - - - - - - - - - -total IN (g) 1700.56 0.13 0.07 10.90 0.01 0.04 0.75 1.52 0.02 0.14 1.52 0.01
solids OUT total g Al Ca Cl Co Cr Fe Mg Mn Ni Si ZnBLT12e-2 0.00 - - - - - - - - - - -BLT12e-120 0.00 - - - - - - - - - - -BLT12e-120bulk 6.26 0.10 0.05 0.01 0.00 0.03 0.54 1.06 0.01 0.06 1.63 0.00solution OUT total g total ml Al Ca Cl Co Cr Fe Mg Mn Ni Si ZnBLT12e-2 22.96 22.93 0.000 0.000 0.157 0.000 0.000 0.000 0.000 0.000 0.000 0.000 0.000BLT12e-120 21.37 21.33 0.000 0.000 0.144 0.000 0.000 0.002 0.003 0.000 0.001 0.001 0.000BLT12e-120bulk 1507.38 1504.52 0.012 0.010 10.441 0.003 0.002 0.140 0.253 0.005 0.071 0.079 0.003wash water 92.89 92.99 0.000 0.000 0.046 0.000 0.000 0.002 0.005 0.000 0.001 0.002 0.000cake moisture 15.34 15.36 0.000 0.000 0.008 0.000 0.000 0.000 0.001 0.000 0.000 0.000 0.000evaporation 13.29 13.32 - - - - - - - - - - -total OUT (g) 1679.49 0.11 0.06 10.81 0.01 0.04 0.69 1.32 0.02 0.13 1.72 0.01
balance (out/in) 99% 88% 93% 99% 89% 87% 91% 87% 75% 94% 113% 89%
extraction (solution) Al Ca Co Cr Fe Mg Mn Ni Si Zn
BLT12d-2 3% 15% 78% 4% 1% 0% 18% 4% 0% 78%BLT12e-2 3% 16% 78% 4% 1% 0% 18% 4% 0% 78%
BLT12e-2 ave. 3% 15% 78% 4% 1% 0% 18% 4% 0% 78%std deviation 0% 1% 0% 0% 0% 0% 0% 0% 0% 0%confidence limits 0.0% 0.7% 0.0% 0.0% 0.1% 0.0% 0.0% 0.6% 0.0% 0.0%BLT12d-60 6% 14% 72% 4% 10% 6% 16% 33% 3% 72%BLT12e-120 10% 16% 76% 4% 18% 16% 26% 54% 5% 76%BLT12e-120bulk 10% 15% 76% 4% 19% 17% 27% 54% 5% 76%
extraction (solids) Al Ca Co Cr Fe Mg Mn Ni Si Zn
BLT12d-60bulk 19% 22% 13% 11% 14% 17% 25% 38% -14% 13%BLT12e-120bulk 18% 16% 20% 11% 25% 28% 38% 57% -11% 20%
based on solids assayacid consumption g consumed kg/t ore Al Fe Mg Ni totalBLT12e-120 1.32 163BLT12e-120bulk 1.42 176acid equivalent (g) 0.10 0.41 1.38 0.10 1.98acid equivalent (%) 5.0 20.5 69.6 4.9 100.0
calc. total solid massg
6.4
ml
1566.92
1532.501532.50
calc. total soln volume
0%10%20%30%40%50%60%70%80%90%
100%
0 20 40 60 80 100 120 140time (min)
extr
actio
n
Fe24%
Mg71%
Ni3%
Al2%
APPENDIX A - Leach Test Sheets

Univers
ity of
Cap
e Tow
n
Test name: BLT13a Date: 1-Apr-05Comment: 80°C baseline, 0.5% solids
mass (g) volume (ml) density @20ºC (kg/l) nominal effective grind (D90) 46 microndry ore added: 8 2.8 2.832 initial pulp % solids: 0.5 0.5 T: 80 °C
stock solution added: 1592.4 1589.9 1.0016 initial HCl (g/l): 7.3 7.1 duration: 10 mintotal slurry in: 1600.4 initial HCl (M): 0.20 0.19 agitation rate: 800 rpm
MgCl2 (g/l): 0 0 impeller: pitched blade, 5cmφ, Titotal Cl- (g/l): 7 8.13 vessel: 2litre, baffled, with reflux condenser
Sample minute slurry removed sample T pH Density @20ºC ORP vs. Ag/AgCl Eh Notes
g (ºC) (kg/l) (mV) (mV)
BLT13a-0 0 1.0016 -
BLT13a-2 2 -
BLT13a-10 10 20.81 -
BLT13a-10bulk 10bulk 1561.6 0.75 1.0018 588 787
Sample filtrate mass filtrate volwet residue mass before
wash
wet residue mass after
wash
dry residue mass wash mass in wash vol in wash mass
outwash density
@20ºC wash vol out calc. evaporation
calc. sample pulp density
g ml g g g g ml g kg/l ml cum. ml % solids
BLT13a-2 0.0 - 3.61 -
BLT13a-10 20.4 20.36 0.0 - 18.03 -
BLT13a-10bulk 1537.8 1535.04 7.7 8.7 7.39 223.57 224.0 215.23 0.9985 215.6 18.03 0.47
ANALYSES
Residue (%) Al Ca Cl Co Cr Fe Mg Mn Ni Si ZnHead 1.53 0.79 0.13 0.05 0.49 9.3 18.8 0.22 1.68 18.8 0.05BLT13a-10bulk 1.34 0.73 0.18 0.05 0.49 8.42 17.5 0.2 1.19 17.6 0.05
Solution (mg/l) Al Ca Cl (g/l) Co Cr Fe HCl (g/l) Mg Mn Ni Si ZnBLT13a-head liquor 2 2 8.13 2 1 2 7.08 2 2 2 2 2BLT13a-2BLT13a-10 4.31 3.5 7.24 2 1 32.4 7.07 38.9 2 18.9 15.1 2BLT13a-10bulk 5.62 3.56 7.57 2 1 44.9 6.9 64.9 2 29 20.6 2BLT13a-comp. wash 2 2 0.5 2 1 2.67 0.5 11.7 2 2 3.15 2
CALCULATIONS AND MASS BALANCE
H+ assay H+ residual HCl ∆ acidmol/l g %
BLT13a-0 0.19 2.5BLT13a-2BLT13a-10 0.19 10.85BLT13a-10bulk 0.19 10.59average 0.19
solids IN total g Al Ca Cl Co Cr Fe Mg Mn Ni Si Znfeed solids 8.00 0.12 0.06 0.01 0.00 0.04 0.74 1.50 0.02 0.13 1.50 0.00solution IN total g total ml Al Ca Cl Co Cr Fe Mg Mn Ni Si Znhead liquor 1592.40 1589.86 0.0 0.0 12.93 0.0 0.0 0.0 0.0 0.0 0.0 0.0 0.0wash water 223.57 224.02 - - - - - - - - - - -total IN (g) 1823.97 0.13 0.07 12.94 0.01 0.04 0.75 1.51 0.02 0.14 1.50 0.01
solids OUT total g Al Ca Cl Co Cr Fe Mg Mn Ni Si ZnBLT13a-2 0.00 - - - - - - - - - - -BLT13a-10 0.00 - - - - - - - - - - -BLT13a-10bulk 7.39 0.10 0.05 0.01 0.00 0.04 0.62 1.29 0.01 0.09 1.30 0.00solution OUT total g total ml Al Ca Cl Co Cr Fe Mg Mn Ni Si ZnBLT13a-2 0.00 0.00 0.000 0.000 0.000 0.000 0.000 0.000 0.000 0.000 0.000 0.000 0.000BLT13a-10 20.40 20.36 0.000 0.000 0.147 0.000 0.000 0.001 0.001 0.000 0.000 0.000 0.000BLT13a-10bulk 1537.80 1535.04 0.009 0.005 11.620 0.003 0.002 0.069 0.100 0.003 0.045 0.032 0.003wash water 215.23 215.55 0.000 0.000 0.108 0.000 0.000 0.001 0.003 0.000 0.000 0.001 0.000cake moisture 1.31 1.31 0.000 0.000 0.001 0.000 0.000 0.000 0.000 0.000 0.000 0.000 0.000evaporation 17.99 18.03 - - - - - - - - - - -total OUT (g) 1800.12 0.11 0.06 11.89 0.01 0.04 0.69 1.40 0.02 0.13 1.33 0.01
balance (out/in) 99% 86% 90% 92% 101% 94% 93% 93% 88% 97% 89% 101%
extraction (solution) Al Ca Co Cr Fe Mg Mn Ni Si Zn
BLT13a-2 0% 0% 0% 0% 0% 0% 0% 0% 0% 0%BLT13a-10 5% 9% 78% 4% 7% 4% 18% 22% 2% 78%BLT13a-10bulk 7% 9% 78% 4% 9% 6% 18% 34% 2% 78%
extraction (solids) Al Ca Co Cr Fe Mg Mn Ni Si Zn
BLT13a-10bulk 18% 14% 6% 5% 15% 13% 15% 34% 12% 6%
extraction (ratio) Al Ca Co Cr Fe Mg Mn Ni Si Zn
BLT13a-2 0% 0% 0% 0% 0% 0% 0% 0% 0% 0%BLT13a-10 14% 13% 6% 5% 11% 8% 15% 22% 9% 6%BLT13a-10bulk 18% 14% 6% 5% 15% 13% 15% 34% 12% 6%
based on solids assayacid consumption g consumed kg/t ore Al Fe Mg Ni totalBLT13a-10 0.40 50BLT13a-10bulk 0.66 83acid equivalent (g) 0.09 0.24 0.63 0.06 1.02acid equivalent (%) 9.3 23.4 61.8 5.6 100.0
7.5
calc. total solid massg
1551.5
calc. total soln volumeml
1586.31551.5
1551.5
calc. total soln volumeml
1586.31551.5
APPENDIX A - Leach Test Sheets
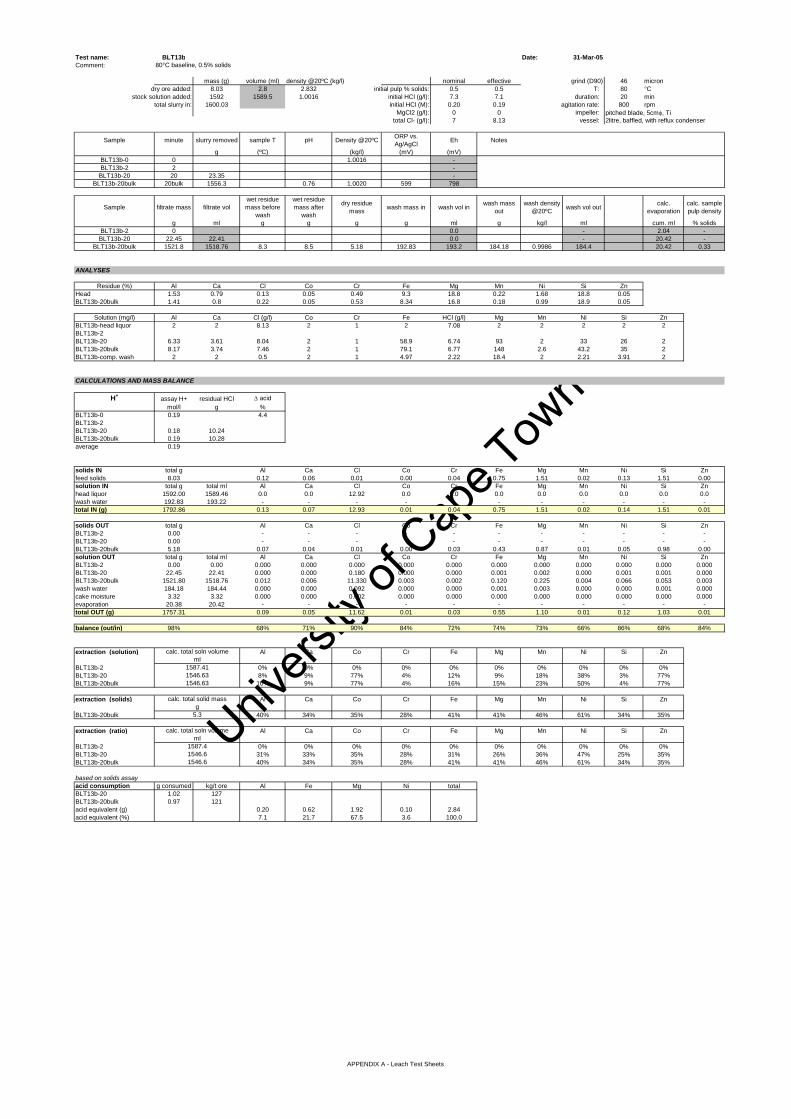
Univers
ity of
Cap
e Tow
n
Test name: BLT13b Date: 31-Mar-05Comment: 80°C baseline, 0.5% solids
mass (g) volume (ml) density @20ºC (kg/l) nominal effective grind (D90) 46 microndry ore added: 8.03 2.8 2.832 initial pulp % solids: 0.5 0.5 T: 80 °C
stock solution added: 1592 1589.5 1.0016 initial HCl (g/l): 7.3 7.1 duration: 20 mintotal slurry in: 1600.03 initial HCl (M): 0.20 0.19 agitation rate: 800 rpm
MgCl2 (g/l): 0 0 impeller: pitched blade, 5cmφ, Titotal Cl- (g/l): 7 8.13 vessel: 2litre, baffled, with reflux condenser
Sample minute slurry removed sample T pH Density @20ºC ORP vs. Ag/AgCl Eh Notes
g (ºC) (kg/l) (mV) (mV)BLT13b-0 0 1.0016 -BLT13b-2 2 -
BLT13b-20 20 23.35 -BLT13b-20bulk 20bulk 1556.3 0.76 1.0020 599 798
Sample filtrate mass filtrate volwet residue mass before
wash
wet residue mass after
wash
dry residue mass wash mass in wash vol in wash mass
outwash density
@20ºC wash vol out calc. evaporation
calc. sample pulp density
g ml g g g g ml g kg/l ml cum. ml % solidsBLT13b-2 0 0.0 - 2.04 -BLT13b-20 22.45 22.41 0.0 - 20.42 -
BLT13b-20bulk 1521.8 1518.76 8.3 8.5 5.18 192.83 193.2 184.18 0.9986 184.4 20.42 0.33
ANALYSES
Residue (%) Al Ca Cl Co Cr Fe Mg Mn Ni Si ZnHead 1.53 0.79 0.13 0.05 0.49 9.3 18.8 0.22 1.68 18.8 0.05BLT13b-20bulk 1.41 0.8 0.22 0.05 0.53 8.34 16.8 0.18 0.99 18.9 0.05
Solution (mg/l) Al Ca Cl (g/l) Co Cr Fe HCl (g/l) Mg Mn Ni Si ZnBLT13b-head liquor 2 2 8.13 2 1 2 7.08 2 2 2 2 2BLT13b-2BLT13b-20 6.33 3.61 8.04 2 1 58.9 6.74 93 2 33 26 2BLT13b-20bulk 8.17 3.74 7.46 2 1 79.1 6.77 148 2.6 43.2 35 2BLT13b-comp. wash 2 2 0.5 2 1 4.97 2.22 18.4 2 2.21 3.91 2
CALCULATIONS AND MASS BALANCE
H+ assay H+ residual HCl ∆ acidmol/l g %
BLT13b-0 0.19 4.4BLT13b-2BLT13b-20 0.18 10.24BLT13b-20bulk 0.19 10.28average 0.19
solids IN total g Al Ca Cl Co Cr Fe Mg Mn Ni Si Znfeed solids 8.03 0.12 0.06 0.01 0.00 0.04 0.75 1.51 0.02 0.13 1.51 0.00solution IN total g total ml Al Ca Cl Co Cr Fe Mg Mn Ni Si Znhead liquor 1592.00 1589.46 0.0 0.0 12.92 0.0 0.0 0.0 0.0 0.0 0.0 0.0 0.0wash water 192.83 193.22 - - - - - - - - - - -total IN (g) 1792.86 0.13 0.07 12.93 0.01 0.04 0.75 1.51 0.02 0.14 1.51 0.01
solids OUT total g Al Ca Cl Co Cr Fe Mg Mn Ni Si ZnBLT13b-2 0.00 - - - - - - - - - - -BLT13b-20 0.00 - - - - - - - - - - -BLT13b-20bulk 5.18 0.07 0.04 0.01 0.00 0.03 0.43 0.87 0.01 0.05 0.98 0.00solution OUT total g total ml Al Ca Cl Co Cr Fe Mg Mn Ni Si ZnBLT13b-2 0.00 0.00 0.000 0.000 0.000 0.000 0.000 0.000 0.000 0.000 0.000 0.000 0.000BLT13b-20 22.45 22.41 0.000 0.000 0.180 0.000 0.000 0.001 0.002 0.000 0.001 0.001 0.000BLT13b-20bulk 1521.80 1518.76 0.012 0.006 11.330 0.003 0.002 0.120 0.225 0.004 0.066 0.053 0.003wash water 184.18 184.44 0.000 0.000 0.092 0.000 0.000 0.001 0.003 0.000 0.000 0.001 0.000cake moisture 3.32 3.32 0.000 0.000 0.002 0.000 0.000 0.000 0.000 0.000 0.000 0.000 0.000evaporation 20.38 20.42 - - - - - - - - - - -total OUT (g) 1757.31 0.09 0.05 11.62 0.01 0.03 0.55 1.10 0.01 0.12 1.03 0.01
balance (out/in) 98% 68% 71% 90% 84% 72% 74% 73% 66% 86% 68% 84%
extraction (solution) Al Ca Co Cr Fe Mg Mn Ni Si Zn
BLT13b-2 0% 0% 0% 0% 0% 0% 0% 0% 0% 0%BLT13b-20 8% 9% 77% 4% 12% 9% 18% 38% 3% 77%BLT13b-20bulk 10% 9% 77% 4% 16% 15% 23% 50% 4% 77%
extraction (solids) Al Ca Co Cr Fe Mg Mn Ni Si Zn
BLT13b-20bulk 40% 34% 35% 28% 41% 41% 46% 61% 34% 35%
extraction (ratio) Al Ca Co Cr Fe Mg Mn Ni Si Zn
BLT13b-2 0% 0% 0% 0% 0% 0% 0% 0% 0% 0%BLT13b-20 31% 33% 35% 28% 31% 26% 36% 47% 25% 35%BLT13b-20bulk 40% 34% 35% 28% 41% 41% 46% 61% 34% 35%
based on solids assayacid consumption g consumed kg/t ore Al Fe Mg Ni totalBLT13b-20 1.02 127BLT13b-20bulk 0.97 121acid equivalent (g) 0.20 0.62 1.92 0.10 2.84acid equivalent (%) 7.1 21.7 67.5 3.6 100.0
1546.6
calc. total soln volumeml
1587.41546.6
1546.63
calc. total solid massg
5.3
calc. total soln volumeml
1587.411546.63
APPENDIX A - Leach Test Sheets

Univers
ity of
Cap
e Tow
n
Test name: BLT13c Date: 31-Mar-05Comment: 80°C baseline, 0.5% solids
mass (g) volume (ml) density @20ºC (kg/l) nominal effective grind (D90) 46 microndry ore added: 8.06 2.8 2.832 initial pulp % solids: 0.5 0.5 T: 80 °C
stock solution added: 1592.6 1590.1 1.0016 initial HCl (g/l): 7.3 7.1 duration: 30 mintotal slurry in: 1600.66 initial HCl (M): 0.20 0.19 agitation rate: 800 rpm
MgCl2 (g/l): 0 0 impeller: pitched blade, 5cmφ, Titotal Cl- (g/l): 7 8.13 vessel: 2litre, baffled, with reflux condenser
Sample minute slurry removed sample T pH Density @20ºC ORP vs. Ag/AgCl Eh Notes
g (ºC) (kg/l) (mV) (mV)BLT13c-0 0 1.0016 -BLT13c-2 2 -
BLT13c-30 30 24.4 -BLT13c-30bulk 30bulk 1556.04 0.79 1.0024 601 800
Sample filtrate mass filtrate volwet residue mass before
wash
wet residue mass after
wash
dry residue mass wash mass in wash vol in wash mass
outwash density
@20ºC wash vol out calc. evaporation
calc. sample pulp density
g ml g g g g ml g kg/l ml cum. ml % solidsBLT13c-2 0 0.0 - 1.35 -BLT13c-30 23.37 23.31 0.0 - 20.26 -
BLT13c-30bulk 1525.3 1521.65 9.1 10.6 5.03 197.66 198.1 194.81 0.9984 195.1 20.26 0.32
ANALYSES
Residue (%) Al Ca Cl Co Cr Fe Mg Mn Ni Si ZnHead 1.53 0.79 0.13 0.05 0.49 9.3 18.8 0.22 1.68 18.8 0.05BLT13c-30bulk 1.49 0.85 0.33 0.05 0.57 8.34 16.3 0.17 0.89 19.8 0.05
Solution (mg/l) Al Ca Cl (g/l) Co Cr Fe HCl (g/l) Mg Mn Ni Si ZnBLT13c-head liquor 2 2 8.13 2 1 2 7.08 2 2 2 2 2BLT13c-2BLT13c-30 8.17 3.8 7.33 2 1 88.3 6.34 170 2.68 47.1 37.7 2BLT13c-30bulk 9.46 3.59 7.54 2 1 101 6.41 222 3.44 52.1 45.3 2.89BLT13c-comp. wash 2 2 0.5 2 1 6.29 8.57 23.7 2 2 4.19 2
CALCULATIONS AND MASS BALANCE
H+ assay H+ residual HCl ∆ acidmol/l g %
BLT13c-0 0.19 9.5BLT13c-2 0.00BLT13c-30 0.17 9.65BLT13c-30bulk 0.18 9.75average 0.14
solids IN total g Al Ca Cl Co Cr Fe Mg Mn Ni Si Znfeed solids 8.06 0.12 0.06 0.01 0.00 0.04 0.75 1.52 0.02 0.14 1.51 0.00solution IN total g total ml Al Ca Cl Co Cr Fe Mg Mn Ni Si Znhead liquor 1592.60 1590.06 0.0 0.0 12.93 0.0 0.0 0.0 0.0 0.0 0.0 0.0 0.0wash water 197.66 198.06 - - - - - - - - - - -total IN (g) 1798.32 0.13 0.07 12.94 0.01 0.04 0.75 1.52 0.02 0.14 1.51 0.01
solids OUT total g Al Ca Cl Co Cr Fe Mg Mn Ni Si ZnBLT13c-2 0.00 - - - - - - - - - - -BLT13c-30 0.00 - - - - - - - - - - -BLT13c-30bulk 5.03 0.07 0.04 0.02 0.00 0.03 0.42 0.82 0.01 0.04 1.00 0.00solution OUT total g total ml Al Ca Cl Co Cr Fe Mg Mn Ni Si ZnBLT13c-2 0.00 0.00 0.000 0.000 0.000 0.000 0.000 0.000 0.000 0.000 0.000 0.000 0.000BLT13c-30 23.37 23.31 0.000 0.000 0.171 0.000 0.000 0.002 0.004 0.000 0.001 0.001 0.000BLT13c-30bulk 1525.30 1521.65 0.014 0.005 11.473 0.003 0.002 0.154 0.338 0.005 0.079 0.069 0.004wash water 194.81 195.12 0.000 0.000 0.098 0.000 0.000 0.001 0.005 0.000 0.000 0.001 0.000cake moisture 5.57 5.58 0.000 0.000 0.003 0.000 0.000 0.000 0.000 0.000 0.000 0.000 0.000evaporation 20.22 20.26 - - - - - - - - - - -total OUT (g) 1774.30 0.09 0.05 11.76 0.01 0.03 0.58 1.17 0.01 0.13 1.07 0.01
balance (out/in) 99% 71% 73% 91% 83% 75% 77% 77% 68% 91% 70% 102%
extraction (solution) Al Ca Co Cr Fe Mg Mn Ni Si Zn
BLT13c-2 0% 0% 0% 0% 0% 0% 0% 0% 0% 0%BLT13c-30 10% 9% 77% 4% 18% 17% 23% 54% 4% 77%BLT13c-30bulk 12% 9% 77% 4% 21% 22% 30% 60% 5% 111%
extraction (solids) Al Ca Co Cr Fe Mg Mn Ni Si Zn
BLT13c-30bulk 38% 32% 37% 26% 43% 45% 51% 66% 33% 37%
extraction (ratio) Al Ca Co Cr Fe Mg Mn Ni Si Zn
BLT13c-2 0% 0% 0% 0% 0% 0% 0% 0% 0% 0%BLT13c-30 33% 34% 37% 26% 38% 34% 40% 60% 28% 25%BLT13c-30bulk 38% 32% 37% 26% 43% 45% 51% 66% 33% 37%
based on solids assayacid consumption g consumed kg/t ore Al Fe Mg Ni totalBLT13c-30 1.61 200BLT13c-30bulk 1.50 187acid equivalent (g) 0.20 0.65 2.09 0.11 3.04acid equivalent (%) 6.4 21.3 68.6 3.7 100.0
1546.51546.5
5.1
calc. total soln volumeml
1588.7
1546.481546.48
calc. total solid massg
calc. total soln volumeml
1588.71
APPENDIX A - Leach Test Sheets

Univers
ity of
Cap
e Tow
n
Test name: BLT13d Date: 30-Mar-05Comment: 80°C baseline, 0.5% solids
mass (g) volume (ml) density @20ºC (kg/l) nominal effective grind (D90) 46 microndry ore added: 8.02 2.8 2.832 initial pulp % solids: 0.5 0.5 T: 80 °C
stock solution added: 1592.6 1590.1 1.0016 initial HCl (g/l): 7.3 7.1 duration: 60 mintotal slurry in: 1600.62 initial HCl (M): 0.20 0.19 agitation rate: 800 rpm
MgCl2 (g/l): 0 0 impeller: pitched blade, 5cmφ, Titotal Cl- (g/l): 7 8.13 vessel: 2litre, baffled, with reflux condenser
Sample minute slurry removed sample T pH Density @20ºC ORP vs. Ag/AgCl Eh Notes
g (ºC) (kg/l) (mV) (mV)BLT13d-0 0 1.0016 -BLT13d-2 2 -
BLT13d-60 60 21.53 -BLT13d-60bulk 60bulk 1558.6 0.81 1.0027 600 799
Sample filtrate mass filtrate volwet residue mass before
wash
wet residue mass after
wash
dry residue mass wash mass in wash vol in wash mass
outwash density
@20ºC wash vol out calc. evaporation
calc. sample pulp density
g ml g g g g ml g kg/l ml cum. ml % solidsBLT13d-2 0 0.0 - 0.68 -BLT13d-60 20.91 20.85 0.0 - 20.53 -
BLT13d-60bulk 1533.4 1529.27 9.8 10.9 4.3 195.39 195.8 180.86 0.9985 181.1 20.53 0.28
ANALYSES
Residue (%) Al Ca Cl Co Cr Fe Mg Mn Ni Si ZnHead 1.53 0.79 0.13 0.05 0.49 9.3 18.8 0.22 1.68 18.8 0.05BLT13d-60bulk 1.54 0.92 0.29 0.05 0.61 8.07 13.7 0.12 0.65 20.6 0.05
Solution (mg/l) Al Ca Cl (g/l) Co Cr Fe HCl (g/l) Mg Mn Ni Si ZnBLT13d-head liquor 2 2 8.13 2 1 2 7.08 2 2 2 2 2BLT13d-2BLT13d-60 11.5 3.59 7.55 2 1.16 147 6.04 361 5.22 64 67.4 2BLT13d-60bulk 12.2 3.68 8.35 2 1.22 142 5.77 402 5.74 64.1 73.8 4BLT13d-comp. wash 2 2 0.5 2 1 8.91 1.29 40.5 2 3.93 5.4 2
CALCULATIONS AND MASS BALANCE
H+ assay H+ residual HCl ∆ acidmol/l g %
BLT13d-0 0.19 18.5BLT13d-2 0.00BLT13d-60 0.17 9.24BLT13d-60bulk 0.16 8.82average 0.13
solids IN total g Al Ca Cl Co Cr Fe Mg Mn Ni Si Znfeed solids 8.02 0.12 0.06 0.01 0.00 0.04 0.75 1.51 0.02 0.13 1.50 0.00solution IN total g total ml Al Ca Cl Co Cr Fe Mg Mn Ni Si Znhead liquor 1592.60 1590.06 0.0 0.0 12.93 0.0 0.0 0.0 0.0 0.0 0.0 0.0 0.0wash water 195.39 195.78 - - - - - - - - - - -total IN (g) 1796.01 0.13 0.07 12.94 0.01 0.04 0.75 1.51 0.02 0.14 1.51 0.01
solids OUT total g Al Ca Cl Co Cr Fe Mg Mn Ni Si ZnBLT13d-2 0.00 - - - - - - - - - - -BLT13d-60 0.00 - - - - - - - - - - -BLT13d-60bulk 4.30 0.07 0.04 0.01 0.00 0.03 0.35 0.59 0.01 0.03 0.89 0.00solution OUT total g total ml Al Ca Cl Co Cr Fe Mg Mn Ni Si ZnBLT13d-2 0.00 0.00 0.000 0.000 0.000 0.000 0.000 0.000 0.000 0.000 0.000 0.000 0.000BLT13d-60 20.91 20.85 0.000 0.000 0.157 0.000 0.000 0.003 0.008 0.000 0.001 0.001 0.000BLT13d-60bulk 1533.40 1529.27 0.019 0.006 12.769 0.003 0.002 0.217 0.615 0.009 0.098 0.113 0.006wash water 180.86 181.13 0.000 0.000 0.091 0.000 0.000 0.002 0.007 0.000 0.001 0.001 0.000cake moisture 6.60 6.61 0.000 0.000 0.003 0.000 0.000 0.000 0.000 0.000 0.000 0.000 0.000evaporation 20.49 20.53 - - - - - - - - - - -total OUT (g) 1766.56 0.09 0.05 13.03 0.01 0.03 0.57 1.22 0.01 0.13 1.00 0.01
balance (out/in) 98% 68% 69% 101% 78% 70% 76% 81% 69% 93% 66% 121%
extraction (solution) Al Ca Co Cr Fe Mg Mn Ni Si Zn
BLT13d-2 0% 0% 0% 0% 0% 0% 0% 0% 0% 0%BLT13d-60 15% 9% 77% 5% 31% 37% 46% 74% 7% 77%BLT13d-60bulk 15% 9% 77% 5% 29% 41% 50% 74% 8% 154%
extraction (solids) Al Ca Co Cr Fe Mg Mn Ni Si Zn
BLT13d-60bulk 45% 37% 46% 32% 53% 60% 70% 79% 40% 46%
extraction (ratio) Al Ca Co Cr Fe Mg Mn Ni Si Zn
BLT13d-2 0% 0% 0% 0% 0% 0% 0% 0% 0% 0%BLT13d-60 43% 36% 46% 30% 55% 54% 64% 79% 37% 23%BLT13d-60bulk 45% 37% 46% 32% 53% 60% 70% 79% 40% 46%
based on solids assayacid consumption g consumed kg/t ore Al Fe Mg Ni totalBLT13d-60 2.02 252BLT13d-60bulk 2.43 303acid equivalent (g) 0.23 0.78 2.76 0.13 3.90acid equivalent (%) 5.9 20.1 70.7 3.4 100.0
1589.41548.71548.7
g4.4
calc. total soln volumeml
1589.371548.671548.67
calc. total solid mass
calc. total soln volumeml
APPENDIX A - Leach Test Sheets
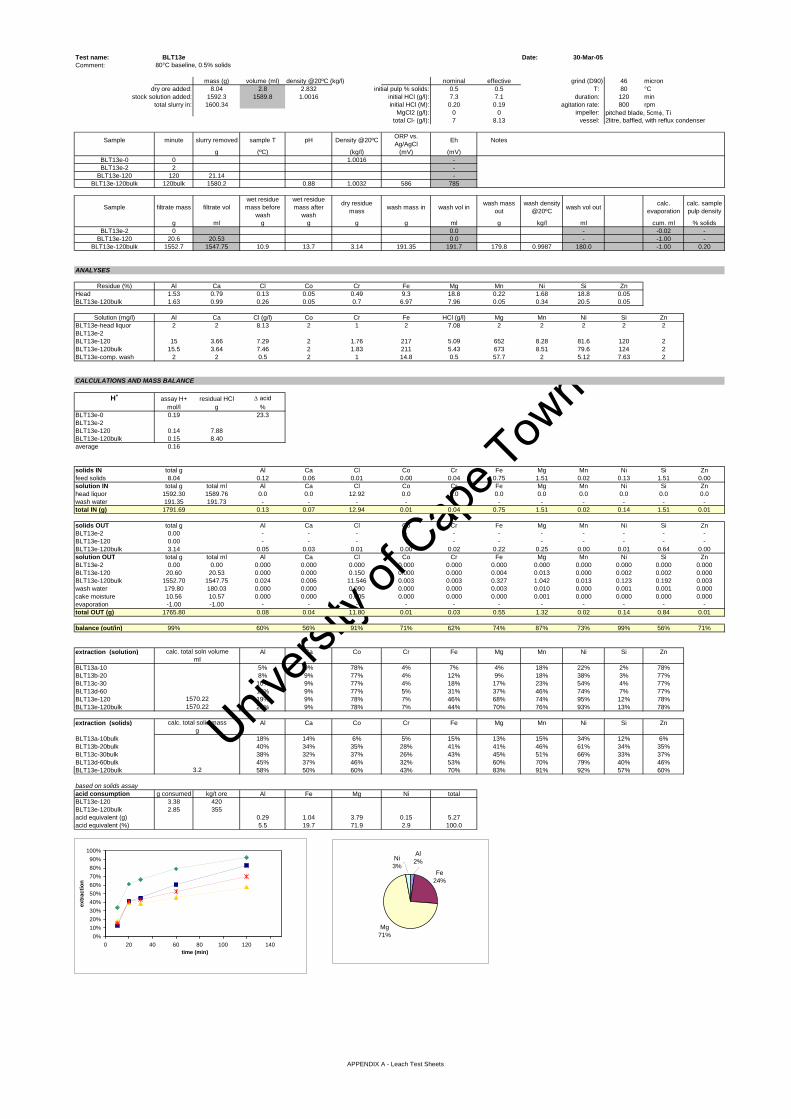
Univers
ity of
Cap
e Tow
n
Test name: BLT13e Date: 30-Mar-05Comment: 80°C baseline, 0.5% solids
mass (g) volume (ml) density @20ºC (kg/l) nominal effective grind (D90) 46 microndry ore added: 8.04 2.8 2.832 initial pulp % solids: 0.5 0.5 T: 80 °C
stock solution added: 1592.3 1589.8 1.0016 initial HCl (g/l): 7.3 7.1 duration: 120 mintotal slurry in: 1600.34 initial HCl (M): 0.20 0.19 agitation rate: 800 rpm
MgCl2 (g/l): 0 0 impeller: pitched blade, 5cmφ, Titotal Cl- (g/l): 7 8.13 vessel: 2litre, baffled, with reflux condenser
Sample minute slurry removed sample T pH Density @20ºC ORP vs. Ag/AgCl Eh Notes
g (ºC) (kg/l) (mV) (mV)BLT13e-0 0 1.0016 -BLT13e-2 2 -
BLT13e-120 120 21.14 -BLT13e-120bulk 120bulk 1580.2 0.88 1.0032 586 785
Sample filtrate mass filtrate volwet residue mass before
wash
wet residue mass after
wash
dry residue mass wash mass in wash vol in wash mass
outwash density
@20ºC wash vol out calc. evaporation
calc. sample pulp density
g ml g g g g ml g kg/l ml cum. ml % solidsBLT13e-2 0 0.0 - -0.02 -
BLT13e-120 20.6 20.53 0.0 - -1.00 -BLT13e-120bulk 1552.7 1547.75 10.9 13.7 3.14 191.35 191.7 179.8 0.9987 180.0 -1.00 0.20
ANALYSES
Residue (%) Al Ca Cl Co Cr Fe Mg Mn Ni Si ZnHead 1.53 0.79 0.13 0.05 0.49 9.3 18.8 0.22 1.68 18.8 0.05BLT13e-120bulk 1.63 0.99 0.26 0.05 0.7 6.97 7.96 0.05 0.34 20.5 0.05
Solution (mg/l) Al Ca Cl (g/l) Co Cr Fe HCl (g/l) Mg Mn Ni Si ZnBLT13e-head liquor 2 2 8.13 2 1 2 7.08 2 2 2 2 2BLT13e-2BLT13e-120 15 3.66 7.29 2 1.76 217 5.09 652 8.28 81.6 120 2BLT13e-120bulk 15.5 3.64 7.46 2 1.83 211 5.43 673 8.51 79.6 124 2BLT13e-comp. wash 2 2 0.5 2 1 14.8 0.5 57.7 2 5.12 7.63 2
CALCULATIONS AND MASS BALANCE
H+ assay H+ residual HCl ∆ acidmol/l g %
BLT13e-0 0.19 23.3BLT13e-2BLT13e-120 0.14 7.88BLT13e-120bulk 0.15 8.40average 0.16
solids IN total g Al Ca Cl Co Cr Fe Mg Mn Ni Si Znfeed solids 8.04 0.12 0.06 0.01 0.00 0.04 0.75 1.51 0.02 0.13 1.51 0.00solution IN total g total ml Al Ca Cl Co Cr Fe Mg Mn Ni Si Znhead liquor 1592.30 1589.76 0.0 0.0 12.92 0.0 0.0 0.0 0.0 0.0 0.0 0.0 0.0wash water 191.35 191.73 - - - - - - - - - - -total IN (g) 1791.69 0.13 0.07 12.94 0.01 0.04 0.75 1.51 0.02 0.14 1.51 0.01
solids OUT total g Al Ca Cl Co Cr Fe Mg Mn Ni Si ZnBLT13e-2 0.00 - - - - - - - - - - -BLT13e-120 0.00 - - - - - - - - - - -BLT13e-120bulk 3.14 0.05 0.03 0.01 0.00 0.02 0.22 0.25 0.00 0.01 0.64 0.00solution OUT total g total ml Al Ca Cl Co Cr Fe Mg Mn Ni Si ZnBLT13e-2 0.00 0.00 0.000 0.000 0.000 0.000 0.000 0.000 0.000 0.000 0.000 0.000 0.000BLT13e-120 20.60 20.53 0.000 0.000 0.150 0.000 0.000 0.004 0.013 0.000 0.002 0.002 0.000BLT13e-120bulk 1552.70 1547.75 0.024 0.006 11.546 0.003 0.003 0.327 1.042 0.013 0.123 0.192 0.003wash water 179.80 180.03 0.000 0.000 0.090 0.000 0.000 0.003 0.010 0.000 0.001 0.001 0.000cake moisture 10.56 10.57 0.000 0.000 0.005 0.000 0.000 0.000 0.001 0.000 0.000 0.000 0.000evaporation -1.00 -1.00 - - - - - - - - - - -total OUT (g) 1765.80 0.08 0.04 11.80 0.01 0.03 0.55 1.32 0.02 0.14 0.84 0.01
balance (out/in) 99% 60% 56% 91% 71% 62% 74% 87% 73% 99% 56% 71%
extraction (solution) Al Ca Co Cr Fe Mg Mn Ni Si Zn
BLT13a-10 5% 9% 78% 4% 7% 4% 18% 22% 2% 78%BLT13b-20 8% 9% 77% 4% 12% 9% 18% 38% 3% 77%BLT13c-30 10% 9% 77% 4% 18% 17% 23% 54% 4% 77%BLT13d-60 15% 9% 77% 5% 31% 37% 46% 74% 7% 77%BLT13e-120 19% 9% 78% 7% 46% 68% 74% 95% 12% 78%BLT13e-120bulk 20% 9% 78% 7% 44% 70% 76% 93% 13% 78%
extraction (solids) Al Ca Co Cr Fe Mg Mn Ni Si Zn
BLT13a-10bulk 18% 14% 6% 5% 15% 13% 15% 34% 12% 6%BLT13b-20bulk 40% 34% 35% 28% 41% 41% 46% 61% 34% 35%BLT13c-30bulk 38% 32% 37% 26% 43% 45% 51% 66% 33% 37%BLT13d-60bulk 45% 37% 46% 32% 53% 60% 70% 79% 40% 46%BLT13e-120bulk 58% 50% 60% 43% 70% 83% 91% 92% 57% 60%
based on solids assayacid consumption g consumed kg/t ore Al Fe Mg Ni totalBLT13e-120 3.38 420BLT13e-120bulk 2.85 355acid equivalent (g) 0.29 1.04 3.79 0.15 5.27acid equivalent (%) 5.5 19.7 71.9 2.9 100.0
calc. total solid massg
3.2
ml
1570.221570.22
calc. total soln volume
0%10%20%30%40%50%60%70%80%90%
100%
0 20 40 60 80 100 120 140time (min)
extr
actio
n
Fe24%
Mg71%
Ni3%
Al2%
APPENDIX A - Leach Test Sheets

Univers
ity of
Cap
e Tow
n
Test name: ST14a Date: 10-Dec-04Comment: high pH, low total Cl-
mass (g) volume (ml) density @20ºC (kg/l) nominal effective grind (D90) 46 microndry ore added: 8.05 2.8 2.832 initial pulp % solids: 0.5 0.5 T: 80 °C
stock solution added: 1592.5 1389.4 1.1462 initial HCl (g/l): 7.3 7.6 duration: 10 mintotal slurry in: 1600.55 initial HCl (M): 0.20 0.21 agitation rate: 800 rpm
MgCl2 (g/l): 191.63 190 impeller: pitched blade, 5cmφ, Titotal Cl- (g/l): 150 147 vessel: 2litre, baffled, with reflux condenser
Sample minute slurry removed sample T pH Density @20ºC ORP vs. Ag/AgCl Eh Notes
g (ºC) (kg/l) (mV) (mV)
ST14a-0 0 25 -0.47 1.1462 496 695
ST14a-2 2 25.85 25.6 1.1471 566 765 90min heat-up time, yellow PLS, clear green wash, light brown solids
ST14a-10 10 14.53 -
ST14a-10bulk 10bulk 1529.76 26.1 -0.19 1.1495 560 759
Sample filtrate mass filtrate volwet residue mass before
wash
wet residue mass after
wash
dry residue mass wash mass in wash vol in wash mass
outwash density
@20ºC wash vol out calc. evaporation
calc. sample pulp density
g ml g g g g ml g kg/l ml cum. ml % solids
ST14a-2 25.85 22.54 0.0 - 6.09 -
ST14a-10 14.53 12.64 0.0 - 30.47 -
ST14a-10bulk 1507.14 1311.13 7.3 7.6 5.72 102.74 102.9 94.76 1.0229 92.6 30.47 0.37
ANALYSES
Residue (%) Al Ca Cl Co Cr Fe Mg Mn Ni Si ZnHead 1.53 0.79 0.13 0.05 0.49 9.3 18.8 0.22 1.68 18.8 0.05ST14a-10bulk 1.51 0.83 0.58 0.05 0.58 7.28 14.5 0.17 0.55 22.2 0.05
Solution (mg/l) Al Ca Cl (g/l) Co Cr Fe HCl (g/l) Mg Mn Ni Si ZnST14a-head liquor 2 2 147 2 1 4.73 7.56 48426 2 8.06 2 2ST14a-2 9.32 6.33 149 2.59 1.28 50 6.96 46246 2 28.9 10.7 2ST14a-10 16.9 6.5 148 2.06 1.36 196 6.19 47579 2.37 57.3 29.4 2ST14a-10bulk 19.2 6.31 150 2.06 1.88 232 5.84 48202 3.67 77.3 35 2ST14a-comp. wash 3.67 2 23.6 2 1 47.8 0.92 6798 2 18.2 5.67 2
CALCULATIONS AND MASS BALANCE
H+ assay H+ residual HCl ∆ acidmol/l g %
ST14a-0 0.21 22.8ST14a-2 0.19ST14a-10 0.17 8.12ST14a-10bulk 0.16 7.66average 0.18
solids IN total g Al Ca Cl Co Cr Fe Mg Mn Ni Si Znfeed solids 8.05 0.12 0.06 0.01 0.00 0.04 0.75 1.51 0.02 0.13 1.51 0.00solution IN total g total ml Al Ca Cl Co Cr Fe Mg Mn Ni Si Znhead liquor 1592.50 1389.37 0.0 0.0 204.24 0.0 0.0 0.0 67.3 0.0 0.0 0.0 0.0wash water 102.74 102.95 - - - - - - - - - - -total IN (g) 1703.29 0.13 0.07 204.25 0.01 0.04 0.76 68.80 0.02 0.15 1.51 0.01
solids OUT total g Al Ca Cl Co Cr Fe Mg Mn Ni Si ZnST14a-2 0.00 - - - - - - - - - - -ST14a-10 0.00 - - - - - - - - - - -ST14a-10bulk 5.72 0.09 0.05 0.03 0.00 0.03 0.42 0.83 0.01 0.03 1.27 0.00solution OUT total g total ml Al Ca Cl Co Cr Fe Mg Mn Ni Si ZnST14a-2 25.85 22.54 0.000 0.000 3.358 0.000 0.000 0.001 1.042 0.000 0.001 0.000 0.000ST14a-10 14.53 12.64 0.000 0.000 1.871 0.000 0.000 0.002 0.601 0.000 0.001 0.000 0.000ST14a-10bulk 1507.14 1311.13 0.025 0.008 196.669 0.003 0.002 0.304 63.199 0.005 0.101 0.046 0.003wash water 94.76 92.64 0.000 0.000 2.186 0.000 0.000 0.004 0.630 0.000 0.002 0.001 0.000cake moisture 1.88 1.84 0.000 0.000 0.043 0.000 0.000 0.000 0.012 0.000 0.000 0.000 0.000evaporation 30.41 30.47 - - - - - - - - - - -total OUT (g) 1680.29 0.11 0.06 204.16 0.01 0.04 0.73 66.31 0.01 0.14 1.32 0.01
balance (out/in) 99% 89% 85% 100% 86% 88% 96% 96% 72% 93% 87% 84%
extraction (solution) Al Ca Co Cr Fe Mg Mn Ni Si Zn
ST14a-2 10% 14% 88% 4% 9% -288% 15% 29% 1% 68%ST14a-10 18% 14% 68% 5% 35% -284% 18% 56% 3% 66%ST14a-10bulk 21% 13% 68% 6% 41% -230% 27% 76% 3% 66%
extraction (solids) Al Ca Co Cr Fe Mg Mn Ni Si Zn
ST14a-10bulk 28% 23% 27% 13% 43% 44% 44% 76% 14% 27%
extraction (ratio) Al Ca Co Cr Fe Mg Mn Ni Si Zn
ST14a-2 14% 23% 34% 9% 9% 42% 24% 28% 4% 27%ST14a-10 25% 24% 27% 9% 36% 43% 28% 56% 11% 27%ST14a-10bulk 28% 23% 27% 13% 43% 44% 44% 76% 14% 27%
based on solids assayacid consumption g consumed kg/t ore Al Fe Mg Ni totalST14a-10 2.39 297ST14a-10bulk 2.85 354acid equivalent (g) 0.15 0.65 2.05 0.13 2.98acid equivalent (%) 5.0 21.9 68.8 4.3 100.0
1323.7
calc. total soln volumeml
1360.71323.7
calc. total soln volumeml
1360.71323.7
5.9
calc. total solid massg
1323.7
APPENDIX A - Leach Test Sheets

Univers
ity of
Cap
e Tow
n
Test name: ST14b Date: 10-Dec-04Comment: high pH, low total Cl-
mass (g) volume (ml) density @20ºC (kg/l) nominal effective grind (D90) 46 microndry ore added: 8.05 2.8 2.832 initial pulp % solids: 0.5 0.5 T: 80 °C
stock solution added: 1592.5 1389.4 1.1462 initial HCl (g/l): 7.3 7.0 duration: 20 mintotal slurry in: 1600.55 initial HCl (M): 0.20 0.19 agitation rate: 800 rpm
MgCl2 (g/l): 192 187 impeller: pitched blade, 5cmφ, Titotal Cl- (g/l): 150 148 vessel: 2litre, baffled, with reflux condenser
Sample minute slurry removed sample T pH Density @20ºC ORP vs. Ag/AgCl Eh Notes
g (ºC) (kg/l) (mV) (mV)ST14b-0 0 25 -0.42 1.1462 515 714ST14b-2 2 25.76 25.7 1.1468 565 764 70min heat-up time, yellow PLS, light green wash, light brown solids
ST14b-20 20 18.37 -ST14b-20bulk 20bulk 1529.68 26 -0.17 1.1495 561 760
Sample filtrate mass filtrate volwet residue mass before
wash
wet residue mass after
wash
dry residue mass wash mass in wash vol in wash mass
outwash density
@20ºC wash vol out calc. evaporation
calc. sample pulp density
g ml g g g g ml g kg/l ml cum. ml % solidsST14b-2 25.76 22.46 0.0 - 2.68 -
ST14b-20 18.37 15.98 0.0 - 26.79 -ST14b-20bulk 1511.3 1314.75 6.2 12.8 5.13 103 103.2 96.37 1.0206 94.4 26.79 0.34
ANALYSES
Residue (%) Al Ca Cl Co Cr Fe Mg Mn Ni Si ZnHead 1.53 0.79 0.13 0.05 0.49 9.3 18.8 0.22 1.68 18.8 0.05ST14b-20bulk 1.6 0.92 0.58 0.05 0.62 6.49 12.5 0.14 0.41 24.2 0.05
Solution (mg/l) Al Ca Cl (g/l) Co Cr Fe HCl (g/l) Mg Mn Ni Si ZnST14b-head liquor 2 2.05 148 2 1 5.38 6.96 47731 2 7.58 2 2ST14b-2 8.23 6.34 147 2.06 1 58.8 6.79 47063 2 69 9.39 2ST14b-20 21.6 6.13 148 3.4 1.81 306 5.46 47236 5.08 77.2 43.1 2ST14b-20bulk 19.6 6.24 149 2.61 2.11 348 5.31 47765 5.69 123 45.6 2ST14b-comp. wash 3.77 2 21.5 2 1 58.6 0.7 6225 2 19.1 6.04 2
CALCULATIONS AND MASS BALANCE
H+ assay H+ residual HCl ∆ acidmol/l g %
ST14b-0 0.19 23.7ST14b-2 0.19ST14b-20 0.15 7.18ST14b-20bulk 0.15 6.98average 0.17
solids IN total g Al Ca Cl Co Cr Fe Mg Mn Ni Si Znfeed solids 8.05 0.12 0.06 0.01 0.00 0.04 0.75 1.51 0.02 0.13 1.51 0.00solution IN total g total ml Al Ca Cl Co Cr Fe Mg Mn Ni Si Znhead liquor 1592.50 1389.37 0.0 0.0 205.63 0.0 0.0 0.0 66.3 0.0 0.0 0.0 0.0wash water 103.00 103.21 - - - - - - - - - - -total IN (g) 1703.55 0.13 0.07 205.64 0.01 0.04 0.76 67.83 0.02 0.15 1.51 0.01
solids OUT total g Al Ca Cl Co Cr Fe Mg Mn Ni Si ZnST14b-2 0.00 - - - - - - - - - - -ST14b-20 0.00 - - - - - - - - - - -ST14b-20bulk 5.13 0.08 0.05 0.03 0.00 0.03 0.33 0.64 0.01 0.02 1.24 0.00solution OUT total g total ml Al Ca Cl Co Cr Fe Mg Mn Ni Si ZnST14b-2 25.76 22.46 0.000 0.000 3.302 0.000 0.000 0.001 1.057 0.000 0.002 0.000 0.000ST14b-20 18.37 15.98 0.000 0.000 2.365 0.000 0.000 0.005 0.755 0.000 0.001 0.001 0.000ST14b-20bulk 1511.30 1314.75 0.026 0.008 195.897 0.003 0.003 0.458 62.799 0.007 0.162 0.060 0.003wash water 96.37 94.42 0.000 0.000 2.030 0.000 0.000 0.006 0.588 0.000 0.002 0.001 0.000cake moisture 7.70 7.54 0.000 0.000 0.162 0.000 0.000 0.000 0.047 0.000 0.000 0.000 0.000evaporation 26.74 26.79 - - - - - - - - - - -total OUT (g) 1691.37 0.11 0.06 203.79 0.01 0.03 0.80 65.89 0.01 0.19 1.30 0.01
balance (out/in) 99% 86% 84% 99% 93% 86% 106% 97% 73% 129% 86% 80%
extraction (solution) Al Ca Co Cr Fe Mg Mn Ni Si Zn
ST14b-2 9% 14% 70% 3% 11% -140% 15% 70% 1% 68%ST14b-20 23% 13% 112% 6% 54% -249% 38% 76% 4% 66%ST14b-20bulk 21% 13% 86% 7% 62% -203% 43% 121% 4% 66%
extraction (solids) Al Ca Co Cr Fe Mg Mn Ni Si Zn
ST14b-20bulk 31% 24% 34% 16% 54% 56% 58% 84% 15% 34%
extraction (ratio) Al Ca Co Cr Fe Mg Mn Ni Si Zn
ST14b-2 13% 24% 27% 8% 9% 56% 20% 47% 3% 34%ST14b-20 35% 23% 45% 14% 48% 56% 52% 53% 15% 34%ST14b-20bulk 31% 24% 34% 16% 54% 56% 58% 84% 15% 34%
based on solids assayacid consumption g consumed kg/t ore Al Fe Mg Ni totalST14b-20 2.49 310ST14b-20bulk 2.69 334acid equivalent (g) 0.17 0.82 2.62 0.14 3.74acid equivalent (%) 4.5 21.8 70.0 3.8 100.0
calc. total soln volumeml
1364.231324.141324.14
calc. total solid massg
5.3
calc. total soln volumeml
1364.21324.11324.1
APPENDIX A - Leach Test Sheets
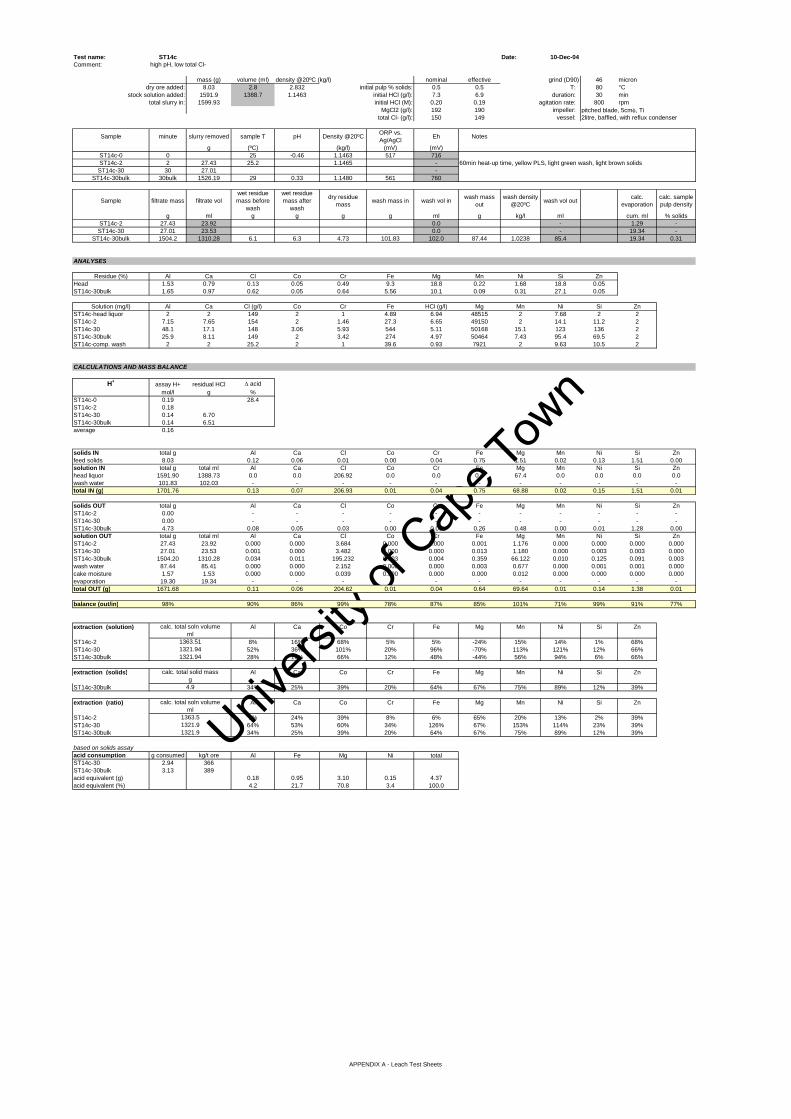
Univers
ity of
Cap
e Tow
n
Test name: ST14c Date: 10-Dec-04Comment: high pH, low total Cl-
mass (g) volume (ml) density @20ºC (kg/l) nominal effective grind (D90) 46 microndry ore added: 8.03 2.8 2.832 initial pulp % solids: 0.5 0.5 T: 80 °C
stock solution added: 1591.9 1388.7 1.1463 initial HCl (g/l): 7.3 6.9 duration: 30 mintotal slurry in: 1599.93 initial HCl (M): 0.20 0.19 agitation rate: 800 rpm
MgCl2 (g/l): 192 190 impeller: pitched blade, 5cmφ, Titotal Cl- (g/l): 150 149 vessel: 2litre, baffled, with reflux condenser
Sample minute slurry removed sample T pH Density @20ºC ORP vs. Ag/AgCl Eh Notes
g (ºC) (kg/l) (mV) (mV)ST14c-0 0 25 -0.46 1.1463 517 716ST14c-2 2 27.43 25.2 1.1465 - 60min heat-up time, yellow PLS, light green wash, light brown solids
ST14c-30 30 27.01 -ST14c-30bulk 30bulk 1526.19 29 0.33 1.1480 561 760
Sample filtrate mass filtrate volwet residue mass before
wash
wet residue mass after
wash
dry residue mass wash mass in wash vol in wash mass
outwash density
@20ºC wash vol out calc. evaporation
calc. sample pulp density
g ml g g g g ml g kg/l ml cum. ml % solidsST14c-2 27.43 23.92 0.0 - 1.29 -
ST14c-30 27.01 23.53 0.0 - 19.34 -ST14c-30bulk 1504.2 1310.28 6.1 6.3 4.73 101.83 102.0 87.44 1.0238 85.4 19.34 0.31
ANALYSES
Residue (%) Al Ca Cl Co Cr Fe Mg Mn Ni Si ZnHead 1.53 0.79 0.13 0.05 0.49 9.3 18.8 0.22 1.68 18.8 0.05ST14c-30bulk 1.65 0.97 0.62 0.05 0.64 5.56 10.1 0.09 0.31 27.1 0.05
Solution (mg/l) Al Ca Cl (g/l) Co Cr Fe HCl (g/l) Mg Mn Ni Si ZnST14c-head liquor 2 2 149 2 1 4.89 6.94 48515 2 7.68 2 2ST14c-2 7.15 7.65 154 2 1.46 27.3 6.65 49150 2 14.1 11.2 2ST14c-30 48.1 17.1 148 3.06 5.93 544 5.11 50168 15.1 123 136 2ST14c-30bulk 25.9 8.11 149 2 3.42 274 4.97 50464 7.43 95.4 69.5 2ST14c-comp. wash 2 2 25.2 2 1 39.6 0.93 7921 2 9.63 10.5 2
CALCULATIONS AND MASS BALANCE
H+ assay H+ residual HCl ∆ acidmol/l g %
ST14c-0 0.19 28.4ST14c-2 0.18ST14c-30 0.14 6.70ST14c-30bulk 0.14 6.51average 0.16
solids IN total g Al Ca Cl Co Cr Fe Mg Mn Ni Si Znfeed solids 8.03 0.12 0.06 0.01 0.00 0.04 0.75 1.51 0.02 0.13 1.51 0.00solution IN total g total ml Al Ca Cl Co Cr Fe Mg Mn Ni Si Znhead liquor 1591.90 1388.73 0.0 0.0 206.92 0.0 0.0 0.0 67.4 0.0 0.0 0.0 0.0wash water 101.83 102.03 - - - - - - - - - - -total IN (g) 1701.76 0.13 0.07 206.93 0.01 0.04 0.75 68.88 0.02 0.15 1.51 0.01
solids OUT total g Al Ca Cl Co Cr Fe Mg Mn Ni Si ZnST14c-2 0.00 - - - - - - - - - - -ST14c-30 0.00 - - - - - - - - - - -ST14c-30bulk 4.73 0.08 0.05 0.03 0.00 0.03 0.26 0.48 0.00 0.01 1.28 0.00solution OUT total g total ml Al Ca Cl Co Cr Fe Mg Mn Ni Si ZnST14c-2 27.43 23.92 0.000 0.000 3.684 0.000 0.000 0.001 1.176 0.000 0.000 0.000 0.000ST14c-30 27.01 23.53 0.001 0.000 3.482 0.000 0.000 0.013 1.180 0.000 0.003 0.003 0.000ST14c-30bulk 1504.20 1310.28 0.034 0.011 195.232 0.003 0.004 0.359 66.122 0.010 0.125 0.091 0.003wash water 87.44 85.41 0.000 0.000 2.152 0.000 0.000 0.003 0.677 0.000 0.001 0.001 0.000cake moisture 1.57 1.53 0.000 0.000 0.039 0.000 0.000 0.000 0.012 0.000 0.000 0.000 0.000evaporation 19.30 19.34 - - - - - - - - - - -total OUT (g) 1671.68 0.11 0.06 204.62 0.01 0.04 0.64 69.64 0.01 0.14 1.38 0.01
balance (out/in) 98% 90% 86% 99% 78% 87% 85% 101% 71% 99% 91% 77%
extraction (solution) Al Ca Co Cr Fe Mg Mn Ni Si Zn
ST14c-2 8% 16% 68% 5% 5% -24% 15% 14% 1% 68%ST14c-30 52% 36% 101% 20% 96% -70% 113% 121% 12% 66%ST14c-30bulk 28% 17% 66% 12% 48% -44% 56% 94% 6% 66%
extraction (solids) Al Ca Co Cr Fe Mg Mn Ni Si Zn
ST14c-30bulk 34% 25% 39% 20% 64% 67% 75% 89% 12% 39%
extraction (ratio) Al Ca Co Cr Fe Mg Mn Ni Si Zn
ST14c-2 9% 24% 39% 8% 6% 65% 20% 13% 2% 39%ST14c-30 64% 53% 60% 34% 126% 67% 153% 114% 23% 39%ST14c-30bulk 34% 25% 39% 20% 64% 67% 75% 89% 12% 39%
based on solids assayacid consumption g consumed kg/t ore Al Fe Mg Ni totalST14c-30 2.94 366ST14c-30bulk 3.13 389acid equivalent (g) 0.18 0.95 3.10 0.15 4.37acid equivalent (%) 4.2 21.7 70.8 3.4 100.0
calc. total soln volumeml
1363.511321.941321.94
calc. total solid massg
4.9
calc. total soln volumeml
1363.51321.91321.9
APPENDIX A - Leach Test Sheets

Univers
ity of
Cap
e Tow
n
Test name: ST14d Date: 9-Dec-04Comment: high pH, low total Cl-
mass (g) volume (ml) density @20ºC (kg/l) nominal effective grind (D90) 46 microndry ore added: 8.03 2.8 2.832 initial pulp % solids: 0.5 0.5 T: 80 °C
stock solution added: 1592 1404.0 1.1339 initial HCl (g/l): 7.3 7.0 duration: 60 mintotal slurry in: 1600.03 initial HCl (M): 0.20 0.19 agitation rate: 800 rpm
MgCl2 (g/l): 192 171 impeller: pitched blade, 5cmφ, Titotal Cl- (g/l): 150 135 vessel: 2litre, baffled, with reflux condenser
Sample minute slurry removed sample T pH Density @20ºC ORP vs. Ag/AgCl Eh Notes
g (ºC) (kg/l) (mV) (mV)ST14d-0 0 24.3 -0.17 1.1339 500 699ST14d-2 2 23.95 25.2 1.1436 - 60min heat-up time, orange-yellow PLS, clear green wash, light brown solids
ST14d-60 60 24.5 -ST14d-60bulk 60bulk 1520.02 25.7 -0.24 1.1463 562 761
Sample filtrate mass filtrate volwet residue mass before
wash
wet residue mass after
wash
dry residue mass wash mass in wash vol in wash mass
outwash density
@20ºC wash vol out calc. evaporation
calc. sample pulp density
g ml g g g g ml g kg/l ml cum. ml % solidsST14d-2 23.95 20.94 0.0 - 1.05 -
ST14d-60 24.5 21.37 0.0 - 31.62 -ST14d-60bulk 1496.01 1305.08 7.2 7.6 4.17 106.59 106.8 99.93 1.0208 97.9 31.62 0.27
ANALYSES
Residue (%) Al Ca Cl Co Cr Fe Mg Mn Ni Si ZnHead 1.53 0.79 0.13 0.05 0.49 9.3 18.8 0.22 1.68 18.8 0.05ST14d-60bulk 1.81 1.14 0.62 0.05 0.72 3.92 6.86 0.05 0.18 30.1 0.05
Solution (mg/l) Al Ca Cl (g/l) Co Cr Fe HCl (g/l) Mg Mn Ni Si ZnST14d-head liquor 2 2 135 2 1 4.18 6.98 43691 2 6.16 2 2ST14d-2 11.6 8.68 141 2 6.06 65.8 6.75 47749 2 27.9 14.7 2ST14d-60 27.9 8.5 145 2 4.15 313 4.72 49286 9.21 47.2 82.2 2ST14d-60bulk 28.3 8.03 146 3.44 4.16 322 4.56 49638 9.39 96.4 84.7 2ST14d-comp. wash 3.96 2 21.6 2 1 44.8 0.5 6804 2 8.74 9.23 2
CALCULATIONS AND MASS BALANCE
H+ assay H+ residual HCl ∆ acidmol/l g %
ST14d-0 0.19 34.7ST14d-2 0.19ST14d-60 0.13 6.16ST14d-60bulk 0.13 5.95average 0.16
solids IN total g Al Ca Cl Co Cr Fe Mg Mn Ni Si Znfeed solids 8.03 0.12 0.06 0.01 0.00 0.04 0.75 1.51 0.02 0.13 1.51 0.00solution IN total g total ml Al Ca Cl Co Cr Fe Mg Mn Ni Si Znhead liquor 1592.00 1404.00 0.0 0.0 189.54 0.0 0.0 0.0 61.3 0.0 0.0 0.0 0.0wash water 106.59 106.80 - - - - - - - - - - -total IN (g) 1706.62 0.13 0.07 189.55 0.01 0.04 0.75 62.85 0.02 0.14 1.51 0.01
solids OUT total g Al Ca Cl Co Cr Fe Mg Mn Ni Si ZnST14d-2 0.00 - - - - - - - - - - -ST14d-60 0.00 - - - - - - - - - - -ST14d-60bulk 4.17 0.08 0.05 0.03 0.00 0.03 0.16 0.29 0.00 0.01 1.26 0.00solution OUT total g total ml Al Ca Cl Co Cr Fe Mg Mn Ni Si ZnST14d-2 23.95 20.94 0.000 0.000 2.953 0.000 0.000 0.001 1.000 0.000 0.001 0.000 0.000ST14d-60 24.50 21.37 0.001 0.000 3.099 0.000 0.000 0.007 1.053 0.000 0.001 0.002 0.000ST14d-60bulk 1496.01 1305.08 0.037 0.010 190.541 0.004 0.005 0.420 64.781 0.012 0.126 0.111 0.003wash water 99.93 97.89 0.000 0.000 2.115 0.000 0.000 0.004 0.666 0.000 0.001 0.001 0.000cake moisture 3.43 3.36 0.000 0.000 0.073 0.000 0.000 0.000 0.023 0.000 0.000 0.000 0.000evaporation 31.56 31.62 - - - - - - - - - - -total OUT (g) 1683.55 0.11 0.06 198.81 0.01 0.04 0.60 67.81 0.01 0.14 1.37 0.00
balance (out/in) 99% 90% 88% 105% 101% 89% 79% 108% 72% 95% 91% 73%
extraction (solution) Al Ca Co Cr Fe Mg Mn Ni Si Zn
ST14d-2 13% 19% 69% 22% 12% 308% 16% 29% 1% 69%ST14d-60 30% 18% 66% 14% 56% 279% 69% 47% 7% 66%ST14d-60bulk 31% 17% 114% 14% 57% 310% 71% 95% 7% 66%
extraction (solids) Al Ca Co Cr Fe Mg Mn Ni Si Zn
ST14d-60bulk 37% 23% 46% 20% 77% 80% 88% 94% 14% 46%
extraction (ratio) Al Ca Co Cr Fe Mg Mn Ni Si Zn
ST14d-2 15% 25% 27% 30% 16% 77% 19% 27% 2% 46%ST14d-60 36% 24% 27% 20% 75% 80% 86% 46% 14% 46%ST14d-60bulk 37% 23% 46% 20% 77% 80% 88% 94% 14% 46%
based on solids assayacid consumption g consumed kg/t ore Al Fe Mg Ni totalST14d-60 3.64 453ST14d-60bulk 3.85 479acid equivalent (g) 0.19 1.14 3.67 0.16 5.16acid equivalent (%) 3.7 22.1 71.1 3.1 100.0
calc. total soln volumeml
1382.011330.061330.06
calc. total solid massg
4.3
calc. total soln volumeml
1382.01330.11330.1
APPENDIX A - Leach Test Sheets
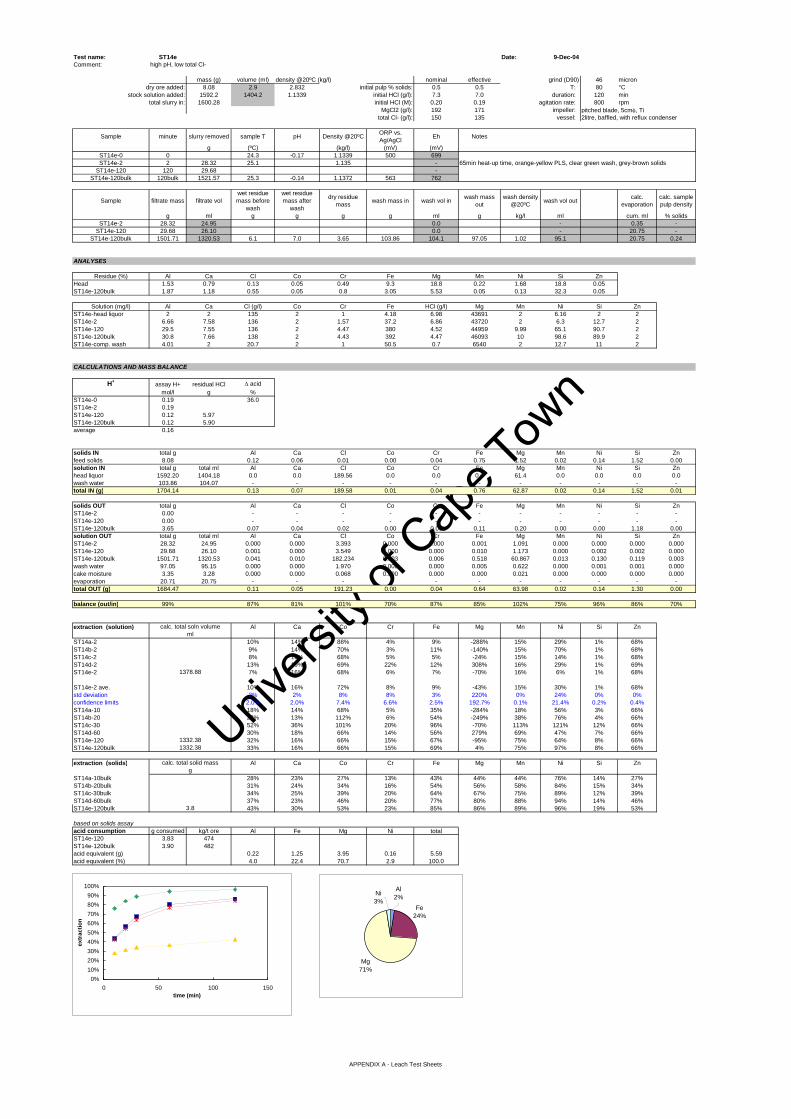
Univers
ity of
Cap
e Tow
n
Test name: ST14e Date: 9-Dec-04Comment: high pH, low total Cl-
mass (g) volume (ml) density @20ºC (kg/l) nominal effective grind (D90) 46 microndry ore added: 8.08 2.9 2.832 initial pulp % solids: 0.5 0.5 T: 80 °C
stock solution added: 1592.2 1404.2 1.1339 initial HCl (g/l): 7.3 7.0 duration: 120 mintotal slurry in: 1600.28 initial HCl (M): 0.20 0.19 agitation rate: 800 rpm
MgCl2 (g/l): 192 171 impeller: pitched blade, 5cmφ, Titotal Cl- (g/l): 150 135 vessel: 2litre, baffled, with reflux condenser
Sample minute slurry removed sample T pH Density @20ºC ORP vs. Ag/AgCl Eh Notes
g (ºC) (kg/l) (mV) (mV)ST14e-0 0 24.3 -0.17 1.1339 500 699ST14e-2 2 28.32 25.1 1.135 - 65min heat-up time, orange-yellow PLS, clear green wash, grey-brown solids
ST14e-120 120 29.68 -ST14e-120bulk 120bulk 1521.57 25.3 -0.14 1.1372 563 762
Sample filtrate mass filtrate volwet residue mass before
wash
wet residue mass after
wash
dry residue mass wash mass in wash vol in wash mass
outwash density
@20ºC wash vol out calc. evaporation
calc. sample pulp density
g ml g g g g ml g kg/l ml cum. ml % solidsST14e-2 28.32 24.95 0.0 - 0.35 -
ST14e-120 29.68 26.10 0.0 - 20.75 -ST14e-120bulk 1501.71 1320.53 6.1 7.0 3.65 103.86 104.1 97.05 1.02 95.1 20.75 0.24
ANALYSES
Residue (%) Al Ca Cl Co Cr Fe Mg Mn Ni Si ZnHead 1.53 0.79 0.13 0.05 0.49 9.3 18.8 0.22 1.68 18.8 0.05ST14e-120bulk 1.87 1.18 0.55 0.05 0.8 3.05 5.53 0.05 0.13 32.3 0.05
Solution (mg/l) Al Ca Cl (g/l) Co Cr Fe HCl (g/l) Mg Mn Ni Si ZnST14e-head liquor 2 2 135 2 1 4.18 6.98 43691 2 6.16 2 2ST14e-2 6.66 7.58 136 2 1.57 37.2 6.86 43720 2 6.3 12.7 2ST14e-120 29.5 7.55 136 2 4.47 380 4.52 44959 9.99 65.1 90.7 2ST14e-120bulk 30.8 7.66 138 2 4.43 392 4.47 46093 10 98.6 89.9 2ST14e-comp. wash 4.01 2 20.7 2 1 50.5 0.7 6540 2 12.7 11 2
CALCULATIONS AND MASS BALANCE
H+ assay H+ residual HCl ∆ acidmol/l g %
ST14e-0 0.19 36.0ST14e-2 0.19ST14e-120 0.12 5.97ST14e-120bulk 0.12 5.90average 0.16
solids IN total g Al Ca Cl Co Cr Fe Mg Mn Ni Si Znfeed solids 8.08 0.12 0.06 0.01 0.00 0.04 0.75 1.52 0.02 0.14 1.52 0.00solution IN total g total ml Al Ca Cl Co Cr Fe Mg Mn Ni Si Znhead liquor 1592.20 1404.18 0.0 0.0 189.56 0.0 0.0 0.0 61.4 0.0 0.0 0.0 0.0wash water 103.86 104.07 - - - - - - - - - - -total IN (g) 1704.14 0.13 0.07 189.58 0.01 0.04 0.76 62.87 0.02 0.14 1.52 0.01
solids OUT total g Al Ca Cl Co Cr Fe Mg Mn Ni Si ZnST14e-2 0.00 - - - - - - - - - - -ST14e-120 0.00 - - - - - - - - - - -ST14e-120bulk 3.65 0.07 0.04 0.02 0.00 0.03 0.11 0.20 0.00 0.00 1.18 0.00solution OUT total g total ml Al Ca Cl Co Cr Fe Mg Mn Ni Si ZnST14e-2 28.32 24.95 0.000 0.000 3.393 0.000 0.000 0.001 1.091 0.000 0.000 0.000 0.000ST14e-120 29.68 26.10 0.001 0.000 3.549 0.000 0.000 0.010 1.173 0.000 0.002 0.002 0.000ST14e-120bulk 1501.71 1320.53 0.041 0.010 182.234 0.003 0.006 0.518 60.867 0.013 0.130 0.119 0.003wash water 97.05 95.15 0.000 0.000 1.970 0.000 0.000 0.005 0.622 0.000 0.001 0.001 0.000cake moisture 3.35 3.28 0.000 0.000 0.068 0.000 0.000 0.000 0.021 0.000 0.000 0.000 0.000evaporation 20.71 20.75 - - - - - - - - - - -total OUT (g) 1684.47 0.11 0.05 191.23 0.00 0.04 0.64 63.98 0.02 0.14 1.30 0.00
balance (out/in) 99% 87% 81% 101% 70% 87% 85% 102% 75% 96% 86% 70%
extraction (solution) Al Ca Co Cr Fe Mg Mn Ni Si Zn
ST14a-2 10% 14% 88% 4% 9% -288% 15% 29% 1% 68%ST14b-2 9% 14% 70% 3% 11% -140% 15% 70% 1% 68%ST14c-2 8% 16% 68% 5% 5% -24% 15% 14% 1% 68%ST14d-2 13% 19% 69% 22% 12% 308% 16% 29% 1% 69%ST14e-2 7% 16% 68% 6% 7% -70% 16% 6% 1% 68%
ST14e-2 ave. 10% 16% 72% 8% 9% -43% 15% 30% 1% 68%std deviation 2% 2% 8% 8% 3% 220% 0% 24% 0% 0%confidence limits 2.0% 2.0% 7.4% 6.6% 2.5% 192.7% 0.1% 21.4% 0.2% 0.4%ST14a-10 18% 14% 68% 5% 35% -284% 18% 56% 3% 66%ST14b-20 23% 13% 112% 6% 54% -249% 38% 76% 4% 66%ST14c-30 52% 36% 101% 20% 96% -70% 113% 121% 12% 66%ST14d-60 30% 18% 66% 14% 56% 279% 69% 47% 7% 66%ST14e-120 32% 16% 66% 15% 67% -95% 75% 64% 8% 66%ST14e-120bulk 33% 16% 66% 15% 69% 4% 75% 97% 8% 66%
extraction (solids) Al Ca Co Cr Fe Mg Mn Ni Si Zn
ST14a-10bulk 28% 23% 27% 13% 43% 44% 44% 76% 14% 27%ST14b-20bulk 31% 24% 34% 16% 54% 56% 58% 84% 15% 34%ST14c-30bulk 34% 25% 39% 20% 64% 67% 75% 89% 12% 39%ST14d-60bulk 37% 23% 46% 20% 77% 80% 88% 94% 14% 46%ST14e-120bulk 43% 30% 53% 23% 85% 86% 89% 96% 19% 53%
based on solids assayacid consumption g consumed kg/t ore Al Fe Mg Ni totalST14e-120 3.83 474ST14e-120bulk 3.90 482acid equivalent (g) 0.22 1.25 3.95 0.16 5.59acid equivalent (%) 4.0 22.4 70.7 2.9 100.0
calc. total soln volume
calc. total solid massg
3.8
ml
1378.88
1332.381332.38
0%10%20%30%40%50%60%70%80%90%
100%
0 50 100 150time (min)
extr
actio
n
Fe24%
Mg71%
Ni3%
Al2%
APPENDIX A - Leach Test Sheets

Univers
ity of
Cap
e Tow
n
Test name: ST15a Date: 20-Dec-04Comment: med pH, med total Cl-
mass (g) volume (ml) density @20ºC (kg/l) nominal effective grind (D90) 46 microndry ore added: 8.31 2.9 2.832 initial pulp % solids: 0.5 0.5 T: 80 °C
stock solution added: 1594 1320.7 1.2069 initial HCl (g/l): 36.5 duration: 10 mintotal slurry in: 1602.31 initial HCl (M): 1.00 0.00 agitation rate: 800 rpm
MgCl2 (g/l): 260 243 impeller: pitched blade, 5cmφ, Titotal Cl- (g/l): 230 230 vessel: 2litre, baffled, with reflux condenser
Sample minute slurry removed sample T pH Density @20ºC ORP vs. Ag/AgCl Eh Notes
g (ºC) (kg/l) (mV) (mV)
ST15a-0 0 24.2 -1.12 1.2069 476 675
ST15a-2 2 26.6 24.4 1.2081 554 753 60min heat-up time, orange PLS, light green wash, grey solids
ST15a-10 10 26.62 -
ST15a-10bulk 10bulk 1531.14 24.2 -1.13 1.2125 519 718
Sample filtrate mass filtrate volwet residue mass before
wash
wet residue mass after
wash
dry residue mass wash mass in wash vol in wash mass
outwash density
@20ºC wash vol out calc. evaporation
calc. sample pulp density
g ml g g g g ml g kg/l ml cum. ml % solids
ST15a-2 26.6 22.02 0.0 - 3.60 -
ST15a-10 26.62 21.95 0.0 - 17.99 -
ST15a-10bulk 1508.2 1243.88 9 12.1 4.55 101.22 101.4 98.12 1.0358 94.7 17.99 0.30
ANALYSES
Residue (%) Al Ca Cl Co Cr Fe Mg Mn Ni Si ZnHead 1.53 0.79 0.13 0.05 0.49 9.3 18.8 0.22 1.68 18.8 0.05ST15a-10bulk 1.59 0.96 1.02 0.05 0.63 2.61 9.67 0.05 0.13 27.6 0.05
Solution (mg/l) Al Ca Cl (g/l) Co Cr Fe HCl (g/l) Mg Mn Ni Si ZnST15a-head liquor 2 2.27 230 2 1 3.94 62066 2 9.61 2 2ST15a-2 18.8 8.65 229 2 2.19 240 33.9 60225 5.62 79.9 23.4 2.52ST15a-10 26.6 9.08 234 2.2 4.72 421 34.2 59514 11.2 102 33.8 2.7ST15a-10bulk 27.8 9.89 237 2.16 4.08 431 33 61205 11.3 99.3 31 2.3ST15a-comp. wash 5.26 2 36.9 2 1 78.4 3.81 9233 2.27 16.6 4.68 2
CALCULATIONS AND MASS BALANCE
H+ assay H+ residual HCl ∆ acidmol/l g %
ST15a-0 0.00ST15a-2 0.93ST15a-10 0.94 42.54ST15a-10bulk 0.91 41.05average 0.69
solids IN total g Al Ca Cl Co Cr Fe Mg Mn Ni Si Znfeed solids 8.31 0.13 0.07 0.01 0.00 0.04 0.77 1.56 0.02 0.14 1.56 0.00solution IN total g total ml Al Ca Cl Co Cr Fe Mg Mn Ni Si Znhead liquor 1594.00 1320.74 0.0 0.0 303.77 0.0 0.0 0.0 82.0 0.0 0.0 0.0 0.0wash water 101.22 101.42 - - - - - - - - - - -total IN (g) 1703.53 0.13 0.07 303.78 0.01 0.04 0.78 83.54 0.02 0.15 1.56 0.01
solids OUT total g Al Ca Cl Co Cr Fe Mg Mn Ni Si ZnST15a-2 0.00 - - - - - - - - - - -ST15a-10 0.00 - - - - - - - - - - -ST15a-10bulk 4.55 0.07 0.04 0.05 0.00 0.03 0.12 0.44 0.00 0.01 1.26 0.00solution OUT total g total ml Al Ca Cl Co Cr Fe Mg Mn Ni Si ZnST15a-2 26.60 22.02 0.000 0.000 5.042 0.000 0.000 0.005 1.326 0.000 0.002 0.001 0.000ST15a-10 26.62 21.95 0.001 0.000 5.137 0.000 0.000 0.009 1.307 0.000 0.002 0.001 0.000ST15a-10bulk 1508.20 1243.88 0.035 0.012 294.799 0.003 0.005 0.536 76.131 0.014 0.124 0.039 0.003wash water 98.12 94.73 0.000 0.000 3.495 0.000 0.000 0.007 0.875 0.000 0.002 0.000 0.000cake moisture 7.55 7.29 0.000 0.000 0.269 0.000 0.000 0.001 0.067 0.000 0.000 0.000 0.000evaporation 17.95 17.99 - - - - - - - - - - -total OUT (g) 1689.59 0.11 0.06 308.79 0.01 0.03 0.68 80.15 0.02 0.14 1.30 0.01
balance (out/in) 99% 84% 82% 102% 77% 82% 87% 96% 81% 89% 83% 80%
extraction (solution) Al Ca Co Cr Fe Mg Mn Ni Si Zn
ST15a-2 19% 17% 62% 7% 40% -254% 40% 74% 2% 79%ST15a-10 26% 17% 67% 15% 69% -452% 77% 92% 3% 82%ST15a-10bulk 28% 19% 65% 13% 70% -316% 78% 90% 3% 70%
extraction (solids) Al Ca Co Cr Fe Mg Mn Ni Si Zn
ST15a-10bulk 41% 31% 43% 26% 84% 71% 87% 96% 17% 43%
extraction (ratio) Al Ca Co Cr Fe Mg Mn Ni Si Zn
ST15a-2 28% 27% 40% 14% 47% 70% 43% 77% 13% 47%ST15a-10 39% 29% 44% 31% 82% 69% 86% 98% 18% 51%ST15a-10bulk 41% 31% 43% 26% 84% 71% 87% 96% 17% 43%
based on solids assayacid consumption g consumed kg/t ore Al Fe Mg Ni totalST15a-10 -42.54 -5119ST15a-10bulk -41.05 -4940acid equivalent (g) 0.22 1.28 3.37 0.17 5.04acid equivalent (%) 4.4 25.5 66.9 3.3 100.0
4.7
calc. total solid massg
1258.8
calc. total soln volumeml
1295.11258.8
1258.8
calc. total soln volumeml
1295.11258.8
APPENDIX A - Leach Test Sheets

Univers
ity of
Cap
e Tow
n
Test name: ST15b Date: 20-Dec-04Comment: med pH, med total Cl-
mass (g) volume (ml) density @20ºC (kg/l) nominal effective grind (D90) 46 microndry ore added: 8.05 2.8 2.832 initial pulp % solids: 0.5 0.5 T: 80 °C
stock solution added: 1592.6 1319.6 1.2069 initial HCl (g/l): 36.5 duration: 20 mintotal slurry in: 1600.65 initial HCl (M): 1.00 0.00 agitation rate: 800 rpm
MgCl2 (g/l): 259.88 243 impeller: pitched blade, 5cmφ, Titotal Cl- (g/l): 230 230 vessel: 2litre, baffled, with reflux condenser
Sample minute slurry removed sample T pH Density @20ºC ORP vs. Ag/AgCl Eh Notes
g (ºC) (kg/l) (mV) (mV)ST15b-0 0 24.2 -1.12 1.2069 476 675ST15b-2 2 29.95 24.4 1.2088 556 755 170min heat-up time, orange PLS, light green wash, grey solids
ST15b-20 20 26.92 -ST15b-20bulk 20bulk 1517.72 24.2 -1.13 1.2122 510 709
Sample filtrate mass filtrate volwet residue mass before
wash
wet residue mass after
wash
dry residue mass wash mass in wash vol in wash mass
outwash density
@20ºC wash vol out calc. evaporation
calc. sample pulp density
g ml g g g g ml g kg/l ml cum. ml % solidsST15b-2 29.95 24.78 0.0 - 2.61 -ST15b-20 26.92 22.21 0.0 - 26.11 -
ST15b-20bulk 1493.87 1232.36 9 7.7 4.15 99.47 99.7 96.76 1.0384 93.2 26.11 0.27
ANALYSES
Residue (%) Al Ca Cl Co Cr Fe Mg Mn Ni Si ZnHead 1.53 0.79 0.13 0.05 0.49 9.3 18.8 0.22 1.68 18.8 0.05ST15b-20bulk 1.56 1.01 1.02 0.05 0.64 1.82 6.34 0.05 0.08 29.3 0.05
Solution (mg/l) Al Ca Cl (g/l) Co Cr Fe HCl (g/l) Mg Mn Ni Si ZnST15b-head liquor 2 2.27 230 2 1 3.94 62066 2 9.61 2 2ST15b-2 17.6 8.07 230 2 2.28 210 34.3 62608 5.15 73.9 22.1 2ST15b-20 29 8.3 232 3.02 4.05 423 32.2 62494 11 93 24.8 2ST15b-20bulk 30.6 8.51 234 2.74 4.45 435 32.8 61977 11.3 95.8 27.4 2ST15b-comp. wash 5.81 2 39.6 2 1 85.8 4.18 10060 2.19 19.5 4.04 2
CALCULATIONS AND MASS BALANCE
H+ assay H+ residual HCl ∆ acidmol/l g %
ST15b-0 0.00ST15b-2 0.94ST15b-20 0.88 39.68ST15b-20bulk 0.90 40.42average 0.68
solids IN total g Al Ca Cl Co Cr Fe Mg Mn Ni Si Znfeed solids 8.05 0.12 0.06 0.01 0.00 0.04 0.75 1.51 0.02 0.13 1.51 0.00solution IN total g total ml Al Ca Cl Co Cr Fe Mg Mn Ni Si Znhead liquor 1592.60 1319.58 0.0 0.0 303.50 0.0 0.0 0.0 81.9 0.0 0.0 0.0 0.0wash water 99.47 99.67 - - - - - - - - - - -total IN (g) 1700.12 0.13 0.07 303.51 0.01 0.04 0.75 83.41 0.02 0.15 1.51 0.01
solids OUT total g Al Ca Cl Co Cr Fe Mg Mn Ni Si ZnST15b-2 0.00 - - - - - - - - - - -ST15b-20 0.00 - - - - - - - - - - -ST15b-20bulk 4.15 0.06 0.04 0.04 0.00 0.03 0.08 0.26 0.00 0.00 1.22 0.00solution OUT total g total ml Al Ca Cl Co Cr Fe Mg Mn Ni Si ZnST15b-2 29.95 24.78 0.000 0.000 5.699 0.000 0.000 0.005 1.551 0.000 0.002 0.001 0.000ST15b-20 26.92 22.21 0.001 0.000 5.152 0.000 0.000 0.009 1.388 0.000 0.002 0.001 0.000ST15b-20bulk 1493.87 1232.36 0.038 0.010 288.373 0.003 0.005 0.536 76.378 0.014 0.118 0.034 0.002wash water 96.76 93.18 0.001 0.000 3.690 0.000 0.000 0.008 0.937 0.000 0.002 0.000 0.000cake moisture 3.55 3.42 0.000 0.000 0.135 0.000 0.000 0.000 0.034 0.000 0.000 0.000 0.000evaporation 26.06 26.11 - - - - - - - - - - -total OUT (g) 1681.26 0.10 0.05 303.09 0.01 0.03 0.63 80.55 0.02 0.13 1.25 0.00
balance (out/in) 99% 83% 80% 100% 86% 80% 84% 97% 81% 86% 83% 72%
extraction (solution) Al Ca Co Cr Fe Mg Mn Ni Si Zn
ST15b-2 18% 16% 64% 8% 36% -66% 38% 71% 2% 64%ST15b-20 29% 16% 94% 13% 70% -265% 77% 86% 2% 62%ST15b-20bulk 31% 17% 85% 14% 72% -307% 80% 89% 2% 62%
extraction (solids) Al Ca Co Cr Fe Mg Mn Ni Si Zn
ST15b-20bulk 45% 32% 47% 29% 90% 82% 88% 97% 16% 47%
extraction (ratio) Al Ca Co Cr Fe Mg Mn Ni Si Zn
ST15b-2 26% 30% 34% 15% 43% 83% 40% 75% 13% 47%ST15b-20 43% 31% 51% 27% 87% 83% 86% 95% 15% 47%ST15b-20bulk 45% 32% 47% 29% 90% 82% 88% 97% 16% 47%
based on solids assayacid consumption g consumed kg/t ore Al Fe Mg Ni totalST15b-20 -39.68 -4929ST15b-20bulk -40.42 -5021acid equivalent (g) 0.24 1.32 3.75 0.16 5.47acid equivalent (%) 4.3 24.1 68.6 3.0 100.0
1246.5
calc. total soln volumeml
1292.21246.5
1246.48
calc. total solid massg
4.3
calc. total soln volumeml
1292.191246.48
APPENDIX A - Leach Test Sheets
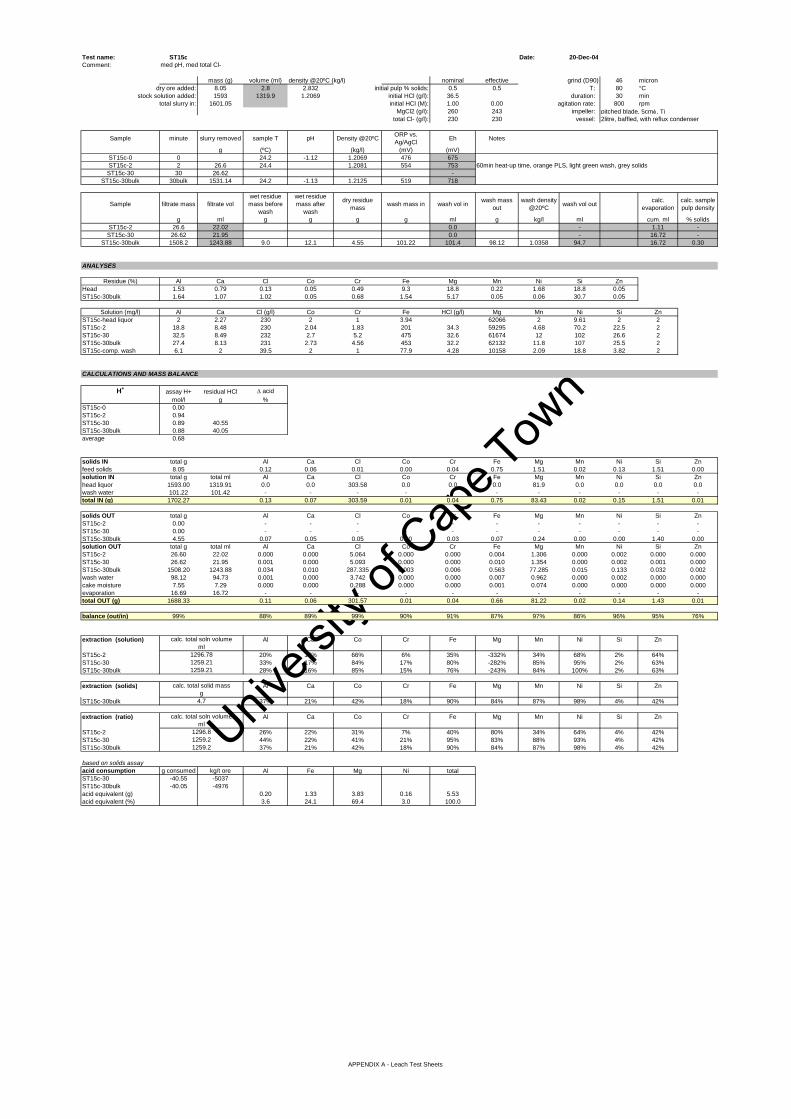
Univers
ity of
Cap
e Tow
n
Test name: ST15c Date: 20-Dec-04Comment: med pH, med total Cl-
mass (g) volume (ml) density @20ºC (kg/l) nominal effective grind (D90) 46 microndry ore added: 8.05 2.8 2.832 initial pulp % solids: 0.5 0.5 T: 80 °C
stock solution added: 1593 1319.9 1.2069 initial HCl (g/l): 36.5 duration: 30 mintotal slurry in: 1601.05 initial HCl (M): 1.00 0.00 agitation rate: 800 rpm
MgCl2 (g/l): 260 243 impeller: pitched blade, 5cmφ, Titotal Cl- (g/l): 230 230 vessel: 2litre, baffled, with reflux condenser
Sample minute slurry removed sample T pH Density @20ºC ORP vs. Ag/AgCl Eh Notes
g (ºC) (kg/l) (mV) (mV)ST15c-0 0 24.2 -1.12 1.2069 476 675ST15c-2 2 26.6 24.4 1.2081 554 753 60min heat-up time, orange PLS, light green wash, grey solids
ST15c-30 30 26.62 -ST15c-30bulk 30bulk 1531.14 24.2 -1.13 1.2125 519 718
Sample filtrate mass filtrate volwet residue mass before
wash
wet residue mass after
wash
dry residue mass wash mass in wash vol in wash mass
outwash density
@20ºC wash vol out calc. evaporation
calc. sample pulp density
g ml g g g g ml g kg/l ml cum. ml % solidsST15c-2 26.6 22.02 0.0 - 1.11 -ST15c-30 26.62 21.95 0.0 - 16.72 -
ST15c-30bulk 1508.2 1243.88 9.0 12.1 4.55 101.22 101.4 98.12 1.0358 94.7 16.72 0.30
ANALYSES
Residue (%) Al Ca Cl Co Cr Fe Mg Mn Ni Si ZnHead 1.53 0.79 0.13 0.05 0.49 9.3 18.8 0.22 1.68 18.8 0.05ST15c-30bulk 1.64 1.07 1.02 0.05 0.68 1.54 5.17 0.05 0.06 30.7 0.05
Solution (mg/l) Al Ca Cl (g/l) Co Cr Fe HCl (g/l) Mg Mn Ni Si ZnST15c-head liquor 2 2.27 230 2 1 3.94 62066 2 9.61 2 2ST15c-2 18.8 8.48 230 2.04 1.83 201 34.3 59295 4.68 70.2 22.5 2ST15c-30 32.5 8.49 232 2.7 5.2 475 32.6 61674 12 102 26.6 2ST15c-30bulk 27.4 8.13 231 2.73 4.56 453 32.2 62132 11.8 107 25.5 2ST15c-comp. wash 6.1 2 39.5 2 1 77.9 4.28 10158 2.09 18.8 3.82 2
CALCULATIONS AND MASS BALANCE
H+ assay H+ residual HCl ∆ acidmol/l g %
ST15c-0 0.00ST15c-2 0.94ST15c-30 0.89 40.55ST15c-30bulk 0.88 40.05average 0.68
solids IN total g Al Ca Cl Co Cr Fe Mg Mn Ni Si Znfeed solids 8.05 0.12 0.06 0.01 0.00 0.04 0.75 1.51 0.02 0.13 1.51 0.00solution IN total g total ml Al Ca Cl Co Cr Fe Mg Mn Ni Si Znhead liquor 1593.00 1319.91 0.0 0.0 303.58 0.0 0.0 0.0 81.9 0.0 0.0 0.0 0.0wash water 101.22 101.42 - - - - - - - - - - -total IN (g) 1702.27 0.13 0.07 303.59 0.01 0.04 0.75 83.43 0.02 0.15 1.51 0.01
solids OUT total g Al Ca Cl Co Cr Fe Mg Mn Ni Si ZnST15c-2 0.00 - - - - - - - - - - -ST15c-30 0.00 - - - - - - - - - - -ST15c-30bulk 4.55 0.07 0.05 0.05 0.00 0.03 0.07 0.24 0.00 0.00 1.40 0.00solution OUT total g total ml Al Ca Cl Co Cr Fe Mg Mn Ni Si ZnST15c-2 26.60 22.02 0.000 0.000 5.064 0.000 0.000 0.004 1.306 0.000 0.002 0.000 0.000ST15c-30 26.62 21.95 0.001 0.000 5.093 0.000 0.000 0.010 1.354 0.000 0.002 0.001 0.000ST15c-30bulk 1508.20 1243.88 0.034 0.010 287.335 0.003 0.006 0.563 77.285 0.015 0.133 0.032 0.002wash water 98.12 94.73 0.001 0.000 3.742 0.000 0.000 0.007 0.962 0.000 0.002 0.000 0.000cake moisture 7.55 7.29 0.000 0.000 0.288 0.000 0.000 0.001 0.074 0.000 0.000 0.000 0.000evaporation 16.69 16.72 - - - - - - - - - - -total OUT (g) 1688.33 0.11 0.06 301.57 0.01 0.04 0.66 81.22 0.02 0.14 1.43 0.01
balance (out/in) 99% 88% 89% 99% 90% 91% 87% 97% 86% 96% 95% 76%
extraction (solution) Al Ca Co Cr Fe Mg Mn Ni Si Zn
ST15c-2 20% 17% 66% 6% 35% -332% 34% 68% 2% 64%ST15c-30 33% 17% 84% 17% 80% -282% 85% 95% 2% 63%ST15c-30bulk 28% 16% 85% 15% 76% -243% 84% 100% 2% 63%
extraction (solids) Al Ca Co Cr Fe Mg Mn Ni Si Zn
ST15c-30bulk 37% 21% 42% 18% 90% 84% 87% 98% 4% 42%
extraction (ratio) Al Ca Co Cr Fe Mg Mn Ni Si Zn
ST15c-2 26% 22% 31% 7% 40% 80% 34% 64% 4% 42%ST15c-30 44% 22% 41% 21% 95% 83% 88% 93% 4% 42%ST15c-30bulk 37% 21% 42% 18% 90% 84% 87% 98% 4% 42%
based on solids assayacid consumption g consumed kg/t ore Al Fe Mg Ni totalST15c-30 -40.55 -5037ST15c-30bulk -40.05 -4976acid equivalent (g) 0.20 1.33 3.83 0.16 5.53acid equivalent (%) 3.6 24.1 69.4 3.0 100.0
1259.21259.2
4.7
calc. total soln volumeml
1296.8
1259.211259.21
calc. total solid massg
calc. total soln volumeml
1296.78
APPENDIX A - Leach Test Sheets

Univers
ity of
Cap
e Tow
n
Test name: ST15d Date: 9-Dec-04Comment: med pH, med total Cl-
mass (g) volume (ml) density @20ºC (kg/l) nominal effective grind (D90) 46 microndry ore added: 8.05 2.8 2.832 initial pulp % solids: 0.5 0.5 T: 80 °C
stock solution added: 1592.7 1320.6 1.206 initial HCl (g/l): 36.5 34.1 duration: 60 mintotal slurry in: 1600.75 initial HCl (M): 1.00 0.94 agitation rate: 800 rpm
MgCl2 (g/l): 260 269 impeller: pitched blade, 5cmφ, Titotal Cl- (g/l): 230 226 vessel: 2litre, baffled, with reflux condenser
Sample minute slurry removed sample T pH Density @20ºC ORP vs. Ag/AgCl Eh Notes
g (ºC) (kg/l) (mV) (mV)ST15d-0 0 25.3 -1.4 1.206 490 689ST15d-2 2 15.23 25.2 1.2054 - 60min heat-up time, orange PLS, light green wash, grey solids
ST15d-60 60 32.09 -ST15d-60bulk 60bulk 1528.9 25.2 -1.37 1.2110 502 701
Sample filtrate mass filtrate volwet residue mass before
wash
wet residue mass after
wash
dry residue mass wash mass in wash vol in wash mass
outwash density
@20ºC wash vol out calc. evaporation
calc. sample pulp density
g ml g g g g ml g kg/l ml cum. ml % solidsST15d-2 15.23 12.63 0.0 - 0.82 -ST15d-60 32.09 26.50 0.0 - 24.58 -
ST15d-60bulk 1509.52 1246.51 6.8 6.4 3.9 101.74 101.9 95.36 1.0344 92.2 24.58 0.26
ANALYSES
Residue (%) Al Ca Cl Co Cr Fe Mg Mn Ni Si ZnHead 1.53 0.79 0.13 0.05 0.49 9.3 18.8 0.22 1.68 18.8 0.05ST15d-60bulk 1.79 1.14 0.73 0.05 0.76 1.23 4.39 0.05 0.05 33.5 0.05
Solution (mg/l) Al Ca Cl (g/l) Co Cr Fe HCl (g/l) Mg Mn Ni Si ZnST15d-head liquor 2 2.46 226 2 1 6.57 34.1 68689 2 11 2 2ST15d-2 18.5 10 228 2 3.09 174 33.5 70946 4.22 75 20.6 2ST15d-60 31.9 10.2 235 3.31 6.31 563 32.4 72054 10.9 128 18.2 2ST15d-60bulk 36.8 9.36 231 2.69 6.3 545 31.3 72924 10.9 114 17.2 2ST15d-comp. wash 5.52 3.56 35 2 1.37 81.9 3.48 10197 2 20.1 2.37 2
CALCULATIONS AND MASS BALANCE
H+ assay H+ residual HCl ∆ acidmol/l g %
ST15d-0 0.94 8.2ST15d-2 0.92ST15d-60 0.89 40.39ST15d-60bulk 0.86 39.02average 0.90
solids IN total g Al Ca Cl Co Cr Fe Mg Mn Ni Si Znfeed solids 8.05 0.12 0.06 0.01 0.00 0.04 0.75 1.51 0.02 0.13 1.51 0.00solution IN total g total ml Al Ca Cl Co Cr Fe Mg Mn Ni Si Znhead liquor 1592.70 1320.65 0.0 0.0 298.47 0.0 0.0 0.0 90.7 0.0 0.0 0.0 0.0wash water 101.74 101.94 - - - - - - - - - - -total IN (g) 1702.49 0.13 0.07 298.48 0.01 0.04 0.76 92.23 0.02 0.15 1.51 0.01
solids OUT total g Al Ca Cl Co Cr Fe Mg Mn Ni Si ZnST15d-2 0.00 - - - - - - - - - - -ST15d-60 0.00 - - - - - - - - - - -ST15d-60bulk 3.90 0.07 0.04 0.03 0.00 0.03 0.05 0.17 0.00 0.00 1.31 0.00solution OUT total g total ml Al Ca Cl Co Cr Fe Mg Mn Ni Si ZnST15d-2 15.23 12.63 0.000 0.000 2.881 0.000 0.000 0.002 0.896 0.000 0.001 0.000 0.000ST15d-60 32.09 26.50 0.001 0.000 6.227 0.000 0.000 0.015 1.909 0.000 0.003 0.000 0.000ST15d-60bulk 1509.52 1246.51 0.046 0.012 287.943 0.003 0.008 0.679 90.900 0.014 0.142 0.021 0.002wash water 95.36 92.19 0.001 0.000 3.227 0.000 0.000 0.008 0.940 0.000 0.002 0.000 0.000cake moisture 2.50 2.42 0.000 0.000 0.085 0.000 0.000 0.000 0.025 0.000 0.000 0.000 0.000evaporation 24.53 24.58 - - - - - - - - - - -total OUT (g) 1683.13 0.12 0.06 300.39 0.01 0.04 0.75 94.84 0.02 0.15 1.33 0.00
balance (out/in) 99% 93% 85% 101% 84% 94% 99% 103% 79% 101% 88% 71%
extraction (solution) Al Ca Co Cr Fe Mg Mn Ni Si Zn
ST15d-2 20% 21% 65% 10% 30% 134% 31% 73% 2% 65%ST15d-60 33% 20% 103% 20% 94% -10% 77% 119% 2% 62%ST15d-60bulk 38% 18% 84% 20% 91% 63% 77% 106% 1% 62%
extraction (solids) Al Ca Co Cr Fe Mg Mn Ni Si Zn
ST15d-60bulk 42% 28% 50% 22% 93% 88% 89% 99% 11% 50%
extraction (ratio) Al Ca Co Cr Fe Mg Mn Ni Si Zn
ST15d-2 21% 30% 37% 11% 30% 86% 34% 65% 13% 50%ST15d-60 36% 30% 62% 22% 96% 87% 89% 111% 11% 50%ST15d-60bulk 42% 28% 50% 22% 93% 88% 89% 99% 11% 50%
based on solids assayacid consumption g consumed kg/t ore Al Fe Mg Ni totalST15d-60 4.65 577ST15d-60bulk 6.02 748acid equivalent (g) 0.22 1.37 4.03 0.17 5.78acid equivalent (%) 3.7 23.8 69.7 2.9 100.0
1307.21256.91256.9
g4.0
calc. total soln volumeml
1307.191256.931256.93
calc. total solid mass
calc. total soln volumeml
APPENDIX A - Leach Test Sheets
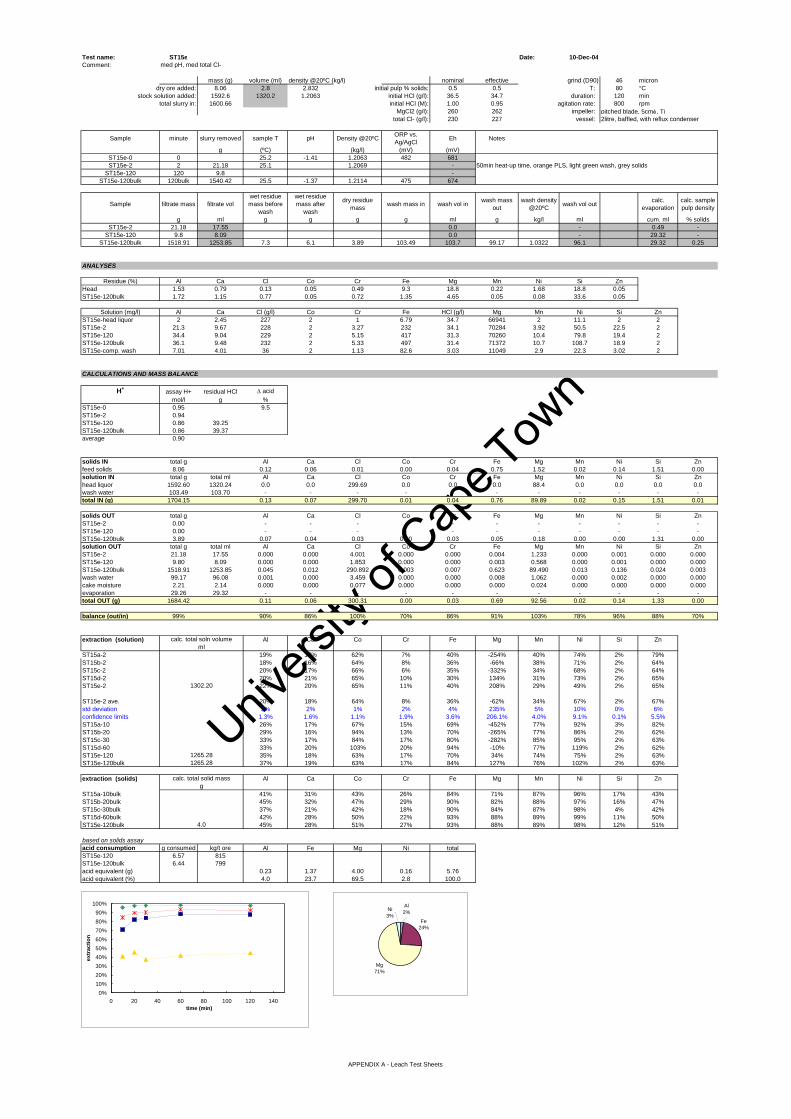
Univers
ity of
Cap
e Tow
n
Test name: ST15e Date: 10-Dec-04Comment: med pH, med total Cl-
mass (g) volume (ml) density @20ºC (kg/l) nominal effective grind (D90) 46 microndry ore added: 8.06 2.8 2.832 initial pulp % solids: 0.5 0.5 T: 80 °C
stock solution added: 1592.6 1320.2 1.2063 initial HCl (g/l): 36.5 34.7 duration: 120 mintotal slurry in: 1600.66 initial HCl (M): 1.00 0.95 agitation rate: 800 rpm
MgCl2 (g/l): 260 262 impeller: pitched blade, 5cmφ, Titotal Cl- (g/l): 230 227 vessel: 2litre, baffled, with reflux condenser
Sample minute slurry removed sample T pH Density @20ºC ORP vs. Ag/AgCl Eh Notes
g (ºC) (kg/l) (mV) (mV)ST15e-0 0 25.2 -1.41 1.2063 482 681ST15e-2 2 21.18 25.1 1.2069 - 50min heat-up time, orange PLS, light green wash, grey solids
ST15e-120 120 9.8 -ST15e-120bulk 120bulk 1540.42 25.5 -1.37 1.2114 475 674
Sample filtrate mass filtrate volwet residue mass before
wash
wet residue mass after
wash
dry residue mass wash mass in wash vol in wash mass
outwash density
@20ºC wash vol out calc. evaporation
calc. sample pulp density
g ml g g g g ml g kg/l ml cum. ml % solidsST15e-2 21.18 17.55 0.0 - 0.49 -
ST15e-120 9.8 8.09 0.0 - 29.32 -ST15e-120bulk 1518.91 1253.85 7.3 6.1 3.89 103.49 103.7 99.17 1.0322 96.1 29.32 0.25
ANALYSES
Residue (%) Al Ca Cl Co Cr Fe Mg Mn Ni Si ZnHead 1.53 0.79 0.13 0.05 0.49 9.3 18.8 0.22 1.68 18.8 0.05ST15e-120bulk 1.72 1.15 0.77 0.05 0.72 1.35 4.65 0.05 0.08 33.6 0.05
Solution (mg/l) Al Ca Cl (g/l) Co Cr Fe HCl (g/l) Mg Mn Ni Si ZnST15e-head liquor 2 2.45 227 2 1 6.79 34.7 66941 2 11.1 2 2ST15e-2 21.3 9.67 228 2 3.27 232 34.1 70284 3.92 50.5 22.5 2ST15e-120 34.4 9.04 229 2 5.15 417 31.3 70260 10.4 79.8 19.4 2ST15e-120bulk 36.1 9.48 232 2 5.33 497 31.4 71372 10.7 108.7 18.9 2ST15e-comp. wash 7.01 4.01 36 2 1.13 82.6 3.03 11049 2.9 22.3 3.02 2
CALCULATIONS AND MASS BALANCE
H+ assay H+ residual HCl ∆ acidmol/l g %
ST15e-0 0.95 9.5ST15e-2 0.94ST15e-120 0.86 39.25ST15e-120bulk 0.86 39.37average 0.90
solids IN total g Al Ca Cl Co Cr Fe Mg Mn Ni Si Znfeed solids 8.06 0.12 0.06 0.01 0.00 0.04 0.75 1.52 0.02 0.14 1.51 0.00solution IN total g total ml Al Ca Cl Co Cr Fe Mg Mn Ni Si Znhead liquor 1592.60 1320.24 0.0 0.0 299.69 0.0 0.0 0.0 88.4 0.0 0.0 0.0 0.0wash water 103.49 103.70 - - - - - - - - - - -total IN (g) 1704.15 0.13 0.07 299.70 0.01 0.04 0.76 89.89 0.02 0.15 1.51 0.01
solids OUT total g Al Ca Cl Co Cr Fe Mg Mn Ni Si ZnST15e-2 0.00 - - - - - - - - - - -ST15e-120 0.00 - - - - - - - - - - -ST15e-120bulk 3.89 0.07 0.04 0.03 0.00 0.03 0.05 0.18 0.00 0.00 1.31 0.00solution OUT total g total ml Al Ca Cl Co Cr Fe Mg Mn Ni Si ZnST15e-2 21.18 17.55 0.000 0.000 4.001 0.000 0.000 0.004 1.233 0.000 0.001 0.000 0.000ST15e-120 9.80 8.09 0.000 0.000 1.853 0.000 0.000 0.003 0.568 0.000 0.001 0.000 0.000ST15e-120bulk 1518.91 1253.85 0.045 0.012 290.892 0.003 0.007 0.623 89.490 0.013 0.136 0.024 0.003wash water 99.17 96.08 0.001 0.000 3.459 0.000 0.000 0.008 1.062 0.000 0.002 0.000 0.000cake moisture 2.21 2.14 0.000 0.000 0.077 0.000 0.000 0.000 0.024 0.000 0.000 0.000 0.000evaporation 29.26 29.32 - - - - - - - - - - -total OUT (g) 1684.42 0.11 0.06 300.31 0.00 0.03 0.69 92.56 0.02 0.14 1.33 0.00
balance (out/in) 99% 90% 86% 100% 70% 86% 91% 103% 78% 96% 88% 70%
extraction (solution) Al Ca Co Cr Fe Mg Mn Ni Si Zn
ST15a-2 19% 17% 62% 7% 40% -254% 40% 74% 2% 79%ST15b-2 18% 16% 64% 8% 36% -66% 38% 71% 2% 64%ST15c-2 20% 17% 66% 6% 35% -332% 34% 68% 2% 64%ST15d-2 20% 21% 65% 10% 30% 134% 31% 73% 2% 65%ST15e-2 22% 20% 65% 11% 40% 208% 29% 49% 2% 65%
ST15e-2 ave. 20% 18% 64% 8% 36% -62% 34% 67% 2% 67%std deviation 2% 2% 1% 2% 4% 235% 5% 10% 0% 6%confidence limits 1.3% 1.6% 1.1% 1.9% 3.6% 206.1% 4.0% 9.1% 0.1% 5.5%ST15a-10 26% 17% 67% 15% 69% -452% 77% 92% 3% 82%ST15b-20 29% 16% 94% 13% 70% -265% 77% 86% 2% 62%ST15c-30 33% 17% 84% 17% 80% -282% 85% 95% 2% 63%ST15d-60 33% 20% 103% 20% 94% -10% 77% 119% 2% 62%ST15e-120 35% 18% 63% 17% 70% 34% 74% 75% 2% 63%ST15e-120bulk 37% 19% 63% 17% 84% 127% 76% 102% 2% 63%
extraction (solids) Al Ca Co Cr Fe Mg Mn Ni Si Zn
ST15a-10bulk 41% 31% 43% 26% 84% 71% 87% 96% 17% 43%ST15b-20bulk 45% 32% 47% 29% 90% 82% 88% 97% 16% 47%ST15c-30bulk 37% 21% 42% 18% 90% 84% 87% 98% 4% 42%ST15d-60bulk 42% 28% 50% 22% 93% 88% 89% 99% 11% 50%ST15e-120bulk 45% 28% 51% 27% 93% 88% 89% 98% 12% 51%
based on solids assayacid consumption g consumed kg/t ore Al Fe Mg Ni totalST15e-120 6.57 815ST15e-120bulk 6.44 799acid equivalent (g) 0.23 1.37 4.00 0.16 5.76acid equivalent (%) 4.0 23.7 69.5 2.8 100.0
calc. total solid massg
4.0
ml
1302.20
1265.281265.28
calc. total soln volume
0%10%20%30%40%50%60%70%80%90%
100%
0 20 40 60 80 100 120 140time (min)
extr
actio
n
Fe24%
Mg71%
Ni3%
Al2%
APPENDIX A - Leach Test Sheets
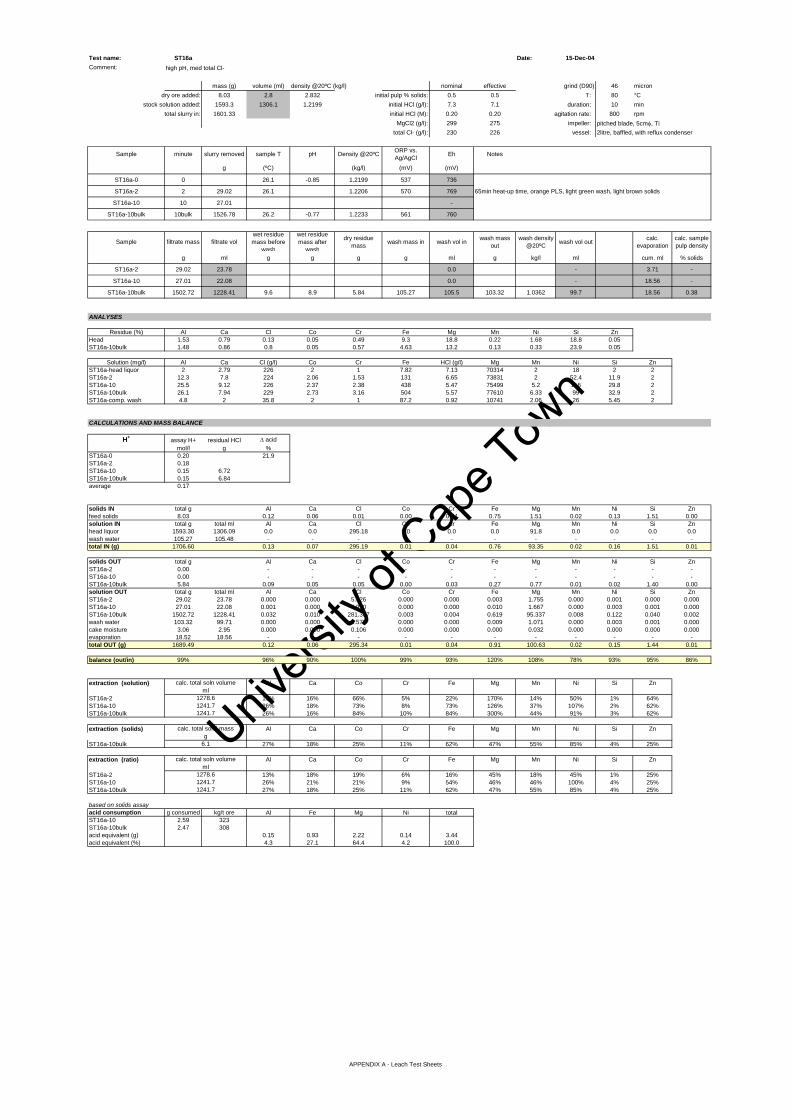
Univers
ity of
Cap
e Tow
n
Test name: ST16a Date: 15-Dec-04Comment: high pH, med total Cl-
mass (g) volume (ml) density @20ºC (kg/l) nominal effective grind (D90) 46 microndry ore added: 8.03 2.8 2.832 initial pulp % solids: 0.5 0.5 T: 80 °C
stock solution added: 1593.3 1306.1 1.2199 initial HCl (g/l): 7.3 7.1 duration: 10 mintotal slurry in: 1601.33 initial HCl (M): 0.20 0.20 agitation rate: 800 rpm
MgCl2 (g/l): 299 275 impeller: pitched blade, 5cmφ, Titotal Cl- (g/l): 230 226 vessel: 2litre, baffled, with reflux condenser
Sample minute slurry removed sample T pH Density @20ºC ORP vs. Ag/AgCl Eh Notes
g (ºC) (kg/l) (mV) (mV)
ST16a-0 0 26.1 -0.85 1.2199 537 736
ST16a-2 2 29.02 26.1 1.2206 570 769 65min heat-up time, orange PLS, light green wash, light brown solids
ST16a-10 10 27.01 -
ST16a-10bulk 10bulk 1526.78 26.2 -0.77 1.2233 561 760
Sample filtrate mass filtrate volwet residue mass before
wash
wet residue mass after
wash
dry residue mass wash mass in wash vol in wash mass
outwash density
@20ºC wash vol out calc. evaporation
calc. sample pulp density
g ml g g g g ml g kg/l ml cum. ml % solids
ST16a-2 29.02 23.78 0.0 - 3.71 -
ST16a-10 27.01 22.08 0.0 - 18.56 -
ST16a-10bulk 1502.72 1228.41 9.6 8.9 5.84 105.27 105.5 103.32 1.0362 99.7 18.56 0.38
ANALYSES
Residue (%) Al Ca Cl Co Cr Fe Mg Mn Ni Si ZnHead 1.53 0.79 0.13 0.05 0.49 9.3 18.8 0.22 1.68 18.8 0.05ST16a-10bulk 1.48 0.86 0.8 0.05 0.57 4.63 13.2 0.13 0.33 23.9 0.05
Solution (mg/l) Al Ca Cl (g/l) Co Cr Fe HCl (g/l) Mg Mn Ni Si ZnST16a-head liquor 2 2.79 226 2 1 7.82 7.13 70314 2 18 2 2ST16a-2 12.3 7.8 224 2.06 1.53 131 6.65 73831 2 52.4 11.9 2ST16a-10 25.5 9.12 226 2.37 2.38 438 5.47 75499 5.2 116 29.8 2ST16a-10bulk 26.1 7.94 229 2.73 3.16 504 5.57 77610 6.33 99 32.9 2ST16a-comp. wash 4.8 2 35.8 2 1 87.2 0.92 10741 2.06 26 5.45 2
CALCULATIONS AND MASS BALANCE
H+ assay H+ residual HCl ∆ acidmol/l g %
ST16a-0 0.20 21.9ST16a-2 0.18ST16a-10 0.15 6.72ST16a-10bulk 0.15 6.84average 0.17
solids IN total g Al Ca Cl Co Cr Fe Mg Mn Ni Si Znfeed solids 8.03 0.12 0.06 0.01 0.00 0.04 0.75 1.51 0.02 0.13 1.51 0.00solution IN total g total ml Al Ca Cl Co Cr Fe Mg Mn Ni Si Znhead liquor 1593.30 1306.09 0.0 0.0 295.18 0.0 0.0 0.0 91.8 0.0 0.0 0.0 0.0wash water 105.27 105.48 - - - - - - - - - - -total IN (g) 1706.60 0.13 0.07 295.19 0.01 0.04 0.76 93.35 0.02 0.16 1.51 0.01
solids OUT total g Al Ca Cl Co Cr Fe Mg Mn Ni Si ZnST16a-2 0.00 - - - - - - - - - - -ST16a-10 0.00 - - - - - - - - - - -ST16a-10bulk 5.84 0.09 0.05 0.05 0.00 0.03 0.27 0.77 0.01 0.02 1.40 0.00solution OUT total g total ml Al Ca Cl Co Cr Fe Mg Mn Ni Si ZnST16a-2 29.02 23.78 0.000 0.000 5.326 0.000 0.000 0.003 1.755 0.000 0.001 0.000 0.000ST16a-10 27.01 22.08 0.001 0.000 4.990 0.000 0.000 0.010 1.667 0.000 0.003 0.001 0.000ST16a-10bulk 1502.72 1228.41 0.032 0.010 281.307 0.003 0.004 0.619 95.337 0.008 0.122 0.040 0.002wash water 103.32 99.71 0.000 0.000 3.570 0.000 0.000 0.009 1.071 0.000 0.003 0.001 0.000cake moisture 3.06 2.95 0.000 0.000 0.106 0.000 0.000 0.000 0.032 0.000 0.000 0.000 0.000evaporation 18.52 18.56 - - - - - - - - - - -total OUT (g) 1689.49 0.12 0.06 295.34 0.01 0.04 0.91 100.63 0.02 0.15 1.44 0.01
balance (out/in) 99% 96% 90% 100% 99% 93% 120% 108% 78% 93% 95% 86%
extraction (solution) Al Ca Co Cr Fe Mg Mn Ni Si Zn
ST16a-2 13% 16% 66% 5% 22% 170% 14% 50% 1% 64%ST16a-10 26% 18% 73% 8% 73% 126% 37% 107% 2% 62%ST16a-10bulk 26% 16% 84% 10% 84% 300% 44% 91% 3% 62%
extraction (solids) Al Ca Co Cr Fe Mg Mn Ni Si Zn
ST16a-10bulk 27% 18% 25% 11% 62% 47% 55% 85% 4% 25%
extraction (ratio) Al Ca Co Cr Fe Mg Mn Ni Si Zn
ST16a-2 13% 18% 19% 6% 16% 45% 18% 45% 1% 25%ST16a-10 26% 21% 21% 9% 54% 46% 46% 100% 4% 25%ST16a-10bulk 27% 18% 25% 11% 62% 47% 55% 85% 4% 25%
based on solids assayacid consumption g consumed kg/t ore Al Fe Mg Ni totalST16a-10 2.59 323ST16a-10bulk 2.47 308acid equivalent (g) 0.15 0.93 2.22 0.14 3.44acid equivalent (%) 4.3 27.1 64.4 4.2 100.0
1241.7
calc. total soln volumeml
1278.61241.7
calc. total soln volumeml
1278.61241.7
6.1
calc. total solid massg
1241.7
APPENDIX A - Leach Test Sheets

Univers
ity of
Cap
e Tow
n
Test name: ST16b Date: 20-Dec-04Comment: high pH, med total Cl-
mass (g) volume (ml) density @20ºC (kg/l) nominal effective grind (D90) 46 microndry ore added: 8.05 2.8 2.832 initial pulp % solids: 0.5 0.5 T: 80 °C
stock solution added: 1592.4 1305.4 1.2199 initial HCl (g/l): 7.3 7.1 duration: 20 mintotal slurry in: 1600.45 initial HCl (M): 0.20 0.20 agitation rate: 800 rpm
MgCl2 (g/l): 299.05 275 impeller: pitched blade, 5cmφ, Titotal Cl- (g/l): 230 226 vessel: 2litre, baffled, with reflux condenser
Sample minute slurry removed sample T pH Density @20ºC ORP vs. Ag/AgCl Eh Notes
g (ºC) (kg/l) (mV) (mV)ST16b-0 0 26.1 -0.85 1.2199 537 736ST16b-2 2 31.13 24.5 1.2214 556 755 55min heat-up time, orange PLS, light green wash, light brown solids
ST16b-20 20 25.67 -ST16b-20bulk 20bulk 1523.99 24.2 -0.68 1.2246 543 742
Sample filtrate mass filtrate volwet residue mass before
wash
wet residue mass after
wash
dry residue mass wash mass in wash vol in wash mass
outwash density
@20ºC wash vol out calc. evaporation
calc. sample pulp density
g ml g g g g ml g kg/l ml cum. ml % solidsST16b-2 31.13 25.49 0.0 - 1.97 -
ST16b-20 25.67 20.96 0.0 - 19.70 -ST16b-20bulk 1500.42 1225.23 9.3 7.4 4.5 100.76 101.0 97.64 1.04 93.9 19.70 0.30
ANALYSES
Residue (%) Al Ca Cl Co Cr Fe Mg Mn Ni Si ZnHead 1.53 0.79 0.13 0.05 0.49 9.3 18.8 0.22 1.68 18.8 0.05ST16b-20bulk 1.57 0.94 1.06 0.05 0.61 3.4 9.83 0.07 0.2 26.2 0.05
Solution (mg/l) Al Ca Cl (g/l) Co Cr Fe HCl (g/l) Mg Mn Ni Si ZnST16b-head liquor 2 2.79 226 2 1 7.82 7.13 70314 2 18 2 2ST16b-2 12.8 9.36 227 2 1.79 88.2 6.72 71426 2 56.4 13.2 2ST16b-20 28.1 9.04 228 2 3.24 334 4.96 72297 9.08 94.8 39.9 2ST16b-20bulk 28.3 9.32 230 2.75 3.44 357 4.87 71476 9.7 103 41.1 2ST16b-comp. wash 5.05 2 39.3 2 1 59.3 0.7 11097 2.26 16.5 6.11 2
CALCULATIONS AND MASS BALANCE
H+ assay H+ residual HCl ∆ acidmol/l g %
ST16b-0 0.20 31.7ST16b-2 0.18ST16b-20 0.14 6.08ST16b-20bulk 0.13 5.97average 0.16
solids IN total g Al Ca Cl Co Cr Fe Mg Mn Ni Si Znfeed solids 8.05 0.12 0.06 0.01 0.00 0.04 0.75 1.51 0.02 0.13 1.51 0.00solution IN total g total ml Al Ca Cl Co Cr Fe Mg Mn Ni Si Znhead liquor 1592.40 1305.35 0.0 0.0 295.01 0.0 0.0 0.0 91.8 0.0 0.0 0.0 0.0wash water 100.76 100.96 - - - - - - - - - - -total IN (g) 1701.21 0.13 0.07 295.02 0.01 0.04 0.76 93.30 0.02 0.16 1.51 0.01
solids OUT total g Al Ca Cl Co Cr Fe Mg Mn Ni Si ZnST16b-2 0.00 - - - - - - - - - - -ST16b-20 0.00 - - - - - - - - - - -ST16b-20bulk 4.50 0.07 0.04 0.05 0.00 0.03 0.15 0.44 0.00 0.01 1.18 0.00solution OUT total g total ml Al Ca Cl Co Cr Fe Mg Mn Ni Si ZnST16b-2 31.13 25.49 0.000 0.000 5.786 0.000 0.000 0.002 1.820 0.000 0.001 0.000 0.000ST16b-20 25.67 20.96 0.001 0.000 4.779 0.000 0.000 0.007 1.515 0.000 0.002 0.001 0.000ST16b-20bulk 1500.42 1225.23 0.035 0.011 281.804 0.003 0.004 0.437 87.575 0.012 0.126 0.050 0.002wash water 97.64 93.88 0.000 0.000 3.690 0.000 0.000 0.006 1.042 0.000 0.002 0.001 0.000cake moisture 2.90 2.79 0.000 0.000 0.110 0.000 0.000 0.000 0.031 0.000 0.000 0.000 0.000evaporation 19.66 19.70 - - - - - - - - - - -total OUT (g) 1681.92 0.11 0.05 296.22 0.01 0.03 0.61 92.43 0.02 0.14 1.23 0.00
balance (out/in) 99% 85% 81% 100% 89% 79% 80% 99% 76% 89% 81% 75%
extraction (solution) Al Ca Co Cr Fe Mg Mn Ni Si Zn
ST16b-2 13% 19% 63% 6% 15% -34% 14% 53% 1% 63%ST16b-20 28% 18% 62% 10% 55% -145% 64% 87% 3% 62%ST16b-20bulk 28% 18% 85% 11% 59% -212% 68% 95% 3% 62%
extraction (solids) Al Ca Co Cr Fe Mg Mn Ni Si Zn
ST16b-20bulk 41% 31% 42% 27% 79% 70% 82% 93% 19% 42%
extraction (ratio) Al Ca Co Cr Fe Mg Mn Ni Si Zn
ST16b-2 18% 31% 31% 14% 19% 70% 17% 51% 6% 42%ST16b-20 40% 30% 31% 26% 74% 70% 76% 86% 18% 42%ST16b-20bulk 41% 31% 42% 27% 79% 70% 82% 93% 19% 42%
based on solids assayacid consumption g consumed kg/t ore Al Fe Mg Ni totalST16b-20 3.23 401ST16b-20bulk 3.34 415acid equivalent (g) 0.21 1.17 3.21 0.16 4.75acid equivalent (%) 4.5 24.6 67.6 3.3 100.0
calc. total soln volumeml
1277.901239.201239.20
calc. total solid massg
4.7
calc. total soln volumeml
1277.91239.21239.2
APPENDIX A - Leach Test Sheets
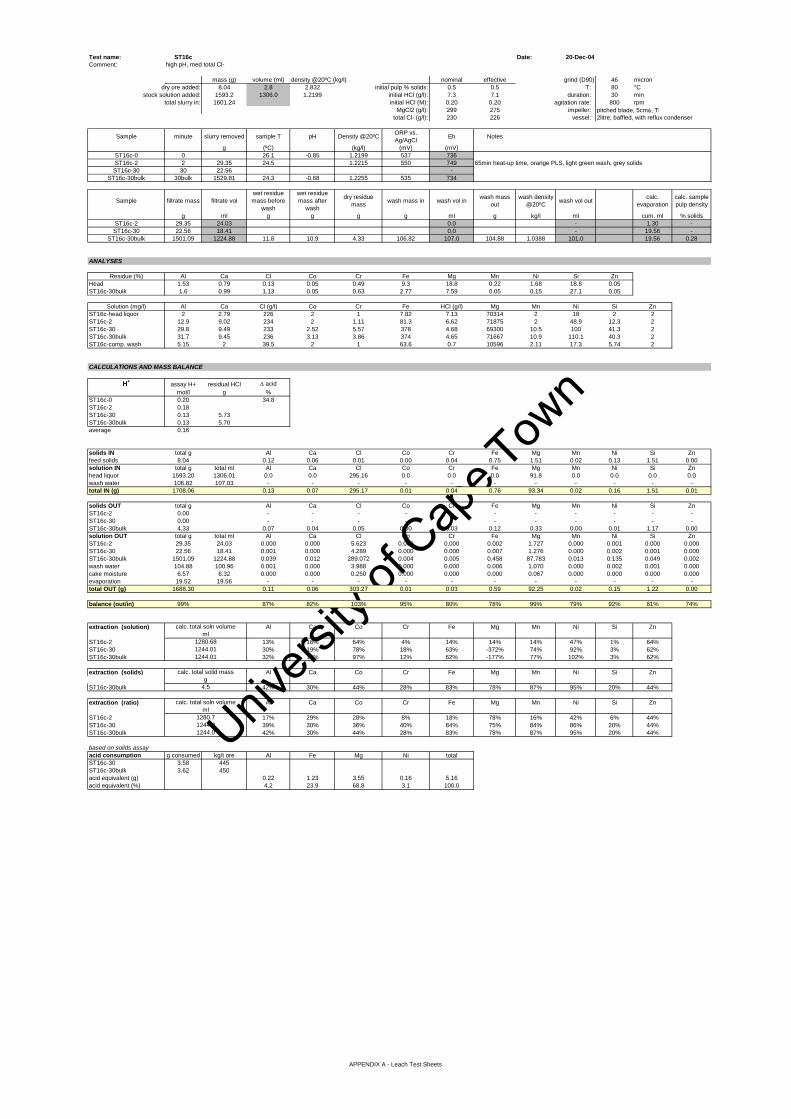
Univers
ity of
Cap
e Tow
n
Test name: ST16c Date: 20-Dec-04Comment: high pH, med total Cl-
mass (g) volume (ml) density @20ºC (kg/l) nominal effective grind (D90) 46 microndry ore added: 8.04 2.8 2.832 initial pulp % solids: 0.5 0.5 T: 80 °C
stock solution added: 1593.2 1306.0 1.2199 initial HCl (g/l): 7.3 7.1 duration: 30 mintotal slurry in: 1601.24 initial HCl (M): 0.20 0.20 agitation rate: 800 rpm
MgCl2 (g/l): 299 275 impeller: pitched blade, 5cmφ, Titotal Cl- (g/l): 230 226 vessel: 2litre, baffled, with reflux condenser
Sample minute slurry removed sample T pH Density @20ºC ORP vs. Ag/AgCl Eh Notes
g (ºC) (kg/l) (mV) (mV)ST16c-0 0 26.1 -0.85 1.2199 537 736ST16c-2 2 29.35 24.5 1.2215 550 749 65min heat-up time, orange PLS, light green wash, grey solids
ST16c-30 30 22.56 -ST16c-30bulk 30bulk 1529.81 24.3 -0.68 1.2255 535 734
Sample filtrate mass filtrate volwet residue mass before
wash
wet residue mass after
wash
dry residue mass wash mass in wash vol in wash mass
outwash density
@20ºC wash vol out calc. evaporation
calc. sample pulp density
g ml g g g g ml g kg/l ml cum. ml % solidsST16c-2 29.35 24.03 0.0 - 1.30 -
ST16c-30 22.56 18.41 0.0 - 19.56 -ST16c-30bulk 1501.09 1224.88 11.8 10.9 4.33 106.82 107.0 104.88 1.0388 101.0 19.56 0.28
ANALYSES
Residue (%) Al Ca Cl Co Cr Fe Mg Mn Ni Si ZnHead 1.53 0.79 0.13 0.05 0.49 9.3 18.8 0.22 1.68 18.8 0.05ST16c-30bulk 1.6 0.99 1.13 0.05 0.63 2.77 7.59 0.05 0.15 27.1 0.05
Solution (mg/l) Al Ca Cl (g/l) Co Cr Fe HCl (g/l) Mg Mn Ni Si ZnST16c-head liquor 2 2.79 226 2 1 7.82 7.13 70314 2 18 2 2ST16c-2 12.9 9.02 234 2 1.11 81.3 6.62 71875 2 48.9 12.3 2ST16c-30 29.8 9.49 233 2.52 5.57 378 4.68 69300 10.5 100 41.3 2ST16c-30bulk 31.7 9.45 236 3.13 3.86 374 4.65 71667 10.9 110.1 40.3 2ST16c-comp. wash 5.15 2 39.5 2 1 63.6 0.7 10596 2.11 17.3 5.74 2
CALCULATIONS AND MASS BALANCE
H+ assay H+ residual HCl ∆ acidmol/l g %
ST16c-0 0.20 34.8ST16c-2 0.18ST16c-30 0.13 5.73ST16c-30bulk 0.13 5.70average 0.16
solids IN total g Al Ca Cl Co Cr Fe Mg Mn Ni Si Znfeed solids 8.04 0.12 0.06 0.01 0.00 0.04 0.75 1.51 0.02 0.13 1.51 0.00solution IN total g total ml Al Ca Cl Co Cr Fe Mg Mn Ni Si Znhead liquor 1593.20 1306.01 0.0 0.0 295.16 0.0 0.0 0.0 91.8 0.0 0.0 0.0 0.0wash water 106.82 107.03 - - - - - - - - - - -total IN (g) 1708.06 0.13 0.07 295.17 0.01 0.04 0.76 93.34 0.02 0.16 1.51 0.01
solids OUT total g Al Ca Cl Co Cr Fe Mg Mn Ni Si ZnST16c-2 0.00 - - - - - - - - - - -ST16c-30 0.00 - - - - - - - - - - -ST16c-30bulk 4.33 0.07 0.04 0.05 0.00 0.03 0.12 0.33 0.00 0.01 1.17 0.00solution OUT total g total ml Al Ca Cl Co Cr Fe Mg Mn Ni Si ZnST16c-2 29.35 24.03 0.000 0.000 5.623 0.000 0.000 0.002 1.727 0.000 0.001 0.000 0.000ST16c-30 22.56 18.41 0.001 0.000 4.289 0.000 0.000 0.007 1.276 0.000 0.002 0.001 0.000ST16c-30bulk 1501.09 1224.88 0.039 0.012 289.072 0.004 0.005 0.458 87.783 0.013 0.135 0.049 0.002wash water 104.88 100.96 0.001 0.000 3.988 0.000 0.000 0.006 1.070 0.000 0.002 0.001 0.000cake moisture 6.57 6.32 0.000 0.000 0.250 0.000 0.000 0.000 0.067 0.000 0.000 0.000 0.000evaporation 19.52 19.56 - - - - - - - - - - -total OUT (g) 1688.30 0.11 0.06 303.27 0.01 0.03 0.59 92.25 0.02 0.15 1.22 0.00
balance (out/in) 99% 87% 82% 103% 95% 80% 78% 99% 79% 92% 81% 74%
extraction (solution) Al Ca Co Cr Fe Mg Mn Ni Si Zn
ST16c-2 13% 18% 64% 4% 14% 14% 14% 47% 1% 64%ST16c-30 30% 19% 78% 18% 63% -372% 74% 92% 3% 62%ST16c-30bulk 32% 19% 97% 12% 62% -177% 77% 102% 3% 62%
extraction (solids) Al Ca Co Cr Fe Mg Mn Ni Si Zn
ST16c-30bulk 42% 30% 44% 28% 83% 78% 87% 95% 20% 44%
extraction (ratio) Al Ca Co Cr Fe Mg Mn Ni Si Zn
ST16c-2 17% 29% 28% 8% 18% 78% 16% 42% 6% 44%ST16c-30 39% 30% 36% 40% 84% 75% 84% 86% 20% 44%ST16c-30bulk 42% 30% 44% 28% 83% 78% 87% 95% 20% 44%
based on solids assayacid consumption g consumed kg/t ore Al Fe Mg Ni totalST16c-30 3.58 445ST16c-30bulk 3.62 450acid equivalent (g) 0.22 1.23 3.55 0.16 5.16acid equivalent (%) 4.2 23.9 68.8 3.1 100.0
calc. total soln volumeml
1280.681244.011244.01
calc. total solid massg
4.5
calc. total soln volumeml
1280.71244.01244.0
APPENDIX A - Leach Test Sheets
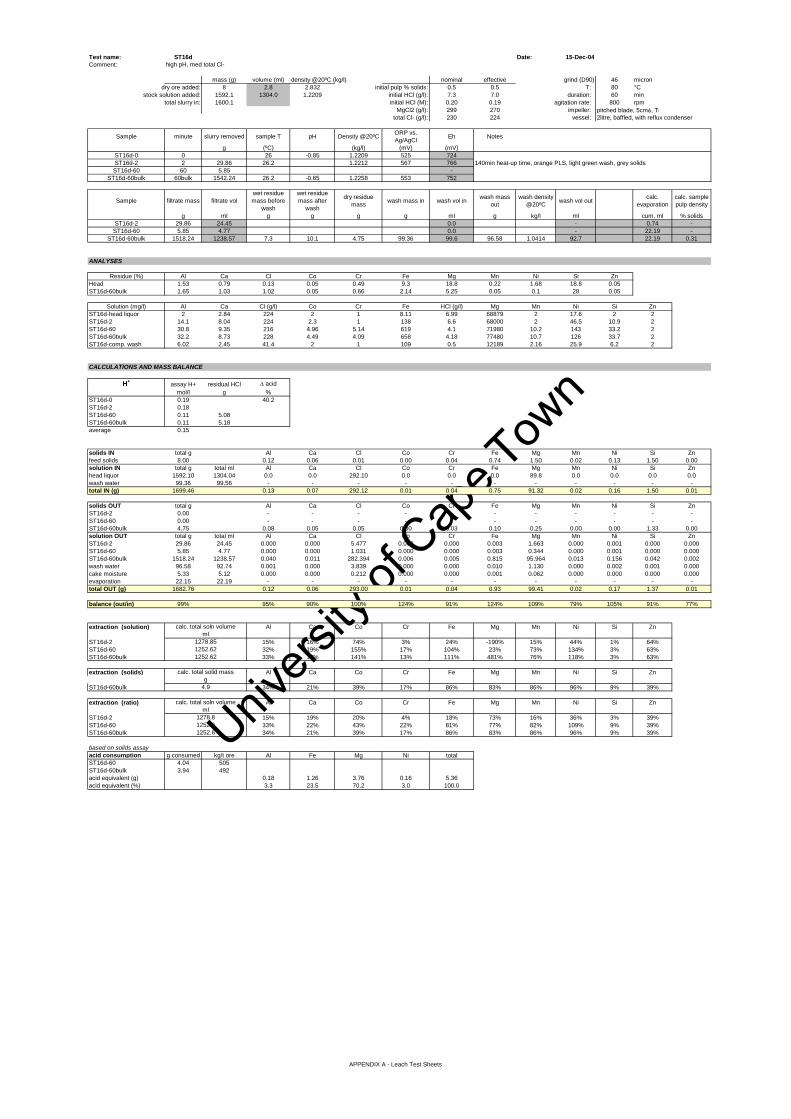
Univers
ity of
Cap
e Tow
n
Test name: ST16d Date: 15-Dec-04Comment: high pH, med total Cl-
mass (g) volume (ml) density @20ºC (kg/l) nominal effective grind (D90) 46 microndry ore added: 8 2.8 2.832 initial pulp % solids: 0.5 0.5 T: 80 °C
stock solution added: 1592.1 1304.0 1.2209 initial HCl (g/l): 7.3 7.0 duration: 60 mintotal slurry in: 1600.1 initial HCl (M): 0.20 0.19 agitation rate: 800 rpm
MgCl2 (g/l): 299 270 impeller: pitched blade, 5cmφ, Titotal Cl- (g/l): 230 224 vessel: 2litre, baffled, with reflux condenser
Sample minute slurry removed sample T pH Density @20ºC ORP vs. Ag/AgCl Eh Notes
g (ºC) (kg/l) (mV) (mV)ST16d-0 0 26 -0.85 1.2209 525 724ST16d-2 2 29.86 26.2 1.2212 567 766 140min heat-up time, orange PLS, light green wash, grey solids
ST16d-60 60 5.85 -ST16d-60bulk 60bulk 1542.24 26.2 -0.65 1.2258 553 752
Sample filtrate mass filtrate volwet residue mass before
wash
wet residue mass after
wash
dry residue mass wash mass in wash vol in wash mass
outwash density
@20ºC wash vol out calc. evaporation
calc. sample pulp density
g ml g g g g ml g kg/l ml cum. ml % solidsST16d-2 29.86 24.45 0.0 - 0.74 -
ST16d-60 5.85 4.77 0.0 - 22.19 -ST16d-60bulk 1518.24 1238.57 7.3 10.1 4.75 99.36 99.6 96.58 1.0414 92.7 22.19 0.31
ANALYSES
Residue (%) Al Ca Cl Co Cr Fe Mg Mn Ni Si ZnHead 1.53 0.79 0.13 0.05 0.49 9.3 18.8 0.22 1.68 18.8 0.05ST16d-60bulk 1.65 1.03 1.02 0.05 0.66 2.14 5.25 0.05 0.1 28 0.05
Solution (mg/l) Al Ca Cl (g/l) Co Cr Fe HCl (g/l) Mg Mn Ni Si ZnST16d-head liquor 2 2.84 224 2 1 8.11 6.99 68879 2 17.6 2 2ST16d-2 14.1 8.04 224 2.3 1 138 6.6 68000 2 46.5 10.9 2ST16d-60 30.8 9.35 216 4.96 5.14 619 4.1 71980 10.2 143 33.2 2ST16d-60bulk 32.2 8.73 228 4.49 4.09 658 4.18 77480 10.7 126 33.7 2ST16d-comp. wash 6.02 2.45 41.4 2 1 109 0.5 12189 2.16 25.9 6.2 2
CALCULATIONS AND MASS BALANCE
H+ assay H+ residual HCl ∆ acidmol/l g %
ST16d-0 0.19 40.2ST16d-2 0.18ST16d-60 0.11 5.08ST16d-60bulk 0.11 5.18average 0.15
solids IN total g Al Ca Cl Co Cr Fe Mg Mn Ni Si Znfeed solids 8.00 0.12 0.06 0.01 0.00 0.04 0.74 1.50 0.02 0.13 1.50 0.00solution IN total g total ml Al Ca Cl Co Cr Fe Mg Mn Ni Si Znhead liquor 1592.10 1304.04 0.0 0.0 292.10 0.0 0.0 0.0 89.8 0.0 0.0 0.0 0.0wash water 99.36 99.56 - - - - - - - - - - -total IN (g) 1699.46 0.13 0.07 292.12 0.01 0.04 0.75 91.32 0.02 0.16 1.50 0.01
solids OUT total g Al Ca Cl Co Cr Fe Mg Mn Ni Si ZnST16d-2 0.00 - - - - - - - - - - -ST16d-60 0.00 - - - - - - - - - - -ST16d-60bulk 4.75 0.08 0.05 0.05 0.00 0.03 0.10 0.25 0.00 0.00 1.33 0.00solution OUT total g total ml Al Ca Cl Co Cr Fe Mg Mn Ni Si ZnST16d-2 29.86 24.45 0.000 0.000 5.477 0.000 0.000 0.003 1.663 0.000 0.001 0.000 0.000ST16d-60 5.85 4.77 0.000 0.000 1.031 0.000 0.000 0.003 0.344 0.000 0.001 0.000 0.000ST16d-60bulk 1518.24 1238.57 0.040 0.011 282.394 0.006 0.005 0.815 95.964 0.013 0.156 0.042 0.002wash water 96.58 92.74 0.001 0.000 3.839 0.000 0.000 0.010 1.130 0.000 0.002 0.001 0.000cake moisture 5.33 5.12 0.000 0.000 0.212 0.000 0.000 0.001 0.062 0.000 0.000 0.000 0.000evaporation 22.15 22.19 - - - - - - - - - - -total OUT (g) 1682.76 0.12 0.06 293.00 0.01 0.04 0.93 99.41 0.02 0.17 1.37 0.01
balance (out/in) 99% 95% 90% 100% 124% 91% 124% 109% 79% 105% 91% 77%
extraction (solution) Al Ca Co Cr Fe Mg Mn Ni Si Zn
ST16d-2 15% 16% 74% 3% 24% -190% 15% 44% 1% 64%ST16d-60 32% 19% 155% 17% 104% 23% 73% 134% 3% 63%ST16d-60bulk 33% 17% 141% 13% 111% 481% 76% 118% 3% 63%
extraction (solids) Al Ca Co Cr Fe Mg Mn Ni Si Zn
ST16d-60bulk 34% 21% 39% 17% 86% 83% 86% 96% 9% 39%
extraction (ratio) Al Ca Co Cr Fe Mg Mn Ni Si Zn
ST16d-2 15% 19% 20% 4% 18% 73% 16% 36% 3% 39%ST16d-60 33% 22% 43% 22% 81% 77% 82% 109% 9% 39%ST16d-60bulk 34% 21% 39% 17% 86% 83% 86% 96% 9% 39%
based on solids assayacid consumption g consumed kg/t ore Al Fe Mg Ni totalST16d-60 4.04 505ST16d-60bulk 3.94 492acid equivalent (g) 0.18 1.26 3.76 0.16 5.36acid equivalent (%) 3.3 23.5 70.2 3.0 100.0
calc. total soln volumeml
1278.851252.621252.62
calc. total solid massg
4.9
calc. total soln volumeml
1278.81252.61252.6
APPENDIX A - Leach Test Sheets

Univers
ity of
Cap
e Tow
n
Test name: ST16e Date: 15-Dec-04Comment: high pH, med total Cl-
mass (g) volume (ml) density @20ºC (kg/l) nominal effective grind (D90) 46 microndry ore added: 8.03 2.8 2.832 initial pulp % solids: 0.5 0.5 T: 80 °C
stock solution added: 1592.2 1303.9 1.2211 initial HCl (g/l): 7.3 6.8 duration: 120 mintotal slurry in: 1600.23 initial HCl (M): 0.20 0.19 agitation rate: 800 rpm
MgCl2 (g/l): 299 270 impeller: pitched blade, 5cmφ, Titotal Cl- (g/l): 230 226 vessel: 2litre, baffled, with reflux condenser
Sample minute slurry removed sample T pH Density @20ºC ORP vs. Ag/AgCl Eh Notes
g (ºC) (kg/l) (mV) (mV)ST16e-0 0 26.1 -0.83 1.2211 525 724ST16e-2 2 25.76 26.1 1.2223 567 766 75min heat-up time, orange PLS, light green wash, grey solids
ST16e-120 120 29.86 -ST16e-120bulk 120bulk 1513.04 26.2 -0.66 1.2272 553 752
Sample filtrate mass filtrate volwet residue mass before
wash
wet residue mass after
wash
dry residue mass wash mass in wash vol in wash mass
outwash density
@20ºC wash vol out calc. evaporation
calc. sample pulp density
g ml g g g g ml g kg/l ml cum. ml % solidsST16e-2 25.76 21.08 0.0 - 0.53 -
ST16e-120 29.86 24.33 0.0 - 31.63 -ST16e-120bulk 1493 1216.59 6.1 4.4 4.71 103.3 103.5 100.44 1.0346 97.1 31.63 0.31
ANALYSES
Residue (%) Al Ca Cl Co Cr Fe Mg Mn Ni Si ZnHead 1.53 0.79 0.13 0.05 0.49 9.3 18.8 0.22 1.68 18.8 0.05ST16e-120bulk 1.63 1.03 0.88 0.05 0.68 1.73 4.18 0.05 0.07 28.6 0.05
Solution (mg/l) Al Ca Cl (g/l) Co Cr Fe HCl (g/l) Mg Mn Ni Si ZnST16e-head liquor 2 2.81 226 2 1.08 7.79 6.81 68831 2 15.4 2 2ST16e-2 13.1 8.48 227 2.24 1.97 159 6.48 75340 2 82.5 12.8 2ST16e-120 35.3 9.73 230 4.96 4.65 747 4.05 77520 11.1 178 27.3 2ST16e-120bulk 32.8 8.22 230 4.2 4.87 752 3.98 75320 11.1 118.7 26.5 2ST16e-comp. wash 5.05 2 34.4 2 1 101 0.5 10180 2 25.8 4.18 2
CALCULATIONS AND MASS BALANCE
H+ assay H+ residual HCl ∆ acidmol/l g %
ST16e-0 0.19 41.6ST16e-2 0.18ST16e-120 0.11 4.93ST16e-120bulk 0.11 4.84average 0.15
solids IN total g Al Ca Cl Co Cr Fe Mg Mn Ni Si Znfeed solids 8.03 0.12 0.06 0.01 0.00 0.04 0.75 1.51 0.02 0.13 1.51 0.00solution IN total g total ml Al Ca Cl Co Cr Fe Mg Mn Ni Si Znhead liquor 1592.20 1303.91 0.0 0.0 294.68 0.0 0.0 0.0 89.7 0.0 0.0 0.0 0.0wash water 103.30 103.51 - - - - - - - - - - -total IN (g) 1703.53 0.13 0.07 294.69 0.01 0.04 0.76 91.26 0.02 0.15 1.51 0.01
solids OUT total g Al Ca Cl Co Cr Fe Mg Mn Ni Si ZnST16e-2 0.00 - - - - - - - - - - -ST16e-120 0.00 - - - - - - - - - - -ST16e-120bulk 4.71 0.08 0.05 0.04 0.00 0.03 0.08 0.20 0.00 0.00 1.35 0.00solution OUT total g total ml Al Ca Cl Co Cr Fe Mg Mn Ni Si ZnST16e-2 25.76 21.08 0.000 0.000 4.784 0.000 0.000 0.003 1.588 0.000 0.002 0.000 0.000ST16e-120 29.86 24.33 0.001 0.000 5.596 0.000 0.000 0.018 1.886 0.000 0.004 0.001 0.000ST16e-120bulk 1493.00 1216.59 0.040 0.010 279.816 0.005 0.006 0.915 91.634 0.014 0.144 0.032 0.002wash water 100.44 97.08 0.000 0.000 3.340 0.000 0.000 0.010 0.988 0.000 0.003 0.000 0.000cake moisture -0.31 -0.30 0.000 0.000 -0.010 0.000 0.000 0.000 -0.003 0.000 0.000 0.000 0.000evaporation 31.57 31.63 - - - - - - - - - - -total OUT (g) 1685.03 0.12 0.06 293.57 0.01 0.04 1.03 96.29 0.02 0.16 1.38 0.01
balance (out/in) 99% 94% 88% 100% 118% 95% 136% 106% 81% 101% 92% 77%
extraction (solution) Al Ca Co Cr Fe Mg Mn Ni Si Zn
ST16a-2 13% 16% 66% 5% 22% 170% 14% 50% 1% 64%ST16b-2 13% 19% 63% 6% 15% -34% 14% 53% 1% 63%ST16c-2 13% 18% 64% 4% 14% 14% 14% 47% 1% 64%ST16d-2 15% 16% 74% 3% 24% -190% 15% 44% 1% 64%ST16e-2 14% 17% 72% 6% 27% 454% 15% 79% 1% 64%
ST16e-2 ave. 14% 17% 68% 5% 20% 83% 14% 55% 1% 64%std deviation 1% 1% 5% 1% 6% 244% 0% 14% 0% 0%confidence limits 0.6% 1.1% 4.1% 1.2% 5.1% 214.0% 0.0% 12.2% 0.1% 0.2%ST16a-10 26% 18% 73% 8% 73% 126% 37% 107% 2% 62%ST16b-20 28% 18% 62% 10% 55% -145% 64% 87% 3% 62%ST16c-30 30% 19% 78% 18% 63% -372% 74% 92% 3% 62%ST16d-60 32% 19% 155% 17% 104% 23% 73% 134% 3% 63%ST16e-120 35% 19% 152% 15% 123% 355% 77% 162% 2% 61%ST16e-120bulk 33% 16% 128% 15% 123% 176% 77% 108% 2% 61%
extraction (solids) Al Ca Co Cr Fe Mg Mn Ni Si Zn
ST16a-10bulk 27% 18% 25% 11% 62% 47% 55% 85% 4% 25%ST16b-20bulk 41% 31% 42% 27% 79% 70% 82% 93% 19% 42%ST16c-30bulk 42% 30% 44% 28% 83% 78% 87% 95% 20% 44%ST16d-60bulk 34% 21% 39% 17% 86% 83% 86% 96% 9% 39%ST16e-120bulk 35% 21% 39% 15% 89% 86% 86% 97% 7% 39%
based on solids assayacid consumption g consumed kg/t ore Al Fe Mg Ni totalST16e-120 3.95 492ST16e-120bulk 4.04 503acid equivalent (g) 0.19 1.30 3.94 0.16 5.59acid equivalent (%) 3.3 23.3 70.4 2.9 100.0
calc. total soln volume
calc. total solid massg
4.9
ml
1282.30
1226.871226.87
0%10%20%30%40%50%60%70%80%90%
100%
0 20 40 60 80 100 120 140time (min)
extr
actio
n
Fe24%
Mg71%
Ni3%
Al2%
APPENDIX A - Leach Test Sheets
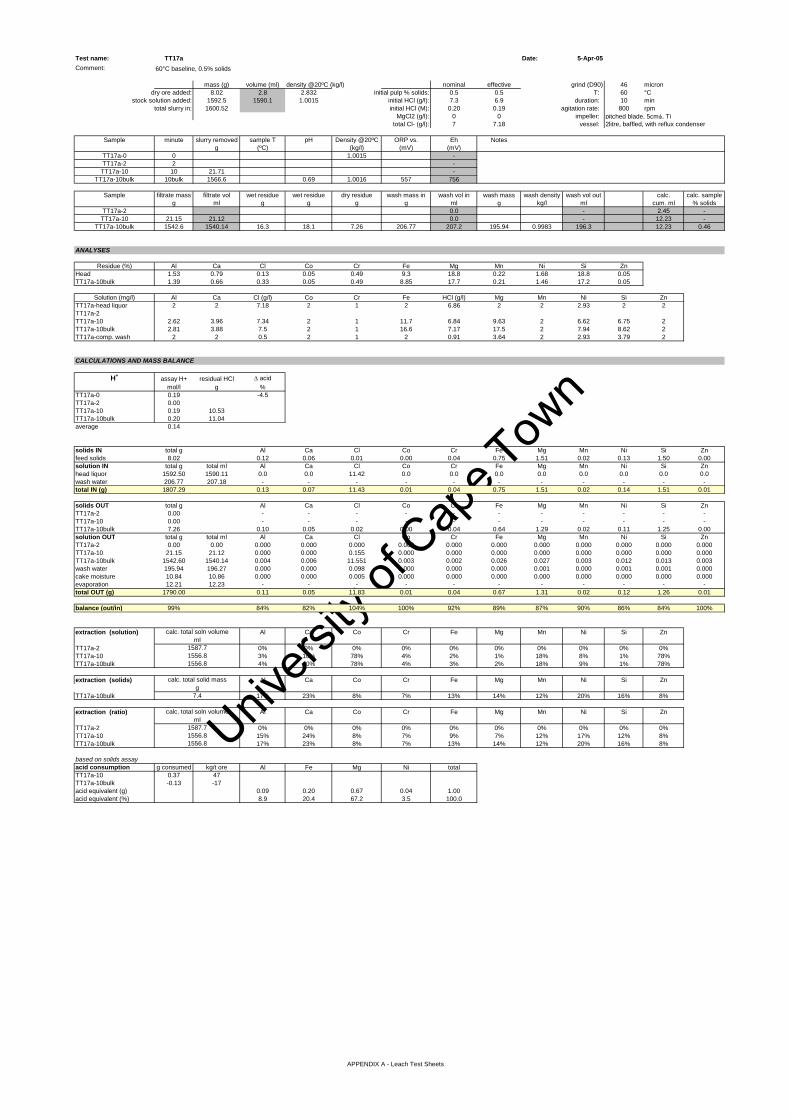
Univers
ity of
Cap
e Tow
n
Test name: TT17a Date: 5-Apr-05Comment: 60°C baseline, 0.5% solids
mass (g) volume (ml) density @20ºC (kg/l) nominal effective grind (D90) 46 microndry ore added: 8.02 2.8 2.832 initial pulp % solids: 0.5 0.5 T: 60 °C
stock solution added: 1592.5 1590.1 1.0015 initial HCl (g/l): 7.3 6.9 duration: 10 mintotal slurry in: 1600.52 initial HCl (M): 0.20 0.19 agitation rate: 800 rpm
MgCl2 (g/l): 0 0 impeller: pitched blade, 5cmφ, Titotal Cl- (g/l): 7 7.18 vessel: 2litre, baffled, with reflux condenser
Sample minute slurry removed sample T pH Density @20ºC ORP vs. Eh Notesg (ºC) (kg/l) (mV) (mV)
TT17a-0 0 1.0015 -TT17a-2 2 -
TT17a-10 10 21.71 -TT17a-10bulk 10bulk 1566.6 0.69 1.0016 557 756
Sample filtrate mass filtrate vol wet residue wet residue dry residue wash mass in wash vol in wash mass wash density wash vol out calc. calc. sample g ml g g g g ml g kg/l ml cum. ml % solids
TT17a-2 0.0 - 2.45 -TT17a-10 21.15 21.12 0.0 - 12.23 -
TT17a-10bulk 1542.6 1540.14 16.3 18.1 7.26 206.77 207.2 195.94 0.9983 196.3 12.23 0.46
ANALYSES
Residue (%) Al Ca Cl Co Cr Fe Mg Mn Ni Si ZnHead 1.53 0.79 0.13 0.05 0.49 9.3 18.8 0.22 1.68 18.8 0.05TT17a-10bulk 1.39 0.66 0.33 0.05 0.49 8.85 17.7 0.21 1.46 17.2 0.05
Solution (mg/l) Al Ca Cl (g/l) Co Cr Fe HCl (g/l) Mg Mn Ni Si ZnTT17a-head liquor 2 2 7.18 2 1 2 6.86 2 2 2.93 2 2TT17a-2TT17a-10 2.62 3.96 7.34 2 1 11.7 6.84 9.63 2 6.62 6.75 2TT17a-10bulk 2.81 3.88 7.5 2 1 16.6 7.17 17.5 2 7.94 8.62 2TT17a-comp. wash 2 2 0.5 2 1 2 0.91 3.64 2 2.93 3.79 2
CALCULATIONS AND MASS BALANCE
H+ assay H+ residual HCl ∆ acidmol/l g %
TT17a-0 0.19 -4.5TT17a-2 0.00TT17a-10 0.19 10.53TT17a-10bulk 0.20 11.04average 0.14
solids IN total g Al Ca Cl Co Cr Fe Mg Mn Ni Si Znfeed solids 8.02 0.12 0.06 0.01 0.00 0.04 0.75 1.51 0.02 0.13 1.50 0.00solution IN total g total ml Al Ca Cl Co Cr Fe Mg Mn Ni Si Znhead liquor 1592.50 1590.11 0.0 0.0 11.42 0.0 0.0 0.0 0.0 0.0 0.0 0.0 0.0wash water 206.77 207.18 - - - - - - - - - - -total IN (g) 1807.29 0.13 0.07 11.43 0.01 0.04 0.75 1.51 0.02 0.14 1.51 0.01
solids OUT total g Al Ca Cl Co Cr Fe Mg Mn Ni Si ZnTT17a-2 0.00 - - - - - - - - - - -TT17a-10 0.00 - - - - - - - - - - -TT17a-10bulk 7.26 0.10 0.05 0.02 0.00 0.04 0.64 1.29 0.02 0.11 1.25 0.00solution OUT total g total ml Al Ca Cl Co Cr Fe Mg Mn Ni Si ZnTT17a-2 0.00 0.00 0.000 0.000 0.000 0.000 0.000 0.000 0.000 0.000 0.000 0.000 0.000TT17a-10 21.15 21.12 0.000 0.000 0.155 0.000 0.000 0.000 0.000 0.000 0.000 0.000 0.000TT17a-10bulk 1542.60 1540.14 0.004 0.006 11.551 0.003 0.002 0.026 0.027 0.003 0.012 0.013 0.003wash water 195.94 196.27 0.000 0.000 0.098 0.000 0.000 0.000 0.001 0.000 0.001 0.001 0.000cake moisture 10.84 10.86 0.000 0.000 0.005 0.000 0.000 0.000 0.000 0.000 0.000 0.000 0.000evaporation 12.21 12.23 - - - - - - - - - - -total OUT (g) 1790.00 0.11 0.05 11.83 0.01 0.04 0.67 1.31 0.02 0.12 1.26 0.01
balance (out/in) 99% 84% 82% 104% 100% 92% 89% 87% 90% 86% 84% 100%
extraction (solution) Al Ca Co Cr Fe Mg Mn Ni Si Zn
TT17a-2 0% 0% 0% 0% 0% 0% 0% 0% 0% 0%TT17a-10 3% 10% 78% 4% 2% 1% 18% 8% 1% 78%TT17a-10bulk 4% 10% 78% 4% 3% 2% 18% 9% 1% 78%
extraction (solids) Al Ca Co Cr Fe Mg Mn Ni Si Zn
TT17a-10bulk 17% 23% 8% 7% 13% 14% 12% 20% 16% 8%
extraction (ratio) Al Ca Co Cr Fe Mg Mn Ni Si Zn
TT17a-2 0% 0% 0% 0% 0% 0% 0% 0% 0% 0%TT17a-10 15% 24% 8% 7% 9% 7% 12% 17% 12% 8%TT17a-10bulk 17% 23% 8% 7% 13% 14% 12% 20% 16% 8%
based on solids assayacid consumption g consumed kg/t ore Al Fe Mg Ni totalTT17a-10 0.37 47TT17a-10bulk -0.13 -17acid equivalent (g) 0.09 0.20 0.67 0.04 1.00acid equivalent (%) 8.9 20.4 67.2 3.5 100.0
1556.8
calc. total soln volumeml
1587.71556.8
calc. total soln volumeml
1587.71556.8
7.4
calc. total solid massg
1556.8
APPENDIX A - Leach Test Sheets

Univers
ity of
Cap
e Tow
n
Test name: TT17b Date: 5-Apr-05Comment: 60°C baseline, 0.5% solids
mass (g) volume (ml) density @20ºC (kg/l) nominal effective grind (D90) 46 microndry ore added: 8.06 2.8 2.832 initial pulp % solids: 0.5 0.5 T: 60 °C
stock solution added: 1592 1589.6 1.0015 initial HCl (g/l): 7.3 6.9 duration: 20 mintotal slurry in: 1600.06 initial HCl (M): 0.20 0.19 agitation rate: 800 rpm
MgCl2 (g/l): 0 0 impeller: pitched blade, 5cmφ, Titotal Cl- (g/l): 7 7.18 vessel: 2litre, baffled, with reflux condenser
Sample minute slurry removed sample T pH Density @20ºC ORP vs. Ag/AgCl Eh Notes
g (ºC) (kg/l) (mV) (mV)TT17b-0 0 1.0015 -TT17b-2 2 -
TT17b-20 20 22.38 -TT17b-20bulk 20bulk 1560.06 0.69 1.0016 575 774
Sample filtrate mass filtrate volwet residue mass before
wash
wet residue mass after
wash
dry residue mass wash mass in wash vol in wash mass
outwash density
@20ºC wash vol out calc. evaporation
calc. sample pulp density
g ml g g g g ml g kg/l ml cum. ml % solidsTT17b-2 0 0.0 - 1.77 -TT17b-20 22.1 22.06 0.0 - 17.66 -
TT17b-20bulk 1542 1539.54 10.1 11.1 7.47 195.04 195.4 189.52 0.9982 189.9 17.66 0.48
ANALYSES
Residue (%) Al Ca Cl Co Cr Fe Mg Mn Ni Si ZnHead 1.53 0.79 0.13 0.05 0.49 9.3 18.8 0.22 1.68 18.8 0.05TT17b-20bulk 1.35 0.69 0.22 0.05 0.5 8.89 17.8 0.21 1.45 17.4 0.05
Solution (mg/l) Al Ca Cl (g/l) Co Cr Fe HCl (g/l) Mg Mn Ni Si ZnTT17b-head liquor 2 2 7.18 2 1 2 6.86 2 2 2.93 2 2TT17b-2TT17b-20 3.07 3.73 7.51 2 1 16.3 6.8 13.9 2 9.67 9.22 2TT17b-20bulk 3.06 3.84 7.48 2 1 19 7.09 18.3 2 11 11.3 2TT17b-comp. wash 2 2 0.5 2 1 5.14 0.71 17.2 2 2.93 4.42 2
CALCULATIONS AND MASS BALANCE
H+ assay H+ residual HCl ∆ acidmol/l g %
TT17b-0 0.19 -3.4TT17b-2 0.00TT17b-20 0.19 10.47TT17b-20bulk 0.19 10.92average 0.14
solids IN total g Al Ca Cl Co Cr Fe Mg Mn Ni Si Znfeed solids 8.06 0.12 0.06 0.01 0.00 0.04 0.75 1.52 0.02 0.14 1.51 0.00solution IN total g total ml Al Ca Cl Co Cr Fe Mg Mn Ni Si Znhead liquor 1592.00 1589.62 0.0 0.0 11.41 0.0 0.0 0.0 0.0 0.0 0.0 0.0 0.0wash water 195.04 195.43 - - - - - - - - - - -total IN (g) 1795.10 0.13 0.07 11.42 0.01 0.04 0.75 1.52 0.02 0.14 1.51 0.01
solids OUT total g Al Ca Cl Co Cr Fe Mg Mn Ni Si ZnTT17b-2 0.00 - - - - - - - - - - -TT17b-20 0.00 - - - - - - - - - - -TT17b-20bulk 7.47 0.10 0.05 0.02 0.00 0.04 0.66 1.33 0.02 0.11 1.30 0.00solution OUT total g total ml Al Ca Cl Co Cr Fe Mg Mn Ni Si ZnTT17b-2 0.00 0.00 0.000 0.000 0.000 0.000 0.000 0.000 0.000 0.000 0.000 0.000 0.000TT17b-20 22.10 22.06 0.000 0.000 0.166 0.000 0.000 0.000 0.000 0.000 0.000 0.000 0.000TT17b-20bulk 1542.00 1539.54 0.005 0.006 11.516 0.003 0.002 0.029 0.028 0.003 0.017 0.017 0.003wash water 189.52 189.86 0.000 0.000 0.095 0.000 0.000 0.001 0.003 0.000 0.001 0.001 0.000cake moisture 3.63 3.64 0.000 0.000 0.002 0.000 0.000 0.000 0.000 0.000 0.000 0.000 0.000evaporation 17.62 17.66 - - - - - - - - - - -total OUT (g) 1782.34 0.11 0.06 11.79 0.01 0.04 0.69 1.36 0.02 0.13 1.32 0.01
balance (out/in) 99% 84% 87% 103% 100% 96% 92% 90% 92% 90% 87% 100%
extraction (solution) Al Ca Co Cr Fe Mg Mn Ni Si Zn
TT17b-2 0% 0% 0% 0% 0% 0% 0% 0% 0% 0%TT17b-20 4% 9% 77% 4% 3% 1% 17% 11% 1% 77%TT17b-20bulk 4% 9% 77% 4% 4% 2% 17% 13% 1% 77%
extraction (solids) Al Ca Co Cr Fe Mg Mn Ni Si Zn
TT17b-20bulk 17% 18% 6% 3% 10% 11% 10% 19% 13% 6%
extraction (ratio) Al Ca Co Cr Fe Mg Mn Ni Si Zn
TT17b-2 0% 0% 0% 0% 0% 0% 0% 0% 0% 0%TT17b-20 17% 17% 6% 3% 9% 8% 10% 16% 10% 6%TT17b-20bulk 17% 18% 6% 3% 10% 11% 10% 19% 13% 6%
based on solids assayacid consumption g consumed kg/t ore Al Fe Mg Ni totalTT17b-20 0.44 54TT17b-20bulk -0.01 -1acid equivalent (g) 0.09 0.17 0.56 0.03 0.85acid equivalent (%) 10.7 19.8 65.6 3.9 100.0
calc. total soln volumeml
1587.851549.901549.90
calc. total solid massg
7.6
calc. total soln volumeml
1587.91549.91549.9
APPENDIX A - Leach Test Sheets
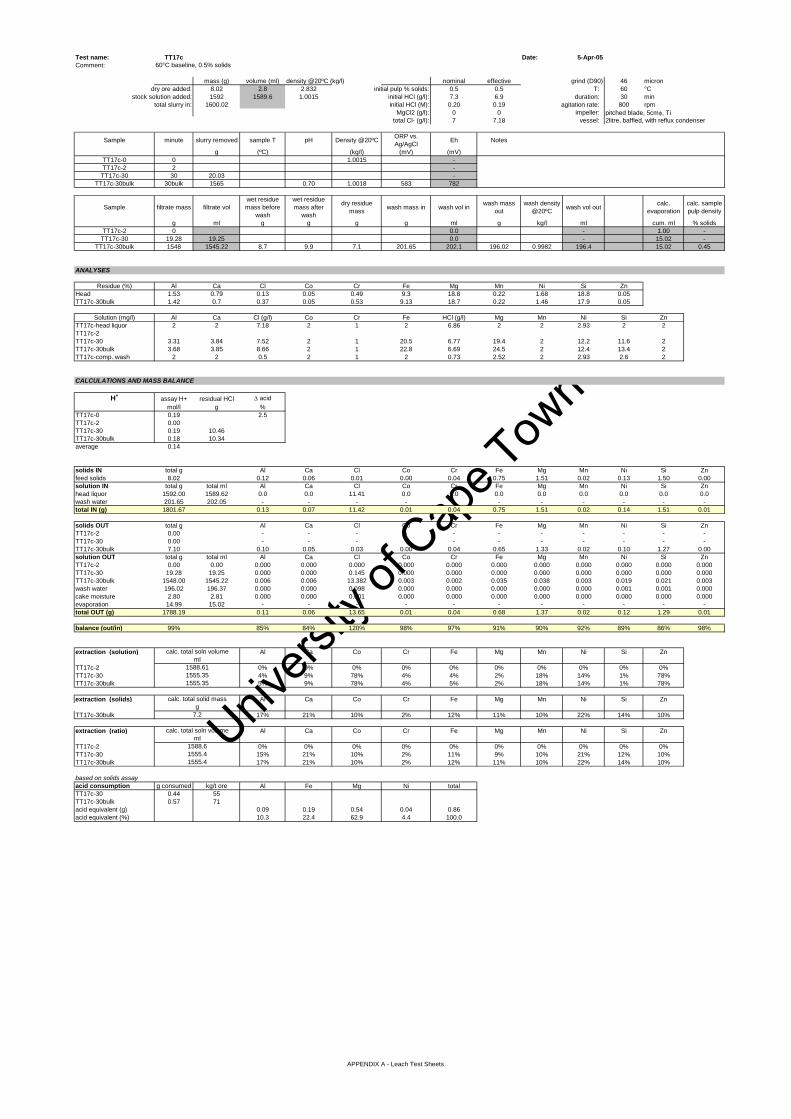
Univers
ity of
Cap
e Tow
n
Test name: TT17c Date: 5-Apr-05Comment: 60°C baseline, 0.5% solids
mass (g) volume (ml) density @20ºC (kg/l) nominal effective grind (D90) 46 microndry ore added: 8.02 2.8 2.832 initial pulp % solids: 0.5 0.5 T: 60 °C
stock solution added: 1592 1589.6 1.0015 initial HCl (g/l): 7.3 6.9 duration: 30 mintotal slurry in: 1600.02 initial HCl (M): 0.20 0.19 agitation rate: 800 rpm
MgCl2 (g/l): 0 0 impeller: pitched blade, 5cmφ, Titotal Cl- (g/l): 7 7.18 vessel: 2litre, baffled, with reflux condenser
Sample minute slurry removed sample T pH Density @20ºC ORP vs. Ag/AgCl Eh Notes
g (ºC) (kg/l) (mV) (mV)TT17c-0 0 1.0015 -TT17c-2 2 -
TT17c-30 30 20.03 -TT17c-30bulk 30bulk 1565 0.70 1.0018 583 782
Sample filtrate mass filtrate volwet residue mass before
wash
wet residue mass after
wash
dry residue mass wash mass in wash vol in wash mass
outwash density
@20ºC wash vol out calc. evaporation
calc. sample pulp density
g ml g g g g ml g kg/l ml cum. ml % solidsTT17c-2 0 0.0 - 1.00 -TT17c-30 19.28 19.25 0.0 - 15.02 -
TT17c-30bulk 1548 1545.22 8.7 9.9 7.1 201.65 202.1 196.02 0.9982 196.4 15.02 0.45
ANALYSES
Residue (%) Al Ca Cl Co Cr Fe Mg Mn Ni Si ZnHead 1.53 0.79 0.13 0.05 0.49 9.3 18.8 0.22 1.68 18.8 0.05TT17c-30bulk 1.42 0.7 0.37 0.05 0.53 9.13 18.7 0.22 1.46 17.9 0.05
Solution (mg/l) Al Ca Cl (g/l) Co Cr Fe HCl (g/l) Mg Mn Ni Si ZnTT17c-head liquor 2 2 7.18 2 1 2 6.86 2 2 2.93 2 2TT17c-2TT17c-30 3.31 3.84 7.52 2 1 20.5 6.77 19.4 2 12.2 11.6 2TT17c-30bulk 3.68 3.85 8.66 2 1 22.8 6.69 24.5 2 12.4 13.4 2TT17c-comp. wash 2 2 0.5 2 1 2 0.73 2.52 2 2.93 2.6 2
CALCULATIONS AND MASS BALANCE
H+ assay H+ residual HCl ∆ acidmol/l g %
TT17c-0 0.19 2.5TT17c-2 0.00TT17c-30 0.19 10.46TT17c-30bulk 0.18 10.34average 0.14
solids IN total g Al Ca Cl Co Cr Fe Mg Mn Ni Si Znfeed solids 8.02 0.12 0.06 0.01 0.00 0.04 0.75 1.51 0.02 0.13 1.50 0.00solution IN total g total ml Al Ca Cl Co Cr Fe Mg Mn Ni Si Znhead liquor 1592.00 1589.62 0.0 0.0 11.41 0.0 0.0 0.0 0.0 0.0 0.0 0.0 0.0wash water 201.65 202.05 - - - - - - - - - - -total IN (g) 1801.67 0.13 0.07 11.42 0.01 0.04 0.75 1.51 0.02 0.14 1.51 0.01
solids OUT total g Al Ca Cl Co Cr Fe Mg Mn Ni Si ZnTT17c-2 0.00 - - - - - - - - - - -TT17c-30 0.00 - - - - - - - - - - -TT17c-30bulk 7.10 0.10 0.05 0.03 0.00 0.04 0.65 1.33 0.02 0.10 1.27 0.00solution OUT total g total ml Al Ca Cl Co Cr Fe Mg Mn Ni Si ZnTT17c-2 0.00 0.00 0.000 0.000 0.000 0.000 0.000 0.000 0.000 0.000 0.000 0.000 0.000TT17c-30 19.28 19.25 0.000 0.000 0.145 0.000 0.000 0.000 0.000 0.000 0.000 0.000 0.000TT17c-30bulk 1548.00 1545.22 0.006 0.006 13.382 0.003 0.002 0.035 0.038 0.003 0.019 0.021 0.003wash water 196.02 196.37 0.000 0.000 0.098 0.000 0.000 0.000 0.000 0.000 0.001 0.001 0.000cake moisture 2.80 2.81 0.000 0.000 0.001 0.000 0.000 0.000 0.000 0.000 0.000 0.000 0.000evaporation 14.99 15.02 - - - - - - - - - - -total OUT (g) 1788.19 0.11 0.06 13.65 0.01 0.04 0.68 1.37 0.02 0.12 1.29 0.01
balance (out/in) 99% 85% 84% 120% 98% 97% 91% 90% 92% 89% 86% 98%
extraction (solution) Al Ca Co Cr Fe Mg Mn Ni Si Zn
TT17c-2 0% 0% 0% 0% 0% 0% 0% 0% 0% 0%TT17c-30 4% 9% 78% 4% 4% 2% 18% 14% 1% 78%TT17c-30bulk 5% 9% 78% 4% 5% 2% 18% 14% 1% 78%
extraction (solids) Al Ca Co Cr Fe Mg Mn Ni Si Zn
TT17c-30bulk 17% 21% 10% 2% 12% 11% 10% 22% 14% 10%
extraction (ratio) Al Ca Co Cr Fe Mg Mn Ni Si Zn
TT17c-2 0% 0% 0% 0% 0% 0% 0% 0% 0% 0%TT17c-30 15% 21% 10% 2% 11% 9% 10% 21% 12% 10%TT17c-30bulk 17% 21% 10% 2% 12% 11% 10% 22% 14% 10%
based on solids assayacid consumption g consumed kg/t ore Al Fe Mg Ni totalTT17c-30 0.44 55TT17c-30bulk 0.57 71acid equivalent (g) 0.09 0.19 0.54 0.04 0.86acid equivalent (%) 10.3 22.4 62.9 4.4 100.0
calc. total soln volumeml
1588.611555.351555.35
calc. total solid massg
7.2
calc. total soln volumeml
1588.61555.41555.4
APPENDIX A - Leach Test Sheets
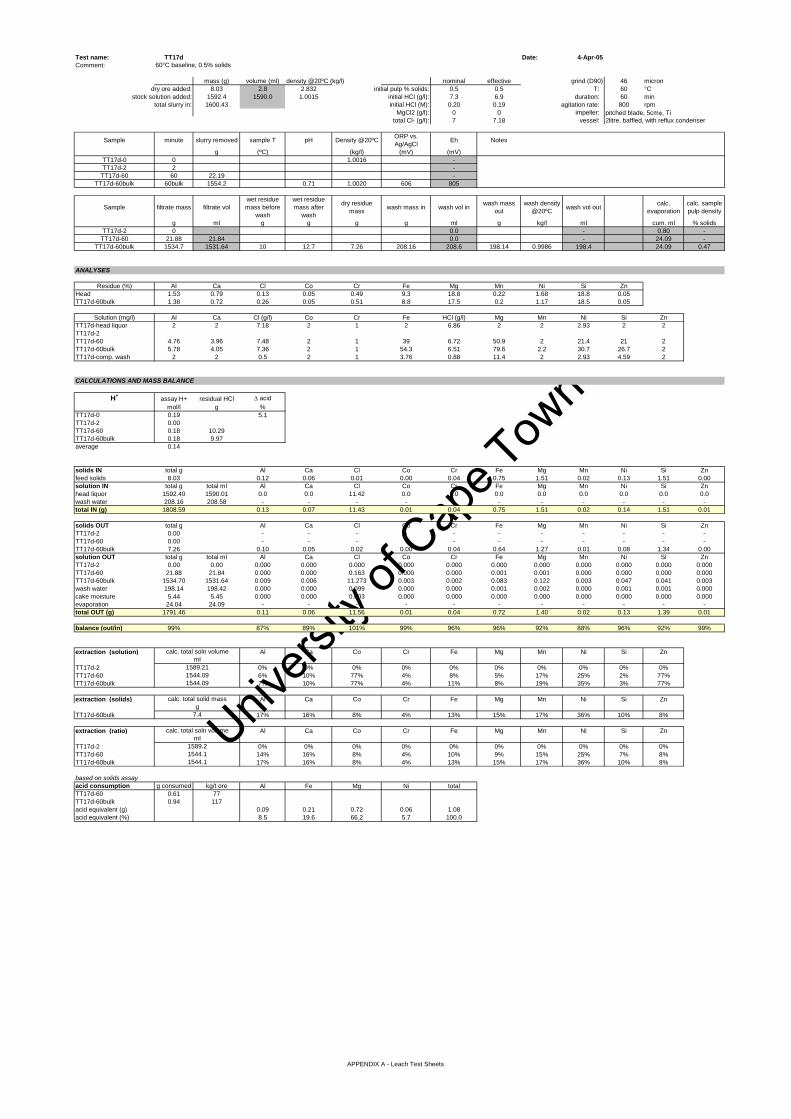
Univers
ity of
Cap
e Tow
n
Test name: TT17d Date: 4-Apr-05Comment: 60°C baseline, 0.5% solids
mass (g) volume (ml) density @20ºC (kg/l) nominal effective grind (D90) 46 microndry ore added: 8.03 2.8 2.832 initial pulp % solids: 0.5 0.5 T: 60 °C
stock solution added: 1592.4 1590.0 1.0015 initial HCl (g/l): 7.3 6.9 duration: 60 mintotal slurry in: 1600.43 initial HCl (M): 0.20 0.19 agitation rate: 800 rpm
MgCl2 (g/l): 0 0 impeller: pitched blade, 5cmφ, Titotal Cl- (g/l): 7 7.18 vessel: 2litre, baffled, with reflux condenser
Sample minute slurry removed sample T pH Density @20ºC ORP vs. Ag/AgCl Eh Notes
g (ºC) (kg/l) (mV) (mV)TT17d-0 0 1.0016 -TT17d-2 2 -
TT17d-60 60 22.19 -TT17d-60bulk 60bulk 1554.2 0.71 1.0020 606 805
Sample filtrate mass filtrate volwet residue mass before
wash
wet residue mass after
wash
dry residue mass wash mass in wash vol in wash mass
outwash density
@20ºC wash vol out calc. evaporation
calc. sample pulp density
g ml g g g g ml g kg/l ml cum. ml % solidsTT17d-2 0 0.0 - 0.80 -TT17d-60 21.88 21.84 0.0 - 24.09 -
TT17d-60bulk 1534.7 1531.64 10 12.7 7.26 208.16 208.6 198.14 0.9986 198.4 24.09 0.47
ANALYSES
Residue (%) Al Ca Cl Co Cr Fe Mg Mn Ni Si ZnHead 1.53 0.79 0.13 0.05 0.49 9.3 18.8 0.22 1.68 18.8 0.05TT17d-60bulk 1.38 0.72 0.26 0.05 0.51 8.8 17.5 0.2 1.17 18.5 0.05
Solution (mg/l) Al Ca Cl (g/l) Co Cr Fe HCl (g/l) Mg Mn Ni Si ZnTT17d-head liquor 2 2 7.18 2 1 2 6.86 2 2 2.93 2 2TT17d-2TT17d-60 4.76 3.96 7.48 2 1 39 6.72 50.9 2 21.4 21 2TT17d-60bulk 5.78 4.05 7.36 2 1 54.3 6.51 79.6 2.2 30.7 26.7 2TT17d-comp. wash 2 2 0.5 2 1 3.76 0.88 11.4 2 2.93 4.59 2
CALCULATIONS AND MASS BALANCE
H+ assay H+ residual HCl ∆ acidmol/l g %
TT17d-0 0.19 5.1TT17d-2 0.00TT17d-60 0.18 10.29TT17d-60bulk 0.18 9.97average 0.14
solids IN total g Al Ca Cl Co Cr Fe Mg Mn Ni Si Znfeed solids 8.03 0.12 0.06 0.01 0.00 0.04 0.75 1.51 0.02 0.13 1.51 0.00solution IN total g total ml Al Ca Cl Co Cr Fe Mg Mn Ni Si Znhead liquor 1592.40 1590.01 0.0 0.0 11.42 0.0 0.0 0.0 0.0 0.0 0.0 0.0 0.0wash water 208.16 208.58 - - - - - - - - - - -total IN (g) 1808.59 0.13 0.07 11.43 0.01 0.04 0.75 1.51 0.02 0.14 1.51 0.01
solids OUT total g Al Ca Cl Co Cr Fe Mg Mn Ni Si ZnTT17d-2 0.00 - - - - - - - - - - -TT17d-60 0.00 - - - - - - - - - - -TT17d-60bulk 7.26 0.10 0.05 0.02 0.00 0.04 0.64 1.27 0.01 0.08 1.34 0.00solution OUT total g total ml Al Ca Cl Co Cr Fe Mg Mn Ni Si ZnTT17d-2 0.00 0.00 0.000 0.000 0.000 0.000 0.000 0.000 0.000 0.000 0.000 0.000 0.000TT17d-60 21.88 21.84 0.000 0.000 0.163 0.000 0.000 0.001 0.001 0.000 0.000 0.000 0.000TT17d-60bulk 1534.70 1531.64 0.009 0.006 11.273 0.003 0.002 0.083 0.122 0.003 0.047 0.041 0.003wash water 198.14 198.42 0.000 0.000 0.099 0.000 0.000 0.001 0.002 0.000 0.001 0.001 0.000cake moisture 5.44 5.45 0.000 0.000 0.003 0.000 0.000 0.000 0.000 0.000 0.000 0.000 0.000evaporation 24.04 24.09 - - - - - - - - - - -total OUT (g) 1791.46 0.11 0.06 11.56 0.01 0.04 0.72 1.40 0.02 0.13 1.39 0.01
balance (out/in) 99% 87% 89% 101% 99% 96% 96% 92% 88% 96% 92% 99%
extraction (solution) Al Ca Co Cr Fe Mg Mn Ni Si Zn
TT17d-2 0% 0% 0% 0% 0% 0% 0% 0% 0% 0%TT17d-60 6% 10% 77% 4% 8% 5% 17% 25% 2% 77%TT17d-60bulk 7% 10% 77% 4% 11% 8% 19% 35% 3% 77%
extraction (solids) Al Ca Co Cr Fe Mg Mn Ni Si Zn
TT17d-60bulk 17% 16% 8% 4% 13% 15% 17% 36% 10% 8%
extraction (ratio) Al Ca Co Cr Fe Mg Mn Ni Si Zn
TT17d-2 0% 0% 0% 0% 0% 0% 0% 0% 0% 0%TT17d-60 14% 16% 8% 4% 10% 9% 15% 25% 7% 8%TT17d-60bulk 17% 16% 8% 4% 13% 15% 17% 36% 10% 8%
based on solids assayacid consumption g consumed kg/t ore Al Fe Mg Ni totalTT17d-60 0.61 77TT17d-60bulk 0.94 117acid equivalent (g) 0.09 0.21 0.72 0.06 1.08acid equivalent (%) 8.5 19.6 66.2 5.7 100.0
calc. total soln volumeml
1589.211544.091544.09
calc. total solid massg
7.4
calc. total soln volumeml
1589.21544.11544.1
APPENDIX A - Leach Test Sheets

Univers
ity of
Cap
e Tow
n
Test name: TT17e Date: 4-Apr-05Comment: 60°C baseline, 0.5% solids
mass (g) volume (ml) density @20ºC (kg/l) nominal effective grind (D90) 46 microndry ore added: 8 2.8 2.832 initial pulp % solids: 0.5 0.5 T: 60 °C
stock solution added: 1592.8 1590.4 1.0015 initial HCl (g/l): 7.3 6.9 duration: 120 mintotal slurry in: 1600.8 initial HCl (M): 0.20 0.19 agitation rate: 800 rpm
MgCl2 (g/l): 0 0 impeller: pitched blade, 5cmφ, Titotal Cl- (g/l): 7 7.18 vessel: 2litre, baffled, with reflux condenser
Sample minute slurry removed sample T pH Density @20ºC ORP vs. Ag/AgCl Eh Notes
g (ºC) (kg/l) (mV) (mV)TT17e-0 0 1.0016 -TT17e-2 2 -
TT17e-120 120 22.8 -TT17e-120bulk 120bulk 1561.5 0.73 1.0024 599 798
Sample filtrate mass filtrate volwet residue mass before
wash
wet residue mass after
wash
dry residue mass wash mass in wash vol in wash mass
outwash density
@20ºC wash vol out calc. evaporation
calc. sample pulp density
g ml g g g g ml g kg/l ml cum. ml % solidsTT17e-2 0 0.0 - 0.28 -
TT17e-120 22.33 22.28 0.0 - 16.53 -TT17e-120bulk 1543.7 1540.00 10.2 11.2 6.78 196.23 196.6 189.22 0.9984 189.5 16.53 0.43
ANALYSES
Residue (%) Al Ca Cl Co Cr Fe Mg Mn Ni Si ZnHead 1.53 0.79 0.13 0.05 0.49 9.3 18.8 0.22 1.68 18.8 0.05TT17e-120bulk 1.47 0.77 0.22 0.05 0.58 8.56 16.8 0.18 0.96 19 0.05
Solution (mg/l) Al Ca Cl (g/l) Co Cr Fe HCl (g/l) Mg Mn Ni Si ZnTT17e-head liquor 2 2 7.18 2 1 2 6.86 2 2 2.93 2 2TT17e-120 8.02 3.89 7.62 2 1 90.5 6.39 159 3.29 42.6 43.2 2TT17e-120bulk 8.58 4.02 7.38 2 1 91.9 6.4 163 3.41 44.1 44.6 2TT17e-comp. wash 2 2 0.5 2 1 2 0.74 2 2 2.93 2.53 2
CALCULATIONS AND MASS BALANCE
H+ assay H+ residual HCl ∆ acidmol/l g %
TT17e-0 0.19 6.7TT17e-120 0.18 9.84TT17e-120bulk 0.18 9.86average 0.18
solids IN total g Al Ca Cl Co Cr Fe Mg Mn Ni Si Znfeed solids 8.00 0.12 0.06 0.01 0.00 0.04 0.74 1.50 0.02 0.13 1.50 0.00solution IN total g total ml Al Ca Cl Co Cr Fe Mg Mn Ni Si Znhead liquor 1592.80 1590.41 0.0 0.0 11.42 0.0 0.0 0.0 0.0 0.0 0.0 0.0 0.0wash water 196.23 196.62 - - - - - - - - - - -total IN (g) 1797.03 0.13 0.07 11.43 0.01 0.04 0.75 1.51 0.02 0.14 1.50 0.01
solids OUT total g Al Ca Cl Co Cr Fe Mg Mn Ni Si ZnTT17e-120 0.00 - - - - - - - - - - -TT17e-120bulk 6.78 0.10 0.05 0.01 0.00 0.04 0.58 1.14 0.01 0.07 1.29 0.00solution OUT total g total ml Al Ca Cl Co Cr Fe Mg Mn Ni Si ZnTT17e-120 22.33 22.28 0.000 0.000 0.170 0.000 0.000 0.002 0.004 0.000 0.001 0.001 0.000TT17e-120bulk 1543.70 1540.00 0.013 0.006 11.365 0.003 0.002 0.142 0.251 0.005 0.068 0.069 0.003wash water 189.22 189.52 0.000 0.000 0.095 0.000 0.000 0.000 0.000 0.000 0.001 0.000 0.000cake moisture 4.42 4.43 0.000 0.000 0.002 0.000 0.000 0.000 0.000 0.000 0.000 0.000 0.000evaporation 16.50 16.53 - - - - - - - - - - -total OUT (g) 1782.95 0.11 0.06 11.65 0.01 0.04 0.72 1.39 0.02 0.13 1.36 0.01
balance (out/in) 99% 90% 89% 102% 96% 102% 97% 92% 86% 97% 90% 96%
extraction (solution) Al Ca Co Cr Fe Mg Mn Ni Si Zn
TT17a-10 3% 10% 78% 4% 2% 1% 18% 8% 1% 78%TT17b-20 4% 9% 77% 4% 3% 1% 17% 11% 1% 77%TT17c-30 4% 9% 78% 4% 4% 2% 18% 14% 1% 78%TT17d-60 6% 10% 77% 4% 8% 5% 17% 25% 2% 77%TT17e-120 10% 10% 78% 4% 19% 16% 29% 49% 4% 78%TT17e-120bulk 11% 10% 78% 4% 19% 17% 30% 51% 5% 78%
extraction (solids) Al Ca Co Cr Fe Mg Mn Ni Si Zn
TT17a-10bulk 17% 23% 8% 7% 13% 14% 12% 20% 16% 8%TT17b-20bulk 17% 18% 6% 3% 10% 11% 10% 19% 13% 6%TT17c-30bulk 17% 21% 10% 2% 12% 11% 10% 22% 14% 10%TT17d-60bulk 17% 16% 8% 4% 13% 15% 17% 36% 10% 8%TT17e-120bulk 17% 16% 14% -3% 21% 23% 30% 51% 13% 14%
based on solids assayacid consumption g consumed kg/t ore Al Fe Mg Ni totalTT17e-120 1.07 134TT17e-120bulk 1.05 132acid equivalent (g) 0.09 0.32 1.09 0.09 1.59acid equivalent (%) 5.8 20.2 68.7 5.4 100.0
calc. total soln volume
calc. total solid massg
6.9
ml
1551.601551.60
0%
10%
20%
30%
40%50%
60%
70%
80%
90%
100%
0 20 40 60 80 100 120 140time (min)
extr
actio
n
Fe24%
Mg71%
Ni3%
Al2%
APPENDIX A - Leach Test Sheets
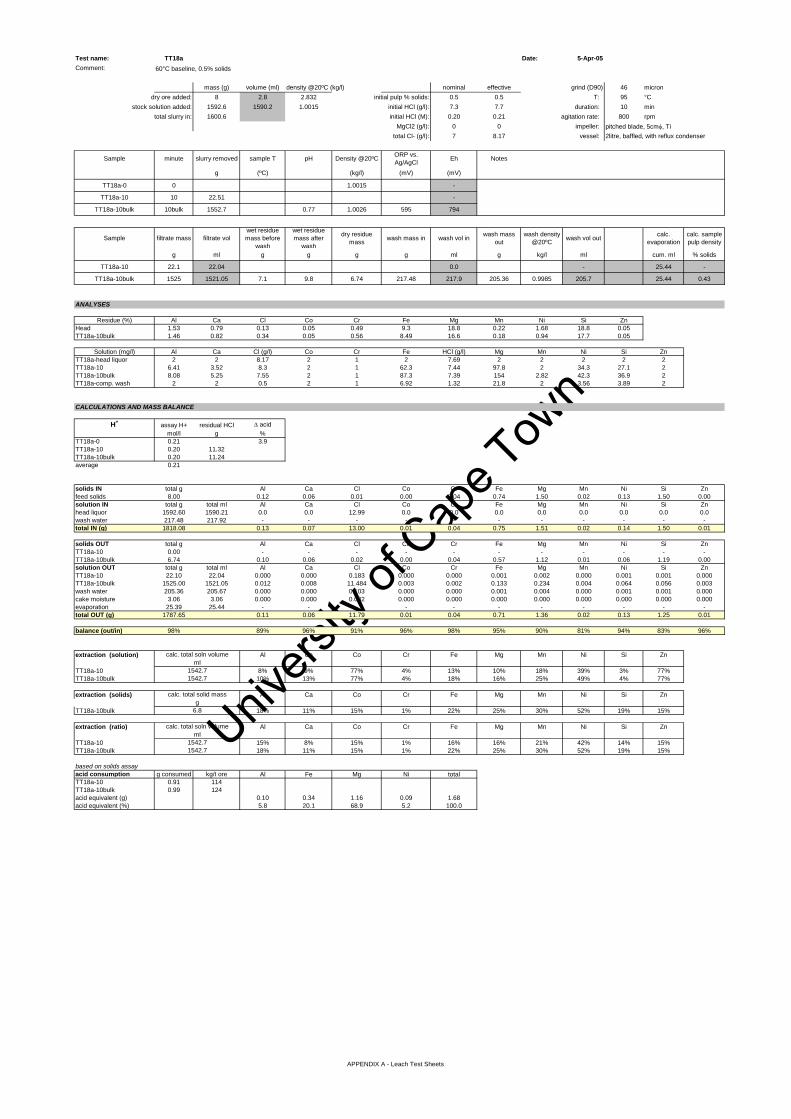
Univers
ity of
Cap
e Tow
n
Test name: TT18a Date: 5-Apr-05Comment: 60°C baseline, 0.5% solids
mass (g) volume (ml) density @20ºC (kg/l) nominal effective grind (D90) 46 microndry ore added: 8 2.8 2.832 initial pulp % solids: 0.5 0.5 T: 95 °C
stock solution added: 1592.6 1590.2 1.0015 initial HCl (g/l): 7.3 7.7 duration: 10 mintotal slurry in: 1600.6 initial HCl (M): 0.20 0.21 agitation rate: 800 rpm
MgCl2 (g/l): 0 0 impeller: pitched blade, 5cmφ, Titotal Cl- (g/l): 7 8.17 vessel: 2litre, baffled, with reflux condenser
Sample minute slurry removed sample T pH Density @20ºC ORP vs. Ag/AgCl Eh Notes
g (ºC) (kg/l) (mV) (mV)
TT18a-0 0 1.0015 -
TT18a-10 10 22.51 -
TT18a-10bulk 10bulk 1552.7 0.77 1.0026 595 794
Sample filtrate mass filtrate volwet residue mass before
wash
wet residue mass after
wash
dry residue mass wash mass in wash vol in wash mass
outwash density
@20ºC wash vol out calc. evaporation
calc. sample pulp density
g ml g g g g ml g kg/l ml cum. ml % solids
TT18a-10 22.1 22.04 0.0 - 25.44 -
TT18a-10bulk 1525 1521.05 7.1 9.8 6.74 217.48 217.9 205.36 0.9985 205.7 25.44 0.43
ANALYSES
Residue (%) Al Ca Cl Co Cr Fe Mg Mn Ni Si ZnHead 1.53 0.79 0.13 0.05 0.49 9.3 18.8 0.22 1.68 18.8 0.05TT18a-10bulk 1.46 0.82 0.34 0.05 0.56 8.49 16.6 0.18 0.94 17.7 0.05
Solution (mg/l) Al Ca Cl (g/l) Co Cr Fe HCl (g/l) Mg Mn Ni Si ZnTT18a-head liquor 2 2 8.17 2 1 2 7.69 2 2 2 2 2TT18a-10 6.41 3.52 8.3 2 1 62.3 7.44 97.8 2 34.3 27.1 2TT18a-10bulk 8.08 5.25 7.55 2 1 87.3 7.39 154 2.82 42.3 36.9 2TT18a-comp. wash 2 2 0.5 2 1 6.92 1.32 21.8 2 3.56 3.89 2
CALCULATIONS AND MASS BALANCE
H+ assay H+ residual HCl ∆ acidmol/l g %
TT18a-0 0.21 3.9TT18a-10 0.20 11.32TT18a-10bulk 0.20 11.24average 0.21
solids IN total g Al Ca Cl Co Cr Fe Mg Mn Ni Si Znfeed solids 8.00 0.12 0.06 0.01 0.00 0.04 0.74 1.50 0.02 0.13 1.50 0.00solution IN total g total ml Al Ca Cl Co Cr Fe Mg Mn Ni Si Znhead liquor 1592.60 1590.21 0.0 0.0 12.99 0.0 0.0 0.0 0.0 0.0 0.0 0.0 0.0wash water 217.48 217.92 - - - - - - - - - - -total IN (g) 1818.08 0.13 0.07 13.00 0.01 0.04 0.75 1.51 0.02 0.14 1.50 0.01
solids OUT total g Al Ca Cl Co Cr Fe Mg Mn Ni Si ZnTT18a-10 0.00 - - - - - - - - - - -TT18a-10bulk 6.74 0.10 0.06 0.02 0.00 0.04 0.57 1.12 0.01 0.06 1.19 0.00solution OUT total g total ml Al Ca Cl Co Cr Fe Mg Mn Ni Si ZnTT18a-10 22.10 22.04 0.000 0.000 0.183 0.000 0.000 0.001 0.002 0.000 0.001 0.001 0.000TT18a-10bulk 1525.00 1521.05 0.012 0.008 11.484 0.003 0.002 0.133 0.234 0.004 0.064 0.056 0.003wash water 205.36 205.67 0.000 0.000 0.103 0.000 0.000 0.001 0.004 0.000 0.001 0.001 0.000cake moisture 3.06 3.06 0.000 0.000 0.002 0.000 0.000 0.000 0.000 0.000 0.000 0.000 0.000evaporation 25.39 25.44 - - - - - - - - - - -total OUT (g) 1787.65 0.11 0.06 11.79 0.01 0.04 0.71 1.36 0.02 0.13 1.25 0.01
balance (out/in) 98% 89% 96% 91% 96% 98% 95% 90% 81% 94% 83% 96%
extraction (solution) Al Ca Co Cr Fe Mg Mn Ni Si Zn
TT18a-10 8% 9% 77% 4% 13% 10% 18% 39% 3% 77%TT18a-10bulk 10% 13% 77% 4% 18% 16% 25% 49% 4% 77%
extraction (solids) Al Ca Co Cr Fe Mg Mn Ni Si Zn
TT18a-10bulk 18% 11% 15% 1% 22% 25% 30% 52% 19% 15%
extraction (ratio) Al Ca Co Cr Fe Mg Mn Ni Si Zn
TT18a-10 15% 8% 15% 1% 16% 16% 21% 42% 14% 15%TT18a-10bulk 18% 11% 15% 1% 22% 25% 30% 52% 19% 15%
based on solids assayacid consumption g consumed kg/t ore Al Fe Mg Ni totalTT18a-10 0.91 114TT18a-10bulk 0.99 124acid equivalent (g) 0.10 0.34 1.16 0.09 1.68acid equivalent (%) 5.8 20.1 68.9 5.2 100.0
calc. total solid massg
1542.7
calc. total soln volumeml
1542.7
6.8
1542.7
calc. total soln volumeml
1542.7
APPENDIX A - Leach Test Sheets
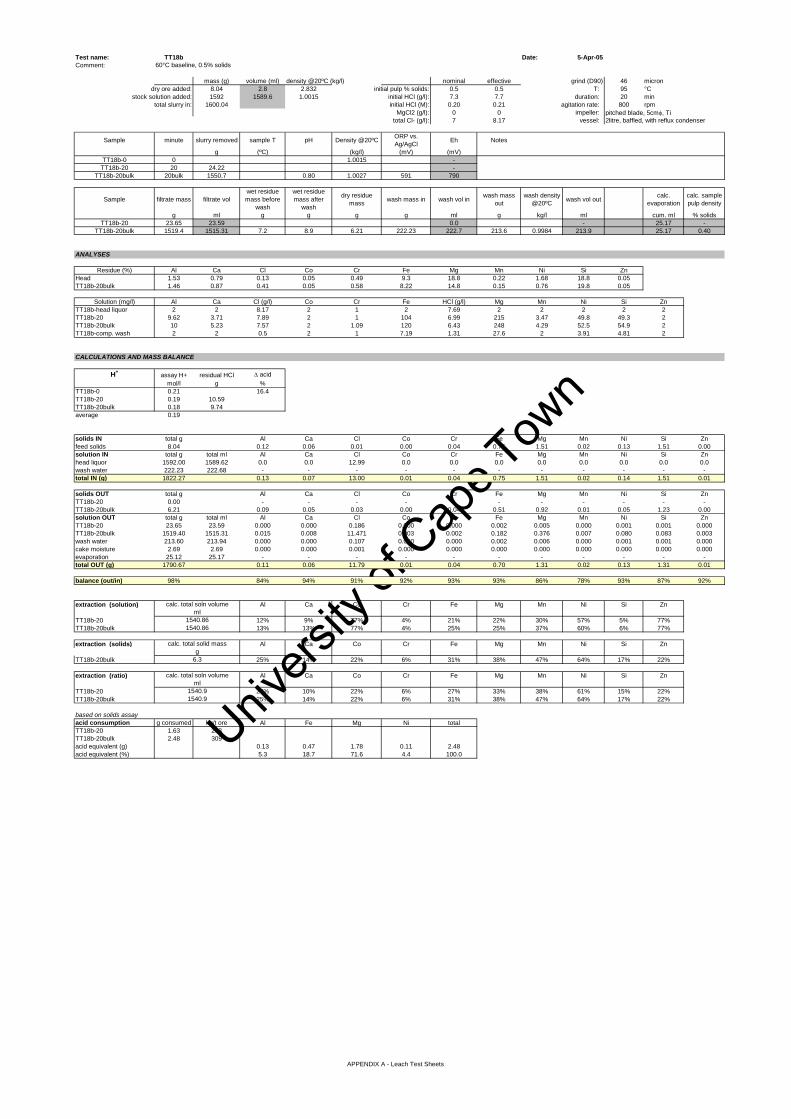
Univers
ity of
Cap
e Tow
n
Test name: TT18b Date: 5-Apr-05Comment: 60°C baseline, 0.5% solids
mass (g) volume (ml) density @20ºC (kg/l) nominal effective grind (D90) 46 microndry ore added: 8.04 2.8 2.832 initial pulp % solids: 0.5 0.5 T: 95 °C
stock solution added: 1592 1589.6 1.0015 initial HCl (g/l): 7.3 7.7 duration: 20 mintotal slurry in: 1600.04 initial HCl (M): 0.20 0.21 agitation rate: 800 rpm
MgCl2 (g/l): 0 0 impeller: pitched blade, 5cmφ, Titotal Cl- (g/l): 7 8.17 vessel: 2litre, baffled, with reflux condenser
Sample minute slurry removed sample T pH Density @20ºC ORP vs. Ag/AgCl Eh Notes
g (ºC) (kg/l) (mV) (mV)TT18b-0 0 1.0015 -
TT18b-20 20 24.22 -TT18b-20bulk 20bulk 1550.7 0.80 1.0027 591 790
Sample filtrate mass filtrate volwet residue mass before
wash
wet residue mass after
wash
dry residue mass wash mass in wash vol in wash mass
outwash density
@20ºC wash vol out calc. evaporation
calc. sample pulp density
g ml g g g g ml g kg/l ml cum. ml % solidsTT18b-20 23.65 23.59 0.0 - 25.17 -
TT18b-20bulk 1519.4 1515.31 7.2 8.9 6.21 222.23 222.7 213.6 0.9984 213.9 25.17 0.40
ANALYSES
Residue (%) Al Ca Cl Co Cr Fe Mg Mn Ni Si ZnHead 1.53 0.79 0.13 0.05 0.49 9.3 18.8 0.22 1.68 18.8 0.05TT18b-20bulk 1.46 0.87 0.41 0.05 0.58 8.22 14.8 0.15 0.76 19.8 0.05
Solution (mg/l) Al Ca Cl (g/l) Co Cr Fe HCl (g/l) Mg Mn Ni Si ZnTT18b-head liquor 2 2 8.17 2 1 2 7.69 2 2 2 2 2TT18b-20 9.62 3.71 7.89 2 1 104 6.99 215 3.47 49.8 49.3 2TT18b-20bulk 10 5.23 7.57 2 1.09 120 6.43 248 4.29 52.5 54.9 2TT18b-comp. wash 2 2 0.5 2 1 7.19 1.31 27.6 2 3.91 4.81 2
CALCULATIONS AND MASS BALANCE
H+ assay H+ residual HCl ∆ acidmol/l g %
TT18b-0 0.21 16.4TT18b-20 0.19 10.59TT18b-20bulk 0.18 9.74average 0.19
solids IN total g Al Ca Cl Co Cr Fe Mg Mn Ni Si Znfeed solids 8.04 0.12 0.06 0.01 0.00 0.04 0.75 1.51 0.02 0.13 1.51 0.00solution IN total g total ml Al Ca Cl Co Cr Fe Mg Mn Ni Si Znhead liquor 1592.00 1589.62 0.0 0.0 12.99 0.0 0.0 0.0 0.0 0.0 0.0 0.0 0.0wash water 222.23 222.68 - - - - - - - - - - -total IN (g) 1822.27 0.13 0.07 13.00 0.01 0.04 0.75 1.51 0.02 0.14 1.51 0.01
solids OUT total g Al Ca Cl Co Cr Fe Mg Mn Ni Si ZnTT18b-20 0.00 - - - - - - - - - - -TT18b-20bulk 6.21 0.09 0.05 0.03 0.00 0.04 0.51 0.92 0.01 0.05 1.23 0.00solution OUT total g total ml Al Ca Cl Co Cr Fe Mg Mn Ni Si ZnTT18b-20 23.65 23.59 0.000 0.000 0.186 0.000 0.000 0.002 0.005 0.000 0.001 0.001 0.000TT18b-20bulk 1519.40 1515.31 0.015 0.008 11.471 0.003 0.002 0.182 0.376 0.007 0.080 0.083 0.003wash water 213.60 213.94 0.000 0.000 0.107 0.000 0.000 0.002 0.006 0.000 0.001 0.001 0.000cake moisture 2.69 2.69 0.000 0.000 0.001 0.000 0.000 0.000 0.000 0.000 0.000 0.000 0.000evaporation 25.12 25.17 - - - - - - - - - - -total OUT (g) 1790.67 0.11 0.06 11.79 0.01 0.04 0.70 1.31 0.02 0.13 1.31 0.01
balance (out/in) 98% 84% 94% 91% 92% 93% 93% 86% 78% 93% 87% 92%
extraction (solution) Al Ca Co Cr Fe Mg Mn Ni Si Zn
TT18b-20 12% 9% 77% 4% 21% 22% 30% 57% 5% 77%TT18b-20bulk 13% 13% 77% 4% 25% 25% 37% 60% 6% 77%
extraction (solids) Al Ca Co Cr Fe Mg Mn Ni Si Zn
TT18b-20bulk 25% 14% 22% 6% 31% 38% 47% 64% 17% 22%
extraction (ratio) Al Ca Co Cr Fe Mg Mn Ni Si Zn
TT18b-20 24% 10% 22% 6% 27% 33% 38% 61% 15% 22%TT18b-20bulk 25% 14% 22% 6% 31% 38% 47% 64% 17% 22%
based on solids assayacid consumption g consumed kg/t ore Al Fe Mg Ni totalTT18b-20 1.63 203TT18b-20bulk 2.48 309acid equivalent (g) 0.13 0.47 1.78 0.11 2.48acid equivalent (%) 5.3 18.7 71.6 4.4 100.0
calc. total soln volumeml
1540.861540.86
calc. total solid massg
6.3
1540.9
calc. total soln volumeml
1540.9
APPENDIX A - Leach Test Sheets

Univers
ity of
Cap
e Tow
n
Test name: TT18c Date: 5-Apr-05Comment: 60°C baseline, 0.5% solids
mass (g) volume (ml) density @20ºC (kg/l) nominal effective grind (D90) 46 microndry ore added: 8.02 2.8 2.832 initial pulp % solids: 0.5 0.5 T: 95 °C
stock solution added: 1592.5 1590.1 1.0015 initial HCl (g/l): 7.3 7.7 duration: 30 mintotal slurry in: 1600.52 initial HCl (M): 0.20 0.21 agitation rate: 800 rpm
MgCl2 (g/l): 0 0 impeller: pitched blade, 5cmφ, Titotal Cl- (g/l): 7 8.17 vessel: 2litre, baffled, with reflux condenser
Sample minute slurry removed sample T pH Density @20ºC ORP vs. Ag/AgCl Eh Notes
g (ºC) (kg/l) (mV) (mV)TT18c-0 0 1.0015 -
TT18c-30 30 23.05 -TT18c-30bulk 30bulk 1536.9 0.81 1.0030 586 785
Sample filtrate mass filtrate volwet residue mass before
wash
wet residue mass after
wash
dry residue mass wash mass in wash vol in wash mass
outwash density
@20ºC wash vol out calc. evaporation
calc. sample pulp density
g ml g g g g ml g kg/l ml cum. ml % solidsTT18c-30 22.31 22.24 0.0 - 40.65 -
TT18c-30bulk 1501.8 1497.31 12.9 4.8 5.73 214.71 215.1 200.86 0.9986 201.1 40.65 0.37
ANALYSES
Residue (%) Al Ca Cl Co Cr Fe Mg Mn Ni Si ZnHead 1.53 0.79 0.13 0.05 0.49 9.3 18.8 0.22 1.68 18.8 0.05TT18c-30bulk 1.35 0.79 0.34 0.05 0.55 7.58 12.9 0.11 0.62 18.7 0.06
Solution (mg/l) Al Ca Cl (g/l) Co Cr Fe HCl (g/l) Mg Mn Ni Si ZnTT18c-head liquor 2 2 8.17 2 1 2 7.69 2 2 2 2 2TT18c-30 11 3.9 7.37 2 1.06 128 6.51 266 4.53 57.4 59.8 2TT18c-30bulk 11.3 5.6 7.74 2 1.15 140 6.78 309 5.45 57.9 67.7 2TT18c-comp. wash 2 2 0.5 2 1 12.1 1.93 37.1 2 5.02 7.54 2
CALCULATIONS AND MASS BALANCE
H+ assay H+ residual HCl ∆ acidmol/l g %
TT18c-0 0.21 11.8TT18c-30 0.18 9.75TT18c-30bulk 0.19 10.15average 0.19
solids IN total g Al Ca Cl Co Cr Fe Mg Mn Ni Si Znfeed solids 8.02 0.12 0.06 0.01 0.00 0.04 0.75 1.51 0.02 0.13 1.50 0.00solution IN total g total ml Al Ca Cl Co Cr Fe Mg Mn Ni Si Znhead liquor 1592.50 1590.11 0.0 0.0 12.99 0.0 0.0 0.0 0.0 0.0 0.0 0.0 0.0wash water 214.71 215.14 - - - - - - - - - - -total IN (g) 1815.23 0.13 0.07 13.00 0.01 0.04 0.75 1.51 0.02 0.14 1.51 0.01
solids OUT total g Al Ca Cl Co Cr Fe Mg Mn Ni Si ZnTT18c-30 0.00 - - - - - - - - - - -TT18c-30bulk 5.73 0.08 0.05 0.02 0.00 0.03 0.43 0.74 0.01 0.04 1.07 0.00solution OUT total g total ml Al Ca Cl Co Cr Fe Mg Mn Ni Si ZnTT18c-30 22.31 22.24 0.000 0.000 0.164 0.000 0.000 0.003 0.006 0.000 0.001 0.001 0.000TT18c-30bulk 1501.80 1497.31 0.017 0.008 11.589 0.003 0.002 0.210 0.463 0.008 0.087 0.101 0.003wash water 200.86 201.14 0.000 0.000 0.101 0.000 0.000 0.002 0.007 0.000 0.001 0.002 0.000cake moisture -0.93 -0.93 0.000 0.000 0.000 0.000 0.000 0.000 0.000 0.000 0.000 0.000 0.000evaporation 40.57 40.65 - - - - - - - - - - -total OUT (g) 1770.34 0.09 0.05 11.87 0.01 0.03 0.65 1.22 0.01 0.12 1.18 0.01
balance (out/in) 98% 75% 81% 91% 88% 83% 87% 80% 72% 91% 78% 96%
extraction (solution) Al Ca Co Cr Fe Mg Mn Ni Si Zn
TT18c-30 14% 9% 76% 4% 26% 27% 39% 65% 6% 76%TT18c-30bulk 14% 13% 76% 5% 29% 31% 47% 66% 7% 76%
extraction (solids) Al Ca Co Cr Fe Mg Mn Ni Si Zn
TT18c-30bulk 36% 27% 27% 18% 41% 50% 64% 73% 28% 13%
extraction (ratio) Al Ca Co Cr Fe Mg Mn Ni Si Zn
TT18c-30 35% 19% 27% 16% 37% 43% 53% 73% 24% 13%TT18c-30bulk 36% 27% 27% 18% 41% 50% 64% 73% 28% 13%
based on solids assayacid consumption g consumed kg/t ore Al Fe Mg Ni totalTT18c-30 2.48 309TT18c-30bulk 2.08 259acid equivalent (g) 0.18 0.61 2.31 0.12 3.22acid equivalent (%) 5.7 19.0 71.5 3.8 100.0
calc. total soln volumeml
5.8
calc. total soln volumeml
1527.221527.22
calc. total solid massg
1527.21527.2
APPENDIX A - Leach Test Sheets
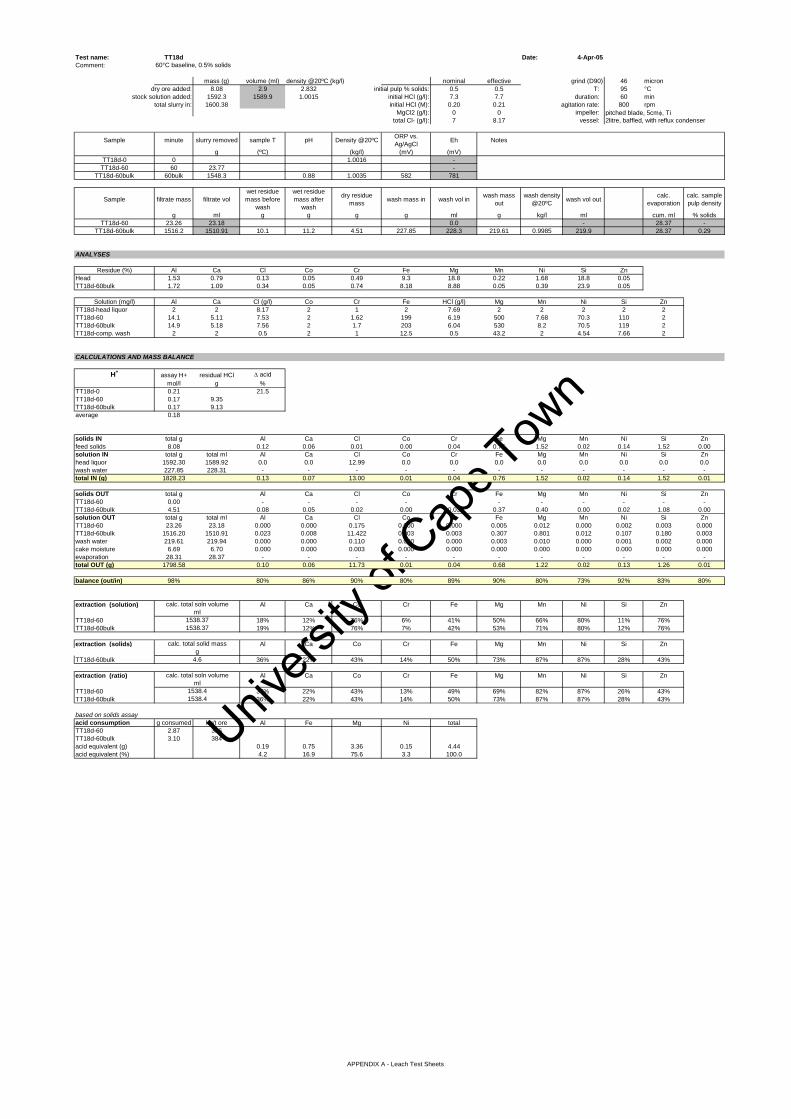
Univers
ity of
Cap
e Tow
n
Test name: TT18d Date: 4-Apr-05Comment: 60°C baseline, 0.5% solids
mass (g) volume (ml) density @20ºC (kg/l) nominal effective grind (D90) 46 microndry ore added: 8.08 2.9 2.832 initial pulp % solids: 0.5 0.5 T: 95 °C
stock solution added: 1592.3 1589.9 1.0015 initial HCl (g/l): 7.3 7.7 duration: 60 mintotal slurry in: 1600.38 initial HCl (M): 0.20 0.21 agitation rate: 800 rpm
MgCl2 (g/l): 0 0 impeller: pitched blade, 5cmφ, Titotal Cl- (g/l): 7 8.17 vessel: 2litre, baffled, with reflux condenser
Sample minute slurry removed sample T pH Density @20ºC ORP vs. Ag/AgCl Eh Notes
g (ºC) (kg/l) (mV) (mV)TT18d-0 0 1.0016 -
TT18d-60 60 23.77 -TT18d-60bulk 60bulk 1548.3 0.88 1.0035 582 781
Sample filtrate mass filtrate volwet residue mass before
wash
wet residue mass after
wash
dry residue mass wash mass in wash vol in wash mass
outwash density
@20ºC wash vol out calc. evaporation
calc. sample pulp density
g ml g g g g ml g kg/l ml cum. ml % solidsTT18d-60 23.26 23.18 0.0 - 28.37 -
TT18d-60bulk 1516.2 1510.91 10.1 11.2 4.51 227.85 228.3 219.61 0.9985 219.9 28.37 0.29
ANALYSES
Residue (%) Al Ca Cl Co Cr Fe Mg Mn Ni Si ZnHead 1.53 0.79 0.13 0.05 0.49 9.3 18.8 0.22 1.68 18.8 0.05TT18d-60bulk 1.72 1.09 0.34 0.05 0.74 8.18 8.88 0.05 0.39 23.9 0.05
Solution (mg/l) Al Ca Cl (g/l) Co Cr Fe HCl (g/l) Mg Mn Ni Si ZnTT18d-head liquor 2 2 8.17 2 1 2 7.69 2 2 2 2 2TT18d-60 14.1 5.11 7.53 2 1.62 199 6.19 500 7.68 70.3 110 2TT18d-60bulk 14.9 5.18 7.56 2 1.7 203 6.04 530 8.2 70.5 119 2TT18d-comp. wash 2 2 0.5 2 1 12.5 0.5 43.2 2 4.54 7.66 2
CALCULATIONS AND MASS BALANCE
H+ assay H+ residual HCl ∆ acidmol/l g %
TT18d-0 0.21 21.5TT18d-60 0.17 9.35TT18d-60bulk 0.17 9.13average 0.18
solids IN total g Al Ca Cl Co Cr Fe Mg Mn Ni Si Znfeed solids 8.08 0.12 0.06 0.01 0.00 0.04 0.75 1.52 0.02 0.14 1.52 0.00solution IN total g total ml Al Ca Cl Co Cr Fe Mg Mn Ni Si Znhead liquor 1592.30 1589.92 0.0 0.0 12.99 0.0 0.0 0.0 0.0 0.0 0.0 0.0 0.0wash water 227.85 228.31 - - - - - - - - - - -total IN (g) 1828.23 0.13 0.07 13.00 0.01 0.04 0.76 1.52 0.02 0.14 1.52 0.01
solids OUT total g Al Ca Cl Co Cr Fe Mg Mn Ni Si ZnTT18d-60 0.00 - - - - - - - - - - -TT18d-60bulk 4.51 0.08 0.05 0.02 0.00 0.03 0.37 0.40 0.00 0.02 1.08 0.00solution OUT total g total ml Al Ca Cl Co Cr Fe Mg Mn Ni Si ZnTT18d-60 23.26 23.18 0.000 0.000 0.175 0.000 0.000 0.005 0.012 0.000 0.002 0.003 0.000TT18d-60bulk 1516.20 1510.91 0.023 0.008 11.422 0.003 0.003 0.307 0.801 0.012 0.107 0.180 0.003wash water 219.61 219.94 0.000 0.000 0.110 0.000 0.000 0.003 0.010 0.000 0.001 0.002 0.000cake moisture 6.69 6.70 0.000 0.000 0.003 0.000 0.000 0.000 0.000 0.000 0.000 0.000 0.000evaporation 28.31 28.37 - - - - - - - - - - -total OUT (g) 1798.58 0.10 0.06 11.73 0.01 0.04 0.68 1.22 0.02 0.13 1.26 0.01
balance (out/in) 98% 80% 86% 90% 80% 89% 90% 80% 73% 92% 83% 80%
extraction (solution) Al Ca Co Cr Fe Mg Mn Ni Si Zn
TT18d-60 18% 12% 76% 6% 41% 50% 66% 80% 11% 76%TT18d-60bulk 19% 12% 76% 7% 42% 53% 71% 80% 12% 76%
extraction (solids) Al Ca Co Cr Fe Mg Mn Ni Si Zn
TT18d-60bulk 36% 22% 43% 14% 50% 73% 87% 87% 28% 43%
extraction (ratio) Al Ca Co Cr Fe Mg Mn Ni Si Zn
TT18d-60 34% 22% 43% 13% 49% 69% 82% 87% 26% 43%TT18d-60bulk 36% 22% 43% 14% 50% 73% 87% 87% 28% 43%
based on solids assayacid consumption g consumed kg/t ore Al Fe Mg Ni totalTT18d-60 2.87 356TT18d-60bulk 3.10 384acid equivalent (g) 0.19 0.75 3.36 0.15 4.44acid equivalent (%) 4.2 16.9 75.6 3.3 100.0
1538.371538.37
calc. total solid mass
calc. total soln volumeml
1538.41538.4
g4.6
calc. total soln volumeml
APPENDIX A - Leach Test Sheets
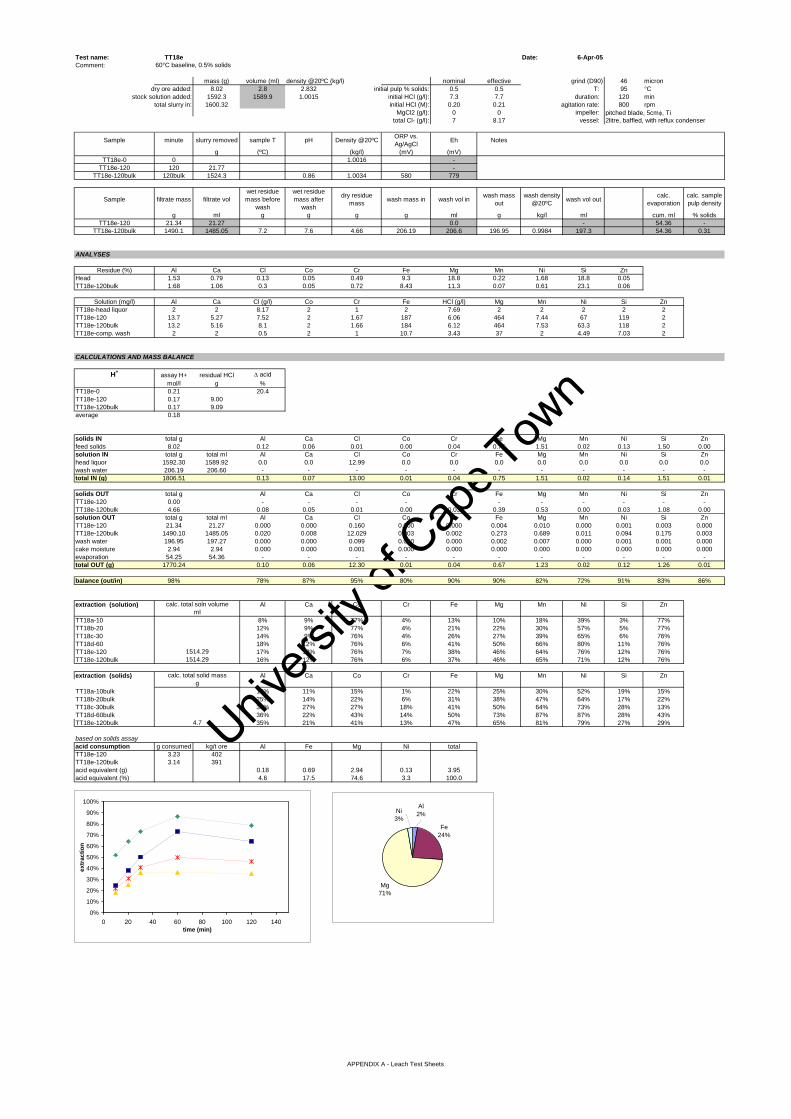
Univers
ity of
Cap
e Tow
n
Test name: TT18e Date: 6-Apr-05Comment: 60°C baseline, 0.5% solids
mass (g) volume (ml) density @20ºC (kg/l) nominal effective grind (D90) 46 microndry ore added: 8.02 2.8 2.832 initial pulp % solids: 0.5 0.5 T: 95 °C
stock solution added: 1592.3 1589.9 1.0015 initial HCl (g/l): 7.3 7.7 duration: 120 mintotal slurry in: 1600.32 initial HCl (M): 0.20 0.21 agitation rate: 800 rpm
MgCl2 (g/l): 0 0 impeller: pitched blade, 5cmφ, Titotal Cl- (g/l): 7 8.17 vessel: 2litre, baffled, with reflux condenser
Sample minute slurry removed sample T pH Density @20ºC ORP vs. Ag/AgCl Eh Notes
g (ºC) (kg/l) (mV) (mV)TT18e-0 0 1.0016 -
TT18e-120 120 21.77 -TT18e-120bulk 120bulk 1524.3 0.86 1.0034 580 779
Sample filtrate mass filtrate volwet residue mass before
wash
wet residue mass after
wash
dry residue mass wash mass in wash vol in wash mass
outwash density
@20ºC wash vol out calc. evaporation
calc. sample pulp density
g ml g g g g ml g kg/l ml cum. ml % solidsTT18e-120 21.34 21.27 0.0 - 54.36 -
TT18e-120bulk 1490.1 1485.05 7.2 7.6 4.66 206.19 206.6 196.95 0.9984 197.3 54.36 0.31
ANALYSES
Residue (%) Al Ca Cl Co Cr Fe Mg Mn Ni Si ZnHead 1.53 0.79 0.13 0.05 0.49 9.3 18.8 0.22 1.68 18.8 0.05TT18e-120bulk 1.68 1.06 0.3 0.05 0.72 8.43 11.3 0.07 0.61 23.1 0.06
Solution (mg/l) Al Ca Cl (g/l) Co Cr Fe HCl (g/l) Mg Mn Ni Si ZnTT18e-head liquor 2 2 8.17 2 1 2 7.69 2 2 2 2 2TT18e-120 13.7 5.27 7.52 2 1.67 187 6.06 464 7.44 67 119 2TT18e-120bulk 13.2 5.16 8.1 2 1.66 184 6.12 464 7.53 63.3 118 2TT18e-comp. wash 2 2 0.5 2 1 10.7 3.43 37 2 4.49 7.03 2
CALCULATIONS AND MASS BALANCE
H+ assay H+ residual HCl ∆ acidmol/l g %
TT18e-0 0.21 20.4TT18e-120 0.17 9.00TT18e-120bulk 0.17 9.09average 0.18
solids IN total g Al Ca Cl Co Cr Fe Mg Mn Ni Si Znfeed solids 8.02 0.12 0.06 0.01 0.00 0.04 0.75 1.51 0.02 0.13 1.50 0.00solution IN total g total ml Al Ca Cl Co Cr Fe Mg Mn Ni Si Znhead liquor 1592.30 1589.92 0.0 0.0 12.99 0.0 0.0 0.0 0.0 0.0 0.0 0.0 0.0wash water 206.19 206.60 - - - - - - - - - - -total IN (g) 1806.51 0.13 0.07 13.00 0.01 0.04 0.75 1.51 0.02 0.14 1.51 0.01
solids OUT total g Al Ca Cl Co Cr Fe Mg Mn Ni Si ZnTT18e-120 0.00 - - - - - - - - - - -TT18e-120bulk 4.66 0.08 0.05 0.01 0.00 0.03 0.39 0.53 0.00 0.03 1.08 0.00solution OUT total g total ml Al Ca Cl Co Cr Fe Mg Mn Ni Si ZnTT18e-120 21.34 21.27 0.000 0.000 0.160 0.000 0.000 0.004 0.010 0.000 0.001 0.003 0.000TT18e-120bulk 1490.10 1485.05 0.020 0.008 12.029 0.003 0.002 0.273 0.689 0.011 0.094 0.175 0.003wash water 196.95 197.27 0.000 0.000 0.099 0.000 0.000 0.002 0.007 0.000 0.001 0.001 0.000cake moisture 2.94 2.94 0.000 0.000 0.001 0.000 0.000 0.000 0.000 0.000 0.000 0.000 0.000evaporation 54.25 54.36 - - - - - - - - - - -total OUT (g) 1770.24 0.10 0.06 12.30 0.01 0.04 0.67 1.23 0.02 0.12 1.26 0.01
balance (out/in) 98% 78% 87% 95% 80% 90% 90% 82% 72% 91% 83% 86%
extraction (solution) Al Ca Co Cr Fe Mg Mn Ni Si Zn
TT18a-10 8% 9% 77% 4% 13% 10% 18% 39% 3% 77%TT18b-20 12% 9% 77% 4% 21% 22% 30% 57% 5% 77%TT18c-30 14% 9% 76% 4% 26% 27% 39% 65% 6% 76%TT18d-60 18% 12% 76% 6% 41% 50% 66% 80% 11% 76%TT18e-120 17% 13% 76% 7% 38% 46% 64% 76% 12% 76%TT18e-120bulk 16% 12% 76% 6% 37% 46% 65% 71% 12% 76%
extraction (solids) Al Ca Co Cr Fe Mg Mn Ni Si Zn
TT18a-10bulk 18% 11% 15% 1% 22% 25% 30% 52% 19% 15%TT18b-20bulk 25% 14% 22% 6% 31% 38% 47% 64% 17% 22%TT18c-30bulk 36% 27% 27% 18% 41% 50% 64% 73% 28% 13%TT18d-60bulk 36% 22% 43% 14% 50% 73% 87% 87% 28% 43%TT18e-120bulk 35% 21% 41% 13% 47% 65% 81% 79% 27% 29%
based on solids assayacid consumption g consumed kg/t ore Al Fe Mg Ni totalTT18e-120 3.23 402TT18e-120bulk 3.14 391acid equivalent (g) 0.18 0.69 2.94 0.13 3.95acid equivalent (%) 4.6 17.5 74.6 3.3 100.0
calc. total soln volume
calc. total solid massg
4.7
ml
1514.291514.29
0%
10%
20%
30%
40%
50%
60%
70%
80%
90%
100%
0 20 40 60 80 100 120 140time (min)
extr
actio
n
Fe24%
Mg71%
Ni3%
Al2%
APPENDIX A - Leach Test Sheets

Univers
ity of
Cap
e Tow
n
Test name: PST19a Date: 14-Apr-05Comment: 106µm, 0.5% solids
mass (g) volume (ml) density @20ºC (kg/l) nominal effective grind (D90) 106 microndry ore added: 8.03 2.8 2.832 initial pulp % solids: 0.5 0.5 T: 80 °C
stock solution added: 1592.1 1588.9 1.002 initial HCl (g/l): 7.3 6.7 duration: 10 mintotal slurry in: 1600.13 initial HCl (M): 0.20 0.18 agitation rate: 800 rpm
MgCl2 (g/l): 0 0 impeller: pitched blade, 5cmφ, Titotal Cl- (g/l): 7 7.4 vessel: 2litre, baffled, with reflux condenser
Sample minute slurry removed sample T pH Density @20ºC ORP vs. Ag/AgCl Eh Notes
g (ºC) (kg/l) (mV) (mV)
PST19a-0 0 1.002 -
PST19a-10 10 21.06 -
PST19a-10bulk 10bulk 1561.3 0.77 1.0018 616 815
Sample filtrate mass filtrate volwet residue mass before
wash
wet residue mass after
wash
dry residue mass wash mass in wash vol in wash mass
outwash density
@20ºC wash vol out calc. evaporation
calc. sample pulp density
g ml g g g g ml g kg/l ml cum. ml % solids
PST19a-10 19.96 19.92 0.0 - 17.81 -
PST19a-10bulk 1521.4 1518.67 17.23 17.8 6.8 202.55 203.0 196.77 0.9983 197.1 17.81 0.44
ANALYSES
Residue (%) Al Ca Cl Co Cr Fe Mg Mn Ni Si ZnHead 1.53 0.79 0.13 0.05 0.49 9.3 18.8 0.22 1.68 18.8 0.05PST19a-10bulk 1.69 0.59 0.11 0.05 0.66 9.7 15.3 0.15 1.16 19.3 0.05
Solution (mg/l) Al Ca Cl (g/l) Co Cr Fe HCl (g/l) Mg Mn Ni Si ZnPST19a-head liquor 2 2.59 7.4 2 1 2 6.73 2 2 2 2 2PST19a-10 6.22 2 7.44 2 1 50.1 6.32 73.4 2 28.9 26.8 2PST19a-10bulk 8.14 2.6 7.56 2 1 76.7 6.43 124 2 40.5 40.2 2PST19a-comp. wash 2 2 0.5 2 1 9.39 0.5 22.4 2 3.27 8.83 2
CALCULATIONS AND MASS BALANCE
H+ assay H+ residual HCl ∆ acidmol/l g %
PST19a-0 0.18 4.5PST19a-10 0.17 9.60PST19a-10bulk 0.18 9.77average 0.18
solids IN total g Al Ca Cl Co Cr Fe Mg Mn Ni Si Znfeed solids 8.03 0.12 0.06 0.01 0.00 0.04 0.75 1.51 0.02 0.13 1.51 0.00solution IN total g total ml Al Ca Cl Co Cr Fe Mg Mn Ni Si Znhead liquor 1592.10 1588.92 0.0 0.0 11.76 0.0 0.0 0.0 0.0 0.0 0.0 0.0 0.0wash water 202.55 202.96 - - - - - - - - - - -total IN (g) 1802.68 0.13 0.07 11.77 0.01 0.04 0.75 1.51 0.02 0.14 1.51 0.01
solids OUT total g Al Ca Cl Co Cr Fe Mg Mn Ni Si ZnPST19a-10 0.00 - - - - - - - - - - -PST19a-10bulk 6.80 0.11 0.04 0.01 0.00 0.04 0.66 1.04 0.01 0.08 1.31 0.00solution OUT total g total ml Al Ca Cl Co Cr Fe Mg Mn Ni Si ZnPST19a-10 19.96 19.92 0.000 0.000 0.148 0.000 0.000 0.001 0.001 0.000 0.001 0.001 0.000PST19a-10bulk 1521.40 1518.67 0.012 0.004 11.481 0.003 0.002 0.116 0.188 0.003 0.062 0.061 0.003wash water 196.77 197.11 0.000 0.000 0.099 0.000 0.000 0.002 0.004 0.000 0.001 0.002 0.000cake moisture 11.00 11.02 0.000 0.000 0.006 0.000 0.000 0.000 0.000 0.000 0.000 0.000 0.000evaporation 17.77 17.81 - - - - - - - - - - -total OUT (g) 1773.70 0.13 0.04 11.74 0.01 0.05 0.78 1.23 0.01 0.14 1.38 0.01
balance (out/in) 98% 101% 66% 100% 96% 115% 104% 82% 66% 103% 91% 96%
extraction (solution) Al Ca Co Cr Fe Mg Mn Ni Si Zn
PST19a-10 8% 5% 77% 4% 10% 7% 18% 33% 3% 77%PST19a-10bulk 10% 6% 77% 4% 16% 13% 18% 47% 4% 77%
extraction (solids) Al Ca Co Cr Fe Mg Mn Ni Si Zn
PST19a-10bulk 5% 36% 14% -17% 11% 30% 41% 41% 12% 14%
extraction (ratio) Al Ca Co Cr Fe Mg Mn Ni Si Zn
PST19a-10 4% 28% 14% -17% 7% 18% 41% 29% 8% 14%PST19a-10bulk 5% 36% 14% -17% 11% 30% 41% 41% 12% 14%
based on solids assayacid consumption g consumed kg/t ore Al Fe Mg Ni totalPST19a-10 1.10 136PST19a-10bulk 0.93 116acid equivalent (g) 0.03 0.17 1.41 0.07 1.68acid equivalent (%) 1.9 10.2 83.8 4.1 100.0
calc. total solid massg
1551.2
calc. total soln volumeml
1551.2
6.9
1551.2
calc. total soln volumeml
1551.2
APPENDIX A - Leach Test Sheets

Univers
ity of
Cap
e Tow
n
Test name: PST19b Date: 14-Apr-05Comment: 106mm, 0.5% solids
mass (g) volume (ml) density @20ºC (kg/l) nominal effective grind (D90) 106 microndry ore added: 8 2.8 2.832 initial pulp % solids: 0.5 0.5 T: 80 °C
stock solution added: 1592 1588.8 1.002 initial HCl (g/l): 7.3 6.7 duration: 20 mintotal slurry in: 1600 initial HCl (M): 0.20 0.18 agitation rate: 800 rpm
MgCl2 (g/l): 0 0 impeller: pitched blade, 5cmφ, Titotal Cl- (g/l): 7 7.4 vessel: 2litre, baffled, with reflux condenser
Sample minute slurry removed sample T pH Density @20ºC ORP vs. Ag/AgCl Eh Notes
g (ºC) (kg/l) (mV) (mV)PST19b-0 0 1.002 -
PST19b-20 20 23.48 -PST19b-20bulk 20bulk 1559.1 0.77 1.0021 593 792
Sample filtrate mass filtrate volwet residue mass before
wash
wet residue mass after
wash
dry residue mass wash mass in wash vol in wash mass
outwash density
@20ºC wash vol out calc. evaporation
calc. sample pulp density
g ml g g g g ml g kg/l ml cum. ml % solidsPST19b-20 22.7 22.65 0.0 - 17.45 -
PST19b-20bulk 1522.5 1519.31 16.7 16.8 6.6 211.06 211.5 207.37 0.9984 207.7 17.45 0.42
ANALYSES
Residue (%) Al Ca Cl Co Cr Fe Mg Mn Ni Si ZnHead 1.53 0.79 0.13 0.05 0.49 9.3 18.8 0.22 1.68 18.8 0.05PST19b-20bulk 1.74 0.61 0.11 0.05 0.69 9.61 15.3 0.14 1.07 19.9 0.05
Solution (mg/l) Al Ca Cl (g/l) Co Cr Fe HCl (g/l) Mg Mn Ni Si ZnPST19b-head liquor 2 2.59 7.4 2 1 2 6.73 2 2 2 2 2PST19b-20 7.68 2 8.07 2 1 69.1 6.39 113 2 37.6 37.1 2PST19b-20bulk 9.46 2 7.47 2 1 94 6.42 162 2.44 48.5 48.9 2PST19b-comp. wash 2 2 0.5 2 1 10.4 0.5 28.3 2 3.82 8.33 2
CALCULATIONS AND MASS BALANCE
H+ assay H+ residual HCl ∆ acidmol/l g %
PST19b-0 0.18 4.6PST19b-20 0.18 9.71PST19b-20bulk 0.18 9.75average 0.18
solids IN total g Al Ca Cl Co Cr Fe Mg Mn Ni Si Znfeed solids 8.00 0.12 0.06 0.01 0.00 0.04 0.74 1.50 0.02 0.13 1.50 0.00solution IN total g total ml Al Ca Cl Co Cr Fe Mg Mn Ni Si Znhead liquor 1592.00 1588.82 0.0 0.0 11.76 0.0 0.0 0.0 0.0 0.0 0.0 0.0 0.0wash water 211.06 211.48 - - - - - - - - - - -total IN (g) 1811.06 0.13 0.07 11.77 0.01 0.04 0.75 1.51 0.02 0.14 1.50 0.01
solids OUT total g Al Ca Cl Co Cr Fe Mg Mn Ni Si ZnPST19b-20 0.00 - - - - - - - - - - -PST19b-20bulk 6.60 0.11 0.04 0.01 0.00 0.05 0.63 1.01 0.01 0.07 1.31 0.00solution OUT total g total ml Al Ca Cl Co Cr Fe Mg Mn Ni Si ZnPST19b-20 22.70 22.65 0.000 0.000 0.183 0.000 0.000 0.002 0.003 0.000 0.001 0.001 0.000PST19b-20bulk 1522.50 1519.31 0.014 0.003 11.349 0.003 0.002 0.143 0.246 0.004 0.074 0.074 0.003wash water 207.37 207.70 0.000 0.000 0.104 0.000 0.000 0.002 0.006 0.000 0.001 0.002 0.000cake moisture 10.20 10.22 0.000 0.000 0.005 0.000 0.000 0.000 0.000 0.000 0.000 0.000 0.000evaporation 17.42 17.45 - - - - - - - - - - -total OUT (g) 1786.79 0.13 0.04 11.65 0.01 0.05 0.78 1.26 0.01 0.15 1.39 0.01
balance (out/in) 99% 103% 65% 99% 95% 117% 104% 84% 65% 106% 92% 95%
extraction (solution) Al Ca Co Cr Fe Mg Mn Ni Si Zn
PST19b-20 10% 5% 77% 4% 14% 11% 18% 43% 4% 77%PST19b-20bulk 12% 5% 77% 4% 20% 16% 21% 56% 5% 77%
extraction (solids) Al Ca Co Cr Fe Mg Mn Ni Si Zn
PST19b-20bulk 5% 35% 16% -19% 14% 32% 47% 47% 11% 16%
extraction (ratio) Al Ca Co Cr Fe Mg Mn Ni Si Zn
PST19b-20 4% 35% 16% -19% 10% 22% 38% 36% 8% 16%PST19b-20bulk 5% 35% 16% -19% 14% 32% 47% 47% 11% 16%
based on solids assayacid consumption g consumed kg/t ore Al Fe Mg Ni totalPST19b-20 0.98 123PST19b-20bulk 0.94 117acid equivalent (g) 0.03 0.22 1.48 0.08 1.81acid equivalent (%) 1.7 11.9 82.0 4.4 100.0
calc. total soln volumeml
1548.721548.72
calc. total solid massg
6.7
1548.7
calc. total soln volumeml
1548.7
APPENDIX A - Leach Test Sheets

Univers
ity of
Cap
e Tow
n
Test name: PST19c Date: 14-Apr-05Comment: 106mm, 0.5% solids
mass (g) volume (ml) density @20ºC (kg/l) nominal effective grind (D90) 106 microndry ore added: 8.03 2.8 2.832 initial pulp % solids: 0.5 0.5 T: 80 °C
stock solution added: 1592.3 1589.1 1.002 initial HCl (g/l): 7.3 6.7 duration: 30 mintotal slurry in: 1600.33 initial HCl (M): 0.20 0.18 agitation rate: 800 rpm
MgCl2 (g/l): 0 0 impeller: pitched blade, 5cmφ, Titotal Cl- (g/l): 7 7.4 vessel: 2litre, baffled, with reflux condenser
Sample minute slurry removed sample T pH Density @20ºC ORP vs. Ag/AgCl Eh Notes
g (ºC) (kg/l) (mV) (mV)PST19c-0 0 1.002 -
PST19c-30 30 23.53 -PST19c-30bulk 30bulk 1558.1 0.80 1.0021 611 810
Sample filtrate mass filtrate volwet residue mass before
wash
wet residue mass after
wash
dry residue mass wash mass in wash vol in wash mass
outwash density
@20ºC wash vol out calc. evaporation
calc. sample pulp density
g ml g g g g ml g kg/l ml cum. ml % solidsPST19c-30 22.8 22.75 0.0 - 18.74 -
PST19c-30bulk 1518.9 1515.72 17.53 16.3 6.18 202.15 202.6 195.96 0.9982 196.3 18.74 0.40
ANALYSES
Residue (%) Al Ca Cl Co Cr Fe Mg Mn Ni Si ZnHead 1.53 0.79 0.13 0.05 0.49 9.3 18.8 0.22 1.68 18.8 0.05PST19c-30bulk 1.68 0.63 0.11 0.05 0.67 9.74 14 0.13 0.9 20.8 0.05
Solution (mg/l) Al Ca Cl (g/l) Co Cr Fe HCl (g/l) Mg Mn Ni Si ZnPST19c-head liquor 2 2.59 7.4 2 1 2 6.73 2 2 2 2 2PST19c-30 9.99 2 7.29 2 1 104 6.11 194 2.66 51.4 56.9 2PST19c-30bulk 11.7 2 7.48 2 1 129 6.11 248 3.3 60.3 68.3 2PST19c-comp. wash 2 2 0.5 2 1 14.1 0.5 38.6 2 4.57 10.7 2
CALCULATIONS AND MASS BALANCE
H+ assay H+ residual HCl ∆ acidmol/l g %
PST19c-0 0.18 9.2PST19c-30 0.17 9.26PST19c-30bulk 0.17 9.26average 0.17
solids IN total g Al Ca Cl Co Cr Fe Mg Mn Ni Si Znfeed solids 8.03 0.12 0.06 0.01 0.00 0.04 0.75 1.51 0.02 0.13 1.51 0.00solution IN total g total ml Al Ca Cl Co Cr Fe Mg Mn Ni Si Znhead liquor 1592.30 1589.12 0.0 0.0 11.76 0.0 0.0 0.0 0.0 0.0 0.0 0.0 0.0wash water 202.15 202.56 - - - - - - - - - - -total IN (g) 1802.48 0.13 0.07 11.77 0.01 0.04 0.75 1.51 0.02 0.14 1.51 0.01
solids OUT total g Al Ca Cl Co Cr Fe Mg Mn Ni Si ZnPST19c-30 0.00 - - - - - - - - - - -PST19c-30bulk 6.18 0.10 0.04 0.01 0.00 0.04 0.60 0.87 0.01 0.06 1.29 0.00solution OUT total g total ml Al Ca Cl Co Cr Fe Mg Mn Ni Si ZnPST19c-30 22.80 22.75 0.000 0.000 0.166 0.000 0.000 0.002 0.004 0.000 0.001 0.001 0.000PST19c-30bulk 1518.90 1515.72 0.018 0.003 11.338 0.003 0.002 0.196 0.376 0.005 0.091 0.104 0.003wash water 195.96 196.31 0.000 0.000 0.098 0.000 0.000 0.003 0.008 0.000 0.001 0.002 0.000cake moisture 10.12 10.14 0.000 0.000 0.005 0.000 0.000 0.000 0.000 0.000 0.000 0.000 0.000evaporation 18.70 18.74 - - - - - - - - - - -total OUT (g) 1772.66 0.12 0.04 11.61 0.01 0.04 0.80 1.25 0.01 0.15 1.39 0.01
balance (out/in) 98% 97% 63% 99% 91% 106% 107% 83% 65% 108% 92% 91%
extraction (solution) Al Ca Co Cr Fe Mg Mn Ni Si Zn
PST19c-30 13% 5% 77% 4% 22% 20% 23% 59% 6% 77%PST19c-30bulk 15% 5% 77% 4% 27% 25% 29% 69% 7% 77%
extraction (solids) Al Ca Co Cr Fe Mg Mn Ni Si Zn
PST19c-30bulk 14% 38% 22% -8% 18% 42% 54% 58% 13% 22%
extraction (ratio) Al Ca Co Cr Fe Mg Mn Ni Si Zn
PST19c-30 12% 38% 22% -8% 15% 33% 43% 49% 11% 22%PST19c-30bulk 14% 38% 22% -8% 18% 42% 54% 58% 13% 22%
based on solids assayacid consumption g consumed kg/t ore Al Fe Mg Ni totalPST19c-30 1.43 179PST19c-30bulk 1.43 179acid equivalent (g) 0.08 0.28 1.93 0.10 2.39acid equivalent (%) 3.2 11.9 80.8 4.1 100.0
calc. total soln volumeml
6.3
calc. total soln volumeml
1547.631547.63
calc. total solid massg
1547.61547.6
APPENDIX A - Leach Test Sheets

Univers
ity of
Cap
e Tow
n
Test name: PST19d Date: 13-Apr-05Comment: 106mm, 0.5% solids
mass (g) volume (ml) density @20ºC (kg/l) nominal effective grind (D90) 106 microndry ore added: 8.05 2.8 2.832 initial pulp % solids: 0.5 0.5 T: 80 °C
stock solution added: 1592.8 1589.6 1.002 initial HCl (g/l): 7.3 6.7 duration: 60 mintotal slurry in: 1600.85 initial HCl (M): 0.20 0.18 agitation rate: 800 rpm
MgCl2 (g/l): 0 0 impeller: pitched blade, 5cmφ, Titotal Cl- (g/l): 7 7.4 vessel: 2litre, baffled, with reflux condenser
Sample minute slurry removed sample T pH Density @20ºC ORP vs. Ag/AgCl Eh Notes
g (ºC) (kg/l) (mV) (mV)PST19d-0 0 1.0016 -
PST19d-60 60 22.71 -PST19d-60bulk 60bulk 1545.3 0.83 1.0026 588 787
Sample filtrate mass filtrate volwet residue mass before
wash
wet residue mass after
wash
dry residue mass wash mass in wash vol in wash mass
outwash density
@20ºC wash vol out calc. evaporation
calc. sample pulp density
g ml g g g g ml g kg/l ml cum. ml % solidsPST19d-60 22.17 22.11 0.0 - 32.91 -
PST19d-60bulk 1510.5 1506.58 16.6 15.3 5.5 203.77 204.2 191.73 0.9985 192.0 32.91 0.36
ANALYSES
Residue (%) Al Ca Cl Co Cr Fe Mg Mn Ni Si ZnHead 1.53 0.79 0.13 0.05 0.49 9.3 18.8 0.22 1.68 18.8 0.05PST19d-60bulk 1.85 0.75 0.15 0.05 0.77 9.38 11.6 0.1 0.66 22.5 0.05
Solution (mg/l) Al Ca Cl (g/l) Co Cr Fe HCl (g/l) Mg Mn Ni Si ZnPST19d-head liquor 2 2.59 7.4 2 1 2 6.73 2 2 2 2 2PST19d-60 13.7 2 7.24 2 1.27 164 5.7 370 4.47 69.4 96.4 2PST19d-60bulk 14.6 2 7.35 2 1.38 182 6.79 414 4.87 77.4 106 2PST19d-comp. wash 2 2 0.5 2 1 16.6 0.5 53.1 2 5.65 11.5 2
CALCULATIONS AND MASS BALANCE
H+ assay H+ residual HCl ∆ acidmol/l g %
PST19d-0 0.18 15.3PST19d-60 0.16 8.59PST19d-60bulk 0.19 10.23average 0.18
solids IN total g Al Ca Cl Co Cr Fe Mg Mn Ni Si Znfeed solids 8.05 0.12 0.06 0.01 0.00 0.04 0.75 1.51 0.02 0.13 1.51 0.00solution IN total g total ml Al Ca Cl Co Cr Fe Mg Mn Ni Si Znhead liquor 1592.80 1589.62 0.0 0.0 11.76 0.0 0.0 0.0 0.0 0.0 0.0 0.0 0.0wash water 203.77 204.18 - - - - - - - - - - -total IN (g) 1804.62 0.13 0.07 11.77 0.01 0.04 0.75 1.52 0.02 0.14 1.51 0.01
solids OUT total g Al Ca Cl Co Cr Fe Mg Mn Ni Si ZnPST19d-60 0.00 - - - - - - - - - - -PST19d-60bulk 5.50 0.10 0.04 0.01 0.00 0.04 0.52 0.64 0.01 0.04 1.24 0.00solution OUT total g total ml Al Ca Cl Co Cr Fe Mg Mn Ni Si ZnPST19d-60 22.17 22.11 0.000 0.000 0.160 0.000 0.000 0.004 0.008 0.000 0.002 0.002 0.000PST19d-60bulk 1510.50 1506.58 0.022 0.003 11.073 0.003 0.002 0.274 0.624 0.007 0.117 0.160 0.003wash water 191.73 192.02 0.000 0.000 0.096 0.000 0.000 0.003 0.010 0.000 0.001 0.002 0.000cake moisture 9.78 9.79 0.000 0.000 0.005 0.000 0.000 0.000 0.001 0.000 0.000 0.000 0.000evaporation 32.84 32.91 - - - - - - - - - - -total OUT (g) 1772.52 0.12 0.04 11.34 0.01 0.04 0.80 1.28 0.01 0.16 1.40 0.01
balance (out/in) 98% 99% 66% 96% 86% 110% 106% 84% 64% 113% 93% 86%
extraction (solution) Al Ca Co Cr Fe Mg Mn Ni Si Zn
PST19d-60 17% 5% 76% 5% 34% 37% 39% 79% 10% 76%PST19d-60bulk 18% 5% 76% 5% 37% 42% 42% 88% 11% 76%
extraction (solids) Al Ca Co Cr Fe Mg Mn Ni Si Zn
PST19d-60bulk 16% 34% 31% -10% 30% 57% 68% 73% 17% 31%
extraction (ratio) Al Ca Co Cr Fe Mg Mn Ni Si Zn
PST19d-60 15% 34% 31% -9% 27% 51% 63% 65% 15% 31%PST19d-60bulk 16% 34% 31% -10% 30% 57% 68% 73% 17% 31%
based on solids assayacid consumption g consumed kg/t ore Al Fe Mg Ni totalPST19d-60 2.11 262PST19d-60bulk 0.47 58acid equivalent (g) 0.09 0.46 2.63 0.12 3.29acid equivalent (%) 2.6 13.9 79.8 3.7 100.0
1534.601534.60
calc. total solid mass
calc. total soln volumeml
1534.61534.6
g5.6
calc. total soln volumeml
APPENDIX A - Leach Test Sheets
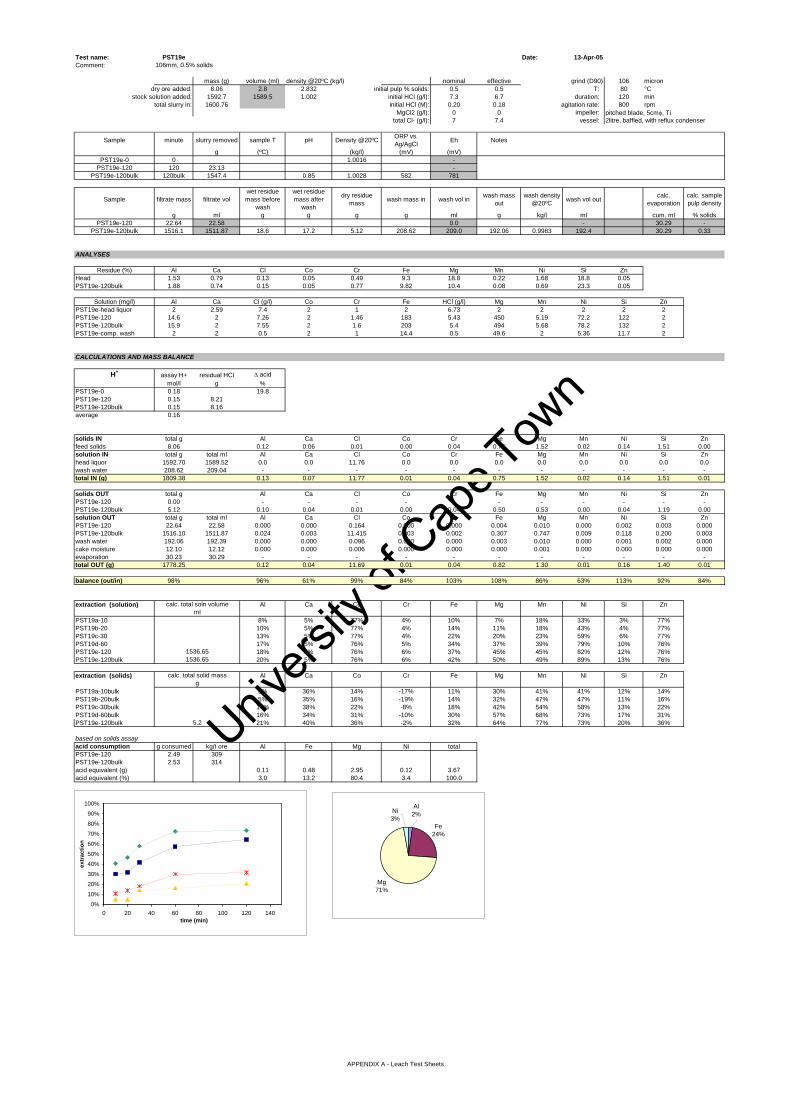
Univers
ity of
Cap
e Tow
n
Test name: PST19e Date: 13-Apr-05Comment: 106mm, 0.5% solids
mass (g) volume (ml) density @20ºC (kg/l) nominal effective grind (D90) 106 microndry ore added: 8.06 2.8 2.832 initial pulp % solids: 0.5 0.5 T: 80 °C
stock solution added: 1592.7 1589.5 1.002 initial HCl (g/l): 7.3 6.7 duration: 120 mintotal slurry in: 1600.76 initial HCl (M): 0.20 0.18 agitation rate: 800 rpm
MgCl2 (g/l): 0 0 impeller: pitched blade, 5cmφ, Titotal Cl- (g/l): 7 7.4 vessel: 2litre, baffled, with reflux condenser
Sample minute slurry removed sample T pH Density @20ºC ORP vs. Ag/AgCl Eh Notes
g (ºC) (kg/l) (mV) (mV)PST19e-0 0 1.0016 -
PST19e-120 120 23.13 -PST19e-120bulk 120bulk 1547.4 0.85 1.0028 582 781
Sample filtrate mass filtrate volwet residue mass before
wash
wet residue mass after
wash
dry residue mass wash mass in wash vol in wash mass
outwash density
@20ºC wash vol out calc. evaporation
calc. sample pulp density
g ml g g g g ml g kg/l ml cum. ml % solidsPST19e-120 22.64 22.58 0.0 - 30.29 -
PST19e-120bulk 1516.1 1511.87 18.6 17.2 5.12 208.62 209.0 192.06 0.9983 192.4 30.29 0.33
ANALYSES
Residue (%) Al Ca Cl Co Cr Fe Mg Mn Ni Si ZnHead 1.53 0.79 0.13 0.05 0.49 9.3 18.8 0.22 1.68 18.8 0.05PST19e-120bulk 1.88 0.74 0.15 0.05 0.77 9.82 10.4 0.08 0.69 23.3 0.05
Solution (mg/l) Al Ca Cl (g/l) Co Cr Fe HCl (g/l) Mg Mn Ni Si ZnPST19e-head liquor 2 2.59 7.4 2 1 2 6.73 2 2 2 2 2PST19e-120 14.6 2 7.26 2 1.46 183 5.43 450 5.19 72.2 122 2PST19e-120bulk 15.9 2 7.55 2 1.6 203 5.4 494 5.68 78.2 132 2PST19e-comp. wash 2 2 0.5 2 1 14.4 0.5 49.6 2 5.36 11.7 2
CALCULATIONS AND MASS BALANCE
H+ assay H+ residual HCl ∆ acidmol/l g %
PST19e-0 0.18 19.8PST19e-120 0.15 8.21PST19e-120bulk 0.15 8.16average 0.16
solids IN total g Al Ca Cl Co Cr Fe Mg Mn Ni Si Znfeed solids 8.06 0.12 0.06 0.01 0.00 0.04 0.75 1.52 0.02 0.14 1.51 0.00solution IN total g total ml Al Ca Cl Co Cr Fe Mg Mn Ni Si Znhead liquor 1592.70 1589.52 0.0 0.0 11.76 0.0 0.0 0.0 0.0 0.0 0.0 0.0 0.0wash water 208.62 209.04 - - - - - - - - - - -total IN (g) 1809.38 0.13 0.07 11.77 0.01 0.04 0.75 1.52 0.02 0.14 1.51 0.01
solids OUT total g Al Ca Cl Co Cr Fe Mg Mn Ni Si ZnPST19e-120 0.00 - - - - - - - - - - -PST19e-120bulk 5.12 0.10 0.04 0.01 0.00 0.04 0.50 0.53 0.00 0.04 1.19 0.00solution OUT total g total ml Al Ca Cl Co Cr Fe Mg Mn Ni Si ZnPST19e-120 22.64 22.58 0.000 0.000 0.164 0.000 0.000 0.004 0.010 0.000 0.002 0.003 0.000PST19e-120bulk 1516.10 1511.87 0.024 0.003 11.415 0.003 0.002 0.307 0.747 0.009 0.118 0.200 0.003wash water 192.06 192.39 0.000 0.000 0.096 0.000 0.000 0.003 0.010 0.000 0.001 0.002 0.000cake moisture 12.10 12.12 0.000 0.000 0.006 0.000 0.000 0.000 0.001 0.000 0.000 0.000 0.000evaporation 30.23 30.29 - - - - - - - - - - -total OUT (g) 1778.25 0.12 0.04 11.69 0.01 0.04 0.82 1.30 0.01 0.16 1.40 0.01
balance (out/in) 98% 96% 61% 99% 84% 103% 108% 86% 63% 113% 92% 84%
extraction (solution) Al Ca Co Cr Fe Mg Mn Ni Si Zn
PST19a-10 8% 5% 77% 4% 10% 7% 18% 33% 3% 77%PST19b-20 10% 5% 77% 4% 14% 11% 18% 43% 4% 77%PST19c-30 13% 5% 77% 4% 22% 20% 23% 59% 6% 77%PST19d-60 17% 5% 76% 5% 34% 37% 39% 79% 10% 76%PST19e-120 18% 5% 76% 6% 37% 45% 45% 82% 12% 76%PST19e-120bulk 20% 5% 76% 6% 42% 50% 49% 89% 13% 76%
extraction (solids) Al Ca Co Cr Fe Mg Mn Ni Si Zn
PST19a-10bulk 5% 36% 14% -17% 11% 30% 41% 41% 12% 14%PST19b-20bulk 5% 35% 16% -19% 14% 32% 47% 47% 11% 16%PST19c-30bulk 14% 38% 22% -8% 18% 42% 54% 58% 13% 22%PST19d-60bulk 16% 34% 31% -10% 30% 57% 68% 73% 17% 31%PST19e-120bulk 21% 40% 36% -2% 32% 64% 77% 73% 20% 36%
based on solids assayacid consumption g consumed kg/t ore Al Fe Mg Ni totalPST19e-120 2.49 309PST19e-120bulk 2.53 314acid equivalent (g) 0.11 0.48 2.95 0.12 3.67acid equivalent (%) 3.0 13.2 80.4 3.4 100.0
calc. total soln volume
calc. total solid massg
5.2
ml
1536.651536.65
0%
10%
20%
30%
40%
50%
60%
70%
80%
90%
100%
0 20 40 60 80 100 120 140time (min)
extr
actio
n
Fe24%
Mg71%
Ni3%
Al2%
APPENDIX A - Leach Test Sheets
Univers
ity of
Cap
e Tow
n
APPENDIX B
pH Calibration and Pitzer-Hydration Model Outputs
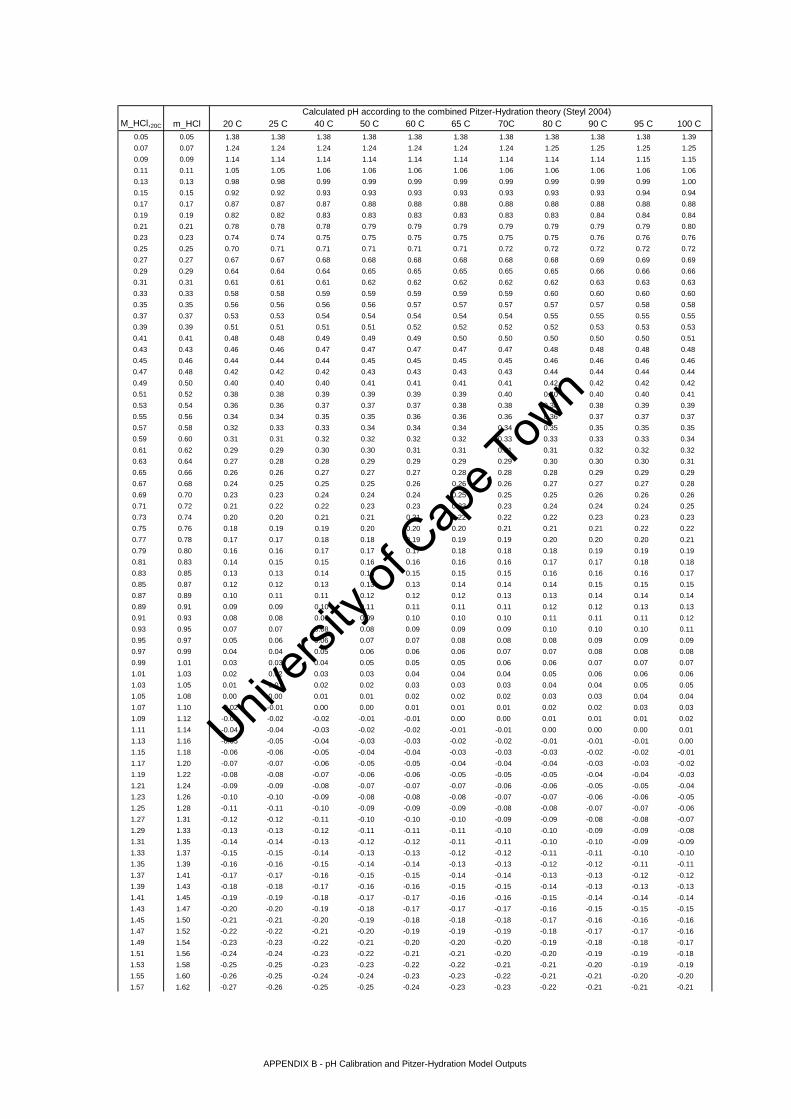
Univers
ity of
Cap
e Tow
n
M_HCl,20C m_HCl 20 C 25 C 40 C 50 C 60 C 65 C 70C 80 C 90 C 95 C 100 C0.05 0.05 1.38 1.38 1.38 1.38 1.38 1.38 1.38 1.38 1.38 1.38 1.390.07 0.07 1.24 1.24 1.24 1.24 1.24 1.24 1.24 1.25 1.25 1.25 1.250.09 0.09 1.14 1.14 1.14 1.14 1.14 1.14 1.14 1.14 1.14 1.15 1.150.11 0.11 1.05 1.05 1.06 1.06 1.06 1.06 1.06 1.06 1.06 1.06 1.060.13 0.13 0.98 0.98 0.99 0.99 0.99 0.99 0.99 0.99 0.99 0.99 1.000.15 0.15 0.92 0.92 0.93 0.93 0.93 0.93 0.93 0.93 0.93 0.94 0.940.17 0.17 0.87 0.87 0.87 0.88 0.88 0.88 0.88 0.88 0.88 0.88 0.880.19 0.19 0.82 0.82 0.83 0.83 0.83 0.83 0.83 0.83 0.84 0.84 0.840.21 0.21 0.78 0.78 0.78 0.79 0.79 0.79 0.79 0.79 0.79 0.79 0.800.23 0.23 0.74 0.74 0.75 0.75 0.75 0.75 0.75 0.75 0.76 0.76 0.760.25 0.25 0.70 0.71 0.71 0.71 0.71 0.71 0.72 0.72 0.72 0.72 0.720.27 0.27 0.67 0.67 0.68 0.68 0.68 0.68 0.68 0.68 0.69 0.69 0.690.29 0.29 0.64 0.64 0.64 0.65 0.65 0.65 0.65 0.65 0.66 0.66 0.660.31 0.31 0.61 0.61 0.61 0.62 0.62 0.62 0.62 0.62 0.63 0.63 0.630.33 0.33 0.58 0.58 0.59 0.59 0.59 0.59 0.59 0.60 0.60 0.60 0.600.35 0.35 0.56 0.56 0.56 0.56 0.57 0.57 0.57 0.57 0.57 0.58 0.580.37 0.37 0.53 0.53 0.54 0.54 0.54 0.54 0.54 0.55 0.55 0.55 0.550.39 0.39 0.51 0.51 0.51 0.51 0.52 0.52 0.52 0.52 0.53 0.53 0.530.41 0.41 0.48 0.48 0.49 0.49 0.49 0.50 0.50 0.50 0.50 0.50 0.510.43 0.43 0.46 0.46 0.47 0.47 0.47 0.47 0.47 0.48 0.48 0.48 0.480.45 0.46 0.44 0.44 0.44 0.45 0.45 0.45 0.45 0.46 0.46 0.46 0.460.47 0.48 0.42 0.42 0.42 0.43 0.43 0.43 0.43 0.44 0.44 0.44 0.440.49 0.50 0.40 0.40 0.40 0.41 0.41 0.41 0.41 0.42 0.42 0.42 0.420.51 0.52 0.38 0.38 0.39 0.39 0.39 0.39 0.40 0.40 0.40 0.40 0.410.53 0.54 0.36 0.36 0.37 0.37 0.37 0.38 0.38 0.38 0.38 0.39 0.390.55 0.56 0.34 0.34 0.35 0.35 0.36 0.36 0.36 0.36 0.37 0.37 0.370.57 0.58 0.32 0.33 0.33 0.34 0.34 0.34 0.34 0.35 0.35 0.35 0.350.59 0.60 0.31 0.31 0.32 0.32 0.32 0.32 0.33 0.33 0.33 0.33 0.340.61 0.62 0.29 0.29 0.30 0.30 0.31 0.31 0.31 0.31 0.32 0.32 0.320.63 0.64 0.27 0.28 0.28 0.29 0.29 0.29 0.29 0.30 0.30 0.30 0.310.65 0.66 0.26 0.26 0.27 0.27 0.27 0.28 0.28 0.28 0.29 0.29 0.290.67 0.68 0.24 0.25 0.25 0.25 0.26 0.26 0.26 0.27 0.27 0.27 0.280.69 0.70 0.23 0.23 0.24 0.24 0.24 0.25 0.25 0.25 0.26 0.26 0.260.71 0.72 0.21 0.22 0.22 0.23 0.23 0.23 0.23 0.24 0.24 0.24 0.250.73 0.74 0.20 0.20 0.21 0.21 0.21 0.22 0.22 0.22 0.23 0.23 0.230.75 0.76 0.18 0.19 0.19 0.20 0.20 0.20 0.21 0.21 0.21 0.22 0.220.77 0.78 0.17 0.17 0.18 0.18 0.19 0.19 0.19 0.20 0.20 0.20 0.210.79 0.80 0.16 0.16 0.17 0.17 0.17 0.18 0.18 0.18 0.19 0.19 0.190.81 0.83 0.14 0.15 0.15 0.16 0.16 0.16 0.16 0.17 0.17 0.18 0.180.83 0.85 0.13 0.13 0.14 0.14 0.15 0.15 0.15 0.16 0.16 0.16 0.170.85 0.87 0.12 0.12 0.13 0.13 0.13 0.14 0.14 0.14 0.15 0.15 0.150.87 0.89 0.10 0.11 0.11 0.12 0.12 0.12 0.13 0.13 0.14 0.14 0.140.89 0.91 0.09 0.09 0.10 0.11 0.11 0.11 0.11 0.12 0.12 0.13 0.130.91 0.93 0.08 0.08 0.09 0.09 0.10 0.10 0.10 0.11 0.11 0.11 0.120.93 0.95 0.07 0.07 0.08 0.08 0.09 0.09 0.09 0.10 0.10 0.10 0.110.95 0.97 0.05 0.06 0.06 0.07 0.07 0.08 0.08 0.08 0.09 0.09 0.090.97 0.99 0.04 0.04 0.05 0.06 0.06 0.06 0.07 0.07 0.08 0.08 0.080.99 1.01 0.03 0.03 0.04 0.05 0.05 0.05 0.06 0.06 0.07 0.07 0.071.01 1.03 0.02 0.02 0.03 0.03 0.04 0.04 0.04 0.05 0.06 0.06 0.061.03 1.05 0.01 0.01 0.02 0.02 0.03 0.03 0.03 0.04 0.04 0.05 0.051.05 1.08 0.00 0.00 0.01 0.01 0.02 0.02 0.02 0.03 0.03 0.04 0.041.07 1.10 -0.02 -0.01 0.00 0.00 0.01 0.01 0.01 0.02 0.02 0.03 0.031.09 1.12 -0.03 -0.02 -0.02 -0.01 -0.01 0.00 0.00 0.01 0.01 0.01 0.021.11 1.14 -0.04 -0.04 -0.03 -0.02 -0.02 -0.01 -0.01 0.00 0.00 0.00 0.011.13 1.16 -0.05 -0.05 -0.04 -0.03 -0.03 -0.02 -0.02 -0.01 -0.01 -0.01 0.001.15 1.18 -0.06 -0.06 -0.05 -0.04 -0.04 -0.03 -0.03 -0.03 -0.02 -0.02 -0.011.17 1.20 -0.07 -0.07 -0.06 -0.05 -0.05 -0.04 -0.04 -0.04 -0.03 -0.03 -0.021.19 1.22 -0.08 -0.08 -0.07 -0.06 -0.06 -0.05 -0.05 -0.05 -0.04 -0.04 -0.031.21 1.24 -0.09 -0.09 -0.08 -0.07 -0.07 -0.07 -0.06 -0.06 -0.05 -0.05 -0.041.23 1.26 -0.10 -0.10 -0.09 -0.08 -0.08 -0.08 -0.07 -0.07 -0.06 -0.06 -0.051.25 1.28 -0.11 -0.11 -0.10 -0.09 -0.09 -0.09 -0.08 -0.08 -0.07 -0.07 -0.061.27 1.31 -0.12 -0.12 -0.11 -0.10 -0.10 -0.10 -0.09 -0.09 -0.08 -0.08 -0.071.29 1.33 -0.13 -0.13 -0.12 -0.11 -0.11 -0.11 -0.10 -0.10 -0.09 -0.09 -0.081.31 1.35 -0.14 -0.14 -0.13 -0.12 -0.12 -0.11 -0.11 -0.10 -0.10 -0.09 -0.091.33 1.37 -0.15 -0.15 -0.14 -0.13 -0.13 -0.12 -0.12 -0.11 -0.11 -0.10 -0.101.35 1.39 -0.16 -0.16 -0.15 -0.14 -0.14 -0.13 -0.13 -0.12 -0.12 -0.11 -0.111.37 1.41 -0.17 -0.17 -0.16 -0.15 -0.15 -0.14 -0.14 -0.13 -0.13 -0.12 -0.121.39 1.43 -0.18 -0.18 -0.17 -0.16 -0.16 -0.15 -0.15 -0.14 -0.13 -0.13 -0.131.41 1.45 -0.19 -0.19 -0.18 -0.17 -0.17 -0.16 -0.16 -0.15 -0.14 -0.14 -0.141.43 1.47 -0.20 -0.20 -0.19 -0.18 -0.17 -0.17 -0.17 -0.16 -0.15 -0.15 -0.151.45 1.50 -0.21 -0.21 -0.20 -0.19 -0.18 -0.18 -0.18 -0.17 -0.16 -0.16 -0.161.47 1.52 -0.22 -0.22 -0.21 -0.20 -0.19 -0.19 -0.19 -0.18 -0.17 -0.17 -0.161.49 1.54 -0.23 -0.23 -0.22 -0.21 -0.20 -0.20 -0.20 -0.19 -0.18 -0.18 -0.171.51 1.56 -0.24 -0.24 -0.23 -0.22 -0.21 -0.21 -0.20 -0.20 -0.19 -0.19 -0.181.53 1.58 -0.25 -0.25 -0.23 -0.23 -0.22 -0.22 -0.21 -0.21 -0.20 -0.19 -0.191.55 1.60 -0.26 -0.25 -0.24 -0.24 -0.23 -0.23 -0.22 -0.21 -0.21 -0.20 -0.201.57 1.62 -0.27 -0.26 -0.25 -0.25 -0.24 -0.23 -0.23 -0.22 -0.21 -0.21 -0.21
Calculated pH according to the combined Pitzer-Hydration theory (Steyl 2004)
APPENDIX B - pH Calibration and Pitzer-Hydration Model Outputs
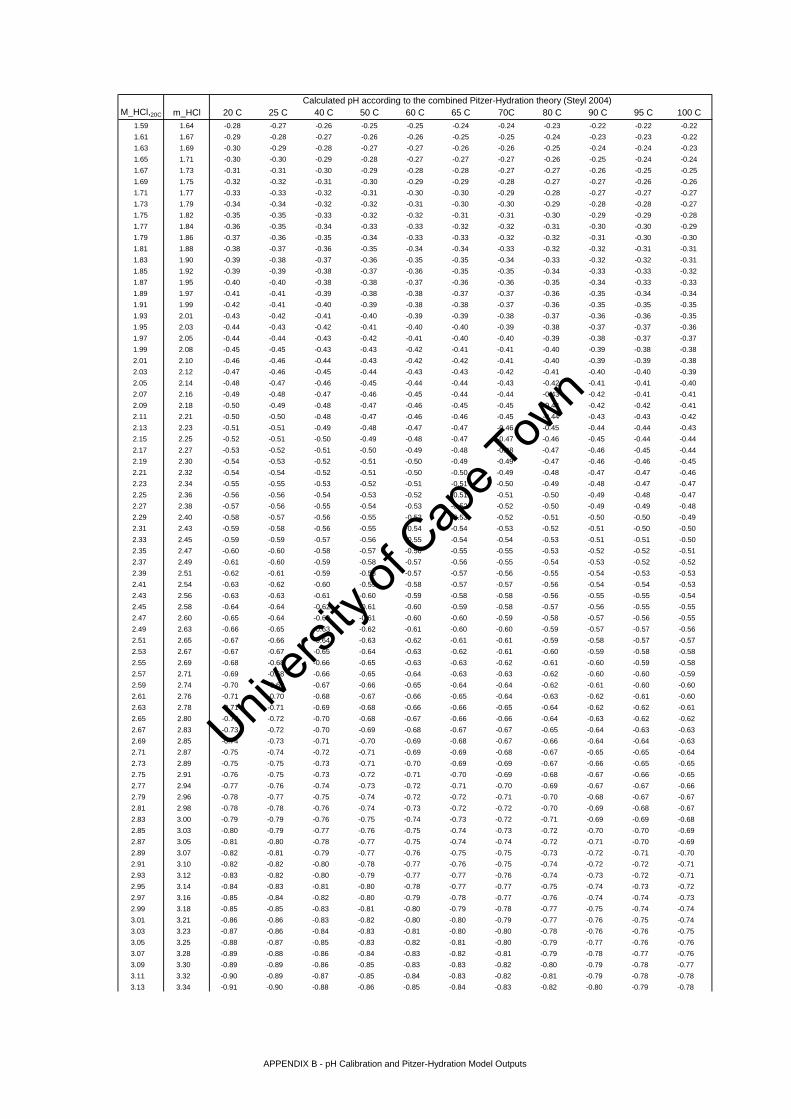
Univers
ity of
Cap
e Tow
n
M_HCl,20C m_HCl 20 C 25 C 40 C 50 C 60 C 65 C 70C 80 C 90 C 95 C 100 C1.59 1.64 -0.28 -0.27 -0.26 -0.25 -0.25 -0.24 -0.24 -0.23 -0.22 -0.22 -0.221.61 1.67 -0.29 -0.28 -0.27 -0.26 -0.26 -0.25 -0.25 -0.24 -0.23 -0.23 -0.221.63 1.69 -0.30 -0.29 -0.28 -0.27 -0.27 -0.26 -0.26 -0.25 -0.24 -0.24 -0.231.65 1.71 -0.30 -0.30 -0.29 -0.28 -0.27 -0.27 -0.27 -0.26 -0.25 -0.24 -0.241.67 1.73 -0.31 -0.31 -0.30 -0.29 -0.28 -0.28 -0.27 -0.27 -0.26 -0.25 -0.251.69 1.75 -0.32 -0.32 -0.31 -0.30 -0.29 -0.29 -0.28 -0.27 -0.27 -0.26 -0.261.71 1.77 -0.33 -0.33 -0.32 -0.31 -0.30 -0.30 -0.29 -0.28 -0.27 -0.27 -0.271.73 1.79 -0.34 -0.34 -0.32 -0.32 -0.31 -0.30 -0.30 -0.29 -0.28 -0.28 -0.271.75 1.82 -0.35 -0.35 -0.33 -0.32 -0.32 -0.31 -0.31 -0.30 -0.29 -0.29 -0.281.77 1.84 -0.36 -0.35 -0.34 -0.33 -0.33 -0.32 -0.32 -0.31 -0.30 -0.30 -0.291.79 1.86 -0.37 -0.36 -0.35 -0.34 -0.33 -0.33 -0.32 -0.32 -0.31 -0.30 -0.301.81 1.88 -0.38 -0.37 -0.36 -0.35 -0.34 -0.34 -0.33 -0.32 -0.32 -0.31 -0.311.83 1.90 -0.39 -0.38 -0.37 -0.36 -0.35 -0.35 -0.34 -0.33 -0.32 -0.32 -0.311.85 1.92 -0.39 -0.39 -0.38 -0.37 -0.36 -0.35 -0.35 -0.34 -0.33 -0.33 -0.321.87 1.95 -0.40 -0.40 -0.38 -0.38 -0.37 -0.36 -0.36 -0.35 -0.34 -0.33 -0.331.89 1.97 -0.41 -0.41 -0.39 -0.38 -0.38 -0.37 -0.37 -0.36 -0.35 -0.34 -0.341.91 1.99 -0.42 -0.41 -0.40 -0.39 -0.38 -0.38 -0.37 -0.36 -0.35 -0.35 -0.351.93 2.01 -0.43 -0.42 -0.41 -0.40 -0.39 -0.39 -0.38 -0.37 -0.36 -0.36 -0.351.95 2.03 -0.44 -0.43 -0.42 -0.41 -0.40 -0.40 -0.39 -0.38 -0.37 -0.37 -0.361.97 2.05 -0.44 -0.44 -0.43 -0.42 -0.41 -0.40 -0.40 -0.39 -0.38 -0.37 -0.371.99 2.08 -0.45 -0.45 -0.43 -0.43 -0.42 -0.41 -0.41 -0.40 -0.39 -0.38 -0.382.01 2.10 -0.46 -0.46 -0.44 -0.43 -0.42 -0.42 -0.41 -0.40 -0.39 -0.39 -0.382.03 2.12 -0.47 -0.46 -0.45 -0.44 -0.43 -0.43 -0.42 -0.41 -0.40 -0.40 -0.392.05 2.14 -0.48 -0.47 -0.46 -0.45 -0.44 -0.44 -0.43 -0.42 -0.41 -0.41 -0.402.07 2.16 -0.49 -0.48 -0.47 -0.46 -0.45 -0.44 -0.44 -0.43 -0.42 -0.41 -0.412.09 2.18 -0.50 -0.49 -0.48 -0.47 -0.46 -0.45 -0.45 -0.44 -0.42 -0.42 -0.412.11 2.21 -0.50 -0.50 -0.48 -0.47 -0.46 -0.46 -0.45 -0.44 -0.43 -0.43 -0.422.13 2.23 -0.51 -0.51 -0.49 -0.48 -0.47 -0.47 -0.46 -0.45 -0.44 -0.44 -0.432.15 2.25 -0.52 -0.51 -0.50 -0.49 -0.48 -0.47 -0.47 -0.46 -0.45 -0.44 -0.442.17 2.27 -0.53 -0.52 -0.51 -0.50 -0.49 -0.48 -0.48 -0.47 -0.46 -0.45 -0.442.19 2.30 -0.54 -0.53 -0.52 -0.51 -0.50 -0.49 -0.49 -0.47 -0.46 -0.46 -0.452.21 2.32 -0.54 -0.54 -0.52 -0.51 -0.50 -0.50 -0.49 -0.48 -0.47 -0.47 -0.462.23 2.34 -0.55 -0.55 -0.53 -0.52 -0.51 -0.51 -0.50 -0.49 -0.48 -0.47 -0.472.25 2.36 -0.56 -0.56 -0.54 -0.53 -0.52 -0.51 -0.51 -0.50 -0.49 -0.48 -0.472.27 2.38 -0.57 -0.56 -0.55 -0.54 -0.53 -0.52 -0.52 -0.50 -0.49 -0.49 -0.482.29 2.40 -0.58 -0.57 -0.56 -0.55 -0.53 -0.53 -0.52 -0.51 -0.50 -0.50 -0.492.31 2.43 -0.59 -0.58 -0.56 -0.55 -0.54 -0.54 -0.53 -0.52 -0.51 -0.50 -0.502.33 2.45 -0.59 -0.59 -0.57 -0.56 -0.55 -0.54 -0.54 -0.53 -0.51 -0.51 -0.502.35 2.47 -0.60 -0.60 -0.58 -0.57 -0.56 -0.55 -0.55 -0.53 -0.52 -0.52 -0.512.37 2.49 -0.61 -0.60 -0.59 -0.58 -0.57 -0.56 -0.55 -0.54 -0.53 -0.52 -0.522.39 2.51 -0.62 -0.61 -0.59 -0.58 -0.57 -0.57 -0.56 -0.55 -0.54 -0.53 -0.532.41 2.54 -0.63 -0.62 -0.60 -0.59 -0.58 -0.57 -0.57 -0.56 -0.54 -0.54 -0.532.43 2.56 -0.63 -0.63 -0.61 -0.60 -0.59 -0.58 -0.58 -0.56 -0.55 -0.55 -0.542.45 2.58 -0.64 -0.64 -0.62 -0.61 -0.60 -0.59 -0.58 -0.57 -0.56 -0.55 -0.552.47 2.60 -0.65 -0.64 -0.63 -0.61 -0.60 -0.60 -0.59 -0.58 -0.57 -0.56 -0.552.49 2.63 -0.66 -0.65 -0.63 -0.62 -0.61 -0.60 -0.60 -0.59 -0.57 -0.57 -0.562.51 2.65 -0.67 -0.66 -0.64 -0.63 -0.62 -0.61 -0.61 -0.59 -0.58 -0.57 -0.572.53 2.67 -0.67 -0.67 -0.65 -0.64 -0.63 -0.62 -0.61 -0.60 -0.59 -0.58 -0.582.55 2.69 -0.68 -0.68 -0.66 -0.65 -0.63 -0.63 -0.62 -0.61 -0.60 -0.59 -0.582.57 2.71 -0.69 -0.68 -0.66 -0.65 -0.64 -0.63 -0.63 -0.62 -0.60 -0.60 -0.592.59 2.74 -0.70 -0.69 -0.67 -0.66 -0.65 -0.64 -0.64 -0.62 -0.61 -0.60 -0.602.61 2.76 -0.71 -0.70 -0.68 -0.67 -0.66 -0.65 -0.64 -0.63 -0.62 -0.61 -0.602.63 2.78 -0.71 -0.71 -0.69 -0.68 -0.66 -0.66 -0.65 -0.64 -0.62 -0.62 -0.612.65 2.80 -0.72 -0.72 -0.70 -0.68 -0.67 -0.66 -0.66 -0.64 -0.63 -0.62 -0.622.67 2.83 -0.73 -0.72 -0.70 -0.69 -0.68 -0.67 -0.67 -0.65 -0.64 -0.63 -0.632.69 2.85 -0.74 -0.73 -0.71 -0.70 -0.69 -0.68 -0.67 -0.66 -0.64 -0.64 -0.632.71 2.87 -0.75 -0.74 -0.72 -0.71 -0.69 -0.69 -0.68 -0.67 -0.65 -0.65 -0.642.73 2.89 -0.75 -0.75 -0.73 -0.71 -0.70 -0.69 -0.69 -0.67 -0.66 -0.65 -0.652.75 2.91 -0.76 -0.75 -0.73 -0.72 -0.71 -0.70 -0.69 -0.68 -0.67 -0.66 -0.652.77 2.94 -0.77 -0.76 -0.74 -0.73 -0.72 -0.71 -0.70 -0.69 -0.67 -0.67 -0.662.79 2.96 -0.78 -0.77 -0.75 -0.74 -0.72 -0.72 -0.71 -0.70 -0.68 -0.67 -0.672.81 2.98 -0.78 -0.78 -0.76 -0.74 -0.73 -0.72 -0.72 -0.70 -0.69 -0.68 -0.672.83 3.00 -0.79 -0.79 -0.76 -0.75 -0.74 -0.73 -0.72 -0.71 -0.69 -0.69 -0.682.85 3.03 -0.80 -0.79 -0.77 -0.76 -0.75 -0.74 -0.73 -0.72 -0.70 -0.70 -0.692.87 3.05 -0.81 -0.80 -0.78 -0.77 -0.75 -0.74 -0.74 -0.72 -0.71 -0.70 -0.692.89 3.07 -0.82 -0.81 -0.79 -0.77 -0.76 -0.75 -0.75 -0.73 -0.72 -0.71 -0.702.91 3.10 -0.82 -0.82 -0.80 -0.78 -0.77 -0.76 -0.75 -0.74 -0.72 -0.72 -0.712.93 3.12 -0.83 -0.82 -0.80 -0.79 -0.77 -0.77 -0.76 -0.74 -0.73 -0.72 -0.712.95 3.14 -0.84 -0.83 -0.81 -0.80 -0.78 -0.77 -0.77 -0.75 -0.74 -0.73 -0.722.97 3.16 -0.85 -0.84 -0.82 -0.80 -0.79 -0.78 -0.77 -0.76 -0.74 -0.74 -0.732.99 3.18 -0.85 -0.85 -0.83 -0.81 -0.80 -0.79 -0.78 -0.77 -0.75 -0.74 -0.743.01 3.21 -0.86 -0.86 -0.83 -0.82 -0.80 -0.80 -0.79 -0.77 -0.76 -0.75 -0.743.03 3.23 -0.87 -0.86 -0.84 -0.83 -0.81 -0.80 -0.80 -0.78 -0.76 -0.76 -0.753.05 3.25 -0.88 -0.87 -0.85 -0.83 -0.82 -0.81 -0.80 -0.79 -0.77 -0.76 -0.763.07 3.28 -0.89 -0.88 -0.86 -0.84 -0.83 -0.82 -0.81 -0.79 -0.78 -0.77 -0.763.09 3.30 -0.89 -0.89 -0.86 -0.85 -0.83 -0.83 -0.82 -0.80 -0.79 -0.78 -0.773.11 3.32 -0.90 -0.89 -0.87 -0.85 -0.84 -0.83 -0.82 -0.81 -0.79 -0.78 -0.783.13 3.34 -0.91 -0.90 -0.88 -0.86 -0.85 -0.84 -0.83 -0.82 -0.80 -0.79 -0.78
Calculated pH according to the combined Pitzer-Hydration theory (Steyl 2004)
APPENDIX B - pH Calibration and Pitzer-Hydration Model Outputs
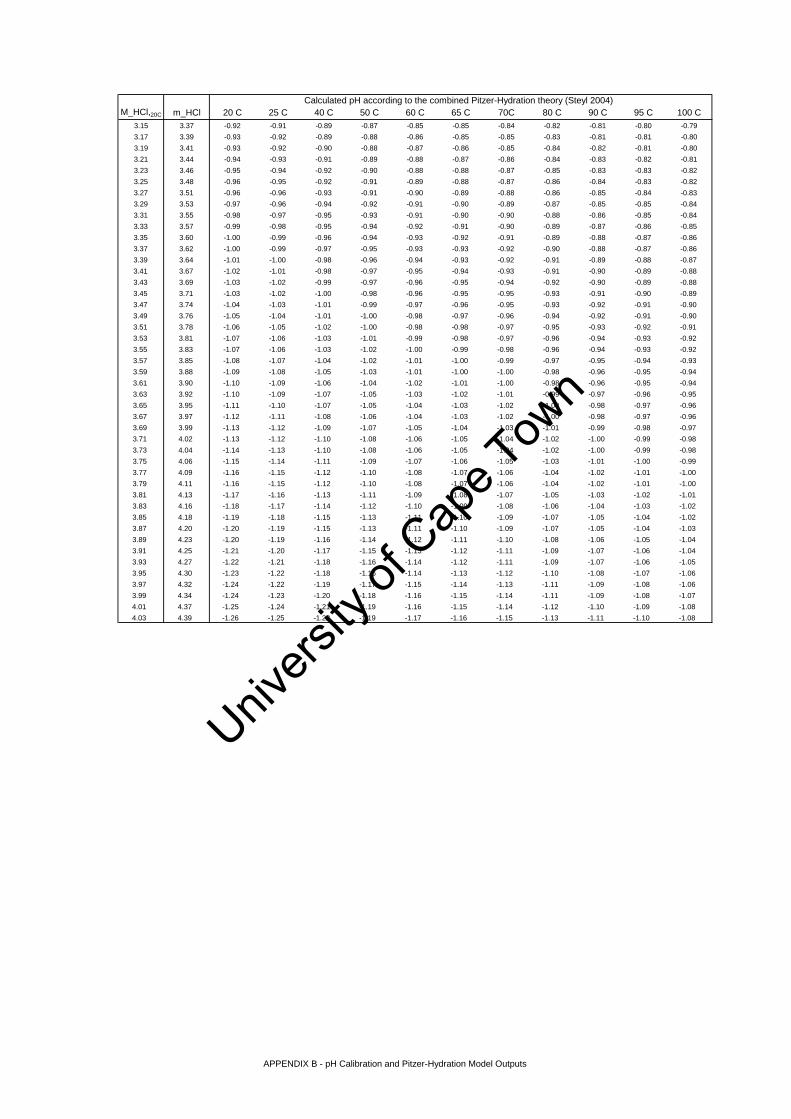
Univers
ity of
Cap
e Tow
n
M_HCl,20C m_HCl 20 C 25 C 40 C 50 C 60 C 65 C 70C 80 C 90 C 95 C 100 C3.15 3.37 -0.92 -0.91 -0.89 -0.87 -0.85 -0.85 -0.84 -0.82 -0.81 -0.80 -0.793.17 3.39 -0.93 -0.92 -0.89 -0.88 -0.86 -0.85 -0.85 -0.83 -0.81 -0.81 -0.803.19 3.41 -0.93 -0.92 -0.90 -0.88 -0.87 -0.86 -0.85 -0.84 -0.82 -0.81 -0.803.21 3.44 -0.94 -0.93 -0.91 -0.89 -0.88 -0.87 -0.86 -0.84 -0.83 -0.82 -0.813.23 3.46 -0.95 -0.94 -0.92 -0.90 -0.88 -0.88 -0.87 -0.85 -0.83 -0.83 -0.823.25 3.48 -0.96 -0.95 -0.92 -0.91 -0.89 -0.88 -0.87 -0.86 -0.84 -0.83 -0.823.27 3.51 -0.96 -0.96 -0.93 -0.91 -0.90 -0.89 -0.88 -0.86 -0.85 -0.84 -0.833.29 3.53 -0.97 -0.96 -0.94 -0.92 -0.91 -0.90 -0.89 -0.87 -0.85 -0.85 -0.843.31 3.55 -0.98 -0.97 -0.95 -0.93 -0.91 -0.90 -0.90 -0.88 -0.86 -0.85 -0.843.33 3.57 -0.99 -0.98 -0.95 -0.94 -0.92 -0.91 -0.90 -0.89 -0.87 -0.86 -0.853.35 3.60 -1.00 -0.99 -0.96 -0.94 -0.93 -0.92 -0.91 -0.89 -0.88 -0.87 -0.863.37 3.62 -1.00 -0.99 -0.97 -0.95 -0.93 -0.93 -0.92 -0.90 -0.88 -0.87 -0.863.39 3.64 -1.01 -1.00 -0.98 -0.96 -0.94 -0.93 -0.92 -0.91 -0.89 -0.88 -0.873.41 3.67 -1.02 -1.01 -0.98 -0.97 -0.95 -0.94 -0.93 -0.91 -0.90 -0.89 -0.883.43 3.69 -1.03 -1.02 -0.99 -0.97 -0.96 -0.95 -0.94 -0.92 -0.90 -0.89 -0.883.45 3.71 -1.03 -1.02 -1.00 -0.98 -0.96 -0.95 -0.95 -0.93 -0.91 -0.90 -0.893.47 3.74 -1.04 -1.03 -1.01 -0.99 -0.97 -0.96 -0.95 -0.93 -0.92 -0.91 -0.903.49 3.76 -1.05 -1.04 -1.01 -1.00 -0.98 -0.97 -0.96 -0.94 -0.92 -0.91 -0.903.51 3.78 -1.06 -1.05 -1.02 -1.00 -0.98 -0.98 -0.97 -0.95 -0.93 -0.92 -0.913.53 3.81 -1.07 -1.06 -1.03 -1.01 -0.99 -0.98 -0.97 -0.96 -0.94 -0.93 -0.923.55 3.83 -1.07 -1.06 -1.03 -1.02 -1.00 -0.99 -0.98 -0.96 -0.94 -0.93 -0.923.57 3.85 -1.08 -1.07 -1.04 -1.02 -1.01 -1.00 -0.99 -0.97 -0.95 -0.94 -0.933.59 3.88 -1.09 -1.08 -1.05 -1.03 -1.01 -1.00 -1.00 -0.98 -0.96 -0.95 -0.943.61 3.90 -1.10 -1.09 -1.06 -1.04 -1.02 -1.01 -1.00 -0.98 -0.96 -0.95 -0.943.63 3.92 -1.10 -1.09 -1.07 -1.05 -1.03 -1.02 -1.01 -0.99 -0.97 -0.96 -0.953.65 3.95 -1.11 -1.10 -1.07 -1.05 -1.04 -1.03 -1.02 -1.00 -0.98 -0.97 -0.963.67 3.97 -1.12 -1.11 -1.08 -1.06 -1.04 -1.03 -1.02 -1.00 -0.98 -0.97 -0.963.69 3.99 -1.13 -1.12 -1.09 -1.07 -1.05 -1.04 -1.03 -1.01 -0.99 -0.98 -0.973.71 4.02 -1.13 -1.12 -1.10 -1.08 -1.06 -1.05 -1.04 -1.02 -1.00 -0.99 -0.983.73 4.04 -1.14 -1.13 -1.10 -1.08 -1.06 -1.05 -1.04 -1.02 -1.00 -0.99 -0.983.75 4.06 -1.15 -1.14 -1.11 -1.09 -1.07 -1.06 -1.05 -1.03 -1.01 -1.00 -0.993.77 4.09 -1.16 -1.15 -1.12 -1.10 -1.08 -1.07 -1.06 -1.04 -1.02 -1.01 -1.003.79 4.11 -1.16 -1.15 -1.12 -1.10 -1.08 -1.07 -1.06 -1.04 -1.02 -1.01 -1.003.81 4.13 -1.17 -1.16 -1.13 -1.11 -1.09 -1.08 -1.07 -1.05 -1.03 -1.02 -1.013.83 4.16 -1.18 -1.17 -1.14 -1.12 -1.10 -1.09 -1.08 -1.06 -1.04 -1.03 -1.023.85 4.18 -1.19 -1.18 -1.15 -1.13 -1.11 -1.10 -1.09 -1.07 -1.05 -1.04 -1.023.87 4.20 -1.20 -1.19 -1.15 -1.13 -1.11 -1.10 -1.09 -1.07 -1.05 -1.04 -1.033.89 4.23 -1.20 -1.19 -1.16 -1.14 -1.12 -1.11 -1.10 -1.08 -1.06 -1.05 -1.043.91 4.25 -1.21 -1.20 -1.17 -1.15 -1.13 -1.12 -1.11 -1.09 -1.07 -1.06 -1.043.93 4.27 -1.22 -1.21 -1.18 -1.16 -1.14 -1.12 -1.11 -1.09 -1.07 -1.06 -1.053.95 4.30 -1.23 -1.22 -1.18 -1.16 -1.14 -1.13 -1.12 -1.10 -1.08 -1.07 -1.063.97 4.32 -1.24 -1.22 -1.19 -1.17 -1.15 -1.14 -1.13 -1.11 -1.09 -1.08 -1.063.99 4.34 -1.24 -1.23 -1.20 -1.18 -1.16 -1.15 -1.14 -1.11 -1.09 -1.08 -1.074.01 4.37 -1.25 -1.24 -1.21 -1.19 -1.16 -1.15 -1.14 -1.12 -1.10 -1.09 -1.084.03 4.39 -1.26 -1.25 -1.22 -1.19 -1.17 -1.16 -1.15 -1.13 -1.11 -1.10 -1.08
Calculated pH according to the combined Pitzer-Hydration theory (Steyl 2004)
APPENDIX B - pH Calibration and Pitzer-Hydration Model Outputs
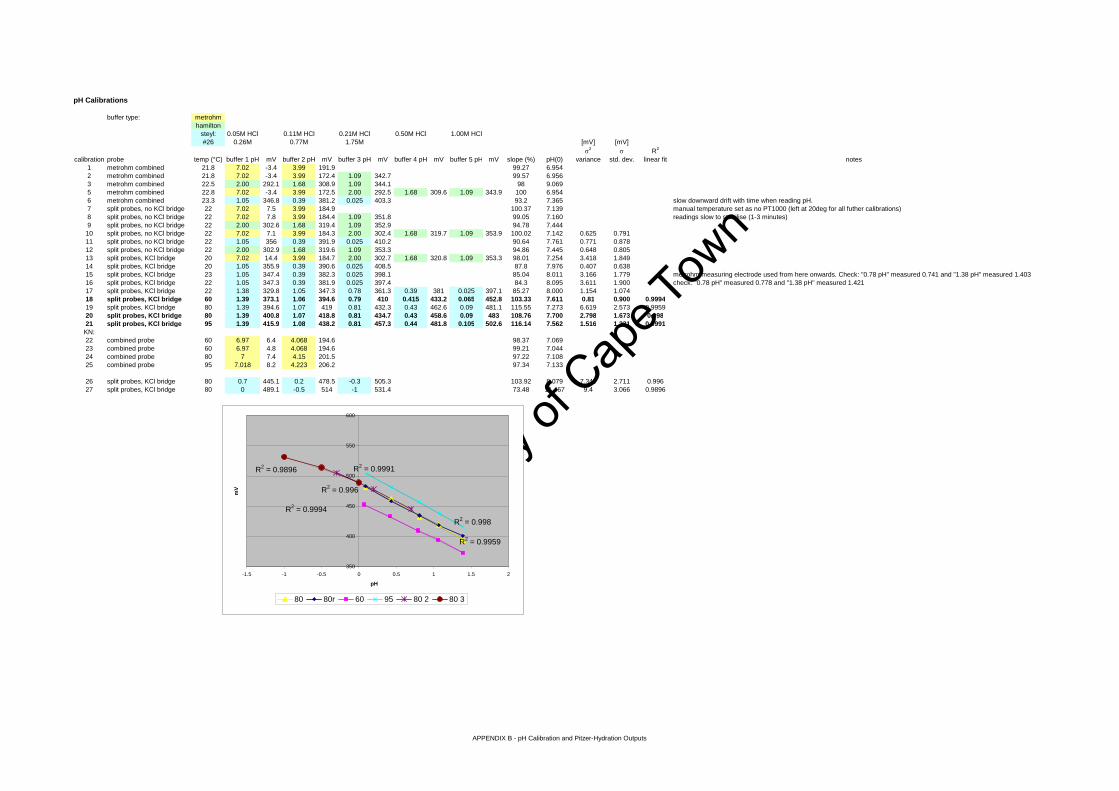
Univers
ity of
Cap
e Tow
n
pH Calibrations
buffer type: metrohmhamilton
steyl: 0.05M HCl 0.11M HCl 0.21M HCl 0.50M HCl 1.00M HCl#26 0.26M 0.77M 1.75M [mV] [mV]
σ2 σ R2
calibration probe temp (°C) buffer 1 pH mV buffer 2 pH mV buffer 3 pH mV buffer 4 pH mV buffer 5 pH mV slope (%) pH(0) variance std. dev. linear fit notes1 metrohm combined 21.8 7.02 -3.4 3.99 191.9 99.27 6.9542 metrohm combined 21.8 7.02 -3.4 3.99 172.4 1.09 342.7 99.57 6.9563 metrohm combined 22.5 2.00 292.1 1.68 308.9 1.09 344.1 98 9.0695 metrohm combined 22.8 7.02 -3.4 3.99 172.5 2.00 292.5 1.68 309.6 1.09 343.9 100 6.9546 metrohm combined 23.3 1.05 346.8 0.39 381.2 0.025 403.3 93.2 7.365 slow downward drift with time when reading pH. 7 split probes, no KCl bridge 22 7.02 7.5 3.99 184.9 100.37 7.139 manual temperature set as no PT1000 (left at 20deg for all futher calibrations)8 split probes, no KCl bridge 22 7.02 7.8 3.99 184.4 1.09 351.8 99.05 7.160 readings slow to stabilise (1-3 minutes)9 split probes, no KCl bridge 22 2.00 302.6 1.68 319.4 1.09 352.9 94.78 7.444
10 split probes, no KCl bridge 22 7.02 7.1 3.99 184.3 2.00 302.4 1.68 319.7 1.09 353.9 100.02 7.142 0.625 0.79111 split probes, no KCl bridge 22 1.05 356 0.39 391.9 0.025 410.2 90.64 7.761 0.771 0.87812 split probes, no KCl bridge 22 2.00 302.9 1.68 319.6 1.09 353.3 94.86 7.445 0.648 0.80513 split probes, KCl bridge 20 7.02 14.4 3.99 184.7 2.00 302.7 1.68 320.8 1.09 353.3 98.01 7.254 3.418 1.84914 split probes, KCl bridge 20 1.05 355.9 0.39 390.6 0.025 408.5 87.8 7.976 0.407 0.63815 split probes, KCl bridge 23 1.05 347.4 0.39 382.3 0.025 398.1 85.04 8.011 3.166 1.779 metrohm measuring electrode used from here onwards. Check: "0.78 pH" measured 0.741 and "1.38 pH" measured 1.40316 split probes, KCl bridge 22 1.05 347.3 0.39 381.9 0.025 397.4 84.3 8.095 3.611 1.900 check: "0.78 pH" measured 0.778 and "1.38 pH" measured 1.42117 split probes, KCl bridge 22 1.38 329.8 1.05 347.3 0.78 361.3 0.39 381 0.025 397.1 85.27 8.000 1.154 1.07418 split probes, KCl bridge 60 1.39 373.1 1.06 394.6 0.79 410 0.415 433.2 0.065 452.8 103.33 7.611 0.81 0.900 0.999419 split probes, KCl bridge 80 1.39 394.6 1.07 419 0.81 432.3 0.43 462.6 0.09 481.1 115.55 7.273 6.619 2.573 0.995920 split probes, KCl bridge 80 1.39 400.8 1.07 418.8 0.81 434.7 0.43 458.6 0.09 483 108.76 7.700 2.798 1.673 0.99821 split probes, KCl bridge 95 1.39 415.9 1.08 438.2 0.81 457.3 0.44 481.8 0.105 502.6 116.14 7.562 1.516 1.231 0.9991
KN:22 combined probe 60 6.97 6.4 4.068 194.6 98.37 7.06923 combined probe 60 6.97 4.8 4.068 194.6 99.21 7.04424 combined probe 80 7 7.4 4.15 201.5 97.22 7.10825 combined probe 95 7.018 8.2 4.223 206.2 97.34 7.133
26 split probes, KCl bridge 80 0.7 445.1 0.2 478.5 -0.3 505.3 103.92 8.079 7.349 2.711 0.99627 split probes, KCl bridge 80 0 489.1 -0.5 514 -1 531.4 73.48 11.467 9.4 3.066 0.9896
R2 = 0.9959
R2 = 0.998R2 = 0.9994
R2 = 0.9991
R2 = 0.996
R2 = 0.9896
350
400
450
500
550
600
-1.5 -1 -0.5 0 0.5 1 1.5 2
pH
mV
80 80r 60 95 80 2 80 3
APPENDIX B - pH Calibration and Pitzer-Hydration Outputs

Univers
ity of
Cap
e Tow
n
Activity Measurement
- Measurements made in 1 litre glass vessel using 500ml of solution- Hot plate linked to temperature probe and controller used to control temperature- Magnetic stirrer used at low speed- 5-point calibrations done at each temperature- reference kept at 20°C and linked through 3 M KCl bridge- Metrohm measuring electrode used- Calibration #18: 60°C, Calibration #20: 80°C, Calibration #21: 95°C (see "Calibrations" sheet)
Test soln no. Leach T [°C] HCl [g/l] [M] Mg [mg/l] [M] Cl- [g/l] Ni [mg/l] Fe [mg/l] Ni acc [%] pH (20°C) pH (T) pH (T, steyl) Calculated pH (Steyl) Calc. - MeasuredST09-180 80 37.9 1.04 65896 2.71 262 365 1858 90 -1.06 -0.90 -1.15 -0.63 0.5ST15e-120 80 31.4 0.86 71372 2.94 232 108.7 497 96 -1.37 -0.96 -1.30 -0.55 0.7ST06-180 80 40.2 1.10 38069 1.57 153 425 2087 109 -0.71 -0.57 -0.64 -0.40 0.2ST08-180 80 24.3 0.67 71459 2.94 237 391 1931 107 -1.02 -0.85 -1.24 -0.40 0.8ST05-180 80 25.3 0.69 44802 1.84 150 377 1935 96 -0.53 -0.42 -0.52 -0.19 0.3ST16e-120 80 3.98 0.11 75320 3.10 230 118.7 752 101 -0.66 -0.39 -0.53 0.47 1.0ST14e-120 80 4.47 0.12 46093 1.90 138 98.6 392 96 -0.14 0.20 0.21 0.66 0.5TT17a-10 60 7.17 0.20 17.5 0.00 7.5 7.94 16.6 86 0.69 0.76 0.79 0.82 0.0TT17b-20 60 7.09 0.19 18.3 0.00 7.48 11 19 90 0.69 0.76 0.84 0.83 0.0ST07-180 80 1.65 0.05 80973 3.33 232 320 829 93 1.09 1.29 1.38 0.84 0.5TT17c-30 60 6.69 0.18 24.5 0.00 8.66 12.4 22.8 89 0.70 0.72 0.81 0.85 0.0TT17d-60 60 6.51 0.18 79.6 0.00 7.36 30.7 54.3 96 0.71 0.78 0.81 0.86 0.0BLT12e-120 60 6.42 0.18 168 0.01 6.94 47.5 93.3 94 0.76 0.77 0.83 0.87 0.0TT17e-120 60 6.39 0.18 3.41 0.00 7.38 44.1 91.9 97 0.73 0.79 0.83 0.87 0.0BLT02-180 80 2.76 0.08 1304 0.05 7.77 262 490 97 1.22 1.23 1.23 1.26 0.0ST04-180 80 <0.5 0.01 49568 2.04 148 349 734 110 1.29 1.30 1.46 1.60 0.1BLT01-180 95 2.44 0.07 1610 0.07 7.63 253 464 95 1.38 1.35 1.45BLT10a-10 80 34.5 0.95 292 0.01 37.1 61.8 186 93 0.00 -0.01 0.08BLT10e-120 80 33.2 0.91 771 0.03 36.9 90.7 417 102 0.02 0.02 0.06BLT11e-120 80 50.9 1.40 771 0.03 56.9 113 399 122 -0.21 -0.20 -0.07BLT13a-10 80 6.9 0.19 64.9 0.00 7.57 29 44.9 97 0.75 0.69 0.79BLT13e-120 80 5.43 0.15 673 0.03 7.46 79.6 211 99 0.88 0.81 0.90TT18a-10 95 7.39 0.20 154 0.01 7.55 42.3 87.3 94 0.77 0.77 0.86TT18e-120 95 6.12 0.17 464 0.02 8.1 63.3 184 91 0.86 0.85 0.94
outside calibration range
-2.0
-1.5
-1.0
-0.5
0.0
0.5
1.0
1.5
2.0
2.5
3.0
-2.0 -1.0 0.0 1.0 2.0
APPENDIX B - pH Calibration and Pitzer-Hydration Model Outputs
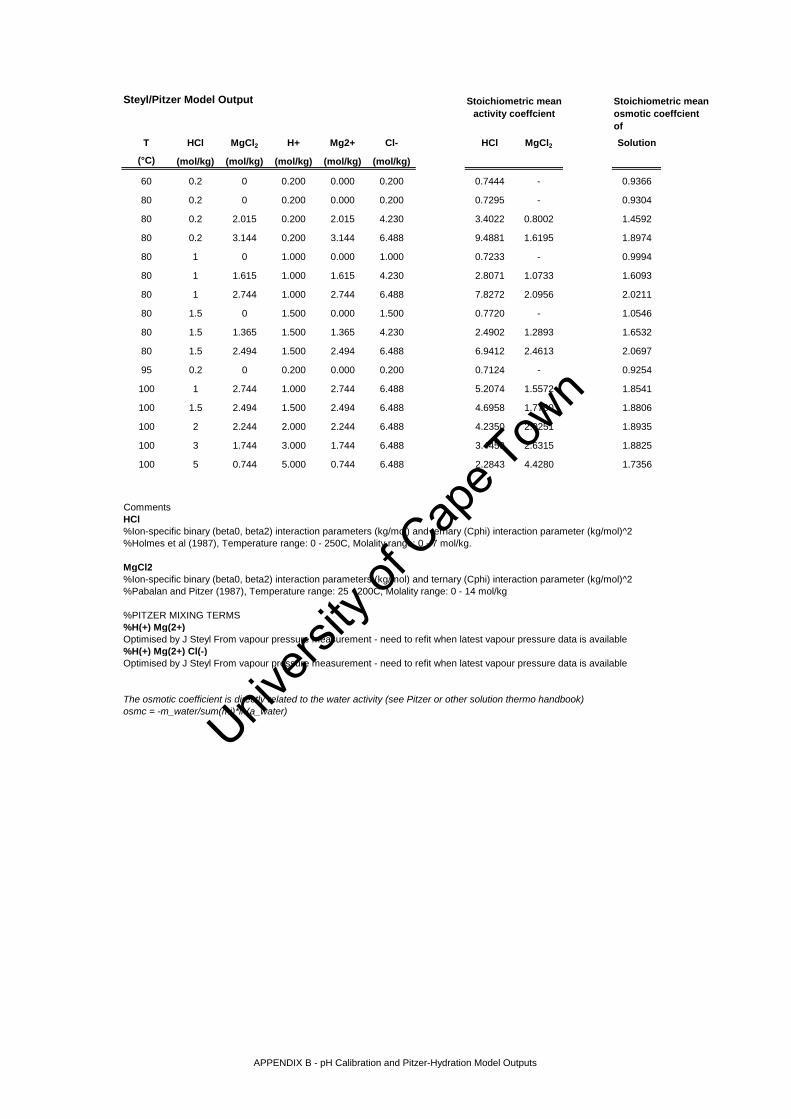
Univers
ity of
Cap
e Tow
n
Steyl/Pitzer Model Output
T HCl MgCl2 H+ Mg2+ Cl- HCl MgCl2 Solution
(°C) (mol/kg) (mol/kg) (mol/kg) (mol/kg) (mol/kg)
60 0.2 0 0.200 0.000 0.200 0.7444 - 0.9366
80 0.2 0 0.200 0.000 0.200 0.7295 - 0.9304
80 0.2 2.015 0.200 2.015 4.230 3.4022 0.8002 1.4592
80 0.2 3.144 0.200 3.144 6.488 9.4881 1.6195 1.8974
80 1 0 1.000 0.000 1.000 0.7233 - 0.9994
80 1 1.615 1.000 1.615 4.230 2.8071 1.0733 1.6093
80 1 2.744 1.000 2.744 6.488 7.8272 2.0956 2.0211
80 1.5 0 1.500 0.000 1.500 0.7720 - 1.0546
80 1.5 1.365 1.500 1.365 4.230 2.4902 1.2893 1.6532
80 1.5 2.494 1.500 2.494 6.488 6.9412 2.4613 2.0697
95 0.2 0 0.200 0.000 0.200 0.7124 - 0.9254
100 1 2.744 1.000 2.744 6.488 5.2074 1.5572 1.8541
100 1.5 2.494 1.500 2.494 6.488 4.6958 1.7760 1.8806
100 2 2.244 2.000 2.244 6.488 4.2350 2.0251 1.8935
100 3 1.744 3.000 1.744 6.488 3.4459 2.6315 1.8825
100 5 0.744 5.000 0.744 6.488 2.2843 4.4280 1.7356
CommentsHCl%Ion-specific binary (beta0, beta2) interaction parameters (kg/mol) and ternary (Cphi) interaction parameter (kg/mol)^2%Holmes et al (1987), Temperature range: 0 - 250C, Molality range: 0 - 7 mol/kg.
MgCl2%Ion-specific binary (beta0, beta2) interaction parameters (kg/mol) and ternary (Cphi) interaction parameter (kg/mol)^2%Pabalan and Pitzer (1987), Temperature range: 25 - 200C, Molality range: 0 - 14 mol/kg
%PITZER MIXING TERMS%H(+) Mg(2+)Optimised by J Steyl From vapour pressure measurement - need to refit when latest vapour pressure data is available%H(+) Mg(2+) Cl(-)Optimised by J Steyl From vapour pressure measurement - need to refit when latest vapour pressure data is available
The osmotic coefficient is directly related to the water activity (see Pitzer or other solution thermo handbook)osmc = -m_water/sum(mi)*ln(a_water)
Stoichiometric mean activity coeffcient
Stoichiometric mean osmotic coeffcient of
APPENDIX B - pH Calibration and Pitzer-Hydration Model Outputs

Univers
ity of
Cap
e Tow
n
APPENDIX C
Density Measurement

Univers
ity of
Cap
e Tow
n
Density Worksheet
temperature stock soln No. pycnometer No. volume mass pycnometer mass with solution Solution Density pycnometer No. volume mass pycnometer mass with solution Solution Density Average Std. dev°C ml g g kg/l ml g g kg/l kg/l20 10 25 49.89 38.216 88.216 1.002 24 50.04 38.575 88.813 1.004 1.003 0.129%20 11 27 50.15 37.007 88.391 1.025 7 49.98 41.182 92.554 1.028 1.026 0.227%20 12 11 49.72 43.210 94.998 1.042 17 50.00 37.006 88.897 1.038 1.040 0.270%20 13 21 50.02 40.400 92.260 1.037 25 49.89 38.216 89.981 1.038 1.037 0.058%20 14 15 49.97 41.508 96.968 1.110 20 49.87 40.677 95.991 1.109 1.110 0.043%20 15 29 49.85 41.528 100.175 1.177 14 49.84 40.094 98.809 1.178 1.177 0.110%20 1 13 49.93 40.887 93.068 1.045 10 49.90 37.858 90.013 1.045 1.045 0.005%20 2 12 49.90 37.628 93.359 1.117 23 50.10 38.241 94.206 1.117 1.117 0.010%20 3 19 50.16 36.049 95.468 1.185 17 50.00 37.006 96.228 1.184 1.184 0.008%20 4 17 50.00 37.006 90.063 1.061 15 49.97 41.508 94.543 1.061 1.061 0.012%20 5 23 50.10 38.241 94.951 1.132 25 49.89 38.216 94.713 1.132 1.132 0.039%20 6 29 49.85 41.528 101.275 1.199 7 49.98 41.182 101.106 1.199 1.199 0.024%20 7 13 49.93 40.887 94.699 1.078 20 49.87 40.677 94.412 1.078 1.078 0.020%20 8 14 49.84 40.094 97.267 1.147 27 50.15 37.007 94.519 1.147 1.147 0.023%20 9 19 50.16 36.049 96.920 1.213 12 49.90 37.628 98.178 1.213 1.213 0.002%60 1 27 50.15 37.007 88.661 1.030 15 49.82 41.508 92.998 1.034 1.032 0.251%60 2 25 49.89 38.216 93.197 1.102 23 50.15 38.241 93.471 1.101 1.102 0.053%60 3 24 50.04 38.575 97.085 1.169 21 50.05 40.400 98.903 1.169 1.169 0.026%60 4 13 49.93 40.887 93.112 1.046 10 49.87 37.858 90.055 1.047 1.046 0.037%60 5 11 49.72 43.210 98.760 1.117 12 49.85 37.628 93.351 1.118 1.118 0.044%60 6 7 49.98 41.182 100.442 1.186 27 50.16 37.007 96.424 1.185 1.185 0.079%60 7 29 49.85 41.528 94.530 1.063 17 50.01 37.006 90.165 1.063 1.063 0.016%60 8 14 49.84 40.094 96.588 1.133 20 49.90 40.677 97.098 1.131 1.132 0.196%60 9 19 50.16 36.049 96.164 1.198 25 49.87 38.216 98.037 1.200 1.199 0.080%95 1 17 50.00 37.006 87.016 1.000 7 49.14 41.182 91.128 1.016 1.008 1.150%95 2 11 49.72 43.210 96.703 1.076 10 49.57 37.858 91.453 1.081 1.079 0.382%95 3 21 50.02 40.400 97.923 1.150 15 49.53 41.508 99.126 1.163 1.157 0.948%95 4 20 49.87 40.677 91.272 1.015 19 49.36 36.049 87.369 1.040 1.027 1.782%95 5 13 49.93 40.887 95.440 1.093 14 49.44 40.094 94.674 1.104 1.098 0.793%95 6 24 50.04 38.575 96.904 1.166 27 49.28 37.007 95.500 1.187 1.176 1.495%95 7 25 49.89 38.216 89.668 1.031 12 49.24 37.628 89.049 1.044 1.038 0.913%95 8 15 49.97 41.508 97.139 1.113 23 49.73 38.241 94.005 1.121 1.117 0.569%95 9 29 49.85 41.528 100.439 1.182 11 49.25 43.210 101.891 1.192 1.187 0.694%90 1 repeat 23 50.14 38.24 96.1014 1.154 11 49.73 43.21 100.6718 1.155 1.155 0.088%90 2 repeat 20 49.89 40.68 98.911 1.167 25 49.94 38.21 96.5538 1.168 1.168 0.061%90 3 repeat 29 49.89 41.53 100.4858 1.182 11 49.73 43.21 101.9732 1.182 1.182 0.017%20 1 repeat 11 49.73 43.21 102.1128 1.184 23 50.14 38.24 97.6458 1.185 1.185 0.042%
1.782% maxt-test: 0.0029 0.002% min
99.7072 % probability of no difference between replicates A and B
BA
APPENDIX C - Density Measurement

Univers
ity of
Cap
e Tow
n
Pycnometer Calibration
pycnometer No. dry mass pycnometer + water @20°C
Calculated volume
pycnometer + water @60°C
Calculated volume
pycnometer + water @95°C
Calculated volume
g g ml g ml g ml7 41.182 91.074 49.98 90.334 49.99 88.449 49.14
10 37.858 87.667 49.90 86.895 49.87 85.535 49.5711 43.210 92.840 49.72 92.101 49.73 90.579 49.2512 37.628 87.438 49.90 86.637 49.85 84.996 49.2413 40.887 90.724 49.93 89.941 49.89 88.649 49.6514 40.094 89.845 49.84 89.073 49.82 87.654 49.4415 41.508 91.391 49.97 90.490 49.82 89.148 49.5316 38.526 88.69 50.25 87.84 50.16 86.423 49.7917 37.006 86.918 50.00 86.173 50.01 84.696 49.5819 36.049 86.122 50.16 85.393 50.19 83.526 49.3620 40.677 90.456 49.87 89.737 49.90 88.170 49.3721 40.400 90.332 50.02 89.606 50.05 88.030 49.5223 38.241 88.254 50.10 87.549 50.15 86.079 49.7324 38.575 88.522 50.04 87.752 50.02 86.300 49.6225 38.216 88.017 49.89 87.249 49.87 85.807 49.4827 37.007 87.067 50.15 86.326 50.16 84.413 49.2829 41.528 91.287 49.85 90.535 49.84 89.031 49.38
Pycnometer Calibration - Repeats
pycnometer No. dry mass pycnometer + water @20°C
Calculated volume
pycnometer + water @90°C
Calculated volume
g g ml g ml11 43.2105 92.8558 49.73 91.033 49.5420 40.6763 90.4738 49.89 88.752 49.8023 38.2398 88.285 50.14 86.696 50.2025 38.2148 88.0648 49.94 86.480 50.0029 41.5290 91.3284 49.89 89.701 49.90
Density @20°C * 998.204 kg/m3
Density @60°C * 983.200 kg/m3
Density @90°C * 965.321 kg/m3
Density @95°C * 961.902 kg/m3
* Perry's p. 3-76
APPENDIX C - Density Measurement

Univers
ity of
Cap
e Tow
n
Literature and Interpolated Data HCl MgCl2
Weast wt % M density, 20ºC Weast wt % M density, 20ºC0 0 0.9982 0 0 0.9982
0.5 0.137 1.0007 0.5 0.053 1.00221 0.275 1.0031 1 0.106 1.0062
1.5 0.414 1.0056 2 0.213 1.01442 0.553 1.0081 Density @20°C *998.204 kg/m3 3 0.322 1.0226
2.5 0.693 1.0105 Density @60°C *983.200 kg/m3 4 0.433 1.03093 0.833 1.013 Density @95°C *961.902 kg/m3 5 0.546 1.0394
3.5 0.975 1.0154 6 0.66 1.04794 1.116 1.0179 7 0.777 1.0564
4.5 1.259 1.0204 8 0.895 1.06515 1.402 1.0228 9 1.015 1.0738
5.5 1.546 1.0253 10 1.137 1.08266 1.691 1.0278 12 1.387 1.1005
6.5 1.836 1.0302 14 1.645 1.11897 1.982 1.0327 16 1.911 1.1372
7.5 2.129 1.0352 18 2.184 1.15538 2.276 1.0377 20 2.466 1.1742
8.5 2.424 1.0401 22 2.758 1.19389 2.573 1.0426 24 3.06 1.214
9.5 2.722 1.045110 2.872 1.0476
curve fit curve fitPerry wt % 20ºC 60ºC 80ºC 100ºC 95 wt % 20ºC 60ºC 80ºC 100ºC 95
1 1.0032 0.9881 0.9768 0.9636 0.9673 Perry 2 1.0146 0.9995 0.9883 0.9753 0.9789072 1.0082 0.9930 0.9819 0.9688 0.9724 4 1.0311 1.0159 1.005 0.9923 0.9957654 1.0181 1.0026 0.9919 0.9791 0.9826 8 1.0646 1.0493 1.0388 1.026 1.029486 1.0279 1.0121 1.0016 0.9892 0.9925 12 1.0989 1.0836 1.0735 1.0622 1.0651238 1.0376 1.0215 1.0111 0.9992 1.0023 16 1.1342 1.1188 1.1092 1.0984 1.101112
10 1.0474 1.0310 1.0206 1.0090 1.0119 20 1.1706 1.1552 1.146 1.1359 1.138632
wt% M dens Weast wt% M dens Weast1.809 0.5 1.0071 4.593 0.5 1.03595.340 1.5 1.0245 12.876 1.5 1.10868.755 2.5 1.0414 20.233 2.5 1.1765
curve fit curve fit curve fit curve fitwt% M dens 20 Perry dens 60 dens 95 wt% M dens 20 Perry dens 60 dens 95
1.809 0.5 1.0072 0.992077 0.97236233 4.593 0.5 1.0361 1.020421 1.0003295.340 1.5 1.0270 1.008961 0.9892136 12.876 1.5 1.1066 1.091748 1.0729898.755 2.5 1.0413 1.025111 1.00598141 20.233 2.5 1.1728 1.156752 1.140583
Temp, °C0 0.5 1.5 2.5
20 1.007 1.027 1.041 Perry p. 3-801.007 1.025 1.041 Weast p. D-240
% diff -0.005 -0.120 0.005
Temp, °C0 0.5 1.5 2.5
20 1.036 1.107 1.173 Perry p. 3-801.036 1.109 1.176 Weast p. D-244
% diff -0.006 0.087 0.156
density, kg/l density, kg/l
HCl, M
MgCl2, M
APPENDIX C - Density Measurement
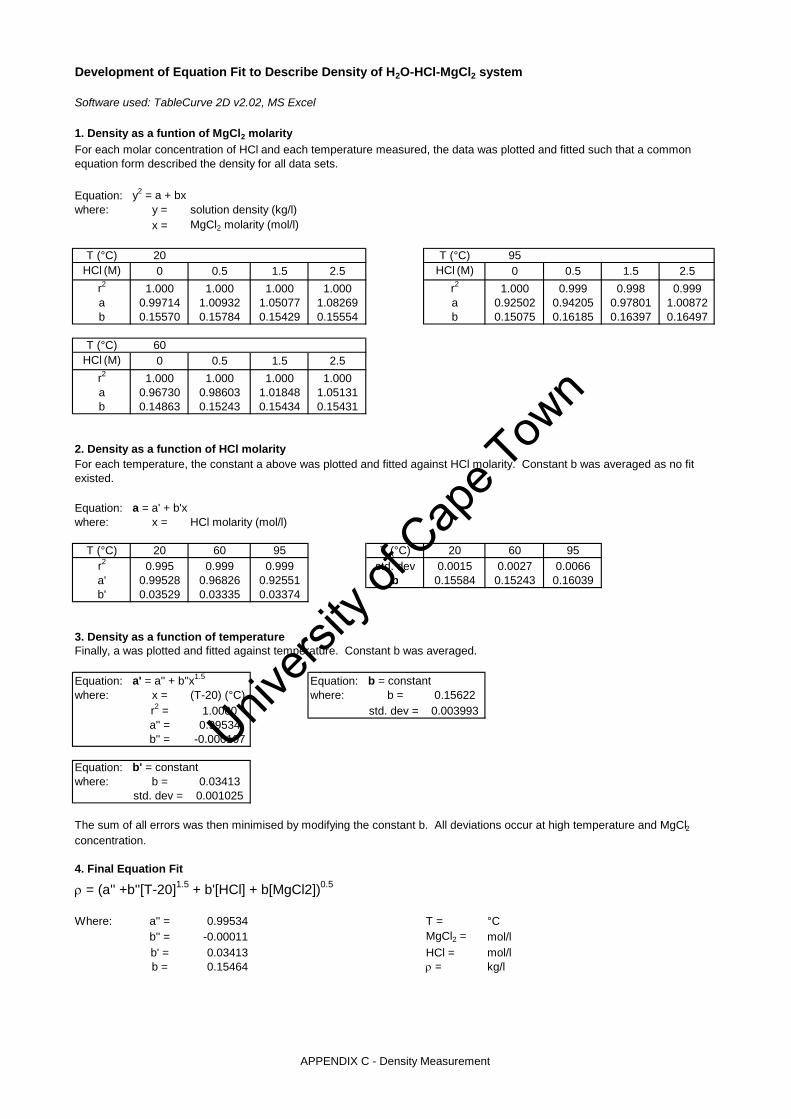
Univers
ity of
Cap
e Tow
n
Development of Equation Fit to Describe Density of H2O-HCl-MgCl2 system
Software used: TableCurve 2D v2.02, MS Excel
1. Density as a funtion of MgCl2 molarity
Equation: y2 = a + bxwhere: y = solution density (kg/l)
x = MgCl2 molarity (mol/l)
T (°C) 20 T (°C) 95HCl (M) 0 0.5 1.5 2.5 HCl (M) 0 0.5 1.5 2.5
r2 1.000 1.000 1.000 1.000 r2 1.000 0.999 0.998 0.999a 0.99714 1.00932 1.05077 1.08269 a 0.92502 0.94205 0.97801 1.00872b 0.15570 0.15784 0.15429 0.15554 b 0.15075 0.16185 0.16397 0.16497
T (°C) 60HCl (M) 0 0.5 1.5 2.5
r2 1.000 1.000 1.000 1.000a 0.96730 0.98603 1.01848 1.05131b 0.14863 0.15243 0.15434 0.15431
2. Density as a function of HCl molarity
Equation: a = a' + b'xwhere: x = HCl molarity (mol/l)
T (°C) 20 60 95 T (°C) 20 60 95r2 0.995 0.999 0.999 std. dev 0.0015 0.0027 0.0066a' 0.99528 0.96826 0.92551 b 0.15584 0.15243 0.16039b' 0.03529 0.03335 0.03374
3. Density as a function of temperature
Equation: a' = a'' + b''x1.5 Equation: b = constantwhere: x = (T-20) (°C) where: b = 0.15622
r2 = 1.0000 std. dev = 0.003993a'' = 0.99534b'' = -0.000107
Equation: b' = constantwhere: b = 0.03413
std. dev = 0.001025
4. Final Equation Fit
ρ = (a'' +b''[T-20]1.5 + b'[HCl] + b[MgCl2])0.5
Where: a'' = 0.99534 T = °Cb'' = -0.00011 MgCl2 = mol/lb' = 0.03413 HCl = mol/lb = 0.15464 ρ = kg/l
Finally, a was plotted and fitted against temperature. Constant b was averaged.
The sum of all errors was then minimised by modifying the constant b. All deviations occur at high temperature and MgCl2
concentration.
For each molar concentration of HCl and each temperature measured, the data was plotted and fitted such that a common equation form described the density for all data sets.
For each temperature, the constant a above was plotted and fitted against HCl molarity. Constant b was averaged as no fit existed.
APPENDIX C - Density Measurement
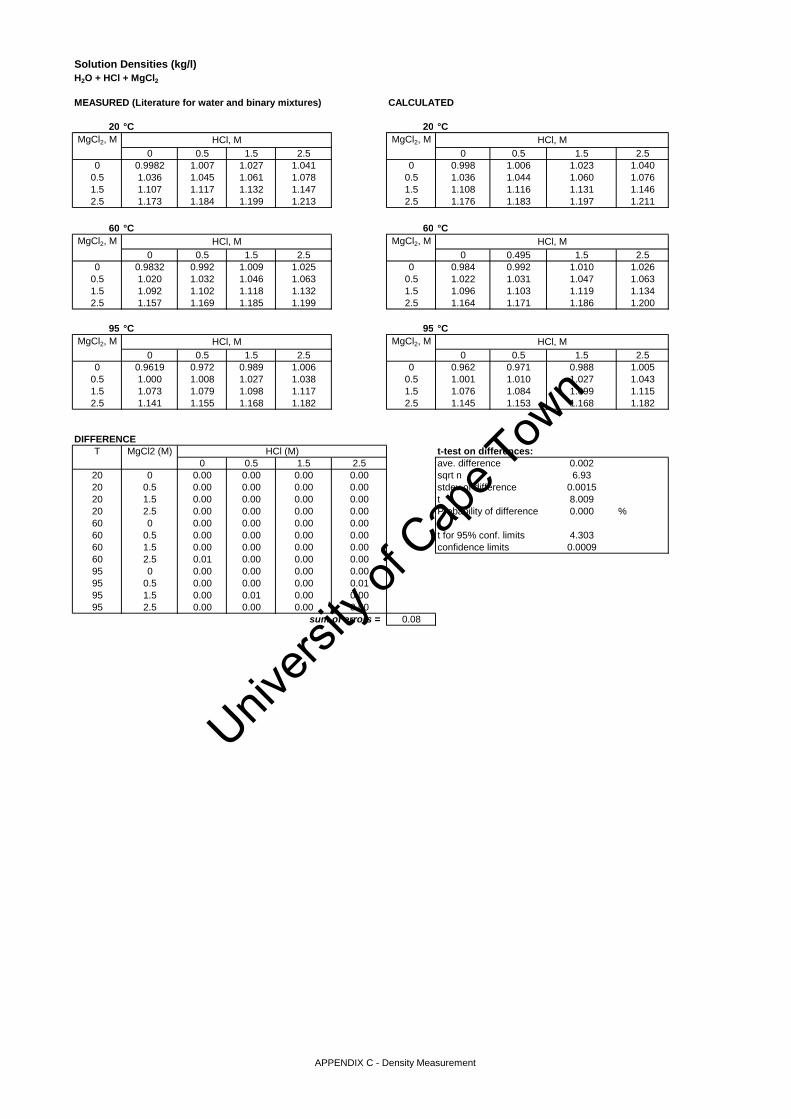
Univers
ity of
Cap
e Tow
n
Solution Densities (kg/l)H2O + HCl + MgCl2
MEASURED (Literature for water and binary mixtures) CALCULATED
20 °C 20 °CMgCl2, M MgCl2, M
0 0.5 1.5 2.5 0 0.5 1.5 2.50 0.9982 1.007 1.027 1.041 0 0.998 1.006 1.023 1.040
0.5 1.036 1.045 1.061 1.078 0.5 1.036 1.044 1.060 1.0761.5 1.107 1.117 1.132 1.147 1.5 1.108 1.116 1.131 1.1462.5 1.173 1.184 1.199 1.213 2.5 1.176 1.183 1.197 1.211
60 °C 60 °CMgCl2, M MgCl2, M
0 0.5 1.5 2.5 0 0.495 1.5 2.50 0.9832 0.992 1.009 1.025 0 0.984 0.992 1.010 1.026
0.5 1.020 1.032 1.046 1.063 0.5 1.022 1.031 1.047 1.0631.5 1.092 1.102 1.118 1.132 1.5 1.096 1.103 1.119 1.1342.5 1.157 1.169 1.185 1.199 2.5 1.164 1.171 1.186 1.200
95 °C 95 °CMgCl2, M MgCl2, M
0 0.5 1.5 2.5 0 0.5 1.5 2.50 0.9619 0.972 0.989 1.006 0 0.962 0.971 0.988 1.005
0.5 1.000 1.008 1.027 1.038 0.5 1.001 1.010 1.027 1.0431.5 1.073 1.079 1.098 1.117 1.5 1.076 1.084 1.099 1.1152.5 1.141 1.155 1.168 1.182 2.5 1.145 1.153 1.168 1.182
DIFFERENCET MgCl2 (M) t-test on differences:
0 0.5 1.5 2.5 ave. difference 0.00220 0 0.00 0.00 0.00 0.00 sqrt n 6.9320 0.5 0.00 0.00 0.00 0.00 stdev of difference 0.001520 1.5 0.00 0.00 0.00 0.00 t 8.00920 2.5 0.00 0.00 0.00 0.00 Probability of difference 0.000 %60 0 0.00 0.00 0.00 0.0060 0.5 0.00 0.00 0.00 0.00 t for 95% conf. limits 4.30360 1.5 0.00 0.00 0.00 0.00 confidence limits 0.000960 2.5 0.01 0.00 0.00 0.0095 0 0.00 0.00 0.00 0.0095 0.5 0.00 0.00 0.00 0.0195 1.5 0.00 0.01 0.00 0.0095 2.5 0.00 0.00 0.00 0.00
sum of errors = 0.08
HCl (M)
HCl, M HCl, M
HCl, M HCl, M
HCl, M HCl, M
APPENDIX C - Density Measurement

Univers
ity of
Cap
e Tow
n
APPENDIX D
Mineralogical Analyses

Univers
ity of
Cap
e Tow
n
APPENDIX D – Mineralogical Analyses
AS040065 Brief Note No.1 Solly Theron Table 1 Mineral Abundance Analysis of Barro Alto WTO Acido ore, size fraction +10µm to -38µm (Karen MacKellar).
Mineral WTO Acido
+10/-38µm Serpentine - Altered Serpentine : 73.92 Fe-hydroxides : 7.96 Clay (Smectitic) : 4.07 Talc : 3.15 Clinopyroxene/Clinoamphibole : 4.45 Cr-spinel : 2.41 Quartz : 0.65 Chlorite : 0.67 Olivine/Orthopyroxene : 1.03 Fe-oxide (Hematite/Magnetite) : 0.18 Mn-hydroxide : 0.41 Others : 1.10
Total: 100.00 The group “others” include analyses that could not be positively identified, dolomite, and Al-hydroxides. Table 2 Comparison between the mineralogy of Karen MacKellar’s Barro Alto WTO Acido +10/-38µm sample and the bulk WTO Acido I ore.
Mineral WTO Acido
(+10/-38µm)
WTO Acido I* (Bulk)
Serpentine - Altered Serpentine : 73.92 63.02 Fe-hydroxides : 7.96 18.14 Clay (Smectitic) 4.07 4.98 Talc : 3.15 3.37 Clinopyroxene/Clinoamphibole : 4.45 2.98 Cr-spinel : 2.41 2.41 Quartz : 0.65 1.05 Chlorite : 0.67 0.99 Olivine/Orthopyroxene : 1.03 0.43 Fe-oxide (Hematite/Magnetite) 0.18 0.41 Mn-hydroxide : 0.41 0.27 Others : 1.10 1.96
Total: 100.00 100.00
The group “others” include analyses that could not be positively identified, dolomite, and Al-hydroxides. *There are minor differences between this mineral abundance analyses and that reported in AARL Process Mineralogy Technical Note No.2 dated 22 December 2004. This is due to a refinement of the ASCAN mineral processing software.
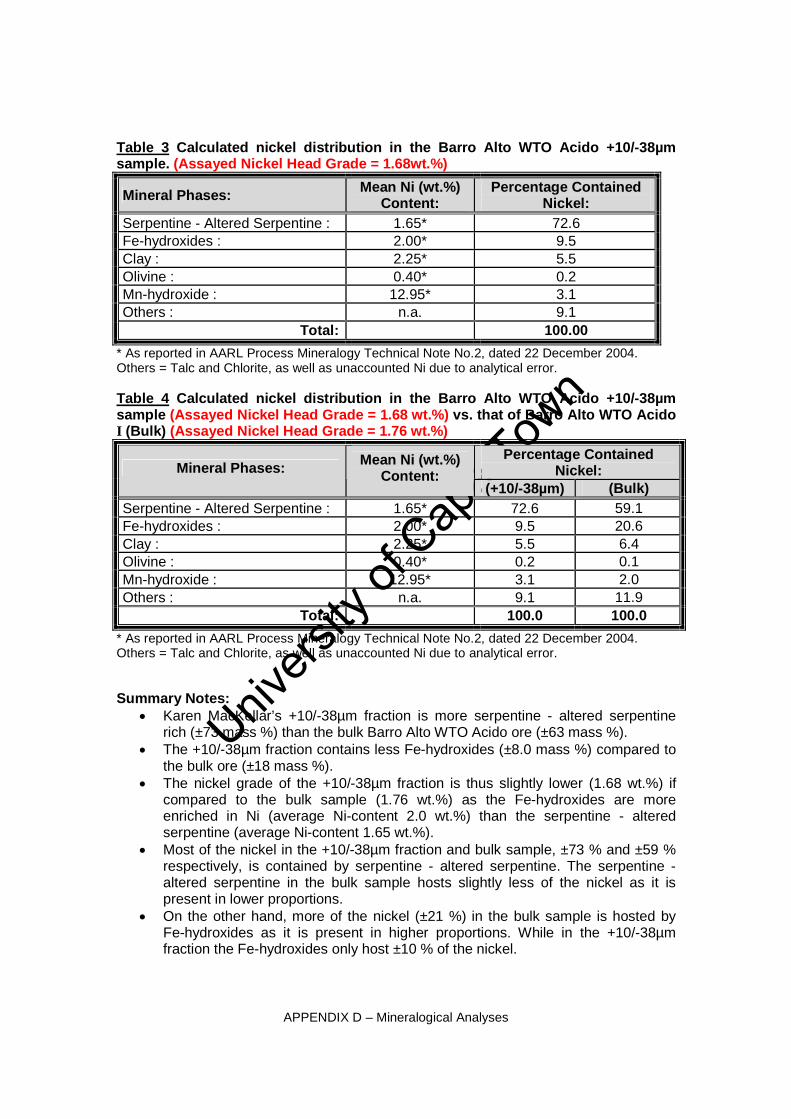
Univers
ity of
Cap
e Tow
n
APPENDIX D – Mineralogical Analyses
Table 3 Calculated nickel distribution in the Barro Alto WTO Acido +10/-38µm sample. (Assayed Nickel Head Grade = 1.68wt.%)
Mineral Phases: Mean Ni (wt.%) Content:
Percentage Contained Nickel:
Serpentine - Altered Serpentine : 1.65* 72.6 Fe-hydroxides : 2.00* 9.5 Clay : 2.25* 5.5 Olivine : 0.40* 0.2 Mn-hydroxide : 12.95* 3.1 Others : n.a. 9.1
Total: 100.00 * As reported in AARL Process Mineralogy Technical Note No.2, dated 22 December 2004. Others = Talc and Chlorite, as well as unaccounted Ni due to analytical error. Table 4 Calculated nickel distribution in the Barro Alto WTO Acido +10/-38µm sample (Assayed Nickel Head Grade = 1.68 wt.%) vs. that of Barro Alto WTO Acido I (Bulk) (Assayed Nickel Head Grade = 1.76 wt.%)
Percentage Contained Nickel: Mineral Phases: Mean Ni (wt.%)
Content: (+10/-38µm) (Bulk)
Serpentine - Altered Serpentine : 1.65* 72.6 59.1 Fe-hydroxides : 2.00* 9.5 20.6 Clay : 2.25* 5.5 6.4 Olivine : 0.40* 0.2 0.1 Mn-hydroxide : 12.95* 3.1 2.0 Others : n.a. 9.1 11.9
Total: 100.0 100.0 * As reported in AARL Process Mineralogy Technical Note No.2, dated 22 December 2004. Others = Talc and Chlorite, as well as unaccounted Ni due to analytical error. Summary Notes:
Karen MacKellar’s +10/-38µm fraction is more serpentine - altered serpentine rich (±73 mass %) than the bulk Barro Alto WTO Acido ore (±63 mass %).
The +10/-38µm fraction contains less Fe-hydroxides (±8.0 mass %) compared to the bulk ore (±18 mass %).
The nickel grade of the +10/-38µm fraction is thus slightly lower (1.68 wt.%) if compared to the bulk sample (1.76 wt.%) as the Fe-hydroxides are more enriched in Ni (average Ni-content 2.0 wt.%) than the serpentine - altered serpentine (average Ni-content 1.65 wt.%).
Most of the nickel in the +10/-38µm fraction and bulk sample, ±73 % and ±59 % respectively, is contained by serpentine - altered serpentine. The serpentine - altered serpentine in the bulk sample hosts slightly less of the nickel as it is present in lower proportions.
On the other hand, more of the nickel (±21 %) in the bulk sample is hosted by Fe-hydroxides as it is present in higher proportions. While in the +10/-38µm fraction the Fe-hydroxides only host ±10 % of the nickel.
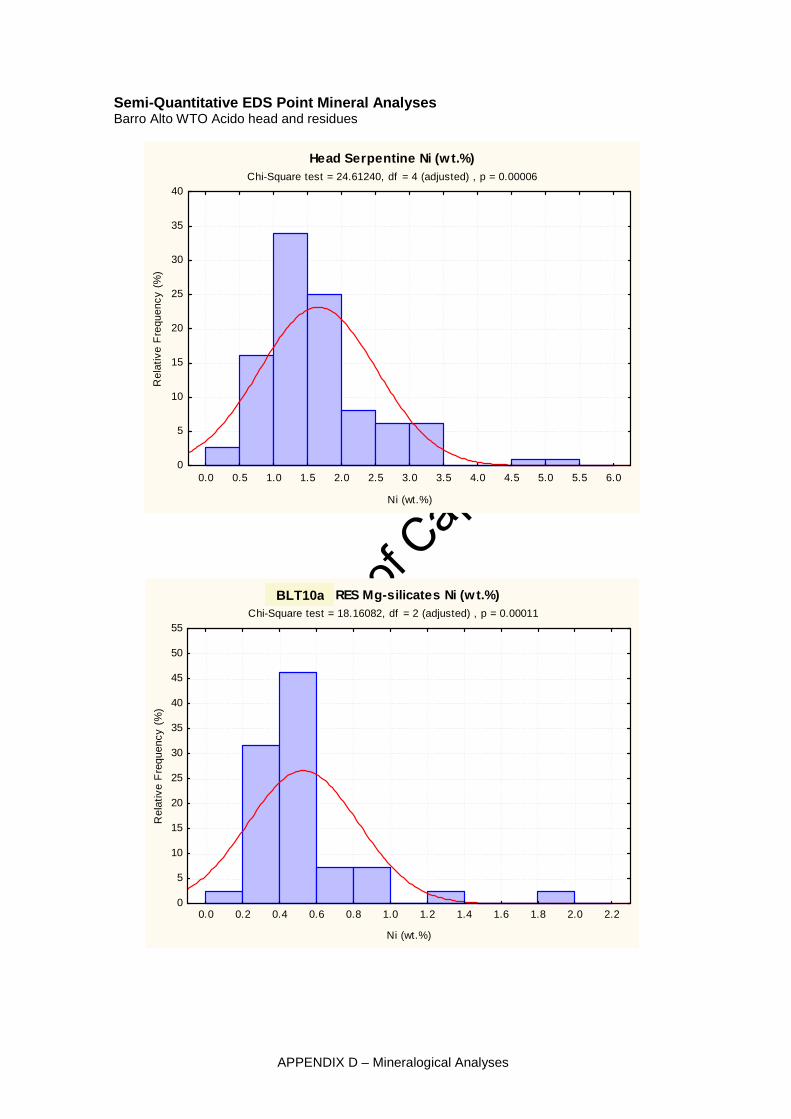
Univers
ity of
Cap
e Tow
n
APPENDIX D – Mineralogical Analyses
Semi-Quantitative EDS Point Mineral Analyses Barro Alto WTO Acido head and residues
BLT16a RES Mg-silicates Ni (w t.%)Chi-Square test = 18.16082, df = 2 (adjusted) , p = 0.00011
0.0 0.2 0.4 0.6 0.8 1.0 1.2 1.4 1.6 1.8 2.0 2.2
Ni (wt.%)
0
5
10
15
20
25
30
35
40
45
50
55
Rel
ativ
e F
requ
ency
(%
)
BLT10a
Head Serpentine Ni (w t.%)Chi-Square test = 24.61240, df = 4 (adjusted) , p = 0.00006
0.0 0.5 1.0 1.5 2.0 2.5 3.0 3.5 4.0 4.5 5.0 5.5 6.0
Ni (wt.%)
0
5
10
15
20
25
30
35
40
Rel
ativ
e F
requ
ency
(%
)
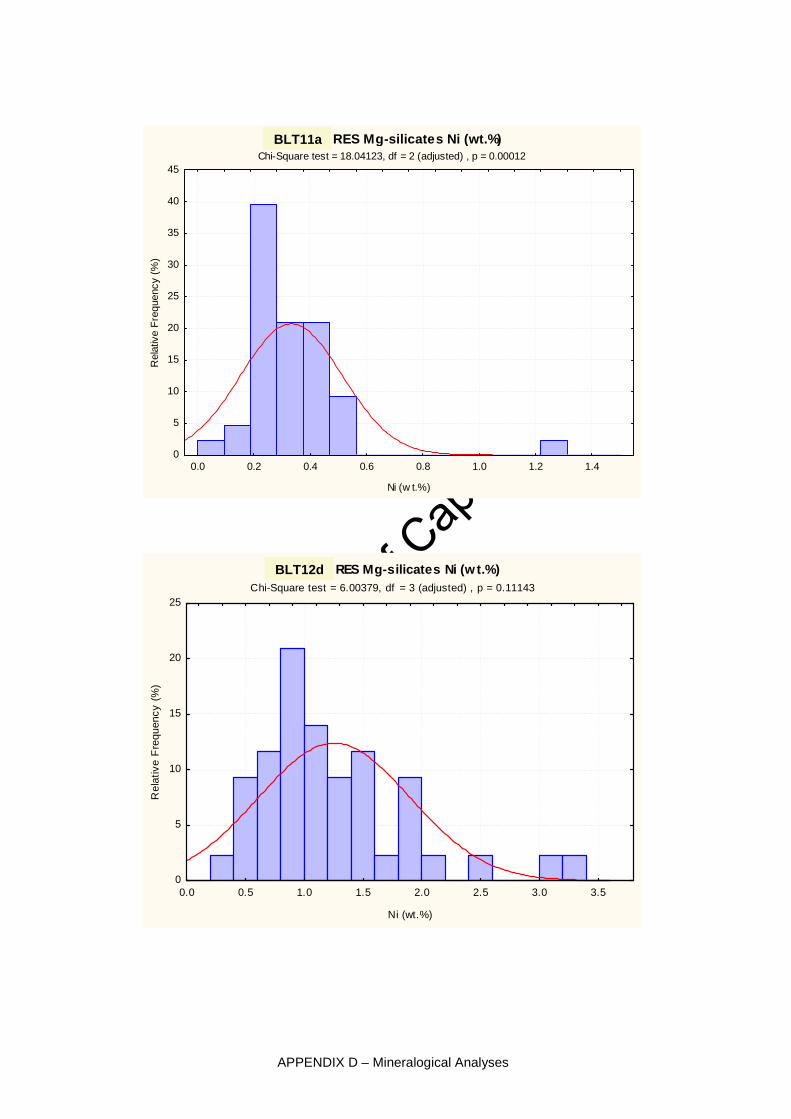
Univers
ity of
Cap
e Tow
n
APPENDIX D – Mineralogical Analyses
BLT18d RES Mg-silicates Ni (w t.%)Chi-Square test = 6.00379, df = 3 (adjusted) , p = 0.11143
0.0 0.5 1.0 1.5 2.0 2.5 3.0 3.5
Ni (wt.%)
0
5
10
15
20
25
Rel
ativ
e Fr
eque
ncy
(%)
BLT17a RES Mg-silicates Ni (wt.%)Chi-Square test = 18.04123, df = 2 (adjusted) , p = 0.00012
0.0 0.2 0.4 0.6 0.8 1.0 1.2 1.4
Ni (w t.%)
0
5
10
15
20
25
30
35
40
45R
elat
ive
Freq
uenc
y (%
) BLT11a
BLT12d

Univers
ity of
Cap
e Tow
n
APPENDIX D – Mineralogical Analyses
RT 20a RES Mg-silicates Ni (w t.%)Chi-Square test = 1.69117, df = 2 (adjusted) , p = 0.42931
0.0 0.2 0.4 0.6 0.8 1.0
Ni (wt.%)
0
5
10
15
20
25
30
35
Rel
ativ
e Fr
eque
ncy
(%)
BLT19a RES Mg-silicates Ni (wt.%)Chi-Square test = 27.16003, df = 3 (adjusted) , p = 0.00001
0.0 0.5 1.0 1.5 2.0 2.5
Ni (w t.%)
0
5
10
15
20
25
30
35
40R
elat
ive
Freq
uenc
y (%
)
BLT14a
ST15a

Univers
ity of
Cap
e Tow
n
APPENDIX D – Mineralogical Analyses
RT21a RES Mg-silicates Ni (wt.%)Chi-Square test = 8.99126, df = 1 (adjusted) , p = 0.00271
0.0 0.1 0.2 0.3 0.4 0.5 0.6 0.7 0.8 0.9 1.0 1.1
Ni (w t.%)
0
5
10
15
20
25
30
35
40
45
50
Rel
ativ
e Fr
eque
ncy
(%)
ST16a
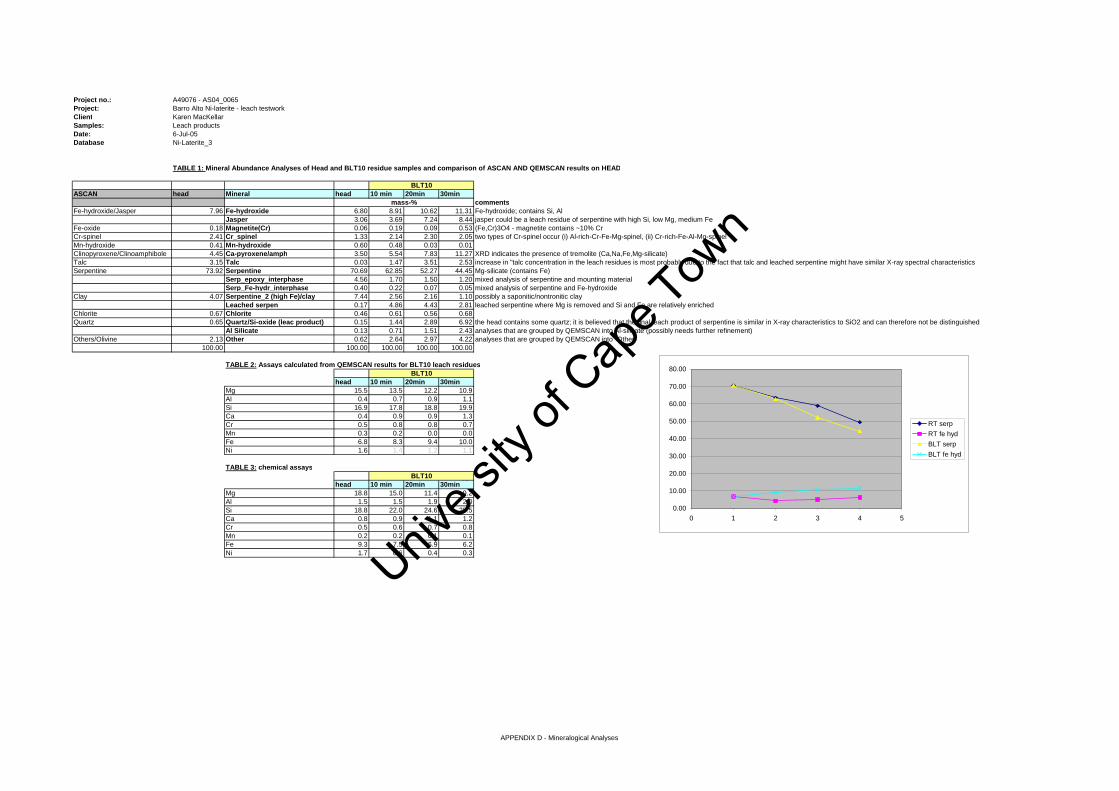
Univers
ity of
Cap
e Tow
n
Project no.: A49076 - AS04_0065Project: Barro Alto Ni-laterite - leach testworkClient Karen MacKellarSamples: Leach products Date: 6-Jul-05Database Ni-Laterite_3
TABLE 1: Mineral Abundance Analyses of Head and BLT10 residue samples and comparison of ASCAN AND QEMSCAN results on HEAD
ASCAN head Mineral head 10 min 20min 30mincomments
Fe-hydroxide/Jasper 7.96 Fe-hydroxide 6.80 8.91 10.62 11.31 Fe-hydroxide; contains Si, AlJasper 3.06 3.69 7.24 8.44 jasper could be a leach residue of serpentine with high Si, low Mg, medium Fe
Fe-oxide 0.18 Magnetite(Cr) 0.06 0.19 0.09 0.53 (Fe,Cr)3O4 - magnetite contains ~10% CrCr-spinel 2.41 Cr_spinel 1.33 2.14 2.30 2.05 two types of Cr-spinel occur (i) Al-rich-Cr-Fe-Mg-spinel, (ii) Cr-rich-Fe-Al-Mg-spinelMn-hydroxide 0.41 Mn-hydroxide 0.60 0.48 0.03 0.01Clinopyroxene/Clinoamphibole 4.45 Ca-pyroxene/amph 3.50 5.54 7.83 11.27 XRD indicates the presence of tremolite (Ca,Na,Fe,Mg-silicate)Talc 3.15 Talc 0.03 1.47 3.51 2.53 increase in "talc concentration in the leach residues is most probably due to the fact that talc and leached serpentine might have similar X-ray spectral characteristicsSerpentine 73.92 Serpentine 70.69 62.85 52.27 44.45 Mg-silicate (contains Fe)
Serp_epoxy_interphase 4.56 1.70 1.50 1.20 mixed analysis of serpentine and mounting materialSerp_Fe-hydr_interphase 0.40 0.22 0.07 0.05 mixed analysis of serpentine and Fe-hydroxide
Clay 4.07 Serpentine_2 (high Fe)/clay 7.44 2.56 2.16 1.10 possibly a saponitic/nontronitic clayLeached serpen 0.17 4.86 4.43 2.81 leached serpentine where Mg is removed and Si and Fe are relatively enriched
Chlorite 0.67 Chlorite 0.46 0.61 0.56 0.68Quartz 0.65 Quartz/Si-oxide (leac product) 0.15 1.44 2.89 6.92 the head contains some quartz; it is believed that the final leach product of serpentine is similar in X-ray characteristics to SiO2 and can therefore not be distinguished
Al Silicate 0.13 0.71 1.51 2.43 analyses that are grouped by QEMSCAN into Al-silicate (possibly needs further refinement)Others/Olivine 2.13 Other 0.62 2.64 2.97 4.22 analyses that are grouped by QEMSCAN into "Other"
100.00 100.00 100.00 100.00 100.00
TABLE 2: Assays calculated from QEMSCAN results for BLT10 leach residues
head 10 min 20min 30minMg 15.5 13.5 12.2 10.9Al 0.4 0.7 0.9 1.1Si 16.9 17.8 18.8 19.9Ca 0.4 0.9 0.9 1.3Cr 0.5 0.8 0.8 0.7Mn 0.3 0.2 0.0 0.0Fe 6.8 8.3 9.4 10.0Ni 1.6 1.4 1.2 1.1
TABLE 3: chemical assays
head 10 min 20min 30minMg 18.8 15.0 11.4 9.2Al 1.5 1.5 1.9 2.0Si 18.8 22.0 24.6 25.5Ca 0.8 0.9 1.1 1.2Cr 0.5 0.6 0.7 0.8Mn 0.2 0.2 0.1 0.1Fe 9.3 7.5 6.9 6.2Ni 1.7 0.6 0.4 0.3
BLT10
mass-%
BLT10
BLT10
0.00
10.00
20.00
30.00
40.00
50.00
60.00
70.00
80.00
0 1 2 3 4 5
RT serpRT fe hydBLT serpBLT fe hyd
APPENDIX D - Mineralogical Analyses

Univers
ity of
Cap
e Tow
n
TABLE 4: Mineral Abundance Analyses of Head and ST16 residue samples
Mineral head 10 min 20min 30minFe-hydroxide 6.80 4.26 4.94 6.29Jasper 3.06 0.81 3.34 3.39Magnetite(Cr) 0.06 0.14 0.15 0.00Cr_spinel 1.33 3.28 3.13 6.02Mn-hydroxide 0.60 0.04 0.47 0.01Ca-pyroxene/amph 3.50 10.17 9.46 12.70Talc 0.03 3.64 4.05 0.00Serpentine 70.69 63.48 58.95 49.47Serp_epoxy_interphase 4.56 0.31 0.69 0.00Serp_Fe-hydr_interphase 0.40 0.00 0.00 0.00Serpentine_2 (high Fe)/clay 7.44 0.04 0.33 0.00Leached serpen 0.17 1.79 2.36 0.00Chlorite 0.46 0.35 0.73 0.24Quartz/Si-oxide (leac product) 0.15 7.74 6.60 17.09Al Silicate 0.13 1.41 1.58 2.79Other 0.62 2.54 3.21 2.01
100.00 100.00 100.00 100.00
TABLE 5: Assays calculated from QEMSCAN results for ST16 leach residues
head 10 min 20min 30minMg 15.5 14.08 13.40 11.31Al 0.4 0.86 0.91 1.37Si 16.9 20.47 20.16 22.32Ca 0.4 1.07 1.13 1.29Cr 0.5 1.16 1.10 2.11Mn 0.3 0.02 0.23 0.00Fe 6.8 5.23 6.19 6.12Ni 1.6 1.16 1.19 0.96
TABLE 6: chemical assays
head 10 min 20min 30minMg 18.8 13.2 9.8 7.6Al 1.5 1.5 1.6 1.6Si 18.8 23.9 26.2 27.1Ca 0.8 0.9 0.9 1.0Cr 0.5 0.6 0.6 0.6Mn 0.2 0.1 0.1 < 0.05Fe 9.3 4.6 3.4 2.8Ni 1.7 0.3 0.2 0.2
ST16
ST16
ST16
APPENDIX D - Mineralogical Analyses

Univers
ity of
Cap
e Tow
n
APPENDIX E
Kinetic Calculations

Univers
ity of
Cap
e Tow
n
Batch Leaching of Barro Alto WTO acido (Saprolytic Laterite)
solid analyses used to calculate extraction, each point represents a separate testIt is proposed: rate of extraction = K.[H+]n[Cl-]mexp(-E/RT)
1. Effect of Acid Concentration
grind 46temp 80% solids 0.5[MgCl2] 0
test 13 10 11 Test 13 10 11Time Ni conv. Ni conv. Ni conv. Nominal [H] 0.2 M 1.0 M 1.5 Mmin 0.2M 1.0M 1.5M Mean time (min) dX/dt dX/dt dX/dt0 0 0 0 5 3.3501 7.4413 8.308910 34 74 83 15 2.7802 1.1248 0.651520 61 86 90 25 0.5019 0.4818 0.494330 66 90 95 45 0.4195 0.1803 0.110560 79 96 98 90 0.2176 0.0387 0.0149
120 92 98 99 ave. initial rate 3.065 4.283 4.480ave. initial [H] 0.20 1.00 1.50 ln(rate) 1.12 1.45 1.50
ln [H] -1.61 0.00 0.41 ave. initial [H] 0.200 1.000 1.500ln [H] -1.66 -0.06 0.36
From plot of ln(initial rate) vs. ln[H], order (slope) = 0.19ln rate constant (intercept) = -3.1596
Thus, k1 = 0.042
2. Effect of Total Chloride Concentration
grind 46temp 80% solids 0.5[HCl] 0.2
test 13 14 16 Test 13 14 16Time Ni conv. Ni conv. Ni conv. Nominal [Cl-]0 0.2 M 4.2 M 6.5 Mmin 7 g/l 150 g/l 230 g/l Mean time (min) dX/dt dX/dt dX/dt0 0 0 0 5 3.3501 7.6054 8.514710 33.5 76.1 85.1 15 2.7802 0.7898 0.793020 61.3 84.0 93.1 25 0.5019 0.4758 0.193730 66.3 88.7 95.0 45 0.4195 0.1844 0.045360 78.9 94.2 96.4 90 0.2176 0.0353 0.0181
120 92.0 96.4 97.5 Ave. initial rate 3.065 4.198 4.654ave. initial [Cl] 0.21 4.07 6.23 ln(rate) 1.12 1.43 1.54
ln [Cl] -1.55 1.40 1.83 Ave. initial [Cl] 0.213 4.066 6.226ln [Cl] -1.55 1.40 1.83
From plot of ln(initial rate) vs. ln[Cl], order (slope) = 0.12ln rate constant (intercept) = -3.307
Thus, k2 = 0.037
rate vs. mean time
0123456789
0 20 40 60 80 100
mean time (min)
dX/d
t
0.2M 1.0 M 1.5M
0
1
2
3
4
5
6
7
8
9
0 20 40 60 80 100mean time (min)
dX/d
t
7 g/l 150 g/l 230 g/l
APPENDIX E - Kinetic Calculations

Univers
ity of
Cap
e Tow
n
3. Effect of Temperature
grind 46% solids 0.5[MgCl2] 0[HCl] 0.2
test 17 13 18 12 test 17 13 18Time Ni conv. Ni conv. Ni conv. Ni conv. mean dX/dt dX/dt dX/dtmin 60°C 80°C 95°C 60°C min 60°C 80°C 95°C0 0 0 010 20.00 33.50 52.04 5 2.0005 3.3501 5.203720 18.62 61.30 64.41 15 -0.1382 2.7802 1.237230 21.85 66.32 73.16 25 0.3228 0.5019 0.875160 35.95 78.91 86.81 0.38 45 0.4700 0.4195 0.4548120 50.72 91.97 78.54 0.57 90 0.2462 0.2176 -0.1377
ave. temp (K) 333 353 368 ave. initial rate 0.931 3.065 3.2201/T 0.00300 0.00283 0.00272 ln(rate) -0.07 1.12 1.17
From plot of ln(initial rate) vs. 1/T, -E/R (slope) = -4548.20ln A (intercept) = 9.096
Thus, Ea = 37.814 kJ/K.moland A = 8.92E+03
Calculation of rate constants
Ea n m Kone Ktwo37.814 0.19 0.12 0.042 0.037
3781.37348
test K calc. initial rate measured initial rate [H] [Cl] T squared error % relative error(/min) mol/l mol/l K
13 5.134 2.666 3.065 0.19 0.21 353 0.16 13.0 14.98010 4.380 4.366 4.283 0.94 1.01 353 0.01 1.9 -1.90311 4.024 4.972 4.480 1.43 1.54 353 0.24 11.0 -9.89414 5.054 3.708 4.198 0.18 4.07 353 0.24 11.7 13.19016 5.384 3.860 4.654 0.17 6.23 353 0.63 17.1 20.57017 1.571 2.647 0.931 0.19 0.20 333 2.94 184.3 -64.82618 5.329 2.699 3.220 0.20 0.22 368 0.27 16.2 19.335
ave. K: 4.411 SSE: 4.50optimised K: 4.465
15 4.040 5.320 4.872 0.92 6.36 353 2.00E-01 9.2
4. Effect of Particle Size
temp 80% solids 0.5[MgCl2] 0[HCl] 0.2
test 13 19Time Ni conv. Ni conv.min 42um 106um0 0 010 33.50 40.5720 61.30 46.5130 66.32 58.0360 78.91 72.69120 91.97 73.44
-1
0
1
2
3
4
5
6
0 20 40 60 80 100
mean time (min)
dX/d
t
60°C 80°C 95°C
APPENDIX E - Kinetic Calculations

Univers
ity of
Cap
e Tow
n
5. Effect of Pulp Density
temp 95grind 46[MgCl2] 0[HCl] 0.2
test 18 1 3Time Ni conv. Ni conv. Ni conv.min 0.5 %solids 2 %solids 5 %solids120 0.79180 0.71 0.51
temp 80grind 46[MgCl2] 0[HCl] 0.2
test 13 2Time Ni conv. Ni conv.min 0.5 %solids 2 %solids120 0.92180 0.73
6. Effect of hydrogen ion activity
grind 46% solids 0.5
test 13 14 16 10 11 15 17 18Time Ni conv. Ni conv. Ni conv.min0 0 0 0 0 0 0 0 010 34 76 85 74 83 96 20 5220 61 84 93 86 90 97 19 6430 66 89 95 90 95 98 22 7360 79 94 96 96 98 99 36 87120 92 96 97 98 99 98 51 79
ave. initial [H] 0.19 0.18 0.17 0.94 1.43 0.92 0.19 0.20ave. initial [MgCl2] 0.00 1.96 3.00 0 0.00 2.53 0.00 0
temperature 80 80 80 80 80 80 60 95H+ activity 0.1493 0.3884 0.6223 0.7633 1.33 4 0.1526 0.1467 from JS model
nominal [H] 0.2 0.2 0.2 1 1.50 1 0.2 0.2nominal [MgCl2] 0 2.01 3.14 0 0.00 2.73 0 0
HCl activity 0.15 0.68 1.90 0.72 1.16 7.83 0.15 0.14H+ activity 0.1493 0.3884 0.6551 0.8126 1.40 4.072 0.1526 0.1467ln activity -1.901797574 -0.945719543 -0.422967383 -0.2075163 0.333252774 1.404134279 -1.87993516 -1.91936559
ln HCl activity -1.924833823 -0.385015631 0.640600469 -0.3239312 0.146694379 2.057604847 -1.904614667 -1.94855364
test 13 14 16 10 11 15 17 18mean dX/dt dX/dt dX/dt dX/dt dX/dt dX/dt dX/dt dX/dtmin
5 3.3501 7.6054 8.5147 7.4413 8.3089 9.5603 2.0005 5.203715 2.7802 0.7898 0.7930 1.1248 0.6515 0.1843 -0.1382 1.237225 0.5019 0.4758 0.1937 0.4818 0.4943 0.0459 0.3228 0.875145 0.4195 0.1844 0.0453 0.1803 0.1105 0.0201 0.4700 0.454890 0.2176 0.0353 0.0181 0.0387 0.0149 -0.0143 0.2462 -0.1377
ave. initial rate 3.065 4.198 4.654 4.283 4.480 4.872 0.931 3.220ln(rate) 1.12 1.43 1.54 1.45 1.50 1.58 -0.07 1.17
rate vs. mean time
-2.00
0.00
2.00
4.00
6.00
8.00
10.00
12.00
0 20 40 60 80 100
mean time (min)
dX/d
t
Series1 Series2 Series4 Series5Series6 Series7 Series8 Series9
initial rate vs. activity
y = -0.1323x + 1.1558R2 = 0.1204
-0.20.00.20.40.60.81.01.21.41.61.8
-3 -2 -1 0 1 2 3
ln [aHCl]
ln (i
nitia
l rat
e)
APPENDIX E - Kinetic Calculations