
OECD Information Technology Outlook 2008
350
OECD Information Technology Outlook 2008 A n O E C D B r o w s e _ i t E d i t i o n L e c t u r e s e u l e y l n O d a e R
-
Upload
khangminh22 -
Category
Documents
-
view
0 -
download
0
Transcript of OECD Information Technology Outlook 2008

www.oecd.org/publishing
OE
CD
Inform
ation Techno
log
y Outlo
ok
OECD Information Technology Outlook Information technology (IT) and broadband are major drivers of research, innovation, economic growth and social change. The 2008 edition of the OECD Information Technology Outlook analyses recent developments in the IT goods and services industries, and suggests that the outlook is for continued long-term growth, constrained by the currently very uncertain macroeconomic environment in OECD countries but with somewhat higher growth possible elsewhere.
The industry is organised internationally. Cross-border investment, trade, and mergers and acquisitions remain high, and ICTs drive globalisation in general. The industry is rapidly restructuring with non-OECD countries, particularly China and India, as major suppliers of information and communications technology (ICT)-related goods and services. The ICT industry is the major performer of R&D; many other industries undertake ICT R&D; and ICT-related R&D drives innovation and new goods and services in many industries.
This edition analyses the impact of high-speed broadband on the economy, and areas of future impacts. The Internet is changing everyday life for 1.5 billion people worldwide, with their socio-economic standing influencing how they use the web. The dynamic growth of digital-content-based creative industries is outlined, covering user-created content, online computer and video games, film and video, music, and online advertising.
Recent trends in OECD ICT policies are analysed to assess whether they are rising to these new challenges. Highly prioritised policy areas include investing in ICT R&D and innovation, improving government online activities, spreading broadband, increasing the use of ICTs, raising ICT skills and employment, and supporting digital content development. Changing policy priorities are reviewed.
The full text of this book is available on line via this link: www.sourceoecd.org/scienceIT/9789264055537
Those with access to all OECD books on line should use this link: www.sourceoecd.org/9789264055537
SourceOECD is the OECD online library of books, periodicals and statistical databases. For more information about this award-winning service and free trials ask your librarian, or write to us at [email protected].
ISbn 978-92-64-05553-7 93 2008 04 1 P -:HSTCQE=UZZZX\:
2008
OECD Information Technology Outlook
2008
2008
An
OE
CD
Bro
wse_it E ditio
n
L e c tures
eu
le
ylnO dae
R
About OECD Browse_it editions
In a traditional bookshop you can browse the display copies from cover-to-cover, free of charge. Wouldn't it be good to be able to do the same online? Now you can. OECD's Browse_it editions allow you to browse our books, online, from cover-to-cover. But, just as in a real bookshop where you can't take or copy pages from the books on display, we've disabled the print and copy functions in our Browse-it editions - they're read-only. And, just as in a real bookshop, you may choose to buy or borrow from a library some titles you've browsed, so we hope you'll buy or borrow our books when they meet your needs. Tell us what you think about our Browse-it service, write to us at [email protected].
Buying OECD Publications
You can purchase OECD books and e-books from our Online Bookshop - www.oecd.org/bookshop where, if you purchase printed editions you can download the e-book edition free of charge. Our books are also available from a network of distributors, click the 'Distributors' button on this website: www.oecd.org/publications/distributors to find your nearest OECD publications stockist.
OECD Publications in Libraries
You'll find OECD publications in many institutional libraries around the world, especially at universities and in government libraries. Many subscribe to the OECD's own e-library, SourceOECD. SourceOECD provides online acess to our books, periodicals and statistical databases. If your institutional library does not yet subscribe to SourceOECD, tell your librarian about our free three-month trial offer. For more details about SourceOECD visit http://new.SourceOECD.org or email [email protected]. OECD has a network of Depository Libraries in each Member country where all OECD printed publications are available for consultation - www.oecd.org/deposoitorylibraries for a list.
An
OE
CD
Bro
wse_it Editio
n
Lecture
se
ule
Read
Only

An
OE
CD
Bro
wse_it E ditio
n
L e c tures
eu
le
ylnO dae
R

Information and Communications Technologies
OECD Information Technology Outlook
2008
An
OE
CD
Bro
wse_it E ditio
n
L e c tures
eu
le
ylnO dae
R

ORGANISATION FOR ECONOMIC CO-OPERATION AND DEVELOPMENT
The OECD is a unique forum where the governments of 30 democracies work together to
address the economic, social and environmental challenges of globalisation. The OECD is also at
the forefront of efforts to understand and to help governments respond to new developments and
concerns, such as corporate governance, the information economy and the challenges of an
ageing population. The Organisation provides a setting where governments can compare policy
experiences, seek answers to common problems, identify good practice and work to co-ordinate
domestic and international policies.
The OECD member countries are: Australia, Austria, Belgium, Canada, the Czech Republic,
Denmark, Finland, France, Germany, Greece, Hungary, Iceland, Ireland, Italy, Japan, Korea,
Luxembourg, Mexico, the Netherlands, New Zealand, Norway, Poland, Portugal, the Slovak Republic,
Spain, Sweden, Switzerland, Turkey, the United Kingdom and the United States. The Commission of
the European Communities takes part in the work of the OECD.
OECD Publishing disseminates widely the results of the Organisation’s statistics gathering and
research on economic, social and environmental issues, as well as the conventions, guidelines and
standards agreed by its members.
Also available in French under the title:
Technologies de l’information et des communications
Perspectives des technologies de l’information de l’OCDE2008
Corrigenda to OECD publications may be found on line at: www.oecd.org/publishing/corrigenda.
© OECD 2008
You can copy, download or print OECD content for your own use, and you can include excerpts from OECD publications, databases and multimedia
products in your own documents, presentations, blogs, websites and teaching materials, provided that suitable acknowledgment of OECD as sourceand copyright owner is given. All requests for public or commercial use and translation rights should be submitted to [email protected]. Requests for
permission to photocopy portions of this material for public or commercial use shall be addressed directly to the Copyright Clearance Center (CCC)at [email protected] or the Centre français d'exploitation du droit de copie (CFC) [email protected].
This work is published on the responsibility of the Secretary-General of the OECD. The
opinions expressed and arguments employed herein do not necessarily reflect the official
views of the Organisation or of the governments of its member countries.
An
OE
CD
Bro
wse_it E ditio
n
L e c tures
eu
le
ylnO dae
R

FOREWORD
DB
ro
wse_it E ditio
n
es
eu
le
ylnO d
Foreword
The OECD Information Technology Outlook 2008 has been prepared by the OECD under the
guidance of its Committee for Information, Computer and Communications Policy (ICCP), and in
particular the Working Party on the Information Economy (WPIE). This edition is the ninth in a
biennial series designed to provide member countries with a broad overview of trends and near-term
prospects in the information technology (IT) industry, analysis of the growing impact of IT on the
economy and society, developments and emerging applications in selected areas of information
technology, and a review of IT policies and new policy directions. The 2008 edition builds on previous
editions to further extend the economic and policy analysis. This edition has been extensively
updated through mid-November 2008 to take account of rapidly worsening macroeconomic
conditions.
The first two chapters provide an overview of the importance and growth of information and
communication technologies (ICTs) in national economies, describe recent market dynamics, give a
detailed overview of the globalisation of the ICT sector, and provide a thorough analysis of the
ongoing shift of production, trade and markets to non-OECD economies, particularly China and
India. The third chapter provides an overview of the importance of ICT R&D and innovation, the
leading role of the ICT sector in developing new sources of innovation and the growing importance of
ICT-related R&D in other sectors. Some of this activity is driven by changing use of the Internet and
broadband by consumers and users, which is analysed in the following chapter; the rise of digital
content and increasing online delivery in a range of content-rich industries are analysed in Chapter 5.
This is followed by a review of some of the economic implications of broadband adoption and use. The
last chapter provides a critical overview of IT policy developments and priorities in OECD countries.
National information technology policy profiles are also posted on the OECD website to enable their
widespread use (www.oecd.org/sti/information-economy).
The OECD Information Technology Outlook 2008 was drafted under the direction of Graham
Vickery, with Cristina Serra-Vallejo and Sacha Wunsch-Vincent of the Information, Computer and
Communications Policy Division of the Directorate for Science, Technology and Industry (DSTI);
Pierre Montagnier and Desirée van Welsum of DSTI, John Houghton of Victoria University
(Australia) and Arthur Mickoleit (consultants), with contributions from Verena Kroth and Adam
Masser (consultants). It benefited from review and valuable contributions by delegates to the
Working Party on the Information Economy, under the chairmanship of Jean-Jacques Sahel (United
Kingdom) and Daniela Battisti (Italy), particularly regarding national IT policy developments and
up-to-date national statistics on the production and use of IT goods and services. This report has
been recommended for wider distribution by the ICCP Committee.
An
OE
C
L e c tur
aeR
OECD INFORMATION TECHNOLOGY OUTLOOK 2008 – ISBN 978-92-64-05553-7 – © OECD 2008 3

se_it E ditin
es
eu
le
This book has...
StatLinks2A service that delivers Excel® files from the printed page!
Look for the StatLinks at the bottom right-hand corner of the tables or graphs in this book. To download the matching Excel® spreadsheet, just type the link into your Internet browser, starting with the http://dx.doi.org prefix. If you’re reading the PDF e-book edition, and your PC is connected to the Internet, simply click on the link. You’ll find StatLinks appearing in more OECD books.
An
OE
CD
Bro
wo
L e c tur
ylnO dae
R

TABLE OF CONTENTS
DB
ro
wse_it E ditio
n
es
eu
le
ylnO d
Table of Contents
Highlights: OECD Information Technology Outlook 2008 . . . . . . . . . . . . . . . . . . . . . . . . . . 15
Chapter 1. The IT Industry: Recent Developments and Outlook . . . . . . . . . . . . . . . . . . . . 23
Introduction . . . . . . . . . . . . . . . . . . . . . . . . . . . . . . . . . . . . . . . . . . . . . . . . . . . . . . . . . . . . 24
Recent developments in ICT supply . . . . . . . . . . . . . . . . . . . . . . . . . . . . . . . . . . . . . . . . 25
Prospects in the near to medium term . . . . . . . . . . . . . . . . . . . . . . . . . . . . . . . . . . . . . . 28
ICT firms . . . . . . . . . . . . . . . . . . . . . . . . . . . . . . . . . . . . . . . . . . . . . . . . . . . . . . . . . . . . . . . 29
Top 250 ICT firms . . . . . . . . . . . . . . . . . . . . . . . . . . . . . . . . . . . . . . . . . . . . . . . . . . . . . . . . 31
Individual firm performance . . . . . . . . . . . . . . . . . . . . . . . . . . . . . . . . . . . . . . . . . . . . . . 38
Top 50 ICT firms. . . . . . . . . . . . . . . . . . . . . . . . . . . . . . . . . . . . . . . . . . . . . . . . . . . . . . . . . 39
Semiconductors . . . . . . . . . . . . . . . . . . . . . . . . . . . . . . . . . . . . . . . . . . . . . . . . . . . . . . . . . 43
Structural change in the ICT sector. . . . . . . . . . . . . . . . . . . . . . . . . . . . . . . . . . . . . . . . . 45
Value added . . . . . . . . . . . . . . . . . . . . . . . . . . . . . . . . . . . . . . . . . . . . . . . . . . . . . . . . . . . . 45
Employment . . . . . . . . . . . . . . . . . . . . . . . . . . . . . . . . . . . . . . . . . . . . . . . . . . . . . . . . . . . . 48
Venture capital . . . . . . . . . . . . . . . . . . . . . . . . . . . . . . . . . . . . . . . . . . . . . . . . . . . . . . . . . . 51
ICT markets and spending . . . . . . . . . . . . . . . . . . . . . . . . . . . . . . . . . . . . . . . . . . . . . . . . 52
Conclusion . . . . . . . . . . . . . . . . . . . . . . . . . . . . . . . . . . . . . . . . . . . . . . . . . . . . . . . . . . . . . 55
Notes . . . . . . . . . . . . . . . . . . . . . . . . . . . . . . . . . . . . . . . . . . . . . . . . . . . . . . . . . . . . . . . . . . 57
References . . . . . . . . . . . . . . . . . . . . . . . . . . . . . . . . . . . . . . . . . . . . . . . . . . . . . . . . . . . . . . 58
Annex 1.A1. . . . . . . . . . . . . . . . . . . . . . . . . . . . . . . . . . . . . . . . . . . . . . . . . . . . . . . . . . . . . . 59
Annex 1.A2. . . . . . . . . . . . . . . . . . . . . . . . . . . . . . . . . . . . . . . . . . . . . . . . . . . . . . . . . . . . . . 67
Chapter 2. Globalisation of the ICT Sector . . . . . . . . . . . . . . . . . . . . . . . . . . . . . . . . . . . . . . . 71
Introduction . . . . . . . . . . . . . . . . . . . . . . . . . . . . . . . . . . . . . . . . . . . . . . . . . . . . . . . . . . . . 72
Global trade in information technology products. . . . . . . . . . . . . . . . . . . . . . . . . . . . . 72
OECD trade in ICT subsectors. . . . . . . . . . . . . . . . . . . . . . . . . . . . . . . . . . . . . . . . . . . . . . 81
Software goods trade. . . . . . . . . . . . . . . . . . . . . . . . . . . . . . . . . . . . . . . . . . . . . . . . . . . . . 86
Trade in ICT services . . . . . . . . . . . . . . . . . . . . . . . . . . . . . . . . . . . . . . . . . . . . . . . . . . . . . 87
Globalisation of the ICT sector . . . . . . . . . . . . . . . . . . . . . . . . . . . . . . . . . . . . . . . . . . . . . 90
Foreign direct investment. . . . . . . . . . . . . . . . . . . . . . . . . . . . . . . . . . . . . . . . . . . . . . . . . 96
Mergers and acquisitions . . . . . . . . . . . . . . . . . . . . . . . . . . . . . . . . . . . . . . . . . . . . . . . . . 98
Conclusion . . . . . . . . . . . . . . . . . . . . . . . . . . . . . . . . . . . . . . . . . . . . . . . . . . . . . . . . . . . . . 107
Notes . . . . . . . . . . . . . . . . . . . . . . . . . . . . . . . . . . . . . . . . . . . . . . . . . . . . . . . . . . . . . . . . . . 108
References . . . . . . . . . . . . . . . . . . . . . . . . . . . . . . . . . . . . . . . . . . . . . . . . . . . . . . . . . . . . . . 109
Annex 2.A1. . . . . . . . . . . . . . . . . . . . . . . . . . . . . . . . . . . . . . . . . . . . . . . . . . . . . . . . . . . . . . 111
Chapter 3. ICT Research and Development and Innovation. . . . . . . . . . . . . . . . . . . . . . . . 143
Introduction . . . . . . . . . . . . . . . . . . . . . . . . . . . . . . . . . . . . . . . . . . . . . . . . . . . . . . . . . . . . 144
ICT R&D challenges and priorities. . . . . . . . . . . . . . . . . . . . . . . . . . . . . . . . . . . . . . . . . . 144
An
OE
C
L e c tur
aeR
OECD INFORMATION TECHNOLOGY OUTLOOK 2008 – ISBN 978-92-64-05553-7 – © OECD 2008 5

TABLE OF CONTENTS
se_it E ditin
es
eu
le
ICT sector R&D expenditures and employment . . . . . . . . . . . . . . . . . . . . . . . . . . . . . . 148
Trends in the organisation of ICT R&D. . . . . . . . . . . . . . . . . . . . . . . . . . . . . . . . . . . . . . 164
ICT-related R&D in other industries . . . . . . . . . . . . . . . . . . . . . . . . . . . . . . . . . . . . . . . . 173
ICT-related patents and R&D expenditures . . . . . . . . . . . . . . . . . . . . . . . . . . . . . . . . . . 176
Conclusion . . . . . . . . . . . . . . . . . . . . . . . . . . . . . . . . . . . . . . . . . . . . . . . . . . . . . . . . . . . . . 182
Notes . . . . . . . . . . . . . . . . . . . . . . . . . . . . . . . . . . . . . . . . . . . . . . . . . . . . . . . . . . . . . . . . . . 182
References . . . . . . . . . . . . . . . . . . . . . . . . . . . . . . . . . . . . . . . . . . . . . . . . . . . . . . . . . . . . . . 185
Annex 3.A1. . . . . . . . . . . . . . . . . . . . . . . . . . . . . . . . . . . . . . . . . . . . . . . . . . . . . . . . . . . . . . 190
Chapter 4. Broadband and ICT Access and Use by Households and Individuals. . . . . . 193
Introduction . . . . . . . . . . . . . . . . . . . . . . . . . . . . . . . . . . . . . . . . . . . . . . . . . . . . . . . . . . . . 194
Access and use of broadband and selected ICTs: Recent developments. . . . . . . . . . 194
Time use and the Internet . . . . . . . . . . . . . . . . . . . . . . . . . . . . . . . . . . . . . . . . . . . . . . . . 208
From the digital access divide to the digital use divide . . . . . . . . . . . . . . . . . . . . . . . . 212
Conclusion . . . . . . . . . . . . . . . . . . . . . . . . . . . . . . . . . . . . . . . . . . . . . . . . . . . . . . . . . . . . . 218
Notes . . . . . . . . . . . . . . . . . . . . . . . . . . . . . . . . . . . . . . . . . . . . . . . . . . . . . . . . . . . . . . . . . . 219
References . . . . . . . . . . . . . . . . . . . . . . . . . . . . . . . . . . . . . . . . . . . . . . . . . . . . . . . . . . . . . . 219
Annex 4.A1. . . . . . . . . . . . . . . . . . . . . . . . . . . . . . . . . . . . . . . . . . . . . . . . . . . . . . . . . . . . . . 222
Annex 4.A2. . . . . . . . . . . . . . . . . . . . . . . . . . . . . . . . . . . . . . . . . . . . . . . . . . . . . . . . . . . . . . 229
Chapter 5. Digital Content in Transition . . . . . . . . . . . . . . . . . . . . . . . . . . . . . . . . . . . . . . . . 247
Introduction . . . . . . . . . . . . . . . . . . . . . . . . . . . . . . . . . . . . . . . . . . . . . . . . . . . . . . . . . . . . 248
Broadband content markets and value chains: Cross-sector comparisons . . . . . . . 248
Broadband content developments . . . . . . . . . . . . . . . . . . . . . . . . . . . . . . . . . . . . . . . . . 257
Conclusion . . . . . . . . . . . . . . . . . . . . . . . . . . . . . . . . . . . . . . . . . . . . . . . . . . . . . . . . . . . . . 278
Notes . . . . . . . . . . . . . . . . . . . . . . . . . . . . . . . . . . . . . . . . . . . . . . . . . . . . . . . . . . . . . . . . . . 278
References . . . . . . . . . . . . . . . . . . . . . . . . . . . . . . . . . . . . . . . . . . . . . . . . . . . . . . . . . . . . . 280
Annex 5.A1. . . . . . . . . . . . . . . . . . . . . . . . . . . . . . . . . . . . . . . . . . . . . . . . . . . . . . . . . . . . . . 282
Chapter 6. Economic Implications of Broadband . . . . . . . . . . . . . . . . . . . . . . . . . . . . . . . . . 283
Introduction . . . . . . . . . . . . . . . . . . . . . . . . . . . . . . . . . . . . . . . . . . . . . . . . . . . . . . . . . . . . 284
The expected economic impact of broadband. . . . . . . . . . . . . . . . . . . . . . . . . . . . . . . . 285
Reliability of the infrastructure . . . . . . . . . . . . . . . . . . . . . . . . . . . . . . . . . . . . . . . . . . . . 288
Evidence on the productivity impacts of broadband . . . . . . . . . . . . . . . . . . . . . . . . . . 291
Broadband and SMEs . . . . . . . . . . . . . . . . . . . . . . . . . . . . . . . . . . . . . . . . . . . . . . . . . . . . . 300
Conclusion . . . . . . . . . . . . . . . . . . . . . . . . . . . . . . . . . . . . . . . . . . . . . . . . . . . . . . . . . . . . . 301
Notes . . . . . . . . . . . . . . . . . . . . . . . . . . . . . . . . . . . . . . . . . . . . . . . . . . . . . . . . . . . . . . . . . . 301
References . . . . . . . . . . . . . . . . . . . . . . . . . . . . . . . . . . . . . . . . . . . . . . . . . . . . . . . . . . . . . . 303
Chapter 7. ICT Policy Developments . . . . . . . . . . . . . . . . . . . . . . . . . . . . . . . . . . . . . . . . . . . . 307
Introduction . . . . . . . . . . . . . . . . . . . . . . . . . . . . . . . . . . . . . . . . . . . . . . . . . . . . . . . . . . . . 308
Overview of ICT policy priorities and developments . . . . . . . . . . . . . . . . . . . . . . . . . . 308
ICT policy environment: Co-ordination and priority setting. . . . . . . . . . . . . . . . . . . . 312
Specific ICT policies and programmes . . . . . . . . . . . . . . . . . . . . . . . . . . . . . . . . . . . . . . 314
Policy assessment and evaluation. . . . . . . . . . . . . . . . . . . . . . . . . . . . . . . . . . . . . . . . . . 332
Conclusion . . . . . . . . . . . . . . . . . . . . . . . . . . . . . . . . . . . . . . . . . . . . . . . . . . . . . . . . . . . . . 334
Notes . . . . . . . . . . . . . . . . . . . . . . . . . . . . . . . . . . . . . . . . . . . . . . . . . . . . . . . . . . . . . . . . . . 336
An
OE
CD
Bro
wo
L e c tur
ylnO dae
R
OECD INFORMATION TECHNOLOGY OUTLOOK 2008 – ISBN 978-92-64-05553-7 – © OECD 20086

TABLE OF CONTENTS
se_it E ditin
es
eu
le
References . . . . . . . . . . . . . . . . . . . . . . . . . . . . . . . . . . . . . . . . . . . . . . . . . . . . . . . . . . . . . . 336
Annex 7.A1. . . . . . . . . . . . . . . . . . . . . . . . . . . . . . . . . . . . . . . . . . . . . . . . . . . . . . . . . . . . . . 337
Annex A. Methodology and Definitions. . . . . . . . . . . . . . . . . . . . . . . . . . . . . . . . . . . . . . . . . . 339
Boxes
1.1. Methodology used to compile the 2006 ICT top 250. . . . . . . . . . . . . . . . . . . . . . . . 30
1.2. ICT equipment manufacturing in Chinese Taipei and China. . . . . . . . . . . . . . . . 34
1.3. Fast-growing ICT firms in the top 250 . . . . . . . . . . . . . . . . . . . . . . . . . . . . . . . . . . . 39
2.1. Depreciation of the US dollar against leading currencies: Impacts on ICT
trade data . . . . . . . . . . . . . . . . . . . . . . . . . . . . . . . . . . . . . . . . . . . . . . . . . . . . . . . . . . . 74
2.2. Communication equipment trade and missing trader inter-community fraud. . . 84
2.3. Measuring software trade . . . . . . . . . . . . . . . . . . . . . . . . . . . . . . . . . . . . . . . . . . . . . 87
2.4. Out of South Africa: Globalisation of ICT services . . . . . . . . . . . . . . . . . . . . . . . . . 89
2.5. Russian communication service providers . . . . . . . . . . . . . . . . . . . . . . . . . . . . . . . 91
2.6. Vietnam: A new centre for offshore assembly? . . . . . . . . . . . . . . . . . . . . . . . . . . . 97
2.7. ICT M&A targets and acquirers . . . . . . . . . . . . . . . . . . . . . . . . . . . . . . . . . . . . . . . . . 101
3.1. Examples of ICT R&D priorities . . . . . . . . . . . . . . . . . . . . . . . . . . . . . . . . . . . . . . . . . 146
3.2. Defining the top ICT R&D spending firms . . . . . . . . . . . . . . . . . . . . . . . . . . . . . . . . 157
3.3. Samsung R&D and innovation . . . . . . . . . . . . . . . . . . . . . . . . . . . . . . . . . . . . . . . . . 160
3.4. Semiconductor research collaboration . . . . . . . . . . . . . . . . . . . . . . . . . . . . . . . . . . 168
3.5. R&D activities of US affiliates . . . . . . . . . . . . . . . . . . . . . . . . . . . . . . . . . . . . . . . . . . 171
3.6. Embedded systems in cars. . . . . . . . . . . . . . . . . . . . . . . . . . . . . . . . . . . . . . . . . . . . . 175
3.A1.1. When is software development R&D? . . . . . . . . . . . . . . . . . . . . . . . . . . . . . . . . . . . 190
3.A1.2. Definition of ICT patents . . . . . . . . . . . . . . . . . . . . . . . . . . . . . . . . . . . . . . . . . . . . . . 191
4.1. France: The diffusion of ICTs compared to other technologies . . . . . . . . . . . . . . 213
5.1. Prevalent pricing models in online advertising . . . . . . . . . . . . . . . . . . . . . . . . . . . 275
6.1. Open source software: User-driven innovation and the role of broadband
communication networks . . . . . . . . . . . . . . . . . . . . . . . . . . . . . . . . . . . . . . . . . . . . . 288
6.2. Deep sea cable infrastructure . . . . . . . . . . . . . . . . . . . . . . . . . . . . . . . . . . . . . . . . . . 290
6.3. The role of intangible capital and other complementary factors for ICTs . . . . . 293
6.4. Modelling the macro-impacts of broadband deployment and use
in the European Union . . . . . . . . . . . . . . . . . . . . . . . . . . . . . . . . . . . . . . . . . . . . . . . . 298
7.1. Achieving socio-economic objectives . . . . . . . . . . . . . . . . . . . . . . . . . . . . . . . . . . . 314
7.2. Government e-health projects . . . . . . . . . . . . . . . . . . . . . . . . . . . . . . . . . . . . . . . . . . . 316
7.3. Open source applications. . . . . . . . . . . . . . . . . . . . . . . . . . . . . . . . . . . . . . . . . . . . 317
7.4. Venture finance policies . . . . . . . . . . . . . . . . . . . . . . . . . . . . . . . . . . . . . . . . . . . . . . . . . . . 318
7.5. Business innovation in SMEs. . . . . . . . . . . . . . . . . . . . . . . . . . . . . . . . . . . . . . . . . . . 319
7.6. Supporting RFID applications . . . . . . . . . . . . . . . . . . . . . . . . . . . . . . . . . . . . . . . . . . 322
7.7. Increasing the appeal of ICT-related professions. . . . . . . . . . . . . . . . . . . . . . . . . . 324
7.8. Policies for digital content development . . . . . . . . . . . . . . . . . . . . . . . . . . . . . . . . . 326
7.9. Public sector information and content . . . . . . . . . . . . . . . . . . . . . . . . . . . . . . . . . . 328
7.10. Monitoring the Recommendation of the OECD Council on Broadband
Development . . . . . . . . . . . . . . . . . . . . . . . . . . . . . . . . . . . . . . . . . . . . . . . . . . . . . . . . 330
7.11. Open standards for information exchange . . . . . . . . . . . . . . . . . . . . . . . . . . . . . . . 331
7.12. Online identity theft . . . . . . . . . . . . . . . . . . . . . . . . . . . . . . . . . . . . . . . . . . . . . . . . . . 332
7.13. Evaluation of ICT R&D in the European Commission’s 6th Framework
Programme. . . . . . . . . . . . . . . . . . . . . . . . . . . . . . . . . . . . . . . . . . . . . . . . . . . . . . . . . . 333
An
OE
CD
Bro
wo
L e c tur
ylnO dae
R
OECD INFORMATION TECHNOLOGY OUTLOOK 2008 – ISBN 978-92-64-05553-7 – © OECD 2008 7

TABLE OF CONTENTS
se_it E ditin
es
eu
le
Tables
Top ten ICT policy priorities, 2008 . . . . . . . . . . . . . . . . . . . . . . . . . . . . . . . . . . . . . . 21
1.1. Economies represented in the top 250 ICT firms, 2000 and 2006 . . . . . . . . . . . . 33
1.2. Top 250 ICT firms by sector, 2000 and 2006 . . . . . . . . . . . . . . . . . . . . . . . . . . . . . . 35
1.3. Top 50 ICT firms ranked by revenue in 2006 . . . . . . . . . . . . . . . . . . . . . . . . . . . . . 40
1.A1.1. Top 10 communications equipment and systems firms . . . . . . . . . . . . . . . . . . . 59
1.A1.2. Top 10 IT equipment and systems firms . . . . . . . . . . . . . . . . . . . . . . . . . . . . . . . . 61
1.A1.3. Top 10 electronics firms . . . . . . . . . . . . . . . . . . . . . . . . . . . . . . . . . . . . . . . . . . . . . . 62
1.A1.4. Top 10 specialist semiconductor firms . . . . . . . . . . . . . . . . . . . . . . . . . . . . . . . . . . . . . . 62
1.A1.5. Top 10 IT services firms . . . . . . . . . . . . . . . . . . . . . . . . . . . . . . . . . . . . . . . . . . . . . . . . . . . 63
1.A1.6. Top 10 software firms . . . . . . . . . . . . . . . . . . . . . . . . . . . . . . . . . . . . . . . . . . . . . . . . . . . . . 64
1.A1.7. Top 10 Internet firms. . . . . . . . . . . . . . . . . . . . . . . . . . . . . . . . . . . . . . . . . . . . . . . . . . . . . . 65
1.A1.8. Top 10 telecommunication services firms . . . . . . . . . . . . . . . . . . . . . . . . . . . . . . . 66
1.A2.1. Total ICT spending, 2003-08 . . . . . . . . . . . . . . . . . . . . . . . . . . . . . . . . . . . . . . . . . . . 68
1.A2.2. Emerging economy ICT spending by segment, 2003-08 . . . . . . . . . . . . . . . . . . . . 69
2.1. Currency exchange rates, national units per USD, percentage changes
compared to 2001 . . . . . . . . . . . . . . . . . . . . . . . . . . . . . . . . . . . . . . . . . . . . . . . . . . . . 74
2.2. Growth in electronics goods production, trade and sales, 1995-2006. . . . . . . . . 93
2.3. US intra-firm trade in ICT goods and services, 2006 . . . . . . . . . . . . . . . . . . . . . . . 96
2.4. Foreign-owned enterprises in Sweden’s ICT sector, 2006 . . . . . . . . . . . . . . . . . . 107
2.A1.1. World and OECD ICT goods trade, 1996-2007 . . . . . . . . . . . . . . . . . . . . . . . . . . . . 111
2.A1.2. OECD trade in ICT goods, 1996-2006 . . . . . . . . . . . . . . . . . . . . . . . . . . . . . . . . . . . . 112
2.A1.3. Balance of OECD trade in ICT goods, 1996-2006 . . . . . . . . . . . . . . . . . . . . . . . . . . 113
2.A1.4. ICT goods trade, 2007 . . . . . . . . . . . . . . . . . . . . . . . . . . . . . . . . . . . . . . . . . . . . . . . . 114
2.A1.5. OECD accession countries trade in ICT goods, 1996-2006 . . . . . . . . . . . . . . . . . . 116
2.A1.6. Emerging economies trade in ICT goods, 1996-2006 . . . . . . . . . . . . . . . . . . . . . . 118
2.A1.7. Direction of ICT goods exports, 1996-2006 . . . . . . . . . . . . . . . . . . . . . . . . . . . . . . . 119
2.A1.8. Direction of ICT goods imports, 1996-2006 . . . . . . . . . . . . . . . . . . . . . . . . . . . . . . 120
2.A1.9. OECD trade in computer and related equipment, 1996-2006 . . . . . . . . . . . . . . . 120
2.A1.10. OECD trade in electronic components, 1996-2006 . . . . . . . . . . . . . . . . . . . . . . . . 121
2.A1.11. OECD trade in communication equipment, 1996-2006 . . . . . . . . . . . . . . . . . . . . 122
2.A1.12. OECD trade in audio and video equipment, 1996-2006 . . . . . . . . . . . . . . . . . . . . 123
2.A1.13. OECD trade in other ICT-related equipment, 1996-2006 . . . . . . . . . . . . . . . . . . . 124
2.A1.14. OECD trade in software goods, 1996-2006 . . . . . . . . . . . . . . . . . . . . . . . . . . . . . . . 125
2.A1.15. Trade in ICT services, 1996-2006 . . . . . . . . . . . . . . . . . . . . . . . . . . . . . . . . . . . . . . . 126
2.A1.16. Growth in the value of electronics production, 2005-2008 . . . . . . . . . . . . . . . . . . 127
2.A1.17. Share of ICT goods in total merchandise exports, 1996-2006 . . . . . . . . . . . . . . . 128
2.A1.18. Revealed comparative advantage in ICT goods exports, 1996-2006 . . . . . . . . . . 129
2.A1.19. Grubel and Lloyd Index for ICT goods, 1996-2006 . . . . . . . . . . . . . . . . . . . . . . . . . 130
2.A1.20. ICT sector cross-border M&A deals, 1997-2007 . . . . . . . . . . . . . . . . . . . . . . . . . . . . . . . 131
2.A1.21. ICT sector cross-border M&A deal values, 1997-2007 . . . . . . . . . . . . . . . . . . . . . . . . . 131
2.A1.22. ICT sector cross-border M&A deals by target country, 1997-2007 . . . . . . . . . . . 132
2.A1.23. ICT sector cross-border M&A deals by country of acquirer, 1997-2007 . . . . . . . . 133
2.A1.24. ICT sector cross-border M&A deal values by target country, 1997-2007 . . . . . . . . . 134
2.A1.25. ICT sector cross-border M&A deal values by country of acquirer, 1997-2007 135
2.A1.26. ICT sector cross-border M&A deals by economy: Top 50 targets
and acquirers, 1997-2007 . . . . . . . . . . . . . . . . . . . . . . . . . . . . . . . . . . . . . . . . . . . . . . 136
An
OE
CD
Bro
wo
L e c tur
ylnO dae
R
OECD INFORMATION TECHNOLOGY OUTLOOK 2008 – ISBN 978-92-64-05553-7 – © OECD 20088

TABLE OF CONTENTS
se_it E ditin
es
eu
le
2.A1.27. ICT sector cross-border M&A deals by economy: Largest acquirers
and targets, 1997-2007 . . . . . . . . . . . . . . . . . . . . . . . . . . . . . . . . . . . . . . . . . . . . . . . 137
2.A1.28. ICT sector foreign affiliates operating in the United States, 2005 . . . . . . . . . . . 138
2.A1.29. US foreign affiliates operating overseas, 2004 . . . . . . . . . . . . . . . . . . . . . . . . . . . . 139
2.A1.30. Country origin of foreign-owned enterprises in Sweden’s ICT sector, 2006 . . . 140
2.A1.31. Swedish-owned ICT sector enterprises operating overseas, 2004. . . . . . . . . . . . 141
3.1. Top ICT R&D spenders: Absolute expenditure, 2006 and 2007 . . . . . . . . . . . . . . 159
3.2. Top ICT R&D spenders: Expenditure growth, 2000-07 . . . . . . . . . . . . . . . . . . . . . 160
3.3. Top ICT R&D spenders: R&D expenditures per employee, 2007 . . . . . . . . . . . . . 161
3.4. Top ICT R&D spenders: R&D intensity (R&D expenditure as share of sales),
2000 and 2007 . . . . . . . . . . . . . . . . . . . . . . . . . . . . . . . . . . . . . . . . . . . . . . . . . . . . . . . 162
3.5. ICT R&D promotion and public funding in selected OECD and non-member
economies . . . . . . . . . . . . . . . . . . . . . . . . . . . . . . . . . . . . . . . . . . . . . . . . . . . . . . . . . . 166
3.6. R&D performed abroad by majority-owned foreign affiliates of US parent
companies, 2002-05 . . . . . . . . . . . . . . . . . . . . . . . . . . . . . . . . . . . . . . . . . . . . . . . . . . 171
3.7. Top 20 ICT patenting firms among patents granted (all industries)
by the USPTO number of patents, 2007 . . . . . . . . . . . . . . . . . . . . . . . . . . . . . . . . . . 180
3.8. Position of ICT firms among the top 20 patent applicants (all industries)
at the European Patent Office, Japan Patent Office, and the PCT, 2007
or latest available year. . . . . . . . . . . . . . . . . . . . . . . . . . . . . . . . . . . . . . . . . . . . . . . . 180
4.1. Speed of diffusion of selected ICT goods/services in selected OECD countries . . . 195
4.2. Average time spent using email, chat or Internet, per week, during leisure
time, in Finland. . . . . . . . . . . . . . . . . . . . . . . . . . . . . . . . . . . . . . . . . . . . . . . . . . . . . . 209
4.3. Differences among high school pupils by socio-economic group in the use
of instant messaging for chatting, France, 2005 . . . . . . . . . . . . . . . . . . . . . . . . . . 217
4.A2.1. Households and individuals with access to a home computer in selected
OECD countries, 1986-2007 . . . . . . . . . . . . . . . . . . . . . . . . . . . . . . . . . . . . . . . . . . . . 230
4.A2.2. Households with access to the Internet in selected OECD countries,
1996-2007. . . . . . . . . . . . . . . . . . . . . . . . . . . . . . . . . . . . . . . . . . . . . . . . . . . . . . . 232
4.A2.3. Households and individuals with broadband access to the Internet from
home in selected OECD countries, 2000-07. . . . . . . . . . . . . . . . . . . . . . . . . . . . . . . 233
4.A2.4. Places where the Internet has been used by females and males, 2005 . . . . . . . 234
4.A2.5. Marginal effect of broadband on selected activities in Canada, 2005 . . . . . . . . 235
4.A2.6. Marginal effect of broadband on selected activities in EU countries, 2007 . . . . . . . 236
4.A2.7. Selected Internet broadband activities in EU countries, 2007. . . . . . . . . . . . . . . . . . . 238
4.A2.8. Marginal effect of broadband on selected Internet activities in the
United States, 2007 . . . . . . . . . . . . . . . . . . . . . . . . . . . . . . . . . . . . . . . . . . . . . . . . . . . 240
4.A2.9. PC and Internet penetration rates, differences between top and bottom
income bands . . . . . . . . . . . . . . . . . . . . . . . . . . . . . . . . . . . . . . . . . . . . . . . . . . . . . . . 241
4.A2.10. Purposes of use of the Internet in Finland, spring 2004 and spring 2007. . . . . . 242
4.A2.11. Number of activities participated in by home Internet users during the
last 12 months, Canada, 2005 . . . . . . . . . . . . . . . . . . . . . . . . . . . . . . . . . . . . . . . . . . 243
4.A2.12. Diversity of Internet activities in the Netherlands, 2006 . . . . . . . . . . . . . . . . . . . 243
4.A2.13. Number of different uses of the Internet in France, all types of connection
combined, 2005 . . . . . . . . . . . . . . . . . . . . . . . . . . . . . . . . . . . . . . . . . . . . . . . . . . . . . 244
5.1. Market size and growth, 2007 or latest available year . . . . . . . . . . . . . . . . . . . . . 250
5.2. Impact of broadband on value chains, competition and market structure . . . . 252
An
OE
CD
Bro
wo
L e c tur
ylnO dae
R
OECD INFORMATION TECHNOLOGY OUTLOOK 2008 – ISBN 978-92-64-05553-7 – © OECD 2008 9

TABLE OF CONTENTS
se_it E ditin
es
eu
le
5.3. New cross-industry participation in broadband content distribution . . . . . . . . 252
5.4. Evolving sector-specific online business models. . . . . . . . . . . . . . . . . . . . . . . . . . 254
5.5. Digital content product characteristics and broadband functionalities. . . . . . . 255
5.6. Platforms for user-created content . . . . . . . . . . . . . . . . . . . . . . . . . . . . . . . . . . . . . 257
5.7. Economic incentives and benefits for different UCC value chain participants. 260
5.8. UCC platform business models: Citizen journalism and photos. . . . . . . . . . . . . 261
5.9. Actual and projected online cinema product revenue, 2004-10 . . . . . . . . . . . . . 265
5.10. Online full-feature film providers, selected examples from OECD countries,
January 2008 . . . . . . . . . . . . . . . . . . . . . . . . . . . . . . . . . . . . . . . . . . . . . . . . . . . . . . . . . . . . . 266
5.11. Evolution of digital music sales and yearly per capita music spending,
selected countries, 2006. . . . . . . . . . . . . . . . . . . . . . . . . . . . . . . . . . . . . . . . . . . . . . . 268
5.A1.1. Intellectual property provisions in terms of services of UCC sites . . . . . . . . . . . 282
7.1. Top ten ICT policy priorities, 2008 . . . . . . . . . . . . . . . . . . . . . . . . . . . . . . . . . . . . . . 309
7.2. Summary of ICT policy replies, 2008, 2006, 2004 and 2002. . . . . . . . . . . . . . . . . . 310
7.3. Summary of ICT policy priorities, 2008 . . . . . . . . . . . . . . . . . . . . . . . . . . . . . . . . . . 312
7.4. Changing ICT policy priorities, 2008 . . . . . . . . . . . . . . . . . . . . . . . . . . . . . . . . . . . . 334
7.A1.1. Ranking of ICT policy areas, 2008. . . . . . . . . . . . . . . . . . . . . . . . . . . . . . . . . . . . . . . 338
Figures
1.1. Growth in monthly shipments of ICT goods by segment in the United States,
December 2001-September 2008 . . . . . . . . . . . . . . . . . . . . . . . . . . . . . . . . . . . . . . . . 26
1.2. Growth in monthly production in selected ICT sectors in Germany,
December 2001-September 2008 . . . . . . . . . . . . . . . . . . . . . . . . . . . . . . . . . . . . . . . . 26
1.3. Growth in monthly turnover in selected ICT sectors in France,
December 2001-August 2008 . . . . . . . . . . . . . . . . . . . . . . . . . . . . . . . . . . . . . . . . . . . 27
1.4. Growth of monthly sales of IT services industries in Japan,
December 2001-August 2008 . . . . . . . . . . . . . . . . . . . . . . . . . . . . . . . . . . . . . . . . . . . 27
1.5. Trends in real output (GDP) in the Canadian ICT sector, Q1 2002-Q2 2008 . . . . 28
1.6. Top 250 ICT firms’ performance trends, 2000-07 . . . . . . . . . . . . . . . . . . . . . . . . . . 31
1.7. Top ICT firms’ revenue and net income trends, 2000-07 . . . . . . . . . . . . . . . . . . . 32
1.8. Top 250 ICT firms’ revenue growth by economy of registration, 2000-06 . . . . . 34
1.9. Top 250 ICT firms’ revenue shares by sector, 2006 . . . . . . . . . . . . . . . . . . . . . . . . 36
1.10. Top 250 ICT firms’ revenue trends by sector, 2000-06 . . . . . . . . . . . . . . . . . . . . . . 36
1.11. Top 250 ICT firms’ profitability by sector, 2000-06. . . . . . . . . . . . . . . . . . . . . . . . . 37
1.12. Top 250 ICT firms’ R&D intensity by sector, 2000-06 . . . . . . . . . . . . . . . . . . . . . . . 38
1.13. Worldwide semiconductor market by region, 1990-2009 . . . . . . . . . . . . . . . . . . . 43
1.14. Worldwide semiconductor sales by market segment, 2007 . . . . . . . . . . . . . . . . . 44
1.15. Worldwide semiconductor market by segment, 1990-2008. . . . . . . . . . . . . . . . . 44
1.16. Share of ICT valued added in business sector value added, 1995 and 2006 . . . . 46
1.17. Share of ICT employment in business sector employment, 1995 and 2006 . . . . 47
1.18. Share of ICT specialist occupations in the total economy, narrow definition,
1995 and 2007. . . . . . . . . . . . . . . . . . . . . . . . . . . . . . . . . . . . . . . . . . . . . . . . . . . . . . . . 49
1.19. Share of ICT-using occupations in the total economy, broad definition,
1995 and 2007. . . . . . . . . . . . . . . . . . . . . . . . . . . . . . . . . . . . . . . . . . . . . . . . . . . . . . . . 50
1.20. Venture capital investments in ICT as a percentage of all venture capital
investment, 2006 . . . . . . . . . . . . . . . . . . . . . . . . . . . . . . . . . . . . . . . . . . . . . . . . . . . . . 51
An
OE
CD
Bro
wo
L e c tur
ylnO dae
R
OECD INFORMATION TECHNOLOGY OUTLOOK 2008 – ISBN 978-92-64-05553-7 – © OECD 200810

TABLE OF CONTENTS
se_it E ditin
es
eu
le
1.21. Quarterly venture capital investments in the ICT sector in the United States,
Q1 1995-Q3 2008 . . . . . . . . . . . . . . . . . . . . . . . . . . . . . . . . . . . . . . . . . . . . . . . . . . . . . 52
1.22. Worldwide ICT spending by market segment, 2003-08 . . . . . . . . . . . . . . . . . . . . . 53
1.23. OECD ICT spending by market segment, 2007 . . . . . . . . . . . . . . . . . . . . . . . . . . . . 53
1.24. Fastest ICT spending growth, 2003-07 . . . . . . . . . . . . . . . . . . . . . . . . . . . . . . . . . . . 54
2.1. World trade in ICT goods, 1996-2007 . . . . . . . . . . . . . . . . . . . . . . . . . . . . . . . . . . . . 73
2.2. United States ICT goods trade growth, March 2001-March 2008 . . . . . . . . . . . . . 75
2.3. China ICT goods export trade growth, April 2000-April 2008 . . . . . . . . . . . . . . . . 76
2.4. Top importers and exporters of ICT goods, 1996-2007 . . . . . . . . . . . . . . . . . . . . . 77
2.5a. ICT goods exports, 2007 . . . . . . . . . . . . . . . . . . . . . . . . . . . . . . . . . . . . . . . . . . . . . . . 78
2.5b. ICT goods imports, 2007 . . . . . . . . . . . . . . . . . . . . . . . . . . . . . . . . . . . . . . . . . . . . . . . 79
2.6. Direction of OECD ICT goods trade, 1996-2006 . . . . . . . . . . . . . . . . . . . . . . . . . . . . 81
2.7. OECD computer equipment trade, 2006. . . . . . . . . . . . . . . . . . . . . . . . . . . . . . . . . . 82
2.8. OECD electronic components trade, 2006 . . . . . . . . . . . . . . . . . . . . . . . . . . . . . . . . 83
2.9. OECD communication equipment trade, 2006 . . . . . . . . . . . . . . . . . . . . . . . . . . . . 85
2.10. OECD audio and video equipment trade, 2006 . . . . . . . . . . . . . . . . . . . . . . . . . . . . 86
2.11. OECD software goods trade, 2006 . . . . . . . . . . . . . . . . . . . . . . . . . . . . . . . . . . . . . . . 87
2.12. OECD and major emerging economies’ computer and information services
trade, 2006 . . . . . . . . . . . . . . . . . . . . . . . . . . . . . . . . . . . . . . . . . . . . . . . . . . . . . . . . . . 88
2.13. OECD and major emerging economies’ communication services trade, 2006 . . 90
2.14. Electronics production, 2005 and 2008 . . . . . . . . . . . . . . . . . . . . . . . . . . . . . . . . . . . . . . . 92
2.15. Growth in the value of electronics production, 2005-2008 . . . . . . . . . . . . . . . . . . 92
2.16. Share of ICT goods in total merchandise exports, 1996-2006 . . . . . . . . . . . . . . . . 94
2.17. Revealed comparative advantage in ICT goods, 1996-2006. . . . . . . . . . . . . . . . . . 95
2.18. Value of cross-border M&A deals in ICT and non-ICT sectors, 1995-2007 . . . . . 99
2.19. Cross-border M&As deals in the ICT sector, 1995-2007 . . . . . . . . . . . . . . . . . . . . . 99
2.20. Cross-border M&As deals in the ICT sector, 1995-2007 . . . . . . . . . . . . . . . . . . . . . 100
2.21. ICT sector cross-border M&As deals by region, 1995-2007 . . . . . . . . . . . . . . . . . . 102
2.22. ICT sector cross-border M&As deals by region, 1997-2007 . . . . . . . . . . . . . . . . . . 102
2.23. Foreign affiliates’ share of turnover in ICT manufacturing, 2005 . . . . . . . . . . . . 104
2.24. Foreign affiliates’ share of employment in ICT manufacturing, 2005. . . . . . . . . 104
2.25. Foreign affiliates’ share of turnover in IT services, 2004. . . . . . . . . . . . . . . . . . . . 105
2.26. United States cross-border and affiliate services sales, 1990-2006 . . . . . . . . . . . 106
3.1. ICT R&D priorities (clusters of topics and subtopics). . . . . . . . . . . . . . . . . . . . . . . 145
3.2. Socio-economic applications of ICT research . . . . . . . . . . . . . . . . . . . . . . . . . . . . 148
3.3. Business R&D spending, 1996-2006 . . . . . . . . . . . . . . . . . . . . . . . . . . . . . . . . . . . . . 149
3.4. Growth of the largest R&D-spending sectors in the OECD area, 1993-2005 . . . . 150
3.5. ICT sub-sector R&D expenditures as a share of total OECD area ICT R&D,
1993-2005 . . . . . . . . . . . . . . . . . . . . . . . . . . . . . . . . . . . . . . . . . . . . . . . . . . . . . . . . . . . 151
3.6. Business R&D expenditure for ICT goods and services, as a share of GDP,
1997 and 2005. . . . . . . . . . . . . . . . . . . . . . . . . . . . . . . . . . . . . . . . . . . . . . . . . . . . . . . . 151
3.7. Share of selected OECD countries in total OECD area ICT sector R&D expenditures,
2005 . . . . . . . . . . . . . . . . . . . . . . . . . . . . . . . . . . . . . . . . . . . . . . . . . . . . . . . . . . . . . . . . . . . . . 152
3.8. R&D expenditures in the United States, the EU15, Japan and Korea by ICT
sub-sectors, 1996, 2003 and 2005 . . . . . . . . . . . . . . . . . . . . . . . . . . . . . . . . . . . . . . . 153
3.9. R&D expenditures in the computer services and software sector, 2006 . . . . . . . . . . 154
3.10. ICT R&D researchers, 2006 or latest available year . . . . . . . . . . . . . . . . . . . . . . . . 155
An
OE
CD
Bro
wo
L e c tur
ylnO dae
R
OECD INFORMATION TECHNOLOGY OUTLOOK 2008 – ISBN 978-92-64-05553-7 – © OECD 2008 11

TABLE OF CONTENTS
se_it E ditin
es
eu
le
3.11. Share of ICT R&D researchers in total R&D researchers, 2006 or latest
available year . . . . . . . . . . . . . . . . . . . . . . . . . . . . . . . . . . . . . . . . . . . . . . . . . . . . . . . . 156
3.12. Top ICT firms, growth of revenue and R&D expenditure, 2000-06 . . . . . . . . . . . 157
3.13. R&D expenditures of top ICT firms, 2006 (left: in USD billions, right: in percentage
of total) and growth of R&D expenditures of top ICT firms, 2000-06 (bottom,
in percentage, current terms) . . . . . . . . . . . . . . . . . . . . . . . . . . . . . . . . . . . . . . . . . . 158
3.14. Reported R&D expenditures of top 100 ICT R&D spending firms, by sector,
2000 and 2006. . . . . . . . . . . . . . . . . . . . . . . . . . . . . . . . . . . . . . . . . . . . . . . . . . . . . . . . 159
3.15. Average R&D intensity of top ICT firms by sector, 2000 and 2006 . . . . . . . . . . . . 162
3.16. R&D intensity of ICT firms, by country/region, 2002-06 (only top ICT firms
reporting R&D) . . . . . . . . . . . . . . . . . . . . . . . . . . . . . . . . . . . . . . . . . . . . . . . . . . . . . . . 163
3.17. Co-operation of innovative firms with universities or higher education
institutions per industry sector, four EU countries (France, Germany, Spain
and the United Kingdom), 2002-04 . . . . . . . . . . . . . . . . . . . . . . . . . . . . . . . . . . . . . . 170
3.18. Share of R&D expenditure under foreign control in the ICT sector, 2005. . . . . . 172
3.19. Japanese ICT R&D expenditures, in ICT and non-ICT sectors, 2006 . . . . . . . . . . 174
3.20. Software development in industrial R&D, United States, 2005 . . . . . . . . . . . . . . 174
3.21. ICT-related patents filed under the PCT, by country, 1994-2005 . . . . . . . . . . . . . 176
3.22. Share of countries in ICT-related patents filed under the PCT, 2005 . . . . . . . . . 178
3.23. ICT-related patents as a percentage of national total, PCT filings, 2003-05 . . . . 179
3.24. ICT-related patents granted at the USPTO versus R&D expenditures . . . . . . . . . 181
3.25. ICT-related patent applications at the EPO versus R&D expenditures . . . . . . . . 181
4.1. Households with access to a home computer in selected OECD countries,
1994-2006 . . . . . . . . . . . . . . . . . . . . . . . . . . . . . . . . . . . . . . . . . . . . . . . . . . . . . . . . . . . 196
4.2. Household access to the Internet in selected OECD countries, 1996-2007 . . . . . 196
4.3. Households with broadband access in OECD countries, 2003-07. . . . . . . . . . . . . 197
4.4. Diffusion of PC and Internet in Sweden by level of education, 1994-2005 . . . . . 198
4.5. Internet access by high, medium and low education level in selected
OECD countries, 2007 . . . . . . . . . . . . . . . . . . . . . . . . . . . . . . . . . . . . . . . . . . . . . . . . . 199
4.6. Broadband access and selected Internet activities among students
and pensioners in Finland, 2002-06 . . . . . . . . . . . . . . . . . . . . . . . . . . . . . . . . . . . . . 200
4.7. Gender differences for selected Internet activities in selected
OECD countries, 2005 . . . . . . . . . . . . . . . . . . . . . . . . . . . . . . . . . . . . . . . . . . . . . . . . . 201
4.8. Broadband uptake among households with or without children in Finland,
Norway and the United Kingdom, 2003-07 . . . . . . . . . . . . . . . . . . . . . . . . . . . . . . . 202
4.9. PC and Internet diffusion and use in the United States and Japan,
by employment status . . . . . . . . . . . . . . . . . . . . . . . . . . . . . . . . . . . . . . . . . . . . . . . . 203
4.10. Non-business-related use of the Internet at the workplace in Luxembourg,
2004 . . . . . . . . . . . . . . . . . . . . . . . . . . . . . . . . . . . . . . . . . . . . . . . . . . . . . . . . . . . . . . . . 204
4.11. Frequency of use of the Internet in Mexico and the United Kingdom . . . . . . . . 205
4.12. Impact of broadband on selected Internet activities, selected
OECD countries, 2007 . . . . . . . . . . . . . . . . . . . . . . . . . . . . . . . . . . . . . . . . . . . . . . . . . 207
4.13. Internet activities of adults in the United Kingdom, 2000-06. . . . . . . . . . . . . . . . 208
4.14. Weekly Internet access hours in Korea, 2004-06 . . . . . . . . . . . . . . . . . . . . . . . . . . 209
4.15. Broadband diffusion and time spent on the Internet in Norway, 2000-07 . . . . . . . 210
4.16. Media consumption by Internet users in France, 2006 . . . . . . . . . . . . . . . . . . . . . 210
4.17. US adult Internet users who use other media while online, 2006 . . . . . . . . . . . . 211
An
OE
CD
Bro
wo
L e c tur
ylnO dae
R
OECD INFORMATION TECHNOLOGY OUTLOOK 2008 – ISBN 978-92-64-05553-7 – © OECD 200812

TABLE OF CONTENTS
se_it E ditin
es
eu
le
4.18. Internet users listening to Web radio/watching TV, selected
OECD countries, 2002-07 . . . . . . . . . . . . . . . . . . . . . . . . . . . . . . . . . . . . . . . . . . . . . . 212
4.19. Evolution of inequalities in possession of selected products in France . . . . . . . 213
4.20. Number of purposes of use of the Internet in Finland, 2006 . . . . . . . . . . . . . . . . 214
4.21. Broadband effect on variety of home Internet use in Finland, 2004 . . . . . . . . . . 215
4.22. Number of activities participated in by home Internet users during the last
12 months, Canada, 2005 . . . . . . . . . . . . . . . . . . . . . . . . . . . . . . . . . . . . . . . . . . . . . . 215
4.23. Number of activities participated in by Internet users during the last month,
France, 2005 . . . . . . . . . . . . . . . . . . . . . . . . . . . . . . . . . . . . . . . . . . . . . . . . . . . . . . . . . 216
4.A1.1. Diffusion of PCs among households by income level in Japan, 1992-2007 . . . . . 222
4.A1.2. Internet access or use by educational attainment in selected OECD countries. . . . 223
4.A1.3. Internet usage in Finland, 2001 and 2005 . . . . . . . . . . . . . . . . . . . . . . . . . . . . . . . . 224
4.A1.4. Internet usage pattern by gender and age in Korea, 2005. . . . . . . . . . . . . . . . . . . 225
4.A1.5. Selected online activities by level of education in Sweden, 2003-07 . . . . . . . . . . 226
4.A1.6. Minutes using the Internet at home in leisure time per week in Finland,
2001-06 . . . . . . . . . . . . . . . . . . . . . . . . . . . . . . . . . . . . . . . . . . . . . . . . . . . . . . . . . . . . . 227
5.1. Broadband growth, OECD total, 2003-08 . . . . . . . . . . . . . . . . . . . . . . . . . . . . . . . . . 249
5.2. Global consumer Internet traffic 2005-11 . . . . . . . . . . . . . . . . . . . . . . . . . . . . . . . . 249
5.3. Digital broadband content value and distribution chain . . . . . . . . . . . . . . . . . . . 251
5.4. Digital broadband content business models . . . . . . . . . . . . . . . . . . . . . . . . . . . . . . 254
5.5. Bandwidth requirements of selected digital content types, in Mbit/s, 2008 . . . . . . 255
5.6. Blog readers, bloggers, and minihompy owners in Korea. . . . . . . . . . . . . . . . . . . 259
5.7. Major film market revenues, 2006 (excluding TV market) . . . . . . . . . . . . . . . . . . 264
5.8. Value of global music sales, 1984-2007 . . . . . . . . . . . . . . . . . . . . . . . . . . . . . . . . . . 269
5.9. Growth of worldwide advertising spending . . . . . . . . . . . . . . . . . . . . . . . . . . . . . . 273
5.10. Worldwide shares of advertising expenditure by medium. . . . . . . . . . . . . . . . . . 273
5.A1.1. Market size and growth, 2007 or latest available year. . . . . . . . . . . . . . . . . . . . . . 282
6.1. The 23 600 mile SEA-ME-WE 3 Cable . . . . . . . . . . . . . . . . . . . . . . . . . . . . . . . . . . . . 289
7.A1.1. ICT policy framework . . . . . . . . . . . . . . . . . . . . . . . . . . . . . . . . . . . . . . . . . . . . . . . . . 337
Table of Contents
An
OE
CD
Bro
wo
L e c tur
ylnO dae
R
OECD INFORMATION TECHNOLOGY OUTLOOK 2008 – ISBN 978-92-64-05553-7 – © OECD 2008 13

se_it E ditin
es
eu
le
An
OE
CD
Bro
wo
L e c tur
ylnO dae
R

ISBN 978-92-64-05553-7OECD Information Technology Outlook 2008
© OECD 2008
DB
ro
wse_it E ditio
n
es
eu
le
ylnO d
OECD Information Technology Outlook 2008Highlights
The ICT industry has slowed with the world economic slowdown but growth continues in some markets and products
The outlook for the ICT sector has weakened with the turmoil in the world economy…
The outlook for the information and communications technology (ICT) sector is much
less favourable than in recent years. With economic conditions deteriorating, recession in
the OECD area and business and consumer confidence falling sharply, global projections for
ICT spending have been revised sharply downwards. Macroeconomic forecasts, short-term
cyclical output indicators and business and consumer activity show ICT growth in OECD
countries to be slower in 2008 than in 2007 at around 4%. But growth has not yet collapsed as
it did in 2001-02 with the ending of the ICT bubble, and so far it has remained somewhat
stronger than OECD economies’ performance as a whole.
Over the next 18 months, ICT growth is likely to be below zero for the OECD with
considerable turbulence as the financial services sector restructures and the real economy
experiences a deep economic downturn. However, IT services and software will generally
grow, along with new Internet and communications-related products and infrastructure as
they are an essential part of spending and partly recession-proof. A general upturn cannot
be expected before the end of 2009 in parallel with renewed GDP growth. Growth after 2009
will potentially be at a somewhat higher level than GDP as new broadband infrastructures
and products develop, although financing new ICT investments will be a continuing
business and policy challenge.
… but medium-term growth is partly underpinned by new products and growth in non-OECD markets
The longer-term prospects for the ICT sector depend on whether businesses and
consumers continue investing in new ICT goods and services at a relatively high rate, and
whether non-OECD economies maintain growth paths that, while slowing, in part compensate
for recession and uncertainties in OECD economies. Non-OECD economies make up over 20%
of the global ICT market, with ICT spending in Brazil, China, India, Indonesia and Russia all
growing in 2003-07 at more than 20% annually in current terms. Around 50% of ICT goods
production now comes from non-OECD countries, and these countries, notably China and
India, are increasingly the home of top ICT firms. But in the medium term, developing country
An
OE
C
L e c tur
aeR
15

OECD INFORMATION TECHNOLOGY OUTLOOK 2008 HIGHLIGHTS
se_it E ditin
es
eu
le
exports and business activity will be curtailed, and commodity price rises and inflation have
squeezed consumer spending in non-OECD countries. ICT employment in OECD countries will
contract as business and consumer expenditures drop, and as competition from non-OECD
economies and industrial restructuring accelerate.
Over the longer term the ICT industry is expanding, ICT-related employment is increasingly important and one half of venture capital goes to ICTs
Looking at developments before the current financial crisis, the ICT sector put in a
strong performance since 2002, underpinning real growth and supported at global level by
the dynamic performance in non-OECD countries, partly through ICT production and
exports and partly through domestic market growth. Currently the ICT sector makes up
over 8% of OECD business GDP, and employs over 15 million people. The top 250 ICT firms
(making up around 70% of OECD ICT employment) grew by 12% in current terms in 2007
and their worldwide revenues reached USD 3.8 trillion. OECD countries specialised in ICT
manufacturing such as Korea, Finland, Japan and Hungary maintained their
competitiveness and ICT goods trade surpluses in recent years and will continue to do so.
ICT skills are an important contributor to growth and they are spread widely across the
economy. Over 4% of total employment is in ICT specialist occupations and this share is
growing rapidly, and over 20% of employment is in intensive ICT-using occupations. The
industry has been underpinned by steady flows of venture capital, with US ICT venture
investments in the first half of 2008 running at the same level as in 2007. Around half of the
US total goes into ICTs, particularly in software and Web 2.0 applications, with increasing
investment in ICT-intensive environmental and energy technologies. However, exit
strategies have been constrained by the credit crunch and new venture financing faces
severe challenges over the medium term.
Global restructuring continues apace
Global restructuring continues, and after expanding strongly, ICT trade slowed in 2008
Global ICT trade expanded strongly to more than USD 3.5 trillion in 2006 while the
share of the OECD area in total world ICT trade decreased steadily to 56%. Weakening
economic conditions slowed ICT trade in 2007 and it slowed further in the first half of 2008,
due to lower growth in both US imports and Asian exports. Nevertheless, ICT exports
remained resilient in the first half of 2008, with exports continuing to grow in some
countries (e.g. China, Korea, Malaysia, Mexico, Thailand, and Eastern European countries),
due to continuing, albeit slowing, demand from OECD countries and strong demand from
emerging markets (especially in the Middle East, Latin America and Africa). With the sharp
economic downturn in OECD countries and increasingly elsewhere, ICT trade is bound to
slow further.
An
OE
CD
Bro
wo
L e c tur
ylnO dae
R
OECD INFORMATION TECHNOLOGY OUTLOOK 2008 – ISBN 978-92-64-05553-7 – © OECD 200816

OECD INFORMATION TECHNOLOGY OUTLOOK 2008 HIGHLIGHTS
se_it E ditin
es
eu
le
China remains by far the leading exporter of ICT goods…
China’s ICT exports rose to USD 360 billion in 2007, surpassing the combined ICT
exports of the EU15 and the United States. However, China’s export growth slowed to
around 10% in the first half of 2008 and continues to drop. Among OECD countries, Korean
exports more than doubled from 2001 to reach almost USD 100 billion in 2007, very close to
those of Japan.
… and ICT-related FDI expanded to new highs before falling sharply in 2008
ICT-related foreign direct investment reached an historic high in 2007, but has fallen
sharply in 2008 with a possible recovery projected after 2009. In 2007 about one-fifth of all
cross-border mergers and acquisitions were ICT-related (USD 170 billion). Such deals have
been increasingly targeting and originating in non-OECD economies, with firms in the
BRICS countries particularly active. There has been a very marked slowdown in global
merger and acquisition activity in 2008 along with the slowdown in foreign direct
investment and this will persist due to constrained business funding.
ICT R&D and innovation as drivers of growth
The ICT sector is by far the largest R&D spender…
The ICT industry in OECD countries spends about two and a half times as much on R&D
(USD 130 billion in 2000 prices) as the automotive sector and more than triple that of the
pharmaceutical sector. R&D spending is especially strong in services and software as these
areas have expanded rapidly. The United States accounts for 40% of all OECD ICT-related
business R&D expenditures, the EU-15 for a little under 25%, Japan for 22% and Korea for 9%.
The ICT business sector has close to one million researchers; of these around half are in the
United States. ICT research priorities are focusing on developing the basic technologies for the
next generations of products and a new development has been interest in addressing major
challenges including climate change and healthcare.
… the top ICT firms are R&D-intensive and the organisation of R&D is changing
R&D expenditures of major ICT firms rose to USD 151 billion in 2006, and growth
continued in 2007. The top 100 R&D companies spend an average of nearly 7% of revenue
on R&D. ICT firms from the United States and Japan still lead by a wide margin, but
Korean firms have been closing the gap. ICT R&D expenditures of non-OECD ICT firms
(China and India, and other emerging economies) are moderate by comparison, although
rising fast.
Publicly funded research, globalised research networks and inter-firm R&D
partnerships and alliances are important factors driving innovation. R&D partnerships and
alliances have spread across new geographical and interdisciplinary domains. While the
An
OE
CD
Bro
wo
L e c tur
ylnO dae
R
OECD INFORMATION TECHNOLOGY OUTLOOK 2008 – ISBN 978-92-64-05553-7 – © OECD 2008 17

OECD INFORMATION TECHNOLOGY OUTLOOK 2008 HIGHLIGHTS
se_it E ditin
es
eu
le
trend is toward globalised research networks, the centres of these networks are highly
concentrated in a few regions in OECD countries. A few new locations are growing in
importance, including Shanghai, Haifa and Bangalore, and to a lesser extent Chinese
Taipei, Malaysia and Singapore.
Non-ICT industries are increasingly undertaking ICT-related research, and ICT patenting is expanding
In some OECD countries the share of R&D conducted by non-ICT firms has risen to 25%
of total industry ICT R&D spending. This R&D is conducted in a wide range of sectors,
notably in automobiles, financial services and defence, and is linked with the growing
importance of embedded systems and software in ICT and non-ICT products. The number of
ICT-related patents grew strongly from the mid-1990s to 2005. The United States, Europe
and Japan continue to lead in the number of international patent applications, but the
proportion of ICT patents in total Chinese filings tripled in a decade, and Korea’s patent
output is also rising.
Broadband is changing household Internet use
Broadband is one of the fastest diffusing technologies…
Broadband is diffusing more rapidly than narrowband Internet at home and catching
up with the PC installed base. In 2007, more than two-thirds of all households had access
to broadband Internet in countries such as Denmark, Finland, Iceland and the Netherlands;
and in Korea, more than eight out of ten households have broadband access.
… accelerating online activities…
People with broadband access use the Internet more often and more intensively, and
broadband drives online shopping, education, use of government services, playing or
downloading digital content and video telephony.
… but a new digital use divide is surfacing based on socio-economic characteristics
The pattern of broadband use is shaped by socio-economic characteristics including
education, income, age, gender, or place of access. Young, highly educated, higher-income
males tend to access the internet more frequently and for different types of online
activities. Having children in the house increases broadband use. But as the digital access
divide decreases a digital use divide is emerging.
An
OE
CD
Bro
wo
L e c tur
ylnO dae
R
OECD INFORMATION TECHNOLOGY OUTLOOK 2008 – ISBN 978-92-64-05553-7 – © OECD 200818

OECD INFORMATION TECHNOLOGY OUTLOOK 2008 HIGHLIGHTS
se_it E ditin
es
eu
le
Digital content is developing rapidly, driven by consumer use
Digital content is transforming ICT and creative industries…
Digital content is a key factor behind the rapid growth of OECD broadband subscribers
to 251 million in 2008, up from 68 million in 2003, and the growing number of users has
spurred the creation of new content. Mobile broadband is also beginning to boost content
creation and demand. Finally, management and distribution technologies are increasing
the supply of broadband content, including from users.
An increasing share of content industry revenues is derived from products delivered
via the Internet, but with marked differences across sectors. Advertising is the biggest
online market, with revenues of over USD 30 billion in 2007 and annual growth of 30%.
Online revenues are around one-sixth of the total for computer and video games and
music, and they are growing fastest for films, albeit from low levels. The development of
user-created content has been rapid, with for example 40% of Korean Internet users being
members of online communities. Video and social networking sites are leading the
development, and virtual worlds have become a major centre of activity.
There are significant impacts on value chains and business models beyond the ICT sector…
Cross-industry collaboration and new business partnerships are emerging, for
example, for content aggregation and distribution. Some online business models mirror
offline models (e.g. pay-per-item) and some are new (e.g. sale of virtual items). Digital
content has also been increasingly used to organise users around non-media industries
such as banking, and non-entertainment applications are emerging in government
services and health.
… although barriers hamper uptake
Industry’s goal of digital content “anywhere, anytime and on any device” is still
remote. Challenges include access speeds, service quality and pricing. Online content
catalogues are still limited and interoperability, geographic access limitations and the
availability of unauthorised digital content hamper uptake. Widespread use of advanced
mobile broadband content services has not yet emerged.
The potential and actual impacts of broadband
Broadband networks are an integral part of the economy…
Broadband is an enabler of structural change, the creation of new digital services, and
it boosts firm efficiency, improves competition and underpins globalisation. Broadband
spurs ICT innovation and ICT-enabled innovation, for example in developing collaborative
R&D, making cloud computing possible and enabling new ways of organising research.
An
OE
CD
Bro
wo
L e c tur
ylnO dae
R
OECD INFORMATION TECHNOLOGY OUTLOOK 2008 – ISBN 978-92-64-05553-7 – © OECD 2008 19

OECD INFORMATION TECHNOLOGY OUTLOOK 2008 HIGHLIGHTS
se_it E ditin
es
eu
le
… but measuring broadband impacts is an ongoing challenge
Despite the rapid take-up of broadband, its diffusion is relatively recent and its
impacts are difficult to disentangle from those of established ICTs. Nevertheless, firms use
fast connections to make existing processes more efficient and productive, develop new
e-business value chains and business models, and transform business activities. There is
evidence that broadband increases the number of businesses and employment particularly
in knowledge-intensive sectors.
Broadband and associated applications are contributing to the transformation of
economic activity as did other general purpose technologies such as electricity and the
internal combustion engine. Broadband impacts may be greater as the price of ICTs has
fallen more dramatically. However necessary, complementary investments in skills and
organisational innovations may take time to materialise to enable broadband’s
contribution to growth and job creation. It is generally accepted that considerably higher
levels of investment in intangibles, human and organisational capital are needed to
complement ICT and broadband investments.
Rising to the challenges? ICT policies in demanding times
ICT policies are widening their focus…
OECD governments are continuing to integrate ICT policies into national strategies for
enhancing economic growth, employment, welfare and achieving wider socio-economic
objectives. There is a greater need for a coordinated, horizontal government approach
since ICTs are increasingly addressing policy challenges in areas as diverse as education,
healthcare, climate change, and energy efficiency. Around one-third of OECD countries are
attempting to centralise formulation and co-ordination of ICT-related policies to improve
policy coherence. Efforts to improve coordination and reduce duplication are likely to
intensify with the economic decline, greater strains on government budgets, and pressures
on long-term investments.
… and priorities are shifting…
In 2008, the top 10 ICT policy priorities of OECD governments are a mixture of
traditional targets (e.g. government online, ICT R&D) and newer areas (e.g. digital content
and public sector information). Some governments are introducing policies to meet
challenges beyond technology uptake. These include R&D programmes and fostering
innovation; government online policies to target public sector efficiency; and broadband
policies to bridge geographic and social divides. Policies to enhance trust online are gaining
in importance; and while policies to improve technology diffusion to business are still a
priority, policies focused on the general ICT business environment decreased.
An
OE
CD
Bro
wo
L e c tur
ylnO dae
R
OECD INFORMATION TECHNOLOGY OUTLOOK 2008 – ISBN 978-92-64-05553-7 – © OECD 200820

OECD INFORMATION TECHNOLOGY OUTLOOK 2008 HIGHLIGHTS
se_it E ditin
es
eu
le
.... while better policy assessment and coordination are needed
Assessment and evaluation are more widespread, but further efforts are needed to
more effectively measure and subsequently improve the efficiency of ICT polices and their
coordination.
ICT policies have evolved to meet new priorities while continuing to focus on core
activities. These policies will be tested in terms of their contributions to long-run
competitiveness, growth and employment. Non-OECD economies are also developing
comprehensive ICT policies which both complement and challenge the development of
policies in OECD countries. To safeguard the future, it is crucial in light of the economic
downturn which began in 2008 to maintain long-term priorities and investments in
research, innovation and human resources.
Top ten ICT policy priorities, 2008
1 Government on line, government as model users
2 Broadband
3 ICT R&D programmes
4 Promoting IT education
5 Technology diffusion to business
6 Technology diffusion to individuals and households
7 Industry-based and on-the-job training
8 General digital content development
9 Public sector information and content
10 ICT innovation support An
OE
CD
Bro
wo
L e c tur
ylnO dae
R
OECD INFORMATION TECHNOLOGY OUTLOOK 2008 – ISBN 978-92-64-05553-7 – © OECD 2008 21

An
OE
CD
Bro
wse_it E ditio
n
L e c tures
eu
le
ylnO dae
R

ISBN 978-92-64-05553-7OECD Information Technology Outlook 2008
© OECD 2008
DB
ro
wse_it E ditio
n
es
eu
le
ylnO d
Chapter 1
The IT Industry: Recent Developments and Outlook
The current outlook for the ICT sector is much less favourable than at the time ofthe last edition of this publication, in 2006. The macroeconomic outlook hasprogressively worsened and both business and consumer confidence in OECDcountries have fallen sharply. Projections both in general and for the ICT sector
have been successively revised sharply downwards. Macroeconomic forecastscombined with business and consumer sentiment suggest that ICT growth inOECD countries slowed rapidly in 2008 but is unlikely to collapse as it didin 2001. Overall, the near-term outlook for OECD countries is for a maximum of
4% ICT growth in 2008 and zero or below until the end of 2009, with verydifferent performances across segments and markets. As in the last downturn,there is also likely to be considerable pressure on OECD ICT employment owingto increasing competition from non-OECD economies and global industrial
restructuring in ICT goods and services. Global ICT markets are also shifting tonon-OECD economies, and the top 250 ICT firms include increasing numbers ofnon-OECD firms. The long-term performance of the ICT sector will depend onwhether new goods and services will continue to prompt businesses and
consumers to keep investing in and buying ICT output and the extent to whichnon-OECD economies maintain their more dynamic growth paths.
An
OE
C
L e c tur
aeR
23

1. THE IT INDUSTRY: RECENT DEVELOPMENTS AND OUTLOOK
DB
ro
wse_it E ditio
n
es
eu
le
ylnO d
IntroductionThe performance of the information and communication technology (ICT) sector, ICT
investment and ICT markets remained moderately good until mid-2008, but the outlook is
much worse than in previous editions of the IT Outlook due to unprecedented turbulence
and the deep economic downturn in OECD economies. Macroeconomic prospects for OECD
countries have fallen sharply since 2005-06, with global turmoil in financial markets and
weaknesses in business investment, beginning in banking and finance and spreading to
the real economy world-wide, and in consumer spending, with the downturn in housing
markets, rising food and commodity prices, and rapidly weakening labour markets.
Continuing global weaknesses have reduced the ICT sector’s prospects owing to the rapid
slowdown in growth and the onset of recession in the OECD area.
In macroeconomic terms the leading role of the United States has diminished
somewhat, with the euro area growing somewhat more strongly than the United States
and Japan over 2006-07, but with the United States looking a little stronger in 2008 (OECD,
2008c). Real GDP growth was forecast at around 1.1% in the euro area for 2008 and –0.5%
for 2009, somewhat stronger in the United States for 2008, and in Japan lower than in the
euro area (OECD, 2008c). OECD countries overall were forecast to have lower real GDP
growth in 2008, negative in 2009, and there have been considerable downward revisions
from projections in mid-2008 (OECD, 2008a, 2008c). Large non-OECD countries have
consistently maintained higher growth but are also slowing. Furthermore, there are few
signs of other OECD countries decoupling from the United States. The shocks in the United
States have spread via the financial crisis and currency movements to other OECD
countries and other major economies.
Aggregate investment has followed the usual pattern, overshooting during expansions
and declining markedly during slowdowns. Because of the collapse of housing and
construction markets in many countries, gross fixed capital formation declined markedly
in 2008 and is negative across the OECD area as a whole. However, business investment as
captured in real gross private non-residential fixed capital formation performed somewhat
better. It grew considerably faster than GDP, by 6.1% across the OECD zone in 2006 and by
5.1% in 2007, with the euro area leading in 2007. It was forecast to grow more slowly than
GDP for the OECD area in 2008-09, but to remain reasonably strong in a few higher-growth
countries and resource-based economies (Australia, Norway) (OECD, 2008a). However,
some of these countries have also slowed sharply as the financial market crisis has
continued and as business and consumer confidence has ebbed.
ICT investment is a large share of non-residential gross fixed capital formation
(10-25%), and ICT investment will slow with the slow-down in aggregate investment.
Nonetheless, some ICT investments will keep growing, owing to continued innovation in
investment goods and services driving new investments across the economy. Many of
these new goods and services will also have accompanying ICT capital expenditures
themselves. The share of ICT in total investment is also likely to be underestimated as
An
OE
C
L e c tur
aeR
OECD INFORMATION TECHNOLOGY OUTLOOK 2008 – ISBN 978-92-64-05553-7 – © OECD 200824

1. THE IT INDUSTRY: RECENT DEVELOPMENTS AND OUTLOOK
se_it E ditin
es
eu
le
measurement is particularly difficult for software, and ICT components that are
incorporated in products such as machine tools or motor vehicles are not included in ICT
investment.1
Continuing long-term current account imbalances in OECD countries, and between
OECD and non-OECD economies and particularly with China, also present continuing risks
for the global economy. The current account balance for OECD countries declined from –1%
of GDP in 2003 to –1.7% in 2006 and was forecast to be around –1.5% in 2008 or to worsen
owing to peak high energy, commodity, and food prices (OECD, 2008c). The United States
has a very large deficit (–5% of GDP in 2008), while Germany and Japan have large surpluses;
some smaller countries have proportionally much larger deficits and surpluses. All
countries with deficits in 2005 are forecast to have them in 2009, and more countries have
entered this group (Canada and Korea). These pressures are also likely to constrain ICT
expenditures.
General government financial imbalances are also a continuing cause of concern. The
total OECD financial balance was declining only slowly from its peak of –4% of nominal GDP
in 2003 and now is forecast to worsen in 2009 and 2010. Deficits tend to persist except in a
few northern European countries. Budget constraints in most OECD countries are likely to
affect public capital investment, including in ICT.
Recent developments in ICT supplyThe ICT supply side remained rather resilient overall through the third quarter of 2008;
if anything, performing better than projections of macroeconomic performance (both GDP
and fixed capital formation) would suggest. In general it parallels macroeconomic
performance and aggregate investment, but shows greater short-term cyclical fluctuation,
particularly in ICT manufacturing. In 2003 production and markets were more robust in the
United States than in Japan and Europe, owing to better macroeconomic performance, but
the situation changed as growth increased in Japan (from 2004) and then in Europe
(from 2006), driving domestic ICT production and investment. The relative strength of
Europe and Japan vis-à-vis the United States persisted into the third quarter of 2008. Some
of the smaller OECD countries (Finland, Korea and Sweden) have had dynamic
performance in ICT manufacturing, and all countries have shown continuing dynamism in
the supply of ICT services. Furthermore, the growing importance of consumers in total ICT
sales (around 30% of total ICT markets and growing steadily, according to WITSA, 2008)
suggests that the composition of ICT production will continue to change, with consumer
products more important than in the past despite current weaknesses.
With the rapid weakening of the United States economy from the third quarter
of 2007, United States ICT manufacturing shipments showed negative growth from
September 2007 in all segments. This follows mostly positive growth after the trough
in 2001-02. Shipments of semiconductor components led both the current decline and the
preceding rebound by at least five quarters. The decline in the US dollar has helped exports
of ICT goods, and these exports in part account for the nascent upturn from the end
of 2007, with the exception of semiconductors, which remained in decline (see Figure 1.1).
In Europe, German computers and communication equipment production remained
strong in mid-2008, and that of process control equipment strengthened somewhat,
reflecting better than expected industrial production and exports in the first half of 2008
(see Figure 1.2). ICT manufacturing has shown positive year-on-year growth since 2003-04,
An
OE
CD
Bro
wo
L e c tur
ylnO dae
R
OECD INFORMATION TECHNOLOGY OUTLOOK 2008 – ISBN 978-92-64-05553-7 – © OECD 2008 25

1. THE IT INDUSTRY: RECENT DEVELOPMENTS AND OUTLOOK
se_it E ditin
es
eu
le
with components (and communications equipment) leading although showing signs of
weakening. In France there is a similar cyclical picture but with an earlier upturn in
computer and office equipment and a later return to growth for electronic components.
Growth of both in mid-2008 was around zero after being positive as of 2006. Computer
services in France have grown consistently, with very strong growth earlier in the decade,
and growth is holding up better than ICT goods (Figure 1.3). Relatively rapid growth in
Figure 1.1. Growth in monthly shipments of ICT goods by segment in the United States, December 2001-September 2008
Year-on-year percentage change, domestic net selling values, seasonally adjusted, 12-month moving average
1 2 http://dx.doi.org/10.1787/472572826243
Source: OECD, based on US Bureau of the Census, Manufacturer’s Shipments, Inventories and Orders (M3) survey,November 2008. www.census.gov/indicator/www/m3/.
Figure 1.2. Growth in monthly production in selected ICT sectors in Germany, December 2001-September 2008
Year-on-year percentage change, monthly volume index, seasonally adjusted, 12-month moving average
1 2 http://dx.doi.org/10.1787/472578032416
Source: Statistisches Bundesamt, Produktionsindex, November 2008.
40
30
20
10
0
-10
-20
-30
-40
% Communications equipment Computers Semiconductors
Dec. 0
1
Sept. 0
2
June
03
Mar. 04
Dec. 0
4
Sept. 0
5
June
06
Mar. 07
Dec. 0
7
Sept. 0
8
50
40
30
20
10
0
-10
-20
% Industrial process control equipment
Radio, TV, communications equipment
Computer and office machinery
Electrical and optical equipment (ISIC 30-33)
Dec. 0
1
Apr. 02
Aug. 0
2
Dec. 0
2
Apr. 03
Aug. 0
3
Dec. 0
3
Apr. 04
Aug. 0
4
Dec. 0
4
Apr. 05
Aug. 0
5
Dec. 0
5
Apr. 06
Aug. 0
6
Dec. 0
6
Apr. 07
Aug. 0
7
Dec. 0
7
Apr. 08
Aug. 0
8An
OE
CD
Bro
wo
L e c tur
ylnO dae
R
OECD INFORMATION TECHNOLOGY OUTLOOK 2008 – ISBN 978-92-64-05553-7 – © OECD 200826

1. THE IT INDUSTRY: RECENT DEVELOPMENTS AND OUTLOOK
se_it E ditin
es
eu
le
computer and software services is part of structural transformation in the ICT industry,
with software and IT services accounting for an increasing share of total ICTs.
ICT activity returned to growth earlier in Japan than in Europe but is also slowing
(Figure 1.4). The Japanese IT services industries had consistent positive growth from
early 2005 after a period of fluctuating and sometimes negative growth from 2003, a picture
very similar to that of IT services in France (Figure 1.3). Because Japan’s IT services are
largely for domestic consumption, their performance more accurately reflects domestic
ICT-related business investment than the highly export-orientated ICT manufacturing
Figure 1.3. Growth in monthly turnover in selected ICT sectors in France, December 2001-August 2008
Year-on-year percentage change, monthly value index, seasonally adjusted, 12-month moving average
1 2 http://dx.doi.org/10.1787/472635607502
Source: INSEE, Indice et séries statistiques, November 2008.
Figure 1.4. Growth of monthly sales of IT services industries in Japan, December 2001-August 2008
Year-on-year percentage change, sales value, monthly and 12-month moving average
1 2 http://dx.doi.org/10.1787/472674750486
Source: METI Monthly Survey on IT Services Market, November 2008.
30
20
10
0
-10
-20
-30
% Computer and office machinery Electronic components Computer services
Dec. 0
1
Apr. 02
Aug. 0
2
Dec. 0
2
Apr. 03
Aug. 0
3
Dec. 0
3
Apr. 04
Aug. 0
4
Dec. 0
4
Apr. 05
Aug. 0
5
Dec. 0
5
Apr. 06
Aug. 0
6
Dec. 0
6
Apr. 07
Aug. 0
7
Dec. 0
7
Apr. 08
Aug. 0
8
15
10
5
0
-5
-10
%
Dec. 0
1
IT services 12-month moving average
Apr. 02
Aug. 0
2
Dec. 0
2
Apr. 03
Aug. 0
3
Dec. 0
4
Apr. 04
Aug. 0
4
Dec. 0
5
Apr. 05
Aug. 0
5
Dec. 0
5
Apr. 06
Aug. 0
6
Dec. 0
6
Apr. 07
Aug. 0
7
Dec. 0
7
Apr. 08
Aug. 0
8
An
OE
CD
Bro
wo
L e c tur
ylnO dae
R
OECD INFORMATION TECHNOLOGY OUTLOOK 2008 – ISBN 978-92-64-05553-7 – © OECD 2008 27

1. THE IT INDUSTRY: RECENT DEVELOPMENTS AND OUTLOOK
se_it E ditin
es
eu
le
sector. Finally, the shift towards ICT services is apparent in Canada’s aggregate data
(Figure 1.5). Although ICT manufacturing and services have outstripped total
manufacturing and total services respectively, ICT services have grown consistently while
ICT manufacturing has been much more volatile, with ICT goods shipments slowing in
mid-2008. For all of these countries, although ICT goods output was slowing or declining
slightly and services slowing in mid-2008, the slowdown and declines so far are not as
dramatic as the ICT crash in 2001-02 as the sector is markedly stronger and has not
engaged in the excesses of the earlier period.
Prospects in the near to medium termIn the first three quarters of 2008, ICT markets and the ICT industry were resilient in
the face of financial market turbulence, rapidly weakening macroeconomic conditions,
falling business and consumer confidence and the onset of recession in the OECD area.
Reasons for resilience included less than expected falls in ICT demand in the United States
and particularly in Europe, continuing demand in the Asia-Pacific region, Latin America,
Eastern Europe and the Russian Federation, and the development of new products,
particularly for consumers. However, rapidly declining OECD economies, investment and
consumer expenditures and more subdued demand in emerging economies moderated
ICT industry growth later in 2008.
Global ICT spending estimates have been revised downwards in the course of 2008, as the
US slowdown and imminent recession spread.2 Lower US growth is spilling over into US IT
employment, with hiring at its lowest since 2004 as firms cease discretionary IT spending.3 On
the other hand, ICT spending continued to grow strongly in the Asia-Pacific region through
mid-20084 and in other non-OECD regions, partly because the falling US dollar made ICT
products cheaper. This partly offset lower growth in the United States, Japan and Europe.
Western European ICT spending was expected to grow by 5% in 2008, but rapidly declining
business and consumer confidence in mid-2008 suggested that this was too optimistic.
Figure 1.5. Trends in real output (GDP) in the Canadian ICT sector, Q1 2002-Q2 2008
Indexed growth, Q1 2002 = 100
1 2 http://dx.doi.org/10.1787/472682210731
Source: Industry Canada, Quarterly Monitor of the Canadian ICT Sector, Second Quarter 2008, September 2008.
135
130
125
120
115
110
105
100
95
90
ICT services Services Canada ICT manufacturing Manufacturing Canada
2002.Q
1
2002.Q
3
2003.Q
1
2003.Q
3
2004.Q
1
2004.Q
3
2005.Q
1
2005.Q
3
2006.Q
1
2006.Q
3
2007
.Q1
2007
.Q3
2008.Q
1
An
OE
CD
Bro
wo
L e c tur
ylnO dae
R
OECD INFORMATION TECHNOLOGY OUTLOOK 2008 – ISBN 978-92-64-05553-7 – © OECD 200828

1. THE IT INDUSTRY: RECENT DEVELOPMENTS AND OUTLOOK
se_it E ditin
es
eu
le
By product area, communications and computer equipment were growing more
slowly or declining, software and IT services continued to grow, and, despite ebbing
consumer confidence, some consumer products remained resilient.5 The global
semiconductor market was forecast to grow at around 2.2% in 2008 with a rather shaky
start and poor finish, and investment in semiconductor production equipment dropped
very sharply.6 Global PC shipments were holding up at least in the first half of 2008, with
growing volumes offsetting price declines, continuing demand for mobile computing
devices and low-cost notebooks, and growth in some geographical markets.7 Future growth
in the PC market will depend on macroeconomic prospects, local demand and
development of new products. The market for mobile phones is expected to drop in 2009.
IT services continue to grow, driven by outsourcing and the development of new services
such as utility computing.
Third-quarter 2008 results of major ICT firms have been mixed; they are positive overall,
but with softening of revenues and some segments and firms performing poorly. By
individual segments, third-quarter 2008 revenues show: new products performing well
(games software and equipment, and new consumer equipment); semiconductor firms
struggling with the global downturn, overcapacity and falling prices, and slashing
investment (but some firms performing well); IT equipment generally growing (laptops,
other IT equipment); telecommunications services firms slowing as core markets stagnate or
even decline and looking to new services (3G services) and markets (developing countries) to
boost growth; services generally growing (software, IT services); and established Internet
businesses maintaining very high growth rates. Non-United States markets are increasing in
importance and Asian firms are growing rapidly except in Japan, with the contrast in results
between United States and Japanese firms partly due to currency movements.
While the first three quarters of 2008 showed moderately resilient output and
markets, growth can be expected to deteriorate in 2009 as the economic downturn plays
itself out and a broad recovery is unlikely before the end of 2009 at the earliest.8 For
example, the finance, insurance and retail sectors and suppliers will curtail ICT spending
and seek to increase efficiency of existing investments, and rapidly falling consumer
confidence and purchasing power will have a direct impact (consumers make up about 30%
of ICT markets; see WITSA, 2008). The nature and length of slower or declining ICT growth
will depend on how OECD countries are affected by the downturn (they have not decoupled
from the United States; see OECD, 2008c), and how emerging economies (in particular
China, but also other major countries) will cushion the declines in OECD markets.
If ICT production and markets in Asia depend on OECD imports and investment to
continue to drive development, ICT supply is in for a bumpy ride. If these markets can limit
the impact of the deep OECD downturn, outcomes will be different. Other factors are
whether ICTs are now viewed as essential parts of long-term business operations and
investment cuts will be resisted in poor times, and whether new consumer goods and
services (new portables, new social networking activities) will maintain momentum for the
ICT supply side.9
ICT firmsThe top 250 ICT firms feature a mix of long-established firms, new entities and new
entrants. The changing cohort reveals renewed merger and acquisition (M&A) activity in
the ICT sector in 2007, most notably large deals in telecommunications, but also many
An
OE
CD
Bro
wo
L e c tur
ylnO dae
R
OECD INFORMATION TECHNOLOGY OUTLOOK 2008 – ISBN 978-92-64-05553-7 – © OECD 2008 29

1. THE IT INDUSTRY: RECENT DEVELOPMENTS AND OUTLOOK
se_it E ditin
es
eu
le
hundreds of deals in electronics manufacturing, IT, software and services but with a
marked drop in 2008. What was most notable is the rapid emergence of major indigenous
firms in the emerging BRICS economies (Brazil, the Russian Federation, India, China and
South Africa) and elsewhere. This was reflected in the rapid growth in both the number
and size of ICT manufacturing firms in Chinese Taipei and China, IT services firms in India
and South Africa, and telecommunication services firms in China, Brazil, the Russian
Federation, South Africa, Egypt and elsewhere. The new wave of global restructuring in the
ICT-producing sector is now clearly evident in the ranks of the top 250 ICT firms; it was first
identified in the last edition of the Information Technology Outlook (OECD, 2006).
Box 1.1. Methodology used to compile the 2006 ICT top 250
Sources used to identify the top 250 ICT firms include the Business Week’s InformationTechnology 100, Software Magazine’s Top 50, Forbes 2000, Washington Post 200, Forbes LargestPrivate Firms, Top 100 Outsourcing, World Top 25 Semiconductors, and a number of other Internetlistings. Having identified the candidates for a top 250 listing, details were sourced from the latestannual reports, Securities Exchange Commission 10K and 20F forms, directly from companyfinancial reports and from various Internet investor sources, including Google Finance, Yahoo!Finance, and Reuter’s MultexInvestor. Details for private firms were sourced from the Forbes listing
of the largest private firms and directly from company websites.
ICT activities are those that “process, deliver, and display information electronically”. Hence, theICT industries are those that produce the equipment, software and services that enable thoseactivities. Each of the top 250 firms is classified by ICT industry sector: i) communicationequipment and systems; ii) electronics; iii) specialist semiconductors; iv) IT equipment andsystems; v) IT services; vi) software; vii) Internet; and viii) telecommunication services. Broadcast
and cable media and content are excluded.
Because many firms operate in more than one market segment, classification is far fromstraightforward. Where possible, firms have been classified according to their official industryclassification (primary SIC). Where that was not possible they have been classified according totheir main ICT-related activity, on the basis of revenue derived from that activity. In some cases a
firm’s primary SIC does not fully reflect its activities (e.g. IBM, which now derives a majority of itsrevenues from services and software). However, primary SIC classifications are followed forconsistency. Where conglomerates have substantial ICT-related activities they have been classifiedaccording to their major activities – principally electronics (e.g. Siemens). This necessarily involvesa degree of judgement. Nevertheless, a consistent and workable framework has been established.
The top 250 ICT firms are ranked by 2006 total revenues, the most recent comprehensive
financial year reported at the time of writing in 2008. Updates for 2007 reported revenues (i.e. fiscalyear ending December 2007 and later) have been compiled after establishing the 2006 list, as most,but not all, companies had issued annual reports by mid-2008. Revenue updates for 2007 areprovided where they add insight to the analysis but were not used to compile a new cohort of top250 firms, i.e. the 2007 revenues reported here are for the ICT top 250 in 2006, which will bedifferent from the top 250 firms in 2007. Historical data are drawn from company annual reports.In each case, company name, country, industry, revenue, employment, R&D expenditure, and netincome are recorded. Financial data are reported using United States GAAP wherever possible.Time series data reflect current reporting and restatements of historical data relating to continuingoperations. The country base is the place of company registration.
An
OE
CD
Bro
wo
L e c tur
ylnO dae
R
OECD INFORMATION TECHNOLOGY OUTLOOK 2008 – ISBN 978-92-64-05553-7 – © OECD 200830

1. THE IT INDUSTRY: RECENT DEVELOPMENTS AND OUTLOOK
se_it E ditin
es
eu
le
Top 250 ICT firmsThe top 250 ICT firms employed around 12 million people worldwide and earned total
revenues of USD 3 375 billion, some USD 325 billion (around 11%) more than in 2005 (in
current USD tracking the same panel of 250 firms over time). In 2007, revenues of the same
set of 250 ICT firms grew by 12% in current USD and reached USD 3 790 billion. Average
revenue of the top 250 ICT firms increased by 6% a year between 2000 and 2006, and
increased by 7% between 2000 and 2007. Average R&D expenditure between 2000 and 2006
increased by around 2% a year and average employment by almost 1% a year. Employment
in the top 250 ICT firms in 2006 in OECD countries was equivalent to almost 70% of ICT
sector employment (see section below on ICT sector employment), and because the top
250 data tracks successful firms, this share has increased over time. Net income fell
dramatically in 2001 and 2002, but there was a strong recovery from this trough. Aggregate
net income increased by 5% a year between 2000 and 2006 to more than USD 256 billion,
while average net income increased by 4% a year to more than USD 1 billion. Not all firms
are publicly listed, but the average recorded market capitalisation of the top 250 ICT firms
increased from USD 26.3 billion in 2001 to USD 30.8 billion in late 2007, although there
have since been sharp declines (see Figures 1.6 and 1.7).10
The top 250 firms spent an average of around 6% of revenue on R&D during 2006, while
the top 10 spent around 4%. This partly reflects incomplete reporting, the number of
telecommunication services firms in the top 10, specialisation in some sectors, and the
diversification of large conglomerate operations (see Chapter 3 for detailed discussion and
comparisons with other sectors). It may also to some extent reflect the continuing
adaptation of the organisation of R&D and innovation, the interest in collaboration and so-
called open innovation, and the move away from centralised corporate laboratories
(Chesbrough, 2003; Chesbrough et al., 2006; Houghton, 2006). Nevertheless, the ICT-
producing sector is relatively R&D-intensive across all firm sizes. The ICT top 250 average
Figure 1.6. Top 250 ICT firms’ performance trends, 2000-071
Average number of employees and current USD, index 2000=100
1 2 http://dx.doi.org/10.1787/472683503145Note: Based on averages for those firms reporting.1. Data for 2007 only available for revenue.
Source: OECD, Information Technology database, compiled from annual reports, SEC filings and market financials.
2000 2001 2002 2003 2004 2005 2006 2007
200
150
100
50
0
-50
-100Revenue Employment Net income R&D spending
An
OE
CD
Bro
wo
L e c tur
ylnO dae
R
OECD INFORMATION TECHNOLOGY OUTLOOK 2008 – ISBN 978-92-64-05553-7 – © OECD 2008 31

1. THE IT INDUSTRY: RECENT DEVELOPMENTS AND OUTLOOK
se_it E ditin
es
eu
le
R&D spending was around 6% of average 2006 revenues compared to the 3.8% reported by
the top 1 000 innovating firms in all sectors (Jaruzelski and Dehoff, 2007). Some of the
largest ICT firms are major R&D spenders: Microsoft spent more than USD 7 billion on R&D
in 2007, Samsung, IBM, Nokia and Siemens more than USD 6 billion, and Intel, Matsushita,
Sony, Cisco Systems and Motorola between USD 4 and 6 billion (see also Chapter 3).
The top 100 ICT firms accounted for around 80% of top 250 revenues in 2006, the top
50 accounted for 63% and the top 10 for 25%. These shares have fallen a little since 2000.
Shares of employment were similar throughout the period, with the top 100 accounting for
76% of top 250 employment in 2006, the top 50 for 58% and the top 10 for 20%. There is little
difference in performance by firm size; average revenues, net incomes and employment
increased evenly across size ranges. However, market capitalisation increased somewhat
faster for larger firms than for smaller firms, with the average reported market
capitalisation of the top 50 ICT firms increasing by 6% a year between 2001 and late 2007 to
an average of USD 66 billion, compared with 2.6% a year to USD 31 billion for the top 250.
Top 250 ICT firms by country
Continuing globalisation and restructuring of the ICT sector is reflected in an increase
in the number of top 250 ICT firms in Asia and in emerging economies elsewhere. There are
fewer US-based firms in the 2006 top 250 panel than in previous years, and there are more
firms from Chinese Taipei, India, China, Hong Kong (China), Korea, Singapore, Malaysia
and Indonesia as well as from Brazil, South Africa, the Russian Federation, Egypt, Saudi
Arabia and Venezuela.11
In all, 40 economies were reported as bases for the top 250 ICT firms in 2006 (i.e. place
of registration): 99 (40%) were based in the United States, 40 were based in Japan and 19 in
Chinese Taipei. Seven were based in Canada and France, six in Korea and the United
Kingdom, and five in Germany and the Netherlands. Regionally, the 115 firms based in the
Americas accounted for 39% of top 250 revenues in 2006 (USD 1 303 billion), 36% of
Figure 1.7. Top ICT firms’ revenue and net income trends, 2000-071
Average USD millions in current prices
1 2 http://dx.doi.org/10.1787/472685800445Note: Based on averages for those firms reporting.1. Data for 2007 only available for revenue.
Source: OECD, Information Technology database, compiled from annual reports, SEC filings and market financials.
110 000
90 000
70 000
50 000
30 000
10 000
0
-10 0002000 2001 2002 2003 2004 2005 2006 2007
Top 250 revenue Top 250 net income Top 10 revenue Top 10 net income
An
OE
CD
Bro
wo
L e c tur
ylnO dae
R
OECD INFORMATION TECHNOLOGY OUTLOOK 2008 – ISBN 978-92-64-05553-7 – © OECD 200832

1. THE IT INDUSTRY: RECENT DEVELOPMENTS AND OUTLOOK
se_it E ditin
es
eu
le
employment and 50% of the overall net profit; the 83 firms based in the Asia-Pacific region
accounted for 37% of revenue (USD 1 235 billion), 42% of employment and 27% of the
overall net profit; and the 44 firms based in Europe accounted for 24% of revenue
(USD 790 billion), 21% of employment and 20% of the overall net profit.
Table 1.1. Economies represented in the top 250 ICT firms, 2000 and 2006By economy of registration, in employment numbers, USD millions in current prices, and percentages
FirmsRevenue
2000Revenue
2006Employees
2000Employees
2006Net income
2000Net income
2006Annual growth
% 2000-06
Australia 1 11 246 17 379 50 761 44 452 2 138 2 399 7.5
Austria 1 2 942 6 054 18 301 15 583 –13 780 12.8
Belgium 2 5 481 9 585 23 769 19 617 388 1 723 9.8
Bermuda 2 11 331 25 404 71 300 165 582 2 464 1 125 14.4
Brazil 3 11 970 19 360 .. 61 157 575 2 212 8.3
Canada 7 57 296 56 432 221 252 218 818 441 3 830 –0.3
Cayman 1 6 448 9 206 42 800 60 000 310 840 6.1
China 4 20 976 46 600 114 717 307 438 3 211 3 400 14.2
Denmark 1 5 787 8 378 18 363 18 546 1 143 608 6.4
Egypt 1 626 4 401 .. .. 11 786 38.4
Finland 1 27 868 51 660 58 708 109 871 3 613 2 992 10.8
France 7 89 444 127 038 547 214 547 328 5 130 10 083 6.0
Germany 5 118 316 203 303 677 343 714 309 14 067 10 019 9.4
Greece 3 7 156 17 784 38 149 31 020 1 207 1 709 16.4
Hong Kong, China 4 24 831 65 091 68 318 326 132 3 332 10 236 17.4
Hungary 1 1 580 3 190 14 380 12 262 236 340 12.4
India 4 1 025 10 053 18 830 260 482 103 2 137 46.3
Indonesia 1 1 587 5 600 .. 34 021 419 1 322 23.4
Ireland 1 1 806 2 127 12 606 8 306 171 9 2.8
Italy 2 29 476 46 393 112 093 90 353 2 550 1 323 7.9
Japan 40 701 001 776 924 2 581 788 2 903 706 7 981 21 365 1.7
Korea 6 78 787 129 638 301 830 178 713 4 487 14 242 8.7
Malaysia 1 2 320 4 451 24 789 19 094 186 625 11.5
Mexico 2 13 693 37 534 80 378 127 406 3 012 6 147 18.3
Netherlands 5 50 598 63 070 296 295 222 783 15 918 8 096 3.7
New Zealand 1 2 562 3 774 7 298 6 677 292 –40 6.7
Norway 1 4 042 14 200 24 950 27 600 123 2 866 23.3
Portugal 1 4 721 7 969 18 539 27 780 495 809 9.1
Russian Federation 2 1 316 11 252 .. 45 428 253 1 887 43.0
Saudi Arabia 1 4 515 9 010 .. .. 1 054 3 413 12.2
Singapore 2 10 066 23 609 95 000 135 000 2 805 2 228 15.3
South Africa 4 8 722 20 436 16 970 52 731 466 3 180 15.2
Spain 1 27 306 66 459 145 730 232 996 1 693 7 966 16.0
Sweden 3 37 381 43 873 136 744 101 507 3 408 5 645 2.7
Switzerland 2 13 844 17 794 61 109 68 927 3 379 2 050 4.3
Chinese Taipei 19 36 777 152 118 45 820 789 900 4 493 10 267 26.7
Turkey 1 2 258 4 700 2 523 2 941 228 876 13.0
United Kingdom 6 71 193 98 716 339 553 258 831 7 530 –6 859 5.6
United States 99 800 823 1 151 408 3 175 008 3 594 142 91 033 113 300 6.2
Venezuela 1 5 227 3 166 .. 9 199 .. 525 –8.0
Total 250 2 314 344 3 375 137 9 463 228 11 850 638 190 332 256 459 6.5
OECD 216 2 129 595 3 032 724 8 668 211 10 469 104 168 609 218 935 6.1
1 2 http://dx.doi.org/10.1787/476164307431Note: Cohort data are necessarily incomplete for firms that did not exist and/or report in 2000. As a result these datamarginally exaggerate growth for Bermuda, Chinese Taipei, Germany, India, the Netherlands and the United States. Source: OECD, Information Technology database, compiled from annual reports, SEC filings and market financials.
An
OE
CD
Bro
wo
L e c tur
ylnO dae
R
OECD INFORMATION TECHNOLOGY OUTLOOK 2008 – ISBN 978-92-64-05553-7 – © OECD 2008 33

1. THE IT INDUSTRY: RECENT DEVELOPMENTS AND OUTLOOK
se_it E ditin
es
eu
le
Firm performance across countries has been mixed. Regionally, revenues have grown
faster over the last five years in Europe (8% a year) than elsewhere (6.2% a year in the
Americas, and 5.6% a year in the Asia-Pacific). Top 250 firm revenues declined in Venezuela
(a single firm) between 2000 and 2006 and were static in Canada but rose by more than 20%
Figure 1.8. Top 250 ICT firms’ revenue growth by economy of registration, 2000-06Average annual growth, percentages
1 2 http://dx.doi.org/10.1787/472707062770Note: Cohort data are necessarily incomplete for firms that did not exist and/or report in 2000. As a result these datamarginally exaggerate growth for Bermuda, Chinese Taipei, Germany, India, the Netherlands and United States.
Source: OECD, Information Technology database, compiled from annual reports, SEC filings and market financials.
50
40
30
20
10
0
-10
India
Russia
n Fed
eratio
nEg
ypt
Chines
e Taip
ei
Indon
esia
Norway
Mexico
Hong K
ong,
China
GreeceSpa
in
Singap
ore
South
Africa
Bermud
aChin
a
Turke
y
Austri
a
Hunga
ry
Saudi
Arabia
Malays
ia
Finlan
d
Belgium
German
y
Portug
alKor
eaBraz
ilIta
ly
Austra
lia
New Ze
aland
Denmark
United
States
Cayman
Islan
ds
Franc
e
United
Kingdo
m
Switzerl
and
Netherl
ands
Irelan
d
SwedenJa
pan
Canad
a
Venez
uela
Box 1.2. ICT equipment manufacturing in Chinese Taipei and China
Ongoing globalisation is leading to increasing regional specialisation, with ICT equipment andrelated electronics manufacturing gravitating to Asia. Of the top 250 ICT firms, ranked by 2006revenue, no fewer than 19 are based in Chinese Taipei, and all but one are manufacturers.
Eleven of these Chinese Taipei-based firms are IT equipment manufacturers: Hon Hai Precision,ASUSTeK Computer, Quanta Computer, Acer, Compal Electronics, Inventec, Wistron, Benq, Lite-onTechnology, High Tech Computer, and MiTAC International; and seven are electronics andcomponent firms (including semiconductors): AU Optronics, Chi Mei Optoelectronics Corp,Chunghwa Picture Tubes, United Microelectronics (UMC), Taiwan Semiconductor, AdvancedSemiconductor Engineering, and PCS (Powerchip Semiconductor). The sole Chinese Taipei-basedtelecommunications services firm in the top 250 is Chunghua Telecom.
Aggregate revenues in 2006 were more than USD 152 billion (average USD 8 billion), net incomeUSD 10.3 billion (average USD 570 million) and total employment 790 000 (average 41 575). In 2007,aggregate revenues of these companies exceeded USD 200 billion, further extending their rapidgrowth since 2000, with aggregate revenues increasing by 28% a year between 2000 and 2007, andaverage revenue increasing by 26% a year. Some of these firms are also very active in patenting(e.g. Hon Hai Precision, which individually, with Tsinghua University and through holdings such as
Hongfujin is assignee for more nanotube patent families than firms such as IBM, Intel or Motorola).
Three more IT equipment manufacturing firms were based in China and another essentially Chinesefirm was registered in Bermuda. They are: Lenovo, Huawei Technologies, ZTE and TPV Technology. Theaggregate revenue for these four firms was almost USD 39 billion during 2007 (average USD 9.7 billion).
An
OE
CD
Bro
wo
L e c tur
ylnO dae
R
OECD INFORMATION TECHNOLOGY OUTLOOK 2008 – ISBN 978-92-64-05553-7 – © OECD 200834

1. THE IT INDUSTRY: RECENT DEVELOPMENTS AND OUTLOOK
se_it E ditin
es
eu
le
a year in India, the Russian Federation, Egypt, Chinese Taipei, Indonesia and Norway. This
reflects a number of factors, including the sectoral composition of firms, different levels of
specialisation and roles in global production systems. It also reflects the emergence of new
developing economies both as new growth markets and as locations for ICT production by
indigenous as well as multinational firms.12
Top 250 ICT firms by sector13
Deregulation of telecommunications has allowed telecommunications firms to
expand their operations internationally, and a number of major regional carriers have
emerged as a result. By sector, 74 (30%) of the top 250 f irms in 2006 were
telecommunication services providers, 61 (24%) were electronics manufacturers, 39 (15%)
were IT equipment and systems producers, 26 were IT services providers,
17 semiconductor firms, 15 communication equipment and systems producers, and there
were nine software publishers and nine Internet firms.
Telecommunication services firms and electronics firms (including semiconductors)
accounted for the largest shares of top 250 revenues, at around USD 1 100 billion. IT
equipment firms accounted for 19% (USD 637 billion), communications equipment firms
for around 7% (USD 219 billion), IT services firms for 5% (USD 171 billion), software firms
for 3% (USD 89 billion) and Internet firms for 2% (USD 56 billion). Reflecting a recovery of
hardware and systems revenues in recent years, average revenue in 2006 was highest
among IT equipment firms, at USD 16.3 billion. Telecommunications firms averaged
revenues of USD 15.4 billion, electronics firms USD 15.2 billion, and communications
equipment firms USD 14.6 billion. Software and services firms tend to be smaller,
averaging revenues of USD 9.8 billion and USD 6.6 billion, respectively. These differences
are also reflected in reported market capitalisation; capitalisation of telecommunications
services firms in the top 250 approached USD 2 000 billion in late 2007, while that of IT
services firms was less than USD 200 billion.
Nevertheless, revenue growth has been strongest for telecommunications services
and software firms, both of which increased revenues by more than 9% a year
between 2000 and 2006, and Internet firms have grown even more strongly, but from a low
Table 1.2. Top 250 ICT firms by sector, 2000 and 2006USD millions in current prices and number of employees
Revenue2000
Revenue2006
Employees2000
Employees2006
R&D2000
R&D2006
Net income2000
Net income2006
Communications equipment
185 959 219 448 638 634 561 693 21 048 25 136 8 024 18 035
Electronics 750 161 929 470 3 555 322 3 674 729 39 517 50 729 37 754 52 977
Internet 18 322 56 073 47 539 93 360 466 3 195 273 8 514
IT equipment 434 458 636 933 1 401 089 2 256 384 24 183 28 839 21 422 31 877
Semiconductors 97 649 130 533 301 775 433 090 11 947 19 830 19 738 16 131
IT services 115 998 170 738 723 998 1 199 168 1 548 1 609 8 717 8 869
Software 52 390 88 737 157 551 262 345 7 907 13 396 18 043 20 125
Telecommunications 659 406 1 143 206 2 637 320 3 369 869 5 955 8 711 76 361 99 931
Total 2 314 344 3 375 137 9 463 228 11 850 638 112 571 151 447 190 332 256 459
1 2 http://dx.doi.org/10.1787/476228688162Note: Cohort data are necessarily incomplete for firms that did not exist and/or report in 2000.Source: OECD, Information Technology database, compiled from annual reports, SEC filings and market financials.
An
OE
CD
Bro
wo
L e c tur
ylnO dae
R
OECD INFORMATION TECHNOLOGY OUTLOOK 2008 – ISBN 978-92-64-05553-7 – © OECD 2008 35

1. THE IT INDUSTRY: RECENT DEVELOPMENTS AND OUTLOOK
se_it E ditin
es
eu
le
base. IT services and IT equipment and systems firms increased revenues by around 6.6%
a year, while electronics, semiconductors and communications equipment firms have seen
increases of around 3 to 5% a year since 2000, owing to declining revenues in 2002-03.
Employment in this group of firms has grown overall, particularly outside of the OECD area
due to the rise of Asian ICT manufacturing and to a lesser extent ICT services firms.
Employment grew most strongly in Internet, software and IT services firms, and only
declined for communications equipment firms.
During the 2001-02 downturn, top 250 cohort firms in the telecommunications
services, communications equipment and electronics sectors experienced substantial
losses, with software and IT services alone remaining profitable in the whole period
from 2000 to 2006. All sectors were profitable from 2003, with strong income growth in the
Figure 1.9. Top 250 ICT firms’ revenue shares by sector, 2006Percentages
1 2 http://dx.doi.org/10.1787/472707854825
Source: OECD, Information Technology database, compiled from annual reports, SEC filings and market financials.
Figure 1.10. Top 250 ICT firms’ revenue trends by sector, 2000-06USD current prices, index 2000=100
1 2 http://dx.doi.org/10.1787/472712320108
Source: OECD, Information Technology database, compiled from annual reports, SEC filings and market financials.
Communications equipment6%
Electronics27%
Internet2%
IT equipment19%
Semiconductors4%
Services5%
Software3%
Telecommunications34%
325
300
275
250
225
200
175
150
125
100
75
502000 2001 2002 2003 2004 2005 2006
IT equipment
Internet
Semiconductors
Telecommunications
Electronics
Software
Communications equipment
Services
An
OE
CD
Bro
wo
L e c tur
ylnO dae
R
OECD INFORMATION TECHNOLOGY OUTLOOK 2008 – ISBN 978-92-64-05553-7 – © OECD 200836

1. THE IT INDUSTRY: RECENT DEVELOPMENTS AND OUTLOOK
se_it E ditin
es
eu
le
communications equipment, IT equipment and systems, and electronics sectors which
tend to have more pronounced business cycle behaviour due to the investment accelerator
effect of IT and IT-related investment. Similar patterns can be expected in the economic
downturn that began in mid-2008.
The average profit margin of the top 250 ICT firms was 7.7% in 2006, compared with
8.5% in 2000 (i.e. average net income over average revenue, to account for missing data).
Average margins in 2006 are highest among software, Internet and semiconductor firms, at
23, 15 and 12%, respectively, while telecommunications services and communications
equipment firms realised average margins of 8.9 and 8.2%, respectively. The margin for
telecommunications services was significantly lower in 2006 than in 2000, and the margin
for communications equipment significantly higher. Average profit margins in the other
sectors have been relatively steady throughout the period, at around 5 to 7%.
R&D data are incomplete as not all firms report R&D expenditures; fewer services than
manufacturing and systems firms do so. Reporting and accounting practices also vary.
Nevertheless available data show that electronics and semiconductor firms have the
largest share (47% of the top 250 total in 2006), followed by IT equipment and systems firms
and communications equipment firms (36% between them). Reporting software and
semiconductor firms were on average the most R&D-intensive. Communications
equipment firms were also relatively R&D-intensive. However, R&D expenditures by
Internet, telecommunications services and software firms reporting R&D expenditure
increased more rapidly from 2000 to 2006. (The presentation here and in Annex 1.A1 is
based on calculations for the whole cohort of top 250 firms, whether or not they report
R&D. Chapter 3 contains a more detailed discussion based only on firms that report R&D.)
R&D spending reflects past firm performance and potential future performance, with
past performance providing funding for current R&D spending and current R&D a platform
for future growth, revenue and profits. It may also be seen as an element of cost, which
directly affects current operating margins, although in the revised System of National
Figure 1.11. Top 250 ICT firms’ profitability by sector, 2000-06Average net income as a share of average revenue, percentages
1 2 http://dx.doi.org/10.1787/472731716217
Source: OECD, Information Technology database, compiled from annual reports, SEC filings and market financials.
0 5 10 15 20 25 30 35 40
%
Profit margin, 2006 Profit margin, 2000
IT equipment
Services
Electronics
Communicationsequipment
Telecommunications
Semiconductors
Internet
Software
An
OE
CD
Bro
wo
L e c tur
ylnO dae
R
OECD INFORMATION TECHNOLOGY OUTLOOK 2008 – ISBN 978-92-64-05553-7 – © OECD 2008 37

1. THE IT INDUSTRY: RECENT DEVELOPMENTS AND OUTLOOK
se_it E ditin
es
eu
le
Accounts, output of R&D will be classified as assets and R&D expenditure as investments
(Robbins, 2007). In 2006, average net income for the cohort of communications equipment,
electronics and Internet firms was higher than it had been in 2000, suggesting that their
R&D efforts were paying off. However, the opposite was true of semiconductor and
software firms, showing that R&D does not automatically feed into profits and that firm-
specific, sector-specific and market-specific factors intervene.
Individual firm performanceThere have been numerous entries into and exits from the top 250 since it was first
compiled in 2001 (See OECD Information Technology Outlook 2002). A number of those exiting
have been taken over (e.g. Compaq by Hewlett Packard, C-MAC Industries by Solectron and
now Flextronics, SCI Systems by Sanmina, Peoplesoft by Oracle, SBC, Bell South and MCI
Worldcom by AT&T, Lucent by Alcatel, and Maxtor by Seagate). Others have simply dropped
below the revenue cut-off line (e.g. ACT Manufacturing, ASM International, Ciena, Cirrus
Logic, Iomega, Misys, Xilinx and Fairchild Semiconductor), although revenue differences
between the firms rankings around 250 are very small. New entrants are the result of such
forces as deregulation and privatisation in telecommunications, spin-offs and organic
growth. Chief among new entrants are telecommunications and IT services firms (e.g.
China Mobile, China Unicom, Singtel, Google, Yahoo!, Wipro, TCS and Infosys). Spin-offs
include Benq, Palm, Infineon Technologies, Wistron, Freescale Semiconductor and NXP.
Of the top 250, 208 had increasing revenues between 2000 and 2006, and just
35 suffered declines (206 and 37 in 2007). Seven new arrivals that did not report in 2000 also
increased revenues on trend. Thirteen of the top 250 had revenue growth in excess of 40%
a year (i.e. Google, Research In Motion, High Tech Computer, Chi Mei Optoelectronics,
VimpelCom, Infosys, Expedia, Hon Hai Precision, MTN, Bharti Airtel, AU Optronics, e-bay
and ASUSTeK Computer, although the last two dropped a little below 40% CAGR by 2007).
Of the 53 firms that increased revenues by more than 20% a year over the six years to 2006,
Figure 1.12. Top 250 ICT firms’ R&D intensity by sector, 2000-06Average R&D spending as a share of average revenue, percentages
1 2 http://dx.doi.org/10.1787/472746417431Note: R&D expenditure data are incomplete and the presentation is based on those firms reporting R&D comparedwith the whole database.
Source: OECD, Information Technology database, compiled from annual reports, SEC filings and market financials.
0 2 4 6 8 10 12 14 16
%
R&D intensity, 2006 R&D intensity, 2000
Services
Telecommunications
IT equipment
Electronics
Internet
Communicationsequipment
Software
Semiconductors
An
OE
CD
Bro
wo
L e c tur
ylnO dae
R
OECD INFORMATION TECHNOLOGY OUTLOOK 2008 – ISBN 978-92-64-05553-7 – © OECD 200838

1. THE IT INDUSTRY: RECENT DEVELOPMENTS AND OUTLOOK
se_it E ditin
es
eu
le
16 were based in the United States and 11 were based in Chinese Taipei. Four were in the
top 50 (Hon Hai Precision, ASUSTeK Computer, America Movil and Vodafone), and 14 in the
top 100. Twenty-one of these fastest-growing firms were in telecommunication services,
12 in the IT equipment and systems sector, five were Internet firms. and five in
communications equipment and electronics (including semiconductors), three in IT
services, and one in software.
Employment increased in 134 of the top 250 ICT firms over the period 2000-06, and
declined in 70 (data were not available for the rest). Job growth has clearly been strong in
most IT services, software, Internet, IT equipment and systems firms, although in all
sectors individual firms did well while others performed poorly. Deregulation and
increasing competition has led to some significant declines in employment in
telecommunications services.
Among the top 250 ICT firms that report R&D expenditures, nine spent more than 20%
of revenue on R&D in 2006 (four in the semiconductors sector, two in communications
equipment, two in the software sector, and one in the electronics sector). No fewer than
42 firms reported R&D spending in excess of 10% of revenues.
Top 50 ICT firmsRanked by 2006 revenues, the largest ICT firms are: Siemens (USD 97 billion), Hewlett-
Packard (USD 92 billion), IBM and NTT (USD 91 billion), Verizon (USD 88 billion), Hitachi
(USD 81 billion), Deutsche Telekom (USD 77 billion), Matsushita (USD 76 billion) and
Telefonica (USD 66 billion). In 2007, AT&T and Hewlett-Packard surpassed USD 100 billion
in revenues (see last column in Table 1.3). At the other end of the top 50, just eight firms
earned revenues of less than USD 20 billion (Apple, Korea Telecom, Accenture, Telstra,
Sumitomo Electric, Schneider Electric, ASUSTeK Computer and Ricoh), and in 2007 only
Ricoh, ASUSTeK, and Sanyo were below this threshold. Ten firms employed more than
200 000 in 2006 (Hitachi, Hon Hai Precision, Siemens, IBM, Matsushita, AT&T, Deutsche
Telekom, China Telecom, Verizon Communications and Telefonica SA), and 23 employed
Box 1.3. Fast-growing ICT firms in the top 250
Thirteen of the top 250 ICT firms reported revenue growth of 40% a year or morebetween 2000 and 2006 (11 for the period between 2000 and 2007). By sector, they includethree IT equipment, Internet and telecommunications firms, two electronics firms and asingle IT services and communications equipment firm. No fewer than five are based inChinese Taipei, two in India and the United States, and one in South Africa, the RussianFederation and Canada.
They are: Google (United States, Internet), Research in Motion (Canada, Communicationsequipment), High Tech Computer (Chinese Taipei, IT equipment), Chi Mei OptoelectronicsCorp (Chinese Taipei, Electronics), VimpelCom (Russian Federation, Telecommunications),Infosys (India, IT services), Expedia (United States, Internet), Hon Hai Precision (ChineseTaipei, IT equipment), MTN (South Africa, Telecommunications), Bharti Airtel (India,Telecommunications), AU Optronics (Chinese Taipei, Electronics), e-bay (United States,Internet) and ASUSTeK Computer (Chinese Taipei, IT equipment). The last two dropped alittle below 40% CAGR by 2007.
An
OE
CD
Bro
wo
L e c tur
ylnO dae
R
OECD INFORMATION TECHNOLOGY OUTLOOK 2008 – ISBN 978-92-64-05553-7 – © OECD 2008 39

1. THE IT INDUSTRY: RECENT DEVELOPMENTS AND OUTLOOK
se_it E ditin
es
eu
le
Tabl
e 1.
3.To
p 5
0IC
T f
irm
s ra
nk
ed b
y re
ven
ue
in20
06U
SDm
illi
on
s in
cu
rren
t p
rice
s an
d n
um
ber
emp
loye
d
Indu
stry
Reve
nue
2000
Reve
nue
2006
Reve
nue
2007
Empl
oyee
s20
00Em
ploy
ees
2006
R&D
2000
R&D
2006
Net i
ncom
e20
00Ne
t inc
ome
2006
Mar
ket c
ap20
07
Siem
ens
Germ
any
Elec
troni
cs64
405
9743
699
108
419
000
371
000
442
56
312
652
83
823
116
630
Hew
lett-
Pack
ard
Unite
d St
ates
IT e
quip
men
t48
870
9165
810
428
688
500
156
000
262
73
591
369
76
198
129
370
IBM
Unite
d St
ates
IT e
quip
men
t85
089
9142
398
785
316
303
355
766
508
46
107
809
39
491
154
450
NTT
Japa
nTe
leco
mm
unic
atio
ns92
679
9141
091
191
224
000
199
113
317
82
651
–603
428
659
810
Veriz
on
Com
mun
icat
ions
Unite
d St
ates
Tele
com
mun
icat
ions
6470
788
144
9346
926
355
223
851
9..
..11
797
619
712
536
0
Hita
chi
Japa
nEl
ectro
nics
7272
581
345
8605
932
382
739
072
53
930
354
615
432
123
920
Deut
sche
Tel
ekom
Germ
any
Tele
com
mun
icat
ions
3755
977
069
8558
020
500
024
848
064
264
35
437
404
478
110
Mat
sush
ita
(Pan
ason
ic)
Japa
nEl
ectro
nics
6871
176
442
7648
831
426
732
864
54
881
485
487
41
327
3885
0
Tele
foni
ca S
ASp
ain
Tele
com
mun
icat
ions
2730
666
459
7726
414
573
023
299
6..
739
169
37
966
118
160
Fran
ce T
elec
omFr
ance
Tele
com
mun
icat
ions
3089
464
952
7249
718
886
619
103
641
21
075
470
78
714
7500
0
Sony
Japa
nEl
ectro
nics
6204
664
550
6966
518
970
016
300
03
660
467
51
131
106
249
560
Sam
sung
El
ectro
nics
Kore
aEl
ectro
nics
3457
363
480
6797
017
300
085
813
133
26
004
476
88
532
..
AT&
TUn
ited
Stat
esTe
leco
mm
unic
atio
ns46
850
6305
511
892
830
480
030
184
0..
223
466
97
356
239
380
Del
l Com
pute
rUn
ited
Stat
esIT
equ
ipm
ent
2526
555
788
5742
040
000
8280
037
445
81
666
360
263
110
Tosh
iba
Japa
nIT
equ
ipm
ent
5334
954
519
5976
119
087
016
500
03
103
319
7–3
0567
2..
Nok
iaFi
nlan
dCo
mm
unic
atio
ns
equi
pmen
t27
868
5166
069
895
5870
810
987
12
371
489
63
613
299
212
110
0
Mic
roso
ftUn
ited
Stat
esSo
ftwar
e22
956
4428
251
122
4760
079
000
377
26
584
942
112
599
281
260
Voda
fone
Unite
d Ki
ngdo
mTe
leco
mm
unic
atio
ns11
929
4375
051
199
2946
566
000
109
408
838
–928
617
579
0
Mot
orol
aUn
ited
Stat
esCo
mm
unic
atio
ns
equi
pmen
t32
107
4287
936
622
147
000
6600
03
426
410
61
318
366
139
220
NEC
Japa
nIT
equ
ipm
ent
4834
341
762
3907
215
478
715
400
02
924
167
9710
49
620
Fujit
suJa
pan
IT e
quip
men
t48
484
4118
042
830
188
053
158
491
372
22
071
397
589
1306
0
Sprin
t Nex
tel
Unite
d St
ates
Tele
com
mun
icat
ions
1722
041
028
4014
664
900
6460
0..
..1
964
132
954
690
Tele
com
Ital
iaIta
lyTe
leco
mm
unic
atio
ns27
516
4005
243
399
107
171
8320
924
716
73
231
130
352
540
Chin
a M
obile
Hong
Kong
, Chi
naTe
leco
mm
unic
atio
ns15
249
3808
346
922
3834
511
199
8..
..2
978
816
221
909
0
BTUn
ited
King
dom
Tele
com
mun
icat
ions
2835
635
937
4083
013
200
010
620
455
21
349
211
11
958
5270
0
Cano
nJa
pan
Elec
troni
cs25
020
3572
538
055
8667
312
097
61
805
265
01
244
391
369
220
Inte
lUn
ited
Stat
esSe
mic
ondu
ctor
s33
726
3538
238
334
8610
090
300
389
75
873
1053
55
044
144
130
Phili
ps E
lect
roni
csNe
ther
land
sEl
ectro
nics
3473
633
889
3667
821
942
912
583
42
553
209
58
786
676
343
620
Mits
ubis
hi E
lect
ric
Japa
nEl
ectro
nics
3502
130
976
3237
911
658
899
444
161
51
117
230
822
..
An
OE
CD
Bro
wo
L e c tur
ylnO dae
R
OECD INFORMATION TECHNOLOGY OUTLOOK 2008 – ISBN 978-92-64-05553-7 – © OECD 200840

1. THE IT INDUSTRY: RECENT DEVELOPMENTS AND OUTLOOK
se_it E ditin
es
eu
le
Cisc
o Sy
stem
sUn
ited
Stat
esCo
mm
unic
atio
ns
equi
pmen
t18
928
2848
434
922
3800
049
926
270
44
067
266
85
580
190
640
Hon
Hai
Pre
cisi
onCh
ines
e Ta
ipei
IT e
quip
men
t2
900
2844
051
828
900
038
200
0..
327
..89
2..
KDD
IJa
pan
Tele
com
mun
icat
ions
1415
926
306
2800
97
361
1435
873
130
–99
163
8..
LG E
lect
roni
csKo
rea
Elec
troni
cs20
085
2426
325
286
5500
031
201
312
175
435
622
3..
Eric
sson
Swed
enCo
mm
unic
atio
ns
equi
pmen
t29
866
2411
327
788
105
129
6750
04
577
378
72
300
353
759
800
Shar
pJa
pan
Elec
troni
cs17
210
2404
026
266
4974
848
927
136
31
596
261
762
1979
0
3MUn
ited
Stat
esEl
ectro
nics
1669
922
923
2446
275
026
7533
31
101
152
21
782
385
162
180
Chin
a Te
leco
mCh
ina
Tele
com
mun
icat
ions
1566
321
961
2348
410
264
724
307
2..
372
754
276
542
610
Amer
ica
Mov
ilM
exic
oTe
leco
mm
unic
atio
ns3
181
2148
228
511
1345
047
526
....
963
615
102
750
Sany
o El
ectri
cJa
pan
Elec
troni
cs18
005
2135
119
387
8351
994
906
928
107
020
1–1
768
289
0
EDS
Unite
d St
ates
Serv
ices
1885
621
268
2213
412
200
013
106
3..
..1
143
470
1159
0
Tech
Dat
aUn
ited
Stat
esSe
rvic
es16
992
2048
321
440
1050
08
000
....
128
271
890
Emer
son
Elec
tric
Unite
d St
ates
Elec
troni
cs15
545
2013
322
572
123
400
127
800
594
356
142
21
845
3629
0
Appl
e In
cUn
ited
Stat
esIT
equ
ipm
ent
798
319
315
2400
68
568
1778
738
071
278
61
989
109
910
Kore
a Te
leco
mKo
rea
Tele
com
mun
icat
ions
1068
618
655
2007
652
533
3751
4..
228
789
139
7..
Acce
ntur
eBe
rmud
aSe
rvic
es11
331
1822
821
453
7130
014
000
025
229
82
464
973
3036
0
Tels
traAu
stra
liaTe
leco
mm
unic
atio
ns11
246
1737
920
544
5076
144
452
9111
02
138
239
938
010
Sum
itom
o El
ectri
cJa
pan
Elec
troni
cs12
142
1725
020
198
6699
213
385
338
955
421
950
1..
Schn
eide
r Ele
ctric
Fran
ceEl
ectro
nics
889
417
249
2369
572
144
100
078
450
411
573
169
221
210
ASUS
TeK
Com
pute
rCh
ines
e Ta
ipei
IT e
quip
men
t2
146
1648
517
931
..9
587
..23
747
566
19
310
Ric
ohJa
pan
Elec
troni
cs12
870
1640
917
374
6730
081
939
591
988
373
834
1489
0
Tota
l1
508
944
213
053
12
387
318
604
861
26
833
482
7444
593
742
121
896
147
426
330
187
0
Aver
age
3017
942
611
4774
612
097
113
667
01
477
186
92
437
294
966
029
1 2
htt
p://
dx.d
oi.o
rg/1
0.17
87/4
7626
8206
880
Sou
rce:
OEC
D, I
nfor
mat
ion
Tech
nolo
gy d
atab
ase,
com
pil
ed f
rom
an
nu
al r
epor
ts, S
EC f
ilin
gs a
nd
mar
ket
fin
anci
als.
Tabl
e 1.
3.To
p 5
0IC
T f
irm
s ra
nk
ed b
y re
ven
ue
in20
06 (
cont
.)U
SDm
illi
on
s in
cu
rren
t p
rice
s an
d n
um
ber
emp
loye
d
Indu
stry
Reve
nue
2000
Reve
nue
2006
Reve
nue
2007
Empl
oyee
s20
00Em
ploy
ees
2006
R&D
2000
R&D
2006
Net i
ncom
e20
00Ne
t inc
ome
2006
Mar
ket c
ap20
07
An
OE
CD
Bro
wo
L e c tur
ylnO dae
R
OECD INFORMATION TECHNOLOGY OUTLOOK 2008 – ISBN 978-92-64-05553-7 – © OECD 2008 41

1. THE IT INDUSTRY: RECENT DEVELOPMENTS AND OUTLOOK
se_it E ditin
es
eu
le
fewer than 100 000. At the end of 2007, the largest single employer was Hon Hai Precision,
which reported more than 500 000 employees.
Nineteen of the top 50 ICT firms enjoyed double-digit revenue growth over the
period 2000-07, most notably Hon Hai Precision, America Movil, ASUSTeK Computer, and
Vodafone. Revenue declined in only four. Twelve firms showed double-digit employment
growth between 2000 and 2006 (Hon Hai Precision, America Movil, China Mobile, China
Telecom, Vodafone, Apple, Dell Computer, Sumitomo Electric, Accenture, KDDI, Nokia and
Hewlett-Packard as a result of mergers and acquisitions); just two firms had double-digit
declines.
Profitability was mixed. Thirty-four of the top 50 ICT firms made a net profit of
USD 1 billion or more in 2006, with twelve firms making more than USD 5 billion
(Microsoft, IBM, France Telecom, Samsung Electronics, China Mobile, Telefonica SA, AT&T,
Philips Electronics, Hewlett-Packard, Verizon Communications, Cisco Systems and Intel).
Just two reported a net loss for 2006 (Sanyo and Vodafone). Reported market capitalisation
of the top 50 exceeded USD 3.3 trillion in late 2007, up from USD 2.3 trillion in 2001.
Average market capitalisation (taking account of missing data) increased from
USD 47 billion to USD 66 billion, or by 6% a year. The slowdown in the United States and
capital market concerns that emerged in late 2007 have led to a reduction in the market
capitalisation of some ICT firms in early 2008, but the value of the top 50 firms reporting
was down by less than 2.5% as of mid-February.
While firms often cut R&D budgets to control costs during difficult times, some see the
need to maintain and even increase them in order to innovate in the years ahead. Overall,
ten of the top 50 ICT firms reduced R&D expenditure between 2000 and 2006, and eight
significantly increased it (by 10% a year or more). R&D expenditure data are not available
for nine of the top 50 ICT firms (primarily telecommunications services providers). Of the
remainder, ten spent more than USD 4 billion on R&D in 2006 and Microsoft, Siemens, IBM,
Samsung and Intel each spent more than USD 5 billion. Across the top 50, firms reporting
R&D expenditure spent an average of 5% of 2006 revenues. However, R&D intensity varied
considerably; some firms had very high levels of R&D expenditure as a share of sales and
some rather low levels. Four of top 50 firms invested between 10 and 20% of revenue in R&D
(Intel, Ericsson, Microsoft and Cisco Systems).
Ongoing globalisation of ICT production and a renewed surge of merger and
acquisition activity over recent years have led to considerable changes in the top rankings.
Telephonos de Mexico, Lenovo, China Netcom, Amazon, Google, Celestica, Saudi
Telecommunications, AU Optronics, HuaWei Technologies and Hynix Semiconductor have
joined the ranks of the top 100 ICT firms, while Fuji Electric, First Data, JVC and ADP have
fallen out of the top 100. SBC Communications, Bell South and MCI Worldcom have been
involved in mergers.
Compiled financial information for 2007 shows that the top ICT firms continued to
grow to the end of 2007 and into 2008, with the top 100 reporting revenues of over
USD 3 000 billion, USD 340 billion or 13% more than in 2006. USD 257 billion of that
increase accrued to the top 50 firms, raising their revenues to over USD 2 380 billion in 2007
but with a sharp slowdown in many segments from mid-2008.
An
OE
CD
Bro
wo
L e c tur
ylnO dae
R
OECD INFORMATION TECHNOLOGY OUTLOOK 2008 – ISBN 978-92-64-05553-7 – © OECD 200842

1. THE IT INDUSTRY: RECENT DEVELOPMENTS AND OUTLOOK
se_it E ditin
es
eu
le
SemiconductorsSemiconductors are a key intermediate input into ICT equipment and embedded
systems and semiconductor production and shipments are leading indicators of ICT product
market trends. Production is highly cyclical, dropping sharply during downturns and
recovering quickly in upturns. Continuously growing demand for consumer PCs, digital
appliances and mobile communications, enhanced by the increase in semiconductor
content per installed system, is expected to drive longer-term growth in semiconductors.
The most recent data suggest 2008 growth of 2.2% to just over USD 260 billion in
current prices, down from earlier projections of USD 280 billion, and 2009 sales declining
by 5.9% (Figure 1.13).14 On average, worldwide semiconductor sales have increased by 10%
a year since 1990 (in current prices). In the growth cycle between 1990 and 2000 the world
market for semiconductors rose from USD 50 billion to more than USD 200 billion, followed
by a dramatic collapse of 32% in sales in 2001 to less than USD 140 billion. The upturn
beginning in 2002 was strong, with sales increasing by 10% a year to USD 255 billion in 2007,
but sales weakened markedly towards the end of 2008.
Asia is the leading semiconductor market with the global reorganisation of electronics
production. By 2007, Asia-Pacific (including Japan) accounted for 68% of worldwide sales,
while Europe and the Americas each accounted for around 16%. Between 2000 and 2007,
the rest of Asia-Pacific grew by more than 13% a year while Japan’s semiconductor market
grew slightly and the Americas and Europe declined (Figure 1.13).
The final use of semiconductor products has changed due to shifts in final
consumption and technological advances. Consumer electronics and other products,
including telecommunications systems and industrial and automotive devices, have all
increased, and combined they now take a larger share of final use than computers
(Figure 1.14). In the period since 1990 there have been stronger sales of microprocessors
and logic devices than of other categories. However since the sales peak in 2000, sales of
Figure 1.13. Worldwide semiconductor market by region, 1990-2009USD billions, current prices
1 2 http://dx.doi.org/10.1787/472773543123Note: 2008 data are preliminary and 2009 are forecast.
Source: OECD, partly estimated, based on World Semiconductor Trade Statistics (WSTS).
300
250
200
150
100
50
0
1990
1991
1992
1993
1994
1995
1996
1997
1998
1999
2000
2001
2002
2003
2004
2005
2006
2007
2008
2009
Americas Japan Europe Asia Pacific
An
OE
CD
Bro
wo
L e c tur
ylnO dae
R
OECD INFORMATION TECHNOLOGY OUTLOOK 2008 – ISBN 978-92-64-05553-7 – © OECD 2008 43

1. THE IT INDUSTRY: RECENT DEVELOPMENTS AND OUTLOOK
se_it E ditin
es
eu
le
logic devices have been strongest in value terms, increasing by 9.4% a year, compared with
4.7% for discrete devices (including optoelectronics and sensors), 2.6% for analogue and
memory devices and a decline of 1.3% in microprocessor sales (Figure 1.15).
In the first half of 2008 semiconductor capacity utilisation was around 90%, with wafer
starts increasing particularly for large wafers (300 mm) and very fine line-widths
(< 0.08 µm), but with pronounced weaknesses in older, more standard products (SIA,
2008c). However capacity utilisation was starting to decline in mid-2008 and the most
recent peak in capacity utilisation around the start of 2008 was lower than the previous
peak in the second quarter of 2006 for both larger and smaller wafers.
Demand for semiconductor production equipment is a predictor of the performance of
semiconductors and the whole ICT goods industry, as it is driven by projections of
Figure 1.14. Worldwide semiconductor sales by market segment, 2007Percentages
1 2 http://dx.doi.org/10.1787/472786334174
Source: Semiconductor Industry Association (SIA), various years.
Figure 1.15. Worldwide semiconductor market by segment, 1990-2008USD billions, current prices
1 2 http://dx.doi.org/10.1787/472805681204Note: 2008 data are preliminary.
Source: OECD, based on World Semiconductor Trade Statistics (WSTS).
Consumer20.5%
Automotive6.3%
Telecom25.5%Industrial and military
8.2%
Computer39.6%
300
250
200
150
100
50
0
1990
1991
1992
1993
1994
1995
1996
1997
1998
1999
2000
2001
2002
2003
2004
2005
2006
2007
2008
Microprocessors Memories Linear LogicDiscrete, optoelectronics and sensors
An
OE
CD
Bro
wo
L e c tur
ylnO dae
R
OECD INFORMATION TECHNOLOGY OUTLOOK 2008 – ISBN 978-92-64-05553-7 – © OECD 200844

1. THE IT INDUSTRY: RECENT DEVELOPMENTS AND OUTLOOK
se_it E ditin
es
eu
le
semiconductor markets, capacity utilisation and technological change. Delivery of, and
demand for, production equipment both declined by at least 20% and up to 40% in 2008,
with declines in all regions, and particularly in the biggest market of 2007, Chinese Taipei.
Increases are expected in some regions from late 2009 as projected demand for
semiconductors strengthens (Semiconductor International, 2008, Manufacturing.net, 2008,
Fabtech, 2008).
Semiconductor capital spending had increased by more than 17% a year in current
prices to USD 57 billion between 2003 and 2007,15 with strong growth in 2004 and 2006 and
slower growth in 2007. Much of the expansion was in memory manufacturing in Asia
(Semiconductor International, 2008; IMF, 2007, p. 45). Spending on wafer fabrication
equipment has been stronger, accounting in 2007-08 for around 80% of semiconductor
capital equipment spending, packaging and assembly equipment for 12% and automated
testing equipment for the remaining 8-9%.
Structural change in the ICT sectorLong-term prospects for sustained growth in the ICT sector16 are good, as ICTs become
a fundamental part of the economic and social infrastructure.17 The development of new
goods and services will drive demand from businesses, households and governments;
replacement ICT investment will help boost demand; and the growth of IT services will be
underpinned by the expanding use of software and by increasing recourse to outsourcing
as ICT-related service activities become codified and rationalised to achieve the
productivity gains that have eluded services in general. This section analyses value added
and employment on the ICT supply side; it excludes the myriad of ICT and ICT-related
activities in other manufacturing and services sectors and in the public sector (education,
health care, public services). It is based on the most recent official data and OECD
definitions of the ICT sector.
Value addedValue added in the ICT sector increased as a share of business sector value added in
most OECD countries over the period 1996-2006, despite the downturn in the early 2000s.
The share of the ICT sector was over 8% in 2006, after peaking in 2000 (Figure 1.16). The
largest shares are in Finland, Korea and Ireland (all over 12%) and the smallest in Mexico
and Greece (below 6%). Increasing shares were most notable in Finland, Hungary and the
Czech Republic, as well as in Korea. The shares declined somewhat between 1995 and 2006
in three countries (Australia, Austria and the United States). By country the United States
still has around 40% of OECD ICT value added, Europe has around 30%, Japan 12% and
Korea 5% (shares in current USD PPPs).
ICT services account for more than two-thirds of total ICT sector value added in most
countries and their share has grown. Overall, computer and related services and other ICT
services have grown most rapidly, and more rapidly than total business services. They have
led the expansion of the total ICT sector which grew more rapidly than the total business
sector. ICT manufacturing grew less than manufacturing as a whole from 1995 to 2006, but
grew very rapidly until 2000; this points to the structure and impact of the dot.com boom
and bust, and the shift of ICT manufacturing to non-OECD economies and particularly to
Asia (see above and Chapter 2).
An
OE
CD
Bro
wo
L e c tur
ylnO dae
R
OECD INFORMATION TECHNOLOGY OUTLOOK 2008 – ISBN 978-92-64-05553-7 – © OECD 2008 45

1. THE IT INDUSTRY: RECENT DEVELOPMENTS AND OUTLOOK
se_it E ditin
es
eu
le
Figure 1.16. Share of ICT valued added in business sector value added, 1995 and 2006
Percentages
1 2 http://dx.doi.org/10.1787/4728076633771. 2005 instead of 2006. 2. 2004 instead of 2006.3. ICT wholesale (5150) is not available.4. Telecommunication services (642) included Postal services.5. Rental of ICT goods (7123) is not available.
Source: OECD estimates, based on national sources; STAN and National Accounts databases, March 2008.
16
14
12
10
8
6
4
2
0
% 2006 1995
0 10 15 255 20 0 105 15%%
5.111.40.27.8
-2.71.7
-2.6-2.3-1.60.41.0-1.12.20.4-1.60.20.0
-2.4-0.61.2
-0.3-1.0-1.5
4.14.12.12.73.22.82.53.22.30.31.51.32.20.30.71.11.6
-1.0-0.60.40.81.10.7
Computer and office Radio, TV, communications
Rest ICT manufacturing
Computer and related services
Telecommunications Rest ICT services
SpainPortugal1AustraliaGreece1
BelgiumNetherlands
ItalyNorwayCanada
DenmarkCzech Republic
FranceGermanyMexico2
AustriaUnited Kingdom1
United StatesSweden1
IrelandHungary
JapanFinland
Korea
Finlan
d
Korea
5
Irelan
d
Hunga
ry
Sweden
1
United
Kingdo
m1
Netherl
ands
United
States
OECD23
Norway
EU14
Denmark
Franc
e
Japa
n3
Belgium
5
Canad
a
Czech
Rep
ublic
3, 5
Italy
Austra
lia
Portug
al1,
5
German
y5
Austri
aSpa
in
Greece
1, 3,
4, 5
Mexico
2
Mexico2
Japan3
Greece1, 3, 4, 5
AustriaGermany5
AustraliaKorea5
SpainPortugal1, 5
FranceItaly
CanadaDenmark
United StatesBelgium6
Czech Republic3, 5
NorwayHungary
NetherlandsSweden1
United Kingdom1
FinlandIreland
Percentagepoint changein the share1995-2006
(%)
Percentagepoint changein the share1995-2006
(%)
Share of ICT manufacturing in total manufacturingvalue added, 2006
Share of ICT services in total business servicesvalue added, 2006
An
OE
CD
Bro
wo
L e c tur
ylnO dae
R
OECD INFORMATION TECHNOLOGY OUTLOOK 2008 – ISBN 978-92-64-05553-7 – © OECD 200846

1. THE IT INDUSTRY: RECENT DEVELOPMENTS AND OUTLOOK
se_it E ditin
es
eu
le
Figure 1.17. Share of ICT employment in business sector employment, 1995 and 2006
Percentages
1 2 http://dx.doi.org/10.1787/4730882684731. 2005 instead of 2006. 2. 2003 instead of 2006.3. Based on employees figures.4. ICT wholesale (5150) is not available.5. Telecommunication services (642) included Postal services.6. Rental of ICT goods (7123) is not available.
Source: OECD estimates, based on national sources; STAN and National Accounts databases, March 2008.
10
8
6
4
2
0
% 2006 1995
0 10 155 0 105%%
4.2-0.3-0.12.51.54.6-1.1-1.7-0.90.4
-0.7-1.0-0.41.81.0
-0.8-0.10.0
-0.5-0.1-0.70.00.0
2.12.31.71.72.30.11.61.20.80.90.20.31.00.10.00.10.40.5
-0.40.4
-0.50.4
-0.1
Computer and office
Radio, TV, communications
Rest ICT manufacturing Computer and related services
Telecommunications Rest ICT services
Finlan
d
Sweden
1
Irelan
d
Denmark
Franc
e1
Hunga
ry6
Italy
Netherl
ands
Korea
Japa
n1, 4
Norway
German
y6EU
14
OECD23
United
States
Canad
a
Austri
a
Austra
lia
Belgium
6
United
Kingdo
m
Czech
Rep
ublic
4, 6
Spain
Mexico
2, 3
Greece
1, 4,
5, 6
Portug
al1,
6
Percentagepoint changein the share1995-2006
(%)
Percentagepoint changein the share1995-2006
(%)
Share of ICT manufacturing in total manufacturingemployment, 2006
Share of ICT services in total business servicesemployment, 2006
Greece1, 4, 5, 6
Portugal1, 6
SpainAustralia Belgium6
DenmarkGermany6
NorwayCzech Republic4, 6
AustriaCanada
United KingdomFrance1
NetherlandsSweden1
United StatesHungary6
Mexico2, 3
FinlandIreland Japan1, 4
Korea
Italy
Mexico2, 3
KoreaPortugal1, 6
Greece1, 4, 5, 6
Japan1, 4
Czech Republic4, 6
SpainHungary6
United KingdomUnited States
AustriaCanada
AustraliaBelgium6
Germany6
NorwayNetherlands
France1
IrelandItaly
DenmarkFinland
Sweden1
An
OE
CD
Bro
wo
L e c tur
ylnO dae
R
OECD INFORMATION TECHNOLOGY OUTLOOK 2008 – ISBN 978-92-64-05553-7 – © OECD 2008 47

1. THE IT INDUSTRY: RECENT DEVELOPMENTS AND OUTLOOK
se_it E ditin
es
eu
le
Some countries have well above average shares of ICT manufacturing value added
despite its relative decline: Korea and Finland above 20% and Japan, Hungary and Ireland
above 10%. Most OECD countries manufacture communications equipment and
components. However Ireland focuses on computer equipment as an export platform
mainly for United States firms, and Denmark, France, Norway and the United Kingdom
focus on other ICT equipment, suggesting relative strength in measuring and controlling
equipment, also shown in relatively good trade performance in these products
(see Chapter 2, Annex).
EmploymentMore than 15 million people were employed in the ICT sector in OECD countries
in 2006, 5.5% of total OECD business sector employment (Figure 1.17). Over the period
1995-2006 ICT sector employment increased at an annual average rate of 0.9%, almost the
same as for the total business sector, adding 1.4 million people. Finland, Sweden and
Ireland had the largest shares of employment in total business employment, over 8%, and
these shares have increased markedly, as they also did in Hungary, the Czech Republic and
Denmark. The share of employment in ICTs declined in a few countries (Japan, the United
States, the United Kingdom, Portugal and Canada), an indication of the impact of
increasing manufacturing and services trade with non-OECD economies; all had relative
declines or very low growth in both manufacturing and services. The United States has
about 30% of OECD ICT employment, Europe 35%, Japan 14% and Korea 6%.
Over 10 million people are employed in services compared with 5 million in
manufacturing, although ICT manufacturing has a higher share of manufacturing
employment at around 7.5%, than ICT services have of total services (around 5%).
Employment in computer and related services and IT services has grown more rapidly than
business services. However, increases in ICT services employment did not counteract
declines in ICT manufacturing employment, so that the ICT sector did not increase its
share of total business sector employment. As the value added share increased, this is an
indication that the sector is becoming less employment-intensive. ICT employment is also
more cyclical than value added; it reached a peak in 2000-2001 (2000 in manufacturing,
2001 in services) and only started growing again in 2005.
ICT specialisation and productivity
There are strong parallels between the shares of ICT in manufacturing and services
value added and trade performance. Specialisation in the ICT sector reflects the relative
strengths of national firms and national factor endowments (see Chapter 2). Korea,
Finland, Japan, Hungary, Ireland and Sweden have high manufacturing value added shares,
relatively strong export performance, consistent ICT trade surpluses and all except Sweden
were in the top group of OECD countries in revealed comparative advantages in ICT goods
exports. Ireland also has a high share and strong growth of value added in computer and
related services, and is the leading exporter of computer and information services
(see Chapter 2).
Countries with the highest revealed comparative advantages in ICT goods exports
(Korea, Hungary, Ireland, Mexico, Japan, Finland and the Netherlands; see Chapter 2) have
a range of production structures and strategies, illustrated by their manufacturing value
added/employment productivity ratios (in constant prices and USD PPPs). These ratios are
high for Finland, Japan and Korea pointing to innovative and capital-intensive
An
OE
CD
Bro
wo
L e c tur
ylnO dae
R
OECD INFORMATION TECHNOLOGY OUTLOOK 2008 – ISBN 978-92-64-05553-7 – © OECD 200848

1. THE IT INDUSTRY: RECENT DEVELOPMENTS AND OUTLOOK
se_it E ditin
es
eu
le
manufacturing. That for the Netherlands is somewhat lower despite strong domestic
firms, suggesting that factors other than simple relative productivity in ICT manufacturing
drives the Netherland’s export performance. Ireland’s position contrasts strongly with
those of Hungary and Mexico, although all three are assembly platforms for international
ICT firms. Ireland has a very high and fluctuating value added/employment ratio due to the
pricing behaviour of international firms operating there. Hungary and Mexico have
relatively low ratios, suggesting that low-cost labour is a major factor driving their good
export performance (see also Chapter 2 on Ireland’s exceptional software and computer
and IT services trade performance).
ICT employment across the economy
ICT-related employment is spread widely across all sectors of the economy. The
analysis in the previous section focuses exclusively on total employment in the ICT sector
only. However many ICT employees are elsewhere in the economy carrying out ICT tasks
and some employees in the ICT sector are non-ICT. Two measures of ICT employment have
been developed based on ICT occupations. One is a narrow measure of ICT occupations,
comprising ICT specialists whose job is ICTs, e.g. software engineers. The other is a broader
measure of ICT employment where ICTs are used regularly as part of the job, but where the
job is not focused on ICTs, e.g. a researcher or an office worker (see OECD, 2004 and OECD,
2006 for the methodology).
Around 3-4% of total employment in most OECD countries was accounted for by ICT
specialists in 2007 (Figure 1.18). This share has risen consistently in recent years in most
countries, despite the relative stagnation in the share of ICT sector employment in
Figure 1.18. Share of ICT specialist occupations in the total economy, narrow definition,1 19952 and 2007
1 2 http://dx.doi.org/10.1787/4731767382751. Narrow definition based on methodology described in OECD (2004, Chapter 6; 2006). The shares for non-European
countries are not directly comparable with shares for European countries as the classifications were notharmonised. The EU15 aggregate has been estimated for missing years.
2. Except: Australia, Finland and Sweden 1997 instead of 1995.
Source: OECD calculations from EULFS, United States Current Population Survey, Statistics Canada, Australian Bureauof Statistics.
5
4
3
2
1
0
% 1995 2007
Canad
a
United
States
Austra
liaEU
15
Sweden
Finlan
d
Denmark
Netherl
ands
Luxe
mbourg
United
Kingdo
m
German
y
Austri
a
BelgiumSpa
inIta
ly
Portug
al
Franc
e
Irelan
d
Greece
Switzerl
and
Norway
Czech
Rep
ublic
Slovak
Rep
ublic
Icelan
d
Sloven
ia
Poland
Hunga
ry
Eston
ia
Turke
y
An
OE
CD
Bro
wo
L e c tur
ylnO dae
R
OECD INFORMATION TECHNOLOGY OUTLOOK 2008 – ISBN 978-92-64-05553-7 – © OECD 2008 49

1. THE IT INDUSTRY: RECENT DEVELOPMENTS AND OUTLOOK
se_it E ditin
es
eu
le
business sector employment (see preceding section). Although these data are not directly
comparable, the divergences between the two suggest that there is ongoing occupational
specialisation as higher level ICT skills are required. These skills are used partly in the ICT
sector as it restructures around more advanced products and activities, and partly across
the wider non-ICT economy as ICT specialist skills are needed to produce ICT products in
non-ICT sectors (software in the banking industry for example) and non-ICT products with
ICTs embedded in them (automobile braking systems for example) (see Chapter 3). The
share of ICT specialists in total employment declined only in France, Ireland and Portugal.
ICT-using occupations (including specialists) make up over 20% of total employment
in most countries (Figure 1.19). These occupations include e.g. scientists and engineers, as
well as office workers, but exclude teachers and medical specialists for whom the use of
ICTs is in general not essential for their tasks. There remains a contrasting picture in terms
of trends, with the share of ICT-using occupations declining in English-language countries
(Australia, Canada, the United States) or remaining flat (the United Kingdom) over the
period 1995-2007, whereas the EU15 increased somewhat overall and with some countries
increasing considerably (Denmark, Finland, Sweden, Ireland and Austria). In most
countries, specialist and user occupations move in the same direction, except for Ireland
where the rapid increase in Ireland’s ICT-using population reflects the structural
transformation of Ireland’s work-force into a more high-skilled one with an increasing
share of employment in service occupations. Overall, these estimates show the importance
of ICT-related occupations across the economy and the necessity of analysing ICT-related
activities and employment very broadly across the economy.
Figure 1.19. Share of ICT-using occupations in the total economy, broad definition,1 19952 and 2007
1 2 http://dx.doi.org/10.1787/4731846478841. Broad definition based on methodology described in OECD (2004, Chapter 6; 2006). The shares for non-European
countries are not directly comparable with shares for European countries as the classifications were notharmonised. The EU15 aggregate has been estimated for missing years.
2. Except: Australia, Finland and Sweden 1997 instead of 1995.
Source: OECD calculations from EULFS, United States Current Population Survey, Statistics Canada, Australian Bureauof Statistics.
30
25
20
15
10
5
0
% 1995 2007
EU15
Austra
lia
Canad
a
United
States
Luxe
mbourg
United
Kingdo
m
Denmark
Finlan
d
Sweden
Netherl
ands Ita
ly
Belgium
German
y
Irelan
d
Austri
a
Franc
eSpa
in
Greece
Portug
al
Norway
Switzerl
and
Hunga
ry
Icelan
d
Czech
Rep
ublic
Sloven
ia
Eston
ia
Slovak
Rep
ublic
Poland
Turke
yAn
OE
CD
Bro
wo
L e c tur
ylnO dae
R
OECD INFORMATION TECHNOLOGY OUTLOOK 2008 – ISBN 978-92-64-05553-7 – © OECD 200850

1. THE IT INDUSTRY: RECENT DEVELOPMENTS AND OUTLOOK
se_it E ditin
es
eu
le
Venture capitalA major share of all venture capital continues to go to the ICT sector, although the
share has declined from its peaks around 2000-01. Venture capital has long been seen as a
major factor converting commercial potential into reality and all OECD countries have
made continued efforts to improve the supply of venture capital going into potentially
productive activities. By country, well over 50% of total venture capital has gone into ICTs
in Canada, Ireland, Korea and the United States, and also in rapidly developing sources of
ICTs in the Czech Republic, Israel, and Poland (Figure 1.20). Although the share of ICT
venture capital in GDP has declined, it still retains a significant share. However, the 2008
financial market crisis cut back the supply of venture capital and financing for promising
new ventures.
In the United States venture capital market – by far the world’s largest – around 50% of
total venture capital still goes to ICTs. This share has declined from its peak of 75% in 2000,
but is still around the level of the mid-1990s (Figure 1.21). The amount flowing into ICT
ventures remained over USD 15.6 billion in 2007 and was USD 7.4 billion in the first half
of 2008 although there was a considerable slowdown in the third quarter of 2008. There
have however been some changes in the composition of this investment, with a shift
towards software, and increasing competition from e.g. energy and environmental
innovations and technologies, many of which are ICT-intensive. The extent to which the
Figure 1.20. Venture capital investments in ICT as a percentage of all venture capital investment, 2006
1 2 http://dx.doi.org/10.1787/473202205467
Source: OECD Venture Capital Database, 2008.
%
0 10 20 30 40 50 60 70 80
Communications Computer-related Other electronics-related ICT unspecified
New ZealandHungaryPortugal
SpainSwitzerland
GermanyBelgium
FranceItaly
NorwayGreece
SwedenAustralia
European UnionIndia
FinlandNetherlands
United KingdomJapanOECD
AustriaDenmark
CanadaPoland
United StatesIrelandKoreaIsrael
Czech Republic
An
OE
CD
Bro
wo
L e c tur
ylnO dae
R
OECD INFORMATION TECHNOLOGY OUTLOOK 2008 – ISBN 978-92-64-05553-7 – © OECD 2008 51

1. THE IT INDUSTRY: RECENT DEVELOPMENTS AND OUTLOOK
se_it E ditin
es
eu
le
composition and amounts flowing into this market will endure depends in part on the
relative opportunities for growth in other technologies, as well as investor confidence in
the returns on these kinds of investments and the potential for successful exit.
ICT markets and spendingTotal worldwide ICT spending was estimated to reach USD 3 433 billion in 2007, of
which 78% (USD 2 681 billion) by OECD member countries, down from 85% in 2003. The
North American market (the United States, Canada and Mexico) is the largest, accounting
for 34% of worldwide ICT spending (USD 1 157 billion). Western Europe accounted for 30%
in 2007 (USD 1 030 billion) and the Asia-Pacific region for 26% (USD 878 billion). With the
emergence of new growth economies as markets for ICT products and services, worldwide
ICT spending has increased 9.6% a year since 2003 while OECD spending increased by an
annual 7.3%. Worldwide, a slowing of growth in ICT spending is expected through to 2011,
but there is unlikely to be as large a drop in current USD as there was in 2001-02, owing to
growth in non-OECD economies and introduction of new products. However the shape of
growth will also depend on the spillovers from turmoil in financial markets onto the global
economy, the depth and length of the looming recession in OECD countries as well as
currency movements and the impacts of food and commodity prices on developing
economies, which are likely to slow ICT growth or lead to declines.
Worldwide, more than half of the estimated 2007 ICT spending (USD 1 960 billion) was
on communications services and hardware, 21% (USD 712 billion) on computer services,
14% (USD 466 billion) on computer hardware and 9% (USD 296 billion) on software (but
note that these totals are based on a narrower definition of ICT than elsewhere in this
report18). As equipment prices have continued to fall, software spending has increased
most rapidly since 2003 (by 10.6% a year), compared with computer hardware by 9.5% a
year. Communications services and hardware spending have increased by 10% reflecting
Figure 1.21. Quarterly venture capital investments in the ICT sector in the United States, Q1 1995-Q3 2008
In billion USD and percentages
1 2 http://dx.doi.org/10.1787/473220263452Note: The ICT sector comprises the following: software, media and entertainment, IT services, telecommunications,semiconductors, computers and peripherals, networking equipment, electronics and instrumentation.
Source: OECD based on data from PricewaterhouseCoopers/National Venture Capital Association MoneyTree Report,October 2008.
25
20
15
10
5
0
100
90
80
70
60
50
40
30
20
10
0
%Amount of ICT VC investments (billion USD)USD % of ICT VC investments on total
1995
Q1
1995
Q3
1996
Q1
1996
Q3
1997
Q1
1997
Q3
1998
Q1
1998
Q3
1999
Q1
1999
Q3
2000
Q1
2000
Q3
2001
Q1
2001
Q3
2002
Q1
2002
Q3
2003
Q1
2003
Q3
2004
Q1
2004
Q3
2005
Q1
2005
Q3
2006
Q1
2006
Q3
2007
Q1
2007
Q3
2008
Q1
2008
Q3
An
OE
CD
Bro
wo
L e c tur
ylnO dae
R
OECD INFORMATION TECHNOLOGY OUTLOOK 2008 – ISBN 978-92-64-05553-7 – © OECD 200852

1. THE IT INDUSTRY: RECENT DEVELOPMENTS AND OUTLOOK
se_it E ditin
es
eu
le
the uptake of more advanced services in OECD countries and the rapid spread, particularly
of mobile services, in developing countries.
The United States is by far the largest national market, spending some
USD 1 031 billion during 2007 – USD 444 billion on communications services and hardware,
USD 317 billion on computer services, USD 148 billion on computer hardware and
USD 121 billion on software. Japan, the second largest spender on ICT in 2007 spent less
than one-third as much as the United States at USD 314 billion. Other major markets
Figure 1.22. Worldwide ICT spending by market segment, 2003-08USD millions, current prices
1 2 http://dx.doi.org/10.1787/473236127104Note: Data for 2008 are forecast.
Source: OECD, from data published by World Information Technology and Services Alliance (WITSA), based onresearch by Global Insight, Inc.
4 000 000
3 500 000
3 000 000
2 500 000
2 000 000
1 500 000
1 000 000
500 000
02003 2004 2005 2006 2007 2008
Computer servicesComputer hardware CommunicationsComputer software
Figure 1.23. OECD ICT spending by market segment, 2007USD millions, current prices
1 2 http://dx.doi.org/10.1787/473245056815
Source: OECD, from data published by World Information Technology and Services Alliance (WITSA), based on research byGlobal Insight, Inc.
1 200 000
200 000
150 000
100 000
50 000
0
1 000 000
800 000
600 000
400 000
200 000
0
Computer servicesComputer hardware CommunicationsComputer software
United
States
Japa
n
German
y
United
Kingdo
mFra
nce
Italy
Canad
aSpa
inKor
ea
Austra
lia
Netherl
ands
Mexico
Turke
y
Switzerl
and
Sweden
Belgium
Poland
Austri
a
Denmark
Norway
Greece
Irelan
d
Portug
al
Finlan
d
Czech
Rep
ublic
Hunga
ry
New Ze
aland
Slovak
Rep
ublic
An
OE
CD
Bro
wo
L e c tur
ylnO dae
R
OECD INFORMATION TECHNOLOGY OUTLOOK 2008 – ISBN 978-92-64-05553-7 – © OECD 2008 53

1. THE IT INDUSTRY: RECENT DEVELOPMENTS AND OUTLOOK
se_it E ditin
es
eu
le
include Germany (USD 206 billion), the United Kingdom (USD 187 billion), and France
(USD 147 billion). Outside the OECD, China was the third largest market at USD 254 billion
in 2007, Brazil ranked ninth at USD 76 billion, India tenth at USD 66 billion, the Russian
Federation sixteenth at USD 53 billion and South Africa twenty-first at USD 27 billion.
ICT spending increased most rapidly between 2003 and 2007 in Latin America and
eastern Europe (Figure 1.24). In North America, growth in spending was more subdued in
the United States (6.2% a year), Canada (11%) and Mexico (14%). Japan was the OECD
member country with the slowest growth, with a rise from USD 278 billion in 2003 to
USD 314 billion in 2007 (in current prices).
There are significant differences in expenditure shares by market segment for
historical structural, cyclical, and regulatory reasons. Among OECD member countries:
● Communications services and hardware account for more than 70% of total 2007 ICT
spending in Mexico, Korea, Greece, Poland, Spain and the Slovak Republic, but less than
45% in Sweden and the United States.
● Computer services account for more than 25% of total ICT spending in the United States,
France, United Kingdom and Canada, but less than 10% in Mexico, Greece, Poland,
Hungary and Portugal.
● Computer hardware accounts for more than 17% of total ICT spending in Turkey,
Switzerland and the Czech Republic, but less than 10% in Mexico.
● Computer software accounts for more than 15% of total spending in Switzerland, the
Netherlands, the Czech Republic and Finland, but less than 5% in Mexico, Korea, Japan
and New Zealand.
Figure 1.24. Fastest ICT spending growth, 2003-07Annual average growth, percentages
1 2 http://dx.doi.org/10.1787/473246468561Note: Includes the 25 fastest-growing markets.
Source: OECD, from data published by World Information Technology and Services Alliance (WITSA), based onresearch by Global Insight, Inc.
35
30
25
20
15
10
5
0
%
Venez
uela
Ukraine Ind
ia
Hondu
ras
Roman
ia
Argen
tina
Russia
n Fed
eratio
n
Bangla
desh
Colombia
Urugu
ayBraz
il
Kenya
Seneg
alIra
n
Indon
esia
Sri Lan
ka
Ecua
dor
Sloven
iaEg
ypt
Pakist
an
Turke
y
Kuwait
China
Poland
Bulgari
a
An
OE
CD
Bro
wo
L e c tur
ylnO dae
R
OECD INFORMATION TECHNOLOGY OUTLOOK 2008 – ISBN 978-92-64-05553-7 – © OECD 200854

1. THE IT INDUSTRY: RECENT DEVELOPMENTS AND OUTLOOK
se_it E ditin
es
eu
le
ICT spending is increasing rapidly in many emerging non-OECD economies,
particularly the larger ones (Figure 1.24). China’s ICT spending is estimated to have grown
by more than 20% a year since 2003. ICT spending in India, the Russian Federation and
Brazil increased even more rapidly, by 30, 28 and 24% a year, respectively. In terms of the
BRIICS rankings of growth in ICT spending between 2003 and 2007, India ranks third world-
wide, the Russian Federation seventh, Brazil eleventh, Indonesia fifteenth and China
twenty-third. Of the accession countries Slovenia is eighteenth. Turkey is the first OECD
country in the top group in terms of market growth at number 21 and Poland is number 24.
Spending on computer hardware was relatively high in some non-OECD economies:
16% of total ICT spending in the Russian Federation in 2007 and 15% in India, compared
with an of OECD average of 14%. Conversely, spending on software and services was below
the OECD average at between 3 and 10% of total ICT spending in India, Brazil and China,
indicating structural differences in ICT markets due to national development, acquisition
and use preferences.
By end-markets, the consumer market is the largest, accounting for 29% of total
worldwide ICT spending in 2007 as defined in this section. Other segments are significantly
smaller, with communications services accounting for 12%, the financial services sector for
10%, and the government, manufacturing and professional services sectors for around 8%
each. On trend, the consumer market and transport and communication services have
increasing market shares, while shares of other sectors are declining.
ConclusionProspects for the ICT sector are very much less favourable than in the 2006 Information
Technology Outlook. The macroeconomic outlook has progressively worsened over the last
year and both business and consumer confidence in OECD countries has fallen sharply as
the financial markets crisis has unfolded and food and commodity prices soared. This has
led to sharp downward revisions to macroeconomic projections and for the ICT sector. In
the recent past, ICT expenditures and markets have closely tracked GDP growth and non-
residential fixed investment. They are likely to continue to do so considering the relative
importance of ICT investment in total investment, and will reflect the deep economic
downturn starting in third-quarter 2008 in the OECD area.
Recent weaknesses in short-term ICT indicators parallel the weakening
macroeconomy and aggregate investment. In the United States ICT production and
markets have weakened considerably as recession loomed; this has been reflected in
Europe and Japan although they have performed somewhat better than the United States,
and ICT trade continued to perform somewhat better in the first half of 2008 than
aggregate performance and ICT indicators would suggest. Macroeconomic forecasts
combined with business and consumer sentiment suggest that ICT growth in OECD
countries will at best be slow in 2008 and decline in 2009, but is unlikely to collapse as it did
in 2001.
The outlook for semiconductors – the bellwether for ICT goods production – remains
moderate with 2.2% growth in 2008 and a projected 5.6% decline in 2009. Additionally,
investment in semiconductor production equipment has plunged but is forecast to pick up
from late 2009. Major ICT firms reporting for the first three quarters of 2008 show positive,
but mixed, results overall. New products were performing well, particularly in consumer
goods, despite ebbing consumer confidence, IT services and software were generally
An
OE
CD
Bro
wo
L e c tur
ylnO dae
R
OECD INFORMATION TECHNOLOGY OUTLOOK 2008 – ISBN 978-92-64-05553-7 – © OECD 2008 55

1. THE IT INDUSTRY: RECENT DEVELOPMENTS AND OUTLOOK
se_it E ditin
es
eu
le
growing, and established Internet businesses maintained very high growth rates. Most
other segments were under pressure, including telecommunications services, which were
looking to new 3G services and non-OECD economies for growth.
Overall growth for 2008 is constrained to a maximum of 4%, with very different
performances across segments and markets, and may well be below zero in 2009 for OECD
markets, but with potentially higher growth outside the OECD area. There is likely to be
considerable pressure on OECD ICT employment, as there was in the last downturn, owing
to increasing competition from non-OECD economies and global industrial restructuring in
both goods and services, and production and value added will decline somewhat in the
medium term.
Global ICT markets are also shifting to non-OECD economies. The share of OECD
countries declined to 78% of the world total market in 2007 from 85% in 2003, as ICT
markets grew at 9.6% globally but at a more subdued 7.3% in OECD countries. Furthermore
there were only two OECD countries in the top 25 ICT markets, but six enhanced
engagement and accession countries (Brazil, China, India, Indonesia; the Russian
Federation and Slovenia). This shows that ICT markets in non-OECD economies are
growing in parallel with the reorganisation of ICT manufacturing and services. This shift is
captured in the top 250 ICT firms, which include increasing numbers of non-OECD firms,
and they are growing more rapidly than OECD firms. Notable among them are
manufacturing firms from Chinese Taipei which have benefited from and partly driven the
rise of China as by far the major exporter of ICT goods. Also notable are IT service firms
from India and telecommunications service providers from a range of non-OECD
economies.
Over the long term the OECD ICT sector has grown and in 2006 represented more than
8% of OECD business value added and employed over 15 million people. With global
restructuring of production, ICT manufacturing has tended to decline overall, but countries
with high shares of ICT manufacturing value added have positive comparative advantages
and consistent export surpluses in ICT goods. The ICT sector has also shifted towards
computer and related services and other ICT services in OECD countries. In terms of ICT-
related employment across the economy, around 3-4% of total employment in most OECD
countries was accounted for by ICT specialists in 2007 and this share has risen consistently
in most countries; and ICT-using occupations make up over 20% of total employment in
most countries. Furthermore the ICT sector continues to attract a disproportionate share of
venture capital; the flows remained around 50% of the total in the United States with little
sign of slackening in the first half of 2008, but slowing in the third quarter with the
financial crisis.
The longer-term global performance of the ICT sector will depend on whether new
goods and services continue to prompt businesses and consumers to keep investing in and
buying ICT output; whether non-OECD economies maintain their dynamic growth paths,
although their aggregate markets are still considerably smaller than for the OECD area; and
how large the contribution of ICTs will be to meeting major challenges such as climate
change, the environment, ageing populations, skills shortages and continuing
globalisation.
An
OE
CD
Bro
wo
L e c tur
ylnO dae
R
OECD INFORMATION TECHNOLOGY OUTLOOK 2008 – ISBN 978-92-64-05553-7 – © OECD 200856

1. THE IT INDUSTRY: RECENT DEVELOPMENTS AND OUTLOOK
se_it E ditin
es
eu
le
Notes
1. See Methodology and Definitions Annex for the definition of ICT investment.
2. See Global Insights data later in this chapter. See also Forrester www.forrester.com/ER/Press/Release/0,1769,1195,00.html, “Global IT 2008 Market Outlook”; IDC www.idc.com/getdoc.jsp?containerId=prSG21195508,and OECD (2008c and 2008d).
3. See Computerworld (2008) for employment trends in the US IT industry.
4. Gartner (2008), “CIOs in Asia expect IT budget growth of 8.3 percent in 2008 compared to worldwideaverage of 3.3 per cent”, 13 February, www.gartner.com/it/page.jsp?id=604408.
5. CIO survey 2008; www.idc.com/getdoc.jsp?containerId=prUS21200908.
6. Gartner projected worldwide semiconductor markets to grow by 4.6% in 2008, “GartnerSemiconductor Insight: Identifying the Growth Hot Spots”, San Jose, 4 June, Stamford, Conn.,2 June; IDC, 3 June 2008; SIA 30 October 2008; Financial Times (2008a), Worldwide PC ProcessorMarket Slowed in the First Quarter; section on semiconductors.
7. IDC Worldwide Quarterly PC Tracker, 16 April 2008 Gartner’s PC Quarterly Statistics Worldwide byRegion program; Gartner report "Market Trends: Worldwide PC Market Scenarios, 1Q08"www.gartner.com/it/page.jsp?id=648619; www.gartner.com/it/page.jsp?id=631107; IDC: PC shipmentsgrowth for EMEA and Asia-Pacific 17% in 2008 www.idc.com/getdoc.jsp?containerId=prUS21190708;Worldwide PC shipments were projected to grow by 12.8% in 2008 to reach 302 million units, IDCWorldwide Quarterly PC Tracker, www.idc.com/getdoc.jsp?containerId=prUS21138308.
8. Financial Times (2008b), Tech tock; OECD (2008c)
9. Gartner (2008), “Gartner Says Economic Slowdown in the US to Accelerate Offshoring of ITServices”, 24 April, www.gartner.com/it/page.jsp?id=654707.
10. Market capitalisations change daily and data collected on a particular day are no more thanindicative. The slowdown in the United States that emerged in late 2007 has affected industrygrowth expectations and a number of the leading ICT firms lost value during early 2008.
11. Greater effort was made to identify non-OECD-based firms for this year’s list, with a few firmsnewly identified that would have qualified for the 2006 Information Technology Outlook top 250 list(prepared in 2005). Nevertheless, the majority of new identifications are due to rapid firm growth.
12. Where there are few firms, performance is firm-based rather than industry-based or country-based.
13. This section focuses on 2006 as the cut-off year for discussion as 2007 data are still incomplete.
14. See Semiconductor Industry Association (2008a), which gave 2007 worldwide sales ofUSD 255.6 billion. September 2008 data showed the sector still growing steadily with world-widesales to July 2008 of USD 148.3 billion, an increase of 5% from the same period of 2007 when saleswere USD 141.3 billion (SIA, 2008b). This is a slight slowdown from the 30 June release when salesto May 2008 were up by 5.3% from the first five months of 2007. Worldwide sales of semiconductorsgrew by 7.6% to USD 22.2 billion in July 2008 from July 2007. Semiconductor sales reflectedcontinued strong sales of consumer electronic products, despite the general decline in consumerconfidence. They also reflect the shift in sales of final products to non-US markets, and show thata slowdown in the US would not have the same impact as in the past. “Growing sales of consumerelectronics, personal computers and cell phones – which account for about 80 per cent of chipdemand – contributed to a healthy 7.6 per cent year-on-year increase in worldwide microchip sales… [with strong] … second quarter GDP growth in the US ,and continued strength in world markets… For the second quarter of this year we’ve seen a significant crossover – 300 mm for the first timeaccounts for the largest share of wafer manufacturing capacity and actual wafers processed, with44 per cent of total capacity and 47 per cent of total silicon processed” (SIA, 2008b).
15. According to Semiconductor International (2008), semiconductor equipment sales were forecast todrop to USD 34 billion in 2008, down 20% from USD 43 billion in 2007, and the outlook hasweakened sunsequently.
16. See Methodology and Definitions Annex for the ICT sector value added and employmentdefinition. The data in this section are not directly comparable with data in the InformationTechnology Outlook 2006.
17. See in particular the outcomes of the 2008 Seoul Ministerial on the Future of the Internet Economy,and the document on future work “Shaping policies for the future of the Internet economy” andAnnexes, available at www.oecd.org/FutureInternet
18. See Methodology and Definitions Annex for the ICT spending definition.
An
OE
CD
Bro
wo
L e c tur
ylnO dae
R
OECD INFORMATION TECHNOLOGY OUTLOOK 2008 – ISBN 978-92-64-05553-7 – © OECD 2008 57

1. THE IT INDUSTRY: RECENT DEVELOPMENTS AND OUTLOOK
se_it E ditin
es
eu
le
References
Chesbrough, H. (2003), Open Innovation: The new imperative for creating and profiting from technology,Harvard Business School Press: Boston MA.
Chesbrough, H., W. Vanhaverbeke and J. West (eds.), (2006), Open Innovation: Researching a New Paradigm,Oxford University Press, Oxford.
Computerworld (2008), “Slowdown hits IT”, 14 July, p. 46.
Fabtech (2008), Worldwide semiconductor equipment billings tank, 10 September, available at:www.fabtech.org/news/_a/worldwide_semiconductor_equipment_billings_tank/, and “Semiconductorequipment back-to-bill ratio at lowest level in four years”, 16 October.
Financial Times (2008a), “TSMC set to forge a path through the gloom”, 1 August, p. 16.
Financial Times (2008b), “Tech tok”, Lex column, 10 September.
Houghton, J.W. (2006), “Innovation in ICT: A changing landscape”, Telecommunications Journal of Australia56(3/4), pp. 93-105.
IMF (2007), World Economic Outlook: Spillovers and Cycles in the Global Economy, International MonetaryFund, Washington, DC.
Jaruzelski, B. and K. Dehoff (2007), The Customer Connection: The Global Innovation 1000,strategy+business 49, Winter.
Manufacturing.net (2008), “FY 2008 Chip-Making Equipment Sales Expected To Drop”, 3 July.
MoneyTree Report (2008), PricewaterhouseCoopers/National Venture Capital Association regular webpublication of venture capital data for the United States.
OECD (2004), OECD Information Technology Outlook 2004, OECD, Paris.
OECD (2006), OECD Information Technology Outlook 2006, OECD, Paris.
OECD (2007a), OECD Communications Outlook 2007, OECD, Paris.
OECD (2007b), OECD Science, Technology and Industry Scoreboard, OECD, Paris.
OECD (2008a), OECD Economic Outlook Number 83, June, OECD, Paris.
OECD (2008b), What is the Economic Outlook for OECD Countries? An Interim Assessment, 2 September,OECD, Paris.
OECD (2008c), “Economic Projections for the US, Japan and Euro Area”, 13 November, OECD, Paris.
OECD (2008d), OECD Economic Outlook, No. 84, November, OECD, Paris.
Robbins, C. A. (2007), “BEA’s R&D satellite account and the capitalization of R&D in the NationalAccounts”, Bureau of Economic Analysis, AUBER Fall Conference, Pensacola Florida, 15 October.
Semiconductor Industry Association (SIA) (2008a), 2008 SIA Annual report, available at www.sia-online.org/downloads/SIA_AR_2008.pdf.
Semiconductor Industry Association (SIA) (2008b), “July Chip Sales up 7.6 Percent Year-on-Year”, pressrelease, 2 September.
Semiconductor Industry Association (SIA) (2008c), “Statistics report, 1st quarter 2008, SemiconductorWafer – Fab Capacity and Utilisation”, 21 May, 21 August.
Semiconductor International (2008), “Equipment Sales Will Fall 20% in 2008”, 15 July, available atwww.semiconductor.net/article/CA6578726.html.
World Information Technology and Services Alliance (WITSA) (2008), “Digital Planet 2008, ReportTables”, published by WITSA, Based on research conducted by Global Insight, Inc., Vienna, Virginia.
An
OE
CD
Bro
wo
L e c tur
ylnO dae
R
OECD INFORMATION TECHNOLOGY OUTLOOK 2008 – ISBN 978-92-64-05553-7 – © OECD 200858

1. THE IT INDUSTRY: RECENT DEVELOPMENTS AND OUTLOOK
DB
ro
wse_it E ditio
n
es
eu
le
ylnO d
ANNEX 1.A1
Top 10 firms in each ICT sectorThe top 250 ICT firms are dominated by large telecommunication services and
electronics firms. Analysis of, for example, the top 50 firms, does not show the
performance of major firms in other industry sectors or indicate the performance of
sectors in which smaller firms predominate. There is, for example, only one software firm
in the top 50 (Microsoft). This section analyses the activities of the top 10 ICT firms in each
sector: communications equipment and systems, electronics, semiconductors, IT
equipment and systems, IT services, software, Internet, and telecommunication services.
Communications equipment and systemsReflecting a recovery in activity, the top 10 communications equipment and systems
firms generated combined revenues of USD 208 billion in 2006 and net income of
USD 18.8 billion. They employed more than 500 000 and spent more than USD 23 billion or
11% of revenues on R&D. There are 15 communications equipment firms in the ICT top 250,
ranked by 2006 revenue, with Nokia, Motorola, Cisco Systems and Ericsson in the top 50.
The composition of the top 10 is much the same as it was in 2005, with the merger of
Alcatel and Lucent Technologies making way for the addition of the rapidly growing China-
Table 1.A1.1. Top 10 communications equipment and systems firmsUSD millions in current prices and number employed
Revenue 2000
Revenue 2006
Revenue 2007
Employees 2000
Employees 2006
R&D 2000
R&D 2006
Net income 2000
Net income 2006
Nokia Finland 27 868 51 660 69 895 58 708 109 871 2 371 4 896 3 613 2 992
Motorola United States 32 107 42 879 36 622 147 000 66 000 3 426 4 106 1 318 3 661
Cisco Systems United States 18 928 28 484 34 922 38 000 49 926 2 704 4 067 2 668 5 580
Ericsson Sweden 29 866 24 113 27 788 105 129 67 500 4 577 3 787 2 300 3 537
Alcatel-Lucent France 28 815 15 430 24 356 131 598 89 370 2 610 1 842 –521 –741
L-3 Communications United States 1 910 12 477 13 961 14 000 63 700 24 86 83 526
Nortel Networks Canada 27 948 11 418 10 948 94 500 33 760 3 663 1 939 –2 995 28
Huawei Technologies China 1 933 8 504 11 000 . . . . 193 850 345 512
Qualcomm United States 3 197 7 536 8 871 6 300 11 200 340 1 538 622 2 470
Avaya United States 7 732 5 148 5 279 31 000 10 000 468 428 –375 201
Total 180 303 207 648 243 641 626 235 501 327 20 376 23 539 7 057 18 766
1 2 http://dx.doi.org/10.1787/476301335863Source: OECD, Information Technology database, compiled from annual reports, SEC filings and market financials.
An
OE
C
L e c tur
aeR
OECD INFORMATION TECHNOLOGY OUTLOOK 2008 – ISBN 978-92-64-05553-7 – © OECD 2008 59

1. THE IT INDUSTRY: RECENT DEVELOPMENTS AND OUTLOOK
se_it E ditin
es
eu
le
based Huawei Technologies. Since 2001, two firms have exited the top 10, Marconi and
Tellabs, to be replaced by Qualcomm and L-3 Communications.
Communications equipment firms were severely affected by the downturn and
sudden slowdown in telecommunications infrastructure investment from 2001.
Nevertheless, some continued to perform well, and a broad recovery is now evident.
Between 2000 and 2006, revenues increased by USD 27 billion, net income increased by
USD 11.7 billion and R&D expenditures by more than USD 3 billion. Nevertheless,
employment in the top 10 communications equipment firms has fallen by around 125 000,
although data are incomplete with respect to Huawei Technologies and the merger of
Alcatel and Lucent Technologies. Combined net income of almost USD 19 billion in 2006 is
a marked improvement on the losses experienced in 2001 and 2002. The top 10 enjoyed an
average margin (i.e. combined net income over revenue) of 9% in 2006, with strong returns
from Qualcomm, Cisco Systems and Ericsson. Average reported market capitalisation of
communications equipment firms increased from USD 39 billion in 2001 to more than
USD 44 billion in late 2007, or by 2.2% a year.
R&D intensity (i.e. R&D spending as a percentage of revenue) averaged more than 11%
across the top 10 in 2006, with Qualcomm, Nortel Networks, Ericsson and Cisco Systems all
spending between 14 and 20% of revenues on R&D. L-3 Communications and Huawei
Technologies were among the fastest growing communications equipment and systems
firms, with revenues increasing by 37 and 28% a year, respectively. Other communications
equipment and systems firms enjoying rapid growth include: Research in Motion,
UTStarcom, Juniper Networks and ZTE. These increases reflect opportunities in security,
defence-related and mobile communications markets and the success of the Blackberry, as
well as the emergence of growth markets in China.
IT equipment and systemsLeading IT equipment and systems firms tend to be larger than specialist
communications equipment firms, with nine of the top 10 in the ICT top 50. A number are
also diversified, but tend to be diversified within ICT (i.e. producing IT equipment, software
and services). For example, IBM derives a larger share of revenues from services and
software than from hardware, while others depend much more upon hardware sales
(e.g. Hewlett-Packard). New entrants into the IT equipment top 10 since 2001 include: Hon
Hai Precision, Apple, ASUSTeK and Quanta Computer. Exits include Compaq Computer,
which was taken over by Hewlett-Packard, Gateway, EMC and Sun Micro Systems. Seagate
entered the 2003 top 10 and exited the 2005 list.
Total revenue of the IT equipment and systems top 10 amounted to USD 455 billion
in 2006, they employed more than 1.5 million people and spent around USD 20 billion on
R&D. Between 2000 and 2006, top 10 IT equipment firms’ total revenue increased by
USD 130 billion, total employment increased by around 520 000, and the R&D expenditure
of those reporting also increased. Total net income increased, with the top 10 firms
reporting a combined net income of almost USD 25 billion in 2006 and a margin (i.e. net
income over revenue) of 5.4%. Average reported market capitalisation of IT equipment
firms increased from USD 24 billion in 2001 to USD 33 billion in late 2007, or by 5.4% a year.
In 2007 top 10 IT equipment firm revenues were USD 518 billion.
Among the top 10 IT equipment firms two had declining revenues over the 2000-06
period (NEC and Fujitsu). These firms shed jobs, while employment increased in most of
An
OE
CD
Bro
wo
L e c tur
ylnO dae
R
OECD INFORMATION TECHNOLOGY OUTLOOK 2008 – ISBN 978-92-64-05553-7 – © OECD 200860

1. THE IT INDUSTRY: RECENT DEVELOPMENTS AND OUTLOOK
se_it E ditin
es
eu
le
the others. Data reflect the ongoing globalisation of ICT manufacturing and the rapid
emergence of manufacturing activities in China and elsewhere in Asia, with IT equipment
firms enjoying annual revenue growth in excess of 25% including High Tech Computer, Hon
Hai Precision, ASUSTeK Computer, Lite-on Technology, Lenovo, SanDisk, Quanta
Computer, Compal Electronics, Inventec and Benq/Qisda, with all but SanDisk from
Chinese Taipei or China, and emerging firms with rapid revenue growth over the last few
years: TPV Technology (essentially a Chinese firm registered in Bermuda) and Wistron of
Chinese Taipei.
ElectronicsLeading electronics firms tend to be significantly larger than those in the
communications equipment and systems sector. They also tend to be more diversified, and
many have significant non-ICT business. There are no less than 61 electronics firms in the
ICT top 250, ranked by 2006 revenue, with 16 in the top 50.
In 2006, the top 10 electronics firms generated combined revenues of USD 532 billion,
employed almost 2 million people, and realised an aggregate net profit of more than
USD 27 billion. Top 10 revenues increased by more than USD 98 billion between 2000
and 2006, but employment fell by 180 000. Total net income increased by USD 3.2 billion.
The combined margin (i.e. net income over revenue) was 5.2%, with much higher margins
enjoyed by Philips, Samsung and Canon. Average reported market capitalisation of
electronics firms in the top 250 increased from USD 12 billion in 2001 to USD 22 billion in
late 2007, or by 11% a year. The top 10 electronics firms spent an average of 6.5% of revenue
on R&D during 2006.
Samsung and Siemens enjoyed strong revenue growth between 2000 and 2006. Other
electronics firms enjoying rapid growth included the emerging Asian manufacturers Chi
Mei Optoelectronics and AU Optronics, Nvidia, Jabil Circuit and Sanmina SCI. These results
reflect some consolidation, especially in contract electronics manufacturing (Flextronics of
Singapore has recently acquired United States-based Solectron), as well as the growth of
emerging Asian economies as the preferred locations for electronics manufacturing. In
2007 top 10 revenues exceeded USD 550 billion.
Table 1.A1.2. Top 10 IT equipment and systems firmsUSD millions in current prices and number employed
Revenue 2000
Revenue 2006
Revenue 2007
Employees 2000
Employees 2006
R&D 2000
R&D 2006
Net income 2000
Net income 2006
Hewlett-Packard United States 48 870 91 658 104 286 88 500 156 000 2 627 3 591 3 697 6 198
IBM United States 85 089 91 423 98 785 316 303 355 766 5 084 6 107 8 093 9 491
Dell Computer United States 25 265 55 788 57 420 40 000 82 800 374 458 1 666 3 602
Toshiba Japan 53 349 54 519 59 761 190 870 165 000 3 103 3 197 –305 672
NEC Japan 48 343 41 762 39 072 154 787 154 000 2 924 2 933 97 104
Fujitsu Japan 48 484 41 180 42 830 188 053 158 491 3 722 2 071 397 589
Hon Hai Precision Chinese Taipei 2 900 28 440 51 828 9 000 382 000 . . 327 . . 892
Apple Inc United States 7 983 19 315 24 006 8 568 17 787 380 712 786 1 989
ASUSTeK Computer Chinese Taipei 2 146 16 485 17 931 . . 9 587 . . 237 475 661
Quanta Computer Chinese Taipei 2 661 14 041 22 262 . . 34 077 . . 153 253 390
Total 325 089 454 611 518 181 996 081 1 515 508 18 214 19 787 15 158 24 588
1 2 http://dx.doi.org/10.1787/476315780205Source: OECD, Information Technology database, compiled from annual reports, SEC filings and market financials.
An
OE
CD
Bro
wo
L e c tur
ylnO dae
R
OECD INFORMATION TECHNOLOGY OUTLOOK 2008 – ISBN 978-92-64-05553-7 – © OECD 2008 61

1. THE IT INDUSTRY: RECENT DEVELOPMENTS AND OUTLOOK
se_it E ditin
es
eu
le
SemiconductorsA number of the larger electronics firms have spun off their semiconductor
manufacturing activities to specialist firms (e.g. Infineon, Freescale Semiconductor and
NXP), making it possible track the performance of specialist semiconductor firms, with
market and investment challenges different from those of the diversified electronics
manufacturers. Nevertheless, a number of the large electronics firms also have substantial
semiconductor operations (e.g. Samsung), but are not specialist semiconductor firms.
Top 10 specialist semiconductor firms earned total revenues of almost USD 110 billion
in 2006, up from around USD 90 billion in 2000. They employed 350 000 people and earned
a combined net profit of USD 13 billion. The largest semiconductor firm, Intel, accounted
for 32% of top 10 revenue and is the only semiconductor firm in the ICT top 50. In 2006,
profit margins were relatively high for semiconductor firms, with a combined margin (i.e.
net income over revenue) of 12%. Some firms enjoyed margins as high as 30% (e.g. Texas
Table 1.A1.3. Top 10 electronics firmsUSD millions in current prices and number employed
Revenue 2000
Revenue 2006
Revenue 2007
Employees 2000
Employees 2006
R&D 2000
R&D 2006
Net income 2000
Net income 2006
Siemens Germany 64 405 97 436 99 108 419 000 371 000 4 425 6 312 6 528 3 823
Hitachi Japan 72 725 81 345 86 059 323 827 390 725 3 930 3 546 154 321
Matsushita (Panasonic) Japan 68 711 76 442 76 488 314 267 328 645 4 881 4 854 874 1 327
Sony Japan 62 046 64 550 69 665 189 700 163 000 3 660 4 675 1 131 1 062
Samsung Electronics Korea 34 573 63 480 67 970 173 000 85 813 1 332 6 004 4 768 8 532
Canon Japan 25 020 35 725 38 055 86 673 120 976 1 805 2 650 1 244 3 913
Philips Electronics Netherlands 34 736 33 889 36 678 219 429 125 834 2 553 2 095 8 786 6 763
Mitsubishi Electric Japan 35 021 30 976 32 379 116 588 99 444 1 615 1 117 230 822
LG Electronics Korea 20 085 24 263 25 286 55 000 31 201 312 1 754 356 223
Sharp Japan 17 210 24 040 26 266 49 748 48 927 1 363 1 596 261 762
Total 434 532 532 146 557 954 1 947 232 1 765 565 25 876 34 602 24 332 27 548
1 2 http://dx.doi.org/10.1787/476317727081Source: OECD, Information Technology database, compiled from annual reports, SEC filings and market financials.
Table 1.A1.4. Top 10 specialist semiconductor firmsUSD millions in current prices and number employed
Revenue 2000
Revenue 2006
Revenue 2007
Employees 2000
Employees 2006
R&D 2000
R&D 2006
Net income 2000
Net income 2006
Intel United States 33 726 35 382 38 334 86 100 90 300 3 897 5 873 10 535 5 044
Texas Instruments United States 11 875 14 225 13 835 42 481 30 986 1 747 2 195 3 058 4 341
Infineon Technologies Germany 8 791 9 961 10 549 29 166 42 500 1 238 1 561 1 359 –335
STMicroelectronics Switzerland 7 813 9 854 10 001 43 650 51 770 1 026 1 667 1 452 782
Taiwan Semiconductor Chinese Taipei 4 968 9 656 9 807 15 888 20 167 215 489 650 2 912
Qimonda Germany . . 7 0261 4 939 . . 12 974 . . 797 . . 136
Freescale Semiconductor United States 7 986 6 363 6 365 24 800 22 700 1 352 1 180 –5 563
NXP Netherlands . . 6 231 6 395 . . 37 468 . . 1 250 . . –768
Advanced Micro Devices United States 4 644 5 649 6 013 14 435 16 500 642 1 621 983 –166
Micron Technology United States 6 362 5 272 5 688 18 800 23 500 427 656 1 504 408
Total 86 165 109 619 111 927 275 320 348 865 10 544 17 289 19 536 12 918
1 2 http://dx.doi.org/10.1787/4763187351541. Qimonda in 2007 restated past revenue figures. After restating, the company reported revenues for 2006 of
EUR 3 815 million (USD 4 786 million).Source: OECD, Information Technology database, compiled from annual reports, SEC filings and market financials.
An
OE
CD
Bro
wo
L e c tur
ylnO dae
R
OECD INFORMATION TECHNOLOGY OUTLOOK 2008 – ISBN 978-92-64-05553-7 – © OECD 200862

1. THE IT INDUSTRY: RECENT DEVELOPMENTS AND OUTLOOK
se_it E ditin
es
eu
le
Instruments and Taiwan Semiconductor), while Infineon, NXP and AMD reported losses.
Average reported market capitalisation of semiconductor firms in the top 250 declined
from USD 35 billion in 2001 to USD 24 billion in late 2007, or by 6% a year, with further falls
in early 2008 as concerns about an economic slowdown lowered expectations. R&D
intensity is high, with combined R&D expenditure of the top 10 semiconductor firms
in 2006 equivalent to almost 16% of revenues. AMD and NXP were the most research-
intensive.
Reported revenue growth since 2000 has been no more than 2% a year, with Taiwan
Semiconductor the only firm in the top 10 to report double-digit growth. However,
semiconductor firms just below the top 10 – ASM Lithography, Broadcom, Advanced
Semiconductor Engineering and PCS (Powerchip Semiconductor) – have enjoyed strong
growth.
IT servicesOnly three of the top 10 IT services firms rank in the ICT top 50 (at 41, 42 and 46).
Nevertheless, a number of the larger IT equipment and systems firms earn a significant
share of their revenue from services. In 2006, software and services accounted for 77% of
IBM’s total revenues, with services revenue of around USD 35 billion, which would put it at
the top of the IT services list.
Revenues of the top 10 specialist IT services firms amounted to USD 118 billion
in 2006, up from USD 88 billion in 2000. They employed some 630 000 people and earned a
combined net profit of USD 5.8 billion. Their revenues increased by almost USD 31 billion
between 2000 and 2006, and total employment grew by around 127 000. However, net
income fell by USD 1.2 billion. Average reported market capitalisation of IT services firms
in the top 250 declined from USD 11 billion in 2001 to USD 9 billion in late 2007, or by 3.4%
a year.
There has been relatively little change at the top of the IT services sector since 2000,
with the takeover of PricewaterhouseCoopers and the reclassification of Ingram Micro and
IAC/Interactive making space for First Data and Atos Origin. SAIC and Atos Origin are the
Table 1.A1.5. Top 10 IT services firmsUSD millions in current prices and number employed
Revenue 2000
Revenue 2006
Revenue 2007
Employees 2000
Employees 2006
R&D2000
R&D2006
Net income 2000
Net income 2006
EDS United States 18 856 21 268 22 134 122 000 131 063 . . . . 1 143 470
Tech Data United States 16 992 20 483 21 440 10 500 8 000 . . . . 128 27
Accenture Bermuda 11 331 18 228 21 453 71 300 140 000 252 298 2 464 973
CSC United States 9 345 14 639 14 857 68 000 79 000 . . . . 403 528
CapGemini Ernst and Young France 6 359 9 625 11 914 59 549 79 981 . . . . 395 366
SAIC United States 4 000 7 775 8 294 40 000 44 100 . . . . 400 927
First Data (Concord EFS) United States 5 922 7 076 8 051 25 380 29 000 . . . . 930 1 513
ADP United States 6 168 6 836 7 800 41 000 36 000 460 472 841 1 554
Atos Origin France 1 756 6 780 7 388 26 916 49 847 . . . . 65 –312
Unisys United States 6 885 5 757 5 653 36 900 31 500 334 231 225 –279
Total 87 613 118 467 128 984 501 545 628 491 1 046 1 001 6 993 5 767
1 2 http://dx.doi.org/10.1787/476342277563
Source: OECD, Information Technology database, compiled from annual reports, SEC filings and market financials.
An
OE
CD
Bro
wo
L e c tur
ylnO dae
R
OECD INFORMATION TECHNOLOGY OUTLOOK 2008 – ISBN 978-92-64-05553-7 – © OECD 2008 63

1. THE IT INDUSTRY: RECENT DEVELOPMENTS AND OUTLOOK
se_it E ditin
es
eu
le
fastest-growing firms in the top 10; only Unisys has experienced declining revenues
since 2000. Top 10 IT services firms are predominantly from the United States, with two
from France. However, developing country-based firms are rapidly catching up, with India’s
Infosys, Wipro and TCS now in the ICT top 250, along with South Africa’s Datatec and
Dimension Data.
SoftwareSoftware firms tend to be smaller than those in other ICT sectors. Only one software
firm ranks in the ICT top 50 (i.e. Microsoft) and there are just nine in the top 250 ICT firms,
so Autodesk is added to make up the software top 10. The top 10 earned a total of more
than USD 90 billion in 2006, employed 268 000 people and spent almost USD 14 billion on
R&D. Microsoft is the clear leader, accounting for almost 50% of total top 10 revenue
in 2006.
Between 2000 and 2006, total top 10 revenues increased by USD 37 billion or more
than 9% a year, employment increased by almost 110 000, and R&D expenditure by
USD 5.7 billion. Net income increased by USD 2.3 billion to more than USD 20 billion.
Average reported market capitalisation of software firms in the top 250 increased from
USD 51 billion in 2001 to USD 59 billion in late 2007, or by 2.5% a year. Software firms’ profit
margins are high, with the top 10 reporting a combined margin of 22.5% during 2006
(i.e. net income over revenue). Microsoft and Oracle enjoyed higher than average margins,
while Symantec reported a margin of just 3.8% and Computer Associates 4.2%. Software
firms are also relatively R&D-intensive, with combined top 10 R&D spending equivalent to
15% of revenues in 2006. Electronic Arts, Adobe Systems and Autodesk were the most R&D-
intensive.
Growth performance has been varied, with some market segments performing well
(e.g. security and virus protection) and others less so. Among the top 10, revenue grew for
all but one between 2000 and 2006. Symantec, Amdocs, Intuit and Verisign showed rapid
growth.
Table 1.A1.6. Top 10 software firmsUSD millions in current prices and number employed
Revenue 2000
Revenue 2006
Revenue 2007
Employees 2000
Employees 2006
R&D 2000
R&D 2006
Net income 2000
Net income 2006
Microsoft United States 22 956 44 282 51 122 47 600 79 000 3 772 6 584 9 421 12 599
Oracle United States 10 231 14 380 17 996 42 927 74 674 1 010 1 872 6 297 3 381
SAP Germany 7 562 11 812 14 021 24 177 39 355 1 170 1 677 743 2 351
Symantec/Veritas United States 746 4 143 5 199 3 800 17 100 108 682 170 157
Computer Associates United States 6 094 3 772 3 943 18 200 14 500 1 110 697 696 159
Electronic Arts United States 1 420 2 951 3 091 3 500 7 900 256 758 117 236
Adobe Systems United States 1 226 2 575 3 158 2 947 6 082 240 540 288 506
Amdocs United States 1 118 2 480 2 836 8 400 16 234 75 187 6 319
Intuit United States 1 037 2 342 2 673 6 000 7 500 166 399 306 417
Autodesk United States 947 1 840 2 172 . . 5 169 185 406 90 290
Total 53 337 90 577 106 211 157 551 267 514 8 092 13 802 18 133 20 415
1 2 http://dx.doi.org/10.1787/476363002435
Source: OECD, Information Technology database, compiled from annual reports, SEC filings and market financials.
An
OE
CD
Bro
wo
L e c tur
ylnO dae
R
OECD INFORMATION TECHNOLOGY OUTLOOK 2008 – ISBN 978-92-64-05553-7 – © OECD 200864

1. THE IT INDUSTRY: RECENT DEVELOPMENTS AND OUTLOOK
se_it E ditin
es
eu
le
InternetThere is no clear definition of an Internet firm, but there are a number of obvious
examples of firms earning their revenue from Internet-based activities without being
members of any of the other ICT firm categories. Some have enjoyed spectacular growth
and are moving up the ICT 250 rankings. The largest by revenue is Amazon, closely
followed by Google, ranking 77th and 78th in the ICT top 250, respectively.
In 2006, the Internet top 10 earned a total of almost USD 58 billion, employed around
100 000 people and had a combined net income of almost USD 9 billion. Between 2000
and 2006, total top 10 revenues increased by more than USD 39 billion, or by 21% a year,
and net income increased by USD 8.3 billion or 77% a year, with the top 10 firms reporting
a combined margin of 15% during 2006 (i.e. net income over revenue). Google, TD
Ameritrade and AOL enjoyed higher than average margins. Growth performance has been
a feature of many of these Internet firms, with Google increasing its revenue from
USD 19 million in 2000 to more than USD 10 600 million in 2006, or by 187% a year. Yahoo!
Japan, Expedia (which is part of IAC/Interactive, but reports separately) and e-bay have also
had strong growth.
Telecommunication servicesThe deregulation of telecommunications and increasing private investment is leading
to the growth and internationalisation of telecommunications firms. What were once
national monopolies are now increasingly globalised, competitive firms. These firms are
often among the largest ICT firms, with no fewer than 74 telecommunications carriers in
the ICT 250 and 15 in the top 50.
In 2006, the top 10 telecommunication services firms earned revenues totalling almost
USD 614 billion, with revenues increasing by USD 240 billion between 2000 and 2006 (or by
8.7% a year). Employment increased by around 166 000 to more than 1.7 million. What,
with hindsight, seem ambitious investments and subsequent restructuring adversely
affected profitability in the early years of the decade, with a top 10 net profit of
USD 36 billion in 2000 becoming a net loss in 2002, led by significant losses by Deutsche
Table 1.A1.7. Top 10 Internet firmsUSD millions in current prices and number employed
Revenue 2000
Revenue 2006
Revenue 2007
Employees 2000
Employees 2006
R&D 2000
R&D2006
Net income 2000
Net income 2006
Amazon United States 3 122 10 711 14 835 7 500 14 400 269 662 –1 411 190
Google United States 19 10 605 16 594 1 000 13 786 11 1 229 –15 3 077
AOL LLC United States 7 605 7 866 5 181 15 000 . . . . . . 1 855 1 923
Yahoo United States 1 110 6 426 6 969 3 259 11 400 111 688 71 751
IAC/Interactive United States 2 918 6 278 6 373 20 780 26 000 . . . . –148 46
e-bay inc United States 749 5 970 7 672 . . 13 200 75 495 90 1 126
E*Trade United States 2 061 3 840 2 223 . . 4 027 . . . . . . 629
Expedia United States 222 2 238 2 665 . . 6 600 . . 121 –78 245
TD AMERITRADE Holding United States 516 2 139 2 632 . . 3 947 . . . . –91 527
Yahoo! Japan Japan 53 1 493 2 225 196 2 534 . . . . 1 49
Total 18 375 57 566 67 369 47 735 95 894 466 3 195 274 8 563
1 2 http://dx.doi.org/10.1787/476365242040Source: OECD, Information Technology database, compiled from annual reports, SEC filings and market financials.
An
OE
CD
Bro
wo
L e c tur
ylnO dae
R
OECD INFORMATION TECHNOLOGY OUTLOOK 2008 – ISBN 978-92-64-05553-7 – © OECD 2008 65

1. THE IT INDUSTRY: RECENT DEVELOPMENTS AND OUTLOOK
se_it E ditin
es
eu
le
Telekom, Vodafone and France Telecom. The subsequent recovery has seen a return to
profitability, with net income in 2006 approaching USD 40 billion, more than USD 3 billion
higher than in 2000. In 2007 top 10 revenues were USD 721 billion.
Changes among the top 10 telecommunications services firms reflect major mergers
and acquisition, including SBC Communications and Bell South merging with AT&T, and
MCI Worldcom’s merger with Verizon, while the ranks of the ICT 250 increasingly feature
telecommunications firms from emerging and developing economies, including China
Mobile, China Telecom, America Movil, Telephonos de Mexico (Telmex), China Unicom,
China Netcom, Saudi Telecommunications, Tele Norte Leste, South Africa’s MTN and
Telkom, Telecomunicacoes de Sao Paulo, the Russian Federation’s Mobile Telesystems,
Chunghwa Telecom, Telekomunikasi Indonesia, VimpelCom and Orascom. Most are
reaping the benefits of serving rapidly growing markets.*
Table 1.A1.8. Top 10 telecommunication services firmsUSD millions in current prices and number employed
Revenue 2000
Revenue 2006
Revenue 2007
Employees 2000
Employees 2006
R&D 2000
R&D 2006
Net income 2000
Net income 2006
NTT Japan 92 679 91 410 91 191 224 000 199 113 3 178 2 651 –603 4 286
Verizon Communications United States 64 707 88 144 93 469 263 552 238 519 . . . . 11 797 6 197
Deutsche Telekom Germany 37 559 77 069 85 580 205 000 248 480 642 643 5 437 4 044
Telefonica SA Spain 27 306 66 459 77 264 145 730 232 996 . . 739 1 693 7 966
France Telecom France 30 894 64 952 72 497 188 866 191 036 412 1 075 4 707 8 714
AT&T United States 46 850 63 055 118 928 304 800 301 840 . . 223 4 669 7 356
Vodafone United Kingdom 11 929 43 750 51 199 29 465 66 000 109 408 838 –9 286
Sprint Nextel United States 17 220 41 028 40 146 64 900 64 600 . . . . 1 964 1 329
Telecom Italia Italy 27 516 40 052 43 399 107 171 83 209 247 167 3 231 1 303
China Mobile Hong Kong, China 15 249 38 083 46 922 38 345 111 998 . . . . 2 978 8 162
Total 371 908 614 001 720 954 1 571 829 1 737 791 4 588 5 906 36 711 40 070
1 2 http://dx.doi.org/10.1787/476375583387Source: OECD, Information Technology database, compiled from annual reports, SEC filings and market financials.
* Detailed analysis of the telecommunication services sector is available in the OECD CommunicationsOutlook 2007 (OECD, 2007a).
An
OE
CD
Bro
wo
L e c tur
ylnO dae
R
OECD INFORMATION TECHNOLOGY OUTLOOK 2008 – ISBN 978-92-64-05553-7 – © OECD 200866

1. THE IT INDUSTRY: RECENT DEVELOPMENTS AND OUTLOOK
DB
ro
wse_it E ditio
n
es
eu
le
ylnO d
ANNEX 1.A2
An
OE
C
L e c tur
aeR
OECD INFORMATION TECHNOLOGY OUTLOOK 2008 – ISBN 978-92-64-05553-7 – © OECD 2008 67

1. THE IT INDUSTRY: RECENT DEVELOPMENTS AND OUTLOOK
se_it E ditin
es
eu
le
Table 1.A2.1. Total ICT spending, 2003-08USD millions in current prices
2003 2004 2005 2006 2007 2008
Australia 32 891 38 499 41 619 45 781 53 825 60 099
Austria 15 145 16 828 17 978 18 748 20 802 22 833
Belgium 18 440 21 303 22 117 23 355 26 201 28 891
Canada 56 410 63 547 70 848 77 657 84 863 92 136
Czech Republic 7 308 8 343 9 516 10 692 12 401 14 503
Denmark 12 502 14 269 14 989 16 345 18 203 19 972
Finland 9 256 10 661 10 562 11 285 12 604 13 777
France 107 073 122 630 127 851 135 526 147 174 159 188
Germany 148 624 169 313 176 329 185 550 205 648 222 860
Greece 11 155 13 573 13 716 14 859 16 917 19 077
Hungary 5 597 6 341 6 752 7 119 8 212 9 108
Iceland . . . . . . . . . . . .
Ireland 9 326 11 339 12 403 13 512 15 279 16 937
Italy 86 996 101 063 103 701 109 674 122 125 132 955
Japan 277 886 304 749 310 019 308 133 313 737 350 470
Korea 47 118 51 018 56 661 62 392 68 517 73 144
Luxembourg . . . . . . . . . . . .
Mexico 24 318 27 195 30 878 36 151 40 910 45 880
Netherlands 35 328 40 671 42 575 46 028 50 534 54 977
New Zealand 5 219 5 976 6 466 6 552 7 760 8 449
Norway 10 696 12 399 14 053 15 150 17 219 19 464
Poland 12 145 14 773 16 594 20 238 25 190 32 081
Portugal 9 405 10 883 10 963 11 532 12 649 13 990
Slovak Republic 2 327 2 746 3 167 3 552 4 515 5 476
Spain 53 292 56 971 62 599 69 457 78 838 88 258
Sweden 20 838 23 567 24 443 26 026 28 918 31 695
Switzerland 25 666 29 101 30 050 31 861 34 069 37 522
Turkey 17 032 21 266 25 849 29 354 36 067 43 907
United Kingdom 133 862 151 811 161 085 169 174 186 873 194 107
United States 829 042 884 063 936 894 988 859 1 030 754 1 061 394
OECD total 2 024 899 2 234 895 2 360 681 2 494 562 2 680 804 2 873 150
World 2 383 312 2 677 348 2 884 260 3 112 670 3 433 397 3 786 380
OECD share 85% 83% 82% 80% 78% 76%
North America 909 770 974 805 1 038 621 1 102 667 1 156 527 1 199 410
Latin America 55 420 70 138 88 320 107 259 129 730 153 122
Western Europe 724 637 827 646 871 265 927 436 1 030 121 1 120 410
Eastern Europe 56 523 71 959 84 820 102 903 127 514 152 398
Asia-Pacific 577 246 661 739 716 174 775 377 877 776 1 032 376
Rest of world 59 717 71 060 85 060 97 028 111 729 128 665
Computer hardware 323 967 369 112 405 586 436 999 465 706 489 886
Computer software 197 959 228 525 252 827 275 174 295 812 311 083
Computer services 522 820 585 452 631 032 674 446 711 678 739 252
Communications 1 338 566 1 494 259 1 594 816 1 726 051 1 960 201 2 246 159
1 2 http://dx.doi.org/10.1787/476428121276. .: no data. Data for 2008 are forecast.Source: OECD, based on data provided by WITSA (2008).
An
OE
CD
Bro
wo
L e c tur
ylnO dae
R
OECD INFORMATION TECHNOLOGY OUTLOOK 2008 – ISBN 978-92-64-05553-7 – © OECD 200868

1. THE IT INDUSTRY: RECENT DEVELOPMENTS AND OUTLOOK
se_it E ditin
es
eu
le
Table 1.A2.2. Emerging economy ICT spending by segment, 2003-08USD millions in current prices
2003 2004 2005 2006 2007 2008
IT HARDWARE
China 15 365 18 605 22 023 25 027 29 355 33 014
Hong Kong, China 1 538 1 669 1 749 1 947 2 005 2 099
Chinese Taipei 2 351 2 612 2 770 2 911 3 032 3 160
India 3 955 5 189 6 334 7 760 9 273 10 460
Russian Federation 3 354 4 467 5 552 6 497 7 317 8 092
Brazil 4 393 5 319 6 629 7 770 8 531 9 231
South Africa 1 453 1 920 2 268 2 566 2 754 2 999
SOFTWARE
China 3 339 5 542 7 878 9 937 12 315 14 376
Hong Kong, China 321 355 380 430 444 463
Chinese Taipei 733 839 912 981 1 029 1 072
India 797 1 066 1 351 1 664 1 988 2 239
Russian Federation 1 122 1 520 1 905 2 306 2 701 3 063
Brazil 1 186 1 436 1 776 2 089 2 300 2 510
South Africa 814 1 124 1 368 1 643 1 843 2 084
IT SERVICES
China 5 481 9 814 13 657 17 266 21 347 24 783
Hong Kong, China 690 757 790 891 912 945
Chinese Taipei 1 350 1 527 1 605 1 706 1 777 1 833
India 3 160 3 777 4 328 5 065 5 855 6 391
Russian Federation 1 419 2 102 2 725 3 387 4 034 4 634
Brazil 3 151 3 988 5 111 6 120 6 826 7 554
South Africa 1 498 2 135 2 626 3 210 3 601 4 105
COMMUNICATIONS
China 97 058 116 149 128 901 153 606 191 337 255 022
Hong Kong, China 5 751 5 869 5 830 6 249 6 435 7 009
Chinese Taipei 13 221 14 582 14 886 14 860 15 542 17 063
India 14 882 21 976 30 301 32 648 48 531 65 514
Russian Federation 14 189 19 648 23 568 29 934 39 094 47 690
Brazil 23 117 29 689 38 846 46 001 58 289 73 695
South Africa 9 862 12 309 16 650 17 666 19 252 21 457
TOTAL ICT
China 121 243 150 110 172 459 205 836 254 353 327 194
Hong Kong, China 8 300 8 650 8 750 9 516 9 796 10 516
Chinese Taipei 17 655 19 560 20 174 20 457 21 380 23 128
India 22 795 32 008 42 314 47 138 65 648 84 604
Russian Federation 20 083 27 736 33 749 42 124 53 146 63 478
Brazil 31 847 40 432 52 362 61 980 75 946 92 990
South Africa 13 628 17 487 22 911 25 085 27 450 30 644
1 2 http://dx.doi.org/10.1787/476441412053Notes: Data for 2008 are forecast.Source: OECD, based on data provided by WITSA (2008).
An
OE
CD
Bro
wo
L e c tur
ylnO dae
R
OECD INFORMATION TECHNOLOGY OUTLOOK 2008 – ISBN 978-92-64-05553-7 – © OECD 2008 69

se_it E ditin
es
eu
le
An
OE
CD
Bro
wo
L e c tur
ylnO dae
R

ISBN 978-92-64-05553-7OECD Information Technology Outlook 2008
© OECD 2008
DB
ro
wse_it E ditio
n
es
eu
le
ylnO d
Chapter 2
Globalisation of the ICT Sector
Global restructuring of ICT production continued in 2007 and 2008, with Asia,
Eastern Europe, Mexico and some new locations becoming increasingly importantas producers and growth markets. Global ICT trade has expanded strongly and wasalmost USD 1.5 trillion higher in 2007 than the peak of 2000. ICT trade slowedin 2007 and the first half of 2008 as world economic conditions weakened.
Nevertheless, ICT trade continued to increase, due to the resilience of some OECDICT imports and strong demand from some emerging markets. An importantquestion is whether the demand for new ICT products, coupled with growth inemerging economies (in Asia but also in other countries) will compensate for the
very sharp downturn in OECD countries. ICT-related FDI increased to historicallyhigh levels in 2007 with non-OECD economies increasingly active, notably in ICTmergers and acquisitions, but with a marked slowdown in global merger andacquisition activity and FDI flows in 2008 as the OECD area went into recession.
An
OE
C
L e c tur
aeR
71

2. GLOBALISATION OF THE ICT SECTOR
DB
ro
wse_it E ditio
n
es
eu
le
ylnO d
IntroductionThis chapter examines recent trends in ICT trade and the globalisation of the ICT
sector to analyse characteristics of the current round of globalisation. It discusses the
continuing global restructuring of ICT production activities. This is apparent in the
continuing emergence of Eastern European and non-member developing economies as
both producers and new growth markets. It is also apparent in the worldwide reorganisation of
both ICT manufacturing and IT and IT-enabled services production as global firms seek
new low-cost production centres, particularly for labour-intensive assembly and service
activities. Intra-regional production networks outside of the OECD area are emerging,
particularly in Asia, sometimes with increasing trade linkages to new markets in Latin
America, India and other non-OECD countries.
Global trade in information technology products1
Global ICT trade (the sum of exports and imports) expanded strongly in recent years to
more than USD 3.5 trillion in 2006 and USD 3.7 trillion in 2007 (up from about USD 1 trillion
in 1996 and an intermediate peak of USD 2.2 trillion in 2000) (Figure 2.1 and Annex
Table 2.A1.1; 2007 ICT data are not directly comparable with earlier years). Recent strong
commodity prices and falling ICT hardware prices tend to disguise the extent and
significance of the recovery in ICT trade, which has been stronger in volume than value
terms. However, currency fluctuations and the weakening of the USD against all key
currencies affect all international trade data as these are expressed in USD (see Box 2.1).
The share of OECD ICT trade in total world ICT trade decreased steadily from 88%
in 1996 to 56% in 2006 and 52% in 2007. The share of OECD ICT goods trade in total OECD
merchandise trade went from 13% in 1996 to 16.5% in 2000 to 12.4% in 2006 and the share
ICT goods trade in total OECD manufactured goods trade was 15.7% in 2006, down from a
high of 20.1% in 2000, due in part to the relative slow-down in ICT goods exports compared
with imports (see Annex Table 2.A1.1 for details). From 2002 OECD ICT goods trade grew by
an average of 11.5% a year to close to USD 2 trillion in 2006 (a rise of more than 10% from a
year earlier), far above the level in 2000 (USD 1.5 trillion). The share of communication
equipment in total OECD ICT trade increased steadily to 19% in 2006. While the shares of
audio and video equipment (14% in 2006) and of other ICT-related goods (11% in 2006) have
increased, the shares of computer and related equipment (30%) and electronic components
(14%) have decreased.
OECD exports of ICT goods reached a new peak of USD 932 billion in 2006 (including
intra-OECD exports) (see Annex Table 2.A1.2).2 OECD ICT goods imports exhibit similar
trends and reached a new peak of USD 1 050 billion in 2006, driven by growth in audio,
video and other ICT-related equipment. The OECD trade deficit in ICT goods jumped from
USD 11 billion in 1996 to USD 116 billion in 2006 (see Annex Table 2.A1.3).
An
OE
C
L e c tur
aeR
OECD INFORMATION TECHNOLOGY OUTLOOK 2008 – ISBN 978-92-64-05553-7 – © OECD 200872

2. GLOBALISATION OF THE ICT SECTOR
se_it E ditin
es
eu
le
ICT trade in 2007 and 2008 outlook
Total world goods and services trade volumes slowed to 7.1% in 2007, close to the
average rate of trade expansion over the last decade, but down from 9.5% in 2006, as
weaker demand in developed countries outweighed higher growth in imports in some
developing countries (OECD, 2008a; WTO, 2008a, b). In parallel, growth in ICT trade slowed
in 2007 and the first half of 2008, after four years of strong expansion. Rapidly weakening
economic conditions in leading OECD countries, falling demand in key markets, such as
the United States and Europe, and tightening monetary policies in Asia are affecting ICT
trade; and November 2008 reports suggest declines. However, the effects are not uniform
and the exports of some countries continued to grow, mainly boosted by the resilience of
some OECD ICT trade and strong demand from emerging markets. Unfortunately, the
magnitude of the slowdown since the end of 2006 is hard to quantify owing to a lack of
detailed international data. Values of OECD ICT goods trade in 2007 cannot be directly
compared with earlier years owing to: the new Harmonized System (HS) classification
adopted in 2007,3 currency fluctuations due to the rapid decline in the USD (see Box 2.1),
and downward corrections in 2007 due to VAT fraud (see Box 2.2).
Taking these factors into account, aggregate OECD ICT goods trade grew less rapidly
in 2007 than in 2006. A country-by-country analysis based on these data shows strong USD
growth in 2007 for total ICT goods trade for Eastern Europe (e.g. Slovak Republic, 68% year-
on-year growth; Czech Republic, 32%); Norway, 16%; Austria, 10%; Australia, New Zealand
and Korea, around 9%; Finland, 8%, and Switzerland, 7%, although all of these USD data are
heavily influenced by exchange rate movements and particularly the drop in the USD vis-
à-vis most currencies in 2007, which detailed analysis of data in national currencies would
help clarify. In Turkey, Canada and Sweden growth was more moderate at 2-3%. Most OECD
countries with stagnating or falling ICT trade are EU countries, but this may be due in part
to VAT corrections (the United Kingdom, but also Germany and France). However, the
Figure 2.1. World trade in ICT goods, 1996-2007USD billions in current prices
1 2 http://dx.doi.org/10.1787/473254016535Note: No data for the Slovak Republic prior to 1997. Partly estimated for non-OECD 2007. ICT data for 2007 are notdirectly comparable with previous years.
Source: OECD-UNSD ITCS and the UN COMTRADE database, November 2008.
1996 1997 1998 1999 2000 2001 2002 2003 2004 2005 2006 2007
3 500
4 000
3 000
2 500
2 000
1 500
1 000
500
0
OECD audio and video equipmentOECD communications equipment
OECD other ICT-related goodsOECD IT and related equipment
Non-OECD ICT goodsOECD electronic components
OECD
An
OE
CD
Bro
wo
L e c tur
ylnO dae
R
OECD INFORMATION TECHNOLOGY OUTLOOK 2008 – ISBN 978-92-64-05553-7 – © OECD 2008 73

2. GLOBALISATION OF THE ICT SECTOR
se_it E ditin
es
eu
le
United States, Japan and Mexico also displayed slowdowns. The most prominent non-
OECD traders have increasing ICT trade, although growth is slower than in previous years:
China (16%), Hong Kong, China (10%), Thailand (7%) and Malaysia (2%); Singapore is an
exception. However, as noted, direct detailed comparisons between 2006 and 2007 are not
possible owing to classification issues.
National quarterly trade data on ICT goods such as office machinery, electronic
components or semiconductors shed light on recent ICT trade performance. These data
(current value) show that ICT trade continued to grow in most countries throughout 2007,
albeit on a sometimes rapidly slowing path. During the first two quarters of 2008, ICT trade
Box 2.1. Depreciation of the US dollar against leading currencies: Impacts on ICT trade data
In recent years the USD depreciated against most currencies (Table 2.1), and by over 25%against key currencies since 2001: 26% against the Korea won and around 15% against theIndian, Chinese and Japanese currencies. From July 2008 the USD started to appreciateagain against key currencies. Given that all international trade data are expressed in USD,these fluctuations affect the analysis of trade flows, as exchange rate (price) effects arehard to dissociate from volume (quantity) effects.
In terms of ICT trade analysis, appreciation against the USD inflates the total reportedexport and import value and growth of non-USD countries to the extent that their productsare initially priced in their national currencies and their trade values are subsequently
converted into USD. This leads USD trade values to exaggerate actual exports and importsin the short term for strong currency exporters and imports from countries with strongcurrencies. In terms of impacts over time, ICT exporters in the United States and countrieswhich have appreciated less against the USD will find their ICT export products morecompetitive and may increase sales abroad. In turn, when their currency appreciates, non-US ICT exporters will find it harder to export to the United States than countries whichhave appreciated less, etc. However ICT exports are often priced in USD and do not changegreatly with changes in the exchange rate; in this case USD fluctuations have a lessimmediate impact and will partly reflect export volumes rather than currency movements.
Table 2.1. Currency exchange rates, national units per USD, percentage changes compared to 2001
%
2002 2003 2004 2005 2006 2007 1st Q 2008
Australia –4.86 –20.35 –29.77 –32.17 –31.39 –38.24 –42.91
Euro area –4.98 –20.73 –27.92 –27.94 –28.65 –34.58 –40.22
Canada 1.40 –9.56 –15.97 –21.74 –26.74 –30.62 –35.10
United Kingdom –4.00 –11.81 –21.39 –20.77 –21.73 –28.02 –27.18
Brazil 24.29 30.98 24.49 3.61 –7.42 –17.13 –26.13
Korea –3.05 –7.71 –11.25 –20.63 –26.24 –27.97 –25.88
Russian Federation 7.47 5.22 –1.22 –3.03 –6.78 –12.30 –16.81
India 3.02 –1.28 –3.96 –6.54 –3.98 –12.37 –15.61
China 0.00 0.00 0.00 –1.00 –3.67 –8.09 –13.46
Japan 3.10 –4.57 –10.98 –9.37 –4.22 –3.07 –13.37
South Africa 22.44 –12.13 –24.97 –26.13 –21.35 –18.16 –12.31
Source: OECD calculations based on OECD Main Economic Indicators.
An
OE
CD
Bro
wo
L e c tur
ylnO dae
R
OECD INFORMATION TECHNOLOGY OUTLOOK 2008 – ISBN 978-92-64-05553-7 – © OECD 200874

2. GLOBALISATION OF THE ICT SECTOR
se_it E ditin
es
eu
le
seems to have held up reasonably well, with ICT exports increasing more slowly than
in 2007 in most countries, in line with slowing demand. US ICT imports were mostly
falling, probably because of the weakening USD, but given the rise of other markets the
overall effect was not pronounced. In Asia growth in ICT exports was slowing or negative
owing to faltering global demand for ICT goods and strengthening currencies, as these
affect the production of multinational ICT firms and purchases of components. In
particular, semiconductor trade – a lead indicator for production and trade in ICT goods –
has grown less strongly in most countries.
Turning to national data, in the United States from 2006 to 2007, growth of ICT trade4
slowed from 8.9 to 2.9%, with import growth falling faster (from 7.9 to 3.8%) than ICT export
growth (from 5.6 to 2.8%), following a trend since 2004. Export growth peaked in 2006
before slowing again in 2007 (Figure 2.2). In the first quarter of 2008, ICT exports recovered
slightly (4.5% year-on-year growth), with telecommunications equipment (15% year-to-
date growth) and computers (12%) growing strongly.5 US semiconductor exports slowed to
4% year-on-year growth from the previous year; the United States also saw a fall in exports
of stereo equipment and computer accessories. At the same time, US ICT imports have
dropped, improving the US ICT trade balance. Declines in US imports have been strongest
in business machines and equipment, computer accessories, and stereo equipment. In
early 2008, US imports of TVs, VCRs and telecommunications equipment increased.
In 2007, Germany experienced a fall in the value of IT hardware exports (–2.2%) and
imports (–7.8%), a very pronounced fall in telecommunication equipment exports (–31%)
and imports (–34%) but an increase in exports of consumer electronics (TVs, video, digital
cameras, etc.) (12%) and imports (6%).6 In the first quarter of 2008, there were also declines
in IT hardware exports (–2%) and imports (–7%), and in telecommunications equipment
exports (–31%) and imports (–34%). However, in consumer electronics growth continues,
albeit more slowly, for both exports (+1%) and imports (+3.3%). A large share of German
exports is for the European market.
Figure 2.2. United States ICT goods trade growth, March 2001-March 2008Year-on-year percentage change, trade values, seasonally adjusted, 4-month moving average
1 2 http://dx.doi.org/10.1787/473278666884
Source: OECD, based on US Department of Commerce, July 2008.
20
10
0
-10
-20
-30
% US ICT goods exports US ICT goods imports
Mar.
01
July
01
Nov
. 01
Mar.
02
July
02
Nov
. 02
Mar.
03
July
03
Nov
. 03
Mar.
04
July
04
Nov
. 04
Mar.
05
July
05
Nov
. 05
Mar.
06
July
06
Nov
. 06
Mar.
07
July
07
Nov
. 07
Mar.
08
An
OE
CD
Bro
wo
L e c tur
ylnO dae
R
OECD INFORMATION TECHNOLOGY OUTLOOK 2008 – ISBN 978-92-64-05553-7 – © OECD 2008 75

2. GLOBALISATION OF THE ICT SECTOR
se_it E ditin
es
eu
le
In Japan office machinery exports grew from 2006 to 2007, mostly owing to strong
Asian demand (by 6.7% in 2007 compared to 6% in 2006) despite strongly slowing ICT
exports to the United States (down from growth of 7.4% in 2006 to 1% in 2007). However,
Japanese ICT and electronics exports in the first five months of 2008 fell by 6.7% from 2007,
possibly due to currency appreciation, and office machinery exports have fallen by 9%
from 2007).7 Whereas exports of consumer electronics and telecommunications
equipment increased, exports of computer and related equipment, electronic components
and integrated circuits fell. Overall Japanese exports have fallen for the first time in four
years in 2008, with exports to the United States falling most strongly.
Between 2006 and 2007 Korean ICT exports continued to rise at double-digit rates. In
order of absolute volume, electronic components were up by 12% (compared to 37%
from 2005 to 2006, mainly owing to slower growth in semiconductors); mobile phones up
by 13% (compared to stagnant growth from 2005 to 2006); screens and data displays up by
36% (compared to –10% from 2005 to 2006); and computer exports increased (by 10%).8
Exports of household electronic articles fell by 8% (mainly owing to falling exports of colour
TVs) and computer parts by 7%. Korean ICT goods exports are reported to have climbed by
about 15% year on year in the first half of 2008, fuelled by greater overseas demand for
mobile phones and display panels, although semiconductor exports seem to have
contracted by 7%, while ICT imports have grown by 17%. Exports to China, other Asian
economies, the EU and the United States have gained compared to the first half of 2007
while exports to Japan fell.
Australia’s exports of office machines and data processing machines grew by 11%
from 2006 to 2007, on a faster path than in 2006 (–0.5%). However, in the first five months
of 2008, exports of office machines and data processing machines stagnated. For the same
period, telecommunications equipment exports have grown by 8% (after a 14% fall in 2007).
Although growth of Chinese ICT exports and imports is slowing rapidly, both continue
at very high levels (Figure 2.3). Quarterly data for Chinese exports of office equipment,
Figure 2.3. China ICT goods export trade growth, April 2000-April 2008Year-on-year percentage change, trade values, 4-month moving average
1 2 http://dx.doi.org/10.1787/473284550361
Source: Chinese customs data, SITC codes: Chinese Office machinery and Telecom and Sound Recording equipment,July 2008.
70
60
50
40
30
20
10
0
% China total exports China ICT goods exports
Apr.
00
Aug
. 00
Dec
. 00
Apr.
01
Aug
. 01
Dec
. 01
Apr.
02
Aug
. 02
Dec
. 02
Apr.
03
Aug
. 03
Dec
. 03
Apr.
04
Aug
. 04
Dec
. 04
Apr.
05
Aug
. 05
Dec
. 05
Apr.
06
Aug
. 06
Dec
. 06
Apr.
07
Apr.
08
Aug
. 07
Dec
. 07
An
OE
CD
Bro
wo
L e c tur
ylnO dae
R
OECD INFORMATION TECHNOLOGY OUTLOOK 2008 – ISBN 978-92-64-05553-7 – © OECD 200876

2. GLOBALISATION OF THE ICT SECTOR
681525
00
50
00
50
00
50
00
0
se_it E ditin
es
eu
le
computers and telecommunication equipment show a rapid increase. However, the
quarterly growth of ICT exports peaked in early 2004 at a very high year-on-year rate but it
has since slowed markedly. Up until the first quarter of 2007, Chinese ICT exports grew
more rapidly than total Chinese manufacturing exports, but total Chinese manufacturing
exports were growing faster in mid-2008.
In June 2008 Chinese Taipei’s year-on-year growth in ICT exports (IT and communication
products) stood at 12%, mainly owing to rising sales of computer components and flat-
panel screens.9 However, growth slowed and was falling most strongly for ICT exports to
the United States. Shipments to China and Hong Kong, China (usually parts which are then
re-exported as finished products) but also to Europe have so far served as a buffer.
In the first half of 2008, Malaysia also reported decelerating growth in exports of
electrical and electronics products (mainly due to falls in integrated circuit exports and in
exports to the United States, its largest market).10 Singapore’s electronic shipments have
declined each month since February 2007, mainly due to weaker exports of integrated
circuits, computer parts and telecommunications equipment (a drop in exports of 15% in
June 2008, as compared to the previous year).11 Exports have decreased most to the United
States and Europe and less to Japan, but exports to China and Hong Kong, China have also
started to slow (12% decline year on year in June 2008, although still growing). ICT goods
exports to Malaysia and Korea continue to grow.
Leading ICT goods exporters and importers
Since 2004, China has been the world’s largest exporter of ICT goods. Exports
increased by 30% a year since 1996 to almost USD 360 billion in 2007 and in 2007 eclipsed
the combined exports of the EU15 and the United States (USD 341 billion) (Figure 2.4).
Figure 2.4. Top importers and exporters of ICT goods, 1996-2007 USD billions in current prices
1 2 http://dx.doi.org/10.1787/4733084461 2 http://dx.doi.org/10.1787/473322306
Note: Data for the EU15 exclude intra-EU trade.
Source: Joint OECD-UNSD ITCS and the UN COMTRADE database, June 2008.
400
300
350
250
200
150
100
50
0
4
3
3
2
2
1
1
5
01996 1997 1998 1999 2000 2001 2002 2003 2004 2005 2006 2007 1996 1997 1998 1999 2000 2001 2002 2003 2004 2005 2006 2007
Imports of ICT goods Exports of ICT goods
United States EU15 China Japan Korea
An
OE
CD
Bro
wo
L e c tur
ylnO dae
R
OECD INFORMATION TECHNOLOGY OUTLOOK 2008 – ISBN 978-92-64-05553-7 – © OECD 2008 77

2. GLOBALISATION OF THE ICT SECTOR
se_it E ditin
es
eu
le
China’s trade surplus exceeds USD 100 billion (see Chapter 3, OECD Information Technology
Outlook 2006). China’s ICT trade continues to be geared towards ICT product assembly:
computers and related equipment, worth almost USD 126 billion, accounted for 42% of
China’s total ICT goods exports in 2006, and is the fastest-growing export category. Because
of China’s assembly operations, electronic components is the largest category of ICT goods
imports (USD 158 billion in 2006, up from less than USD 7.4 billion in 1996, or by 36% a year.
Electronic components accounted for no less than 70% of all ICT goods imported into China
in 2006, resulting in a trade deficit in components of USD 92 billion as compared to trade
surpluses in all categories of assembled ICT equipment. A shift in production from Chinese
Taipei and Hong Kong, China, to mainland China has further inflated Chinese export
figures.
After China, the largest exporters of ICT goods in 2007 were the EU15 (USD 176 billion), the
United States (USD 165 billion), Hong Kong, China (USD 148 billion), Japan (USD 112 billion),
Singapore (USD 108 billion), and Germany (USD 105 billion) (Figure 2.5a and Annex
Table 2.A1.4). The role of Hong Kong, China and Singapore can mainly be attributed to
re-exports, particularly of electronic parts and components from other Asian countries.
The fastest export growth among OECD countries over the decade to 2006 was in
Hungary (40% a year), the Slovak Republic (38%), the Czech Republic (31%), and Poland
(25%). ICT exports from Korea grew at an average of 10% from 1996 to USD 88 billion
in 2006. Available data for 2007 show that many OECD countries had strong growth of ICT
exports in 2006: mainly in the Asian region (New Zealand. 12%; Australia, 10%; Korea, 10%)
but also in Europe (Norway, 24%; Austria, 13%; Switzerland, 12%).12
In 2007, the largest importers of ICT goods were the United States (USD 273 billion),
EU15 (USD 263 billion), China (USD 255 billion), Hong Kong, China (USD 154 billion),
Germany (USD 106 billion), Singapore (USD 81 billion), and Japan (USD 76 billion)
Figure 2.5a. ICT goods exports, 2007USD billions
1 2 http://dx.doi.org/10.1787/473336776138Note: Data for the EU15 exclude intra-EU trade. Countries for which only 2006 data are available are marked by *.
Source: Joint OECD-UNSD ITCS database, October 2008.
350
400
300
250
200
150
9
8
7
6
5
4
3
2
1
0
100
50
0
China
EU15
United
States
Hong K
ong,
China
Japa
n
Singap
ore
German
yKor
ea
Chines
e Taip
ei
Malays
ia
Netherl
ands
Mexico
United
Kingdo
m
Thaila
nd
Franc
e
Irelan
d
Hunga
ry
Canad
a
Czech
Rep
ublic
Sweden Ita
ly
Finlan
d
Philipp
ines
Belgium
Austri
a
Slovak
Rep
.
Poland
Spain
Denmark
Switzerl
and
Indon
esia
Portug
alBraz
ilIsr
ael
Norway
Austra
lia
Costa
Rica*
Vietnam
*Ind
ia
Russia
n Fed
.Malt
a
Roman
ia
Luxe
mbour
g
South
Africa
Turke
y
An
OE
CD
Bro
wo
L e c tur
ylnO dae
R
OECD INFORMATION TECHNOLOGY OUTLOOK 2008 – ISBN 978-92-64-05553-7 – © OECD 200878

2. GLOBALISATION OF THE ICT SECTOR
se_it E ditin
es
eu
le
(Figure 2.5b and Annex Table 2.A1.4). In part, OECD imports of ICT goods are the result of
OECD exports of high-value added electronic components (semiconductors) to Asia, which
are then assembled in notebooks, PCs, communication products and imported as final
products.
The EU15 and the United States have a steadily growing ICT trade deficit (from
USD –50 billion in 2003 to USD –87 billion in 2007 for the EU15, and from USD –63 billion
in 2003 to USD –109 billion in 2007 for the United States). Australia (USD –15 billion) and
Canada (USD –17 billion) also had very large deficits. Spain, Canada, Italy, Australia and
France all had deficits in excess of USD 10 billion, as did India, the Russian Federation,
Brazil, and South Africa. However, Korea, Japan, China, Hong Kong (China) and Singapore
have growing surpluses and nine OECD countries had a surplus in ICT goods in 2006, most
notably Japan (USD 46 billion) and Korea (USD 38 billion).
ICT exports of OECD accession countries and the BRICS economies
The five OECD accession countries (Chile, Estonia, Israel, the Russian Federation and
Slovenia) are not particularly prominent in world ICT goods trade, with combined trade
(the sum of imports and exports) of less than USD 34 billion in 2006, a level similar to
Ireland’s and less than 6% of OECD ICT goods trade (see Annex Table 2.A1.5). Taken
together, these countries have a deficit in all categories of ICT goods. At USD 25 billion
in 2006 their imports were almost three times their exports (USD 8.6 billion), and exports
have declined by almost 3% a year since 2000. Communication equipment accounted for
45% of combined exports in 2006, and components for 20%; communication equipment is
also the largest category of ICT goods imports, accounting for 35% in 2006.
Israel is the largest exporter of ICT goods among accession countries at USD 5 billion
in 2006, accounting for almost 60% of combined exports, more than half of which in
communication equipment. However, Israel’s exports of communication equipment have
Figure 2.5b. ICT goods imports, 2007USD billions
1 2 http://dx.doi.org/10.1787/473350057612Note: Data for the EU15 exclude intra-EU trade. Countries for which only 2006 data are available are marked by *.
Source: Joint OECD-UNSD ITCS database, October 2008.
300
250
200
150
9
8
7
6
5
4
3
2
1
0
100
50
0
United
States
EU15
China
Hong K
ong,
China
German
y
Singap
oreJa
pan
United
Kingdo
m
Netherl
ands
Korea
Malays
ia
Chines
e Taip
ei
Franc
e
Mexico
Canad
aSpa
inIta
ly
Thaila
nd
Hunga
ry
Russia
n Fed
eratio
n
Czech
Rep
ublic
Austra
liaInd
ia
Belgium
Irelan
d
Sweden
Brazil
Poland
Philipp
ines
Austri
a
Finlan
d
Switzerl
and
Denmark
Slovak
Rep
.
South
Africa
Saudi
Arabia
Norway
Portug
al
Turke
yIsr
ael
Roman
ia
Argen
tina
Greece
Indon
esia
Colombia
Vietnam
*Chil
e*
New Zea
land
Costa
Rica*
Pakist
an
Morocc
o
Bulgari
a
Croati
aAn
OE
CD
Bro
wo
L e c tur
ylnO dae
R
OECD INFORMATION TECHNOLOGY OUTLOOK 2008 – ISBN 978-92-64-05553-7 – © OECD 2008 79

2. GLOBALISATION OF THE ICT SECTOR
se_it E ditin
es
eu
le
declined by 7% a year since 2000, as have its total ICT goods exports. The Russian
Federation is the largest and fastest-growing importer of ICT equipment among these
countries, owing to significant imports of communication equipment and rapidly
increasing imports of audio and video equipment. Its ICT goods imports have increased by
around 40% a year since 2000 to almost USD 14 billion in 2006.
The major emerging economies, or BRICS (i.e. Brazil, the Russian Federation, India, China
and South Africa), are increasingly important as both producers and new growth markets for
ICT goods and services. ICT goods exports from the BRICS economies have increased by almost
35% a year from USD 51 billion in 2000 to almost USD 307 billion in 2006 (equivalent to 33% of
OECD exports), while imports have increased by 26% a year from USD 69 billion to
USD 276 billion (equivalent to 25% of OECD imports) (see Annex Table 2.A1.6).
Since 1997, Brazil has increased its exports of ICT goods by 16% a year, faster than
imports (5% a year) owing to strong growth in exports of communication equipment. In
spite of a substantial trade surplus in communication equipment, Brazil had a trade deficit
in ICT goods of almost USD 9 billion in 2006. Conversely, imports of ICT goods into the
Russian Federation and India are growing more than three times faster than exports in
both. Over the decade to 2006, communication equipment imports into India increased by
43% a year from USD 171 million to more than USD 6.2 billion. South Africa’s ICT goods
exports and imports have both risen by around 10% a year over the period, with slightly
stronger growth in exports. With deficits on trade in all categories of ICT equipment
in 2006, the Russian Federation’s ICT goods deficit was more than USD 12.3 billion, India’s
more than USD 13 billion and South Africa’s USD 6.8 billion.
Indonesia (an OECD enhanced engagement country) has a substantial and growing
trade surplus in ICT equipment. It exported almost USD 7 billion of ICT equipment in 2006,
an increase of more than 9% a year from USD 3.3 billion in 1996 (see Annex Table 2.A1.6).
Computers and audio and video equipment are the main contributors, with exports of each
worth around USD 2.3 billion in 2006. Electronic components were the other major
category of exports at USD 1.6 billion. Communication equipment accounted for almost
half of ICT equipment imports worth a total of USD 2.4 billion in 2006.
Direction of ICT trade
The direction and composition of trade in ICT goods shows a good deal about the
changing patterns of global production, with rapid growth of non-member and, to a lesser
extent, Eastern European countries as both markets and producers. Import trends in
particular reveal a shift of manufacturing activity towards non-member economies,
especially in Asia.
ICT goods imports into OECD countries increased by 7.4% a year between 1996 and 2006,
with growth of imports much stronger from non-member economies (12% a year) than from
OECD countries (4.7% a year) (Figure 2.6 and Annex Tables 2.A1.7 and 2.A1.8).
There is also a shift in manufacturing and related export activities within the OECD,
which is apparent if Mexico and Eastern European members (the Czech Republic, Hungary,
Poland, the Slovak Republic and Turkey) are separated out. Between 1998 and 2006, overall
OECD ICT goods trade increased by 7.2% a year, while that of Mexico and the Eastern
European members increased by 13.7% (Figure 2.6). In 2006, components accounted for 12%
of ICT goods exports and 44% of imports for Mexico and the Eastern European members,
compared with 31% of exports and 21% of imports of the other OECD countries. Conversely,
An
OE
CD
Bro
wo
L e c tur
ylnO dae
R
OECD INFORMATION TECHNOLOGY OUTLOOK 2008 – ISBN 978-92-64-05553-7 – © OECD 200880

2. GLOBALISATION OF THE ICT SECTOR
se_it E ditin
es
eu
le
audio and video equipment accounted for 36% of ICT goods exports and 10% of imports for
Mexico and the Eastern European members, compared with just 9% of exports and 16% of
imports for the other member countries.
Mexico and the Eastern European members had a trade surplus in most categories of
assembled ICT equipment in 2006, but a combined trade deficit in components in excess of
USD 32 billion. In contrast, the other OECD countries recorded a combined trade deficit in
assembled audio and video and computer equipment, with a trade surplus in components
in excess of USD 60 billion. These figures reflect a shift of ICT equipment assembly
activities to Mexico and Eastern Europe which, while less pronounced, is similar in nature
to what is occurring in China and elsewhere in Asia.
OECD trade in ICT subsectorsOECD trade flows are dominated by computer and related equipment, electronic
components and communication equipment (in that order). Yet, apart from OECD trade in
ICT services, which is discussed later, it is audio and video equipment and software trade
which have grown fastest.
Computer and related equipment
Computer equipment is the largest segment of OECD ICT goods trade, accounting for
around 30% of the total. In addition to the traditional producers, Korea and Ireland have
become major producers, and Mexico and Eastern Europe have also emerged as significant
producers in recent years (Figure 2.7). In 2006, OECD exports reached USD 239 billion,
exceeding the previous peak in 2000 (Annex Table 2.A1.9). The largest exporters were the
United States (USD 46 billion), the Netherlands (USD 37 billion), Germany (USD 29 billion),
Japan (USD 22 billion), and the United Kingdom (USD 19 billion). However, at almost
USD 126 billion, China’s exports of computer equipment were almost three times those of
Figure 2.6. Direction of OECD ICT goods trade, 1996-2006USD current prices, indexed 1996 = 100
1 2 http://dx.doi.org/10.1787/473362213212Notes: No data for the Slovak Republic prior to 1997.
Source: Joint OECD-UNSD ITCS and the UN COMTRADE database.
350
300
250
200
150
1001996 1997 1998 1999 2000 2001 2002 2003 2004 2005 2006
Imports from OECD Imports from non-OECD
Exports to OECD Exports to non-OECD
An
OE
CD
Bro
wo
L e c tur
ylnO dae
R
OECD INFORMATION TECHNOLOGY OUTLOOK 2008 – ISBN 978-92-64-05553-7 – © OECD 2008 81

2. GLOBALISATION OF THE ICT SECTOR
se_it E ditin
es
eu
le
the United States. Over the last decade, exports from Hungary, the Slovak Republic, the
Czech Republic and Portugal have increased by 30% a year or more.
OECD imports of computer equipment also reached a new peak of USD 357 billion
in 2006, with the United States (USD 101 billion), Germany (USD 39 billion), the Netherlands
(USD 39 billion), the United Kingdom (USD 27 billion) and Japan (USD 25 billion) among the
largest importers (Figure 2.7). Where both imports and exports of a particular category of
equipment are relatively large (e.g. the Netherlands) a substantial element of that trade
may be transhipment (i.e. re-exports).
Korea enjoyed the OECD’s largest trade surplus in computer equipment in 2006, at
USD 9.6 billion. Other countries with significant surpluses included Ireland (USD 4.5 billion),
the Czech Republic (USD 1.4 billion), Hungary (USD 1.2 billion) and Mexico (USD 787 million).
The Slovak Republic was the only other OECD country with a surplus. None approached the
USD 87.5 billion surplus enjoyed by China. The United States had a trade deficit in
computer equipment of more than USD 54 billion, while Germany (USD 10.6 billion) and
France (USD 9.5 billion) also had substantial deficits.
Electronic components trade
Electronic components account for almost 26% of OECD ICT goods trade, but has been
one of the slowest-growing market segments in value terms owing, in part, to falling prices.
Recovering in recent years, OECD exports of electronic components reached a new peak of
USD 269 billion in 2006 (Annex Table 2.A1.10). The largest exporters were the United States
(USD 63 billion), Japan (USD 62 billion), Korea (USD 45 billion) and Germany (USD 24 billion).
OECD imports of components reached USD 241 billion in 2006, with the largest importers
being the United States (USD 40 billion), Japan (USD 33 billion), Korea (USD 30 billion), and
Germany (USD 28 billion). Reflecting their increasing role in ICT equipment assembly,
Figure 2.7. OECD computer equipment trade, 2006USD millions
1 2 http://dx.doi.org/10.1787/473368034141
Source: Joint OECD-UNSD ITCS and the UN COMTRADE database.
100 000
80 000
60 000
40 000
20 000
0
Exports Imports
Unit
ed Stat
es
Neth
erlan
ds
Germ
any
Japa
n
Unit
ed King
dom K
orea
Irela
nd
Mex
ico
Cze
ch R
epub
lic
Fran
ce
Belg
ium
Hun
gary
Can
ada It
aly
Swed
en
Aus
tria
Den
mark
Spa
in
Slov
ak R
epub
lic
Finl
and
Aus
tralia
Por
tugal
Switz
erlan
d
Luxe
mbourg
Nor
way
Pola
nd
New
Zeala
nd
Gree
ce
Turke
y
Icela
nd
An
OE
CD
Bro
wo
L e c tur
ylnO dae
R
OECD INFORMATION TECHNOLOGY OUTLOOK 2008 – ISBN 978-92-64-05553-7 – © OECD 200882

2. GLOBALISATION OF THE ICT SECTOR
se_it E ditin
es
eu
le
imports into Hungary, the Slovak Republic, the Czech Republic and Poland have increased
by 20% a year or more since 1996 (Figure 2.8).
Japan enjoyed the largest trade surplus in components in 2006, at almost USD 29 billion.
The United States was the only other country with a large surplus (USD 23 billion),
although Korea, the Netherlands and Ireland also had substantial surpluses, owing to their
continuing role in high value electronics manufacturing. Reflecting their roles in assembly
activities, Mexico (USD 18.8 billion) and Hungary (USD 5.5 billion) had the largest trade
deficits in electronic components.
Communication equipment trade
Communication equipment is the fastest-growing segment of ICT trade, but it is affected
by increasing VAT fraud, called missing trader inter-community (MTIC) fraud, which inflates in
particular exports from certain EU countries such as the United Kingdom (see Box 2.2). OECD
exports of communication equipment increased from USD 72 billion in 1996 to around
USD 190 billion in 2006 (see Annex Table 2.A1.11). The largest exporters were the United
Kingdom (USD 49 billion),13 the United States (USD 22 billion), Germany (USD 21 billion) and
Korea (USD 19 billion), with exports from Hungary, the Czech Republic, Poland and Korea (and
the United Kingdom) growing by 20% a year or more between 1996 and 2006 (Figure 2.9). OECD
imports of communication equipment also reached a new peak of USD 186 billion in 2006,
with the United States, United Kingdom, Germany and France the largest importers.
The United Kingdom and Korea enjoyed the largest trade surpluses in communication
equipment in 2006 at USD 21 billion and USD 16 billion, respectively. Other countries with
a significant surplus were a mix of established high-value manufacturing locations (e.g.
Finland USD 8 billion and Sweden USD 4.7 billion) and more recent manufacturing
locations (e.g. Mexico USD 4.6 billion and Hungary USD 4.5 billion). The United States had a
Figure 2.8. OECD electronic components trade, 2006USD millions
1 2 http://dx.doi.org/10.1787/473423564664
Source: Joint OECD-UNSD ITCS and the UN COMTRADE database.
60 000
50 000
40 000
30 000
10 000
20 000
0
Exports Imports
Unit
ed Stat
es
Japa
n
Kor
ea
Germ
any
Mex
ico
Fran
ce
Unit
ed King
dom
Hun
gary
Neth
erlan
ds
Can
ada It
aly
Cze
ch R
epub
lic
Pola
nd
Spa
in
Finl
and
Swed
en
Belg
ium
Aus
tria
Por
tugal
Irela
nd
Slov
ak R
epub
lic
Switz
erlan
d
Den
mark
Aus
tralia
Turke
y
Nor
way
Gree
ce
New
Zeala
nd
Luxe
mbourg
Icela
nd
An
OE
CD
Bro
wo
L e c tur
ylnO dae
R
OECD INFORMATION TECHNOLOGY OUTLOOK 2008 – ISBN 978-92-64-05553-7 – © OECD 2008 83

2. GLOBALISATION OF THE ICT SECTOR
se_it E ditin
es
eu
le
Box 2.2. Communication equipment trade and missing trader inter-community fraud
Trade data show very volatile exports of communication equipment from the UnitedKingdom, increasing by 134% from USD 9.6 billion to USD 22.6 billion in 2005, by a further116% to USD 48.7 billion in 2006 followed by a very substantial fall in total ICT exports of39% in 2007 (however, the data are not directly comparable because of changes in theHarmonised System). This spike to 2006 and fall in 2007 is also apparent for some other EUmember states and some other ICT trade sub-components and affects the overallaggregate trade figures. There are many reasons for volatility in communications
equipment trade.1 However, the main explanation for this spike in export activity is value-added tax (VAT) missing trader inter-community (MTIC) fraud, which has tended toconcern small, high-value items of electronics, such as cellular mobile handsets.2
VAT intra-community missing trader fraud is a systematic criminal attack on the VATsystem, which has been detected in many EU member states (Ruffles et al., 2003). Inessence, fraudsters obtain VAT registration to acquire goods VAT-free from other member
states. They then sell on the goods at VAT-inclusive prices and disappear without payingthe VAT paid by their customers to the tax authorities by the time the tax authorities followup the registration with their regular assurance activities. The “carousel” version of thefraud occurs when goods that have been imported are sold through a series of transactionsbefore being re-exported to another EU member state and subsequently re-imported.In 2006, communication equipment exports from the United Kingdom increased mostrapidly in both volume and percentage terms to France (increasing by USD 12 billion or408% during the year), Germany (USD 3.3 billion or 350%) and the Netherlands(USD 3.4 billion or 303%). However, UK import data do not show such rapid growth –increasing by 20% from USD 14 billion to USD 17 billion in 2004 and by a further 65% toUSD 28 billion in 2006.
Taxation authorities and national statistical offices have been working hard to preventthe fraud and to minimise its impact on official national statistics. However, internationalconvention dictates that the treatment of the impact is to adjust imports upwards toinclude the fraudulent transactions, rather than adjusting exports downwards to excludethem, even though the trade may not be genuine. This can have a significant impact on EUmember trade statistics. The UK National Statistics Office (2007) estimated MTIC fraud
trade adjustments at GBP 11.2 billion in 2005 and GBP 22.9 billion in 2006 (more thanGBP 20 billion of which in the first two quarters). This means that when MTIC frauddeclines exports decline markedly.
To estimate the impact on communication equipment trade data, growth in communicationequipment production for 2004-06 was applied to UK export data. This is rather crude becausere-exports can increase rapidly, but it may be taken as an approximate guide to export growth.
On that basis, reported UK exports of communication equipment may have been as much asGBP 7 billion too high in 2005, and GBP 20 billion too high in 2006 – close to the officialestimates of the total impact of MTIC fraud on UK trade data.
Official estimates of the impact of MTIC fraud on trade declined markedly in mid-2006 asa result of a number of initiatives aimed at detecting and preventing such fraud, includingthe introduction of a computer database containing the unique identification number of
mobile phones being exported, tightening up the refund process and gaining a EuropeanCommission ruling to allow reverse charging for certain products. As a result, 2007 data,which is often substantially lower than 2006 data, more accurately reflects underlyingtrends in communication equipment trade. Total ICT exports for the United Kingdom, for
An
OE
CD
Bro
wo
L e c tur
ylnO dae
R
OECD INFORMATION TECHNOLOGY OUTLOOK 2008 – ISBN 978-92-64-05553-7 – © OECD 200884

2. GLOBALISATION OF THE ICT SECTOR
se_it E ditin
es
eu
le
trade deficit in communication equipment of almost USD 34 billion, while Spain, Australia
and Italy each had a deficit of USD 3 billion or more.
Audio and video equipment trade
Audio and video equipment accounts for less than 15% of ICT equipment trade, but
sales of digital cameras, flat screen TVs and MP3 players have made this one of the faster-
growing market segments. OECD exports of audio and video equipment reached
USD 112 billion in 2006 (Annex Table 2.A1.12). The largest exporters were Japan and Mexico
(USD 20 billion), the United States (USD 9.8 billion) and Germany (USD 8.4 billion), with
exports from the Czech Republic, the Slovak Republic, Hungary and Poland increasing most
rapidly as assembly activities have moved to Eastern Europe. China’s exports of audio and
Box 2.2. Communication equipment trade and missing trader inter-community fraud (cont.)
example, fell by 60% from USD 91 billion to USD 37.6 billion in 2007, in part due to reducedMTIC fraud and better measurement of actual trade. However, this downward correction ofICT export figures complicates the analysis of growth between 2006 and 2007 as it is hardto separate real slowdowns in ICT trade growth from downward corrections due to lessMTIC fraud.
1. Other reasons include major communications network investments, technology life cycles drivinginvestment cycles, and deregulation, increasing competition and cross-border mergers and acquisitions intelecommunications leading to sudden changes in supply contracts and relationships.
2. It was reported that in 2005 mobile phones worth more than EUR 2 billion were imported into Germanyfrom Switzerland alone, although there is no manufacture of mobile phones in Switzerland and no otherobvious commercial reason for such trade (HM Revenue and Customs, 2006).
Sources: House of Lords (2007), Pollack (2006), Recipero (2007),
Figure 2.9. OECD communication equipment trade, 2006USD millions
1 2 http://dx.doi.org/10.1787/473431030025
Source: Joint OECD-UNSD ITCS and the UN COMTRADE database.
50 000
40 000
30 000
10 000
20 000
0
Exports Imports
Unit
ed King
dom
Unit
ed Stat
es
Germ
any
Kor
ea
Mex
ico
Finl
and
Fran
ce
Swed
en
Can
ada
Hun
gary
Neth
erlan
ds
Japa
n It
aly
Aus
tria
Den
mark
Belg
ium S
pain
Irela
nd
Switz
erlan
d
Cze
ch R
epub
lic
Nor
way
Pola
nd
Aus
tralia
Greece
Slov
ak R
epub
lic
Por
tugal
Luxe
mbourg
New
Zeala
nd
Turke
y
Icela
nd
An
OE
CD
Bro
wo
L e c tur
ylnO dae
R
OECD INFORMATION TECHNOLOGY OUTLOOK 2008 – ISBN 978-92-64-05553-7 – © OECD 2008 85

2. GLOBALISATION OF THE ICT SECTOR
se_it E ditin
es
eu
le
video equipment reached more than USD 50 billion in 2006, equivalent to the combined
exports of the United States, Japan and Mexico (Figure 2.10).
OECD imports of audio and video equipment reached almost USD 164 billion in 2006;
the largest importers were the United States (USD 59 billion), Germany (USD 15 billion), the
United Kingdom (USD 12 billion) and the Netherlands (USD 9 billion). Mexico enjoyed the
largest trade surplus in audio and video equipment in 2006 at almost USD 16 billion, while
Japan (USD 11.5 billion), Hungary (USD 3 billion), the Slovak Republic (USD 2.9 billion) and
Korea (USD 2.3 billion) also had significant surpluses. China’s surplus reached
USD 40 billion. The US trade deficit in audio and video equipment was by far the largest at
almost USD 50 billion in 2006.
Software goods tradeTotal OECD exports of software goods (i.e. the media that contain software, see Box 2.3,
not included in ICT trade totals above) reached almost USD 19 billion in 2006, and imports
USD 18 billion (Annex Table 2.A1.14). Between 1996 and 2006, exports increased by 5.2% a
year, while imports increased by 5.6% a year (Figure 2.11).
In 2006, the leading exporters of software goods were Germany (USD 3.9 billion), the
United States (USD 3.3 billion) and Ireland (USD 2 billion), although exports from Ireland
have declined since 1996. Sweden, Poland, Mexico and Korea have also recorded strong
growth in exports. Germany, the United Kingdom, Italy, France, Canada and the United
States were the OECD’s leading importers of software goods, each importing between
USD 1 billion and USD 2 billion in 2006. Italy, Canada, Spain, France and Korea had the
largest trade deficits in software goods in 2006, while the United States, Ireland and
Germany had the largest surpluses (Figure 2.11).
Figure 2.10. OECD audio and video equipment trade, 2006USD millions
1 2 http://dx.doi.org/10.1787/473505518578
Source: Joint OECD-UNSD ITCS and the UN COMTRADE database.
60 000
50 000
40 000
30 000
10 000
20 000
0
Exports Imports
Japa
n
Mex
ico
Unit
ed Stat
es
Germ
any
Neth
erlan
ds
Kor
ea
Unit
ed King
dom
Hun
gary
Slov
ak R
epub
lic
Belg
ium
Pola
nd
Spa
in
Fran
ce
Cze
ch R
epub
lic
Turke
y
Swed
en
Den
mark
Por
tugal
Irela
nd It
aly
Can
ada
Finl
and
Aus
tria
Luxe
mbourg
Switz
erlan
d
Aus
tralia
Nor
way
Gree
ce
New
Zeala
nd
Icela
nd
An
OE
CD
Bro
wo
L e c tur
ylnO dae
R
OECD INFORMATION TECHNOLOGY OUTLOOK 2008 – ISBN 978-92-64-05553-7 – © OECD 200886

2. GLOBALISATION OF THE ICT SECTOR
se_it E ditin
es
eu
le
Trade in ICT servicesOECD ICT-related services trade – by far the most dynamic OECD ICT export
component – increased from around USD 70 billion in 1996 to more than USD 235 billion
in 2006, or by 13% a year. Over the period, OECD exports of ICT services increased by 16% a
year to USD 134 billion and imports by 11% a year to USD 102 billion, and a trade deficit in
ICT services has turned into a surplus of around USD 32 billion. The share of ICT services
in total OECD services trade increased from 3.4% in 1996 to 6% by 2006, or by 5.8% a year
(Annex Table 2.A1.15).
Figure 2.11. OECD software goods trade, 2006USD millions
1 2 http://dx.doi.org/10.1787/473514062576
Source: Joint OECD-UNSD ITCS and the UN COMTRADE database.
Box 2.3. Measuring software trade
There are a range of problems for measuring international trade in software. First, asborder valuations are based on physical media, the value of the software traded is likely tobe significantly understated. Second, the bundling of software with hardware leads tosignificant mis-measurement (with an overstating of equipment trade and understating ofsoftware trade). Third, trade statistics do not measure the value of copyright works sold inforeign markets when only the original software product is transferred internationally andcopied multiple times for sale in the importing country (i.e. the “gold master” problem).
Fourth, trade statistics do not measure the value of software transmitted electronicallyacross borders, which accounts for a rapidly increasing share of sales, or the rise ofapplication service providers of software (ASPs) and software as a service (SAAS). Theapproach used here is to track trade in the physical supports (e.g. magnetic and opticaldiscs and other recorded media). When seen alongside trade in computer and informationservices (discussed below) these data give some indication of the relative size andgeographical distribution of cross-border sales of software.
Source: OECD Information Technology Outlook 2002 and OECD (2007a).
4 000
3 500
3 000
2 500
2 000
1 500
1 000
500
0
Exports Imports
Germ
any
Unit
ed Stat
es
Irela
nd
Unit
ed King
dom
Neth
erlan
ds
Aus
tria
Fran
ce
Swed
en
Japa
n
Belg
ium
Cze
ch R
epub
lic
Can
ada
Pola
nd
Mex
ico
Switz
erlan
d
Den
mark It
aly
Kor
ea
Spa
in
Luxe
mbourg
Aus
tralia
Hun
gary
Finl
and
Nor
way
Gree
ce
Slov
ak R
epub
lic
Por
tugal
New
Zeala
nd
Turke
y
Icela
nd
An
OE
CD
Bro
wo
L e c tur
ylnO dae
R
OECD INFORMATION TECHNOLOGY OUTLOOK 2008 – ISBN 978-92-64-05553-7 – © OECD 2008 87

2. GLOBALISATION OF THE ICT SECTOR
se_it E ditin
es
eu
le
Computer and information services
Reported OECD exports of computer and information services increased by 20% a year
from around USD 14 billion in 1996 to USD 86 billion in 2006, and imports increased by
more than 15% a year from USD 13 billion to USD 54 billion (Figure 2.12 and Annex
Table 2.A1.15).14 In 2006, Ireland was the leading exporter (USD 20.7 billion), followed by
the United Kingdom (USD 11.9 billion), the United States (USD 10.1 billion) and Germany
(USD 9.4 billion). The United States (USD 11 billion) and Germany (USD 9 billion) were the
largest importers, followed by the United Kingdom (USD 4.9 billion) and the Netherlands
(USD 3.7 billion).
Ireland had by far the largest trade surplus in computer and information services in 2006.
The United Kingdom also had a large surplus, followed by Canada, Spain, Luxembourg and
Sweden. However, Ireland includes software licence fees in computer and information
services, while other countries record them separately under “royalties and licence fees”.
Nevertheless, taking into account computer and information services, software goods
(discussed above) and software-related royalties and licence fees, Ireland is a major producer
and exporter of software and IT services due very largely to multinational enterprise activity.
Among the major emerging economies, reported data show that India is clearly the
leading exporter of computer and information services, at USD 29 billion in 2006, more
than any OECD country and almost three times more than the United States (for a more
detailed analysis of outsourcing, see OECD, 2006, Chapter 4). China is also a significant
exporter of computer and information services with USD 3 billion in 2006 (more than all
but eight OECD countries). Brazil (USD 2 billion) and China (USD 1.7 billion) are also major
importers. The globalisation of ICT services is particularly pronounced in countries which
are not known for them. A few South African ICT services firms with very strong
international linkages appear in the OECD Top 250 ICT firms (see Box 2.4).
Figure 2.12. OECD and major emerging economies’ computer and information services trade, 2006
USD millions
1 2 http://dx.doi.org/10.1787/473577474371
Source: OECD Statistics on International Trade in Services, Volume I, detailed tables by Service Category, Sept. 2008.
20 000
15 000
10 000
5 000
30 000
25 000
20 000
15 000
10 000
5 000
0
0
Irela
nd
Unit
ed King
dom
Unit
ed Stat
es
Germ
any
Can
ada
Spa
in
Neth
erlan
ds
Swed
en
Belg
ium
Luxe
mbourg
Fran
ce
Aus
tria
Finl
and
Nor
way
Den
mark
Aus
tralia
Japa
n
Cze
ch R
epub
lic It
aly
India
China
Russia
n Fed
.
South
Africa
Indon
esia
Brazil
Hun
gary
Pola
nd
Kor
ea
Gree
ce
Por
tugal
New
Zeala
nd
Slov
ak R
epub
lic
Icela
nd
Turke
y
Exports Imports
An
OE
CD
Bro
wo
L e c tur
ylnO dae
R
OECD INFORMATION TECHNOLOGY OUTLOOK 2008 – ISBN 978-92-64-05553-7 – © OECD 200888

2. GLOBALISATION OF THE ICT SECTOR
se_it E ditin
es
eu
le
Communication services
Communication services trade trends are difficult to interpret (see OECD Communications
Outlook 2007 and the forthcoming 2009 edition). Values are often tied to progress in the
deregulation of communications in various countries and trade is often a contrary
indicator to overall services trade (i.e. communication services imports tend to increase
when other services exports increase, and vice versa, as domestic service providers
communicate with overseas clients more when they export more and provide services to
them than when they import more and receive services from them).
Box 2.4. Out of South Africa: Globalisation of ICT services
Some of the larger South African ICT service firms are globalising rapidly and are listedamong the top 250 ICT firms (see Chapter 1).
Datatec Group
Datatec is registered in South Africa, its shares are listed in Johannesburg and Londonand its subsidiaries have headquarters and operations in multiple countries beyond Africa.Its revenues increased from USD 1.9 billion in 2000 to almost USD 4 billion in 2007 and thecompany employs just over 3 500 people. It ranked 220th in the OECD top 250 ICT firms,based on 2006 revenue. Westcom is its global distributor of networking and communicationsconvergence products from Cisco, Nortel, Avaya, Checkpoint and Nokia; it is headquartered inthe United States with operations in 16 countries. Since 1997, Datatec has undertakenmore than 35 international acquisitions (M&As), including 14 in the United Kingdom andseven in the United States, and has made acquisitions in Argentina, Australia, Brazil,France, Germany, the Netherlands, Singapore, Switzerland and Turkey. Among the largeracquisitions reported are those of the Westcom Group, Bloomfield Computer Network
Solutions, Avent Inc. (Hewlett-Packard Enterprise End-User Business), and Puget SoundSystems Group in the United States; and RBR Networks Ltd., Satelcom UK Ltd., CraneTelecommunications Group Ltd., Logical Networks plc., Mason Group Ltd., Bluepoint Plc.and Analysys Ltd. in the United Kingdom.
Dimension Data
Founded in 1983 and headquartered in South Africa, Dimension Data is a specialist ITservices and solution provider which helps to build IT infrastructures. Dimension Data’srevenues increased from less than USD 2 billion in 2000 to almost USD 3.8 billion in 2007,and the company employs 10 060 people worldwide. It ranked 205th in the ICT top 250,
based on 2006 revenue. During the first half of 2007, Dimension Data reported that 27% ofits total revenue was earned in Europe, 22% in Africa, 20% in Australia, 16% in the UnitedStates and 15% in Asia. Since 1997, Dimension Data has made close to 20 internationalacquisitions, including five in the United Kingdom, three in Australia, and two inSingapore and Belgium, as well as in Korea, the Netherlands, Switzerland, India andNigeria. Major deals include the acquisitions of Comparex Holdings European NetworkingOperations, Chernikeeff Networks and Merchants Group in the United Kingdom, andDatacraft and Com Tech Communications in Australia. In November 2005, Dimension Dataacquired the remaining 51% stake in Plessey, and in 2006 it acquired the remaining 20% inInternet Solutions (Pty) Limited.
Source: OECD, based on top ICT firms database, annual reports, market financials and data provided byDealogic.
An
OE
CD
Bro
wo
L e c tur
ylnO dae
R
OECD INFORMATION TECHNOLOGY OUTLOOK 2008 – ISBN 978-92-64-05553-7 – © OECD 2008 89

2. GLOBALISATION OF THE ICT SECTOR
se_it E ditin
es
eu
le
Reported OECD trade in communication services increased by around 9% a year
from 1996 to 2006, with exports increasing by 11% a year and imports by 7% (Annex
Table 2.A1.12). The leading exporters were the United Kingdom (USD 7.8 billion), the United
States (USD 6.6 billion), Germany (USD 4.3 billion), the Netherlands (USD 4 billion) and
France (USD 3.7 billion). The main importers were the United Kingdom (USD 7.3 billion),
Germany (USD 6.1 billion) and the United States (USD 5.2 billion). France had the largest
surplus, at almost USD 1.6 billion (Figure 2.13).
The Russian Federation and China are significant exporters of communication
services, with exports in 2006 of USD 738 million and USD 803 million, respectively
(see Box 2.5). Both are also substantial importers and had trade deficits in communication
services in 2006. However, India was the largest exporter among the BRICS economies at
USD 2.2 billion.
Globalisation of the ICT sectorOver the past quarter of a century, the overall pattern of world investment, production
and trade has changed with the development of international sourcing (i.e. international
purchasing of intermediate product and service inputs) both within firms and between
firms in the same industry (i.e. intra-firm and intra-industry trade). The ICT sector plays a
major role in this, as it is highly globalised and enables the globalisation of other sectors.
This section explores these features of globalisation, and examines the level of
specialisation and the nature and extent of globalisation of the ICT-producing sector.
Global ICT production
In recent years globalisation of ICT and electronics has featured the rapid
development of new production locations and markets in emerging economies. Reed
Electronics Research provides data on electronics production, one of the best available
Figure 2.13. OECD and major emerging economies’ communication services trade, 2006
USD millions
1 2 http://dx.doi.org/10.1787/473588767036
Source: OECD Statistics on International Trade in Services, Volume I, detailed tables by Service Category, September 2008.
8 000
7 000
6 000
5 000
4 000
3 000
2 000
1 000
0
2 500
2 000
1 500
1 000
5 00
0
Russia
n Fed
.
Unit
ed King
dom
Unit
ed Stat
es
Germ
any
Neth
erlan
ds
Fran
ce It
aly
Can
ada
Belg
ium
Swed
en
Spa
in
Luxe
mbourg
Aus
tria
Switz
erlan
d
Den
mark
Por
tugal
Aus
tralia
Irela
nd
Mex
ico
Kor
ea
India
Indon
esia
China
South
Africa
Brazil
Cze
ch R
epub
lic
Japa
n
Finl
and
Turke
y
Hun
gary
Nor
way
Poland
Gree
ce
New
Zeala
nd
Slov
ak R
epub
lic
Icela
nd
Exports Imports
An
OE
CD
Bro
wo
L e c tur
ylnO dae
R
OECD INFORMATION TECHNOLOGY OUTLOOK 2008 – ISBN 978-92-64-05553-7 – © OECD 200890

2. GLOBALISATION OF THE ICT SECTOR
se_it E ditin
es
eu
le
proxies for ICT production (Annex Table 2.A1.16). Higher-cost locations accounted for 75%
of electronics output in 1995. However, in 2007 this share was reduced to less than 50% of
the total. Whereas the Asia-Pacific region (and China in particular) has been the main
beneficiary, Central and Eastern Europe, Mexico and Brazil have also seen very significant
increases in electronics production.
In line with earlier trade figures, China is the leading producer of electronics products
in 2008 (USD 413 billion), followed by the United States (USD 282 billion), Japan
(USD 184 billion), Korea (USD 94 billion), Germany (USD 81 billion), and some leading Asian
producers (Malaysia, Singapore, Chinese Taipei) (Figure 2.14, Reed Electronics Research).
ICT production locations such as Mexico, Brazil and Thailand and other countries in
Eastern Europe (including established locations such as Hungary and the Czech Republic,
but also newer ones such as Bulgaria, Romania and the Slovak Republic) are also gaining in
importance.
From 2005 to 2008, electronics production increased by 10% a year or more in the
Slovak Republic, Brazil, India, Vietnam, China, Poland, Thailand, the Czech Republic,
Bulgaria, Greece, Hungary and Mexico (Figure 2.15 and Annex Table 2.A1.16), while it
contracted in Hong Kong, China as well as in Belgium, Finland, France, Japan, Korea and the
United Kingdom. However, ICT manufacturing value added rose substantially in Finland,
Japan and Korea through 2006 (see Chapter 1).
Trade, production and sales
One indicator of increasing globalisation is that worldwide ICT trade is growing faster
than production and sales (Table 2.2). Between 1995 and 2005, western European
Box 2.5. Russian communication service providers
Two of the top 250 ICT firms are Russian communication service providers (seeChapter 1). Their development sheds light on the growing service markets in the RussianFederation and the Commonwealth of Independent States (CIS).
Mobile Telesystems (MTS)
MTS is the largest mobile phone operator in the Russian Federation and the CIS (it is listedon the New York Stock Exchange and is traded in Europe) servicing about 84 millionsubscribers. The Russian Federation and the CIS have a total population of over 240 million,and future subscriber growth is expected to be high. The company is majority-owned bySistema, the largest private-sector consumer services company in the Russian Federationand the CIS. Its revenues grew from USD 893 million in 2001 to over USD 8 billion in 2007,with annual growth of about 40% between 2000 and 2006, and it had 24 700 employeesin 2007.
VimpelCom
VimpelCom covers the same territories as MTS, with a focus on almost all Russianregions and the territories of Kazakhstan, Ukraine, Uzbekistan, Tajikistan, Georgia andArmenia (including 3G licences in some territories). Its active subscriber base in 2007 wasclose to 52 million. Its revenues have grown from USD 423 million in 2001 to more thanUSD 7 billion in 2007, with annual growth exceeding 50% between 2000 and 2006.VimpelCom had 23 200 employees by the end of 2007.
Source: OECD, based on top ICT firms database, annual reports and market financials.
An
OE
CD
Bro
wo
L e c tur
ylnO dae
R
OECD INFORMATION TECHNOLOGY OUTLOOK 2008 – ISBN 978-92-64-05553-7 – © OECD 2008 91

2. GLOBALISATION OF THE ICT SECTOR
se_it E ditin
es
eu
le
production of electronics goods increased by 0.4% a year, sales by 1.9%, and trade by 6.7% a
year. Similarly, the production of electronics goods in the Americas and Asia-Pacific region
increased by 1.7% a year, sales by 2.1% and trade by 6.7%. In Eastern European and
emerging countries, production growth rates are very high, although lower than those of
electronics exports.
Figure 2.14. Electronics production, 2005 and 2008USD billions
1 2 http://dx.doi.org/10.1787/473627562071Notes: 2005 are current figures at current exchange rates. 2008 are forecasts at 2007 constant values and exchange rates.
Source: OECD, based on data provided by Reed Electronics Research.
Figure 2.15. Growth in the value of electronics production, 2005-2008Percentage annual growth in current prices, top 25 economies
1 2 http://dx.doi.org/10.1787/473632357248Notes: 2008 are forecasts at 2007 constant values and exchange rates.
Source: OECD, based on data provided by Reed Electronics Research.
400
450
350
300
250
200
150
100
50
0
2005 2008
China
Unit
ed Stat
es
Japa
n
Kor
ea
Germ
any
Malays
ia
Sing
apor
e
Chin
ese T
aipei
Mex
ico
United
Kingdo
m
Fran
ce
Braz
il
Tha
iland
Irela
nd It
aly
Phil
ippine
s
Hun
gary
Can
ada
India
Finl
and
Indo
nesia
Switz
erlan
d
Swed
en
Neth
erlan
ds
Cze
ch R
epub
lic
Israe
l
0
5
10
15
20
25
30
35
40
Slovak
Repub
licBraz
ilInd
ia
Vietna
mChin
a
Poland
Thaila
nd
Czech
Rep
ublic
Bulgari
a
Greece
Hunga
ry
Mexico
Russia
n Fed
eratio
n
Malays
ia
Croati
a
Chines
e Taip
ei
Denmark
Norway
Ukraine
Roman
iaEg
ypt
Irelan
d
New Ze
aland
World
An
OE
CD
Bro
wo
L e c tur
ylnO dae
R
OECD INFORMATION TECHNOLOGY OUTLOOK 2008 – ISBN 978-92-64-05553-7 – © OECD 200892

2. GLOBALISATION OF THE ICT SECTOR
se_it E ditin
es
eu
le
Specialisation in ICT production
Globalisation and the international rationalisation of production will also be expected
to lead to increasing specialisation. One indicator is the share of ICT goods in total
merchandise exports, which varies significantly from country to country (see Annex
Table 2.A1.17). In 2006, ICT goods accounted for 27% of Korea’s merchandise exports, and
between 20 and 26% of merchandise exports from Hungary, Ireland, Mexico and the United
Kingdom (Figure 2.16). Among OECD countries, Iceland, Norway, Australia and Turkey are
the least specialised in the production of ICT goods for export. Some countries, such as the
Netherlands, act as transport and distribution hubs and exhibit relatively high levels of
trade in ICT equipment and a larger share of ICT equipment in merchandise trade than
domestic production would suggest, with re-exports making a substantial contribution to
exports.
Trends since 1996 reveal a number of aspects of globalisation, with rapid increases in
the share of ICTs in merchandise exports from Hungary, the Slovak Republic and the Czech
Republic owing to the establishment of manufacturing facilities in Eastern Europe. There
has also been increasing specialisation among already relatively specialised countries (e.g.
Korea, Finland and Mexico). The impact of the previous boom and bust cycle on particular
sectors (e.g. communication equipment), firms (e.g. Ericsson and Nortel) and countries (e.g.
Sweden, Canada, Ireland and Mexico) are also evident. While 16 OECD countries increased
Table 2.2. Growth in electronics goods production, trade and sales, 1995-2006Annual percentage
Electronic data processing equipment
Radio communications
Telecommunications Other Total
Western Europe
Imports 6.6 17.5 6.0 5.2 6.8
Exports 5.5 15.5 3.3 5.5 6.5
Trade 6.2 16.4 4.6 5.3 6.7
Production –2.0 5.0 –3.7 0.9 0.4
Market 2.7 4.7 –2.2 1.4 1.9
Americas and Asia-Pacific
Imports 7.2 14.0 7.4 6.6 7.3
Exports 5.1 14.3 3.3 5.9 6.1
Trade 6.1 14.2 5.2 6.2 6.7
Production 0.2 7.0 –3.6 1.8 1.7
Market 1.3 6.5 –1.7 1.8 2.1
Eastern Europe
Imports 14.1 26.9 7.0 16.3 15.9
Exports 42.9 36.7 13.2 24.6 28.5
Trade 19.3 30.3 8.4 18.8 19.4
Production 23.9 25.9 8.4 13.9 16.8
Market 11.4 21.9 6.4 11.8 12.2
Emerging economies
Imports 21.7 16.1 5.9 18.9 18.4
Exports 28.2 30.0 20.1 17.9 22.2
Trade 25.9 24.4 12.8 18.4 20.5
Production 26.8 27.4 17.4 14.8 20.2
Market 21.2 18.1 7.4 16.0 16.7
1 2 http://dx.doi.org/10.1787/476441650312Note: Annual growth for Eastern Europe is given for 1995-2005.Source: OECD, based on data provided by Reed Electronics Research.
An
OE
CD
Bro
wo
L e c tur
ylnO dae
R
OECD INFORMATION TECHNOLOGY OUTLOOK 2008 – ISBN 978-92-64-05553-7 – © OECD 2008 93

2. GLOBALISATION OF THE ICT SECTOR
se_it E ditin
es
eu
le
their specialisation in ICT production between 1996 and 2006, 14 reduced theirs. In general,
those specialising in ICT production do so increasingly, while those not specialising are
becoming even less specialised (Figure 2.16).
Another way to look at specialisation in manufacture of ICT goods for trade is to
calculate an index of “revealed comparative advantage” (RCA) to see whether, as exporter, the
ICT manufacturing industry performs better or worse in a given country than the average of its
performance throughout the OECD area.15 In 2006, 11 OECD countries had a comparative
advantage in ICT manufacturing – Korea, Hungary, Ireland, Mexico, the United Kingdom,
Japan, Finland, Netherlands, the United States, the Czech Republic and the Slovak Republic
(Figure 2.17 and Annex Table 2.A1.18). Recent trends suggest increasing specialisation; those
with an increasing advantage include a mix of countries that already had a high level of
specialisation (e.g. Finland and Mexico) and countries with relatively recent investment in ICT
manufacturing (e.g. Hungary, the Slovak Republic, Czech Republic and to a lesser extent
Poland). Again, the focus of ICT production in Korea (and elsewhere in Asia), Ireland, Mexico
and Eastern Europe is evident, as is the continuing global rationalisation of production.
Particular specialisations are also apparent, with the Slovak Republic, Mexico and
Hungary the leading producer-exporters of audio and video equipment. Finland and
Hungary lead in communications equipment (see Box 2.2 on MTIC fraud in the United
Kingdom), Ireland leads in computer equipment, and Korea, Japan and the United States
are the only OECD countries with a revealed comparative advantage in electronic
components.
Intra-industry trade
As a result of specialisation, developed countries increasingly trade products of the
same industries. This “intra-industry” trade tends to enhance gains from trade by
increasingly focusing specialisation on a more limited number of products in particular
Figure 2.16. Share of ICT goods in total merchandise exports, 1996-2006Percentages
1 2 http://dx.doi.org/10.1787/473651121571Notes: No data for the Slovak Republic prior to 1997. Belgium includes Luxembourg prior to 1999.
Source: Joint OECD-UNSD ITCS and the UN COMTRADE database.
30
25
20
15
10
5
0
1996 2006
Korea
Hun
gary
Irela
nd
Mex
ico
Unit
ed King
dom
Japa
n
Finl
and
Neth
erlan
ds
Unit
ed Stat
es
Czech
Rep
ublic
Slov
ak R
epub
lic
Swed
en
Germ
any
Por
tugal
Luxe
mbourg
Fran
ce
Den
mark
Aus
tria
Pola
nd
Can
ada
Spa
in
Switz
erlan
d
Belg
ium Italy
Gree
ce
New
Zeala
nd
Turke
y
Aus
tralia
Nor
way
Icela
nd
An
OE
CD
Bro
wo
L e c tur
ylnO dae
R
OECD INFORMATION TECHNOLOGY OUTLOOK 2008 – ISBN 978-92-64-05553-7 – © OECD 200894

2. GLOBALISATION OF THE ICT SECTOR
se_it E ditin
es
eu
le
industries. It reflects an increasingly fine-grained specialisation and global fragmentation
of production activities.16
Among OECD countries, the Czech Republic, Germany, Mexico, Sweden, Netherlands
and the United Kingdom have relatively high levels of intra-industry trade in ICT goods
(Annex Table 2.A1.19). Fifteen OECD countries recorded higher levels of intra-industry
trade in 2006 than in 1996, with the Eastern European countries experiencing some of the
most rapid increases in their intra-industry trade index (e.g. the Slovak Republic, the Czech
Republic, Poland, Greece, Turkey and Hungary) because of imports of electronic
components for assembly into computer, communications, audio and video equipment.
Intra-firm trade
As multinational enterprises (MNEs) expand into new markets and production locations,
a large and growing share of international trade takes place between related enterprises
(i.e. within firms). Because of high levels of globalisation in the sector, ICT goods and services
are among those with the highest shares of this related-party trade in total trade.
However, only a few countries, such as the United States, have the data to analyse
intra-firm trends at sector level (Table 2.3). In 2006, intra-firm trade accounted for 41% of
total US merchandise trade – 47% of imports and 30% of exports.17 Intra-firm trade in ICT
manufacturing industries accounts for more than 64% of US ICT goods imports and 37% of
exports. Moreover, ICT goods accounted for 14% of total US goods imports and 11% of
exports, but for more than 19% of related-party imports and 13% of related-party exports.
Intra-firm trade is also increasingly important in services. In 2006, affiliated trade
accounted for 26% of US cross-border exports of services and 23% of cross-border imports,
compared with 16 and 22%, respectively, in 1997. Again, the ICT sector appears relatively
highly globalised, with affiliated trade accounting for 25% of US cross-border exports of
computer and information services and 72% of cross-border imports, compared with
Figure 2.17. Revealed comparative advantage in ICT goods, 1996-2006
1 2 http://dx.doi.org/10.1787/473728384322Notes: No data for the Slovak Republic prior to 1997. Belgium includes Luxembourg prior to 1999.
Source: OECD based on Joint OECD-UNSD ITCS and the UN COMTRADE database.
2.5
2.0
1.5
1.0
0.5
0
1996 2006
Korea
Hun
gary
Irela
nd
Mex
ico
Unit
ed King
dom
Japa
n
Finl
and
Neth
erlan
ds
Unit
ed Stat
es
Czech
Rep
ublic
Slov
ak R
epub
lic
Swed
en
Germ
any
Por
tugal
Luxe
mbourg
Fran
ce
Den
mark
Aus
tria
Pola
nd
Can
ada
Spa
in
Switz
erlan
d
Belg
ium Italy
Gree
ce
New
Zeala
nd
Turke
y
Aus
tralia
Nor
way
Icela
nd
An
OE
CD
Bro
wo
L e c tur
ylnO dae
R
OECD INFORMATION TECHNOLOGY OUTLOOK 2008 – ISBN 978-92-64-05553-7 – © OECD 2008 95

2. GLOBALISATION OF THE ICT SECTOR
se_it E ditin
es
eu
le
31 and 50%, respectively, in 1997. The emergence of IT services offshoring may be one
factor in the relatively high and growing share of affiliated imports of computer and
information services into the United States, reflecting, in part, the extent of captive (i.e. in-
house) offshoring of such services by US parent firms (OECD, 2004, 2006).
Foreign direct investmentForeign direct investment (FDI) increased to historically high levels in 2007, with an
increasing focus on services, and greater participation by developing countries, both as
destinations and sources of investment. Worldwide FDI inflows reached USD 1 538 billion
in 2007, 18% higher than 2006, and recovering strongly from the depressed levels of 2002
and 2003, with about one-third of 2007 flows going to developing economies
(USD 538 billion, up from less than 20% of total inflows in the 1980s) (OECD, 2008b,
UNCTAD, 2006, 2008a; EIU, 2007). The share of developing countries’ worldwide outflows
increased from 7% to more than 12%.
FDI outflows from OECD countries in 2007 were USD 1.82 trillion (of which
USD 471 billion to developing countries), considerably higher than the record outflows
in 2000. FDI inflows to OECD countries were USD 1.37 trillion, only slightly higher than the
previous record inflows to OECD countries in 2000 as an increasing share of OECD outflows
goes to non-OECD economies (OECD, 2007b, 2008b). The United States continued as the top
OECD investor and recipient of foreign investment (USD 333 billion in outflows,
USD 238 billion in inflows) but EU countries combined – notably the UK and France – are
well in advance of the US totals. The BRICS – Brazil, the Russian Federation, India, China
and South Africa – account for around 55% of developing country inflows.
However, the performance in 2008 is less positive, with FDI flows projected to fall
sharply and with negative implications for developing country inflows (OECD, 2008b).
Based on the historical relationship between OECD outflows and developing country
inflows, the projected 37% drop in OECD outflows in 2008 could mean a decline of around
Table 2.3. US intra-firm trade in ICT goods and services, 2006USD millions and percentage shares
US imports US exports
Total importsRelated party
trade Share Total exports
Related party trade
Share
All NAICS 1 845 053 862 657 47% 929 486 279 832 30%
Computer equipment 83 928 55 347 66% 29 780 10 220 34%
Communication equipment 50 754 30 026 59% 14 995 3 303 22%
Audio and video equipment 46 778 29 169 62% 4 232 1 102 26%
Electronic components 75 042 49 743 66% 49 826 22 187 45%
Magnetic and optical media 4 758 3 043 64% 1 298 539 42%
ICT products 261 260 167 328 64% 100 131 37 351 37%
ICT share of total 14% 19% 11% 13%
All services 307 770 71 164 23% 404 327 103 315 26%
Computer and information services 11 092 8 000 72% 10 096 2 500 25%
ICT share of total 3.60% 11.20% 2.50% 2.40%
1 2 http://dx.doi.org/10.1787/476447383303Note: ICT sector based on four-digit NAICS. ICT goods includes imports for domestic consumption and domesticexports. ICT services include affiliated and total cross-border trade in computer and information services.Source: OECD, based on data from US Bureau of Economic Analysis, Survey of Current Business.
An
OE
CD
Bro
wo
L e c tur
ylnO dae
R
OECD INFORMATION TECHNOLOGY OUTLOOK 2008 – ISBN 978-92-64-05553-7 – © OECD 200896

2. GLOBALISATION OF THE ICT SECTOR
se_it E ditin
es
eu
le
40% for developing country inflows to around USD 276 billion. A recovery was projected
for 2009 (OECD, 2008b).
FDI in the ICT sector
In spite of the recent resurgence of international investment in energy and resources,
the ICT sector continued to be a major source and target of FDI (also reflected in M&A
activity, see below). During 2006, ICT industries accounted for more than 20% of the
number of FDI projects worldwide (EIU, 2007). Software and IT services led with 1 264 FDI
projects, there were 548 in communications, 344 in electronic components, 222 in
semiconductors and 146 in business machines and equipment.
ICT investments in Asia have increased rapidly, with cross-border M&A investments in
electrical and electronic equipment manufacturing in south, east and south-east Asia
worth USD 2.4 billion in 2005 (up from USD 1.7 billion in 2004), and M&As in transport,
storage and communications worth USD 6.6 billion (up from USD 840 million) (UNCTAD,
2006). Aside from China, Chinese Taipei, Malaysia and other Asian countries, new
investment locations are emerging (see Box 2.6). In 2004, developing economies accounted
for 25% of inward FDI stock in electrical and electronic equipment manufacturing (up from
20% in 1990), and 24% of inward stock in transport, storage and communication services
(up from just 3%) (UNCTAD, 2006). Developing economies accounted for no less than 82% of
worldwide FDI inflows into electrical and electronic equipment manufacturing in 2002-04,
and 26% of flows to transport, storage and communications.
The services sector has increased its share of worldwide M&As from around 30% in the
late 1980s to around 60%, with a growing emphasis on telecommunications and a range of
IT and IT-enabled business services. It is estimated that around 20 000 of the 78 000 MNEs
operating worldwide originate from developing countries and that more than 80% of the
total outward FDI stock from developing countries is in the services sector (UNCTAD, 2006).
Box 2.6. Vietnam: A new centre for offshore assembly?
The Vietnamese ICT sector, while still small, is growing rapidly and attracting increasingforeign investment. Vietnam’s ICT production increased by around 12% annually from 2004to 2007 to USD 2.5 billion. While still far behind China, Vietnam is ahead of for exampleNorway or South Africa. Vietnam’s ICT goods exports are still modest (aroundUSD 2 billion), but larger than ICT goods exports from for example India. Vietnam recentlyjoined the World Trade Organization as part of a process of further liberalisation and to
attract FDI.
Since 2000, FDI in Vietnam has been oriented towards export sectors, including assemblyactivities in the electronics and ICT industries, and is expected to continue to producecomputer hardware, telecommunications equipment and related services. After initiallyopening marketing offices, global ICT firms have invested in Vietnam. As part of “Chinaplus-one” strategies, firms from Korea, Japan and Chinese Taipei, including Samsung, LG
Electronics, Fujitsu, Renesas and Hon Hai Precision, have invested or plan to invest inmobile phone production plants, electronics manufacturing and semiconductorproduction. Intel for example has started building a semiconductor assembly and testfacility and has announced investments of up to USD 1 billion by 2009. The country’ssoftware and IT services sector is small, but has specialised in sourcing softwaredevelopment, IT services and telecommunications-related services. Diversified service
An
OE
CD
Bro
wo
L e c tur
ylnO dae
R
OECD INFORMATION TECHNOLOGY OUTLOOK 2008 – ISBN 978-92-64-05553-7 – © OECD 2008 97

2. GLOBALISATION OF THE ICT SECTOR
se_it E ditin
es
eu
le
Mergers and acquisitionsCross-border M&As have become the most common form of FDI. Recent years have
seen a renewed upswing in M&A activity, with strong growth from 2003 through 2007, and
particularly in 2007. The value and volume of cross-border M&As have grown faster than
domestic M&As. Earlier there was an unprecedented spike in M&A activity in the ICT-
producing sector during the boom years of the late 1990s followed b108y a collapse
from 2001 to 2003 (OECD, 2006).18 The outlook for 2008 was for a very marked slowdown in
international merger and acquisition activity and an equally sharp downturn in total FDI
activity with total OECD FDI inflows projected in mid-2008 to fall by around 24% and
outflows by around 37% based on the sharp slowdown in M&A activity (OECD, 2008b).
Declines will be much sharper.
Over the decade since 1997, the value of all cross-border M&As has increased annually
by 17% and the number of deals by almost 10%. The ICT sector has played a leading role,
with the value of M&A deals targeting ICT industries increasing by 14% a year
(Figure 2.18).19 During the boom of 2000, the ICT sector accounted for more than 30% of all
cross-border M&A deal value, and it has accounted for around 17% since although
flattening in 2007.
From 1997 through 2007, there were 55 M&A deals in the ICT sector with a reported
value in excess of USD 5 billion, 18 with a value of more than USD 10 billion and two worth
more than USD 50 billion, both of which were acquisitions by Vodafone (Mannesmann
in 2000 and Airtouch Communications in 1999). Of the 18 deals worth more than
USD 10 billion all but two were in telecommunications, the exceptions being Alcatel’s 2006
acquisition of Lucent Technologies, and Seagram’s 1998 acquisition of Polygram NV.
Cross-border M&As in the ICT sector
Over the last decade, there have been 16 710 completed cross-border M&A deals
targeting the ICT sector and 12 883 in which the ICT sector was the acquirer. With the shift
to services, most deals have been in IT services, followed by telecommunications and
electronics, and the fastest growth has been in telecommunications and IT services
(Figure 2.19 and Annex Table 2.A1.20).
Box 2.6. Vietnam: A new centre for offshore assembly? (cont.)
providers such as FPT Corporation (2007 revenues USD 860 million), in which Intel has astake, are developing rapidly.
Since the second half of 2007 macroeconomic conditions have deteriorated as the globaleconomy has slowed, and GDP growth was at a seven-year low in 2008 at around 6.5%according to the Asian Development Bank. Rapidly rising inflation, increases in oil andfood prices, rising interest rates and a contraction of credit have all had impacts oninvestment and trade and are hampering growth. In 2008 these challenges combined withskills shortages led some ICT firms to slow or stop investment. However, the economyremains strong overall, and Vietnam with its 87 million population is expected to play anincreasing role as the global ICT industry looks to diversify investments in Asia.
Source: OECD from official Vietnamese data, US Department of Commerce (2008), World Bank (2008), annualreports and company information.
An
OE
CD
Bro
wo
L e c tur
ylnO dae
R
OECD INFORMATION TECHNOLOGY OUTLOOK 2008 – ISBN 978-92-64-05553-7 – © OECD 200898

2. GLOBALISATION OF THE ICT SECTOR
se_it E ditin
es
eu
le
The recorded value of cross-border M&A deals targeting the ICT sector reached
USD 170 billion in 2007, up by 14% a year from USD 46 billion in 1997 (in current prices);
and the recorded value of deals in which the ICT sector was the acquirer reached
USD 130 billion, up by 11% a year (Annex Table 2.A1.21). Some of the largest deals have
occurred in telecommunication services, which as a target has accounted for more than
60% of total cross-border ICT industry M&A deal value over the last decade. As targets, the
telecommunications, electronics and IT services industries have experienced the most
rapid increases in cross-border M&A deal values over the decade; as acquirers, growth has
been fastest in telecommunications and communications equipment.
Figure 2.18. Value of cross-border M&A deals in ICT and non-ICT sectors, 1995-2007
Deal value in current prices, index 1995 = 100
1 2 http://dx.doi.org/10.1787/473741005507
Source: OECD, based on data provided by Dealogic.
Figure 2.19. Cross-border M&As deals in the ICT sector, 1995-2007Number of deals targeting the ICT sector
1 2 http://dx.doi.org/10.1787/473744514852
Source: OECD, based on data provided by Dealogic.
1995 1996 1997 1998 1999 2000 2001 2002 2003 2004 2005 2006 2007
2 000
1 800
1 600
1 400
1 200
1 000
800
600
400
200
0
M&As targeting ICT industries M&As targeting other industries
1995 1996 1997 1998 1999 2000 2001 2002 2003 2004 2005 2006 2007
3 000
2 500
2 000
1 500
1 000
500
0
Communications equipment IT equipment Electronics IT servicesIT wholesale Telecommunications Media and content
An
OE
CD
Bro
wo
L e c tur
ylnO dae
R
OECD INFORMATION TECHNOLOGY OUTLOOK 2008 – ISBN 978-92-64-05553-7 – © OECD 2008 99

2. GLOBALISATION OF THE ICT SECTOR
se_it E ditin
es
eu
le
Whether one looks at the number or values of M&A deals, the extraordinary peak of
cross-border M&A activity around 2000 is evident (Figure 2.20). What is also evident is the
recent recovery in both, with increased stock market valuations again lifting deal values
into the first part of 2007, when activity began to slow (EIU, 2007 and press reports).
The recovery in cross-border M&A deals focused on equipment manufacturing,
semiconductors, telecommunications, IT and Internet services. Notable deals targeting the
ICT sector during the last three years include Vodafone’s acquisition of Hutchison Essar,
Siemens’ acquisitions of Dade Behring Holdings, Bayer HealthCare (Diagnostics Division)
and UGS Corp, Swisscom’s acquisition of FastWeb, and Weather Investments’ acquisition
of TIM Hellas Telecommunications in 2007, Telefonica’s acquisition of O2, Alcatel’s
acquisition of Lucent, AMD’s acquisition of ATI Technologies and South African MTN’s
acquisition of Investcom in 2006. In the preceding years major deals included France
Telecom’s acquisition of Retevision Movil SA of Spain, Vodafone’s acquisition of the Dutch
ClearWave, E-bay’s acquisition of Skype, IAC/InterActive’s acquisition of Ask Jeeves,
Yahoo!’s purchase of a stake in Alibaba.com, Sun Microsystem’s acquisition of StorageTek,
Intelsat’s purchase of PanAmSat, Oracle’s acquisition of Siebel Systems, the buyout of
SunGard Data Systems, the equity firm purchase of Agilent’s semiconductor operations,
and Lenovo’s purchase of IBM’s PC manufacturing operations.
Some of the larger ICT firms make many acquisitions. Over the decade to 2007, ten ICT
firms made 50 or more – Telefonica SA (96 individual acquisitions and a further seven
consortium deals), Vodafone Group (77 individual, plus 14 as Vodafone Airtouch), Siemens
AG (77), Telenor ASA (75 individual and one consortium deal), Intel Corporation (74), France
Telecom (67 individual and six consortium deals), Flextronics International Ltd (67),
Tietoenator Oyj (68), Deutsche Telekom (65) and PSINet Inc. (59). A further 26 ICT firms
made between 25 and 50 acquisitions.
Figure 2.20. Cross-border M&As deals in the ICT sector, 1995-2007Number of deals and deal value in current prices, index 1995 = 100
1 2 http://dx.doi.org/10.1787/473748730457
Source: OECD, based on data provided by Dealogic.
1995 1996 1997 1998 1999 2000 2001 2002 2003 2004 2005 2006 2007
4 500
4 000
3 500
3 000
2 500
2 000
1 500
1 000
500
0
Target deals Target value Acquirer deals Acquirer value
An
OE
CD
Bro
wo
L e c tur
ylnO dae
R
OECD INFORMATION TECHNOLOGY OUTLOOK 2008 – ISBN 978-92-64-05553-7 – © OECD 2008100

2. GLOBALISATION OF THE ICT SECTOR
se_it E ditin
es
eu
le
ICT sector M&As by country
Globalisation of the ICT sector can be illustrated by the expansion of indigenous ICT
industries through cross-border M&As and the expansion of MNEs into domestic
industry.20 Over the decade to 2007, the value of cross-border M&A deals targeting the ICT
sector amounted to USD 1 792 billion worldwide, USD 1 411 billion (79%) of which were for
deals in which OECD member countries were the target (Annex Table 2.A1.23); while the
value of cross-border M&A deals in which the ICT sector was the acquirer amounted to
USD 1 623 billion worldwide, USD 1 378 billion (85%) of which were for deals in which OECD
member countries were the acquirer (Annex Table 2.A1.25 and 2.A1.26).
Over the same period, the United States accounted for 31% of all cross-border M&A
deals targeting the ICT sector in OECD countries by value, the United Kingdom accounted
for 18%, Germany 10% and the Netherlands 5.4%. No other country accounted for more
than 5%. Data are incomplete, but countries with the fastest growth in inward ICT-sector
M&A deal values over the last decade include Poland, Belgium, Norway, Canada, Italy and
Japan. These data match the ICT trade specialisation indicators discussed above and
indicate a global rationalisation of production rather than simple market access. The
United Kingdom accounted for 28% of outward ICT-sector M&A deals from OECD countries
over the last decade by value, and the United States for 15%.
Over the last decade, fewer countries have been originators of ICT-sector M&A deals
than have been targets. A total of 97 countries (and regions) were reported as acquirer
nationality and 173 as target nationality (Annex Table 2.A1.26), of which 34 were reported
as the target nationality for 100 or more M&A deals and just 25 as the acquirer nationality.
Moreover, 19 countries were named as net acquirers and 151 as net targets. By number of
deals, the largest net acquirer by far was the United States; the others were Singapore,
Hong Kong (China), Luxembourg, Japan, Norway, Bermuda, South Africa, Greece, Canada,
Kuwait, Iceland, Egypt, Virgin Islands (United States), Bahrain, Jamaica and Qatar (in that
order). The largest net targets of ICT sector M&As were China, Germany and the United
Kingdom, followed by Australia, India, Brazil, Switzerland, Korea and Spain (Annex
Table 2.A1.27).
ICT cross-border M&As are increasingly targeting and originating in non-member
countries (Annex Table 2.A1.26 and 2.A1.27). The phenomenon is clearer in terms of
Box 2.7. ICT M&A targets and acquirers
A notable trend in ICT-sector M&As has software firms as common acquisition targetsand capital funds and investment vehicles as increasingly common acquirers.
Software publishers: During the decade from 1997 (inclusive) there were 1 818 deals inwhich software publisher firms were the target. Of these, 618 (34%) were acquired by othersoftware publishers (i.e. horizontal deals) and a further 340 (19%) by computer systemsdesign and related services firms. The rest were acquired by a wide range of firms frommany industries. Indeed, at the six-digit NAICS level, there were no fewer than159 different industries listed as acquirers (and seven cases in which the acquiringindustry was unrecorded).
Finance and investment vehicles: Of the 16 676 M&A deals targeting the ICT sectorduring the decade from 1997, more than 2 600 (15%) involved acquirers that were in thefinance industries. Such deals are increasing, particulary since 2000.
An
OE
CD
Bro
wo
L e c tur
ylnO dae
R
OECD INFORMATION TECHNOLOGY OUTLOOK 2008 – ISBN 978-92-64-05553-7 – © OECD 2008 101

2. GLOBALISATION OF THE ICT SECTOR
se_it E ditin
es
eu
le
number of deals than of values as these tend to be low. The number of cross-border M&A
deals targeting the ICT sector in non-member countries has increased by 17% a year
since 1997, while those targeting ICTs in OECD countries has increased by 6%; the number
in which the ICT sector in non-member countries was acquirer increased by 12% a year,
compared with 3% a year for OECD country acquirers (Figures 2.21 and 2.22). In the new
wave of globalisation of ICT production, cross-border M&A deals increasingly target
services and rapidly emerging, non-member economies.
Figure 2.21. ICT sector cross-border M&As deals by region, 1995-2007Number of deals, index 1995 = 100
1 2 http://dx.doi.org/10.1787/473807686648
Source: OECD, based on data provided by Dealogic.
Figure 2.22. ICT sector cross-border M&As deals by region, 1997-2007Number of deals inward and outward
1 2 http://dx.doi.org/10.1787/473816747667Note: Total deals, including intra-regional deals.
Source: OECD, based on data provided by Dealogic.
1995 1996 1997 1998 1999 2000 2001 2002 2003 2004 2005 2006 2007
1 200
1 000
800
600
400
200
0
OECD target OECD acquirer Non-OECD target Non-OECD acquirer
Europe
In : 8 404
Out: 5 559In : 4 205
Out: 4 915
Americas
Out: 159
In : 221
Africa
In : 366
Out: 229
Middle East
In : 2 830
Out: 1 671
Asia
In : 684
Out: 296
Oceania
An
OE
CD
Bro
wo
L e c tur
ylnO dae
R
OECD INFORMATION TECHNOLOGY OUTLOOK 2008 – ISBN 978-92-64-05553-7 – © OECD 2008102

2. GLOBALISATION OF THE ICT SECTOR
se_it E ditin
es
eu
le
M&As targeting the ICT sector in the emerging economies have increased from
negligible levels in the mid-1990s to be worth hundreds and sometimes thousands
of millions of USD (Annex Tables 2.A1.22 and 2.A1.24). In 2006, for example, 127 M&A deals
targeting ICT industry entities in China totalled more than USD 3 billion, 44 deals targeting
ICT in India worth more than USD 3.7 billion, and 21 deals targeting ICT in Brazil worth
almost USD 3.9 billion. During 2005, the BRICS economies were the acquiring base in
55 cross-border deals worth almost USD 4 billion, and in 2006 for 81 deals worth more than
USD 9 billion. Major acquisitions in recent years have included South Africa’s MTN’s
acquisition of Lebanon’s Investcom, Russian VimpelCom’s acquisition of ArmenTel of
Armenia and Kazakhstan KarTel, and China’s China Network Group acquisition of a major
stake in PCCW.
Taking cross-border M&As as indicative of the broader trends in FDI, at least 44% of the
outflows from emerging economies since 1990s have targeted enterprises in the service
sectors (UNCTAD, 2006). In the telecommunication sector the importance of south-south
FDI appears to be increasing. Such investment accounted for over 36% of total flows and
close to 20% of the total number of telecommunications projects from 2001 to 2003,
compared with only 23% and 11%, respectively, in 1990. For example, Indian ICT companies
are very active in acquiring foreign firms. Until mid-2008, Bharti Airtel, India’s largest
telecommunications company, was in the midst of talks to acquire a majority stake in
South Africa’s MTN. Since 2006, Indian ICT service firms such as Tata Consultancy and
Satyam have also been buying smaller ICT service firms in Europe, Latin America, and Asia.
Activities of affiliates
MNEs’ production spans virtually all countries, sectors and economic activities.
In 2008, there were an estimated 78 411 parent MNEs worldwide with more than
850 000 foreign affiliates employing almost 73 million people (UNCTAD, 2008b). As
globalisation increases, global sales and gross product associated with international
production have increased faster than world GDP, and affiliate employment is now three
times larger than in 1990 (UNCTAD, 2007).
Foreign affiliates typically account for between 25 and 50% of manufacturing industry
turnover in OECD countries, ranging from a low of around 3% in Japan to almost 70% in the
Slovak Republic. Affiliate shares of manufacturing employment are similar, ranging from
lows of around 1% in Japan and 8% in Switzerland to almost 50% in Ireland, 37% in the
Czech Republic, 33% in Sweden, 30% in Poland, and around 25% in the United Kingdom,
France, Luxembourg, the Netherlands and Norway.
Foreign affiliates’ shares in the ICT sector are often higher than their shares in the
economy as a whole (Figures 2.23 and 2.24). Their share of computer equipment
manufacturing turnover exceeds 90% in Ireland and the Czech Republic, and is between
45 and 70% in Germany, Hungary, France, Finland and the United Kingdom. Employment
shares are highest in Ireland and the Czech Republic, where foreign affiliates account for
more than 90% of employment, followed by Hungary (70%) and Germany, the
United Kingdom and France, where they account for around 50%.
Affiliates’ shares of turnover in communication equipment manufacturing exceeded
80% in Hungary, the Slovak Republic, Poland and the Czech Republic, and were between
50 and 60% in Turkey, Spain, the United Kingdom, Germany and Denmark. Their shares of
employment in the industry are similarly high at more than 70% in Portugal, Hungary,
An
OE
CD
Bro
wo
L e c tur
ylnO dae
R
OECD INFORMATION TECHNOLOGY OUTLOOK 2008 – ISBN 978-92-64-05553-7 – © OECD 2008 103

2. GLOBALISATION OF THE ICT SECTOR
se_it E ditin
es
eu
le
Ireland and the Slovak Republic, and they accounted for more than 95% of industry exports
from Poland in 2004, and around 50% from France. Foreign affiliates’ shares of turnover in
computer and related services are somewhat lower (Figure 2.25), but still exceed 30% in the
Czech Republic, Belgium, Spain, and the United Kingdom, and have been increasing in
telecommunications services following high levels of M&A activity.
Figure 2.23. Foreign affiliates’ share of turnover in ICT manufacturing, 2005Percentages
1 2 http://dx.doi.org/10.1787/473831813322Note: Data refer to 2005 or most recent year.
Source: OECD, AFA database.
Figure 2.24. Foreign affiliates’ share of employment in ICT manufacturing, 2005Percentages
1 2 http://dx.doi.org/10.1787/473843882818Note: Data refer to 2005 or most recent year.
Source: OECD, AFA database.
0 20 40 60 80 100 0 20 40 60 80 100
Czech Republic
Germany
Hungary
France
Finland
United Kingdom
Netherlands
Spain
Sweden
Poland
HungarySlovak Republic
PolandCzech Republic
PortugalTurkeySpain
United KingdomGermanyDenmark
FranceNorway
ItalySwedenFinland
NetherlandsJapan
Computer manufacturing (ISIC 30)Communication equipment
manufacturing (ISIC 32)
0 20 40 60 80 100 0 20 40 60 80 100
Czech Republic
Ireland
Hungary
Germany
United Kingdom
France
Finland
Spain
Poland
Sweden
Netherlands
Italy
Norway
PortugalHungary
IrelandSlovak Republic
PolandCzech Republic
TurkeyFrance
GermanyUnited Kingdom
DenmarkSpain
ItalyNorwaySwedenFinland
Netherlands
Computer manufacturing (ISIC 30)Communication equipment
manufacturing (ISIC 32)
An
OE
CD
Bro
wo
L e c tur
ylnO dae
R
OECD INFORMATION TECHNOLOGY OUTLOOK 2008 – ISBN 978-92-64-05553-7 – © OECD 2008104

2. GLOBALISATION OF THE ICT SECTOR
se_it E ditin
es
eu
le
Activities of foreign affiliates in the United States and activities of US affiliates abroad
Affiliate activities play an increasingly important role in the ICT sector in many
countries. The United States (and Sweden, see next section) are among the few countries
that provide detailed information on the activities of ICT-sector MNEs. These data are
explored to present a picture of the extent and nature of ICT-sector affiliate activities.21
In 2005, foreign affiliates operating in the US ICT sector accounted for 4.6% of all
foreign affiliate employment in the United States, 3.6% of affiliate sales and almost 5% of
affiliate value added (BEA, 2007). Foreign affiliates spent almost USD 32 billion on R&D in
the United States, of which around 10% in the ICT sector (Annex Tables 2.A1.28). Computer
and electronic products manufacturing received some of the largest increases in foreign
investment, owing in large part to major M&A deals (e.g. Alcatel’s acquisition of Lucent
Technologies) which pushed investments from USD 3.6 billion in 2005 to almost
USD 18 billion in 2006. Majority-owned affiliates of US ICT firms operating abroad
employed almost 1.2 million people and realised USD 86 billion in gross product (Annex
Tables 2.A1.29). Affiliates in computer and electronic products manufacturing employed
around 645 000 and realised USD 39 billion in gross product, affiliates in electrical
equipment and appliances manufacturing employed 247 000 and realised almost
USD 11 billion, and affiliates in information services employed 318 000 and realised more
than USD 36 billion.
There are major differences among countries in the scale of the activities of affiliates.
In employment terms, the ICT sector accounted for a relatively large share of US affiliate
activities in Ireland, Austria, Hungary, Sweden, Korea, Mexico and the Czech Republic.
Reflecting recent globalisation trends, ICT-sector US affiliates have relatively large shares
of employment and gross product in non-OECD economies, with 33% of employment
outside the OECD and 18% of industry gross product.
Sales of US affiliates abroad have become significantly larger than cross-border trade
in ICT goods and services. US cross-border exports of domestically produced computer and
Figure 2.25. Foreign affiliates’ share of turnover in IT services, 2004Percentages
1 2 http://dx.doi.org/10.1787/473854114524Note: Data refer to 2004 or most recent year.
Source: OECD, AFA database.
0 10 20 30 40 50 60 70 80 90 100
Czech RepublicBelgium
SpainUnited Kingdom
PolandSweden
ItalyGermanyPortugal
FinlandFrance
NetherlandsHungary
AustriaUnited States
Computer and related services (ISIC 72)
An
OE
CD
Bro
wo
L e c tur
ylnO dae
R
OECD INFORMATION TECHNOLOGY OUTLOOK 2008 – ISBN 978-92-64-05553-7 – © OECD 2008 105

2. GLOBALISATION OF THE ICT SECTOR
se_it E ditin
es
eu
le
electronic products were worth USD 135 billion in 2006, compared with sales of US
affiliates operating abroad of some USD 230 billion in 2004. Sales of US cross-border and
affiliate services have increased since 1990, but affiliate sales increased faster than cross-
border sales, by 10.3 and 6.8% a year, respectively (Figure 2.26). In 2005, US cross-border
exports of computer and information services were worth USD 8.2 billion, of which
USD 2.2 billion were by affiliates (i.e. intra-firm trade), while computer systems design and
related services sales by US affiliates abroad were worth USD 44.4 billion in 2004; and
cross-border exports of telecommunication services were worth USD 4.7 billion, while
sales of US affiliates abroad were worth USD 32.2 billion (Koncz et al., 2006).
Activities of foreign affiliates in Sweden and the activities of Swedish affiliates abroad
There were 11 107 foreign-owned enterprises operating in Sweden in 2006, employing
572 715, of which 1 144 (10.3%) were ICT enterprises which employed 57 065 (10%)
(Table 2.4, Annex Tables 2.A1.30 and ITPS, 2006, 2007). Most foreign enterprises in Sweden’s
ICT sector are in services, with 114 ICT manufacturing enterprises employing 9 391,
compared to 1 030 ICT services enterprises employing 47 674. The top ten countries’
affiliates accounted for 88% of affiliate employment in Sweden’s ICT sector and 83% of the
total number of enterprises. The United States (244 ICT enterprises with 18 850 employees)
was the leading country of origin. Norway (142 enterprises and 6 251 employees) and the
United Kingdom (139 enterprises and 7 051 employees) were the other leading players.
Swedish-owned ICT-sector enterprises operating abroad employed a total of
163 308 in 2004, of which 40% were located abroad (Annex Tables 2.A1.31). Not surprisingly,
communication equipment manufacturing was a major activity of Swedish affiliates and
employed 31 977 abroad in 2004. Swedish ICT equipment manufacturing enterprises
(including communications) employed fewer at home (24 431) than abroad (33 970),
whereas Swedish-owned ICT services enterprises employed fewer abroad (30 696) than at
home (74 211).
Figure 2.26. United States cross-border and affiliate services sales, 1990-2006Current prices, index 1990 = 100
1 2 http://dx.doi.org/10.1787/473864666584
Source: US Department of Commerce, 2007.
450
400
350
300
250
200
150
1001990 1991 1992 1993 1994 1995 1996 1997 1998 1999 2000 2001 2002 2003 2004 2005 2006
Sales by US affiliates abroadUS cross-border exports
Sales by foreign affiliates in USUS cross-border imports
An
OE
CD
Bro
wo
L e c tur
ylnO dae
R
OECD INFORMATION TECHNOLOGY OUTLOOK 2008 – ISBN 978-92-64-05553-7 – © OECD 2008106

2. GLOBALISATION OF THE ICT SECTOR
se_it E ditin
es
eu
le
ConclusionWorldwide ICT trade has continued to grow faster than production and sales. Global
ICT trade has expanded strongly in recent years and, up to 2007, to levels which are about
USD 1.5 trillion higher than the peak of 2000. Weakening economic conditions in leading
OECD countries and falling demand in key markets have led growth in ICT trade to slow
in 2007 and the first half of 2008. However, ICT exports continued to increase rapidly for
some Asian countries in the first half of 2008, boosted by the resilience of OECD ICT
imports of new consumer products and portable computers and strong demand from
emerging markets.
Global restructuring of ICT production continued in 2007 and 2008, with Eastern
Europe (including new EU members), Mexico and non-member developing economies
increasingly important as both producers and new growth markets. MNEs’ operations,
international sourcing, and intra-firm and intra-industry trade have had major impacts on
the global ICT value chain, and reorganisation of the supply of ICT services and software
and associated trade flows have been major sources of growth.
Asia plays an increasing role in the production networks that import high value
electronic components for assembly and re-export. China’s role as production and sourcing
location for MNEs has intensified since the last Information Technology Outlook, and in 2006
China’s ICT exports eclipsed the combined exports of the United States and the EU.
However, Chinese ICT production and trade is closely tied to Hong Kong (China), Chinese
Taipei, Japan, Malaysia, and Singapore and to firms from the United States and Europe. In
terms of ICT export performance, Korea has made the greatest strides among OECD
countries but Japan also remains very important for ICT trade and production.
ICT-related FDI has increased to historic levels, and about one-sixth of all M&A cross-
border deals are in ICTs or are ICT-related. Non-member economies are increasingly active,
with ICT-sector cross-border M&As both targeting and originating in non-member
countries. FDI in ICT services has grown in importance, and emerging economy FDI
outflows have been particularly important in this area (about 45% of their outflows since
the 1990s).
Rapidly weakening global economic conditions will affect the globalisation of the ICT
sector, both the restructuring of global production networks and the origin and destination
of investment and associated R&D, production and distribution activities. An important
question is whether the demand for new ICT products and related investments in
production, coupled with growth in emerging economies will be strong enough to
Table 2.4. Foreign-owned enterprises in Sweden’s ICT sector, 2006Number of enterprises and employees
Enterprises Employees
Electronic equipment manufacturing 114 9 391
Wholesale 342 8 195
Computer and related services 603 33 276
Renting office machinery 10 50
Telecommunication services 75 6 153
Total ICT sector 1 144 57 065
All industries 11 107 572 751
1 2 http://dx.doi.org/10.1787/476484088411Source: ITPS 2007.
An
OE
CD
Bro
wo
L e c tur
ylnO dae
R
OECD INFORMATION TECHNOLOGY OUTLOOK 2008 – ISBN 978-92-64-05553-7 – © OECD 2008 107

2. GLOBALISATION OF THE ICT SECTOR
se_it E ditin
es
eu
le
compensate for declining activity in OECD countries. Are countries such as China simply
production platforms for re-export to the OECD, or will domestic demand from major
emerging production centres, other Asian economies and other countries drive further ICT
growth and globalisation?
New production locations are also emerging as the search for low-cost assembly
continues, with the re-organisation of the global ICT supply chain against the backdrop of
a difficult macroeconomic environment and the rise of new ICT firms and products. As ICT
firms from non-OECD economies continually move up the value chain and as wages and
welfare in these countries increase, the global distribution of innovation and production
activities will continually evolve.
Notes
1. This section initially focuses mainly on trends in goods trade from 1996 to 2006. Developmentsin 2007 and 2008 are treated separately as the data are not directly comparable owing to changesin classification and use of national sources.
2. All values are expressed in current USD at annual average exchange rates, unless otherwise indicated.
3. Revisions to the Harmonized System (HS) for trade classification take place every four to six years.A classification for 2007 (HS2007) has been agreed and implemented by most/all OECD countries.The earlier classification (HS2002) and HS2007 do not match well for ICT goods, reflecting updatesto the latter to reflect changes in the nature of ICT. Any time series data extending to 2007 andbeyond should therefore be considered approximate. The OECD Working Party on Indicators forthe Information Society (WPIIS) has developed a revised OECD ICT goods classification based onthe Central Product Classification, Version 2 which will be available for use from 2009 and willinclude a correspondence table to HS2007. However this revision will also narrow the scope of ICTgoods and thus reduce values for ICT goods trade. “Bridge” or “backcast” time series will show theeffect of this change.
4. Defined as: Measuring, testing, and control instruments, Computers, peripherals, and parts,Semiconductors, Telecommunications equipment, Other office and business machines,Televisions, video receivers, and other video equipment, Radio and stereo equipment, includingrecords, tapes, and disks.
5. “US International Trade in Goods and Services May 2008”, 11 July, www.bea.gov/newsreleases/international/trade/tradnewsrelease.htm.
6. BITKOM at www.bitkom.de/49038_52810.aspx.
7. JEITA, www.jeita.or.jp/english/www.bloomberg.com/apps/news?pid=20601068&sid=azL_czxrlsRo&refer=home.
8. Ministry of Knowledge Economy www.mke.go.kr/language/eng/glance/news_view2.jsp.
9. www.chinapost.com.tw/business/asia/%20taiwan/2008/07/08/164484/Taiwan-exports.htm.http://cus93.trade.gov.tw/english/FSCE/FSC0011E.ASP.
10. www.statistics.gov.my/english/frameset_rpm.php?file=rpmmay08. ww.statistics.gov.my/english/frameset_release.php?nid=1.
11. www.iesingapore.gov.sg/wps/portal/PressRelease?WCM_GLOBAL_CONTEXT=/wps/wcm/connect/My+Portal/Main/Press+Room/Press+Releases/2008/Singapore+External+Trade+January+2008.
12. Note that these export data are affected by currency appreciation in many countries in terms ofUSD values, and there are problems with the HS2007 trade conversions discussed above (see Note 3and see Annex Table 2.A1.4. for more detailed data for 2007).
13. MTIC fraud accounted for a substantial proportion of UK communication equipment exportsin 2006.
14. See Methodology and Definitions Annex for the definition of Computer and information services.
15. A value greater than 1 indicates a comparative advantage in ICTs, and a value of less than 1 acomparative disadvantage. See Methodology and Definitions Annex for more details.
An
OE
CD
Bro
wo
L e c tur
ylnO dae
R
OECD INFORMATION TECHNOLOGY OUTLOOK 2008 – ISBN 978-92-64-05553-7 – © OECD 2008108

2. GLOBALISATION OF THE ICT SECTOR
se_it E ditin
es
eu
le
16. The most widely used measure of intra-industry trade is the Grubel-Lloyd Index. The closer thevalues of imports and exports the higher the index. Because the ICT goods trade categories usedhere include both equipment and components they approximate the inputs and outputs of the ICTmanufacturing sector. Thus, although they are at a relatively high level of aggregation, they can beused to construct a Grubel-Lloyd Index. The index has a number of limitations, which areespecially noticeable where trade is either very large (e.g. United States) or very small (e.g. Iceland),but it does reveal aspects of the globalisation of the ICT sector. See Methodology and DefinitionsAnnex for more details.
17. The United States is among a handful of countries that report intra-firm trade in detail. US-relatedparty trade includes trade by US companies with their subsidiaries abroad, as well as trade by theUS subsidiaries of foreign companies with their parent companies.
18. Detailed analysis of cross-border mergers and acquisitions (M&As) is based on Dealogic data(www.dealogic.com). The data include completed deals that are between entities within economies(domestic) and entities based in different economies (cross-border). They are recorded as occurringin the year in which the deals were completed. Country data refer to country of ICT sector bidderand country of ICT sector target and reflect M&A deal outflows and inflows, respectively. Not alldeal values are recorded, and not all deals are reported. Consequently, these data provide no morethan a guide to M&A activity.
19. See Methodology and Definitions Annex for definitions.
20. The analysis focuses on target country where the ICT sector is the target of deals, and acquirercountry where the ICT sector is the acquirer. Hence, data relate to country inflows which target theICT sector, and country outflows in which the ICT sector is acquirer.
21. While indicative of affiliate activities they do not show the extent of affiliate activities in easternEuropean member countries and Mexico.
References
BEA (US Bureau of Economic Analysis) (2007), US Affiliates of Foreign Companies: Operations in 2005,T. Anderson, BEA, Washington DC.
EIU (2007), World Investment Prospects to 2011: Foreign direct investment and the challenge of political risk,Economist Intelligence Unit, London, New York and Hong Kong.
HM Revenue and Customs (2006), “E165m fraud discovered in UK and German joint operation”,Government News Network, 31 August.
House of Lords (2007), “Memorandum by the Institute of Chartered Accountants of Scotland”, UKHouse of Lords Select Committee on European Union, 12 January.
ITPS (2006), Swedish controlled enterprise groups with subsidiaries abroad 2004, ITPS, Ostersund.
ITPS (2007), Foreign controlled enterprises 2006, ITPS, Ostersund.
Koncz, J. and A. Flatness (2007), US International Services Cross-Border Trade in 2006 and Sales ThroughAffiliates in 2005, BEA, Washington, DC.
National Statistics (2007), UK trade: August 2007, National Statistics, London.
OECD (2004), OECD Information Technology Outlook 2004, OECD, Paris.
OECD (2006), OECD Information Technology Outlook 2006, OECD, Paris.
OECD (2007a), Guide to Measuring the Information Society, OECD, Paris, www.oecd.org/dataoecd/41/12/36177203.pdf.
OECD (2007b), International Investment Perspectives 2007: Freedom of investment in a changing world, OECD,Paris.
OECD (2008a), OECD Economic Outlook. Number 83, June, OECD, Paris.
OECD (2008b), OECD Investment News, June 2008, Issue 7, www.oecd.org/dataoecd/18/28/40887916.pdf.
Pollack, I. (2006), “The Nemesis for VAT fraudsters?”, BBC News, 18 June.
Recipero (2007), NEMESIS: Global online tax fraud identification system, Kings Stanley, UK.
Ruffles, D., G. Tily, D. Caplan and S. Tudor (2003), “VAT missing trader inter-community fraud: the effecton balance of payments statistics and UK National Accounts”, Economic Trends, No. 597, August.
An
OE
CD
Bro
wo
L e c tur
ylnO dae
R
OECD INFORMATION TECHNOLOGY OUTLOOK 2008 – ISBN 978-92-64-05553-7 – © OECD 2008 109

2. GLOBALISATION OF THE ICT SECTOR
se_it E ditin
es
eu
le
Seager, A. (2006), “Fraud could account for 10% of UK’s exports”, The Guardian, 11 May.
United Nations Conference on Trade and Development (UNCTAD) (2006), World Investment Report 2006:FDI from Developing and Transition Economies – Implications for Development, UNCTAD, New York andGeneva.
UNCTAD (2007), World Investment Report 2007: Transnational Corporation, Extractive Industries andDevelopment, UNCTAD, New York and Geneva.
UNCTAD (2008a), UNCTAD Investment Brief, Number 1, UNCTAD, New York and Geneva.
UNCTAD (2008b), UNCTAD Investment Brief, Number 2, UNCTAD, New York and Geneva.
US Department of Commerce (2008), Doing Business in Vietnam: 2008 Country Commercial Guide forUS Companies, Washington DC, www.buyusa.gov/Vietnam/en/265.pdf.
World Bank (2008), Taking Stock: An Update on Vietnam’s Recent Economic Developments. For the Mid-yearConsultative Group Meeting for Vietnam; Sapa, 5-6 June.
WTO (2008a), “World Trade 2007, Prospects for 2008 – WTO: developing, transition economies cushiontrade slowdown”, 17 April, WTO, Geneva.
WTO (2008b), World Trade Report 2008: Trade in a globalising world, July, WTO, Geneva.
An
OE
CD
Bro
wo
L e c tur
ylnO dae
R
OECD INFORMATION TECHNOLOGY OUTLOOK 2008 – ISBN 978-92-64-05553-7 – © OECD 2008110

2. GLOBALISATION OF THE ICT SECTOR
DB
ro
wse_it E ditio
n
es
eu
le
ylnO d
ANNEX 2.A1
Table 2.A1.1. World and OECD ICT goods trade, 1996-2007USD millions in current prices and percentages
1996 1998 2000 2002 2004 2006 2007
TRADE
World total ICT 1 161 862 1 497 516 2 239 666 2 015 861 2 790 459 3 525 497 3 708 225
ICT share of world merchandise trade 13.3 15.0 17.9 15.9 15.5 15.1 13.3
OECD total ICT 1 018 769 1 136 339 1 525 312 1 282 148 1 670 869 1 979 575 1 911 107
OECD ICT share of world merchandise trade 11.6 11.4 12.2 10.1 9.3 8.5 6.9
OECD EXPORTS
Communication equipment 72 296 92 827 139 713 114 140 138 141 192 376 175 689
IT and related equipment 158 521 177 742 219 386 183 452 218 698 239 122 189 280
Electronic components 165 068 169 711 242 731 185 344 246 683 268 871 262 019
Audio and video equipment 54 785 57 808 66 676 66 608 89 226 112 256 123 825
Other ICT-related goods 53 104 57 254 68 873 69 653 97 158 118 839 125 726
Total ICT 503 774 555 341 737 379 619 197 789 906 931 465 876 539
ICT share of OECD merchandise exports 13.2 13.9 16.6 13.9 13.0 12.4 10.2
ICT share of OECD manufacturing goods (SITC rev3) exports 15.7 16.2 19.5 16.3 15.3 14.9 12.2
OECD IMPORTS
Communication equipment 56 722 73 101 127 647 97 412 138 864 186 232 200 792
IT and related equipment 198 611 232 893 284 889 246 042 313 464 357 086 307 083
Electronic components 147 590 153 133 229 977 165 501 218 092 240 870 240 843
Audio and video equipment 65 631 71 748 86 230 93 527 130 665 164 499 177 790
Other ICT-related goods 46 441 50 123 59 190 60 468 79 878 99 423 108 059
Total ICT 514 994 580 998 787 933 662 951 880 963 1 048 110 1 034 567
ICT share of OECD merchandise imports 13.3 14.3 16.3 13.9 13.3 12.4 10.9
ICT share of OECD manufacturing goods (SITC rev3) imports 17.1 17.6 20.5 17.4 17.1 16.6 14.5
OECD BALANCE
Communication equipment 15 574 19 726 12 066 16 729 –722 6 144 –25 103
IT and related equipment –40 089 –55 152 –65 503 –62 590 –94 766 –117 964 –117 803
Electronic components 17 477 16 578 12 753 19 843 28 590 28 001 21 175
Audio and video equipment –10 845 –13 940 –19 554 –26 919 –41 440 –52 242 –53 965
Other ICT-related goods 6 663 7 131 9 682 9 184 17 280 19 416 17 667
Total ICT –11 220 –25 657 –50 555 –43 753 –91 057 –116 646 –158 028
1 2 http://dx.doi.org/10.1787/476484150832Note: Partly estimated for non-OECD 2007. ICT data in 2007 are not directly comparable with previous years.Source: OECD, based on data from the joint OECD-UNSD ITCS and COMTRADE database, November 2008.
An
OE
C
L e c tur
aeR
OECD INFORMATION TECHNOLOGY OUTLOOK 2008 – ISBN 978-92-64-05553-7 – © OECD 2008 111

2. GLOBALISATION OF THE ICT SECTOR
se_it E ditin
es
eu
le
Table 2.A1.2. OECD trade in ICT goods, 1996-2006 USD millions in current prices and annual growth per cent
Exports Imports
1996 2001 2006 CAGR 1996 2001 2006 CAGR
Australia 2 180 1 983 2 238 0 9 380 9 136 16 982 6
Austria 3 270 5 237 8 465 10 5 454 7 319 11 015 7
Belgium 8 272 12 209 13 655 5 9 202 14 358 16 829 6
Canada 13 875 15 011 18 048 3 23 526 28 254 35 204 4
Czech Republic 894 3 201 13 498 31 2 761 4 867 14 015 18
Denmark 3 154 4 061 6 778 8 4 651 5 568 10 656 9
Finland 5 935 9 414 14 640 9 4 214 5 465 10 032 9
France 25 892 30 457 38 120 4 28 458 34 402 52 069 6
Germany 42 812 59 083 107 388 10 48 736 67 918 113 155 9
Greece 182 384 700 14 1 593 2 095 3 831 9
Hungary 663 7 510 19 353 40 1 483 8 050 15 285 26
Iceland . . 9 16 . . . . 185 344 . .
Ireland 13 265 29 734 24 360 6 9 297 18 849 18 460 7
Italy 13 047 12 825 15 377 2 18 452 21 509 31 004 5
Japan 103 213 94 696 125 089 2 47 858 58 321 79 263 5
Korea 34 316 46 793 88 544 10 23 482 30 335 50 995 8
Luxembourg . . 1 552 1 143 . . . . 1 646 1 578 . .
Mexico 16 422 38 055 53 462 13 14 968 36 593 50 254 13
Netherlands 24 899 34 543 70 049 11 23 938 36 216 65 594 11
New Zealand 232 273 509 8 1 620 1 446 2 576 5
Norway 1 301 1 528 2 173 5 3 206 3 558 6 207 7
Poland 648 1 738 6 124 25 2 989 5 060 12 004 15
Portugal 1 371 2 065 3 907 11 2 616 3 789 6 229 9
Slovak Republic . . 574 5 518 . . . . 1 232 4 575 . .
Spain 4 969 6 161 8 547 6 10 565 13 276 26 160 9
Sweden 11 407 9 353 16 475 4 9 094 9 073 15 450 5
Switzerland 4 143 4 301 5 512 3 7 267 8 181 10 527 4
Turkey 496 1 188 1 718 13 2 567 3 230 5 511 8
United Kingdom 43 116 53 396 91 282 8 47 144 55 389 82 628 6
United States 123 802 152 150 169 027 3 150 475 193 798 280 177 6
OECD 503 774 639 482 931 713 6 514 994 689 118 1 048 606 7
1 2 http://dx.doi.org/10.1787/476511507803Notes: No data for the Slovak Republic prior to 1997. Belgium includes Luxembourg prior to 1999. Source: OECD, based on data from the joint OECD-UNSD ITCS and COMTRADE database, July 2008.
An
OE
CD
Bro
wo
L e c tur
ylnO dae
R
OECD INFORMATION TECHNOLOGY OUTLOOK 2008 – ISBN 978-92-64-05553-7 – © OECD 2008112

2. GLOBALISATION OF THE ICT SECTOR
se_it E ditin
es
eu
le
Table 2.A1.3. Balance of OECD trade in ICT goods, 1996-2006 USD millions in current prices and annual growth per cent
1996 1998 2000 2002 2004 2006 CAGR
Australia –7 200 –6 794 –9 558 –7 697 –12 375 –14 744 7.4
Austria –2 185 –2 724 –2 417 –1 536 –2 127 –2 550 1.6
Belgium –930 –1 542 –1 660 –2 154 –2 655 –3 175 13.1
Canada –9 651 –11 994 –13 345 –12 735 –15 716 –17 156 5.9
Czech Republic –1 867 –1 453 –1 773 –1 048 – 186 –517 –12.1
Denmark –1 496 –1 219 –1 735 –1 256 –2 047 –3 878 10.0
Finland 1 721 3 550 5 262 4 528 4 565 4 608 10.4
France –2 566 –2 305 –3 877 –3 903 –10 727 –13 949 18.4
Germany –5 924 –8 130 –7 816 –4 401 1 431 –5 767 –0.3
Greece –1 412 –1 988 –1 984 –1 699 –2 920 –3 131 8.3
Hungary –820 38 164 273 2 904 4 067 . .
Iceland . . –214 –251 –173 –252 –328 . .
Ireland 3 967 5 078 9 123 9 571 8 109 5 901 4.0
Italy –5 405 –8 281 –10 673 –9 446 –15 431 –15 627 11.2
Japan 55 355 52 697 56 678 39 917 51 542 45 826 –1.9
Korea 10 834 14 593 22 439 22 738 43 266 37 549 13.2
Luxembourg . . . . –167 17 –248 –435 . .
Mexico 1 454 3 126 1 935 2 944 317 3 208 8.2
Netherlands 962 –1 327 –900 1 753 667 4 455 16.6
New Zealand –1 388 –1 091 –1 470 –1 192 –1 841 –2 067 4.1
Norway –1 905 –2 120 –2 212 –2 156 –3 360 –4 033 7.8
Poland –2 342 –3 087 –3 683 –3 018 –4 319 –5 880 9.6
Portugal –1 245 –1 773 –1 695 –1 640 –2 098 –2 322 6.4
Slovak Republic . . –752 –538 –799 –596 943 . .
Spain –5 595 –5 996 –8 101 –7 184 –12 176 –17 613 12.2
Sweden 2 314 2 412 4 702 1 618 1 848 1 025 –7.8
Switzerland –3 124 –3 706 –4 513 –3 821 –4 705 –5 014 4.8
Turkey –2 071 –2 822 –4 932 –2 099 –4 143 –3 793 6.2
United Kingdom –4 028 –4 042 –11 862 2 101 –22 218 8 654 . .
United States –26 674 –33 792 –55 681 –61 260 –85 572 –111 151 15.3
OECD –11 220 –25 657 –50 542 –43 760 –91 064 –116 893 26.4
1 2 http://dx.doi.org/10.1787/476531344722Notes: No data for the Slovak Republic prior to 1997. Belgium includes Luxembourg prior to 1999. Source: OECD, based on data from the joint OECD-UNSD ITCS and COMTRADE database, July 2008.
An
OE
CD
Bro
wo
L e c tur
ylnO dae
R
OECD INFORMATION TECHNOLOGY OUTLOOK 2008 – ISBN 978-92-64-05553-7 – © OECD 2008 113

2. GLOBALISATION OF THE ICT SECTOR
se_it E ditin
es
eu
le
Table 2.A1.4. ICT goods trade, 2007USD millions in current prices
Exports Imports Balance Trade
OECD area
Australia 2 454 18 358 –15 904 20 812
Austria 9 602 11 721 –2 119 21 323
Belgium 12 815 17 683 –4 868 30 497
Canada 18 463 35 896 –17 433 54 359
Czech Republic 17 946 18 473 –528 36 419
Denmark 6 247 9 531 –3 284 15 778
Finland 15 409 10 951 4 459 26 360
France 32 790 48 829 –16 039 81 619
Germany 104 716 105 502 –786 210 218
Greece 700 4 787 –4 087 5 486
Hungary 23 194 19 541 3 653 42 735
Iceland 17 433 –416 450
Ireland 23 532 17 610 5 922 41 142
Italy 15 552 30 440 –14 888 45 991
Japan 112 199 75 797 36 402 187 995
Korea 97 371 54 090 43 281 151 461
Luxembourg 1 143 1 497 –353 2 640
Mexico 53 343 41 928 11 415 95 271
Netherlands 70 621 65 823 4 798 136 443
New Zealand 569 2 815 –2 246 3 384
Norway 2 688 7 018 –4 330 9 706
Poland 8 587 14 001 –5 413 22 588
Portugal 4 300 6 778 –2 479 11 078
Slovak Republic 8 779 8 134 645 16 913
Spain 8 194 30 850 –22 657 39 044
Sweden 15 980 16 591 –611 32 571
Switzerland 6 194 10 907 –4 713 17 101
Turkey 954 6 503 –5 550 7 457
United Kingdom 37 560 68 723 –31 163 106 282
United States 164 623 273 360 –108 737 437 983
EU15, excl. intra-EU trade 176 033 262 809 –86 776 438 843
Accession countries
Chile .. .. .. ..
Estonia 827 1 193 –366 2 020
Israel 3 256 5 625 –2 369 8 881
Russian Federation 1 680 19 303 –17 623 20 983
Slovenia 761 1 425 –663 2 186
Emerging economies
Brazil 3 380 14 315 –10 935 17 696
China 355 568 255 195 100 373 610 764
Hong Kong, China 148 084 154 416 –6 332 302 500
India 1 877 18 091 –16 214 19 968
Indonesia 5 998 3 993 2 005 9 991
Malaysia 73 187 52 900 20 287 126 087
Singapore 108 325 80 674 27 651 188 998
South Africa 1 142 7 707 –6 565 8 849
Chinese Taipei 85 342 49 824 35 518 135 166
Thailand 34 150 27 044 7 107 61 194
Vietnam1 2 049 3 406 –1 357 5 455
An
OE
CD
Bro
wo
L e c tur
ylnO dae
R
OECD INFORMATION TECHNOLOGY OUTLOOK 2008 – ISBN 978-92-64-05553-7 – © OECD 2008114

2. GLOBALISATION OF THE ICT SECTOR
se_it E ditin
es
eu
le
Selected non-member economies
Saudi Arabia 911 7 186 –6 276 8 097
Romania 1 265 5 126 –3 860 6 391
Argentina 307 4 981 –4 674 5 288
Costa Rica1 2 133 2 805 –672 4 938
Colombia 63 3 962 –3 899 4 025
Morocco 837 2 130 –1 294 2 967
Malta 1 492 1 223 269 2 715
Croatia 676 1 781 –1 105 2 457
Pakistan 91 2 357 –2 266 2 449
Bulgaria 442 1 796 –1 354 2 238
Lithuania 700 1 517 –817 2 217
Tunisia 640 1 125 –485 1 765
Kazakhstan 31 1 699 –1 668 1 730
Peru 14 1 630 –1 615 1 644
Jordan 496 1 141 –645 1 637
Paraguay 5 1 532 –1 527 1 537
Serbia 135 1 233 –1 099 1 368
Latvia 312 986 –674 1 297
Oman 448 651 –203 1 099
Ecuador 47 1 039 –992 1 085
1 2 http://dx.doi.org/10.1787/4765522547141. 2006 data.Source: OECD, based on data from the joint OECD-UNSD ITCS database, November 2008.
Table 2.A1.4. ICT goods trade, 2007 (cont.)USD millions in current prices
Exports Imports Balance Trade
An
OE
CD
Bro
wo
L e c tur
ylnO dae
R
OECD INFORMATION TECHNOLOGY OUTLOOK 2008 – ISBN 978-92-64-05553-7 – © OECD 2008 115

2. GLOBALISATION OF THE ICT SECTOR
se_it E ditin
es
eu
le
Table 2.A1.5. OECD accession countries trade in ICT goods, 1996-2006USD millions in current prices and annual growth per cent
1996 1998 2000 2002 2004 2006 CAGR
CHILE
Exports
Communication equipment . . 5 12 14 9 18 13.8
Computer equipment . . 12 15 15 17 22 9.1
Electronic components . . 1 2 5 5 9 33.5
Audio and video equipment . . 2 1 3 2 5 14.1
Other ICT goods . . 3 5 4 5 7 13.1
Total ICT goods . . 23 34 41 39 61 13.2
Imports
Communication equipment . . 679 625 511 659 1 145 9.4
Computer equipment . . 533 609 465 590 862 5.3
Electronic components . . 134 161 112 163 228 14.1
Audio and video equipment . . 336 314 259 393 650 5.8
Other ICT goods . . 141 125 127 163 251 5.3
Total ICT goods . . 1 823 1 834 1 474 1 967 3 135 7.3
ESTONIA
Exports
Communication equipment 14 286 708 278 420 568 44.9
Computer equipment 62 22 11 16 10 29 –7.3
Electronic components 47 112 239 298 600 663 30.3
Audio and video equipment 27 13 15 8 13 62 8.8
Other ICT goods 12 28 24 25 36 45 14.6
Total ICT goods 161 462 996 625 1 079 1 367 23.8
Imports
Communication equipment 72 150 145 163 184 212 11.4
Computer equipment 113 95 84 111 122 190 5.3
Electronic components 59 306 701 319 661 812 30.0
Audio and video equipment 73 59 52 61 105 179 9.3
Other ICT goods 37 40 46 38 64 85 8.7
Total ICT goods 355 650 1 028 691 1 135 1 478 15.3
ISRAEL
Exports
Communication equipment 1 651 2 432 4 004 2 433 2 766 2 582 4.6
Computer equipment 742 1 054 591 367 530 363 –6.9
Electronic components 735 801 2 326 1 663 1 773 632 –1.5
Audio and video equipment 153 160 256 326 374 270 5.8
Other ICT goods 302 615 744 514 1 023 1 231 15.1
Total ICT goods 3 584 5 061 7 921 5 303 6 466 5 078 3.5
Imports
Communication equipment 842 759 1 115 838 906 1 000 1.7
Computer equipment 1 057 1 114 1 635 1 218 1 415 1 600 4.2
Electronic components 1 047 991 1 995 921 1 586 1 494 3.6
Audio and video equipment 290 288 424 342 412 558 6.7
Other ICT goods 398 415 704 606 731 791 7.1
Total ICT goods 3 635 3 566 5 874 3 925 5 049 5 442 4.1
RUSSIAN FEDERATION
Exports
Communication equipment . . 113 96 110 239 559 21.4
Computer equipment . . 53 51 78 71 99 7.2
Electronic components . . 150 265 306 257 306 8.0
Audio and video equipment . . 48 22 28 32 35 –20.1
Other ICT goods . . 245 364 420 538 519 4.6
Total ICT goods . . 609 799 942 1 137 1 519 5.8
An
OE
CD
Bro
wo
L e c tur
ylnO dae
R
OECD INFORMATION TECHNOLOGY OUTLOOK 2008 – ISBN 978-92-64-05553-7 – © OECD 2008116

2. GLOBALISATION OF THE ICT SECTOR
se_it E ditin
es
eu
le
Imports
Communication equipment . . 1 172 749 1 313 2 174 6 249 17.2
Computer equipment . . 243 252 634 1 137 2 425 23.1
Electronic components . . 149 161 408 755 1 195 19.6
Audio and video equipment . . 133 101 417 822 2 017 22.7
Other ICT goods . . 890 620 759 1 089 1 959 8.9
Total ICT goods . . 2 586 1 883 3 532 5 977 13 845 17.1
SLOVENIA
Exports
Communication equipment 111 90 78 128 187 134 1.9
Computer equipment 11 15 17 23 49 77 20.9
Electronic components 53 65 119 90 148 123 8.9
Audio and video equipment 51 41 53 53 14 48 –0.5
Other ICT goods 142 141 131 143 220 246 5.7
Total ICT goods 368 351 397 436 619 629 5.5
Imports
Communication equipment 89 122 190 164 263 227 9.8
Computer equipment 190 212 201 248 361 416 8.2
Electronic components 120 119 166 159 194 175 3.8
Audio and video equipment 56 73 67 77 146 207 13.9
Other ICT goods 81 83 71 86 165 191 8.9
Total ICT goods 537 609 694 734 1 128 1 216 8.5
1 2 http://dx.doi.org/10.1787/476556047876Note: For Chile and the Russian Federation, CAGR 1997-2006. Source: OECD, based on data from the joint OECD-UNSD ITCS and COMTRADE database, September 2008.
Table 2.A1.5. OECD accession countries trade in ICT goods, 1996-2006 (cont.)USD millions in current prices and annual growth per cent
1996 1998 2000 2002 2004 2006 CAGR
An
OE
CD
Bro
wo
L e c tur
ylnO dae
R
OECD INFORMATION TECHNOLOGY OUTLOOK 2008 – ISBN 978-92-64-05553-7 – © OECD 2008 117

2. GLOBALISATION OF THE ICT SECTOR
se_it E ditin
es
eu
le
Table 2.A1.6. Emerging economies trade in ICT goods, 1996-2006USD millions in current prices and annual growth per cent
1996 1998 2000 2002 2004 2006 CAGR
BRAZIL
Exports
Communication equipment . . 251 1 145 1 361 1 162 3 112 34.6
Computer equipment . . 240 366 159 281 355 3.6
Electronic components . . 183 385 444 391 344 7.9
Audio and video equipment . . 357 417 269 244 175 –8.8
Other ICT goods . . 159 201 187 212 409 13.5
Total ICT exports . . 1 190 2 513 2 420 2 290 4 396 15.8
Imports
Communication equipment . . 1 811 1 889 689 922 1 241 –5.3
Computer equipment . . 1 539 1 786 1 244 1 460 2 520 5.8
Electronic components . . 2 487 4 029 2 716 4 407 6 776 10.5
Audio and video equipment . . 598 398 338 543 1 136 1.6
Other ICT goods . . 1 240 1 032 1 034 1 283 1 583 3.0
Total ICT imports . . 7 676 9 133 6 020 8 616 13 256 5.1
CHINA
Exports
Communication equipment 2 417 3 004 6 675 10 801 25 579 51 627 35.8
Computer equipment 5 317 10 168 16 577 33 253 83 790 125 636 37.2
Electronic components 3 782 5 781 11 263 15 520 34 884 65 666 33.0
Audio and video equipment 6 283 7 501 11 165 17 855 33 309 50 007 23.1
Other ICT goods 785 965 1 316 1 948 2 859 6 057 22.7
Total ICT exports 18 584 27 419 46 996 79 377 180 422 298 993 32.0
Imports
Communication equipment 2 861 4 427 6 297 6 792 6 904 8 620 11.7
Computer equipment 2 877 5 300 9 883 15 929 28 209 38 104 29.5
Electronic components 7 375 12 149 28 432 44 849 97 302 157 689 35.8
Audio and video equipment 1 889 1 961 2 920 3 978 6 877 10 226 18.4
Other ICT goods 1 848 1 677 3 065 4 900 9 371 11 838 20.4
Total ICT imports 16 850 25 514 50 597 76 447 148 663 226 477 29.7
INDIA
Exports
Communication equipment 54 45 68 90 101 298 18.6
Computer equipment 281 70 253 252 347 372 2.8
Electronic components 194 99 197 295 403 576 11.5
Audio and video equipment 96 63 99 139 139 164 5.5
Other ICT goods 34 41 96 163 214 332 25.7
Total ICT exports 659 317 714 939 1 205 1 742 10.2
Imports
Communication equipment 171 302 481 1 726 3 619 6 285 43.4
Computer equipment 356 729 1 428 1 453 2 535 3 980 27.3
Electronic components 472 557 773 1 102 1 450 2 174 16.5
Audio and video equipment 83 112 167 256 488 922 27.2
Other ICT goods 285 421 451 653 947 1 491 18.0
Total ICT imports 1 368 2 122 3 300 5 189 9 040 14 852 26.9
INDONESIA
Exports
Communication equipment 421 402 725 239 438 535 2.4
Computer equipment 699 755 3 009 2 137 2 515 2 314 12.7
Electronic components 518 451 1 344 1 321 1 553 1 550 11.6
Audio and video equipment 1 553 921 2 684 2 828 2 453 2 246 3.8
Other ICT goods 96 46 83 156 317 303 12.2
Total ICT exports 3 287 2 575 7 844 6 680 7 276 6 948 7.8
An
OE
CD
Bro
wo
L e c tur
ylnO dae
R
OECD INFORMATION TECHNOLOGY OUTLOOK 2008 – ISBN 978-92-64-05553-7 – © OECD 2008118

2. GLOBALISATION OF THE ICT SECTOR
se_it E ditin
es
eu
le
Imports
Communication equipment 1 356 454 256 383 990 1 149 –1.6
Computer equipment 201 137 189 228 336 507 9.7
Electronic components 805 171 164 209 300 248 –11.1
Audio and video equipment 89 42 133 121 178 217 9.3
Other ICT goods 399 237 259 139 261 289 –3.2
Total ICT imports 2 851 1 041 1 001 1 081 2 065 2 411 –1.7
SOUTH AFRICA
Exports
Communication equipment . . 194 223 178 233 204 6.2
Computer equipment . . 124 127 96 108 248 7.1
Electronic components . . 25 42 78 142 166 19.5
Audio and video equipment . . 32 50 43 100 141 17.8
Other ICT goods . . 92 79 99 177 196 11.0
Total ICT exports . . 467 521 493 761 955 10.3
Imports
Communication equipment . . 2 004 1 432 1 216 1 748 2 645 9.1
Computer equipment . . 1 067 1 020 939 2 074 2 563 10.1
Electronic components . . 425 456 347 491 652 4.5
Audio and video equipment . . 375 353 337 742 941 11.3
Other ICT goods . . 367 387 399 633 913 8.6
Total ICT imports . . 4 237 3 648 3 237 5 688 7 714 9.1
1 2 http://dx.doi.org/10.1787/476561008083Note: South Africa includes the South African Customs Union for 1998. For Brazil and South Africa, CAGR 1997-2006. Source: OECD, based on data from the joint OECD-UNSD ITCS and COMTRADE database, September 2008.
Table 2.A1.7. Direction of ICT goods exports, 1996-2006 USD millions in current prices and percentages
From To 1996 1998 2000 2002 2004 2006 CAGR
Values
OECD World 503 774 555 341 737 410 619 210 789 895 931 713 6.3
OECD OECD 361 233 408 447 539 911 448 340 547 433 638 275 5.9
OECD Non-OECD (incl. unrecorded) 142 542 146 894 197 499 170 870 242 462 293 438 7.5
Shares
OECD World 100 100 100 100 100 100
OECD OECD 72 74 73 72 69 69
OECD Non-OECD (incl. unrecorded) 28 26 27 28 31 31
1 2 http://dx.doi.org/10.1787/476605228718Source: OECD, based on data from the joint OECD-UNSD ITCS and COMTRADE database, July 2008.
Table 2.A1.6. Emerging economies trade in ICT goods, 1996-2006 (cont.)USD millions in current prices and annual growth per cent
1996 1998 2000 2002 2004 2006 CAGR
An
OE
CD
Bro
wo
L e c tur
ylnO dae
R
OECD INFORMATION TECHNOLOGY OUTLOOK 2008 – ISBN 978-92-64-05553-7 – © OECD 2008 119

2. GLOBALISATION OF THE ICT SECTOR
se_it E ditin
es
eu
le
Table 2.A1.8. Direction of ICT goods imports, 1996-2006 USD millions in current prices and percentages
To From 1996 1998 2000 2002 2004 2006 CAGR
Values
OECD World 514 994 580 998 787 952 662 970 880 959 1 048 606 7.4
OECD OECD 361 704 407 013 533 376 421 849 511 402 570 322 4.7
OECD Non-OECD (incl. unrecorded) 153 290 173 985 254 575 241 121 369 558 478 283 12.1
Shares
OECD World 100 100 100 100 100 100
OECD OECD 70 70 68 64 58 54
OECD Non-OECD (incl. unrecorded) 30 30 32 36 42 46
1 2 http://dx.doi.org/10.1787/476606857272Source: OECD, based on data from the joint OECD-UNSD ITCS and COMTRADE database, July 2008.
Table 2.A1.9. OECD trade in computer and related equipment, 1996-2006 USD millions in current prices and annual growth per cent
Exports Imports
1996 2001 2006 CAGR 1996 2001 2006 CAGR
Australia 1 270 756 759 –5.0 4 181 3 630 6 250 4.1
Austria 528 1 033 1 352 9.9 1 793 2 119 3 103 5.6
Belgium 2 402 4 021 4 759 7.1 3 607 5 069 5 725 4.7
Canada 4 919 4 097 3 426 –3.6 8 355 9 785 11 809 3.5
Czech Republic 179 1 002 7 192 44.6 886 1 602 5 771 20.6
Denmark 839 855 1 309 4.5 2 103 1 934 3 559 5.4
Finland 974 326 776 –2.2 1 369 1 237 1 871 3.2
France 8 722 7 720 6 942 –2.3 11 723 12 916 16 444 3.4
Germany 10 374 14 387 28 718 10.7 19 301 26 276 39 343 7.4
Greece 24 72 102 15.6 430 582 1 071 9.6
Hungary 34 2 520 4 403 62.8 322 1 945 3 157 25.7
Iceland . . 1 2 . . . . 73 130 . .
Ireland 9 605 19 468 17 029 5.9 6 014 10 728 12 474 7.6
Italy 4 439 2 695 1 887 –8.2 6 703 6 990 8 805 2.8
Japan 27 913 22 239 22 343 –2.2 18 362 22 388 25 392 3.3
Korea 5 420 13 125 17 284 12.3 3 638 5 358 7 647 7.7
Luxembourg 0 193 367 . . 0 421 574 . .
Mexico 3 779 12 759 12 042 12.3 1 973 7 488 11 255 19.0
Netherlands 13 109 22 791 37 149 11.0 13 910 20 715 38 583 10.7
New Zealand 66 90 139 7.7 666 589 1 052 4.7
Norway 345 312 319 –0.8 1 392 1 542 2 387 5.5
Poland 59 86 308 17.9 978 1 474 2 729 10.8
Portugal 53 243 737 30.1 757 1 016 1 406 6.4
Slovak Republic . . 78 882 . . . . 324 871 . .
Spain 1 498 1 443 1 188 –2.3 3 393 3 938 7 511 8.3
Sweden 777 670 1 713 8.2 3 233 2 741 4 858 4.2
Switzerland 816 948 601 –3.0 3 492 3 839 4 058 1.5
Turkey 14 46 42 11.4 654 674 2 038 12.0
United Kingdom 17 216 17 546 18 965 1.0 18 344 22 275 26 630 3.8
United States 43 146 46 761 46 453 0.7 61 031 73 573 100 763 5.1
OECD 158 521 198 284 239 186 4.2 198 611 253 241 357 263 6.0
1 2 http://dx.doi.org/10.1787/476630714251Notes: No data for the Slovak Republic prior to 1997. Belgium includes Luxembourg prior to 1999. Source: OECD, based on data from the joint OECD-UNSD ITCS and COMTRADE database, July 2008.
An
OE
CD
Bro
wo
L e c tur
ylnO dae
R
OECD INFORMATION TECHNOLOGY OUTLOOK 2008 – ISBN 978-92-64-05553-7 – © OECD 2008120

2. GLOBALISATION OF THE ICT SECTOR
se_it E ditin
es
eu
le
Table 2.A1.10. OECD trade in electronic components, 1996-2006 USD millions in current prices and annual growth per cent
Exports Imports
1996 2001 2006 CAGR 1996 2001 2006 CAGR
Australia 131 219 338 9.9 1 225 830 1 196 –0.2
Austria 1 398 2 561 3 283 8.9 1 336 2 148 2 546 6.7
Belgium 1 457 1 897 2 339 4.8 1 738 2 642 2 765 4.8
Canada 3 831 3 617 3 386 –1.2 7 522 6 387 6 280 –1.8
Czech Republic 496 901 2 079 15.4 501 1 720 4 594 24.8
Denmark 453 552 948 7.7 584 977 1 423 9.3
Finland 733 1 170 1 281 5.7 1 587 2 262 3 757 9.0
France 7 670 8 487 11 013 3.7 7 031 8 048 9 914 3.5
Germany 10 198 15 189 24 341 9.1 12 166 17 132 28 171 8.8
Greece 13 20 68 17.5 116 196 313 10.5
Hungary 313 1 359 2 692 24.0 380 3 931 8 237 36.0
Iceland . . 0 0 . . . . 13 25 . .
Ireland 2 102 6 228 4 686 8.3 1 993 4 876 2 509 2.3
Italy 3 720 4 151 5 046 3.1 4 848 4 635 5 735 1.7
Japan 42 108 38 553 61 952 3.9 15 707 19 458 33 018 7.7
Korea 19 493 18 204 44 524 8.6 12 984 18 596 30 113 8.8
Luxembourg . . 157 232 . . . . 192 156 . .
Mexico 4 081 4 528 5 850 3.7 8 248 18 598 24 616 11.6
Netherlands 6 110 1 896 10 472 5.5 3 649 3 383 7 693 7.7
New Zealand 38 48 134 13.3 135 187 235 5.7
Norway 158 241 371 8.9 365 408 618 5.4
Poland 287 456 1 132 14.7 575 1 170 4 507 22.9
Portugal 457 843 1 685 13.9 706 1 133 2 541 13.7
Slovak Republic . . 234 446 . . . . 365 1 692 . .
Spain 737 1 125 1 528 7.6 1 550 2 136 4 478 11.2
Sweden 3 552 2 191 4 265 1.8 2 756 2 403 3 114 1.2
Switzerland 888 1 042 1 413 4.8 1 052 1 253 1 463 3.4
Turkey 43 56 24 –5.8 682 981 920 3.0
United Kingdom 9 927 12 103 10 164 0.2 13 235 12 163 8 448 –4.4
United States 44 672 57 593 63 194 3.5 44 921 40 733 39 821 –1.2
OECD 165 068 185 621 268 887 5.0 147 590 178 955 240 897 5.0
1 2 http://dx.doi.org/10.1787/476664664418Notes: No data for the Slovak Republic prior to 1997. Belgium includes Luxembourg prior to 1999. Source: OECD, based on data from the joint OECD-UNSD ITCS and COMTRADE database, July 2008.
An
OE
CD
Bro
wo
L e c tur
ylnO dae
R
OECD INFORMATION TECHNOLOGY OUTLOOK 2008 – ISBN 978-92-64-05553-7 – © OECD 2008 121

2. GLOBALISATION OF THE ICT SECTOR
se_it E ditin
es
eu
le
Table 2.A1.11. OECD trade in communication equipment, 1996-2006 USD millions in current prices and annual growth per cent
Exports Imports
1996 2001 2006 CAGR 1996 2001 2006 CAGR
Australia 485 630 498 0.2 1 606 2 306 4 087 9.4
Austria 466 478 2 062 15.7 651 1 310 2 252 13.2
Belgium 1 216 2 999 1 577 4.9 1 185 2 869 2 186 8.5
Canada 3 560 5 196 7 372 6.7 2 871 4 864 5 779 8.0
Czech Republic 73 509 897 37.0 654 752 1 131 10.9
Denmark 621 1 366 2 017 0.0 811 1 571 3 116 0.0
Finland 3 477 7 029 10 749 12.1 562 1 208 2 592 20.8
France 4 245 8 201 10 552 4.0 2 714 5 929 11 470 11.6
Germany 8 315 14 047 21 155 7.5 4 662 10 391 18 784 11.5
Greece 79 228 370 12.9 459 765 1 221 11.8
Hungary 30 1 730 6 398 0.0 391 764 1 891 0.0
Iceland . . 0 3 . . . . 44 70 . .
Ireland 888 2 924 1 029 3.0 419 2 408 1 606 12.9
Italy 2 210 3 747 4 429 6.8 2 475 4 744 7 425 9.7
Japan 10 407 8 057 4 552 –2.7 4 343 4 722 4 638 7.7
Korea 2 099 9 044 19 205 27.1 1 715 2 055 3 047 10.1
Luxembourg . . 749 182 . . . . 782 381 . .
Mexico 2 151 9 078 11 037 15.2 1 501 4 536 6 439 13.9
Netherlands 1 576 4 713 5 663 21.6 1 786 6 362 6 417 22.3
New Zealand 81 81 103 3.8 392 354 536 4.3
Norway 470 484 714 4.7 751 830 1 296 7.0
Poland 75 132 701 0.0 662 1 408 2 286 0.0
Portugal 79 136 217 0.0 403 788 1 031 0.0
Slovak Republic . . 49 322 . . . . 208 698 . .
Spain 930 1 477 1 290 0.0 2 448 3 519 6 307 0.0
Sweden 5 983 5 145 7 793 4.0 1 306 1 989 3 098 11.8
Switzerland 768 795 992 0.6 1 077 1 361 2 013 7.3
Turkey 108 173 44 –1.6 528 911 1 063 9.5
United Kingdom1 7 342 15 623 48 684 –0.8 7 011 10 357 28 064 7.5
United States 14 561 20 400 21 918 5.0 13 339 32 204 55 572 14.8
OECD 72 296 125 224 192 526 0.0 56 722 112 311 186 495 0.0
1 2 http://dx.doi.org/10.1787/4767211201211. See Box 2.1 in Chapter 2.Notes: No data for the Slovak Republic prior to 1997. Belgium includes Luxembourg prior to 1999.Source: OECD, based on data from the joint OECD-UNSD ITCS and COMTRADE database, July 2008.
An
OE
CD
Bro
wo
L e c tur
ylnO dae
R
OECD INFORMATION TECHNOLOGY OUTLOOK 2008 – ISBN 978-92-64-05553-7 – © OECD 2008122

2. GLOBALISATION OF THE ICT SECTOR
se_it E ditin
es
eu
le
Table 2.A1.12. OECD trade in audio and video equipment, 1996-2006 USD millions in current prices an annual growth per cent
Exports Imports
1996 2001 2006 CAGR 1996 2001 2006 CAGR
Australia 53 71 151 11.1 1 319 1 402 3 509 10.3
Austria 284 466 538 6.6 941 879 1 661 5.8
Belgium 2 552 2 639 3 636 3.6 1 766 2 450 3 927 8.3
Canada 284 381 679 9.1 2 086 3 197 6 209 11.5
Czech Republic 33 625 2 786 55.9 313 349 1 639 18.0
Denmark 645 680 1 240 6.8 844 690 1 723 7.4
Finland 198 146 603 11.7 355 408 1 141 12.4
France 2 417 2 690 3 329 3.3 3 896 3 923 8 343 7.9
Germany 4 415 4 278 8 368 6.6 7 668 7 754 14 964 6.9
Greece 9 27 63 21.0 402 356 892 8.3
Hungary 209 1 660 4 516 36.0 214 1 057 1 435 20.9
Iceland . . 0 0 . . . . 27 77 . .
Ireland 399 396 800 7.2 643 420 977 4.3
Italy 846 455 695 –1.9 2 172 2 621 5 201 9.1
Japan 13 753 16 155 20 225 3.9 5 551 7 399 8 765 4.7
Korea 6 831 5 732 5 772 –1.7 1 226 1 671 3 489 11.0
Luxembourg . . 374 289 . . . . 199 380 . .
Mexico 5 682 9 531 20 147 13.5 1 913 3 604 4 515 9.0
Netherlands 1 976 1 931 7 636 14.5 2 931 3 794 8 890 11.7
New Zealand 7 7 17 8.9 259 189 514 7.1
Norway 39 158 111 11.0 379 479 1 161 11.9
Poland 169 1 000 3 557 35.6 347 568 1 440 15.3
Portugal 673 745 1 169 5.7 497 524 834 5.3
Slovak Republic . . 159 3 696 . . . . 145 811 . .
Spain 1 172 1 356 3 420 11.3 1 852 2 228 5 517 11.5
Sweden 291 478 1 431 17.2 842 1 047 2 832 12.9
Switzerland 135 109 182 3.0 812 829 1 541 6.6
Turkey 310 873 1 594 17.8 268 229 522 6.9
United Kingdom 4 320 2 644 5 763 2.9 4 664 5 611 12 172 10.1
United States 7 082 6 994 9 848 3.4 21 473 30 847 59 428 10.7
OECD 54 785 62 761 112 261 7.4 65 631 84 894 164 510 9.6
1 2 http://dx.doi.org/10.1787/476758717373Notes: No data for the Slovak Republic prior to 1997. Belgium includes Luxembourg prior to 1999. Source: OECD, based on data from the joint OECD-UNSD ITCS and COMTRADE database, July 2008.
An
OE
CD
Bro
wo
L e c tur
ylnO dae
R
OECD INFORMATION TECHNOLOGY OUTLOOK 2008 – ISBN 978-92-64-05553-7 – © OECD 2008 123

2. GLOBALISATION OF THE ICT SECTOR
se_it E ditin
es
eu
le
Table 2.A1.13. OECD trade in other ICT-related equipment, 1996-2006 USD millions in current prices and annual growth per cent
Exports Imports
1996 2001 2006 CAGR 1996 2001 2006 CAGR
Australia 241 306 493 7.4 1 049 967 1 941 6.3
Austria 594 699 1 230 7.6 733 864 1 454 7.1
Belgium 644 653 1 343 7.6 906 1 328 2 228 9.4
Canada 1 281 1 721 3 185 9.5 2 691 4 022 5 126 6.7
Czech Republic 113 164 545 17.0 407 443 880 8.0
Denmark 597 607 1 263 7.8 308 396 834 10.5
Finland 552 743 1 232 8.4 341 350 671 7.0
France 2 838 3 359 6 284 8.3 3 094 3 586 5 898 6.7
Germany 9 510 11 181 24 806 10.1 4 939 6 366 11 894 9.2
Greece 56 37 97 5.7 187 195 335 6.0
Hungary 77 241 1 344 33.2 176 353 565 12.4
Iceland . . 7 10 . . . . 28 41 . .
Ireland 270 718 815 11.7 229 417 894 14.6
Italy 1 833 1 776 3 320 6.1 2 255 2 519 3 838 5.5
Japan 9 031 9 692 16 018 5.9 3 895 4 354 7 451 6.7
Korea 474 688 1 760 14.0 3 920 2 655 6 698 5.5
Luxembourg . . 79 74 . . . . 51 87 . .
Mexico 728 2 159 4 386 19.7 1 334 2 367 3 428 9.9
Netherlands 2 129 3 210 9 128 15.7 1 661 1 962 4 011 9.2
New Zealand 39 46 116 11.4 168 127 239 3.6
Norway 288 332 657 8.6 320 299 745 8.8
Poland 57 63 425 22.2 427 440 1 042 9.3
Portugal 109 98 99 –0.9 253 329 418 5.1
Slovak Republic . . 54 172 . . . . 191 503 . .
Spain 633 761 1 120 5.9 1 321 1 457 2 347 5.9
Sweden 805 869 1 274 4.7 957 893 1 548 4.9
Switzerland 1 537 1 407 2 325 4.2 834 898 1 452 5.7
Turkey 21 40 14 –3.9 435 437 968 8.3
United Kingdom 4 310 5 480 7 706 6.0 3 889 4 983 7 314 6.5
United States 14 340 20 403 27 613 6.8 9 711 16 440 24 593 9.7
OECD 53 104 67 593 118 854 8.4 46 441 59 716 99 442 7.9
1 2 http://dx.doi.org/10.1787/476761550034Notes: No data for the Slovak Republic prior to 1997. Belgium includes Luxembourg prior to 1999. Source: OECD, based on data from the joint OECD-UNSD ITCS and COMTRADE database, July 2008.
An
OE
CD
Bro
wo
L e c tur
ylnO dae
R
OECD INFORMATION TECHNOLOGY OUTLOOK 2008 – ISBN 978-92-64-05553-7 – © OECD 2008124

2. GLOBALISATION OF THE ICT SECTOR
se_it E ditin
es
eu
le
Table 2.A1.14. OECD trade in software goods, 1996-2006 USD millions in current prices and annual growth per cent
Exports Imports
1996 2001 2006 CAGR 1996 2001 2006 CAGR
Australia 61 50 80 2.7 403 299 466 1.4
Austria 217 882 1 241 19.1 155 296 667 15.7
Belgium 158 307 380 9.2 328 417 658 7.2
Canada 303 207 291 –0.4 832 997 1 151 3.3
Czech Republic 144 30 371 9.9 73 135 178 9.3
Denmark 82 157 196 9.1 145 206 240 5.1
Finland 30 53 66 8.0 115 125 284 9.5
France 428 443 819 6.7 972 916 1 318 3.1
Germany 784 865 3 924 17.5 1 226 1 174 2 218 6.1
Greece 27 10 49 6.1 64 60 233 13.9
Hungary 15 26 76 17.7 9 99 102 27.2
Iceland . . 0 0 . . . . 10 21 . .
Ireland 3 565 2 972 2 022 –5.5 636 294 268 –8.3
Italy 89 61 180 7.3 558 856 1 419 9.8
Japan 254 301 467 6.3 560 606 636 1.3
Korea 27 185 169 20.3 438 538 582 2.9
Luxembourg . . 46 92 . . . . 45 104 . .
Mexico 36 50 230 20.4 180 389 383 7.8
Netherlands 506 1 125 1 581 12.1 505 489 886 5.8
New Zealand 8 5 15 5.6 74 52 128 5.7
Norway 20 26 59 11.5 149 168 361 9.3
Poland 37 35 242 20.5 16 62 266 32.2
Portugal 4 4 18 16.0 59 129 192 12.6
Slovak Republic . . 10 23 . . . . 34 89 . .
Spain 53 138 141 10.2 267 330 755 11.0
Sweden 88 363 622 21.6 269 327 569 7.8
Switzerland 305 166 222 –3.1 487 755 604 2.2
Turkey 11 6 4 –10.3 42 137 76 6.1
United Kingdom 1 019 1 066 1 968 6.8 1 095 1 466 1 967 6.0
United States 3 087 2 951 3 307 0.7 714 868 1 007 3.5
OECD 11 360 12 539 18 851 5.2 10 370 12 278 17 829 5.6
1 2 http://dx.doi.org/10.1787/476780082101Notes: No data for the Slovak Republic prior to 1997. Belgium includes Luxembourg prior to 1999. Source: OECD, based on data from the joint OECD-UNSD ITCS and COMTRADE database, July 2008.
An
OE
CD
Bro
wo
L e c tur
ylnO dae
R
OECD INFORMATION TECHNOLOGY OUTLOOK 2008 – ISBN 978-92-64-05553-7 – © OECD 2008 125

2. GLOBALISATION OF THE ICT SECTOR
se_it E ditin
es
eu
le
Table 2.A1.15. Trade in ICT services, 1996-2006 USD millions in current prices
Communications Computer and Information Communications Computer and Information
Exports 1996 Imports 1996 Exports 1996 Imports 1996 Exports 2006 Imports 2006 Exports 2006 Imports 2006
Australia 752 843 167 173 641 657 1 049 922
Austria 338 362 84 171 1 350 1 096 1 501 1 059
Belgium . . . . . . . . 2 039 1 596 2 848 1 979
Canada 1 282 1 243 788 529 2 302 1 955 4 033 2 020
Czech Republic 77 63 28 22 436 453 885 538
Denmark . . . . . . . . 801 763 1 216 1 491
Finland 155 194 888 615 432 544 1 488 1 126
France 582 417 509 482 3 698 2 076 1 936 1 966
Germany 2 025 2 692 1 602 2 379 4 318 6 146 9 385 8 947
Greece 71 78 362 55 385 359 203 254
Hungary 42 24 93 58 389 411 485 543
Iceland 23 24 17 2 12 46 89 17
Ireland 86 254 105 306 515 945 20 682 656
Italy 536 944 207 590 3 159 4 585 873 1 699
Japan 1 378 1 869 1 223 2 443 436 733 966 3 126
Korea 643 706 6 76 466 778 240 773
Luxembourg . . . . . . . . 1 363 1 340 2 210 668
Mexico 846 . . . . . . 466 107 . . . .
Netherlands 648 668 638 651 4 002 3 487 3 902 3 746
New Zealand . . . . 29 58 . . 195 184 270
Norway 216 172 122 149 388 299 1 239 1 200
Poland 315 203 28 135 385 456 409 584
Portugal 275 168 40 110 679 471 186 300
Slovak Republic 20 19 8 16 255 98 170 200
Spain 642 443 1 279 976 1 411 2 239 3 961 2 094
Sweden 166 127 121 119 1 602 1 754 3 567 2 245
Switzerland 516 727 . . . . 1 101 802 . . . .
Turkey 0 74 . . . . 416 296 11 14
United Kingdom 1 652 2 094 1 705 518 7 835 7 304 11 949 4 889
United States 3 543 8 792 2 775 422 6 578 5 163 10 096 11 092
OECD . . . . 14 296 12 839 . . 47 151 85 764 54 418
Emerging economies
Brazil 227 91 4 112 205 102 102 2 005
China 315 134 . . . . 738 764 2 958 1 739
India . . . . . . . . 2 191 899 29 186 2 199
Indonesia 278 187 . . . . 1 103 571 118 596
Russian Federation 563 365 . . . . 803 917 632 613
South Africa 86 126 . . . . 305 246 129 127
1 2 http://dx.doi.org/10.1787/476806181407Note: Communication services include telecommunications, postal and courier services. Computer and informationservices include IT and subscription services. Source: OECD Statistics on International Trade in Services, Volume I, detailed tables by Service Category, Sept. 2008.
An
OE
CD
Bro
wo
L e c tur
ylnO dae
R
OECD INFORMATION TECHNOLOGY OUTLOOK 2008 – ISBN 978-92-64-05553-7 – © OECD 2008126

2. GLOBALISATION OF THE ICT SECTOR
se_it E ditin
es
eu
le
Table 2.A1.16. Growth in the value of electronics production, 2005-2008 Per cent per annum
Electronic data
processing
Office equipment
Control andinstrument
Medical and industrial
Radio and radar
Telecoms Consumer Components Total
Australia 1.09 2.62 3.67 4.05 5.54 –0.76 –1.83 3.71 2.42Austria –4.83 0.00 10.39 3.53 3.13 7.47 –2.27 1.80 2.86Belgium –1.41 .. 2.95 5.74 –0.65 –7.12 –3.78 2.07 –0.51Brazil 27.26 14.41 14.98 8.88 16.81 15.75 14.80 14.28 21.24Bulgaria 14.05 2.70 13.04 12.00 15.37 7.72 1.06 9.39 10.67Canada 1.73 6.07 8.91 9.10 8.64 –1.33 –6.52 2.01 4.78China 15.80 10.74 25.39 15.38 17.81 15.55 14.40 15.17 15.86Croatia 10.33 0.00 6.27 6.27 9.14 5.27 .. 14.05 8.17Czech Republic 11.29 –1.94 9.99 7.07 11.64 8.02 28.69 –2.84 12.76Denmark 6.64 .. 8.63 10.79 2.60 11.03 1.36 2.26 6.93Egypt 7.07 3.61 6.15 10.82 10.46 12.90 2.63 3.37 6.28Estonia 14.67 0.00 –0.33 7.22 4.31 3.67 .. 5.49 4.75Finland –3.15 .. 7.34 8.49 –4.28 –2.85 5.27 0.25 –2.22France –13.80 6.74 7.71 9.47 –0.76 0.22 –3.81 1.82 –0.36Germany 0.39 –4.15 8.62 6.19 –1.19 0.99 –4.19 9.08 4.76Greece 11.84 3.45 6.38 18.98 7.72 10.85 0.00 21.14 10.54Hong Kong, China –18.53 –15.75 –4.75 –2.15 –8.33 –13.01 –10.46 –7.12 –10.23Hungary 7.99 0.00 10.63 7.52 7.33 2.01 21.52 3.80 10.38India 21.70 7.72 13.48 10.75 65.17 11.34 9.05 5.28 19.93Indonesia –0.66 –0.61 3.78 5.76 4.42 –11.13 –3.21 2.99 0.19Ireland 7.67 1.72 11.64 2.47 14.14 –3.82 7.99 3.25 6.03Israel 1.33 –11.17 5.96 10.70 2.81 0.82 –2.23 2.41 3.20Italy –2.43 –23.31 5.26 10.63 –2.48 3.09 7.34 3.11 2.14Japan –3.05 –7.02 –3.98 2.22 –5.16 –7.22 1.50 0.49 –1.31Korea –5.00 –9.33 9.08 16.71 –2.42 –2.81 –3.88 0.84 –1.13Lithuania 7.24 10.06 7.56 32.64 43.42 37.00 –0.93 –19.66 0.68Malaysia 13.67 34.03 16.39 23.52 20.89 11.31 –6.43 5.63 8.58Mexico 3.06 10.72 5.90 1.50 7.67 –5.65 20.78 3.39 10.34Netherlands –2.82 –9.29 3.19 16.34 –8.16 2.33 –7.17 –1.15 1.76New Zealand 5.70 –12.21 3.27 7.92 8.54 2.10 –8.53 10.90 5.99Norway 0.99 .. 5.53 7.72 4.70 5.17 .. 20.10 6.58Philippines 4.07 9.20 3.72 10.98 –5.94 –0.67 –4.16 3.93 3.34Poland 5.98 2.17 2.96 4.91 7.31 4.01 31.06 –8.45 15.84Portugal –6.88 0.00 22.00 22.00 8.76 2.67 7.51 10.82 5.59Puerto Rico –11.26 –3.13 1.22 –15.93 4.32 0.50 –3.29 –6.62 –11.93Romania 13.83 0.00 9.65 11.17 8.01 2.21 –2.27 5.90 6.43Russian Federation 14.92 2.91 6.99 6.14 11.24 5.27 11.04 7.76 9.55Saudi Arabia 3.31 –1.34 4.87 2.62 7.41 2.89 –3.85 3.82 3.93Singapore –9.12 –4.22 4.23 17.92 5.76 0.15 –12.17 8.34 1.52Slovak Republic 7.60 3.57 9.35 4.59 7.96 1.91 61.82 12.82 40.17Slovenia 10.97 0.00 8.13 6.40 2.44 1.90 3.23 1.54 3.99South Africa 0.48 –0.32 2.40 0.00 2.60 0.93 4.27 –1.09 1.32Spain –1.52 –10.93 1.61 6.99 4.70 –3.45 –4.44 7.97 0.61Sweden –3.15 .. 3.65 10.96 –2.69 0.56 9.49 1.22 0.06Switzerland –2.19 –10.74 6.76 6.85 0.53 –0.41 2.05 2.57 3.85Chinese Taipei –14.05 –9.62 18.17 33.19 3.23 –16.50 –2.16 10.02 7.38Thailand 16.49 –2.90 18.59 17.74 6.62 1.26 12.05 13.97 14.07Turkey 15.48 –5.80 0.66 3.98 1.64 0.48 0.82 6.73 2.01United Kingdom –21.47 –15.48 6.50 7.34 5.58 2.64 –7.60 –2.76 –1.34Ukraine 11.32 3.23 5.07 9.31 7.00 3.70 3.45 5.36 6.52United States –1.21 –1.27 3.78 4.30 2.94 –0.78 –4.22 2.18 1.76Venezuela 3.31 0.33 10.81 7.93 3.31 1.99 –2.57 9.35 4.90Vietnam 35.29 6.35 10.85 7.60 11.76 –1.08 15.56 14.17 18.44World 6.64 0.45 6.09 7.55 4.75 2.88 9.34 4.94 5.86
1 2 http://dx.doi.org/10.1787/476812275200Source: OECD, based on data provided by Reed Electronics Research.
An
OE
CD
Bro
wo
L e c tur
ylnO dae
R
OECD INFORMATION TECHNOLOGY OUTLOOK 2008 – ISBN 978-92-64-05553-7 – © OECD 2008 127

2. GLOBALISATION OF THE ICT SECTOR
se_it E ditin
es
eu
le
Table 2.A1.17. Share of ICT goods in total merchandise exports, 1996-2006Per cent
1996 1998 2000 2002 2004 2006
Australia 3.6 3.4 3.2 2.7 2.5 1.8
Austria 5.7 6.7 7.9 8.0 7.1 6.3
Belgium 4.9 5.4 6.2 4.9 4.4 3.7
Canada 6.9 6.8 8.2 4.8 4.5 4.7
Czech Republic 4.1 5.3 7.3 12.4 13.8 14.2
Denmark 6.5 8.1 8.5 9.8 7.8 7.5
Finland 14.6 20.0 25.4 22.0 19.0 18.9
France 9.1 10.7 12.1 9.1 7.9 8.0
Germany 8.2 8.7 10.5 10.0 10.0 9.6
Greece 1.5 2.4 4.4 3.7 3.8 3.3
Hungary 5.2 20.7 27.7 26.0 30.6 26.1
Iceland . . 0.2 0.6 0.6 0.6 0.4
Ireland 29.1 29.0 34.5 30.8 22.7 22.4
Italy 5.2 4.9 5.3 4.5 4.1 3.7
Japan 25.1 24.1 25.8 22.8 22.0 19.3
Korea 26.5 25.6 35.7 33.9 33.9 27.2
Luxembourg . . . . 14.9 15.1 10.1 8.1
Mexico 17.2 21.0 23.0 22.6 22.0 21.4
Netherlands 14.0 18.8 22.9 18.0 20.1 18.9
New Zealand 1.6 2.5 2.2 2.2 2.3 2.3
Norway 2.7 3.7 2.4 2.3 2.0 1.8
Poland 2.7 4.6 4.5 5.4 4.5 5.6
Portugal 5.9 6.0 7.8 7.8 8.1 9.0
Slovak Republic . . 3.6 3.9 4.3 6.8 13.2
Spain 4.9 5.2 5.4 4.7 4.5 4.0
Sweden 13.7 15.6 19.1 12.4 12.0 11.2
Switzerland 5.2 5.2 5.8 4.1 4.0 3.7
Turkey 2.2 3.9 4.0 4.8 4.9 2.0
United Kingdom 17.0 17.8 19.8 18.5 12.6 20.5
United States 19.9 19.9 23.4 19.1 18.3 16.3
OECD 13.2 13.9 16.6 13.9 13.0 12.4
1 2 http://dx.doi.org/10.1787/476837100418Notes: No data for the Slovak Republic prior to 1997. Belgium includes Luxembourg prior to 1999. Source: OECD, based on data from the joint OECD-UNSD ITCS and COMTRADE database, July 2008.
An
OE
CD
Bro
wo
L e c tur
ylnO dae
R
OECD INFORMATION TECHNOLOGY OUTLOOK 2008 – ISBN 978-92-64-05553-7 – © OECD 2008128

2. GLOBALISATION OF THE ICT SECTOR
se_it E ditin
es
eu
le
Table 2.A1.18. Revealed comparative advantage in ICT goods exports, 1996-2006Balassa Method
1996 1998 2000 2002 2004 2006
Australia 0.27 0.24 0.19 0.19 0.19 0.15
Austria 0.43 0.48 0.47 0.57 0.55 0.51
Belgium 0.37 0.38 0.37 0.35 0.34 0.30
Canada 0.52 0.49 0.49 0.34 0.35 0.38
Czech Republic 0.31 0.38 0.44 0.89 1.07 1.15
Denmark 0.49 0.58 0.51 0.70 0.60 0.61
Finland 1.11 1.44 1.53 1.58 1.46 1.53
France 0.69 0.77 0.73 0.66 0.61 0.64
Germany 0.62 0.63 0.63 0.72 0.77 0.77
Greece 0.12 0.17 0.26 0.26 0.30 0.27
Hungary 0.40 1.49 1.66 1.87 2.36 2.11
Iceland . . 0.01 0.04 0.04 0.05 0.04
Ireland 2.21 2.08 2.08 2.21 1.75 1.81
Italy 0.39 0.35 0.32 0.32 0.32 0.30
Japan 1.90 1.73 1.55 1.64 1.69 1.56
Korea 2.01 1.84 2.15 2.43 2.61 2.20
Luxembourg . . . . 0.90 1.09 0.78 0.65
Mexico 1.30 1.51 1.38 1.62 1.69 1.73
Netherlands 1.06 1.35 1.38 1.29 1.55 1.53
New Zealand 0.12 0.18 0.13 0.16 0.18 0.18
Norway 0.20 0.27 0.14 0.16 0.16 0.14
Poland 0.20 0.33 0.27 0.38 0.35 0.45
Portugal 0.45 0.43 0.47 0.56 0.63 0.73
Slovak Republic . . 0.26 0.23 0.31 0.52 1.07
Spain 0.37 0.37 0.33 0.34 0.35 0.32
Sweden 1.04 1.12 1.15 0.89 0.93 0.90
Switzerland 0.39 0.37 0.35 0.29 0.31 0.30
Turkey 0.16 0.28 0.24 0.34 0.38 0.16
United Kingdom 1.29 1.28 1.19 1.33 0.97 1.66
United States 1.51 1.43 1.40 1.37 1.41 1.32
OECD 1.00 1.00 1.00 1.00 1.00 1.00
1 2 http://dx.doi.org/10.1787/476856538156Notes: No data for the Slovak Republic prior to 1997. Belgium includes Luxembourg prior to 1999. Balassa Index =(Country ICT export/Country Total export)/(OECD ICT export/OECD Total export).Source: OECD, based on data from the joint OECD-UNSD ITCS and COMTRADE database, July 2008.
An
OE
CD
Bro
wo
L e c tur
ylnO dae
R
OECD INFORMATION TECHNOLOGY OUTLOOK 2008 – ISBN 978-92-64-05553-7 – © OECD 2008 129

2. GLOBALISATION OF THE ICT SECTOR
se_it E ditin
es
eu
le
Table 2.A1.19. Grubel and Lloyd Index for ICT goods, 1996-2006
1996 1998 2000 2002 2004 2006
Australia 0.38 0.36 0.30 0.31 0.26 0.23
Austria 0.75 0.75 0.81 0.88 0.88 0.87
Belgium 0.95 0.93 0.93 0.91 0.91 0.90
Canada 0.74 0.71 0.77 0.65 0.64 0.68
Czech Republic 0.49 0.68 0.71 0.90 0.99 0.98
Denmark 0.81 0.86 0.83 0.90 0.85 0.78
Finland 0.83 0.74 0.71 0.70 0.75 0.81
France 0.95 0.97 0.95 0.93 0.86 0.85
Germany 0.94 0.92 0.94 0.97 0.99 0.97
Greece 0.20 0.21 0.33 0.31 0.29 0.31
Hungary 0.62 1.00 0.99 0.98 0.91 0.88
Iceland . . 0.03 0.08 0.13 0.13 0.09
Ireland 0.82 0.84 0.79 0.79 0.79 0.86
Italy 0.83 0.74 0.71 0.71 0.66 0.66
Japan 0.63 0.61 0.70 0.73 0.74 0.78
Korea 0.81 0.73 0.78 0.74 0.66 0.73
Luxembourg . . . . 0.93 0.99 0.91 0.84
Mexico 0.95 0.93 0.97 0.96 1.00 0.97
Netherlands 0.98 0.98 0.99 0.97 0.99 0.97
New Zealand 0.25 0.35 0.28 0.35 0.33 0.33
Norway 0.58 0.59 0.56 0.56 0.50 0.52
Poland 0.36 0.46 0.44 0.59 0.61 0.68
Portugal 0.69 0.62 0.69 0.71 0.73 0.77
Slovak Republic . . 0.51 0.63 0.61 0.86 0.91
Spain 0.64 0.65 0.60 0.62 0.57 0.49
Sweden 0.89 0.90 0.83 0.91 0.93 0.97
Switzerland 0.73 0.69 0.68 0.66 0.68 0.69
Turkey 0.32 0.42 0.31 0.62 0.60 0.48
United Kingdom 0.96 0.96 0.90 0.98 0.80 0.95
United States 0.90 0.89 0.87 0.81 0.78 0.75
OECD 0.99 0.98 0.97 0.97 0.95 0.94
1 2 http://dx.doi.org/10.1787/476860177160Notes: No data for the Slovak Republic prior to 1997. Belgium includes Luxembourg prior to 1999. GLI = [1 – !Mi – Xi! /(Mi + Xi)].Source: OECD, based on data from the joint OECD-UNSD ITCS and COMTRADE database, July 2008.
An
OE
CD
Bro
wo
L e c tur
ylnO dae
R
OECD INFORMATION TECHNOLOGY OUTLOOK 2008 – ISBN 978-92-64-05553-7 – © OECD 2008130

2. GLOBALISATION OF THE ICT SECTOR
se_it E ditin
es
eu
le
Table 2.A1.20. ICT sector cross-border M&A deals, 1997-2007 Number of deals
1997 1998 1999 2000 2001 2002 2003 2004 2005 2006 2007
Target
Communications equipment 62 61 80 102 90 93 63 76 65 70 92
IT equipment 55 55 60 80 41 30 24 38 47 37 48
Electronics 87 134 164 246 225 199 164 193 190 197 225
IT services 213 375 728 1 275 816 619 445 527 610 567 594
IT wholesale 84 105 119 155 108 70 65 58 85 67 62
Telecommunications 158 252 485 669 402 293 236 301 323 363 356
Media and content 48 91 198 347 218 129 112 95 153 172 169
Total cross-border ICTs 707 1 073 1 834 2 874 1 900 1 433 1 109 1 288 1 473 1 473 1 546
ICT share of all 18% 18% 24% 31% 24% 21% 19% 21% 19% 17% 15%
Acquirer
Communications equipment 53 100 91 160 92 86 61 98 113 74 79
IT equipment 45 57 77 95 59 42 46 43 63 38 46
Electronics 103 131 143 234 199 163 118 150 179 115 116
IT services 175 294 514 876 522 351 313 363 503 376 359
IT wholesale 57 70 87 122 63 68 40 27 62 42 46
Telecommunications 135 251 433 589 344 242 164 240 247 251 238
Media and content 39 74 124 255 169 97 79 59 92 81 81
Total cross-border ICTs 607 977 1 469 2 331 1 448 1 049 821 980 1 259 977 965
ICT share of all 15% 17% 19% 25% 18% 15% 14% 16% 16% 12% 10%
1 2 http://dx.doi.org/10.1787/476873137458Source: OECD, based on data provided by Dealogic.
Table 2.A1.21. ICT sector cross-border M&A deal values, 1997-2007 (USD millions in current prices)
1997 2000 2001 2002 2003 2004 2005 2006 2007
Target
Communications equipment 2 617 22 288 14 513 1 670 3 415 3 182 4 738 23 450 9 279
IT equipment 2 591 13 938 3 737 2 892 703 1 566 3 227 1 645 1 955
Electronics 4 973 25 557 18 121 6 515 5 772 9 748 15 164 15 069 35 905
IT services 4 655 41 335 19 851 7 403 7 009 13 985 22 058 21 463 30 587
IT wholesale 4 694 5 355 1 411 2 013 343 1 908 2 093 2 587 2 713
Telecommunications 19 053 306 591 131 772 54 715 42 543 58 364 76 886 104 133 78 484
Media and content 7 334 29 121 14 321 21 727 9 054 2 699 10 010 11 127 11 287
Total cross-border ICTs 45 916 444 184 203 726 96 935 68 840 91 452 134 176 179 473 170 210
ICT share of all 14% 34% 30% 20% 17% 17% 17% 17% 10%
Acquirer
Communications equipment 10 207 36 662 5 143 3 467 1 774 4 833 7 877 26 447 25 200
IT equipment 1 466 7 072 1 345 1 429 644 1 289 2 957 1 613 1 938
Electronics 5 526 20 721 17 473 2 910 4 800 6 911 4 556 8 885 13 523
IT services 4 039 35 745 12 922 11 981 4 353 9 843 10 486 10 040 12 346
IT wholesale 1 754 2 655 633 433 1 215 857 1 099 1 565 861
Telecommunications 16 309 466 134 127 857 37 591 22 217 32 608 64 793 82 251 62 558
Media and content 7 940 34 896 14 570 7 452 4 915 2 438 5 742 4 390 13 709
Total cross-border ICTs 47 241 603 885 179 943 65 264 39 919 58 780 97 509 135 192 130 135
ICT share of all 14% 47% 27% 13% 10% 11% 13% 13% 8%
1 2 http://dx.doi.org/10.1787/477008600273Source: OECD, based on data provided by Dealogic.
An
OE
CD
Bro
wo
L e c tur
ylnO dae
R
OECD INFORMATION TECHNOLOGY OUTLOOK 2008 – ISBN 978-92-64-05553-7 – © OECD 2008 131

2. GLOBALISATION OF THE ICT SECTOR
se_it E ditin
es
eu
le
Table 2.A1.22. ICT sector cross-border M&A deals by target country, 1997-2007 Number of deals
1997 1998 1999 2000 2001 2002 2003 2004 2005 2006 2007
Australia 26 60 75 103 73 37 26 29 39 24 32
Austria 9 10 23 44 26 13 16 19 18 11 20
Belgium 8 18 23 44 32 17 16 15 18 17 17
Canada 45 66 119 135 111 113 61 48 64 60 73
Czech Republic 1 7 10 31 12 12 11 11 14 11 11
Denmark 19 21 42 56 32 29 21 42 23 27 29
Finland 12 6 32 43 38 31 19 20 22 14 20
France 55 69 73 134 100 66 62 85 63 55 47
Germany 57 86 99 184 129 123 95 107 112 104 86
Greece 1 0 2 6 5 3 3 5 3 6 3
Hungary 13 0 21 29 14 8 7 10 10 10 9
Iceland 0 0 0 3 2 1 1 2 1 0
Ireland 2 13 22 45 36 36 15 17 19 18 16
Italy 10 25 40 65 23 21 14 16 17 13 21
Japan 9 14 28 39 31 21 28 34 21 29 57
Korea 1 21 25 25 21 13 14 18 18 31 33
Luxembourg 0 4 13 8 4 5 2 2 5 1 6
Mexico 8 13 16 15 7 8 6 6 1 7 1
Netherlands 36 31 55 87 59 36 34 24 55 23 34
New Zealand 5 9 26 31 19 12 10 11 7 6 12
Norway 7 9 29 51 25 21 16 21 22 22 28
Poland 2 1 13 22 16 12 7 7 11 18 6
Portugal 9 3 10 7 6 5 3 5 7 9 9
Slovak Republic 0 0 6 8 1 2 3 1 7 2 5
Spain 16 13 53 78 44 27 19 20 26 25 26
Sweden 17 18 46 86 86 61 35 51 48 50 47
Switzerland 16 17 41 92 51 27 24 26 30 27 36
Turkey 1 5 5 4 2 3 0 0 4 9 6
United Kingdom 94 147 185 329 226 143 120 114 111 148 129
United States 124 171 264 432 315 215 154 209 230 204 230
OECD 603 857 1 396 2 236 1 546 1 121 842 975 1 026 981 1 049
Emerging economies 29 70 160 281 124 140 120 146 193 222 217
Brazil 12 27 54 60 14 15 8 7 10 21 15
China 6 9 37 91 45 65 57 95 113 127 133
Hong Kong, China 14 17 50 54 29 20 22 24 33 34 38
Indonesia 1 2 2 8 6 4 0 3 9 3 12
India 4 20 47 91 38 39 31 34 53 44 56
Russian Federation 1 5 8 24 14 8 17 5 12 24 12
South Africa 6 9 14 15 13 13 7 5 5 6 1
Chinese Taipei 0 3 17 29 20 6 8 10 14 21 18
World 707 1 073 1 834 2 874 1 900 1 433 1 109 1 288 1 473 1 473 1 546
Non-OECD 104 216 438 638 354 312 267 313 447 492 497
1 2 http://dx.doi.org/10.1787/477016572468Source: OECD, based on data provided by Dealogic.
An
OE
CD
Bro
wo
L e c tur
ylnO dae
R
OECD INFORMATION TECHNOLOGY OUTLOOK 2008 – ISBN 978-92-64-05553-7 – © OECD 2008132

2. GLOBALISATION OF THE ICT SECTOR
se_it E ditin
es
eu
le
Table 2.A1.23. ICT sector cross-border M&A deals by country of acquirer, 1997-2007 Number of deals
1997 1998 1999 2000 2001 2002 2003 2004 2005 2006 2007
Australia 9 14 29 44 31 22 23 15 27 13 29
Austria 0 3 3 23 21 15 11 8 8 9 9
Belgium 9 35 34 44 15 8 11 9 7 8 11
Canada 61 102 104 140 107 74 55 85 72 49 61
Czech Republic 0 0 0 0 1 1 1 1 0 1 4
Denmark 6 6 21 50 28 15 7 10 19 11 11
Finland 3 12 22 53 42 37 27 14 13 17 14
France 20 36 56 102 98 77 36 48 80 45 58
Germany 18 29 67 190 90 44 37 53 68 38 50
Greece 0 2 1 9 11 8 6 2 17 1 2
Hungary 0 0 7 2 3 2 0 0 6 2 1
Iceland 0 0 0 2 1 1 2 3 6 1 0
Ireland 3 12 14 28 20 7 2 5 14 15 9
Italy 2 12 10 40 57 21 15 6 14 12 12
Japan 18 17 49 51 29 28 24 34 46 32 26
Korea 3 3 4 1 4 8 7 4 6 9 0
Luxembourg 3 4 8 34 14 4 6 6 14 15 1
Mexico 3 1 1 3 6 7 7 10 6 6 13
Netherlands 21 33 46 73 33 27 21 24 29 25 29
New Zealand 0 0 4 11 3 1 1 3 8 3 6
Norway 8 20 27 60 30 33 12 27 27 24 25
Poland 0 0 3 1 0 0 1 1 4 1 10
Portugal 0 2 4 9 3 1 1 0 3 3 1
Slovak Republic 0 0 0 1 0 1 0 0 0 1
Spain 7 7 25 47 26 13 6 24 13 16 5
Sweden 16 39 72 99 50 32 32 28 61 46 38
Switzerland 6 15 11 38 34 20 17 22 18 13 8
Turkey 0 0 0 1 1 1 3 0 1 1 1
United Kingdom 67 84 136 232 139 105 98 93 113 82 72
United States 249 400 557 660 376 267 211 296 312 266 226
OECD 532 888 1 315 2 048 1 273 880 680 831 1 012 764 733
Emerging economies 17 22 33 52 37 22 31 32 55 81 60
Brazil 1 0 0 0 3 1 3 2 0
China 2 2 1 5 5 3 7 7 6 13 16
Hong Kong, China 14 9 32 80 43 54 39 34 56 36 33
India 0 0 4 31 18 10 15 15 34 36 30
Indonesia 0 0 2 0 0 0 0 0 0 0 0
Russian Federation 0 1 0 0 1 2 5 7 6 16 7
South Africa 14 19 28 16 10 6 1 3 9 14 7
Chinese Taipei 3 5 11 11 10 10 9 6 12 12 13
World 607 977 1 469 2 331 1 448 1 049 821 980 1 259 977 965
Non-OECD 75 89 154 283 175 169 141 149 247 213 232
1 2 http://dx.doi.org/10.1787/477046684235Source: OECD, based on data provided by Dealogic.
An
OE
CD
Bro
wo
L e c tur
ylnO dae
R
OECD INFORMATION TECHNOLOGY OUTLOOK 2008 – ISBN 978-92-64-05553-7 – © OECD 2008 133

2. GLOBALISATION OF THE ICT SECTOR
se_it E ditin
es
eu
le
Table 2.A1.24. ICT sector cross-border M&A deal values by target country, 1997-2007 USD millions in current prices
1997 1998 1999 2000 2001 2002 2003 2004 2005 2006 2007
Australia 2 082 589 3 328 1 699 8 725 692 1 019 1 203 706 627 3 266
Austria 771 2 694 36 627 184 231 17 453 704 1 879 162
Belgium 46 31 967 5 972 4 590 591 161 545 381 300 882
Canada 386 1 762 13 096 15 998 5 090 3 729 1 843 1 639 3 116 10 018 5 725
Czech Republic 0 287 214 969 503 140 348 273 6 575 1 998 546
Denmark 263 3 519 1 589 3 864 563 1 411 37 2 465 280 221 918
Finland 0 68 245 519 256 8 534 279 458 949 235 113
France 4 304 2 830 6 002 5 905 4 303 1 736 3 322 5 152 4 285 3 807 4 573
Germany 1 612 3 956 5 071 76 315 22 286 3 998 11 935 4 734 3 471 7 488 5 488
Greece 0 0 1 16 89 315 381 1 364 50 506 4 638
Hungary 0 162 95 3 997 64 920 382 366 609 280 1 169
Iceland 0 0 0 6 7 26 9 24 0 0 0
Ireland 83 168 1 694 3 949 5 811 711 116 486 991 5 215 645
Italy 504 1 972 9 220 6 598 347 144 1 252 654 792 394 6 809
Japan 542 405 4 206 3 972 12 537 388 5 368 6 336 7 260 1 016 5 418
Korea 0 2 294 1 399 2 891 4 920 2 682 637 1 242 1 526 0 545
Luxembourg 0 277 1 013 2 399 1 8 081 109 19 4 844 1 065 3 100
Mexico 867 457 11 4 304 1 192 1 810 37 223 213 68 0
Netherlands 4 000 12 223 4 742 22 095 2 454 6 737 4 512 817 10 238 491 8 018
New Zealand 30 413 956 44 142 1 013 156 62 2 71 81
Norway 279 29 1 305 4 438 501 213 301 61 540 1 997 4 792
Poland 9 1 877 6 275 1 404 288 112 63 3 589 639 1 052
Portugal 455 0 112 33 924 276 769 954 242 1 273 905
Slovak Republic 0 0 41 911 180 8 13 15 318 24 83
Spain 1 246 197 533 12 963 2 780 2 697 2 668 239 12 014 1 303 2 974
Sweden 514 112 2 317 4 228 922 1 753 1 277 1 677 1 578 4 919 1 807
Switzerland 636 2 654 703 6 819 8 583 96 2 719 2 285 6 067 1 105 3 753
Turkey 0 23 0 72 0 1 0 0 8 440 5 718 702
United Kingdom 2 554 4 459 60 170 95 980 11 818 2 927 7 983 7 012 11 141 39 300 11 113
United States 13 983 28 652 104 729 65 086 75 730 13 844 11 516 22 443 15 212 40 090 39 295
OECD 35 166 70 236 224 672 358 944 176 904 65 990 59 279 63 264 106 133 132 047 118 572
Emerging economies 2 346 22 209 10 873 52 599 7 067 14 012 2 821 9 634 5 917 11 868 23 566
Brazil 884 18 053 2 325 15 581 5 048 2 243 956 782 188 3 874 1 805
China 124 3 019 7 301 34 236 1 636 10 607 1 303 7 199 2 329 3 062 4 890
Hong Kong, China 1 893 1 933 3 492 4 344 4 570 1 443 762 528 2 855 721 533
India 14 221 357 2 169 161 516 244 1 323 2 932 3 709 15 182
Indonesia 13 90 2 200 657 1 179 0 42 1 055 2 402
Russian Federation 0 196 16 296 197 10 111 158 413 1 068 1 689
South Africa 1 324 721 874 317 25 636 207 172 55 155 0
Chinese Taipei 0 67 124 2 015 853 26 120 183 411 1 504 441
World 45 916 102 185 255 226 444 184 203 726 96 935 68 840 91 452 134 176 179 473 170 210
Non-OECD 10 750 31 949 30 553 85 240 26 822 30 946 9 561 28 189 28 043 47 426 51 638
1 2 http://dx.doi.org/10.1787/477124034558Source: OECD, based on data provided by Dealogic.
An
OE
CD
Bro
wo
L e c tur
ylnO dae
R
OECD INFORMATION TECHNOLOGY OUTLOOK 2008 – ISBN 978-92-64-05553-7 – © OECD 2008134

2. GLOBALISATION OF THE ICT SECTOR
se_it E ditin
es
eu
le
Table 2.A1.25. ICT sector cross-border M&A deal values by country of acquirer, 1997-2007
USD millions in current prices
1997 1998 1999 2000 2001 2002 2003 2004 2005 2006 2007
Australia 5 899 501 2 585 1 041 12 718 576 1 320 248 689 386 3 005
Austria 0 14 0 227 185 42 72 1 1 970 49 1 214
Belgium 75 308 303 1 663 398 89 2 297 523 36 755
Canada 1 017 13 530 2 674 26 877 3 397 545 1 847 2 933 1 834 1 270 3 636
Czech Republic 0 0 0 0 0 0 0 0 0 0 0
Denmark 416 56 764 2 699 1 454 78 1 196 749 250 160 621
Finland 120 739 2 165 2 686 794 304 112 368 244 766 74
France 1 807 7 813 9 879 85 806 12 006 9 196 9 239 3 336 18 527 19 756 7 539
Germany 1 101 2 938 15 637 21 053 42 585 2 843 1 373 5 005 5 722 2 158 25 358
Greece 0 818 0 144 30 13 278 3 1 247 1 1
Hungary 0 0 43 0 1 0 0 0 0 0 78
Iceland 0 0 0 0 16 20 51 0 24 0 0
Ireland 22 157 189 609 443 70 0 15 67 175 96
Italy 914 6 078 2 482 11 697 3 553 239 690 352 666 700 6 406
Japan 1 869 765 1 387 12 821 10 066 3 028 321 597 2 886 1 105 778
Korea 170 6 0 0 24 50 101 122 0 84 1 339
Luxembourg 145 0 773 6 990 5 281 127 80 309 1 279 3 649 1 019
Mexico 36 2 57 153 771 569 2 739 1 429 1 505 3 941 1 959
Netherlands 887 1 257 4 102 23 744 6 162 2 445 180 496 2 198 2 169 2 107
New Zealand 823 269 215 1 0 0 27 42 623
Norway 161 427 821 3 579 492 1 201 52 976 1 309 3 854 1 411
Poland 0 0 5 0 9 15 5 39 97
Portugal 0 3 163 156 2 452 1 234 854 82 0 4 144 6
Slovak Republic 0 0 0 0 0 0 0 0 0 0 0
Spain 1 773 7 832 2 284 39 370 3 447 1 848 15 6 397 8 207 34 176 499
Sweden 78 1 599 1 072 6 659 691 8 327 456 1 756 3 508 2 870 4 338
Switzerland 9 393 2 364 453 1 150 38 92 387 317 186 5 513
Turkey 0 0 61 0 0 0 5 161
United Kingdom 8 260 6 376 70 567 222 737 39 139 4 040 8 119 7 566 9 397 8 913 17 411
United States 14 801 19 891 35 319 50 297 20 724 14 166 7 272 12 414 14 999 18 774 15 627
OECD 39 558 74 662 156 451 524 027 166 976 50 767 35 698 45 770 77 404 105 408 101 671
Emerging economies 2 275 1 995 505 2 118 355 119 1 036 893 3 980 9 009 2 958
Brazil 59 0 0 0 1 0 49 0 0 2 0
China 1 186 1 660 0 39 127 22 540 155 2 864 561 1 012
Hong Kong, China 570 3 616 7 363 42 522 1 037 12 427 532 4 723 793 1 542 646
India 0 0 9 430 96 27 73 100 503 1 007 1 139
Indonesia 0 0 80 0 0 0 0 0 0 0 0
Russian Federation 0 0 0 0 1 5 374 615 463 1 181 807
South Africa 1 030 335 496 1 649 130 64 0 24 150 6 258 0
Chinese Taipei 42 85 340 1 344 469 99 290 345 552 284 1 497
World 47 241 81 651 183 203 603 885 179 943 65 264 39 919 58 780 97 509 135 192 130 135
Non-OECD 7 683 6 988 26 752 79 858 12 967 14 496 4 220 13 010 20 105 29 784 28 464
1 2 http://dx.doi.org/10.1787/477126364806Source: OECD, based on data provided by Dealogic.
An
OE
CD
Bro
wo
L e c tur
ylnO dae
R
OECD INFORMATION TECHNOLOGY OUTLOOK 2008 – ISBN 978-92-64-05553-7 – © OECD 2008 135

2. GLOBALISATION OF THE ICT SECTOR
se_it E ditin
es
eu
le
Table 2.A1.26. ICT sector cross-border M&A deals by economy:Top 50 targets and acquirers, 1997-2007
Number of deals
Target Count Acquirer Count
United States 2 548 United States 3 820
United Kingdom 1 746 United Kingdom 1 221
Germany 1 182 Canada 910
Canada 895 Germany 684
France 809 France 656
China 778 Sweden 513
Sweden 545 Hong Kong, China 430
Australia 524 Netherlands 361
Netherlands 474 Japan 354
India 457 Singapore 348
Switzerland 387 Norway 293
Spain 347 Australia 256
Denmark 341 Finland 254
Hong Kong, China 335 Switzerland 202
Japan 311 Italy 201
Israel 288 India 193
Italy 265 Belgium 191
Finland 257 Spain 189
Norway 251 Denmark 184
Brazil 243 Israel 182
Ireland 239 Ireland 129
Belgium 225 South Africa 127
Korea 220 Austria 110
Austria 209 Luxembourg 109
Singapore 195 Chinese Taipei 102
New Zealand 148 Malaysia 94
Chinese Taipei 146 China 67
Czech Republic 131 Bermuda 64
Hungary 131 Mexico 63
Russian Federation 130 Greece 59
Argentina 119 Korea 59
Poland 115 Russian Federation 45
Malaysia 105 New Zealand 40
Thailand 100 Portugal 27
South Africa 94 Hungary 23
Mexico 88 International 23
Portugal 73 Egypt 22
Philippines 59 Poland 21
Romania 59 Iceland 19
Chile 58 United Arab Emirates 17
Colombia 52 Kuwait 14
Indonesia 50 Argentina 13
Luxembourg 50 Brazil 10
Bulgaria 49 Cyprus 10
Estonia 41 Czech Republic 9
Ukraine 40 Estonia 9
Turkey 39 Philippines 9
Greece 37 Thailand 9
Lithuania 33 Turkey 9
United Arab Emirates 33 Jamaica 8
1 2 http://dx.doi.org/10.1787/477184144488Source: OECD, based on data provided by Dealogic.
An
OE
CD
Bro
wo
L e c tur
ylnO dae
R
OECD INFORMATION TECHNOLOGY OUTLOOK 2008 – ISBN 978-92-64-05553-7 – © OECD 2008136

2. GLOBALISATION OF THE ICT SECTOR
se_it E ditin
es
eu
le
Table 2.A1.27. ICT sector cross-border M&A deals by economy: Largest acquirers and targets, 1997-2007
Number of deals
Country Target of M&A deals Acquirer in M&A deals Net
Largest net acquirers:
United States 2 548 3 820 1 272
Singapore 195 348 153
Hong Kong, China 335 430 95
Luxembourg 50 109 59
Japan 311 354 43
Norway 251 293 42
Bermuda 26 64 38
South Africa 94 127 33
Greece 37 59 22
Canada 895 910 15
Kuwait 2 14 12
Iceland 10 19 9
Egypt 16 22 6
Bahrain 2 4 2
Jamaica 7 8 1
Qatar 3 4 1
Largest net targets:
Poland 115 21 –94
Austria 209 110 –99
Argentina 119 13 –106
Israel 288 182 –106
Hungary 131 23 –108
New Zealand 148 40 –108
Ireland 239 129 –110
Netherlands 474 361 –113
Czech Republic 131 9 –122
France 809 656 –153
Denmark 341 184 –157
Spain 347 189 –158
South Korea 220 59 –161
Switzerland 387 202 –185
Brazil 243 10 –233
India 457 193 –264
Australia 524 256 –268
Germany 1 182 684 –498
United Kingdom 1 746 1 221 –525
China 778 67 –711
1 2 http://dx.doi.org/10.1787/477205848458Source: OECD, based on data provided by Dealogic.
An
OE
CD
Bro
wo
L e c tur
ylnO dae
R
OECD INFORMATION TECHNOLOGY OUTLOOK 2008 – ISBN 978-92-64-05553-7 – © OECD 2008 137

2. GLOBALISATION OF THE ICT SECTOR
se_it E ditin
es
eu
le
Table 2.A1.28. ICT sector foreign affiliates operating in the United States, 2005 (USD millions and percentage shares)
Employees ('000)
Compensation to employees
Total assets Sales Value addedExports of affiliates
Imports by affiliates
R&D by affiliates
All industries 5 086 355 870 5 883 782 2 495 380 539 869 169 238 452 968 31 694
Manufacturing 1 987 151 447 1 095 936 1 001 845 242 355 97 333 160 323 21 818
Computers and electronic products 143 10 514 55 176 57 621 14 234 . . 14 405 2 878
Computers and peripheral equipment 14 1 227 4 225 9 452 1 569 1 842 3 898 160
Communications equipment 14 1 280 5 952 6 958 1 078 981 754 582
Audio and video equipment . . . . . . . . . . . . . .
Semiconductors and other electronics 36 2 754 17 815 19 207 4 654 5 119 5 241 583
Magnetic and optical media . . . . . . . . . . . . . .
ICT share of manufacturing 2.80% 3.00% 0.90% 2.30% 2.60% . . 3.20% 9.10%
ICT services 93 8 034 75 861 33 245 11 577 3 5 165
Telecommunications 37 2 635 66 254 20 799 5 106 . . . . . .
Information services and data processing . . . . . . . . . . . . . . . .
Computer systems design services 55 5 399 9 607 12 446 6 471 3 5 165
Total ICT sector 236 18 548 131 037 90 866 25 811 3 14 410 3 043
ICT share of total 4.60% 5.20% 2.20% 3.60% 4.80% . . 3.20% 9.60%
1 2 http://dx.doi.org/10.1787/477206011511Note: ICT sector based on 4 digit NAICS. ICT goods includes imports for domestic consumption and domestic exports.ICT services include affiliated and total cross-border trade in computer and information services.Source: US Department of Commerce, 2007.
An
OE
CD
Bro
wo
L e c tur
ylnO dae
R
OECD INFORMATION TECHNOLOGY OUTLOOK 2008 – ISBN 978-92-64-05553-7 – © OECD 2008138

2. GLOBALISATION OF THE ICT SECTOR
se_it E ditin
es
eu
le
Table 2.A1.29. US foreign affiliates operating overseas, 2004 USD millions and thousands of employees
All IndustriesComputer and electronic
productsElectrical equipment appliances
and componentsInformation
Employees Gross product Employees Gross product Employees Gross product Employees Gross product
Australia 271.9 29 853 3.3 205 5 273 14.5 1 199
Austria 33.3 4 576 2.6 448 0.5 66 1.9 510
Belgium 120 18 343 1.1 96 3.8 316 5.1 357
Canada 1 065.1 94 205 38.5 2 701 11.4 730 26 1 921
Czech Republic 60.3 2 974 8.3 152 22.8 60 0.7 142
Denmark 38.3 5 475 1.3 79 0.3 33 0.9 108
Finland 19.6 2 899 3.5 171 0.2 15 75
France 562.8 47 717 24.8 1 783 10 840 12.6 1 450
Germany 601.7 74 184 29.9 2 680 32 2 835 13 1 507
Greece 15.8 2 778 0.1 11 0 0 1.1 44
Hungary 51.3 2 337 4.7 64 12.8 231 2.4 204
Iceland . . . . . . . .
Ireland 82.8 27 022 19.9 5 083 1.3 122 4.7 2 613
Italy 238.5 29 292 9.6 1 005 10 799 10.4 713
Japan 227.6 46 491 18.5 2 276 2.2 454 13.2 2 292
Korea 79.9 6 902 14.8 1 059 0.8 89 1.7 250
Luxembourg 9.8 –636 0 0 0 0 0.5 169
Mexico 785.2 22 383 81.4 1 089 33.9 574 13.6 853
Netherlands 175.1 28 220 5.3 547 1.8 –335 11.3 1 860
New Zealand 46.4 3 065 0.6 34 0.2 13 3.6 216
Norway 33.4 14 329 0.7 102 0.2 1 5.3 521
Poland 90.7 4 604 2.5 77 . . . . 2.8 361
Portugal 31.3 5 179 2.2 160 0.1 4 1.1 107
Slovak Republic . . . . . . . .
Spain 197.2 14 821 6.9 409 8.9 415 5.7 454
Sweden 101.2 11 028 4.5 326 0.7 106 5 1 897
Switzerland 67.3 17 636 2.9 419 2.7 276 1.8 1 007
Turkey 25.6 3 698 . . . . . . 125 0.2 61
United Kingdom 1 166.3 132 527 31.1 2 437 13.3 830 82.3 10 600
United States . . . . . . . . . . . . . . . .
Other countries 2 418.8 182 434 325.8 15 705 72 1 646
Total 8 617.2 834 336 644.8 39 118 247 10 518 318.3 36 514
1 2 http://dx.doi.org/10.1787/477231551373Note: Includes majority owned non bank foreign affiliates of US parents operating abroad. Blanks imply no data wereavailable or that they were suppressed for reasons of confidentiality.Source: US Department of Commerce, 2006.
An
OE
CD
Bro
wo
L e c tur
ylnO dae
R
OECD INFORMATION TECHNOLOGY OUTLOOK 2008 – ISBN 978-92-64-05553-7 – © OECD 2008 139

2. GLOBALISATION OF THE ICT SECTOR
se_it E ditin
es
eu
le
Table 2.A1.30. Country origin of foreign-owned enterprises in Sweden’s ICT sector, 2006
Numbers and percentage shares
ICT All industries ICT share
Enterprises Employment Enterprises Employment Enterprises Employment
United States 244 18 850 1 260 109 620 19.4 17.2
Norway 142 6 251 1 472 42 093 9.6 14.9
United Kingdom 139 7 051 1 218 67 138 11.4 10.5
Netherlands 89 2 202 1 166 51 308 7.6 4.3
Denmark 74 1 304 1 186 36 038 6.2 3.6
Germany 63 1 473 873 50 189 7.2 2.9
Finland 62 5 440 721 56 577 8.6 9.6
Luxembourg 54 1 356 . . . . . . . .
France 51 4 957 357 42 343 14.3 11.7
Japan 26 1 434 124 6 461 21 22.2
Top 10 944 50 318 8 377 461 767 11.3 10.9
Other countries 200 6 647 2 730 110 984 7.3 6
Total 1 144 57 065 11 107 572 751 10.3 10
1 2 http://dx.doi.org/10.1787/477256650118Source: ITPS 2007.
An
OE
CD
Bro
wo
L e c tur
ylnO dae
R
OECD INFORMATION TECHNOLOGY OUTLOOK 2008 – ISBN 978-92-64-05553-7 – © OECD 2008140

2. GLOBALISATION OF THE ICT SECTOR
se_it E ditin
es
eu
le
Table 2.A1.31. Swedish-owned ICT sector enterprises operating overseas, 2004Numbers and percentage shares
Enterprises Employees Industry share Location shares
Total
ICT equipment manufacturing 11 58 401 4
Office machinery 4 3 471 0.2
Communication equipment 7 54 930 3.8
ICT services 69 104 907 7.3
Communications and post 5 74 761 5.2
Computer and related services 64 30 146 2.1
Total ICT 80 163 308 11.3
All industries 856 1 446 294 100
Abroad
ICT equipment manufacturing 33 970 3.6 58.2
Office machinery 1 993 0.2 57.4
Communication equipment 31 977 3.4 58.2
ICT services 30 696 3.2 29.3
Communications and post 17 725 1.9 23.7
Computer and related services 12 971 1.4 43
Total ICT 64 666 6.8 39.6
All industries 953 635 100 65.9
Sweden
ICT equipment manufacturing 24 431 5 41.8
Office machinery 1 478 0.3 42.6
Communication equipment 22 953 4.7 41.8
ICT services 74 211 15.1 70.7
Communications and post 57 036 11.6 76.3
Computer and related services 17 175 3.5 57
Total ICT 98 642 20 60.4
All industries 492 659 100 34.1
1 2 http://dx.doi.org/10.1787/477281647334Source: ITPS 2007.
An
OE
CD
Bro
wo
L e c tur
ylnO dae
R
OECD INFORMATION TECHNOLOGY OUTLOOK 2008 – ISBN 978-92-64-05553-7 – © OECD 2008 141

se_it E ditin
es
eu
le
An
OE
CD
Bro
wo
L e c tur
ylnO dae
R

ISBN 978-92-64-05553-7OECD Information Technology Outlook 2008
© OECD 2008
DB
ro
wse_it E ditio
n
es
eu
le
ylnO d
Chapter 3
ICT Research and Development and Innovation
The ICT sector is in the lead for R&D expenditures, employment, and patents. Thesoftware and semiconductor segments are particularly R&D-intensive. The share ofICT R&D conducted in non-ICT industries is also high (about one-quarter of totalICT R&D) and in some non-ICT sectors, ICT R&D spending (especially software-
related) makes up a large share of total R&D budgets. The United States and Japanstill have a large lead in terms of ICT R&D expenditures by businesses, but countriessuch as Korea and some non-OECD economies are catching up. The organisation ofICT R&D is continuing to develop and change around new kinds of business
collaboration and internationalisation.
An
OE
C
L e c tur
aeR
143

3. ICT RESEARCH AND DEVELOPMENT AND INNOVATION
DB
ro
wse_it E ditio
n
es
eu
le
ylnO d
IntroductionThe information and communication technology (ICT) sector undertakes large
investments in research and development (R&D) and is very innovative. In terms of R&D
expenditures, patents and venture capital investments, it exceeds other industries by a
large margin. ICT R&D also spills over to many other products and industries. ICT research
is increasingly undertaken in other industries and the outputs used to meet challenges in
areas such as the environment and health. Overall it is an important driver of innovation
and growth and for increasing the competitiveness of OECD economies.
This chapter analyses recent developments in ICT R&D and innovation in five areas. It
first addresses ICT-related R&D research challenges and priorities. Second, it looks at the
patterns of ICT-related business R&D expenditures and employment in OECD countries (at
both the aggregate and firm level). Next it considers the organisation of ICT-related
business R&D before turning to the increasingly crucial nature of ICT-related R&D for
innovation in non-ICT products and sectors. Finally, recent developments in ICT-related
patents are analysed.
While ICTs are increasingly essential as a tool in most research fields (e.g. cloud
computing in genomic research or virtual simulations to conceptualise and test products
before they are built), this issue is not covered here.
ICT R&D challenges and prioritiesThe importance of ICT R&D to the wave of innovation which has shaped the last
50 years is widely acknowledged by firms and governments.1 While ICT-related research
challenges and priorities are evolving, it is possible to identify eight broad priorities
(Figure 3.1 and Box 3.1).2
Some of these have been on ICT R&D agendas for some time, especially those
clustered around the physical foundations of computing and computing systems and
software engineering. Quantum and optical computing, robotics and artificial intelligence
also remain important for addressing long-term challenges. In practice, research and
innovation in a given area lead to the emergence of new topics: for example, the rapidity
with which complementary metal-oxide semiconductor technology (CMOS) is being
miniaturised has made nanotechnology research part of core ICT R&D; and increasing
demand for high-speed broadband is driving research into all-optical networks and optical
computing. The growing ubiquity of ICTs gives areas such as artificial intelligence and
virtual reality renewed impetus for research on natural language processing and the
integration of natural and virtual environments.
Scientific and technological progress is also leading to new ICT R&D clusters. Progress
in biotechnology, nanotechnology, cognitive sciences and interdisciplinary research fosters
synergy and convergence and opens up new research areas (see Chapter 7 in OECD, 2006a,
2004; and van Lieshout et al., 2005). These trends are having a major impact on ICT
research, as hardware, software and ICT systems and networks increasingly imitate
An
OE
C
L e c tur
aeR
OECD INFORMATION TECHNOLOGY OUTLOOK 2008 – ISBN 978-92-64-05553-7 – © OECD 2008144

3. ICT RESEARCH AND DEVELOPMENT AND INNOVATION
se_it E ditin
es
eu
le
natural processes in order to raise efficiencies. Merging ICT research with other scientific
disciplines and applications opens up new possibilities, such as ICT-enabled biomarkers
and biosensors to improve medical diagnostics, brain-computer interfaces to operate
computers and other applications via brain activity, bio-computing using living tissue for
information processing, quantum cryptography for Internet security and reverse
engineering the brain through cognitive computing.
Research and innovation also underpin the growing importance of digital content
technologies beyond end-user demand for multimedia entertainment. The development,
distribution and use of digitised information (e.g. geospatial information, digital libraries,
medical image processing, pattern recognition, networked collaboration) have become an
essential part of science, communications, business, education, health and almost all
areas of production and consumption.
Furthermore, ICT research and innovation help to address pressing socio-economic
challenges. OECD governments, businesses and research institutions increasingly
structure ICT R&D projects and funding around the following themes: health care,
independent living and social inclusion, the environment, emergency and disaster
management, transport/mobility, and defence (Figure 3.2). Existing technologies are being
Figure 3.1. ICT R&D priorities (clusters of topics and subtopics)
Physical foundations of computing
• Miniaturisation of CMOS (complementary metal-oxide semiconductor) technology, use of nanotechnology• “Beyond CMOS”: Optical and quantum computing, spintronics• Flexible electronics for increased applicability of computing devices
Computing systems and architectures
Converging technologiesand scientific disciplines
Network infrastructures
Software engineeringand data management
Digital content technologies
Human-technology interfaces
ICT and Internet security and safety
• Security of computing systems, networks, applications, and services• Security of critical information systems• Data integrity, confidentiality and issues of privacy• Internet crime, cyberterror
• High-end computing and storage (upscaling)• Embedded systems, Systems-on-a-chip, Systems-in-package (downscaling)• Robotics, autonomous computing systems
• Converging research agendas of ICT, nano-, biotechnologies and other scientific disciplines• ICTs imitating natural information processing• ICTs enabling scientific research
• Wired and wireless broadband technologies• Next-generation networks, mobile ad-hoc networks• RFID (radio frequency identification) in sensor-based networks, Internet of Things• Network reliability, quality of service
• Software development paradigms, artificial intelligence• Use of ICTs to increase productivity of software engineering• Management of large and heterogenous data sources• Natural language processing
• Data mining in complex sources, multimedia content extraction, semantic web• Content digitisation, digital preservation and access• Participative web and networked collaboration• Customised and context-oriented information
• Productivity gains through improved user interfaces• ICT accessibility and usability• Interaction with all human senses• Augmented, immersive, and virtual realities
An
OE
CD
Bro
wo
L e c tur
ylnO dae
R
OECD INFORMATION TECHNOLOGY OUTLOOK 2008 – ISBN 978-92-64-05553-7 – © OECD 2008 145

3. ICT RESEARCH AND DEVELOPMENT AND INNOVATION
se_it E ditin
es
eu
le
Box 3.1. Examples of ICT R&D priorities
Physical foundations of computing: Research into physical foundations helps to achieve betterperformance and to improve the cost and energy efficiency of computing devices. Miniaturisationand nanotechnology applications are increasing the density and number of transistors onintegrated circuits (Moore’s law), thereby increasing their performance and storage capacity. Effortsare being made to identify more efficient ways to process information than electron-based
semiconductor technology, e.g. spintronics (“spin transport electronics”, which exploits the spin ofelectrons and the associated magnetic moment) and optical and quantum computing. Researchinto organic materials for computing will enable low-cost mass production of integrated circuitsand can increase possibilities for ICT applications by creating non-rigid semiconductors anddisplays, e.g. for wearable computing.
Computing systems and architectures: Research in this area aims at improving computing
through better integration of single components (processor, memory, connectors, etc.). Likeperformance, cost and energy efficiency are important objectives. Systems that can effectively (andautonomously) scale up or down computing resources in response to sudden changes inrequirements are part of this agenda. Embedded systems increase flexibility and applicability byincorporating the hardware and software necessary to fulfil a given function on a single chip andhelp to save power. Research into robotics and other systems with autonomous decision-makingcapabilities further increase the adaptability of computing systems.
Converging technologies and scientific disciplines: Research objectives in nanotechnology,biotechnology and information technologies (but also cognitive and social sciences) are increasinglylinked to form clusters around specific challenges. This is improving the innovation potential of ICTs,e.g. by using nanotechnology to achieve further miniaturisation, and is increasing applicationopportunities, e.g. ICTs in health care. Trends include imitating natural information processing, e.g.
cognitive networks and genetic programming, and facilitating scientific research and convergence,e.g. genome sequencing and medical image processing, through robot experiments and computer-aided simulation. The merging of various disciplines and ICTs is evolving, e.g. tissue computing,cognitive computing and mining of online social networking activities by social scientists.
Network infrastructures: Here the aim is to meet challenges to network infrastructures resultingfrom patterns of Internet use by consumers and businesses. High-speed, reliable, flexible and cost-efficient networks are needed to support the rise in data traffic and the number of connectedpeople and objects. Research on wired and wireless broadband technologies focuses on high-bandwidth data delivery, e.g. high definition video. Next-generation networks will improveflexibility by detaching physical infrastructures from digital content transport. Flexibility will betaken further by mobile ad-hoc networks, personal area networks, and sensor-based inter-objet
communication, i.e. the “Internet of Things”. Increased dependence on the Internet and othernetwork infrastructures facilitates research into issues of reliability and quality of service.
Software engineering and data management: Software engineering is undergoing significantchanges triggered by trends in ubiquitous computing. The challenge is to exploit effectively advancesin hardware (e.g. through operating systems, compilers) and to develop software engineeringenvironments that result in more reliable software for systems, devices and networks. Research into
new programming paradigms is needed to solve complex computing problems. Inspiration forartificial intelligence is drawn from natural information processing, e.g. neural networks. Databasemanagement systems are adapting to trends in distributed computing and storage. Advances inthese fields improve the efficiency of software engineering, e.g. through automated quality assurance(bug tracking and testing), collaborative programming environments, and open-source development.Research into natural language processing (e.g. for automated speech translation) addresseschallenges in terms of efficient information processing and data storage.
An
OE
CD
Bro
wo
L e c tur
ylnO dae
R
OECD INFORMATION TECHNOLOGY OUTLOOK 2008 – ISBN 978-92-64-05553-7 – © OECD 2008146
3. ICT RESEARCH AND DEVELOPMENT AND INNOVATION
se_it E ditin
es
eu
le
applied in these areas; sensor-based networks, for example, facilitate remote patientmonitoring and monitoring of traffic, pollution and geological phenomena.
Other factors in the emergence of new topics and ICT research agendas include usage
considerations, changing government priorities and changing public perceptions. There is
a long history of research into human-technology interfaces, but the rapid proliferation of
ICTs and demands for universal accessibility and usability have renewed this as a research
priority. ICT and Internet security and safety are not new research areas but now receive
greater attention.3 ICT research also increasingly includes foreseeing societal,
organisational and legal implications and fostering social acceptance of ICT research
outputs (MIC, 2007; PCAST, 2007).
The following sections quantify business ICT R&D efforts in the pursuit of these ICT
research priorities and show how these efforts are being organised.
Box 3.1. Examples of ICT R&D priorities (cont.)
Digital content technologies: Researchers try to facilitate the discovery of patterns inexponentially growing sources and formats of digital information. New types of digital content areincreasingly difficult to interpret in automated ways, (e.g. three-dimensional images from medicalapplications in virology, neurology), a problem that is exacerbated by the fact that both the contentand form of information sources often change rapidly. Research is enhancing existing data mining
technologies through automated multimedia content extraction and semantic web technologies.Improved content production technologies (e.g. three-dimensional capturing) and approaches(e.g. networked collaboration) facilitate digital knowledge creation. Research into effective andinteroperable compression and conversion technologies are improving access to digital contentand are important for efficient distribution over the Internet.
Human-technology interfaces: Interfaces for interaction between human users and computing
hardware and software have not markedly changed in the last decade, but research is diminishingthe role of “traditional” access barriers, most notably specialised ICT skills. Simplification of userinterfaces, research into patterns of ICT usage and intuitive ways to create and access digitalinformation aim at improving productivity and the accessibility of hardware and software withspecial focus on disadvantaged user groups. Information representation is an important aspect,including research into three-dimensional and holographic displays, tangible digital informationand augmented and immersive virtual realities (e.g. for simulation purposes).
ICT and Internet security and safety: Research is being conducted to match increased use andapplication of ICTs with adequate levels of security for computing systems, networks, applicationsand users and their data. To match these requirements, R&D efforts aim at integrating securityconcerns early into the design of ICTs as well as at weaving ICT security into overall organisationalsecurity, especially for critical information infrastructures. Significant impetus for improving theintegrity and confidentiality of digital information as well as the privacy of individual users comesfrom natural processes (e.g. quantum cryptography, self-healing computing systems, and intrusiondetection inspired by immunology). Technological solutions to prevent and tackle criminal activitysuch as online fraud and identity theft and terrorist activities are being sought, including digitalinvestigation and retaliation.
Note: These clusters have been compiled after analysing and combining OECD national ICT R&D policy projects, R&Dprojects of the top 250 firms, and the ICT research literature.
An
OE
CD
Bro
wo
L e c tur
ylnO dae
R
OECD INFORMATION TECHNOLOGY OUTLOOK 2008 – ISBN 978-92-64-05553-7 – © OECD 2008 147

3. ICT RESEARCH AND DEVELOPMENT AND INNOVATION
se_it E ditin
es
eu
le
ICT sector R&D expenditures and employmentR&D expenditures in the ICT sector continue to increase and business expenditures
are higher than a decade ago in absolute terms and as a share of GDP.4 ICT services and
software development in particular have seen significant increases, compensating for
expenditure declines in ICT manufacturing. Firm-level analysis shows that the ICT sector
is one of the most R&D-intensive, with R&D expenditures of the top ICT firms rising
consistently and holding up well during downturns. Most expenditures are for electronics
(33%) and IT equipment (19%), but semiconductor firms are the most R&D-intensive and
software firms have the most growth in R&D expenditure. The bulk of R&D activities are in
the United States, the European Union (EU) and Japan, but Korea’s ICT R&D expenditures
and personnel have grown strongly. Moreover, while they are often still at comparatively
low absolute levels of R&D expenditures, non-OECD economies are increasingly important.
OECD aggregate R&D expenditures
Total OECD public and private R&D investment in 2006 climbed to USD 818 billion, up
from USD 468 billion in 1996 (OECD, 2008a).5 In 2006, the non-OECD economies for which
data are available accounted for 18.3% of total R&D expenditure (current USD PPP), up from
14.6% in 2001.6 In nominal terms, business enterprise expenditure on R&D (BERD) reached
USD 563 billion for the OECD area in 2006 and accounts for about 70% of total OECD R&D.7
From 1996 to 2006 BERD in the OECD area increased by 4% annually (in constant USD,
Figure 3.3); the pace of growth slowed in 2001 and 2002 and then picked up again
between 2001 and 2006 to 2.4% annual compound growth. In the United States – with USD
242 billion, the biggest spender accounting for almost half of the OECD total – BERD
Figure 3.2. Socio-economic applications of ICT research
Healthcare Independent living and socialinclusion
Emergency and disaster management
Transport and mobilityDefence
Environmental challenges• Healthcare management, patient files, health databases, clinical information systems
• Telemedicine, remote health monitoring, drug delivery using RFID and biosensors
• Detection of adverse health events, early warning systems
• Remote surgery using haptic interfaces, virtualisation, and advanced network technologies
• Data mining in medical images
• Bioinformatics and biomedical computing
• Collaborative networking and grid computing in medical research, simulated surgeries
• Remote, sensor-based detection systems connected to geo-spatial information systems
• Mobile ad-hoc networks for immediate disaster relief
• Interoperability of observation and monitoring systems
• Holistic warning systems integrating disaster-specific solutions
• Personalised traffic information• Traffic monitoring and control systems
• Accessibility of ICT solutions for the young, the elderly, impaired users
• Improved usability through advanced software and hardware interfaces, e.g. natural language control, brain-computer interfaces
• Mobile monitoring, dectection of adverse health events through sensor-based and wearable computing
• Smart home technologies to assist elderly and chronically ill patients
• Adapted online services to assist administrative tasks
• Energy-efficient ICTs for data centres and Internet infrastructures
• ICTs for energy-intensive industries
• Digitalisation and digital delivery of goods and services
• Pollution monitoring using adaptive sensor networks
• Improved product design for recyclability
• Tracking waste streams using sensors
• Environmental information systems for decision-makers, businesses, citizens
• Command-and-control systems• Real-time language translation• Surveillance robots, e.g. unmanned armoured vehicles (UAVs)• Augmented reality systems to assist decision-making in theatres• Sensor-based threat detection, e.g. biochemical substances• Electronic warfare, e.g. ragio frequency jamming• Combat simulations using immersive virtual reality technologies• Mobile ad-hoc networks in theatres
• Driver assistance systems using sensors, embedded systems and augmented reality technologies• Software optimisation for freight route planning• Sensor and satellite-based navigation and positioning systems• Adaptative safety systems using RFID• Teleworking solutions
An
OE
CD
Bro
wo
L e c tur
ylnO dae
R
OECD INFORMATION TECHNOLOGY OUTLOOK 2008 – ISBN 978-92-64-05553-7 – © OECD 2008148

3. ICT RESEARCH AND DEVELOPMENT AND INNOVATION
se_it E ditin
es
eu
le
increased by 1% annually between 2001 and 2006, in the European Union (EU27) by 2%, in
Japan by 4.4% and in China by 23% (in constant USD). China’s catch-up in absolute terms to
USD 62 billion BERD (current USD) and as percentage of GDP (about 1%) has been
remarkable.
While manufacturing continues to account for the bulk of business R&D, investment
in services R&D is increasing and made up 25% of OECD business R&D in 2004.8
Most company R&D is for product and process development. Companies spend less on
applied research and even less on basic research, and the shares seem to be declining. In
the United States, for example, corporate basic and applied R&D as share of total business
R&D stood at about 23% (4% basic and 20% applied) in 2005 as opposed to more than 30%
(7% basic and 23% applied) in 1975 (National Science Board, 2008). Anecdotal evidence
indicates that firms have reduced their share of basic research in total R&D in response to
competition and shorter product cycles (OECD, 2008b).
ICT-related business R&D expenditures
The ICT sector leads other sectors in R&D expenditures, number of patents and
venture capital investments. It is the most important of the five sectors that dominate
business sector R&D (Figure 3.4). In 2004, for example, ICT manufacturing accounted for
more than a quarter of total manufacturing business R&D expenditure in most OECD
countries. It accounted for more than half in Finland, and Korea (63% and 57%,
respectively), and more than 30% in the United States (39%), Australia (32% in 2002-03),
Canada (39% in 2005), Japan (36% in 2005) and Ireland (34%).9
In 2005 the OECD2110 ICT goods and services sector spent about two and a half times as
much on R&D (USD 130 billion) as the automotive sector (USD 52 billion) and more than triple
the pharmaceutical sector (USD 40 billion). R&D in the ICT goods sector increased strongly
until 2001, but then fell in constant terms, mirroring the more general evolution of the ICT
Figure 3.3. Business R&D spending, 1996-2006Billions of USD (constant 2000 PPP USD)
As a % of GDP
1 2 http://dx.doi.org/10.1787/473875308073
Source: Main Science and Technology Indicators (MSTI 2008/1), August 2008. New PPPs used for China, Japan and theUnited States.
600
550
500
450
400
350
300
250
200
150
100
50
0
3.0
2.5
2.0
1.5
1.0
0.5
0
1996
1997
1998
1999
2000
2001
2002
2003
2004
2005
2006
1996
1997
1998
1999
2000
2001
2002
2003
2004
2005
2006
%United States Japan EU OECD China
An
OE
CD
Bro
wo
L e c tur
ylnO dae
R
OECD INFORMATION TECHNOLOGY OUTLOOK 2008 – ISBN 978-92-64-05553-7 – © OECD 2008 149

3. ICT RESEARCH AND DEVELOPMENT AND INNOVATION
se_it E ditin
es
eu
le
sector and overall business R&D. However, as of 2004 business ICT manufacturing R&D picked
up, but has still not reached the levels of 2001.
The decline in the ICT goods sector since 2001 (constant terms) has been partly
compensated by an increase in ICT services, which has grown very rapidly since the 1990s.
It surpassed the chemical sector in 2001 and almost reached the level of expenditure in the
pharmaceutical sector; following a drop between 2002 and 2004, ICT services R&D has
grown again.11 According to preliminary official data it grew faster in 2006 and 2007 so that
goods and services combined were at levels similar to 2001 (constant terms). In the United
States, ICT services R&D expenditures are now close to USD 30 billion, or 14% of total US
business R&D, as compared to computer and electronic products at USD 42.5 billion (21%)
or chemicals at USD 43 billion (21%) (National Science Board, 2008; Jankowski, 2001).
Together, radio, television and communication equipment (including electronic
components and semiconductors) and office, accounting and computing machinery
(38 and 17%, respectively, in 2005) account for over half of total ICT R&D, a share that rises
and falls with the output cycle of the semiconductor industry (Figure 3.5). There has been
a very significant increase in the share of services in Computer and related activities
(largely software and IT services) (21% in 2005, up from 9% in 1993).
In ICT manufacturing, Finland, Korea, Japan, Sweden and the United States have
higher than average shares of R&D expenditure in GDP. Finland and Korea have increased
their shares since 1997 and estimates for 2006 show a further pick-up for Korea. As a share
of GDP, Denmark, Finland, Ireland and Sweden have the greatest specialisation in ICT
services R&D (Figure 3.6). Estimates for 2006 show pronounced upturns for Korea and
Figure 3.4. Growth of the largest R&D-spending sectors in the OECD area, 1993-2005
Billions of constant PPP dollars at 2000 prices
1 2 http://dx.doi.org/10.1787/4738845885561. Office, accounting and computing machinery (ISIC 30); Radio, TV and communication equipment (ISIC 32);
Medical, precision and optical instruments (ISIC 33).2. Telecommunications (ISIC 642) and in some cases ISIC 64; Computer and related services (ISIC 72).3. Research and development (ISIC 73): Research and experimental development on natural sciences and
engineering and on social sciences and humanities.Note: Includes Austria, Australia, Belgium, Canada, the Czech Republic, Denmark, Finland, France, Germany, Greece,Ireland, Italy, Japan, Korea, the Netherlands, Norway, Poland, Portugal, Spain, the United Kingdom and the United States.
Source: OECD estimates based on ANBERD and RDS databases, June 2008.
160
140
120
100
80
60
40
20
01993 1994 1995 1996 1997 1998 1999 2000 2001 2002 2003 2004 2005
ICT services2Pharmaceuticals Research and development sector3
ChemicalsICT total ICT manufacturing1 Motor vehicles
An
OE
CD
Bro
wo
L e c tur
ylnO dae
R
OECD INFORMATION TECHNOLOGY OUTLOOK 2008 – ISBN 978-92-64-05553-7 – © OECD 2008150

3. ICT RESEARCH AND DEVELOPMENT AND INNOVATION
se_it E ditin
es
eu
le
Figure 3.5. ICT sub-sector R&D expenditures as a share of total OECD area ICT R&D, 1993-2005
As a percentage of total OECD ICT R&D
1 2 http://dx.doi.org/10.1787/4740667580271. Telecommunications (ISIC 642, and in some cases ISIC 64). Data for Japan and Germany are not available.Note: Includes Austria, Australia, Belgium, Canada, the Czech Republic, Denmark, Finland, France, Germany, Greece,Ireland, Italy, Japan, Korea, the Netherlands, Norway, Poland, Portugal, Spain, the United Kingdom and the United States.Source: OECD estimates based on ANBERD and RDS databases, June 2008.
Figure 3.6. Business R&D expenditure for ICT goods and services, as a share of GDP, 1997 and 2005
1 2 http://dx.doi.org/10.1787/474078101812Note: When data for class 642 (Telecommunications) are unavailable, division 64 (Post and telecommunications) isused. Class 642 has the major share of division 64 R&D expenditure; for example in the United States, class642 accounts for 97-98% of the R&D in division 64.Source: OECD estimates based on ANBERD and RDS databases, June 2008. See also OECD (2007a).
50
40
30
20
10
0
%
1993 1994 1995 1996 1997 1998 1999 2000 2001 2002 2003 2004 2005
Computer and related servicesMedical, precision and optical instruments Telecommunications1
Office, accounting and computing machinery Radio, TV and communication equipment
Business R&D expenditure by selected ICT manufacturing industries, 1997 and 2005
As a percentage of GDP
Business R&D expenditure by selected ICT services industries, 1997 and 2005
As a percentage of GDP
0 0.3 0.6 0.9 1.2 0 0.3 0.6 0.9 1.2% %
1997 2005
FinlandKoreaJapan
SwedenUnited States
GermanyNetherlands
FranceIrelandCanada
DenmarkBelgium
United KingdomNorway
ItalyAustralia
Czech RepublicPortugal
SpainGreecePoland
DenmarkFinlandIreland
SwedenUnited Kingdom
United StatesCanadaNorwayFrance
BelgiumKorea (1998)
AustraliaCzech Republic
SpainGermany
JapanItaly
GreeceNetherlands
PortugalPoland
An
OE
CD
Bro
wo
L e c tur
ylnO dae
R
OECD INFORMATION TECHNOLOGY OUTLOOK 2008 – ISBN 978-92-64-05553-7 – © OECD 2008 151

3. ICT RESEARCH AND DEVELOPMENT AND INNOVATION
se_it E ditin
es
eu
le
Norway. In 2006, increases in the Czech Republic’s shares of ICT R&D expenditure in GDP
for both ICT goods and services are significant, although from low levels.
The United States still accounts for 40% of all OECD R&D expenditures in ICT
manufacturing and services (Figure 3.7).12 The EU15 accounts for a little under a quarter of the
total, Japan for 22% and Korea for 9%, with the larger OECD members making up the bulk of the
remainder. By 2005, Korea’s ICT R&D expenditures exceeded those of Europe’s leading R&D
spender, Germany, and Australia and Canada have both seen a decrease in their shares over
the last years.13 Despite the decline in R&D expenditure for computers and office machinery in
the United States, computer and electronic products manufacturing still accounts for the
largest share of total US business R&D (about 19% according to National Science Board, 2008).
Figure 3.8 shows R&D expenditures of the main geographic areas in each of the ICT
component sectors.14 The United States continues to lead in Radio, television and
communication equipment (ISIC 32), Medical and precision instruments (ISIC 33), and
Computer and related activities (ICT services, ISIC 72). After a rapid increase in absolute
spending in Japan and a strong decline in the United States, Japan has taken the lead in
Office, accounting and computing machinery (ISIC 30). Telecommunications (ISIC 64) is the
only segment in which the EU15 spends more than the United States, but the expenditures
are relatively low, at around USD 3.5 billion.
R&D in computer services (ISIC 72) increased most sharply in the United States,
tripling between 1996 and 2003. In Europe it doubled but was still only a third of that of the
United States, while levels remain low in Japan and Korea. The lower overall R&D intensity
of European firms may be due to their specialisation in less R&D-intensive sectors such as
telecommunications while the United States specialises in more R&D-intensive sectors
such as software (see below and Lindmark et al., 2008).
Figure 3.7. Share of selected OECD countries in total OECD area ICT sector R&D expenditures,1 2005
Percentage of total OECD ICT R&D
1 2 http://dx.doi.org/10.1787/4740862137871. Office, accounting and computing machinery (ISIC 30); Radio, TV and communication equipment (ISIC 32); Medical,
precision and optical instruments (ISIC 33); Telecommunications (ISIC 642); Computer and related services (ISIC 72).2. Excluding Austria and Luxembourg. German R&D expenditures in telecommunications (ISIC 642) are not available.3. Excluding telecommunication services (ISIC 642).Source: OECD estimates based on ANBERD and RDS databases, June 2008.
45
40
35
30
25
20
15
10
5
0
%
Unit
ed
States E
U152
Japa
n
Kor
ea
Germ
any3
Fran
ce
Unit
ed
Kingdo
m C
anad
a
Swed
en
Finl
and
Italy
Neth
erlan
ds
Spa
in
Aus
tralia
Den
mark
Belg
ium
Irela
nd
An
OE
CD
Bro
wo
L e c tur
ylnO dae
R
OECD INFORMATION TECHNOLOGY OUTLOOK 2008 – ISBN 978-92-64-05553-7 – © OECD 2008152

3. ICT RESEARCH AND DEVELOPMENT AND INNOVATION
se_it E ditin
es
eu
le
Figure 3.8. R&D expenditures in the United States, the EU15, Japan and Korea by ICT sub-sectors, 1996, 2003 and 2005
Billion of current PPP dollars
1 2 http://dx.doi.org/10.1787/4741277047841. Austria and Luxembourg not available.2. 1998 instead of 1996.3. Post and telecommunications (ISIC 64) is included.4. Post and telecommunications (ISIC 64) when (ISIC 642) is not available. Data for Germany and Japan are not available.
Source: OECD estimates based on ANBERD and RDS databases, June 2008.
1996 2003 2005
80
70
60
50
40
30
20
10
0
15
10
5
0
25
20
15
10
5
0
25
20
15
10
5
0
4
3
2
1
0
20
15
10
5
0
Overall ICT Office, accounting and computing machinery (ISIC 30)
Radio, television and communication equiment (ISIC 32) Medical, precision and optical instruments (ISIC 33)
Telecommunications (ISIC 642)4 Computer and related activities (ISIC 72)
United States
United States EU151 Japan Korea2 United States EU151 Japan Korea
EU151 Japan3 Korea United States EU151 Japan Korea
United States EU151 Korea2 United States EU151 Japan Korea2
An
OE
CD
Bro
wo
L e c tur
ylnO dae
R
OECD INFORMATION TECHNOLOGY OUTLOOK 2008 – ISBN 978-92-64-05553-7 – © OECD 2008 153

3. ICT RESEARCH AND DEVELOPMENT AND INNOVATION
se_it E ditin
es
eu
le
Firm-level data show that expenditure on software R&D has risen most rapidly. In
Canada, for example, year-on-year growth is higher than in any other ICT sub-sector
(CAD 657 million intramural R&D expenditures in 2006) (Industry Canada, 2007). However,
expenditure on software R&D can differ significantly depending on how it is reported
(see Annex Box 3.A1.1). The data also usually do not take account of the increasing amount
of software R&D outside the software sector (see below).
Figure 3.9. R&D expenditures in the computer services and software sector, 2006Billions of current PPP USD
BERD in computer and related services, 2006 or latest available year1
BERD in software consultancy and supply, 2006 or latest available year2
1 2 http://dx.doi.org/10.1787/4741343630831. 2005 for Australia, France, Denmark, Germany, Greece, Iceland, Ireland, the Netherlands, Mexico, New Zealand,
Portugal, Russian Federation, Spain, Sweden, the United States. 2004 for Austria.2. 2005 for Denmark, Germany, Iceland, Ireland, the Netherlands, Norway, Mexico, Portugal, Russian Federation, Spain,
the United States. 2004 for Austria, France.Note: Figures for the United States from the National Science Foundation. Data not comparable to OECD estimates inFigure 3.8.
Source: OECD, RDS database, June 2008.
2.5
2.0
1.5
1.0
0.5
0
USA: 30.5 billion in 2005
Israe
l
Japa
n
Unit
ed King
dom
Germ
any
Can
ada
Fran
ce
Kor
ea
Den
mark
Swed
en
Spa
in
Aus
tralia
Irela
nd It
aly
Chin
ese T
aipei
Finl
and
Nor
way
Belg
ium
Cze
ch R
epub
lic
Aus
tria
Neth
erlan
ds
Sing
apor
e
Gree
ce
New
Zeala
nd
Pola
nd
Mex
ico
Rom
ania
Por
tugal
Hun
gary
Icela
nd
Rus
sian F
edera
tion
Slov
enia
Slov
ak R
epub
lic
2.0
1.8
1.6
1.4
1.2
1.0
0.8
0.6
0.4
0.2
0
Germ
any
Kor
ea
Fran
ce
Den
mark
Spa
in It
aly
Irela
nd
Nor
way
Cze
ch R
epub
lic
Neth
erlan
ds
Aus
tria
Belg
iumPola
nd
Mex
ico
Por
tugal
Hun
gary
Icela
nd
Sing
apor
e
Rom
ania
Rus
sian F
edera
tion
Slov
ak R
epub
lic
USA: 17 billion in 2005
An
OE
CD
Bro
wo
L e c tur
ylnO dae
R
OECD INFORMATION TECHNOLOGY OUTLOOK 2008 – ISBN 978-92-64-05553-7 – © OECD 2008154

3. ICT RESEARCH AND DEVELOPMENT AND INNOVATION
se_it E ditin
es
eu
le
Data on business R&D in computer and related services for 2006 show that the United
States leads by a large margin (USD 30.5 billion), fifteen times more than Israel
(USD 2.1 billion), Japan (USD 2 billion), the United Kingdom (USD 2 billion) and Germany
(USD 1.9 billion) (Figure 3.9). The same applies to business R&D in software consultancy and
supply; the United States (USD 17 billion) carries out around ten times more than Germany
(USD 1.8 billion), followed by Korea and France (USD 0.9 billion each). In the United States,
industries associated with software and computer-related services account for roughly
15% of all business-funded industrial R&D.
ICT R&D employment
The output and competitiveness of ICT research and the ICT sector depend on highly
qualified research personnel and skilled employees. In 2006 there were 943 000 R&D
personnel in the ICT sector in the OECD25.15 With 487 000 researchers, the United States has
a wide lead in total numbers (Figure 3.10), followed by Japan (147 000), and Korea (86 000), and
the overall ranking of all OECD countries has hardly changed since 2002 (OECD, 2006a). Data
for non-OECD economies are available only for Chinese Taipei (38 500), Singapore (6 400), and
Slovenia (500). Chinese Taipei has slightly fewer ICT R&D personnel than Canada. The OECD
countries with the largest share of ICT R&D personnel in total R&D personnel are Ireland
(54%), Korea (53%), Finland (51%), Denmark (39%) and Canada (39%) (Figure 3.11). Chinese
Taipei (68%) and Singapore (40%) have a very high specialisation in ICT researchers.
In most OECD countries the availability of highly trained research personnel for the
ICT industry is an increasing policy concern (e.g. Eutema, 2007, for Austria; BMWI, 2007, for
Germany; MTI, 2007, for Norway; PCAST, 2007, for the United States; MIC, 2005, for Japan).
Attracting students (especially women) to pursue research and engineering degrees in
OECD countries is an ongoing challenge (see Chapter 7, Box 7.7).
Figure 3.10. ICT R&D researchers, 2006 or latest available yearFull time equivalents
1 2 http://dx.doi.org/10.1787/474234772518Note: EU15 excludes Luxembourg.
Source: OECD, estimates based on RDS database, April 2008.
0 100 000
0 2 000 4 000 6 000 8 000
200 000 300 000 400 000 500 000
United States
EU15
Japan
Korea
France
Germany
Canada
Chinese Taipei
United Kingdom
Finland
Sweden
ItalyDenmark
SpainAustralia
SingaporeAustria
NetherlandsBelgiumNorwayIreland
Czech RepublicSwitzerland
PortugalGreecePoland
HungarySlovenia
Mexico
An
OE
CD
Bro
wo
L e c tur
ylnO dae
R
OECD INFORMATION TECHNOLOGY OUTLOOK 2008 – ISBN 978-92-64-05553-7 – © OECD 2008 155

3. ICT RESEARCH AND DEVELOPMENT AND INNOVATION
se_it E ditin
es
eu
le
R&D spending of top ICT firms
A complementary view of ICT R&D can be drawn from looking at the R&D activities of
large ICT firms. The top 250 ICT firms are mainly large multinational enterprises (MNEs) from
OECD countries operating in this high-technology sector and may be expected to have very
large R&D expenditures (Dunning, 1977; Bae and Noh 2001; Ho et al., 2006). These tend to be
pro-cyclical, growing most in periods of economic expansion and retracting during downturns,
but R&D of the top ICT firms has grown consistently over the last decade and held up well
during the downturn, reaching USD 151 billion in 2006 (see Box 3.2). R&D expenditures of the
top ICT firms are significantly higher than those of R&D-intensive firms in the chemicals,
pharmaceuticals or automotive sectors (see also Jaruzelski and Dehoff, 2007).
In 2006 the top 100 R&D-performing firms (ranked by absolute R&D expenditures
in 2006, see Chapter 1 and Box 3.2) spent an average of 6.7% of revenue on R&D. This is
slightly less than the average R&D intensity of the top 100 ICT R&D spending firms in 2001
(close to 7%) (OECD, 2002a).16 Only firms in the pharmaceutical sector display higher R&D
intensities (Jaruzelski and Dehoff, 2007).
At firm level, revenue growth and R&D expenditure are moderately well correlated in
the ICT sector (Figure 3.12), a correlation which is harder to demonstrate for other industry
sectors. Annual revenue growth between 2000 and 2006 of the top ICT firms reporting R&D
expenditures averaged about 6% (compound annual growth rate – CAGR). During the same
period, R&D expenditures by these firms increased by around 5% a year, with a slight fall
from 2001 to 2002 but a strong 9% increase from 2005 to 2006.
The bulk of ICT R&D in the top 250 ICT firms is conducted by US (43%) and Japanese
(26%) firms, followed by firms from Germany (11%), Korea (8%) and other European
countries (Figure 3.13, left-hand bar chart and right-hand pie chart). Firms from Chinese
Taipei, in particular, have overtaken firms from Canada and the United Kingdom. Despite
Figure 3.11. Share of ICT R&D researchers in total R&D researchers, 2006 or latest available year
Percentages
1 2 http://dx.doi.org/10.1787/474245682546
Source: OECD, estimates based on RDS database, April 2008.
70
60
50
40
30
20
10
0
%
Chin
ese T
aipei
Irelan
dKor
ea
Finlan
d
Singap
ore
Denmark
Canad
a
Sweden
Portug
al
Norway
Franc
e
Austri
a
United
Kingdo
mJa
pan
Netherl
ands Ita
ly
Austra
lia
Sloven
ia
Belgium
Greece
Czech
Rep
ublic
United
States
German
y
Hunga
rySpa
in
Switzerl
and
Poland
Mexico
An
OE
CD
Bro
wo
L e c tur
ylnO dae
R
OECD INFORMATION TECHNOLOGY OUTLOOK 2008 – ISBN 978-92-64-05553-7 – © OECD 2008156

3. ICT RESEARCH AND DEVELOPMENT AND INNOVATION
se_it E ditin
es
eu
le
rapid growth, Chinese ICT firms still have a relatively small share of the R&D expenditures
of top 250 ICT firms.
Korean firms have caught up to firms of other advanced OECD countries. Despite
initially high starting levels, German and US firms have also significantly increased their
Box 3.2. Defining the top ICT R&D spending firms
The sample of around 170 firms is drawn from the top 250 ICT firms which report R&Dexpenditures for the years 2000 to 2006. It excludes small and medium-sized ICTenterprises which are often much more R&D-intensive (sometimes owing to low revenues).A few caveats apply (see Chapter 1, Box 1.1): First, the sample excludes a number of non-reporting high-revenue firms from the telecommunications, software and ICT services
sectors. The impact is likely to be small, however, because firms that do not report R&Dexpenditures often spend little on R&D. Second, firms reporting R&D expenditure maychoose different accounting standards or change from one set of standards to another withimpacts on the absolute level of reported R&D spending – in particular the switch from USGenerally Accepted Accounting Principles (GAAP) to International Financial ReportingStandards (IFRS).* Third, while for most OECD firms R&D expenditures come from SECfilings or audited annual reports, R&D expenditures for non-OECD firms, e.g. China,Chinese Taipei and India, often come from company statements or other sources that maynot always conform to the same standards as audited accounts. Finally, R&D expendituresof non-US firms are converted from the respective currency into USD and are subject toexchange rate fluctuations, notably the large depreciation of the USD in the last two yearswhich results, for example, in a relative overstatement of EU ICT firm R&D.
* The GAAP prescribe that most R&D spending be stated as incurred, i.e. reported as operating costs; IFRS treatresearch expenses as incurred costs, but prescribe capitalisation of development costs under a set ofconditions (technological feasibility, commercial intention and ability) in which case these costs must bereported as intangible assets and thus become subject to amortisation and impairment losses in the currentand subsequent years. Consequently, for a given firm, R&D expenditures according to the GAAP are usuallyreported as being higher than those according to IFRS. Beside GAAP and IFRS, domestic accountingprinciples may differ in their treatment of R&D expenditures.
Figure 3.12. Top ICT firms, growth of revenue and R&D expenditure, 2000-06Percentages
1 2 http://dx.doi.org/10.1787/474251005486
Source: OECD Information Technology Outlook database.
-50 0 50 100 150 200
140
120
100
80
60
40
20
0
-20
-40
R&D expenditure growth 2000-06
Revenue growth 2000-06
SanDisk
Research in Motion
GoogleR2 = 0.6805
Lenovo
InfosysLG Electronics
AU Optronics
AlltelAn
OE
CD
Bro
wo
L e c tur
ylnO dae
R
OECD INFORMATION TECHNOLOGY OUTLOOK 2008 – ISBN 978-92-64-05553-7 – © OECD 2008 157

3. ICT RESEARCH AND DEVELOPMENT AND INNOVATION
se_it E ditin
es
eu
le
R&D spending. Japan had a slight increase, and France a slight decrease. Canada has also
seen a drop owing to spending declines by Nortel Networks and Celestica. In terms of
growth in R&D spending 2000-06, firms from Chinese Taipei and China are leading, albeit
from low levels (Figure 3.13, bottom bar chart).
Other than China and India, ICT companies from OECD enhanced engagement
countries (Brazil, Indonesia and South Africa) and OECD accession countries (Chile,
Estonia, Israel, the Russian Federation and Slovenia) are not in the top R&D spending
group. In some cases, this may be due to lack of reporting (e.g. some Israeli and Russian ICT
firms potentially qualify for inclusion but no figures are available). In most cases, however,
R&D expenditures or revenues of these countries’ ICT firms are not high enough.
Sector distribution of ICT R&D spending of top ICT firms
For the top 100 R&D-spending ICT firms, the largest shares are in electronics (33%), IT
equipment (19%), communication equipment (17%) and semiconductor firms (14%)
(Figure 3.14 shows absolute expenditure levels; see also Box 3.2 for underreporting of
Figure 3.13. R&D expenditures of top ICT firms, 2006 (left: in USD billions, right: in percentage of total) and growth of R&D expenditures of top ICT firms,
2000-06 (bottom, in percentage, current terms)
1 2 http://dx.doi.org/10.1787/474267875214Note: Europe includes reporting firms in the sample from Germany, Finland, Sweden, the Netherlands, France, theUnited Kingdom, Switzerland, Spain, Italy, Norway, Belgium, Austria and Denmark in descending order.
Source: OECD Information Technology Outlook database.
70
0.2
0.1
0
60
50
40
30
20
10
0
-50 0 50 100 150 200 250 300 350
Unit
ed Stat
es
Aus
tria In
dia
Nor
way
Belg
ium Italy
Aus
tralia
Japa
n
Germ
any
Kor
ea
Finl
and
Swed
en
Neth
erlan
ds
Fran
ce
Chin
ese T
aipei
Can
ada
Unit
ed King
dom
Switz
erlan
d
Chin
a
Cay
man Is
lands
Spa
in
Berm
uda
Europe21%
Japan26%
Korea 5%Chinese Taipei 2%
Canada 1%China 1%
Cayman Islands 1%Bermuda 0.2%Australia 0.1%
India 0.03%
United States43%
Chinese Taipei
China
Korea
Germany
United States
Japan
France
Canada
An
OE
CD
Bro
wo
L e c tur
ylnO dae
R
OECD INFORMATION TECHNOLOGY OUTLOOK 2008 – ISBN 978-92-64-05553-7 – © OECD 2008158

3. ICT RESEARCH AND DEVELOPMENT AND INNOVATION
se_it E ditin
es
eu
le
services). Telecommunication firms have progressively reduced their R&D expenditures
and make up only about 5% of the top 100 total in 2006 (OECD, 2007b). Compared to the top
100 R&D spenders in the OECD Information Technology Outlook 2002 (OECD, 2002a), the
relative importance of communication equipment firms has declined most. The largest
growth of R&D expenditures over the period 2000-06 was in sectors with lower initial
shares: Internet, software and semiconductor firms.
Top ICT R&D spenders by firm
Microsoft, Samsung, IBM and Intel lead the list of ICT firms ranked by R&D
expenditures (Table 3.1; Siemens ranked in the top five in 2006, but comparable figures
for 2007 are not available17). In 2007, Samsung overtook IBM in reported R&D spending
(see Box 3.3). The first three firms were also top R&D spenders across all industries in 2006,
just behind Toyota Motor (USD 7.7 billion), Pfizer (USD 7.6 billion), and Ford Motor Corp.
(USD 7.2 billion) in the automotive and pharmaceutical sectors.
Figure 3.14. Reported R&D expenditures of top 100 ICT R&D spending firms, by sector, 2000 and 2006
Current USD billions
1 2 http://dx.doi.org/10.1787/474321574616
Source: OECD Information Technology Outlook database.
2006 2000
0 10 20 30 40 50 60
Electronics and components
IT equipment
Communications equipment
Semiconductors
Software
Telecommunications
Internet
Services
Table 3.1. Top ICT R&D spenders: Absolute expenditure, 2006 and 2007USD millions
Company Country Industry R&D 2006 R&D 2007
1 Microsoft United States Software 6 584 7 121
2 Siemens Germany Electronics and components 6 312 n.a.
3 Samsung Electronics Korea Electronics and components 6 004 6 451
4 IBM United States IT equipment 6 107 6 153
5 Intel United States Semiconductors 5 873 5 700
6 Nokia1 Finland Communications equipment 4 896 n.a.
7 Matsushita (Panasonic) Japan Electronics and components 4 854 4 909
8 Sony Japan Electronics and components 4 675 4 619
9 Cisco Systems United States Communications equipment 4 067 4 499
10 Motorola United States Communications equipment 4 106 4 429
1 2 http://dx.doi.org/10.1787/4773006706641. From 2007, Nokia consolidates financial information for Nokia Siemens Networks, a joint venture between Nokia
and Siemens. Nokia’s reported 2007 R&D expenditure of USD 7 730 million is therefore not comparable to earlierexpenditures.
Source: OECD Information Technology Outlook database.
An
OE
CD
Bro
wo
L e c tur
ylnO dae
R
OECD INFORMATION TECHNOLOGY OUTLOOK 2008 – ISBN 978-92-64-05553-7 – © OECD 2008 159

3. ICT RESEARCH AND DEVELOPMENT AND INNOVATION
se_it E ditin
es
eu
le
Compared to the list of the top 10 in the OECD Information Technology Outlook 2002
(OECD, 2002a), Ericsson, Lucent Technologies and Nortel Networks (all communication
equipment manufacturers) dropped out and were replaced by Samsung, Nokia and Sony.
Compared to the top 250 ICT firms named in the OECD Information Technology Outlook 2002,
the current list of top ICT R&D spenders contains a much higher number of Korean,
Chinese Taipei and Chinese firms.
In terms of growth in R&D spending, the leaders are Google (114%, Internet firm),
SanDisk (91%, IT equipment), Research in Motion (63%, communication equipment),
Lenovo (54%, IT equipment) and Nvidia (42%, electronics) (all CAGR, in current USD terms),
followed by a group of Internet, service, and software firms despite their smaller number in the
overall top 250 (Table 3.2). China and India each have one firm in the top 10 in terms of growth.
Box 3.3. Samsung R&D and innovation
Korean ICT firms (mainly LG Electronics, Samsung Electronics and SK Telecom) havecaught up very rapidly in terms of R&D spending. Samsung is now the world’s secondlargest semiconductor company behind Intel Corp. (partly owing to earlier appreciation ofthe Korean won against the USD), and the 11th largest global R&D spender in 2006.Samsung is the third largest ICT firm in terms of R&D expenditure (USD 6.5 billion in 2007)
just after Microsoft and Siemens and before IBM and Intel. Its growth of R&D expenditureis a multiple of that of other top 10 firms, with growth of around 25% (CAGR, USD terms)between 2000 and 2007 (as compared to 10% for Microsoft and 3% for IBM). This placesSamsung within the top 20 fastest-growing spenders on R&D. R&D expenditure as apercentage of sales also rose from 4% in 2000 to close to 10% in 2007. A quarter ofSamsung’s workforce (36 000 employees) is involved in R&D with facilities in Korea, India,China, the Russian Federation, the United States and Japan. Samsung’s research activitiesfocus on semiconductors, solid-state drives (SSDs), flash memory, liquid crystal displays(LCDs), printers, mobile WiMAX technology and cell phones. Mirroring similar R&Dresearch trends in other ICT firms, the company has developed research in biotechnology(biochips) and other fields that link ICTs with natural sciences (convergence of IT,biotechnology and nanotechnology).
Source: Based on OECD Information Technology Outlook database and company information.
Table 3.2. Top ICT R&D spenders: Expenditure growth, 2000-07Percentages, CAGR, based on current USD
Company Country Industry Growth 2000-07
1 Google United States Internet 114
2 SanDisk United States IT equipment 91
3 Research in Motion Canada Communications equipment 63
4 Lenovo China IT equipment 54
5 Nvidia United States Electronics and components 42
6 Infosys India Services 40
7 Yahoo United States Internet 39
8 e-bay inc United States Internet 35
9 Symantec/Veritas United States Software 35
10 Jabil Circuit United States Electronics and components 34
1 2 http://dx.doi.org/10.1787/477317104847Source: OECD Information Technology Outlook database.
An
OE
CD
Bro
wo
L e c tur
ylnO dae
R
OECD INFORMATION TECHNOLOGY OUTLOOK 2008 – ISBN 978-92-64-05553-7 – © OECD 2008160

3. ICT RESEARCH AND DEVELOPMENT AND INNOVATION
se_it E ditin
es
eu
le
Non-OECD firms are over-represented in terms of growth of R&D, in part because of
their low starting level (Table 3.2). Apart from Lenovo (China) and Infosys (India) which are
in the top 10, there are a significant number of IT, electronic equipment and semiconductor
firms from Chinese Taipei (Lite-on Technology, AU Optronics, Taiwan Semiconductor,
Benq/Qisda) and communication equipment firms from China (Huawei, ZTE) among the
top 50 (see OECD, 2006a Chapter 3).
Semiconductor and hardware firms (communication and IT equipment, electronics)
are the most R&D-intensive in terms of R&D expenditures per employee (Table 3.3).
Broadcom (semiconductors) leads with USD 213 000 per employee, followed by Qualcomm
(communication equipment), Nvidia (electronics and components), and SanDisk (IT
equipment). Google has greatly increased R&D spending per employee to reach sixth place
in 2007. Software firms such as Electronic Arts, Microsoft, Adobe Systems and Intuit are
also spending leaders (on the R&D intensity of the computer and video game industry,
see OECD, 2005a). US ICT firms dominate the top 50 with notable exceptions such as
Nintendo (Japan), Advantest (Japan), ASM Lithography (the Netherlands), Samsung (Korea),
LG Electronics (Korea), Qimonda (Germany), Nortel Networks (Canada), Nokia (Finland) and
Ericsson (Sweden). Few other European or Japanese firms are among the top 50. None of the
biggest R&D spenders is among the top 10 for R&D expenditure per employee and as a
share of sales, suggesting either that they specialise in R&D or are at an early stage in the
growth cycle before R&D efforts become new saleable products.
Trends in R&D intensity
R&D expenditure as a share of sales revenues is another measure of R&D intensity.
Semiconductor firms lead by this measure (Table 3.4). The top 10 firms in this ranking
spent between one-fifth and one-third of revenue on R&D.
On average, in 2006, semiconductor and software firms were the most R&D-intensive,
with average R&D spending equivalent to around 15% of revenues (Figure 3.15).
Communication equipment firms are also relatively R&D-intensive. Semiconductor firms
had a strong increase in R&D intensity between 2000 and 2006 while IT equipment,
services and telecommunication firms have seen an overall decrease. The leading
Table 3.3. Top ICT R&D spenders: R&D expenditures per employee, 2007USD
Company Country Industry R&D expenditure per employee 2007
1 Broadcom United States Semiconductors 212 541
2 Qualcomm United States Communication equipment 142 891
3 Nvidia United States Electronics and components 135 440
4 SanDisk United States IT equipment 131 778
5 Electronic Arts United States Software 131 772
6 Google United States Internet 126 153
7 Advanced Micro Devices United States Semiconductors 112 485
8 Juniper Networks United States Communication equipment 105 971
9 LSI Corp United States Semiconductors 105 765
10 Nintendo Japan Electronics and components 93 924
1 2 http://dx.doi.org/10.1787/477370442428Source: OECD Information Technology Outlook database.
An
OE
CD
Bro
wo
L e c tur
ylnO dae
R
OECD INFORMATION TECHNOLOGY OUTLOOK 2008 – ISBN 978-92-64-05553-7 – © OECD 2008 161

3. ICT RESEARCH AND DEVELOPMENT AND INNOVATION
se_it E ditin
es
eu
le
telecommunications firms reporting R&D include former monopoly incumbents (e.g. BTand SK Telecom), some of which are required by law to conduct R&D (OECD, 2007b).
IT equipment firms such as Apple, Dell and Hewlett Packard are often seen as leading
innovators, but with R&D intensity below 5% they are at the lower end of the top
100 ranking of R&D intensity. Apple’s very strong revenue growth coupled with slower
increases in R&D have led to declining R&D intensities in recent years (3.3% in 2007), even
though it is well known for product innovations, leading design and strong branding. Other
IT equipment firms with strong consumer product operations from Chinese Taipei and
China such as Benq/Qisda, Lenovo, ASUStek and Acer are also at the lower end of the
ranking of R&D intensity, but they tend to innovate most in process technology and supply
arrangements. Internet firms such as Amazon and Expedia have stronger R&D intensities
(over 5%) but are still far from other US Internet firms such as Google (13%) or Yahoo! (16%).
Firms from the United States dominate the list of the most R&D-intensive, but there
are exceptions, such as NXP (the Netherlands, semiconductors). Other European firms in
the top 50 include the semiconductor manufacturers STMicroelectronics (Switzerland),
Infineon Technologies (Germany) and the software firm SAP (Germany). A few non-US
Table 3.4. Top ICT R&D spenders: R&D intensity (R&D expenditure as share of sales), 2000 and 2007
Company Country Industry R&D intensity 2000 (%) R&D intensity 2007 (%)
1 Broadcom United States Semiconductors 23 36
2 Electronic Arts United States Software 18 34
3 Advanced Micro Devices United States Semiconductors 14 31
4 LSI Corp United States Semiconductors 14 25
5 Juniper Networks United States Communications equipment 13 22
6 NXP Netherlands Semiconductors n.a. 21
7 Qualcomm United States Communications equipment 11 21
8 Analog Devices United States Electronics and components 16 20
9 Freescale Semiconductor United States Semiconductors 17 20
10 Adobe Systems United States Software 20 19
1 2 http://dx.doi.org/10.1787/477425685188Source: OECD Information Technology Outlook database.
Figure 3.15. Average R&D intensity of top ICT firms by sector, 2000 and 2006Percentages
1 2 http://dx.doi.org/10.1787/474342515785
Source: OECD Information Technology Outlook database.
2006 2000
0 5 10 15%
Semiconductors
Software
Communications equipment
Internet
Electronics and components
IT equipment
Services
Telecommunications
An
OE
CD
Bro
wo
L e c tur
ylnO dae
R
OECD INFORMATION TECHNOLOGY OUTLOOK 2008 – ISBN 978-92-64-05553-7 – © OECD 2008162

3. ICT RESEARCH AND DEVELOPMENT AND INNOVATION
se_it E ditin
es
eu
le
communication equipment firms (e.g. Nortel Networks of Canada, Ericsson of Sweden) are
also on the list. Only one Japanese firm, Advantest (IT equipment), has been in this top
50 ranking for some years, and some other Japanese companies (e.g. Rohm, Pioneer,
Omron, Yokogawa Electric) have oscillated between 50th and 60th place.
There are two Chinese communication equipment firms (ZTE and Huawei) in the top
50 most R&D-intensive ICT firms, sharing top positions with firms such as Juniper Networks,
Tellabs, Qualcomm, Motorola, Avaya and Cisco (all United States), Nortel Networks, Research
in Motion (both Canada), Ericsson (Sweden), Alcatel-Lucent (France) and Nokia (Finland).
The leading countries in terms of average R&D intensity of top R&D-performing firms
are Sweden (Ericsson, TeliaSonera), Switzerland (STMicroelectronics, Swisscom), Finland
(Nokia), Canada (CGI Group, Nortel Networks, Celestica, Research in Motion) and the
United States, with averages of between 11 and 7% (in decreasing order of intensity). But
the R&D intensity of ICT firms from the United States is based on the averages of nearly
70 ICT firms in the sample, many more than for other countries. Only US Internet or
software firms (and the German SAP) are among the top R&D spenders in absolute terms
or in R&D intensity. Korean firms have an average R&D intensity of 6.5%. Japan is ninth
(R&D intensity of 5.1% in 2006), but it also has many ICT firms in the sample (36). Average
R&D intensities of reporting firms from Australia and the United Kingdom are low (mostly
telecommunication firms).
Over time the average R&D intensities of countries’ top ICT firms have shifted
(Figure 3.16). Canada and the United States lead in intensity but have experienced some
declines (to an average of about 8%). Japan and the European Union have considerably lower
R&D intensities (around 5%). The strongest increase in R&D intensity has occurred for Korean
firms (6.5%, now ahead of Japanese and European firms and close to the United States) and
Chinese ICT firms (3%, overtaking Chinese Taipei firms). However, the IT equipment firm
Figure 3.16. R&D intensity of ICT firms, by economy/region, 2002-06 (only top ICT firms reporting R&D)
Percentages, figures in brackets are number of firms in the sample
1 2 http://dx.doi.org/10.1787/474428823676Note: Given the increased internationalisation of corporate R&D, some R&D performed by ICT firms is conductedabroad and not in the home country. EU includes R&D reporting firms from Austria, Belgium, Denmark, Finland,France, Germany, Italy, the Netherlands, Spain, Sweden, and the United Kingdom.
Source: OECD Information Technology Outlook database.
%12
10
8
6
4
2
02002 2003 2004 2005 2006
EU (24)
Canada (4)
China (4)
USA (68)
Chinese Taipei (18)
Korea (5)
India (3)
Japan (36)
An
OE
CD
Bro
wo
L e c tur
ylnO dae
R
OECD INFORMATION TECHNOLOGY OUTLOOK 2008 – ISBN 978-92-64-05553-7 – © OECD 2008 163

3. ICT RESEARCH AND DEVELOPMENT AND INNOVATION
se_it E ditin
es
eu
le
Lenovo (China) has a low R&D intensity (1.5%) compared to OECD IT equipment firms –
Sandisk (11%), Sun Microsystems and NEC (both 7%), IBM (6%), Toshiba (6%) – and it is behind
many Chinese Taipei firms. No Chinese semiconductor firm is in the top 250 list.
Indian firms (ICT services firms TCS, Wipro and Infosys) have increased their R&D
intensities but these remain below 1%; they are among the few ICT services firms in the top
250 by revenue. Their R&D intensities are still relatively low compared to US ICT services
firms such as DST systems (7%), ADP (7%) and SunGard (6%). India has no ICT equipment
or semiconductor firms with R&D expenditures or revenues comparable to the group of top
ICT firms.
Overall, firms from Chinese Taipei are not very R&D-intensive despite its large PC-
related market shares; Acer and ASUSTeK have low R&D intensities (0.1% and 1.4%,
respectively), and the overall R&D intensity of its ICT firms has decreased significantly
(from almost 3% to less than 2%). This can be explained by the strong increase in revenue
for IT equipment and electronics firms combined with more moderate growth of R&D
expenditures. Currency fluctuations and transfers of ICT-related R&D activities from
Chinese Taipei to China (see OECD, 2006a, Chapter 3) may also play a role. The Taiwan
Semiconductor Manufacturing Company is relatively R&D-intensive (around 5%), but less
so than OECD semiconductor firms which spend between 15 and 35% of revenue on R&D.
In electronics and components Chinese Taipei’s United Microelectronics R&D intensity is
equivalent to that of OECD firms.
Firms from the OECD accession country Israel are not in the top 250 ICT R&D list,
although its software firms, which focus mainly on enterprise and security software,
Internet applications and computer-assisted design (CAD) software (e.g. Check Point, Nice
Systems, Emblaze, Retalix) are R&D-intensive (Figure 3.9 shows the high volume of
software R&D in Israel).
Trends in the organisation of ICT R&DThe ICT sector is R&D-intensive but is also innovative in terms of how it organises
R&D. It has benefited from partnerships with public research and employed a mix of
internal and external and national and international R&D strategies. While all have been
used for many years, the organisation of R&D has been changing: collaboration and
internationalisation of R&D are seen as major sources of innovation for the industry and
there are signs that they are increasing. Moreover, public support for ICT-related R&D
continues to be a major priority (see Chapter 7). However, the lack of internationally
comparable data remains an issue if trends are to be identified more clearly.
The importance of publicly funded research
The move from initial basic research to applications can take several decades, and
unanticipated results from basic research have been important building blocks for
developing new products. Publicly funded research has long been a stimulus for business
R&D and the development of key technologies such as semiconductors or networking
technologies (NRC, 2003; MIC Japan, 2005).18 In particular, national space and defence R&D
programmes have funded a significant amount of ICT-related research in the past,
underpinning applied ICT hardware and software research and new fields such as
bioinformatics and nanotechnology. Often-cited examples that began from publicly funded
An
OE
CD
Bro
wo
L e c tur
ylnO dae
R
OECD INFORMATION TECHNOLOGY OUTLOOK 2008 – ISBN 978-92-64-05553-7 – © OECD 2008164

3. ICT RESEARCH AND DEVELOPMENT AND INNOVATION
se_it E ditin
es
eu
le
basic research and became commercial products are the Internet, graphical user
interfaces, global positioning systems, and web search technologies.
Because of the complex interactions between research, development and innovation, the
ICT sector has always relied heavily on publicly funded R&D and on partnerships involving
government, public sector research organisations, industry and universities (for long-term
basic scientific research). ICT firms are often part of regionally concentrated clusters or set up
labs close to universities to benefit from spillovers of public ICT-related R&D. In the United
States, for example, 70% of the R&D performed by all domestic and foreign computer and
electronic firms in 2005 took place in four locations,19 all in close proximity to public research
institutes (National Science Board, 2008). The relative importance of access to public research
results increases in times of falling company budgets for basic research.
In recent years OECD countries have substantially increased their overall public
funding for R&D (OECD, 2008a). Data on government budget appropriations or outlays for
R&D (GBAORD) show that between 2000 and 2006, government R&D budgets in the OECD
area expanded by 6.8% annually, faster than GDP, although with considerable differences
among countries.20 The composition of public R&D also varies considerably, as some
countries have large defence R&D budgets (e.g. 0.6% of GDP in the United States, and 0.2%
of GDP in the United Kingdom and France).21
In spite of the importance of public research for the ICT sector, internationally comparable
official figures on publicly funded ICT-related R&D are not available.22 Government
appropriations for ICT-related R&D and related activities cannot be broken down by sub-sector
or by ICT-related socio-economic objectives. Although broad socio-economic objectives such
as “Non-oriented research in mathematics and computer science” are directly or indirectly
related to ICT research, ICT-specific data are difficult to produce.
Most OECD governments have multi-annual funding programmes for ICT R&D to
promote research and (international) co-operation between the private and public sectors
(Table 3.5). ICT R&D budgets in the United States (NITRD), Japan (Council for Science and
Technology Policy’s ICT-related R&D budget), and at the EU level (ICT-related funding in the
Seventh Framework Programme – FP7) are each over USD 1 billion a year.23 These
programmes alone are equivalent to around 5% of the R&D expenditures of the top ICT
firms discussed above (close to 5% for the United States and the EU, close to 4% for Japan),
and most of these expenditures complement those of business by focusing on basic or
exploratory research which would not otherwise be undertaken by the business sector.
Furthermore, most of these programmes are only a part of total public funding available for
ICT-related research and are often accompanied by public research project funding at sub-
national or national level. General public policy measures, e.g. R&D tax concessions and
incentives, education and training, and support for university and public institutional
research are also important for the direct promotion and indirect support of ICT-related
R&D in the business sector. Other countries’ funding for ICT research also has high priority,
as stand-alone policies (e.g. Germany’s ICT 2020), or as a major pillar of wider science,
technology and innovation policies (e.g. Spain’s Ingenio 2010, Canada’s Mobilizing Science
and Technology to Canada’s Advantage). Non-OECD countries such as China and India are
also increasing public support for ICT-related research. These programmes are usually part
of national science and technology agendas, but compared to the United States, Japan and
the EU, annual funding explicitly for ICT-related research is still low.
An
OE
CD
Bro
wo
L e c tur
ylnO dae
R
OECD INFORMATION TECHNOLOGY OUTLOOK 2008 – ISBN 978-92-64-05553-7 – © OECD 2008 165

3. ICT RESEARCH AND DEVELOPMENT AND INNOVATION
se_it E ditin
es
eu
le
Finally, national ICT diffusion strategies include plans to boost R&D as a driver of
innovation. Examples include the u-Korea Master Plan (2006-10) and Turkey’s and
Switzerland’s Information Society Strategies. Non-OECD economies are also including
Table 3.5. ICT R&D promotion and public funding in selected OECD and non-member economies
ICT R&D funding programmes
United States: Networking and Information Technology Research and Development (NITRD) ProgrammeFunding (proposed): USD 3 billion (2008)● High-end computing infrastructure and applications● High-end computing R&D● Cybersecurity and information assurance● Human-computer interaction and information management● Large-scale networking● High-confidence software and systems● Socio-economic implications of IT and workforce development● Software design and productivity● Prioritised application areas: health care, public safety, environmental
protection, space sciences, defence
Japan: Third Science and Technology Basic PlanFunding for ICT-related R&D projects (approved): JPY 161 billion (USD 1.4 billion) (2008)● High-speed, highly reliable information systems (mobile networks,
optical networks, high-speed low-consumption networked devices, distributed computing, digital authentication, IPv6, RFID)
● Next-generation ICTs (advanced human-computer interfaces, quantum cryptography, robotics, organic devices)
● R&D infrastructures (high-end databases and computing, networked collaboration, Earth Simulator, satellite communication systems)
● Prioritised application areas: environment and energy, mobility, disaster prevention and public security, health care and welfare, education and human resources, e-government.
European Union: Seventh Framework Programme (EU FP7), Co-operationFunding for ICT-related R&D projects (approved): EUR 9.1 billion (USD 12.5 billion) (2007-13)● Pervasive and trusted network and service infrastructure● Cognitive systems, interaction, robotics● Components, systems, engineering● Digital libraries and content● Future and emerging technologies● Prioritised application areas: sustainable and personalised health
care, transport and mobility, environmental sustainability and energy efficiency, independent living and inclusion
Germany: ICT 2020 – Research for innovationsFunding (planned): EUR 380 million (USD 520 million) a year● Electronics and microsystems (nanostructures)● Software systems and knowledge processing (simulated reality,
human-computer interaction)● Communication technologies and networks (grid computing)● ICT security and reliability● ICT in complex systems (embedded systems)● Internet of Things and services (RFID)● Future developments (organic computing, photonics)● Prioritised application areas: automotive, mobility, engineering,
health care and medical engineering, logistics, energy and environment
Canada: Networks of Centres of Excellence, and othersFigures indicate approved yearly funding● Canadian Institute for Photonic Innovations (USD 4 million)● Geomatics for informed decisions (USD 3 million)● Mathematics of IT and complex systems (USD 4 million)● Intelligent sensing for innovative structures (USD 2 million)● New media research networks (USD 4 million)● New Media R&D Initiative (USD 1 million)
Finland: TEKES research programmesFigures indicate approved yearly funding● Converging networks (USD 23 million)● Future healthcare (USD 34 million)● Modelling and simulation (USD 12.3 million)● Mobile enterprise solutions programme (USD 18 million)● Ubiquitous communication (USD 23 million)● Application of IT in mechanical, civil and automation engineering
(USD 0.5 million)
India: Eleventh 5-year plan (2007-12)Figures indicate proposed yearly funding for ICT-related R&D programmes● Advanced computing, e.g. grid computing (USD 24 million)● Robotics and automation (USD 6 million)● Sensors and integrated systems (USD 12 million)● Distributed sensors and networks (USD 10 million)● ICT security technologies (USD 27 million)● Telemedicine, instrumentation, diagnostics (USD 5 million)● Centre for photonics (USD 10 million)● Centre for molecular and medical imaging (USD 10 million)● Centre for mathematical and computational sciences
(USD 24 million)
China: National Guidelines for Medium- and Long-term Plan for Science and Technology Development (2006-20)Funding for ICT-related R&D programmes by the National Natural Science Foundation of China: USD 345 million (2006)● Electronics, information theory and processing (electromagnetic
fields, nano-electronics, bioinformatics, adaptive signal processing)● Computer science (system architectures, software engineering,
natural language processing, virtual reality, embedded systems)● Network and information security● Automation science (control theory, pattern recognition, artificial
intelligence, robotics, environmentally sustainable industrial production processes)
● Semiconductors, photonics (nanotechnology, high-speed optical networks, quantum optics, photonics in health and medical research)
● Interdisciplinary research between information and mathematics (theoretical studies on number representation, software engineering)
Note: Spending cannot be directly compared between countries. Sub-national funding programmes are not included,e.g. in federal states. Examples of research topics indicated in parentheses are not exhaustive. 2007 exchange ratesare used.Sources: OECD Information Technology Policy questionnaire and official ICT research strategy documents.24
An
OE
CD
Bro
wo
L e c tur
ylnO dae
R
OECD INFORMATION TECHNOLOGY OUTLOOK 2008 – ISBN 978-92-64-05553-7 – © OECD 2008166

3. ICT RESEARCH AND DEVELOPMENT AND INNOVATION
se_it E ditin
es
eu
le
R&D promotion in national ICT strategies, e.g. Singapore’s Intelligent Nation 2015
(see Chapter 7).
Collaborative R&D and “open innovation”
The terms “collaborative R&D” and “open innovation”25 are increasingly used to
characterise new forms of R&D and innovation which rely less on traditional in-house R&D
and more on collaborating on research and innovation with universities, public
laboratories, other firms and other knowledge sources. Major incentives include cost and
risk reduction (especially for pre-competitive R&D) and possibilities to enter new markets
with jointly developed technologies (Freeman and Soete, 2007). Such collaboration is
increasingly international and spans various ICT sectors and adjacent industries
(e.g. biotechnology).
Externally organised R&D activities of the ICT business sector have mainly taken the
form of:
● Partnerships, framework agreements or contract R&D with universities, R&D
laboratories and research institutes, often with a focus on longer-term R&D (including
the creation of joint laboratories or high-technology zones by ICT firms on university
campuses).26
● The involvement of PhD and postdoctoral researchers in the work of company R&D labs.
● R&D partnerships, industrial technology alliances and consortia of ICT firms (some
focused on upstream research and some on product co-development).
● Prospecting for new ideas from individuals and start-ups with promising research
(including through venture capital, incubation and acquisitions, and new participative
web strategies).
These trends have strengthened with the increased internationalisation of
collaboration and the development of global innovation networks. ICT R&D has become
more modularised and increasingly takes place outside the OECD region. The
internationalisation of R&D in general is also driven by the increasing use of ICTs as the
basic international science and technology infrastructure (e.g. broadband research
networks), by programmes that encourage international research collaboration (e.g. the EU
FP7’s focus on co-operation with entities from Asian countries) and by specialised
organisations (e.g. the International Technology Roadmap for Semiconductors).27 Long-
standing public research organisations (Fraunhofer ICT institutes in Germany, Battelle in
the United States, VTT in Finland, TNO in the Netherlands) also increasingly form global
research alliances or public-corporate R&D consortia.
At the firm level, Asia is becoming the target for new collaboration, both within Asia
(e.g. co-development of optical storage media by Samsung and Toshiba) and between OECD
ICT firms and Asian partners. Chinese and Indian firms in particular have become strategic
research partners for OECD ICT firms (e.g. Siemens and China’s Huawei; Ericsson and
China’s Datang Telecom on alternative 3G network protocols; Agilent and China’s Chengdu
Quianfeng on communications test equipment; Microsoft and India’s Infosys on enterprise
resource planning software; Yahoo and India’s Tata on cloud computing). OECD ICT firms
also collaborate with Asian universities (e.g. Philips with China’s Zhejiang University, US
Xybernaut with Beijing University of Aeronautics for software solutions). A few alliances
are also forming between Indian and Chinese ICT firms (mainly in the area of software and
An
OE
CD
Bro
wo
L e c tur
ylnO dae
R
OECD INFORMATION TECHNOLOGY OUTLOOK 2008 – ISBN 978-92-64-05553-7 – © OECD 2008 167

3. ICT RESEARCH AND DEVELOPMENT AND INNOVATION
se_it E ditin
es
eu
le
ICT services) and between Russian and Chinese ICT firms (e.g. Russia’s Sitronics Corp. and
ZTE for global navigation satellite systems).
Second, R&D partnerships and alliances have encompassed different ICT sub-sectors,
often with links to universities. Semiconductors and microelectronics pioneered such
collaboration in the ICT sector in the 1970s (see Box 3.4). Recent examples include: i) the
Reliable Adaptive Distributed Systems Laboratory (RAD Lab) at the University of Berkeley,
which is supported by Google, Sun, Microsoft, Siemens, Oracle, Cisco and others;
Box 3.4. Semiconductor research collaboration
Semiconductor and microcomputer research collaborations in the 1970s and 1980s wereearly examples of public-private research partnerships in the ICT sector, which wereinitiated by government and later inspired collaboration in other sectors. The first suchinitiative was the very large-scale integration (VLSI) consortium (1976-80), initiated by theJapanese Ministry of International Trade and Industry (MITI) (which provided around 40%of the USD 350 million budget); it included Fujitsu, NEC, Hitachi, Mitsubishi, and Toshiba.Subsequently, the growing market shares of Japanese semiconductor manufacturers ledthe US government to initiate similar collaboration, notably the Semiconductor ResearchCorporation (SRC)1 in 1982 and SEMATECH in 1987, the latter with funding from the publicresearch agency DARPA, which provided around half of the consortium’s budget.2
Semiconductor R&D industry alliances are still formed, increasingly for relatednanotechnology research. Purely domestic research alliances continue, e.g. the STARC andSELETE programmes in Japan,3 and Japan’s Toshiba, NEC and Fujitsu have also joinedforces and agreed to spend JPY 3 billion (USD 29 million) from 2006 to 2010 to develop non-volatile memory technologies (STT-MRAM). Korea initiated a state-backed R&D programme:from 2004, KRW 52.58 billion (USD 54 million) are to be spent over eleven years on
semiconductor research, of which the Korean government pays half. Some nationalcollaboration has become international – sometimes with less or no government support.In 1998, for instance, SEMATECH started to include foreign companies such as Hyundai,Infineon, STMicroelectronics, and DARPA funding was subsequently ended. New allianceswere also formed, such as the Common Platform consortium composed of IBM andSamsung and partnering with Infineon, Freescale, STMicroelectronics and Toshiba tojointly develop CMOS manufacturing processes.
International semiconductor collaboration also includes joint research by companies,universities and private research institutes. Some of these ventures are publicly co-funded,such as that of IBM and STMicroelectronics at Crolles, France, which is supported by taxconcessions. The State University of New York at Albany’s College of Nanoscale Scienceand Engineering has attracted a number of company collaborations (e.g. the recentlyannounced IBM-Hitachi alliance), some of which benefit from public grants. TheInteruniversity Microelectronics Centre in Belgium is a private research institute withalmost all of the top semiconductor manufacturers among its core technology partners(e.g. Intel, Samsung, STM, NXP Semiconductors, TSMC, Hynix) and with governmentsupport of various kinds.
1. Founding members: AMD, CDC, DEC, General Instrument, Honeywell, HP, IBM, Intel, Monolithic Memories,Motorola, National Semiconductor.
2. Founding members: AMD, AT&T, DEC, Harris, HP, Intel, IBM, LSI Logic, Micron, Motorola, NationalSemiconductor, NCR, Rockwell International, Texas Instruments.
3. STARC and SELETE are both formed by: Fujitsu, Matsushita, NEC, Oki, Renesas, Rohm, Sanyo, Seiko-Epson,Sharp, Sony, Toshiba; see www.starc.jp and www.selete.co.jp.
Sources: Grindley et al. (1994); Katz and Ordover (1990); NIST (2006); Samuels (1987); and company information.
An
OE
CD
Bro
wo
L e c tur
ylnO dae
R
OECD INFORMATION TECHNOLOGY OUTLOOK 2008 – ISBN 978-92-64-05553-7 – © OECD 2008168

3. ICT RESEARCH AND DEVELOPMENT AND INNOVATION
se_it E ditin
es
eu
le
ii) RESERVOIR, a research initiative led by IBM in the field of cloud computing, with support
from the EU FP7, involving ICT firms from the United States (e.g. Sun Microsystems), the EU
(e.g. SAP, Telefonica), and European universities; iii) Microsoft and Intel’s joint funding of
academic research into software development for parallel computing, business
intelligence and RFID; and iv) the joint laboratory for large-scale computer network
research formed by the Chinese companies Baidu and Huawei.28 Collaboration between
ICT firms on horizontal topics such as the environment is also increasingly common
(e.g. the StEP initiative for e-waste, and the Green Grid project in which companies from
various ICT sub-sectors are developing technologies with minimum environmental
impact).
Third, ICT R&D is becoming more interdisciplinary, with more research involving
nanotechnology, biotechnology and ICT firms. Such collaboration has not been widely
publicised (e.g. Sun Microsystems and SimBioSys for pharmaceuticals; the BioIT Alliance,
co-founded by Microsoft, HP, Sun and pharmaceutical and biotechnology companies;
Google’s investment in 23andMe, a company providing personalised genome analysis).
Finally, an increasing number of research partnerships have formed around open
standards or common technology platforms. The Open Handset Alliance (formerly Google
Android) engages in developing an open source mobile platform; its over 30 members
include Google, Broadcom, Intel, China Mobile, KDDI, and Samsung. Further examples of
joint handset development platforms include the LiMo Foundation (founding members
Motorola, NEC, NTT DoCoMo, Orange, Panasonic, Samsung and Vodafone) and the joint
venture Symbian. Open source software development and the increasing co-development
of application interfaces and services are also leading to collaboration and externally
focused ICT R&D. The Eclipse Foundation is an open source platform supported by IBM
which creates development environments, e.g. for enterprise software. Yahoo! partners
with the Apache Software Foundation on the development of Hadoop, an open source
project for distributed computing and data-intensive applications, which is being used for
commercial purposes by Amazon Web Services, as well as for research into distributed
computing by Yahoo! in collaboration with Computational Research Laboratories (India),
IBM and Google.
In sum, ICT companies increasingly use in-house R&D and their knowledge base
(including their intellectual property portfolios) to build increasingly complex global
innovation networks, to shape global standards, to develop platform strategies and to
access globalising markets for knowledge workers (Ernst, 2008; Dedrick and Kraemer, 2008,
ITIF, 2008).
In spite of these many examples, there is little comparable data on expenditures and
on the impact of R&D collaboration and alliances. While industry alliance databases show
increasing numbers of ICT alliances, they are often incomplete or not available for recent
years.29 Available data show that corporate funding of collaboration is low, especially when
compared to participating companies’ internal R&D expenditures. Official data on
collaboration on R&D for the United States in 2005 show that USD 745 million was spent by
industry for collaborative R&D projects in computer and electronic products, less than 2%
of the field’s total R&D expenditures (National Science Board, 2008).30 Moreover, R&D
outsourcing made up less than 3% of total computer and electronics R&D, compared to
much higher shares of contracted-out R&D for pharmaceutical companies (13%), for
example.31
An
OE
CD
Bro
wo
L e c tur
ylnO dae
R
OECD INFORMATION TECHNOLOGY OUTLOOK 2008 – ISBN 978-92-64-05553-7 – © OECD 2008 169

3. ICT RESEARCH AND DEVELOPMENT AND INNOVATION
se_it E ditin
es
eu
le
The extent of innovative ICT firms’ co-operation can be analysed from innovation
surveys, which cover co-operation on innovation activities beyond R&D (e.g. joint
marketing), but exclude pure contracting out.32 On this broad definition, the ICT sector is
one of the most collaborative sectors after the energy and chemical industries. Among
innovative ICT firms in four EU countries, about 34% engage in some type of collaboration
for innovation (against 24% of all firms), and 13% of ICT firms co-operate with universities
and public research organisations (against 8.5% of all firms) (Figure 3.17).
Overall these data suggest that ICT firms and institutions have a large array of co-
operative activities, particularly of an exploratory nature, but that the competitive
dynamics of the industry mean that most development and innovation close to market is
still often tightly held within firms. In sum, ICT R&D collaborations have historically been
important and continue to evolve in number and different forms. Yet despite the long
tradition and growing importance of externally focussed R&D initiatives in the ICT sector,
this phenomenon should not be overestimated. In strategic areas ICT firms still focus
firmly on internal development of technology while strongly relying on public-funded R&D.
The organisation of joint R&D projects continues to raise potential difficulties relating to
the sharing of research results and the protection of strategic company information. Future
research and better data will have to shed more light on this complex topic.
Globalisation of ICT R&D
Along with the pharmaceutical, biotechnology, chemical, health and automotive
sectors, the ICT industry has considerable foreign R&D investment (UNCTAD, 2005). ICT
Figure 3.17. Co-operation of innovative firms with universities or higher education institutions per industry sector, four EU countries (France, Germany, Spain and the United Kingdom), 2002-04
Percentages
1 2 http://dx.doi.org/10.1787/474448721826
Source: Fourth Community Innovation Survey (CIS4), OECD calculations.
0 5 10 15 20 25 30%
Publishing, printing, reproduction of recorded mediaTransport, storage and communication (w/o ICT)
Wholesale and retail trade, repairFinancial intermediation
Textiles, clothes and textile productsWood and wood products, except furniture
Pulp, paper and paper productsOther manufacturing
Non-metallic mineral productsFood products and beverages
Electricity, gas and water supplyBasic metals and fabricated metal products
Industry averageRubber and plastic products
Mining and quarryingReal estate, renting and business activities (w/o ICT)
Other electrical machinery and apparatusICT manufacturing and services
Motor vehicles, transports and transport equipmentOther machinery and equipment
Chemicals and chemical productsCoke, refined petroleum products and nuclear fuel
An
OE
CD
Bro
wo
L e c tur
ylnO dae
R
OECD INFORMATION TECHNOLOGY OUTLOOK 2008 – ISBN 978-92-64-05553-7 – © OECD 2008170

3. ICT RESEARCH AND DEVELOPMENT AND INNOVATION
se_it E ditin
es
eu
le
firms and public research organisations have increasingly internationalised their activities
and are establishing R&D laboratories in or links with foreign locations, including in non-
OECD countries. The ICT sector thus follows the trend of globalising R&D activities as
multinational enterprises increasingly aim to exploit globally available knowledge and
skills (MERIT, 2000; OECD, 2008a, 2008c).
At the same time, ICT R&D activities seem less internationalised than those of some
other sectors (OECD, 2008c; UNCTAD, 2007). Most ICT firms still conduct most of their R&D
in their home country. In 2005 only around 12% of business ICT R&D in the OECD was under
foreign control, and most international R&D relationships were among affiliated
companies rather than between domestic and foreign-owned ICT firms or laboratories.
Moreover, the R&D intensity of affiliates abroad is generally far lower than R&D intensity in
the home country. The need for secrecy, strong network effects, the search for spillovers
and the high costs of dispersed R&D centres favour concentrating R&D activities in a few
places. Globalised business ICT R&D networks are limited in number and often involve
leading firms such as Cisco, HP, IBM, Nokia, Motorola, Toshiba, NEC, Microsoft and Google,
which are likely to have between five and ten global ICT research centres. However,
available data probably do not capture global innovation networks involving smaller firms
(Ernst, 2008).
Outside the home country, ICT-related R&D investments are generally within the
OECD area, with Japanese and European ICT firms mostly establishing R&D centres in the
United States, and US ICT firms mainly establishing centres in Europe but increasingly in
Asia (see Box 3.5). Japan and Korea attract comparatively little foreign ICT R&D.
Box 3.5. R&D activities of US affiliates
US-based non-bank multinational enterprises have more than doubled the value of theiroverseas R&D activities through their foreign affiliates since the mid-1990s, toUSD 28.3 billion in 2005 or around 15% of total R&D expenditures of US MNEs (home andabroad) (BEA, 2007, and Table 3.6). In 2005, seven countries – the United Kingdom,Germany, Canada, France, Japan, and more recently Singapore and China – accounted fortwo-thirds of total R&D performed by US foreign affiliates. The share of R&D in Computersand electronic products is about 20% of total US MNE R&D abroad – a share which has
fallen slightly – but the share of ICT services has increased to around 5% of total overseasR&D.
Table 3.6. R&D performed abroad by majority-owned foreign affiliates of US parent companies, 2002-05
Current USD millions
Industry/sector 2002 2005
All industries 21 063 28 316
Manufacturing 18 736 24 036
Computers and electronic products 4 975 5 376
Non-manufacturing
Information services and data processing services 24 657
Computer systems design and related services 447 n.a.
1 2 http://dx.doi.org/10.1787/477425810053n.a.: not available; data are suppressed for reasons of confidentiality.Source: National Science Board, 2008; Bureau of Economic Analysis, 2007.
An
OE
CD
Bro
wo
L e c tur
ylnO dae
R
OECD INFORMATION TECHNOLOGY OUTLOOK 2008 – ISBN 978-92-64-05553-7 – © OECD 2008 171

3. ICT RESEARCH AND DEVELOPMENT AND INNOVATION
se_it E ditin
es
eu
le
Portugal, Hungary and Ireland have very high shares of ICT R&D under foreign control
(over 70%) (Figure 3.18). The United Kingdom and France are among the large European
countries in which foreign-controlled R&D exceeds 40%. All of these countries have even
higher shares of foreign affiliates in ICT production (e.g. the foreign affiliates’ share of
computer equipment manufacturing turnover exceeded 90% in the Czech Republic and
Hungary and is between 50 and 70% in France and the United Kingdom; see Chapter 2). In
spite of considerable foreign investment, the overall share of R&D expenditures under
foreign control in the ICT sector in the United States remains low.
Nonetheless, internationalisation of ICT R&D also increasingly involves establishing
ICT R&D centres in emerging economies. The sector is one of the first to have transformed
these into fully fledged elements of globalised research networks. This internationalisation
is strongly clustered and a few non-OECD locations are increasingly involved: China
(Shanghai, Beijing) (OECD, 2006a), Israel (Haifa), India (Bangalore and Delhi), the Russian
Federation (Moscow, St. Petersburg), and to a lesser extent Chinese Taipei, Malaysia and
Singapore. New locations are also emerging as sources of innovation.
Affiliates under foreign control continue to devote a smaller share of turnover to R&D
than national firms. However, in contrast to a few years ago, when foreign R&D, particularly
in developing countries, mainly reflected an investment requirement or adapted for local
markets, some foreign research activities now complement headquarter research
activities. For example, Hewlett Packard’s datamining in the Russian Federation, IBM’s
research on speech technologies in India and embedded systems in China, and Intel/
Yahoo!’s software or search technologies in Israel all draw on the local talent pool,
domestic firms and research organisations. In addition, ICT firms from emerging markets
(e.g. Huawei, Tata) increasingly have their own globalised innovation networks.
Figure 3.18. Share of R&D expenditure under foreign control in the ICT sector, 2005Percentages
1 2 http://dx.doi.org/10.1787/4745570387771. Manufacturing ICT only.2. 2004.
Source: OECD, AFA database, March 2008.
%0 20 40 60 80 100
Portugal1
Hungary1, 2
IrelandNetherlands1, 2
Czech RepublicFrance1
BelgiumUnited Kingdom
Germany1
Canada2
Sweden1
Poland1, 2
United StatesJapan1, 2
An
OE
CD
Bro
wo
L e c tur
ylnO dae
R
OECD INFORMATION TECHNOLOGY OUTLOOK 2008 – ISBN 978-92-64-05553-7 – © OECD 2008172

3. ICT RESEARCH AND DEVELOPMENT AND INNOVATION
se_it E ditin
es
eu
le
ICT-related R&D in other industriesICT-related R&D is increasingly crucial to technological advances and innovation in
non-ICT sectors and products.33 These include space, defence, infrastructure (e.g. power
grids), automobiles, automation, robots, logistics, aviation, healthcare, environment
monitoring, and toys.34 However, little is known about the extent and impact of ICT-related
R&D in these sectors, and these are hard to quantify because ICT R&D conducted in non-
ICT industries often cannot be identified separately and its spillovers are hard to measure.
To shed light on this issue, this section first examines official data on ICT R&D of non-
ICT firms which result in ICT products (mostly special tabulations from R&D surveys).35
However, this approach does not measure the ICT research in non-ICT sectors that is an
integral, but hidden, part of non-ICT products (e.g. embedded systems or software).36
These data also do not deal with the use of ICTs in R&D in non-ICT industries, e.g. in the
conception, development or production of products (e.g. software to conceptualise an
airplane), although they are increasingly used for such purposes.
Non-ICT industry R&D leading to ICT products
Overall analysis of product-field data shows that a large share of the R&D in non-ICT
industries, i.e. about one-quarter of economy-wide total ICT R&D, leads to ICT products.
Moreover, in some non-ICT sectors, expenditures on R&D that result in ICT products are a
large share of total R&D expenditures.37
Data for European countries show that in the Czech Republic, around 25% of ICT R&D
in 2006 was performed in non-ICT industries, mainly real estate, renting and business
activities (8%), construction (6%), manufacturing (5%), and financial intermediation (4%). In
Denmark, close to 20% of business ICT R&D in 2005 was conducted in non-ICT industries,
mainly in machinery, electrical equipment and medical instruments as well as financial
intermediation and engineering and technical testing. This ICT R&D was predominantly
devoted to product development rather than basic or applied research (Bloch and
Graversen, 2007).
In Norway, around 25% of ICT R&D in 2006 was performed outside the ICT sector
(Statistics Norway, 2008). The Norwegian financial and insurance sector accounts for half
of these ICT R&D expenditures. The rest is distributed across all other manufacturing and
service industries with some noteworthy shares in engineering and technical testing (3.5%)
and manufacturing of machinery and equipment (2%). In many non-ICT, often traditional
industries, the ICT R&D budget represents a large share of total R&D: 88% of the total R&D
budget of publishing, printing and reproduction of recorded media, 65 to 95% in financial
and insurance services, 28% in construction and 21% in wood manufacturing. In Finland,
on the other hand, almost all ICT R&D expenditures are still in the ICT industry itself.
In the Asia-Pacific region, the trends are similar. In Japan, in 2006 USD 5.5 billion was
spent on ICT-related R&D activities outside the ICT industry, or 24% of economy-wide ICT
R&D spending (Figure 3.19). The biggest share was in transport equipment, which is
dominated by the country’s carmakers and suppliers, and in electrical and general
machinery manufacturing. In Australia, non-ICT-industries were responsible for over 60%
of all ICT R&D expenditure in 2005-06 (up from 55% two years earlier). Finance and
insurance represented 34%, largely owing to in-house R&D of large Australian banks.
Software development plays a particularly important role in ICT R&D expenditures of
non-ICT industries, notably in finance and publishing, but also in manufacturing
An
OE
CD
Bro
wo
L e c tur
ylnO dae
R
OECD INFORMATION TECHNOLOGY OUTLOOK 2008 – ISBN 978-92-64-05553-7 – © OECD 2008 173

3. ICT RESEARCH AND DEVELOPMENT AND INNOVATION
se_it E ditin
es
eu
le
(e.g. machinery). In Australia, software R&D accounts for most ICT-related R&D in the
Australian manufacturing, wholesale and retail trade sectors. The National Bank of
Australia, for example, spent AUD 253 million (6% of revenue) on internal development
in 2006. Software development constitutes more than half of ICT R&D in the Czech
Republic’s financial intermediation, wholesale and retail trade, and motor vehicle repair
sectors.38 In the United States in 2005 about 30% of software was developed by non-ICT
industries – chemical, finance and insurance, automotive and real estate sectors, other
manufacturing activities, and service activities such as newspapers and architecture
(Figure 3.20) (see Jankowski, 2001). In Germany, non-ICT industries employ an increasing
number of software engineers; sometimes more than the IT industry itself (BITKOM, 2007).
Embedded systems and software in non-ICT industries
A growing amount of ICT-related research results in outputs which are an integral part
of non-ICT products (embedded systems or software) to improve their performance and
efficiency. This is usually not measured or is underestimated in the product-field data.
Figure 3.19. Japanese ICT R&D expenditures, in ICT and non-ICT sectors, 2006Percentages
1 2 http://dx.doi.org/10.1787/474561275655
Source: Japanese Statistics Bureau, 2007.
Figure 3.20. Software development in industrial R&D, United States, 2005Percentage of total software development
1 2 http://dx.doi.org/10.1787/474626703743
Source: National Science Foundation (2007).
ICT industry76%
Transportation equipment, 6%
General machinery, 5%
Electrical machinery,equipment and supplies, 5%
Other manufacturing, 3%Chemical products, 2%
Services, 2%Iron and metal products, 1%
Other, 0%
Software, 34%
Computer systems designand related services, 21%
Computer and electronicproducts, 10%
Internet service/search, 5%
Other sectors (incl. non-disclosed information), 19%
Finance, insurance, andreal estate, 4% Other non-manufacturing, 3%Wholesale and retail trade, 2%Scientific R&D services, 2%
An
OE
CD
Bro
wo
L e c tur
ylnO dae
R
OECD INFORMATION TECHNOLOGY OUTLOOK 2008 – ISBN 978-92-64-05553-7 – © OECD 2008174

3. ICT RESEARCH AND DEVELOPMENT AND INNOVATION
se_it E ditin
es
eu
le
Industry associations and private consultancy reports put the 2008 market value for
embedded systems at around EUR 138 billion and for embedded software at EUR 1.5 billion
(BITKOM, 2007); this is equivalent to around 2.5% of total worldwide ICT spending
(see Chapter 1). The market for embedded systems is growing rapidly (FAST, 2005): 60% of
global semiconductor revenues, for example, came from uses outside the traditional
computer market in 2007 (see Chapter 1).39 Corporate R&D strategies as well as many R&D
policies and programmes priorit ise the development of embedded systems
(see Figure 3.1 and Table 3.5).40
A substantial share of the research for these embedded systems is conducted by the
ICT industry itself and is captured by ICT industry R&D expenditures. In particular
computing and telecommunications have been bigger producers and users of embedded
systems than the automotive, medical and other sectors (FAST, 2005). In the United States,
for example, ICT firms other than software firms still account for most R&D expenditures for
software development despite the growing share in non-ICT industries (National Science
Board, 2008; Figure 3.20).41 In China, the leading producers of embedded software are also
communication equipment firms such as ZTE or the consumer electronics firm Haier.
However, R&D on embedded systems is increasingly used outside the ICT sector even
if generated in the sector. Semiconductor R&D in particular is catering to the growing
commercial interests of the non-ICT industry. Manufacturers such as Intel, Samsung,
Texas Instruments, Toshiba, Renesas, Freescale and STMicroelectronics have increasing
revenues from these activities.
Non-ICT firms in fields such as electrical engineering have also specialised in ICT
R&D (Bosch and Continental develop products for the automotive industry, see Box 3.6).
In official statistics, this would probably be captured as R&D in manufacturing of electrical
equipment (main activity) or by R&D for automotive products (product field) but not as
ICT-related R&D. This therefore complicates the analysis of the development of
embedded systems. Furthermore, the process of gearing ICT research results to non-ICT
products and the development of embedded systems is seldom simple and often requires
substantial R&D by the non-ICT firms to adapt and integrate the technologies (Mortensen
and Bloch, 2006).42
Box 3.6. Embedded systems in cars
The automobile sector is under pressure to improve its energy efficiency, to reduce its
environmental footprint and to increase passenger and pedestrian security. ICT research isplaying a major role to improve the competitiveness of automobile companies and toaddress these challenges. A modern, high-end car features about 80 embedded systemswhich are organised in various domain-specific networks. It has been suggested that acar’s electronics cost more than the steel used to build it, and that high-end cars can havemore than 100 central processing units (BITKOM, 2007). The same sources forecast that thesoftware code volumes necessary for a car will soon rival the software code of computeroperating systems.
Embedded systems and software are mostly used for security, multimedia and the interfacebetween the driver and the automobile. Standard components are electronic fuel injection oranti-lock brakes. Advanced driver assistance systems include brake assist systems, lanedeparture warning systems, Adaptive Cruise Control (ACC), blind spot detection, driver
An
OE
CD
Bro
wo
L e c tur
ylnO dae
R
OECD INFORMATION TECHNOLOGY OUTLOOK 2008 – ISBN 978-92-64-05553-7 – © OECD 2008 175

3. ICT RESEARCH AND DEVELOPMENT AND INNOVATION
se_it E ditin
es
eu
le
ICT-related patents and R&D expendituresPatent data can be used as an indicator of R&D output although they are a trailing rather
than a leading indicator.43 The number of ICT-related patents grew very strongly from the
mid-1990s to 2005 when over 50 000 international ICT-related patent applications were filed
Box 3.6. Embedded systems in cars (cont.)
drowsiness monitoring and warning, emergency calls, Electronic Stability Control (ESC), nightvision, obstacle and collision warning and voice recognition. Finally, meeting emissionstandards is only possible with new electronics and embedded systems. Safety measures gobeyond in-car electronics: new traffic safety systems make use of communication betweencars, modern networks and the road infrastructure (Kompetenznetze Deutschland, 2007).
This focus on ICT R&D is reflected in increasing ICT expenditures by and for the automotivesector. For example, German automotive companies have far higher R&D intensities than theinternational averages, partly because of the increasing ICT-related R&D (Federal Ministry ofEducation and Research, Germany, 2007). Germany has also seen automotive originalequipment suppliers specialise in the provision of ICT-related R&D. Continental Corporation,for instance, with revenues of EUR 16.6 billion in 2007 and almost 152 000 employees, evolved
from a tyre manufacturer to a leading supplier of brake technology, vehicle dynamics control,electronics and sensor systems. Other leading microelectronics and automotive supplierssuch as Bosch contribute to ICT and microelectronics research.
Sources: German Association for Electrical, Electronic and Information Technologies; German Association ofthe Automotive Industry (VDA), www.vda.de/en/aktuell/statistik/jahreszahlen/allgemeines/index.html; BITKOM,2007; and Centre for Automotive Safety Research at the University of Adelaide. OECD (2008d) provides moredetails on the importance of broadband networks to modern transport and road management systems.
Figure 3.21. ICT-related patents filed under the PCT, by country, 1994-2005Number of patents
1 2 http://dx.doi.org/10.1787/474628656187
Source: OECD, Patent database, March 2008.
18 000
10 000
12 000
14 000
16 000
8 000
6 000
4 000
2 000
02002 2003 2004 2005200120001996 1997 1998 199919951994
Israel
United States
Australia
EU25
India
Japan
Russian Federation
Korea China
An
OE
CD
Bro
wo
L e c tur
ylnO dae
R
OECD INFORMATION TECHNOLOGY OUTLOOK 2008 – ISBN 978-92-64-05553-7 – © OECD 2008176

3. ICT RESEARCH AND DEVELOPMENT AND INNOVATION
se_it E ditin
es
eu
le
under the Patent Co-operation Treaty (PCT) with an average increase of 5% a year (CAGR)
over 2000-05 (see Annex Box 3.A1.2 and OECD, 2007c for definitions). From 2000 to 2004, ICTs
were the third fastest-growing technical field among PCT international applications (+28%),
behind medical (+32.2%) and audiovisual technology (+28.3%) (WIPO, 2008).
The United States, Europe and Japan continue to lead in terms of total PCT
applications (Figure 3.21). The number of ICT-related patent applications grew strongly in
Korea and in China, with 2 308 and 2 099 international patents, respectively, in 2005;
Chinese ICT patents more than doubled between 2004 and 2005. Resident ICT patent filings
in the home country have grown particularly strongly in Korea and China. The main drivers
are Samsung Electronics, (Korea), LG Electronics (Korea), Huawei Technologies (China),
Electronics and Telecommunications Research Institute (Korea), ZTE Corporation (China)
and NHN Corporation (Korea).
ICT-related patents represent on average 36.5% of total PCT filings and the share of ICT
patents in total patents has been rising in almost all countries since the late 1990s
(Figure 3.22). The shares are higher in some countries (Figure 3.23) owing to the focus on
ICT inventions in Finland (59% of all national PCT filings), Singapore (56%), the Netherlands
(48%), Korea (44%) and Japan (41%). The proportion of ICT patents in total Chinese filings
tripled in a decade, from 17.3% in 1996-98 to 50.3% in 2002-05. India, the Russian
Federation, South Africa, Brazil, Chile and other OECD enhanced engagement or accession
countries are lower, with Israel as the exception. The United States (35% of all ICT-related
patents), Japan (18%) and Germany (8%) lead in ICT-related patenting under the PCT and
together make up well over half of ICT patent filings. Korea stands sixth, just before China,
which is ahead of many other OECD economies.
Patent data also reveal that ICT patents are more internationalised than patents of
other sectors: 17.5% of all ICT patents granted between 2001 and 2003 involve cross-border
ownership (OECD, 2007c). Non-OECD countries such as China, India, Brazil and the Russian
Federation still show a high level of foreign ownership in ICT-related patents. Patent data
also confirm the increasing role of non ICT-industries in ICT R&D and innovation. In
Europe, for example, the automotive sector accounted for 4% of total software patents (Hall
et al., 2006).
ICT firms as patent applicants
ICT firms occupy the top positions with respect to patents granted or applications for
patents. Patent grants result from applications a few years earlier and are more a retrospective
than prospective indicator. As shown in Table 3.7, 18 ICT firms are among the first 20 firms
with patents granted by the United States Patent and Trademark Office (USPTO).44 The top
20 are stable over time, but Samsung (now second, closing the gap with IBM), LG Electronics
and Microsoft have made a significant jump in US patent applications. ICT service and Internet
firms such as Google and Yahoo! do not have large numbers of patents.
Patent applications are potentially a better way to analyse trends in ICT inventions
than patent grants as they reflect more recent activity (Table 3.8). The majority of the top
20 patent applicants in Europe, Japan and under the PCT are ICT firms: 13 out of 20 in
Europe, 14 out of 20 in Japan, and 16 out of 20 under the PCT.45 No ICT firm from outside
the OECD region or from OECD accession/enhanced engagement countries is in the top
20 firms granted patents in the United States or among the top 20 applicants at the
European Patent Office (EPO) or the Japan Patent Office (JPO). The picture is different for
An
OE
CD
Bro
wo
L e c tur
ylnO dae
R
OECD INFORMATION TECHNOLOGY OUTLOOK 2008 – ISBN 978-92-64-05553-7 – © OECD 2008 177
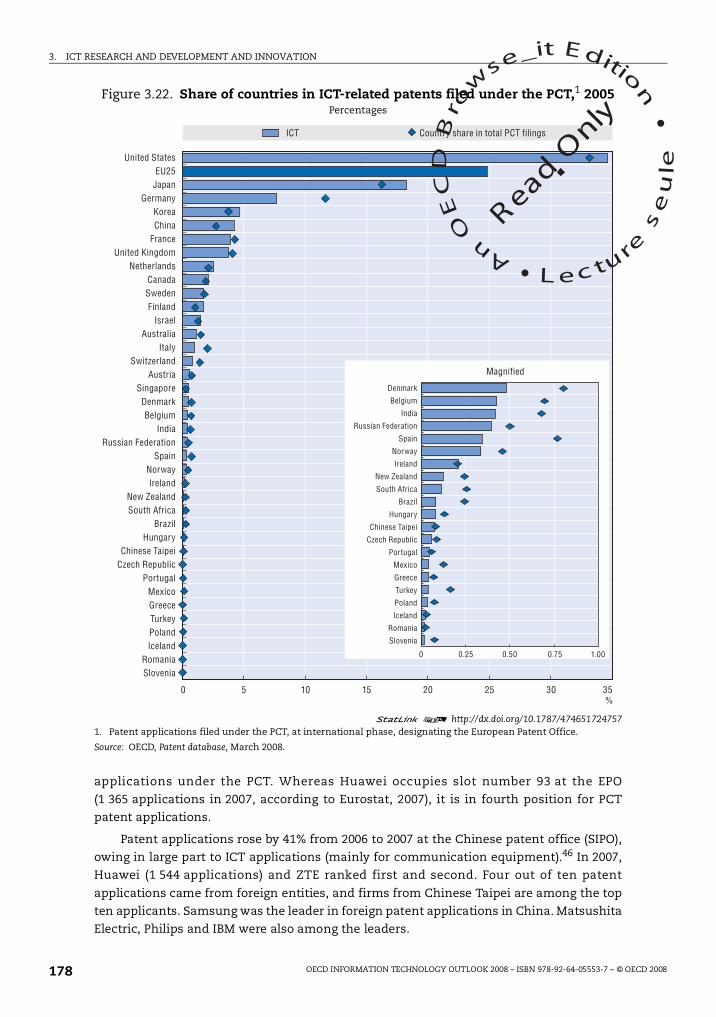
3. ICT RESEARCH AND DEVELOPMENT AND INNOVATION
se_it E ditin
es
eu
le
applications under the PCT. Whereas Huawei occupies slot number 93 at the EPO
(1 365 applications in 2007, according to Eurostat, 2007), it is in fourth position for PCT
patent applications.
Patent applications rose by 41% from 2006 to 2007 at the Chinese patent office (SIPO),
owing in large part to ICT applications (mainly for communication equipment).46 In 2007,
Huawei (1 544 applications) and ZTE ranked first and second. Four out of ten patent
applications came from foreign entities, and firms from Chinese Taipei are among the top
ten applicants. Samsung was the leader in foreign patent applications in China. Matsushita
Electric, Philips and IBM were also among the leaders.
Figure 3.22. Share of countries in ICT-related patents filed under the PCT,1 2005Percentages
1 2 http://dx.doi.org/10.1787/4746517247571. Patent applications filed under the PCT, at international phase, designating the European Patent Office.
Source: OECD, Patent database, March 2008.
ICT Country share in total PCT filings
0 105 15 20 25 30 35
0.75 1.00
Magnified
0.500.250
%
United StatesEU25
JapanGermany
KoreaChina
FranceUnited Kingdom
NetherlandsCanadaSwedenFinland
IsraelAustralia
ItalySwitzerland
AustriaSingaporeDenmarkBelgium
IndiaRussian Federation
SpainNorwayIreland
New ZealandSouth Africa
BrazilHungary
Chinese TaipeiCzech Republic
PortugalMexicoGreeceTurkeyPolandIceland
RomaniaSlovenia
Denmark
Belgium
India
Russian Federation
Spain
Norway
Ireland
New Zealand
South Africa
Brazil
Hungary
Chinese Taipei
Czech Republic
Portugal
Mexico
Greece
Turkey
Poland
Iceland
Romania
Slovenia
An
OE
CD
Bro
wo
L e c tur
ylnO dae
R
OECD INFORMATION TECHNOLOGY OUTLOOK 2008 – ISBN 978-92-64-05553-7 – © OECD 2008178

3. ICT RESEARCH AND DEVELOPMENT AND INNOVATION
se_it E ditin
es
eu
le
Figures 3.24 and 3.25 plot the ICT R&D expenditure (2002-04) of leading ICT firms
against their lagged patenting activity in 2006 – patents granted by the USPTO and patent
applications to the EPO, JPO and PCT. While ICT firms tend to engage in R&D and related
ICT patenting, there is not necessarily a clear correlation at the firm level. Some firms with
high R&D expenditures were granted or applied for few ICT patents. USPTO patents
granted are low relative to the R&D expenditures of some large ICT firms such as Microsoft,
Siemens, Nokia, NTT and Ericsson. At the EPO, the firms that patent relatively less than
Figure 3.23. ICT-related patents as a percentage of national total,1 PCT filings,2 2003-05
1 2 http://dx.doi.org/10.1787/4746762005541. Only countries with more than 250 PCT filings during 2003-05 are included in the graph.2. Patent applications filed under the Patent Co-operation Treaty, at international phase, designating the European
Patent Office.Note: Patent counts are based on the priority date, the inventor’s country of residence and fractional counting.
Source: OECD, Patent database, March 2008.
1996-98
0 10 20 30 40 50 60%
FinlandSingapore
ChinaNetherlands
KoreaJapanIsrael
IrelandChinese Taipei
CanadaUnited States
TotalSweden
OECDUnited Kingdom
FranceEU25
Russian FederationAustralia
NorwayAustria
GermanyHungaryDenmark
SwitzerlandNew Zealand
PolandBelgium
South AfricaIndiaItaly
SpainCzech Republic
BrazilSlovenia
MexicoTurkey
An
OE
CD
Bro
wo
L e c tur
ylnO dae
R
OECD INFORMATION TECHNOLOGY OUTLOOK 2008 – ISBN 978-92-64-05553-7 – © OECD 2008 179

3. ICT RESEARCH AND DEVELOPMENT AND INNOVATION
se_it E ditin
es
eu
le
other ICT firms are Microsoft, IBM, Intel, HP and Cisco. This also reflects the geographic
location of the patent office and firm strategies, but some firms (e.g. Microsoft)
systematically take out relatively few patents in relation to R&D expenditure. Japanese and
Table 3.7. Top 20 ICT patenting firms among patents granted (all industries) by the USPTO number of patents, 2007
United States, 2007
1. IBM Corporation, United States, 3 125
2. Samsung Electronics, Korea, 2 723
3. Canon Inc., Japan, 1 983
4. Matsushita Electric Industrial, Japan, 1 910
5. Intel Corp., United States, 1 864
6. Microsoft Corp., United States, 1 637
7. Toshiba Corporation, Japan, 1 519
8. Micron Technology, United States, 1 476
9. Hewlett Packard, United States, 1 466
10. Sony Corp., Japan, 1 454
11. Hitachi, Ltd, Japan, 1 381
12. Fujitsu Limited, Japan, 1 293
13. Seiko Epson, Japan, 1 205
15. Infineon Tech AG, Germany, 847
17. Texas Instruments, United States, 749
18. Ricoh, Japan, 727
19. Siemens, Germany, 698
20. LG Electronics, Korea, 682
Note: The USPTO does not publish patent applications but patents granted. Figures showthe total number of patents granted to these firms and not only ICT-related patents asdefined in Annex Box 3.A1.2.Source: USPTO (2008).
Table 3.8. Position of ICT firms among the top 20 patent applicants (all industries) at the European Patent Office, Japan Patent Office, and the PCT, 2007 or latest
available year
Europe, 2007 Japan, 2006 PCT, 2007
1. Phillips, Netherlands, 3 222 1. Matsushita, Japan, 13 842 1. Matsushita, Japan, 2 100
2. Samsung, Korea, 2 478 3. Canon, Japan, 8 317 2. Phillips, Netherlands, 2 041
3. Siemens, Germany, 1 850 4. Toshiba, Japan, 8 104 3. Siemens, Germany, 1 644
5. Matsushita, Japan, 1 395 5. Seiko Epson, Japan, 8 000 4. Huawei Technologies, China, 1 365
7. LG Electronics, Korea, 1 080 6. Sharp, Japan, 5 992 7. Qualcomm Inc, United States, 974
8. Sony, Japan, 929 7. Ricoh, Japan, 5 953 8. Microsoft Corp, United States, 845
9. Nokia, Finland, 873 9. Sony, Japan, 5 419 9. Motorola, United States, 824
10. Fujitsu, Japan, 819 10. Fujitsu, Japan, 4 923 10. Nokia Corp, Finland, 822
13. Hitachi, Japan, 755 11. Mitsubishi Electric, Japan, 4 697 13. LG Electronics, Korea, 719
15. NXP, Netherlands, 670 12. Hitachi, Japan, 4 485 14. Fujitsu, Japan, 708
16. Qualcomm, United States, 669 14. Fuji Xerox, Japan, 4 012 15. Sharp, Japan, 702
19. IBM, United States, 631 15. NEC, Japan, 3 318 16. NEC Corporation, Japan, 626
20. 3M, United States, 584 16. Sanyo Electric, Japan, 3 099 17. Intel, United States, 623
20. Samsung Electronics, Korea, 2 536 18. Pioneer, United States, 611
19. IBM, United States, 606
20. Samsung, Korea, 598
Note: Figures show the total number of patents applied for by firms and not only ICT-related patents as defined inAnnex Box 3.A1.2.Source: EPO, 2008; Japan Patent Office; WIPO patent database (PCT applications).
An
OE
CD
Bro
wo
L e c tur
ylnO dae
R
OECD INFORMATION TECHNOLOGY OUTLOOK 2008 – ISBN 978-92-64-05553-7 – © OECD 2008180

3. ICT RESEARCH AND DEVELOPMENT AND INNOVATION
se_it E ditin
es
eu
le
Korean ICT firms seem instead to be very active in patenting in non-Asian patent offices
when compared with R&D expenditures, and Chinese ICT firms are following their lead.
Strong growth in ICT sector patenting is first and foremost a result of high R&D
expenditures and the innovative nature of the ICT sector. It also reflects the trend towards
more patenting, new ICT sub-sectors, patenting by non-OECD ICT firms, and the rise of
new forms of patenting (e.g. of software or business methods in certain OECD countries).
Additional drivers are strategies to take out multitudes of patents (so-called patent
thickets) or to bring technologies to market; interest in licensing technologies (including by
firms specialising in patenting); the desire to ward off patent disputes; and the building of
a domestic technology base to avoid paying royalties.
The ICT sector has also played a leading role in post-R&D alliances, product innovation
and other innovation related to intellectual property. ICT firms have long been, and are
Figure 3.24. ICT-related patents granted at the USPTO versus R&D expendituresPatents granted in 2006 (y axis); average R&D expenditure 2002-04 in USD millions (x axis)
1 2 http://dx.doi.org/10.1787/474816575282
Source: USPTO and OECD Information Technology Outlook database.
Figure 3.25. ICT-related patent applications at the EPO versus R&D expendituresPatent applications in 2006 (y axis); Average R&D expenditure 2002-04 in USD millions (x axis)
1 2 http://dx.doi.org/10.1787/474826775765Note: Philips is not included.
Source: EPO and OECD Information Technology Outlook database.
4 000
3 500
3 000
2 500
2 000
1 500
1 000
0
500
0 1 000 2 000 3 000 4 000 5 000 6 000 7 000 8 000
IBM
SamsungCanon Matsushita (Panasonic)HP
IntelSonyHitachiToshibaMicron Technology
Fujitsu MicrosoftSeiko Epson
Infineon TI SiemensAlcatel-Lucent
Sun NECCisco NokiaMotorola
EricssonNortelNTT
R² = 0.5172
2 500
2 000
1 500
1 000
0
500
0 1 000 2 000 3 000 4 000 5 000 6 000 7 000 8 000
Samsung Siemens
Matsushita (Panasonic)
LG ElectronicsSony
Nokia
HitachiFujitsuThomson
Alcatel IBMEricsson IntelToshibaSTMicroelectronics
MicrosoftQualcomm
Huawei
HPInfineon Cisco
R² = 0.227
An
OE
CD
Bro
wo
L e c tur
ylnO dae
R
OECD INFORMATION TECHNOLOGY OUTLOOK 2008 – ISBN 978-92-64-05553-7 – © OECD 2008 181

3. ICT RESEARCH AND DEVELOPMENT AND INNOVATION
se_it E ditin
es
eu
le
increasingly, engaged in strategies involving, for example, technology cross-licensing
(including to competitors), the creation of patent pools (e.g. the MPEG-2 patent pool),
patent clearinghouses, the granting of patents to wide communities of users (e.g. IBM).
These commercial exchanges of intellectual property allow for combining patented
technologies from various sources into new products, for potentially avoiding patent
disputes, and for facilitating product innovation at lower costs.
However, the overall impact of increased patenting and of new intellectual property
alliances on innovation and the patent system remains unclear. Patent data need to be
complemented by research that seeks to establish better patent quality indicators and
links with the measurement of innovation.
ConclusionThe ICT industry leads in R&D expenditures, employment and patents, and the
software and semiconductor sectors are particularly R&D-intensive. The share of ICT R&D
conducted in non-ICT industries is also high (about one-quarter of total ICT R&D), and in
some non-ICT sectors, ICT R&D spending (especially software-related) accounts for a large
share of total R&D. The United States and Japan still have a large lead in terms of ICT firms’
R&D expenditures and of ICT firms that spend the most. Korea has caught up impressively
in this area. Although some other OECD and non-OECD countries also have relatively high
levels of ICT R&D spending, ICT R&D expenditures from non-OECD ICT firms (especially
from China and India, but also other emerging economies) are still comparatively low.
However, new ICT firms from non-OECD countries are emerging rapidly, are increasingly
R&D-intensive, and are rapidly forging new partnerships with OECD ICT firms and research
organisations.
The organisation of R&D in the ICT sector continues to evolve, in particular around
new kinds of collaboration (involving emerging ICT sub-sectors or common standards and
technology platforms). The sector’s research activities are increasingly international,
although ICT firms commonly form global R&D networks with a limited number of global
R&D centres located in only a few locations. Moreover, the reliance on long-term ICT-
related public R&D and public-private collaboration continues to be important for the ICT
sector (see Chapter 7). There has been a striking increase in the number of ICT patents in
the OECD region (in particular from Korea) but also from non-OECD ICT firms (e.g. some
Chinese firms).
Countries and firms have laid out ambitious ICT research priorities, which matter not
only for innovation in the sector but increasingly for non-ICT sectors and for tackling
societal challenges. OECD and non-OECD countries need to reassess the balance between
public and private ICT R&D and the appropriate mix of short and long-term incentives and
support for ICT research and innovation in the context of internationalisation and location
of ICT firms, their R&D activities and high skill requirements.
Notes
1. See for instance DCITA (2007) on ICT R&D spillovers.
2. For other compilations of ICT-related research challenges, see Dachs and Zahradnik (2005);Jordan (2008); National Academy of Engineering, Grand Challenges for Engineering,www.engineeringchallenges.org; UK Computing Research Committee, Grand Challenges in ComputerResearch, www.ukcrc.org.uk/grand_challenges.
An
OE
CD
Bro
wo
L e c tur
ylnO dae
R
OECD INFORMATION TECHNOLOGY OUTLOOK 2008 – ISBN 978-92-64-05553-7 – © OECD 2008182

3. ICT RESEARCH AND DEVELOPMENT AND INNOVATION
se_it E ditin
es
eu
le
3. Early US High Performance Computing and Communications programmes (the predecessor of theNetworking and Information Technology Research and Development programme, NITRD) onlyindicated ICT security as a sub-part of research into network infrastructures as did the EU’s FourthFramework Programme (FP4). The recent NITRD and the FP7 name ICT security as high-levelresearch challenges; see also National Research Council (2007).
4. See Methodology and Definitions Annex for the definition of the ICT sector used for R&Dexpenditures.
5. Definitions for R&D figures follow the Frascati Manual: OECD (2002b).
6. The data are for 77 non-OECD countries and territories.
7. Industrial research and development is defined as R&D activities carried out in the businessenterprise sector, regardless of the origin of funding.
8. More than one-third of total business R&D is carried out in the services sector in: Australia (47%),Norway (42%), Canada (39%), Ireland (39%), the Czech Republic (38%), the United States (36%) andDenmark (34%). In Korea, Germany and Japan less than 10% of business R&D is in the servicessector, but this may also partly reflect the limited coverage of services in their R&D surveys.
9. For Canada, see Industry Canada (2007); for Japan, see MIC (2007).
10. Austria, Australia, Belgium, Canada, the Czech Republic, Denmark, Finland, France, Germany,Greece, Ireland, Italy, Japan, Korea, the Netherlands, Norway, Poland, Portugal, Spain, the UnitedKingdom and the United States.
11. There is a break in series in the US data from 2003 to 2005 and this may largely explain theapparent decline in US ICT sector expenditures between 2003 and 2005.
12. This mirrors findings of a positive relationship between the size of a country and its propensity toinvest in R&D (Guellec, 1999).
13. Canada because of major reductions in R&D spending by the communications equipmentmanufacturing industries; Australia because of declining activities of Telstra’s ResearchLaboratories, closure of ICT related Cooperative Research Centres and withdrawals of a number ofmajor multinational firms from R&D activities in Australia (e.g. Ericsson, Motorola and Nortel)(Houghton, 2007).
14. Because of the break in series in US data between 2003 and 2005 the US data are not directlycomparable over time.
15. Austria, Australia, Belgium, Canada, the Czech Republic, Denmark, Finland, France, Germany,Greece, Hungary, Ireland, Italy, Japan, Korea, Mexico, the Netherlands, Norway, Poland, Portugal,Slovenia, Spain, Switzerland, the United Kingdom and the United States.
16. The comparison is between two different samples of firms: the top 100 firms by R&D expendituresin 2001 and the top 100 firms by R&D expenditures in 2006.
17. In accordance with European legislation and SEC rules, Siemens changed accounting principlesfrom GAAP to IFRS starting Q1 2007 and does not provide a reconciliation of R&D expenditures.Therefore, Siemens’ R&D expenditures are only available until 2006 according to GAAP and onlyfrom 2005 according to IFRS. In 2006, R&D expenditures reported under GAAP were EUR 5 billion,but under IFRS only EUR 3 billion, a difference of 40%.
18. See van Pottelsberghe (2008) on the links between publicly and privately funded R&D.
19. Cambridge and Route 128 in Massachusetts; the Silicon Hills of Austin, Texas; Champaign Countyin Illinois; Silicon Valley in California.
20. Since 2000, GBAORD grew by 8% annually across the OECD, from USD 197 billion in 2000 toUSD 293 billion in 2006 (in current PPP USD) (OECD, 2008a).
21. US spending for defence R&D is double the OECD average of 0.3% of GDP. Russia’s defence R&Dbudget was 0.4% of GDP in 2003. Intensities should be seen in the context of the United States’large GDP (see OECD, 2008a; OECD, Main Science and Technology Indicators [MSTI] database 2007/2).
22. Estimates were produced by GFII (2007); projects of the European Commission to produce furtherestimates are under way.
23. All three enjoy high priority due to their location at the highest policy-making level (United States:Executive Office of the President, Japan: PM’s Cabinet Office, EU: European Commission, adoptedby the European Parliament and European Council).
An
OE
CD
Bro
wo
L e c tur
ylnO dae
R
OECD INFORMATION TECHNOLOGY OUTLOOK 2008 – ISBN 978-92-64-05553-7 – © OECD 2008 183

3. ICT RESEARCH AND DEVELOPMENT AND INNOVATION
se_it E ditin
es
eu
le
24. Sources: National Coordination Office for Networking and Information Technology Researchand Development, United States, www.nitrd.gov; Council for Science and Technology Policy,Japan, www8.cao.go.jp/cstp/siryo/haihu73/siryo2.pdf and Ministry of Education, Culture, Sports,Science and Technology, Japan, www.mext.go.jp/english/kagaku/index.htm; Community R&DInformation Service, http://cordis.europa.eu/fp7; Federal Ministry of Education and Research,Germany, www.bmbf.de/en/9069.php ; Networks of Centres of Excellence Program, Canada,www.nce.gc.ca; TEKES, Finland, www.tekes.fi/eng/programmes/all; Government of India PlanningCommission, http://planningcommission.nic.in/plans/planrel/11thf.htm; Government of the People’sRepublic of China, www.gov.cn/jrzg/2006-02/09/content_183787.htm and National Natural ScienceFoundation of China, www.nsfc.gov.cn/english/06gp/index.html.
25. Open innovation comprises i) sourcing and integrating external knowledge of customers,suppliers, universities, research organisations, competitors; ii) bringing ideas to market, selling/licensing intellectual property and multiplying technology; and iii) working in alliances withcomplementarities (Chesbrough, 2003; Enkel and Gassmann, 2004; Chesbrough et al., 2006; OECD,2008b).
26. Examples of partnerships with universities include: Oracle and CERN (European Organisation forNuclear Research) for grid computing technologies; Microsoft, Nokia, Hitachi and Toshiba withresearch centres at the University of Cambridge; Fujitsu with the Universities of Tokyo andCambridge on quantum technologies.
27. The objective of the ITRS is to ensure advances in the performance of integrated circuits and toremove roadblocks to the continuation of Moore’s Law. This assessment, called roadmapping, is aco-operative effort of global industry manufacturers and suppliers, government organisations,consortia, and universities. See www.itrs.net.
28. For more information on particular collaborations, see RAD Lab, http://radlab.cs.berkeley.edu; IBM andGoogle partnership, www.ibm.com/ibm/ideasfromibm/us/google; RESERVOIR, ftp://ftp.cordis.europa.eu/pub/fp7/ict/docs/ssai/project-reservoir_en.pdf; Microsoft, “Microsoft and Intel Launch ParallelComputing Research Centers to Accelerate Benefits to Consumers, Businesses”, Press Release,18 March 2008, www.microsoft.com/presspass/press/2008/mar08/03-18UPCRCPR.mspx; “Baidu, Huaweito form joint lab”, China Business News, 17/12/2007.
29. See e.g. Hagedoorn (2001). Two information sources are the Co-operative Agreements andTechnology Indicators database of the Maastricht Economic Research Institute on Innovation andTechnology (CATI-MERIT) last updated in 2003 and the Thomas Database from which it is hard toseparate R&D alliances from other alliances and obtain time-series data. See also National ScienceBoard (2008).
30. The data do not cover possible international R&D collaborations or ICT services.
31. See also “NAICS and the ICT Sector (An analysis)”, 1998, prepared by the United States Bureau ofthe Census, OECD, Paris (internal OECD working document).
32. The European Union’s Fourth Community Innovation Survey (CIS4) measures four types ofinnovation as defined in the Oslo Manual: product, process, organisational, and marketing (OECD,2005b). Product innovations involve significant changes in the capabilities of goods or services. Bothentirely new goods and services and significant improvements to existing products are included.Process innovations represent significant changes in production and delivery methods.Organisational innovations refer to the implementation of new organisational methods. These canbe changes in business practices, in workplace organisation or in the firm’s external relations.Marketing innovations involve the implementation of new marketing methods. These can includechanges in product design and packaging, in product promotion and placement, and in methodsfor pricing goods and services. In the CIS4, innovation co-operation measures the activepartnership of the observed enterprise with other enterprises or non-commercial institutions suchas universities or public research institutes. Co-operation can take place with more than onepartner.
33. This section does not include ICTs in research, e.g. virtual modelling in the design of aircraft,except in cases where the ICT becomes part of the final product.
34. Often-cited anecdotal evidence indicates that over 80-90% of all integrated circuits and computinghardware are not in PCs but are embedded in other products (Artemis, 2006; BITKOM, 2007).
35. Data and specific tabulations for this chapter are based on: for Australia, the Australian Bureau ofStatistics (ABS), see also DBCDE (2006); for the Czech Republic, the annual business R&D surveyconducted by the Czech Statistical Office (CSO, 2008), with special tabulations provided to theOECD; for Denmark, Bloch and Graversen (2007); for Finland, provided by Statistics Finland; for
An
OE
CD
Bro
wo
L e c tur
ylnO dae
R
OECD INFORMATION TECHNOLOGY OUTLOOK 2008 – ISBN 978-92-64-05553-7 – © OECD 2008184

3. ICT RESEARCH AND DEVELOPMENT AND INNOVATION
se_it E ditin
es
eu
le
Germany, results of a business R&D survey published in Stifterverband (2007), special tabulationswere provided by the Stifterverband für die Deutsche Wissenschaft; for Japan, Japanese StatisticsBureau (2003, 2005, 2007); for Norway, Statistics Norway (2008). Cross-country comparison shouldbe treated with care due to different classifications, definitions, and survey designs.
36. In regular surveys following the “principal activity” approach, research by the automotive industrywould be classified as automotive R&D. In contrast, when using the product-field approach in R&Dsurveys, firms are asked to indicate the character of the end product of their R&D efforts(independently from their main activity). Under the product-field approach, a car companyconducting R&D leading to an ICT product would thus classify the research expenditures as ICTR&D. ICT research results (e.g. special chips) which can be identified as an integral part of anotherproduct (e.g. a car braking system) are classified as R&D in that sector (e.g. automotive R&D).
37. Not considered is ICT research which leads to non-ICT products which can also be identified inproduct-field data.
38. Data provided from the annual R&D survey conducted by the Czech Statistical Office (CSO, 2008).
39. See also the Embedded Software Industry Survey (2007), conducted by the Japanese Ministry ofEconomy, Trade and Industry (METI), www.meti.go.jp/policy/it_policy/technology/houkoku.html andwww.meti.go.jp/policy/it_policy/technology/ ET2007presentation.htm; and P. Tsarchopoulos, 2008,“Message from the project officer”, in HIPEAC info, No. 13, January, www.hipeac.net/system/files/nl13.pdf.
40. See also PCAST, 2007 (for the United States); and the EU’s ARTEMIS (Advanced Research andTechnology for Embedded Intelligence and Systems) programme, funded by public-privateinvestment of EUR 5.4 billion between 2007 and 2013, with the aim of achieving “world leadershipin intelligent electronic systems” by 2016; see www.artemis-office.org.
41. The majority of US and European software patents were obtained by the electronics,telecommunications equipment and machinery industries (Bessen and Hunt, 2007; Hall andMacGarvie, 2006). In Europe, the sector “electronic instruments and telecommunicationsequipment” alone accounted for 61.9% of software patents, followed by “telecommunications”with 8.2%.
42. See EurActiv.com, “Car industry EU’s top R&D investor”, 23 October 2006, www.euractiv.com/en/science/car-industry-eu-top-rd-investor/article-159033 and F. Simonot-Lion and Y. Trinquet (2003), “NewSolutions for In-Vehicle Embedded System Development”, ERCIM News, No. 52, www.ercim.org/publication/Ercim_News/enw52/simonot-lion.html.
43. Patents are an indicator of invention rather than innovation since not all patents arecommercialised and some types of technology are not patentable.
44. The USPTO does not publish patent applications.
45. Patent applications. However, national patent systems and application procedures are not entirelyharmonised and therefore differ. For example, EPO and JPO numbers refer to patent applicationsfiled in a given year, whereas PCT statistics cover patent applications published that year (18-monthtime lag). Moreover, the large number of JPO patent applications is largely due to proceduraldifferences (see OECD, 2009).
46. See Chinese Government’s Official Web Portal (2006), “SIPO reports fast growth of patentapplications”, 31 August, www.gov.cn/english/2006-08/31/content_374694.htm; and SIPO press releases:“Dramatic Increase of PCT Application in China in 2007”, 19 February, www.sipo.gov.cn/sipo_English/news/official/200802/t20080219_233605.htm and “China Sees Sharp Increase in Domestic PatentApplications”, 30 January, www.sipo.gov.cn/sipo_English/news/official/200801/t20080130_232476.htm.
References
Artemis (2006), “Artemis Strategic Research Agenda”, March, Advanced Research and Technology forEmbedded Intelligence and Systems, http://artemis-sra.eu/downloads/SRA_MARS_2006.pdf.
Bae, S.C. and S. Noh (2001), “Multinational Corporations versus Domestic Corporations: A ComparativeStudy of R&D Investment Activities”, Journal of Multinational Financial Management, Vol. 11, Issue 1,pp. 89-104.
Bessen, J. and R.M. Hunt (2007), “An Empirical Look at Software Patents”, Journal of Economicsand Management Strategy, Vol. 16, No. 1, pp. 157-189.
BITKOM (2007), Zukunft Digitale Wirtschaft, report by BITKOM e.V. and Roland Berger StrategyConsultants, BITKOM, Berlin.
An
OE
CD
Bro
wo
L e c tur
ylnO dae
R
OECD INFORMATION TECHNOLOGY OUTLOOK 2008 – ISBN 978-92-64-05553-7 – © OECD 2008 185

3. ICT RESEARCH AND DEVELOPMENT AND INNOVATION
se_it E ditin
es
eu
le
Bloch, C. and E.K. Graversen (2007), “Danish Research and Development within Information andCommunication Technology, ICT R&D Statistics”, Danish Center for Studies in Research andResearch Policy, www.forskningsanalyse.dk/IKT2005/MiniPub_%20IKT05_eng_A4.pdf.
Bureau of Economic Analysis [BEA] (2007), “Operations of US Multinational Companies in 2005”, byR. Mataloni, Survey of Current Business, US Department of Commerce, www.bea.gov/scb/pdf/2007/11%20November/1107_mnc.pdf.
Chesbrough, H.W. (2003), Open Innovation: The New Imperative for Creating and Profiting from Technology,Harvard Business School Press, Boston.
Chesbrough, H.W., W. Vanhaverbeke and J. West (eds.) (2006), Open Innovation: Researching a NewParadigm, Oxford University Press, Oxford.
Czech Statistical Office [CSO] (2008), “Information Economy in Figures 2008”, Czech Statistical Office,Prague, www.czso.cz/eng/redakce.nsf/i/information_economy_in_figures_2008.
Dachs, B. and G. Zahradnik (2005), “R&D Priorities of Europe’s Leading Public Research Organisations inthe Field of ICT”, in R. Compano, C. Pascu and M. Weber (eds.), Challenges and Opportunities for ISTResearch in Europe, Romanian Academy, Bucharest, http://fistera.jrc.es/pages/books/content Challengesbook/challenges book.htm.
Department of Broadband, Communications and the Digital Economy, Australia [DBCDE] (2006), “Overviewof the Australian ICT industry”, November, www.dbcde.gov.au/communications_and_technology/publications_and_reports/2006/ november/overview_of_the_australian_ict_industry.
Department of Communications, Information Technology, and the Arts [DCITA] (2007), “ICT andproductivity. Summary of DCITA publications”, www.dbcde.gov.au/communications_and_technology/publications_and_reports/2007/april/ict_and_productivity_summary_of_dcita_publications.
Dedrick, J. and K.L. Kramer (2008), “Globalisation of Innovation: The Personal Computing Industry”,MIT Industry Studies 2008, Personal Computing Industry Center, University of California (Irvine).
Dunning, J.H. (1977), “Trade, Location of Economic Activity and the Multinational Enterprise: A Searchfor an Eclectic Approach”, in B.G. Ohline, P.O. Hesselborn and P.M. Wijkman (eds.), The InternationalAllocation of Economic Activity: Proceedings of a Nobel Symposium held at Stockholm, Macmillan, London.
Enkel, E. and O. Gassmann (2004), “Driving Open Innovation in the Front End”, EURAM ConferencePaper, 16 May, www.alexandria.unisg.ch/Publikationen/37584.
Ernst, D. (2008), “The New Geography of Innovation and US Comparative Competitiveness”,Presentation at the 83rd Western Economic Association International Conference, Honolulu, 2 July.
European Commission (2006), Monitoring Industrial Research: The Annual Digest of Industrial R&D,Technical Report EUR22556, First issue – Pilot, European Communities, Brussels.
European Patent Office [EPO] (2008), Annual Report 2007, EPO, Munich, www.epo.org/about-us/publications/general-information/annual-reports/2007.html.
Eurostat (2007), “High-technology Patent Applications to the European Patent Office”, Statistics in Focus.Science and Technology, No. 20, by B. Felix, European Communities, Luxembourg.
Eutema (2007), Grundlagen einer IKT-Forschungsstrategie für Österreich, study commissioned by theFederal Ministry of Transport, Innovation and Technology of Austria and the Austrian Council forResearch and Technology Development, www.rat-fte.at/UserFiles/File/Studie07_Eutema_Grundlagen-IKT-Strategie.pdf.
FAST (2005), “Study of Worldwide Trends and R&D Programmes in Embedded Systems”, studycommissioned by the European Commission, ftp://ftp.cordis.europa.eu/pub/ist/docs/embedded/final-study-181105_en.pdf.
Federal Ministry of Economics and Technology, Germany [BMWI] (2007), “Second National IT Summit 2007.Hannover Declaration”, www.bmwi.de/BMWi/Navigation/Service/publikationen,did=230162.html.
Federal Ministry of Education and Research, Germany (2007), “Bericht zur technologischenLeistungsfähigkeit Deutschlands 2007”, www.technologische-leistungsfaehigkeit.de/en/1869.php.
Freeman, C. and L. Soete (2007), “Developing Science, Technology and Innovation Indicators: What WeCan Learn from the Past”, Maastricht Economic and Social Research and Training Centre onInnovation and Technology, UNU-MERIT Working Paper 2007-001, www.merit.unu.edu/publications/wppdf/2007/wp2007-001.pdf.
An
OE
CD
Bro
wo
L e c tur
ylnO dae
R
OECD INFORMATION TECHNOLOGY OUTLOOK 2008 – ISBN 978-92-64-05553-7 – © OECD 2008186

3. ICT RESEARCH AND DEVELOPMENT AND INNOVATION
se_it E ditin
es
eu
le
Grindley, P., D. Mowery and B. Silverman (1994), “SEMATECH and Collaborative Research: Lessons in theDesign of High-Technology Consortia”, Journal of Policy Analysis and Management, Vol. 13, No. 4,pp. 723-758.
Groupement Français de l’Industrie de l’Information (GFII) (2007), “Étude sur la Recherche etdéveloppement en sciences et technologies de l’information dans les grands pays industriels”,(Vols. 1 and 2, study commissioned by the French Ministry of National Education, Higher Educationand Research, www.csti.pm.gouv.fr/fr/activites-etudes.html.
Guellec, D. (1999), “À la recherche du tant perdu”, Revue Française d’Économie, Vol. 14, No. 1, pp. 117-169.
Hagedoorn, J. (2001), “Inter-Firm R&D Partnership – An Overview of Major Trends and PatternsSince 1960” in National Science Foundation, Division of Science Resources Studies, StrategicResearch Partnerships: Proceedings from an NSF Workshop, NSF 01-336, www.nsf.gov/statistics/nsf01336/p1s3.htm.
Hall, B.H. and M. MacGarvie (2006), “The Private Value of Software Patents”, National Bureau ofEconomic Research Working Paper, No. 12195, NBER, Cambridge, MA.
Hall, B.H., G. Thoma and S. Torrisi (2006), “The Market Value of Patents and R&D: Evidence fromEuropean Firms”, National Bureau of Economic Research Working Paper, No. 13426, NBER,Cambridge, MA.
Ho, Y.K, M. Tjahjapranata and C.M. Yap (2006), “Size, Leverage, Concentration, and R&D Investment inGenerating Growth Opportunities”, Journal of Business, Vol. 79, No. 2, pp. 851-876.
Houghton, J. (2007), “The Globalisation of ICT Research and Development: Some Implications for Firms,Public Research Institutions and Governments”, Minerva, http://eprints.vu.edu.au/archive/00000701.
Industry Canada (2007), “Canadian ICT Sector Profile”, March, www.ic.gc.ca/epic/site/ict-tic.nsf/en/h_it07229e.html.
ITIF (The Information Technology and Innovation Foundation) (2008), “Where Do Innovations Come From?Transformations in the US National Innovation System, 1970-2006”, by F. Bloch and M.R. Keller, July,Washington, DC.
Jankowski, J. (2001), “Measurement and Growth of R&D within the Service Economy”, Journal ofTechnology Transfer, Vol. 26, No. 4, pp. 323-336.
Japanese Statistics Bureau (several years), “Report on the Survey of Research and Development”,Ministry of Internal Affairs and Communication, www.stat.go.jp/english/data/kagaku/index.htm andwww.stat.go.jp/data/kagaku/2007/index2.htm.
Jaruzelski, B. and K. Dehoff (2007), “The Customer Connection: The Global Innovation 1000”,Strategy+Business, Issue 49, published by Booz Allen Hamilton.
Jordan, A.G. (2008), “Frontiers of Research and Future Directions in Information and CommunicationTechnology”, Technology in Society, Vol. 30, pp. 388-396.
Katz, M.L. and J.A. Ordover (1990), “R&D Co-operation and Competition”, Brookings Papers on EconomicActivity: Microeconomics, pp. 137-203.
Kompetenznetze Deutschland (2007), “Driver Assistance – But Safe!”, September, www.kompetenznetze.de/netzwerke/transp-gzvb-gesamtzentrum-verkehr-bschweig/innovationshighlights/en/driver-assistance.
Lieshout, M. van, C. Enzing, G. Bodea, A. van der Giessen, A. Hoffknecht, D. Holtmannspötter andE. Noyons (2005), “Converging Technologies for Enabling the Information Society”, report to theEuropean Commission Institute for Prospective Technological Studies, http://fiste.jrc.es/pages/documents/ConvTechReportforWEBv9.pdf.
Lindmark, S., T. Geomina and M. Ulbrich (2008), “R&D Business Investment in the EU ICT Sector”,European Commission Institute for Prospective Technological Studies Policy Brief, No. 23250 EN,February, http://ftp.jrc.es/JRC42084.pdf.
Maastricht Economic Research Institute on Innovation and Technology [MERIT] (2000), “Should Policy-makers Attract Foreign R&D? Understanding and Reacting to Industrial R&D Globalisation”, byS. Wunsch-Vincent, July 2000.
Ministry of Internal Affairs and Communications, Japan [MIC] (2005), “ICT R&D Programs for theUbiquitous Network Society. UNS Strategic Programs”, Telecommunications Council, http://203.140.31.100/joho_tsusin/eng/features/r_d_progrums.pdf.
MIC (2007), “Information and Communications in Japan”, White Paper 2007,www.johotsusintokei.soumu.go.jp/whitepaper/eng/WP2007/2007-index.html.
An
OE
CD
Bro
wo
L e c tur
ylnO dae
R
OECD INFORMATION TECHNOLOGY OUTLOOK 2008 – ISBN 978-92-64-05553-7 – © OECD 2008 187

3. ICT RESEARCH AND DEVELOPMENT AND INNOVATION
se_it E ditin
es
eu
le
Ministry of Trade and Industry, Norway [MTI] (2007), “Attracting Human Resources into ICT R&D –A Norwegian Perspective”, presented by P. Gretland at the National ICT Directors Forum, Braga,Portugal, 19 November.
Mortensen, P.S. and S. Bloch (2006), “Specialized R&D Surveys: Design and Application”, paperpresented at Blue Sky II Forum, 25-27 September, Ottawa, Canada, www.oecd.org/dataoecd/10/14/37450513.pdf.
National Institute of Standards and Technology [NIST] (2006), “Sustainable Collaboration: A Study ofthe Dynamics of Consortia”, by I. Petrick, A. Echols, S. Mohammed and J. Hedge for the USDepartment of Commerce, www.atp.nist.gov/eao/gcr06-888/gcr06-888report.pdf.
National Research Council [NRC] (2003), Innovation in Information Technology, Computer Science andTelecommunications Board, The National Academies Press, Washington, DC.
National Research Council (2007), Toward a Safer and More Secure Cyberspace, S.E. Goodman and H.S. Lin(eds.), The National Academies Press, Washington, DC.
National Science Board (2008), Science and Engineering Indicators 2008, National Science Foundation,Arlington, VA.
National Science Foundation (2007), “Federal Funds for Research and Development: Fiscal Years 2004-06”,June, by J. Jankowski, NSF 07-323.
OECD (1996), “Measuring R&D in the Services”, STI Working Papers 1996/1997, by A. Young,www.olis.oecd.org/olis/1996doc.nsf/LinkTo/NT00000A0A/$FILE/08E60120.PDF.
OECD (2002a), OECD Information Technology Outlook 2002, OECD, Paris, www.oecd.org/sti/ito.
OECD (2002b), Frascati Manual. Proposed Standard Practice for Surveys on Research and ExperimentalDevelopment, OECD, Paris.
OECD (2004), OECD Information Technology Outlook 2004, OECD, Paris, www.oecd.org/sti/ito.
OECD (2005a), “Digital Broadband Content: The Online Computer and Video Game Industry”, OECD,Paris, DSTI/ICCP/IE(2004)13/FINAL, www.oecd.org/dataoecd/19/5/34884414.pdf.
OECD (2005b), Oslo Manual: Guidelines for Collecting and Interpreting Innovation Data. A joint publication ofOECD and Eurostat, 3rd edition, OECD, Paris.
OECD (2006a), OECD Information Technology Outlook 2006, OECD, Paris, www.oecd.org/sti/ito.
OECD (2006b), Research and Development Expenditure in Industry. 1987-2004. ANBERD, OECD, Paris.
OECD (2007a), Science, Technology and Industry Scoreboard 2007. Innovation and Performance in the GlobalEconomy, OECD, Paris, www.oecd.org/sti/scoreboard.
OECD (2007b), OECD Communications Outlook 2007, OECD, Paris, www.oecd.org/sti/telecom/outlook.
OECD (2007c), Compendium of Patent Statistics 2007, OECD, Paris, www.oecd.org/sti/ipr-statistics.
OECD (2008a), OECD Science, Technology and Industry Outlook 2008, OECD, Paris, www.oecd.org/sti/outlook.
OECD (2008b), “Business Symposium on Open Innovation in Global Networks”, policy issues paper,25-26 February, Copenhagen, www.oecd.org/dataoecd/28/48/40199686.pdf.
OECD (2008c), “Recent Trends in the Internationalisation of R&D in the Enterprise Sector. Specialsession on globalisation”, DSTI/EAS/IND/SWP(2006)1/FINAL, OECD, Paris.
OECD (2008d), Broadband Growth and Policies in OECD Countries, OECD, Paris, www.oecd.org/sti/ict/broadband/growth.
OECD (2009), OECD Patent Statistics Manual, OECD, Paris, forthcoming.
Pottelsberghe, B. van (2008), “Europe’s R&D: Missing the Wrong Targets?”, Bruegel Policy Brief, Issue 3.
President’s Council of Advisors on Science and Technology, United States [PCAST] (2007), LeadershipUnder Challenge: Information Technology R&D in a Competitive World, August.
Samuels, R.J. (1987), “Research Collaboration In Japan”, MIT-Japan Program Working Paper, http://hdl.handle.net/1721.1/7580.
Statistics Norway (2008), “Research and Development (R&D) in the Norwegian Business EnterpriseSector 2006, Final Figures”, www.ssb.no/foun_en.
Stifterverband für die Deutsche Wissenschaft [Stifterverband] (2007), “FuE-Datenreport 2007. Tabellen undDaten”, Wissenschaftsstatistik GmbH, Essen, www.stifterverband.de/pdf/fue_datenreport_2007.pdf.
An
OE
CD
Bro
wo
L e c tur
ylnO dae
R
OECD INFORMATION TECHNOLOGY OUTLOOK 2008 – ISBN 978-92-64-05553-7 – © OECD 2008188

3. ICT RESEARCH AND DEVELOPMENT AND INNOVATION
se_it E ditin
es
eu
le
United Nations Conference on Trade and Development [UNCTAD] (2005), World Investment Report 2005.Transnational Corporations and the Internationalization of R&D, United Nations, New York,www.unctad.org/en/docs/wir2005_en.pdf.
UNCTAD (2007), World Investment Report 2007. Transnational Corporations, Extractive Industries andDevelopment, United Nations, New York, www.unctad.org/en/docs/wir2007_en.pdf.
United States Patent and Trademark Office [USPTO] (2008), “Report on Patenting by Organizations 2007”,www.uspto.gov/web/offices/ac/ido/oeip/taf/topo_07.htm.
World Intellectual Property Organization [WIPO] (2008), “WIPO Patent Report: Statistics on WorldwidePatent Activity, 2007 Edition”, www.wipo.int/ipstats/en/statistics/patents/patent_report_2007.html.
An
OE
CD
Bro
wo
L e c tur
ylnO dae
R
OECD INFORMATION TECHNOLOGY OUTLOOK 2008 – ISBN 978-92-64-05553-7 – © OECD 2008 189

3. ICT RESEARCH AND DEVELOPMENT AND INNOVATION
DB
ro
wse_it E ditio
n
es
eu
le
ylnO d
ANNEX 3.A1
Box 3.A1.1. When is software development R&D?
Guidelines on the treatment of software were included in the OECD Frascati Manual
in 1993. For a software development project to be classified as R&D, its completion must bedependent on the development of a scientific and/or technological advance, and the aimof the project must be resolution of a scientific and/or technological uncertainty on asystematic basis. R&D is, thus, only one of the stages in bringing a new software product
to the market and some of the following are considered R&D (not exhaustive):
1. R&D producing new theorems and algorithms in the field of theoretical computerscience.
2. Development of IT at the level of operating systems, programming languages, datamanagement, communications software and software development tools.
3. Development of Internet technology.
4. R&D on software tools or technologies in specialised areas of computing (e.g. artificialintelligence). Software-related activities of a routine nature are not considered R&D.*
National and firm-level data do not always follow this complex separation of softwareactivities which are considered R&D and those which are considered “routine”: Thiscomplicates the task of producing reliable and internationally comparable software R&Dfigures.
* This relates to work on system-specific or programme-specific advances publicly available prior to thecommencement of the work. Elimination of technical problems is excluded, as are support activities,converting and/or translating computer languages, adding user functionality to applications, debugging,adaptation of existing software, preparation of user documentation which does not involve scientific and/ortechnological advances, and market research.
Source: OECD Frascati Manual (2002b); OECD (1996).
An
OE
C
L e c tur
aeR
OECD INFORMATION TECHNOLOGY OUTLOOK 2008 – ISBN 978-92-64-05553-7 – © OECD 2008190

3. ICT RESEARCH AND DEVELOPMENT AND INNOVATION
se_it E ditin
es
eu
le
Box 3.A1.2. Definition of ICT patents
Within a patent document, several sections can be analysed in order to connect thepatent to the relevant technology: the International Patent Classification system (IPC) andthe national patent classification system; the title of the invention; the abstract describingthe invention and the list of claims. One or several classification codes are attributedduring the patent examination process. However, for emerging technologies, a specific
category or class might not yet be incorporated in the patent classification systems, whichmakes it difficult to identify patents related to these technologies afterwards. Therefore, toselect patents related to specific technological domains, one can either look at the IPCclasses and subclasses, and/or search for appropriate keywords within the text fields of thepatent document. Such a method might exclude, or include, patents that are, or are not,relevant for a specific domain, but it makes it possible nonetheless to provide a relativelygood picture of innovative activity in the technology field.
The 8th edition of IPC is used to identify patents in the ICT or biotechnology sectors. Thisdefinition remains provisional, as such fields evolve rapidly.
Patents in the ICT sector can be split into four fields, based on selected IPC classes:
Telecommunications
[G01S,G08C,G09C,H01P,H01Q,H01S3/(025,043,063,067,085,0933,0941,103,133,18,19,25),
H1S5,H03B,H03C,H03D, H03H, H03M, H04B, H04J, H04K, H04L, H04M, H04Q]
Consumer electronics
[G11B,H03F,H03G,H03J,H04H,H04N,H04R,H04S]
Computers, office machinery
[B07C,B41J,B41K,G02F,G03G,G05F,G06,G07,G09G,G10L,G11C,H03K,H03L]
Other ICT
[G01B,G01C,G01D,G01F,G01G,G01H,G01J,G01K,G01L,G01M,G01N,G01P,G01R,G01V,G01W,G02B6,G05B, G08G, G09B, H01B11, H01J (11/,13/,15/,17/,19/,21/,23/,25/,27/,29/,31/,33/,40/,41/,43/,45/),H01L]
Source: OECD (2007c). For further details on the IPC classes (IPC, 8th edition, 2006): www.wipo.int/classifications/ipc/ipc8.
An
OE
CD
Bro
wo
L e c tur
ylnO dae
R
OECD INFORMATION TECHNOLOGY OUTLOOK 2008 – ISBN 978-92-64-05553-7 – © OECD 2008 191

se_it E ditin
es
eu
le
An
OE
CD
Bro
wo
L e c tur
ylnO dae
R

ISBN 978-92-64-05553-7OECD Information Technology Outlook 2008
© OECD 2008
DB
ro
wse_it E ditio
n
es
eu
le
ylnO d
Chapter 4
Broadband and ICT Access and Use by Households and Individuals
Use of the Internet and broadband is spreading rapidly, and 1.5 billion people nowhave Interent access. Their socio-economic characteristics influence how they usethe Internet, and there is evidence that new kinds of “digital use divides” based onthese socio-economic differences are appearing as the original digital access divides
narrow. These new divides will need policy attention if they are to be overcome.
An
OE
C
L e c tur
aeR
193

4. BROADBAND AND ICT ACCESS AND USE BY HOUSEHOLDS AND INDIVIDUALS
DB
ro
wse_it E ditio
n
es
eu
le
ylnO d
Introduction1
The Internet and broadband are part of the everyday life of 1.5 billion people,2 and the
surge in broadband3 access is providing new paths for innovative Internet use. Over the
past decade, information and communication technology (ICT) policy has progressively
shifted its focus from ICT readiness to the impacts of use and the more complex aspects of
the “information society”.
This chapter focuses on how the diffusion of ICTs, the Internet and broadband to
households and individuals has developed and how the use of ICTs has changed. It first
describes diffusion of, and access to, personal computers, the Internet and broadband in
the light of different socio-economic factors. Next, it analyses the impacts of the Internet
and broadband on how people allocate their time. Finally, it looks at the different rates of
ICT diffusion across various populations, the resultant digital access divides (haves versus
have-nots), the subsequent use divides (OECD, 2004), and how the use of ICTs is evolving
with the uptake of broadband.
Access and use of broadband and selected ICTs: Recent developments
Speed of diffusion
The diffusion of ICTs depends on a range of economic, social and human factors, and
often requires skills that are not necessarily needed for other goods and services. For this
reason, home personal computers (PCs) initially diffused slowly, requiring at least a decade
before they were widely adopted (Annex Table 4.A2.1). In contrast, the mobile phone was
adopted very rapidly, as its use is straightforward and requires very few skills in addition to
those needed for fixed telephones. Home Internet access, which relied on the PC installed
base, diffused much more rapidly than PCs but more slowly than mobile telephones
(Sciadas, 2002). Since the beginning of this century, broadband has spread rapidly and is
catching up with the PC installed base. It has generally diffused more rapidly than
narrowband Internet (Table 4.1; OECD, 2008a, 2008b; Annex Table 4.A2.2 and 4.A2.3; see
also the OECD Broadband Portal at www.oecd.org/sti/ict/broadband).
Some countries are clearly ahead in terms of household diffusion. In Korea, more than
nine out of ten households had home broadband access4 at the end of 2005 (MIC-NIDA,
2006); in 2006 the share was above 50% in Canada, the Netherlands, the United Kingdom
and the Nordic countries (Denmark, Finland, Iceland, Norway and Sweden), and near 50%
in Belgium. In France, by mid-2006, more than nine out of ten home Internet connections
were broadband and by mid-2007 the share was 95% (CREDOC, 2007).
The diffusion of high-speed Internet access has thus been very rapid. Early high-speed
Internet users had the usual socio-economic characteristics of early technology adopters
(younger, more educated, richer) but broadband then spread rapidly throughout the
population. In Finland, for instance, two-thirds of home broadband connections in 2003
were in one-person households, but by 2006, differences in households had been
considerably reduced: more than 93% of all Internet connections in one-person households
An
OE
C
L e c tur
aeR
OECD INFORMATION TECHNOLOGY OUTLOOK 2008 – ISBN 978-92-64-05553-7 – © OECD 2008194

4. BROADBAND AND ICT ACCESS AND USE BY HOUSEHOLDS AND INDIVIDUALS
se_it E ditin
es
eu
le
were broadband, but more than 88% also were in total households. In France, diffusion of
broadband among Internet users in 2005 was so common that there were no significant
differences between broadband Internet users and total users (see below).
Recent changes in the diffusion of PCs, the Internet and broadband
Following the readiness, intensity and impact phases of diffusion (OECD, 2000, 2005),
PC readiness and diffusion have been achieved, with measurable impacts. In countries
such as the Netherlands, Denmark and Finland diffusion of PCs to households is near 80%,
after which diffusion slows significantly; in Japan, for example, even below that level, some
households will probably never have a PC (Annex Figure 4.A1.1).
The pace of diffusion of household PCs is similar across OECD countries, with a similar
pattern in Denmark, Finland, the Netherlands, New Zealand and the United Kingdom over
more than a decade (Figure 4.1). However, significant disparities among countries remain.
In France the prior uptake of the Minitel had a dampening effect; only in 2006 did France
reach levels achieved in 1999 by Denmark and the Netherlands, and in 2001 by Australia,
Germany and the United States.
Usage rates are higher than the presence of equipment in homes. In Finland in
spring 2006, for example, the households PC equipment rate was 71%, but eight out of ten
persons had used a computer in the previous three months compared to only three out of
four in spring 2005 (Statistics Finland, 2006a). In 2006 use was nearly 100% among those
aged 15 to 39 and 40% among those aged 60 to 74. Similarly, in 2006 in the EU15 53% of
individuals had a PC at home, but more than 58% on average used a PC in some place at
least once a week, almost every day or every day. In the same year in the United States, the
share of adults using a computer at least occasionally was slightly higher than the share of
individuals equipped with a computer, although in 2002, the share of adults using a
computer was slightly lower than the share equipped (Pew, 2006). Overall household
penetration rates thus underestimate people’s contact with PCs.
Table 4.1. Speed of diffusion of selected ICT goods/services in selected OECD countries
Estimated number of years to move from…
Canada Denmark Finland France Japan Netherlands NorwayUnited
Kingdom
… 20 to 50% of households
TV 2 . . . . . . . . . . . . . .
Colour TV . . . . 7 4 3 4 . . . .
PC 7 6 5 7 5 8 71 7
VCR 3 . . 6 5 5 6 . .
Mobile phone 4 3 2 2 . . . . 3
Mobile phone1 . . . . 3 3 4 2 . .
Internet at home2 3.75 3.5 5.3 5.51 . . 2.5 21 4.2
Broadband at home 4 2.2 2 31 . . 2.2 1.751 . .
… 20 to 40% of householdsInternet at home 2.25 1.7 2.9 41 . . 1.5 1.51 2Broadband at home 2.6 1.6 1.6 21 . . 1.7 1.251 1.6
1 2 http://dx.doi.org/10.1787/4774540818461. Percentage of individuals.2. Including both narrow and broadband.Source: OECD estimates, based on data from the OECD Telecom database, Statistics Canada, Cabinet Office (Japan), StatisticsFinland, Statistics Netherlands, INSEE and CREDOC (France), and the Office of National Statistics (United Kingdom).
An
OE
CD
Bro
wo
L e c tur
ylnO dae
R
OECD INFORMATION TECHNOLOGY OUTLOOK 2008 – ISBN 978-92-64-05553-7 – © OECD 2008 195

4. BROADBAND AND ICT ACCESS AND USE BY HOUSEHOLDS AND INDIVIDUALS
se_it E ditin
es
eu
le
Internet penetration at home
The Internet has spread much more rapidly than PCs. In Denmark and the
Netherlands 80% of households have Internet access and more than half in most other
countries for which data are available (Figure 4.2). The diffusion curve is strikingly similar
Figure 4.1. Households with access to a home computer in selected OECD countries, 1994-2006
Percentage of households
1 2 http://dx.doi.org/10.1787/474837804028
Source: OECD, based on ICT database and national sources. For further details, see Annex Table 4.A2.1.
Figure 4.2. Household access to the Internet in selected OECD countries, 1996-2007In percentage of households
1 2 http://dx.doi.org/10.1787/4748602525261. Households that own equipment that can access the Internet. 2. April-June quarter until 2002. 3. 1997/98 instead of 1998.
Source: OECD, based on data from National Statistical Offices, the US Bureau of the Census, and Statistics Bureau of theMinistry of Internal Affairs and Communications of Japan, Survey of Household Economy. See also Annex Table 4.A2.2.
1994 1995 1996 1997 1998 1999 2000 2001 2002 2003 2004 2005 2006
90
80
70
60
50
40
30
20
10
0
United States Japan United Kingdom Germany
Finland New zealand France
Netherlands Denmark Canada Australia
1996 1997 1998 1999 2000 2001 2002 2003 2004 2005 2006 2007
90
80
70
60
50
40
30
20
10
0
United States
Japan1
United Kingdom2
Germany
Finland
Austria France Belgium3
Netherlands Denmark
Canada Australia
An
OE
CD
Bro
wo
L e c tur
ylnO dae
R
OECD INFORMATION TECHNOLOGY OUTLOOK 2008 – ISBN 978-92-64-05553-7 – © OECD 2008196

4. BROADBAND AND ICT ACCESS AND USE BY HOUSEHOLDS AND INDIVIDUALS
se_it E ditin
es
eu
le
across countries even if diffusion is heterogeneous. Home is where people access the
Internet most, and home use probably mirrors most accurately use of the Internet (Annex
Table 4.A2.4).5
Broadband penetration at home
Household broadband use surged from around 2000 (OECD, 2008b). Price declines and
speed increases have made high-speed household Internet availability and connection
increasingly common even if uptake has differed among OECD countries (Figure 4.3; OECD,
2007a; US Department of Commerce, 2004). Furthermore, broadband availability has
expanded far beyond the OECD area. The number of countries with commercial broadband
available at speeds of 256 kbit/s or more rose from 81 in 2002 to 166 in 2006 and by 2006
most countries had at least some services available over 1 Mbit/s (ITU, 2006; the OECD
Broadband Portal at www.oecd.org/sti/ict/broadband).
Effects of socio-economic characteristics on Internet and broadband access and use
Socio-economic characteristics (educational attainment, income, age, gender, place of
access) have significant impacts on access to and use of PCs and the Internet. The impact
of these characteristics around 2002 was described in detail in OECD (2004, Chapter 4).
Figure 4.3. Households with broadband access in OECD countries, 2003-071
In percentage of households
1 2 http://dx.doi.org/10.1787/4748702037721. Generally, data from the EU Community Survey on household use of ICT, which covers EU countries plus Iceland,
Norway and Turkey, relate to the first quarter of the reference year. For the Czech Republic, data relate to thefourth quarter of the reference year.
2. For 2003, data included broadband access modes such as xDSL, cable and other fixed and wireless broadband viacomputers.
3. Only broadband access via a computer.4. For 2003, data include LAN (wireless or cable).5. Statistics for 2003 and every other year thereafter include the territories (Northwest Territories, Yukon Territory
and Nunavut). For the even years, statistics include the 10 provinces only.6. For 2004, data include wireless access.7. Households with Internet access via cable, ADSL or fixed wireless.8. No 2007 data available, 2006 data used instead, 2006-07 data for Australia.
Source: OECD ICT database; Eurostat Community Survey on ICT usage in households and by individuals; AustralianBureau of Statistics; Japan MIC, Communications Usage Trend Survey; Korean National Information Society Agency.See also Annex Table 4.A2.3.
0
20
40
60
80
2007 2005 2003
Korea
(2) (
8)
Icelan
d
Netherl
ands
Denmark
Japa
n (3) (
8)
Norway
(4)
Sweden
Finlan
d
Luxe
mbourg
(6)
United
Kingdo
m
Belgium
Canad
a (5)
(8)
United
States
German
y
Austri
a
Austra
lia (8
)EU
25
Franc
eSpa
in
New Ze
aland
(8)
Hunga
ry
Irelan
d
Poland
Portug
al
Czech
Rep
ublic
Slovak
Rep
ublic Ita
ly
Greece
Mexico
(7) (
8)
Turke
y
An
OE
CD
Bro
wo
L e c tur
ylnO dae
R
OECD INFORMATION TECHNOLOGY OUTLOOK 2008 – ISBN 978-92-64-05553-7 – © OECD 2008 197

4. BROADBAND AND ICT ACCESS AND USE BY HOUSEHOLDS AND INDIVIDUALS
se_it E ditin
es
eu
le
Differences in access have tended to persist although continuing penetration of PCs and
the Internet has reduced them. However, usage patterns are changing as a result of greater
access to PCs and the Internet and the spread of broadband. The following sections
describe recent developments in access and use in terms of socio-economic characteristics
and usage patterns and look again at the digital access divide.
Education
With rapid uptake of the Internet and the even more rapid switch to broadband, the
impact of socio-economic differences appears to be declining in some countries. In Sweden
for example both PC and Internet diffusion are increasing steadily and the gap between
more and less highly educated groups is diminishing (Figure 4.4). The same is true of
Internet access in Denmark. However, in Canada, Korea and the United States, the gaps
have not closed significantly (Annex Figure 4.A1.2), and in 2007 Internet access by
education level still showed significant gaps in some OECD countries (Figure 4.5).
Figure 4.4. Diffusion of PC and Internet in Sweden by level of education, 1994-2005
Percentage of the population1
1 2 http://dx.doi.org/10.1787/4750070064361. Persons aged 16 to 84.
Source: OECD, based on data from Statistics Sweden (2007).
100
80
60
40
20
35
30
25
20
30
25
20
15
35
15
0
% %
% %
1998 1999 2000 2001 2002 2003 2004 2005
High education All Low education Gap high minus low (right-hand scale)
PC at home
100
80
60
40
20
0
1994 1995 1996 1997 1998 1999 2000 2001 2002 2003
Internet at home
2004 2005
An
OE
CD
Bro
wo
L e c tur
ylnO dae
R
OECD INFORMATION TECHNOLOGY OUTLOOK 2008 – ISBN 978-92-64-05553-7 – © OECD 2008198

4. BROADBAND AND ICT ACCESS AND USE BY HOUSEHOLDS AND INDIVIDUALS
se_it E ditin
es
eu
le
Age: generational differences
Earlier OECD analysis showed that the use of ICTs by older people is positively related
to age of retirement from the workforce and educational attainment (OECD, 2004,
Chapter 4). Once online, their patterns of use were similar to those of younger age groups,
except for lower propensities to purchase and to use the Internet for entertainment. This
suggested that older age groups that worked longer would not suffer a technological use
divide, provided that they had the educational background to take advantage of new
technologies. Recent analysis for Canada indicates that Internet use by tomorrow’s older
Canadians will reflect the higher rate of today’s adults (McKeown et al., 2007).
There are however enduring differences in terms of access speed. Internet users in
older age groups subscribe more often than younger users to narrowband connections. The
available evidence also indicates that different age groups engage in different kinds of
online activities when using broadband. This has also been the case for the Internet.
ICT usage patterns among students, employed persons and pensioners in Finland
show that while PC and Internet use is very widespread among the two first groups, only
one in five pensioners used the Internet (Sirkiä et al., 2004). The reason was not income but
the fact that pensioners felt that the Internet did not provide services that met their
everyday needs and that the services provided did not help resolve problems they found
important. In spite of the overall rise in Internet users, differences in the use of ICTs by
different generations seem to have increased (Figure 4.6).
Figure 4.5. Internet access1 by high, medium and low education level2 in selected OECD countries, 2007
Percentage of individuals
1 2 http://dx.doi.org/10.1787/4750386428121. Individuals having accessed the Internet in the last three months.2. Low = ISCED 0 to 2; medium = ISCED 3 to 4; high = ISCED 5 to 6/7.
Source: OECD, based on data from Eurostat, NewCronos database.
% High Medium Low
10
20
30
40
50
60
70
80
90
Icelan
d
Sweden
Norway
Netherl
ands
Luxe
mbourg
Denmark
Finlan
d
United
Kingdo
m
Portug
al
Belgium
Slovak
Rep
ublic
Spain
Austri
a
Hunga
ry
German
yIta
ly
Czech
Rep
ublic
Poland
Irelan
d
Greece
An
OE
CD
Bro
wo
L e c tur
ylnO dae
R
OECD INFORMATION TECHNOLOGY OUTLOOK 2008 – ISBN 978-92-64-05553-7 – © OECD 2008 199

4. BROADBAND AND ICT ACCESS AND USE BY HOUSEHOLDS AND INDIVIDUALS
se_it E ditin
es
eu
le
GenderICT access continues to differ significantly by gender. Access by females tends to lag
access by males, and while the gaps are narrowing they remain large in older age groups
and for newer technologies. Furthermore, males and females access the Internet from
different places. In many countries males are more likely to access the Internet from both
home and work whereas females are more likely to access it from educational
establishments, although the gaps are narrowing. There are also some significant
differences in Internet use (Figure 4.7). For example, emailing was a very common activity
for six Internet users out of ten, and the gender difference did not exceed 5 percentage
points, whereas males downloaded more software and females were considerably more
likely to engage in health-related activities or online shopping. Males were also more likely
to play games and visit sports pages across all age groups (Annex Figures 4.A1.3,
and 4.A1.4; Montagnier and Van Welsum, 2006).
Figure 4.6. Broadband access and selected Internet activities1 among students and pensioners in Finland, 2002-06
1 2 http://dx.doi.org/10.1787/475061875461
1. Activities undertaken during the past three months on the Internet, whatever the place, except for “Returnedcompleted forms online”, for which no specific period was indicated.
2. Broadband connection at home is from Statistics Finland, Consumer Survey, and refers to the month of Novemberof each year.
Source: Research Project The Finns and the Future Information Society, published by Statistics Finland (2006b).
% %
100
0
30
25
20
15
10
5
0
10
20
30
40
50
60
70
80
90
2002 2003 2004 2005 2006 2002 2003 2004 2005 2006
1
2 3
4
56
7
8
9
10
11, 13
12
14
15
1
2
3
45
6
7
9, 1110, 15
12
13
14
8
5. Used e-banking
4. Looked for informationon products and services
3. Broadband connectionat home2
2. Used Internet at home1. Used Internet somewhere
15. Returned completed forms online
14. Looked for information on publicauthority website
13. Sold something over the Internet
12. Ordered or bought somethingover the Internet
10. Used web radio or TV
9. Used chat/noticeboard
8. Played/downloaded music
7. Looked for informationon travel and accommodation
6. Read online magazines 11. Made Internet phone call
Students Pensioners
An
OE
CD
Bro
wo
L e c tur
ylnO dae
R
OECD INFORMATION TECHNOLOGY OUTLOOK 2008 – ISBN 978-92-64-05553-7 – © OECD 2008200

4. BROADBAND AND ICT ACCESS AND USE BY HOUSEHOLDS AND INDIVIDUALS
se_it E ditin
es
eu
le
Figure 4.7. Gender differences for selected Internet activities in selected OECD countries, 20051
Percentage of individuals2
1 2 http://dx.doi.org/10.1787/475068148566
1. 2006 for the United States for “Seeking health information on injury, disease or nutrition”.2. Aged 16 to 74 or more having used the Internet in the last three months.3. Difference measured as percentages of females minus percentages of males, in percentage points.
Source: OECD, based on data from Eurostat, NewCronos database (2006), Pew (2006).
1009080706050403020100
30
20
10
0
-10
-20
20
10
0
-10
-20
20
10
0
-10
-20
30
-30
30
-30
-30
0
% %
% %
% %
70
60
50
40
30
20
10
Females Males Difference (right hand scale)3
Sending/receiving emails
Downloading software
90
80
70
60
50
40
30
20
10
0
Seeking health information on injury, disease or nutrition
United
States
Austri
a
Finlan
d
Icelan
d
Sweden
Irelan
d
Belgium
Denmark
Portug
al
Netherl
ands
Spain
Hunga
ry
Poland Ita
ly
Norway
Slovak
Rep
ublic
Czech
Rep
ublic
Eston
ia
Luxe
mbourg
United
Kingdo
mGree
ce
Greece
Eston
ia
Czech
Rep
ublic
Irelan
d
Poland
United
States Ita
ly
Slovak
Rep
ublic
Hunga
ry
Portug
al
Austri
a
Sweden
United
Kingdo
m
Norway
Netherl
ands
Denmark
Icelan
d
Luxe
mbourg
Finlan
d
Finlan
d
Icelan
d
Denmark
Portug
al
Norway
Netherl
ands
Poland
Czech
Rep
ublic
Sweden
Belgium
Irelan
d
Austri
a
Slovak
Rep
ublic
United
Kingdo
mIta
lySpa
in
United
States
Greece
Hunga
ry
Luxe
mbourg
An
OE
CD
Bro
wo
L e c tur
ylnO dae
R
OECD INFORMATION TECHNOLOGY OUTLOOK 2008 – ISBN 978-92-64-05553-7 – © OECD 2008 201

4. BROADBAND AND ICT ACCESS AND USE BY HOUSEHOLDS AND INDIVIDUALS
se_it E ditin
es
eu
le
Children in the family
Children have a clear positive impact on PC and Internet diffusion and broadband
access among households (for details on PCs, see OECD, 2004). Broadband enables a far
greater variety of online activities, some of which are undertaken by children. Age of
household members is also a factor, as households with children tend to be younger. As the
diffusion of PCs nears saturation, data from some countries shows that gaps are narrowing
between families with and without children, but in terms of broadband diffusion families
with children clearly lead those without (Figure 4.8).
Place of connection
In OECD countries the Internet is used most often at home. In Europe the Slovak
Republic is the exception, where access is most often from work; work is not very far
behind in other catch-up countries such as the Czech Republic, Greece, Portugal or Spain
(Annex Table 4.A2.4). In all countries except Korea and the Netherlands, males are more
likely to access the Internet from home than females. Overall, work or public places
(cybercafés, etc.) replace home access where this is still limited owing to low network
availability, cost of access, etc. Social norms governing interactions in public places also
influence Internet usage pattern (Orbicom, 2005). In Korea, for example, people use the
Internet at commercial public access facilities despite very high home use rates, although
females do so less than males.
Work also contributes significantly to diffusion and use of ICTs. Among those aged
60 or more in Canada, unemployment has been negatively related to Internet use (Silver,
2001); the diffusion of PCs in Japanese and US households is clearly related to employment
(Figure 4.9); and in Luxembourg Internet use at work significantly influences being
connected at home (Poussing, 2006). In Finland, computer use became widespread in
Figure 4.8. Broadband uptake among households with or without children in Finland, Norway and the United Kingdom, 2003-07
1 2 http://dx.doi.org/10.1787/475175377143
Source: OECD, based on data from Eurostat – NewCronos database.
20062003 2004 2005 2007
90
80
70
60
50
40
30
20
10
0
%
Norway, with children
Norway, without children
Finland, with children
Finland, without children
United Kingdom, with children
United Kingdom, without children
An
OE
CD
Bro
wo
L e c tur
ylnO dae
R
OECD INFORMATION TECHNOLOGY OUTLOOK 2008 – ISBN 978-92-64-05553-7 – © OECD 2008202

4. BROADBAND AND ICT ACCESS AND USE BY HOUSEHOLDS AND INDIVIDUALS
se_it E ditin
es
eu
le
working life in the late 1980s. In 1984, 17% of wage and salary earners used ICT, 44%
in 1990, 66% in 1997, and 75% in 2003 (Statistics Finland, 2006b).
Mobility
Mobile Internet access is increasing, but the propensity to use mobile Internet access
varies greatly by country. Mobile phones are not necessarily the only way to access the
Internet from a mobile device, but they are one indicator of mobile access. In Korea, more
than in many other countries, people often use mobile access to connect to the Internet. In
September 2002, one-third of mobile users (aged 12 or more) had accessed the Internet via
a wireless connection more than once within the previous six months, and by September 2005,
43% had done so; in 2005, 99.6% of mobile access was via a mobile phone in preferences to
devices such as Notebooks, PDAs or smart phones (MIC-NIDA, 2005). In the United
Kingdom, the share of adults accessing the Internet via mobile phones remained constant
at 8% between January 2001 and April 2003, but increased to 17% by October 2005 (Office of
National Statistics of the United Kingdom, 2007). In France, in 2003, only 5% of mobile
phone owners used them to access the Internet, but by mid-2007, this share reached 7%
(CREDOC, 2007).
Accessing the Internet from home through mobile devices is one indicator of “mobility
readiness”. In 2005 in the Nordic countries, the share of all households accessing the
Internet at home via a portable computer varied from 15% in Finland to 37% in Iceland. For
hand-held computers and mobile phones, the shares were highest in Denmark at 4 and
12%, respectively, of all households. Shares were significantly higher in households with
two adults and children (see Table 2.4 in Nordic Council of Ministers, 2005). In many
countries WiFi is increasingly the home broadband service for multiple access points, and
portable computers are often used as a first or second access point in multiple user
families. In June 2007 in France, 17% of the population was broadly defined as mobile
Internet users (connecting in public areas such as libraries, cybercafés, WiFi hotspots, etc.,
Figure 4.9. PC and Internet diffusion and use in the United States and Japan, by employment status
1 2 http://dx.doi.org/10.1787/475224048580
Source: US Department of Commerce (2004) and Economic Planning Agency (Japan).
% %
90
0
80
0
10
20
30
40
50
60
70
10
20
30
40
50
60
7080
1992 1995 1998 2001 2004 2007 Oct. 1997 Dec. 1998 Aug. 2000 Sept. 2001 Oct. 2003
Salaried Employed Not employed
PC diffusion in Japan, 1992-2007 Internet use in United States, 1997-2003
An
OE
CD
Bro
wo
L e c tur
ylnO dae
R
OECD INFORMATION TECHNOLOGY OUTLOOK 2008 – ISBN 978-92-64-05553-7 – © OECD 2008 203

4. BROADBAND AND ICT ACCESS AND USE BY HOUSEHOLDS AND INDIVIDUALS
se_it E ditin
es
eu
le
outside the home and workplace), but only 6% accessed the Internet via a mobile phone,
and 5% via a laptop using WiFi. “Mobility” is relatively more developed in younger groups
(under 39 years old), with high income and educational levels, with four or more persons in
the household, and living in or near Paris (CREDOC, 2007).
Non-work related use at work
Using the computer or accessing the Internet from the workplace for reasons other
than work is common and is likely to have implications for firm efficiency and productivity.
In Canada in 2005, four out of ten Internet users had used the Internet at work for personal
reasons in the last 12 months. Three out of four of those using the Internet while at work
for personal reasons did so at least once a week, and 37% every day (Statistics Canada,
Canadian Internet use survey, 2005). In Luxembourg in 2004 more than two-thirds of
salaried employees used the Internet at work for personal reasons, and more than half
were looking for non-business-related information (Poussing, 2006). Around one in five
collected travel information, read newspapers or magazines or did financial operations;
games, listening to the radio, accessing discussion forums or chatting were less frequent
(Figure 4.10).
The effects of single variables
Socio-economic characteristics influence each other and a single variable will also
reflect the influence of other variables. Using microdata and econometric techniques it is
possible to isolate the effect of a given variable, controlling for the effects of all others. In
France, for example, these analytical techniques show that age and education have the
most significant impact on Internet access (Frydel, 2006). More than nine out of ten home
Internet connections in France are broadband and there are no significant differences
between broadband and Internet access for the same set of socio-economic variables.6
Similar analysis of Internet use by Japanese households shows that age group had the
Figure 4.10. Non-business-related use of the Internet at the workplace in Luxembourg, 2004
1 2 http://dx.doi.org/10.1787/475267772507
Source: Poussing, 2006.
60
50
40
30
20
10
0
%
54.051.8
22.619.6 19.5
12.0 11.5
6.4 5.72.7 0.9
Infor
mation
Trave
l
Finan
ce
Magaz
ine
Health
Commerc
eRad
io
Games
Foru
mCha
t
An
OE
CD
Bro
wo
L e c tur
ylnO dae
R
OECD INFORMATION TECHNOLOGY OUTLOOK 2008 – ISBN 978-92-64-05553-7 – © OECD 2008204

4. BROADBAND AND ICT ACCESS AND USE BY HOUSEHOLDS AND INDIVIDUALS
se_it E ditin
es
eu
le
greatest impact on access, followed by household income, while city size and gender had
smaller impacts (Ministry of Internal Affairs and Communication of Japan, 2006). There is
a negative influence for both the youngest and oldest age categories, and particularly for
the group of those 60 years old or more (i.e. respondents in these age groups were less likely
to use the Internet). Household income shows a clear threshold at around JPY 6 million a
year.
The impact of broadband on Internet activities
Household use and the subsequent impact of ICTs, particularly the Internet, are
influenced by a complex mix of socio-economic factors and relations, which broadband
amplifies or accelerates (OECD, 2008b). These impacts include the frequency and time/
duration of use and its variety and diversity.
Impacts on frequency of use
Broadband increases the frequency of Internet use as well as the share of the online
population conducting various activities. Daily access increased more via broadband than
via narrowband in all 21 European countries surveyed in 2006 and again 2007. Having
broadband clearly increases the frequency of Internet use, and there are shifts to higher
use among users who previously accessed the Internet less frequently (at least once a
week, but not every day, or at least once a month but not every week; Annex Tables 4.A2.6
and 4.A2.7). Access prices have a significant impact on connection and frequency of use,
and broadband access prices are generally declining while average speed is increasing
(OECD, 2008b).
Figure 4.11. Frequency of use of the Internet in Mexico1 and the United Kingdom2
1 2 http://dx.doi.org/10.1787/475280166617
1. For 2001 and 2002, month of December; for 2004 and 2005, month of June; for 2006, month of April andpreliminary results.
2. Great Britain only.
Source: Instituto Nacional de Estadística y Geografía (INEGI); OECD, based on data from the Office of NationalStatistics of the United Kingdom.
%25
0
70
0
5
10
15
10
20
30
40
50
6020
2001 2002 2004 2005 2006 20072004 2005 2006
At least once a week but not every day
Share of daily Internet users Every day or almost every day
At least once a month but not every week
Less than once a month
An
OE
CD
Bro
wo
L e c tur
ylnO dae
R
OECD INFORMATION TECHNOLOGY OUTLOOK 2008 – ISBN 978-92-64-05553-7 – © OECD 2008 205

4. BROADBAND AND ICT ACCESS AND USE BY HOUSEHOLDS AND INDIVIDUALS
se_it E ditin
es
eu
le
In France in 2006 seven out of ten persons with a broadband connection accessed the
Internet daily but only three out of ten with a narrowband connection did so (CREDOC,
2007). In Finland most Internet connections are from home, and, with the diffusion of
broadband, weekly frequency increases more at home than in other places (Statistics
Finland, 2006b). In Mexico, the share of daily Internet users tripled between 2004 and 2006;
although broadband diffusion among households is still relatively low, the share of
Internet users accessing Internet via cable TV rose from 11 to 22% and diffusion of higher
speed connections is undoubtedly amplifying the frequency of use. In the United Kingdom,
frequency of access was relatively constant in 2000-02, with the exception of a decrease in
very low frequency users (less than once a month) and an increase in daily users. From
February 2003 to July 2007 the share of households with access to broadband Internet at
home rose from 10 to 51%, and this amplified the trend towards more frequent use
(Figure 4.11).
Expanding different online activities
Broadband expands the frequency of various online activities. People who have home
access to broadband are much more inclined to undertake various online activities than
those who do not, and the differences are large (Figure 4.12). In 2007 in Iceland 31% more
broadband than narrowband users listen to the radio or watch TV via a PC; in the United
States 12% more send or receive emails; and in the United States and Canada 22% more
play/download games and music. These differences are an important indicator of the
impact of broadband (Figure 4.12, and Annex Tables 4.A2.5 and 4.A2.8).
Impacts of broadband on the development of new Internet activities
Various new activities have grown in parallel with broadband. The growth in new
online activities is evident in all OECD countries (see Figure 4.18 for listening to Web radio/
watching TV; see OECD, 2007b, for the rise in user-created content; and OECD, 2008c, for
developments in film and video; see Chapter 5). Playing or downloading music, games,
images, telephoning or videoconferencing are all developing rapidly in parallel with the
spread of broadband in the United Kingdom for example (Figure 4.13). While broadband
plays a role, so do the development of new services, complements to other services
(e.g. delivery), and ease of use. In a very short time, the Internet has become a major
shopping place; in the United Kingdom for example buying or ordering tickets or goods and
services has progressed rapidly, and selling goods and services has also grown rapidly as
consumers bypass traditional intermediaries.
New activities are not undertaken equally by all users. A recent report shows that in
the United States, the differences are considerable (Horrigan, 2007). The level of education
plays a role through exposure to and use of broadband, wireless and other information
technologies, which often begins in schools, and the level of education is important for the
both intensity and type of online activity. In Sweden, for example, between 2003 and 2006,
the gap between the highest and lowest education attainment level increased significantly
for Internet banking, been stable for reading or downloading online newspapers/news
magazines, and declined significantly for obtaining information from public authorities’
websites or for sending completed forms (Annex Figure 4.A1.5).
An
OE
CD
Bro
wo
L e c tur
ylnO dae
R
OECD INFORMATION TECHNOLOGY OUTLOOK 2008 – ISBN 978-92-64-05553-7 – © OECD 2008206

4. BROADBAND AND ICT ACCESS AND USE BY HOUSEHOLDS AND INDIVIDUALS
se_it E ditin
es
eu
le
Figure 4.12. Impact of broadband on selected Internet activities, selected OECD countries, 20071
Difference between broadband and narrowband users, in percentage points2, 3
1 2 http://dx.doi.org/10.1787/4753151348841. 2005 for Canada.2. Differences, in percentage points, for a specific activity: for European countries, between individuals who live in
a household with a broadband connection and those who live in a household with Internet access but with nobroadband access.
3. Countries for which the difference is greater are selected. For a complete list of countries, see AnnexTables 4.A2.5 to 4.A2.8.
Source: OECD, based on data from National Statistical Offices, the Pew Internet and American Life Project, and theEurostat NewCronos database. See Annex Tables 4.A2.5 to 4.A2.8.
35
30
25
20
15
10
5
0
34.0 31.3
17.7
29.1
12.0
4.5
28.6 28.0
12.1
27.5
22.2 22.0
25.5
19.2
23.8
15.1
8.0
35
30
25
20
15
10
5
0
23.6
6.0
22.3
18.019.7
10.0 9.8
18.2
14.5
17.8
12.9 12.8 12.7
8.0
Greece
Icelan
d
Canad
a
Greece
United
States
Canad
a
Norway
United
Kingdo
m
Canad
a
Sweden
Canad
a
United
States
United
Kingdo
m
Canad
a
Norway
Canad
a
United
States
In the last 3 months, accessed the Internet, on average, every day or almost every day
Listening to web radio/watching TV Sending/receiving e-mails
Downloading softwareFor other communication uses (chat, instant, messenging)
Playing/downloading games and music
Internet banking
Using services related to travel and accommodation
Reading/downloading online newspapers/newsmagazines Purchasing/ordering goods or services
Looking for health information on injury, disease or nutrition Training and education
Voice calls over the Internet, videoconferencing Selling goods and services (e.g. via auctions)
Finding information about goods and servicesSearching for a job or sending a job application
Online course (of any subject)
Denmark
United
States
United
States
United
States
United
Kingdo
m
Icelan
d
Canad
a
Finlan
d
Canad
a
German
y
German
y
Denmark
Norway
Finlan
dAn
OE
CD
Bro
wo
L e c tur
ylnO dae
R
OECD INFORMATION TECHNOLOGY OUTLOOK 2008 – ISBN 978-92-64-05553-7 – © OECD 2008 207

4. BROADBAND AND ICT ACCESS AND USE BY HOUSEHOLDS AND INDIVIDUALS
534277
nt
rvices
cation
ews
lication
eb TV
o
se_it E ditin
es
eu
le
Time use and the InternetBoth the time devoted to communication and the means of communication are
changing, partly spurred by the Internet and broadband.
Time use is increasing
The Finns spend an average of around one hour a day with the PC and Internet. The
time devoted to online activities is increasing for all age categories, driven by broadband
applications and services, but use is considerably higher among the 15 to 39 than among
the 60 to 74 age group, and students use PCs and the Internet more than employees and
retired persons (Statistics Finland, 2006b). For specific online activities, in 2006 the 15 to
39 age group still spent on average over twice as much time using email, chat or the
Internet as the 60 to 74 group, although the differences are lessening (Table 4.2). From 2001
to 2006, the average leisure time spent online from home increased considerably and one-
third of those aged 15 to 74 spend more than five hours a week (Annex Figure 4.A1.6).
Nevertheless, if “net addicts” are defined as those using PCs and the Internet more than
five hours a day at home (i.e. more than five times the average), it was found that less than
2% can be so defined.
In Korea more time is also devoted to ICT use, especially the Internet, not only during
leisure time. Between 2004 and mid-2006 the average time per week spent online increased
Figure 4.13. Internet activities of adults in the United Kingdom, 2000-06
1 2 http://dx.doi.org/10.1787/475332
Source: Office of National Statistics.
1
2
3
4
5
6
7
8
9 10
11
12
13
14
15
16
1710
20
30
40
50
60
70
80
90
0
%
% of increase since the initial point of activity measureme
1 [14%] Finding information about goods or services
2 [3%] Using e-mail
3 [7 ] General browsing
4 [3%] Search for information about travel and accommodation
5 [2 %] Buying or ordering tickets/goods or services
6 [17%] Personal banking and financial se
7 [18%] Playing or downloading music
8 [0%] Finding information relating to edu
9 [5%] Reading or downloading on-line n
10 [7%] Downloading images
11 [6%] Looking for a job/sending job app
12 [16%] Listening to web radio/watching w
13 [5%] Downloading other software
14 [4%] Using chatrooms
15 [13%] Selling goods or services
16 [5%] Playing or downloading games
17 [6%] Telephoning over the Internet/vide conferencing
Oct. 00
Jan.
01
Apr. 01
July
01
Oct. 01
Jan.
02
Apr. 02
July
02
Oct. 02
Jan.
03
Apr. 03
July
03
Oct. 03
Jan.
04
Apr. 04
July
04
Oct. 04
Jan.
05
Apr. 05
July
05
Oct. 05
Jan.
06
An
OE
CD
Bro
wo
L e c tur
ylnO dae
R
OECD INFORMATION TECHNOLOGY OUTLOOK 2008 – ISBN 978-92-64-05553-7 – © OECD 2008208

4. BROADBAND AND ICT ACCESS AND USE BY HOUSEHOLDS AND INDIVIDUALS
se_it E ditin
es
eu
le
from 11.7 to 13.5 hours. But the increases are at the low- and high-user ends of the scale:
low-intensity users (less than two hours) have stagnated or slightly increased, mid-
intensive users (between two and ten hours) have decreased, and intensive or regular users
(more than ten hours) have increased significantly (Figure 4.14).
The diffusion of broadband and the range of available uses have clearly affected the
amount of time spent on the Internet. In Norway, time devoted to the Internet was
multiplied more than threefold between 2000 and 2007 in parallel with the spread of
broadband (Figure 4.15). Trends by age categories are similar for the Internet and PCs, and
Internet access is highest among those with the highest educational attainment (Annex
Figure 4.A1.2). However, longer use does not necessarily imply greater variety of uses
despite the broader range available. In Finland also, the increase in regular use
between 1996 and 2005 came from the rapid diffusion of broadband access and, in
particular, from the replacement of slow connections with broadband connections
(Statistics Finland, 2006c).
Table 4.2. Average time spent using email, chat or Internet, per week, during leisure time, in Finland
Age 2004 2005 2006 Variation 2004-2006 (%)
15-39 3 h 30 mn 5 h 40 mn 6 h 71
40-59 1 h 40 mn 2 h 3 h 10 mn 90
60-74 40 mn 1 h 40 mn 2 h 30 mn 275
All 2 h 30 mn 3 h 50 mn 4 h 30 mn 80
Ratio younger/older 19% 29% 42%
1 2 http://dx.doi.org/10.1787/477466150674Source: Statistics Finland. See also Annex Figure 4.A1.6.
Figure 4.14. Weekly Internet access hours in Korea, 2004-061
Percentage of people
1 2 http://dx.doi.org/10.1787/4753416431241. June 2006.
Source: OECD, based on data from NIDA.
60
% 2004 2006 2004 2006
0
10
20
30
40
50
11.7 13.5
Less than 1 hour 1-2 hours 2-4 hours 4-10 hours 10 hours or more Average (hours)
Number of hours
An
OE
CD
Bro
wo
L e c tur
ylnO dae
R
OECD INFORMATION TECHNOLOGY OUTLOOK 2008 – ISBN 978-92-64-05553-7 – © OECD 2008 209

4. BROADBAND AND ICT ACCESS AND USE BY HOUSEHOLDS AND INDIVIDUALS
se_it E ditin
es
eu
le
Private and work access are blurring
Significant use of the Internet occurs during work hours, when there is little contact
with established media (TV, radio, press, cinema). Peak-time periods for established media,
in particular TV news (morning, midday, evening) are also periods in which there is
relatively less Internet contact (Figure 4.16). However, the line between private life and
working time is blurring, particularly with the development of portable access devices
(e.g. notebooks, mobile phones), which allow working life to impinge to a greater extent on
private life and vice versa. Private tasks were undertaken by 48% of equipped workers
Figure 4.15. Broadband diffusion and time spent on the Internet in Norway, 2000-07
1 2 http://dx.doi.org/10.1787/475380784373
Source: OECD, based on data from Statistics Norway and Eurostat.
Figure 4.16. Media consumption1 by Internet users in France, 2006In millions
1 2 http://dx.doi.org/10.1787/4754025415531. Penetration rate, in million of Internet users aged 13 or more, who had at least a contact with Internet or other
media, during the day: Monday-Sunday, aggregates 2006, 5 a.m. to midnight.2. Traditional media include television, radio, press and cinema.
Source: Media In Life, Médiamétrie, 2007.
70 100
90
80
70
60
50
40
30
20
10
0
60
50
40
30
20
10
0
%
2000 2001 2002 2003 2004 2005 2006 2007
% of households with broadband at home (right scale)
Minutes spent on the Internet by a person on an average day (left scale)
10
9
8
7
6
5
4
3
2
1
0
Video gamesMobile phoneMusicInternetTraditional media2
5 am 6 7 8 9 10 11 noon 1 pm 2 3 4 5 6 7 8 9 10 11 pm
An
OE
CD
Bro
wo
L e c tur
ylnO dae
R
OECD INFORMATION TECHNOLOGY OUTLOOK 2008 – ISBN 978-92-64-05553-7 – © OECD 2008210

4. BROADBAND AND ICT ACCESS AND USE BY HOUSEHOLDS AND INDIVIDUALS
se_it E ditin
es
eu
le
during their working time in France, compared with only 30% of those without a portable
ICT tool. This trend to mix private and business life during working time was most
pronounced for people equipped with a business portable computer (53%). A similar
blurring between private and work-related activities in various time periods within an
average working day has been observed in Luxembourg (Poussing, 2006).
Media consumption patterns are changing
The Internet makes it possible to pursue a large range of different activities online,
sometimes in parallel, and broadband diffusion has increased these possibilities. A large
share of American adult Internet users watch TV, listen to the radio or read magazines or
newspapers online (Figure 4.17), although some of these activities may substitute each
other; for example, the average time devoted daily to computer-related telephone calls,
mail and email remained constant between 2003 and 2005 at around 19 minutes (US
Bureau of Labor Statistics, 2006). Playing games and using computers for leisure activities
decrease with age, except among those aged 55 or more, owing to differences in the use of
time after retirement. Use on weekends is greater for those under 35 years of age, and,
compared to use on week days, increases with the level of income and educational
attainment.
Listening to web radio and watching TV over the Internet have also increased
dramatically (Figure 4.18), particularly among younger age groups. In France the youngest
Internet users have almost double the number of contacts with the Internet and other
media than overall users, with Internet contacts at a maximum in the evening, clearly
linked to the daily education schedule (Médiamétrie, 2007).
Figure 4.17. US adult Internet users who use other media while online, 2006Percentage of total adult Internet users1
1 2 http://dx.doi.org/10.1787/4754180777761. Based on 146.8 million adult Internet users, from BIGResearch’s July 2006 survey.
Source: eMarketer, January 2007.
70
60
50
40
30
20
10
0
%
Watching TV Listening to radio Reading magazines Reading newspapers
An
OE
CD
Bro
wo
L e c tur
ylnO dae
R
OECD INFORMATION TECHNOLOGY OUTLOOK 2008 – ISBN 978-92-64-05553-7 – © OECD 2008 211

4. BROADBAND AND ICT ACCESS AND USE BY HOUSEHOLDS AND INDIVIDUALS
se_it E ditin
es
eu
le
From the digital access divide to the digital use divideThe digital divide and the different rates of ICT uptake by households and individuals
reflect economic and social structures and development, infrastructure deployment, skills,
training and knowledge, and relative income, none of which is necessarily directly linked
to ICTs (Sciadas, 2003). Although some measures of the digital divide may decrease over
time, some will remain, reflecting more enduring socio-economic differences. In Finland
for example, marginalisation due to ICT is not different from other types of marginalisation
(Statistics Finland, 2003). In spite of declining measures of overall dispersion, the gap in
penetration rates between the top and bottom groups has increased in many countries
(Annex Table 4.A2.9).
Adoption of ICT goods as compared to other goods is initially much more clearly
driven by higher income, education or occupation (“early adopters”). In France, in spite of
narrowing differences in penetration for selected ICT goods (mobile phone, PC, the
Internet) differences are much more persistent than for other electronic/electrical goods
(microwave, television, fixed phone, or video tape recorder). PCs diffuse more slowly
among the different groups than either the Internet or mobile phones (see Box 4.1).
A widening usage divide?
Internet activities mirror social activities and people’s interests: who they are, their
tastes, their activities and the social group to which they belong. Although the digital
divide is decreasing and differences in access among various social groups are declining, a
second digital use divide is based on inequalities of use and socio-economic factors. It can
be observed indirectly through the variety of Internet use and the very diverse abilities of
individuals to find information efficiently online (Hargittai, 2002, also available in Pénard
and Suire, 2006). Moreover as broadband use increases in frequency, variety and diversity
among frequent users two other effects are likely to increase the advantages of broadband
Figure 4.18. Internet users listening to Web radio/watching TV, selected OECD countries, 2002-07
Percentage of Internet users aged 16 to 74
1 2 http://dx.doi.org/10.1787/475443274387
Source: OECD; based on data from Eurostat, 2008.
2002 2003 2004 2005 2006 2007
60
50
40
30
20
10
0
%
Luxembourg
Germany
Iceland
Portugal
Ireland
Norway
Finland
Austria
Denmark
United Kingdom
Sweden
An
OE
CD
Bro
wo
L e c tur
ylnO dae
R
OECD INFORMATION TECHNOLOGY OUTLOOK 2008 – ISBN 978-92-64-05553-7 – © OECD 2008212

4. BROADBAND AND ICT ACCESS AND USE BY HOUSEHOLDS AND INDIVIDUALS
se_it E ditin
es
eu
le
use for frequent and diversified users. The costs of undertaking transactions via the
Internet are likely to be lower than off-line costs and to decline further, and there is likely
to be a rapid expansion of diversified and accessible content available. Both of these effects
are likely to increase the importance and impacts of the digital use divide linked with
broadband use (see also OECD 2008b).
Box 4.1. France: The diffusion of ICTs compared to other technologies
Penetration rates for products differ, and for a given diffusion rate, the disparities aregenerally greater for the Internet or the PC than for the mobile phone, suggesting thatsome products are intrinsically more widespread and “democratic” than others. Comparedwith “old” goods, new ICTs have higher but more rapidly decreasing rates of disparity,except for PCs. This is especially true for mobile phones, but the Internet also has rapidly
decreasing rates of disparity.
Diffusion of the PC has been slow and disparities remain. The Internet shows even largerinitial disparities; however the impact of different social factors on disparities (location,occupation, education or income level) was reduced more rapidly, and the pace tends toparallel that of PCs. ICTs thus seem to have a specific diffusion pattern with the level ofdisparities, for a given penetration rate, systematically higher than for other products.Among ICTs, mobile phones and the Internet are diffusing rapidly and the Internet is
second after mobiles among all technologies in diffusion speed.
Source: OECD, based on Bigot (2002, 2006) and CREDOC (2005, 2007); OECD (2004).
Figure 4.19. Evolution of inequalities in possession of selected products in France
Average value1 of the Gini coefficient in percentage
1 2 http://dx.doi.org/10.1787/475572522364
1. Gini coefficient average calculated from values for each category (age, income, diploma, profession, andsize of agglomeration).
Source: OECD, based on Bigot (2002, 2006) and CREDOC (2005, 2007). For a discussion of Gini coefficientssee OECD (2004).
1979 1981 1983 1985 1987 1989 1991 1993 1995 1997 1999 2001 2003 2005 2007
45
5
10
0
15
20
25
30
35
40
%
Fixed phone
PC Mobile phone Internet
Television Video tape recorder Microwave
An
OE
CD
Bro
wo
L e c tur
ylnO dae
R
OECD INFORMATION TECHNOLOGY OUTLOOK 2008 – ISBN 978-92-64-05553-7 – © OECD 2008 213

4. BROADBAND AND ICT ACCESS AND USE BY HOUSEHOLDS AND INDIVIDUALS
se_it E ditin
es
eu
le
Diversity and variety of Internet use
Internet use is highly differentiated by age and to a lesser extent by gender. In Finland
for example young people use the Internet in more varied ways than older people (Sirkiä
et al., 2005). In 2004, six out of ten users in the 15 to 29 age group listed eight uses, against
one out of seven among those 50 to 74 years old. Less than 5% of Internet users aged 15 to
29 used it for only one or two purposes, compared with nearly 20% of those aged 50 or
more. In 2006 these differences remained. Only 2% of the youngest age group used it for
only one or two purposes compared to 10% among those aged 50 or more. More than two-
thirds of the youngest group used the Internet for more than eight different purposes
compared with less than 30% of persons aged 50 or more (Figure 4.20). Males tend to use
the Internet in more ways than females.
Broadband has a significant effect on the variety of uses from home. Broadband
Internet users have much more varied uses than those with slower Internet connections
(Figure 4.21), and the share of multi-users is four times higher among broadband users (for
similar results in the United States, see US Department of Commerce, 2004). One-third of
narrowband users had eight or more different uses, but this share was double among
broadband users. It has also been underlined that residents of urban areas use the Internet
for more purposes than those living in rural areas. Overall it seems that in terms of variety
of use the Internet is not yet abolishing distance (Sirkiä et al., 2005). More than geographical
location, a broader group of socio-economic and social capital factors may explain the
variety of Internet use.
Similar effects are observed in Canada for both age and broadband7 (Figure 4.22).
In 2005, persons aged 18 to 34 clearly used the Internet in a more varied way. More than
45% identified 12 or more different purposes, compared with only one-third of those aged
35 to 44 and even fewer in older age groups. In Canada only among those aged 65 or more
Figure 4.20. Number of purposes of use of the Internet in Finland, 2006Percentage of Internet users by age and gender
1 2 http://dx.doi.org/10.1787/4754524054781. 21 activities are measured. For the list of activities, see Annex Table 4.A2.10.
Source: Statistics Finland, “Suomalaiset tietoyhteiskunnassa 2006” (“Everyday Use of ICT in Finland 2006”), Katsauksia2007/1. See also Annex Table 4.A2.10.
0 20 40 60 80 100
%
1-2 purposes 3-7 purposes 8-11 purposes 12+ purposes
Men 15-29 years
Women 15-29 years
Men 30-49 years
Women 30-49 years
Men 50-74 years
Women 50-74 years
An
OE
CD
Bro
wo
L e c tur
ylnO dae
R
OECD INFORMATION TECHNOLOGY OUTLOOK 2008 – ISBN 978-92-64-05553-7 – © OECD 2008214

4. BROADBAND AND ICT ACCESS AND USE BY HOUSEHOLDS AND INDIVIDUALS
se_it E ditin
es
eu
le
does the majority (56%) use the Internet for fewer than eight purposes. Similarly, more
than four out of ten broadband users use it for more than 12 purposes, compared with
fewer than one out of six narrowband users, and only one out of four broadband users use
Figure 4.21. Broadband effect on variety of home Internet use in Finland, 2004Percentage of the respective category
1 2 http://dx.doi.org/10.1787/475504450564
Source: OECD, based on data from Sirkiä et al., 2005.
Figure 4.22. Number of activities1 participated in by home Internet users during the last 12 months, Canada, 2005
1 2 http://dx.doi.org/10.1787/4755347651111. 21 activities are measured, see Annex Table 4.A2.11.2. Due to low reliability of the estimate for the 0-2 purposes category (the coefficient of variation exceeds 33.3%), this
category has been combined with the category 3-7 purposes for the 18 to 24 age group.3. “High speed” includes all respondents who identified that they access the Internet at home using cable or
satellite, and all respondents accessing the Internet using a telephone connection or other connection (e.g.television, wireless [cellular phone or PDA], other) which they identified as a high-speed connection.
4. “Low speed” includes all respondents accessing the Internet at home through a telephone or other connection(e.g. television, wireless [cellular phone or PDA], other) which they identified as not a high-speed connection.
Source: Statistics Canada, ad hoc tabulation, based on data from the Canadian Internet Use Survey 2005, February 2007.See also Annex Table 4.A2.11.
70
60
50
40
30
20
10
0
% Broadband users Narrowband users
Internet multi-usage With 8 or more different Internet usages
All
Males
Females
Age 18 to 242
Age 25 to 34
Age 35 to 44
Age 45 to 54
Age 55 to 64
Age 65 and up
High speed3
Low speed4
0 50 100%
0-2 purposes 3-7 purposes 8-11 purposes 12+ purposes
An
OE
CD
Bro
wo
L e c tur
ylnO dae
R
OECD INFORMATION TECHNOLOGY OUTLOOK 2008 – ISBN 978-92-64-05553-7 – © OECD 2008 215

4. BROADBAND AND ICT ACCESS AND USE BY HOUSEHOLDS AND INDIVIDUALS
se_it E ditin
es
eu
le
it for fewer than eight purposes compared with more than one out of two narrowband
users. Broadband is clearly a strong spur to increase the variety of Internet use.
In the Netherlands, it has similarly been shown that the frequency of Internet use is
much higher for younger than for older people, and this also holds for the variety of use.
Users with ten Internet activities were 32 years old on average against 49 years old on
average for those with only one (CBS, 2007, and Annex Table 4.A2.12).
France appears to have a distribution somewhat different from other countries. More
than eight out of ten Internet users (those having used Internet during the last month) had
more than 12 different Internet activities. This may be due to the influence of relatively
cheap home broadband penetration on the variety of activities. Compared with Canada,
Finland and the Netherlands, variety of use appears to be high in the youngest Internet
users and then increase with age, although numbers in the older age groups are relatively
small and these users may largely be “early adopters” with socio-economic characteristics
that make them more advanced users (education, income). Broadband clearly multiplies
the variety of uses (Figure 4.23).
Regarding age differences, use by older groups will increase as they are progressively
equipped, particularly as diffusion of ICTs is close to saturation in some countries (e.g.
Denmark, Finland, Korea, the Netherlands). The share of advanced users among retired
people should grow, not only due to a mechanical increase in Internet-using people who
reach retirement age, but also because increasing numbers of routine activities (such as
social contacts, administrative tasks, etc.) take place via the Internet. Social contact and
interaction between older and younger age groups also increasingly take place via the
Internet and this will further spur use by older groups as broadband uptake spreads.
Figure 4.23. Number of activities1 participated in by Internet users during the last month, France, 2005
1 2 http://dx.doi.org/10.1787/4755534315761. 22 activities measured.
Source: INSEE, ad hoc tabulations, based on data from the survey Enquête Technologies de l'information et de lacommunication, October 2005. See also Annex Table 4.A2.13.
0 4020 60 80 100%
1-2 purposes 3-7 purposes 8-11 purposes 12+ purposes
All
Males
Females
Age 15 to 19
Age 20 to 29
Age 30 to 39
Age 40 to 49
Age 50 to 59
Age 60 to 69
Age 70 and up
High speed
Low speed
An
OE
CD
Bro
wo
L e c tur
ylnO dae
R
OECD INFORMATION TECHNOLOGY OUTLOOK 2008 – ISBN 978-92-64-05553-7 – © OECD 2008216
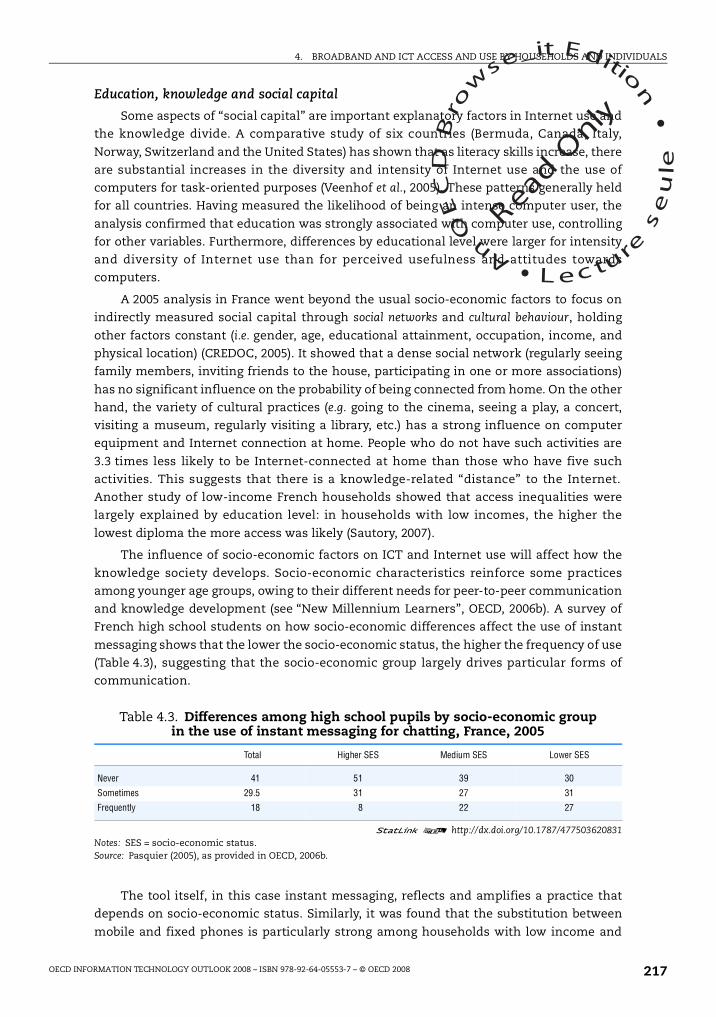
4. BROADBAND AND ICT ACCESS AND USE BY HOUSEHOLDS AND INDIVIDUALS
se_it E ditin
es
eu
le
Education, knowledge and social capital
Some aspects of “social capital” are important explanatory factors in Internet use and
the knowledge divide. A comparative study of six countries (Bermuda, Canada, Italy,
Norway, Switzerland and the United States) has shown that as literacy skills increase, there
are substantial increases in the diversity and intensity of Internet use and the use of
computers for task-oriented purposes (Veenhof et al., 2005). These patterns generally held
for all countries. Having measured the likelihood of being an intense computer user, the
analysis confirmed that education was strongly associated with computer use, controlling
for other variables. Furthermore, differences by educational level were larger for intensity
and diversity of Internet use than for perceived usefulness and attitudes towards
computers.
A 2005 analysis in France went beyond the usual socio-economic factors to focus on
indirectly measured social capital through social networks and cultural behaviour, holding
other factors constant (i.e. gender, age, educational attainment, occupation, income, and
physical location) (CREDOC, 2005). It showed that a dense social network (regularly seeing
family members, inviting friends to the house, participating in one or more associations)
has no significant influence on the probability of being connected from home. On the other
hand, the variety of cultural practices (e.g. going to the cinema, seeing a play, a concert,
visiting a museum, regularly visiting a library, etc.) has a strong influence on computer
equipment and Internet connection at home. People who do not have such activities are
3.3 times less likely to be Internet-connected at home than those who have five such
activities. This suggests that there is a knowledge-related “distance” to the Internet.
Another study of low-income French households showed that access inequalities were
largely explained by education level: in households with low incomes, the higher the
lowest diploma the more access was likely (Sautory, 2007).
The influence of socio-economic factors on ICT and Internet use will affect how the
knowledge society develops. Socio-economic characteristics reinforce some practices
among younger age groups, owing to their different needs for peer-to-peer communication
and knowledge development (see “New Millennium Learners”, OECD, 2006b). A survey of
French high school students on how socio-economic differences affect the use of instant
messaging shows that the lower the socio-economic status, the higher the frequency of use
(Table 4.3), suggesting that the socio-economic group largely drives particular forms of
communication.
The tool itself, in this case instant messaging, reflects and amplifies a practice that
depends on socio-economic status. Similarly, it was found that the substitution between
mobile and fixed phones is particularly strong among households with low income and
Table 4.3. Differences among high school pupils by socio-economic group in the use of instant messaging for chatting, France, 2005
Total Higher SES Medium SES Lower SES
Never 41 51 39 30
Sometimes 29.5 31 27 31
Frequently 18 8 22 27
1 2 http://dx.doi.org/10.1787/477503620831Notes: SES = socio-economic status.Source: Pasquier (2005), as provided in OECD, 2006b.
An
OE
CD
Bro
wo
L e c tur
ylnO dae
R
OECD INFORMATION TECHNOLOGY OUTLOOK 2008 – ISBN 978-92-64-05553-7 – © OECD 2008 217

4. BROADBAND AND ICT ACCESS AND USE BY HOUSEHOLDS AND INDIVIDUALS
se_it E ditin
es
eu
le
education attainment (Sautory, 2007). For this particular use the higher the socio-economic
status the lower the use of the tool. The relationship between socio-economic status and
the intensity and variety of ICT usage, i.e. cultural experience and knowledge acquisition
through the Internet, is thus not necessarily uniform across applications. Differences in
existing patterns of use are magnified but not caused by ICTs.
Moreover, ICT devices and equipment are constantly changing. Until recently, much
ICT and Internet content was text-based (Stewart, 2000, cited in Veenhof et al., 2005).
Broadband is encouraging audio-visual content, but text or words remain crucial. For
example new video search engines can use vocal recognition systems to find video or TV
programmes in which specific words are used. The Web site blinkx.com, allows full-text
search on TV or radio programmes. Such developments will be reflected in new use
patterns by different socio-economic groups, as in the case of instant messaging.
ConclusionHigh-speed broadband is changing people’s use of the Internet. The Internet is part of
everyday life for 1.5 billion people and is driving major changes in people's lives. This
chapter analysed the use of the Internet, showing that socio-economic characteristics have
a direct bearing on how people use the possibilities it offers. It focused on the diffusion and
use of ICTs, particularly the Internet and broadband, among households and individuals.
Personal computers, the Internet and broadband have reached relatively high diffusion
levels across and within OECD countries but differences among countries remain
significant. Selected socio-economic variables were used to track pervasiveness and
variety of use and the impact of broadband on patterns and frequency of use.
With increasing frequency of Internet use there are changes in how time is allocated,
and broadband has a significant effect in this respect. Different rates of PC and Internet
diffusion across different populations have resulted in digital divides (haves versus have-
nots), and a digital use divide is increasingly evident as the simple digital access divide
declines (OECD, 2004, 2006a). This knowledge or second-level use divide persists beyond
connectedness and is increasingly important as broadband access increases. Background
and socio-economic status have a direct bearing on how people use information
technology in general and broadband in particular.
Policy responses to reduce the emerging use divide need to be wider than a simple
focus on ICT-related issues. The increasing digital use divide and the remaining digital
access divide are linked to other social and economic divides as well as to location factors.
Efficient and creative use of ICTs is one of the keys to innovation, organisational change,
growth and employment, and the emerging use divide needs to be taken into account
when devising policies to increase the benefits of broadband and ICTs. Most OECD
countries have programmes to promote IT education and skill formation. All aim at
improving quality and spreading skills more widely, but the approaches for achieving these
common aims are diverse (see Chapter 7). When investing in the future, a key question is:
What kind of education and training should be encouraged to close the digital use divide
and ensure wider benefits for all.
An
OE
CD
Bro
wo
L e c tur
ylnO dae
R
OECD INFORMATION TECHNOLOGY OUTLOOK 2008 – ISBN 978-92-64-05553-7 – © OECD 2008218

4. BROADBAND AND ICT ACCESS AND USE BY HOUSEHOLDS AND INDIVIDUALS
se_it E ditin
es
eu
le
Notes
1. A full set of tables and graphs for this chapter is available in OECD (2008a). Thanks are due to In-Hoe An (National Internet Development Agency, Ministry of Information and Communication,Korea), Régis Bigot (CREDOC, France), John Horrigan (PEW Research Center), Anders Hintze(Statistics Sweden), Martin Mana (Czech Statistical Office), Thomas Le Jeannic, Emmanuelle Andréand Samuel Dambrin (INSEE, France), Lea Parjo (Statistics Finland) and Ben Veenhof (StatisticsCanada) who provided data used in this chapter.
2. Data for end 2007. See ITU, “Global ICT developments” at: www.itu.int/ITU-D/ict/statistics/ict/index.html. Note also that the report estimates 3.3 billion mobile subscribers and 1.3 billion fixedtelephone lines end 2007.
3. The OECD definition of broadband is download speeds equal to or faster than 256 kbit/s. Manybroadband services are considerably higher in most OECD countries. The term “high-speedInternet” is synonymous with broadband. In some surveys users self-identify whether they areusing a high-speed connection.
4. Assuming that xDSL wired access at home is a good proxy for broadband access.
5. There are also considerable differences in take-up of different technologies. Cable modem is apopular access platform for home subscribers in countries where it is widely available and canprovide competitive services, e.g. the United States.
6. INSEE, ad hoc tabulations, based on data from the survey Enquête Technologies de l'information et de lacommunication, October, 2005.
7. For Internet use in Canada in 2005, enduring digital access divides are linked with location factors(e.g. remote and rural locations) and socio-economic factors (e.g. lower income and lower levels ofeducational attainment), see McKeown, et al. (2007). Significant differences in Internet accessbetween rural and urban locations were also found in earlier OECD work, see OECD (2002).
References
Bigot, R. (2002), Le fossé numérique en France, Cahier de Recherche n° 177 du CREDOC, November.
Bigot, R. (2006), La diffusion des technologies de l’information dans la société française 2006, November,www.arcep.fr/uploads/tx_gspublication/etude-credoc2006.pdf.
CBS (2006), The Digital Economy 2005, Central Bureau of Statistics – Statistics Netherlands, Voorburg/Heerlen, www.cbs.nl/NR/rdonlyres/CB06D0DC-8905-48E4-B1D9-A54F790AB215/0/2006p38pub.pdf.
CBS (2007), The Digital Economy 2006, Central Bureau of Statistics – Statistics Netherlands, Voorburg/Heerlen, www.cbs.nl/NR/rdonlyres/243639BE-67DA-43D2-933B-583E3C97631E/0/2006p38pub.pdf.
CREDOC (2005), La dynamique des inégalités en matière de nouvelles technologies, Cahier de Recherche n° 217,November, www.credoc.fr/pdf/Rech/C217.pdf.
CREDOC (2007), La diffusion des technologies de l’information dans la société française 2007, December,www.arcep.fr/uploads/tx_gspublication/etude-credoc-2007.pdf.
Frydel, Y. (2006), Internet au quotidien: un Français sur quatre, INSEE Première n° 1076, May, www.insee.fr/fr/ffc/ipweb/ip1076/ip1076.pdf.
Hargittai, E. (2002), “Second-Level digital divide. Differences in people’s online skills”, First Monday,www.firstmonday.dk/issues/issue7_4/hargittai/.
Horrigan, J. (2007), A Typology of Information and Communication Technology Users, PEW Internet andAmerican Life Project, 7May, www.pewinternet.org/pdfs/PIP_ICT_Typology.pdf.
ITU (International Telecommunication Union) (2006), World Information Society Report 2006, www.itu.int/osg/spu/publications/worldinformationsociety/2006/report.html.
McKeown, L., A. Noce and P. Czerny (2007), “Factors Associated with Internet Use: Does RurailtyMatter?”, Rural and Small Town Canada Analysis Bulletin, Vol. 7, No. 3, September, www.statcan.ca/english/freepub/21-006-XIE/21-006-XIE2007003.pdf.
Médiamétrie, Media in Life (2007), as reported in Le Monde, 28 February 2007, “En 2006, Internet a stimuléla consommation des médias”.
Ministry of Internal Affairs and Communication of Japan (2006), Communication Usage Trend Survey,2005 issue Summary.
An
OE
CD
Bro
wo
L e c tur
ylnO dae
R
OECD INFORMATION TECHNOLOGY OUTLOOK 2008 – ISBN 978-92-64-05553-7 – © OECD 2008 219

4. BROADBAND AND ICT ACCESS AND USE BY HOUSEHOLDS AND INDIVIDUALS
se_it E ditin
es
eu
le
Ministry of Internal Affairs and Communication of Japan (2007), Survey of Household Economy, 2003 to 2006results. Detailed results available at:www.stat.go.jp/English/data/joukyou/2003ni/gaiyou/index.htm (2003).www.stat.go.jp/English/data/joukyou/2004ni/gaiyou/index.htm (2004). www.stat.go.jp/English/data/joukyou/2005ni/gaiyou/index.htm (2005). www.stat.go.jp/English/data/joukyou/2006ni/gaiyou/index.htm (2006).
MIC-NIDA (2005), 2005 Survey on the Wireless Internet Use, Ministry of Information and Communication– National Internet Development Agency of Korea, November.
MIC-NIDA (2006), Survey on the Computer and Internet Usage, Ministry of Information and Communication– National Internet Development Agency of Korea, August.
Montagnier, P. and D. Van Welsum (2006), “ICTs and Gender – Evidence from OECD and Non-OECDCountries”, UNCTAD Expert Meeting, 4-5 December, www.unctad.org/sections/wcmu/docs/c3em29p025_en.pdf.
Nordic Council of Ministers (2005), Nordic Information Society Statistics 2005, Copenhagen,www.norden.org/pub/uddannelse/IT/TN2005562.pdf.
OECD (2000), Information Technology Outlook 2000, OECD, Paris, www.oecd.org/sti/ito.
OECD (2002), OECD Information Technology Outlook 2002, OECD, Paris, www.oecd.org/sti/ito.
OECD (2004), OECD Information Technology Outlook 2004, OECD, Paris, www.oecd.org/sti/ito.
OECD (2005), Guide to Measuring the Information Society, www.oecd.org/dataoecd/41/12/36177203.pdf.
OECD (2006a), OECD Information Technology Outlook 2006, OECD, Paris, www.oecd.org/sti/ito.
OECD (2006b), “New Millennium Learners: Challenging our Views on ICT and Learning”, Backgroundpaper: EDU/CERI/CD/RD(2006)3 (internal working document).
OECD (2007a), OECD Communications Outlook 2007, OECD, Paris, www.oecd.org/sti/telecom/outlook.
OECD (2007b), Participative Web and User-created Content: Web 2.0, Wikis and Social Networking, OECD,Paris.
OECD (2008a), “Broadband and ICT access and use by households and individuals”, OECD, Paris, DSTI/ICCP/IE(2007)4/FINAL, www.oecd.org/sti/information-economy.
OECD (2008b), Broadband Growth and Policies in OECD Countries, OECD, Paris, www.oecd.org/sti/ict/broadband/growth.
OECD (2008c), Remaking the Movies: Digital Content and the Evolution of the Film and Video Industries, OECD,Paris.
Office of National Statistics of the United Kingdom (2006), Family Spending , 2006 Edition,www.statistics.gov.uk/downloads/theme_social/Family_Spending_2005-06/TableA6.xls.
ORBICOM (2005), From the digital divide to digital opportunities, measuring infostates for development,www.orbicom.ca/media/projets/ddi2005/index_ict_opp.pdf.
Pasquier, D. (2005), Cultures lycéennes. La tyrannie de la majorité, Éditions Autrement, Paris.
Pénard, T. and R. Suire (2006), “Le rôle des interactions sociales dans les modèles économiques del’Internet”, Cahier de Recherche MARSOUIN n° 11, November, www.marsouin.org/IMG/pdf/Penard_Suire_11-2006.pdf.
Pew Internet and American Life Project (2006), Online Health Search 2006, October, www.pewInternet.org/pdfs/PIP_Online_Health_2006.pdf.
Poussing, N. (2006), “Les usages d’Internet au travail et à la maison : usages complémentaires ousubstituables ?”, Working Paper CEPS/INSTEAD No. 2006-05, Version 8 November 2006,www.ceps.lu/pdf/4/art1164.pdf.
Sautory, O. (2007), L’accès des ménages à bas revenus aux technologies de l’information et de la communication(TIC), DREES, Études et résultats n° 557, Ministère de la Santé et des Solidarités, February,www.sante.gouv.fr/drees/etude-resultat/er557/er557.pdf.
Sciadas, G. (2002), Unveiling the Digital Divide, Connectedness Series, No 7, Statistics Canada,www.statcan.ca/english/research/56F0004MIE/56F0004MIE2002007.pdf.
Sciadas, G. (ed.) (2003), Monitoring the Digital Divide… and beyond, Orbicom, www.orbicom.uqam.ca/projects/ddi2002/2003_dd_pdf_en.pdf.
Sciadas, G. (2006), Our Lives in Digital Times, Connectedness Series, No. 14, Statistics Canada,www.statcan.ca/english/research/56F0004MIE/56F0004MIE2006014.pdf.
An
OE
CD
Bro
wo
L e c tur
ylnO dae
R
OECD INFORMATION TECHNOLOGY OUTLOOK 2008 – ISBN 978-92-64-05553-7 – © OECD 2008220

4. BROADBAND AND ICT ACCESS AND USE BY HOUSEHOLDS AND INDIVIDUALS
se_it E ditin
es
eu
le
Sirkiä, T., Y. Nurmela and L. Mustonen (2004), “Communication capabilities in Finland in the 2000s”, inStatistics Finland, The Finns and the Future Information Society, Helsinki, June.
Sirkiä, T., V. Muttilainen, P. Kangassalo and J. Nurmela (2005), Finnish people's communication capabilitiesin interactive society of the 2000s, Part 2, Reviewed 2005/2, Statistics Finland (English versionunpublished).
Silver, C. (2001), “Internet use among older Canadians”, Research Paper, Connectedness Series,Statistics Canada, August, www.statcan.ca/english/research/56F0004MIE/56F0004MIE2001004.pdf.
Statistics Finland (2003), A Great Migration to the Information Society, Helsinki.
Statistics Finland (2006a), “Finns as users of information and communications technology. Figureson per cent of respondents who have used a PC during the past three months by gender and agegroup”, Spring 2005 and Spring 2006, For 2005: www.stat.fi/til/sutivi/2005/sutivi_2005_2006-06-12_kuv_004_en.html.For 2006: www.stat.fi/til/sutivi/2006/sutivi_2006_2006-12-11_kuv_004_en.html.
Statistics Finland (2006b), Information Society Statistics 2006.
Statistics Finland (2006c), From Citizen to eCitizen, Results from statistical surveys about Finn’s use of ICTin 1996-2005, Reviews 2006/3.
Stewart, J. (2000), The Digital divide in the UK: A review of quantitative Indicators and Public Policies, Researchfor Social Sciences, University of Edinburgh, Scotland.
US Bureau of Labor Statistics (2006), “American Time Use Survey – 2005 Results announced by BLS”,July 2006, www.bls.gov/news.release/pdf/atus.pdf.
US Department of Commerce (2002), A Nation Online: Internet Use in America, February, www.ntia.doc.gov/ntiahome/dn/anationonline2.pdf.
US Department of Commerce (2004), A Nation Online: Entering the Broadband Age, September,www.ntia.doc.gov/reports/anol/NationOnlineBroadband04.pdf.
Veenhof, B., Y. Clermont and G. Sciadas (2005), Literacy and digital technologies: Linkages and outcomes,Connectedness Series, No. 12, Statistics Canada, www.statcan.ca/english/research/56F0004MIE/56F0004MIE2005012.pdf.
An
OE
CD
Bro
wo
L e c tur
ylnO dae
R
OECD INFORMATION TECHNOLOGY OUTLOOK 2008 – ISBN 978-92-64-05553-7 – © OECD 2008 221

4. BROADBAND AND ICT ACCESS AND USE BY HOUSEHOLDS AND INDIVIDUALS
DB
ro
wse_it E ditio
n
es
eu
le
ylnO d
ANNEX 4.A1
Figure 4.A1.1. Diffusion of PCs among households by income level1 in Japan, 1992-20072
1 2 http://dx.doi.org/10.1787/4756374342041. In millions of current JPY.2. Fiscal year, ending in March.
Source: Cabinet Office, Japan.
100
80
60
40
20
0
%
1999 2000 2001 2002 2003 2004 2005 2006 2007
4-5.5 million
Over 12 million
3-4 million
9.5-12 million
Under 3 million
7.5-9.5 million
Total
5.5-7.5 million
An
OE
C
L e c tur
aeR
OECD INFORMATION TECHNOLOGY OUTLOOK 2008 – ISBN 978-92-64-05553-7 – © OECD 2008222

4. BROADBAND AND ICT ACCESS AND USE BY HOUSEHOLDS AND INDIVIDUALS
se_it E ditin
es
eu
le
Figure 4.A1.2. Internet access or use by educational attainment in selected OECD countries1
1 2 http://dx.doi.org/10.1787/4756650538371. Levels of education, locations and populations (households or individuals) vary among the selected countries.2. Levels of education of household head.
Source: OECD, based on data from national statistical offices, Ministry of Information and Communication–NIDA (Korea), and fromUS Department of Commerce.
90
7060
80
50403020100
90
7060
80
50403020100
100
90
80
70
60
50
40
1997 1998 1999 2000 2001 2002 2003
100
90
80
70
60
50
1997 1998 1999 2000 2001 2002 2003
2003 2004 2005 2006
2001 2002 2003 2004 2005 2006
University degree High school/college Less than high school
Canada2
% of households with Internet at home
Middle school graduates
College or university graduates or higher
Elementary school graduates or lower
High school graduates
Korea% of individuals having used Internet the last month
Upper secondary educationTertiary (university) education
Primary education/lower secondary
Denmark% of the population with Internet at home
High school diploma/GED
Beyond bachelor’s degree
Less than high school
Bachelor’s degree Some college
United States% of persons age 25+ (18+ for 2003) using Internet
An
OE
CD
Bro
wo
L e c tur
ylnO dae
R
OECD INFORMATION TECHNOLOGY OUTLOOK 2008 – ISBN 978-92-64-05553-7 – © OECD 2008 223

4. BROADBAND AND ICT ACCESS AND USE BY HOUSEHOLDS AND INDIVIDUALS
se_it E ditin
es
eu
le
Figure 4.A1.3. Internet usage in Finland, 2001 and 20051
Percentage of individuals aged 15 to 74
1 2 http://dx.doi.org/10.1787/4756673827331. Spring of each year.2. Expressed as Internet usage rate of males minus females.
Source: Statistics Finland (2006b).
9397
80
96
72
88
62
76
40
64
16
32
89 9883
95
72
93
56
86
39
65
7
23
100
90
80
70
60
50
40
30
20
10
0
%
2001 2005
10
5
0
-5
-10
%
2001 2005
Females 15-19 years
Females 60-74 years
Females 20s Females 30s Females 40s Females 50s
Males 15-19 years Males 20s Males 30s Males 40s Males 50s Males 60-74 years
All
and gender differences2
Difference 50s Difference 30s Difference 40s
Difference 60s or older All Difference 20s Difference 15-19 years
An
OE
CD
Bro
wo
L e c tur
ylnO dae
R
OECD INFORMATION TECHNOLOGY OUTLOOK 2008 – ISBN 978-92-64-05553-7 – © OECD 2008224

4. BROADBAND AND ICT ACCESS AND USE BY HOUSEHOLDS AND INDIVIDUALS
se_it E ditin
es
eu
le
Figure 4.A1.4. Internet usage pattern by gender and age in Korea, 2005Percentages of individuals
1 2 http://dx.doi.org/10.1787/4756718745031. Difference measured as percentages of females minus percentages of males, in percentage points.
Source: Montagnier and Van Welsum (2006), based on data from the National Internet Development Agency of Korea,2006. Available at: http://isis.nic.or.kr/english/sub02/sub02_index.html?flag=2.
100
80
60
40
20
0 -10-8-6-4-202468
%
%
%
%
%
%
100
80
60
40
20
0 -10-8-6-4-202468
100
80
60
40
20
0 -10-8-6-4-202468
All (individuals aged 6 and older)
Individuals aged 6 to 19 years
Individuals aged more than 60 years
Males Females
reserv
ation
Shopp
ing/
Home p
age/b
log
Educ
ation
Infor
mation
searc
h
Job s
earch
Intern
et tel
epho
ne
Sell go
ods/s
ervice
Bankin
g
Public
servi
ce
Commun
ity
Enter
tainm
ent
Software
downlo
ad
Difference (right hand scale)
Home p
age/b
log
Shopp
ing/re
serva
tion
Infor
mation
searc
h
Educ
ation
Commun
ityE-
Job s
earch
Intern
et tel
epho
ne
Public
servi
ce
Bankin
g
Sell go
ods/s
ervice
Software
downlo
ad
Enter
tainm
ent
Educ
ation
Shopp
ing/re
serva
tion
Commun
ity
Software
downlo
ad
Infor
mation
searc
h
Sell go
ods/s
ervice
Public
servi
ceE-
Home p
age/b
log
Enter
tainm
ent
Bankin
g
Job s
earch
Intern
et tel
epho
ne
An
OE
CD
Bro
wo
L e c tur
ylnO dae
R
OECD INFORMATION TECHNOLOGY OUTLOOK 2008 – ISBN 978-92-64-05553-7 – © OECD 2008 225

4. BROADBAND AND ICT ACCESS AND USE BY HOUSEHOLDS AND INDIVIDUALS
se_it E ditin
es
eu
le
Figure 4.A1.5. Selected online activities by level of education in Sweden, 2003-07Percentage of people aged 16 to 74
1 2 http://dx.doi.org/10.1787/475710272447
Source: Statistics Sweden.
80
60
40
20
02003 2004 2005 2006 2007
80
60
40
20
02003 2004 2005 2006 2007
80
60
40
20
02003 2004 2005 2006 2007
80
60
40
20
02003 2004 2005 2006 2007
Internet banking
Post-secondary education
Compulsory school only
Upper secondary education
Total
Read or download online newspapers/news magazines
Obtain information from public authorities' websites
Send filled in forms
An
OE
CD
Bro
wo
L e c tur
ylnO dae
R
OECD INFORMATION TECHNOLOGY OUTLOOK 2008 – ISBN 978-92-64-05553-7 – © OECD 2008226

4. BROADBAND AND ICT ACCESS AND USE BY HOUSEHOLDS AND INDIVIDUALS
se_it E ditin
es
eu
le
Figure 4.A1.6. Minutes using the Internet at home in leisure time per week in Finland, 2001-061
1 2 http://dx.doi.org/10.1787/4757268712161. November of each year. All people in November 2001 and people aged 15 to 74 in November 2006.
Source: OECD, based on data from Statistics Finland.
2001 2006
40
35
30
25
20
15
10
5
0
40
35
30
25
20
15
10
5
0
40
35
30
25
20
15
10
5
0
10.0
14.217.1
20.1
11.2
5.1 4.7
17.6
1.2
5.1
13.8
19.9
8.76.1 6.8
38.4
14.3 13.7
25.3
21.5
9.2
4.8 4.37.0
2.75.2
19.6
22.9
9.67.1 7.1
25.8
12.114.0
21.0 20.8
10.3
4.9 4.5
12.5
1.9
5.2
16.5
21.3
9.26.6 7.0
32.4
Males
20 mn 20-30 mn 31-60 mn 1-2 h 2-3 h 3-4 h 4-5 h 5 h and more
20 mn 20-30 mn 31-60 mn 1-2 h 2-3 h 3-4 h 4-5 h 5 h and more
20 mn 20-30 mn 31-60 mn 1-2 h 2-3 h 3-4 h 4-5 h 5 h and more
Females
All
An
OE
CD
Bro
wo
L e c tur
ylnO dae
R
OECD INFORMATION TECHNOLOGY OUTLOOK 2008 – ISBN 978-92-64-05553-7 – © OECD 2008 227

An
OE
CD
Bro
wse_it E ditio
n
L e c tures
eu
le
ylnO dae
R

4. BROADBAND AND ICT ACCESS AND USE BY HOUSEHOLDS AND INDIVIDUALS
DB
ro
wse_it E ditio
n
es
eu
le
ylnO d
ANNEX 4.A2
An
OE
C
L e c tur
aeR
OECD INFORMATION TECHNOLOGY OUTLOOK 2008 – ISBN 978-92-64-05553-7 – © OECD 2008 229

4. BROADBAND AND ICT ACCESS AND USE BY HOUSEHOLDS AND INDIVIDUALS
se_it E ditin
es
eu
le
Tab
le 4
.A2.
1.H
ou
seh
old
s an
d i
nd
ivid
ual
s w
ith
acc
ess
to a
hom
e co
mp
ute
r in
sel
ecte
d O
EC
D c
ou
ntr
ies,
198
6-20
07
1986
1987
1988
1989
1990
1991
1992
1993
1994
1995
1996
1997
1998
1999
2000
2001
2002
2003
2004
2005
2006
2007
Perc
enta
ge o
f hou
seho
lds
Aust
ralia
26.9
33.5
44.0
47.0
53.0
58.0
61.0
66.0
67.0
Aust
ria34
.049
.250
.858
.663
.166
.870
.7
Belg
ium
128
.135
.634
.945
.347
.348
.757
.567
.2
Cana
da2
10.3
16.2
18.5
20.0
23.0
25.0
28.8
31.6
36.4
40.6
50.0
55.2
59.8
64.1
66.6
68.7
72.0
Denm
ark
15.0
27.0
33.0
37.0
45.0
48.0
53.0
60.0
65.0
69.6
72.0
79.0
81.0
84.0
85.0
83.0
Finl
and
8.0
17.0
19.0
23.0
35.0
37.0
43.4
47.0
52.9
54.5
57.4
57.0
64.0
71.1
76
Fran
ce3
7.0
8.2
11.0
14.3
15.0
16.0
19.0
23.0
27.0
32.4
36.6
41.0
45.0
50.4
54.0
Germ
any
39.8
44.9
47.3
53.4
57.2
61.0
65.2
68.7
69.9
76.8
Irela
nd18
.632
.542
.246
.254
.958
.565
.4
Italy
29.4
43.9
46.1
47.8
Japa
n411
.79.
711
.610
.611
.512
.211
.913
.915
.617
.322
.125
.229
.538
.650
.157
.263
.3
Japa
n516
.322
.328
.832
.637
.750
.558
.071
.778
.277
.5
Kore
a671
.076
.978
.677
.977
.878
.979
.6
Mex
ico7
3.1
5.7
10.4
11.6
15.2
18.0
18.4
20.5
Neth
erlan
ds8
11.0
14.0
18.0
22.0
25.0
29.0
31.0
34.0
39.0
43.0
47.0
55.0
59.0
64.0
69.0
Neth
erlan
ds9
76.0
76.0
80.0
83.0
84.0
86.0
New
Zea
land
36.
78.
69.
611
.511
.613
.315
.917
.118
.621
.724
.827
.632
.937
.542
.846
.652
.062
.071
.6
Norw
ay10
68.0
72.0
74.0
75.0
82.0
Portu
gal11
11.0
14.0
21.0
29.4
38.3
41.3
42.5
45.4
Spai
n1130
.447
.152
.154
.656
.9
Swed
en11
, 12
56.7
59.9
69.2
79.7
82.5
Switz
erla
nd13
14.5
51.1
57.7
62.2
65.4
68.9
70.6
76.5
77.4
Turk
ey14
12.3
Unite
d Ki
ngdo
m15
16.0
26.0
33.0
47.0
52.9
57.9
62.0
65.0
Unite
d St
ates
1614
.415
.223
.036
.642
.151
.056
.261
.8
An
OE
CD
Bro
wo
L e c tur
ylnO dae
R
OECD INFORMATION TECHNOLOGY OUTLOOK 2008 – ISBN 978-92-64-05553-7 – © OECD 2008230

4. BROADBAND AND ICT ACCESS AND USE BY HOUSEHOLDS AND INDIVIDUALS
se_it E ditin
es
eu
le
Tabl
e 4.
A2.
1.H
ou
seh
old
s an
d i
nd
ivid
ual
s w
ith
acc
ess
to a
ho
me
com
pu
ter
in s
elec
ted
OEC
D c
oun
trie
s, 1
986-
2007
(co
nt.)
1986
1987
1988
1989
1990
1991
1992
1993
1994
1995
1996
1997
1998
1999
2000
2001
2002
2003
2004
2005
2006
2007
Perc
enta
ge o
f ind
ividu
als17
Aust
ralia
38.0
46.0
53.0
55.3
Italy
39.2
39.9
41.4
Neth
erlan
ds9
60.0
66.0
70.0
74.0
81.0
82.0
85.0
87.0
88.0
Norw
ay13
.033
.039
.043
.050
.057
.067
.071
.075
.076
.077
.079
.083
.0
Swed
en23
.427
.634
.340
.352
.161
.464
.767
.469
.7
Turk
ey18
17.7
1 2
htt
p://
dx.d
oi.o
rg/1
0.17
87/4
7752
2043
137
1.IN
S, D
irec
tion
Gén
éral
e St
atis
tiqu
e et
Info
rmat
ion
Écon
omiq
ue
– En
quêt
e su
r le
s bu
dget
s de
s m
énag
es.
2.U
nti
l19
96, M
ay o
f ea
ch y
ear.
Hou
seh
old
Fac
ilit
ies
and
Eq
uip
men
t Su
rvey
. 199
7an
d o
nw
ard
s, S
urv
ey o
f H
ouse
ho
ld S
pen
din
g.3.
Jun
e of
eac
h y
ear,
exc
ept
Oct
ober
for
2005
.4.
Fisc
al y
ear
end
ing
in M
arch
. Con
sum
er S
urv
ey, E
con
omic
an
d S
oci
al R
esea
rch
In
stit
ute
, Cab
inet
Off
ice.
5.Fi
scal
yea
r en
din
g in
Mar
ch.
Info
rmat
ion
an
d C
om
mu
nic
atio
ns
Poli
cy B
ure
au,
Min
istr
y of
Pu
blic
Man
agem
ent,
Ho
me
Aff
airs
, Po
sts
and
Tel
eco
mm
un
icat
ion
s. C
om
mu
nic
atio
n T
ren
ds
Su
rvey
.6.
From
NID
A. D
ecem
ber
of e
ach
yea
r, e
xcep
t Ju
ne
for
2003
.7.
Dec
embe
r fo
r20
01 a
nd
2002
. Ju
ne
for
2004
an
d20
05. A
pri
l pre
lim
inar
y d
ata
for
2005
an
d20
06.
8.Fr
om C
BS,
Soc
iaal
-eco
nom
ish
pane
lond
erzo
ek (S
EP).
9.C
BS,
PO
LS S
urv
ey u
p t
o20
04. I
CT-
gebr
uik
huis
houd
ens
en p
erso
nen
surv
ey f
or
2005
-06.
10.S
econ
d q
uar
ter
of e
ach
yea
r fr
om20
04 o
nw
ard
s.11
.Fro
m20
02 o
nw
ard
s, E
uro
stat
New
Cro
nos
data
base
.12
.Su
rvey
on
livi
ng
con
dit
ion
s u
nti
l200
1.13
.OFS
, En
qu
ête
sur
les
reve
nu
s et
la c
onso
mm
atio
n.
14.F
or20
00, h
ouse
ho
lds
in u
rban
are
as o
nly
.15
.Mar
ch20
01-A
pri
l200
2 (f
inan
cial
yea
r) in
stea
d o
f20
01. F
or20
04, 2
004/
05an
d20
05, 2
005/
06, E
xpen
dit
ure
an
d F
ood
Su
rvey
, Off
ice
for
Nat
ion
al S
tati
stic
s.16
.Nov
embe
r of
eac
h y
ear,
exc
ept
Au
gust
for
2000
an
d S
epte
mbe
r fo
r20
01.
17.A
ge c
ut-
off:
Au
stra
lia
(18+
), N
eth
erla
nd
s (1
2+),
No
rway
(9
to 7
9), S
wed
en (1
6to
84)
. Nor
weg
ian
med
ia b
arom
eter
for
Nor
way
.18
.Sh
are
of t
he
pop
ula
tion
hav
ing
use
d a
PC
in t
he
last
th
ree
mon
ths.
Sour
ce:
OEC
D, I
CC
P, f
rom
Nat
ion
al S
tati
stic
al O
ffic
es, E
uro
stat
New
Cro
nos
data
base
, or
oth
er n
atio
nal
off
icia
l sta
tist
ical
sou
rces
.
An
OE
CD
Bro
wo
L e c tur
ylnO dae
R
OECD INFORMATION TECHNOLOGY OUTLOOK 2008 – ISBN 978-92-64-05553-7 – © OECD 2008 231

4. BROADBAND AND ICT ACCESS AND USE BY HOUSEHOLDS AND INDIVIDUALS
se_it E ditin
es
eu
le
Table 4.A2.2. Households with access to the Internet1 in selected OECD countries, 1996-2007
1996 1997 1998 1999 2000 2001 2002 2003 2004 2005 2006 2007
Percentage of households
Australia2 4.4 16.0 22.0 32.0 42.0 46.0 53.0 56.0 64.2Austria 19.0 33.5 37.4 44.6 46.7 52.3 59.6Belgium3 4.8 13.5 24.1 29.2 45.5 50.2 54.0 60.4Canada 16.0 22.6 28.7 40.1 48.7 51.4 54.5Denmark 5.0 10.0 22.0 33.0 46.0 55.0 59.0 66.0 71.0 73.0 80.0Finland 12.0 24.7 30.0 36.0 41.0 45.0 50.0 57.0 64.0 68.8France4 6.5 11.9 18.1 23.0 28.0 30.7 36.5 40.9 49.2Germany 54.1 60.0 61.6 67.1 70.7Ireland 5.0 20.5 33.5 38.2 45.1 48.7 57.0Italy 7.7 18.8 34.5 35.6 38.8Japan5 34.0 35.1 48.8 53.6 55.8 57.0 60.5Japan6 3.3 6.4 11.0 19.1 34.0 60.5 81.4Korea7 49.8 63.2 70.2 68.8 72.2 74.8Mexico8 6.2 7.4 8.7 9.0 10.1Netherlands9 63.0 65.0 71.0 78.0 80.0 83.0New Zealand10 37.4 60.5Norway 55.0 60.0 64.0 69.0 78.0Portugal 5.0 9.0 13.0 21.7 26.2 31.5 35.2Sweden11 42.3 48.2 53.3 72.5 77.4Switzerland12 61.0 70.5Turkey13 6.9United Kingdom14 9.0 14.0 27.0 38.0 44.0 48.0 57.0 61.0Great Britain15 46.0 50.0 51.0 55.0 57.0 61.0United States16 26.2 41.5 50.5 54.6
Percentage of individuals with access at home17
Canada18 60.9Netherlands19 16.0 26.0 45.0 56.0 64.0Netherlands 68.0 71.0 76.0 82.0 85.0Norway 13.0 22.0 36.0 52.0 60.0 63.0 64.0 66.0 74.0 79.0Sweden 30.7 46.3 53.3 58.2 63.5 66.4 69.2Switzerland20 51.8 59.4 64.4 68.7 70.6 76.8 79.1
1 2 http://dx.doi.org/10.1787/4775508530831. For Denmark, Ireland, the Netherlands and before 1999 for the United Kingdom, access to the Internet via a home computer; for
the other countries access to the Internet through any device (e.g. computer, phone, TV, etc.). Age cut-offs vary across countries.2. 2004-05 instead of 2005.3. INS, Direction Générale Statistique et Information Économique – Enquête sur les budgets des ménages, until 2004. Eurostat NewCronos
database for 2005 and 2006.4. June of each year, except October for 2005. Before 2005, Internet access from PC. For 2005, Internet access from any device.5. Survey of Household Economy. Device that can access the Internet.6. MPHPT, Communications Usage Trend Survey. End of the calendar year. Ratio of households using the Internet. Access devices
include PCs, mobile phones, PDAs, Internet-capable video game consoles, TVs, etc.7. Internet access at home. From NIDA. December of each year, except June for 2003.8. December for 2001 and 2002. June for 2004 and 2005. April preliminary data for 2005 and 2006.9. CBS, POLS Survey up to 2004. ICT-gebruik huishoudens en personen survey for 2005-06.10. July 2000-June 2001 for 2001. The information is based on households in private occupied dwellings with access to the Internet.
Visitor-only dwellings, such as hotels, are excluded. For 2006, QuickStats National Highlights of the 2006 Census.11. Survey on living conditions. Eurostat NewCronos database for 2005-06.12. OFS, Enquête sur les revenus et la consommation.13. Households in urban areas only.14. April-June quarter.15. National Statistics Omnibus Survey.16. November of each year, except August for 2000.17. Age cut-offs may vary across countries. For instance, 12 to 74 for the Netherlands and 16 to 84 in Sweden; from 14 years in
Switzerland.18. Canadian Internet use survey.19. Autumn of each year. POLS Survey.20. OFS, based on REMP/MA-Net, Net-Metrix-Base.Source: OECD, ICCP, from National Statistical Offices, Eurostat NewCronos database, or other national official statistical sources.
An
OE
CD
Bro
wo
L e c tur
ylnO dae
R
OECD INFORMATION TECHNOLOGY OUTLOOK 2008 – ISBN 978-92-64-05553-7 – © OECD 2008232

4. BROADBAND AND ICT ACCESS AND USE BY HOUSEHOLDS AND INDIVIDUALS
se_it E ditin
es
eu
le
Table 4.A2.3. Households and individuals with broadband access to the Internet from home in selected OECD countries, 2000-07
2000 2001 2002 2003 2004 2005 2006 2007
Households1
Australia2 28.0 38.9
Austria3, 4 10.3 15.9 23.1 33.1 46.1
Austria11 18.0 25.4 33.6 40.7 45.7
Belgium 40.6 48.0 56.4
Canada 20.5 27.2 35.0 43.0 50.0
Denmark 25.1 35.8 51.2 63.3 69.5
Finland 12.4 21.3 36.1 52.9 60.2
France5 27.0
France3 30.3 42.9
Germany 9.3 18.0 23.2 33.5 49.6
Iceland 45.4 63.5 72.1 76.1
Ireland 0.6 2.9 7.4 13.0 31.0
Italy6 11.6 14.4 22.6
Italy3 12.9 16.2 25.3
Japan7 29.6 47.8 62.0 65.0 67.9
Korea 30.3 57.7 68.4 67.0 70.5 74.0 78.1
Netherlands 15.0 22.0 34.0 54.0 66.0 74.0
Norway 22.9 30.0 41.4 57.1 66.7
Poland 8.3 15.6 21.6 29.6
Portugal 7.9 12.3 19.7 24.0 30.4
Sweden 40.2 51.0 66.6
United Kingdom8 40.0 51.0
United Kingdom3 10.7 15.8 31.5 43.9 56.7
Individuals1
Australia2 31.0
Netherlands 17.0 26.0 39.0 59.0 71.0
Switzerland9 39.5 44.8 53.5
United States10 3.0 8.7 13.6 19.0 27.0 36.0 45.0 54.0
1 2 http://dx.doi.org/10.1787/4775586325251. Age cut-offs vary across countries.2. 2004-05.3. Eurostat. Age cut-offs 16 to 74.4. Statistics Austria.5. INSEE.6. ISTAT.7. Only broadband access via a computer.8. National Statistics Omnibus Survey.9. OFS, based on Publica Data-IGEM, KommTech Studie; 15 years old or more.10. PEW Research Center.11. Austrian Regulatory Authority for Broadcasting and Telecommunications; data excludes mobile broadband access;
as opposed to other sources this data includes private and business customers. Source: OECD, compiled from national statistical offices, Eurostat NewCronos database, and PEW Research Center.
An
OE
CD
Bro
wo
L e c tur
ylnO dae
R
OECD INFORMATION TECHNOLOGY OUTLOOK 2008 – ISBN 978-92-64-05553-7 – © OECD 2008 233

4. BROADBAND AND ICT ACCESS AND USE BY HOUSEHOLDS AND INDIVIDUALS
se_it E ditin
es
eu
le
Table 4.A2.4. Places where the Internet has been used1 by females and males,2 2005
At home At work At place of education3 Other people's house
Females Males Females Males Females Males Females Males
Australia 50.0 53.0 28.0 31.0 9.0 8.0 20.0 18.0
Austria 73.6 75.2 41.4 47.7 9.4 8.3 1.9 3.8
Belgium 79.4 83.0 29.7 31.4 9.2 7.5 4.8 5.7
Canada 60.3 61.5 25.2 27.4 11.3 12.0 . . . .
Czech Republic 59.9 62.9 43.2 43.8 23.2 19.7 6.5 7.0
Denmark 92.7 93.3 47.7 48.7 14.9 13.7 . . . .
Finland 74.1 80.8 53.3 50.8 . . . . 5.5 9.1
Germany 86.1 89.0 27.7 34.0 12.9 14.6 6.3 10.0
Greece 60.9 65.9 40.4 46.5 18.9 14.8 10.0 13.1
Hungary 52.8 59.0 43.9 46.5 18.9 19.8 15.5 15.3
Iceland 87.5 91.5 52.3 56.1 19.7 20.0 11.5 15.5
Ireland 66.8 71.1 44.4 47.2 10.9 9.7 6.3 9.2
Italy 68.9 74.1 44.8 49.1 13.5 9.9 9.3 12.1
Korea 98.0 97.5 13.5 32.5 8.9 8.6 7.7 7.2
Luxembourg 92.3 94.5 28.3 45.4 14.9 13.1 3.1 4.9
Netherlands 93.4 93.1 40.1 50.9 10.3 11.0 3.6 3.9
Norway 83.0 85.7 54.0 62.3 17.9 13.3 7.0 11.0
Poland 56.5 59.5 34.2 29.3 28.1 28.7 15.4 18.9
Portugal 58.4 63.2 47.0 49.3 28.6 20.7 13.8 15.5
Slovak Republic 34.0 45.4 56.2 51.8 23.7 20.3 22.1 24.5
Spain 60.7 65.9 44.2 47.2 19.9 17.5 23.3 24.1
Sweden 84.8 88.7 47.7 49.7 16.8 12.5 5.1 7.2
Switzerland4 87.3 86.7 33.9 49.0 7.0 8.5 10.0 11.5
United Kingdom 83.0 83.2 44.9 48.3 17.5 14.1 21.0 26.9
1 2 http://dx.doi.org/10.1787/4775681855271. Used in the last month in Korea, last three months for EU countries, past six months in Switzerland, past
12 months for Australia and Canada.2. Persons aged 16 to 74 for EU countries, age 6 and older for Korea, and 18 and older for Australia and Canada.3. Technical and further education or tertiary institution for Australia, school for Canada and Korea.4. OFS, based on REMP/MA-Net. Source: OECD, based on data from the Australian Bureau of Statistics, Eurostat, Statistics Canada, and the Ministry ofInformation and Communication, National Internet Development Agency of Korea.
An
OE
CD
Bro
wo
L e c tur
ylnO dae
R
OECD INFORMATION TECHNOLOGY OUTLOOK 2008 – ISBN 978-92-64-05553-7 – © OECD 2008234

4. BROADBAND AND ICT ACCESS AND USE BY HOUSEHOLDS AND INDIVIDUALS
se_it E ditin
es
eu
le
Table 4.A2.5. Marginal effect of broadband on selected activities in Canada, 2005
High speed1 Low speed2 Difference3 for Internet users
E-mail 93.0 88.6 4.5
Participating in chat groups or using a messenger 40.8 27.2 13.6
Searching for information on Canadian municipal, provincial or federal government 54.6 45.0 9.6
Communicating with Canadian municipal, provincial or federal government 23.8 19.5 4.3
Searching for medical or health related information 60.6 50.8 9.8
Education, training or school work 46.2 31.8 14.5
Travel information or making travel arrangements 66.7 51.6 15.1
Paying bills 59.4 41.3 18.1
Electronic banking 62.5 43.3 19.2
Researching investments 28.6 18.9 9.6
Playing games 41.5 27.9 13.6
Obtaining or saving music 41.1 18.9 22.2
Obtaining or saving software 34.8 22.6 12.1
Viewing the news or sports 65.8 47.8 18.1
Obtaining weather reports or road conditions 69.9 57.4 12.5
Listening to the radio over the Internet 29.9 12.2 17.7
Downloading or watching television 10.2 2.04 8.1
Downloading or watching a movie 9.8 1.94 7.8
Researching community events 45.6 32.4 13.2
General browsing (surfing) 86.1 78.0 8.1
1 2 http://dx.doi.org/10.1787/4775687242831. “High speed” includes all respondents who identified that they access the Internet at home using cable or satellite,
and all respondents accessing the Internet using a telephone connection or other connection (e.g. television,wireless [cellular phone or PDA], other) which they identified as a high-speed connection.
2. “Low speed” includes all respondents accessing the Internet at home through a telephone or other connection (e.g.television, wireless [cellular phone or PDA], other) which they identified as not a high-speed connection.
3. Difference, in percentage points, between home Internet users with high-speed connections and those with low-speed connections. Internet users at home are individuals who answered they used the Internet from home in thepast 12 months.
4. Use with caution – coefficient of variation between 16.6 and 33.3%.Source: Statistics Canada, Canadian Internet Use Survey 2005.
An
OE
CD
Bro
wo
L e c tur
ylnO dae
R
OECD INFORMATION TECHNOLOGY OUTLOOK 2008 – ISBN 978-92-64-05553-7 – © OECD 2008 235

4. BROADBAND AND ICT ACCESS AND USE BY HOUSEHOLDS AND INDIVIDUALS
se_it E ditin
es
eu
le
Tabl
e 4.
A2.
6.M
argi
nal
eff
ect
of b
road
ban
d1
on s
elec
ted
act
ivit
ies
in E
U c
oun
trie
s, 2
007
Activ
ities
Send
ing/
rece
ivin
gem
ails
Usin
g se
rvic
es
rela
ted
to
trave
land
ac
com
mod
atio
n
Telep
honi
ng o
ver
the
Inte
rnet
, vi
deoc
onfe
renc
ing
Find
ing
info
rmat
ion
abou
tgoo
ds
and
serv
ices
List
enin
g to
web
radi
os/
wat
chin
g TV
Play
ing/
do
wnl
oadi
ng
gam
es a
nd m
usic
Dow
nloa
ding
so
ftwar
e
Read
ing/
do
wnl
oadi
ng
onlin
e ne
wsp
aper
s/
new
smag
azin
es
Seak
ing
heal
th
info
rmat
ion
onin
jury
, dis
ease
or
nutri
tion
Usin
g In
tern
et
tom
ake
phon
e ca
lls
Sellin
g go
ods
and
serv
ices
(e
.g.v
ia a
uctio
ns)
Inte
rnet
ba
nkin
g
Aust
ria4.
15.
68.
75.
83.
38.
910
.612
.88.
010
.4..
5.8
Belg
ium
5.4
9.6
1.4
6.6
7.5
11.9
8.8
10.3
1.8
5.0
6.5
14.2
Czec
h R
epub
lic6.
75.
66.
23.
92.
5–1
.38.
14.
63.
78.
80.
08.
2
Denm
ark
5.7
12.5
9.2
12.8
19.5
14.2
25.3
23.6
13.0
19.8
11.3
16.5
Gree
ce29
.116
.514
.78.
527
.920
.622
.823
.311
.924
.5..
12.9
Spai
n7.
38.
49.
63.
118
.020
.314
.210
.22.
49.
01.
65.
0
Finl
and
7.2
13.4
16.5
8.8
18.1
22.7
18.3
13.8
11.5
14.6
4.8
8.1
Fran
ce14
.616
.617
.29.
415
.619
.412
.68.
46.
327
.712
.714
.3
Hung
ary
3.5
14.2
14.5
8.1
14.7
8.5
19.3
12.6
2.3
14.8
1.7
10.7
Irela
nd2.
815
.17.
59.
213
.912
.19.
18.
38.
810
.02.
916
.8
Icel
and
11.1
19.1
14.8
6.7
31.3
19.2
15.1
–1.0
19.7
25.2
7.3
12.6
Italy
4.5
6.0
7.6
4.1
8.8
9.9
7.8
9.2
5.0
10.1
1.8
6.3
Luxe
mbo
urg
7.6
2.3
13.9
6.9
19.4
15.9
23.1
11.9
9.5
19.3
4.7
22.3
Neth
erlan
ds3.
48.
96.
09.
824
.018
.514
.014
.912
.58.
56.
015
.0
Norw
ay15
.723
.810
.99.
424
.226
.121
.012
.916
.120
.58.
311
.3
Pola
nd6.
75.
65.
35.
98.
06.
07.
011
.67.
08.
13.
610
.1
Portu
gal
11.6
15.9
11.2
9.9
10.7
8.2
12.7
19.7
13.3
12.0
..18
.8
Swed
en14
.613
.69.
47.
725
.127
.516
.618
.29.
711
.010
.119
.5
Slov
ak R
epub
lic4.
74.
714
.84.
214
.212
.79.
711
.82.
519
.02.
212
.3
Unite
d Ki
ngdo
m8.
67.
513
.75.
329
.619
.728
.011
.77.
514
.28.
125
.5
1 2
htt
p://
dx.d
oi.o
rg/1
0.17
87/4
7762
5026
330
1.D
iffe
ren
ces,
in p
erce
nta
ges,
am
ong
ind
ivid
ual
s w
ho
hav
e u
sed
th
e In
tern
et in
th
e la
st t
hre
e m
onth
s, fo
r th
e sp
ecif
ic a
ctiv
ity,
bet
wee
n in
div
idu
als
wh
o liv
e in
a h
ouse
hol
d w
ith
bro
adba
nd
acc
ess
and
th
ose
wh
o liv
e in
a h
ouse
hol
d w
ith
Inte
rnet
acc
ess
but
no
broa
dba
nd
acc
ess.
Sour
ce:
OEC
D, b
ased
on
dat
a fr
om E
uro
stat
, New
Cro
nos
data
base
.
An
OE
CD
Bro
wo
L e c tur
ylnO dae
R
OECD INFORMATION TECHNOLOGY OUTLOOK 2008 – ISBN 978-92-64-05553-7 – © OECD 2008236

4. BROADBAND AND ICT ACCESS AND USE BY HOUSEHOLDS AND INDIVIDUALS
se_it E ditin
es
eu
le
Tabl
e 4.
A2.
6.M
argi
nal
eff
ect
of b
road
ban
d1
on s
elec
ted
act
ivit
ies
in E
U c
oun
trie
s, 2
007
(con
t.)
Activ
ities
In th
e las
t 3m
onth
s,
Iacc
esse
d th
e In
tern
et, o
n av
erag
e,
ever
y da
y or
alm
ost
ever
y da
y
In th
e la
st 3
mon
ths,
Ia
cces
sed
the
Inte
rnet
, on
aver
age,
at
leas
t onc
e a
wee
k (b
ut n
ot e
very
day
)
In th
e la
st 3
mon
ths,
Ia
cces
sed
the
Inte
rnet
, on
aver
age,
at
leas
t onc
e a
mon
th
(but
not
eve
ry w
eek)
Yes,
I ha
ve a
lread
y us
ed th
eIn
tern
et
in th
e la
st 3
mon
ths,
to s
end
a fil
led-
out
form
In th
e la
st 3
mon
ths,
Ih
ave
rece
ived
un
solic
ited
e-m
ail
that
I wou
ld re
gard
as
junk
or
spa
m2
I hav
e us
ed In
tern
et,
inth
e la
st 3
mon
ths,
to lo
ok fo
r a jo
b or
send
a jo
b ap
plica
tion
I hav
e us
ed In
tern
et,
inth
e las
t 3m
onth
s,
for t
rain
ing
and
educ
atio
n
I hav
e us
ed In
tern
et,
inth
e la
st 3
mon
ths,
fo
r doi
ng a
n on
line
cour
se
(on
any
subj
ect)
I hav
e us
ed In
tern
et,
inth
e la
st 3
mon
ths,
fo
r oth
er
com
mun
icat
ion
uses
(c
hat s
ites,
m
esse
nger
, etc
.)
for o
rder
ing/
buyin
g go
ods
or s
ervi
ces,
ov
er th
e In
tern
et,
forp
rivat
e us
e,
inth
ela
st 3
mon
ths
Aust
ria9.
7–7
.1–2
.32.
85.
64.
00.
9..
4.9
6.0
Belg
ium
15.3
–12.
0–3
.64.
34.
6–1
.83.
2–1
.29.
210
.9
Czec
h R
epub
lic12
.5–6
.6–5
.82.
1..
3.0
–1.6
–0.1
11.7
11.7
Denm
ark
18.5
–9.7
–7.6
11.8
15.3
3.1
17.1
3.0
13.9
16.2
Gree
ce34
.0–2
2.3
–9.0
12.1
23.7
2.1
6.5
3.5
10.8
19.0
Spai
n19
.0–8
.8–7
.5–0
.94.
04.
64.
01.
410
.86.
8
Finl
and
25.0
–15.
6–6
.02.
915
.49.
118
.28.
012
.68.
2
Fran
ce22
.7–1
4.0
–7.0
10.6
6.0
–0.8
12.0
3.5
23.7
12.8
Hung
ary
18.7
–14.
3–3
.37.
113
.82.
26.
03.
110
.07.
2
Irela
nd24
.0–1
6.7
–7.0
3.5
9.3
6.3
6.9
0.5
9.6
14.0
Icel
and
18.5
–17.
6–0
.9–1
.36.
67.
417
.62.
921
.714
.8
Italy
5.9
–1.6
–3.0
1.0
6.4
1.0
5.2
0.4
6.1
3.4
Luxe
mbo
urg
26.5
–17.
0–5
.511
.33.
2–3
.83.
7–0
.69.
613
.2
Neth
erlan
ds15
.3–1
2.4
–2.3
12.9
13.0
5.5
9.7
0.9
26.2
17.3
Norw
ay30
.7–2
0.8
–8.5
4.3
15.7
12.7
16.1
2.1
28.6
22.1
Pola
nd13
.5–9
.6–3
.22.
16.
31.
43.
1..
2.6
6.5
Portu
gal
28.9
–12.
8–1
2.3
9.7
22.5
2.1
11.0
3.1
8.1
18.8
Swed
en29
.7–2
3.2
–5.9
13.0
11.7
8.2
13.1
–1.2
21.2
18.4
Slov
ak R
epub
lic15
.1–1
0.1
–3.5
–2.9
12.8
2.0
–1.2
0.5
14.5
6.3
Unite
d Ki
ngdo
m26
.0–1
4.7
–9.1
9.7
12.5
7.4
12.1
7.2
15.9
22.3
1 2
htt
p://
dx.d
oi.o
rg/1
0.17
87/4
7762
5026
330
1.D
iffe
ren
ces,
in p
erce
nta
ges,
am
ong
indi
vid
ual
s w
ho
hav
e u
sed
th
e In
tern
et in
th
e la
st t
hre
e m
onth
s, fo
r th
e sp
ecif
ic a
ctiv
ity,
bet
wee
n in
divi
du
als
wh
o liv
e in
a h
ouse
hol
d w
ith
bro
adba
nd
acc
ess
and
th
ose
wh
o liv
e in
a h
ouse
hol
d w
ith
Inte
rnet
acc
ess
but
no
broa
dba
nd
acc
ess.
Sour
ce:
OEC
D, b
ased
on
dat
a fr
om E
uro
stat
, New
Cro
nos
data
base
.
An
OE
CD
Bro
wo
L e c tur
ylnO dae
R
OECD INFORMATION TECHNOLOGY OUTLOOK 2008 – ISBN 978-92-64-05553-7 – © OECD 2008 237

4. BROADBAND AND ICT ACCESS AND USE BY HOUSEHOLDS AND INDIVIDUALS
se_it E ditin
es
eu
le
Tabl
e 4.
A2.
7.S
elec
ted
In
tern
et b
road
ban
d a
ctiv
itie
s1 in
EU
cou
ntr
ies,
200
7
Activ
ities
Send
ing/
rece
iving
emai
ls
Usi
ng s
ervi
ces
rela
ted
totra
vela
nd
acco
mm
odat
ion
Tele
phon
ing
over
the
Inte
rnet
, vi
deoc
onfe
renc
ing
Find
ing
info
rmat
ion
abou
t go
ods
and
serv
ices
List
enin
g to
w
eb ra
dios
/w
atch
ing
TV
Play
ing/
do
wnl
oadi
ng
gam
es a
nd m
usic
Dow
nloa
ding
so
ftwar
e
Read
ing/
do
wnl
oadi
ng
onlin
e ne
wsp
aper
s/
new
smag
azin
es
Seak
ing
heal
th
info
rmat
ion
on
inju
ry, d
isea
se
ornu
tritio
n
Usin
g In
tern
et
tom
ake
phon
e ca
lls
Sellin
g go
ods
and
serv
ices
(e
.g. v
ia a
uctio
ns)
Inte
rnet
ba
nkin
g
Aust
ria86
.445
.621
.674
.912
.028
.229
.840
.345
.124
.5..
49.7
Belg
ium
92.5
54.0
16.6
84.2
21.2
36.6
24.1
26.8
39.1
16.5
13.1
56.2
Czec
h R
epub
lic90
.256
.939
.781
.821
.444
.124
.849
.625
.238
.2..
30.0
Denm
ark
92.4
65.2
14.9
85.6
45.0
42.9
47.5
60.7
48.9
31.1
29.3
74.0
Gree
ce88
.765
.219
.392
.544
.561
.245
.068
.333
.131
.6..
22.1
Spai
n86
.969
.918
.783
.737
.754
.847
.050
.845
.615
.87.
037
.1
Finl
and
92.8
75.2
25.8
88.9
34.2
47.4
43.1
66.1
62.3
29.8
18.0
86.4
Fran
ce86
.555
.817
.291
.431
.738
.726
.831
.250
.844
.212
.760
.8
Hung
ary
96.1
54.3
31.2
87.2
38.3
56.3
41.0
61.2
49.2
32.1
8.5
27.9
Irela
nd86
.878
.116
.183
.424
.028
.722
.921
.527
.916
.28.
052
.6
Icel
and
90.5
69.0
25.8
87.5
56.5
41.9
33.9
75.3
50.9
37.9
13.8
82.5
Italy
85.6
51.7
18.6
72.7
25.6
42.0
35.5
51.2
45.1
26.3
10.7
35.2
Luxe
mbo
urg
94.9
73.4
33.5
89.5
42.1
46.8
53.7
57.3
64.2
36.1
16.8
65.1
Neth
erlan
ds95
.758
.425
.391
.944
.855
.836
.449
.255
.729
.525
.079
.9
Norw
ay91
.268
.216
.390
.147
.244
.244
.080
.845
.827
.310
.786
.5
Pola
nd80
.330
.728
.367
.835
.142
.933
.040
.233
.830
.813
.436
.1
Portu
gal
88.5
40.2
25.7
86.2
41.3
57.3
27.9
44.7
50.1
22.1
..37
.2
Swed
en90
.254
.712
.689
.746
.150
.033
.358
.034
.215
.918
.176
.0
Slov
ak R
epub
lic93
.551
.533
.775
.729
.352
.727
.652
.633
.637
.05.
736
.2
Unite
d Ki
ngdo
m89
.667
.313
.789
.329
.638
.728
.033
.729
.714
.219
.951
.8
1 2
htt
p://
dx.d
oi.o
rg/1
0.17
87/4
7763
8462
037
1.Pe
rcen
tage
s of
ind
ivid
ual
s w
ho
hav
e u
sed
the
Inte
rnet
in t
he
last
th
ree
mon
ths
and
un
der
take
n t
he
sele
cted
act
ivit
ies,
an
d w
ho
live
in a
hou
seh
old
wit
h b
road
ban
d a
cces
s.So
urce
:O
ECD
, bas
ed o
n d
ata
from
Eu
rost
at, N
ewC
rono
s da
taba
se.
An
OE
CD
Bro
wo
L e c tur
ylnO dae
R
OECD INFORMATION TECHNOLOGY OUTLOOK 2008 – ISBN 978-92-64-05553-7 – © OECD 2008238

4. BROADBAND AND ICT ACCESS AND USE BY HOUSEHOLDS AND INDIVIDUALS
se_it E ditin
es
eu
le
Tabl
e 4.
A2.
7.S
elec
ted
Inte
rnet
bro
adba
nd
act
ivit
ies1
in E
U c
oun
trie
s, 2
007
(con
t.)
Activ
ities
In th
e las
t 3m
onth
s,
Iacc
esse
d th
e In
tern
et, o
n av
erag
e,
ever
y da
y or
alm
ost
ever
y da
y
In th
e la
st 3
mon
ths,
Ia
cces
sed
the
Inte
rnet
, on
aver
age,
at
leas
t onc
e a
wee
k (b
ut n
ot e
very
day
)
In th
e la
st 3
mon
ths,
Ia
cces
sed
the
Inte
rnet
, on
aver
age,
at
leas
t onc
e a
mon
th
(but
not
eve
ry w
eek)
Yes,
I ha
ve a
lread
y us
ed th
eIn
tern
et
in th
e las
t 3m
onth
s, to
se
nd a
fille
d-ou
t for
m
In th
e la
st 3
mon
ths,
Ih
ave
rece
ived
un
solic
ited
e-m
ail
that
I wou
ld re
gard
as
junk
or
spa
m2
I hav
e us
ed In
tern
et,
inth
e las
t 3m
onth
s, to
lo
ok fo
r a jo
b or
send
a jo
b ap
plica
tion
I hav
e us
ed In
tern
et,
inth
e la
st 3
mon
ths,
fo
r tra
inin
g an
ded
ucat
ion
I hav
e us
ed In
tern
et,
inth
e las
t 3m
onth
s,
for d
oing
an
onlin
e co
urse
(o
n an
y su
bjec
t)
I hav
e us
ed In
tern
et,
inth
e la
st 3
mon
ths,
fo
r oth
er
com
mun
icat
ion
uses
(c
hat s
ites,
m
esse
nger
, etc
.)
For o
rder
ing/
buyi
ng
good
s or
ser
vice
s,
over
the
Inte
rnet
, fo
rpriv
ate
use,
in
the
last 3
mon
ths
Aust
ria72
.121
.84.
621
.663
.513
.333
.7..
23.2
43.5
Belg
ium
77.2
19.5
2.6
13.1
63.6
11.3
34.8
3.1
36.0
23.5
Czec
h R
epub
lic60
.131
.08.
38.
5..
17.6
30.9
2.2
54.4
6.4
Denm
ark
85.4
11.2
2.8
41.9
57.0
32.0
80.5
5.0
44.1
55.4
Gree
ce84
.811
.43.
122
.469
.717
.046
.89.
727
.330
.1
Spai
n67
.124
.66.
617
.768
.820
.055
.910
.157
.829
.8
Finl
and
83.2
14.1
2.4
22.7
58.6
34.8
57.9
18.0
31.7
43.7
Fran
ce72
.021
.84.
532
.956
.919
.977
.73.
534
.945
.6
Hung
ary
85.5
13.4
1.0
31.1
62.5
26.3
50.4
5.6
57.8
17.4
Irela
nd69
.424
.15.
237
.470
.413
.352
.54.
718
.953
.5
Icel
and
85.1
11.4
2.4
21.4
76.7
17.9
55.1
10.3
57.1
38.0
Italy
86.6
4.2
6.5
12.3
53.7
19.7
59.9
4.8
36.1
20.0
Luxe
mbo
urg
79.6
15.9
3.9
30.2
64.8
17.1
62.5
3.9
47.6
51.2
Neth
erlan
ds81
.016
.32.
340
.770
.022
.739
.64.
234
.353
.2
Norw
ay81
.814
.32.
832
.367
.627
.365
.44.
650
.859
.6
Pola
nd73
.620
.25.
49.
768
.617
.452
.1..
63.1
30.3
Portu
gal
77.6
15.8
4.7
36.4
59.9
16.8
74.0
3.1
71.1
18.8
Swed
en79
.017
.23.
033
.560
.024
.344
.23.
138
.952
.3
Slov
ak R
epub
lic72
.423
.73.
813
.563
.321
.114
.41.
060
.323
.3
Unite
d Ki
ngdo
m74
.120
.73.
827
.572
.422
.551
.77.
231
.568
.7
1 2
htt
p://
dx.d
oi.o
rg/1
0.17
87/4
7763
8462
037
1.Pe
rcen
tage
s of
ind
ivid
ual
s w
ho
hav
e u
sed
the
Inte
rnet
in t
he
last
th
ree
mon
ths
and
un
der
take
n t
he
sele
cted
act
ivit
ies,
an
d w
ho
live
in a
hou
seh
old
wit
h b
road
ban
d a
cces
s.So
urce
:O
ECD
, bas
ed o
n d
ata
from
Eu
rost
at, N
ewC
rono
s da
taba
se.
An
OE
CD
Bro
wo
L e c tur
ylnO dae
R
OECD INFORMATION TECHNOLOGY OUTLOOK 2008 – ISBN 978-92-64-05553-7 – © OECD 2008 239

4. BROADBAND AND ICT ACCESS AND USE BY HOUSEHOLDS AND INDIVIDUALS
se_it E ditin
es
eu
le
Table 4.A2.8. Marginal effect of broadband on selected Internet activities in the United States, 20071
Difference2 for Internet users
Who have ever done the corresponding
activity
Who have yesterday done the corresponding
activity
1. Go online for no particular reason, just for fun or to pass the time 12 14
2. Send instant messages to someone who is online at the same time 8 10
3. Download a podcast so you can listen to it or view it at a later time 3 1
4. Visit a local, state, or federal government website 6 8
5. Get sports scores and information 18 15
6. Participate in an online discussion, a listserv or other online group or forum 7 3
7. Use an online search engine to help you find information on the web 10 30
8. Rate a product, service, or person using an online rating system 8 2
9. Buy or make a reservation online for a travel service, such as airline tickets, hotel room, or rent-a-car 21 4
10. Get financial information online such as stock quotes or mortgage interest rates 8 5
11. Download music files to your computer so you can play them at any time you want 22 7
12. Pay to access or download digital content online, such as music, video, or newspaper articles 15 3
13. Download video files to your computer so you can play them at any time you want 12 4
14. Send or read e-mail 6 24
15. Get news online 18 21
16. Buy a product online such as books, music, toys, or clothing 17 4
17. Looked for health information online 8 7
18. Log onto the Internet using a wireless device 21
19. Post comments to an online news group or website 12
20. Create or work on your own online journal or blog 8
21. Take material you find online – like songs, text, or images – and remix it into your own artistic creation 7
22. Create or work on your own webpage 11
23. Create or work on webpages or blogs for others including friends, group you belong to, or work 6
24. Share something online that you created yourself, such as your own artwork, photos, stories or videos 8
25. Create or use an avatar or online graphic representation of yourself, for example, in a virtual world such as Second Life 5
26. Done at least one of the content activities (items 20 to 25) 23
1 2 http://dx.doi.org/10.1787/4776652857861. Survey of April 2006 for items 1 to 7, December 2006 for items 8 to 11, August 2006 for items 12 to 18, and
December 2005 for the others.2. Difference, in percentage points, between home broadband Internet users and home dial-up users. Source: Pew Internet and American Life Project.
An
OE
CD
Bro
wo
L e c tur
ylnO dae
R
OECD INFORMATION TECHNOLOGY OUTLOOK 2008 – ISBN 978-92-64-05553-7 – © OECD 2008240

4. BROADBAND AND ICT ACCESS AND USE BY HOUSEHOLDS AND INDIVIDUALS
se_it E ditin
es
eu
le
Table 4.A2.9. PC and Internet penetration rates, differences between top and bottom income bands1
1994 1996 1997 1998 1999 2000 2001 2002 2003 2004 2005 2006
Quartiles
Canada
Internet . . . . 27 38 43 49 53 53 55 . . . . . .
Finland
Internet . . . . 20 33 41 52 54 49 60 59 47 53
France
PC . . 18 20 22 28 28 33 32 35 . . 34 . .
Internet . . . . . . . . 11 20 27 29 35 . . 37 . .
Sweden
PC 22 23 25 30 23 18 15 13 15 12 . . . .
Internet . . . . . . 29 28 25 21 18 19 17 . . . .
Quintiles
Australia2
PC 45
Internet 50
United Kingdom
Internet . . . . . . 24 40 61 62 66 68 69 . . . .
Deciles
Canada3
PC 32 48 . . . . . . 65 . . . . . . . . . . . .
Internet . . 18 41 47 55 63 . . . . . . . . . . . .
Netherlands
PC . . . . . . 29 38 38 50 . . . . . . . . . .
Internet . . . . . . 24 37 41 59 . . . . . . . . . .
Sweden
PC 30 33 42 35 26 23 18 15 17 12 . . . .
Internet . . . . . . 37 34 32 25 23 25 18 . . . .
United Kingdom4
Internet . . . . . . 29 42 66 70 73 75 71 76 . .
1 2 http://dx.doi.org/10.1787/4776882223651. Difference in the penetration rates between high- and low-income quartiles, quintiles or deciles.2. 2004-05 instead of 2005.3. 1990 instead of 1994.4. 1998/99 instead of 1998, and similarly for other years.Source: OECD, based on data from national statistical offices.
An
OE
CD
Bro
wo
L e c tur
ylnO dae
R
OECD INFORMATION TECHNOLOGY OUTLOOK 2008 – ISBN 978-92-64-05553-7 – © OECD 2008 241

4. BROADBAND AND ICT ACCESS AND USE BY HOUSEHOLDS AND INDIVIDUALS
se_it E ditin
es
eu
le
Table 4.A2.10. Purposes of use of the Internet in Finland, spring 2004 and spring 2007
Percentage of Internet users 2004 2007
Sending/receiving e-mail 88 90
Finding information about goods or services 84 86
Internet banking 71 84
Using services related to travel and accommodation 60 71
Reading or downloading online papers/news magazines 52 63
Seeking health-related information . . 59
Obtaining information from public authorities websites 62 54
Looking for information about education, training or course offers . . 45
Listening to the music on the net or downloading it onto the computer or other device 30 41
Formalised educational activities at school, university or other educational institution 29 38
Purchasing/ ordering goods or services (excl. shares/financial services) 37 . .
Other financial and insurance services (e.g. buying of shares or securities) 16 . .
Downloading programmes to the PC . . 38
Downloading pictures onto the computer 37 . .
Downloading of games from the net onto the computer 11 . .
Instant messaging . . 37
Looking for a job or sending a job application 31 33
Reading weblogs . . 33
Listening to web radios or watching web television 17 31
Chatting or writing to discussion forums 25 29
Playing games on the net 23 25
Telephoning over the Internet 5 20
Selling goods or services (e.g. via auctions) 11 17
Completing post education courses 8 16
Downloading games to the PC . . 9
Video conferencing 4 7
1 2 http://dx.doi.org/10.1787/477716514055Source: Sirkiä et al., 2005.
An
OE
CD
Bro
wo
L e c tur
ylnO dae
R
OECD INFORMATION TECHNOLOGY OUTLOOK 2008 – ISBN 978-92-64-05553-7 – © OECD 2008242

4. BROADBAND AND ICT ACCESS AND USE BY HOUSEHOLDS AND INDIVIDUALS
se_it E ditin
es
eu
le
Table 4.A2.11. Number of activities1 participated in by home Internet users during the last 12 months, Canada, 2005
0-2 purposes 3-7 purposes 8-11 purposes 12+ purposes
All 5.5 26.7 33.4 34.4
Males 5.0 22.4 32.1 40.5
Females 6.0 31.0 34.6 28.4
Age 18 to 24 20.72 33.6 45.7
Age 25 to 34 3.3 18.6 33.0 45.1
Age 35 to 44 5.2 26.7 33.6 34.5
Age 45 to 54 6.6 30.7 34.6 28.1
Age 55 to 64 8.4 38.2 32.6 20.8
Age 65 and up 12.8 44.8 30.1 12.43
High speed4 3.9 22.5 33.4 40.2
Low speed5 9.6 40.8 35.0 14.6
1 2 http://dx.doi.org/10.1787/4777357440151. 21 activities are measured.2. Owing to low reliability of the estimate for the 0-2 purposes category (coefficient of variation exceeds 33.3%), this
category has been combined with the category 3-7 purposes for the 18 to 24 age group.3. Use with caution – coefficient of variation between 16.6 and 33.3%.4. “High speed” includes all respondents who identified that they access the Internet at home using cable or
satellite, and all respondents accessing the Internet using a telephone connection or other connection(e.g. television, wireless [cellular phone or PDA], other) that they identified as a high-speed connection.
5. “Low speed” includes all respondents accessing the Internet at home through a telephone or other connection(e.g. television, wireless [cellular phone or PDA], other) which they identified as not a high-speed connection.
Source: Statistics Canada, ad hoc tabulation, based on data from the Canadian Internet Use Survey 2005, February 2007.
Table 4.A2.12. Diversity of Internet activities1 in the Netherlands, 2006
Number of Internet activities
Number of Internet usersShare of Internet users 2006
Average age of Internet users 20062005 2006
Abs. (x 1 million) % cumulative Years
1 0.4 0.3 3 49
2 0.6 0.5 7 43
3 1.0 0.7 14 38
4 1.5 1.1 24 39
5 1.6 1.7 41 37
6 1.5 1.7 57 37
7 1.6 1.8 75 36
8 1.2 1.5 90 36
9 0.6 0.8 97 34
10 0.2 0.3 100 32
Total 10.3 10.4 38
1 2 http://dx.doi.org/10.1787/4777451178611. Persons aged 12 to 74 years who used the Internet in the three months preceding the survey and carried out
specific Internet activities.Source: CBS-Statistics Netherlands, ICT use by households and individuals, 2005-06. As published in The DigitalEconomy 2006, CBS (2007), www.cbs.nl/NR/rdonlyres/243639BE-67DA-43D2-933B-583E3C97631E/0/2006p38pub.pdf.
An
OE
CD
Bro
wo
L e c tur
ylnO dae
R
OECD INFORMATION TECHNOLOGY OUTLOOK 2008 – ISBN 978-92-64-05553-7 – © OECD 2008 243

4. BROADBAND AND ICT ACCESS AND USE BY HOUSEHOLDS AND INDIVIDUALS
se_it E ditin
es
eu
le
Table 4.A2.13. Number of different uses of the Internet in France, all types of connection combined, 2005
Number of individuals
Number of different uses of Internet
1 to 2 3 to 7 8 to 11 12 and over
All 2 462 0 2.9 13.9 83.2
Males 1 202 0 4.4 16.2 79.4
Females 1 260 0 1.4 11.4 87.2
Males
15-19 years 128 0 4.4 6.0 89.6
20-29 years 251 0 7.7 25.2 67.1
30-39 years 310 0 7.0 19.4 73.6
40-49 ans 230 0 1.7 14.2 84.1
50-59 years 185 0 0.0 11.5 88.5
60-69 years 69 0 4.1 17.9 78.1
70 and over 29 0 0.0 8.5 91.5
Females
15-19 years 151 0 0.0 6.7 93.3
20-29 years 283 0 2.6 16.8 80.6
30-39 years 316 0 1.7 11.1 87.2
40-49 ans 228 0 0.0 10.0 90.0
50-59 years 201 0 1.3 11.1 87.5
60-69 years 65 0 7.0 11.3 81.7
70 and over 16 0 0.0 6.5 93.5
All
15-19 years 279 0 2.1 6.7 91.6
20-29 years 534 0 5.2 21.0 73.8
30-39 years 626 0 4.5 15.5 80.1
40-49 ans 458 0 0.9 12.2 86.9
50-59 years 386 0 0.6 11.3 88.1
60-69 years 134 0 5.4 14.8 79.8
70 and over 45 0 0.0 7.9 92.1
Farmers 22 0 0.0 8.5 91.5
Artisans, with own business 84 0 0.0 13.2 86.8
Managers 405 0 6.0 19.2 74.8
Intermediate professions 591 0 1.8 13.0 85.3
Non-manual workers 511 0 2.0 13.9 84.1
Manual workers 214 0 4.5 12.3 83.2
Pensioners 194 0 1.7 16.0 82.4
Other non-active 441 0 3.3 12.2 84.6
Employed 1 629 0 2.7 13.8 83.5
Unemployed 169 0 5.0 19.7 75.4
Retired 175 0 1.8 14.8 83.4
Student 364 0 3.6 12.0 84.5
Other 125 0 0.8 14.0 85.2
Higher education 1 043 0 4.1 18.7 77.2
General secondary school diploma 258 0 5.3 13.4 81.3
Technical secondary school diploma 137 0 1.1 17.7 81.3
Professional secondary school diploma 81 0 4.2 10.9 85.0
Vocational qualifying certificate (BEP, CAP, BEPC) 805 0 1.4 10.7 88.0
No degree 138 0 2.5 4.9 92.7
1st quartile 415 0 4.1 11.6 84.4
2nd quartile 501 0 1.1 12.2 86.7
3rd quartile 682 0 2.0 14.7 83.3
4th quartile 864 0 4.3 15.5 80.2
An
OE
CD
Bro
wo
L e c tur
ylnO dae
R
OECD INFORMATION TECHNOLOGY OUTLOOK 2008 – ISBN 978-92-64-05553-7 – © OECD 2008244

4. BROADBAND AND ICT ACCESS AND USE BY HOUSEHOLDS AND INDIVIDUALS
se_it E ditin
es
eu
le
Paris 510 0 3.7 17.6 78.7Urban area, pop. > 100 000 758 0 4.1 14.7 81.2
Urban area, pop. 20 000-100 000 295 0 2.3 13.2 84.5
Urban area, pop. < 20 000 377 0 2.0 13.7 84.3
Rural community 522 0 1.6 9.5 88.8
Low speed 476 0 1.2 5.2 93.6
High speed 1 357 0 4.3 21.3 74.4
1 2 http://dx.doi.org/10.1787/477756767431Read: 74.8% of managers with Internet access used the Internet for 12 or more different purposes in the past month.Coverage: population aged 15 years or older having used the Internet in the last month.Source: INSEE ad hoc tabulations, based on data from the survey Enquête Technologies de l'information et de la communication,October 2005.
Table 4.A2.13. Number of different uses of the Internet in France, all types of connection combined, 2005 (cont.)
Number of individuals
Number of different uses of Internet
1 to 2 3 to 7 8 to 11 12 and over
An
OE
CD
Bro
wo
L e c tur
ylnO dae
R
OECD INFORMATION TECHNOLOGY OUTLOOK 2008 – ISBN 978-92-64-05553-7 – © OECD 2008 245

se_it E ditin
es
eu
le
An
OE
CD
Bro
wo
L e c tur
ylnO dae
R

ISBN 978-92-64-05553-7OECD Information Technology Outlook 2008
© OECD 2008
DB
ro
wse_it E ditio
n
es
eu
le
ylnO d
Chapter 5
Digital Content in Transition
Digital content is an important driver of the ICT industry, spurred by the rapid
increase of OECD broadband subscribers, mobile broadband technologies anddevelopment of the participative Web. Digital content markets have annual growthwell over 20% in the industry sectors analysed in this chapter (advertising, games,music, and film) and increasing shares of total revenues, but with significant
differences among them. As new revenue streams and business models develop,functions and control along the value chain are shifting among established and newparticipants to dominate different parts of it. Cross-industry collaboration and newbusiness partnerships are developing and new entrants and online business models
are emerging. Despite fast growth the goal of digital content “anywhere, anytimeand on any device” is still hampered by structural factors.
An
OE
C
L e c tur
aeR
247

5. DIGITAL CONTENT IN TRANSITION
DB
ro
wse_it E ditio
n
es
eu
le
ylnO d
IntroductionBroadband applications and digital content are expected to provide new impetus for
the digital economy, following and complementing the infrastructure push that has
provided widespread network access. This chapter focuses on user-created content, a set
of creative industries (online computer and video games, film and video and music) and
online advertising. It builds on studies on the digital content sector (OECD, 2005a, 2005b,
2006a, 2007, 2008a, 2008b), and the results of the “OECD-Canada Technology Foresight
Forum on the Participative Web: Strategies and Policies for the Future”.1
Following an overview, sector analyses describe the main market developments,
impacts on value chains and online business models, challenges and outlook, and barriers
to digital broadband content development. The analysis is part of a broader project on the
impact of broadband and digital content on industry structure, growth and employment
and the associated policy implications (see Chapter 7 and OECD, 2006b).2
Broadband content markets and value chains: Cross-sector comparisonsThe availability of broadband has encouraged the development of new Internet
activities and demand for content and applications (see Chapter 4). A greater willingness
to pay for Internet content and greater confidence in Internet applications have played a
large role on the demand side. Broadband use has also become more participative as users
upload content, increasing demand for upstream bandwidth.
On the supply side, technological developments such as more widespread broadband
and wireless access, the emergence of other technologies (e.g. content protection
technologies, portable media players and tools which allow shifting content from the PC to
the TV), lower entry barriers (e.g. for content distribution), and a corresponding rise in new
business models have facilitated the emergence of innovative broadband content and
applications. Consequently, the role of broadband as a communication and content
distribution platform has evolved significantly. Since 2003, broadband subscribers in the
OECD area increased from 68 million in June 2003 to 251 million in June 2008 (Figure 5.1).
Connections are faster and less expensive with an average speed of advertised connections
at almost 14 Mbit/s in 2008.
More data-intensive applications are being developed, e.g. streaming high-definition
video, new peer-to-peer applications, virtual reality environments, and health,
environmental or educational broadband applications. Global consumer Internet traffic is
set to double between 2007 and 2009 and to increase by another 77% until 2011. Broadband
applications based on peer-to-peer technology remain the main source of traffic, but
Internet video applications are rapidly gaining shares and are overtaking traffic generated
by Web browsing, emailing, and file downloads (Figure 5.2). Online games are showing
increased popularity and rely on ever-more efficient data transfer technologies.
However, the evolution towards broadband applications and use is far from its full
potential. Many new broadband content applications, especially converged services such
An
OE
C
L e c tur
aeR
OECD INFORMATION TECHNOLOGY OUTLOOK 2008 – ISBN 978-92-64-05553-7 – © OECD 2008248

5. DIGITAL CONTENT IN TRANSITION
se_it E ditin
es
eu
le
as television over wireless networks, are taking longer to arrive than expected. Despite
great potential and a large installed-user base, widespread use of advanced mobile
broadband services (e.g. entertainment or health applications) have yet to emerge in most
OECD countries. The goal of broadband content “anywhere, anytime and on any device” is
still remote. Infrastructure challenges relate to availability, pricing, speed (e.g. for high-
definition video), service quality, and other technical issues (e.g. interoperability).
Commercial digital content revenues are also challenged by unauthorised use of music,
films, games, etc.
There is considerable flux in business approaches, with broadband-based models
already posing serious challenges to some established business models, and suppliers of
Figure 5.1. Broadband growth, OECD total, 2003-08 Million subscribers
1 2 http://dx.doi.org/10.1787/475733644837
Source: OECD Broadband Portal, www.oecd.org/sti/ict/broadband.
Figure 5.2. Global consumer Internet traffic 2005-11In million terabytes/month
1 2 http://dx.doi.org/10.1787/475765781701
Source: Based on Cisco, 2007.
250
300
200
150
100
50
0June 03 Dec. 03 June 04 Dec. 04 June 05 Dec. 05 June 06 June 07 Dec. 07 June 08Dec. 06
Cable DSLOther
2005 2007 2009 2011
3.5
3.0
2.5
2.0
1.5
1.0
0.5
0
Web, e-mail, FTP Online games
P2P Internet video (PC, TV, communication)
An
OE
CD
Bro
wo
L e c tur
ylnO dae
R
OECD INFORMATION TECHNOLOGY OUTLOOK 2008 – ISBN 978-92-64-05553-7 – © OECD 2008 249

5. DIGITAL CONTENT IN TRANSITION
se_it E ditin
es
eu
le
broadband services and content having to reinvent their technology and services. The
development of digital content services also requires co-ordinating a wide range of
industry participants, some of which have not yet worked together, on complex issues such
as developing new markets and revenue sharing. For example, broadband service providers
are uncertain about how to recoup their large investments in the absence of new revenue-
generating services, and content providers are waiting for improved connectivity and
content protection technologies before providing content services. Furthermore, existing
companies are still uncertain about whether to maintain current business models or to
shift to Internet business models, potentially cannibalising their offline sales and risking
unauthorised copying and downloads.
Market size and growth
Digital content revenues are growing rapidly across all sectors, but growth rates and
shares in overall revenues vary (see Table 5.1 and Annex Figure 5.A1.1). Advertising
represents the biggest online market in absolute terms, followed by computer and video
games, online music, and film and video. Overall global market revenues (offline and
online) generated by video games overtook music revenues for the first time in 2007 and
revenues from the narrowly defined “online games” category are higher than those from
online music. However, virtually all top-selling games are now Internet-enabled and the
online game market is much bigger (closer to total revenues from “online games” and
games software sales).
Table 5.1. Market size and growth, 2007 or latest available year
Computer and video games1 Film and video2 Music3 Advertising4
Global revenues (offline + online) USD 37.5 billion USD 84 billion USD 30 billion USD 445 billion
Growth of market (offline + online) 19% (2006-07) 4% (2006-07) –6% (2006-07) 5% (2006-07)
Global online revenues USD 6.5 billionIncreasingly all new games are Internet-enabled
Marginal USD 4.7 billion USD 31 billion
Growth of online market 28% (2006-07) > 100% (2006-07) 27% (2006-2007) 28% (2006-07)
Share of online in total 17% but increasingly all new games are Internet-enabled
Marginal(under 1% in most markets)
16% 7.5%
Unauthorised downloading of online content and its impact
Low for Internet-enabled games but growing quickly(i.e. “server piracy”)
Medium and growing High n.a.
1 2 http://dx.doi.org/10.1787/477773152446n.a.: not available.
1. Global computer and video games revenues consist of console and PC games sales, online games, and mobilephone games. Figures for online revenues are based on a definition which includes casual games, onlinesubscription offers (e.g. World of Warcraft; Xbox Live Marketplace), and paid downloads from websites(e.g. Electronic Arts; Ubisoft; GameTap). This definition does not include revenues from mobile phone games,trade in virtual items (e.g. skins, arms), and sales of online-enabled console and PC games. Source: OECDcalculations; PricewaterhouseCoopers, 2007.
2. Global film and video revenues do not include television licensing. Online revenues include paid moviedownloads, streaming, and (mobile) subscription offers; they do not include IPTV offers. Source: OECDcalculations; PricewaterhouseCoopers, 2007; Screen Digest et al., 2007.
3. Global music revenues represent estimates of physical and digital music sales as reported by IFPI. Online revenuesinclude downloads to PCs and mobile phones, as well as subscriptions. (Online revenues indicated are retailvalues. Online revenues reported by IFPI refer to record company revenues, which differ from retail revenues.)Source: OECD calculations; IFPI, 2008.
4. Global advertising revenues include expenditure for advertisements in the following media: print publications,television, radio, cinema, outdoor and Internet. Source: ZenithOptimedia, 2007.
An
OE
CD
Bro
wo
L e c tur
ylnO dae
R
OECD INFORMATION TECHNOLOGY OUTLOOK 2008 – ISBN 978-92-64-05553-7 – © OECD 2008250

5. DIGITAL CONTENT IN TRANSITION
se_it E ditin
es
eu
le
Growth is fastest for online film, albeit from very low levels, followed by computer and
video games, advertising, and online music. User-created content is not included as offline
and online revenues are hard to define and measure.
Unauthorised downloading of digital content (online piracy) may be an important
impediment to legitimate online distribution services and is putting pressure on content
providers to craft innovative and appealing new business models and strategies. Online
music is facing the greatest challenges, but as ever-faster uncapped broadband
subscriptions allow sharing of larger files, the film sector, which had been shielded by low
broadband availability and speeds, is increasingly faced with online piracy. Many pirated
films are available online before or just after their official release dates. Piracy can be high
for offline computer and video games, but manufacturers have been relatively successful
in fighting online games piracy by adopting new business models (e.g. online
subscriptions). But even this solution seems increasingly to face “server piracy” (servers
that allow playing at lower prices or for free) especially in Asia.
Digital content value chains, business models and market structure
Broadband content relies on new value and distribution chains and business models.
As new revenue streams and business models are explored, functions and control over the
value chain are shifting among established and new entities vying to dominate certain
parts of the value chain. Figure 5.3 displays a stylised digital broadband content value and
distribution chain. Compared to offline value chains, certain activities become obsolete
(e.g. manufacture of physical carrier media such as CDs, distribution of physical products)
and certain value chain participants face disintermediation (Table 5.2). Digital content
value chains are also seeing the emergence of new “digital infomediaries” that provide
support functions (e.g. digitisation, digital rights management, hosting of content), content
aggregation and distribution (e.g. Internet portals, search engines, online bookshops and
online music providers), and new value-adding functions (i.e. reintermediation). Even
offline retailers have gained an important foothold in digital content distribution
(Table 5.3).
Figure 5.3. Digital broadband content value and distribution chain
Management of creativecontent
Broadband
Auxiliary activities (e.g. marketing, advertising)
Consumer
Digital content support services(e.g. rights clearance; DRM, streaming, e-payment)
Content creation
Aggregation, publishing, distribution
– Hosting and platform provision (portals)
– Online retail
Access technology(e.g. PC, phone,
MP3 player)
User feedback loop
An
OE
CD
Bro
wo
L e c tur
ylnO dae
R
OECD INFORMATION TECHNOLOGY OUTLOOK 2008 – ISBN 978-92-64-05553-7 – © OECD 2008 251

5. DIGITAL CONTENT IN TRANSITION
se_it E ditin
es
eu
le
Table 5.2. Impact of broadband on value chains, competition and market structure
User-created content Computer and video games Film and video Music Advertising
Impact of broadband on value chain
New value chain for production and distribution.
Medium to high on the production and distribution of online games.
Low to medium. While production greatly affected, not much impact on value chain. Growing impacts on distribution.
High for distribution but not production.
High
Impact of broadband on content creation
Very high High Medium Medium Low (text ads) to very high (interactive ads)
Importance of new digital intermediaries
Very high Medium High Very high Very high
Concentration/ variety of online suppliers or platforms
High concentration of traffic on few UCC platforms despite large number of new entrants.
Limited number of new entrants; traditional publishers still in charge.
Low but growing fast as online offers are still emerging.
Very high despite large number of new entrants.
High despite number of new entrants.
New broadband content cross-industry alliances
High Medium Low but growing as online offers are still emerging.
High High
Table 5.3. New cross-industry participation in broadband content distribution
User-created content
Computer andvideo games
Film and video Music Advertising
Internet service providers (ISPs)
ISPs distribute digital content to subscribers (e.g. Free: music downloads, film on-demand); and Internet consumers (e.g. Verizon: Games-on-Demand; Usen Group: GyaO, OnGen); Internet Web pages becoming important advertising platforms.
Telcos Most telecommunications providers (including mobile) involved in the distribution of digital content, mostly across sectors (e.g. Telstra BigPond); Deutsche Telekom (Musicload.de); KDDI (Chaku Uta), NTT DoCoMo, O2, Verizon)
Internet businesses Google (YouTube, Blogger), Yahoo!, Mixi, Naver
Yahoo!, Steam, Naver (Hangame)
Amazon (Unbox), MovieFlix
Amazon (Unbox), Yahoo!,Emusic, Excite Music Store
Amazon, Google, Yahoo!, Facebook, Mixi, Naver, Ebay
Content producers, media and broadcasting
News Corp. (MySpace), ProSiebenSat.1 (MyVideo.de), Viacom (Atom)
Electronic Arts, Ubisoft, Activision Blizzard, Time Warner (GameTap)
News Corp. (BitTorrent), ProSiebenSat.1 (Maxdome), NBC/Universal (Hulu), Lionsgate (CinemaNow)
Viacom (Rhapsody), NBC/Universal (DG Web shop)
News Corp., ProSiebenSat.1, Viacom (Atom)
Offline retailers Fnac (Live), Tsutaya
Fnac,Wal-Mart (Wmtmobile.com), Tsutaya
Blockbuster (MovieLink), Fnac, Tsutaya
Fnac, F.Y.E.,Wal-Mart, Tsutaya
Fnac,Tsutaya
Equipment and software manufacturers
Microsoft (MSN), Sony (Crackle), TiVo (Podcasts, Home video sharing)
Microsoft (Xbox), Sony (Playstation)
Apple (iTunes), Microsoft (Xbox), Sony (Playstation), TiVo, Cisco (CinemaNow)
Apple (iTunes), Nokia (Music store), Sony (Mora), TiVo (Rhapsody), Microsoft (Zune)
Microsoft (MSN), Sony (In-game advertising)
An
OE
CD
Bro
wo
L e c tur
ylnO dae
R
OECD INFORMATION TECHNOLOGY OUTLOOK 2008 – ISBN 978-92-64-05553-7 – © OECD 2008252

5. DIGITAL CONTENT IN TRANSITION
se_it E ditin
es
eu
le
For music and film, new value chain participants are mostly confined to the area of
distribution, but online games and user-created content (UCC) also face large impacts on
the production side. In the area of professional content production and advertising, the
roles of artists and management of creative content (e.g. music labels, Hollywood studios,
creative advertising studios) have not yet been strongly affected, but new approaches are
being trialed for user-created content (direct links between content creators and users are
indicated by the shaded “management of creative content” function in Table 5.3).
In spite of some instances of more direct producer-to-consumer relations, digital
entertainment is mostly characterised by re-intermediation. Direct relations between
content creators and consumers – full disintermediation – are still rare (e.g. musicians
offering music for free to obtain revenue from donations, concerts without involvement of
a music label, film writers offering short or feature films on video-sharing platforms to gain
visibility; see Table 5.2). Contrary to early expectations, the role of intermediaries and
aggregators for user-created content is large and growing.
The roles of value chain participants are changing throughout the sectors studied.
Internet service providers (ISPs), telecommunication operators (telcos), Internet
businesses, content producers, offline retailers and even equipment and software
manufacturers are increasingly engaged in digital content distribution in one way or the
other (Table 5.3). Some capitalise on existing consumer bases (e.g. retailers, telcos,
hardware manufacturers) and possibilities to “bundle” different services into attractive
offers or to “tie” them to devices or software (e.g. ISPs, telcos, hardware manufacturers).
ISPs, telcos and IT firms are very large when compared to individual digital content sectors.
Leading telecommunication operators such as NTT or Verizon have annual revenues (about
USD 90 billion) which are much higher than entire content sectors (combined offline and
online): the music sector is about USD 32 billion. The same applies to software and IT
equipment firms.
As the boundaries between the IT, telecommunications, media, and entertainment
industries blur, cross-industry collaboration and new business partnerships are emerging:
Microsoft and Viacom are collaborating in online advertising, Viacom holds stakes in the
online music service Real Rhapsody and Microsoft a share of Facebook (a social networking
site, SNS); the equipment manufacturer Nokia is in distribution deals with major music
labels; Korean telecommunications provider SK Telecom runs Cyworld (the country’s most
popular SNS). While initially surprising, these moves enable businesses to spread and
increase their stakes in growing online sectors. Previously specialised companies may
assume totally new roles (e.g. mobile phone companies buying music labels and becoming
more involved in mobile television distribution, search engines increasing their
involvement in the mobile phone business).
Despite their very recent emergence, some of these new value chain participants
already significantly influence the value and distribution chain (e.g. certain online content
platforms, digital rights management [DRM] and billing providers). Concentration and
consolidation, in both production and distribution, tend to be high and growing despite
many new entrants and great market dynamism. This is, for example, evidenced by the
high market shares of the few successful online music distribution platforms, the limited
number of participants in the online advertising value chain, or the very few successful
UCC platforms (Table 5.3). The variety of product offers is also quite low in the area of new
digital intermediaries (e.g. DRM).
An
OE
CD
Bro
wo
L e c tur
ylnO dae
R
OECD INFORMATION TECHNOLOGY OUTLOOK 2008 – ISBN 978-92-64-05553-7 – © OECD 2008 253

5. DIGITAL CONTENT IN TRANSITION
se_it E ditin
es
eu
le
Finally, new digital content business models are emerging, some of which mirror
offline models (pay-per-item digital content sales, for example) and some of which
innovate (e.g. sale of virtual items or professional subscription accounts). The seven main
and existing generic categories are depicted in Figure 5.4 and correspondences to sectors
are noted in Table 5.4. Except for online advertising, which is developing new, highly
efficient and high-revenue business models (e.g. cost-per-click models; see the section on
online advertising below), all other sectors are experimenting with new approaches to
generating more, increasingly advertising-based, digital content revenue.
Digital content product characteristics and user acceptance
The different digital content product characteristics and functionalities summarised
in Table 5.5 can help explain differences in user acceptance and potentially dissimilar
online market growth trajectories.
Bandwidth requirements differ from sector to sector but requirements are high and
growing in all (Figure 5.5), including in terms of latency.3 Current average ADSL
(asynchronous DSL) download speeds in OECD countries (around 9 Mbit/s) are sufficient for
a range of existing digital content services, especially for online music. Yet many new video
(especially high-definition streams and video-on-demand [VoD] downloads) and game
services require even greater speeds. Moreover, gaps between OECD countries are wide,
including with respect to pricing (average monthly prices per advertised Mbit/s range from
USD 3 PPP in Japan to almost USD 100 PPP in Turkey).4 Despite expectations regarding
mobile content, wireless access speeds are low in most OECD countries. Furthermore, low
Figure 5.4. Digital broadband content business models
1. Voluntary donations and contributions
2. Digital content sales (pay-per-track, pay-per-view, pay-per-game, etc.)
3. Subscription-based revenues
4. Avertising-based revenues
5. Selling goods and services (including virtual items) to the audience
6. Selling of user data and customised market research
7. Licensing content and technology to other providers
Table 5.4. Evolving sector-specific online business models
User-created content Mostly free or based on voluntary donations and contributions. Increasingly subscription- and advertisement-based revenues and business-to-business licensing of technologies. In the future, revenue will be generated by selling information about users or offering access to the user community.
Computer and video games Mostly digital content sales (purchase of console game with Internet functionality) and subscription-based revenues. Increasingly advertising-based and selling of virtual items, etc.
Film and video Mostly digital content sales (pay-per-view) and few examples of advertising-based business models. Increasingly subscription-based revenues.
Music Mostly digital content sales (pay-per-track) and some examples of advertising-based business models. Increasingly subscription-based revenues and artists trying to derive revenues from concerts or even voluntary contributions.
Advertising Mainly search advertising (cost-per-click and cost-per-action models) and display ads. Increasingly behavioural advertising linked to existing online ad models or stand-alone.
An
OE
CD
Bro
wo
L e c tur
ylnO dae
R
OECD INFORMATION TECHNOLOGY OUTLOOK 2008 – ISBN 978-92-64-05553-7 – © OECD 2008254

5. DIGITAL CONTENT IN TRANSITION
se_it E ditin
es
eu
le
ADSL upload speeds (OECD area: 1.6 Mbit/s on average) restrict some kinds of interactivity
and user-created content and applications such as video conferencing.
Access points and mobile access: The ways to access most broadband content offers are
still limited (mostly PC-based access or consoles in the case of games). Sectors differ,
however (Table 5.5) and new forms of access are developing, e.g. “triple play” set-top boxes
Table 5.5. Digital content product characteristics and broadband functionalities
User-created content Computer and video games Film and video Music
Bandwidth requirements Low (such as text-based blogs) to very high (virtual worlds)
High to very high Very high Medium
Access point Still mostly PC, except Japan and Korea
PC or console, except Japan and Korea
PC or set-top box Still mostly PC, except Japan and Korea
Mobile access Mostly PC, but mobile access growing
Low, but growing(e.g. PSP or mobile games)
Mostly no.Higher in Japan and Korea
Low but increasing.Very high in Japan and Korea
Online catalogue depth Strongly growing with various quality levels
High percentage of new online games. But very thin catalogue of older games.
Very modest but growing Modest but growing
Price attractiveness as compared to offline
n.a. Variable. Online games can be more expensive due to subscription pricing
Mostly cheaper but usage restrictions
Mostly cheaper but usage restrictions
Offers with geographic access restrictions
Mostly no access restrictions but language as barrier and local offers exist
Mostly no Yes Yes (especially subscription services)
Personalisation, interactive and community features
Very high Very high Low Medium
Limits on interoperability and content portability
Medium High (PC) to very high (consoles)
Very high Very high but falling
Figure 5.5. Bandwidth requirements of selected digital content types, in Mbit/s, 2008
1 2 http://dx.doi.org/10.1787/475775160214
Note: Horizontal bars represent approximate ranges of bandwidth requirements for 2008 and will increase; onlyminimum values are explicitly defined. Maximum requirements are open-ended (indicated by shading). Flags markadvertised average ADSL speeds in OECD countries (around 9 Mbit/s for ADSL downloads; 1.6 Mbit/s for uploads inearly 2008).
Source: Estimates based on OECD Communications Outlook 2007 and further analysis.
0 2 4 6 8 10 1412 16 18
High-definition TV
Online games
Video on demand
Internet protocol TV
Video conferencing
Virtual worlds
Web browsing
Audio streaming
Voice call
ADSL (up) ADSL (down)
An
OE
CD
Bro
wo
L e c tur
ylnO dae
R
OECD INFORMATION TECHNOLOGY OUTLOOK 2008 – ISBN 978-92-64-05553-7 – © OECD 2008 255
5. DIGITAL CONTENT IN TRANSITION
se_it E ditin
es
eu
le
offering TV services and mobile access possibilities by ISPs (except for Japan and Korea
where this is already common for various types of content).
Online catalogue depth (“long tail”): For music and film, online catalogues are growing
but still modest or low compared to offline. Difficult rights negotiations and at times costly
digitisation processes are keeping the “long tail” (i.e. greater amount of content, including
niche and non-mainstream content, in the absence of shelf-space constraints and
associated costs) rather short. For instance, very popular online music stores currently
offer around 5 million songs. Gracenote’s MusicID, a music database, references 80 million
songs; this indicates that only a small share of music is available online. Online film
catalogues are even smaller: although Amazon Unbox indicates a catalogue of around
4 000 films, most competitors hold a maximum of 1 000, yet roughly 3 000 films are
released each year in OECD countries alone. In the video and computer games industry
virtually all new releases have online features, but a “long tail” of older releases is not
available to consumers for online download.5
The modest depth of catalogues can partly be explained by a concentration on
“blockbuster” content and/or the fact that few services offer access to truly international
catalogues (especially content from other geographic regions or even non-OECD countries).
Price attractiveness: Online offers can make certain types of content more affordable
for consumers. Most UCC is still free to users. For music and films, online prices can be
substantially cheaper than purchase of the equivalent content offline (OECD, 2008a). Often,
however, different usage restrictions are imposed. Video games show that online revenues
can potentially be higher than offline as subscription-based models are replacing digital
content sales models.
Offers with geographic access restrictions: Traditional content offers such as film and
music are mostly limited to specific geographic regions, i.e. the service is inaccessible from
other countries. National boundaries apply on the Internet for commercial (e.g. market
segmentation), legal (e.g. territoriality of intellectual property rights) or cultural
(e.g. language) reasons. This imposes significant costs on content delivery services for
adapting their service to multiple destinations.
Personalisation, interactive and community features: Broadband offers unprecedented
possibilities for personalisation, interactive and community features, e.g. personalised
music and film suggestions; the ability to rate, recommend or share content; the ability to
share playing or viewing experiences such as in online games; the ability to interact with
the content or the creator; the ability to create or modify content. UCC and games already
strongly rely on these features. Commercial content offers in fields such as music, and
more importantly film, are just starting to capitalise on the Internet’s possibilities. Mobile
applications will further increase possibilities for personalisation and put pressure on
providers to reinvent their service offerings.
Limits on interoperability and content portability: All digital content sectors face rather
high interoperability constraints, mostly related to hardware, software and “built-in by
design” as part of a business model (e.g. tying music purchases to specific portable music
players or imposing limitations due to DRM software6); sometimes they are the result of
the inability of the industry to agree on common standards or interoperability criteria. The
portability of content from one device to another (e.g. from console to PC, from PC to mobile
phone or TV, from set-top box and TV to PC or mobile phone) is usually extremely limited.
With increasing user frustration and concerns among OECD governments, competition
An
OE
CD
Bro
wo
L e c tur
ylnO dae
R
OECD INFORMATION TECHNOLOGY OUTLOOK 2008 – ISBN 978-92-64-05553-7 – © OECD 2008256

5. DIGITAL CONTENT IN TRANSITION
se_it E ditin
es
eu
le
authorities and consumer associations, small but potentially growing interoperability is on
the horizon (e.g. the rise of DRM-free content; the ability to play online videos on PC, TV or
portable devices). At the same time, growing competition among UCC platforms may result
in new formats and interoperability restrictions.
In sum, network, hardware and software infrastructures are increasingly in place that
allow for the delivery of sophisticated and integrated broadband content offers covering a
varied range of digital content. On the industry and company level, business models and
value chains are adjusting to tap this potential. The resulting digital content value chains
are more complex than ever before; they involve a range of new actors, some of which
exercise considerable influence on terms, conditions and configuration of the final
products. However, the changes, maturity of business models and user acceptance are not
identical across content sectors. The following sections provide a more detailed analysis of
similarities and differences.
Broadband content developments
User-created content
The Internet has altered the nature and the economics of producing content. Entry
barriers for creation and distribution have declined radically and led to broader
participation in media production, greater user autonomy, increased diversity and a shift
away from passive consumption of broadcasting and other mass distribution models.
Terms such as the “participative web” or Web 2.0 describe an Internet increasingly
influenced by intelligent Web services, based on new technologies which increasingly
enable users to contribute to developing, rating, collaborating and distributing Internet
content and to developing and customising Internet applications (OECD, 2007). Here user-
created content (UCC) is defined as content which is made publicly available over the
Internet, reflects a “certain amount of creative effort”, and is “created outside of professional
routines and practices” (OECD, 2007). Table 5.6 provides an overview of UCC platforms.
The traditional media publishing value chain depends on entities that select, develop
and distribute the creator’s work, often at high cost. Technical and content quality is
guaranteed through traditional media “gatekeepers”. In the UCC value chain, content is
created and posted directly on UCC platforms at much lower cost, although the quality is
potentially more diverse. Lower access barriers, increased demand for content
Table 5.6. Platforms for user-created content
Type of platform Examples
Blogs Blogs such as BoingBoing, Engadget, Ohmy News; Blogs on sites such as LiveJournal; Windows Live Spaces; Cyworld; Skyrock
Wikis and other text-based collaboration formats Wikipedia, Wiktionary; sites providing wikis such as PBWiki, Google Docs
Sites allowing feedback on written works FanFiction.Net, SocialText, Amazon
Group-based aggregation Sites where users contribute links and rate them, such as Digg, reddit.Sites where users post tagged bookmarks such as del.icio.us
Photo-sharing sites Kodak Gallery, Flickr
Podcasting iTunes, FeedBurner (Google), WinAmp, @Podder
Social network sites MySpace, Mixi, Facebook, Hi5, Bebo, Orkut, Cyworld, Imeem, ASmallWorld
Virtual worlds Second Life, Active Worlds, Entropia Universe, Dotsoul Cyberpark
Video content or file-sharing sites YouTube, DailyMotion, GyaO, Crackle
An
OE
CD
Bro
wo
L e c tur
ylnO dae
R
OECD INFORMATION TECHNOLOGY OUTLOOK 2008 – ISBN 978-92-64-05553-7 – © OECD 2008 257

5. DIGITAL CONTENT IN TRANSITION
se_it E ditin
es
eu
le
downstream, and lower entry barriers in supply upstream may lead to recognition for
creators who would not be selected by traditional media publishers.7
The production and consumption of UCC has been accompanied by social and
behavioural changes, including increased participation and the creation of cultural
content. Users often select content that is more personalised, and they assess content, for
example, by recommendations and ratings. The nature of localised UCC platforms also
triggers a greater availability of specialised local and minority content in diverse
languages. UCC is also a form of personal expression that is increasingly used for critical,
political, and social ends. Blogs, social networking sites and virtual worlds can be platforms
for exchanging political views, provoking debate, and sharing knowledge about societal
questions. In an educational context, platforms tend to be collaborative, encouraging the
sharing of knowledge and “peer production”.
Market development
Since 2006, a significant expansion of UCC platforms has offered users the possibility
to upload and display content. Participative websites have benefited from an ever larger
and more experienced broadband user base, more widely available access to software
(e.g. music mixing or blogging software), technologies for interactive web applications
(e.g. Ajax, RSS), as well as demographic factors, new investments and ways of monetising
UCC. Institutional and legal developments have also acted as drivers, such as the rise of
flexible licensing and copyright schemes and end-user licensing agreements that grant
copyright for UCC (e.g. in SecondLife).
Video sites and social networking sites are becoming the most popular websites,
ranking among the top 50 most visited websites in most OECD countries and among the
top 10 fastest growing sites in terms of usage. Owing to strong network effects, a handful
of UCC platforms receive the most attention, with, for example, MySpace attracting more
than 110 million unique users in 2007.
Overall, little official statistical information on UCC is available.8 However, existing
data show that broadband users produce and share content at a high rate (several
hundred million pieces of content on the Internet are under various Creative Commons
licences)9 and point to evolving intergenerational and gender differences in Web media
usage.
By the end of March 2007, Japan had 8 million estimated bloggers and 35 million
estimated blog readers (about 41% of Japanese Internet users), i.e. roughly one out of five
readers created blogs (MIC, 2007). There were an estimated 10 million Japanese users of
social networking services (SNS) (about 12% of Japanese Internet users). In Korea, roughly
16 million (i.e. close to half of all Korean Internet users) read blogs or visit “minihompys”
(mini homepages) (Figure 5.6). About 8 million Koreans own a mini homepage (about one-
quarter of all Korean Internet users) and around 40% of Korean Internet users use online
communities (NIDA, 2007b). These numbers increased in 2008.
In 2007 in the United States, 29% of Internet users read blogs and 12% had created their
own blog; the latter share is close to 30% for teenagers between 12 and 17 years old; and
17% of all Americans use online material in their own online creations (Pew, 2007b). In the
EU in that year, 16% of all Internet users reported having created pages.10
Depending on the type of UCC and the country, the number of creators is often
relatively small as compared to those simply viewing content, especially for blogs and
An
OE
CD
Bro
wo
L e c tur
ylnO dae
R
OECD INFORMATION TECHNOLOGY OUTLOOK 2008 – ISBN 978-92-64-05553-7 – © OECD 2008258

5. DIGITAL CONTENT IN TRANSITION
se_it E ditin
es
eu
le
online videos. In the case of Wikipedia, for example, in 2006 about 4% of all contributors
made the majority of contributions.11 This is less true for SNS, as most users create some
form of content.
Age remains a determining factor in the degree of active contribution. Older teens are
the most active users of social networking services in the United States: 55% of American
adolescents between 12 and 17 years of age have created personal online profiles on sites
such as Facebook or MySpace (Pew, 2007a, 2007b). In countries with a longer tradition of
UCC, such as Korea, older age brackets (including over 40 years old) are increasingly
involved, and users between 20 and 29 years old are the most active (NIDA, 2007b, 2007c).
Gender is another factor in online activity. In many OECD countries, the share of
females who actively contribute by putting up a web page or a blog is smaller than the
share of males. However, in the United States, 70% of all girls aged 15 to 17 are reported to
have used an online social network compared to 54% of boys; and girls constitute nearly
60% of web page creators among teenagers aged 12 to 17 (Pew, 2007a, 2007b). In Japan,
women in the 20-30 age group also more actively seek friends online (MIC, 2005) and
blogging activity is high among Asian women.12
Online business models
Initially, most user-created content was not linked to expectations of remuneration or
profit. Motivating factors included connecting with peers, self-expression, and achieving
fame, notoriety or prestige. Today, UCC sites are of increasing interest to investors and
businesses (see Table 5.7 for economic incentives). A number of new entities are now
involved in content provision, especially the advertising industry, search engine operators,
and media firms that own UCC platforms or select content from these platforms for
distribution over traditional media publishing channels.
Most business models are still in flux and revenue generation for content creators or
firms is only beginning. There are essentially six approaches to monetising UCC which are
described below; combinations of these approaches are illustrated in two cases in Table 5.8.
Figure 5.6. Blog readers, bloggers, and minihompy owners in KoreaIn million users (left) and as a percentage of Internet users (right)
1 2 http://dx.doi.org/10.1787/475787824488
Note: A “minihompy” is a user profile page on popular social networking platforms such as Cyworld.
Source: Based on NIDA Survey on the Computer and Internet Usage, 2007a, 2007b (February; October).
18
16
14
12
10
8
6
4
2
0
50
45
40
35
30
25
20
15
10
5
0
%
Blog/Minihompy readers (est.) Minihompy owners (est.) Bloggers (est.)
47.40%
23.70%
12.40%
An
OE
CD
Bro
wo
L e c tur
ylnO dae
R
OECD INFORMATION TECHNOLOGY OUTLOOK 2008 – ISBN 978-92-64-05553-7 – © OECD 2008 259

5. DIGITAL CONTENT IN TRANSITION
se_it E ditin
es
eu
le
Some of the models include remunerating creators, either by sharing revenues or by direct
payments from other users.
● Voluntary donations: Content creators make content freely available but solicit donations
from users (online by credit card or via PayPal). Blogging and citizen journalism sites
such as Global Voices Online are supported by bloggers who provide content for free;
operating expenses are funded by grants from foundations or in some cases news
companies.
● Charging viewers: Pay-per-item model: users make per-item (micro) payments to UCC
platforms or creators to access individual pieces of content. Subscription model:
consumers subscribe to services. Users pay a subscription for enhanced hosting services
for their own content or for access to other users’ content (subscriptions to the latter are
rarely used). In two-tiered subscription services a user can opt for a “basic” account free
of charge or for a paid “pro” account with advanced features.
● Advertising-based models (“monetising the audience”): Advertising is often seen as a more
promising source of revenue and some UCC sites are distributing revenue among those
who create or own content. “Branded channels” have been launched on UCC platforms
with content from a special brand or media publisher. Virtual worlds allow firms to
create and display advertisements.
● Licensing content and technology to third parties: Increasingly UCC is being used on other
platforms, and licensing content to third parties (e.g. TV stations) may be a source of
revenue. Users may agree to license the site to use their content without payment,
sometimes reserving the right to exploit their work commercially, but a revenue-sharing
model between content creators and the UCC site may apply. Mobile carriers are
increasingly acquiring licences to distribute UCC and technologies that enable sharing of
content.
Table 5.7. Economic incentives and benefits for different UCC value chain participants
Consumer electronics and ICT goods Selling hardware with new functionality and interoperability for users to create and access content.
Software producers Providing ICT services and software for creation, hosting and delivery of UCC.
ISPs and web portals ISPs: using UCC to attract customers and build a user base for premium Internet services. Web portals: aiming to attract traffic, build Internet audiences and advertising revenues (and avoid losing traffic to UCC-related sites).
UCC platforms and sites Attracting traffic, building Internet audiences and subscription and advertising revenues; increasing attractiveness for potential acquisition.
Creators and users Non-commercial incentives (to entertain or inform other users, for recognition or fame); Commercial incentives to generate revenue through donations, sale of content or sharing revenue from advertisement-based models. Other users benefit from free access to content which is entertaining or educational (e.g. on purchasing decisions, or advice).
Traditional media Participating in UCC online revenues (essentially through advertising-based business models); promoting own content to UCC audiences; broadcasting or hosting UCC to retain audience and advertisers and to prevent disintermediation.
Professional content creators Reinventing business models to compete with free web content (e.g. photographs, images).
Search engines Using UCC audiences to attract advertising revenues while improving searchability.
Web services that benefit from UCC Using UCC to build more attractive websites and customer services and information (e.g. a travel agency or hotel chain that encourages users to post pictures and share appreciations).
Advertising Benefiting from increased online advertising directed at communities on UCC platforms; using UCC content in advertising campaigns.
Marketing and brands Expanding customer loyalty by promoting brands on social networking sites or advertising to UCC communities.
An
OE
CD
Bro
wo
L e c tur
ylnO dae
R
OECD INFORMATION TECHNOLOGY OUTLOOK 2008 – ISBN 978-92-64-05553-7 – © OECD 2008260

5. DIGITAL CONTENT IN TRANSITION
se_it E ditin
es
eu
le
● Selling goods and services to the community (“monetising the audience via online sales”): Owing
to network effects, successful UCC sites are likely to have a large user base. This can be
monetised by selling items and services directly to users or developing transactions
among them (e.g. sale of avatars, virtual accessories or even virtual land). UCC sites can
also co-operate with third parties to allow them to sell directly to their users but take a
share of the revenue.
● Selling of user data: Other business models may involve the sale of mostly anonymous
information about users to market research and other firms.
Challenges
UCC raises a number of business, social and regulatory challenges related (see OECD,
2007).13 To begin with, fostering more broad-based participation will be a continuing
challenge, as an enduring gap between digitally literate users and others may accentuate
social fragmentation and intergenerational differences. Moreover, most users consume
UCC; only a limited number of mostly young early adopters contribute actively. Slow
upload speeds on asymmetric networks pose a challenge (see Figure 5.5), but the
deployment of fibre is helping to overcome this problem.
New sustainable business or other models for UCC platforms will have to be explored
in the near future. Very few UCC platforms generate significant revenue, and online
advertising is seen as the main future source. Yet it is unclear whether revenues will suffice
to maintain the increasing number of UCC platforms and whether users will appreciate
increased ads and commercialisation. Some video-sharing platforms are also scaling back
UCC in favour of traditional, professional content.
With respect to IPRs, the ease with which Internet content can be reproduced makes
UCC platforms particularly susceptible to copyright infringement. Encouraging
transformative content creation and greater openness and access while ensuring rights of
creators and fair use is an important issue. There are also questions regarding who retains
copyright over works created by users (see Annex Table 5.A1.1) as well as questions
concerning the copyright liability of UCC platforms (OECD, 2007).
With respect to illegal, defamatory and similar content, most UCC platforms
emphasise that they do not assume editorial responsibility for the content created,
although an increasing number of platforms and communities are adopting community
Table 5.8. UCC platform business models: Citizen journalism and photos
Citizen journalism: AgoraVox (France) AgoraVox is a European site supporting “citizen journalism” which is currently based on voluntaryin-kind contributions. Users submit news articles on a voluntary basis and the content is moderated by the small AgoraVox staff and volunteers. Readers also provide feedback on the reliability of the information. Despite its low-cost model, AgoraVox aims to generate revenue through online advertising. Similar citizen journalism sites such as OhmyNews in Korea remunerate their writers. OhmyNews redistributes advertising revenues to writers for highly rated articles. Readers also directly remunerate citizen journalists through a micro-payment system.
Photo: Flickr (United States) Flickr is funded from advertising and subscriptions. A free account provides the possibility to host a certain number of photos. Advertising is displayed while searching or viewing photos. This revenue is not shared with users. A subscription “pro” account for USD 24.95 offers unlimited storage, upload, bandwidth, permanent archiving and an ad-free service. Flickr is part of Yahoo! and thus enhances membership and traffic to other Yahoo! sites. Similar photo sites such as KodakGallery are owned by photography firms. Users can create free accounts and revenues are generated through various photo services (e.g. purchase of prints).
Source: Based on company information and press reports.
An
OE
CD
Bro
wo
L e c tur
ylnO dae
R
OECD INFORMATION TECHNOLOGY OUTLOOK 2008 – ISBN 978-92-64-05553-7 – © OECD 2008 261

5. DIGITAL CONTENT IN TRANSITION
se_it E ditin
es
eu
le
standards and associated rules on issues such as harassment, privacy and advertisement.
Age rating systems or age limits are seen as important to ensure protection of minors.14
Concerns relating to privacy and digital identity are mounting. Most UCC platforms collect
and use personal information relevant to the service and most reserve the right to transfer
personal information in the event of a transfer of ownership or sale of assets. Finally, with
increased interactivity and uploading of content from a large user base, the participative
Web is prone to information security risks.
Outlook
The popularity of UCC is likely to continue to grow and new drivers will further its
creation and use:
● The increasing use of mobile phones to watch and capture mobile UCC with higher
uplink data transmission speeds and other consumer devices allowing easier content
upload.
● New types of UCC around more interactive social networks, video-sharing sites and new
types of virtual worlds.
● New types of software and services for creation of content, including social networking
applications and personal profiles/digital identities, that work across different UCC
platforms.
● Economic incentives for users to create their own content, for instance by offering a
share of revenues generated through sales, advertising, or licensing to traditional media
outlets.
However, a number of issues need to be addressed: Copyright infringement often
involves disputes between copyright holders, UCC platforms and users. UCC platforms will
also have to address privacy concerns of users and regulators as popular platforms will
increasingly be victims of “phishing” and other attacks, making user data vulnerable.
Content quality, safety on the Internet and possibly better self-governance of users are
issues to be dealt with. Increased concentration of UCC platforms and the growing role of
gatekeepers will be continuing business and policy issues.
The impacts of UCC are wider than commercial applications and despite increased
attention to related business ventures, harnessing the participative web’s potential for
educational, political and social objectives has to remain a priority and will have major
impacts.
Film and video
The film and video market (i.e. filmed entertainment excluding TV) is composed of
cinema box office revenues, the sale of physical media such as DVD formats, the rental
market and online film distribution (OECD, 2008a).15 The most recent estimates suggest
that worldwide revenues of the film industries (excluding TV revenues) were roughly
USD 84 billion in 2007 (PwC, 2007), an increase of 3.8% compared to 2006 and roughly triple
revenues of the music or computer and video game industries.
Most of the total value of the film and video market is produced in only a few OECD
countries. In 2007, the United States accounted for over 40%, Europe for about 20%,
Australia, New Zealand, Asia/Pacific for about 20%, and Canada for about 7% (PwC, 2007).
Although Chinese and Indian film and video markets are large in terms of audiences and
An
OE
CD
Bro
wo
L e c tur
ylnO dae
R
OECD INFORMATION TECHNOLOGY OUTLOOK 2008 – ISBN 978-92-64-05553-7 – © OECD 2008262

5. DIGITAL CONTENT IN TRANSITION
se_it E ditin
es
eu
le
numbers of films produced, revenues are still a small fraction of global film and video
markets.
The filmed entertainment market in OECD countries is characterised by large
vertically integrated multinational conglomerates. With the exception of public
broadcasters, virtually every audio-visual media undertaking in the OECD area is now
wholly or partly owned by one or more of perhaps 50 conglomerates based mainly in eight
countries.16 All of the studio-owning conglomerates hold substantial interests in
commercial Internet operations (ISPs or major commercial portals): Time Warner owns
America Online (AOL); News Corporation includes Fox Interactive Media which owns
MySpace; others are involved in consumer electronics (e.g. Sony).
Relative to other media products, film production requires by far the largest initial
investment per unit, most of it high-risk. Average costs have soared over the past 20 years,
driven largely by the “blockbuster” phenomenon (an average USD 100 million per
Hollywood film, including marketing costs17). The film industry is spreading revenue flows
over a carefully timed and sequenced set of distribution windows: i) cinema box-office
markets, ii) television markets, iii) consumer markets (including home video sales and
rentals) iv) and increasingly online markets (including video services, interactive
television, and wireless digital content).
In many respects, the basic structure of the film industry has not changed significantly
in nearly 100 years despite rapid adoption of new technologies. However, digitisation has
had major impacts and the film and video value chain is already heavily digitised. It has
helped streamline the increasingly international production process (including digital
special effects) and enabled repeated exchange of content with no loss of technical quality.
The potential for Internet distribution of films is large. The adoption of broadband at
ever-faster speeds and the development of popular video-sharing platforms have helped
mainstream audiences embrace online video viewing. Furthermore, online distribution
encourages consumption of higher bandwidth products from broadband network
providers. Media conglomerates owning both film studios and Internet-based platforms
with large viewer bases (e.g. Internet portals such as AOL or social online networks such as
MySpace) are increasingly using this new window to release films and video.
Market developments
The film and video market continued to grow and changing user behaviour or online
piracy have not affected the film sector in the same way as the music industry. The film
and video industry has grown every year, except for 2005 which saw a fall of the market by
roughly 2.5%, reaching a high-point in 2007 of USD 84 billion (PwC, 2007). DVD sales
experienced strong growth for more than a decade, but the increase has been slower
since 2005; worldwide cinema box office receipts grew from USD 17 billion in 2001 to
USD 27 billion in 2007 with a fall in revenues only in 2005 (MPAA, 2008; EAO, 2007). The
major new innovation is the increasingly rapid introduction of digital cinema following the
development of industry standards and new financing mechanisms for the conversion of
existing cinemas to the digital format. This is revolutionising the technology at the filming
and projection stages of the value chain without fundamentally changing it. These
developments will have major effects on the film industry as it completes the digitisation
of the value chain.
An
OE
CD
Bro
wo
L e c tur
ylnO dae
R
OECD INFORMATION TECHNOLOGY OUTLOOK 2008 – ISBN 978-92-64-05553-7 – © OECD 2008 263

5. DIGITAL CONTENT IN TRANSITION
se_it E ditin
es
eu
le
Whereas a few years ago, film revenues of major studios were mainly generated by
cinema box office receipts, DVD (and negligible VHS) sales and rentals now make up more
than half of the major US studios’ revenues; cinema box-office receipts are around 20%.18
In Japan, the share of DVD sales revenues is larger than in the United States, and in western
Europe, box-office revenues take a larger share of total revenues. Figure 5.7 shows the size
and composition of the three biggest film markets in 2006, demonstrates the relative
importance of DVD sales, and the still relatively minor contribution of revenues from
online film distribution. The most common online business model for filmed
entertainment is still linked to rental or purchase of physical DVDs online, which are then
delivered via postal mail.
In 2006, film downloads in western Europe generated revenues of USD 25 million, a
small fraction compared to USD 9.4 billion in physical format (DVD) sales and less than
0.1% of total filmed entertainment revenue (Table 5.9). In the United States, online film
revenues were USD 23 million in 2006, a negligible amount when compared to DVD sales
and rentals and less than in western Europe. Other data sources put the revenue of
Japanese online movie ventures considerably higher at USD 292 million (2.2% of total
filmed entertainment revenues) (DCAJ, 2007); however, these figures include revenue from
the distribution of TV productions and animated films.
While online film revenues are expected to grow, projected values up to 2010 are still
relatively small (Table 5.9). For the EU14, the share of online movie downloads in total
revenue (excluding TV licensing) is expected to rise from 0.1% to 7% (Screen Digest et al.,
2007), equivalent to the share of online music distribution in many European countries
in 2006.
Figure 5.7. Major film market revenues, 2006 (excluding TV market)Million USD
1 2 http://dx.doi.org/10.1787/475834060040
Notes: The three regional or country entities do not necessarily use the same data definitions, and expenditures incertain categories across countries/regions are not directly comparable. Online film distribution in Japan, forinstance, includes revenues generated from distribution over the Internet of TV series and animated films.EU14 comprises Austria, Belgium, Denmark, Finland, France, Germany, Greece, Ireland, Italy, Netherlands, Portugal,Spain, Sweden, and the United Kingdom.
Sources: Based on Digital Entertainment Group, 2007; Screen Digest et al., 2007; European Audiovisual Observatory,2007; Digital Content Association of Japan, 2007.
25 000
20 000
15 000
10 000
5 000
0
24 100
9 353
6 059
9 490
7 026
1 73623 25 292
United States EU14 Japan
DVD sales and rental Box office revenues Online film
An
OE
CD
Bro
wo
L e c tur
ylnO dae
R
OECD INFORMATION TECHNOLOGY OUTLOOK 2008 – ISBN 978-92-64-05553-7 – © OECD 2008264

5. DIGITAL CONTENT IN TRANSITION
se_it E ditin
es
eu
le
Despite the initially slow uptake, the number of online film suppliers is increasing. In
Europe, the number of Internet sites providing Video-on-Demand (VoD) doubled in 2007
with France, Germany, the Netherlands, and Spain leading (NPA Conseil, 2008). The
majority of sites aim at specific national markets, and no European video provider offers
access to the rich library of films of various European countries. Cross-border services are
limited to markets with shared languages, e.g. SF Anytime in the Nordic countries;
in2movies in Austria, Germany and Switzerland. Online film services and video-sharing
sites have also created a strong demand for new video software and services (i.e. video
hosting, editing and delivery). Firms such as VideoEgg provide video tools and advertising
features for online video providers and Web application developers.
Online business models
There are four principal online film business models; examples are provided in
Table 5.10:
● Rental downloads (R): The film is downloaded for a specified period of time (DRM disables
playback beyond the agreed rental period, allowed storage and viewing periods differ).
Prices range from USD 1-4. Download rentals are on average comparable or cheaper than
DVD rentals, but the period of use is shorter. Many DVD rental firms offer up to 30 days
possession with unlimited plays for under USD 6.
● Purchase downloads (P): The purchased movie is delivered online, like the established DVD
sell-through model. The range of prices for online purchases varies from USD 10 to
USD 40 depending on the type of product and country. Generally, prices are comparable
to or even slightly cheaper than offline forms of distribution. But content portability is
often restricted.
● Subscription downloads (S): This model allows consumers to access a range of titles on a
monthly or yearly basis for a single subscription fee. DRM technologies prevent the film
from being watched once a subscription expires. Transfer to other devices is mostly
restricted or impossible. “Triple play” Internet providers have recently added unlimited
VoD offers to their broadband subscriptions (e.g. Free in France). Prices vary according to
the package, but one of the market leaders, CinemaNow, has a USD 30 monthly
subscription; Maxdome in Germany offers a monthly EUR 10 subscription. Depending
upon frequency of use, these prices may be a considerable bargain over DVD and cable.
● Advertising-based (A): Initially, this business model applied to independent and low-
budget productions only; examples include platforms such as Joost and Guba. But major
studio productions and recent TV productions can increasingly be viewed online for free.
Gyao, a Japanese Internet portal backed by the Usen Group, streams a limited catalogue
of older studio content; Hulu, an Internet portal backed by NBC Universal and News
Table 5.9. Actual and projected online cinema product revenue, 2004-10 USD millions
2004 2005 2006 2008p 2010p
United States 9.5 11.8 22.9 455 1 975
EU14 1.8 3.7 24.6 269 1 356
1 2 http://dx.doi.org/10.1787/477784320845
Note: EU14 comprises Austria, Belgium, Denmark, Finland, France, Germany, Greece, Ireland, Italy, Netherlands,Portugal, Spain, Sweden, United Kingdom.Source: Screen Digest et al., 2007.
An
OE
CD
Bro
wo
L e c tur
ylnO dae
R
OECD INFORMATION TECHNOLOGY OUTLOOK 2008 – ISBN 978-92-64-05553-7 – © OECD 2008 265

5. DIGITAL CONTENT IN TRANSITION
se_it E ditin
es
eu
le
Corp., streams feature films and TV shows in North America; Paramount and MTV were
the first major studios to launch a movie, “Jackass 2.5”, for unpaid streaming on the
Internet before switching to DVD sales.
Around one third o f European VoD serv ices are operated by ISPs and
telecommunications operators. Telecom Italia, France Telecom and Deutsche Telekom are
prominent suppliers in different European markets (NPA Conseil, 2008). These services are
usually bundled with broadband subscriptions and accessible to subscribers only.
Broadcasters, content producers, and non-media companies increasingly offer
download services. Amazon’s digital video download service was launched in
September 2006 exclusively for the United States market; other general and specialised
retailers (e.g. Fnac) distribute films online; Apple iTunes launched film downloads for the
United States market in 2007 and film rentals in 2008; Microsoft’s Live Marketplace is
developing a popular video rental and purchase location for owners of the Xbox 360 game
console (Screen Digest, 2007). However, overall even major Internet market participants
have difficulties offering a rich film catalogue and mostly target the United States market.
Given bandwidth constraints and the fact that the current infrastructure may be
unable to deal with the increasing volume of video content (especially high-definition
content), the distribution of films over peer-to-peer networks is an alternative and is being
Table 5.10. Online full-feature film providers, selected examples from OECD countries, January 2008
Provider Cost R P S A Service
Amazon Unbox (United States)
Rental: from USD 0.99; Purchase: from USD 1.50 (around USD 10 for newer releases)
♦ ♦ > 4 000 films; rentals are available for 30 days with a 24-hour viewing period; viewing on PC, portable device (PlaysForSure), or TiVo
Apple iTunes (United States)
Rental: from USD 2.99; Purchase: USD 10-15
♦ ♦ > 500 films, including high-definition content; rentals are available for 30 days with a 24-hour viewing period; playable on PC, Mac, iPod, iPhone, TV (via AppleTV)
BitTorrent, Inc. (United States)
Rental: from USD 0.99; Purchase: from USD 2.99 (around USD 10 for newer releases)
♦ ♦ Around 2 000 films, including shorts and user content; peer-to-peer based, PC only; burn option for backup only, not viewable on DVD playback devices; major studio productions for United States use only
CinemaNow (United States)
Subscription: USD 29.95/month, USD 99.95/year; individual purchase: USD 9.99
♦ ♦ > 900 films, for viewing on PC only; service available in Japan
Glowria (France) Rental: from EUR 0.99 ♦ Glowria services a number of French VoD providers, e.g. Canal Play; > 1 000 films; PC or IPTV via “triple play” broadband subscriptions; language choice available
Gyao (Japan) Free ♦ > 100 films; free, advertising-based streaming of films, TV series, etc.
Jaman (United States)
Rental: from USD 1.99;purchase from USD 4.99
♦ ♦ > 900 films; rentals are viewable for seven days; peer-to-peer based, playable on PC, Mac, TV; eased geographic access conditions
Lovefilm (United Kingdom)
Rental: from GBP 2.99; purchase: from GBP 9.99
♦ ♦ > 500 films; PC and portable (PlaysForSure); bundles with physical DVD available
Maxdome (Germany)
Rental: from EUR 0.99 subscription: EUR 9.99/month;
♦ ♦ > 800 films, viewing on PC or TV via set-top box; no purchase option
MovieFlix (United States)
Subscription: USD 9.99/month ♦ Around 1 500 films, including shorts, documentaries and free content; RealPlayer compatible
SF Anytime (Sweden)
Rental: from EUR 1 ♦ > 800 films; available in Denmark, Finland, Norway, Sweden; PC and IPTV
Note: Rental downloads (R), Purchase downloads (P), Subscription downloads (S), Advertising-based (A).
An
OE
CD
Bro
wo
L e c tur
ylnO dae
R
OECD INFORMATION TECHNOLOGY OUTLOOK 2008 – ISBN 978-92-64-05553-7 – © OECD 2008266

5. DIGITAL CONTENT IN TRANSITION
se_it E ditin
es
eu
le
trialled by BitTorrent, Jaman, Vuze, Guba, Joost, etc. (OECD, 2004; de Fontenay et al., 2008).
However, despite the potential distribution cost savings, peer-to-peer distribution of
licensed online content has not yet taken off.
Challenges
The film industry still performs well with existing business models via its strategy of
release windows. The slow appearance of online distribution may be due to difficult rights
negotiations or the hesitancy of right holders to make new films available online out of
concerns about online piracy and so as not to reduce box office and DVD sales or threaten
existing exclusive arrangements, e.g. with cable and TV providers, often part of the same
conglomerate.
Apart from these business considerations, technical obstacles remain. The benchmark
in terms of image and sound quality set by digital cinema, (HD) DVDs, and home cinema
equipment is very high. Current broadband speeds and compression techniques often do
not meet such quality standards. The demand for film content for portable devices is still
low. Many value-added features of DVD packages (additional content, interactive features,
language tracks) are not part of Internet downloads, and usage restrictions are less
attractive.
On the demand side, although watching videos online is increasingly popular,
consumers have not replaced TV or DVDs with online movie consumption. It appears,
however, that Internet business models are now competitive in terms of price both with
offline distribution methods and with e-commerce DVD rentals and sales. The remaining
problems are limited catalogues and the geographic market segmentation which dominate
Internet distribution. More extensive film catalogues over a single platform covering film
of different origin (including European and Asian productions) would be a competitive
advantage.
A major step towards increasing consumer uptake will be the removal of technological
hurdles to online film downloads. First, the lack of interoperability between operating
systems and media playing software limits the hardware that can be used to watch films.
Many online content platforms use proprietary formats for streaming and/or file
downloads. The user is “locked in” to a provider’s software, a concept similar to the
“walled-garden” set-top VoD systems. Second, although several of the major online
download services provide an interface to enhance home entertainment set-ups, the
process is never as straightforward as playing a DVD. Nevertheless, this is changing as
games consoles and set-top boxes such as Vudu, TiVo, and Apple TV offer better viewing
environments.
Outlook
Growing broadband speeds and the transition to fibre, the increased availability of
online film content with more favourable access conditions, solutions for streaming
content onto televisions, and the emergence of high-definition digital films and digital
cinema will underpin growth of online film markets. Given the increased prevalence of
triple play broadband services, it is very likely that, at least in Europe, online VoD services
will be part of these services and peer-to-peer services are likely to expand.
In the future, falling revenue or a rise in online piracy may increase the emphasis on
online downloads and changes in release windows. Slow growth in DVD sales in 2007 and
An
OE
CD
Bro
wo
L e c tur
ylnO dae
R
OECD INFORMATION TECHNOLOGY OUTLOOK 2008 – ISBN 978-92-64-05553-7 – © OECD 2008 267

5. DIGITAL CONTENT IN TRANSITION
se_it E ditin
es
eu
le
lower than expected sales of high-definition DVDs – initially largely owing to competing
standards (Toshiba’s HD DVD and Sony’s Blu-ray) – are also factors that could favour online
services. Furthermore, while the film industry has so far not suffered major effects from
Internet-based piracy, unauthorised access to films is increasing, often before their official
release dates.
The Internet may also encourage film writers and producers to engage in online
production and distribution. Eventually, the online environment and social networks may
develop commercial potential from entirely new interactive relationships between film
viewers and publishers.
Music
Market developments
Online music distribution has grown rapidly since 2004 and has become a significant
market with a rich catalogue (OECD, 2005a, 2006a). Digital music sales (defined as online and
mobile music downloads) were close to USD 5 billion in 2007 (from near-zero revenues
before 2002) with about 500 online music services in over 40 countries (IFPI, 2007, 2008).
In 2007, digital music sales accounted for 16% of the world market (Table 5.11). In countries
with a more developed “wireless access culture” downloading of music to portable devices
dominates. The move to online music reflects strong consumer demand and there are various
online distribution models for streaming and downloading of music, with newer approaches
such as advertising-supported services. Other broadband-based business models such as
Internet radio are helping to generate music industry revenues and are also developing rapidly.
Online distribution of singles is the largest part of music downloads. It accounts for
over 80% of worldwide single sales, physical and digital, and in the United States, Canada,
and Korea it has replaced physical single sales (IFPI, 2007). Although single music tracks are
Table 5.11. Evolution of digital music sales and yearly per capita music spending, selected countries, 2006
Total digital sales (incl. mobile music)
USD millions
Mobile music sales USD millions
Digital as % of total sales
Per capita digital sales
USD
Per capita total sales (physical + digital)
USD
United States 1 849 754 16 9 58
Japan 778 709 15 9 62
United Kingdom 201 82 6 5 82
Korea 151 78 61 4 7
France 128 88 8 3 43
Germany 117 54 6 2 38
Canada 51 25 7 2 32
Italy 41 27 7 1 15
Australia 37 20 6 3 45
Spain 32 27 7 1 17
Mexico 17 17 5 0 6
Belgium 16 9 5 2 48
Sweden 14 8 6 2 39
Austria 13 10 5 2 48
Netherlands 13 3 3 1 36
1 2 http://dx.doi.org/10.1787/477808587873
Source: Calculations based on data obtained from IFPI. Per capita calculations are based on OECD population figuresfor the age group 15-64 years. Figures are rounded.
An
OE
CD
Bro
wo
L e c tur
ylnO dae
R
OECD INFORMATION TECHNOLOGY OUTLOOK 2008 – ISBN 978-92-64-05553-7 – © OECD 2008268

5. DIGITAL CONTENT IN TRANSITION
se_it E ditin
es
eu
le
the biggest part of online music downloads, album downloads are gaining in popularity,
reflected in increasing ratios of album versus single-track downloads.
Despite fast take-up, digital music sales have not (yet) made up for losses on physical
unit sales or reversed the trend of revenue decline in the music industry after rapid CD-led
growth peaked in 1995 (see Figure 5.8). In 2007, worldwide music sales amounted to
USD 30 billion, down by 6% from 2006. The United States, Canada, Australia and most
European countries have seen music sales decline by around 10% or more, but they
increased in a few countries such as Korea.
In most countries for which data are available, per capita revenues from digital music
downloads are still modest: less than USD 10 per capita is spent annually in the population
aged 15 to 64 (see last two columns of Table 5.11). However, with more digital music
available online, the rise of generations that rely predominantly on music in digital format
and on portable music players is set to evolve quickly. Therefore new business models are
likely to lead to rising revenues in this area.
The advent of digital music has also driven revenue and growth in sectors other than
the music industry (OECD, 2005a). It has been a driver for broadband uptake and use and
has benefited ISPs. It also continues to boost global technology markets: consumer
electronics manufacturers, PC and hard drive vendors. Revenue from MP3 players grew by
37% in 2007 in the United States market alone.19 Finally, the online music business has led
to new businesses. Contrary to earlier expectations, distribution of digital music is
complex and far from costless. The creation of an online music store requires content
creation and production, the digitisation of content, the clearing of rights, the creation of
online music storefronts, secure billing systems and new digital intermediaries (e.g. digital
rights clearance, software such as the Windows DRM, online billing). Real Networks is an
example of a business centred on distribution of digital content (including sales,
streaming, and hosting of music and filmed content), mobile distribution and DRM
solutions.
Figure 5.8. Value of global music sales, 1984-2007Current USD billions
1 2 http://dx.doi.org/10.1787/475848812102
Source: Based on IFPI data and updated from OECD (2005a).
40
35
30
25
20
15
10
1984
1985
1986
1987
1988
1989
1990
1991
1992
1993
1994
1995
1996
1997
1998
1999
2000
2001
2002
2003
2004
2005
2006
2007
An
OE
CD
Bro
wo
L e c tur
ylnO dae
R
OECD INFORMATION TECHNOLOGY OUTLOOK 2008 – ISBN 978-92-64-05553-7 – © OECD 2008 269

5. DIGITAL CONTENT IN TRANSITION
se_it E ditin
es
eu
le
Online business models
New business models are mainly built around digital download and streaming
subscription models, although portable subscriptions, online music bundled with
subscriptions by ISPs and advertising based-business models are also developing. However,
most online music sales still rely on pay-per-track or pay-per-album download models.
There are three online music business models:
● Digital download: The pay-per-track business model is dominated by a few firms, which
are not directly linked to the music industry, but which generate revenues from the sale
of portable music players or have an interest in setting software standards (e.g. Apple,
Microsoft). They have been joined by retailers such as Amazon and Wal-Mart as well as
ISPs offering music download services. While globally the number of online music stores
is growing, the supply side is consolidating as many new online music stores cannot
generate enough revenue, especially those that rely exclusively on music and are not
affiliated with an existing business; they either close (Virgin Digital in the United
Kingdom) or are merged (MTV Urge into Real’s Rhapsody). The market leader iTunes
Store (70% of paid music downloads, cf. NPD Group, 2007) has simplified music
downloading using a unique-pricing model: USD 0.99 per song and USD 9.99 per album.
This lead is being challenged by competitors with comparable catalogues and DRM-free
sales as well as cheaper offers from retailers such as Amazon and Wal-Mart.
● Subscription: Subscription-based business models with monthly prices starting from less
than USD 10 have the potential to generate significantly more revenue than digital
download music services (OECD, 2005a). With a large subscriber base, subscription
revenues could easily generate more revenue than traditional offline music. For
instance, in 2006 the country with the highest yearly per capita music consumption, the
United Kingdom, still only generated a monthly average of USD 7 per person in total
music revenues (offline and online). For other countries this average is far less (e.g. in
Korea and Mexico an average of less than USD 1 per month per person).
Various online music subscription models exist: streaming an unlimited amount of
music to the computer (e.g. Yahoo! offers unlimited basic access for a monthly minimum
fee of USD 9 a month) or downloading songs to portable devices (e.g. Napster and
Rhapsody “To go” for USD 15 a month); monthly subscriptions to download a set number
of songs (e.g. EUR 12.99 a month for 30 downloads on the European eMusic store); music
services for a given portable device, e.g. Microsoft Zune at USD 14.99 a month. However,
in 2007 there was still relatively low market penetration and slow growth for music
subscription services. Existing music subscription services are developing mobile access
services and are increasing compatibility with existing hardware to allow portability of
content.
Services can also be bundled into existing subscriptions and new forms of online music
subscriptions have emerged, e.g. ISPs that sell unlimited music downloads or streaming
as part of their triple play packages (Internet, voice and TV). The French ISP Neuf offers
free unlimited music downloads in one music genre to its triple play subscribers, and a
complete music subscription to all music genres is available for EUR 4.99 a month
(including to non-subscribers and for transfer to portable players).
● Advertisement-based business models are being tested but have not yet widely developed.
Deezer.com, for instance, offers free on-demand streaming beyond the United States
and Canada and remunerates the creation of music (artists, record companies, etc.)
An
OE
CD
Bro
wo
L e c tur
ylnO dae
R
OECD INFORMATION TECHNOLOGY OUTLOOK 2008 – ISBN 978-92-64-05553-7 – © OECD 2008270

5. DIGITAL CONTENT IN TRANSITION
se_it E ditin
es
eu
le
through revenues generated by advertising. Free music is being provided through
authorised peer-to-peer downloads (e.g. iMesh, which offers DRM-protected file sharing)
and communities such as Last.fm, MySpace, MOG, and Imeem, which connect people
through their tastes in music and allow for new ways of exploring available music. Social
networking activities are thus becoming more attractive to advertisers and marketers.
Challenges
A major challenge for the development of online music markets is to reduce online
piracy and develop business models that are attractive to consumers and provide revenue
streams from the creation and legitimate distribution of original recordings.
Online music markets currently face many hurdles for becoming major revenue
drivers. Barriers to development include the lack of an industry standard (music format
and DRM standards), incompatibilities between content and playing devices, differing and
hard-to-understand usage rights, difficulties associated with securing distribution rights,
and cumbersome licensing processes for different national territories (e.g. for a pan-European
release).
Beyond these issues, it will be important to devise revenue models which remunerate
artists and content right holders fairly. Online music sales at USD 0.99 per song, with usage
restrictions and in a proprietary format, marked a turnaround and is providing new music
industry revenue flows. Yet, it is unclear whether this will be a viable long-term business
model for artists and the music industry. Artists currently earn about 10% of each track
sold on popular online music stores (i.e. roughly EUR 0.10). While this is about the same
share in overall revenues as most artists achieve in the offline model (OECD, 2005a), it may
not prove to be a viable revenue model in a market still dominated by single-track
downloads. Increasing the price of online music at this point is however a risky strategy
that may alienate new online music consumers.
Outlook
Online distribution of music will most likely adopt Internet-specific business models
to cater to user habits and expectations. Shifts away from the traditional pay-per-album or
more recent pay-per-track (with usage restrictions) business models are likely to be
coupled with models with greater flexibility (i.e. without DRM) or in universally compatible
formats. New forms of bundling music into existing or new subscriptions and
advertisement-based business models will continue to develop and achieve greater market
penetration. Social networks will play an increasing role in the discovery of artists and the
purchase of music; some are offering ad-supported content or developing partnerships
with mobile music providers.
Music will increasingly be used to promote other brands or to federate users around
products or services. A new trend may be the purchase of music labels by ISPs, search
engines, online advertisers or even consumer product companies. Korea’s SK Telecom has
purchased the country’s biggest music label (YBM Seoul Records), its service MelOn offers
a USD 4.50 monthly subscription, which lets users stream for free on their PC and to
download tracks onto mobile handsets. The impact of this “commodisation of music” on
artists and music creation, i.e. free advertising-supported music or full music catalogues
bundled into existing subscriptions, is far from clear.
An
OE
CD
Bro
wo
L e c tur
ylnO dae
R
OECD INFORMATION TECHNOLOGY OUTLOOK 2008 – ISBN 978-92-64-05553-7 – © OECD 2008 271

5. DIGITAL CONTENT IN TRANSITION
se_it E ditin
es
eu
le
Direct sales from artists to consumers without the involvement of record labels are
still rare although some independent artists are achieving visibility from Internet marketing
and distribution (e.g. through sites such as Indiestore.com, SellABand.com), a trend that is
likely to continue. New approaches (e.g. well-known artists leaving record labels to derive
revenues solely from concerts and merchandising or popular artists giving away new albums)
may lead to new business models and even greater reorganisation of the value chain.
The downloading of mobile music (including ringtones) is growing fast from low levels
in most OECD countries. This is fuelled by an increase in mobile broadband subscriptions
(in Japan and Korea growth rates are lower owing to earlier growth). Partnerships such as
that between AT&T and Napster to offer pay-per-track or music packages will increase
mobile music use as will Nokia’s plans to offer unlimited music downloads to mobile
phones with the music label Universal Music Group.
Advertising
Advertising is an important driver of free content services and content offered to
consumers in newspapers, radio or broadcasting. In this two-sided market, publishers are
often willing to subsidise one group (usually consumers), in order to have a large enough
audience to attract the other (usually advertisers).
The global advertising industry had revenues of some USD 445 billion in 2007
(ZenithOptimedia, 2007; PwC 2007). The United States and Canada account for over 40% of
global advertising spending, but the region’s share has been declining as advertising
markets in the Middle East, Asia, and Central and Eastern Europe are growing fast.
Throughout the 1980s the advertising market experienced a wave of mergers and
acquisitions after which it became highly concentrated and dominated by a few global
holding companies (GHCs) which controlled large numbers of agencies and were capable of
providing all ad-related services, although individual value chain activities remain distinct
(OECD, 2008b). Today the creation, placement and media purchasing services for most
medium to large advertising campaigns are provided by vertically integrated GHCs,
e.g. Omnicom, WPP, Interpublic, and Publicis Groupe, each of which controls various
marketing services, advertising and media agencies.20 These GHCs thus intermediate
between advertisers, content publishers and the consumer. There are also numerous mid-
sized holding companies, e.g. Havas, Aegis, Dentsu and Hakuhodo DY, and small businesses
that specialise in one or more of these value-adding steps or in direct marketing services.
Market developments
Increasing broadband penetration and e-commerce, the increasing power of online
transactional platforms and tracking technologies, as well as changes in consumers’
behaviour and Internet use have fuelled investment in online advertising and allowed for
a steady supply of funds. Broadband in particular has amplified the Internet’s media
substitution effect, and trends in various OECD countries indicate that young people in
particular increasingly replace traditional media consumption with Internet usage. Around
70% of Korean Internet users access traditional media on the Internet, with newspaper,
films and television content leading the field (NIDA, 2007b). At least 30% of US online users
consumed less televised content, newspapers and magazines in 2006 (WAN, 2007), and 26%
of Canadian Internet users are reported to watch less television, a rate that is slightly
higher in the United Kingdom, Italy, Germany, and is valid for more than 50% of Internet
users in France (Ofcom, 2007).
An
OE
CD
Bro
wo
L e c tur
ylnO dae
R
OECD INFORMATION TECHNOLOGY OUTLOOK 2008 – ISBN 978-92-64-05553-7 – © OECD 2008272

5. DIGITAL CONTENT IN TRANSITION
se_it E ditin
es
eu
le
Online advertising was estimated at USD 31 billion in 2007, still a relatively small
segment of the advertising industry (around 7%). However, online advertising growth
outperformed overall growth by a factor of five in 2007. It contributed significantly to
overall industry growth: the USD 7 billion increase in 2007 represents over 30% of
worldwide advertising growth (USD 22 billion). In general, online advertising has seen
double-digit growth for the past ten years, with a significant drop after the “dot.com”
bubble and a recovery since 2003 with growth rates of around 30%, although they are slowly
declining (Figure 5.9). The online sector has already surpassed cinema and outdoor
Figure 5.9. Growth of worldwide advertising spendingTotal values in USD billion (left scale); yearly growth in percentages (right scale)
1 2 http://dx.doi.org/10.1787/476047040383Note: 2008 and 2009 figures represent forecasts.
Source: Based on ZenithOptimedia, 2007.
Figure 5.10. Worldwide shares of advertising expenditure by mediumAs a percentage of total advertising spending
1 2 http://dx.doi.org/10.1787/476126875742Note: 2008 and 2009 shares are forecasts.
Source: Based on ZenithOptimedia, 2007.
2005 2006 2007 2008p 2009p
%600
500
400
300
200
100
0
35
30
25
20
15
10
5
0
Overall ad. spending growthOverall ad. spending Internet ad. spending growth
%
45
40
35
30
25
20
15
10
5
0
Telev
ision
New
spap
ers
Mag
azine
s
Rad
io
Outdoor
Inter
net
Cine
ma
2005 2006 2007 2008p 2009p
An
OE
CD
Bro
wo
L e c tur
ylnO dae
R
OECD INFORMATION TECHNOLOGY OUTLOOK 2008 – ISBN 978-92-64-05553-7 – © OECD 2008 273

5. DIGITAL CONTENT IN TRANSITION
se_it E ditin
es
eu
le
advertising revenues and is expected to surpass radio advertising revenues in 2008
(Figure 5.10) (ZenithOptimedia, 2007). However, it is not expected to break through the 10%
barrier globally before 2009 (Fitch Ratings, 2006)
Online advertising activity is also high in individual OECD countries. Expenditures in
Canada, for example, are estimated to have grown by approximately 80% in 2006 to
CAD 1.01 billion and to increase by a further 32% in 2007, making it one of the fastest
growing markets for online advertising (Interactive Advertising Bureau Canada, 2007).
The United Kingdom, Norway and Sweden have the highest shares of domestic online
advertising revenues worldwide, all surpassing 10%. In 2006, online advertising in Korea
grew by an estimated 34% to reach 12.2% of the total domestic advertising market
(NIDA, 2007c).
Online advertisers have begun to move into the traditional domains of GHCs. The
main providers are Google and Yahoo!, with 17% and 16%, respectively, of the United States
online advertising market in 2006, followed by AOL (8%) and MSN (7%).21 These new
entrants offer affordable advertising to small- and medium-sized businesses and reach
consumers that are beyond the mainstream targets of advertising. Their customer base is
very large. For example, WPP, the world’s largest media buyer, is reportedly Google’s largest
single customer, but it represents a very small portion of Google’s revenues (only 1.5% of its
search advertising revenues) (Mandese, 2007).
A major advantage of online advertising is the capacity to track a user’s behaviour over
time, allowing for more accurate, effective and efficient targeting. Targeting and pay-per-
click models seem to be giving online advertising a considerable advantage by reducing
ineffective advertising budgets and securing enhanced levels of engagement from
recipients by tracking responses to ads placed; they charge advertisers only when
consumers react to advertising by taking measurable action (performance-based
advertising). Behavioural targeting allows an unusual level of precision in identifying a
potential consumer and his/her likelihood to purchase products. EMarketer estimate that
USD 1.2 billion is going into behaviourally targeted advertising in the United States; it
estimates that the number will almost double to USD 2.1 billion in 2008 (EMarketer, 2006).22
Beyond the move of new online entrants into the traditional domains of media buying
companies, other areas are also beginning to experience competitive pressure. The entry of
new high-traffic user-created content sites, notably MySpace and YouTube, means that
advertisers can turn to other suppliers. Low entry barriers for creators and dramatically
reduced transaction costs for advertisers are slowly creating a long tail of small content
producers that are capable of participating in the advertising industry and of competing
with GHCs.
Cumulatively, these transformations are driving convergence of offline and online
advertising platforms and disintermediation in the demand, creation and allocation of
advertising. However, the biggest online advertising platforms produce almost no ad
content. Unlike GHCs or most traditional offline advertising platforms, search engines by
and large neither create advertising campaigns nor produce or contract out the production
of any content destined to be paired with advertising.
An
OE
CD
Bro
wo
L e c tur
ylnO dae
R
OECD INFORMATION TECHNOLOGY OUTLOOK 2008 – ISBN 978-92-64-05553-7 – © OECD 2008274

5. DIGITAL CONTENT IN TRANSITION
se_it E ditin
es
eu
le
Online business models
There are five main types of online advertising:
● Search ads involve advertisers bidding on keywords that affect the position of their text
ads on the user’s results page.
● Display ads tend to be static or hyperlinked banners for which an advertiser pays an
online company in order to appear on one of its pages.
● Classified ads are listings of certain products or services on a web page, e.g. eBay’s
gumtree.com.
● E-mail advertising consists of ads delivered through any type of electronic mail.
● Referrals are a method by which advertisers pay fees to online companies that refer
purchase requests or provide customer information.
Search ads are the most popular form of online advertising, mostly due to the
dominance of search engines as entry portals for Internet users. In the United States, the
USD 17 billion online advertising market was led by search ads in 2006, followed by display
ads and referrals. While most western European countries display similar shares, Japan
and Korea show much higher shares of mobile advertising owing to their advanced mobile
broadband usage (NIDA, 2007c).
Pricing for online advertising initially mirrored traditional pricing models (see Box 5.1);
roughly 50% of online advertising is charged at cost-per-thousand-impressions (CPM), a
reflection of traditional publishing in which advertising rates are determined by circulation
(PwC/IAB, 2007). While this form of pricing means less risk for publishers, it fails to exploit
the Internet’s possibilities for performance tracking. Consequently, performance-based
pricing is gaining importance, including cost-per-click (CPC) and cost-per-action (CPA)
models. These models depend on measuring exposure to advertising in terms of
occurrence and time as well as tracking user actions across Websites.
Box 5.1. Prevalent pricing models in online advertising
Cost-per-thousand-views/impressions (CPM). In this pricing model every time an ad isdisplayed the publisher is entitled to receive revenue. The CPM model is usually preferredby publishers since it involves little financial risk. Online advertising rates average USD 3-5 CPM for bulk ads. However, prices vary widely depending on format, accuracy and targetaudience. Dynamic video-game advertising rates, for example, typically resemble cable TVrates; IGA, a popular game producer, currently charges USD 25-40 CPM (Snyder Bulik, 2006).
Cost-per-click (CPC). A performance-based model, the CPC model requires users to click onan ad in order to generate revenue for publishers. Performance-based models are favouredby advertisers since they provide a higher return on Investment. In the case of search ads,advertisers bid for keywords to which their ad is associated. Prices can range fromUSD 0.01 to over USD 5 per click to be associated with the search term “Internet marketing”on Google’s AdWords.
Cost-per-action (CPA). A performance-based model, CPA does not generate revenue for thepublisher each time the ad is displayed but when a user takes an action which actuallybenefits the advertiser, such as purchasing online, registering, etc. (Fitch Ratings, 2006).Advertisers tend to prefer this model since it gives them a better return on investment.
Source: Adapted from PwC/IAB, 2007.
An
OE
CD
Bro
wo
L e c tur
ylnO dae
R
OECD INFORMATION TECHNOLOGY OUTLOOK 2008 – ISBN 978-92-64-05553-7 – © OECD 2008 275

5. DIGITAL CONTENT IN TRANSITION
se_it E ditin
es
eu
le
Search advertising
Marketing revenues through search grew to USD 5.1 billion for the first half of 2008 in
the United States alone (PwC/IAB, 2008). Google reported advertising revenues of close to
USD 17 billion in 2007, which accounts for virtually all of its revenues (the figure also
includes revenues from advertising activities other than search). Naver dominates Korean
searches with a 75% market share in 2006, followed by Daum and Yahoo! (NIDA, 2007c).
Several forms of paid search may appear on these and similar Websites:
Paid listings. An advertiser is guaranteed the ad will appear high on a user’s search
results page. The ad is usually related to certain keywords and payment is usually on a pay-
per-click (CPC) model. By auctioning multiple ad spaces for specific searches, search
engines assign the most desirable space to the advertisers willing to pay the most.23
Contextual search. Ads are placed on content pages contextually related to the ad rather
than on the results page of a search engine and uses a pay-per-click model. The two leading
companies in this area are Google and Overture (now part of Yahoo! Search Marketing).
Most online publishers easily allow advertising intermediaries to place relevant ads on
their sites and thus automatically share a percentage of the profits with these
intermediaries.
Paid inclusion. Advertisers pay a fee to have their Websites included in the search
engine’s search results.24 Payment is usually by fixed fee per URL (for small web pages) or
by cost-per-click (for large web pages).
Challenges
Hopes surrounding the potential of online advertising to support Internet-based
businesses are enormous. In early 2008, online advertising was seen as the new business
model for any web platform in search of a source of income, especially for entertainment
content. These hopes are sometimes augmented by the fact that it has been difficult to
develop other revenue streams (e.g. subscriptions or pay-per-play). While behavioural
advertising promises even greater efficiency, it remains to be seen whether the technology
will be developed and whether consumers will tolerate intrusive advertising.
Other challenges relate to market structure and competition, privacy and security, and
click fraud.
Market structure and competition: While the online advertising industry is relatively
young and very innovative, it is also highly concentrated. Tracking networks have strong
incentives to increase the number of clients and tracking posts, and clients (publishers and
advertisers) have equally strong incentives to belong to the largest tracking network in
order to better predict the online behaviour of their potential consumers. Information
about consumers tends to be aggregated in fewer hands and this raises potential issues for
privacy and competition. A very few commercial entities dominate online advertising,
especially in the area of search; the trend seems to be towards further concentration, and
recent mergers are being reviewed. In addition, advertisement-funded search engines may
have a significant influence on structuring access to the Internet and its information
sources.
Privacy concerns and security: While generating efficiencies, the technologies that
facilitate the collection, aggregation and analysis of enormous quantities of consumer data
and preferences also raise serious challenges to the privacy and security of Internet users,
particularly in the case of behavioural advertising. In the presence of booming online data
An
OE
CD
Bro
wo
L e c tur
ylnO dae
R
OECD INFORMATION TECHNOLOGY OUTLOOK 2008 – ISBN 978-92-64-05553-7 – © OECD 2008276

5. DIGITAL CONTENT IN TRANSITION
se_it E ditin
es
eu
le
gathering activities and increased demand for consumer profiling, marketers may be less
likely to invest as heavily in protecting the information gathered through tracking
networks as others with different incentives (e.g. consumers and governments) would like.
Breaches in security are often hard to identify. Even supposedly anonymous search queries
and data-saving activities have been shown to lead potentially to the identification of users
(Barbaro and Zeller, 2006).
Online advertising fraud: The flexibility that allows almost unrestricted entry into ad-
supported publishing has also meant an increase in undesirable activity, such as the
proliferation of spam blogs (“splogs” or, more general, impression fraud). Designed to
pass off as relevant sites, splogs mostly provide only a deceiving front intended to boost
ad impressions or attract clicks and inflate the publisher’s ad-related revenue from CPM.
Click fraud relates to organised networks that pay private individuals to click on
hyperlinks in e-mails or on pages that compile advertisements priced using CPC models
(“Paid to read”); these fake clicks are estimated at about 10-15% of all advertisement clicks
(Grow and Elgin, 2006).
Outlook
Online advertising is increasingly at the core of the evolution of the Internet economy.
Although it has grown rapidly, online advertising budgets still represent less than 10% of
total advertising spending. Growth in online advertising is expected to slow and already is
at the expense of advertising budgets for traditional channels. At some point, advertisers
will expect to reap the benefits of more efficient online advertising and be able to reduce
growth in online advertising budgets. However, new tracking technologies, more time
spent online and other drivers can be expected to sustain online advertising growth.
Video advertising, in-game advertising, and mobile advertising are likely to grow
rapidly. In Korea, 3G mobile broadband advertisements already had revenues of around
USD 80 million in 2006 (NIDA, 2006). New network-ready games consoles open markets
previously precluded for lack of connectivity, e.g. for pre-launch product placement
advertising. This advertising will increasingly be entertainment (e.g. the Toyota Yaris
game), and advertising models based on social networking sites are likely to proliferate.
Behavioural advertising, i.e. the use of interactive monitoring technologies to target
consumers based on their online behaviour, is a further, potentially intrusive, step towards
efficient advertising. Technically, behavioural targeting would be able to offer different
prices for the same product depending on the characteristics of the potential customer.
Privacy and security concerns in the use of online advertising (especially behavioural
advertising) may grow. Consumers’ willingness to view rich media and targeted ads will
grow if consumers feel that they are worthwhile. Younger Internet users appear less
hesitant to reveal personal details online. Yet as the incentives to gather, process and sell
consumer data escalate with increasing online advertising revenues and increased
propensity of users to share content online (e.g. through UCC), national regulations and
enforcement practices are likely to be put to the test. Attention will need to be given to
working out how to regulate and enforce effectively in global Internet advertising markets.
Overall, the development of Internet services will be intimately linked to how
advertising develops, how its efficiencies in linking information to users are applied and
how advertising click-fraud is combated. Business models based on online advertising may
become the most prevalent, superseding payment- or subscription-based models.
An
OE
CD
Bro
wo
L e c tur
ylnO dae
R
OECD INFORMATION TECHNOLOGY OUTLOOK 2008 – ISBN 978-92-64-05553-7 – © OECD 2008 277

5. DIGITAL CONTENT IN TRANSITION
se_it E ditin
es
eu
le
ConclusionDigital content markets have double-digit growth rates across the industry sectors
examined and increasing shares of total revenues, but with significant differences among
sectors. Growth is driven by the transfer online of existing commercial activities and by
innovative content from new enterprises and Internet users. Despite the high growth rates,
the impact on content industries is still unclear. Established firms face adjustment
pressures, the increasing numbers of businesses competing for relatively small direct
revenues, and the complexity of setting up new partnerships and revenue sharing
agreements in new digital content value chains.
So far, the impact of digital content on established value chains is largely on the
distribution side (e.g. for music), but the impact on the production side is also increasing as
user-created content, computer and video games, and advertising often create entirely
new production value chains. The Internet and greater interactivity may also increasingly
affect the supply of creative content owing to the impact of new business models (e.g. pay-
per-track or advertisement) and free access to content (content “commoditisation”) on
artists and content creators.
Business models are still evolving. The simple migration of business models from the
offline retail environment to the Internet (e.g. digital content sales: pay-per-item model) is
often not enough to achieve adequate revenues and satisfy user demand. Online
advertising is hailed as the “new business model” for the content industry and for user-
created content platforms but other business models, including subscriptions, will need to
develop.
However, the impact of digital content is much broader than the revenues provided by
the content industry. As users purchase broadband connections, software, computers and
electronic equipment to create and consume content, ICT and Internet industries
increasingly rely on digital content to drive demand for their services and products. The
boundaries between IT, telecommunications and media industries are blurring and new
digital intermediaries and hosting platforms have emerged.
Broadband content will continue to grow rapidly as it overcomes various barriers to
creation, distribution and access and thus to growth. With broadband content increasingly
designed for mobiles, future growth will also come from mobile content. Although digital
products are often substantially cheaper than their analogue equivalent, the depth of
online catalogues is often shallow. The promised “long tail” has not yet materialised, but is
likely to appear in the future. Problems relating to interoperability continue. These and
other developments will require ongoing analysis of the broader impact of the
development and distribution of digital content on value chains, business models, growth
and employment and associated policy implications.
Notes
1. See: www.oecd.org/sti/ict/digitalcontent and www.oecd.org/futureinternet/participativeweb.
2. Digital content policy principles have been developed in the context of the 2008 OECD Ministerialon the Future of the Internet Economy (www.oecd.org/futureinternet).
3. Latency is another factor in access to content. It is the time needed for a data packet to travel fromthe user’s computer to the server and back and is important when real-time response times areneeded, e.g. online games, video and voice communications.
4. See: www.oecd.org/sti/ict/broadband.
An
OE
CD
Bro
wo
L e c tur
ylnO dae
R
OECD INFORMATION TECHNOLOGY OUTLOOK 2008 – ISBN 978-92-64-05553-7 – © OECD 2008278

5. DIGITAL CONTENT IN TRANSITION
se_it E ditin
es
eu
le
5. Paid download offers for older games are rather limited (below 100 for publishers such asElectronic Arts or Ubisoft; below 1 000 for GameTap, a game subscription service) compared to20 000 or more entries in video and computer game databases, e.g. AMG, www.allmediaguide.com/game.html and Game Collector Connect, www.collectorz.com/connect/games.
6. On DRM issues in digital content distribution, see OECD, 2005a, 2006b, 2006c; Cabrera, 2007.
7. OECD-BIAC Workshop on Future of Online Audiovisual Services, Film and Video: Issues forAchieving Growth and Policy Objectives, 29 September 2006, www.oecd.org/dataoecd/33/42/37866987.pdf.
8. National statistical offices have only started to include related questions in surveys. Examplesinclude the “Communications Usage Trend Survey for Households”, conducted by the JapaneseMinistry of Information and Communication; the “Survey on the Computer and Internet Use”, bythe National Internet Development Agency of Korea; and the “Community survey on ICT usage inHouseholds and by Individuals” by Eurostat.
9. Counted using the number of “link-backs” to these licences on the Internet as tracked by Google.
10. Based on the Eurostat survey “Community Survey on ICT Usage in Households and by Individuals”,April 2007, Luxembourg, Statistical Office of the European Communities.
11. Based on Wikipedia (4 August 2007) at http://stats.wikimedia.org/EN/ and a presentation of FriedaBrioschi (Wikipedia) at the OECD, available at www.oecd.org/dataoecd/15/14/36133622.pdf.
12. See Xinhua-PRNewswire (2006), “Microsoft Windows Live survey: Blogging Phenomenon SweepsAsia”, 28 November.
13. See also the OECD-Canada Technology Foresight Forum on the Participative Web, fn. 1.
14. Most sites require users either to be at least 13-14 or 18 years old. Some have special sub-sites orparts of virtual worlds which are reserved for teenagers.
15. This definition of filmed entertainment only deals with the viewing, purchase and rental ofcinema films. It excludes TV productions as well as licensing revenues from films distributed overtelevision networks, digital TV, IPTV.
16. The United States, United Kingdom, France, Germany, Italy, Canada, Australia, and theNetherlands. Holdings include Axel Springer Group, Bertelsmann Group, Vivendi, Berlusconi,Carlton Group and Granada Group, but most of these are much more heavily invested in print,music and networking businesses than in film and television production.
17. See MPAA Research Statistics at www.mpaa.org/researchStatistics.asp.
18. Adams Media Research at www.adamsmediaresearch.com/comersus/store/comersus_viewitem.asp?idProduct=25.
19. CEA Market Research, May 2007, Product Sales Data, www.ce.org/Research/Sales_Stats/1218.asp.Apple shipped around 52 million iPods and over 1 million iPhones in 2007.
20. Advertisements may be placed in periodicals, newspapers, radio, television, online, billboards andflyers. Market research or advice can be included if provided in conjunction with ad creation orplacement. Media buyers purchase ad space from media outlets and resell it primarily toadvertising agencies. Marketing services refers to advertising which communicates with theaudience directly, for example by direct mail or other methods which require a directcommunication (“publishers” in the value chain). Advertising agencies are in charge of creatinglarge marketing campaigns.
21. Yahoo News, 2007, “Yahoo closes Internet advertising gap on Google; AOL and MSN complete BigFour” 21 March.
22. Currently, there are two major business models for behavioural targeting in online advertising:First, publisher networks specialise in collecting and combining behavioural data across Websites.Expected to be a USD 1.5 billion industry in 2007 (Advertising Age, 2007), these networks mainlyprovide behavioural targeting services for publishers and advertisers. Second, Adware is a rapidlygrowing segment despite the deceptive and malicious “malware” that is regarded as a major threatto security on the Internet. Tracking software continuously monitors, collects and reports theuser’s online moves and displays targeted pop-up ads.
23. Under generalised second price (GSP) auctions, the highest bidder submitting bids for a particularkeyword only pays a per-click price equal to the bid placed by the second highest bidder plus aminimum increment (of usually USD 0.01). In 2005 over 98% of Google’s revenues and over half ofYahoo!’s came from such GSP auctions (Edelman, 2006).
An
OE
CD
Bro
wo
L e c tur
ylnO dae
R
OECD INFORMATION TECHNOLOGY OUTLOOK 2008 – ISBN 978-92-64-05553-7 – © OECD 2008 279
5. DIGITAL CONTENT IN TRANSITION
se_it E ditin
es
eu
le
24. There are two types of paid inclusion. Under the first type a fee is paid to have an editor review theWeb site and include it to their directory. Under the second type an advertiser submits his webpage for indexing by a search engine which guarantees its inclusion in the results search page.
References
Advertising Age (2007), “The right ads at the right time – viaYahoo!”, www.mediainfocenter.org/story.asp?story_id=103009716.
Barbaro, M. and T. Zeller (2006), “A Face Is Exposed for AOL Searcher No. 4417749”, The New YorkTimes, 9 August, www.nytimes.com/2006/08/09/technology/09aol.html.
Cabrera, F. (2007), “Digital Rights Management Systems (DRMs): Recent Developments in Europe”, IRISplus. Legal Observations of the European Audiovisual Observatory, Issue 2007-01, www.obs.coe.int.
Cisco (2007), “Global IP Traffic Forecast and Methodology, 2006-2011”, white paper, available atwww.cisco.com/en/US/netsol/ns537/networking_solutions_white_papers_list.html.
Digital Content Association of Japan [DCAJ] (2007), “The Content Industry in Japan 2007”.
Digital Entertainment Group (2007), “DEG Year-End 2006 Home Entertainment Sales Update”, pressrelease, 8/01/2007, www.dvdinformation.com/News/press/CES010807.htm.
Edelman, B. (2006), “Internet Advertising and the Generalized Second-Price Auction: Selling Billions ofDollars Worth of Keywords”, www.benedelman.org/publications/gsp-060801.pdf.
EMarketer (2006), “Online Ad Targeting: Engaging The Audience”, www.emarketer.com/Reports/All/Targeting_may06.aspx?src=report_head_info_sitesearch.
European Audiovisual Observatory [EAO] (2007), Focus 2007. World Film Market Trends, Cannes,Marché du Film, www.obs.coe.int/oea_publ/market/focus.html.
Fitch Ratings (2006), “The Internet, Online Advertising and Old Media – a Primer”.
de Fontenay, A., de Fontenay, E., and L. Pupillo (2008), “The Economics of Peer-to-Peer”, in E. Noam andL. Pupillo (eds.), Peer to Peer as a Mass Medium, [tbc].
Grow, B. and B. Elgin (2006), “Click Fraud. The Dark Side of Online Advertising”, Business Week,2 October, www.businessweek.com/magazine/content/06_40/b4003001.htm.
IFPI (2007), Digital Music Report 2007, www.ifpi.org/content/library/digital-music-report-2007.pdf.
IFPI (2008), “Recorded Music Sales 2007”, www.ifpi.org/content/library/Recorded-music-sales-2007.pdf.
Interactive Advertising Bureau Canada (2007), “Canadian Online Advertising Revenue Survey”,www.iabcanada.com/newsletters/070430.shtml.
Mandese, J. (2007), “Pop Culture, Media, Art, Science and Everything in Between”.
Mininstry of Internal Affairs and Communications of Japan [MIC] (2005), “Analysis on Current Statusof and Forecast on Blogs/SNSs”, www.soumu.go.jp/joho_tsusin/eng/Releases/Telecommunications/pdf/news050517_2_1.pdf.
Ministry of Internal Affairs and Communications of Japan [MIC] (2007), “White Paper on Information andCommunications in Japan”, www.johotsusintokei.soumu.go.jp/whitepaper/eng/WP2007/2007-index.html.
Motion Picture Association of America [MPAA] (2008), “International Theatrical Snapshot”, researchreport available at www.mpaa.org/researchStatistics.asp.
National Internet Development Agency of Korea [NIDA] (2006), “2006 Korea Internet White Paper”,www.nida.or.kr/english.
National Internet Development Agency of Korea [NIDA] (2007a), “Survey on the Computer and InternetUsage”, February, http://isis.nida.or.kr/eng/.
National Internet Development Agency of Korea [NIDA] (2007b), “Survey on the Computer and InternetUsage”, October, http://isis.nida.or.kr/eng/.
National Internet Development Agency of Korea (NIDA) (2007c), “2007 Korea Internet White Paper”,www.nida.or.kr/english.
NPA Conseil (2008), Vidéo à la demande en Europe : Second recensement des services de VoD, Reportcommissioned by the European Audiovisual Observatory and the Media Development Department ofthe French Ministry of Culture and Communication, www.ddm.gouv.fr/article.php3?id_article=1298.
An
OE
CD
Bro
wo
L e c tur
ylnO dae
R
OECD INFORMATION TECHNOLOGY OUTLOOK 2008 – ISBN 978-92-64-05553-7 – © OECD 2008280

5. DIGITAL CONTENT IN TRANSITION
se_it E ditin
es
eu
le
NPD Group (2007), “Legal Music Downloads Were Fastest Growing Digital Music Category in 2006”,press release, 14 March, www.npd.com/press/releases/press_0703141.html.
OECD (2004), OECD Information Technology Outlook 2004, Paris, Organisation for Economic Co-operationand Development.
OECD (2005a), “Digital Broadband Content: Music”, DSTI/ICCP/IE(2004)12/FINAL, www.oecd.org/sti/digitalcontent.
OECD (2005b), “Digital Broadband Content: The Online Computer and Video Game Industry”, DSTI/ICCP/IE(2004)13/FINAL, www.oecd.org/sti/digitalcontent.
OECD (2006a), OECD Information Technology Outlook 2006, Paris, Organisation for Economic Co-operationand Development.
OECD (2006b), “Digital Broadband Content: Digital Content Strategies and Policies”, DSTI/ICCP/IE(2005)3/FINAL, www.oecd.org/sti/digitalcontent.
OECD (2006c), “Report on Disclosure Issues related to the Use of Copy Control and Digital RightsManagement Technologies”, DSTI/CP(2005)15/FINAL.
OECD (2007), “Participative Web: User-Created Content”, DSTI/ICCP/IE(2006)7/FINAL.
OECD (2008a), “Digital Broadband Content: Film and Video”, DSTI/ICCP/IE(2006)11/FINAL.
OECD (2008b), “Digital Broadband Content: Online Advertising”, DSTI/ICCP/IE(2007)1/FINAL.
Ofcom (2007), “The Communications Market 2007”, 23 August, London, Office of Communications.
PricewaterhouseCoopers [PwC] (2007), Global Entertainment and Media Outlook: 2007-2011, New York,PricewaterhouseCoopers LLP.
PricewaterhouseCoopers/Internet Advertising Bureau [PwC/IAB] (2008), “IAB Internet AdvertisingRevenue Report”, May, www.iab.net/insights_research/1357.
Pew (2007a), “Social Networking Websites and Teens: An Overview”, Pew Internet and American LifeProject, 1 July.
Pew (2007b), “Teens and Social Media”, Pew Internet and American Life Project, 19 December. Data wasmade available by John B. Horrigan of the Pew Internet and American Life Project.
Screen Digest (2007), “Online movies: the state of play”, at www.screendigest.com/online_services/intelligence/ broadband/updates/JGAK7KES8/ScreenDigest_Onine%20Movies_SDseminar.pdf.
Screen Digest, CMS Hasche Sigle, Goldmedia Gmbh, Rightscom Ltd. (2007), “Interactive content andconvergence: Implications for the information society”, final report for the European Commission(DG Information Society and Media).
Snyder Bulik, B. (2006), “User-Generated video gets its own TV channel”, Advertising Age, http://adage.com/abstract.php?article_id=113187.
World Association of Newspapers (WAN) (2007), World Digital Media Trends 2007, www.wan-press.org/worlddigitalmediatrends/home.php, accessed 08 November.
ZenithOptimedia (2007), “2008 Olympics to boost TV to its highest ever share of world adspend”, Pressrelease, October.
An
OE
CD
Bro
wo
L e c tur
ylnO dae
R
OECD INFORMATION TECHNOLOGY OUTLOOK 2008 – ISBN 978-92-64-05553-7 – © OECD 2008 281

5. DIGITAL CONTENT IN TRANSITION
DB
ro
wse_it E ditio
n
es
eu
le
ylnO d
ANNEX 5.A1
Figure 5.A1.1. Market size and growth, 2007 or latest available yearIn USD billion (left-hand); in % year-on-year growth (right-hand)
1 2 http://dx.doi.org/10.1787/476155357582
Source: OECD based on various sources as under Table 5.1.
120
100
80
60
40
20
0
100
90
80
70
60
50
40
30
20
10
0
%Online revenuesOffline revenues
Advertising Computer and video games Music Film and video
Onlineshare: 7.5% Online
share: 17%Online
share: 16%Online
share: < 1%
Advertising total revenue:USD 445 billion Film and video online
revenue growth: > 100%
Growth of online market
Table 5.A1.1. Intellectual property provisions in terms of services of UCC sites
Content created by site Most sites specify that they retain IPRs in their respective content (e.g. text, software, graphics, layout, design) under copyright.
Content created by users
● Most sites specify that users who post content retain ultimate ownership, but that they have given the site a licence to use content without payment. In other words, by posting the content the sites receive a limited irrevocable, perpetual, non-exclusive, transferable, fully paid-up, worldwide licence (with the right to sub-license) to use, modify, publicly perform, publicly display, reproduce and distribute such content.
● Most sites specify that this licence does not grant the site the right to sell the content or to distribute it outside of the respective service.● Most sites pledge to mention the identity of the user, the author of the work, and also the title of the work, in so far as technical
conditions make this possible. ● Most sites specify that the licence terminates at the time the user removes his/her content.● Some sites reserve the right to prepare derivative works (modify, edit content posted by users) or the right to adapt. At times, it is
specified that the site may commercially exploit the works posted by users. ● Some sites specify that users lose their IPRs and forfeit payment in perpetuity (even when the content is removed). Sometimes the sites
also ask the user to admit “moral rights” (meaning that the site does not have to give the author credit).● Some sites require the user to agree that content will be subject to the Creative Commons licence. ● Some sites reserve the right of reproduction, i.e. the right to reproduce, without limitation, on any known or unknown medium, current
or future, especially optical, digital, paper, disc, network, diskette, electronic, DVD, etc.● Some sites reserve the right to distribute the work or to sub-license rights to third parties. Mostly, it is proposed that revenue from these
activities be shared between the user and the site. ● Some sites reserve the right to use the name and content of users for advertising and promotional purposes (promotional licence).
Reservation to terminate the service
Most sites reserve the right to modify or terminate the service for any reason, without notice, at any time, which may have consequences on content stored or acquired by users.
Source: OECD, 2007 based on a review of the terms of service of a sample of 15 widely used English-speaking UCC sites.
An
OE
C
L e c tur
aeR
OECD INFORMATION TECHNOLOGY OUTLOOK 2008 – ISBN 978-92-64-05553-7 – © OECD 2008282

ISBN 978-92-64-05553-7OECD Information Technology Outlook 2008
© OECD 2008
DB
ro
wse_it E ditio
n
es
eu
le
ylnO d
Chapter 6
Economic Implications of Broadband
Broadband and networked ICTs are diffusing rapidly, but there are significant
differences in use among countries, sectors and firms, and their manifold impactsare only beginning to be felt. Broadband and networked ICTs are important formeeting environmental, health and demographic challenges, and policy plays animportant role in expanding their use and enhancing their impact.
An
OE
C
L e c tur
aeR
283

6. ECONOMIC IMPLICATIONS OF BROADBAND
DB
ro
wse_it E ditio
n
es
eu
le
ylnO d
IntroductionThis chapter examines broadband networks and the role they play in creating the
conditions for sustainable economic growth and prosperity and the structural changes
they enable. The important economic impacts of information and communication
technologies (ICTs) are well recognised. This chapter considers some of the economic
implications of broadband and the networks that increasingly link ICTs in ways that
should ultimately have very significant and positive effect on economic activity,1
productivity, output growth and quality of life. Broadband is a relatively new development
and take-up has been rapid, but it is difficult to disentangle its impact from the overall
impact of ICTs, already a challenging area for measurement. However, evidence of a
positive impact is increasing as statistics improve (see the OECD Broadband Portal2) and as
studies from official statistical agencies or studies based on official statistics become
available.
Broadband networks are an increasingly integral part of the economy. As the
technology evolves and bandwidth increases, the scope for broadband to enable structural
change expands as it becomes part of an increasing number of economic sectors and
activities. Direct effects result from investments in the technology and from rolling out the
infrastructure. Indirect effects come from factors that drive growth, such as innovation,
firm efficiency, competition and globalisation. Broadband facilitates the development of
new inventions, new and improved goods and services, new business models, and new
processes; it increases competitiveness and flexibility in the economy, contributing to
occupational change and job creation.
More generally, broadband improves the performance of ICTs. ICTs are a general
purpose technology (GPT), i.e. a technological improvement that fundamentally changes
how and where economic activity is organised. As such, the economic impacts of
broadband are likely to be significant, for example by enabling organisational change and
enhancing co-ordination to reap productivity gains from investments in ICTs, although it
is likely to be difficult to disentangle the economic impact of broadband from that of ICTs
more generally. Relative to other historical GPTs, such as railways and electricity, the
impacts may also be larger and materialise more rapidly.
Broadband has become an important part of almost every aspect of the knowledge
economy, especially in activities that rely on the provision of data and information in the
services sector. Many aspects of production, delivery, consumption, co-ordination and
organisation now take place over broadband communications networks. This increased
pervasiveness gives rise, however, to security and privacy concerns. Protecting users'
security will be paramount as the broadband-enabled Internet becomes a core part of the
economic infrastructure.3
This chapter gives more attention to potential than to measured impacts. The
evidence to date suggests that the largest productivity gains come increasingly from the
use, rather than the production, of ICTs. ICT and e-business skills as well as the
An
OE
C
L e c tur
aeR
OECD INFORMATION TECHNOLOGY OUTLOOK 2008 – ISBN 978-92-64-05553-7 – © OECD 2008284

6. ECONOMIC IMPLICATIONS OF BROADBAND
se_it E ditin
es
eu
le
organisational changes enabled by ICTs are playing an increasingly pivotal role in
achieving productivity gains. The diffusion of broadband and wireless developments are
expected to encourage organisational change and fuel associated productivity gains.
Informational mobility is also gaining in importance with the diffusion of mobile
broadband (OECD, 2008a). The following section discusses the expected and potential
economic impacts of broadband. Next, some evidence of productivity gains from
broadband and ICTs is discussed, and the increasing reliance on this infrastructure
illustrated. The final section looks at broadband and small and medium-sized enterprises
(SMEs).
The expected economic impact of broadbandBroadband, when combined with ICTs,4 operates through many channels both directly
and indirectly. It enables the emergence of new business models, new processes, new
inventions, new and improved goods and services. It increases competitiveness and
flexibility in the economy, for example by the increased diffusion of information at lower
cost, by improving access to increasingly larger markets, by allowing people to work from
multiple locations with flexible hours, and by generally speeding up procedures and
processes, thereby boosting the economy’s dynamism. Finally, by nature these
technologies create network externalities such that the benefits that accrue from using
them increase as diffusion spreads. There may be further spillovers as well, for example
when companies adopt broadband and ICTs that transform their supply chain and thereby
prompt other companies to change theirs, either because they are part of the chain, or
because they copy the innovative leader.
Broadband as an infrastructure enabler of a general purpose technology
Economic growth is driven by many things, notably product, process and organisational
innovations related to technological change. Technological change usually involves small
incremental improvements. However, technological improvements, when they are general
purpose technologies, can fundamentally change how and where economic activity is
organised. Earlier GPTs include printing with moveable type, electricity and the dynamo,
the internal combustion engine, steam engines and railways. ICTs, including computers
and the Internet, are generally considered a GPT. A GPT evolves over time and goes through
phases involving efficiency, applications and diffusion. It creates spillovers throughout the
economy, not merely in the sector that produces the GPT, it leads to fundamental changes
in the production processes of those who use it, and it spurs further inventions and
innovations.
ICTs are the GPT for today’s world, with broadband acting as the required
infrastructure enabler, and the Internet as the platform supporting a widening variety of
applications whose effects are likely to raise productivity and give rise to network effects
that increase over time. Already, many new products, both goods and services, have been
created as a result of ICTs and have been fully integrated into everyday life, and working
life.
GPT-type effects suggest that measured total factor productivity (TFP) should rise in
ICT-using sectors, probably with considerable time lags. However, investment in ICTs may
initially be associated with declines in TFP as reorganisation and learning require
resources (Basu et al., 2003). This is also consistent with David’s (1990) “delay hypothesis”
or “learning hypothesis” which relates to the time it takes to learn to use and apply new
An
OE
CD
Bro
wo
L e c tur
ylnO dae
R
OECD INFORMATION TECHNOLOGY OUTLOOK 2008 – ISBN 978-92-64-05553-7 – © OECD 2008 285

6. ECONOMIC IMPLICATIONS OF BROADBAND
se_it E ditin
es
eu
le
technologies. In fact, technological revolutions may occur but not be reflected in major
accelerations in measured productivity. Efficiency has been growing rapidly, although there
are physical limits, at least with the current networks, but there is still room for further
diffusion of existing applications, and completely new applications appear regularly in
many different parts of the economy (Carlaw et al., 2007; see also Crafts, 2003).
Overall, it is very likely that broadband and associated ICT applications will replicate
the positive and transformative effects of previous GPTs and possibly exceed them
(see OECD, 2004; OECD, 2008c). The prices of ICTs have fallen more dramatically than the
prices of other GPTs, such as electricity and the combustion engine, even though they
require, like other GPTs, complementary investments, so that the innovations that drive
change may take time to make their contribution (Fernald et al., 2007).
Applications generated by broadband
The Internet has been widespread since the mid-1990s, but faster speeds and greater
bandwidth continue to increase the range of activities that are carried out online. For
example, traditional telecommunications increasingly take place over broadband
communications networks, in particular IP networks, rather than circuit switched
networks, and IP telecommunications (e.g. Skype) are also increasingly used. Public
infrastructure greatly depends on broadband communications networks, from control of
traffic lights to control of sewage systems to many forms of transport – air traffic control,
maritime and rail transport, and logistics management systems. Governments
increasingly maintain online relations with citizens and firms through the provision of e-
government services (e.g. applications for permits of all sorts, tax authorities, information
etc.). Military and defence systems also depend on broadband and the Internet. Global
positioning systems (GPS) and other navigation systems all rely on this means of
information transmission and they enable new applications such as monitoring of patients
and prisoners at a distance. Natural and other disaster prevention and warning systems
also rely heavily on the Internet and broadband communication networks.
Many aspects of business now take place over broadband communications networks:
supply chain management, fleet management, e-procurement, e-invoicing, online
recruitment, customer service, call centres, e-commerce, online payment systems, co-
ordination of fragmented production processes both within and between firms, and the
connection of teleworkers to their employers’ networks. Further gains can be expected as
possibilities for the use of virtual private networks and video conferencing, for example,
expand with increased bandwidth.5 Broadband is especially important in all sectors that
rely on provision of information, such as financial markets, insurance and accounting
firms and systems. Other examples include consultancies, weather forecasts and reports,
research (from school homework to professional and academic research and R&D
activities), online databases, banking (offline and online) and ATM services, marketing,
online advertising, advertising and graphics design, and news distribution (offline and
online). Broadband also plays a wider and important role in enabling innovation, another
factor that contributes to creating the conditions for sustainable economic growth.
Broadband and innovation
Broadband has an impact on innovation6 both through innovation in ICTs and through
innovation enabled by ICTs, such as collaborative R&D networks, virtual simulation,
artificial intelligence, grid computing, e-business processes, and new work practices.
An
OE
CD
Bro
wo
L e c tur
ylnO dae
R
OECD INFORMATION TECHNOLOGY OUTLOOK 2008 – ISBN 978-92-64-05553-7 – © OECD 2008286

6. ECONOMIC IMPLICATIONS OF BROADBAND
se_it E ditin
es
eu
le
Broadband enables innovation both through new applications and through the diffusion of
existing innovations, two mutually reinforcing channels. There is also some evidence that
firms that use ICTs more intensively innovate more, creating larger spillovers and
productivity gains (Koellinger, 2006). Broadband reinforces such effects by enabling more
intensive use of ICTs and enhancing possibilities for exploiting the benefits of ICTs.
Broadband also increases firms’ ability to move more quickly from idea to product, for
example by allowing around around-the-clock R&D, “24x7x52”, and concurrent
development of multiple phases and projects in different locations. Thus, ICTs and
broadband tend to transform how innovative activity is carried out. New forms of ICT-
related innovation processes are emerging and are fundamentally changing how research
takes place. ICTs and broadband enable faster diffusion of codified knowledge and ideas,
linking science more closely to business. They lower barriers to product and process
innovation,7 encourage start-ups, improve business collaboration, enable small firms to
expand their R&D and collaborate in larger R&D consortia, reduce cycle times, and foster
greater networking in the economy.
The focus of ICT-related R&D has shifted from computer hardware to software,
computer and related IT services, including Web services, and digital content (e.g. OECD,
2007b, 2008b). Broadband enables innovation in these areas and can be expected to drive
further innovations in the future, especially in broadband-enabled services and digital
content. Furthermore, with the diffusion of ICTs throughout the economy, ICT-related R&D
is also increasingly carried out in other sectors (see Chapter 3).8
With the diffusion of broadband Internet, people outside traditional institutions and
hierarchies can also innovate to produce new goods and services and content. The role of
network users and consumers in the innovation process increases as they actively
participate by generating or contributing to new product ideas (user-led innovation, or “the
democratisation of innovation”, see von Hippel, 2005) and collectively develop new
products (e.g. Wikipedia, open source software).
The trend towards this democratisation of innovation applies not only to information
products, such as software, but also to physical products. However, especially for services
and knowledge and information products, the process is enabled and greatly enhanced by
the use of broadband communication networks (see Box 6.1).
Broadband and the globalisation of services
ICTs and broadband facilitate the globalisation of many services, as broadband makes
it feasible for consumers and producers of services to be in different locations. ICT-enabled
globalisation of services involves highly skilled and relatively higher value-added services
as well as lower-skill services such as back-office and administrative functions and call-
centre activities. Examples of such ICT-enabled services include legal, accounting,
advertising, design, R&D, IT-related services (such as software programming, IT support
and consultancy), technical testing and analysis, marketing and advertising, management
consultancy, and human resource management and labour recruitment. Broadband also
raises product market competition in many sectors, especially in services.
The ICT-enabled globalisation of services is beginning to affect how economies work
and the global allocation of resources. It also contributes to productivity growth by
reinforcing competitive pressure and increasing business efficiency as firms focus on their
core activities and outsource/offshore others. Given that services are often intermediate
An
OE
CD
Bro
wo
L e c tur
ylnO dae
R
OECD INFORMATION TECHNOLOGY OUTLOOK 2008 – ISBN 978-92-64-05553-7 – © OECD 2008 287

6. ECONOMIC IMPLICATIONS OF BROADBAND
se_it E ditin
es
eu
le
inputs in other sectors, increased productivity in services because of globally distributed
value chains is likely also to improve productivity in the sectors purchasing these services.
The globalisation of services may also have broader welfare benefits for consumers,
increasing the range and variety of services available. Potential productivity gains may also
arise from greater access to a larger variety of inputs.
Broadband-enabled global sourcing can affect a country’s services productivity in
other ways as well. If imports compete with domestic production, efficiency gains can be
achieved when the least efficient firms are driven out and competitive pressures force the
remaining firms to become more efficient and innovative. Furthermore, when global
sourcing allows countries, or firms, to focus on their areas of competitive advantage,
overall productivity is likely to increase as a result of the increased specialisation of tasks
and activities.
Reliability of the infrastructureAs broadband and rapid, high-capacity communication networks become increasingly
widespread they are also increasing the reliance of the economy on their continued and
permanent operation. Damage to the physical infrastructure has increasingly important
economic ramifications. Incidents have been relatively minor to date, but they give an idea
of the kinds of activities affected and of the duration of disruptions, some of which are
described below. As more and more activities take place over these cables, faults in the
infrastructure will have increasingly wide and disruptive repercussions. Box 6.2 describes
some of the deep-sea cable infrastructure.
Internet activities, e-mail and telecommunications were affected when Telstra,
Australia’s biggest Internet service provider (ISP), lost around 60% of its Internet
transmission capacity in 2000 as a result of damage to a major Internet backbone cable
(Figure 6.1), situated in less than 100 feet of sea 40 miles off Singapore. Initially Telstra was
Box 6.1. Open source software: User-driven innovation and the role of broadband communication networks
ICTs and broadband create new ways for companies to exploit the creativity andinnovativeness of their workforce. Blogs, wikis, podcasting, tagging technologies, andother lessons of community and social networking sites are increasingly seen as importanttools to improve the efficiency of employees. An important advantage is that innovation byusers results in a more adequate response to their heterogeneous needs.
An open source software project illustrates the role of new ICT tools and how broadbandenables interactions. The necessary tools and infrastructure include: e-mail lists forspecialised purposes that are open to all and are publicly archived; common softwarelanguages (often available on the web); common basic toolkits. All greatly facilitateinteraction, and version-control software allows contributors to insert new code into theexisting project code base and test to see if the new code causes malfunctions in existingcode. If so, the tools allow easy reversion to the previous version. This makes “try it andsee” testing much more practical, because there is less risk of a new contribution
inadvertently breaking the code. Toolkits used in open source projects have evolved withpractice and are continuously being improved by user-innovators. Individual projects cannow start up using standard infrastructure sets offered by sites such as Sourceforge.net.
Source: Adapted from von Hippel (2005).
An
OE
CD
Bro
wo
L e c tur
ylnO dae
R
OECD INFORMATION TECHNOLOGY OUTLOOK 2008 – ISBN 978-92-64-05553-7 – © OECD 2008288

6. ECONOMIC IMPLICATIONS OF BROADBAND
se_it E ditin
es
eu
le
able to cover only 30% of its usual capacity, but after rerouting data around the damage
service rose relatively quickly to 75%. To avoid disruptions of this kind, improve service and
provide increased network capacity and reliability, Telstra announced in early 2007 that it
was investing in a new 5 600 mile deep-sea cable linking Australia to Hawaii, and then to
the United States mainland.9
Sri Lanka’s communications link to the rest of the world, a single fibre connection, was
cut in 2004 by a ship’s anchor. News reports indicated that its Internet and long-distance
phone service were cut off, with potentially major economic implications for Sri Lanka
given the importance of its call centre activity. In mid-December 2006, hundreds of
thousands of people in Iceland suffered severe disruptions to their use of the Internet and
Iceland’s universities and hospitals suffered a temporary shut-down of data communications
when a deep-sea cable break caused an interruption of CANTAT-3 services. During the repair
the affected institutions relied on emergency connectivity obtained via local Internet
providers.10
In December 2006, an undersea earthquake and rockslides damaged undersea cables
off Chinese Taipei’s southern coast causing outages in Chinese Taipei, China, Korea, Japan
and India. This incident, dubbed “a digital tsunami”,11 disrupted financial markets, phone
calls, online banking, computer kiosks at airport check-ins, ATMs, logistics companies,
communications and Internet sites. Chunghwa Telecom, Chinese Taipei’s largest
telephone company, reported that all of the island’s phone communications with other
Asian countries were disrupted and that capacity to the United States was cut by 60%.
Japan’s NTT reported damage to 1 400 phone lines and 84 international phone lines,
disrupting phone capacity to Southeast Asia. China’s access to major international
Websites was also affected, as were phone calls to Chinese Taipei and Hong Kong, China.
Korea’s leading fixed line company KT reported that some 90 leased lines had been
destroyed, but that telephone and Internet lines had been re-routed rapidly with minimal
disruption.
Figure 6.1. The 23 600 mile SEA-ME-WE 3 Cable
1 2 http://dx.doi.org/10.1787/476157204117
Source: Forbes, www.forbes.com/2000/11/21/1121disaster.html.
Norden
Tetouan
Marmaris
Suez
MuscatKarachi
Singapore
Batangas
Okinawa
Keoje
Mumbai
Alexandria
Djibouti
Jeddah
CochinColombo
Yangon
ShanghaiHong Kong
Jakarta
Perth
An
OE
CD
Bro
wo
L e c tur
ylnO dae
R
OECD INFORMATION TECHNOLOGY OUTLOOK 2008 – ISBN 978-92-64-05553-7 – © OECD 2008 289

6. ECONOMIC IMPLICATIONS OF BROADBAND
se_it E ditin
es
eu
le
Box 6.2. Deep sea cable infrastructure
Much ICT-enabled activity takes place over deep-sea cables. Experiments with deep-seacables started in Europe and Japan in the mid-1980s, but the large-scale laying of opticaldeep-sea cables took off in 1996-97. At the time, the demand for International bandwidthwas driven by simple Internet connections, wireless and wire-line voice traffic. Ten yearslater, Internet video traffic on peer-to-peer networks and websites such as YouTube are
driving demand. While deep-sea networks are growing strongly, there has been little build-up of terrestrial networks. Instead of adding more cables, some carriers (such asLevel 3 and Global Crossing) are using next-generation optical equipment from companiessuch as Infinera to send more bandwidth cheaply over their existing terrestrial fibre. Sucha solution does not yet exist for the deep-sea sector, which partly explains the increasedlaying of undersea cables. In recent years investment in the deep-sea cable market hasshifted to South Asia, and two of the largest owners of deep-sea cable networks are inIndia: Reliance Globalcom (FLAG) and Tata Communications (VSNL).
The largest amount of construction activity is on the trans-Pacific route, and accordingto Telegeography estimates, only 18% of the potential trans-Pacific capacity is lit atpresent. The total potential capacity on existing cables is about 17 terabits per second(Tbps), but as some 75% of it is on a single cable, VSNL Transpacific, global carriers arelooking for second and third sources. Four new cables are being proposed that wouldincrease the potential capacity to about 39.8 Tbps. The Trans-Pacific Express (TPE) wentlive in the third quarter of 2008, connecting China, Korea and Chinese Taipei to the UnitedStates (see below). The other three cables planned were (in order) the Asia AmericaGateway (AAG) project, the EAC Pacific and FLAG NGN-Pacific.
The TPE is a network costing over USD 500 million with an 18 000 kilometre cable systemand a maximum capacity of up to 1.28 Tbps, created by Verizon Business with a multitudeof Asian telecommunication operators including China Telecom, China Netcom, ChinaUnicom, Korea Telecom and Chunghwa Telecom of Chinese Taipei. The network will landon Nedonna Beach (Oregon), on the United States side and in China at Qingdao andChongming. It will also have landings in Tanshui, Chinese Taipei and Keoje, South Korea.
Indian companies have been buying up large shares of the cable market. For example,VSNL bought the Tyco Global Network. It is likely VSNL will upgrade its networks to meetcapacity demands and face the challenge posed by the new China-United States TPEnetwork. Another recent example of dynamic Asian growth involves Spice Telecom,Indian state Karnataka's oldest cellular service provider. It was reportedly looking atusing Telecom Malaysia's international long distance (ILD) infrastructure to enter the
international market. Spice Telecom is also reported to be setting up three ILD points ofpresence (POPs) – the United States, the United Kingdom and Singapore – to distribute itstraffic across India, along with its two national long distance POPs. This will allow Spiceto compete with other ILD major carriers, like BSNL, Bharti, Reliance and VSNL. TelecomMalaysia (TM), which has a large share in Spice Telecom, is a consortium member of allsubmarine cable systems that land in Malaysia, with access to capacity in othersubmarine cable systems globally. It also has co-location facilities at major data centres.The relationship between Spice and TM will allow Spice to access those cable systemsand facilities.
Source: OECD, 2008c.
An
OE
CD
Bro
wo
L e c tur
ylnO dae
R
OECD INFORMATION TECHNOLOGY OUTLOOK 2008 – ISBN 978-92-64-05553-7 – © OECD 2008290

6. ECONOMIC IMPLICATIONS OF BROADBAND
se_it E ditin
es
eu
le
Overall, most network operators and data providers were able to re-route traffic
without too much disruption. For example, Cable and Wireless used back-up terrestrial
circuits through China, and Reuters, whose main regional data centre is located in
Singapore with a back-up in Hong Kong, China, restored services to Japan and Chinese
Taipei on the same day and to Korea on the following day. Bloomberg suffered more, as it
supplies its information from New York. Traders, investment bankers and Bloomberg’s
editors based in Hong Kong, China, could not access the company’s terminals for two
days.12 The Hong Kong stock market returned to normal after a few days, and China
Telecom had recovered 70% of its Internet service and all of its phone calls to Hong Kong
and Macau. Singapore Telecom’s Internet access and voice services had also been restored.
Five days after the event, Indonesia’s PT Indosat had 80% capacity.13 This incident shows
that a great deal of data transfer relies on deep sea cables and that the network is quite
resilient, since at least partial service was restored in most affected networks in less than
12 hours. Companies also reverted to using fax and mobile phones.
India is particularly aware of reliability and interruption issues given its huge call
centre, software and business process outsourcing industries which cannot afford to be
offline for an extended period of time. During the December 2006 incident, only one
company suffered a major outage lasting around eight hours; other large companies only
suffered slight disruptions. This is because Indian companies rely on a multitude of
telecom service providers and use four different cable systems that land in different Indian
cities: diversity is the key to reducing impact from such outages.14
Repairing breaks in deep-sea cables is complicated by the need for ships with special
equipment, which may take some time to arrive and are very costly. Also, the full extent of
the damage cannot be known immediately, as the equipment can only scan the cable to
the first break, so that further breaks are not discovered until the first is repaired. The
sequence must be repeated until all breaks have been repaired. Parts of severed cables
may also be far removed from the breakage point if they have been dragged by currents
or moved by rock slides, for example. Increasingly, efforts are being made to keep local
Internet traffic local, which not only lowers costs but also improves performance and
reliability (Gibbard, 2007).
In general, because Asia has fault lines and is vulnerable to quakes, it is necessary to
study carefully where to lay the cables and to diversify cable loops and landing points. For
example, the Trans-Pacific Express cable system, linking the United States to China and
other countries in Asia will use a “mesh system” which will run three different loops
connected at switching stations on land. This should make re-routing easier in case of a
break. Geographical diversity in landing points is also important.
Evidence on the productivity impacts of broadbandOnly a few studies have so far looked directly at the economic impact of broadband,
and there are very few cross-country comparisons. Most studies consider the impact of
ICTs more broadly, but to some extent the results for broadband can be extrapolated, even
though the impact of broadband will also depend on other factors. Indeed, with the very
rapid advances in ICTs that have and are still taking place, productivity gains are no longer
limited to or dictated by the technology but by the use made of it and the (organisational)
capacity to exploit the gains that it allows to achieve.
An
OE
CD
Bro
wo
L e c tur
ylnO dae
R
OECD INFORMATION TECHNOLOGY OUTLOOK 2008 – ISBN 978-92-64-05553-7 – © OECD 2008 291

6. ECONOMIC IMPLICATIONS OF BROADBAND
se_it E ditin
es
eu
le
Productivity effects of ICTs
The productivity impact of ICTs has been studied at the aggregate, sector and firm
level. Macroeconomic studies of the impact of ICTs on the economy can be broken down
into two types: growth accounting and country-level econometric studies. Overall the
evidence finds a positive impact on productivity. In neoclassical growth accounting,
productivity impacts show up in measured total factor productivity (TFP), whereas the
direct impact of ICTs leads to capital deepening which boosts labour productivity. The
drawbacks to using growth accounting techniques include: the limiting assumptions and
hypotheses that are needed; data limitations especially for the data on investment in ICTs;
the need for hedonic deflators adjusted for quality change; and international comparisons
remain difficult. Many studies find that much of the acceleration of TFP comes from
greater use of the technology (see e.g. Basu et al., 2003; Pilat, 2005).
ICTs essentially have a productivity impact through three channels: i) the ICT-
producing sector, ii) ICT investment in ICT-using sectors, and iii) complementary factors,
such as organisational capital, firm organisation, skills and human capital. Regarding
organisational capital, studies have shown United States affiliates in the United Kingdom
to be more productive than United Kingdom firms because of their relatively more efficient
use of ICTs but that this is not necessarily the case for other countries’ affiliates (e.g. Bloom
et al., 2007; Oulton, 2001). Thus, the productivity of United States multinationals operating
in the United Kingdom has been found to exceed that of non-United States multinationals
operating in the United Kingdom and this applies to their acquisitions (Bloom et al., 2007;
see also the role of organisational capital and other intangible and complementary factors
in Box 6.3). The competitive environment, the general macroeconomic climate and the
state of the economy are also important, as are competitive pressures, especially in recent
years (Oliner et al., 2007).
The impact of ICTs on productivity may also change over time. Growth accounting
estimates for the United States in Oliner et al. (2007) suggest that the direct impact of ICTs
on labour productivity growth peaked in 1995-99, accounting for around three-quarters of
productivity growth. Nonetheless, the direct impact of ICTs remained substantial
from 2000 to 2005, accounting for around two-fifths of labour productivity growth. The
latter period also saw a marked acceleration in multi-factor productivity growth outside IT-
producing sectors, suggesting that the continued diffusion of ICTs and the move towards
an increasingly broadband-enabled economy may have had important indirect impacts on
productivity growth.
Cheap ICTs will only have a productivity effect if firms fundamentally change their
organisation of production in order to enhance productivity. If the diffusion of ICTs
subsequently leads to complementary innovations in ICT-using industries, increasing the
demand for ICT capital, such innovations can have important long-term effects before
diminishing returns set in (Basu et al., 2003). A similar point can be made for diffusion and
roll-out of broadband and continuously increasing bandwidth.
Studies using more disaggregated data (at sector and firm level) provide useful
additional insights. Productivity effects are likely to vary across sectors and firms and may
be masked at the aggregate level where effects may cancel each other out. There may also
be a role for firm entry and exit, over and above the productivity impact of IT, when low-
productivity firms exit and high-productivity firms enter the market (Foster et al., 2002). A
An
OE
CD
Bro
wo
L e c tur
ylnO dae
R
OECD INFORMATION TECHNOLOGY OUTLOOK 2008 – ISBN 978-92-64-05553-7 – © OECD 2008292

6. ECONOMIC IMPLICATIONS OF BROADBAND
se_it E ditin
es
eu
le
Box 6.3. The role of intangible capital and other complementary factors for ICTs
For broadband to achieve its impacts, it requires other ICTs and a range of other complementary,often intangible, assets. Basu et al. (2003) argue that the United States-United Kingdom TFPdifferentials from 1995 onwards can be explained by a combination of unmeasured investments inintangible organisation capital and the role of ICTs as a GPT. The existence and importance ofintangible capital helps to explain both the Solow productivity paradox of the 1980s and
early 1990s and why productivity growth remained strong after 2000 when ICT spending felldramatically (Baily, 2003). The idea is that it takes time and resources to learn how to use ICT (orany GPT) properly. Initially productivity may even decline as resources are allocated to learning. IfICTs are used to do the same things in the same way as they were done before or if the purpose ofthe investment in ICTs is not clear, the impact will be limited. Improvements in workplaceorganisation, enabled by ICT, have also improved productivity. The main driver of productivityimprovements has been the changes and innovations that ICT investment has enabled, such as there-organisation and streamlining of existing business processes, including order and deliverytracking, inventory control and accounting services (Atrostic and Nguyen, 2006). When consideringICTs as a GPT, the expected economic impact will be far greater than what is predicted by justexamining the capital investment associated with ICTs because this does not take into account thewidespread complementary innovations enabled by ICTs (Brynjolfsson and Hitt, 2000).
The effects of organisational change may rival the effects of changes in the production processin terms of their impact on productivity at the firm level (Black and Lynch, 2001). The ability tocreate economic value from intellectual assets is highly contingent on the management capabilitiesof individual firms and the implementation of appropriate business strategies. The ability of ICTsto enable complementary organisational investments in business processes and work practicesalso constitutes a significant component of the value of ICTs. These investments, in turn, lead to
productivity gains by allowing firms to reduce costs and increase output quality, for example in theform of new products or improvements in intangible aspects of existing products, such asconvenience, customisation, timeliness, quality and variety (Brynjolfsson and Hitt, 2000). However,the productivity effects of these complementary factors may take time to appear. The longer-termcontributions of computerisation to productivity and output at the firm level have been found to beup to five times greater than the short-term contributions (Brynjolfsson and Hitt, 2003).
Quantitative studies of the effects of intangible investments, such as organisational changes andmanagement practices, on growth are relatively recent and require new frameworks andmeasurement practices (OECD, 2006b). Corrado et al. (2006) argue that the conventionally measuredUS capital stock is underestimated by some USD 1 trillion and the business capital stock by up toUSD 3.6 trillion (equivalent to around 29% of United States GDP in 2005, or around 12% of UnitedStates business capital stock). Adding this capital to the standard growth accounting frameworkchanges the observed patterns and sources of United States economic growth significantly. Inparticular, the rate of change of output per worker increases more rapidly in the presence ofintangible capital, and capital deepening becomes the dominant source of labour productivitygrowth. Oliner et al. (2007) also provide preliminary estimates of the growth contributions ofintangible capital using an augmented growth accounting system. Intangible investment is
estimated to have surged during 1995-2000, boosting growth in aggregate output, but thenretreated during 2000-06. The contribution of intangible capital deepening to growth follows thegeneral pattern for IT capital, high during 1995-2000 and then falling. This similarity reflects thestrong association between intangible capital and IT capital. Nevertheless, intangible capitalincreases less rapidly than IT capital in each period, and particularly during 1995-2000, as a resultof the quality-adjusted declines in computer prices that lower the user cost for IT capital.
An
OE
CD
Bro
wo
L e c tur
ylnO dae
R
OECD INFORMATION TECHNOLOGY OUTLOOK 2008 – ISBN 978-92-64-05553-7 – © OECD 2008 293

6. ECONOMIC IMPLICATIONS OF BROADBAND
se_it E ditin
es
eu
le
lack of competitive conditions may keep unproductive firms in business and thus drive
down aggregate productivity growth.
Most of these studies looked at the aggregate level, while pointing out the importance
of disaggregation in order to better understand the mechanisms and conditions that affect
productivity. Overall, sector level evidence on the impact of ICTs generally confirms
aggregate level evidence, namely that investing in ICTs alone is not enough to reap the
benefits. However, at lower levels of aggregation, the effects may be larger, as broader
aggregation may hide substantial productivity and performance differences at the sector
and firm level.
Broadband can also be expected to have a very large impact on the services sector as
it enables dispersion of production and international trade in services that were not
previously tradable or contestable. Furthermore, the increased management,
communication and information processing possibilities offered by broadband can be
expected to become especially important in the services sector.
The impact of the “C” in “ICT”
This section focuses on research that has singled out the “C” in ICTs, i.e. the
communication factor, and has examined its impact on productivity.15 Whereas rapid
developments in ICTs have tended to focus on advances in the “I” of ICTs, greater attention
has recently been paid to the “C”, in particular with the advent of broadband and wireless
(broadband) technologies.
While initial productivity gains from ICT investment are most likely to have stemmed
from investment in IT itself, investments in the “C” link individual computers and result in
gains from network effects. The “C” saw little change until relatively recently, but as a
result of infrastructure roll-out, regulatory changes and technological advances in wired
(particularly optical) and wireless networks, a range of sources of potential productivity
gains becomes possible, owing not only to increased sharing and networking, but also to
updating of information in real time, on-the-run decision making and more flexible
working relationships than what was feasible without the more advanced “C” in ICT. The
productivity gains likely to lie ahead are expected to be large with the spread of broadband,
but will require even more intangible investment, especially in organisational change.
For example, earlier studies have shown that computer networks have a positive
impact on total factor productivity in the United States (Atrostic and Nguyen, 2002) and the
United Kingdom (Criscuolo and Waldron, 2003). Other studies have found a positive impact
on labour productivity from using computer networks to link business processes in firms,
especially in conjunction with the creation of intangible assets through investments in
human and organisational capital, with the effects varying by sector (Clayton and
Goodridge, 2004; Brynjolfsson and Yang, 1999). Fuss and Waverman (2006) attribute
Canada’s lagging productivity growth relative to the United States16 to less intensive use of
ICTs, based on a range of variables, such as telecommunications and PC penetration,
mobile and fixed telecom retail and supply prices, IT prices, and digital mainlines.
Broadband potentially magnifies and widens these effects.
Farooqui (2005) has taken the use of telecommunications services by United Kingdom
firms as a proxy for external relationships in work. He finds that employees’ use of the
Internet has a positive effect on productivity beyond what can be explained by IT
investment. The purchase of external infrastructure constitutes the bulk of spending on
An
OE
CD
Bro
wo
L e c tur
ylnO dae
R
OECD INFORMATION TECHNOLOGY OUTLOOK 2008 – ISBN 978-92-64-05553-7 – © OECD 2008294

6. ECONOMIC IMPLICATIONS OF BROADBAND
se_it E ditin
es
eu
le
communications technology equipment for firms outside the communications sector
(which in turn accounts for less than 15% of investment in telecommunications products).
Use of telecommunications is found to have a significant and positive effect on output in
both manufacturing and services. The author suggests that the impact of IT through the
management of complex supply chains and external links is greater than its impact as a
driver of internal efficiency.
Richer communications structures can lead to multitasking, which, in turn, drives
productivity up to a certain point. For example, the structure and size of workers’
communication networks have been found to be highly correlated with performance (Aral
et al., 2007). Both synchronous communication technologies (e.g. telephone and video-
conferencing) and asynchronous communication technologies (e.g. e-mail, sharing large
data and graphics files) support the ability of geographically dispersed groups to
collaborate seamlessly. It is not the speed of communication that makes the difference, but
its use to reorganise work and perform tasks more efficiently. This confirms that it is not
ICT equipment but how it is used that matters most and this applies to communications
and broadband.
Oliner and Sichel (2000) and Oliner et al. (2007) take communications equipment into
account as a vital component of computer networks along with computer hardware and
software. These three components determine the contribution of the use of ICTs to growth.
Their results are broken down for the periods 1973-95, 1995-2000, and 2000-06. While
computer hardware accounted for the largest contribution in each of the three periods,
followed by software and then communications, the contribution of communication
equipment to labour productivity growth increased relative to that of computer hardware
and software, with the contribution of the latter two decreasing while that of
communications equipment remained constant, probably in part linked with the
increasing efficiency and importance of communications networks. Baldwin and Sabourin
(2002), in a study of Canadian manufacturing firms, also differentiated between three
groups of advanced ICTs: software, network communications and hardware. They found
that establishments that had adopted network communication technologies experienced
significantly higher productivity growth than those that had not, and that the largest gains
were in establishments that had adopted combinations of all three types of ICTs.
By focusing on the networking capabilities of communications equipment, Fuss and
Waverman (2005) attempted to capture the spillovers from the diffusion of computers,
software and telecommunications. They model diffusion of telephones and computers as
an increase in the capital stock and also account for the interaction between the
digitisation of telecommunications networks and the diffusion of computers, which they
find to have a positive impact on productivity. In addition to a positive impact from ICT-
related capital deepening, spillovers are found to explain at least some of productivity
differences between the United States and some other countries.
Most of the studies discussed so far have considered computers and ICTs as a form of
capital to be used as an input into the production process. However, computers can also be
used to transform business processes; in this context, computer networks are examined as
a productivity-enhancing technology by Atrostic et al. (2002) in a study covering Denmark,
Japan and the United States. Different types of networks are distinguished, such as
wireless, Internet, intranet, and electronic data interchange (EDI). The results for Japan and
the United States indicate that manufacturing firms/plants with networks have higher
An
OE
CD
Bro
wo
L e c tur
ylnO dae
R
OECD INFORMATION TECHNOLOGY OUTLOOK 2008 – ISBN 978-92-64-05553-7 – © OECD 2008 295

6. ECONOMIC IMPLICATIONS OF BROADBAND
se_it E ditin
es
eu
le
labour productivity and tend to be larger than those without networks. Furthermore, the
use of both intra-firm and inter-firm networks is found to be positively correlated with the
level of TFP at the firm level. For Japan the productivity impacts are also shown to differ by
type of network. In Denmark, firms with networks were found to achieve higher growth
rates both of value added and employment, leading to a lower rate of labour productivity
growth.
Some of the diverging effects of different types of network use have been disentangled
by Atrostic and Nguyen (2006) who also report further evidence confirming the positive link
between computer networks and productivity. In particular, online supply chain activities
driven by communications networks, such as inventory control, order tracking, transport
and logistics management, are consistently positively linked to productivity and
productivity impacts tend to be higher in newer plants which are likely equipped with
faster and more effective communications networks.
The productivity impacts of broadband
Broadband is an enabler of change – it has an impact on the economy and
restructuring when it is combined with other ICTs, such as computer hardware and
software, and complementary factors such as skills and organisational change. The study
of the economic impact of broadband is complicated by data availability and measurement
problems, reminiscent of the early days of the study of the impact of ICTs more generally
and Solow’s productivity paradox17 (IT is everywhere except in the productivity statistics).
Another factor complicating the identification of the economic impact of broadband is that
the impact is likely to be large in the services sector (non-farm, non-manufacturing
industries) where output and productivity changes are not yet well captured. Furthermore,
data on the availability and even the adoption of broadband do not necessarily adequately
reflect its use and the impacts of use. Merely investing in acquiring the technology does not
suffice to achieve productivity gains – here as elsewhere, what matters is how it is used. It
is also difficult to establish causality owing to the difficulty of disentangling the effects of
infrastructure availability and economic growth.
Nevertheless, studies are increasingly being undertaken on the specific productivity
impacts of broadband. For example, Lehr et al. (2006) use a cross-sectional panel data set at
the zip-code level for the United States to examine the impact of broadband on variables
such as employment, wages and industry mix. They find some evidence that broadband
positively affects economic activity. In particular, they find evidence of more rapid growth
in employment and the overall number of businesses and in IT-intensive sectors. However,
they also find a negative impact on the growth rate of salaries in areas with earlier access
to broadband. This result is not yet well understood and is being investigated.
Analysis for Australia18 finds a positive productivity impact from ICTs, focusing on
effects in new industries, such as the film and animation industry, where broadband can
be expected to matter even more than in “traditional industries”. The analysis could not
distinguish the effect of broadband on e-commerce, but this is not very surprising since
much e-commerce can also be done with narrow band. The results confirm that what one
does with ICTs and broadband matters more than having it.
A project constructing ICT-related indicators, including broadband, based on
microdata has been developed under the auspices of Eurostat. It aims to build a set of
indicators of ICT intensity19 and impact that are comparable across countries and
An
OE
CD
Bro
wo
L e c tur
ylnO dae
R
OECD INFORMATION TECHNOLOGY OUTLOOK 2008 – ISBN 978-92-64-05553-7 – © OECD 2008296

6. ECONOMIC IMPLICATIONS OF BROADBAND
se_it E ditin
es
eu
le
compatible with macro databases such as EU KLEMS in an attempt to bridge the gap
between macro and micro data approaches, which can subsequently be used in
international comparisons and analysis. One of the objectives of the project is to help
identify the impact of ICT readiness and intensity on firm-level performance. Building on
earlier analysis by Hagén and Zeed (2006), new results for Sweden for 2002 appear to point
to a negative impact from faster broadband when looking at gross multi-factor productivity
(MFP) and to a positive impact on value added labour productivity. A possible explanation
may be simultaneous large capital investments. However, by 2004 the impact on both
variables is positive, suggesting that the benefits of broadband appear over time. Data for
the Netherlands show that by 2004, only 5% of firms had reached the highest level of ICT
use. First results from analytical work show that broadband is very significant for
determining the production frontier, but that, conditional on using broadband, the
distance from the frontier is determined by ICT usage (the level of ICT maturity), without a
significant contribution from broadband intensity.
Sadun and Farooqui (2006) find broadband adoption to be related to e-commerce, ICT-
equipped labour intensity and external demand. Investment in hardware was found to be
higher in regions and sectors with broadband availability especially among United
Kingdom domestic firms in non-IT intensive industries. Broadband users are also more
likely to have multiple business links, and multiple links with broadband technology
improve labour productivity. Firms with a large share of labour equipped with broadband
have higher productivity.
As direct data on broadband are under constant development and since broadband
complements other IT tools, related measures can be used to gauge potential broadband
impacts. Several possible measures are interlinked: data on the hardware capital stock, the
software capital stock, the number of employees using ICT, use of telecommunications
services and e-commerce can each tell part of the story. Results for the United Kingdom
show that the impact of IT varies greatly across sectors and is highest in the services sector
(Farooqui, 2005). Firm age also appears to matter, with younger manufacturing firms
achieving greater benefits than older firms. In the services sector, however, there is a time
lag due to a learning effect: IT capital and networks are used together to build up
knowledge bases of clients and services provision. A strong relationship also exists
between spending on telecommunication services and productivity, and between
investment in IT and spending on communication technologies, the latter reinforcing the
effect of IT investment.
The importance of attaching geographical location to broadband data is highlighted by
Di Gregorio (2006). Anecdotal evidence reveals that local businesses and home-office
workers experience benefits such as efficiencies in administration, purchasing and less
time searching for information.
Although few studies have estimated macroeconomic effects on growth and
employment and tried to model future impacts, a new study for the European Commission
has undertaken this kind of research (see Box 6.4).
Overall, as Lehr et al. (2006) point out, although broadband appears to have positive
measurable economic impacts, it has been difficult to draw precise conclusions owing to
the lack of firm-level (and employee-level), geographically disaggregated time-series panel
data. It is nonetheless obvious that as broadband spreads throughout the economy,
changes are taking place in the way business is done, work is organised and resources are
An
OE
CD
Bro
wo
L e c tur
ylnO dae
R
OECD INFORMATION TECHNOLOGY OUTLOOK 2008 – ISBN 978-92-64-05553-7 – © OECD 2008 297

6. ECONOMIC IMPLICATIONS OF BROADBAND
se_it E ditin
es
eu
le
allocated. These effects are observable especially in some very large services sectors which
account for a large share of the total economy, such as communications, financial services,
business services, transport, real estate, travel and tourism and retail, and in growing
impacts on public services such as health,20 education,21 government and addressing
environmental challenges. Content provision and advertising are also rapidly changing in
the face of broadband. As a result, larger effects than those currently identified can be
expected.
The impact from informational mobility
A relatively new aspect of ICTs that is rapidly gaining in importance is that ICT devices
are becoming ever more portable (laptops and other portable devices), and that widespread
fixed and mobile broadband increasingly allows “informational mobility”. This makes the
“C” in ICT increasingly important. Increased ICT penetration is no longer a major source of
productivity growth in developed countries,22 but new features (such as portability and
wireless connectivity) can boost productivity in activities requiring information and
communication. Mobility has become an integral part of communications.
Maliranta and Rouvinen (2006), in a study for Finland, find that a computer with only
processing and storage capabilities boosts labour productivity by 9%, portability boosts it by
32%, wireline connectivity by 14% and wireless connectivity by 6%. As the study was
carried out on data for 2001, when wireless connectivity was still in its infancy, the impacts
are likely to have increased significantly with more intensive use of wireless devices and
mobile broadband. However, “selectivity” is an issue, as the more productive workers may
be those who get the better equipment.
The economic benefits of mobile phones in developing countries are often studied.
McKinsey (2006), in a study for China, India and the Philippines, estimates that mobile
phones may add as much as 8% to a nation’s GDP. The contribution has three components:
a direct impact from mobile phone operators, and indirect impacts from other firms
operating in the mobile sector (e.g. hardware, software and handset vendors), mobile
content providers, and end user benefits (e.g. increased productivity of mobile workers,
Box 6.4. Modelling the macro-impacts of broadband deployment and use in the European Union
A recent study for the European Commission collects evidence of the economic impactof broadband Internet on labour productivity, employment level and growth. Theinvestigation focuses on the improvement of business processes through the use of onlinetechnologies and particularly of broadband. According to the model on which the study isbased, broadband leads to net growth of the European gross value added of EUR 82 billion(+0.71%). Employment creation in new activities compensates for job loss due to processoptimisation and structural displacements with net creation of jobs in 2006. However,
depending on broadband access and levels of use, impacts are not uniform acrossEuropean countries, with some seeing more positive broadband-related results thanothers. The study concludes that the key to significant positive impacts are not only accessto the infrastructure but also the integration of value-added online services in companyprocesses. According to the study, in the best case scenario, broadband could lead to thecreation of more than 2 million jobs in Europe in the period until 2015.
Source: MICUS, 2008.
An
OE
CD
Bro
wo
L e c tur
ylnO dae
R
OECD INFORMATION TECHNOLOGY OUTLOOK 2008 – ISBN 978-92-64-05553-7 – © OECD 2008298

6. ECONOMIC IMPLICATIONS OF BROADBAND
se_it E ditin
es
eu
le
increased access to employer, family and friends, and improved security). Similarly,
Waverman et al. (2005) find that mobile telephony has a significantly positive effect on
economic growth and that the effect in developing countries may be twice that in
developed countries. Furthermore, as mobile telephony will increasingly be related to
wireless broadband, future impacts may be even larger. Mobile phones increasingly
constitute a working tool, not simply for communication but because of the increasing
number of applications and tasks they support and the increasing capability for mobile
Internet access. As mobile Internet access increases user flexibility in terms of time and
location of use, it can be expected to add additional benefits
Wireless devices can also have a huge impact on productivity in transport, delivery
and courier services, for example. Mobile broadband devices can help drivers to identify
optimal routes, in terms of delivery points, distance, traffic congestion, etc., and increase
the number of deliveries that can be made in a given day. Mobile devices, when used in
conjunction with RFID technologies, for example, can also be used to download
information about stocks in different sales/delivery points while “on the road” so that
these can be managed more efficiently. As wireless technologies become increasingly
widespread, their ability to function anywhere in real time constitutes an additional
determinant of competitiveness.
The productivity impact of ICT and broadband-enabled globalisation
Some of the beneficial effects of ICT- and broadband-enabled offshoring in the
services sector are emphasised by Mann (2003), who suggests that the globalisation of
production of IT and ICT-enabled services should result in lower prices for ICTs and ICT-
related goods and services, encouraging their diffusion and use throughout the economy
and enhancing productivity. Abramovsky and Griffith (2005), in a study using data for the
United Kingdom, argue that the positive effects from services offshoring arise in the form
of productivity gains stemming from the increased fragmentation and specialisation
enabled by ICTs.23 Amiti and Wei (2006) also find positive effects of services offshoring on
United States manufacturing productivity (contributing around 11% to labour productivity
growth, versus only about 5% from materials offshoring).
Some studies have been devoted to the productivity impacts of services outsourcing
and offshoring.24 For example, Görg et al. (2005) find that plant-level heterogeneity matters
when analysing the productivity effects of international services sourcing. Their plant-
level study for Ireland takes characteristics such as plant ownership (domestic or foreign)
and whether or not the plant is an exporter into account. They find positive effects from
both material and services outsourcing, but only for foreign-owned exporting plants. While
there is a positive effect from materials outsourcing for domestic exporters, no such effect
is observed for services outsourcing. It is suggested that being part of a foreign
multinational and an international production network may provide advantages such as
better knowledge about how and where to procure competitively priced services, resulting
in lower search costs. It may also provide negotiating advantages with suppliers, further
lowering the price of intermediate services, and output economies of scale may lower the
unit cost of sourced services.
Broadband thus appears to be very important for reaping potential benefits from ICTs.
It is instrumental in efficiency and productivity gains and increased competitiveness not
only from ICTs, but also from complementary factors that increase efficiency and raise
productivity, such as innovation and organisational change.
An
OE
CD
Bro
wo
L e c tur
ylnO dae
R
OECD INFORMATION TECHNOLOGY OUTLOOK 2008 – ISBN 978-92-64-05553-7 – © OECD 2008 299

6. ECONOMIC IMPLICATIONS OF BROADBAND
se_it E ditin
es
eu
le
Broadband and SMEsSMEs are a very large share of OECD countries’ businesses. In 2003, 99.8% of
enterprises in the enlarged EU were SMEs (< 250 employees) and small enterprises
(< 50 employees). They accounted for over 95% of manufacturing enterprises and an even
higher share of many service industries. In many OECD countries, micro-enterprises
(< 10 employees) account for more than 90% of enterprises in computer services and
related activities, and for large shares of R&D and innovation. SMEs tend to generate two-
thirds of private-sector employment, and are the principal creator of jobs. High firm entry
rates have been recorded in dynamic services sectors, such as business services or ICT-
related industries, health and age-related services.
ICTs and e-business applications can offer SMEs a wide range of benefits in terms of
efficiency and market access, reducing costs and increasing the speed and reliability of
transactions. However, even though ICT connectivity (PCs and Internet) is widespread in
businesses of all sizes, small businesses tend to be slower than large ones to adopt new
ICTs and e-business applications, mainly because of a perceived lack of applicability and
uncertain returns (OECD, 2005; Vickery, 2005). In a survey conducted among UK SMEs by BT
research,25 78% cited speed and flexibility as a reason for broadband uptake. Voice over
Internet Protocol is used by 20% of SMEs and a further 23% indicated they intended using
VoIP within a year, although use appears to decrease with the size of the SME.
The impact of ICTs on SMEs
ICTs and broadband allow SMEs to buy services they previously could not afford, for
example, IT and IT-enabled legal, accounting, and advertising services, and managed
services provided by broadband providers such as application service provision (ASP). A
study by Analysis (reported in The Register, 2007) based on a survey of 184 SMEs in France,
Germany and the United Kingdom estimated that SME spending on broadband-managed
services was some EUR 5.7 billion in 2006 and was forecast to increase by more than
EUR 4 billion in western Europe by the end of 2011.
Canadian survey data show generally high connectivity levels for Canadian businesses
of all sizes, with broadband connectivity now the norm, and the use of ICTs, e.g. for Web
site development and use and purchasing online has increased substantially over the
period 2000-06. However, the growth of more sophisticated e-business activities,
e.g. transactional applications like selling online, remains slow and concentrated among
large firms and a few sectors. ICTs in general, and e-business activities in particular, affect
productivity and competitiveness, and the lag in the adoption of e-business applications by
SMEs, and the nature of the perceived barriers, raise concerns. Targeted sector-specific
interventions may be necessary in some cases, both by governments and the private sector,
to help SMEs in lagging sectors to increase and more efficiently use broadband (Neogi et al.,
2003; Neogi and Brocca, 2007).
At the same time, ICTs and broadband-enabled trade in services offer SMEs increased
market access abroad and opportunities to become part of the value chain of production of
other, larger firms. A survey by Value Leadership (2005) among European SMEs in the IT
sector present in India found that the advantages included lower costs, ease of hiring
talented workers (in fact, size, flexibility and quality of the labour pool was found to be at
least as important as labour cost advantages), greater flexibility and scalability of
operations, market access, and shorter product development cycles. Broadband also
An
OE
CD
Bro
wo
L e c tur
ylnO dae
R
OECD INFORMATION TECHNOLOGY OUTLOOK 2008 – ISBN 978-92-64-05553-7 – © OECD 2008300

6. ECONOMIC IMPLICATIONS OF BROADBAND
se_it E ditin
es
eu
le
increasingly enables people to start small businesses from home, which can contribute to
a more dynamic and entrepreneurial business sector. ICTs and broadband networks also
increasingly allow small firms to increase their R&D activities and to participate in larger
research networks (Hunt and Nakamura, 2006).
ConclusionWhile ICTs have been employed for many decades, it is only relatively recently that
widespread networking of ICTs has taken place, enabling them to play an increasingly
pivotal role in an ever-rising number of activities. This development has been enabled and
greatly enhanced by the roll-out of broadband Internet. Almost every aspect of economic
activity and everyday life is affected by broadband-enabled ICTs, and rapid technological
developments and a continuous stream of new applications mean that ICTs are likely to
become even more pervasive.
There is significant heterogeneity in the use of ICTs and broadband at sector and firm
levels, and optimal diffusion and use of these technologies would mean significant gains
in terms of productivity and efficiency and overall welfare. For example, flexible working
practices enabled by broadband can help to increase labour market participation and
reduce problems related to transport (e.g. pollution and congestion). They can help address
concerns related to ageing populations and improve functions in the health sector, for
example by monitoring patients at a distance. On the other hand, global restructuring, and
ICT-enabled offshoring and globalisation of the services sector, raises the challenge of how
OECD countries should adjust to a new global environment with rapidly growing
economies such as China and India, and deal with short-term adjustment costs in
employment and the geographic location of economic activities.
The government’s role in maximising the economic benefits of broadband is multiple.
Policies and practices encouraging investment, innovation and competition in the
development of infrastructures and the delivery of services should aim at reaching full
diffusion and mainstreaming of ICTs and broadband where this has not already taken
place. A competitive business environment is also necessary to stimulate productivity
gains, innovation, and the development and delivery of improved products and services in
flexible and efficient markets (see OECD 2008a). It is important that policies that facilitate
change are accompanied with those supporting adjustment.
Governments help create the macroeconomic framework conditions for a favourable
investment and innovation climate and they play an important role as regulators, in
setting standards, as infrastructure providers, customers and, innovators. Government-
funded basic research has often led to the development of ICT-related innovations
(see Chapter 3). Overall, new broadband-enabled technologies and platforms, products and
services, skills and jobs are changing the ways of consuming, producing and innovating
and recent policies supporting these changes are discussed in Chapter 7.
Notes
1. The chapter does not look at the economic impact of e-commerce, the impact of broadband onbusiness-to-consumer relations or on individuals (see Chapter 4), or the use of broadband bygovernments for on-line services. See the extensive review of broadband impacts and policies inOECD (2008a), Broadband Growth and Policies in OECD Countries, OECD, Paris (monitoring theRecommendation of the OECD Council on Broadband Development), and in OECD (2008c).
An
OE
CD
Bro
wo
L e c tur
ylnO dae
R
OECD INFORMATION TECHNOLOGY OUTLOOK 2008 – ISBN 978-92-64-05553-7 – © OECD 2008 301

6. ECONOMIC IMPLICATIONS OF BROADBAND
se_it E ditin
es
eu
le
2. The OECD Broadband Portal provides access to a range of broadband-related statistics gathered bythe OECD at www.oecd.org/sti/ict/broadband; see also OECD, 2007a.
3. Protecting users' security is crucial as the Internet is becoming the platform for voice, content, dataand a core part of the economic infrastructure. Data security breaches in 2005 are estimated tohave caused USD 100 billion in damages, more than the United States illegal drug trade (Swindle,2006, p. 18).
4. And vice versa : ICTs without broadband would not nearly be as effective and transformative. AsAtkinson and McKay (2007, p. 15) put it: “without a World Wide Web to connect to, manycomputing devices acted as nothing more than glorified typewriters”.
5. However, asymmetric connections could become a bottleneck for multiple-play services thatrequire fast upload speeds. The move towards more symmetric bandwidth as in fibre networksmay be important as multiple play services increase usage of the upstream path (Okamoto andReynolds, 2006).
6. Innovation can help address major global challenges such as climate change, energy security andhealth. It can help boost income and productivity growth, the key to fighting poverty and othersocial ills. Countries, regions, cities and firms can become more competitive, and better preparedto face the challenges of globalisation. These issues are being addressed in the OECD InnovationStrategy, launched in 2007.
7. Survey results for EU10 countries show that ICTs are a key enabler and driver of process innovationin most industries: 32% of firms (by employment share) had introduced "new or significantlyimproved internal processes" in the 12 months prior to the interview, and 75% of these claimedthat these process innovations were "directly related to or enabled by ICT". e-Business W@tch, ChartReport 2006, Slide 8, www.ebusiness-watch.org/resources/charttool.html.
8. For example, the bulk of software patents in Europe are filed by companies whose primary activityis not in the software sector (Hall et al., 2007).
9. See www.businessweek.com/ap/financialnews/D8O5330O0.htm?chan=search.
10. See http://en.wikipedia.org/wiki/CANTAT-3.
11. See www.wsws.org/articles/2007/jan2007/taiw-j09.shtml.
12. Financial Times, 29 December 2006.
13. See www.businessweek.com/magazine/content/07_03/b4017068.htm?chan=top+news_top+news+index_businessweek+exclusives, and www.wsws.org/articles/2007/jan2007/taiw-j09.shtml.
14. See www.businessweek.com/magazine/content/07_03/b4017068.htm?chan=top+news_top+news+index_businessweek+exclusives.
15. Röller and Waverman (2001), in a study for 21 OECD countries over a 20-year period, find evidenceof a positive and causal impact of telecommunications infrastructure on economic growth,especially once a critical mass of infrastructure, which appears to be near universal service, is inplace.
16. Labour productivity growth over the period 1995-2001 was 1.76% in Canada versus 2.49% in theUnited States, and the ICT contribution was 1.25% in Canada and 2.14% in the United States (Fussand Waverman, 2006).
17. It is often argued (e.g. Lehr and Lichtenberg, 1999) that this productivity paradox is largely ameasurement problem closely related to the problem of measuring output and productivity of theservice sector. This is especially so since computers are used most intensively in the service sectorand in the service functions of non-service sector firms (see for example van Welsum and Vickery(2005) and OECD (2004a, 2006a, Chapter 6). The same argument is likely to hold for broadband.
18. Joint OECD WPIIS/WPIE Workshop, “The economic and social impacts of broadband communications:From ICT measurement to policy implications”, London, 22 May 2007. Presentations available at:www.oecd.org/document/48/0,3343,en_2649_33757_38697712_1_1_1_1,00.html.
19. The continued importance of using such indicators in analysis is shown in a recent study thatfound evidence of a link between IT intensity and productivity acceleration in the United States(Corrado et al., 2007).
20. The potential impacts of broadband networks in health care are multiple. For example, patientshave greater access to health-related information and opinion; medical research can be enhanced;grids and distributed computing allow faster and more complex calculations; diagnostics andsecond opinions are facilitated by electronic images; remote patient monitoring can reduce
An
OE
CD
Bro
wo
L e c tur
ylnO dae
R
OECD INFORMATION TECHNOLOGY OUTLOOK 2008 – ISBN 978-92-64-05553-7 – © OECD 2008302

6. ECONOMIC IMPLICATIONS OF BROADBAND
se_it E ditin
es
eu
le
congestion in hospitals and enhance the quality of care provided; better records may reduce thetime patients have to wait, improve patient identification, drug prescription and avoid druginteractions; and medical records systems can improve the efficiency of hospitals and medicalpractices and save administrative costs (see OECD, 2004a, Chapter 5).
21. There are many applications and uses of ICTs in education which can be enhanced by broadband,from young pupils searching for information to do their homework to collaborative R&D networks;online education and tutoring; educational services and software; open and distance learning;production and access to academic and educational journals, and books, knowledge and researchcontent. See also Brynjolfsson et al., 2006, for “long-tail” implications of digitisation.
22. As ICTs are ubiquitous, merely investing in ICT is unlikely to yield a competitive advantage.Instead, performance differences depend on the way ICTs are used (e.g. Atrostic and Nguyen, 2006).
23. Abramovsky and Griffith (2005) report that establishments using the Internet outsourced about10.6% more than those that did not. There is an endogeneity issue when firms start to use theInternet to place orders if they anticipate starting to outSource: using the Internet increased theprobability of offshoring by about 2%. These results suggest that when a firm either invests in ICTsor uses the Internet it increases the probability of offshoring by 6%. When it does both theprobability it offshores increases by about 12%.
24. In the absence of official data and measures on outsourcing and offshoring each of these studiesuse slightly different proxies, making comparisons difficult.
25. See http://businessclub.bt.com/stateofthenation.pdf.
References
Abramovsky, L. and R. Griffith (2005), “Outsourcing and offshoring of business services: How importantis ICT?”, Institute for Fiscal Studies, Working Paper WP05/22.
Amiti, M. and S. Wei (2006), “Service offshoring and productivity: Evidence from the United States”,NBER Working Paper No. 11926, January.
Aral, S., E. Brynjolfsson and M. van Alstyne (2007), “Information, technology and informationworker productivity: Task level evidence”, draft 6 February, http://papers.ssrn.com/sol3/papers.cfm?abstract_id=942310.
Atkinson, R.D. and A.S. McKay (2007), Digital prosperity – Understanding the economic benefits of theinformation technology revolution, The Information Technology and Innovation Foundation Report,March.
Atrostic, B.K. and S. Nguyen (2002), “Computer networks and United States manufacturing plantproductivity: New evidence from the CNUS data”, Center for Economic Studies, Working Paper 02-01,January.
Atrostic, B.K. and S. Nguyen (2006), “How businesses use information technology: Insights formeasuring technology and productivity”, United States Bureau of the Census, Center for EconomicStudies, CES 06-15, June.
Atrostic, B.K., P. Boegh-Nielsen, and K. Motohashi (2002), “The effect of computer networks on firmperformance: Japan, Denmark and the United States”, Center for Economic Studies, United StatesDepartment of Commerce, OECD internal working document.
Baily, M. (2003), “Recent productivity growth: The role of Information Technology and otherinnovation”, article based on the keynote address delivered in November 2003 at the conferenceorganised by the Federal Reserve Bank of San Francisco’s Center for the Study of Innovation andProductivity on “Technology, Productivity, and Public Policy”.
Baldwin, J.R. and D. Sabourin (2002), “Impact of the adoption of advanced ICTs on firm performance inthe Canadian manufacturing sector”, OECD DSTI Working Paper 2002/1, OECD, Paris.
Basu, S., J.G. Fernald, N. Oulton and S. Srinivasan (2003), “The case of missing productivity growth: Or,does information technology explain why productivity accelerated in the United States but not inthe United Kingdom?”, NBER Working Paper 10010, NBER, Cambridge, MA.
Black, S.E., and L.M. Lynch (2001), “How to compete: The impact of workplace practices andinformation technology on productivity”, Review of Economics and Statistics, Vol. 83, No. 3, August.
An
OE
CD
Bro
wo
L e c tur
ylnO dae
R
OECD INFORMATION TECHNOLOGY OUTLOOK 2008 – ISBN 978-92-64-05553-7 – © OECD 2008 303

6. ECONOMIC IMPLICATIONS OF BROADBAND
se_it E ditin
es
eu
le
Bloom, N., R. Sadun, and J. van Reenen (2007), “Americans do I.T. better: United States multinationalsand the productivity miracle”, Centre for Economic Performance, CEP Discussion Paper No. 788,April.
Brynjolfsson, E. and Yang (1999), “The intangible costs and benefits of computer investments:Evidence from financial markets”, Revised 1999 version of a paper presented at the InternationalConference on Information Systems, Atlanta, GA, December, 1997.
Brynjolfsson, E. and L.M. Hitt (2000), “Beyond computation: Information Technology, organisationaltransformation and business performance”, Journal of Economic Perspectives, Vol. 14, No. 4, pp. 23-48.
Brynjolfsson, E. and L.M. Hitt (2003), “Computing productivity: Firm-level evidence”, Quarterly Journal ofEconomics, Vol. 84(4), pp. 793-808.
Brynjolfsson, E., Y. Hu and M. D. Smith (2006), “From Niches to Riches: Anatomy of the Long Tail”, MITSloan Management Review, Summer 2006, Vol. 47, No 4.
BT Business (2007), State of the small business nation, BT, April 2007, http://businessclub.bt.com/stateofthenation.pdf.
Carlaw, K.I., R.G. Lipsey, and R. Webb (2007), “The Past, Present and Future of the GPT-Driven ModernICT revolution”, Final (Blue) Report, Industry Canada, 27 March.
Clayton, T. and P. Goodridge (2004), “E-business and labour productivity in manufacturing andservices”, Economic Trends, No. 609, pp. 47-53, August.
Corrado, C.A., C.R. Hulten and D.E. Sichel (2006), “Intangible capital and economic growth”, NBERWorking Paper No. 11948, NBER, Cambridge, MA.
Corrado, C.A., P. Lengermann, E.J. Bartelsman and J.J. Beaulieu (2007), “Sectoral productivity in theUnited States: Recent developments and the role of IT”, Finance and Economics DiscussionSeries 2007-24, Division of Research and Statistics and Monetary Affairs, Federal Reserve Board,Washington DC.
Crafts, N. (2003), “Steam as a general purpose technology: A growth accounting perspective”,Department of Economic History, London School of Economics, Working Paper 75/03, May.
Criscuolo, C. and K. Waldron (2003), “E-commerce and productivity”, United Kingdom Office forNational Statistics, Economic Trends, Vol. 600, pp. 52-57, November.
David, P. (1990), “The dynamo and the computer: An historical perspective on the modern ProductivityParadox”, The American Economic Review, Papers and Proceedings of the Hundred and SecondAnnual Meeting of the American Economic Association, Vol. 80, No. 2, May, pp. 355-361.
Di Gregorio, J. (2006), “Development of broadband baseline data sources”, Power Point presentationprepared for the meeting of the OECD Working Party on Indicators for the Information Society,3-4 May, OECD, Paris.
Farooqui, S. (2005), “Information and Communication Technology Use and Productivity”, EconomicTrends, No. 625, December.
Fernald, J., D. Thipphavong and B. Trehan (2007), “Will fast productivity growth persist?”, FederalReserve Bank of San Francisco, FRBSF Economic Letter, Number 2007-09, 6 April.
Foster, L., J. Haltiwanger and C.J. Krizan (2002), “The link between aggregate and micro productivitygrowth: Evidence from retail trade”, NBER Working Paper No. 9120, NBER, Cambridge, MA.
Fuss, M. and L. Waverman (2005), “The networked computer: The contribution of computing andtelecommunications to economic growth and productivity”, Digital Transformation WorkingPaper, London Business School, May.
Fuss, M. and L. Waverman (2006), “Canada’s productivity dilemma: The role of computers andtelecom”, Bell Canada’s submission to the Telecommunications Policy Review Panel 2006,Appendix E-1.
Gibbard, S. (2007), “Geographic implications of DNS infrastructure distribution”, The Internet ProtocolJournal, Vol. 10, No. 1, March.
Görg, H., A. Hanley and E. Strobl (2005), “Productivity effects of international outsourcing: Evidencefrom plant-level data”, paper presented at the OECD Workshop on the Globalisation of Production:Impacts on Employment, Productivity and Economic Growth, Paris, 15-16 November.
Hagén, H-O. and J. Zeed (2006), “Does ICT use matter for firm productivity?” Paper prepared for theOECD Working Party on Indicators for the Information Society, 3-4 May, OECD, Paris.
An
OE
CD
Bro
wo
L e c tur
ylnO dae
R
OECD INFORMATION TECHNOLOGY OUTLOOK 2008 – ISBN 978-92-64-05553-7 – © OECD 2008304

6. ECONOMIC IMPLICATIONS OF BROADBAND
se_it E ditin
es
eu
le
Hall, B., G. Thoma and S. Torrisi (2007), “The Market Value of Patents and R&D: Evidence from EuropeanFirms”, NBER Working Paper No. 13426, NBER, Cambridge, MA.
Hippel, E. von (2005), Democratizing Innovation, The MIT Press, Cambridge, MA.
Hunt, R.M. and L.I. Nakamura (2006), “The democratization of United States research and developmentafter 1980”, Federal Reserve Bank of Philadelphia, Research Department.
International Telecommunication Union (ITU) (2006), ITU World Telecommunication Indicators 2006, ITU,Geneva.
International Telecommunication Union (ITU) (2007), “Bridging the digital divide”, Chapter 2 in WorldInformation Society Report 2007, ITU, Geneva.
Koellinger, P. (2006), “Impact of ICT on corporate performance, productivity and employmentdynamics”, e-Business W@tch, European Commission, DG Enterprise and Industry, Special ReportNo. 01/2006.
Lehr, W.H., C.A. Osorio, S.E. Gillett and M.A. Sirbu (2006), Measuring Broadband’s Economic Impact, Finalreport prepared for the US Department of Commerce, Economic Development Administration,February.
Maliranta, M. and P. Rouvinen (2006), “Informational mobility and productivity: Finnish evidence”,Economics of Innovation and New Technology, Vol. 15(6), September, pp. 605-616.
Mann, C.L. (2003), “Globalisation of IT services and white collar jobs: The next wave of productivitygrowth”, Institute for International Economics Policy Brief No. PB03-11, December.
McKinsey (2006), “Wireless unbound – The surprising economic value and untapped potential of themobile phone”, McKinsey and Company, December.
MICUS (2008), The Impact of Broadband on Growth and Productivity, study for the European Commission(DG Information Society and Media), September 2008, Düsseldorf
Neogi, P. K., A. Leduc and C. Peters (2003), “Internet Connectivity and E-Business Adoption by CanadianFirms: An Empirical Analysis”, paper presented to the 6th International Conference on ElectronicCommerce Research, Dallas, 23-26 October.
Neogi, P. K. and J. Brocca (2007), “E-Business Adoption by Canadian Firms: Is progress being made?”,paper presented to NAEC 2007, the 2007 Networking and Electronic Commerce ResearchConference, Riva del Garda, Italy, 18-21 October.
OECD (2004a), Information Technology Outlook 2004, OECD, Paris.
OECD (2004b), The Economic Impact of ICT; Measurement, Evidence and Implications, OECD, Paris.
OECD (2005), SME and Entrepreneurship Outlook 2005, OECD, Paris.
OECD (2006a), Information Technology Outlook 2006, OECD, Paris.
OECD (2006b), Creating Value from Intellectual Assets, Meeting of the OECD Council at MinisterialLevel 2006, OECD, Paris.
OECD (2007a), Communications Outlook 2007, OECD, Paris.
OECD (2007b), Participative Web and user-created content: Web 2.0, wikis and social networking, OECD, Paris.
OECD (2007c), “Global opportunities for Internet access development”, COM/DSTI/DCD(2007)3/FINAL,OECD, Paris.
OECD (2008a), Broadband growth and policies in OECD countries, OECD, Paris.
OECD (2008b), Remaking the movies: Digital content and the evolution of the film and video industries, OECD,Paris.
OECD (2008c), “Broadband and the economy”, DSTI/ICCP/IE(2007)3/FINAL, OECD, Paris.
Okamoto, Y. and T. Reynolds (2006), “Multiple play: Pricing and policy trends”, DSTI/ICCP/TISP(2005)12/FINAL, OECD, Paris.
Oliner, S.D and D.E. Sichel (2000), “The resurgence of growth in the late 1990s: Is InformationTechnology the story?”, Journal of Economic Perspectives, Vol. 14, No. 4, pp. 3-22.
Oliner, S.D., D.E. Sichel and K.J. Stiroh (2007), “Explaining a productive decade”, Preliminary versionprepared for the Brookings Panel on Economic Activity, 29-30 March.
An
OE
CD
Bro
wo
L e c tur
ylnO dae
R
OECD INFORMATION TECHNOLOGY OUTLOOK 2008 – ISBN 978-92-64-05553-7 – © OECD 2008 305

6. ECONOMIC IMPLICATIONS OF BROADBAND
se_it E ditin
es
eu
le
Oulton, N., (2001), “Why do foreign-owned firms in the UK have higher labour productivity?” in N. Pain(ed.), Inward investment, technological change and growth – The impact of multinational corporations on theUK economy, Palgrave, London.
Pilat, D. (2005), “The Economic Impacts of ICT – What Have We Learned Thus Far?” STI WorkingPaper 2005/6, OECD, Paris.
Sadun, R. and S. Farooqui (2006), “Broadband availability, use, and impact on returns to ICT in UKfirms”, paper prepared for the OECD Working Party on Indicators for the Information Society,3-4 May, OECD, Paris.
Swindle, O. (2006), Transcript of the event hosted by the Progress and Freedom Foundation on“Securing the Internet: The role of consumers, industry and government”, available at:www.pff.org/issues-pubs/pops/pop13.30securitysummittranscript.pdf.
The Register (2007), www.theregister.co.uk/2007/03/05/sme_broadband_demand/.
Value Leadership (2005), European IT companies in India – How European SMEs are leveraging offshorecapabilities to reignite growth, improve financial performance, and capture new markets, Frankfurt amMain.
Vickery, G. (2005), “ICT diffusion to business: Pursuing policy reform”, DSTI Information EconomyReport, DSTI/ICCP/IE(2005)6, OECD, internal working document.
Waverman, L., M. Meschi and M. Fuss (2005), “The impact of telecoms on economic growth indeveloping countries”, available at: http://web.si.umich.edu/tprc/papers/2005/450/L%20Waverman-%20Telecoms%20Growth%20in%20Dev.%20Countries.pdf.
van Welsum, D. and G. Vickery (2005), “Potential Offshoring of ICT-intensive Occupations”, Enhancingthe Performance of the Services Sector, OECD, Paris, pp. 179-204; report also available at: www.oecd.org/sti/offshoring.
An
OE
CD
Bro
wo
L e c tur
ylnO dae
R
OECD INFORMATION TECHNOLOGY OUTLOOK 2008 – ISBN 978-92-64-05553-7 – © OECD 2008306

ISBN 978-92-64-05553-7OECD Information Technology Outlook 2008
© OECD 2008
DB
ro
wse_it E ditio
n
es
eu
le
ylnO d
Chapter 7
ICT Policy Developments
Information and communication technologies are increasingly seen as a source of
innovation, growth, and employment. ICT policies are being integrated into long-term socio-economic strategies and co-ordinated across government, but levels ofco-ordination differ. This chapter outlines recent policy changes and continuities innational ICT policies. Highly prioritised policy areas include: fostering innovation in
and through ICT R&D, improving online government activities, spreadingbroadband, increasing the diffusion and use of ICTs, raising ICT skills andemployment, and supporting digital content development. Policies to promote RFIDapplications are relatively new, but dedicated programmes are in place in one half
of OECD countries. Lack of consistency in policy assessment and evaluation remainsan important weakness, including evaluation of broadband uptake and use.
An
OE
C
L e c tur
aeR
307

7. ICT POLICY DEVELOPMENTS
DB
ro
wse_it E ditio
n
es
eu
le
ylnO d
IntroductionInformation and communication technology (ICT) policies are increasingly integrated
into overall strategies for enhancing economic growth, employment and welfare in OECD
countries. They have shifted in the last decade from dealing with sector-specific
infrastructure issues towards the formulation of long-term strategies on how ICTs, the
Internet and other types of networks can enable information societies to achieve wider
socio-economic objectives.
The OECD Ministerial Meeting on the Future of the Internet Economy in June 2008
underlined the importance of ICTs and the Internet as a fundamental economic
infrastructure. The Seoul Declaration for the Future of the Internet Economy, adopted by 30 OECD
member countries, nine non-member economies and the European Community,
emphasised that ICT policies are no longer narrow sectoral policies but mainstream
economic policies which encompass creativity, convergence and confidence.1
Replies to the OECD IT Outlook Policy Questionnaire 2008 indicate that governments
continue to integrate ICTs into most aspects of business and societal activities, but
challenges relating to policy assessment and evaluation remain. Most OECD countries aim
to co-ordinate ICT policies with policies to support growth, generate employment, adapt
education systems to reduce “digital divides”, improve delivery of health care, and address
emerging challenges. E-government activities are a part of strategies to boost public-sector
efficiencies. ICTs are also increasingly used to address wider socio-economic issues at the
national level (e.g. social cohesion, ageing societies, national security) and globally
(e.g. climate change, energy-efficiency, global health issues).
This chapter first highlights current priorities in ICT policy-making and then describes
the changing ICT policy environment in OECD countries. Next, it turns to a more detailed
analysis of specific ICT policies and programmes. A discussion of national policy
assessment and evaluation efforts is followed by the chapter’s conclusion.
The analysis of trends in ICT policies and programmes is based on detailed
information provided by all OECD countries.2 Survey results have been analysed and
published four times, beginning with the OECD Information Technology Outlook 2002. This
makes it possible to follow over time the ICT policy environment covered by the survey: ICT
innovation, diffusion and use of ICTs, the business environment, infrastructure and
security issues of ICTs (see Annex Figure 7.A1.1 for areas covered).
Overview of ICT policy priorities and developmentsGovernments recognise ICTs’ potential as a major driver of innovation and economic
growth across industries. Strategies that aim to harness this potential are commonplace in
OECD countries and encompass policies aimed at:
● Individuals and citizens (e.g. information technology education).
● Business and industry (e.g. technology uptake).
An
OE
C
L e c tur
aeR
OECD INFORMATION TECHNOLOGY OUTLOOK 2008 – ISBN 978-92-64-05553-7 – © OECD 2008308

7. ICT POLICY DEVELOPMENTS
se_it E ditin
es
eu
le
● The public sector (e.g. government online activities and public sector transformation).
● Scientific research (e.g. broadband research networks and research clusters).
● Improving welfare (e.g. ICT R&D for better provision of health care or environmental
performance).
Regardless of their level of development, most OECD countries are developing long-
term ICT strategies. They typically aim to harness ICTs to promote economic growth and
employment and increase welfare; those with more widespread technology diffusion,
e.g. Finland, Japan and Korea, are weaving these strategies into broader visions of how
information and communication technologies can transform virtually all areas of society.
The increasing focus on ICTs as drivers of socio-economic change has led to a
somewhat decreased priority for more narrowly based improvements to the ICT business
environment as compared with survey results described in previous editions of the OECD
Information Technology Outlook. Governments continue to prioritise competition in domestic
ICT industries, but there appears to be less formulation of new policies and more
continuity in established policies. Moreover, ICT policies no longer concern the ICT sector
alone, but increasingly target ICT-related developments in other sectors, e.g. the
automotive and healthcare sectors.
Ranking ICT policy priorities
These trends are summarised in a composite ranking of replies to the OECD IT Outlook
Policy Questionnaire 2008. Table 7.1 lists the top ten policy priorities (for a detailed ranking,
see Annex Table 7.A1.1). The ranking is based on how many countries have specific ICT-
related policies (see Table 7.2) and their level of priority (measured by the number of
countries attributing high and increased priority, see Table 7.3). This section briefly
outlines the most prominent policy areas and noteworthy developments with regard to
policies not contained in the top ten.
At the top of the ranking stand government online activities and policies to promote
broadband uptake and use. A majority of countries attribute high priority to both areas
and they also featured prominently in past OECD Information Technology Outlooks, indicating
the continuing importance given to bringing the public sector online and building a high-
speed Internet economy to link citizens, business, researchers and the public sector
Table 7.1. Top ten ICT policy priorities, 2008
1 Government online, government as model users
2 Broadband
3 ICT R&D programmes
4 Promoting IT education
5 Technology diffusion to businesses
6 Technology diffusion to individuals and households
7 Industry-based and on-the-job training
8 General digital content development
9 Public sector information and content
10 ICT innovation support
Note: For a detailed ranking, see Annex Table 7.A1.1.Source: Based on detailed responses to the OECD IT Outlook PolicyQuestionnaire 2008.
An
OE
CD
Bro
wo
L e c tur
ylnO dae
R
OECD INFORMATION TECHNOLOGY OUTLOOK 2008 – ISBN 978-92-64-05553-7 – © OECD 2008 309

7. ICT POLICY DEVELOPMENTS
se_it E ditin
es
eu
le
(see also OECD, 2008a). There is increased focus on extending (affordable) broadband
access to rural areas, to persons with special needs and to disadvantaged minorities.
Two specific policies to foster innovation in ICTs feature among the top ten: ICTresearch and development (R&D) programmes and ICT innovation support. The former is
one of the most highly prioritised policy areas in the current survey and in previous OECD
Information Technology Outlooks, highlighting the sector’s role as a driver of scientific
advances, innovation and economic growth. Small- and medium-sized enterprises (SMEs)
Table 7.2. Summary of ICT policy replies, 2008, 2006, 2004 and 2002
Number of country responses
2008 2006 2004 2002
Co-ordination and priority setting 29 22 22 20
Fostering ICT R&D and innovation 30 24 26 20
ICT R&D programmes 24 22 26 19
Government development projects 20 20 21 12
Government ICT procurement 17 20 17 11
Venture finance 14 19 16 9
ICT innovation support 24 22 18 n.a.
Internationalisation of R&D and innovation 12 n.a. n.a. n.a.
Increasing ICT diffusion and use 30 24 25 21
Technology diffusion to businesses 27 20 21 20
Organisational change 19 14 10 n.a.
Demonstration programmes 19 17 10 17
Technology diffusion to individuals and households 28 20 21 20
Government online, government as model users 30 23 22 19
Government programmes to promote or encourage e-procurement and/or e-invoicing 22 15 n.a. n.a.
RFID programmes1 14 n.a. n.a. n.a.
ICT skills and employment 26 23 24 n.a.
Promoting IT education 24 19 n.a. n.a.
Industry-based and on-the-job training 19 10 n.a. n.a.
Foreign workers 5 3 n.a. n.a.
International sourcing 2 3 n.a. n.a.
Improving labour market information 7 8 n.a. n.a.
Digital content 27 23 16 n.a.
General digital content development 22 19 n.a. n.a.
Public sector information and content 22 11 n.a. n.a.
The ICT business environment 22 23 25 20
Competition in ICT markets 15 18 19 n.a.
Intellectual property rights 12 23 19 14
Trade and foreign direct investment 18 17 15 8
International co-operation 15 19 15 17
Enhancing infrastructure 30 24 26 n.a.
Broadband 30 23 24 n.a.
Electronic settlement/ payment 18 18 22 19
Standards 18 21 20 11
Policy assessment and evaluation 28 15 17 n.a.
Programme evaluation 26 15 n.a. n.a.
Broadband uptake and use 24 5 n.a. n.a.
RFID development and applications1 2 n.a. n.a. n.a.
Total responding countries 30 25 30 21
1 2 http://dx.doi.org/10.1787/4778132368811. New policy area in the 2008 survey.n.a.: not available.Source: Based on detailed responses to the OECD IT Outlook Policy Questionnaire 2008.
An
OE
CD
Bro
wo
L e c tur
ylnO dae
R
OECD INFORMATION TECHNOLOGY OUTLOOK 2008 – ISBN 978-92-64-05553-7 – © OECD 2008310

7. ICT POLICY DEVELOPMENTS
se_it E ditin
es
eu
le
engaged in ICT research are often a focus of policies designed to increase national
innovation potential.
Beyond promoting ICT uptake in government, almost all respondents cite policies to
promote technology diffusion to businesses and to individuals and households and the
number of related policy programmes has gradually increased over time. Many OECD
governments seek to increase the competitiveness of SMEs through effective use of ICTs,
e.g. by supporting uptake and use of business intelligence applications. Moreover, even
where high rates of Internet penetration and access have been achieved, policy makers
continue to focus on individuals and households, e.g. with policies aimed at minorities and
persons with special needs.
Specific policies to promote IT education and to encourage industry-based/on-the-jobIT training have also featured prominently since the question was introduced in 2004.
Governments promote overall ICT literacy through national education systems, but also
focus on providing advanced skills to those already at work. This includes training civil
servants but also encouraging business leaders to integrate skill formation in company ICT
strategies. Other policies within the area of ICT skills and employment feature at the lower
end of the overall ranking (see Annex Table 7.A1.1).
The ranking underlines the importance attributed to general digital contentdevelopment and the growing importance of public-sector digital information andcontent. The number of related policies has risen since the question was introduced
in 2004. In particular, the number of programmes for government content, including
provision of information and policies for the free (or low-cost) reuse of government
information has greatly increased.
The top ten do not include policies to enhance the ICT business environment, which
appears lower in the overall ranking (see Annex Table 7.A1.1). The number of responses
has declined and only around half of respondents indicate new developments in sub-areas.
This can be partly explained by the effectiveness of earlier policies and is supported by
Table 7.3, which shows that most countries continue their efforts in this area. Moreover,
specific ICT policies may not always appear necessary as policies for overall business
promotion also apply to the ICT sector and ICT policies are becoming part of mainstream
general economic policies.
RFID programmes appear rather low in the overall ranking despite their
implementations in around half of responding countries. The question was only
introduced in the last questionnaire and their low priority is partly explained by some
governments’ preference to let the technology develop in the marketplace with little public
intervention (see also OECD, 2008b, 2008c).
Policies to promote trust online often have high priority, especially as regards security
of information systems and networks. This area is not included in summaries of the
questionnaire as it features in only one section (see Table 7.3). OECD countries increasingly
focus on protecting critical infrastructures (e.g. energy) through secure ICT systems and
R&D activities into Internet security (see also Chapter 3). As Internet penetration and
uptake among individuals grows, governments are increasing their focus on privacy and
consumer protection in the Internet environment to underpin growth and ensure that
offline policy and regulation, e.g. for consumer protection, is also applied online.
An
OE
CD
Bro
wo
L e c tur
ylnO dae
R
OECD INFORMATION TECHNOLOGY OUTLOOK 2008 – ISBN 978-92-64-05553-7 – © OECD 2008 311

7. ICT POLICY DEVELOPMENTS
se_it E ditin
es
eu
le
ICT policy environment: Co-ordination and priority settingBetter co-ordination of ICT policies and clearer priority setting can help improve
internal government efficiency as well as the effectiveness and coherence of policies
(e.g. the impact on businesses and citizens). The survey asks governments to indicate the
institutional settings and procedures for the formulation of ICT policies. The number of
responses has increased over the years, suggesting a greater focus on mainstreaming
national ICT policies and improving the overall efficiency of delivery, but the level and
extent of co-ordination varies among countries.
Efficiency of ICT policy making
Public authorities and government organisations are taking more steps to co-ordinate
and set priorities in order to avoid overlapping and sometimes duplicating ICT initiatives,
but most countries still have rather decentralised structures for formulating and
implementing ICT policies. Co-ordination is however gaining in importance as ICT policies
increasingly seek to address wider socio-economic objectives and involve ministries and
Table 7.3. Summary of ICT policy priorities, 2008
High Medium Low Total Increased Continued Decreased Total
Fostering ICT R&D and innovation
ICT R&D programmes 20 6 1 27 10 16 0 26
Government development projects 14 9 2 25 5 17 1 23
Government ICT procurement 8 13 3 24 10 11 1 22
Venture finance 7 11 8 26 9 15 1 25
Innovation networks and clusters 13 12 1 26 7 17 1 25
Increasing ICT diffusion and use
Technology diffusion to businesses 18 8 2 28 8 19 0 27
Organisational change 6 14 7 27 6 19 1 26
Demonstration programmes 3 13 9 25 6 16 2 24
Technology diffusion to individuals and households 18 8 2 28 7 20 0 27
Government on-line, government as model users 23 5 0 28 11 16 0 27
RFID programmes1 3 5 15 23 3 16 1 20
ICT skills and employment 18 9 1 28 12 16 0 28
Digital content 14 11 3 28 12 16 0 28
ICT business environment
Competition in ICT markets 12 11 3 26 8 16 0 24
Intellectual property rights 7 17 3 27 6 19 0 25
Trade and foreign direct investment 11 10 5 26 5 20 0 25
International co-operation 11 12 3 26 6 18 0 24
Enhancing the infrastructure
Broadband 21 6 1 28 9 17 1 27
Electronic settlement/payment 12 11 4 27 7 17 2 26
Standards 16 8 4 28 8 18 1 27
Promoting trust online
Security of information systems and networks 17 9 1 27 10 15 0 25
Privacy protection 14 10 3 27 7 18 0 25
Consumer protection 12 12 2 26 9 16 0 25
1 2 http://dx.doi.org/10.1787/4778331756541. New policy area in the 2008 survey.Source: Based on 28 detailed responses to the OECD IT Outlook Policy Questionnaire 2008, section “Current IT policypriorities and new directions”.
An
OE
CD
Bro
wo
L e c tur
ylnO dae
R
OECD INFORMATION TECHNOLOGY OUTLOOK 2008 – ISBN 978-92-64-05553-7 – © OECD 2008312

7. ICT POLICY DEVELOPMENTS
se_it E ditin
es
eu
le
agencies, such as employment, social security, and education ministries, that have not
traditionally been the source of ICT-related policies.
Japan and Korea, two countries with a high level of technology diffusion, have
established central government institutions to formulate ICT policies and oversee their
implementation across ministries. Japan’s IT Strategic Headquarters and Korea’s
Informatisation Promotion Committee have been active for some years and are chaired by
each country’s prime minister. Other countries have established advisory bodies that co-
ordinate the implementation of ICT policies across government. Some report directly to the
prime minister (e.g. Ireland, Turkey) while others are located in a ministry or government
agency (e.g. Denmark’s Council for ICT, Finland’s Advisory Board for the Ubiquitous
Information Society, Switzerland’s Interdepartmental Committee for the Information
Society and non-OECD member Singapore’s Infocomm Development Authority). With the
change of government, Italy has formulated policies for innovation and re-organisation in
the public administration, judicial and education systems, including increased broadband
deployment and improved public sector connectivity.
The majority of countries, however, have adopted a decentralised approach to priority
setting of ICT policies. While this may be of advantage in some respects, ICT policies
require broader ad hoc co-ordination because they touch upon many ministries’ portfolios
and two or more ministries are often in charge of different issues, such as infrastructure,
e-government, applications and uptake, science, research and higher education, skills and
employment.
Centralised ICT procurement is another way to increase organisational efficiency as it
helps governments to reduce ICT investment costs and avoid redundant or incompatible
purchases. Examples include Finland’s central procurement unit “Hansel”, the US “SmartBuy”
programme for commercial software, and the Czech Republic’s government’s electronic
marketplace. Some countries without such measures point to the risk of ICT procurement
being poorly co-ordinated and not taking into account broader objectives of ICT policies as
well as government efficiency.
Effectiveness of ICT policies
Long-term strategies for information economies/societies are linking ICT and
Internet-related policies with strategies to promote a range of socio-economic objectives
(see Box 7.1). Mainstreaming of ICT policies is not new, but the scope and implications of
ICT-related policies have continuously widened. Whereas the 2002 and 2004 editions of the
OECD Information Technology Outlook highlighted countries’ focus on ICT policies to foster
economic growth and employment, the 2006 edition showed that the focus had shifted
towards using ICTs as an agent of change and societal transformation, a trend that
continues in 2008. Policies seek to exploit the Internet and other forms of networks to
stimulate national innovation potential in many areas.
To increase overall policy coherence, some OECD countries have shifted the focus of
ICT policies from simple development and diffusion to the promotion of ICTs as part of
the overall socio-economic context. The u-Japan policy, for instance, regards ICTs and
particularly network-based services as a key enabling technology. It builds on results
achieved through the “e-Japan” strategy (in place until 2006), which focused on
advancing broadband infrastructures and exploring applications. Similarly, Finland’s
National Knowledge Society Strategy and the u-Korea Master Plan were built on the
An
OE
CD
Bro
wo
L e c tur
ylnO dae
R
OECD INFORMATION TECHNOLOGY OUTLOOK 2008 – ISBN 978-92-64-05553-7 – © OECD 2008 313

7. ICT POLICY DEVELOPMENTS
se_it E ditin
es
eu
le
results of earlier policies that helped to develop ICTs in a national context and promoted
their uptake.
Measures to ensure policy coherence between ICT policies and attainment of long-
term socio-economic objectives often include a focus on:
● Joint innovation activities in high-technology areas, including ICTs and nanotechnology,
biotechnology, and medical research, through co-ordination with ministries for science
and technology, research, higher education, etc.
● Technology uptake in industry sectors not typically covered by ICT policies, e.g. business
intelligence software across industry sectors.
● Government leadership, e.g. by acting as model users.
● Co-ordination with stakeholders, e.g. public consultation processes in the drafting of
legislation.
Specific ICT policies and programmesThis section covers six areas in more detail: fostering ICT innovation, increasing
diffusion and use, skills and employment, digital content, the ICT business environment,
and enhancing the infrastructure. Promoting trust online is not covered in detail in the
policy questionnaire, but countries indicated their priorities in this area along with other
ICT policy priorities (see Table 7.3).
Fostering ICT R&D and innovation
Fostering ICT and ICT-related research and innovation are of major importance for
economic growth, boosting national innovation potential, and stimulating supply of and
demand for highly skilled labour. For the first time, all responding OECD countries reported
Box 7.1. Achieving socio-economic objectives
A growing number of countries adopt ICT policies to address key issues such aseconomic growth, sustainable development, and improving social welfare.
Denmark: The “Action Plan for Green IT” contains initiatives to mitigate the environmentalimpact of ICT deployment and to exploit ICTs’ huge potential for enabling other industriesto reduce their environmental impact. The plan highlights the leading role of the Ministryof Science, Technology and Innovation in applying such measures.
Japan: The u-Japan policy aims at widespread diffusion of broadband applications andnetwork-based services to create a “ubiquitous network society” by 2010. Seamlessnetworking is a key element in this vision which encompasses objectives relating to healthcare, inclusiveness, the environment and public safety.
Korea: The u-Korea Master Plan aims to build a “ubiquitous society” by 2010. ICTs are
seen as the key to exploiting the country’s innovation potential in various industry sectorsand for socio-economic applications.
Turkey: The Information Society Strategy (2006-10) has as major focus areas: developmentof an effective ICT infrastructure and a competitive industry, promotion of ICT R&D, use ofICTs to increase competitiveness across industries; facilitation of public sector reformsand widespread social transformation.
Source: Responses to the OECD IT Outlook Policy Questionnaire 2008.
An
OE
CD
Bro
wo
L e c tur
ylnO dae
R
OECD INFORMATION TECHNOLOGY OUTLOOK 2008 – ISBN 978-92-64-05553-7 – © OECD 2008314

7. ICT POLICY DEVELOPMENTS
se_it E ditin
es
eu
le
dedicated policies to support ICT innovation. This includes domestic programmes to
support ICT-related R&D and measures to provide ICT innovation support.
ICT R&D programmes
Policies for ICT R&D are a top priority for respondents to the 2008 survey. A total of
23 countries point to a policy in place (Table 7.2) and 20 gave the area high priority
(Table 7.3). Within the OECD, only the Czech Republic, Greece, Hungary, Iceland, the Slovak
Republic and Sweden do not attribute high priority to this area. In previous years many
countries supported the area as part of general science and technology (S&T) policies, but
they increasingly establish R&D programmes that explicitly promote ICT-related R&D. As
part of a focus on enhancing competitiveness, SMEs are often targeted by ICT R&D
programmes. This can include facilitated bidding for public R&D tenders and joint research
conducted by public and private research institutes, governments and SMEs.
The form of ICT R&D programmes varies, and it is difficult to pinpoint a specific
determinant. In 2004, a dividing line was visible between countries with higher GDP per
capita which had dedicated ICT R&D programmes and countries with lower GDP per capita
which embedded such programmes in national S&T strategies, but this line has now
blurred. On the one hand, the United States has had a large ICT-specific research
programme in place for a long time, while countries such as Germany and Norway have
recently implemented such programmes (see Chapter 3). On the other hand, ICT-related
policies are a major pillar of S&T policies in Canada, Finland, Japan and Spain, countries
with high GDP per capita. In fact, the funds allocated to the Networking and Information
Technology Research and Development (NITRD) programme in the United States and to the
ICT branch of Japan’s S&T strategy are comparable, suggesting that a distinction in terms
of funding and impact may be more apparent than real.
Survey replies underline two trends identified in Chapter 3 of this volume: i) increased
channelling of support mechanisms towards specific goals and instruments (e.g. to foster
research into digital content technologies, embedded systems and software); and ii) an
expanded focus on public-private co-operation in applied ICT research to further socio-
economic goals, e.g. improved health care, environmental protection. Details and
outcomes of such focused policies are discussed in Chapter 3.
Government development projects
Government development projects are mostly geared towards the provision of public
services online. This is not a new trend; already in 2004 most countries focused on
developing e-government applications and services, e.g. electronic authentication and tax
filing. A few countries report no particular government development projects as systems
have been in place for a number of years, e.g. for electronic payments and revenue
collection in Finland.
An increasing trend is the employment of e-health strategies, mostly in the form of
pilot projects rather than fully implemented policy measures (Box 7.2). Nonetheless, such
projects can have a major impact on the use of ICTs and the Internet beyond the health-
care sector.
An
OE
CD
Bro
wo
L e c tur
ylnO dae
R
OECD INFORMATION TECHNOLOGY OUTLOOK 2008 – ISBN 978-92-64-05553-7 – © OECD 2008 315

7. ICT POLICY DEVELOPMENTS
se_it E ditin
es
eu
le
Government ICT procurement
Government ICT procurement policies aim primarily to improve public-sector
efficiency, reduce procurement costs, ensure interoperability and enhance the integrity of
systems in place. They can also be a tool to increase innovation in the business sector by
co-ordinating procurement of IT systems and services with overall ICT policy goals, e.g. in
order to foster specific technology developments. A total of 17 countries mentioned ICT-
specific government procurement policies (Table 7.2) and ten reported that they were of
increased importance (Table 7.3). Examples include preferential access to public
procurement for SMEs (Australia); agreements between IT companies and governments for
preferential purchase terms and training programmes for civil servants (Greece). Countries
such as Sweden accentuate the neutrality of their procurement procedures, i.e. decisions
on government procurement are based only on price; Switzerland and Finland indicate
similar approaches.
Governments continue to focus on open source applications in ICT procurement and a
number of countries actively promote these (see Box 7.3). They are often seen as a means
of increasing competition in ICT markets, enhancing interoperability, improving the
security and effectiveness of the public administration, e.g. in data exchange.
Venture finance
Around half of the countries surveyed in 2008 have ICT-specific venture finance
initiatives. While most indicated medium priority, one-third attributed increased
importance to policies and programmes to encourage risk investment in the ICT sector.
Venture finance programmes include public-sector start-up and growth funds, facilitation
and support for partnerships between companies and investors, programmes to foster
spin-offs from research organisations, and support for venture capital firms (see Box 7.4).
Box 7.2. Government e-health projects
Germany is upgrading its system of electronic health insurance cards for cross-institutional co-operation between patients, practitioners, hospitals, pharmacies and healthinsurance funds. The new e-Health cards are expected to lead to more comprehensive ICTapplications, e.g. electronic health records. Also, electronic prescription handling is reducingside effects and undesirable interactions of pharmaceutical products and providing
efficiency gains.
Mexico envisages ICTs as a key enabler to modernise health-care management withinthe national health-care system at federal and state levels. The programme foreseesintegrated information systems for practitioners, electronic health-care records, a publichealth-care portal for citizens, continued education of health-care staff.
The United States has set the goal of providing most Americans with an electronic healthrecord by 2014. In line with this goal, the Department of Health and Human Services (HHS)issued a strategy on how to improve health-care systems and population health by 2012through the use of ICTs. The strategy defines objectives in four categories: interoperability,adoption, collaborative governance, privacy and security. From 2009, a Nationwide HealthInformation Network (NHIN) is expected to be used for health data exchange.
Source: Responses to the OECD IT Outlook Policy Questionnaire 2008; United States Department of Health andHuman Services, 2008, “The ONC-Coordinated Federal Health Information Technology Strategic Plan:2008-2012”, www.hhs.gov/healthit.
An
OE
CD
Bro
wo
L e c tur
ylnO dae
R
OECD INFORMATION TECHNOLOGY OUTLOOK 2008 – ISBN 978-92-64-05553-7 – © OECD 2008316

7. ICT POLICY DEVELOPMENTS
se_it E ditin
es
eu
le
Box 7.3. Open source applications
Out of 30 countries, 14 indicated having specific policies or programmes relating toopen source applications (Austria, Belgium, Denmark, Germany, Hungary, Italy, Japan,Korea, the Netherlands, Norway, Portugal, the Slovak Republic, Switzerland, Turkey). Inthe OECD Information Technology Outlook 2002, there were only eight. Governments canpromote open source developments in a variety of ways, many of which are directly
related to government ICT procurement. Other policies aim at diffusing open sourcetechnologies more generally and creating frameworks for effective deployment in thepublic sector.
Front-end software and back-office applications (operating systems, databases, middleware)
Austria: The Vienna city government uses WIENUX, a client operating system based onthe Debian GNU/Linux distribution. Open source software is also being used for variousfront-end applications such as Internet browsers, e-mail and SAP client software.
Germany: Open source software is used to combine geographic maps with publicinformation in some German cities (e.g. Bonn, Mainz, Nuremberg) for electronic citizen andvisitor services.
Government institutions as open source repositories and knowledge providers
Denmark: The National IT and Telecom Agency (NITA) operates an open source softwareexchange, Softwarebørsen (Software Exchange). The repository provides the public sectorwith project management tools for sharing open source software.
Italy: Italy established an Internet repository for the development of open sourcesoftware for public administrations. The Ministry for Innovations in Public Administrationlaunched the website for the project called Ambiente di Sviluppo Cooperativo (Environment
for Co-operative Development).
Turkey: The Ministry of National Education together with IBM co-founded the PublicSector Linux Competency Centre. The centre provides Linux training for technical staff ofgovernment institutions.
General open source policies
Japan: The Ministry of Economy, Trade and Industry (METI) promotes pan-Asianresearch on open source software for multilingual information processing. The aim is toenhance the circulation of information in various languages within Asia’s multi-languageenvironment.
Korea: Korea supports domestic open source development communities and theNortheast Asia Open Source software Promotion Forum for exchanging information andrelated policy among Korea, Japan and China.
Netherlands: The programme Open Source as Part of the Software Strategy focuses onthe implementation of open source software within government ministries.
Switzerland: As part of the country’s open source strategy, Switzerland commissioned astudy to assess the legal impact and requirements for public procurement of open sourceapplications. It provides the legal framework for public ICT procurement with regard toopen source applications.
Source: Responses to the OECD IT Outlook Policy Questionnaire 2008; official sources.
An
OE
CD
Bro
wo
L e c tur
ylnO dae
R
OECD INFORMATION TECHNOLOGY OUTLOOK 2008 – ISBN 978-92-64-05553-7 – © OECD 2008 317

7. ICT POLICY DEVELOPMENTS
se_it E ditin
es
eu
le
Government-sponsored venture capital funds are often managed independently and
typically co-invest with business angels or other private and public capital sources.
Venture finance initiatives are often combined with goals such as fostering ICT R&D
(e.g. Austria’s PreSeed IT and Physical Sciences), supporting SMEs (e.g. Enterprise Ireland),
or fostering regional development (e.g. Italy’s High-Tech Fund).
ICT innovation support
Most respondents mentioned programmes to support innovation in ICTs through the
establishment of clusters of firms and innovation networks. Countries’ approaches to
cluster development vary largely, but they typically establish centres of competence and
technology parks along sector value chains and across sectors and combine them with
policies for regional economic development. Examples include the competitiveness
clusters (pôles de compétitivité) in France and Japan’s Okinawa Development Plan to cluster
international ICT businesses. To help industrial and academic research communities to co-
ordinate their activities, the European Commission supports a number of European
technology platforms, e.g. the Networked European Software and Services Initiative
(NESSI).
Internationalisation of R&D and innovation
At least 12 OECD countries have measures to promote cross-border R&D and
innovation in ICTs. Japan, for instance, has initiated a collaborative project to develop
ubiquitous networking technologies that allow for seamless access to context-sensitive
information in any of Asia’s languages. Denmark has developed a strategy for scientific
collaboration with China which includes ICTs as one of the key areas and is partly co-
ordinated by the Danish Innovation Centre in Shanghai. The European Union encourages
pan-European collaboration in ICT-related R&D, e.g. via an initiative called Co-ordination of
the Information Society Technologies Research and National Activities (CISTRANA).
Moreover, a number of countries cite initiatives to attract research laboratories of
multinational ICT companies (e.g. Korea, Singapore, Turkey).
Increasing ICT diffusion and use
Technology uptake is essential to the success of information societies/economies and
governments play a role through both enabling policies and their own use of ICTs. All
responding countries have initiatives in place with a focus on government activities online
Box 7.4. Venture finance policies
Hungary: The Hungarian Investment and Trade Development Agency mediates betweenHungarian IT firms and venture capital investors, collecting business plans and forwardingthem to the major international high-technology funds. Additionally the HungarianDevelopment Bank has various capital development programmes for IT companies.
Korea: The Ministry of Information and Communication (MIC) (partly replaced by theKorean Communications Commission), in co-operation with the private sector, established aninvestment corporation which focuses investments on SMEs in the ICT sector. The ministryalso supports training on investment screening and provides information on market andtechnology trends and various legal issues.
Source: Responses to the OECD IT Outlook Policy Questionnaire 2008.
An
OE
CD
Bro
wo
L e c tur
ylnO dae
R
OECD INFORMATION TECHNOLOGY OUTLOOK 2008 – ISBN 978-92-64-05553-7 – © OECD 2008318

7. ICT POLICY DEVELOPMENTS
se_it E ditin
es
eu
le
as well as technology diffusion to businesses, individuals and households. Organisational
change and demonstration programmes are commonplace, but usually of medium priority.
Programmes to promote RFID technologies are in place in around half of responding
countries. Business leaders are often seen as potential multipliers of government efforts to
increase technology diffusion to employees through top-down approaches (see the section
on ICT skills and employment and OECD, 2005).
Technology diffusion to businesses
Almost all respondents mentioned initiatives for technology diffusion to businesses.
The focus has shifted from basic technology diffusion (PC and Internet usage) to more
complex applications. The Korean Ministry of Commerce, Industry and Energy, for
instance, established a programme to promote inter-company integration of product
design and manufacturing processes, RFID usage, and supply-chain management systems.
At the same time, governments continue to focus on the adoption of ICTs by SMEs, as in
earlier surveys (see Box 7.5).
Organisational change
The share of countries citing programmes for organisational change has increased
since 2004 when the area was added to the questionnaire (Table 7.2) and a majority of
countries report continued efforts (Table 7.3). Measures promoted include telework
applications, improving working conditions through ICTs and changing managerial
behaviour in both the private and public sector to make more effective use of ICTs, often to
achieve wider goals such as raising productivity or tackling socio-economic challenges
Box 7.5. Business innovation in SMEs
Austria’s Protec II programme supports the implementation of ICT-aided strategicproduct development in SMEs and is based on the recommendations of an evaluation of itspredecessor programme Protec 2002+.
France’s TIC-PME 2010 (ICTs-SMEs 2010) aims to advance ICT uptake in SMEs. Measuresinclude ICT training for SME managers and directors, uptake of software for businessintelligence and enterprise resource management.
Japan’s Ministry of Economy, Trade and Industry (METI) supports ICT diffusion to SMEs,e.g. through best practices, facilitation of IT investments, ICT training of managers andchief information officers, and technology uptake. METI aims to achieve an ICT uptakewithin basic business processes in 60% of medium-sized enterprises by 2010 and anuptake of e-commerce by 50% of trade partners of SMEs.
Korea’s SME Production Digitalisation Project introduces measures to lower initialinvestments and maintenance costs for SMEs which are clearly lagging major companiesin using ICT solutions for business operations (e.g. integrated systems for supply-chainand customer-relationship management).
Spain’s Avanza Plan is intended to increase the use of ICTs in SMEs. The aim is to connectto the Internet 99% of companies with over ten employees and 79% of micro-businessesand self-employed. It also promotes the integration of ICTs in business processes,e.g. electronic invoicing.
Source: Responses to the OECD IT Outlook Policy Questionnaire 2008.An
OE
CD
Bro
wo
L e c tur
ylnO dae
R
OECD INFORMATION TECHNOLOGY OUTLOOK 2008 – ISBN 978-92-64-05553-7 – © OECD 2008 319

7. ICT POLICY DEVELOPMENTS
se_it E ditin
es
eu
le
such as climate change. Although the uptake of telework has been rather slow,
governments still refer to its importance, e.g. in combating climate change, as in
Denmark’s recent Action Plan for Green IT, or Ireland’s Work Flow project. In another
instance, the Slovak Republic amended labour laws in 2007 to lay down provisions for a
widespread introduction of telework.
Policies also focus on organisational change at managerial level in the private and
public sectors in order to provide information on how process efficiency can be improved
by introducing ICT solutions throughout an organisation. The Japanese Ministry of
Economy, Trade and Industry, for instance aims to raise acceptance of ICTs in major
companies by promoting the establishment of chief information officer (CIO) posts in firms
in all sectors. In the United Kingdom, the government launched a scheme to recruit
technology graduates to foster organisational change through the use of advanced ICTs in
the public sector.
Demonstration programmes
The number of countries with demonstration programmes is largely the same as
in 2006 (Table 7.2). This policy area is not highly prioritised: half of the countries give it
medium priority and nine low priority (Table 7.3). Demonstration programmes can be
general, like Portugal’s DEMTEC programme, which supports pilot projects for diffusing
knowledge about technologies; or they can be dedicated, like the Finnish VAMOS
programme for demonstrating the potential of mobile applications for providing added
value to businesses. Governments can also set an example by implementing ICT standards
in their organisations, e.g. the shift to IPv6 in public administrations (see the section on
standards).
Technology diffusion to individuals and households
The number of policies and programmes which seek to increase diffusion of ICTs to
individuals and households has increased continuously since 2004, at the same pace as
policies for diffusion to businesses (Table 7.2). Both areas are highly prioritised (Table 7.3).
Overall uptake of ICTs, e.g. computer literacy and broadband, is increasing in OECD
countries, but differences in income, education and gender are creating new kinds of
“digital use divides” (see Chapter 4). Consequently, the focus has generally shifted from
promotion of overall ICT penetration at home, work, schools and public access points
(although programmes to foster public Internet access points are still being formulated, e.g.
Poland’s Ikonka project) towards inclusion of hard-to-reach groups (e.g. the European
Commission’s e-inclusion campaign) and the development of digital products and services.
Effective policies typically focus on promoting both the supply and demand sides of
technology uptake by individuals. Spain’s Ciudades Digitales (Digital Cities) programme, for
instance, stimulates the development and provision of public electronic services,
particularly in small municipalities. To encourage demand, the government offered credits
for computer equipment and broadband subscriptions at zero interest rates which
amounted to EUR 700 million in 2007.
Government online, government as model user
All responding countries use the Internet for internal and external communication as
well as to provide public services, but the level of implementation varies. Only a few
An
OE
CD
Bro
wo
L e c tur
ylnO dae
R
OECD INFORMATION TECHNOLOGY OUTLOOK 2008 – ISBN 978-92-64-05553-7 – © OECD 2008320

7. ICT POLICY DEVELOPMENTS
se_it E ditin
es
eu
le
countries indicate a widespread shift towards integrated information management and
user-focused e-government (e.g. Canada, Japan, Korea, New Zealand, Norway). Many
countries still replicate existing service procedures online, so that the potential for using
the Internet and ICTs to link e-government activities with wider public-sector changes
remains unexploited (see also OECD, 2007c, 2008a).
The number of recent initiatives is large even though governments have long used the
Internet to enable activities such as filing of forms, tax declarations, business registration,
or social security services. Particular emphasis on this policy area is set in the Czech
Republic, Hungary, Poland and the Slovak Republic, where e-government activities are
regarded an integral and sometimes pivotal element of overall information society
strategies. On the other hand, Australia, Austria, Canada and Finland, which have long led
e-government developments, reported no significant recent policy measures in this area.
Many countries continue to focus on e-government activities as part of an overall
transformation of the public sector, e.g. increased availability and transparency through
one-stop shops on the Internet or improved inter-organisational collaboration and co-
ordination of service delivery and delivery channels. Canada and Norway, for example,
have with notable success shifted from government-centric to citizen-centric approaches,
e.g. by measuring user satisfaction and conducting e-government audits. Japan and Korea
have formulated policies to further government usages of ICTs for citizen services,
improved business processes, back-office integration of government systems, ICT training
of civil servants, and reliability and security of government services.
Some countries cite programmes to improve e-government access on a technological
level: Italy initiated the Italia Utile (Useful Italy) portal, which provides services to citizen via
digital terrestrial television; in Norway citizens can file income tax returns via short-
messages service (SMS); and non-OECD member Singapore also provides a range of
government services via SMS.
Government programmes to promote or encourage e-procurement and e-invoicing
The number of policies to promote e-procurement and e-invoicing by business has
increased since the question was first asked in 2006; in the 2008 survey 22 countries cited
such measures (Table 7.2). Apart from technology diffusion, these programmes help
increase efficiency and transparency of public procurement. While advantages of
e-invoicing are typically recognised, the Slovak Republic, for its part, leaves this to
businesses.
Public e-procurement and electronic tendering help to promote uptake of e-procurement
and other e-business transactions in the private sector. In recent years, a growing number
of OECD governments have shifted towards e-procurement of tenders or are in the process
of doing so, e.g. Belgium, the Czech Republic, Japan, the Slovak Republic. Where e-procurement
has long been in place, policies aim to improve their effectiveness. The Korean
government, for example, established an Internet-based call centre, installed customer-
relationship management (CRM) applications, and recently launched mobile procurement
solutions to encourage wider use of e-procurement. The United States set up an Integrated
Acquisition Environment to consolidate information systems related to federal acquisition
processes.
Denmark and Sweden have shifted towards full electronic invoicing among public
authorities and the European Commission is developing a European e-invoicing
An
OE
CD
Bro
wo
L e c tur
ylnO dae
R
OECD INFORMATION TECHNOLOGY OUTLOOK 2008 – ISBN 978-92-64-05553-7 – © OECD 2008 321

7. ICT POLICY DEVELOPMENTS
se_it E ditin
es
eu
le
Framework (EEI) to create a legal framework and common standards for e-invoicing
between business partners in the context of the Single Euro Payments Area, due by 2010.
RFID programmes
Countries were first asked in the current survey to provide information about RFID
programmes and 14 responses were received (Table 7.2). Japan, Korea and the Netherlands
give RFID high priority and Canada, the Czech Republic, Germany, Portugal and Spain give
it medium priority. The priority has increased in Korea, Mexico and Portugal. However,
most countries still regard it as low priority area and Sweden, for its part, prefers little
public intervention in the development of the technology (see also OECD, 2008b, 2008c).
Given the very recent expansion of RFID applications, policies in this area mostly focus
on creating national centres of excellence and online information portals, sponsoring pilot
projects and R&D programmes, promoting best practices, and exploring privacy concerns
and frequency issues (see Box 7.6). A number of governments have singled out RFID as an
important area of research in their current ICT R&D programmes (e.g. Germany’s ICT 2020).
ICT skills and employment
Widespread development of ICT skills is crucial as ICTs have become an integral part
of professional and personal life in information economies. However, many OECD
countries face shortages of highly skilled labour and research personnel for the ICT sector
despite weakening labour markets. In this survey, more countries than in 2006 indicated
having specific policies in place (Table 7.2) and the more gave it high priority as well. Only
Sweden attributes low priority to this policy area.
Box 7.6. Supporting RFID applications
Korea’s government is pursuing various initiatives to support RFID uptake: Songdo,Incheon, will be a geographic cluster for R&D and business co-operation on RFID. Thegovernment has promoted RFID pilot projects in various sectors, including procurement,defence and environment, which have led to guidelines for organisations and companiesplanning to adopt RFID-based services.
In Mexico the government has applied RFID technology in the health sector for patientcards. The Ministry of the Economy’s PROSOFT fund aims to improve the competitiveness of thecountry’s software industry through support for the development of RFID-related applications.
Singapore’s National RFID Centre operates a central Internet portal where results from
deployment trials and pilot projects are publicly available. The website lists best practicesby different industry sectors and provides contacts to a network of national RFID expertsand businesses. The centre focuses on applications across industry supply chains,provides funding to pilot projects, establishes networks of experts, conducts training forcompanies wishing to apply RFID technologies, and demonstrates and promotes R&Dresults from its network of research institutes.
Switzerland: A number of Swiss institutions have initiatives to discuss different aspectsof RFID deployment, mostly in the context of pervasive computing. The Risk DialogueFoundation developed a guide for responsible use of pervasive computing in co-operationbetween industry, academia and the public sector.
Source: Responses to the OECD IT Outlook Policy Questionnaire 2008.An
OE
CD
Bro
wo
L e c tur
ylnO dae
R
OECD INFORMATION TECHNOLOGY OUTLOOK 2008 – ISBN 978-92-64-05553-7 – © OECD 2008322

7. ICT POLICY DEVELOPMENTS
se_it E ditin
es
eu
le
OECD countries clearly focus on policies to promote overall IT education and industry-
based/on-the-job training. Foreign workers, international sourcing and improving labour
market information typically attract considerably less attention.
Promoting IT education
Promotion of IT education is seen as essential to achieving the long-term objectives of
information economies/societies. Around 80% of respondents pointed to policy
programmes in this area, a share similar to the 2006 survey. Policies geared towards the
reduction of “digital divides” and an increase in the supply of highly skilled labour and
researchers include broadening and deepening primary/secondary education in this area,
reviewing and updating advanced education curricula, and tackling structural challenges.
Primary and secondary education. Promoting IT in primary and secondary education
comprises two interlinked dimensions: i) ICTs in the curriculum and ii) ICTs in the
classroom. A number of countries specifically include ICT skills in school curricula,
sometimes as part of the natural sciences. Norway’s strategy, An Information Society for
All, for example, has developed a school curriculum that makes the ability to use digital
tools one of the five basic skills to be obtained through primary and secondary education.
Greater focus, however, is set on the provision of ICT education through technology
diffusion in classrooms and skills training for teachers. New Zealand’s Digital Strategy
aims to have e-learning activities applied across subjects by 2010 and provides teachers’
fellowships for making effective use of these technologies in classrooms. The target of
Spain’s Avanza is to supply all state schools with broadband access and multimedia
applications by 2008 along with the corresponding teacher education. Switzerland’s Schule
im Netz (School on the Net) programme provided ICT training for teachers over a six-year
period and its impact was recently evaluated. Furthermore, the Swiss Education Server has
since 2001 published a monthly newsletter on ICTs in education. The US National Science
Foundation (NSF) recommends addressing changes in education due to the Internet and
ICTs, e.g. by integrating virtual worlds for guided inquiry and experimentation.
Advanced education. Reaping the economic and social potential of ICTs depends on a
highly skilled workforce in various disciplines. Many OECD countries have been under
pressure to find immediate solutions to short- and medium-term skill shortages and
mismatches in the ICT sector. A number of structural challenges are being addressed to
increase the appeal of ICT-related professions and some governments are tackling low
female ICT-related participation rates in ICT businesses and the research community, and
among students (Box 7.7; see also OECD, 2007a).
Learners with special needs. National policies to increase the ICT skills of other under-
represented or structurally disadvantaged groups target:
● The long-term unemployed – the Slovak Republic’s “National eInclusion Strategy” aims
to address the particular needs of the unemployed and those with low levels of
education.
● The elderly – Switzerland’s “Swisscom Help Points” train the elderly in the practical use
of mobile phones and the Internet.
● Persons with disabilities – Hungary’s “e-Accessibility” programme aims to promote ICT
education and the uptake of telework for the disabled.
An
OE
CD
Bro
wo
L e c tur
ylnO dae
R
OECD INFORMATION TECHNOLOGY OUTLOOK 2008 – ISBN 978-92-64-05553-7 – © OECD 2008 323

7. ICT POLICY DEVELOPMENTS
se_it E ditin
es
eu
le
While these individual activities and programmes are important, they need to be
integrated into overall policies to increase the supply of ICT-skilled labour and to extend
their reach.
Industry-based and on-the-job training
A majority of governments cite on-the-job and industry-based training initiatives, but
less than programmes to promote IT education overall. Responses primarily focus on two
key groups: i) training civil servants and ii) encouraging management to integrate skill
formation more effectively in their overall strategies. Governments see IT-related training
in the civil service as essential to diffuse knowledge about ICT applications as well as to
modernise work processes.3 Most OECD countries are funding ICT training to enhance civil
Box 7.7. Increasing the appeal of ICT-related professions
OECD governments are looking for effective ways to stimulate the supply of highlyskilled professionals in science, technology, engineering and mathematics (STEM),including ICTs. A sustainable supply of skilled labour is crucial to realising the socio-economic objectives of information economy strategies. To deal with shortages,governments are increasing efforts to raise the appeal of ICT-related professions and
research paths to young people and especially to women, a structurally underrepresentedgroup.
Australia’s government-commissioned report “Building Australian ICT Skills” identifiedan outmoded perception of ICT careers and a lack of understanding in schools andcommunities about the diversity of professional opportunities in the sector. According tothe report, there is an urgent need to address this issue among young people and among
those who influence future career choices, i.e. parents, teachers, career advisers.
As part of Germany’s High-Tech Strategy, the government aims to increase the share ofwomen in ICT-related professions and research. For long-term impact, the government isco-sponsoring an annual Girls’ Day on which pupils learn about various professions anduniversity subjects; the ICT industry is one of the focus areas.
Ireland runs the Discover Sensors project in around 200 schools to enable “real science”learning in the classroom and sharing these experiences over the Internet. The governmentalso co-sponsors projects such as ChooseIT, an Internet portal to promote ICT-relatedprofessions, and Women in Technology and Science, which provides professional rolemodels to female students in scientific disciplines.
In the United States, recent reports by the National Science Foundation highlight theimportance of diversifying the skills profiles of ICT-related studies in order to increasetheir appeal, e.g. through training in management and marketing. The NSF sees this asimportant to support “adaptive leaders” who can develop and implement complexengineering applications to achieve the socio-economic objectives of the informationeconomy.
Sources: Australian Department of Communications, Information Technology and the Arts, 2006, “BuildingAustralian ICT Skills”, Commonwealth of Australia; German Federal Ministry of Education and Research, 2007,“ICT 2020. Research for Innovations”, BMBF, Bonn; Ireland Discover Science and Engineering (DSE),www.discover-science.ie; United States National Science Board, 2007, “A National Action Plan for Addressing theCritical Needs of the US Science, Technology, Engineering, and Mathematics Education System”, NationalScience Foundation, Arlington, VA; United States National Science Board, 2007, “Moving Forward to ImproveEngineering Education”, NSF, Arlington, VA.
An
OE
CD
Bro
wo
L e c tur
ylnO dae
R
OECD INFORMATION TECHNOLOGY OUTLOOK 2008 – ISBN 978-92-64-05553-7 – © OECD 2008324

7. ICT POLICY DEVELOPMENTS
se_it E ditin
es
eu
le
servants’ skills profiles, e.g. the European Computer Driving Licence or its international
version in countries such as Australia and the United States.
Governments typically lend support to professional bodies and industry associations
for apprenticeship programmes and national awareness campaigns. They also support
industry-tertiary education partnerships that aim to increase the supply and skill sets of
highly skilled personnel.
Business leaders are sometimes targeted as part of a “top-down” approach to the
diffusion of ICT skills in companies. Singapore’s CXO programme, for instance, provides
assistance for firm-wide technology uptake to increase employees’ ICT skills but also to
expand the amount of workforce available, e.g. through telework.
Foreign workers
Many OECD governments emphasise an insufficient supply of highly skilled workers
for ICT industries and research, but only a handful cited recent policy initiatives to attract
foreign workers (i.e. “bringing workers to the work”) although many explored this option
during the skill shortages of the late 1990s and early 2000s. For instance, the Danish
government recently proposed amendments to its Green Card scheme in order to attract
qualified foreign workers into the ICT sector and Germany’s High-Tech Strategy underlines
the importance of foreign ICT specialists and scientists as a way to satisfy domestic
demand for skills. Most countries address shortages in the sector through policies
targeting technology jobs and academic research more generally.
International sourcing
Policies for international sourcing of ICTs skills and services (i.e. “sending work to the
workers”) do not feature high on government agendas. Most countries indicate that it is not
a separate policy but part of more general economic adjustment policies.
Improving labour market information
Connecting job seekers with job offers is greatly facilitated by the Internet, and
governments and/or national labour market institutions have long-established Internet
portals that provide job search and advisory services. The European Job Mobility Portal
(EURES), for instance, facilitates the dissemination of information on national labour
markets, living and working conditions, employment opportunities, etc., across Europe.
ICT-specific labour market information is typically part of national labour market
information services, e.g. Skills Australia or the United States Department of Labor’s
Industries at a Glance portal.
Digital content
Digital content is an increasingly pervasive aspect of socio-economic developments,
and creative industries and activities are regarded as strategic in information economies
(see Chapter 5 for a discussion of selected digital content industries). In this survey, 27 out
of 29 responding countries reported specific initiatives for digital content, a continuation
in importance from 2006 and a considerable increase from 2004, when just over half of
responding countries had such initiatives (Table 7.2). Whereas in previous years policies
concentrated on general digital content development, initiatives for the creation or reuse
of government content have gained in importance: in 2008 over 70% of respondents had
policies in place compared to less than half in 2006.
An
OE
CD
Bro
wo
L e c tur
ylnO dae
R
OECD INFORMATION TECHNOLOGY OUTLOOK 2008 – ISBN 978-92-64-05553-7 – © OECD 2008 325

7. ICT POLICY DEVELOPMENTS
se_it E ditin
es
eu
le
General digital content development
A wide range of direct and indirect government measures affect digital content
development (see Box 7.8). For example, policies in Canada, Denmark and the United
Kingdom target domestic games and interactive media developers. They are often
co-ordinated with general business incentives, e.g. funds for SMEs or ICT R&D and
innovation policies, e.g. initiatives geared towards developing mobile entertainment,
semantic web and participative web technologies. Korea accentuates the importance of the
digital content industries as part of its ICT growth strategies (u-IT 839 Strategy).
A growing trend is to harness the potential of digital content for integrating linguistic
and cultural minorities. Ethnically heterogeneous countries such as Canada and New
Zealand mention policies aimed at promoting cultural diversity through digital content
initiatives. Other countries use digital content technologies to preserve and promote
cultural assets, to protect their national heritage and to enable intercultural exchange, e.g.
Box 7.8. Policies for digital content development
OECD governments recognise that market participants create digital content and establishnew business models. But governments have a role in developing “enabling factors” for thecreation and use of digital content, in taking measures to support cultural diversity and localcontent-related entrepreneurship, and in removing unnecessary regulatory barriers and otherimpediments across previously separate policy areas. To enhance development, distributionand use of digital content, OECD countries endorsed a set of digital content policy principles,based on extensive analysis of digital broadband content industries and policies (OECD,
2008d). The following are examples of digital content policies from the current survey:
Canada’s Digital Information Strategy is being developed by Library and ArchivesCanada. Through a multi-stakeholder approach (content developers and consumers,academic institutions), it is supposed to reflect values such as bilingualism, multiculturalism,inclusiveness, and equity in digital content provision and development. Also, the CanadaNew Media Fund supports the Canadian interactive media industry through various
funding initiatives.
The European Commission initiated the European Charter for the Development andthe Take-up of Film Online, which was adopted by a number of business representativesin 2006. It aims to increase the number of digital video-on-demand services available toconsumers and addresses film and content industries, Internet service providers, andtelecommunications companies.
Ireland established the Digital Hub centre of excellence, which aims to support digital mediabusinesses. It provides facilities for start-ups and established digital content businesses, aswell as research companies and individuals. The centre offers training in various areas ofdigital content development, conducted jointly with private-sector companies.
New Zealand launched a Digital Content Strategy in 2007. The initiative includes anincubator to promote 3D graphics development businesses as well as programmes to identifydigital standards, promote digital content creation and its public dissemination. It alsoincludes a periodic survey on digital content uptake by New Zealand Internet users.
Source: Responses to the OECD IT Outlook Policy Questionnaire 2008; OECD, 2008, “OECD Policy Guidance forDigital Content”, OECD, Paris, www.oecd.org/dataoecd/20/54/40895797.pdf.
An
OE
CD
Bro
wo
L e c tur
ylnO dae
R
OECD INFORMATION TECHNOLOGY OUTLOOK 2008 – ISBN 978-92-64-05553-7 – © OECD 2008326

7. ICT POLICY DEVELOPMENTS
se_it E ditin
es
eu
le
digitisation and translation of a variety of Japanese cultural resources into English, French,
Chinese and Korean.
Public sector information and content
The number of OECD countries with policies that facilitate access and commercial
reuse of public-sector information has increased from 11 to 23 since 2006 (i.e. from 44 to
77% of responding countries). This is partly due to national implementation of the
European Commission’s directive on the reuse of public sector information (PSI) in EU
member states, but the increasing significance of the public sector as provider and channel
of digital broadband content is not geographically limited. The recent OECD Council
Recommendation on Public Sector Information will further this development by providing
overarching economic principles for establishment, implementation and review of PSI
policies (see Box 7.9; OECD, 2008e).
While many initiatives concentrate on access and commercial use of information
(e.g. weather information, statistical databases), some are shifting the focus towards
Internet portals which allow end-users (typically freely) access to and use of content,
e.g. geospatial information and educational and cultural content.
The ICT business environment
Policies to facilitate competition in the ICT business environment are an important
part of national strategies of information economies, but compared with previous years
and other policy areas, they have received less attention (Table 7.2), although this may
change with the current economic downturn. This is partly a result of the perceived
effectiveness of pro-competition and competitiveness policies enacted earlier. Most
respondents attribute continued priority to each of the four sub-areas and no country
indicated decreased priority (Table 7.3). Moreover, countries have general cross-sector
policies to provide a competitive and attractive environment for business operations and
investments, which also cover the ICT sector.
Competition in ICT markets
The number of countries citing specific new policies on competition in the ICT sector
was smaller than in previous years, pointing to the continuation of comprehensive policies
enacted earlier. The focus in 2008 is on measures to increase effective competition and to
improve market and policy monitoring. Korea and Japan, for example, highlight recent
policies to ensure competition in the telecommunications sector, including the facilitation
of investments in fixed-mobile convergence and Internet Protocol (IP)-based networks
(see the section on enhancing the infrastructure and OECD, 2007b).
Intellectual property rights
The share of countries with recent policies on intellectual property rights (IPRs) has
fallen since 2006, with less than half of respondents indicating recent policy measures.
This change is also reflected in the allocation of priorities. Whereas the majority of
countries indicated increased priority in 2006, only the Czech Republic, Finland, Germany,
Korea, Mexico, and Singapore did in this survey. Software piracy is the primary focus of IPR-
related policies, and Korea and Japan cite recent policies to improve enforcement of IPR
protection. Governments often refer to co-operation with international organisations,
notably the World Intellectual Property Organization (WIPO).
An
OE
CD
Bro
wo
L e c tur
ylnO dae
R
OECD INFORMATION TECHNOLOGY OUTLOOK 2008 – ISBN 978-92-64-05553-7 – © OECD 2008 327

7. ICT POLICY DEVELOPMENTS
se_it E ditin
es
eu
le
Trade and foreign direct investment
Policies to promote trade and foreign direct investment (FDI) play a moderately
important direct role in ICT policies. The main focus is on promoting ICT exports and
seeking export opportunities, including the establishment of liaison offices abroad,
participation in international fairs, and free trade agreements (see below). Specific
measures include Internet portals and agencies to promote FDI, some of a general nature,
Box 7.9. Public sector information and content
The OECD Council has issued a set of principles to provide a framework for the wider and moreeffective use of public sector information (PSI). The principles aim to increase returns on publicinvestments in public sector information and promote more efficient distribution of thisinformation by providing principles on openness, access and transparent conditions on reuse,quality and integrity, new technologies and long-term preservation, pricing, competition and
copyright issues, international reuse and best practices (see OECD, 2008e). While these principlesunderpin current and future policies, the following are examples of policies cited in the currentsurvey:
In Germany, Bonn, Mainz, Muenster and Nuremberg have set up a map tool and an Internetportal to create new services based on public geographic and spatial data. The cities are alsodeveloping new ways of accessing public information such as environmental data on water quality,
noise levels or constructions plans.
In Korea the national Knowledge Portal provides access to various public-sector databases,which are also available for search through the popular Internet portals Naver and Daum. Uptakeby businesses is exploited through dedicated programmes of the Korean Agency for DigitalOpportunity and Promotion (KADO).
In the Netherlands the SURFnet/Kennisnet project aims to produce innovative applications andservices to allow educational institutions to make optimal use of ICTs, e.g. streaming video ofeducational content from the Dutch public broadcast archives.
The New Zealand Geospatial Strategy is designed to improve access to public geospatialinformation. It provides a framework for the development and management of geospatialresources and aims to ensure compatibility of data collected by different agencies.
Poland’s Ministry of Culture and National Heritage is supporting the digitisation of multimedia
assets in museums as well as the national library. The Polish Film Institute initiated a programmeto finance the digitisation of the national film archives in order to facilitate preservation and publicaccess.
The government of Switzerland is defining an overall preservation policy for Swiss culturalgoods, which includes digitised and digital content. The country is also involved in the EU’s Digital
Libraries Initiative.
Turkey’s Information Society Strategy affirms that policies for commercial and non-commercial(re)use of public-sector information will be enacted in line with existing EU legislation.
The United States created Geospatial One-Stop (GOS), a portal to improve access to geospatialinformation by public entities and the general public. The aim is also to stimulate commercialdevelopment of geospatial tools and to reduce technology risk for data users by providingconsistent and compatible access to information.
Source: Responses to the OECD IT Outlook Policy Questionnaire 2008; OECD, 2008, “OECD Recommendation of theCouncil for Enhanced Access and More Effective Use of Public Sector Information”, OECD, Paris, C(2008)36, www.oecd.org/dataoecd/0/27/40826024.pdf.
An
OE
CD
Bro
wo
L e c tur
ylnO dae
R
OECD INFORMATION TECHNOLOGY OUTLOOK 2008 – ISBN 978-92-64-05553-7 – © OECD 2008328
7. ICT POLICY DEVELOPMENTS
se_it E ditin
es
eu
le
but with a dedicated focus on ICTs (e.g. IDA Ireland). An important part of the work of these
agencies is to provide foreign investors information about investment aid and subsidies,
local partners, pilot projects, R&D facilities, geographic technology/ICT clusters, cash
grants and tax benefits and to support domestic ICT firms to find business partners abroad.
International co-operation
Half of the respondents cite recent policies to promote international co-operation in
ICTs, including:
● Encouraging investment through developing cross-country standards, e.g. on RFID
spectrum use and harmonisation in Canada and the United States, or pilot projects on
cross-border recognition and interoperability of national electronic ID systems in some
EU member states.
● Establishment of free-trade agreements (FTAs) on a bilateral or regional level,
e.g. Singapore with Australia, Japan, Korea and the United States.
● Partnerships and co-operation initiatives, e.g. Mexico-Korea IT co-operation centre
(ITCC-MEXCOR).
● A number of countries mentioned co-operation with international organisations, e.g. the
International Telecommunication Union (ITU) in the area of telecommunication
standards.
Enhancing the infrastructure
OECD governments acknowledge that attaining the socio-economic objectives of
information economies requires rapid and reliable infrastructures. Virtually all countries
cite policies to promote broadband roll-out and use (Table 7.2). Policies in the areas of
electronic settlement/payment and standards have historically been less common, but the
share of countries attributing high priority to these areas has increased from the previous
survey (Table 7.3). A few countries indicated decreased priority, which is partly due to the
effectiveness of policies enacted earlier.
Broadband
Broadband policies have been commonplace since 2006, and, as broadband uptake
expands, the focus turns increasingly to the inclusion of structurally disadvantaged user
groups (see Box 7.10). With regard to priority, 21 out of 27 responding countries gave
broadband policy high priority. Nine countries gave it increased importance (Australia,
Austria, Belgium, Greece, Mexico, New Zealand, the Slovak Republic, Spain, Singapore).
With the exception of Australia, Belgium and the non-OECD member Singapore, these
countries lag the OECD average on broadband penetration suggesting that focused
broadband policies are seen as a way of increasing broadband coverage and use.
Besides the general promotion of broadband uptake, policies aim to bridge access
divides between urban and rural areas, e.g. in Greece, Japan, Korea, Spain, and the United
States (US Department of Agriculture Rural Development Broadband Programme). Australia
and Canada have programmes to facilitate the inclusion of indigenous communities,
although programme funding is sometimes relatively small compared to overall broadband
action plans. Korea, Singapore and other countries that already have high penetration rates
focus on the promotion of ultra high-speed (gigabit) networks, e.g. via fibre-to-the-home
(FTTH), and wireless broadband access technologies.
An
OE
CD
Bro
wo
L e c tur
ylnO dae
R
OECD INFORMATION TECHNOLOGY OUTLOOK 2008 – ISBN 978-92-64-05553-7 – © OECD 2008 329

7. ICT POLICY DEVELOPMENTS
se_it E ditin
es
eu
le
A few countries indicate programmes to develop broadband applications as a way to
increase uptake. By 2010, Korea plans to provide access to broadband convergence
networks (BcN) which integrate a wide array of services to 20 million users, half of whom
are expected to access them via wireless network devices. Moreover, national broadband
plans often refer to domestic R&D and innovation activities, including research into
advanced broadband technologies, development of applications as well as broadband
networks as facilitators of scientific research (see section on fostering ICT R&D and
innovation).
Electronic settlement/payment
The share of countries mentioning electronic settlement and payment policies is
smaller than in previous years. This is to a large degree a result of the widespread
establishment of these technologies in many countries, as indicated by the large number
Box 7.10. Monitoring the Recommendation of the OECD Council on Broadband Development
The Recommendation on Broadband Development provides policy principles to expandbroadband infrastructure, promote efficient and innovative supply, and encourageeffective use of broadband services. The 2008 OECD monitoring exercise shows that thedevelopment and use of broadband has flourished in most OECD countries, but that thereare substantial differences among them and that there are continuing and new issues tobe addressed. Competition among service providers varies between countries and betweenrural and urban areas. Access prices remain high in some markets and users may have a
very limited choice of providers, and while the number of rural connections has increased,their quality varies. Differences remain in the uptake of broadband in businesses,households and schools, and attention needs to be paid to access and use by SMEs anddisadvantaged groups.
Broadband applications and use are expanding, but many services remain experimental.Faster upstream bandwidth is more important as demand for content increases, and
advanced mobile broadband services have yet to develop in most OECD countries. OECDfirms and governments are only beginning to realise the full potential of advancedapplications and the use of broadband in health, e-government services, education,telework, environment, energy and transport systems (intelligent transport systems,smart buildings, monitoring networks) is still in its infancy.
The monitoring exercise shows that new broadband-related security threats are
emerging, and that there are new or more pronounced consumer and privacy issuesdeveloping with “always-on” broadband connections and the development of theparticipative web, all of which warrant continued policy attention. Continuing investmentsin R&D for broadband infrastructure, applications and content are necessary, and devisingbalanced regulatory frameworks, especially in fields such as intellectual property rights,will be a continuing challenge for governments.
A few countries have undertaken broadband policy evaluations that enable policies to bedesigned and implemented in a more effective and accountable manner. These needexpanding. Overall the monitoring exercise identifies ongoing and emerging policy issuesto be tackled to further broadband development, roll-out and innovative use.
Source: OECD, 2008, “Broadband Growth and Policies in OECD Countries”, OECD, Paris, www.oecd.org/dataoecd/32/57/40629067.pdf.
An
OE
CD
Bro
wo
L e c tur
ylnO dae
R
OECD INFORMATION TECHNOLOGY OUTLOOK 2008 – ISBN 978-92-64-05553-7 – © OECD 2008330

7. ICT POLICY DEVELOPMENTS
se_it E ditin
es
eu
le
of “continued” priorities. All countries with decreased (Austria, the Czech Republic) and
low priority (Belgium, Finland, the Netherlands, Sweden) are EU member states, some of
which refer to EC directives and harmonisation of national legislation in this area.
The public sector plays an important role as model user. Finland, for instance, is using
banking technologies for electronic payments and revenue collection. Italy promotes
uptake across the public sector through an electronic public administration payments
system (SIPA), which integrates a wide range of electronic budget execution, assignment
and monitoring functions. However, OECD countries have adopted no single electronic
payment standard. Proprietary standards compete and not all payment methods are
equally accepted across countries.
Standards
As many respondents have policies on ICT standards as on electronic payment/
settlement, but more give it high priority. Policies regarding standards often include model
use by the public sector to spur technology diffusion to businesses, e.g. open standards for
information exchange (Box 7.11). Some countries mention the objective of developing
national standards that will then be internationally adopted (e.g. Korea) and most refer to
co-ordination activities with international standardisation institutions, e.g. the
International Telecommunication Union and the International Organisation for
Standardization.
Some public authorities are encouraging widespread uptake or enabling in
preparation for Internet Protocol version 6 (IPv6) in order to avoid problems related to the
rapidly diminishing supply of IPv4-based Internet addresses (see OECD, 2008f). Japan, for
instance, established an IPv6 Promotion Council in 2001 and is often regarded as a leader
in the transition process, for example through the engagement of companies such as NTT.
Other countries have followed, e.g. in 2005 the US federal government set June 2008 as the
date by which the network infrastructures of all public administration agencies should be
IPv6-capable; but no official evaluation of the achievement of that goal is as yet available.
The European Commission recently proposed a set of actions to facilitate widespread
transition by 2010, e.g. through public procurement.
Promoting trust online
Promoting trust online is not covered by the survey responses in Table 7.2, but
governments indicated their priorities as shown in Table 7.3. The security of information
Box 7.11. Open standards for information exchange
Belgium and the Netherlands have policies to promote the use of OpenDocumentformats (ODF) for all information exchange within the public administration. Belgiumrecently commissioned a study to analyse the impact of ODF on communications in thepublic administration.
Denmark: The National IT and Telecom Agency developed an open source application(NemHandel) for the exchange of e-business documents, e.g. electronic invoices, via theInternet. The application is freely available and can be incorporated in commercialproducts.
Source: Responses to the OECD IT Outlook Policy Questionnaire 2008.
An
OE
CD
Bro
wo
L e c tur
ylnO dae
R
OECD INFORMATION TECHNOLOGY OUTLOOK 2008 – ISBN 978-92-64-05553-7 – © OECD 2008 331

7. ICT POLICY DEVELOPMENTS
se_it E ditin
es
eu
le
systems remains a high policy priority in most responding countries and governments
continue efforts in this area. As Internet penetration and uptake by individuals is growing
rapidly, consumer protection and privacy are becoming a high priority in around half of
respondent countries. Governments are, for instance, taking steps to protect consumers by
preventing Internet-related identity theft and related fraud (Box 7.12).
Policy assessment and evaluationOECD countries clearly acknowledge the importance of evaluation in formulating (and
reformulating) policy goals and related instruments, but coherence in national evaluations
and international comparability of results remain issues to be resolved. The share of
countries reporting systematic and regular assessments of ICT policies has increased to
over 90% in 2008 from just over half in 2004 (Table 7.2). The increase is particularly high in
the area of broadband policies where policy assessment has become commonplace.
Evaluation and monitoring of RFID programmes are still low, but are likely to increase as
governments develop specific RFID policies.
Overall programme evaluation
Programme evaluation is part of most countries’ policy-making process, and this
includes ICT policies. Out of 30 respondents, 26 mentioned individual programme
evaluations. Evaluation procedures typically consist of ex ante and ex post evaluations of
programme impact and administrative procedures. Korea, for instance, carries out
evaluations of ICT programmes as well as of the “informatisation” of government
authorities. The Mexican government assesses the impact of its PROSOFT programme on
employment along with the evaluation of application and grant approval procedures.
Box 7.12. Online identity theft
Consumers benefit from more choice and easier ways to purchase goods and services onthe Internet, but despite growth rates of around 25% per year, business-to-consumeronline transactions are still low, in particular across borders. In a 2008 OECD report,identity theft is identified as one of the main reasons for such limited success (OECD,2008g). According to the US Federal Trade Commission, in 2006, for the sixth consecutiveyear, identity theft topped the list of consumer complaints, accounting for over one-thirdof fraud cases filed with the agency.
Governments have taken steps to implement more effective schemes for fighting IDtheft. In addition to preventive consumer education, actions that stakeholders can take toprotect identity online include: i) the concept should be consistently defined domesticallyand internationally to ensure effective co-operation on enforcement; ii) governmentsshould consider making ID theft a specific offence – this is currently the case in only a fewcountries; iii) statistics to measure ID theft are mostly not comparable across countries oreven authorities in the same country; iv) related legislation such as security breachnotification schemes should require companies holding personal data to inform theircustomers of any risk or security breach affecting their data; v) sanctions should beincreased to discourage fraudsters from evading regulatory compliance by locating in
countries in which identity theft is not or is poorly regulated.
Source: OECD, 2008, “OECD Policy Guidance on Online Identity Theft”, OECD, Paris, DSTI/CP(2007)12/FINAL.
An
OE
CD
Bro
wo
L e c tur
ylnO dae
R
OECD INFORMATION TECHNOLOGY OUTLOOK 2008 – ISBN 978-92-64-05553-7 – © OECD 2008332

7. ICT POLICY DEVELOPMENTS
se_it E ditin
es
eu
le
Evaluation is becoming more widespread and systematic and some countries actively
promote methodologies that are applicable to multiple policy areas (e.g. Austria’s Platform
Research and Technology Policy Evaluation, the United Kingdom’s ROAME system).
However, many evaluations still focus on particular policies rather than a coherent
evaluation of national ICT policy as a whole. Improved evaluation of policies, including co-
ordination among various agencies, ministries and the private sector, is especially needed
as countries increasingly promote ICTs as a way to tackle wider socio-economic
challenges, e.g. ageing populations, climate change.
Evaluation standards and procedures differ among countries, making international
comparisons of programme outcomes, their effectiveness and the promotion of best
practices difficult. There are attempts to create cross-country benchmarking tools, but they
need to be extended. The European Commission, for instance, carries out periodic
benchmarking and evaluation exercises of ICT use in various areas, e.g. health care, the
public sector, and individuals and households (see Box 7.13 on evaluation of its ICT R&D
support).
Box 7.13. Evaluation of ICT R&D in the European Commission’s 6th Framework Programme
The Framework Programme, currently in its 7th edition (FP7), is a multi-year funding
programme for R&D sponsored by the European Commission. ICT-related research hasbeen a major pillar in recent FPs: Between 2003 and 2006 the European Commissiongranted some EUR 4 billion for ICT-related research projects and the funding mechanismsas well as their outcome have been evaluated.
In general, the evaluation concludes that support for ICT-related R&D under FP6 was well
managed and effective. It highlights the successful promotion of pan-European public-private partnerships and research networks, e.g. through joint technology initiatives (JTIs)in areas such as embedded systems. Also, the goal of 15% participation of SMEs has beenexceeded at 20%. The report credits FP6 with reinforcing European co-ordination andemphasises that European cross-border infrastructures are benefiting from FP funding,e.g. by improving standards for and interoperability of national e-government and e-healthsystems.
The evaluation highlights some shortcomings, many of which echo general observationsof the European R&D landscape, especially in international comparisons. It suggests a lackof flexibility in administration procedures and proposes measures such as granting smallamounts of “seed funding” to proposals that have not yet been fully evaluated. The biggertheme of improving Europe’s research and innovation “eco-system” requires wider-ranging,systemic changes that are not necessarily specific to ICT-related R&D, such as increasedavailability of venture capital and better incentives for the commercialisation of R&D. Thereport also highlights a lack of rules for (pre-commercial) procurement of innovative goodsand services by public authorities.
Source: European Commission, 2008, “Information Society Research and Innovation: Delivering results withsustained impact”, Evaluation of the effectiveness of Information Society Research in the 6th FrameworkProgramme 2003-2006, May, http://ec.europa.eu/dgs/information_society/evaluation/data/pdf/fp6_ict_expost/ist-fp6_panel_report.pdf. See also Chapter 3.
An
OE
CD
Bro
wo
L e c tur
ylnO dae
R
OECD INFORMATION TECHNOLOGY OUTLOOK 2008 – ISBN 978-92-64-05553-7 – © OECD 2008 333

7. ICT POLICY DEVELOPMENTS
se_it E ditin
es
eu
le
Assessment of broadband uptake and use
Assessments of broadband uptake have increased in number since 2006 and OECD
governments collect numerous statistics on the progress of broadband strategies. EU
members in conjunction with Eurostat have implemented surveys compatible with the
OECD model surveys for ICT Access and Use by Households and Individuals and ICT Use by
Businesses. Other countries are using variations of one or both surveys, e.g. Australia,
Canada, Japan, Korea, Mexico, New Zealand and Switzerland. The OECD Broadband Portal
(www.oecd.org/sti/ict/broadband) provides a range of internationally comparable broadband-
related statistics, but comparable metrics are not always available in some areas, such as
indicators on broadband coverage, usage of fixed broadband subscriptions and high-speed
mobile data usage (see also Chapter 4).
However, only a few countries go beyond measuring the spread of broadband to
effective monitoring of broadband plans (e.g. Finland, Korea, Japan; see Box 7.10 and OECD,
2008a). Plans rarely include mechanisms to review the performance of government
initiatives.
Assessment of RFID development and applications
Only Canada and Korea indicate efforts to assess and evaluate programmes to diffuse
RFID technologies. The Office of Consumer Affairs at Industry Canada issued a report on
technology uptake (e.g. of the Electronic Product Code, an improvement to existing bar
codes) which reviews policy developments, deployment, pilot projects and consumer
concerns, such as privacy protection. Some countries refer to projects that evaluate the
business use of RFID technologies (typically in partnership with the private sector) and
indicate the need to measure actual and potential socio-economic effects by collecting
effective statistics (e.g. Italy, Portugal, the United Kingdom).
ConclusionThis chapter outlines current policy priorities for information and communication
technologies. It is based on replies to the OECD IT Outlook Policy Questionnaire 2008 and
on trends since the survey was first used in the OECD Information Technology Outlook 2002.
The top ten ranking of current priorities shows that some policies continue to be of high
importance, particularly government online activities, infrastructure issues (especially
broadband), technology diffusion and ICT-related skills and employment. OECD countries
also report increased focus on linking ICT policies with policies for economic growth,
employment and increasing welfare.
Table 7.4. Changing ICT policy priorities, 2008Policies ranked by the number of countries indicating increased priority
1. ICT skills and employment
2. Digital content
3. Government online/as model users
4. ICT R&D programmes
5. Security of information systems and networks
Source: Based on detailed responses to the OECD IT Outlook Policy Questionnaire 2008.
An
OE
CD
Bro
wo
L e c tur
ylnO dae
R
OECD INFORMATION TECHNOLOGY OUTLOOK 2008 – ISBN 978-92-64-05553-7 – © OECD 2008334

7. ICT POLICY DEVELOPMENTS
se_it E ditin
es
eu
le
Some noteworthy changes and developments in ICT policy priorities are described.
Table 7.4 lists five policy areas which have greater priority in 2008; they are presented in
more detail in the overall ranking (Annex Table 7.A1.1):
● Policies to foster ICT skills and employment are receiving more attention. The focus is
mainly on IT education, ranging from ICTs in primary education to life-long learning and
“e-inclusion” programmes, as well as on-the-job training in the private and public sectors.
● Policies regarding digital content have risen greatly in prominence. They include general
policies for digital content development, e.g. the promotion of digital content industries and
digital content generation and use more generally, and especially policies aimed at the (re)
use of public sector information which have become common over the last two years.
● Government online policies have always been significant, but the focus has shifted from
transferring existing business processes online to using ICTs as a tool to transform those
processes and increase the overall efficiency of government. Some countries, e.g. Central
and Eastern European OECD members, emphasise the direct and indirect impact of
e-government activities on the development of information societies.
● ICT R&D programmes have increased both in number and in priority. OECD countries aim
to harness the ICT sector’s innovation potential to stimulate overall national innovation
in the medium and long term. Some countries with lower GDP per capita regard this as
less important than measures to improve ICT uptake and use.
● While the issue of promoting trust online is not covered in detail by the survey, the OECD
Seoul Declaration for the Future of the Internet Economy highlights countries’ preoccupation
with security-related issues, especially for consumer and user protection and for critical
information systems and infrastructures.
Policies that focus exclusively on the ICT business environment have decreased in
prominence, a further indication that ICT policies are now becoming less sector-specific
and more a part of the mainstream economic policies that concern the economy and
society as a whole, although this may change with the current economic downturn.
The shift in ICT policies in some instances also results in changes in the institutional
context within which these policies are formulated and implemented. OECD countries
with long-term strategies for information societies typically emphasise the role of ICTs and
the Internet as key enablers of wider societal change, in some cases alongside other
technologies, e.g. biotechnology and nanotechnology.
The survey shows that stronger links between ICT policies and government objectives,
in areas such as social cohesion, the environment, health care, education and national
security, can lead to two types of, often sequential, institutional developments. First, the
number of ministries and agencies involved increases as the policy portfolio extends well
beyond infrastructure and economic development. Second, governments formalise this
divers ity through co-ordination bodies that centralise the formulation and
implementation of ICT policies. Most countries still follow a decentralised approach, but
one-third of OECD countries have already established government-wide co-ordination
institutions. Their set-ups and competencies vary, ranging from ad hoc committees, e.g. for
the formulation of Iceland’s recent ICT policy strategy, through advisory bodies, as in
Denmark or Switzerland, to standing policy-formulating committees reporting directly to
the prime minister (e.g. in Japan and Korea).
An
OE
CD
Bro
wo
L e c tur
ylnO dae
R
OECD INFORMATION TECHNOLOGY OUTLOOK 2008 – ISBN 978-92-64-05553-7 – © OECD 2008 335

7. ICT POLICY DEVELOPMENTS
se_it E ditin
es
eu
le
Apart from the need to co-ordinate diverse institutions, governments face challenges
for developing and implementing future ICT policies. The increasing pervasiveness of ICTs,
for example, presents governments with a trade-off: to design ICT policies to promote
technology research and uptake or to channel and guide technology developments towards
dealing with wider socio-economic objectives. As the current survey shows, ICT policies
are often expected to produce outcomes that go beyond technology uptake and diffusion,
thereby increasing the challenge to measure the socio-economic impacts of ICTs and their
contribution to increasing welfare.
ICT policies have evolved to meet new priorities while continuing to focus on core
activities. These policies will be tested in terms of their contributions to long-run
competitiveness, growth and employment. To safeguard the future, it is crucial in light of
the sharp economic downturn which began in 2008 to maintain long-term priorities and
investments in research, innovation and human resources.
Notes
1. See www.oecd.org/FutureInternet.
2. In total, all OECD countries, plus the European Commission (EC) and non-member Singaporereplied to the questionnaire in part or in full. Individual country responses are posted on the OECDInformation Economy web page (www.oecd.org/sti/information-economy).
3. The importance of improving ICT skills and competencies among civil servants is a key challengefor the implementation of e-government according to OECD e-government country studies(available at www.oecd.org/gov/egov).
References
OECD (2005), “ICT Diffusion to Business: Pursuing Policy Reform”, OECD, Paris, DSTI/ICCP/IE(2005)6,internal working document.
OECD (2007a), “ICTs and Gender”, OECD, Paris, DSTI/ICCP/IE(2006)9/FINAL, www.oecd.org/dataoecd/16/33/38332121.pdf.
OECD (2007b), OECD Communications Outlook 2007, OECD, Paris, www.oecd.org/sti/telecom/outlook.
OECD (2007c), “E-Government as a Tool for Transformation”, OECD, Paris, GOV/PGC(2007)6, internalworking document.
OECD (2008a), “Broadband Growth and Policies in OECD Countries”, OECD, Paris, www.oecd.org/dataoecd/32/57/40629067.pdf.
OECD (2008b), “RFID Applications, Impacts And Country Initiatives”, OECD, Paris, DSTI/ICCP/IE(2007)13/FINAL, www.oecd.org/dataoecd/6/12/40536990.pdf.
OECD (2008c), “OECD Policy Guidance On Radio Frequency Identification (RFID)”, OECD, Paris, DSTI/ICCP/IE/REG(2007)1/FINAL.
OECD (2008d), “OECD Policy Guidance for Digital Content”, OECD, Paris, www.oecd.org/dataoecd/20/54/40895797.pdf.
OECD (2008e), “OECD Recommendation of the Council for Enhanced Access and More Effective Use ofPublic Sector Information”, OECD, Paris, C(2008)36, www.oecd.org/dataoecd/0/27/40826024.pdf.
OECD (2008f), “Economic Considerations in the Management of IPv4 and in the Deployment of IPv6”,OECD, Paris, DSTI/ICCP(2007)20/FINAL, www.oecd.org/dataoecd/7/1/40605942.pdf.
OECD (2008g), “OECD Policy Guidance on Online Identity Theft”, OECD, Paris, DSTI/CP(2007)12/FINAL,www.oecd.org/dataoecd/49/39/40879136.pdf.
An
OE
CD
Bro
wo
L e c tur
ylnO dae
R
OECD INFORMATION TECHNOLOGY OUTLOOK 2008 – ISBN 978-92-64-05553-7 – © OECD 2008336

7. ICT POLICY DEVELOPMENTS
DB
ro
wse_it E ditio
n
es
eu
le
ylnO d
ANNEX 7.A1
Figure 7.A1.1. ICT policy framework
Note: Policy areas have been developed on the basis of priorities expressed in national replies, the frameworkdeveloped in the series of peer reviews on ICT diffusion to business, and other completed work of the Working Partyon the Information Economy. Policy areas with an asterisk (*) are examined in the OECD Communications Outlook andpromoting trust online is not dealt with in detail.
ICT policies
Fostering ICTinnovation
Increasing diffusion/Use
Maintaining a healthy ICT business environment
Promoting trust online
Enhancing the infrastructure
R&D programmes Diffusion to businesses
Standards Privacy protection
Trade and FDI
Broadband
Consumer protection
Venture finance
Organisational change
General network infrastructure*
Innovation networks e-government
Content
Government demonstration
Diffusion to householdsand individuals
Professional/managerial ICT skills
Security of information systems and networks
Electronic payment/settlement
International co-operation
Government development
Government procurement
Competition in ICT markets
Intellectual property rights
RFID
An
OE
C
L e c tur
aeR
OECD INFORMATION TECHNOLOGY OUTLOOK 2008 – ISBN 978-92-64-05553-7 – © OECD 2008 337

7. ICT POLICY DEVELOPMENTS
se_it E ditin
es
eu
le
Table 7.A1.1. Ranking of ICT policy areas, 2008
ICT policy areaNumber of countrieswith policy in place
Number of countries indicating high policy
priority
Number of countries indicating increased
policy priority Sum
(out of 30) (out of 28) (out of 28) (max. 86)
1 Government online, government as model users 30 23 11 64
2 Broadband 30 21 9 60
3 ICT R&D programmes 24 20 10 54
4 Promoting IT education1 27 18 12 54
5 Technology diffusion to businesses 28 18 8 53
6 Technology diffusion to individuals and households 24 18 7 53
7 Industry-based and on-the-job training1 22 18 12 49
8 General digital content development1 22 14 12 48
9 Public sector information and content1 19 14 12 48
10 ICT innovation support 24 13 7 44
11 Standards 18 16 8 42
12 Government development projects 20 14 5 39
13 Electronic settlement/payment 18 12 7 37
14 Competition in ICT markets 15 12 8 35
15 Government ICT procurement 18 8 10 35
16 Trade and foreign direct investment 17 11 5 34
17 International co-operation 15 11 6 32
18 Organisational change 14 6 6 31
19 Venture finance 19 7 9 30
20 Demonstration programmes 19 3 6 28
21 Intellectual property rights 12 7 6 25
22 Improving labour market information1 7 9 6 22
23 Foreign workers1 14 9 6 20
24 RFID programmes2 5 3 3 20
25 International sourcing1 2 9 6 17
1 2 http://dx.doi.org/10.1787/4781170140471. Countries were not asked to prioritise sub-areas for ICT skills and employment and digital content. For digital
content, the number of countries indicating high and increased priorities is used for both sub-areas because of thehigh number of policy replies received. For ICT skills and employment, only two sub-areas were treated in thisway, whereas the number of countries indicating high and increased priorities for the remaining three werehalved because of the comparably low number of policy replies received. The ranking includes only policy areas covered in both Tables 7.2 and 7.3., i.e. co-ordination and priority setting,promoting trust online, policy assessment and evaluation are not included.
2. New policy area in the 2008 survey.Source: Based on detailed responses to the OECD IT Outlook Policy Questionnaire 2008.
An
OE
CD
Bro
wo
L e c tur
ylnO dae
R
OECD INFORMATION TECHNOLOGY OUTLOOK 2008 – ISBN 978-92-64-05553-7 – © OECD 2008338

ISBN 978-92-64-05553-7OECD Information Technology Outlook 2008
© OECD 2008
DB
ro
wse_it E ditio
n
es
eu
le
ylnO d
ANNEX A
Methodology and Definitions
This annex describes the definitions and classifications adopted in Chapters 1,
2 and 3 of this edition of the OECD Information Technology Outlook. Thesedefinitions and classifications, and the data collected on the basis of them, drawwherever possible on work by the OECD Working Party on Indicators for theInformation Society (WPIIS) which seeks to improve the international comparability
and collection of statistics and data on the information economy and informationsociety.
An
OE
C
L e c tur
aeR
339

ANNEX A. METHODOLOGY AND DEFINITIONS
DB
ro
wse_it E ditio
n
es
eu
le
ylnO d
Chapter 1
ICT investment
ICT investment comprises information technology equipment, communications
equipment and software. ICT investment is likely to be under-estimated as expenditure on
ICT products is only considered as investment if it can be physically isolated. This will
apply particularly to software but also to components embedded in other equipment.
Furthermore, software is very often rented (licensing is very common in standard and
semi-customised business software packages), and it can also can be developed on own
account.
For a more detailed overview of Investment in ICT as a share of total investment
see Section E.1, “Investment in ICT Equipment and Software” in OECD Science, Technology
and Industry Scoreboard 2007, OECD, Paris.
Recent developments
Indicators are taken from the sources cited at the bottom of each graph. Refer to these
sources for more details. Note that definitions of goods and services groupings vary across
countries.
Semiconductor data
Data are provided by the World Semiconductor Trade Statistics (WSTS), an industry
association of some 70 semiconductor manufacturers representing around 90% of the
value of production. WSTS collects revenue statistics directly from its members. The data
cover only the “commercial” (merchant) semiconductor market and not internal or
“captive” consumption (www.wsts.org).
ICT sector value added and employment
To the extent possible, data on value added and employment are collected according
to the official 1998 (and amended slightly in 2002) OECD industry-based definition of the
ICT sector which comprises both ICT goods and services. This widely accepted definition of
the ICT sector is the first step towards comparisons over time and across countries. The
ISIC Rev. 3.1 classes included in the definition are:
Manufacturing
● 3000 Manufacture of office, accounting and computing machinery.
● 3130 Manufacture of insulated wire and cable.
● 3210 Manufacture of electronic valves and tubes and other electronic components.
● 3220 Manufacture of television and radio transmitters and apparatus for line telephony
and line telegraphy.
An
OE
C
L e c tur
aeR
OECD INFORMATION TECHNOLOGY OUTLOOK 2008 – ISBN 978-92-64-05553-7 – © OECD 2008340

ANNEX A. METHODOLOGY AND DEFINITIONS
se_it E ditin
es
eu
le
● 3230 Manufacture of television and radio receivers, sound or video recording or
reproducing apparatus, and associated goods.
● 3312 Manufacture of instruments and appliances for measuring, checking, testing,
navigating and other purposes, except industrial process control equipment.
● 3313 Manufacture of industrial process control equipment.
Services: goods-related
● 5151 Wholesale of computers, computer peripheral equipment and software.
● 5152 Wholesale of electronic and telecommunications parts and equipment.
● 7123 Renting of office machinery and equipment (including computers).
Services: intangible
● 6420 Telecommunications
● 7200 Computer and related activities
However, the definition is not yet consistently applied and data provided by OECD
countries and available in the OECD STAN database have in some cases been combined
with data from other sources to estimate ICT aggregates that are compatible with national
accounts totals. These data are also partly estimated for missing values. For this reason,
the statistics presented here are not directly comparable with those contained in many
national reports and in previous OECD publications (see OECD Information Technology
Outlook 2006). When such data were not available, the footnotes clarify the scope for each
country.
ICT markets and spending
Data on ICT markets and spending are based on data published by World Information
Technology and Services Alliance (WITSA), based on research by Global Insight, Inc.
In this section the definition used for the ICT spending is based on a narrower one and
it is as follows:
● Computer hardware includes the total value of purchased or leased computers, storage
devices, memory upgrades, printers, monitors, scanners, input-output devices,
terminals, other peripherals, and bundled operating systems.
● Computer software includes the total value of purchased or leased packaged software
such as operating systems, database systems, programming tools, utilities, and
applications. It excludes expenditures for internal software development and
outsourced custom software development.
● Computer services includes the total value of outsourced services (whether domestic or
offshore) such as IT consulting, computer systems integration, outsourced custom
software development, outsourced World Wide web page design, network systems
integration, office automation, facilities management, equipment maintenance, web
hosting, computer disaster recovery, and data processing services.
● Communications includes the total value of voice and data communications services
and equipment.
An
OE
CD
Bro
wo
L e c tur
ylnO dae
R
OECD INFORMATION TECHNOLOGY OUTLOOK 2008 – ISBN 978-92-64-05553-7 – © OECD 2008 341

ANNEX A. METHODOLOGY AND DEFINITIONS
se_it E ditin
es
eu
le
● Communications services include local and long distance wire-line telecommunications,
wireless telecommunications, paging, satellite telecommunications, Internet access,
private line services, and other data communications services.
● Communications equipment includes wire-line and wireless telephone handsets,
legacy and IP PBXs, key systems, wired and wireless LAN equipment, WAN equipment,
central office equipment, modems, multiplexers, and telephone answering machines
and systems.
Chapter 2
Trade
ICT goods
A commodity-based definition of the ICT sector is used based on the CPC (Central
Product Classification) and the Harmonised System (HS). See code details and broad
categories of groups in “A Proposed Classification of ICT Goods”, document ref. DSTI/ICCP/
IIS(2003)1/REV2, available at www.oecd.org/dataoecd/5/61/22343094.pdf.
For ICT goods, the ICT commodities list is more accurate than the industry-based sector
definition used previously, which only approximates the ICT sector. For ICT goods, trade
data were extracted from the joint OECD-UNSD International Trade Statistics (ITCS)
database. Following the OECD proposed classification, this publication groups the detailed
codes of ICT goods into five broad categories: Telecommunications equipment, Computer
and related equipment, Electronic components, Audio and video equipment, and Other ICT
goods.
Software goods, which are not included in the ICT goods classification listed above,
were defined using the Harmonised System (HS2002) and include the following product
groups:
● 852431: discs, recorded, for laser reading systems, for reproducing phenomena other
than sound or image.
● 852439: discs, recorded, for laser reading systems, for reproducing sound and image or
image only.
● 852440: magnetic tapes, recorded, for reproducing phenomena other than sound or
image.
● 852491: recording media (excluding those for sound or image recordings, discs for laser
reading systems, magnetic tapes, cards incorporating a magnetic stripe and goods of
Chapter 37).
● 852499: recorded media for sound or image reproducing phenomena, including matrices
and masters for the production of records (excluding gramophone records, discs for laser
reading systems, magnetic tapes, cards incorporating a magnetic stripe and goods of
Chapter 37).
The OECD Working Party on Indicators for the Information Society (WPIIS) is
developing a revised OECD ICT goods classification based on the Central Product
Classification, Version 2 which will be available for use in early 2009 and will include a
correspondence table to HS2007. However this revision will also narrow the scope of ICT
goods and thus reduce values for ICT goods trade.
An
OE
CD
Bro
wo
L e c tur
ylnO dae
R
OECD INFORMATION TECHNOLOGY OUTLOOK 2008 – ISBN 978-92-64-05553-7 – © OECD 2008342

ANNEX A. METHODOLOGY AND DEFINITIONS
se_it E ditin
es
eu
le
ICT services
For ICT services, an industry-based definition was used. The two ICT services sectors
correspond to the following Balance of Payments Coding System (BPM5) categories (for a
full list, see www.imf.org/external/np/sta/bopcode/topical.htm):
● 245: communications services
● 262: computer and information services. This one includes a range of processing,
bureau, consulting, development, database and other subscription services.
Trade performance indicators
Revealed comparative advantage
Revealed comparative advantage is calculated as the ratio of the share of ICT goods
exports in total merchandise exports for each country to the share of OECD ICT exports in
total OECD merchandise exports – i.e. (country ICT exports/country total exports)/(OECD
ICT exports/OECD total exports).
where stands for exports for industry i from country j, stands
for total manufacturing exports from country j, and denotes total OECD exports for
industry i.
A value greater than 1 indicates a comparative advantage in ICTs, and a value of less
than 1 a comparative disadvantage.
Grubel-Lloyd Index
The most widely used measure of intra-industry trade is the Grubel-Lloyd Index.
GLIi + [1 – |Mi – Xi| / (Mi – Xi)] where Mi and Xi stand for imports and exports for
industry I respectively.
The closer the values of imports and exports, the higher the index.
ICT goods production, trade and sales
Data on production, trade and sales of ICT goods were compiled from Reed Electronics
Research, Yearbook of World Electronics Data 2006 and previous years. The six main groups
that comprise ICT goods, and their corresponding Standard International Trade
Classification (SITC) Revision.3 codes, are:
● Electronic data processing (EDP) equipment: 752.1, 752.2, 752.3, 752.6, 752.7, 752.9, 759.9.
● Office equipment: 751.1, 751.2, 763.3, 763.8, 751.3, 759.1.
● Control and instrumentation: 778.7, 874.1, 874.2, 874.3, 874.4, 874.5, 874.6, 874.7
● Radio communications (including mobiles) and radar: 764.3, 764.8, 764.9, 874.1.
● Telecommunications: 764.1, 764.9, 763.8.
● Consumer equipment: 763.8, 764.8, 761.1, 761.2, 763.3, 763.8, 762.1, 762.2, 762.8, 881.1,
885.3, 885.4, 885.7, 898.2.
● Components: 776.2, 776.3, 776.4, 776.8, 771.1, 771.2, 778.6, 772.2, 772.3, 772.4, 772.5, 764.2,
764.9, 898.4, 761.1.
OT
Oi
jT
ji
ji
XX
XX
RCA jiX j
TX
OiX
An
OE
CD
Bro
wo
L e c tur
ylnO dae
R
OECD INFORMATION TECHNOLOGY OUTLOOK 2008 – ISBN 978-92-64-05553-7 – © OECD 2008 343

ANNEX A. METHODOLOGY AND DEFINITIONS
se_it E ditin
es
eu
le
FDI flows
FDI data from the OECD International Direct Investment Statistics Yearbook cover the
following ICT-related sectors (the corresponding ISIC Rev. 3 codes are in parentheses):
● Office machinery, computers, radio, TV and communication equipment (30, 32).
● Telecommunication services (642).
Mergers and acquisitions
Detailed analysis of cross-border M&As is based on Dealogic data (www.dealogic.com).
ICT sector M&As are those in which ICT sector entities, defined by primary NAICS
(North American Industry Classification System), are the acquirer and/or target. The ICT
sector includes the following NAICS industry groups:
● Manufacturing. Communications equipment manufacturing: 33421: Telephone apparatus
manufacturing; 33422: Radio and television broadcasting and wireless communications
equipment manufacturing; 33429: Other communications equipment manufacturing;
33431: Audio and video equipment manufacturing; Computer and office equipment
manufacturing: 33411: Computer and peripheral equipment manufacturing; Electronics
equipment manufacturing: 33441: Semiconductor and other electronic component
manufacturing; 33451: Navigational, measuring, electro-medical, and control
instruments manufacturing; 33461: Manufacturing and reproducing magnetic and
optical media.
● IT services. 51121: Software publishers; 54151: Computer systems design and related
services.
● IT wholesale. 42342: Office equipment merchant wholesalers; 42343: Computer and
computer peripheral equipment and software merchant wholesalers; 42362: Electrical
and electronic appliance, television, and radio set merchant wholesalers; 42369: Other
electronic parts and equipment merchant wholesalers.
● Media and content. 51211: Motion picture and video production; 51212: motion picture and
video distribution; 51213: Motion picture and video exhibition; 51219: Postproduction
services and other motion picture and video industries; 51221: Record production;
51222: Integrated record production/distribution; 51223: Music publishers; 51224: Sound
recording studios; 51229: Other sound recording industries; 51511: Radio broadcasting;
51512: Television broadcasting; 51521: Cable and other subscription programming;
51611: Internet publishing and broadcasting.
● Communication services. 51711: Wired telecommunications carriers; 51721: Wireless
telecommunications carriers (except satellite); 51731: Telecommunications resellers;
51741: Satellite telecommunications; 51751: Cable and other program distribution;
51791: Other telecommunications; 51811: Internet service providers and web search
portals; 51821: Data processing, hosting, and related services.
Chapter 3Definitions for R&D figures follow the Frascati Manual: Proposed Standard Practice for
Surveys on Research and Experimental Development, OECD, Paris.
For this chapter on R&D expenditures, the ICT sector is defined to comprise:
(ISIC Rev. 3) 30 – Manufacture of office, accounting and computing machinery; 32 –
Manufacture of radio, television and communication equipment and apparatus (which
An
OE
CD
Bro
wo
L e c tur
ylnO dae
R
OECD INFORMATION TECHNOLOGY OUTLOOK 2008 – ISBN 978-92-64-05553-7 – © OECD 2008344

ANNEX A. METHODOLOGY AND DEFINITIONS
se_it E ditin
es
eu
le
includes electronic components and semiconductors); 33 – Manufacture of medical,
precision and optical instruments, watches and clocks; 642 – Telecommunications; 72 –
Computer and related activities. Note that in the OECD Information Technology Outlook 2006,
ISIC 33 was excluded.
For a more detailed overview of R&D investment see Section A: “R&D and Investment
in Knowledge” in OECD Science, Technology and Industry Scoreboard 2007, OECD, Paris.
An
OE
CD
Bro
wo
L e c tur
ylnO dae
R
OECD INFORMATION TECHNOLOGY OUTLOOK 2008 – ISBN 978-92-64-05553-7 – © OECD 2008 345

OECD PUBLISHING, 2, rue André-Pascal, 75775 PARIS CEDEX 16PRINTED IN FRANCE
(93 2008 04 1 P) ISBN 978-92-64-05553-7 – No. 56417 2008
An
OE
CD
Bro
wse_it E ditio
n
L e c tures
eu
le
ylnO dae
R

www.oecd.org/publishing
OE
CD
Inform
ation Techno
log
y Outlo
ok
OECD Information Technology Outlook Information technology (IT) and broadband are major drivers of research, innovation, economic growth and social change. The 2008 edition of the OECD Information Technology Outlook analyses recent developments in the IT goods and services industries, and suggests that the outlook is for continued long-term growth, constrained by the currently very uncertain macroeconomic environment in OECD countries but with somewhat higher growth possible elsewhere.
The industry is organised internationally. Cross-border investment, trade, and mergers and acquisitions remain high, and ICTs drive globalisation in general. The industry is rapidly restructuring with non-OECD countries, particularly China and India, as major suppliers of information and communications technology (ICT)-related goods and services. The ICT industry is the major performer of R&D; many other industries undertake ICT R&D; and ICT-related R&D drives innovation and new goods and services in many industries.
This edition analyses the impact of high-speed broadband on the economy, and areas of future impacts. The Internet is changing everyday life for 1.5 billion people worldwide, with their socio-economic standing influencing how they use the web. The dynamic growth of digital-content-based creative industries is outlined, covering user-created content, online computer and video games, film and video, music, and online advertising.
Recent trends in OECD ICT policies are analysed to assess whether they are rising to these new challenges. Highly prioritised policy areas include investing in ICT R&D and innovation, improving government online activities, spreading broadband, increasing the use of ICTs, raising ICT skills and employment, and supporting digital content development. Changing policy priorities are reviewed.
The full text of this book is available on line via this link: www.sourceoecd.org/scienceIT/9789264055537
Those with access to all OECD books on line should use this link: www.sourceoecd.org/9789264055537
SourceOECD is the OECD online library of books, periodicals and statistical databases. For more information about this award-winning service and free trials ask your librarian, or write to us at [email protected].
ISbn 978-92-64-05553-7 93 2008 04 1 P -:HSTCQE=UZZZX\:
2008
OECD Information Technology Outlook
2008
2008
An
OE
CD
Bro
wse_it E ditio
n
L e c tures
eu
le
ylnO dae
R