OECD Digital Economy Outlook 2020
318
OECD Digital Economy Outlook 2020
-
Upload
khangminh22 -
Category
Documents
-
view
29 -
download
0
Transcript of OECD Digital Economy Outlook 2020
OECD Digital Economy Outlook 2020


OECD Digital Economy Outlook
2020
This document, as well as any data and map included herein, are without prejudice to the status of or sovereignty overany territory, to the delimitation of international frontiers and boundaries and to the name of any territory, city or area.
The statistical data for Israel are supplied by and under the responsibility of the relevant Israeli authorities. The use ofsuch data by the OECD is without prejudice to the status of the Golan Heights, East Jerusalem and Israeli settlements inthe West Bank under the terms of international law.
Note by TurkeyThe information in this document with reference to “Cyprus” relates to the southern part of the Island. There is no singleauthority representing both Turkish and Greek Cypriot people on the Island. Turkey recognises the Turkish Republic ofNorthern Cyprus (TRNC). Until a lasting and equitable solution is found within the context of the United Nations, Turkeyshall preserve its position concerning the “Cyprus issue”.
Note by all the European Union Member States of the OECD and the European UnionThe Republic of Cyprus is recognised by all members of the United Nations with the exception of Turkey. Theinformation in this document relates to the area under the effective control of the Government of the Republic of Cyprus.
l a cit t i u lication aOECD (2020), OECD Digital Economy Outlook 2020, OECD Publishing, Paris, https://doi.org/10.1787/bb167041-en.
ISBN 978-92-64-42476-0 (print)ISBN 978-92-64-74044-0 (pdf)
oto c it Cover © iStockphoto.com/metamorworks
Corrigenda to publications may be found on line at: www.oecd.org/about/publishing/corrigenda.htm.
© OECD 2020
The use of this work, whether digital or print, is governed by the Terms and Conditions to be found at http://www.oecd.org/termsandconditions.

FOREWORD
3OECD DIGITAL ECONOMY OUTLOOK 2020 © OECD 2020
Foreword
The OECD Digital Economy Outlook 2020 examines and documents evolutions and emerging opportunities and challenges in the digital economy. It highlights how OECD countries and partner economies are taking advantage of information and communication technologies (ICTs) and the Internet to meet their public policy objectives. Through comparative evidence, it informs policy makers of regulatory practices and policy options to help maximise the potential of the digital economy as a driver for innovation and inclusive growth.
This third edition of the OECD Digital Economy Outlook provides a holistic overview of converging trends, policy developments and data on both the supply and demand sides of the digital economy. It illustrates how the digital transformation is affecting economies and societies. Finally, it provides a special focus on how the COVID-19 pandemic is amplifying opportunities and challenges from the digital transformation.
The OECD Secretariat prepared the OECD Digital Economy Outlook 2020 under the guidance of the OECD Committee on Digital Economy Policy (CDEP), chaired by Yoichi Iida (Japan). The publication has benefited from the input of delegates to the Committee and its Working Parties on Communications Infrastructure Services Policy (CISP), on Measurement and Analysis of the Digital Economy (MADE), on Security in the Digital Economy (SDE) and on Privacy and Data Governance (PDG). A large part of its content builds on responses by OECD countries and partner economies to the 2019 OECD Digital Economy Policy Questionnaire.
The OECD Digital Economy Outlook 2020 was prepared by the Division on Digital Economy Policy in the OECD Directorate for Science, Technology and Innovation. The publication was co-ordinated by Elif Koksal-Oudot and Vincenzo Spiezia, under the supervision of Audrey Plonk, Head of Division. Authors include, in alphabetical order, Brigitte Acoca, Laurent Bernat, Frédéric Bourassa, Lauren Bourke, Thyme Burdon, Ghislain De Salins, Laura Galindo-Romero, David Gierten, Alexia González-Fanfalone, Louise Hatem, Suguru Iwaya, Daniel Ker, Elif Koksal-Oudot, Jaeho Lee, Molly Lesher, Christopher Lomax, Emanuele Mazzini, Andras Molnar, Pierre Montagnier, Matthew Nuding, Karine Perset, Christian Reimsbach-Kounatze, Elettra Ronchi, Lucia Russo, Vincenzo Spiezia, Jan Tscheke, Verena Weber and Jeremy West.
Further inputs were provided by Sarah Box, Dirk Pilat and Andy Wyckoff (all chapters); Michela Bello, Hélène Dernis, Fernando Galindo-Rueda, Brigitte van Beuzekom and Fabien Verger (Chapter 9); Felipe González-Zapata (Chapter 4); Marco Bianchini and Sandrine Kergroach (Chapters 4 and 11); Stijn Broecke (Chapter 10); and Caroline Malcolm (Chapter 11). Linde Wester contributed the section on quantum computing in Chapter 11 as an external author. Mark Foss and Angela Gosmann provided editorial support. Marion Barberis, Sarah Ferguson and Alice Weber provided assistance with formatting.
The OECD Committee on Digital Economy Policy (CDEP) declassified the OECD Digital Economy Outlook 2020 on 24 September 2020 by written procedure. The OECD Secretariat prepared it for publication.


TABLE OF CONTENTS
OECD DIGITAL ECONOMY OUTLOOK 2020 © OECD 2020 5
Table of Contents
Foreword ........................................................................................................................................................................................................ 3
Acronyms, abbreviations and units of measure ........................................................................................................... 9
Executive Summary .............................................................................................................................................................................. 13
Chapter 1 GOING DIGITAL: AN INTEGRATED APPROACH TO POLICY MAKING IN THE DIGITAL AGE
Key findings .................................................................................................................................................................................... 16Introduction ................................................................................................................................................................................... 16Access .................................................................................................................................................................................................. 17Use .......................................................................................................................................................................................................... 19Innovation ........................................................................................................................................................................................ 20Jobs ......................................................................................................................................................................................................... 22Society ................................................................................................................................................................................................. 24Trust ...................................................................................................................................................................................................... 25Market openness ........................................................................................................................................................................ 27Putting the framework into practice .......................................................................................................................... 28References ........................................................................................................................................................................................ 30Notes .................................................................................................................................................................................................... 31
Chapter 2 POLICY TRENDSKey findings .................................................................................................................................................................................... 34Introduction .................................................................................................................................................................................. 34National digital strategies................................................................................................................................................... 35Key policy developments ..................................................................................................................................................... 39References ........................................................................................................................................................................................ 54Notes .................................................................................................................................................................................................... 54
Chapter 3 ACCESS AND CONNECTIVITYKey findings .................................................................................................................................................................................... 58Introduction ................................................................................................................................................................................... 58Trends in access and connectivity............................................................................................................................... 59Developments in communication policy and regulation ......................................................................... 79References ........................................................................................................................................................................................ 88Notes .................................................................................................................................................................................................... 91
Chapter 4 DIGITAL UPTAKE, USAGE AND SKILLSKey findings .................................................................................................................................................................................... 94Introduction ................................................................................................................................................................................... 94Use of digital technologies by individuals ............................................................................................................ 95ICT usage by businesses....................................................................................................................................................... 103Digital government ................................................................................................................................................................... 111Skills for the digital transformation ........................................................................................................................... 115References ........................................................................................................................................................................................ 126Notes .................................................................................................................................................................................................... 127
Chapter 5 ENHANCING DATA ACCESS, SHARING AND RE-USEKey findings .................................................................................................................................................................................... 130Introduction ................................................................................................................................................................................... 130Trends in the use of data and data analytics...................................................................................................... 131Data sharing and re-use beyond borders ............................................................................................................... 135

TABLE OF CONTENTS
OECD DIGITAL ECONOMY OUTLOOK 2020 © OECD 2020 6
Facilitating data sharing and re-use: An overview of government initiatives ........................ 140References ........................................................................................................................................................................................ 148Notes .................................................................................................................................................................................................... 151
Chapter 6 PRIVACY AND DATA PROTECTIONKey findings .................................................................................................................................................................................... 156Introduction ................................................................................................................................................................................... 156Technological developments and implications for privacy .................................................................... 158Privacy and data protection concerns ...................................................................................................................... 160New regulations under international, regional and national frameworks for cross-border data flows, privacy and personal data protection ................................................ 163Ongoing efforts to strengthen compliance with, and enforcement of, privacy and data protection frameworks .......................................................................................................................................................... 169References ........................................................................................................................................................................................ 173Notes .................................................................................................................................................................................................... 175
Chapter 7 DIGITAL SECURITYKey findings .................................................................................................................................................................................... 178Introduction ................................................................................................................................................................................... 178Trends in digital security risk ......................................................................................................................................... 178Evolution of digital security policies ........................................................................................................................ 187Policies to encourage digital security innovation ........................................................................................... 189Initiatives to improve digital security of products and better manage vulnerabilities ............................................................................................................................................................................... 191Digital security and artificial intelligence ............................................................................................................ 195References ........................................................................................................................................................................................ 199Note ....................................................................................................................................................................................................... 202
Chapter 8 CONSUMER POLICY IN THE DIGITAL TRANSFORMATIONKey findings .................................................................................................................................................................................... 204Introduction ................................................................................................................................................................................... 204Technological trends and developments ............................................................................................................... 204Using behavioural insights to address consumer policy challenges in the digital transformation ........................................................................................................................................... 208References ........................................................................................................................................................................................ 216
Chapter 9 DIGITAL INNOVATIONKey findings .................................................................................................................................................................................... 220Introduction ................................................................................................................................................................................... 220Innovation in digital technologies ............................................................................................................................. 221The digitalisation of science and innovation ..................................................................................................... 225The digitalisation of science and innovation policy ..................................................................................... 234References ........................................................................................................................................................................................ 238Notes .................................................................................................................................................................................................... 239
Chapter 10 EVOLVING BUSINESS MODELSKey findings .................................................................................................................................................................................... 242Introduction ................................................................................................................................................................................... 242The rise of new e-commerce business models ................................................................................................. 242Online platforms ........................................................................................................................................................................ 247Digital business models and work ............................................................................................................................. 254Digital transformation during COVID-19: Business models and work practices ................................................................................................................................................................... 260References ........................................................................................................................................................................................ 267Notes .................................................................................................................................................................................................... 269

TABLE OF CONTENTS
OECD DIGITAL ECONOMY OUTLOOK 2020 © OECD 2020 7
Look for the StatLinks2at the bottom of the tables or graphs in this book. To download the matching Excel® spreadsheet, just type the link into your Internet browser, starting with the http://dx.doi.org prefix, or click on the link from the e-book edition.
Follow OECD Publications on:
This book has... StatLinks2A service that delivers Excel® files from the printed page!
http://twitter.com/OECD_Pubs
http://www.facebook.com/OECDPublications
http://www.linkedin.com/groups/OECD-Publications-4645871
http://www.youtube.com/oecdilibrary
http://www.oecd.org/oecddirect/ OECD
Alerts
Chapter 11 ARTIFICIAL INTELLIGENCE, BLOCKCHAIN AND QUANTUM COMPUTINGKey findings .................................................................................................................................................................................... 272Introduction ................................................................................................................................................................................... 272Artificial intelligence ............................................................................................................................................................... 273National policies promote the responsible stewardship of trustworthy AI systems ....................................................................................................................................................................................... 277National policies seek to leverage AI for societies and economies .................................................. 278Blockchain and other distributed ledger technologies ............................................................................. 286Quantum computing .............................................................................................................................................................. 294References ........................................................................................................................................................................................ 306Notes .................................................................................................................................................................................................... 309
List of Figures ............................................................................................................................................................................................. 311
List of Tables ............................................................................................................................................................................................... 313
List of Boxes ................................................................................................................................................................................................ 314

ACRONYMS, ABBREVIATIONS AND UNITS OF MEASURE
OECD DIGITAL ECONOMY OUTLOOK 2020 © OECD 2020 9
Acronyms, abbreviations and units of measure
ACARA Australian Curriculum, Assessment and Reporting AuthorityAFBF American Farm Bureau FederationAHEG Ad Hoc Expert GroupAI Artificial intelligenceAPEC Asia-Pacific Economic CooperationAUD Australian dollarBDA Big data analyticsBEC Business email compromiseBEPS Base Erosion and Profit ShiftingBEREC Body of European Regulators for Electronic CommunicationsBIT Behavioural Insights TeamCAD Canadian dollarCAS Chinese Academy of SciencesCCPA California Consumer Privacy ActCDR Consumer Data RightCISA Cyber and Infrastructure Security AgencyCNY Yuan renminbiCoE Council of EuropeCPF Compte personnel de formationCRC Comisión de Regulación de ComunicacionesCRM Customer-relationship managementCVD Co-ordinated vulnerability disclosureDDoS Distributed denial of serviceDEO Digital Economic OutlookDKK Danish kroneDLT Distributed ledger technologyDS&R Data sharing and releaseDSIP Digital Science and Innovation PolicyDSS Dynamic spectrum sharingDTS Digital transformation strategyEECC European Electronic Communications CodeELLIS European Laboratory for Learning and Intelligent SystemsEPO European Patent OfficeERP Enterprise resource planningESRI Economic and Social Research InstituteEU European UnionEUR EuroFCC Federal Communications CommissionFWA Fixed Wireless AccessGB GigabyteGBP British poundGbps Gigabits per secondGDP Gross domestic productGDPR General Data Protection RegulationGIS Geographic information systemsICO Initial coin offering
ACRONYMS, ABBREVIATIONS AND UNITS OF MEASURE
OECD DIGITAL ECONOMY OUTLOOK 2020 © OECD 2020 10
ICS Industrial control systemICT Information and communication technologyIDS Industrial Data SpaceIMDA Infocomm Media Development AuthorityIoT Internet of ThingsILA Individual Learning AccountILS Individual learning schemesIM Instant messagingIP Internet ProtocolISP Internet service providerISSA International Survey of Scientific AuthorsIT Information technologyJPO Japan Patent OfficeJRC Joint Research Centrekbps Kilobits per secondKBC Knowledge-based capitalKIPO Korean Intellectual Property OfficeLORCA London Office for Rapid Cybersecurity AdvancementMaaS Mobility as a ServiceMB MegabyteMbps Megabits per secondMinTIC Ministry of Information Technology and CommunicationsMNO Mobile network operatorMOOC Massive open online courseMVNO Mobile virtual network operatorNDGS National digital government strategyNDS National digital strategyNIA National Information Society AgencyNICE National Initiative for Cybersecurity EducationNIST National Institute of Standards and TechnologyNSA National Security AgencyNSF National Science FoundationNTIA National Telecommunications and Information AdministrationNUS National University of SingaporeOGD Open government dataOT Operational technologyPDBN Personal data breach notificationPEA Privacy enforcement authorityPES Public employment servicesPIAAC Programme for International Assessment of Adult CompetenciesPISA Programme for International Student AssessmentPPP Purchasing power parityPSI Public sector informationQoS Quality of ServiceR&D Research and developmentRD&I Research, development and innovationRFID Radio frequency identificationSAFT Simple agreements for future tokensSDGs Sustainable Development GoalsSFI Science Foundation IrelandSMEs Small and medium-sized enterprisesSMP Significant market power

ACRONYMS, ABBREVIATIONS AND UNITS OF MEASURE ACRONYMS, ABBREVIATIONS AND UNITS OF MEASURE
OECD DIGITAL ECONOMY OUTLOOK 2020 © OECD 2020 11
SNA System of National AccountsSTEM Science, technology, engineering and mathematicsSTI Science, technology and innovationSTO Security token offeringT&C Terms and conditionsTfL Transport for LondonUK United KingdomUNESCO United Nations Educational, Scientific and Cultural OrganizationUS United StatesUSD United States dollarUSPTO US Patent and Trademark OfficeVNI Visual Networking IndexVR Virtual Reality


EXECUTIVE SUMMARY
OECD DIGITAL ECONOMY OUTLOOK 2020 © OECD 2020 13
Executive Summary
The COVID-19 pandemic has amplified all aspects of the digital transformationMeasures to contain the COVID-19 pandemic have profoundly affected OECD countries’ relationship with digital technologies. Perhaps never before has our global dependency on digital technology touched all aspects of society – from education to health. Teleworking, distance learning and e-commerce have surged across the OECD, as has uptake of digital tools in businesses. Governments, businesses and academia have been quick to grasp the potential of artificial intelligence (AI) to contribute to the crisis response, as well as the need for timely, secure and reliable access to data within nations and across borders. Global sharing and collaboration in research data have reached unprecedented levels.
However, these Internet-based and bandwidth-intensive activities fuel demand for high-quality connectivity and lay bare existing digital divides, reinforcing the need for a more inclusive approach to digital transformation. With accelerated teleworking and e-commerce, the COVID-19 outbreak also creates a fertile environment for cybercriminals. Digital security agencies in the OECD promptly responded by sounding the alarm and supporting operators of critical activities, particularly in the health sector. Many agencies have issued guidance on the collection, processing and sharing of personal data to support contact tracing and other response measures.
The longer-term effects of the pandemic on digital transformation are only beginning to emerge. This report provides a snapshot of the state of the digital economy and policy environment, as a departure point for policy makers to shape a stronger, more inclusive digital future.
OECD countries are strengthening their strategic approach to policy for the digital transformationDigital transformation affects economies and societies in complex and interrelated ways, demanding more strategic approaches. Thirty-four OECD countries have a national digital strategy to enhance policy co-ordination at the highest levels of government, most commonly the prime minister or chancellery, or a dedicated ministry or body. This strategic approach is especially apparent in the context of emerging technologies: by mid-2020, 24 OECD countries had a national AI strategy, with strong emphases on adoption and skills. Since 2017, many OECD countries have issued national 5G strategies. Additionally, most have comprehensive digital security strategies, although in many cases these are separate from national digital plans and lack independent budget and evaluation tools.
Connectivity continues to improve in OECD countriesReliable connectivity is essential for the digital transformation as it facilitates interactions between people, organisations and machines. Communications subscriptions continue to grow rapidly: in the past eight years, the share of high-speed fibre in all fixed broadband subscriptions in the OECD has more than doubled, and has risen to at least 50% in nine OECD countries. Among businesses, the access gap between large and small firms narrowed across the OECD, with 93% of enterprises having a broadband connection in 2019. The average mobile data usage per subscription in the OECD quadrupled in four years. It reached 4.6 GB per month in 2018, while prices for high-usage mobile broadband plans decreased by about 60% between 2013 and 2019. Finally, as of June 2020, 5G commercial services were available in select locations in 22 OECD countries. To further increase affordable access to high-speed broadband, OECD countries are implementing policy and regulatory measures to ensure efficient spectrum management, facilitate deployment and access to backhaul and backbone facilities, and encourage new forms of infrastructure sharing.

EXECUTIVE SUMMARY
OECD DIGITAL ECONOMY OUTLOOK 2020 © OECD 2020 14
Internet use has risen fast, but the digital divide remainsInternet uptake among both individuals and businesses continues to grow although divides remain in capabilities and effective use.
In 2019, 70% to 95% of adults used the Internet in OECD countries and smartphones became the favoured device for Internet access. Individuals also spend more time on line, with daily use in the OECD increasing by 30 minutes on average over 2014-19. Differences in use by age group or education level, however, persist. For example, only 58% of individuals aged 55-74 used the Internet frequently in 2019 – up from 30% in 2010, but still well below the nearly 95% share of daily Internet users aged 16-24. In 2018, only 40% of adults in OECD countries with low or no formal education used the Internet to interact with public authorities compared to 80% of those with tertiary education.
Gaps also persist between large and small firms. For instance, e-commerce accounted for 24% of economic turnover in large firms in 2019, but only 10% in small firms.
Big data create new opportunities for businesses and consumers, and new challenges for security and privacyThe use of data – whether sold to third parties or used by firms to advertise or tailor their own products – has become integral to business models. On average, 12% of businesses in the OECD performed big data analytics in 2017 – and up to 33% among large firms. Social media were the main source with their data used by half of businesses performing big data analytics in the OECD.
Data-intensive technologies such as AI and the Internet of Things (IoT) offer greater consumer choice and personalisation. At the same time, they pose new risks to safety, privacy and security, and may discriminate against disadvantaged groups such as women and ethnic minorities. Already in 2019, over 80% of OECD countries reported AI and big data analytics as the biggest challenges to privacy and personal data protection, followed closely by the IoT and biometrics.
Against this backdrop, governments are implementing policies to raise awareness about privacy and data protection frameworks and strengthen their enforcement, while promoting accountability for data controllers. OECD countries are also seeking policy solutions to address digital security issues and incentivise good practices. These efforts take on additional importance as economies and societies move steadily on line.

Chapter 1GOING DIGITAL: AN INTEGRATED APPROACH
TO POLICY MAKING IN THE DIGITAL AGE
15OECD DIGITAL ECONOMY OUTLOOK 2020 © OECD 2020
KEY FINDINGS
�� The Going Digital Integrated Policy Framework helps countries develop a co-ordinated, whole-of-government approach to digital transformation. It includes seven interrelated dimensions: access, use, innovation, jobs, society, trust and market openness.
�� Good policies in all of these dimensions are needed to make digital transformation work for growth and well-being. Cross-cutting issues such as gender, skills, digital government and data governance also need to be taken into account.
�� The COVID-19 crisis reinforces the need for an inclusive approach to digital transformation. As the health and economic crisis has evolved, the trade-offs between policy objectives may have changed.
�� Re-evaluating existing digital policies should involve establishing a governance approach that supports co-ordination, articulating a strategic vision, assessing key digital trends and policies, and developing and implementing a comprehensive strategy.
IntroductionDesigning and implementing well-suited policies for the digital age is a complex challenge, but one that can produce many benefits. This chapter introduces the Going Digital Integrated Policy Framework (hereafter “the framework”), which helps countries shape policies for an inclusive digital future. The framework recognises technologies, data and business models as driving forces underlying digital transformation (OECD, 2019[1]).
To that end, it builds on the cross-cutting analysis of “vectors” of digital transformation across many different policy domains (OECD, 2019[2]). The framework applies to both OECD countries and partner economies. It also underpins the OECD Going Digital Toolkit,1 which provides interactive data visualisations and access to key indicators, analysis and policy guidance.
The framework includes seven interrelated policy dimensions: access, use, innovation, jobs, society, trust and market openness (Figure 1.1). Each of the dimensions brings together multiple policy domains that need to be considered jointly, rather than as separate policy silos. Leveraging the benefits and addressing the challenges of digital transformation require co-ordination across all policy domains identified by the framework. They also demand consideration of transversal policy issues (e.g. gender, skills, digital government and data governance) that cut across the seven dimensions (OECD, 2020[3]). All policy dimensions must be considered to make digital transformation work for growth and well-being.
The COVID-19 crisis reinforces the need for a co-ordinated, whole-of-government policy approach to digital transformation as outlined in the framework. Indeed, as the health and economic crisis has evolved, the trade-offs between policy domains may have changed. This requires a balancing act that will not be the same for all countries, as cultural, social and economic factors influence the most suitable policy environment. The framework is designed to help countries strike the right balance, make better policies in the digital age and ensure no one is left behind (OECD, 2020[3]). The pandemic also underscores the importance of a multi-stakeholder approach to digital policy making.
This chapter explores the framework’s seven dimensions and the policy domains contained therein. It also identifies key policy actions and guidance for each one. It concludes by describing how to put the framework into practice; further insights on national digital strategies are discussed in Chapter 2.
16 OECD DIGITAL ECONOMY OUTLOOK 2020 © OECD 2020
1. GOING DIGITAL: AN INTEGRATED APPROACH TO POLICY MAKING 1. GOING DIGITAL: AN INTEGRATED APPROACH TO POLICY MAKING

Figure 1.1. Going Digital Integrated Policy Framework
Access
Mar
ket
open
ness
Trust
Society Jobs
Inn
ovat
ion
UseGrowth andwell-being
Source: OECD (2020[3]), “Going Digital integrated policy framework”, https://dx.doi.org/10.1787/dc930adc-en.
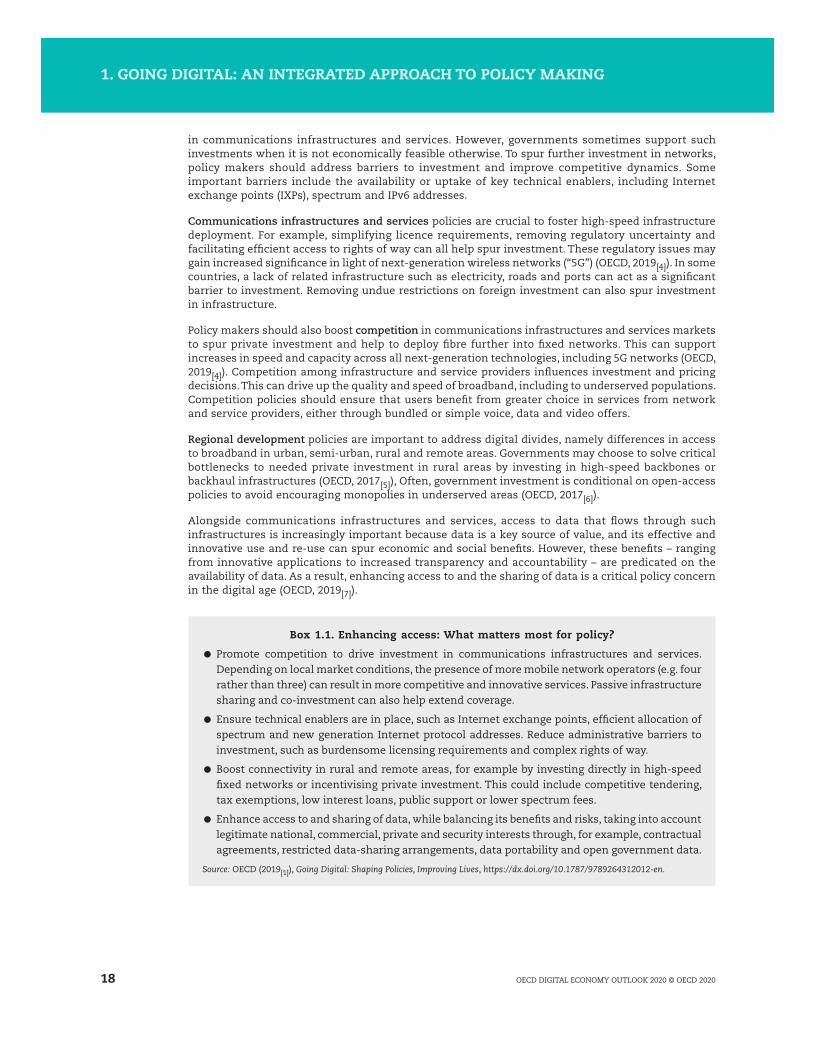
Access
KEY POLICY DOMAINS AND INDICATORS
�� Investment
�� Communications infrastructures and services
�� Competition
�� Regional development
Explore key indicators on Access on the interactive Going Digital Toolkit: www.oecd.org/going-digital-toolkit.
Communications infrastructures and services underpin the use of digital technologies, and facilitate interactions between connected people, organisations and machines. They serve as the basis for an open, interconnected and distributed Internet that enables the global free flow of information. High-quality access to communication networks and services at competitive prices is fundamental to digital transformation.
Data are emerging as a similarly vital resource. Data are a driver of economic activity and a general-purpose input into production in many contexts, but the benefits are predicated on data availability and accessibility. Enhancing access to and the sharing of data is thus important, although such decisions should be balanced with considerations of data privacy and security, among others. Governments can enhance access in four key ways.
Policy makers can promote investment in communications infrastructures, especially broadband networks, by encouraging the deployment of more fibre into networks to drive a substantial increase in speeds across technologies. Among OECD countries, the private sector invests the highest share
ACCESS
17OECD DIGITAL ECONOMY OUTLOOK 2020 © OECD 2020
1. GOING DIGITAL: AN INTEGRATED APPROACH TO POLICY MAKING
in communications infrastructures and services. However, governments sometimes support such investments when it is not economically feasible otherwise. To spur further investment in networks, policy makers should address barriers to investment and improve competitive dynamics. Some important barriers include the availability or uptake of key technical enablers, including Internet exchange points (IXPs), spectrum and IPv6 addresses.
Communications infrastructures and services policies are crucial to foster high-speed infrastructure deployment. For example, simplifying licence requirements, removing regulatory uncertainty and facilitating efficient access to rights of way can all help spur investment. These regulatory issues may gain increased significance in light of next-generation wireless networks (“5G”) (OECD, 2019[4]). In some countries, a lack of related infrastructure such as electricity, roads and ports can act as a significant barrier to investment. Removing undue restrictions on foreign investment can also spur investment in infrastructure.
Policy makers should also boost competition in communications infrastructures and services markets to spur private investment and help to deploy fibre further into fixed networks. This can support increases in speed and capacity across all next-generation technologies, including 5G networks (OECD, 2019[4]). Competition among infrastructure and service providers influences investment and pricing decisions. This can drive up the quality and speed of broadband, including to underserved populations. Competition policies should ensure that users benefit from greater choice in services from network and service providers, either through bundled or simple voice, data and video offers.
Regional development policies are important to address digital divides, namely differences in access to broadband in urban, semi-urban, rural and remote areas. Governments may choose to solve critical bottlenecks to needed private investment in rural areas by investing in high-speed backbones or backhaul infrastructures (OECD, 2017[5]), Often, government investment is conditional on open-access policies to avoid encouraging monopolies in underserved areas (OECD, 2017[6]).
Alongside communications infrastructures and services, access to data that flows through such infrastructures is increasingly important because data is a key source of value, and its effective and innovative use and re-use can spur economic and social benefits. However, these benefits – ranging from innovative applications to increased transparency and accountability – are predicated on the availability of data. As a result, enhancing access to and the sharing of data is a critical policy concern in the digital age (OECD, 2019[7]).
Box 1.1. Enhancing access: What matters most for policy?
● Promote competition to drive investment in communications infrastructures and services. Depending on local market conditions, the presence of more mobile network operators (e.g. four rather than three) can result in more competitive and innovative services. Passive infrastructure sharing and co-investment can also help extend coverage.
● Ensure technical enablers are in place, such as Internet exchange points, efficient allocation of spectrum and new generation Internet protocol addresses. Reduce administrative barriers to investment, such as burdensome licensing requirements and complex rights of way.
● Boost connectivity in rural and remote areas, for example by investing directly in high-speed fixed networks or incentivising private investment. This could include competitive tendering, tax exemptions, low interest loans, public support or lower spectrum fees.
● Enhance access to and sharing of data, while balancing its benefits and risks, taking into account legitimate national, commercial, private and security interests through, for example, contractual agreements, restricted data-sharing arrangements, data portability and open government data.
Source: OECD (2019[1]), Going Digital: Shaping Policies, Improving Lives, https://dx.doi.org/10.1787/9789264312012-en.
18 OECD DIGITAL ECONOMY OUTLOOK 2020 © OECD 2020
1. GOING DIGITAL: AN INTEGRATED APPROACH TO POLICY MAKING 1. GOING DIGITAL: AN INTEGRATED APPROACH TO POLICY MAKING

Use
KEY POLICY DOMAINS AND INDICATORS
�� Digital government
�� Investment
�� Business dynamism
�� Small and medium enterprises
�� Skills
�� Digital security and privacy
Explore key indicators on Use on the interactive Going Digital Toolkit: www.oecd.org/going-digital-toolkit.
Harnessing the power and potential of digital technologies depends on how they are used. Effective use enables individuals to participate in society, firms to boost productivity, and governments to go digital and adopt a user-driven approach. Widespread diffusion and effective use of digital technologies and data require awareness of the opportunities they bring, business dynamism, investment in information and communication technologies (ICTs) and complementary assets, especially skills. At the same time, policies need to strengthen trust in digital environments, for example, by empowering people and organisations to better manage digital risk.
Digital government strategies help ensure a more comprehensive approach to digital transformation of the government and the public sector (OECD, 2014[8]). Most OECD countries have digitised some aspects of public service delivery (e.g. public procurement and tax collection). However, large cross-country variations persist. Much potential remains for more comprehensive digital government approaches. This includes using digital technologies to digitise analogue processes and services; reorganising administrative procedures to make them digital by design; making user needs drivers of change; and opening up government data. In addition, countries are increasingly adopting a “mobile first” approach to digital government.
Unleashing the potential of digital tools for firms to increase productivity requires successful diffusion, which crucially depends on firms’ investment in ICTs as well as public investment in infrastructure and equipment. Countries promote ICT investment through monetary support or incentives to buy ICT equipment or services, as well as non-financial support (e.g. targeted training), among others2 (OECD, 2019[9]). Effective use of technologies further requires firms’ investment in complementary assets, knowledge-based capital (KBC) in particular. KBC assets include research and development (R&D), data, organisational capital and skills.
Technology diffusion is linked to business dynamism, which depends on efficient resource allocation. Digital transformation of firms involves experimentation and learning. Some firms successfully adopt digital tools and rapidly scale up, while others scale down or exit the market (Andrews and Criscuolo, 2013[10]). Business dynamism can benefit from structural reforms. Several policies can affect competitive pressure and business dynamism, and in turn technology diffusion and better resource allocation. These include labour market regulations, employment protection legislation and the design of insolvency regimes. For example, governments could enact less penalising sanctions for bankruptcy and lower barriers for corporate restructuring of insolvent firms (Andrews, Nicoletti and Timiliotis, 2018[11]; Adalet McGowan and Andrews, 2018[12]; Sorbe et al., 2019[13]).
Effective use of digital tools is increasingly essential for small and medium-sized enterprises (SMEs) to improve business processes, innovate, scale up and internationalise. However, SMEs lag behind large firms in the adoption of digital tools and, crucially, in the use of advanced ones. Key barriers include lack of awareness; limited collateral to take risk and access finance for investing in ICTs and complementary assets; and a lack of human resources and capabilities (e.g. ICT specialists). To help overcome these barriers, governments need to better target policies3 to SMEs (OECD, 2019[1]).
USE
19OECD DIGITAL ECONOMY OUTLOOK 2020 © OECD 2020
1. GOING DIGITAL: AN INTEGRATED APPROACH TO POLICY MAKING
Technology diffusion and effective use crucially depend on skills (Andrews, Nicoletti and Timiliotis, 2018[11]). The success of firms in the digital age depends on workers with good literacy, numeracy, problem solving and generic ICT skills4 used at work.5 Increasingly, it also requires ICT specialists6 and data specialists.7 In addition, firms require complementary skills and competences8 for new organisational forms and in digital-intensive sectors. Ensuring the provision of relevant skills for the digital age requires investments in education and training. Primary education needs to deliver sound literacy and numeracy skills. Subsequently, students need options to develop ICT and complementary skills, including social, communication and management skills. In addition, many forms of learning can benefit from the use of digital technologies (OECD, 2019[14]).
Mistrust in digital technologies can be an important barrier to diffusion and effective use. In particular, concerns about digital security and privacy can severely hamper individuals’ propensity to engage on line. For businesses as well, trust is a key factor affecting the adoption and use of digital tools. Governments may also face privacy issues, for example when linking data sets or when opening up government data to the public. Addressing these barriers requires all actors to better manage digital risk. This involves building capacities to assess digital risk and reduce it to an acceptable level, including through risk mitigation and/or transfer.
Box 1.2. Increasing effective use: What matters most for policy?
● Close the usage gap between those with high versus low education levels and empower everyone with a mix of skills to thrive and trust in a digital world. To do so, review education and training systems to better exploit the possibilities of digital learning.
● Boost diffusion of digital tools to drive productivity growth in firms, and small and medium-sized enterprises in particular. To do so, promote investment in digital technologies and intangible assets (e.g. patents, software) and foster business dynamism and structural change that encourages adoption.
● Shift from an e-government to a holistic and user-driven digital government approach. At the same time, continue to improve online public services and ensure coherent use of digital technologies and data across all parts and levels of government.
● Address mistrust to increase online engagement by raising awareness and empowering people and businesses to better manage digital risks.
Source: OECD (2019[1]), Going Digital: Shaping Policies, Improving Lives, https://dx.doi.org/10.1787/9789264312012-en.
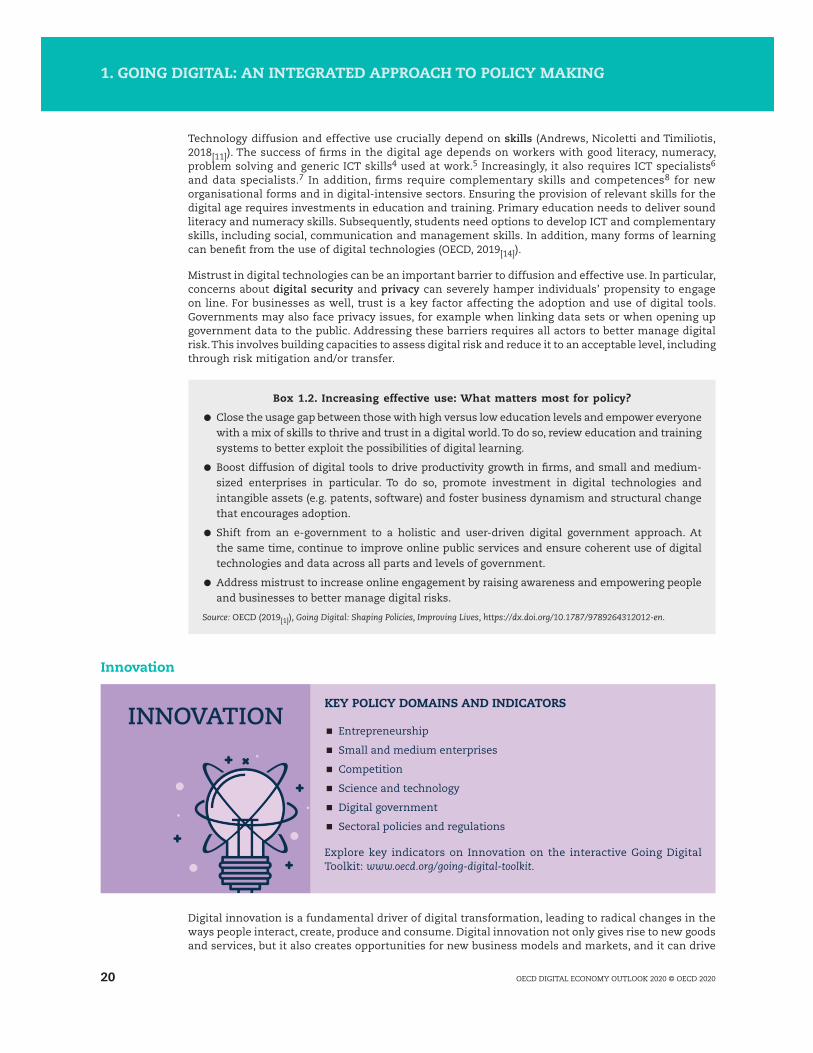
Innovation
KEY POLICY DOMAINS AND INDICATORS
�� Entrepreneurship
�� Small and medium enterprises
�� Competition
�� Science and technology
�� Digital government
�� Sectoral policies and regulations
Explore key indicators on Innovation on the interactive Going Digital Toolkit: www.oecd.org/going-digital-toolkit.
Digital innovation is a fundamental driver of digital transformation, leading to radical changes in the ways people interact, create, produce and consume. Digital innovation not only gives rise to new goods and services, but it also creates opportunities for new business models and markets, and it can drive
INNOVATION
20 OECD DIGITAL ECONOMY OUTLOOK 2020 © OECD 2020
1. GOING DIGITAL: AN INTEGRATED APPROACH TO POLICY MAKING 1. GOING DIGITAL: AN INTEGRATED APPROACH TO POLICY MAKING
efficiencies in the public sector and beyond. Digital technologies and data spur innovation in a wide range of sectors, including education, health, finance, insurance, transportation, energy, agriculture, fisheries and manufacturing, as well as the ICT sector itself.
Since young firms are an essential part of the digital innovation landscape, promoting digital innovation requires a focus on entrepreneurship and SME policies that encourage the emergence and growth new and young firms. Helping entrepreneurs start innovative businesses also requires attention to structural factors that facilitate new ventures and do not excessively penalise entrepreneurial failure (Adalet McGowan, Andrews and Millot, 2017[15]). In addition, organisations need to invest in KBC. This is essential for innovative business models and new organisational forms that raise the premium associated with complementary skills. Digital technologies can help improve access to finance of SMEs and start-ups through innovative instruments like crowdfunding (OECD, 2019[16]).
Market concentration in a digitalised economy can represent another barrier to innovation, underscoring the importance of competition policies. Regulatory frameworks can constrain the entry of new players, which is essential for driving competition, innovation and technological diffusion across the economy. For example, regulations that require a physical presence can constrain the emergence of online intermediary businesses (OECD, 2018[17]). Similarly, the high regulatory burden in some industries, such as banking, can create costs that only incumbent firms of a certain size can afford. This constrains the emergence of smaller, often digitally enabled, business models.
Digital innovation relies on continuously building the knowledge base, and basic research into science and technology is critical in this respect. Public support for universities and other institutions conducting basic research can help sow the seeds of future innovation. The public sector also helps drive innovation beyond research through partnerships between universities, industry and government. These can provide start-ups with the know-how, equipment and initial funding to test and scale new technologies. Well-designed incentives to support R&D and innovation can be helpful in this regard. Such incentives include the protection of intellectual property regimes and tax-based incentives such as R&D tax credits. Open Science9 initiatives can also be useful for boosting digital innovation (OECD, 2015[18]).
Digital government strategies, and open government data in particular, can drive innovation and efficiencies in the public sector and beyond. Digital technologies can help governments to better develop, design and enforce policies and regulations; become more efficient; and reduce waste. As the public sector both produces and consumes large amounts of data, there is significant potential for governments to use this data and digital technologies to innovate.
The pace of digital transformation varies across sectors. Perhaps unsurprisingly, the ICT sector and the telecommunication sector appear to have incorporated digital assets and know-how across the breadth of their businesses. However, ICT services outstrip their manufacturing counterparts. Looking ahead, digital technologies, such as data analytics and artificial intelligence (AI), offer vast potential to improve productivity in service activities. This includes enhancements in less knowledge-intensive activities such as personal transport and accommodation where productivity has traditionally been sluggish (Sorbe, Gal and Millot, 2018[19]). Connecting historical patient data with real-time patient data and using connected devices, for example, could drive increasingly personalised care and sector-wide innovation in the health sector.
Box 1.3. Unleashing innovation: What matters most for policy?
● Boost entrepreneurship by reducing regulatory burdens for start-ups and facilitating access to finance for new and young firms through a mix of venture capital, debt and equity financing, and digital financing solutions such as platform-based lending.
● Re-evaluate regulations that may not be fit for the digital age, such as those that require a physical presence or minimum scale, or seek to address information asymmetries.
● Incentivise investment in basic R&D and intangible assets, including skills, organisational capital, data, software and patents, such as through R&D tax credits and intellectual property systems that are well-suited to the digital age.
21OECD DIGITAL ECONOMY OUTLOOK 2020 © OECD 2020
1. GOING DIGITAL: AN INTEGRATED APPROACH TO POLICY MAKING 1. GOING DIGITAL: AN INTEGRATED APPROACH TO POLICY MAKING
Jobs
KEY POLICY DOMAINS AND INDICATORS
�� Labour markets
�� Skills
�� Social protection
�� Tax and benefit systems
�� Regional development
Explore key indicators on Jobs on the interactive Going Digital Toolkit: www.oecd.org/going-digital-toolkit.
Digital transformation has already begun to change organisations and markets, raising important questions. Which jobs might disappear? Where will new ones come from? What will they look like? Which skills will be required? At the same time, other questions have emerged. Who might be most affected? What can be done to foster job creation and align skills development with the changing skills requirement of new jobs? Social partners can play an important role in answering such questions.
Maintaining and improving labour market performance in a digital world of work requires a fresh look at labour market regulations. This includes employment protection legislation, minimum wage laws, work time regulations and regulations to safeguard occupational health and safety, among others (OECD, 2019[21]). Digital transformation may continue to promote non-standard forms of work, resulting in job and income security for some such workers. Countries must determine whether legal frameworks need updating or adjusted to remain fit for purpose. Such frameworks should ensure that all workers – regardless of contract type – receive adequate rights, including freedom to association and bargaining, equal pay for equal work, benefits and protections.
People need the right mix of skills to prepare for future jobs. The evolution of skills required to thrive in a highly digital economy and society remains uncertain. However, the mix of crucial skills include literacy, numeracy and problem solving, ICT generic skills, as well as complementarity skills and competences (e.g. creative thinking and team work). An effective response to these skill needs requires a holistic approach to skills development – from early childhood education to lifelong learning. The training investment required to meet future needs goes beyond the capacity of the public sector, with firms and individuals also implicated. Training should target those most in need, who are often low-skilled workers. Online courses, such as massive open online courses (MOOCs), also offer flexible and affordable
JOBS
Box 1.3. Unleashing innovation: What matters most for policy? (cont.)
● Foster knowledge diffusion through open innovation and open science initiatives, and promote open government data through, for example, “open by default” policies, to stimulate innovation across the economy.
● Encourage policy experimentation and new business models across sectors, including through agile regulation and flexible application or enforcement of regulation (e.g. regulatory “sandboxes”), while protecting consumers.
Sources: OECD (2019[1]), Going Digital: Shaping Policies, Improving Lives, https://dx.doi.org/10.1787/9789264312012-en; Attrey, Lesher and Lomax (2020[20]), “The role of sandboxes in promoting flexibility and innovation in the digital age”, https://goingdigital.oecd.org/toolkitnotes/the-role-of-sandboxes-in-promoting-flexibility-and-innovation-in-the-digital-age.pdf.
22 OECD DIGITAL ECONOMY OUTLOOK 2020 © OECD 2020
1. GOING DIGITAL: AN INTEGRATED APPROACH TO POLICY MAKING 1. GOING DIGITAL: AN INTEGRATED APPROACH TO POLICY MAKING

options for distance education in several areas. However, skills certification and recognition outside of formal education still pose a challenge (OECD, 2019[14]).
Social protection is crucial to enable successful and fair transitions for all, including displaced workers. Some workers will want to transition into new occupations. Others will try to enter the labour market for the first time or after a spell of unemployment. In both cases, they may not find a new job immediately. Helping these workers involves a system of well-designed and adequately resourced active and passive labour market programmes. These approaches provide workers with timely access to basic job search services and target those that require more extensive assistance. Many people work informally and are not protected under existing rules. All this adds to the challenges faced by social security systems, which still largely assume a full-time, regular, open-ended contract with a single employer.
Governments also need to extend and/or adapt tax and benefit systems to ensure all workers receive minimum protection and wages, and that their various sources of income are brought into the tax system. Tax and benefit systems should promote portability of social security entitlements to prevent the loss of benefit entitlements when workers move between jobs. Governments may also need to expand the role of non-contributory schemes so no one is left without social protection as a result of their contract status.
Regional development policies are needed to address geographical disparities that emerge because of digitally induced job creation and automation (Sorbe, Gal and Millot, 2018[19]). Reducing the costs of relocation, for example through subsidies, is one way to enhance labour mobility and help displaced workers transition back into employment. In addition, well-designed housing policies can encourage people to move into regions where more and better jobs are available (Andrews, Caldera Sánchez and Johansson, 2011[22]; OECD, 2015[23]).
Box 1.4. Ensuring good jobs: What matters most for policy?
● Promote successful and fair transitions from declining to expanding jobs by striking a balance between flexibility and mobility (including through wage incentives for workers to move from low- to high-productivity firms) and job stability (including through dialogue with social partners).
● Review labour market policies and institutions to ease firms’ workforce adjustment and to facilitate job-to-job transitions for workers. Providing adequate protection through better transferability of skills, portability of benefits and effective employment services.
● Ensure people have the right mix of skills to succeed in technology-rich work environments, notably sound cognitive skills, ICT skills, complementary skills, specialist skills and the ability to cope with change and keep learning, including when out of work. Co-ordinate among education and training institutions, employers and social partners.
● Get ready for a massive training challenge and review education systems. Improve the accessibility, quality and equity of education for young people and of training for adults throughout their working life, including through addressing barriers to adult learning, training incentives for those most in need, and better use of digital technologies for learning.
● Address concerns around emerging forms of work and ensure good outcomes for all workers by applying and, where needed, reviewing and extending labour market regulation, and strengthening workers’ voices. Reduce the risk of arbitrage between different forms of employment and work by ensuring neutrality of regulation, tax systems and benefit schemes.
● Improve social protection to ensure nobody is left behind. Strengthen active labour market programmes to support displaced workers and design effective income support schemes to provide income security without undermining work incentives.
Source: OECD (2019[1]), Going Digital: Shaping Policies, Improving Lives, https://dx.doi.org/10.1787/9789264312012-en.
23OECD DIGITAL ECONOMY OUTLOOK 2020 © OECD 2020
1. GOING DIGITAL: AN INTEGRATED APPROACH TO POLICY MAKING 1. GOING DIGITAL: AN INTEGRATED APPROACH TO POLICY MAKING

Society
KEY POLICY DOMAINS AND INDICATORS
�� Social policies
�� Skills
�� Tax and benefit systems
�� Environment
�� Health care
�� Digital government
Explore key indicators on Society on the interactive Going Digital Toolkit: www.oecd.org/going-digital-toolkit.
Digital transformation affects society and culture in complex ways. First, digital technologies dramatically change the ways in which individuals, firms and governments interact. In addition, overall impacts are often not clear-cut and may vary across countries. For example, digital technologies enhance access to information (a free and interconnected Internet), improve health care (e.g. telemedicine) and enrich education (e.g. MOOCs). On the other hand, challenges arise related to work-life imbalances; the segregation of people into relatively isolated, like-minded groups; negative mental health outcomes such as screen addiction, depression and cyberbullying, including among children; and the emergence of digital divides (e.g. gender, skills).
Social policies can help address a range of digital divides. When knowledge-intensive firms cluster in places with high-skilled workers, for example, place-based social policies can help address geographic divides (Moretti, 2012[24]; Berger and Frey, 2015[25]; OECD, 2018[26]). Digital tools can also help governments make better social policy choices and improve well-being. Linking longitudinal and multi-domain data about individuals, families, and the environment, for example, can provide insight into the impact of policies on communities.
Skills development throughout the life cycle, especially through education and training policies, can ensure that digital transformation benefits all and avoids exacerbating existing divides. Skills development involves a range of foundational competences, including literacy, numeracy and problem-solving skills (see “Use”). It also embraces social and emotional skills that are increasingly valued by employers and more generally by society. Approaches to develop such “soft skills” include working with students’ feelings and relationships through role playing, collaborative-based pedagogies, gaming, case studies, problem-solving pedagogies, sports and the arts (Le Donné, Fraser and Bousquet, 2016[27]).
As economies and societies change and adjust, redistribution policies such as tax and benefit systems ensure no one is left behind. Redistribution through income support has declined across the OECD alongside a decline in the share of personal income taxes. However, higher aggregate spending on policies like health care has partially offset this change (Causa and Hermansen, 2017[28]). Governments may also need to reconsider redistribution patterns in light of changes to organisations and the nature of work (Causa, Vindics and Akgun, 2018[29]).
Digital technologies likewise present challenges and opportunities for tackling some great, collective challenges such as the environment and health care. With respect to the environment, digital technologies can support green growth. For example, they can enable efficiencies and monitoring in “smart” infrastructures and cities. However, the widening range and rapid diffusion of digital technologies may also increase resource and energy demands in production and use. This would offset some environmental gains, resulting in greater need for recycling and disposal of old equipment.
With respect to health care, digitising health records, expanding tele-care and tele-consultation, and implementing mobile health technologies can improve health care and potentially reduce costs. However, data-driven health services also raise new challenges. These relate primarily to personal data
SOCIETY
24 OECD DIGITAL ECONOMY OUTLOOK 2020 © OECD 2020
1. GOING DIGITAL: AN INTEGRATED APPROACH TO POLICY MAKING 1. GOING DIGITAL: AN INTEGRATED APPROACH TO POLICY MAKING

protection and privacy, security, control and ownership, transparency and accountability, and quality and safety. Good governance of sensitive health data can address many of these concerns.
Digital government can empower users to access digital public services at their convenience and in new ways. Citizens can enjoy enhanced interaction with public administrations within and across tiers of government, for example. Where service provision is fragmented across disparate public agencies, governments can embrace the “once only” principle.10 This would reduce the burden for citizens and businesses of having to provide the same information multiple times. In addition, digital one-stop-shops can ease access to information and assistance, such as for job seekers. Governments can also gather more detailed information through interacting with citizens on line to personalise public services and better target public policies.
A range of social issues has emerged or become heightened as digital transformation progresses, including questions about ethics and morality. For example, AI, machine learning and autonomous decision making raise new questions about transparency (possible biases and discrimination), responsibility and accountability. Disinformation11 has also gained attention. Some argue it negatively affects individuals and society (European Commission, 2018[30]; DCMS Committee, 2018[31]; Ministry of Foreign Affairs of Denmark, 2018[32]; Pamment, Nothhaft and Agardh-Twetman, 2018[33]).
Box 1.5. Promoting an inclusive digital society: What matters most for policy?
● Reduce digital divides and include everyone in a digital society, notably women, the elderly and low-income individuals, including through social policies that support mobility and redistribution.
● Promote foundational skills for all, including by offering incentives for and easing access to adult learning and improving the recognition of skills acquired after initial education.
● Harness the potential of digital technologies and data to address collective challenges, such as environmental protection and health care, by promoting energy efficiency and reducing health care costs with mobile health technologies.
● Boost civic engagement through digital government strategies and involve all stakeholders, including the technical community, the business community, trade unions and civil society, to help understand and address societal issues such as risks like cyberbullying and disinformation.
Source: OECD (2019[1]), Going Digital: Shaping Policies, Improving Lives, https://dx.doi.org/10.1787/9789264312012-en.
Trust
KEY POLICY DOMAINS AND INDICATORS
�� Digital risk management
�� Small and medium enterprises
�� Privacy
�� Digital security
�� Consumer protection
Explore key indicators on Trust on the interactive Going Digital Toolkit: www.oecd.org/going-digital-toolkit.
To fully embrace and benefit from digital transformation, individuals, firms and governments need to be confident that the digital environment will bring more benefits than downsides for their social and economic activities. The digital environment could exacerbate digital security incidents, information
TRUST
25OECD DIGITAL ECONOMY OUTLOOK 2020 © OECD 2020
1. GOING DIGITAL: AN INTEGRATED APPROACH TO POLICY MAKING 1. GOING DIGITAL: AN INTEGRATED APPROACH TO POLICY MAKING

asymmetries, power imbalances or jurisdictional challenges. These may translate into breaches of laws and regulations such as privacy, consumer protection or product safety that are intended to reduce these imbalances and challenges. Such uncertainties must be mitigated as much as possible to ensure trust.
Digital risk management applies to individuals, as well as to organisations – from small and large businesses to public entities. All actors share some responsibility to manage the digital risks of their activities. This will vary according to their roles, ability to act, context and the need to be equipped with the right skills to manage the risks. Risk is a cross-boundary, cross-sectoral and multi-stakeholder issue. As such, digital risk management provides a common reference framework for different policy communities to discuss trust policies in an integrated manner. It also enables different actors to address risks in a more holistic way, building on the fundamental components of a risk management cycle.
SMEs, and start-ups in particular, are critical to economic growth in contributing to competition, innovation and job creation. However, they also face distinct challenges in managing digital risk. Typically, SMEs lack the awareness, resources or expertise to assess and manage risk effectively. To help SMEs realise opportunities from digital transformation, they need more awareness of good practices in digital risk management.
As digital transformation progresses, privacy is emerging as a critical factor influencing trust, especially the protection of personal data. Privacy is recognised as a fundamental value that merits protection, as well as a condition for the free flow of personal data across organisations and borders (OECD, 2016[34]). Technological advances can help increase trust through “privacy by design”, which considers privacy implications at the initial design phase of a product or service.
While technology can help, it cannot replace a strategic approach to protect privacy and personal data. One example is a national data strategy, supported at the highest level of government, which incorporates a whole-of-society perspective and balances individual and collective interests. Interoperability of privacy and data protection frameworks at the national and international levels needs to be fostered internationally.
Given it is impossible to create an entirely safe and secure digital environment, businesses, other organisations and individuals always take some digital security risk when engaging on line. Security standards (e.g. ISO 27000 series) can increase resilience and maintain business continuity by mitigating the potential consequences of security incidents. All stakeholders are interdependent in the digital environment, including across borders. Consequently, fostering partnerships, including with SMEs, can help reduce risk and promote good risk management. Cyber insurance can be an important element of managing digital security risk. It can enable the transfer of some risk, while creating incentives for better risk management.
For digital transformation to flourish, it is important to protect consumers effectively when they are engaged in e-commerce and other online activities. Transactions involving digital content and services (including zero price activities that involve users’ data) and blurred boundaries between consumers and businesses can also complicate traditional ideas of ownership, liability, rights and obligations.
Key challenges relate to information disclosure, misleading and unfair commercial practices, confirmation and payment, fraud and identity theft, product safety, and dispute resolution and redress. Novel forms of asset and content usage, including through rental, asset sharing and subscription services, pose challenges for consumer understanding of their rights and obligations. In financial markets, individuals (notably those with low levels of digital literacy) need new skills and knowledge to use new digital products and services effectively, and to understand the potential ramifications of sharing data.
26 OECD DIGITAL ECONOMY OUTLOOK 2020 © OECD 2020
1. GOING DIGITAL: AN INTEGRATED APPROACH TO POLICY MAKING 1. GOING DIGITAL: AN INTEGRATED APPROACH TO POLICY MAKING

Box 1.6. Strengthening trust: What matters most for policy?
● Use risk management as a framework to develop policies to increase trust, including to assess and manage risks related to digital technologies, data and cross-border flows. Ensure digital security risk goes beyond technical questions to become a strategic priority for individuals, firms – small and medium-sized enterprises in particular – and governments, and that everyone takes responsibility for managing digital risk.
● Develop and implement a national privacy strategy with a whole-of-society perspective supported at the highest level of government. Encourage interoperability of privacy frameworks across jurisdictions to enable the free flow of personal data; increase transparency on the purpose and use of personal data collections; and enhance users’ access and control over their data, including through “privacy by design”.
● Support digital consumers who face challenges related to online information disclosure, misleading and unfair commercial practices, confirmation and payment, fraud and identity theft, product safety, and dispute resolution and redress, including in the context of connected devices where the offline and online worlds converge.
Source: OECD (2019[1]), Going Digital: Shaping Policies, Improving Lives, https://dx.doi.org/10.1787/9789264312012-en.
Market openness
KEY POLICY DOMAINS AND INDICATORS
�� Trade
�� Investment
�� Financial markets
�� Competition
�� Taxation
Explore key indicators on Market Openness on the interactive Going Digital Toolkit: www.oecd.org/going-digital-toolkit.
Digital technologies are transforming the environment in which firms compete, trade and invest. Market openness enables digital transformation to flourish by creating a business-friendly environment. This allows foreign and domestic firms to compete on an equal footing and without excessive restrictions or regulations. Market openness policies related to trade, investment, financial markets, competition and taxation play an important role in this respect.
Digital technologies and data profoundly affect international trade by reducing trade costs; facilitating the co-ordination of global value chains; diffusing ideas and technologies across borders; and connecting greater numbers of businesses and consumers globally. In particular, goods are increasingly bundled with services, and new and previously non-tradeable services are now traded across borders. Reaping the benefits of trade in the digital age requires multi-stakeholder dialogue on regulatory approaches. These approaches should ensure the interoperability of differing regulatory regimes, particularly for transversal issues such as cross-border data flows.12 To support this dialogue, the nature and composition of heterogeneous data flows must be better understood, and the scope of public policy objectives should be clarified.
Investment regimes that mobilise private investment, including in communications infrastructures, technologies, and KBC (e.g. business models, software and data), coupled with open financial markets, attract foreign direct investment (FDI). Multinational enterprises – which by definition operate across
MARKETOPENNESS
27OECD DIGITAL ECONOMY OUTLOOK 2020 © OECD 2020
1. GOING DIGITAL: AN INTEGRATED APPROACH TO POLICY MAKING
borders – can make extensive use of digital technologies and data to organise their business operations and improve processes and procedures (see “Use”). Use of such technologies also promotes market-based international technology transfer (Lesher and Miroudot, 2008[35]).
Efficient, stable and open financial markets, based on transparency, confidence and integrity, help allocate financial resources to firms investing in digital transformation. Open financial markets also ensure that domestic financial services firms can compete with foreign competitors. Increased competition should make domestic firms more efficient and transparent. Financial flows can lower the cost of capital for firms in countries in which capital is scarce. This, in turn, can raise investment in digital transformation. Digital technologies also underpin new forms of external funding (e.g. crowdfunding13).
Strengthening competition in the digital age, including by opening access to markets, benefits consumers through lower prices and a greater variety of goods and services. This, in turn, supports trade and investment. Competitive markets also underpin digital transformation by spurring innovation, new business models, business dynamism and productivity, driving structural change across the economy. However, as digital technologies and data lead to greater competition in many markets, they have also demonstrated a potential to tilt others towards greater concentration, market power and even dominance. The OECD Competition Assessment Toolkit helps governments eliminate barriers to competition by identifying unnecessary restraints on market activities and developing alternative, less restrictive measures (OECD, 2020[36]).
Digital transformation has a wide range of implications for taxation. It affects tax policy and tax administration at both domestic and international levels, introducing new tools and challenges for policy makers. Work under the OECD/G20 Base Erosion and Profit Shifting (BEPS) Project and the Inclusive Framework on BEPS has recognised that digitalisation – and some of its related business models – present important challenges for international taxation (OECD, 2015[37]; OECD, 2018[38]).
Members of the Inclusive Framework on BEPS have agreed to undertake a coherent and concurrent review of the two key aspects of the existing tax framework – the profit allocation and nexus rules. This review would consider the impacts of digitalisation on the economy, relating to the principle of aligning profits with underlying economic activities and value creation.14
Box 1.7. Fostering market openness: What matters most for policy?
● Monitor changing competitive dynamics, especially trends in market concentration and dominance in digital-intensive sectors, and ensure that competition authorities use flexible tools and co-operate across borders to address transnational competition issues.
● Lower trade barriers, particularly for digitally deliverable services, e.g. inefficient regulations on interconnection. Ensure holistic market openness policies through multi-stakeholder dialogue to ensure interoperability across regulatory regimes, including for cross-border data flows and related privacy and security considerations.
● Reduce barriers to international investment, including in communications infrastructures, digital technologies and knowledge-based capital (e.g. business models, software, data), and promote open financial markets.
● Ensure that tax systems are fit for purpose in the digital age through continued international co-operation towards a consensus-based, global solution.
Source: OECD (2019[1]), Going Digital: Shaping Policies, Improving Lives, https://dx.doi.org/10.1787/9789264312012-en.
Putting the framework into practiceA whole-of-government approach to digital transformation requires a digital transformation strategy (DTS). Many countries have a national digital strategy or an equivalent policy in place (see Chapter 2), but most are still narrow in scope. A DTS should be comprehensive in addressing the range of interrelated policy issues discussed above. It should ensure coherence and co-ordination of policies
28 OECD DIGITAL ECONOMY OUTLOOK 2020 © OECD 2020
1. GOING DIGITAL: AN INTEGRATED APPROACH TO POLICY MAKING 1. GOING DIGITAL: AN INTEGRATED APPROACH TO POLICY MAKING

across all domains and sectors that shape digital transformation. Finally, it should involve all relevant stakeholders in its development and implementation. There are five key steps to develop a DTS (Box 1.8).
Box 1.8. Five steps to develop a digital transformation strategy
1. Establish a governance approach that supports effective co-ordination.
● Establish a governance approach that supports effective steering and co-ordination of digital transformation policies in light of the country’s culture and institutions.
● Assign clear responsibilities for strategic co-ordination (e.g. the head of government or a lead minister) and operational co-ordination (e.g. chief digital officers in implementing bodies) for development and implementation of a national digital transformation strategy (DTS).
2. Articulate a strategic vision and ensure coherence.
● Articulate a strategic vision that provides direction on identifying the main priorities and scoping the main objectives of a DTS.
● Ensure coherence between a DTS and other related domestic and international digital strategies and/or policy objectives.
3. Assess key digital trends, related policies and regulations.
● Monitor key digital trends, including by international benchmarking, to identify opportunities and challenges and related priorities to be addressed by a DTS.
● Evaluate the effectiveness of current strategies and/or policies, identify gaps and/or incoherence, and scope objectives for a DTS.
4. Develop a comprehensive and coherent strategy.
● Leverage the governance approach, the strategic vision, and insights from monitoring and evaluation to develop a comprehensive and coherent DTS.
● Engage all relevant actors in developing a DTS, including different parts and levels of government, non-governmental stakeholders and international partners.
5. Implement the strategy successfully.
● Anticipate and address implementation challenges related to institutions and policy frameworks, social preferences and (lack of) administrative capacity.
● Issue an action plan with specific measures, clear responsibilities, budget, timeframes and measurable targets to successfully implement the DTS.
Source: (OECD, 2019[1]), Going Digital: Shaping Policies, Improving Lives, https://dx.doi.org/10.1787/9789264312012-en.
Government actors who draft a strategy and design policies can never by themselves have a full understanding of all opportunities, challenges and issues related to a DTS. One key to success is thus engaging stakeholders from the early stages of strategy and policy development. Multi-stakeholder co-operation brings tangible benefits that lead to better policies and outcomes. It improves the quality of rulemaking through ideas, expertise and evidence from stakeholders. Furthermore, it creates a sense of ownership in and enhances the legitimacy of policies and regulations. In turn, stakeholder engagement can increase trust in government and compliance with regulations.
29OECD DIGITAL ECONOMY OUTLOOK 2020 © OECD 2020
1. GOING DIGITAL: AN INTEGRATED APPROACH TO POLICY MAKING 1. GOING DIGITAL: AN INTEGRATED APPROACH TO POLICY MAKING

References
Adalet McGowan, M. and D. Andrews (2018), “Design of insolvency regimes across countries”, OECD Economics Department Working Papers, No. 1504, OECD Publishing, Paris, https://dx.doi.org/10.1787/d44dc56f-en.
[12]
Adalet McGowan, M., D. Andrews and V. Millot (2017), “The Walking Dead?: Zombie Firms and Productivity Performance in OECD Countries”, OECD Economics Department Working Papers, No. 1372, OECD Publishing, Paris, https://dx.doi.org/10.1787/180d80ad-en.
[15]
Andrews, D., A. Caldera Sánchez and Å. Johansson (2011), “Housing Markets and Structural Policies in OECD Countries”, OECD Economics Department Working Papers, No. 836, OECD Publishing, Paris, http://dx.doi.org/10.1787/5kgk8t2k9vf3-en.
[22]
Andrews, D. and C. Criscuolo (2013), “Knowledge-Based Capital, Innovation and Resource Allocation”, OECD Economics Department Working Papers, No. 1046, OECD Publishing, Paris, https://dx.doi.org/10.1787/5k46bj546kzs-en.
[10]
Andrews, D., G. Nicoletti and C. Timiliotis (2018), “Digital technology diffusion: A matter of capabilities, incentives or both?”, OECD Economics Department Working Papers, No. 1476, OECD Publishing, Paris, http://dx.doi.org/10.1787/7c542c16-en.
[11]
Attrey, A., M. Lesher and C. Lomax (2020), “The role of sandboxes in promoting flexibility and innovation in the digital age”, Going Digital Toolkit Policy Note, No. 2, https://goingdigital.oecd.org/toolkitnotes/the-role-of-sandboxes-in-promoting-flexibility-and-innovation-in-the-digital-age.pdf.
[20]
Berger, T. and C. Frey (2015), “Industrial renewal in the 21st century: Evidence from US cities”, Regional Studies, Vol. 51/3, pp. 404-413, http://dx.doi.org/10.1080/00343404.2015.1100288.
[25]
Causa, O. and M. Hermansen (2017), “Income redistribution through taxes and transfers across OECD countries”, OECD Economics Department Working Papers, No. 1453, OECD Publishing, Paris, http://dx.doi.org/10.1787/bc7569c6-en.
[28]
Causa, O., A. Vindics and O. Akgun (2018), “An empirical investigation on the drivers of income redistribution across OECD countries”, OECD Economics Department Working Papers, No. 1488, OECD Publishing, Paris, http://dx.doi.org/ 10.1787/5cb47f33-en.
[29]
DCMS Committee (2018), “Disinformation and ‘fake news’: Interim report”, Fifth Report of Session 2017-19, Digital, Culture, Media and Sport Committee, House of Commons, United Kingdom, https://publications.parliament.uk/pa/cm201719/cmselect/cmcumeds/363/363.pdf.
[31]
European Commission (2018), “A multi-dimensional approach to disinformation”, Report of the Independent High Level Group on Fake News and Online Disinformation, European Commission, Brussels, http://ec.europa.eu/newsroom/dae/document.cfm?doc_id=50271.
[30]
Le Donné, N., P. Fraser and G. Bousquet (2016), “Teaching Strategies for Instructional Quality: Insights from the TALIS-PISA Link Data”, OECD Education Working Papers, No. 148, OECD Publishing, Paris, http://dx.doi.org/10.1787/5jln1hlsr0lr-en.
[27]
Lesher, M. and S. Miroudot (2008), “FDI Spillovers and their Interrelationships with Trade”, OECD Trade Policy Papers, No. 80, OECD Publishing, Paris, https://dx.doi.org/10.1787/235843308250.
[35]
Ministry of Foreign Affairs of Denmark (2018), “Strengthened safeguards against foreign influence on Danish elections and democracy”, webpage, https://um.dk/en/news/newsdisplaypage/?newsid=1df5adbb-d1df-402b-b9ac-57fd4485ffa4 (accessed on 19 October 2019).
[32]
Moretti, E. (2012), The New Geography of Jobs, Houghton Mifflin Harcourt, Boston. [24]
OECD (2020), “Going Digital integrated policy framework”, OECD Digital Economy Papers, No. 292, OECD Publishing, Paris, https://dx.doi.org/10.1787/dc930adc-en.
[3]
OECD (2020), “OECD Competition Assessment Toolkit”, webpage, https://www.oecd.org/competition/assessment-toolkit.htm (accessed on 21 October 2020).
[36]
OECD (2019), Enhancing Access to and Sharing of Data: Reconciling Risks and Benefits for Data Re-use across Societies, OECD Publishing, Paris, https://dx.doi.org/10.1787/276aaca8-en.
[7]
OECD (2019), “Enhancing SME access to diversified financing instruments”, in Strengthening SMEs and Entrepreneurship for Productivity and Inclusive Growth: OECD 2018 Ministerial Conference on SMEs, OECD Publishing, Paris, https://dx.doi.org/10.1787/16fe6707-en.
[16]
OECD (2019), Going Digital: Shaping Policies, Improving Lives, OECD Publishing, Paris, https://dx.doi.org/10.1787/9789264312012-en. [1]
OECD (2019), “ICT investments in OECD countries and partner economies: Trends, policies and evaluation”, OECD Digital Economy Papers, No. 280, OECD Publishing, Paris, https://dx.doi.org/10.1787/bcb82cff-en.
[9]
30 OECD DIGITAL ECONOMY OUTLOOK 2020 © OECD 2020
1. GOING DIGITAL: AN INTEGRATED APPROACH TO POLICY MAKING 1. GOING DIGITAL: AN INTEGRATED APPROACH TO POLICY MAKING
References and Notes
OECD (2019), OECD Employment Outlook 2019: The Future of Work, OECD Publishing, Paris, https://dx.doi.org/10.1787/9ee00155-en. [21]
OECD (2019), OECD Skills Outlook 2019: Thriving in a Digital World, OECD Publishing, Paris, https://dx.doi.org/10.1787/df80bc12-en. [14]
OECD (2019), “The road to 5G networks: Experience to date and future developments”, OECD Digital Economy Papers, No. 284, OECD Publishing, Paris, https://dx.doi.org/10.1787/2f880843-en.
[4]
OECD (2019), “Vectors of digital transformation”, OECD Digital Economy Papers, No. 273, OECD Publishing, Paris, https://doi.org/10.1787/5ade2bba-en.
[2]
OECD (2018), Job Creation and Local Economic Development 2018: Preparing for the Future of Work, OECD Publishing, Paris, http://dx.doi.org/10.1787/9789264305342-en.
[26]
OECD (2018), “Maintaining competitive conditions in the era of digitalisation”, OECD Report to G-20 Finance Ministers and Central Bank Governors, July 2018, OECD, Paris, http://www.oecd.org/g20/Maintaining-competitive-conditions-in-era-of-digitalisation-OECD.pdf.
[17]
OECD (2018), Tax Challenges Arising from Digitalisation – Interim Report 2018: Inclusive Framework on BEPS, OECD/G20 Base Erosion and Profit Shifting Project, OECD Publishing, Paris, https://dx.doi.org/10.1787/9789264293083-en.
[38]
OECD (2017), Key Issues for Digital Transformation in the G20, OECD, Paris, https://www.oecd.org/g20/key-issues-for-digital-transformation-in-the-g20.pdf.
[5]
OECD (2017), OECD Digital Economy Outlook 2017, OECD Publishing, Paris, https://dx.doi.org/10.1787/9789264276284-en. [39]
OECD (2017), “The evolving role of satellite networks in rural and remote broadband access”, OECD Digital Economy Papers, No. 264, OECD Publishing, Paris, https://dx.doi.org/10.1787/7610090d-en.
[6]
OECD (2016), OECD Ministerial Declaration on the Digital Economy: Innovation, Growth and Social Prosperity (“Cancún Declaration”), OECD, Paris, https://www.oecd.org/internet/Digital-Economy-Ministerial-Declaration-2016.pdf.
[34]
OECD (2015), Addressing the Tax Challenges of the Digital Economy, Action 1 - 2015 Final Report, OECD/G20 Base Erosion and Profit Shifting Project, OECD Publishing, Paris, https://dx.doi.org/10.1787/9789264241046-en.
[37]
OECD (2015), Data-Driven Innovation: Big Data for Growth and Well-Being, OECD Publishing, Paris, http://dx.doi.org/10.1787/ 9789264229358-en.
[23]
OECD (2015), “Making Open Science a Reality”, OECD Science, Technology and Industry Policy Papers, No. 25, OECD Publishing, Paris, http://dx.doi.org/10.1787/5jrs2f963zs1-en.
[18]
OECD (2014), Recommendation of the Council on Digital Government Strategies, OECD, Paris, https://legalinstruments.oecd.org/en/instruments/OECD-LEGAL-0406.
[8]
Pamment, J., H. Nothhaft and A. Agardh-Twetman (2018), “Countering information influence activities: The state of the art”, Research Report, Swedish Civil Contingencies Agency and Lund University, Stockholm, https://rib.msb.se/filer/pdf/28697.pdf.
[33]
Sorbe, S., P. Gal and V. Millot (2018), “Can productivity still grow in service-based economies?: Literature overview and preliminary evidence from OECD countries”, OECD Economics Department Working Papers, No. 1531, OECD Publishing, Paris, https://doi.org/10.1787/4458ec7b-en.
[19]
Sorbe, S. et al. (2019), “Digital Dividend: Policies to Harness the Productivity Potential of Digital Technologies”, OECD Economic Policy Papers, No. 26, OECD Publishing, Paris, https://dx.doi.org/10.1787/273176bc-en.
[13]
Notes
1. www.oecd.org/going-digital-toolkit.
2. Other approaches used across OECD countries include, in order of frequency: i) measures to facilitate data (re)use across organisations and sectors; ii) promotion of e-health applications and e-commerce; iii) digital content creation and diffusion; and iv) measures to foster the uptake of the Internet of Things and machine-to-machine communication (OECD, 2017[39]).
3. Policies to help SMEs overcome these barriers include: i) support schemes to facilitate the adoption of tools that are particularly beneficial and may be new to SMEs (e.g. cloud computing); ii) measures to help SMEs overcome obstacles to better exploit and protect intellectual property; iii) policies targeting firms by size that avoid creating disincentives for SMEs to scale up; iv) exemptions of certain rules for SMEs to facilitate regulatory compliance; and v) programmes that raise awareness of and create opportunities for linkages and partnerships between
31OECD DIGITAL ECONOMY OUTLOOK 2020 © OECD 2020
1. GOING DIGITAL: AN INTEGRATED APPROACH TO POLICY MAKING 1. GOING DIGITAL: AN INTEGRATED APPROACH TO POLICY MAKING
References and Notes

SMEs and larger firms, domestically and internationally, to help SMEs to exploit their potential in producing intermediate goods and digital services (OECD, 2019[1]).
4. ICT skills are also sometimes referred to as digital skills.
5. ICT skills used at work range from basic computer skills to communication and information search to office productivity software skills.
6. ICT specialists include ICT service managers, professionals and technicians; electro-technology engineers; and electronics and telecom installers and repairers.
7. Data specialists include mathematicians, actuaries, statisticians, and database and network professionals.
8. Complementary skills include teamwork and autonomy, among others.
9. Open Science initiatives promise greater access to scientific information and data sharing, as well as more effective engagement of businesses, policy makers, citizens and other interested parties in the processes of public research.
10. The “once only” principle seeks to ensure that individuals, institutions, and companies only have to provide certain standard information to public authorities once.
11. Disinformation is defined as all forms of false, inaccurate or misleading information designed, presented and promoted to intentionally cause public harm or for profit (European Commission, 2018[30]).
12. On the one hand, emerging measures affecting cross-border data flows raise concerns for business activity and the ability to benefit from digital trade. On the other hand, important public policy objectives, such as the protection of privacy, security and intellectual property rights, must be considered. The challenge is to address public policy objectives in a manner that is not arbitrary or discriminatory to preserve the significant economic and trade benefits flowing from data-enabled trade.
13. Crowdfunding refers to external financing that is raised through online platforms. Crowdfunding reaches a larger investor population and more varied investor profiles.
14. The Inclusive Framework on BEPS groups over 135 countries and jurisdictions on an equal footing. In January 2020, it agreed upon an outline of the architecture on Pillar One as the basis for negotiations and welcomed progress made on Pillar Two. The statement of the Inclusive Framework on BEPS is available at www.oecd.org/tax/beps/statement-by-the-oecd-g20-inclusive-framework-on-beps.htm.
32 OECD DIGITAL ECONOMY OUTLOOK 2020 © OECD 2020
1. GOING DIGITAL: AN INTEGRATED APPROACH TO POLICY MAKING
References and Notes

Chapter 2POLICY TRENDS
33OECD DIGITAL ECONOMY OUTLOOK 2020 © OECD 2020

KEY FINDINGS
�� OECD countries are strengthening their strategic approach to policy for the digital transformation.
�� National digital strategies are increasingly co-ordinated at the highest levels of government. In 2019, four more countries reported co-ordination at the prime minister/chancellery level and several more indicated a ministry dedicated to digital affairs than in 2016.
�� In the last three years, many countries, including Australia, Austria, Colombia, France, Germany, Korea, Spain, the United Kingdom and the United States, have issued national 5G strategies.
�� All OECD countries and several partner economies enhance access to and sharing of public sector data. Only a few (Australia, Germany, Japan, Singapore, United States) also have initiatives to facilitate data sharing within the private sector.
�� Digital security innovation is an emerging trend in the OECD. Several OECD countries, including Australia, France, Germany, Israel and the United Kingdom, have established open innovation centres to promote its development.
�� By mid-2020, over 60 countries had a national artificial intelligence (AI) strategy. Priority areas include AI-related research and development (R&D) (Canada, United States, European Commission), AI adoption (Finland, Germany, Korea), and AI skills (Australia, Finland, United Kingdom, United States).
�� Blockchain and quantum computing are attracting increasing policy attention worldwide. Several countries have issued a blockchain strategy (Australia, People’s Republic of China [hereafter “China”], Germany, India, Switzerland). Others (France, Italy) are developing one. The United States, China and the European Union are leading on quantum computing R&D expenditure.
�� Dealing with the socio-economic effects of the COVID-19 pandemic has become a policy priority in the digital area. Governments, academia and businesses in OECD countries (United Kingdom, United States) have rapidly developed AI systems to predict and monitor the spread of the disease and advance medical research.
�� OECD national privacy enforcement authorities, as well as the European Data Protection Board and the Council of Europe, have issued guidance on the collection, processing and sharing of personal data in relation to COVID-19.
�� Digital security agencies in countries such as Canada, the Czech Republic and the United States have responded to the COVID-19 crisis by raising awareness, monitoring threats and providing assistance.
�� All OECD countries have policies to support digital uptake by firms, particularly start-ups, and the creation of new businesses.
�� Some countries have extended collective bargaining (Canada, Denmark, France). Others are considering minimum wages (Netherlands, United Kingdom) to platform-mediated workers, who have been most severely hit by the economic crisis.
Introduction National digital strategies (NDSs) help governments shape the way digital transformation takes place in a country. Such strategies define policy priorities, set objectives and outline actions for implementation. As such, their development should involve representatives from a wide range of stakeholder groups1 and different parts of the government, including at the subnational level. Today, almost all OECD countries and many partner economies have developed NDSs.
Based on responses to the 2019 OECD Digital Economy Policy Questionnaire on national digital strategies and policies from 32 OECD countries2 and 5 partner economies,3 the first section of this chapter analyses recent developments in NDSs across countries. It identifies the main policy objectives, exploring key developments and progress, as well as challenges faced in developing such strategies. It then outlines different governance approaches to NDSs. The second section presents key developments of the domain-specific policies that are described in more detail in the thematic chapters. These policies
34 OECD DIGITAL ECONOMY OUTLOOK 2020 © OECD 2020
2. POLICY TRENDS 2. POLICY TRENDS
focus on connectivity, usage, data governance, security, privacy, innovation, work and key technologies such as artificial intelligence (AI), blockchain and quantum computing.
National digital strategies
More countries are developing national digital strategiesMost OECD countries and partner economies have established an NDS. Of the 37 countries that responded to the 2019 OECD Digital Economy Policy Questionnaire on national digital strategies and policies, 34 countries have an overarching NDS, many of which were established in 2018. The exceptions include Poland, which does not have a strategy; Mexico, which is developing an NDS; and the United States, which takes a decentralised, market-driven approach to its overall digital policy.4
In all, 27 countries used an earlier strategy as a foundation to build the current one. Countries with a specified time frame for their strategies develop them every four to six years.
Most countries with available data reported having a budget associated with the NDS. Some indicated the NDS was part of a broader framework (e.g. United Kingdom), while in others it is decentralised (e.g. Austria, Costa Rica).
Half of the countries have stand-alone strategies, while the other half have ones that form part of a broader national strategy, such as a national innovation strategy. In addition, 19 countries have aligned their NDS with a supra-national agenda. For example, most European OECD countries have based their strategies on the principles and objectives of the Digital Agenda for Europe (European Commission, 2010[1]), the Digital Single Market Strategy for Europe (European Commission, 2015[2]), the Europe 2020 Strategy (European Commission, 2010[3]), the European Union eGovernment Action Plan (European Commission, 2016[4]) or a combination thereof.
Countries follow a common set of digital economy policy prioritiesAs in 2016, countries were asked to rank policy objectives by priority in the 2019 OECD Digital Economy Policy Questionnaire. In the 2019 questionnaire, however, countries could allocate a unique value to each priority. Countries such as Japan, Sweden and the United Kingdom reported their NDS does not allow them to make such distinctions.
The following results are based on countries that could allocate priorities. While priority objectives in NDSs have evolved in recent years, some have remained highly important to most countries (Table 2.1). For example, “enhance digital government” was the highest ranked policy objective in both 2016 and 2019. “Develop telecommunications infrastructure” was the second-highest ranked policy objective over the same period. “Develop skills for the digital transformation” likewise remains important for many countries. In 2019, however, “foster innovation in digital technologies” emerged as an important policy objective.
Mid-ranked policy objectives (in order of priority in both 2016 and 2019) include improving digital security, enhancing data governance and promoting digital uptake by businesses. Promotion of digital uptake by individuals, enhancement of consumer protection on line and enhancement of Internet governance rank the lowest, with the latter falling the most during the period. Respondents indicated that most policy objectives in 2019 were foreseen to remain the same over the next three to five years. The two exceptions – developing skills for the digital transformation and enhancing data governance – were expected to become more important.
The 2019 priority ranking of policy objectives, from highest to lowest, corresponds approximately with the number of countries whose NDSs feature matching policy objectives (Table 2.1, column 3). For example, the top three ranked policy objectives – enhancing digital government, developing telecommunications infrastructure and fostering innovation in digital technologies – are mentioned the most frequently of all policy objectives (26, 26 and 25 times, respectively). In parallel, the two lowest ranked policy objectives – enhancing consumer protection on line and enhancing Internet governance – are mentioned the least frequently of all policy objectives (twice and thrice, respectively).
35OECD DIGITAL ECONOMY OUTLOOK 2020 © OECD 2020
2. POLICY TRENDS 2. POLICY TRENDS
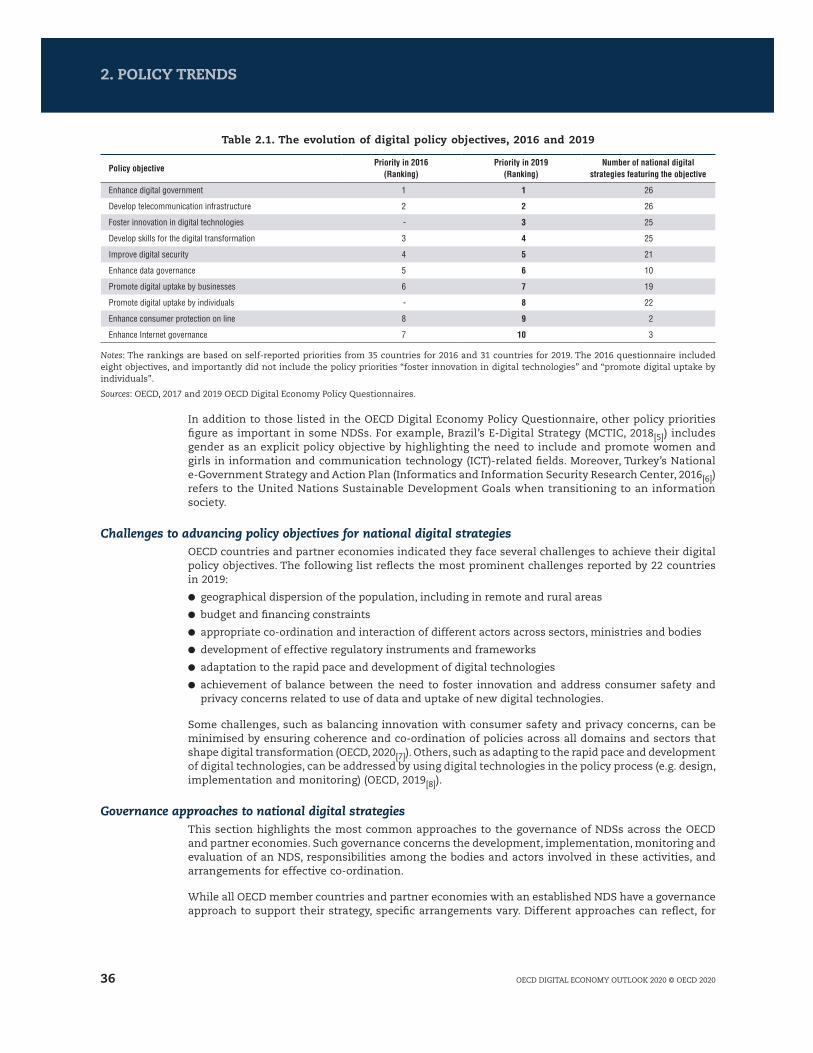
Table 2.1. The evolution of digital policy objectives, 2016 and 2019
Policy objectivePriority in 2016
(Ranking)Priority in 2019
(Ranking)Number of national digital
strategies featuring the objective
Enhance digital government 1 1 26
Develop telecommunication infrastructure 2 2 26
Foster innovation in digital technologies - 3 25
Develop skills for the digital transformation 3 4 25
Improve digital security 4 5 21
Enhance data governance 5 6 10
Promote digital uptake by businesses 6 7 19
Promote digital uptake by individuals - 8 22
Enhance consumer protection on line 8 9 2
Enhance Internet governance 7 10 3
Notes: The rankings are based on self-reported priorities from 35 countries for 2016 and 31 countries for 2019. The 2016 questionnaire included eight objectives, and importantly did not include the policy priorities “foster innovation in digital technologies” and “promote digital uptake by individuals”.
Sources: OECD, 2017 and 2019 OECD Digital Economy Policy Questionnaires.
In addition to those listed in the OECD Digital Economy Policy Questionnaire, other policy priorities figure as important in some NDSs. For example, Brazil’s E-Digital Strategy (MCTIC, 2018[5]) includes gender as an explicit policy objective by highlighting the need to include and promote women and girls in information and communication technology (ICT)-related fields. Moreover, Turkey’s National e-Government Strategy and Action Plan (Informatics and Information Security Research Center, 2016[6]) refers to the United Nations Sustainable Development Goals when transitioning to an information society.
Challenges to advancing policy objectives for national digital strategiesOECD countries and partner economies indicated they face several challenges to achieve their digital policy objectives. The following list reflects the most prominent challenges reported by 22 countries in 2019:
● geographical dispersion of the population, including in remote and rural areas
● budget and financing constraints
● appropriate co-ordination and interaction of different actors across sectors, ministries and bodies
● development of effective regulatory instruments and frameworks
● adaptation to the rapid pace and development of digital technologies
● achievement of balance between the need to foster innovation and address consumer safety and privacy concerns related to use of data and uptake of new digital technologies.
Some challenges, such as balancing innovation with consumer safety and privacy concerns, can be minimised by ensuring coherence and co-ordination of policies across all domains and sectors that shape digital transformation (OECD, 2020[7]). Others, such as adapting to the rapid pace and development of digital technologies, can be addressed by using digital technologies in the policy process (e.g. design, implementation and monitoring) (OECD, 2019[8]).
Governance approaches to national digital strategiesThis section highlights the most common approaches to the governance of NDSs across the OECD and partner economies. Such governance concerns the development, implementation, monitoring and evaluation of an NDS, responsibilities among the bodies and actors involved in these activities, and arrangements for effective co-ordination.
While all OECD member countries and partner economies with an established NDS have a governance approach to support their strategy, specific arrangements vary. Different approaches can reflect, for
36 OECD DIGITAL ECONOMY OUTLOOK 2020 © OECD 2020
2. POLICY TRENDS 2. POLICY TRENDS

example, variations in countries’ domestic institutions, government organisation, or administrative culture and capacity. In addition, governance arrangements can evolve over time, underpinned, for example by changes in government, technological progress and the evolution in the constellation of key actors due to digital transformation (OECD, 2019[9]). This can affect the allocation of key responsibilities, such as for strategy development, co-ordination, implementation, monitoring and evaluation.
Two main types of approaches can be identified. In the first approach, countries assign high-level leadership and centralised responsibility for strategic co-ordination above ministerial level (Figure 2.1). In these countries, a co-ordination office under the president, prime minister or chancellor usually holds the pen in drafting the strategy and involves key ministries and stakeholders in the process. This office tends to be led by a state secretary or a similar function. In about half of the countries with this approach, this office also leads strategic co-ordination. In some countries, co-ordination can instead be part of a centre of government.5 Focal points within each implementing ministry and agency, such as chief digital officers, tend to ensure operational co-ordination for the strategy. These ministries and agencies usually also monitor implementation and report to the co-ordinating office. In most cases, this office ensures strategy evaluation, with oversight by the head of government (OECD, 2019[9]).
Figure 2.1. High-level strategic co-ordination of national digital strategies
Ministerialcouncil Stakeholders
Head of government
Co-ordination officeStrategy development,
co-ordination, evaluation
Co-ordination groupOperational co-ordination
MinistriesImplementationand monitoring
AgenciesImplementationand monitoring
Source: OECD (2019[9]), Going Digital: Shaping Policies, Improving Lives, https://dx.doi.org/10.1787/9789264312012-en.
In the second approach, a lead ministry is typically in charge of strategy development and strategic co-ordination (Figure 2.2). This approach is likely to be most effective if the lead ministry is exclusively dedicated to digital affairs instead of having a range of portfolios. Strategy development tends to involve stakeholders, e.g. under the auspices of a ministerial council, which is usually hosted by the lead ministry and sometimes chaired by the head of government. Similar to the first approach, a dedicated group of focal points from the implementing ministries and agencies usually ensures operational co-ordination. The same bodies also tend to monitor implementation, reporting to the lead ministry and/or the ministerial council, which often ensures strategy evaluation. In most cases where the lead ministry is dedicated to digital affairs, the latter also ensures monitoring and evaluation (OECD, 2019[9]).
37OECD DIGITAL ECONOMY OUTLOOK 2020 © OECD 2020
2. POLICY TRENDS 2. POLICY TRENDS

Figure 2.2. Ministry-level strategic co-ordination of national digital strategies
Co-ordination groupOperational co-ordination
MinistriesImplementationand monitoring
AgenciesImplementationand monitoring
Executive StakeholdersMinisterial council
Lead ministry Strategy development,
co-ordination, implementation,
monitoring and evaluation
Source: OECD (2019[9]), Going Digital: Shaping Policies, Improving Lives, https://dx.doi.org/10.1787/9789264312012-en.
Information collected via the 2019 OECD Digital Economy Policy Questionnaire confirms the persistence of these two main types of governance approaches, but also reveals some evolution in recent years (OECD, 2017[10]). Table 2.2 provides an overview of the responsibilities allocated for the development, co-ordination, implementation, monitoring and evaluation of NDSs in 2016 and 2019.
Table 2.2. National digital strategy governanceNumber of countries that have allocated respective responsibilities
Entity responsibleLead strategy development
Contribution Co-ordination Implementation Monitoring Evaluation
2016 2019 2016 2019 2016 2019 2016 2019 2016 2019 2019
Office of the Prime Minister, Presidency, Chancellery
4 8 0 0 5 5 1 0 6 3 4
Ministry or body dedicated to digital affairs
8 10 1 0 10 14 3 5 8 14 13
Ministry or body not dedicated to digital affairs
15 12 2 0 13 10 1 2 11 9 9
Several ministries or bodies 6 3 14 9 5 4 26 15 7 7 4
Multiple public and private stakeholders
1 0 17 24 0 0 3 11 0 0 0
Notes: The data for 2016 are based on survey responses from 35 countries. The data for 2019 are based on survey responses from 33 countries. Italy, Hungary and Turkey provided no information on Evaluation. Multiple public and private stakeholders include government actors, as well as civil society and the private sector.
Sources: OECD, 2017 and 2019 OECD Digital Economy Policy Questionnaires.
The number of countries that allocate strategic responsibilities to a high-level government body has doubled from four to eight between 2016 and 2019. However, only in Chile, Colombia and Turkey is the high-level body leading both strategy development and strategic co-ordination. In Japan, Luxembourg, the Russian Federation and Switzerland, the responsibility for leading the development of the strategy also lies with a high-level government body, while the task of strategic co-ordination is entrusted to
38 OECD DIGITAL ECONOMY OUTLOOK 2020 © OECD 2020
2. POLICY TRENDS 2. POLICY TRENDS

a ministry or body dedicated to digital affairs. Individual approaches exist across these countries on handling the monitoring and evaluation of the strategy.
The largest group of countries still has a single ministry or body in charge of strategy development and strategic co-ordination. In most countries, this entity has a portfolio that extends beyond digital areas to include others such as the economy, science, innovation or industrial affairs. Countries with a dedicated digital affairs ministry or body include Austria, Belgium, Greece, Israel, Slovenia, Sweden and the United Kingdom. In these countries, the lead ministry or body has a strong mandate for both strategy development and strategic co-ordination. Concurrently, they are also in charge of monitoring and evaluation. This is also the case in Spain, with the exception of strategic co-ordination being managed across several ministries.
The contribution of several ministries or bodies to strategy development has decreased between 2016 and 2019 – from 14 to 9. This may be explained, at least in part, by the increase in the contribution of multiple public and private stakeholders, including government actors, civil society and the private sector. The latter is a positive development, given that stakeholder input is essential for the inclusiveness and subsequently the quality and successful implementation of the strategy (OECD, 2019[9]).
Monitoring and evaluation of national digital strategiesMonitoring and evaluation are essential to know how well an NDS is implemented and how effective it is. Countries do this in different ways, including through benchmarking surveys, annual or bi-annual status and progress reports, and dashboards with forecasts.
According to the results of the 2019 OECD Digital Economy Policy Questionnaire, all countries with available data monitor progress in the implementation of their NDS, and 24 countries reported having set specific targets against which they measure progress. Japan, for example, has targets to reduce the operating costs of information systems, while Estonia, Finland, Norway and Sweden have ambitious targets for faster Internet. Other countries have targets on improving e-commerce development (Latvia) or fostering start-up creation (Belgium).
Most countries also use international metrics and scoreboards to measure national progress towards policy objectives set in NDSs. Such metrics can be found in the OECD Digital Economy Outlook, the OECD Going Digital Toolkit, the European Commission’s Digital Economy and Society Index, the UN e-Government Survey and the World Economic Forum’s Global Competitiveness Index, among others. In the Czech Republic, for example, the Government Council for Information Society periodically carries out a benchmark survey with a set of performance indicators that focus on assessing the maturity and performance of each entity involved in the NDS.
Beyond monitoring and evaluating progress against an NDS’ own targets and objectives, it can be informative for countries to also measure the effects of achieving objectives of their NDSs on higher-level national goals, such as growth, productivity and innovation. For example, in Iceland, initiatives that form part of their Digital Iceland strategy also relate to its financial strategy (Ministry of Finance and Economic Affairs, 2019[11]). In Japan, spurred by the Internet of Things (IoT), big data and AI, the Fourth Industrial Revolution, as envisaged in its New IT Strategy, is expected to contribute to nominal gross domestic product (GDP) growth over the next few years. Similarly, in the Russian Federation, more than half of GDP growth by 2030 is expected to come from increased efficiency and competitiveness resulting from higher uptake of digital technologies.
Key policy developmentsThis section reviews the main policy trends across different fields of the digital economy: connectivity, usage, data governance, security, privacy, innovation, work and key technologies (AI, blockchain and quantum computing). Further information on each field is provided in the thematic chapters.
Access and connectivityOver the past few years, policy makers and regulators have been adapting regulatory frameworks to spur competition, innovation and investment in communication markets (Chapter 3).
39OECD DIGITAL ECONOMY OUTLOOK 2020 © OECD 2020
2. POLICY TRENDS 2. POLICY TRENDS

As countries weather the COVID-19 crisis, connectivity, more than ever, is essential to ensure that economic activities can continue remotely. Disparities in access to communication services among and within countries may accentuate the consequences of the COVID-19 crisis. Therefore, policies aiming to reduce digital divides are of paramount importance. In addition, regulation and policies that foster competition and investment in communication infrastructure become even more crucial. In the medium and long term, upgrading networks to the next evolution of fixed and wireless broadband will help ensure reliable and resilient connectivity for all.
Communication markets are changing, including a trend towards convergence. This had led countries such as Colombia, Finland and Germany to modify the mandates and responsibilities of communication regulators. Other countries, such as Italy and the United Kingdom, have adapted regulatory frameworks as part of the transition of legacy networks and services, such as copper fixed networks.
OECD countries, including Austria, France, Germany and Korea, increasingly use data-driven regulation to complement traditional regulatory tools. Data on network quality, for example, provide incentives for operators to “self-regulate” and improve their networks.
OECD countries are further focusing on how to extend and improve access through policies to reduce broadband deployment costs. This includes work on infrastructure sharing and co-investment provisions, as well as “dig-once” policies.
Passive infrastructure sharing has been common in OECD countries, including Australia, France, Korea and Switzerland. There are also more examples of active infrastructure sharing. These range from radio access network sharing agreements (Czech Republic, France, Germany, Spain, Sweden, Switzerland) to national roaming agreements (Colombia, France).
Several OECD countries have focused on “dig-once” policies. These aim to leverage non-broadband infrastructure projects (e.g. utilities, street light providers, and highway/road construction) and reduce the costs of broadband network deployment. For example, countries belonging to the European Union (EU) transposed the EU Broadband Cost Reduction Directive (2014/61/EU) into legislation by January 2016. This includes provisions that allow communication network operators to access other utility networks. Switzerland has also taken initiatives in the same sense.
In mobile markets, OECD countries continue to focus on efficient spectrum management to boost deployment of the next generation of wireless networks. Spectrum assignments for wireless networks have been prominent in the OECD since 2016. The 15 countries that have embraced such spectrum assignments are Austria, Canada, Chile, Denmark, Finland, France, Germany, Ireland, Italy, Latvia, Spain, Sweden, Switzerland, the United Kingdom and the United States.
The “network densification” required for 5G deployment will have important technical, regulatory and policy implications for all levels of government, including municipalities, industry and the public. Several OECD countries, including the United Kingdom and the United States, are streamlining rights of way to facilitate network densification. Others, such as Korea, Ireland and Sweden, have adopted policies to enhance backhaul and backbone connectivity.
In the last three years, many countries, including Australia, Austria, Colombia, France, Germany, Spain and the United Kingdom, have issued national 5G strategies. The European Union has several 5G initiatives, such as the “5G Action Plan” and the 5G Infrastructure Public Private Partnership. Korea has rolled out a comprehensive strategy named “5G+” to promote a “5G ecosystem”, where 5G is the underlying infrastructure connecting advanced devices and innovative services. In the United States, the Federal Communications Commission (FCC) released a comprehensive strategy to “Facilitate America’s Superiority in 5G Technology” coined as the “5G FAST Plan”.
Almost all OECD countries have established broadband access targets, and in some cases, usage targets. Korea, for example, has the highest target for download speeds: 10 Gigabits per second (Gbps) to 50% of urban households by 2022. Luxembourg aims to offer 1 Gbps to all households by 2020. Sweden follows with the goal of connecting 98% of both households and businesses with 1 Gbps broadband by 2025.Austria is targeting nationwide coverage of 1 Gbps broadband connections, both fixed and mobile, by 2030. Canada aims for 90% of Canadians to have access to 50 Megabits per second (Mbps) download
40 OECD DIGITAL ECONOMY OUTLOOK 2020 © OECD 2020
2. POLICY TRENDS 2. POLICY TRENDS
speeds by 2021. By 2020, the United States aims to have broadband of 100 Mbps or more for 80% of households, while Norway has a similar goal for 90% of households.
A growing number of OECD countries have changed their legal frameworks to include broadband as part of their universal service framework. Switzerland was the first to do so, followed by Australia, Belgium, Canada, Finland, Spain and Sweden, among many others. In Korea, fixed broadband was designated as universal service in 2020.
Several policies have been introduced to ease market entry and reduce switching costs for the IoT. For example, Italy has allowed the use of extraterritorial numbering resources for the IoT, thus creating a clear regulatory framework for SIMs used in connected vehicles. EU member states may allow the use of certain national numbering resources, in particular certain non-geographic numbers, in an extraterritorial manner. This could create a new range for machine-to-machine (M2M) communication.
Some countries have reviewed their legislative frameworks around network neutrality in recent years. The European Union reviewed its legislation on Open Internet Access (2015/2120) and published a report on its implementation in April 2019. The Body of European Regulators for Electronic Communications began reviewing its Guidelines on the Implementation by National Regulators of European Net Neutrality Rules. Japan initiated discussions on network neutrality; the Study Group on Network Neutrality organised by the Ministry of Internal Affairs and Communications issued a report in 2019. In the United States, the FCC enacted its 2017 “Restoring Internet Freedom Order” to pursue a lighter-touch regulatory approach. Among other changes, the order classified broadband Internet access service as an information service, eliminated certain reporting requirements and authorised the Federal Trade Commission to oversee the privacy practices of Internet service providers.
Governments are seeking ways to foster IPv6 adoption. To that end, they are establishing promotion programmes to upgrade Internet services, adapting government purchasing and/or by promoting multi-stakeholder task forces to foster IPv6 deployment. For example, in 2019 Sweden implemented the recommendation by the OECD Review on Digital Transformation and provided the communication regulator with funds to promote IPv6 deployment.
Digital uptake and use
Households and individualsOf the 30 countries responding to the 2019 OECD Digital Economy Policy Questionnaire on the uptake and usage of digital technologies, all but 4 – Italy, Germany, the Netherlands and Spain – reported explicit policies to promote the use of digital technologies in households and by individuals (Chapter 4).
Policy objectives across countries vary greatly. They include addressing the digital divide; raising digital skills and literacy; improving connectivity; enhancing cybersecurity and trust; and increasing e-government efficiency.
Often these policies target specific population groups. Common target groups include children (Czech Republic, Japan, Portugal), students (Colombia, Singapore), seniors (Australia, Austria, Japan), low-income households (Costa Rica, Singapore) or people with disabilities (Costa Rica, Israel, Japan).
Non-financial support is the most widespread instrument to promote use of digital technologies by households and individuals. In particular, official portals or hubs provide a virtual space for sharing experiences (Japan, Korea), running awareness campaigns (Colombia, Denmark, Mexico, Portugal) and undertaking training activities (Singapore). Cybersecurity, trust and consumer protection are a common focus.
Direct financial support may go through lead agencies managing programme implementation or take the form of loans, grants, vouchers or specific training. Programmes benefiting from this kind of support aim to reduce the digital divide in its many dimensions. This includes increasing network speed and availability (Australia, Colombia, Estonia, Finland, Singapore, Sweden, United States) and increasing digital skills (Portugal, the Russian Federation). In some countries (Costa Rica, Estonia, United States), such programmes also benefit from indirect financial support.
41OECD DIGITAL ECONOMY OUTLOOK 2020 © OECD 2020
2. POLICY TRENDS 2. POLICY TRENDS

Indirect financial support is often provided in the field of education. This includes improving the educational system (Czech Republic, Portugal), promoting technological development (Russian Federation) and improving digital skills of students and teachers (Denmark). In Austria, fees for government services at the federal level are reduced when the application for such services is submitted by electronic means.
Regulations and statutory guidelines are employed to lay legal foundations in a wide range of areas, mainly in relation to consumer protection (Mexico, Turkey); personal data (Portugal, Singapore); digital security (Austria, Denmark); e-government (Australia, Japan) and e-health (Latvia).
BusinessesOf the 30 countries responding to the Digital Economy Policy Questionnaire, all but 3 – Italy, the United Kingdom and the United States – reported having policies to promote the use of digital technologies by businesses.
Policy objectives vary greatly. They range from fostering uptake of productivity-enhancing digital technologies in firms and fostering access to knowledge and skills to supporting development of innovative products and social services (e.g. e-Health).
Small and medium-sized enterprises (SMEs) are the most common target for policies aiming to increase digital skills, technology awareness and adoption, as well as for awareness campaigns about digital security and privacy.
Direct financial support measures are the most widely used. These include grants for firms’ uptake of digital technologies, such as cloud services (Korea) and big data (Portugal), digital consultancy services and digital skills (Denmark, Slovenia). While not directly aimed at digital technologies, many countries report grants or vouchers to support research and development (R&D). Germany, for example, targets big data, autonomous systems, information technology security and service platforms for this kind of direct support.
Indirect financial support takes several forms. Brazil and Japan, for example, offer tax credits or other relief for ICT investment. Other countries offer broader tax support for R&D; the Russian Federation has an explicit focus on digital technologies.
Non-financial support also takes several forms. Australia, Lithuania, Singapore and Sweden provide tailored business advice and counselling services. Turkey provides tailored advice on regulations relevant to new business models. Latvia and Norway provide training, while Portugal and Slovenia support the sharing of experience and mentorship.
Regulations and statutory guidelines lay legal foundations in a wide range of areas. These range from cybersecurity (Czech Republic) and FinTech (Mexico) to electronic signatures (Chile) and e-invoicing for public procurement (Austria, Norway). Actions in this area also include establishing guiding principles for regulation of new business models enabled by digital technologies (Denmark).
Digital governmentOver the past decades, large-scale public sector reforms have enabled greater efficiency and effectiveness of public services through digital transformation. As part of these efforts, governments invested heavily in new practices and modernised services to better respond to citizens’ needs. Online service platforms common to several public sector organisations have been established to simplify administrative processes and improve interaction with citizens.
Most OECD countries have given responsibility for digital government strategies to the central or federal levels, according to the 2019 OECD Survey on Digital Government. Many have also established bodies dedicated to digital government, with varying degrees of advisory and decision-making responsibilities. The mandate of these bodies is the broadest in Canada, the Czech Republic, Iceland, Israel, Korea and Luxembourg, while its scope is narrower in Belgium and Sweden.
According to the same survey, 22 OECD countries, as well as Brazil, use a standard model for ICT project management. Further, 22 have adopted a business-case approach, such as cost-benefit
42 OECD DIGITAL ECONOMY OUTLOOK 2020 © OECD 2020
2. POLICY TRENDS 2. POLICY TRENDS

and/or cost-effectiveness analysis. In addition, 24 have a specific ICT procurement strategy for the public sector, while another 10 have a whole-of-government procurement strategy that covers ICT. Only 12 of 31 OECD countries with available data have adopted all three policy levers (ICT project management, business-case approach and ICT procurement strategy) as part of their digital government strategy.
SkillsIn recent years, several countries have adapted school curricula to changing skills requirements driven by the digital transformation. In Australia, the “ICT capability development” framework aims to develop digital skills in stand-alone ICT classes, as well as across other learning areas. In Canada, several provincial governments have adopted a comprehensive approach to digital competence. In the Czech Republic, the Digital Education Strategy for 2020 aims to open education to new ways of learning through digital technologies and to improve pupils’ competences in ICTs and computational thinking. France has recently introduced a mandatory course on computational sciences and technology in secondary schools. Sweden has made changes in the curricula for the school system, aiming to strengthening digital competence, media and information literacy, as well as abilities to be source-critical.
For over a decade, countries across the OECD have been tackling the need for teachers to develop ICT skills through diverse policies. These range from developing national plans promoting this goal to introducing compulsory training, national accreditation standards or national certification for teachers. Denmark, for instance, has developed a voluntary licence that combines pedagogical knowledge of ICTs and basic ICT skills training. In Portugal, the Train the Trainers programme aims to improve teachers’ competencies, including digital skills.
Many OECD countries have established digital literacy programmes to increase digital inclusion, especially for the most vulnerable groups (Chapter 4). The Pact for Digital Competence in Austria, for example, targets young career starters; off-liners; professionals aged 45 or more; and seniors. Other examples include Colombia’s Digital Citizenship; Israel’s Senior Citizens Digital Skills Course; and Latvia’s Father’s Third Son, where libraries provide counselling on how to use e-services and navigate safely on the Internet. In Norway, the Digital Inclusion for All programme targets the elderly, women and immigrants. Portugal’s National Digital Competences Initiative e.2030 helps citizens and workers improve their digital competences. Finally, the Future Digital Inclusion Programme in the United Kingdom supports adult learning.
Programmes to upskill or reskill workers have also become common among OECD countries. These include vouchers for raising digital competences (Slovenia), Competence Centres (Germany), ICT training for SMEs (Israel), training support for employees in the ICT industry (Latvia), business counselling for SMEs (Lithuania), programmes to reskill and upskill workers (Portugal) and free online courses (United Kingdom).
Data access, sharing and re-useAll OECD countries and most partner economies have one or more initiatives around data access, sharing and re-use (Chapter 5). Most focus on access to and sharing of public sector data. For example, France, Japan, the United Kingdom and the United States aim to enable open access to government data. Many countries have public sector information initiatives, while others have open data initiatives or both. The latter is the case for EU member states, following Directive (EU) 2019/1024 of 20 June 2019 on Open Data and the Re-Use of Public Sector Information. A general trend towards the establishment of open data portals can be observed across the OECD.
Governments’ commitment to become more data-driven and to leverage technological developments, e.g. big data and AI, have led them to facilitate data sharing within the public sector. Australia’s data sharing and release legislation is a prominent example. Other examples include Estonia’s Information Sharing Data Sheet (X-Road) and the United Kingdom’s Government Data Ethics Framework.
Opening geospatial data and transportation data ranked high on the agenda of public sector data initiatives. Examples include the Geocoded National Address File in Australia. In Switzerland, the Federal Office of Transport wants to facilitate the exchange of data between public and private actors active in the Swiss public transport system.
43OECD DIGITAL ECONOMY OUTLOOK 2020 © OECD 2020
2. POLICY TRENDS 2. POLICY TRENDS
Few countries facilitate data sharing within the private sector, although they recognise this as an emerging challenge. Most initiatives are voluntary, the most common being contract guidelines and data partnerships, including public-private partnerships. Examples of government initiatives based on contract guidelines include the Contract Guidance on Utilisation of AI and Data in Japan and the Privacy and Security Principles for Farm Data in the United States. The Industrial Data Space in Germany, the Data Integration Partnership for Australia, Japan’s Certification System for data-sharing platforms, Singapore’s Trusted Data Sharing Framework and Digital Hub Denmark are examples of data partnerships.
Where data sharing is mandated, regimes are commonly restricted to trusted users. Australia, for instance, is considering a framework to identify “national interest datasets” or “designated datasets”. In France, the Law for a Digital Republic (Loi pour une République numérique) defines criteria for “data of general interest” (Government of France, 2016[12]). The European Commission is examining data sharing between the private and public sector under the notion of “private-sector data for public interest purposes”. In some cases, access to data is based on competition and (system) efficiency considerations. This mainly touches network industries such as telecommunications, energy and transport. Finland’s Act on Transport Services is an example.
Data portability is often regarded as a promising means for promoting cross-sectoral re-use of data. At the same time, it could strengthen the control rights of individuals over their personal data and of businesses, particularly SMEs, over their business data. Prominent data portability initiatives include My Data in the United States, Midata in the United Kingdom, the European Union’s Right to Data Portability set by the General Data Protection Regulation (GDPR) and Australia’s recent proposal for a Consumer Data Right.
Some governments established dedicated initiatives to support the development of data-related skills and infrastructures in the public sector. Examples include the Digital Skills Partnership in the United Kingdom, Estonia’s Digital Solutions seminars, the data analytic competitions in China and Slovenia’s education and training programmes for civil servants.
Some governments have established data analytic and innovation centres to support their government agencies in the sharing and re-use of data. Others have created and strengthened partnerships with such centres. Ireland established the Insight Centre for Data Analytics, considered one of Europe’s largest data analytics research organisations. Australia’s data innovation centre, Data61, has partnered with government agencies to build new technologies that make high-value government data available to more people, while preserving privacy. The European Commission is developing a support centre for data sharing under the Connecting Europe Facility Programme.
Several countries have also supported innovation and R&D in data analytics and related technologies. The European Commission, for example, has a number of funding mechanisms for data-related innovation. These are in relation to data innovation incubators, pan-European aggregators of public sector information (European Data Portal) and privacy-enhancing technologies.
Governments have turned to a wide array of digital technologies and advanced analytics to collect, analyse and share data for frontline response to the COVID-19 crisis. For example, Deutsche Telekom has provided anonymised “movement flows” data of its users to the Robert Koch Institute, a research centre and government agency responsible for disease control and prevention in Germany. Vodafone Group’s Five Point Plan to address COVID-19 includes providing large anonymised data sets to help authorities better understand population movements. The European Commission has liaised with eight European telecommunications operators to obtain anonymised aggregate mobile location data in order to co-ordinate measures tracking the spread of COVID-19.
COVID-19 response applications (apps) for location tracking have also emerged. Singapore, for example, initiated contact tracing for all confirmed and suspected cases since the early days of the outbreak. In addition, the app can share people’s health information between hospitals, the government and third parties. Such apps may raise considerable privacy issues, particularly if users do not give informed, explicit consent for this data sharing but even when they do.
44 OECD DIGITAL ECONOMY OUTLOOK 2020 © OECD 2020
2. POLICY TRENDS 2. POLICY TRENDS

PrivacyPrivacy frameworks are particularly important during crisis periods such as the COVID-19 pandemic. Such frameworks facilitate data sharing when in the interests of national security and public security, including public health and welfare. Recent OECD work suggests that despite these frameworks, few countries have policies to facilitate data sharing within the private sector. Even fewer have governance frameworks to support extraordinary data collection and sharing in ways that are fast, secure, trustworthy, scalable and in compliance with relevant privacy and data protection regulations.
As a result, many countries have recently sought advice from privacy enforcement authorities (PEAs), private-sector law firms, civil society, academics and other actors. They wish for assurance that their actions are necessary and proportionate, and that they fully understand their potential implications. Many governments passed or have pending legislation that restricts data collection based on population, time period and purpose. PEAs across many OECD countries have generally endorsed a pragmatic and contextual approach. To that end, they have enforced laws with discretion to ensure that respect for fundamental data protection and privacy principles do not stand in the way of necessary and proportionate frontline responses to COVID-19. Additionally, PEAs in many jurisdictions are issuing guidance on the collection, processing and sharing of personal data for COVID-19 contact tracing and other measures. Much of this guidance relates to how privacy-by-design features can be incorporated into “track and trace” applications so as to ensure the protection of personal data collected.
The past two years have seen a number of significant regulatory developments worldwide (Chapter 6). In particular, the European Union’s GDPR on 25 May 2018 introduced new rules governing the global free flow of personal data regarding data subjects in the European Union.
Further, the Council of Europe has recently extensively revised its 1985 Convention for the Protection of Individuals with regard to Automatic Processing of Personal Data (Convention 108). These revisions aim to ensure its applicability to new ICTs and to strengthen implementation. The modernised instrument, Convention 108+, was to enter into force in October 2023.
The OECD is also monitoring the implementation of the 2013 revisions to the 1980 OECD Privacy Guidelines (OECD, 2013[15]). This exercise planned to identify gaps and suggest possible next steps to ensure the guidelines remain relevant.
There has been an increase in various trade agreements and other frameworks that seek to promote trust in transborder flows of personal data. These instruments sit alongside others that continue to shape privacy and global data transfers, e.g. EU-US Privacy Shield Framework or the Asia-Pacific Economic Co-operation (APEC) Privacy Framework.
At a national level, an increasing number of countries around the world, including OECD countries, are putting in place modern data protection frameworks and policies. These combine openness for international data flows with the highest level of privacy and data protection for individuals. Many governments have been introducing and modifying data-related policies to adapt them to the digital age. Such policies also place conditions on the transfer of data across borders or require that data be stored locally.
Understanding how privacy laws apply to emerging technologies, such as AI, and their impact on consumers, remains a challenge. Countries are developing dedicated regulation and guidance to deal with the privacy challenges from emerging technologies, such as AI. Countries are also employing, developing or considering measures for regulatory innovation in the context of emerging technologies, most commonly regulatory sandboxes and experimentation. Other measures reported include development of international standards for specific technologies (such as blockchain), a Digital Charter, a privacy research grants programme and an AI auditing framework.
Some privacy developments are particularly notable. The California Consumer Privacy Act, enacted in 2018, creates new consumer rights regarding the collection, processing, retention and sharing of personal data. Brazil also enacted a General Data Protection Law in 2018. In India, long-awaited national data protection legislation was before parliament.
45OECD DIGITAL ECONOMY OUTLOOK 2020 © OECD 2020
2. POLICY TRENDS 2. POLICY TRENDS
The 2013 revision of the OECD Privacy Guidelines (OECD, 2013[15]) calls on governments to “develop national privacy strategies that reflect a co-ordinated approach across governmental bodies.” However, just under half of the 29 respondents to the 2019 OECD Privacy Guidelines Questionnaire have a national privacy strategy or whole-of-government approach to privacy.
In addition to regulatory reforms and innovation, countries are addressing challenges posed by emerging technologies through policy responses. Primarily they develop new data governance frameworks but they also create new bodies or institutions and guidance on specific technologies. For example, the United Kingdom recently established a Centre for Data Ethics and Innovation to identify ethical issues raised by emerging technologies, agree on best practices around data use and develop potential new regulations to “build trust and enable innovation in data-driven technologies”.
Countries today are striving to provide additional and complementary policy responses to enhance the protection of children’s privacy. At the domestic level, almost all respondents to a 2017 OECD survey reported their privacy laws include specific provisions regarding the protection of children. The GDPR recognises that children merit special protection in regard to their personal data, particularly in relation to their marketing and collection. However, OECD countries differ in approaches to notice and consent for the collection, processing and sharing of children’s personal data.
As more privacy and data protection frameworks are enacted, attention has shifted increasingly towards how to enhance compliance with those frameworks, including by greater enforcement. In particular, governments are investing in policy measures to enhance awareness of requirements in privacy and data protection frameworks. Governments also emphasise promoting data controllers’ accountability, along with engaging in international enforcement co-operation. Some key mechanisms at the multilateral level include the Global Privacy Enforcement Network, the International Conference of Data Protection and Privacy Commissioners (now the Global Privacy Assembly) Enforcement Cooperation Arrangement and the APEC Privacy Cross-border Privacy Enforcement Arrangement.
Digital securitySeveral OECD countries have national digital security strategies to support economic and social prosperity and/or foster trust and confidence in the digital environment (Chapter 7). Capacity building, protection of critical infrastructures, information sharing and international co-operation are the main pillars of these strategies.
Government agencies in charge of digital security across the OECD have responded to the COVID-19 crisis in several key ways. They have raised awareness, monitored the threat landscape, provided assistance where appropriate, and co-operated with all relevant stakeholders, including at the international level. For example, the United States’ Cyber and Infrastructure Security Agency set up a section on its website dedicated to security risks related to COVID-19 (www.cisa.gov/coronavirus). The European Commission, the European Union Agency for Cybersecurity, the Computer Emergency Response Team for the EU Institutions and Europol co-operated to track malicious activities related to COVID-19 and alert their respective communities. The Canadian Centre for Cybersecurity recommended that Canadian health organisations involved in the national response to the pandemic remain vigilant and ensure use of digital security best practices. The Czech National Office for Cyber and Information Security ordered selected health care entities to enhance the security of key ICT systems; it offered consultations and support to these entities.
Co-ordination mechanisms tend to differ among countries. In Denmark, for instance, the Agency for Digitisation (Ministry of Finance) and the Centre for Cyber Security (Ministry of Defence) share responsibility. In the Netherlands, the Ministry of Justice is in charge of overall co-ordination. In some countries, such as Latvia, Spain or the United States, a national council gathers representatives of all ministries and agencies involved.
The nature and the scope of multi-stakeholder co-operation also varies greatly. Some governments co-operate on an ad-hoc basis with specific trade associations, while others involve stakeholders more broadly from the design phase. As an example of the latter, Brazil set up three working groups on, respectively, digital governance, prevention and mitigation of threats, and protection of government and critical infrastructures.
46 OECD DIGITAL ECONOMY OUTLOOK 2020 © OECD 2020
2. POLICY TRENDS 2. POLICY TRENDS
Beyond national strategies and policies, governments across the OECD are facilitating new forms of multi-stakeholder and international partnerships to enhance digital security. Examples include the Paris Call for Trust and Security in Cyberspace, the Charter of Trust and the Cybersecurity Tech Accord.
Digital security innovation is an emerging trend in OECD countries, which have established open innovation centres to encourage its development. Examples include Israel’s CyberSpark campus, the Australian Cyber Security Growth Network, the London Office for Rapid Cybersecurity Advancement in the United Kingdom, Singapore’s Innovation Cybersecurity Ecosystem, the Agency for Innovation in Cyber Security in Germany, the Cyber Campus France and the European Cyber Security Organisation.
Governments support educational programmes to overcome the shortage of digital security professionals. In the United States, for example, the National Institute of Standards and Technology, within the Department of Commerce, has launched the National Initiative for Cybersecurity Education. Canada promotes talent development by teaching programming and digital skills to children from a young age. Governments can also promote sustainable interlinkages between academia, industry, government itself, entrepreneurs and financial actors. For instance, the Global Ecosystem of Ecosystems Partnership in Innovation and Cybersecurity co-ordinates co-operation between digital security ecosystems across the world.
Some OECD countries have launched voluntary labelling schemes to improve product transparency and reduce vulnerability. For instance, the Finnish government is partnering with industry to launch an IoT security label. The governments of Japan and Germany plan their own labelling schemes for IoT products and routers, respectively.
Facilitating multi-stakeholder partnerships is an additional tool for governments. For instance, the Dutch government is working with stakeholders to monitor and enhance the digital security of connected devices. In the United States, the National Telecommunications and Information Agency is encouraging developers to provide a “software bill of materials”. Other governments in the OECD have funded and/or facilitated joint work on botnets, including “botfrei” in Germany and the National Operation Towards IoT Clean Environment in Japan.
Some governments are also mandating basic security features for all IoT products through regulations. In the United Kingdom, for instance, the government plans to mandate manufacturers to implement the key principles of its guidelines for IoT security. In Japan, the regulator has also imposed requirements on IoT products.
Several industry players have established coalitions to enhance digital security of their products. The Charter of Trust, for example, gathers companies along the value chain to create a reliable foundation for trust in the digital environment. Through the Cybersecurity Tech Accord, 120 ICT sector companies partner on initiatives that improve the security, stability and resilience of cyberspace. Meanwhile, France launched the Paris Call for Trust and Security in Cyberspace to strengthen the security of digital processes, products and services, throughout their lifecycle and supply chain.
Consumer policyGovernments need to consider how to adapt, change and implement consumer policy in this age of rapid technological progress (Chapter 8). While consumer policy is generally broad enough to cover new technologies and business models, governments should ensure there are no gaps that leave consumers exposed. Governments have a key role in ensuring that new technologies are used in a human-centric, ethical and sustainable way to maintain consumer trust.
As another key challenge, governments must have the technical expertise to understand these emerging issues to engage in effective policy making and enforcement. Many risks span several areas, including data protection, privacy, consumer protection, competition and security. Therefore, consumer authorities need to co-operate and co-ordinate with counterparts in other relevant disciplines. Furthermore, the global nature of the digital transformation implies that governments increasingly need to co-operate across borders. They should enhance their authority to do so, including by implementing the co-operation provisions of the 2016 OECD Recommendation of the Council on Consumer Protection in E-commerce (OECD, 2016[13]) and the 2003 OECD Guidelines for Protecting Consumers from Fraudulent and Deceptive Commercial Practices Across Borders (OECD, 2003[16]).
47OECD DIGITAL ECONOMY OUTLOOK 2020 © OECD 2020
2. POLICY TRENDS 2. POLICY TRENDS

Consumer policy should consider the vulnerabilities of different groups of consumers to target protections and awareness accordingly. In this way, they can ensure the benefits of new technologies are shared across society. For example, some consumer groups, such as the elderly, may be more prone to online scams. Moreover, data protection and privacy concerns may be more sensitive when it comes to IoT products used by, and aimed at, children who may be less aware of the risks. In addition, the COVID-19 crisis shows that policy makers should also consider whether large-scale events, such as pandemics or natural disasters, might render wider groups of consumers vulnerable to online commercial exploitation. For example, the pandemic has made many mainstream groups of consumers more vulnerable to exploitative practices on line due to job and financial losses, as well as to fear and anxiety regarding the virus. Such practices include price gouging of essential or in-demand products.
It is important to encourage businesses and industry associations, as well as consumer and other civil society organisations, to provide input into policies regarding the incorporation of new technologies in consumer products. This will help ensure that new products benefit consumers without harming them economically, compromising the privacy or security of their personal information, or otherwise putting them at risk.
The digitalisation of science and innovation policyAs well as profoundly affecting science, research and innovation, digitalisation is also beginning to impact how policy is made in these areas (Chapter 9).
Digital Science and Innovation Policy (DSIP) initiatives are underway in several countries. They experiment with semantic technologies to link datasets; with AI to support big data analytics; and with interactive visualisation and dashboards to promote data use in the policy process.
Data linking and synchronisation across digital systems can help optimise administrative workflows to reduce reporting burdens. They can also support performance monitoring and management. Finally, they can provide anticipatory intelligence to identify the need for innovation policy.
Realising the potential of DSIP involves overcoming several possible barriers, including data quality, interoperability, sustainable funding and data protection regulations. Policy makers wishing to promote DSIP face further systemic challenges. These include overseeing fragmented DSIP efforts and multiple, often weakly co-ordinated, initiatives; ensuring responsible use of data generated for other purposes; and balancing the benefits and risks of private-sector involvement in providing DSIP data, components and services.
Digital tools may help provide solutions for data interoperability. Harvesting datasets from all the public and private actors involved in research and innovation activities requires common data formats and other interoperability enablers. These include application programming interfaces (APIs), ontologies, protocols and unique persistent and pervasive identifiers (UPPIs) for research, development and innovation (R&DI) actors.
Some UPPIs exist as an integral part of, or support for, commercial products such as publication/citation databases, research information systems and supply-chain-management services. Others exist solely to provide a system of identifiers for wide adoption and use. Open Researcher and Contributor ID, for example, aims to resolve name ambiguity in scientific research. It develops a digital register of unique identifiers and basic associated identity information for individual researchers.
As a UPPI system gains traction there may be a “network effect”, whereby each additional registrant increases the value of the system to all users. Eventually the UPPI system may become a generally expected way for entities to unambiguously identify each other. This results in strong incentives for those not yet registered to join.
Besides UPPIs, APIs have become a standard for enabling M2M interactions and data exchanges. Within a framework of digital government initiatives, several countries have started to proliferate APIs across the landscape of government websites and databases, improving data re-use. Improvements in access to administrative datasets have positive impacts on the functionality and reliability of the results of analyses delivered by DSIP systems.
48 OECD DIGITAL ECONOMY OUTLOOK 2020 © OECD 2020
2. POLICY TRENDS 2. POLICY TRENDS

Aside from government agencies and other public funders, R&DI-performing organisations store a significant share of research and innovation data. However, these often have different formats and structures, even for the same type of information. The Common European Research Information Format and metadata formats by Consortia Advancing Standards in Research Administration Information were originally designed to serve the needs of higher education institutions in data management. Some DSIP systems use them to harvest curated data from research institutes and directly apply them in analysis.
Interoperability remains a major hurdle despite the recent proliferation of identifiers, standards and protocols. Policy makers may be able to influence the development of international UPPI systems. They could focus on target populations, information captured, compatibility with statistical systems, governance systems and especially adoption both by entities and potential users. International efforts related to data documentation and the development of metadata standards could be consolidated to improve data interoperability.
Work in the digital eraIn recent years, many countries have experienced an increase in non-standard forms of work, an umbrella definition for arrangements such as temporary jobs, part-time contracts and self-employment. Although some of these forms are not new, digitalisation, together with globalisation and changes in regulations/policies, have contributed to their diffusion. Digital technologies have also enabled new forms of work, such as jobs mediated by platforms. The COVID-19 pandemic has most severely hit non-standard workers, as they are more exposed to health risks and often receive less government support than employees (Chapter 10).
Several countries, including the United Kingdom, the Netherlands and Poland, are discussing the introduction of minimum rates for some groups of self-employed workers. Subnational governments have also set minimum wages for platform workers. New York City, for example, has set a minimum wage for Uber and Lyft drivers. Platforms have also voluntarily set minimum wages (e.g. Topdesigner in the Czech Republic; Adtriboo in Spain; Upwork and Prolific in the United Kingdom; and Favor in the United States).
As an alternative or complement to minimum wage, countries like Canada, Denmark, France, Germany and Sweden have extended collective bargaining rights to certain groups of self-employed workers. In addition to worker-led initiatives, some platforms have also started addressing platform workers’ limited access to representation and social dialogue. These actions are mostly in response to government threats to reclassify their activities.
Governments have taken steps to regulate atypical contracts, such as “zero-hours” contracts, to reduce unpredictability in working hours and income. Finland, for example, restricts use of this type of contract to situations where employers truly have a variable need for labour. Along with Norway and Ireland, Finland also requires employers to provide information (such as the minimum number of hours) up-front or in the employment contract. Those three countries, alongside the Netherlands and the state of Oregon in the United States, require advance notice of work schedules. Meanwhile, Australia and the United Kingdom give employees the right to request a more predictable contract after a certain period.
Countries have also taken steps to extend occupational and safety health protection to non-employees. Australia, Ireland, Lithuania, Turkey and the United Kingdom have decoupled such protections from the employment relationship. Australia, Bulgaria, Canada and Poland are connecting related regulation to the workplace rather than to any specific contract type. Korea had plans to extend the Occupational Safety and Health Act to “all working people”. Meanwhile, France’s new labour law foresees that platforms must reimburse workers who voluntarily insure themselves against occupational risks or illness.
Denmark and France have also introduced significant reforms to their social protection system to establish portability of entitlements for individuals moving between or combining employee status and self-employment. In November 2019, the European Union adopted a Council Recommendation on Access to Social Protection for Workers and the Self-Employed (European Commission, 2019[17]). This encouraged member states to allow non-standard workers and self-employed to adhere to social security schemes, while increasing adequacy of these schemes to non-standard work.
49OECD DIGITAL ECONOMY OUTLOOK 2020 © OECD 2020
2. POLICY TRENDS 2. POLICY TRENDS
Some OECD countries, including France and Ireland, have extended available financial incentives for training to self-employed, including own-account workers. Incentives include both tax deductions and subsidies. Other approaches, such as in Korea, Austria and Belgium, make financial support for training conditional on the payment of social security contributions or enrolment in an employment insurance plan. Some countries, including Austria, Finland and Luxembourg, provide wage replacements to self-employed enrolled in training. France’s labour law requires platforms to pay employers’ contributions for training, cover expenses for the recognition of prior learning and provide a training indemnity for all gig workers above a set income threshold.
To deal with increasingly non-linear career paths, several OECD countries have established some individual learning schemes. In these cases, the rights to training are attached to individuals rather than to a specific employer or employment status. Some countries, including Belgium (Flanders), Germany and Latvia, have also extended skills advice and guidance services provided by public employment services to own-account workers.
Artificial intelligenceCanada was the first country to launch a national AI strategy in 2017. By April 2020, over 60 countries had devised a national AI strategy and policies, while others were developing policies. Priority areas include AI R&D and financing, industry, societal challenges, education and employment, regulation and international co-operation. At the same time, countries are addressing AI-related risks and ethical challenges. Some have created oversight bodies and issued ethical guidance. Several are reviewing and adapting the applicable policy and regulatory frameworks (Chapter 11).
During the COVID-19 pandemic, governments, academia and companies have rapidly developed AI systems. These aimed to predict and monitor the spread of the disease, provide medical diagnosis, fight misinformation and undertake research on vaccines and treatments. Many countries have also deployed virtual assistants and chatbots to support health care organisations. For example, the US Center for Disease Control and Prevention and Microsoft provide a Coronavirus Self-Checker service to help users self-assess COVID-19 and suggest a course of action.
Several countries have established dedicated bodies to co-ordinate implementation of their AI strategy (Canada, Egypt, United Kingdom, United States); conduct technology foresight and impact assessment (Austria, Canada, United Kingdom, United States); or address ethical issues (Singapore, New Zealand, United Kingdom). In addition, AI observatories have been established at the regional (Quebec), national (Italy, France, Germany) and international levels (European Commission’s AI Watch, AI4EU Observatory, OECD.AI).
Building on digital government approaches, many national AI strategies and policies explicitly encourage adoption of AI in the public sector. Denmark, for example, aims for the public sector to use AI to offer world-class services for the benefits of citizens and society. Finland’s AuroraAI project aims to use AI to provide personalised, one-stop-shop and human-centric AI-driven public services. Korea’s AI service – The Work – helped 2 666 job seekers find relevant job offers that led to a job in the second quarter of 2019. The EU Coordinated Plan on AI aims to “make public administrations in Europe frontrunners in the use of AI”.
Most countries have introduced guidelines for trustworthy AI, largely aligned with the OECD Recommendation of the Council on Artificial Intelligence (OECD AI Principles) (OECD, 2019[14]). Examples include Australia’s AI Ethics Framework, Hungary’s AI Ethical Guidelines, Japan’s AI R&D Guidelines and AI Utilisation Guidelines, Singapore’s Model AI Governance Framework and the European Commission’s Ethical Guidelines on AI.
Several governments and intergovernmental bodies are considering or have adopted binding legislation for areas of AI applications deemed high risk. For example, Belgium has prohibited the use of lethal autonomous weapons by local armed forces. New regulations have been issued on driverless cars (Belgium, Denmark) or unmanned aircraft systems (United States). In February 2020, the European Commission issued a White Paper on Artificial Intelligence – A European approach to excellence and trust. It proposed a voluntary “quality label” for AI applications considered not to be high risk.
50 OECD DIGITAL ECONOMY OUTLOOK 2020 © OECD 2020
2. POLICY TRENDS 2. POLICY TRENDS

The International Organization for Standardization, the Institute of Electrical and Electronics Engineers and similar bodies are developing cross-sector and sector-specific AI standards. Several countries, including Australia, Canada, China, Germany, the Russian Federation and the United States, emphasise the need for common standards, including to address security issues. Others, including Denmark and Malta, plan to establish AI certification programmes.
Most countries seek to enhance national AI R&D capabilities. The United States plans to invest an additional USD 950 million in non-defence AI R&D in 2021 and the creation of national AI research institutes. Canada’s federal and provincial governments have dedicated over CAD 300 million (USD 227 million) to AI research over 2017-22, anchored in the three AI institutes of the Pan-Canadian AI Strategy. The EU Horizon 2020 programme has committed EUR 1.5 billion to AI research over two years and expects an additional EUR 20 billion in 2020 from the private sector and member states.
As part of their AI strategy, several countries have developed or are developing centralised and accessible repositories of open public data in relation to AI (Norway, Portugal, Spain, United States). Others seek to incentivise data sharing in the private sector (United Kingdom, European Union).
Countries also boost development of innovative AI research ecosystems by establishing networking and collaborative platforms. Examples include Canada’s Innovation Superclusters Initiative, Denmark’s Digital Hub for AI public-private partnerships, Finland’s AI Business programme, Hungary’s AI in practice self-service online platform and Portugal’s Digital Innovation Hubs.
Countries are introducing a wide range of policy initiatives to spur innovation and AI adoption by SMEs. Examples include the European Commission’s AI4EU project, Finland’s AI Accelerator, the SME 4.0 Excellence Centres in Germany and Korea’s AI Open Innovation Hub. Governments are also experimenting with controlled environments for the testing of AI systems, including by SMEs (Lithuania, New Zealand, United Arab Emirates, United Kingdom, United States).
Education and skills are a priority for all national AI strategies. Some initiatives pertain to formal education and training programmes on AI, including science, technology, engineering and mathematics education (Australia, Finland, United Kingdom, United States). Others provide incentives to retain and attract foreign skills and top talent in AI (Belgium, United Kingdom).
Countries are also devising vocational training and lifelong learning programmes to help citizens keep up with technological and societal changes. As an example, Finland’s Elements of AI programme seeks to increase AI literacy across the Finnish population through a ten-hour Massive Open Online Course.
In parallel, national AI strategies are collaborating among government and business, as well as educational and non-profit communities, to develop educational programmes, tools and technologies. Examples include Korea’s Smart Training Education Platform and Germany’s Learning Systems Platform (Plattform Lernende Systeme).
Some countries, including, France, the Czech Republic, Germany and Poland, have established dedicated labour market observatories to better understand the impact of AI on jobs.
International co-operation for AI is taking place in fora including the OECD, the Group of Seven, the Group of Twenty, the European Union, Council of Europe and the United Nations Educational, Scientific and Cultural Organization. Cross-border research on AI is also a priority. For example, the French National Research Agency together with the German Research Foundation and the Japan Science and Technology Agency have called for trilateral French-Japanese-German collaborative research projects on AI.
Some countries (Canada, Italy, France, Germany, United Kingdom, United States) have begun policy intelligence activities to evaluate implementation of their national AI strategies. At the European level, AI Watch is collecting indicators to monitor investments in AI. In February 2020, the OECD launched the AI Policy Observatory (OECD.AI),6 a platform for policy makers to monitor developments in the AI policy landscape. The OECD also hosts the new Global Partnership on AI (GPAI), a coalition launched in June 2020 to ensure AI is used responsibly, respecting human rights and democratic values. Its founding members are Australia, Canada, the European Union, France, Germany, India, Italy, Japan, Korea, Mexico, New Zealand, Singapore, Slovenia, the United Kingdom and the United States.
51OECD DIGITAL ECONOMY OUTLOOK 2020 © OECD 2020
2. POLICY TRENDS 2. POLICY TRENDS
The GPAI will bring together experts from industry, government, civil society and academia to conduct research and pilot projects on AI. It aims to bridge the gap between theory and practice on AI policy. For example, it could look at how AI could help societies respond to and recover from the COVID-19 crisis.
Distributed ledger technologies Governments are increasingly interested about the effects of blockchain and other distributed ledger technologies (DLTs) on economies and societies, as well as on their use as a policy tool. Several countries have already issued overarching blockchain strategies, including Australia, China, Germany and India. Others, including France and Italy, are developing them (Chapter 11).
Blockchain and other distributed technologies pose important challenges to traditional policy and regulatory frameworks and governments’ ability to control risks for end-users and provide certainty. These challenges relate particularly to their potential for highly distributed and completely decentralised governance, as well as ease of operation across borders. At the same time, evidence from several OECD projects shows that over-regulation could suffocate innovation and result in a loss of competitiveness.
In 2018, OECD countries agreed to establish the Global Blockchain Policy Centre. This move responded to growing international interest in blockchain, as well as the OECD’s own research and analysis. The Centre supports governments to better understand blockchain technology, address the challenges raised by DLTs and their applications, seize opportunities to achieve policy objectives and deliver more effective government services.
Quantum computingSeveral countries have formulated a national agenda for the development of quantum computing (Chapter 11).
The United States is a world leader in quantum computing research. It has billions of dollars in funding and around 50 companies and start-ups engaged in quantum technology and services. Funding is aimed at practical and commercial purposes, as well as fundamental scientific research. Europe has a long academic tradition of quantum mechanics research. It has received funding from the European Commission since 1998. In 2018, the European Union established the Quantum Technology Flagship Research Initiative to develop a solid industrial base to exploit its scientific leadership. The initiative has an expected budget of EUR 1 billion over ten years. This complements the spending of individual countries and stimulates international collaboration. It focuses on applications, as well as the basic science behind the technologies.
While China is lagging behind on the development of universal quantum computers, its Quantum Experiments at Space Scale project is on the forefront of space-based quantum communication and cryptography. In 2016, the Chinese Academy of Sciences (CAS) launched the first “quantum satellite”. This satellite emits signals to different receiving stations in the world to establish a shared random secret key. Initial experiments within China were soon followed by intercontinental quantum cryptography between China and five ground stations in Europe. The latter were supervised by a team from the University of Vienna and the Austrian Academy of Sciences.
China is also trying to catch up on universal quantum computing. In 2015, CAS and Alibaba Cloud established the Alibaba Quantum Laboratory, the first quantum computing laboratory in Asia. In 2018, they launched the first free public quantum computing service, accessible through the cloud. However, their processor has only a fraction of the computational power of rival services by Google and IBM. Alibaba’s competitor Baidu reportedly invested USD 15 billion in 2018 in its own institute for quantum computing.
In addition to the European Union, China and the United States, other countries are pursuing quantum technology. Japan, Korea, Israel, the Russian Federation and India have formulated a national agenda for the development of quantum computing. Furthermore, India has announced investment in quantum computing to maintain its technological edge and attract further investments. Israel plans to invest in applications of quantum technology and peripheral hardware.
52 OECD DIGITAL ECONOMY OUTLOOK 2020 © OECD 2020
2. POLICY TRENDS 2. POLICY TRENDS

On top of collaborations within the scientific community, quantum computing strategies often involve close ties with industrial partners. In Canada, through the Quantum Alliance, the University of Waterloo and industry partners exchange research ideas and collectively develop quantum technology via focused workshops. In the United Kingdom, the Quantum Technology Innovation Centre at the University of Bristol is a dedicated open-access innovation facility. Businesses can access “pay-as-you-go” incubator labs, office space and state-of-the-art equipment, while being supported by experts in a range of business, technology and manufacturing areas.
Besides national initiatives, international collaborations are sought as well. Various governments worldwide have entered a partnership with IBM, which installed their machine on university campuses. Through this initiative, governments hope to foster quantum computing talent worldwide by providing access to the newest quantum technology.
Cryptographic algorithms are essential in e-commerce, mobile and online communication, online banking and cloud computing. Many methods for cryptography that are effective today may be easy to break once large quantum computers are developed. In response, the European Union started PQCRYPTO, a project that develops post-quantum cryptographic techniques. The US National Security Agency created the National Institute of Standards and Technology in 2016 to develop encryption schemes that could withstand a quantum assault.
53OECD DIGITAL ECONOMY OUTLOOK 2020 © OECD 2020
2. POLICY TRENDS 2. POLICY TRENDS

References
European Commission (2019), Council Recommendation on Access to Social Protection for Workers and the Self-Employed, 2019/C 387/01, ST/12753/2019/INIT, Brussels, https://eur-lex.europa.eu/legal-content/EN/TXT/?uri=uriserv:OJ.C_.2019.387.01.0001.01.ENG&toc=OJ:C:2019:387:TOC.
[17]
European Commission (2016), “European Union eGovernment Action Plan”, webpage, https://ec.europa.eu/digital-single-market/en/egovernment-action-plan-digitising-european-industry (accessed on 24 March 2020).
[4]
European Commission (2015), “A digital single market strategy for Europe”, Communication from the Commission to the European Parliament, the Council, the European Economic and Social Committee and the Committee of the Regions, COM(2015), 232, Final, European Commission, Brussels, https://eur-lex.europa.eu/legal-content/EN/TXT/PDF/?uri=CELEX:52015DC0192&from=EN.
[2]
European Commission (2010), “A digital agenda for Europe”, Communication from the Commission to the European Parliament, the Council, the European Economic and Social Committee and the Committee of the Regions, COM(2010), 245, Final, European Commission, Brussels, https://eur-lex.europa.eu/legal-content/EN/TXT/PDF/?uri=CELEX:52010DC0245&from=en.
[1]
European Commission (2010), Europe 2020: A Strategy for Smart, Sustainable and Inclusive Growth, European Commission, Brussels, https://ec.europa.eu/eu2020/pdf/COMPLET%20EN%20BARROSO%20%20%20007%20-%20Europe%202020%20- %20EN%20version.pdf.
[3]
Government of France (2016), Loi pour une République numérique, Paris, http://www.senat.fr/leg/pjl15-744.html. [12]
Informatics and Information Security Research Center (2016), “2016-2019 National e-government strategy and action plan (Turkey)”, webpage, https://bilgem.tubitak.gov.tr/en/urunler/2016-2019-national-e-government-strategy-and-action-plan (accessed on 2020 March 24).
[6]
MCTIC (2018), Digital Transformation Strategy, Ministry of Science, Technology, Innovation and Communications, Brasilia, http://www.mctic.gov.br/mctic/export/sites/institucional/sessaoPublica/arquivos/digitalstrategy.pdf.
[5]
Ministry of Finance and Economic Affairs (2019), Icelandic Financial Plan for the Years 2019-2023, Ministry of Finance and Economic Affairs, Reykjavík.
[11]
OECD (2020), “Going Digital integrated policy framework”, OECD Digital Economy Papers, No. 292, OECD Publishing, Paris, https://dx.doi.org/10.1787/dc930adc-en.
[7]
OECD (2019), Going Digital: Shaping Policies, Improving Lives, OECD Publishing, Paris, https://dx.doi.org/10.1787/9789264312012-en. [9]
OECD (2019), Recommendation of the Council on Artificial Intelligence, OECD, Paris, https://legalinstruments.oecd.org/api/print?ids=648&lang=en.
[14]
OECD (2019), “Using digital technologies to improve the design and enforcement of public policies”, OECD Digital Economy Papers, No. 274, OECD Publishing, Paris, https://dx.doi.org/10.1787/99b9ba70-en.
[8]
OECD (2017), OECD Digital Economy Outlook 2017, OECD Publishing, Paris, https://dx.doi.org/10.1787/9789264276284-en. [10]
OECD (2016), Recommendation of the Council on Consumer Protection in E-Commerce, OECD, Paris, https://legalinstruments.oecd.org/en/instruments/OECD-LEGAL-0422.
[13]
OECD (2013), OECD Privacy Framework, OECD Publishing, Paris, https://www.oecd.org/internet/ieconomy/privacy-guidelines.htm. [15]
OECD (2003), OECD Guidelines for Protecting Consumers from Fraudulent and Deceptive Commercial Practices across Borders, OECD Publishing, Paris, https://doi.org/10.1787/9789264103573-en-fr.
[16]
Notes
1. Stakeholder groups include business, civil society, the Internet technical community and trade unions, among others.
2. OECD countries that responded to the 2019 OECD Digital Economy Policy Questionnaire on national digital strategies and policies are Australia, Austria, Belgium, Chile, Colombia, the Czech Republic, Denmark, Estonia, Finland, Germany, Greece, Hungary, Iceland, Israel, Italy, Japan, Korea, Latvia, Lithuania, Luxembourg, Mexico, the Netherlands, Norway, Poland, Portugal, Slovenia, Spain, Sweden, Switzerland, Turkey, the United Kingdom and the United States.
54 OECD DIGITAL ECONOMY OUTLOOK 2020 © OECD 2020
2. POLICY TRENDS 2. POLICY TRENDS
References and Notes
3. The OECD’s partner economies that responded to the 2019 OECD Digital Economy Policy Questionnaire on national digital strategies and policies are Brazil, Costa Rica, the Russian Federation, Singapore and Thailand.
4. The United States approaches digital policy through a portfolio strategy: it has a collection of policies, regulations and laws associated with specific issues and/or sectors that together support the evolution and progression of digital transformation. Elements include, in no particular order, policies relating to telecommunications and the Internet, digital privacy, cybersecurity, big data, smart information technology (IT) delivery, open data, IT research and development, educational technology, online education and environmental information systems. The portfolio strategy is reflected in policies at the national (federal) and subnational (state and local) levels. The United States nurtures the continued development and improvement of the technologies that underlie digital transformation economy and that contribute to advancing its priority areas.
5. The centre of government usually supports the highest level of the executive branch of government.
6. https://www.oecd.ai/.
55OECD DIGITAL ECONOMY OUTLOOK 2020 © OECD 2020
2. POLICY TRENDS 2. POLICY TRENDS
References and Notes


Chapter 3ACCESS AND CONNECTIVITY
57OECD DIGITAL ECONOMY OUTLOOK 2020 © OECD 2020
KEY FINDINGS
�� The COVID-19 pandemic has fuelled more demand for high-quality connectivity. In some cases, operators have experienced a 60% jump in Internet traffic.
�� For the first time, the share of fibre in all fixed broadband subscriptions in OECD countries rose to 27% by June 2019, up from 12% eight years earlier. In nine OECD countries, high-speed fibre makes up at least half of fixed Internet connections. Overall, fixed broadband networks more and more take on the ‘heavy lifting’ of the increasing demands on wireless networks.
�� Mobile broadband subscriptions increased in the OECD from 32 subscriptions per 100 inhabitants in 2009 to almost 113 subscriptions per 100 inhabitants by June 2019. The average mobile data usage per subscription in the OECD has quadrupled since 2014, reaching 4.6 GB in 2018. Machine-to-machine embedded mobile cellular subscriptions grew by over 21% in 2017-18. Prices for high-usage plans of mobile broadband services decreased by 59% over 2013-19. Several operators have announced the “shutting down” of legacy wireless networks (e.g. 2G/3G wireless networks).
�� Many countries in the OECD moved towards high-capacity fixed networks (Gigabit networks), and the next generation of wireless networks, i.e. 5G. As of June 2020, 22 OECD countries offered 5G commercial services in selected locations. Gigabit networks and 5G are likely to become the underlying connectivity behind the Internet of Things (IoT) and artificial intelligence.
�� Many OECD countries have published 5G national strategies. COVID-19 has further shown it will be essential to deploy more fibre deeper into networks and to gradually phase out xDSL technologies to allow for more symmetrical speeds.
�� Convergence, and the pervasiveness of bundled communication services, has largely driven market consolidation in recent years. Many proposed mergers and acquisitions have been both horizontal and vertical, increasing the complexity of analysis. Key regulatory trends include data-driven regulation, promotion of the IoT, IPv6 and developments in the area of network neutrality. New regulatory trends are emerging focusing on the role of terminal devices and their effects on open Internet access.
IntroductionThis chapter analyses recent trends in communication markets, broadband networks and the Internet of Things (IoT), which provide the foundation of connectivity within digital environments. It then discusses recent changes in communication policies and regulatory frameworks, the potential regulatory implications of the evolution of broadband networks, as well as developments in convergence with the associated effects on market structures.
Economies, governments and societies across the globe are going digital. Reliable connectivity is essential for the digital transformation and facilitates interactions between people, organisations and machines. Communication subscriptions providing such connectivity have continued to grow rapidly in recent years and bundled communication offers are becoming increasingly pervasive. The COVID-19 health emergency further fuelled demand for broadband communication services. Some operators have experienced as much as a 60% Internet traffic growth compared to before the crisis.
Fixed broadband networks increasingly take on the “heavy lifting” of the growing demands on wireless networks, as cellular Internet Protocol (IP) traffic is being offloaded into fixed networks through Wi-Fi. For the first time, the share of fibre in all fixed broadband subscriptions in OECD countries rose to 27% by June 2019, up from 12% eight years earlier. This allows for high-bandwidth online activities, such as video streaming services, multiple screens services and home-connected devices. In nine OECD countries, high-speed fibre makes up at least half of fixed Internet connections.
Mobile broadband subscriptions increased in OECD countries from 32 subscriptions per 100 inhabitants in 2009 to almost 113 subscriptions per 100 inhabitants by June 2019. The average mobile data usage per subscription in the OECD has quadrupled since 2014, reaching 4.6 GB in 2018. Machine-to-machine
58 OECD DIGITAL ECONOMY OUTLOOK 2020 © OECD 2020
3. ACCESS AND CONNECTIVITY 3. ACCESS AND CONNECTIVITY
(M2M) embedded mobile cellular subscriptions grew by over 21% in 2017-18. Prices for mobile broadband services have seen a strong decrease over 2013-19, namely in high-usage plans (i.e. 900 calls and 2 GB of data basket), with a price reduction of 59%.
As more people and things go on line, many OECD countries have witnessed an increasing trend towards high-capacity fixed networks (Gigabit networks), and the next generation of wireless networks, i.e. 5G. As of June 2020, 5G commercial services were available in selected locations of 22 OECD countries.
Gigabit networks and 5G are likely to become the underlying connectivity behind the IoT and artificial intelligence (AI). In particular, the use of connected devices in critical contexts, including in health, energy or in transport sectors, may require time-sensitive upload or download of data. This underscores the need for ultra-reliable, low-latency networks (OECD, 2018[1]). Networks will also need to become more flexible, and in this sense, 5G may allow the same network to cater to objects with diverse quality features (OECD, 2019[2]).
Regulatory measures and policies that promote access to high-speed broadband networks at affordable prices are crucial given the role of these networks for a successful and inclusive digital transformation (OECD, 2019[3]). Key issues include trends in convergence, the evolution of fixed and mobile networks, and the increased need for different stakeholders in government and industry (i.e. connectivity providers and industrial players) to work closely together. These, among other issues, are raising new challenges for policy makers in the area of communication infrastructures and services.
OECD countries committed to enhancing access to high-quality and affordable communication infrastructure and services at the Cancún Ministerial Meeting in 2016 (OECD, 2016[4]). Over the subsequent three years (i.e. 2017-20), countries worked on policies and regulation to extend access and promote deployment of the next generations of fixed and wireless networks. Those include policies to reduce broadband deployment costs, streamline rights of way, ensure efficient spectrum management and promote connectivity to backhaul and backbone facilities. Many OECD countries have also published 5G national strategies. The COVID-19 health emergency has further shown it will be essential to deploy more fibre deeper into networks and to gradually phase out xDSL technologies to allow for more symmetrical speeds.
The analysis of market structures and their effects on delivering efficient and inclusive communication services has been an additional key policy and regulatory issue. Convergence, and the pervasiveness of bundled communication services, has been a driver for market consolidation in recent years.
Many proposed mergers and acquisitions have been both horizontal and vertical, increasing the complexity of analysis. Overall, scrutiny over these mergers in OECD countries has increased. Many countries have recurred to behavioural and structural measures when approving them to safeguard competition.
Data-driven regulation is an emerging trend in the OECD to complement traditional regulatory tools. It relies on the power of disclosing information to steer communication markets in the right direction.
Further regulatory trends include the promotion of the IoT, IPv6 and developments in the area of network neutrality. Several OECD countries have adopted policies and regulatory measures aiming to harness the IoT. These include extraterritorial use of numbers and solutions to facilitate provider switching to avoid lock-in. Discussions are ongoing regarding the use of embedded SIMs.
In the area of network neutrality, in particular within the debate of zero rating, governments in the OECD area are taking a number of different approaches. Some are implementing network neutrality rules and reviewing them. Furthermore, new regulatory trends are emerging on the role of terminal devices and their effects on open Internet access.
Trends in access and connectivityCommunication revenues in the OECD area reached their peak in 2008, amounting to USD 1 472 billion. Since then, with several fluctuations inherent to the economic cycle, revenues have remained relatively high. In the past decade, revenues have averaged USD 1 330 billion, stabilising at USD 1 287 billion in 2018 (Figure 3.1). Turkey, Ireland, Canada and Mexico had the highest growth rates in revenues in the
59OECD DIGITAL ECONOMY OUTLOOK 2020 © OECD 2020
3. ACCESS AND CONNECTIVITY 3. ACCESS AND CONNECTIVITY
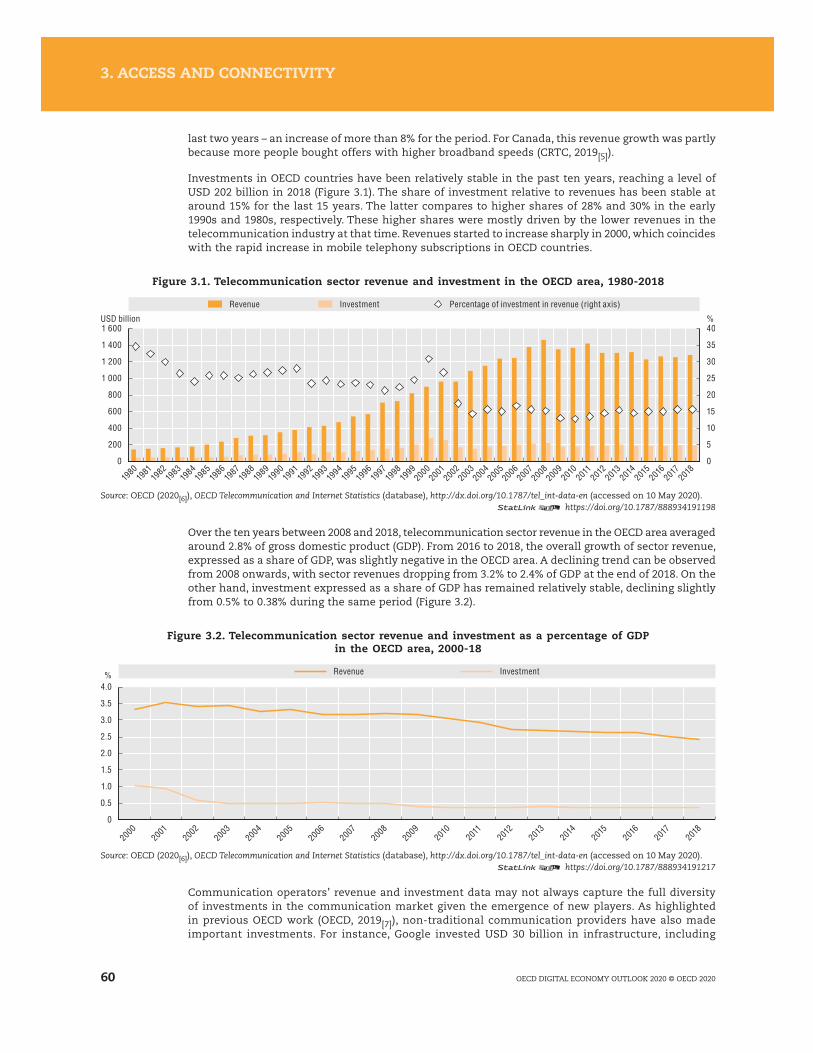
last two years – an increase of more than 8% for the period. For Canada, this revenue growth was partly because more people bought offers with higher broadband speeds (CRTC, 2019[5]).
Investments in OECD countries have been relatively stable in the past ten years, reaching a level of USD 202 billion in 2018 (Figure 3.1). The share of investment relative to revenues has been stable at around 15% for the last 15 years. The latter compares to higher shares of 28% and 30% in the early 1990s and 1980s, respectively. These higher shares were mostly driven by the lower revenues in the telecommunication industry at that time. Revenues started to increase sharply in 2000, which coincides with the rapid increase in mobile telephony subscriptions in OECD countries.
Figure 3.1. Telecommunication sector revenue and investment in the OECD area, 1980-2018
0
5
10
15
20
25
30
35
40
0
200
400
600
800
1 000
1 200
1 400
1 600
1980
1981
1982
1983
1984
1985
1986
1987
1988
1989
1990
1991
1992
1993
1994
1995
1996
1997
1998
1999
2000
2001
2002
2003
2004
2005
2006
2007
2008
2009
2010
2011
2012
2013
2014
2015
2016
2017
2018
%USD billion
Revenue Investment Percentage of investment in revenue (right axis)
Source: OECD (2020[6]), OECD Telecommunication and Internet Statistics (database), http://dx.doi.org/10.1787/tel_int-data-en (accessed on 10 May 2020).12 https://doi.org/10.1787/888934191198
Over the ten years between 2008 and 2018, telecommunication sector revenue in the OECD area averaged around 2.8% of gross domestic product (GDP). From 2016 to 2018, the overall growth of sector revenue, expressed as a share of GDP, was slightly negative in the OECD area. A declining trend can be observed from 2008 onwards, with sector revenues dropping from 3.2% to 2.4% of GDP at the end of 2018. On the other hand, investment expressed as a share of GDP has remained relatively stable, declining slightly from 0.5% to 0.38% during the same period (Figure 3.2).
Figure 3.2. Telecommunication sector revenue and investment as a percentage of GDP in the OECD area, 2000-18
0
2000
2001
2002
2003
2004
2005
2006
2007
2008
2009
2010
2011
2012
2013
2014
2015
2016
2017
2018
0.5
1.0
1.5
2.0
2.5
3.0
3.5
4.0% Revenue Investment
Source: OECD (2020[6]), OECD Telecommunication and Internet Statistics (database), http://dx.doi.org/10.1787/tel_int-data-en (accessed on 10 May 2020).12 https://doi.org/10.1787/888934191217
Communication operators’ revenue and investment data may not always capture the full diversity of investments in the communication market given the emergence of new players. As highlighted in previous OECD work (OECD, 2019[7]), non-traditional communication providers have also made important investments. For instance, Google invested USD 30 billion in infrastructure, including
60 OECD DIGITAL ECONOMY OUTLOOK 2020 © OECD 2020
3. ACCESS AND CONNECTIVITY 3. ACCESS AND CONNECTIVITY
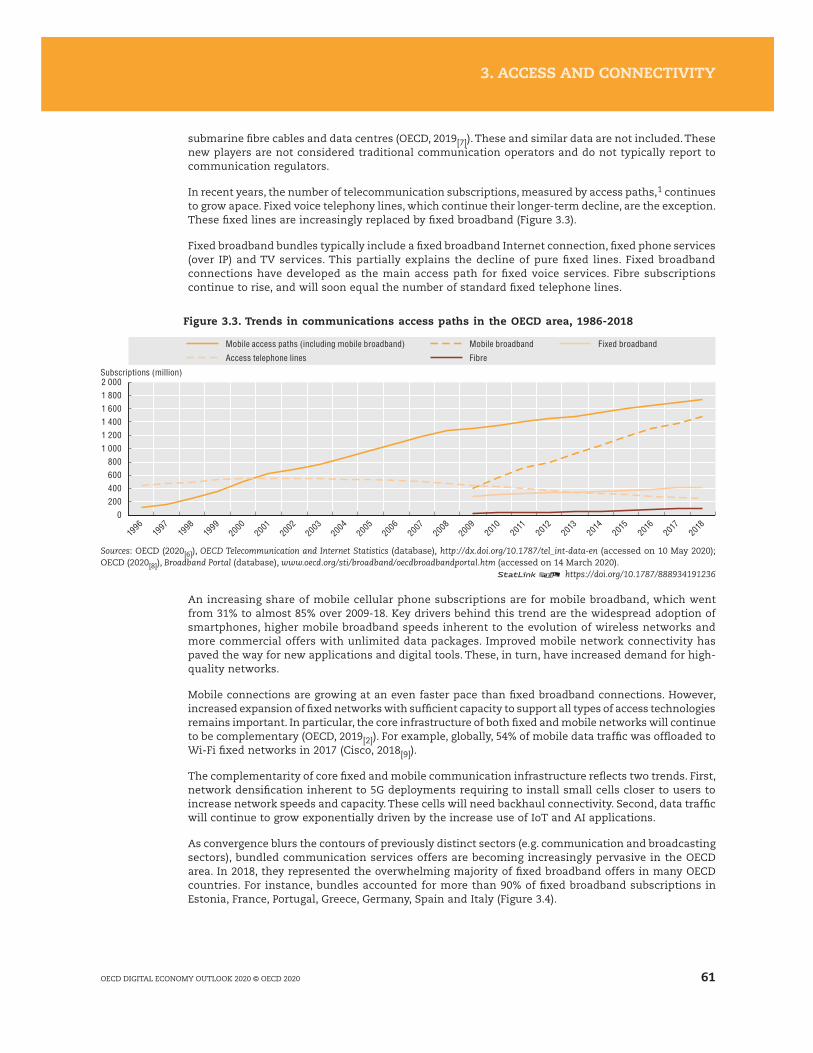
submarine fibre cables and data centres (OECD, 2019[7]). These and similar data are not included. These new players are not considered traditional communication operators and do not typically report to communication regulators.
In recent years, the number of telecommunication subscriptions, measured by access paths,1 continues to grow apace. Fixed voice telephony lines, which continue their longer-term decline, are the exception. These fixed lines are increasingly replaced by fixed broadband (Figure 3.3).
Fixed broadband bundles typically include a fixed broadband Internet connection, fixed phone services (over IP) and TV services. This partially explains the decline of pure fixed lines. Fixed broadband connections have developed as the main access path for fixed voice services. Fibre subscriptions continue to rise, and will soon equal the number of standard fixed telephone lines.
Figure 3.3. Trends in communications access paths in the OECD area, 1986-2018
0200
1996
1997
1998
1999
2000
2001
2002
2003
2004
2005
2006
2007
2008
2009
2010
2011
2012
2013
2014
2015
2016
2017
2018
400600800
1 0001 2001 4001 6001 8002 000Subscriptions (million)
Access telephone linesMobile access paths (including mobile broadband)
FibreMobile broadband Fixed broadband
Sources: OECD (2020[6]), OECD Telecommunication and Internet Statistics (database), http://dx.doi.org/10.1787/tel_int-data-en (accessed on 10 May 2020); OECD (2020[8]), Broadband Portal (database), www.oecd.org/sti/broadband/oecdbroadbandportal.htm (accessed on 14 March 2020).
12 https://doi.org/10.1787/888934191236
An increasing share of mobile cellular phone subscriptions are for mobile broadband, which went from 31% to almost 85% over 2009-18. Key drivers behind this trend are the widespread adoption of smartphones, higher mobile broadband speeds inherent to the evolution of wireless networks and more commercial offers with unlimited data packages. Improved mobile network connectivity has paved the way for new applications and digital tools. These, in turn, have increased demand for high-quality networks.
Mobile connections are growing at an even faster pace than fixed broadband connections. However, increased expansion of fixed networks with sufficient capacity to support all types of access technologies remains important. In particular, the core infrastructure of both fixed and mobile networks will continue to be complementary (OECD, 2019[2]). For example, globally, 54% of mobile data traffic was offloaded to Wi-Fi fixed networks in 2017 (Cisco, 2018[9]).
The complementarity of core fixed and mobile communication infrastructure reflects two trends. First, network densification inherent to 5G deployments requiring to install small cells closer to users to increase network speeds and capacity. These cells will need backhaul connectivity. Second, data traffic will continue to grow exponentially driven by the increase use of IoT and AI applications.
As convergence blurs the contours of previously distinct sectors (e.g. communication and broadcasting sectors), bundled communication services offers are becoming increasingly pervasive in the OECD area. In 2018, they represented the overwhelming majority of fixed broadband offers in many OECD countries. For instance, bundles accounted for more than 90% of fixed broadband subscriptions in Estonia, France, Portugal, Greece, Germany, Spain and Italy (Figure 3.4).
61OECD DIGITAL ECONOMY OUTLOOK 2020 © OECD 2020
3. ACCESS AND CONNECTIVITY 3. ACCESS AND CONNECTIVITY

Figure 3.4. Bundled communication services subscriptions, 2018Percentage of fixed broadband subscriptions that are bundled communication services
0
20
40
60
80
100
Eston
iaFra
nce
Portug
al
Greece
German
ySpa
inIta
ly
Belgium
Switzerl
and
Sloven
ia
Luxe
mbourg
Korea
United
Kingdo
mAus
tria
Hunga
ry
United
States
Latvia
Sweden
Irelan
d
Poland
Czech R
epub
lic
Icelan
d
Lithu
ania
Norway
Canad
a
Denmark
% Total Double-play Triple-play Quadruple-play Quintuple-play
Source: OECD (2020[8]), Broadband Portal (database), www.oecd.org/sti/broadband/oecdbroadbandportal.htm (accessed on 14 March 2020).12 https://doi.org/10.1787/888934191255
A steady increase of fixed broadband penetration with the gap narrowing among different OECD countries
Fixed broadband penetration has experienced a steady growth in the 2009-19 period (Figure 3.5). Over the past nine years, fixed broadband subscriptions have grown by one-third, representing an average compound annual growth rate of 3.7%. In June 2019, OECD countries had a higher level of fixed broadband penetration (31.6 subscribers per 100 inhabitants) than the world’s average (14.5 per 100). However, both groups are following the same growth path.
Figure 3.5. Fixed broadband evolution, OECD area and world, 2009-19
0
5
10
15
20
25
30
35
2009
2010
2011
2012
2013
2014
2015
2016
2017
2018
2019
Subscriptions per 100 inhabitants
OECD World World excluding OECD
Note: For 2019, data refer to Q2.
Sources: OECD (2020[8]), Broadband Portal (database), www.oecd.org/sti/broadband/oecdbroadbandportal.htm (accessed on 14 March 2020); ITU (2019[10]), World Telecommunication/ICT Indicators (database), www.itu.int/pub/D-IND-WTID.OL (accessed on 10 May 2020).
12 https://doi.org/10.1787/888934191274
Some historic leaders in the OECD in terms of fixed broadband penetration are Canada, Denmark, France, the Netherlands, Sweden, Switzerland and the United States. In the early 2000s, Korea was far ahead of other OECD countries. It had a fixed broadband penetration of more than 20 subscriptions per 100 inhabitants in 2001. Korea achieved this rate when residential broadband was still at an early stage of development in other OECD countries. The gap among OECD countries has narrowed in the past two decades, however. Switzerland, Denmark, France and the Netherlands were leading in terms of fixed broadband penetration in June 2019 (Figure 3.6).
62 OECD DIGITAL ECONOMY OUTLOOK 2020 © OECD 2020
3. ACCESS AND CONNECTIVITY 3. ACCESS AND CONNECTIVITY
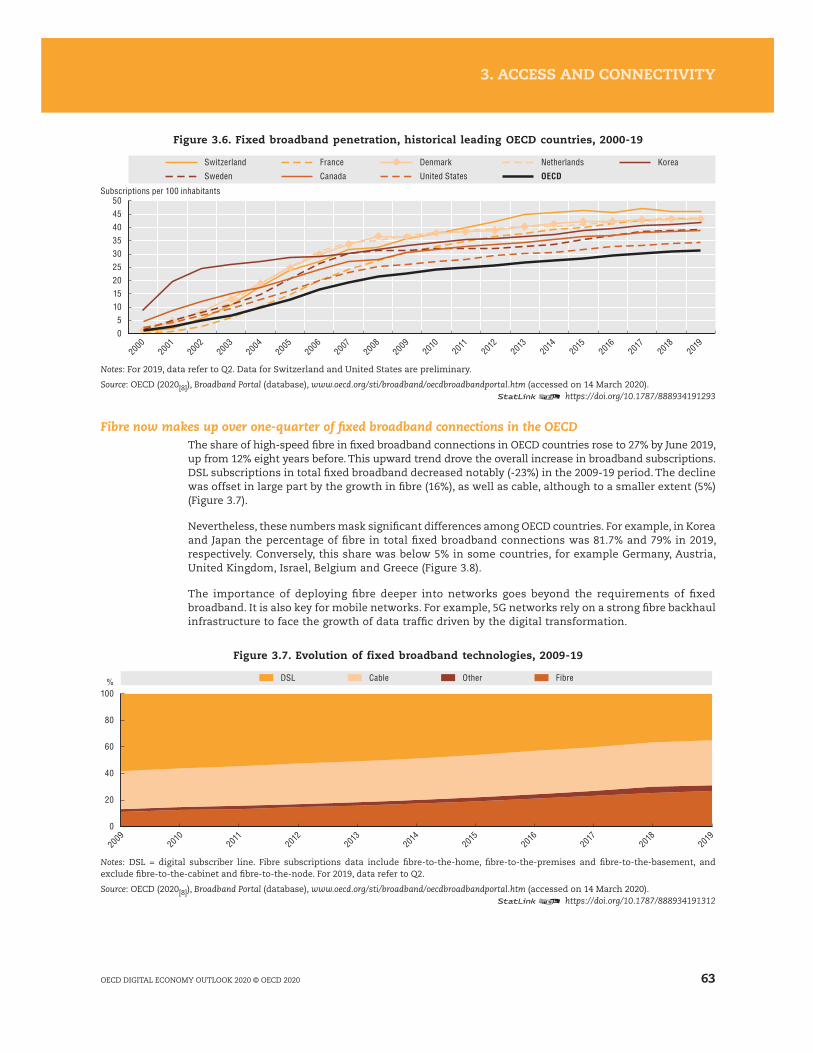
Figure 3.6. Fixed broadband penetration, historical leading OECD countries, 2000-19
0
50
51015202530354045
2000
2001
2002
2003
2004
2005
2006
2007
2008
2009
2010
2011
2012
2013
2014
2015
2016
2017
2018
2019
Subscriptions per 100 inhabitants
SwedenSwitzerland
CanadaFrance
OECDNetherlands Korea
United StatesDenmark
Notes: For 2019, data refer to Q2. Data for Switzerland and United States are preliminary.
Source: OECD (2020[8]), Broadband Portal (database), www.oecd.org/sti/broadband/oecdbroadbandportal.htm (accessed on 14 March 2020).12 https://doi.org/10.1787/888934191293
Fibre now makes up over one-quarter of fixed broadband connections in the OECD The share of high-speed fibre in fixed broadband connections in OECD countries rose to 27% by June 2019, up from 12% eight years before. This upward trend drove the overall increase in broadband subscriptions. DSL subscriptions in total fixed broadband decreased notably (-23%) in the 2009-19 period. The decline was offset in large part by the growth in fibre (16%), as well as cable, although to a smaller extent (5%) (Figure 3.7).
Nevertheless, these numbers mask significant differences among OECD countries. For example, in Korea and Japan the percentage of fibre in total fixed broadband connections was 81.7% and 79% in 2019, respectively. Conversely, this share was below 5% in some countries, for example Germany, Austria, United Kingdom, Israel, Belgium and Greece (Figure 3.8).
The importance of deploying fibre deeper into networks goes beyond the requirements of fixed broadband. It is also key for mobile networks. For example, 5G networks rely on a strong fibre backhaul infrastructure to face the growth of data traffic driven by the digital transformation.
Figure 3.7. Evolution of fixed broadband technologies, 2009-19
0
100
20
40
60
80
2009
2010
2011
2012
2013
2014
2015
2016
2017
2018
2019
% DSL Cable Other Fibre
Notes: DSL = digital subscriber line. Fibre subscriptions data include fibre-to-the-home, fibre-to-the-premises and fibre-to-the-basement, and exclude fibre-to-the-cabinet and fibre-to-the-node. For 2019, data refer to Q2.
Source: OECD (2020[8]), Broadband Portal (database), www.oecd.org/sti/broadband/oecdbroadbandportal.htm (accessed on 14 March 2020).12 https://doi.org/10.1787/888934191312
63OECD DIGITAL ECONOMY OUTLOOK 2020 © OECD 2020
3. ACCESS AND CONNECTIVITY 3. ACCESS AND CONNECTIVITY

Figure 3.8. Fibre broadband connections, June 2019As a percentage of total fixed broadband subscriptions
0
90
20
10
40
30
60
50
80
70
% Q2 2019 Q2 2017 Q2 2015
KoreaJa
pan
Lithu
ania
Sweden
Latvia
Spain
Icelan
d
Finlan
d
Norway
New Ze
aland
Portug
al
Luxe
mbourg
Eston
ia
Sloven
ia
Denmark
Slovak
Repub
licOEC
DChil
e
Hunga
ry
Mexico
Turke
y
Poland
Switzerl
andFra
nce
Czech R
epub
lic
Austra
lia
Netherl
ands
United
States
Canad
a
Colombia
Irelan
dIta
ly
German
y
Austria
United
Kingdo
mIsr
ael
Belgium
Greece
Notes: Fibre subscriptions data include fibre-to-the-home, fibre-to-the-premises and fibre-to-the-building and exclude fibre-to-the-cabinet and fibre-to-the-node. In Australia, a new entity using a different methodology is collecting data reported for December 2018 and onwards. Figures reported from December 2018 comprise a series break and are incomparable with previous data for any broadband measures Australia reports to the OECD. The OECD definition of fibre differs from fibre classifications commonly used in Australian reporting. These figures treat connections known in Australia as fibre-to-the-node and fibre-to-the-curb as DSL connections, while fibre-to-the-premises and fibre-to-the-basement are treated as fibre connections. Data on technology type prior to Q2-2016 should be treated as indicative until further notice. Data for Israel are OECD estimates. Data for Switzerland and United States are preliminary.
Source: OECD (2020[8]), Broadband Portal (database), www.oecd.org/sti/broadband/oecdbroadbandportal.htm (accessed on 14 March 2020).12 https://doi.org/10.1787/888934191331
Higher speeds as fibre is deployed deeper into broadband networksThe growing share of fibre in fixed broadband2 allows for much higher speeds for high-bandwidth online activities such as video streaming services, multiple screens services and home-connected devices. The average fixed broadband download speed has continued to grow in recent years. For example, according to data from the Ookla Speedtest Global Index, download speeds in the OECD area have increased from 24.1 Mbps to 40.9 Mbps between April 2014 and July 2019 (Ookla, 2019[11]).
3
The share of broadband subscriptions, relative to broadband penetration, in higher speed tier categories (advertised data as provided by countries) is becoming increasingly common in OECD countries (Figure 3.9). A large number of countries had a significant share of their fixed broadband subscriptions with speeds above 100 Mbps in 2018. Nine countries had more than half of their subscriptions above 100 Mbps (e.g. Korea, Sweden, Spain, Portugal, Iceland, Latvia, Hungary, Belgium, United States and Switzerland). The OECD average was situated at 37% (Figure 3.10).
Advertised broadband speeds may differ from actual speeds experienced by users. Regulatory authorities across OECD countries have increasingly examined this issue. Internationally comparable data on “actual” broadband speeds are not easy to collect. Many countries have national speed statistics, but use different methodologies. As a result, the OECD often relies on external sources such as Ookla, M-Lab, Steam or Akamai for broadband speed measurement to obtain comparable national average or peak speeds. OECD (2019[7]) reviews different approaches of broadband speed measurement.
It is worth noting the features of the different tools used for measuring download speeds when drawing conclusions from these data. M-Lab and Ookla compile results from speed tests by users who actively measure their actual speed to access the Internet.4 Steam data are a further way to consider download speeds across countries. They reflect the speeds of one of the most IP-intensive applications: online games. According to M-Lab data, the average fixed broadband download speed in OECD countries was 26.8 Mbps in July 2019. Using Ookla data as a reference, the average download speed was 78.3 Mbps, whereas the OECD average calculated using Steam data was 36.1 Mbps (Figure 3.11). Leading OECD countries in 2019 in terms of fixed broadband download speeds, using Steam data as a reference, include Korea (106.5 Mbps), Japan (69.6 Mbps) and Sweden (68 Mbps).
64 OECD DIGITAL ECONOMY OUTLOOK 2020 © OECD 2020
3. ACCESS AND CONNECTIVITY 3. ACCESS AND CONNECTIVITY

Figure 3.9. Fixed broadband subscriptions per 100 inhabitants, by speed tiers, June 2019
0
50
20
10
40
30
Switzerl
andFra
nce
Denmark
Netherl
ands
Korea
Norway
German
y
United
Kingdo
m
Belgium
Sweden
Canad
a
Icelan
d
Greece
Portug
al
Luxe
mbourg
Austra
lia
New Ze
aland
United
States
Spain
Hunga
ry
Eston
iaJa
pan
Finlan
dOEC
D
Czech R
epub
lic
Irelan
d
Sloven
ia
Austria Ita
ly
Slovak
Repub
licIsr
ael
Lithu
ania
Latvia
Poland
ChileTu
rkey
Mexico
Colombia
≥25-30 Mbps; <100 Mbps≥1.5-2 Mbps; <10 Mbps≥1 000 Mbps
<1.5-2 Mbps≥100 Mbps; <1 000 Mbps
≥10 Mbps; <25-30 MbpsBreakdown not available
Subscriptions per 100 inhabitants
Notes: Mbps = Megabits per second. In Australia, a new entity is using a different methodology to collect data reported from December 2018 onwards. Figures reported from December 2018 comprise a series break and are incomparable with previous data for any broadband measures Australia reports to the OECD. Data for Israel are OECD estimates. Data for Switzerland and United States are preliminary.
Source: OECD (2020[8]), Broadband Portal (database), www.oecd.org/sti/broadband/oecdbroadbandportal.htm (accessed on 14 March 2020). 12 https://doi.org/10.1787/888934191350
Figure 3.10. Fixed broadband subscriptions with contracted speed faster than 25/30 Mbps and 100 Mbps, 2018
0
100
20
40
60
80
% >100 Mbps >25-30 Mbps
Korea
Sweden
Spain
Portug
al
Icelan
d
Latvia
Hunga
ry
Belgium
United
States
Switzerl
and
Lithu
ania
Netherl
ands
Luxe
mbourg
Poland
OECD
Denmark
Finlan
d
Canad
a
Norway Ita
ly
New Ze
aland
Czech R
epub
lic
Franc
e
German
y
Sloven
ia
United
Kingdo
m
Eston
ia
Austria
Colombia
Isr
ael
Greece
Slovak
Repub
lic
Turke
y
Note: Mbps = Megabits per second.
Source: OECD (2020[8]), Broadband Portal (database), www.oecd.org/sti/broadband/oecdbroadbandportal.htm (accessed on 14 March 2020).12 https://doi.org/10.1787/888934191369
Mobile broadband continues to be a strong driver of growth in broadband subscriptionsGrowth in mobile broadband subscriptions has been impressive for the last nine years across OECD countries and partner economies.
The total number of subscriptions in the OECD area grew by 278% or 16% per annum (Figure 3.12). The second quarter of 2019 had a slightly lower growth rate despite more than 100 subscriptions per 100 inhabitants. The sector seems to be still growing apace and will not reach maturity yet for many years.
65OECD DIGITAL ECONOMY OUTLOOK 2020 © OECD 2020
3. ACCESS AND CONNECTIVITY 3. ACCESS AND CONNECTIVITY

Figure 3.11. Average experienced download speed of fixed broadband connections, July 2019
0
180
160
80
60
40
20
140
120
100
SteamM-LabSpeedtest (Ookla)Mbps
Korea
United
States
Switzerl
and
Hunga
ry
Canad
a
Sweden
Franc
e
Luxe
mbourg Spa
in
Norway
Japa
n
Netherl
ands
New Ze
aland
Denmark
Portug
al
Lithu
ania
Latvia
OECD
Israe
l
Poland
German
yChil
e
Belgium
Irelan
d
Finlan
d
United
Kingdo
m
Sloven
ia
Slovak
Repub
lic
Eston
iaIta
ly
Czech R
epub
lic
Austria
Austra
lia
Mexico
Greece
Turke
y
Colombia
Icelan
d
Notes: Mbps = Megabits per second. Speedtest (Ookla) data are for July 2019; M-Lab (Worldwide Broadband Speed League) speeds were measured from 9 May 2018 to 8 May 2019; and Steam data are for July 2019.
Sources: Ookla (2019[11]), “Speedtest Global Index”, www.speedtest.net/global-index; M-Lab (2019[12]), “Worldwide Broadband Speed League”, www.cable.co.uk/broadband/speed/worldwide-speed-league; Steam (2019[13]) “Steam Global Traffic Map”, https://store.steampowered.com/stats/content.
12 https://doi.org/10.1787/888934191388
Figure 3.12. Mobile broadband evolution, OECD area and world, 2009-19
0
20
40
60
80
100
120
2009
2010
2011
2012
2013
2014
2015
2016
2017
2018
2019
Subscriptions per 100 inhabitants
OECD World World excluding OECD
Notes: For 2019, data refer to Q2. World data for 2019 are estimates.
Sources: OECD (2020[8]), Broadband Portal (database), www.oecd.org/sti/broadband/oecdbroadbandportal.htm (accessed on 14 March 2020); ITU (2019[10]), World Telecommunication/ICT Indicators (database), www.itu.int/pub/D-IND-WTID.OL (accessed on 10 May 2020).
12 https://doi.org/10.1787/888934191407
In OECD partner economies, the annual growth rate in mobile broadband penetration is higher. It will likely remain high for a long time; mobile broadband fills a connectivity gap due to relatively low levels of fixed broadband infrastructure. In the OECD, the leaders are Japan, Finland, Estonia, United States and Australia with a mobile broadband subscription rate of more than 140 per 100 inhabitants (Figure 3.13).
Mobile data usage has reached over 15 GB per subscription a month in the leading OECD countryThe high growth in mobile broadband subscriptions is led by an ever-growing demand for mobile data used for services and apps, which are becoming essential for everyday life. In OECD countries, the growth in average mobile data traffic through cellular networks has been exponential, passing from 1.1 GB used per mobile broadband subscription per month in 2014 to 4.6 GB in 2018 (for available countries) (Figure 3.14). Leading countries in 2018 were Finland, Austria, Latvia and Lithuania.
66 OECD DIGITAL ECONOMY OUTLOOK 2020 © OECD 2020
3. ACCESS AND CONNECTIVITY 3. ACCESS AND CONNECTIVITY

Figure 3.13. Mobile broadband subscriptions per 100 inhabitants, June 2019
0
180
160
80
60
40
20
140
120
100
Total (breakdown not available)Data-only subscriptions Data and voice subscriptions
Per 100 inhabitants
Japa
n
Finlan
d
Eston
ia
United
States
Austra
lia
Denmark
Latvia
Sweden
Icelan
d
Netherl
ands
KoreaOEC
DPola
nd
Irelan
d
Lithu
ania
Norway
Israe
lSpa
in
Luxe
mbourg
United
Kingdo
m
Switzerl
and
Czech R
epub
lic
New Ze
aland
ChileFra
nce
Austria Ita
ly
Slovak
Repub
lic
Greece
German
y
Sloven
ia
Canad
a
Belgium
Portug
al
Turke
y
Mexico
Hunga
ry
Colombia
Notes: In Australia, a new entity using a different methodology is collecting data reported for December 2018 and onwards. Figures reported from December 2018 comprise a series break and are incomparable with previous data for any broadband measures Australia reports to the OECD. Data for Israel are OECD estimates. Data for Switzerland and United States are preliminary. StatLink contains more data.
Source: OECD (2020[8]), Broadband Portal (database), www.oecd.org/sti/broadband/oecdbroadbandportal.htm (accessed on 14 March 2020).12 https://doi.org/10.1787/888934191426
Figure 3.14. Mobile data usage per mobile broadband subscription, 2018
0
20
1618
8642
141210
GB per month
2018 2017 2016
Finlan
d
Austria
Latvia
Lithu
ania
Eston
ia
Icelan
d
Denmark
Sweden
Irelan
dChil
eKore
a
Poland
Switzerl
andFra
nce
United
States
Norway
Sloven
iaOEC
DTu
rkeyJa
pan
Italy
Luxe
mbourg
Hunga
ry
Austra
lia
Czech R
epub
lic
United
Kingdo
mSpa
in
Portug
al
Netherl
ands
German
y
Canad
a
New Ze
aland
Mexico
Belgium
Colombia
Greece
Slovak
Repub
lic
Notes: GB = gigabyte. A new entity using a different methodology is collecting data reported for December 2018 and onwards. Figures reported from December 2018 comprise a series break and are incomparable with previous data for any broadband measures Australia reports to the OECD. Data for Canada and Switzerland are preliminary.
Source: OECD (2020[8]), Broadband Portal (database), www.oecd.org/sti/broadband/oecdbroadbandportal.htm (accessed on 14 March 2020).12 https://doi.org/10.1787/888934191445
The growing demand for mobile data can be exemplified with the remarkable success of the Finnish company Elisa, the first company in the country to offer unlimited data plans back in 2007. All of Elisa’s mobile plans come with unlimited data for the home markets (Elisa, 2017[14]). They are differentiated by speed with tiers ranging from 1 Mbps up to 300 Mbps. As a consequence of these offers, the data volume handled by Elisa has grown more than 700% over five years. Meanwhile, the number of mobile subscriptions has remained constant between 2013 and 2017 (roughly 4.7 million). Its share of non-voice revenues in mobile communications rose from 44% to nearly 66% of revenues during the five years between 2013 and 2017. This growth highlights the role of data service and the increase of data-voice substitution (OECD, 2019[7]).
67OECD DIGITAL ECONOMY OUTLOOK 2020 © OECD 2020
3. ACCESS AND CONNECTIVITY 3. ACCESS AND CONNECTIVITY
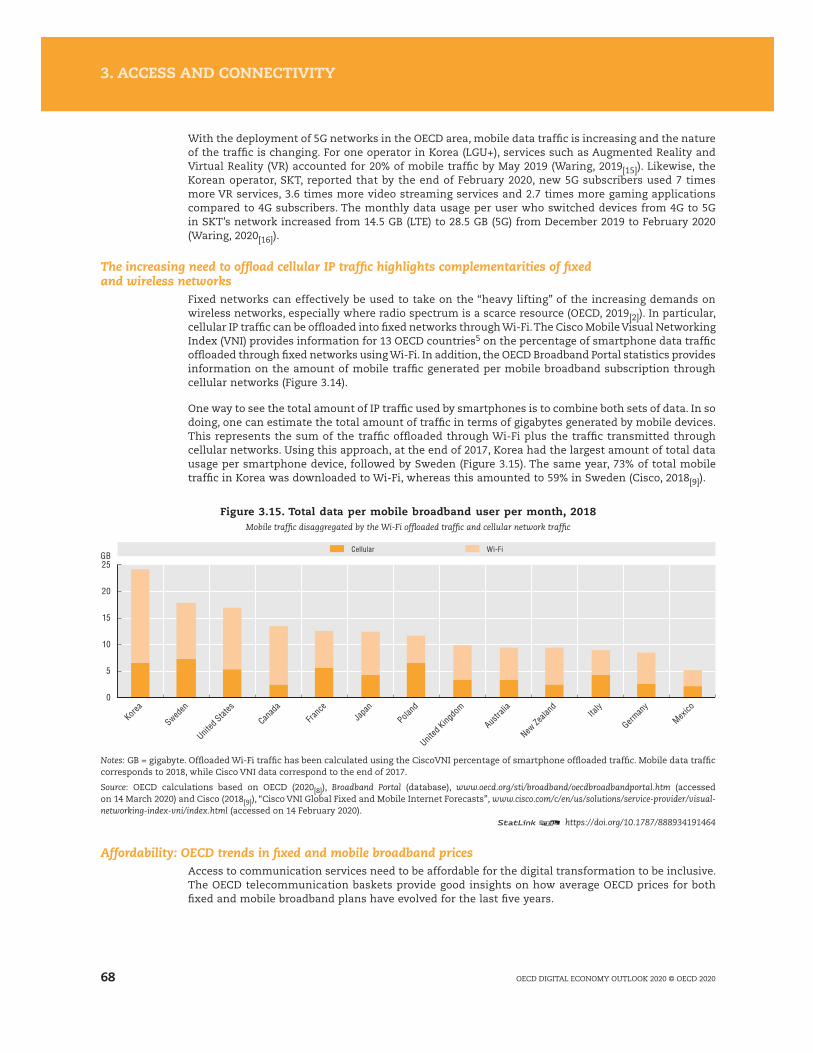
With the deployment of 5G networks in the OECD area, mobile data traffic is increasing and the nature of the traffic is changing. For one operator in Korea (LGU+), services such as Augmented Reality and Virtual Reality (VR) accounted for 20% of mobile traffic by May 2019 (Waring, 2019[15]). Likewise, the Korean operator, SKT, reported that by the end of February 2020, new 5G subscribers used 7 times more VR services, 3.6 times more video streaming services and 2.7 times more gaming applications compared to 4G subscribers. The monthly data usage per user who switched devices from 4G to 5G in SKT’s network increased from 14.5 GB (LTE) to 28.5 GB (5G) from December 2019 to February 2020 (Waring, 2020[16]).
The increasing need to offload cellular IP traffic highlights complementarities of fixed and wireless networks
Fixed networks can effectively be used to take on the “heavy lifting” of the increasing demands on wireless networks, especially where radio spectrum is a scarce resource (OECD, 2019[2]). In particular, cellular IP traffic can be offloaded into fixed networks through Wi-Fi. The Cisco Mobile Visual Networking Index (VNI) provides information for 13 OECD countries5 on the percentage of smartphone data traffic offloaded through fixed networks using Wi-Fi. In addition, the OECD Broadband Portal statistics provides information on the amount of mobile traffic generated per mobile broadband subscription through cellular networks (Figure 3.14).
One way to see the total amount of IP traffic used by smartphones is to combine both sets of data. In so doing, one can estimate the total amount of traffic in terms of gigabytes generated by mobile devices. This represents the sum of the traffic offloaded through Wi-Fi plus the traffic transmitted through cellular networks. Using this approach, at the end of 2017, Korea had the largest amount of total data usage per smartphone device, followed by Sweden (Figure 3.15). The same year, 73% of total mobile traffic in Korea was downloaded to Wi-Fi, whereas this amounted to 59% in Sweden (Cisco, 2018[9]).
Figure 3.15. Total data per mobile broadband user per month, 2018Mobile traffic disaggregated by the Wi-Fi offloaded traffic and cellular network traffic
0
25
20
5
15
10
GBCellular Wi-Fi
Korea
Sweden
United
States
Canad
aFra
nceJa
pan
Poland
United
Kingdo
m
Australi
a
New Ze
aland
Italy
German
y
Mexico
Notes: GB = gigabyte. Offloaded Wi-Fi traffic has been calculated using the CiscoVNI percentage of smartphone offloaded traffic. Mobile data traffic corresponds to 2018, while Cisco VNI data correspond to the end of 2017.
Source: OECD calculations based on OECD (2020[8]), Broadband Portal (database), www.oecd.org/sti/broadband/oecdbroadbandportal.htm (accessed on 14 March 2020) and Cisco (2018[9]), “Cisco VNI Global Fixed and Mobile Internet Forecasts”, www.cisco.com/c/en/us/solutions/service-provider/visual-networking-index-vni/index.html (accessed on 14 February 2020).
12 https://doi.org/10.1787/888934191464
Affordability: OECD trends in fixed and mobile broadband pricesAccess to communication services need to be affordable for the digital transformation to be inclusive. The OECD telecommunication baskets provide good insights on how average OECD prices for both fixed and mobile broadband plans have evolved for the last five years.
68 OECD DIGITAL ECONOMY OUTLOOK 2020 © OECD 2020
3. ACCESS AND CONNECTIVITY 3. ACCESS AND CONNECTIVITY

OECD countries have observed a sharp decline in mobile broadband prices, which reflects greater competition in this market. This is especially true of high-usage plans, including 900 calls and 2 GB of data, with a 59% reduction in prices from May 2013 to November 2019 (Figure 3.16B). The two other mobile broadband baskets also witnessed important prices drops: -46% for the medium usage basket (i.e. 300 calls and 1 GB of data) and -39% for the low-usage plans (i.e. 100 calls and 500 MB of data).
Concerning fixed broadband baskets, the price decreases have been less steep or null, compared to mobile broadband usage baskets (Figure 3.16A). The price of the high-usage fixed broadband basket (i.e. 200 GB) shows a slight decrease of 3% over the June 2013 to December 2019 period. Meanwhile, the low-usage basket shows a price increase of 13% in the same period.
Figure 3.16. OECD trends in fixed and mobile broadband prices, 2013-19
0
80
70
60
50
10
40
30
20
0
80
70
60
50
10
40
30
20
USD PPP USD PPP
200 GB 20 GB300 calls + 1 GB100 calls + 500 MB
900 calls + 2 GB
A. Fix ed broadband B. Mobile broadband
June
2013
Sept 2
014
Sept 2
015
June
2016
June
2017
June
2018
June
2019
Dec 20
19
May 20
13
May 20
14
Aug 20
15
May 20
16
May 20
17
May 20
18
May 20
19
Nov 20
19
Note: GB = gigabyte; MB = megabyte; PPP = purchasing power parity.
Source: OECD calculations based on Teligen/Strategy Analytics (2020[17]), “Teligen tariff & benchmarking market data using the OECD methodology”, https://www.strategyanalytics.com/access-services/service-providers/tariffs---mobile-and-fixed/ (accessed on 14 March 2020).
12 https://doi.org/10.1787/888934191483
The development of the Internet of Things in OECD countriesThe OECD began measuring M2M, a subset of the IoT, in 2012. Since that date, M2M/mobile broadband subscriptions per 100 inhabitants in the OECD area grew from 4.3% to 22% in June 2019. The most recent data on M2M communications show Sweden as the leading country in terms of the number of M2M SIM cards in use per 100 inhabitants (with 140.6 M2M SIM cards per 100 inhabitants). Sweden is followed by Austria, Italy, United States, the Netherlands and New Zealand (Figure 3.17). Sweden provides such a high number of M2M SIM cards because most (61%) of these cards are used in other countries by one Swedish operator (PTS, 2020[18]). Overall, M2M/embedded mobile cellular subscriptions grew by over 30% in one year (the Q2 2018-Q2 2019 period) in countries where data were available.
To date, the OECD has gathered data on the number of M2M connections on cellular wireless networks. However, platform-agnostic IP IoT devices increasingly create new challenges for policy makers seeking to measure the number of such devices and their implications for communication networks. Following the Cancún Ministerial mandate on the Digital Economy (2016), recent OECD work has provided a comprehensive overview on how to tackle the measurement of the IoT (OECD, 2018[1]).
OECD countries have agreed on a working definition of IoT. They have also proposed a framework (taxonomy) for measurement, which includes subcategories of the IoT according to demand placed on networks. The OECD overarching IoT definition is below:
The Internet of Things includes all devices and objects whose state can be altered via the Internet, with or without the active involvement of individuals. While connected objects may require the involvement of devices considered part of the “traditional Internet”, this definition excludes laptops, tablets and smartphones already accounted for in current OECD broadband metrics. (OECD, 2018[1])
69OECD DIGITAL ECONOMY OUTLOOK 2020 © OECD 2020
3. ACCESS AND CONNECTIVITY 3. ACCESS AND CONNECTIVITY

Figure 3.17. M2M/embedded mobile cellular subscriptions, June 201914
1
122 298
0
5
10
15
20
25
0
10
20
30
40
50MillionPer 100 inhabitants
M2M cards, per 100 inhabitants M2M cards (right axis)
Sweden
Austria
United
States
Netherl
ands
New Ze
aland
Norway
Franc
e
Finlan
d
German
y
Belgium
Denmark
Eston
ia
Irelan
dOEC
DJa
panLatv
ia
Slovak
Repub
lic
Icelan
dKore
a
Switzerl
and
Luxe
mbourg
Spain
United
Kingdo
m
Hunga
ry
Portug
al
Lithu
ania
Canad
a
Czech R
epub
lic
Poland
Turke
y
Greece
Sloven
iaChil
e
MexicoIta
ly
Notes: M2M = machine to machine. For Switzerland, data are preliminary. For United States, data are OECD estimates.
Source: OECD (2020[8]), Broadband Portal (database), www.oecd.org/sti/broadband/oecdbroadbandportal.htm (accessed on 14 March 2020).12 https://doi.org/10.1787/888934191502
The OECD taxonomy for the IoT includes subcategories based on the diversity of network needs. Namely, it includes critical IoT applications (e.g. automated vehicles or applications for remote surgery), and massive and disperse M2M (e.g. sensors used for smart agriculture or smart cities, among others) (OECD, 2018[1]).
Some IoT applications, such as connected and fully automated vehicles, may have strong implications for network infrastructure. Therefore, their measurement may be a priority to track developments. While “connected cars” have been common for several years in OECD countries, the trend in the level of automation of vehicles may pose significant network infrastructure challenges in the near future (OECD, 2018[1]). For example, Intel estimated in 2016 that one fully automated vehicle would produce 4 000 GB of data per day (Krzanich, 2016[19]). Compared to the OECD average mobile data usage of 2018, this would be equivalent to the data usage of 26 000 mobile subscribers per day.
New developments in IoT applications may help fill gaps in connectivity. There is a gap between the new forms of cellular wireless connectivity for IoT devices and smart home devices relying on short-range technologies such as Bluetooth and Wi-Fi connections. In response, Amazon Sidewalk aims at providing a low-cost and low-bandwidth connectivity that extends the range of sensors around the home (Amazon, 27 September 2019[20]).
An inclusive digital transformation: The need for higher speeds and high-quality broadband in rural areas
While overall speeds have been uniformly increasing, important disparities still exist between urban and rural areas in terms of the quality of connections.
There are persistent gaps between rural and urban households across the OECD in terms of the availability of fixed broadband services with a minimum speed of 30 Mbps. In 2018, only 52% of rural households in Europe had access to fixed broadband with this speed compared to 83% of households in other areas. For Canada, the difference is 72% of availability in rural areas, against 94% in total. In 2018, in the United States, 74% of rural areas have access to this minimum speed against 93.5% in total.6 Meanwhile, just 9.3% of Finnish rural households had access to fixed broadband with a minimum speed of 30 Mbps (Figure 3.18). However, household surveys show that 90% of rural Finnish households had broadband access (OECD, 2019[3]). The difference can be explained by the importance of mobile technologies such as 4G for broadband coverage in rural Finland.
The availability of advanced mobile services, such as LTE, has been improving across the OECD. For the European Union, coverage of rural LTE reached 96% households by 2018. Rural LTE coverage for Canada and the United States amounted to 96.5% and 99%, respectively, in the same year (Figure 3.19).
70 OECD DIGITAL ECONOMY OUTLOOK 2020 © OECD 2020
3. ACCESS AND CONNECTIVITY 3. ACCESS AND CONNECTIVITY

Figure 3.18. Households with minimum 30 Mbps of fixed broadband coverage, 2018As a percentage of all households in total and rural areas
0
100
20
40
60
80
% Rural Total
Netherl
ands
Icelan
d
Belgium
Switzerl
and
Luxe
mbourg
United
Kingdo
mIre
land
Latvia
United
States
Canad
a
Denmark
Portug
al
German
y
Hunga
ry
Slovak
Repub
lic
Czech R
epub
lic
Eston
ia
Sloven
ia
Austria
EU28
Norway
Greece
Spain
Franc
eIta
ly
Sweden
Poland
Lithu
ania
Finlan
d
Notes: For EU countries, rural areas are those with a population density less than 100 per square kilometre. For Canada, rural areas are those with a population density less than 400 per square kilometre. For the United States, rural areas are those with a population density less than 1 000 per square mile or 386 people per square kilometre. For EU countries, fixed broadband coverage of NGA technologies (VDSL, FTTP and DOCSIS 3.0) capable of delivering at least 30 Mbps download was used. For the United States, coverage of fixed terrestrial broadband capable of delivering 25 Mbps download and 3 Mbps upload services was used.
Sources: OECD calculations based on CRTC (2019[5]), Communications Monitoring Report, 2019 (Canada); European Commission (2019[21]), Study on Broadband Coverage in Europe 2018 (European Union) and FCC (2019[22]), 2019 Broadband Deployment Report (United States).
12 https://doi.org/10.1787/888934191521
Figure 3.19. Households with LTE mobile coverage, 2018As a percentage of all households in total and rural areas
Denmark
Sweden
Poland
Finlan
dFra
nce
Belgium
Switzerl
and
Norway
Netherl
ands
United
Kingdo
mEs
tonia
United
States
Sloven
ia
Hunga
rySpa
in
Lithua
nia
Icelan
d
Canad
a
Austria
EU28
Luxem
bourg
Czech R
epub
licLatv
ia
Portug
al
Greece
Slovak
Repub
lic Italy
German
y
Irelan
d80
100
85
90
95
% Rural Total
Notes: For EU countries, rural areas are those with a population density less than 100 per square kilometre. For Canada, rural areas are those with a population density less than 400 per square kilometre. For the United States, rural areas are those with a population density less than 1 000 per square mile or 386 people per square kilometre.
Sources: OECD calculations based on CRTC (2019[5]), Communications Monitoring Report, 2019 (Canada), European Commission (2019[21]), Study on Broadband Coverage in Europe 2018 (European Union) and FCC (2019[22]), 2019 Broadband Deployment Report (United States).
12 https://doi.org/10.1787/888934191540
While the available data indicated important advances in connectivity in rural areas through mobile technologies, OECD countries look for additional metrics to complement their assessment. One metric could include measuring speed tiers for both fixed broadband and mobile broadband services. Regulators and policy makers still have valid concerns around the reliability of broadband connectivity over mobile networks, such as LTE, despite improved speed and connection quality.
The persistence of the rural-urban divide raises questions about inclusiveness and opportunities in the digital age. It highlights the importance of better metrics for quality broadband access and of continued investment and sharing of good practices for ensuring connectivity for all.
71OECD DIGITAL ECONOMY OUTLOOK 2020 © OECD 2020
3. ACCESS AND CONNECTIVITY 3. ACCESS AND CONNECTIVITY

The next evolution of fixed and mobile networksAs more people and things go on line, continued investments in fixed and mobile broadband networks are required. These are needed to face the increasing demands in data stemming from the digital transformation. In particular, it is becoming increasingly critical to upgrade networks to “future proof” technologies, such as fibre, to support increases in speed and capacity across all next-generation technologies. In response, many OECD countries have witnessed an increasing trend towards high-capacity fixed networks (Gigabit networks) and the next generation of wireless networks, i.e. 5G. Policies and regulatory measures that seek to foster competition, promote investment and reduce obstacles to infrastructure deployment will be key for an inclusive and successful digital transformation. Potential synergies in deployment among providers will become increasingly important to drive deployment costs down.
The next generation of wireless networks, also known as 5G, refers to networks designed to support enhanced mobile broadband, massive machine type communications, as well as critical communications and applications (ultra-reliable and low-latency communications). The promise of 5G includes 200 times the current data transfer capacity with one-tenth of the latency of 4G networks. The combination of increased data transfer speeds and heightened processing power could enable many more simultaneous connections. Combined with lower latency, 5G networks have been heralded as necessary to support the deepening of digital transformation (OECD, 2019[2]).
The next generation of wireless networks, 5G, requires bringing smaller cells closer to connected devices through a process called “network densification”. Such cells will need to be connected to backhaul, underlining the need for more investment in next-generation network deployment (OECD, 2019[2]).
Infrastructure-sharing agreements among operators are likely to become common to mitigate the costs of 5G deployment. The nature of these agreements may change as they may possibly relate to deeper forms of network and spectrum sharing. Specifically, this would affect the active layer of networks compared to only passive infrastructure- sharing agreements. This may create new competition and regulatory challenges, forcing communication regulators to adapt to this development (OECD, 2019[2]). Some operators in OECD countries are leveraging on passive infrastructure, as well as active network sharing agreements to expand their coverage and speed up the deployment of 5G networks. Such countries include Belgium, Colombia, Italy, Spain and the United Kingdom.
In line with the trend towards upgrading networks, operators in several OECD markets have announced the “shutting down” of legacy wireless networks (e.g. 2G/3G wireless networks), and the transition to the next evolution of mobile networks. Several examples are highlighted below.
In June 2020, the Colombian Ministry of Information Technology and Communications (Ministerio de Tecnologías de la Información y las Comunicaciones, MinTIC) published a plan to transition to new mobile technologies in the country. This would include a tax reduction for 4G terminal devices. It would also provide incentives to connect rural areas where operators have coverage obligations that stemmed from the 700 MHz auction.
In Switzerland, Swisscom announced it would guarantee 2G networks until the end of 2020. After this date, it would use those allocated spectrum frequencies for 5G.
In June 2019, Vodafone announced it would start closing down 3G networks in the United Kingdom and in the Netherlands. The company is planning to use the spectrum frequencies for 4G and 5G. It also plans to migrate business users’ 3G equipment so it will be compatible with the next generation of networks. Vodafone plans to keep 2G operating as it is still important for many M2M devices, and the company has been focusing on its IoT business strategy in the past years.
In Europe, the European Commission issued a regulation in 2015 on new car models to be equipped with the “eCALL” emergency system. These often rely on 2G and 3G communication services. Shutting down legacy networks may thus raise issues for the emergency system (European Commission, 2015[23]).
72 OECD DIGITAL ECONOMY OUTLOOK 2020 © OECD 2020
3. ACCESS AND CONNECTIVITY 3. ACCESS AND CONNECTIVITY

With regards to fixed broadband, operators in several OECD countries have begun closing down copper networks and upgrading them to fibre:
● In Japan, the operator NTT released a “PSTN Migration General Outlook” in 2010. It aims to shift its networks from PSTN to IP over 2020-25.
● In Portugal, the fixed incumbent operator told the regulator (ANACOM) it would initiate the phase-out of its copper network, as fibre deployment is increasingly reaching the geographical footprint of copper. The transition should take several years. Initially, it will focus on areas with fibre coverage and where no other operator accesses the incumbent’s copper network.
● In Sweden, Telia is gradually transitioning its copper network and replacing it by fibre, fixed wireless services or wireless connectivity (Telia, 2020[24]).
The path towards Gigabit networks While fibre is increasingly being deployed deeper into networks throughout the OECD, some countries and operators have started to extend coverage of Gigabit Internet commercial offers. A number of OECD countries offer fixed broadband subscriptions with advertised speeds above 1 Gbps (i.e. “Gigabit offers”) to consumers and businesses (Figure 3.20). The least expensive countries in 2019 were Hungary (USD 20 PPP), Italy (USD 30 PPP) and France (USD 35.5 PPP).
Residential offers at 1 Gbps and low prices are most common where there is either strong infrastructure competition between operators or competition between retail providers using wholesale networks. In Singapore, for example, its structurally separated entity has given rise to commercial offers of two 1 Gbps fibre connections to a single household. Singapore has a national two-layer wholesale-only broadband network model (NetLink Trust). It provides dark fibre to ISPs like MyRepublic, which then provide the active electronics and manage services to their customers (OECD, 2019[7]). Such offers indicate that competition can drive markets to be more responsive to demands, which are constantly rising in this environment.
Figure 3.20. Baskets of fixed broadband offers for 1 Gbps, 2019
0
50
100
150
200
250USD PPP
2019 201620172018
Austria
Mexico
United
States
Canad
a
Norway
Spain
Belgium
Sloven
ia
Luxe
mbourg
Icelan
d
Sweden
Eston
ia
German
y
Switzerl
and
Portug
al
Finlan
d
Czech R
epub
lic
New Ze
aland
Denmark
Irelan
d
Netherl
ands
Poland
Japa
nKore
a
Slovak
Repub
lic
Franc
eIta
ly
Hunga
ry
Note: PPP = purchasing power parity.
Source: OECD calculations based on Teligen/Strategy Analytics (2020[17]), “Teligen tariff & benchmarking market data using the OECD methodology”, https://www.strategyanalytics.com/access-services/service-providers/tariffs---mobile-and-fixed/ (accessed on 14 March 2020).
12 https://doi.org/10.1787/888934191559
The first 10 Gbps broadband commercial offers (advertised speed) for consumers have emerged in France, Korea, Japan, Sweden and Switzerland. Outside the OECD, Singapore was one of the first countries with 10 Gbps consumer offers (Table 3.1). By way of example, a 10 Gbps connection allows users to download the latest full 4K ultra HD movie (75 GB) in one minute, compared to almost two hours on a 100 Mbps connection (Wakefield, 2018[25]).
73OECD DIGITAL ECONOMY OUTLOOK 2020 © OECD 2020
3. ACCESS AND CONNECTIVITY 3. ACCESS AND CONNECTIVITY
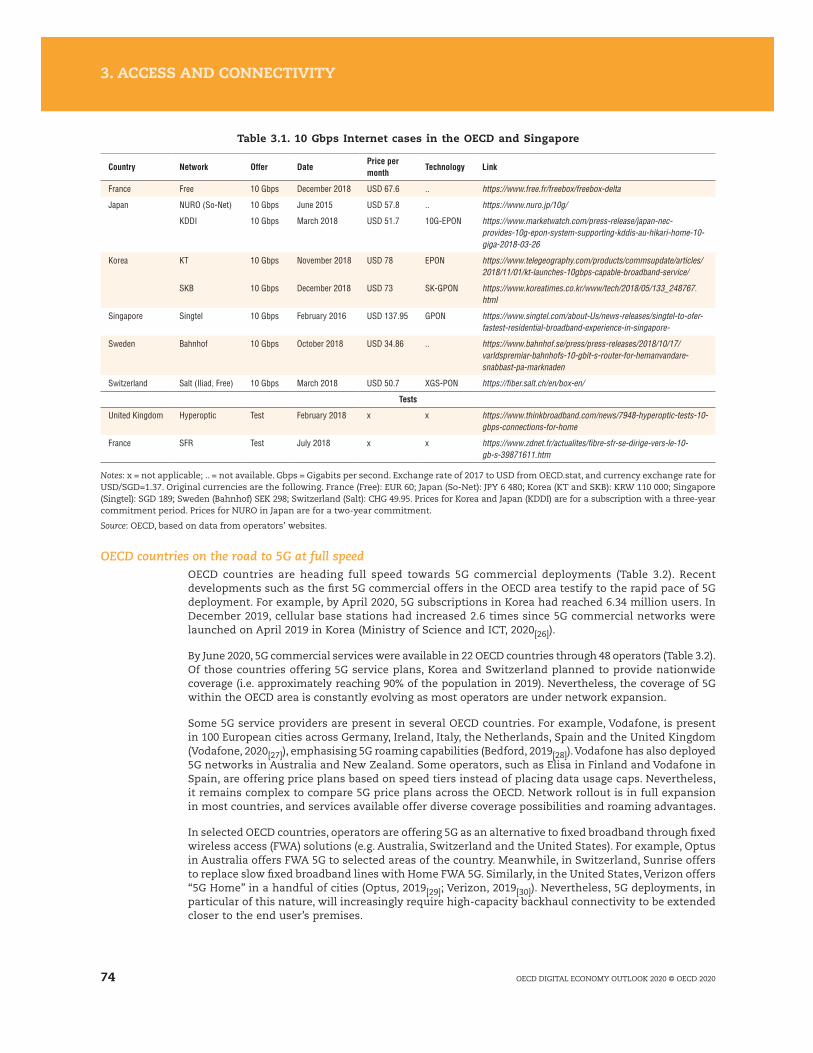
Table 3.1. 10 Gbps Internet cases in the OECD and Singapore
Country Network Offer DatePrice per month
Technology Link
France Free 10 Gbps December 2018 USD 67.6 .. https://www.free.fr/freebox/freebox-delta
Japan NURO (So-Net) 10 Gbps June 2015 USD 57.8 .. https://www.nuro.jp/10g/
KDDI 10 Gbps March 2018 USD 51.7 10G-EPON https://www.marketwatch.com/press-release/japan-nec-provides-10g-epon-system-supporting-kddis-au-hikari-home-10-giga-2018-03-26
Korea KT 10 Gbps November 2018 USD 78 EPON https://www.telegeography.com/products/commsupdate/articles/ 2018/11/01/kt-launches-10gbps-capable-broadband-service/
SKB 10 Gbps December 2018 USD 73 SK-GPON https://www.koreatimes.co.kr/www/tech/2018/05/133_248767.html
Singapore Singtel 10 Gbps February 2016 USD 137.95 GPON https://www.singtel.com/about-Us/news-releases/singtel-to-ofer-fastest-residential-broadband-experience-in-singapore-
Sweden Bahnhof 10 Gbps October 2018 USD 34.86 .. https://www.bahnhof.se/press/press-releases/2018/10/17/varldspremiar-bahnhofs-10-gbit-s-router-for-hemanvandare-snabbast-pa-marknaden
Switzerland Salt (Iliad, Free) 10 Gbps March 2018 USD 50.7 XGS-PON https://fiber.salt.ch/en/box-en/
Tests
United Kingdom Hyperoptic Test February 2018 x x https://www.thinkbroadband.com/news/7948-hyperoptic-tests-10-gbps-connections-for-home
France SFR Test July 2018 x x https://www.zdnet.fr/actualites/fibre-sfr-se-dirige-vers-le-10-gb-s-39871611.htm
Notes: x = not applicable; .. = not available. Gbps = Gigabits per second. Exchange rate of 2017 to USD from OECD.stat, and currency exchange rate for USD/SGD=1.37. Original currencies are the following. France (Free): EUR 60; Japan (So-Net): JPY 6 480; Korea (KT and SKB): KRW 110 000; Singapore (Singtel): SGD 189; Sweden (Bahnhof) SEK 298; Switzerland (Salt): CHG 49.95. Prices for Korea and Japan (KDDI) are for a subscription with a three-year commitment period. Prices for NURO in Japan are for a two-year commitment.
Source: OECD, based on data from operators’ websites.
OECD countries on the road to 5G at full speedOECD countries are heading full speed towards 5G commercial deployments (Table 3.2). Recent developments such as the first 5G commercial offers in the OECD area testify to the rapid pace of 5G deployment. For example, by April 2020, 5G subscriptions in Korea had reached 6.34 million users. In December 2019, cellular base stations had increased 2.6 times since 5G commercial networks were launched on April 2019 in Korea (Ministry of Science and ICT, 2020[26]).
By June 2020, 5G commercial services were available in 22 OECD countries through 48 operators (Table 3.2). Of those countries offering 5G service plans, Korea and Switzerland planned to provide nationwide coverage (i.e. approximately reaching 90% of the population in 2019). Nevertheless, the coverage of 5G within the OECD area is constantly evolving as most operators are under network expansion.
Some 5G service providers are present in several OECD countries. For example, Vodafone, is present in 100 European cities across Germany, Ireland, Italy, the Netherlands, Spain and the United Kingdom (Vodafone, 2020[27]), emphasising 5G roaming capabilities (Bedford, 2019[28]). Vodafone has also deployed 5G networks in Australia and New Zealand. Some operators, such as Elisa in Finland and Vodafone in Spain, are offering price plans based on speed tiers instead of placing data usage caps. Nevertheless, it remains complex to compare 5G price plans across the OECD. Network rollout is in full expansion in most countries, and services available offer diverse coverage possibilities and roaming advantages.
In selected OECD countries, operators are offering 5G as an alternative to fixed broadband through fixed wireless access (FWA) solutions (e.g. Australia, Switzerland and the United States). For example, Optus in Australia offers FWA 5G to selected areas of the country. Meanwhile, in Switzerland, Sunrise offers to replace slow fixed broadband lines with Home FWA 5G. Similarly, in the United States, Verizon offers “5G Home” in a handful of cities (Optus, 2019[29]; Verizon, 2019[30]). Nevertheless, 5G deployments, in particular of this nature, will increasingly require high-capacity backhaul connectivity to be extended closer to the end user’s premises.
74 OECD DIGITAL ECONOMY OUTLOOK 2020 © OECD 2020
3. ACCESS AND CONNECTIVITY 3. ACCESS AND CONNECTIVITY

Country Operator Technology Launch date Coverage Details
Australia Telstra Mobile; FWA 22 May 2019 46 cities
Optus Mobile; FWA 28 November 2019 14 cities
Vodafone Mobile 5 March 2020 8 cities by mid-2020
Austria Drei (Three) Austria Mobile; FWA 19 June 2019 4 cities (Linz, Wörgl, Pörtschach and Vienna)
Magenta Telekom (T- Mobile Austria)
Mobile 26 March 2019 28 cities
A1 Telekom Mobile 27 January 2020 129 municipalities Download and upload speeds from 100 Mbps/50 Mbps to 500 Mbps/70 Mbps.
Belgium Proximus Mobile 2 April 2020 79 municipalities
Canada Bell Mobile 11 June 2020 5 cities (Calgary, Edmonton, Montreal, Toronto and Vancouver)
Rogers Mobile 15 January 2020 4 cities (Montreal, Ottawa, Toronto and Vancouver)
Using 2.5 GHz and 600 MHz spectrum; Rogers plans to start deploying with 3.5 GHz spectrum and dynamic spectrum sharing.
Telus Mobile 18 June 2020 5 cities (Calgary, Edmonton, Montreal, Toronto and Vancouver)
Czech Republic O2 Mobile 19 June 2020 2 cities (Prague and Kolin)
Finland Elisa Mobile 1 July 2019 30 cities
DNA Mobile; FWA (5G-Home)
3 June 2020 21 cities In December 2019, DNA launched “Home 5G” (FWA).
Telia Mobile; FWA 9-October 2019 8 cities In March 2019, Telia and Nokia introduced Nokia FastMile 5G gateway for 4G-5G Fixed Wireless Access (FWA).
Germany Vodafone Mobile 16 July 2019 96 cities
Telekom Deutschland Mobile 18 July 2019 8 cities, 20 cities by end of 2020
Hungary Maygar Telekom Mobile 19 April 2020 2 cities (Budapest and Zalaegerszeg)
Vodafone Mobile 17 October 2019 2 cities (Budapest and Zalaegerszeg)
Ireland Vodafone Mobile 13 August 2019 5 cities (Dublin, Cork, Limerick, Waterford and Galway)
Eir Mobile 24 October 2019 19 cities and towns
Italy Vodafone Mobile 6 June 2019 5 cities: Milan, Turin, Bologna, Rome and Naples (expects 45-50 cities to be covered by the end of 2020)
Telecom Italia (TIM) Mobile 25 June 2019 8 cities (expects to cover 120 cities by 2021)
Japan NTT Docomo Mobile 25 March 2020 35 cities and towns (expects 200 cities to have 5G service by March 2021)
Peak speeds of 3.4 Gbps to 4.1 Gbps in June 2020
KDDI Mobile 26 March 2020 15 prefectures (19 cities and townsas of in August 2020 , with 10 000 additional stations throughout all Japan’s major cities)
First unlimited 5G data plan in Japan.
Softbank Mobile 27 March 2020 12 cities and towns New services, (5G LAB and VR SQUARE) deliver immersive viewing experience, and Augmented Reality experiences, respectively.
Korea SKT Mobile 3 April 2019 85 cities (93% of population in 2019) Stand-alone (SA) 5G to be launched in 2021.
KT Mobile 3 April 2019 85 cities (93% of population in 2019)
LGU+ Mobile 3 April 2019 85 cities (93% of population in 2019)
Latvia Tele2 Mobile 22 January 2020 2 cities (Daugavpils and Jelgava) Peak theoretical download speeds of over 1 Gbps.
Table 3.2. Status of 5G commercial deployment in OECD countries
75OECD DIGITAL ECONOMY OUTLOOK 2020 © OECD 2020
3. ACCESS AND CONNECTIVITY 3. ACCESS AND CONNECTIVITY

Country Operator Technology Launch date Coverage Details
Netherlands Vodafone Ziggo Mobile 28 April 2020 50% of the Netherlands, or around 940 locations (expects to reach the entire country by July 2020)
New Zealand Vodafone Mobile 10 December 2019
4 cities (Auckland, Wellington, Christchurch and Queenstown)
Norway Telenor Mobile 13 March 2020 4 cities (Oslo, Bergen, Stavanger and Sandnes)
Telia Mobile 12 May 2020 2 cities (Lillestrøm and parts of Groruddalen in Oslo; nationwide 5G network by the end of 2023)
Poland Plus Mobile 12 May 2020 7 cities (plans to extend coverage to 3 million people by 2021)
T-Mobile Mobile 9 June 2020 11 cities
Spain1 Vodafone Mobile 15 June 2019 22 cities
Sweden Tele2 Mobile 24 May 2020 3 cities (Stockholm, Gothenburg and Malmö) Peak theoretical download speeds of over 1 Gbps.
3-Sweden Mobile 17 June 2020 5 cities (Malmö, Helsingborg, Lund, Västerås, Uppsala and Stockholm)
Telia Mobile 25 May 2020 12 cities
Switzerland Sunrise Mobile; (FWA) 1 April 2019 384 cities Vodafone and Sunrise announced partnership on 23 January 2020 to leverage their combined 5G scale.
Swisscom Mobile 17 April 2019 90% population coverage in 2019
United Kingdom
Vodafone Mobile; (FWA) 3 July 2019 44 towns and cities
EE Mobile; (FWA) 30 May 2019 80 towns and cities
Three Mobile; (FWA) 14 February 2020 (1 August 2019)2
66 towns and cities
O2 Mobile 17 October 2019 60 towns and cities
United States Sprint Mobile 1 May 2019 9 major cities (20 million people) According to the company, 5G download speeds of 213 Mbps (i.e. five times faster than Sprint’s average 4G speeds).
Verizon Wireless Mobile; (FWA) 3 Apr 2019 35 cities (plans to expand coverage to 60 cities by end of 2020)
Verizon is using millimetre wave (mmWave) spectrum for 5G. They plan to expand mmWave 5G services to a total of 60 cities during the course of 2020.
T-Mobile Mobile 6 December 2019 6 000 cities and towns SA-5G launched in August 2020
AT&T Mobile 13 December 2019
335 cities (179 million people) In June 2020, AT&T commenced dynamic spectrum sharing in parts of Texas.
1. At the time of writing only Vodafone was present in Spain. The other players (including Telefónica) planned to deploy after the 700 MHz spectrum auction to commence 5G deployments; however, the COVID-19 health emergency delayed the auction to June 2020.
2. Launch dates in parenthesis correspond to the date of launching the FWA service.
Notes: FWA = Fixed Wireless Access. Survey initially done on 11 October 2019 and updated on 30 June 2020.
Source: OECD, based on data from operators’ websites, Ookla (2020[32]), “Ookla 5G Map: Tracking 5G rollouts around the world”, www.speedtest.net/ookla-5g-map (accessed 30 June 2020) and GSMA (2020[33]), “5G Global Launches & Statistics”, www.gsma.com/futurenetworks/technology/understanding-5g/5g-innovation (accessed on 30 June 2020).
Many operators in the OECD area are predominately relying on low and mid- range spectrum for initial 5G commercial network deployments (e.g. 700 MHz and 3.5 GHz frequency bands), some operators have started to deploy commercial networks making use of higher spectrum frequency bands (i.e. mmWave spectrum), which may necessitate the use of complementary solutions to resolve indoor network coverage.
Table 3.2. Status of 5G commercial deployment in OECD countries (cont.)
76 OECD DIGITAL ECONOMY OUTLOOK 2020 © OECD 2020
3. ACCESS AND CONNECTIVITY 3. ACCESS AND CONNECTIVITY

While in its initial stages 5G is being deployed in OECD countries for enhanced mobile broadband applications, in a second stage is likely to be driven by applications across economic sectors, such as health, energy, mining, robotics, automotive, and so forth. Thus, 5G may represent a paradigm shift as the first standard conceived with the IoT world in mind, where different connected devices have diverse network requirements (OECD, 2019[2]). In particular, “network slicing” may be key for innovative IoT and AI business models. As one of the main features of 5G, network slicing offers the possibility of several customised virtual networks over one physical infrastructure. However, the transformational aspects of 5G are likely to commence after 2020, when “stand-alone” (SA) 5G networks start their deployment. It is believed that SA-5G networks will increasingly make use of network slicing, with productivity effects across all sectors in the economy.
Several OECD countries have concrete plans for SA-5G networks. In Korea, all three operators expected to launch SA-5G networks in 2021 with industrial applications. In the United States, T-Mobile expected to launch SA-5G networks by the end of 2020.
OECD partner economies also expect to launch SA-5G. For example, in Singapore, the Infocomm Media Development Authority (IMDA) announced in April 2020 that Singtel, together with StarHub and M1, will deploy a nationwide SA-5G network from January 2021 onwards. According to the Ministry for Communications and Information in Singapore a “secure and resilient 5G infrastructure” will be the backbone of its digital economy (IMDA, 2020[31]).
The COVID-19 crisis has placed unprecedented demand on communication networksAs mobility restrictions are enforced to contain the spread of COVID-19, increasingly the estimated 1.3 billion citizens of OECD countries are working and studying from home. Fora such as the G7 and G20 are co-ordinating critical international policy on line. Along the entire Internet value chain, the various players are experiencing as much as 60% more Internet traffic than before the outbreak. This includes fixed and mobile broadband operators, content and cloud providers, and Internet exchange points (IXPs), where Internet networks connect to exchange traffic. In this unprecedented situation, the resilience and capability of broadband networks has become even more critical.
Fixed and mobile operators are witnessing a surge in Internet traffic:
● In Canada, between 16 March and 27 April 2020, operators reported an increase of Internet traffic through fixed broadband connections of 48.7% and 69.2% for download and upload traffic, respectively (CWTA, 2020[34]).
● In Colombia, during the first two weeks of confinement (i.e. the last two weeks of March 2020), total Internet traffic increased by 37%; levels increased by 20% to 42% depending on the operator (CRC, 2020[35]).
● In France, Orange reports that its international infrastructure has been in high demand. Some 80% of traffic generated by Orange users in France went to the United States, where a good part of entertainment and content are located (Orange, 2020[36]).
● In Italy, Telecom Italia traffic has increased by 70% to 90% in the fixed network and by 30% in the mobile network.
● In Japan, NTT Communications reports an increase in data usage of 30% to 40%.
● In Korea, operators have reported traffic increases of 13%, reaching 45% to 60% of their deployed capacity (Woo-hyuan, 2020[37]).
● Telefónica reports nearly 40% more bandwidth in Spain, with mobile traffic growth of 50% in voice and 25% in data (Telefónica, 2020[38]).
● In the United Kingdom, BT reports a 35% to 60% increase in daytime weekday fixed broadband usage (BT, 2020[39]).
● In the United States, Verizon reported a 47% increase in use of collaboration tools and a 52% increase of virtual private network traffic (Verizon, 2020[40]). AT&T has seen mobile voice and Wi-Fi call minutes up by 33% and 75%, respectively, while consumer voice minutes were up by 64% on fixed lines: a reversal of previous trends. AT&T also reported its core network traffic was up by 23% (AT&T, 2020[41]).
77OECD DIGITAL ECONOMY OUTLOOK 2020 © OECD 2020
3. ACCESS AND CONNECTIVITY 3. ACCESS AND CONNECTIVITY
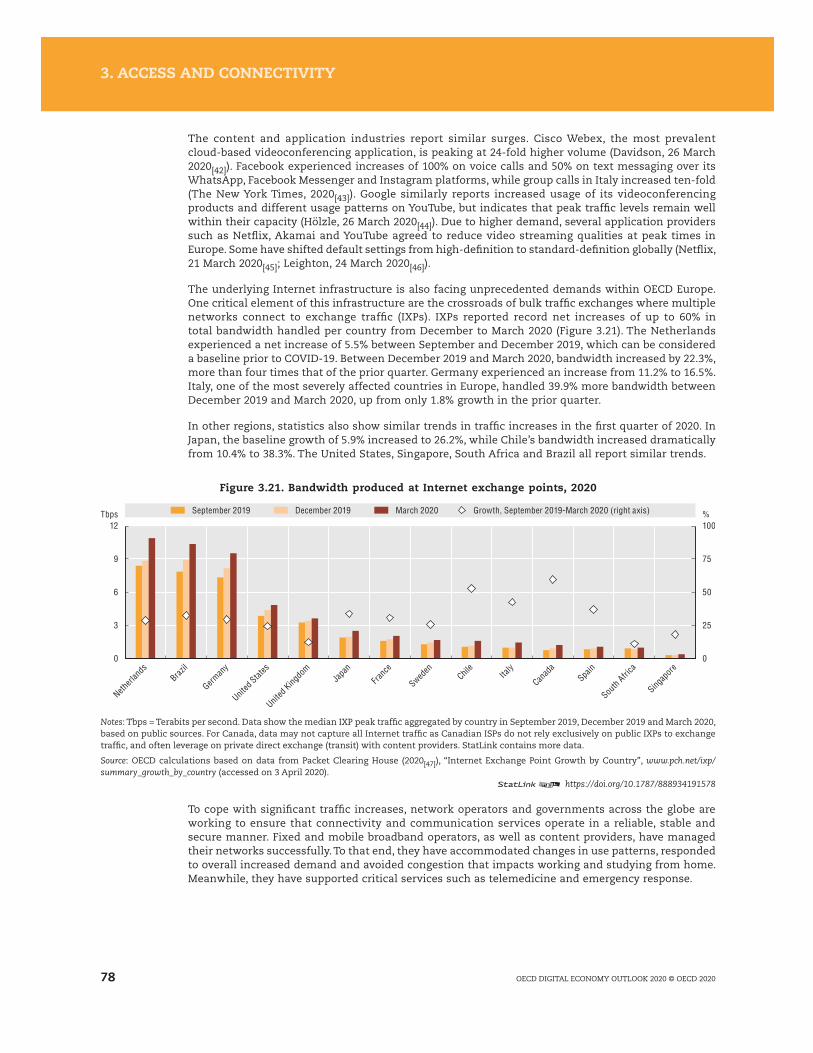
The content and application industries report similar surges. Cisco Webex, the most prevalent cloud-based videoconferencing application, is peaking at 24-fold higher volume (Davidson, 26 March 2020[42]). Facebook experienced increases of 100% on voice calls and 50% on text messaging over its WhatsApp, Facebook Messenger and Instagram platforms, while group calls in Italy increased ten-fold (The New York Times, 2020[43]). Google similarly reports increased usage of its videoconferencing products and different usage patterns on YouTube, but indicates that peak traffic levels remain well within their capacity (Hölzle, 26 March 2020[44]). Due to higher demand, several application providers such as Netflix, Akamai and YouTube agreed to reduce video streaming qualities at peak times in Europe. Some have shifted default settings from high-definition to standard-definition globally (Netflix, 21 March 2020[45]; Leighton, 24 March 2020[46]).
The underlying Internet infrastructure is also facing unprecedented demands within OECD Europe. One critical element of this infrastructure are the crossroads of bulk traffic exchanges where multiple networks connect to exchange traffic (IXPs). IXPs reported record net increases of up to 60% in total bandwidth handled per country from December to March 2020 (Figure 3.21). The Netherlands experienced a net increase of 5.5% between September and December 2019, which can be considered a baseline prior to COVID-19. Between December 2019 and March 2020, bandwidth increased by 22.3%, more than four times that of the prior quarter. Germany experienced an increase from 11.2% to 16.5%. Italy, one of the most severely affected countries in Europe, handled 39.9% more bandwidth between December 2019 and March 2020, up from only 1.8% growth in the prior quarter.
In other regions, statistics also show similar trends in traffic increases in the first quarter of 2020. In Japan, the baseline growth of 5.9% increased to 26.2%, while Chile’s bandwidth increased dramatically from 10.4% to 38.3%. The United States, Singapore, South Africa and Brazil all report similar trends.
Figure 3.21. Bandwidth produced at Internet exchange points, 2020
0
25
50
75
100
0
3
6
9
12%September 2019 December 2019 March 2020 Growth, September 2019-March 2020 (right axis)Tbps
Netherl
ands
Brazil
German
y
United
States
United
Kingdo
mJa
pan
Franc
e
Sweden
Chile
Italy
Canad
aSpa
in
South
Africa
Singap
ore
Notes: Tbps = Terabits per second. Data show the median IXP peak traffic aggregated by country in September 2019, December 2019 and March 2020, based on public sources. For Canada, data may not capture all Internet traffic as Canadian ISPs do not rely exclusively on public IXPs to exchange traffic, and often leverage on private direct exchange (transit) with content providers. StatLink contains more data.
Source: OECD calculations based on data from Packet Clearing House (2020[47]), “Internet Exchange Point Growth by Country”, www.pch.net/ixp/summary_growth_by_country (accessed on 3 April 2020).
12 https://doi.org/10.1787/888934191578
To cope with significant traffic increases, network operators and governments across the globe are working to ensure that connectivity and communication services operate in a reliable, stable and secure manner. Fixed and mobile broadband operators, as well as content providers, have managed their networks successfully. To that end, they have accommodated changes in use patterns, responded to overall increased demand and avoided congestion that impacts working and studying from home. Meanwhile, they have supported critical services such as telemedicine and emergency response.
78 OECD DIGITAL ECONOMY OUTLOOK 2020 © OECD 2020
3. ACCESS AND CONNECTIVITY 3. ACCESS AND CONNECTIVITY

Developments in communication policy and regulation
Various regulatory frameworks have been adapted in the past three yearsOver the past three years, policy makers and regulators have been adapting regulatory frameworks to spur competition, innovation and investment in communication markets. Several OECD countries are reviewing their regulatory frameworks, public policies and telecommunication laws. For example, in 2017, the Government of Canada announced its intention to review and modernise Canada’s communication legislative framework. In February 2019, the Canadian Radio-television and Telecommunications Commission issued a notice to review the regulatory framework regarding mobile services. For OECD countries within the European Union (EU) area, the publication of the new European Electronic Communications Code (EECC) in December 2018 completed the overhaul of the European Telecommunication framework.7 EU member states will have to transpose the EECC into national legislation by 21 December 2020. Therefore, many changes of telecommunication frameworks at a national level are expected to occur in the next couple of years.
The changing nature of communication markets, such as the increase in convergence, has driven significant modifications in the mandates and responsibilities of communication regulators in OECD countries. In Colombia, for example, the new ICT Modernisation Law created a converged regulator by merging the audio-visual broadcasting regulatory entity with the communications regulator.8 In Finland, the Law on Electronic Communications was reformed in 2018, and merged the communication and transport regulator into one entity, Traficom. Germany is transposing provisions of the EECC into the German Telecommunications Act. In this way, the Federal Ministry for Economic Affairs and Energy and the Federal Ministry of Transport and Digital Infrastructure aim to create a modern regulatory framework. It will pave the way for an accelerated rollout of high-capacity networks, as well as creating a level playing field for communication and over-the-top providers.
Adapting the regulatory framework for closing down legacy networksSeveral OECD countries have begun the transition of legacy networks and services, such as copper fixed networks, and are adapting regulatory frameworks to the evolving nature of networks. For example, in Italy, the regulator adopted measures for the migration from legacy copper network of the incumbent to a Next Generation Access (NGA) network.9 In OECD countries within in the EU area, the EECC (Article 81) establishes that operators with significant market power should notify in a timely manner their plan to migrate from legacy infrastructure (including copper networks). Furthermore, the regulator should ensure this transition occurs in a timely and transparent manner (European Commission, 2018[48]). In Mexico, asymmetric regulation has been imposed to the “preponderant” economic agent in the communication sector (i.e. a similar notion to the player with significant market power). The regulation requires this agent to transition its legacy network to fibre, and to provide non-discriminatory access to wholesale services to rival operators. In the United Kingdom, the communication regulator, Ofcom, has noted the need for regulatory approaches that encourage investment in fibre-to-the-premises (FTTP) deployment, or what it calls “full-fibre broadband” (Ofcom, 2020[49]).
Data-driven regulation gains in importance through applications that monitor the quality of communication networks
OECD countries increasingly make use of data-driven regulation to complement traditional regulatory tools. Austria, France, Germany and Korea, for example, rely on the power of disclosing information to steer communication markets in the right direction. In particular, the transparency generated by data on network quality provides incentives for operators to “self-regulate” and invest in network improvements. These types of measures may become increasingly important with the next evolution of fixed and wireless networks.
Arcep, the communication regulator in France, is seeking to provide users with precise and personalised information. This could come from users (crowdsourcing) or be collected by the regulator from operators (Arcep, 2019[50]). Arcep’s priority is to make data on coverage and quality of communication networks available to users. In this way, competition extends beyond prices to also include network quality. Since “crowd-sourced” quality measures of broadband depend on the user’s connection at home, France moved to use more complex techniques in December 2018. Such techniques, such as application
79OECD DIGITAL ECONOMY OUTLOOK 2020 © OECD 2020
3. ACCESS AND CONNECTIVITY 3. ACCESS AND CONNECTIVITY
programming interfaces, will be implemented in operators’ set-top boxes to measure the quality of networks more accurately.
In a similar fashion, the Korean government, through the National Information Society Agency (NIA), monitors the quality of broadband providers through “in the field” measurements, and renders the results publicly available. According to the NIA, the service quality evaluation has significantly contributed to broadband development, as operators increased network quality each publication of the results. Furthermore, it has helped increase competition by providing users with objective quality information on communication services. In this way, they can choose providers accordingly.
Austria and Germany provide two other examples of broadband quality measurements by regulatory authorities. The Austrian communication regulator, RTR, offers a certified measurement of fixed broadband quality. This allows consumers to make conclusive statements about the quality of the service and may be used to file complaints. The German communication regulator, the Bundesnetzagentur (BNetza), has operated a broadband measurement tool since October 2015. It enables users to measure the download and upload speeds of their fixed and mobile broadband connections.
Extending access through policies reducing the cost of broadband deploymentBesides reviewing the overall regulatory frameworks and telecommunication laws, OECD countries are further focusing on how to extend and improve access through policies to reduce broadband deployment costs. These include work on infrastructure sharing and co-investment provisions, as well as dig-once policies.
With the increasing need for high-quality networks, new partnerships and infrastructure-sharing agreements among operators will likely become common to reduce deployment costs. Many OECD countries have witnessed network sharing, either passive infrastructure or active mobile infrastructure such as antenna-, site-, radio access network- or even spectrum sharing. In addition, most encourage infrastructure sharing, provided it does not undermine competition. Passive infrastructure sharing has been common in such OECD countries as Australia, Colombia, France, Korea and Switzerland. There are also increasing examples within the OECD of active infrastructure sharing. Communication operators in the Czech Republic, Germany, France, Spain, Sweden and Switzerland, for example, have radio access network (RAN) sharing agreements. Meanwhile, operators in several OECD countries, for example Colombia and France, have national roaming agreements.
More and more OECD countries have adopted policies to reduce broadband deployment costs through co-investment or joint deployment of broadband networks. For example, in OECD countries within the EU zone, the EECC envisages incentives to foster co-investment because it provides for regulatory relief to operators entering into such agreements.10
A number of OECD countries have focused on “dig-once” policies. On the one hand, these aim to leverage non-broadband infrastructure projects (e.g. utilities, street light providers and highway/road construction). On the other, they seek to reduce the costs of broadband network deployment. For example, in January 2020, Colombia updated its regulation for passive infrastructure sharing (i.e. towers, poles, and ducts). This resulted in faster procedures for new agreements and estimated fee reductions of up to 74% (CRC, 2020[51]). Countries in the European Union transposed the European Union Broadband Cost Reduction Directive (2014/61/EU) into national legislation by January 2016. This includes provisions that allow communication network operators to access other utility networks. In Germany, the fifth action to amend the German Telecommunications Act, was enforced by the end of 2019. It contains additional provisions regarding transparency of mobile network coverage. It also has measures relating to co-ordination of civil works regarding the deployment of high-speed telecommunication infrastructure in areas of public funding. In Switzerland, through commercial agreements in the past decade, Swisscom has signed several contracts of co-operation with municipal utilities to deploy fibre-to-the-home networks on communal territories.
Facilitating the deployment of 5G networks is a key priority for OECD countriesThe required “network densification” for 5G deployment may magnify the traditional challenges of operators or tower companies in securing rights of way (i.e. permissions to install towers or masts). As such, it will have important technical, regulatory and policy implications for all levels of government
80 OECD DIGITAL ECONOMY OUTLOOK 2020 © OECD 2020
3. ACCESS AND CONNECTIVITY 3. ACCESS AND CONNECTIVITY

(where municipalities will play a key role), industry and the public (OECD, 2019[2]). Policies seeking to streamline rights of way, increase backhaul and backbone connectivity, and promote efficient spectrum management should ease the deployment of 5G networks. Several OECD countries have regrouped these policies in national 5G strategies.
Several OECD countries have been working to streamline rights of way to facilitate network densification. In the United States, the Federal Communications Commission (FCC) adopted the “Accelerating Wireless and Wireline Broadband Deployment by Removing Barriers to Infrastructure Investment” order on September 2018 (FCC, 2018[52]). The decision clarifies how much municipalities may reasonably charge for small cell deployment given the practicalities of 5G deployment and its importance to the United States. In offering guidelines for determining this value, the FCC cited the rules of 20 states that limit charges to USD 500 for use of an existing pole, USD 1 000 for installation of a new pole and recurring fees of USD 270 (OECD, 2019[2]). The United Kingdom reformed its Electronic Communications Code in 2017 as part of the Digital Economy Act 2017. These reforms, which came into force in December 2017, were intended to reduce the cost and make it easier for operators to deploy communication infrastructure. In Colombia, the regulation for passive infrastructure sharing was to be revised in 2021 to include installations that may be required for 5G deployment (e.g. small sites, post lamps, indoor installations, etc.).
Taking fibre backhaul closer to the end user is important for increasing speeds across all technologies, not only 5G. This is true whether the speed is for a business location or residential dwelling, and includes final connections using co-axial cable or copper. A growth in fibre backhaul availability should help support projected capacity demands, particularly demands raised by 5G networks (OECD, 2019[2]).
Several OECD countries have adopted policies to enhance backhaul and backbone connectivity. For example, Korea requires network operators to share fibre cables, including backhaul, but to maintain incentives to invest. In its “Future Telecoms Infrastructure Review”, the United Kingdom sets out such measures as allowing “unrestricted access” to Openreach ducts and poles (i.e. BT’s physical infrastructure company) for both residential and business broadband use, including for essential mobile infrastructure (DCMS, 2018[53]). The Irish communication regulator (ComReg), has mandated access to dark fibre on the operator with significant market power (SMP) in certain circumstances. In Sweden, the operator with SMP – Telia – must provide access to a backhaul connection between an operator’s co-located equipment and a point no more than 50 km away. This would allow a so-called backhaul connection for transport to the operator’s own network (PTS, 2015[54]).
11
Promoting efficient spectrum managementIn mobile markets, OECD countries continue to focus on efficient spectrum management to boost deployment of the next generation of wireless networks. Spectrum is the primary essential input for wireless communications. Therefore, its timely availability is of critical importance for the next generation of wireless networks (OECD, 2019[2]). Spectrum assignments for wireless networks have been prominent in in the OECD since 2016 (e.g. Austria, Canada, Chile, Denmark, Finland, France, Germany, Ireland, Italy, Latvia, Spain, Sweden, Switzerland, the United Kingdom and the United States). Spectrum auctions conducted in OECD countries follow, in general, the principle of technological neutrality. That said, many recent auctions have intended to encourage 5G deployments.
When designing spectrum auctions, policy makers need to strike a balance between several policy objectives. These include expanding network coverage and investment, assigning spectrum to the operator that will make the most efficient use of it (expressed by its willingness to pay), and promoting competition.
Spectrum assignment procedures (i.e. auctions or comparative selection processes) in OECD countries in the past three years have taken into account coverage obligations and/or included means to promote market competition (e.g. giving priority to new entrants, spectrum caps – generic or spectrum-specific – or commitment to host mobile virtual network operators [MVNOs]). For example, in France, Arcep has imposed obligations in spectrum auctions such as hosting MVNOs (i.e. 800 MHz auction) or spectrum caps (i.e. 700 MHz allocation). In the June 2019 auction for spectrum licences of the 2.1 GHz and 3.6 GHz bands, Germany included coverage obligations of 98% of all households per federal state with 100 Mbps by the end of 2022. It also included coverage of all transport ways (motorways, main roads,
81OECD DIGITAL ECONOMY OUTLOOK 2020 © OECD 2020
3. ACCESS AND CONNECTIVITY 3. ACCESS AND CONNECTIVITY

waterways, railways) by the end of 2022 or 2024 (BNetza, 2018[55]). In 2011, during the 800 MHz auction, Spain imposed commitments on operators to jointly cover 90% of the villages with fewer than 5 000 inhabitants at 30 Mbps. In 2018, it finalised regulations to this effect (Government of Spain, 2018[56]).
National strategies fostering 5G deploymentsMany OECD countries have published strategies to promote 5G deployment in the last three years. For example, Australia published a 5G strategy in October 2017. It recognised the potential benefits of 5G to the country’s economy, identifying actions to support the timely rollout. In Austria, the Broadband Strategy 2030 embedded a vision for 5G. Published in August 2019, Austria’s Path to the Gigabit Society aims to realise a nationwide coverage with gigabit connections (both fixed and mobile) by 2030.12 In Colombia, MinTIC published the 5G Plan in December 2019. It identifies policy challenges linked to 5G deployment and sets a strategy to foster its adoption. The Colombian communication regulator (Comisión de Regulación de Comunicaciones, CRC) followed this plan with a regulatory framework analysis to identify potential barriers to 5G deployment. Additionally, in June 2020, MinTIC granted five licences for 5G trials to establish case studies for the industry and foster a 5G ecosystem.
The European Union has several 5G initiatives, such as the 5G Action Plan and the 5G Infrastructure Public Private Partnership for 5G (European Commission, 2019[57]). In France, the government published its 5G national strategy in December 2017 (Ministère de l’économie et des finances, 2018[58]). Meanwhile, Arcep released a report to share its understanding of the issues and challenges to foster deployment of 5G networks (Arcep, 2018[59]). Germany established a Government 5G Strategy 5G-Strategie für Deutschland in July 2017 (Federal Government of Germany, 2018[60]). On 18 November 2019, the German government released the Mobilfunkstrategie (Mobile Radio Strategy) to improve 4G-network connectivity, while helping accelerate 5G deployment. In Korea, to maximise impact of early 5G commercialisation (April 2019), the government established a comprehensive 5G strategy named 5G+ on 8 April 2019 (Box 3.1). It aims to promote a “5G ecosystem” where 5G is the underlying infrastructure connecting advanced devices and innovative services.
Box 3.1. Korea’s 5G+ strategy: To realise innovative growth
For Korea, 5G is a core infrastructure of the 4th Industrial Revolution, characterised by the ability to connect all objects in a network and transmit large volumes of data at high speeds and in real time (i.e. ultra-low latency). In addition, 5G can trigger a ripple effect in large investments and across upstream and downstream industries. The Korean government sees it as a driving force of Korea’s new economic growth.
The 5G+ Strategy in Korea aims to create a holistic and safe 5G environment by integrating advanced devices and innovative services that connect all things to the 5G infrastructure. In particular, it plans to focus efforts on ten core industries1 and five core services based on 5G networks (i.e. digital health care, immersive contents, smart factories, autonomous vehicles and smart cities). To this end, the government aims to support growth of the 5G market through its use in the public sector and to accelerate private-sector investment. At the same time, it expects the strategy will address institutional barriers to innovative convergent services.
The Korean action plan aims to i) secure early market dominance and improve quality of life with lead investment by the public sector; ii) create a testbed and pursue industrial advancement to attract private investment; iii) support adoption of 5G services and user protection through institutional improvements; iv) develop companies and talent that match the global standard; and v) promote globalisation of Korea’s 5G technology and services by supporting their overseas expansion.
1. The industries included are wearable devices, Augmented Reality and Virtual Reality devices, next-generation smart phones, network equipment, edge computing, information security, 5G Vehicle-to-Everything communication (V2X) for self-driving cars, connected robots, drones and intelligent CCTV.
Source: MSIT (2019[61]), “5G+ strategy to realize innovative growth”, https://www.msit.go.kr/cms/english/pl/policies2/__icsFiles/afieldfile/2020/01/20/5G%20plus%20Strategy%20to%20Realize%20Innovative%20Growth.pdf.
82 OECD DIGITAL ECONOMY OUTLOOK 2020 © OECD 2020
3. ACCESS AND CONNECTIVITY 3. ACCESS AND CONNECTIVITY
In Spain, the 5G National Plan aims to become the foundation to maximise the benefits from 5G for the telecommunication sector and more broadly for economic and social development. The plan is grounded on three main pillars: spectrum management; 5G trials and fostering research in 5G; and taking advantage of Spain’s extensive fibre optic network coverage.
The United Kingdom aspires for 5G to cover most of the population by 2027. The Future Telecoms Infrastructure Review analysed the telecommunication market to understand incentives for investment in future infrastructure and assess whether the market could deliver the government’s aims (DCMS, 2018[53]). The report suggested incentives to encourage 5G investment such as streamlining rights of way and obliging the installation of fixed fibre in new buildings.
In the United States, the FCC released a comprehensive strategy to “Facilitate America’s Superiority in 5G Technology” (“5G FAST Plan”), and has acted to foster 5G deployment. The plan seeks to make more spectrum available to the market and to update infrastructure policy so as to reduce deployment costs and modernise regulation (FCC, 2018[62]).
Broadband targets and universal service provisions are used to promote an inclusive digital transformation in the OECD
Almost all OECD countries have established broadband access targets, and somewhat less commonly, usage targets. National targets differ in elements such as end-dates, speed and proportion of population or premises to be covered.
Within the OECD, Korea has the highest target in terms of download speeds: 10 Gbps to half of urban households (85 cities) by 2022. When considering both percentage of households, timeframe and speed contemplated, Luxembourg has the highest access target with a goal of offering 1 Gbps to all households by 2020. Sweden follows with the goal of connecting 98% of both households and businesses with 1 Gbps broadband by 2025. Meanwhile, Belgium aims to provide that speed to half of its households by 2020. Austria is targeting nationwide coverage of 1 Gbps broadband connections (i.e. both fixed and mobile) by 2030. In Canada, the government aims for 90% of Canadians to access 50 Mbps download speeds by 2021, with the remainder to be served over the subsequent decade (CRTC, 2016[63]). By 2020, the United States aims for broadband of 100 Mbps or more in 80% of households; Norway has the same goal for 90% of households.
A growing number of countries in the OECD have changed their legal frameworks to include broadband as part of their universal service framework. In 2018, Switzerland became the first country to include broadband in its universal service obligations, followed by Australia, Belgium, Canada, Finland, Spain and Sweden, among many others.. In Canada, a 2016 decision declared broadband Internet a basic service, which recognises broadband as part of its universal service framework (OECD, 2018[64]). Korea fixed broadband was designated as a universal service in January 2020. In Mexico, the constitutional reform of the telecommunication sector in 2013 included notions of universal service. It underscored the state should guarantee access to ICTs, including broadband services.
OECD countries are adapting to new developments in convergence and competition in communication markets
A key issue for policy makers and regulators has been the effects of market structures on delivery of efficient and inclusive communication services. Due to convergence, bundles of communication services have become more pervasive in the OECD area. These developments have been key drivers for market consolidation in recent years.
In approving mergers between mobile network operators, competition and regulatory authorities in OECD countries have imposed a number of conditions. These include divestment of spectrum or facilities (e.g. towers) to open possibilities for new mobile network operators (MNOs); allowing other operators on their networks through wholesale access obligations; and new innovative remedies to reduce consumer switching costs. In Italy, for example, the main remedy issued in 2017 for the Hutchison 3G/Wind merger in Italy allowed a new MNO entry by divesture of spectrum and a transitional roaming agreement.13 As a result of these commitments, Italy experienced the entry of a challenger MNO in 2016. In 2019, the European Commission cleared the Vodafone–Liberty global merger subject to remedies. This included the company granting wholesale access to its cable network in Germany to its rival company,
83OECD DIGITAL ECONOMY OUTLOOK 2020 © OECD 2020
3. ACCESS AND CONNECTIVITY 3. ACCESS AND CONNECTIVITY

Telefónica Deutschland. In the United States, within the context of discussed merger remedies for the T-Mobile – Sprint merger of 2019, the Department of Justice may require the merged entity to support eSIMs14 to reduce consumers’ switching costs (Bohn, 2019[65]).
Several policies aim to ease market entry and reduce switching costs for the IoTPrevious OECD work has highlighted several policies to spur development of the IoT. Those include fostering interoperability; an efficient spectrum management; the extraterritorial use of numbers; and solutions to help consumers switch providers and avoid lock-in (OECD, 2018[1]). Several OECD reports have highlighted extraterritorial numbers as a way to increase competition (OECD, 2012[66]; OECD, 2015[67]). For example, Italy allowed the use of extraterritorial numbering resources for the IoT in 2016, creating a clear regulatory framework for SIMs used in connected vehicles.15 For OECD countries in the European Union area, EU member states may allow the use of certain national numbering resources in an extraterritorial manner. This could include, in particular, certain non-geographic numbers (European Commission, 2018[48]), which could be the case of a new M2M range.
Several OECD countries have reviewed their net neutrality frameworksSome countries have reviewed their legislative frameworks around network neutrality in the past years. The European Union published a report in April 2019 on the implementation of its Open Internet Access Rules (Regulation (EU) 2015/2120), which compared the current situation with the one in 2015. The report concluded “the Regulation’s principles are appropriate and effective in protecting end-users’ rights and promoting the Internet as an innovative engine” (European Commission, 2019[68]). The Body of European Regulators for Electronic Communications (BEREC) reviewed its guidelines on the implementation of European net neutrality rules by national regulators. BEREC held a public consultation on the guidelines between 10 October 2019 and 28 November 2019, and they were adopted in June 2020.
Some countries have been discussing whether 5G network “slicing” will be consistent with their “net neutrality” regulation. In 2016, BEREC had already recognised that network slicing in 5G networks may be used to deliver “specialised services” (BEREC, 2016[69]). In 2019, BEREC further clarified that the regulatory framework allows for 5G technologies, such as network slicing, Standardised 5G QoS Identifier (5QI) and Mobile Edge Computing. It stated that both tariffs with different quality of service (QoS) parameters (as long as they remain application-agnostic), as well as specialised services, were possible (BEREC, 2019[70]).
In Japan, a study group organised by the Ministry of Internal Affairs and Communications began discussing network neutrality in 2018. It produced a report in April 2019 (Box 3.2).
Box 3.2. Expert discussion on network neutrality in Japan
In October 2018, the Ministry of Internal Affairs and Communications in Japan set up a study group on network neutrality. The group discussed potential provisions to maintain the benefits of “the openness of the Internet”. At the same, it considered the evolution of the Internet, including the growing number of mobile broadband subscriptions and the rapid increase in IP traffic.
The interim report in April 2019 highlights the rights of users (consumers and business). Namely, users are entitled to: i) use the Internet and access content and applications freely; ii) provide their content and applications freely to other users; iii) connect to the Internet freely through any device that complies with technical standards; and iv) use communication and platform services fairly at appropriate prices. The report highlights the need to continuously monitor network neutrality At the same time, co-regulatory approaches, including use of the revised Telecommunications Business Act, can ensure compliance with network neutrality principles. This includes the revised Telecommunications Business Act. In addition, it states that network neutrality is closely connected to safeguarding users’ rights. It provides the direction of future approaches for issues such as “traffic management” and “zero rating”.
Source: MIC (2019[71]), “Interim report on Study Group on Network Neutrality”.
84 OECD DIGITAL ECONOMY OUTLOOK 2020 © OECD 2020
3. ACCESS AND CONNECTIVITY 3. ACCESS AND CONNECTIVITY
In Mexico, the Federal Telecommunications Institute opened the draft guidelines for traffic and network management for public consultation in December 2019, which ended on July 2020. Among several objectives, the guidelines seek to promote end-user freedom, provide legal certainty in terms of traffic management and foster innovation.
In the United States, the FCC enacted its 2017 Restoring Internet Freedom Order. Among other goals, the order classified broadband Internet access service as an information service, eliminated certain reporting requirements and authorised the Federal Trade Commission to oversee the privacy practices of ISPs.
The discussion of zero rating is embedded in the wider network neutrality debate. In the OECD area, governments are taking a number of different approaches towards zero rating. While some countries do not have specific zero-rating policies and regulation, others have network neutrality laws and regulation that cover zero-rating matters. Many countries with network neutrality regulation take a case-by-case approach in assessing offers in the market (OECD, 2019[72]).
Governments are seeking ways to foster IPv6 adoptionPolicy makers can enable the IPv6 transition in three key ways. They can establish government promotion programmes to upgrade Internet services. They can adapt government purchasing. Finally, they can promote multi-stakeholder task forces to foster IPv6 deployment. IPv6 may also be important for the IoT for scalability, security (end-to-end encryption) and numbering reasons. For example, a “focal user” approach can play an important role in facilitating the transition to IPv6. Governments and large companies can sometimes play this role (OECD, 2018[73]).
16
In 2017, OECD Reviews of Digital Transformation: Going Digital in Sweden recommended that the government could work as an enabler of the IPv6 transition by establishing government promotion programmes to adjust Internet services for which it has responsibility, adapting government purchasing and ensuring multi-stakeholder task forces to foster IPv6 deployment to foster IPv6 in the country (OECD, 2018[73]).
The government of Sweden implemented this recommendation in 2019 and provided the communication regulator, PTS, with funds to promote IPv6 deployment.
Connectivity and COVID-19: Keeping the Internet up and running in times of crisisAs the world weathers the COVID-19 crisis, connectivity is more essential than ever to ensure that economic activities can continue remotely. In addition, disparities in access to communication services among and within countries may accentuate the consequences of the crisis. Therefore, policies aiming to reduce digital divides is of paramount importance. In addition, regulation and policies that foster competition and investment in communication infrastructure become even more crucial. In the medium and long term, upgrading networks to the next evolution of fixed and wireless broadband will help ensure reliable and resilient connectivity for all.
The following good practices offer means for maintaining and supporting the networks as they evolve to meet both the surge and the changing nature of demand in network connectivity (Box 3.3).
Preventing logistical and supply-chain shortages. Network operators need to be able to order and receive new hardware and consumables to implement network upgrades and replace components that fail. If countries close borders, shortages or delays in the global supply chains could prevent network operators from repairing an outage or upgrading their capacity.
Maintaining access to key communication facilities. Data centres play a critical role, but most facilities are restricting access in response to the outbreak to prioritise scheduled maintenance by established customers. Governments should ensure that staff can access their equipment under controlled conditions in case of a critical need. In Sweden, for example, the national crisis co-ordination group for the communication sector stays in contact with the Swedish regulator (PTS) on datacentre access. While PTS cannot legally mandate datacentres to take specific actions, this is under review.
85OECD DIGITAL ECONOMY OUTLOOK 2020 © OECD 2020
3. ACCESS AND CONNECTIVITY 3. ACCESS AND CONNECTIVITY

Box 3.3. COVID-19: Key recommendations for policy makers, regulators and/or network operators to meet both the surge and the changing nature of demand
in network connectivity
Policy makers/regulators
● Ensure network operators and content providers have access to the equipment-supply chain and maintain controlled and prioritised access to datacentre facilities.
● Grant the engineering workforce of network operators and content providers the needed mobility to maintain functionality of the core and access networks and still be able to connect homes at customers’ sites. Alleviating administrative burdens would also help operators to deploy networks rapidly.
● Release additional spectrum temporarily or approve temporary commercial spectrum transactions between providers that put unused spectrum into service to alleviate congestion in mobile networks.
Network operators
● Anticipate increased demand and prevent congestion by upgrading interconnection capacity with other providers, including for additional direct traffic exchange between networks (peering).
● Track key performance indicators of the Internet infrastructure such as the Domain Name System, particularly when they are provided externally.
Regulators
● Stimulate broadband providers to deploy more fibre deeper into the networks in the medium term and gradually phase out xDSL technologies, where possible.
Source: OECD (2020[79]), Keeping the Internet up and running in times of crisis, https://www.oecd.org/coronavirus/policy-responses/keeping-the-internet-up-and-running-in-times-of-crisis-4017c4c9/.
Monitoring the performance of key Internet infrastructure services. Essential Internet infrastructure services such as the Domain Name System (DNS) are seeing more use. Unimpeded access to the DNS is crucial given its performance is a prerequisite to reaching any service on the Internet. Some operators, particularly of country-code top-level domains, perform domain resolution for public health awareness websites and related online emergency services. Operators of DNS authoritative servers should therefore monitor the load to ensure service availability. Governments could also review the configuration and standards-compliance of their national top-level domains.
Improving direct interconnection. A lack of direct interconnection among networks negatively affects the overall Internet performance in a country, while increasing costs and risk, and diminishing quality. In some countries, large communication operators may refuse to interconnect domestically with other networks. This forces smaller networks to send domestic traffic over large distances to IXPs in other countries and back, leading to higher costs and lower quality. Two large Canadian operators, for instance, peer at IXPs within the United States. This forces 64% of Canadian domestic traffic to flow through the United States. Some Latin American countries, including Mexico and Colombia, exchange an important amount of traffic outside the countries. In general, a lack of domestic interconnection negatively affects overall Internet performance in a country and also increases costs and potential risks. In Italy, one of the most affected countries, Telecom Italia agreed to open peering at two exchange points to improve network experience between 6 April and 30 June 2020 (Telecom Italia, 2020[74]). In Costa Rica, the largest communication provider (Grupo ICE) joined the local Internet exchange on 30 March 2020 to improve network experience during the crisis (La Nación, 2020[75]). Network operators should anticipate increased demand and prevent congestion by upgrading their interconnection capacity with other providers, including adding more direct traffic exchange between networks (peering).
Placing unused spectrum into service on a temporary basis. Regulators and policy makers could consider making additional spectrum available on a temporary basis for mobile operators to add capacity to the over-the-air interface. In the United States, the FCC granted approval to AT&T, Verizon and T-Mobile to reach a commercial agreement with satellite TV provider Dish. The companies could
86 OECD DIGITAL ECONOMY OUTLOOK 2020 © OECD 2020
3. ACCESS AND CONNECTIVITY 3. ACCESS AND CONNECTIVITY

thus borrow Dish’s unused wireless spectrum to address congestion created by COVID-19 quarantines (Welch, 2020[76]). In addition, the FCC granted operators temporary access to spectrum in the 5.9 GHz band to meet increased rural broadband demand and granted use of spectrum for 60 days in the AWS-4 and AWS-3 band. In Ireland, the regulator ComReg approved plans to release extra radio spectrum in the 700 MHz and 2.6 GHz bands. This added capacity for mobile phone and data connectivity. It also issues temporary Electronic Communications Services licences on 22 April 2020 to three operators (ComReg, 2020[77]; ComReg, 2020[78]). Reducing administration burdens and streamlining rights of way for faster deployment of networks is another way to expand mobile connectivity.
Increasing network capacity by upgrading legacy infrastructure. Residential broadband operators might suffer from congestion due to the inherent asymmetrical capacity of xDSL technology and oversubscription. xDSL networks use telephone infrastructure that was primarily built for low-speed analogue voice service. Most xDSL broadband services have moderate download speeds but low upload speeds. This makes them poorly suited for services requiring higher upload speeds that are needed to support work its use from home for work or other activities. While transitioning from copper to fibre takes longer-term planning, broadband providers could be encouraged in the medium term to deploy fibre deeper into their networks to gradually phase out xDSL technology and replace it with FTTx technologies. Such investments would add resilience to help combat epidemics like COVID-19 and prepare for a post-crisis environment that is likely to require more connectivity and network capacity.
87OECD DIGITAL ECONOMY OUTLOOK 2020 © OECD 2020
3. ACCESS AND CONNECTIVITY 3. ACCESS AND CONNECTIVITY

References
Amazon (27 September 2019), “Introducing Amazon Sidewalk”, Amazon Devices blog, https://blog.aboutamazon.com/devices/introducing-amazon-sidewalk (accessed on 21 October 2020).
[20]
Arcep (2019), “La régulation par la data, c’est quoi ?” [Data-driven regulation: what is it?], webpage, https://www.arcep.fr/la-regulation/grands-dossiers-thematiques-transverses/la-regulation-par-la-data.html (accessed on 21 October 2020).
[50]
Arcep (2018), 5G: An Ambitious Roadmap for France, Autorité de régulation des communications électroniques et des postes, Paris, https://www.arcep.fr/fileadmin/reprise/dossiers/programme-5G/Roadmap_5G_-_VA.pdf (accessed on 21 October 2020).
[59]
AT&T (2020), “COVID-19: Our response”, webpage, https://about.att.com/pages/COVID-19.html (accessed on 21 October 2020). [41]
Bedford, T. (2019), “Vodafone kicks off 5G roaming in 55 European cities”, Tech Radar, 26 July, https://www.techradar.com/uk/news/vodafone-kicks-off-5g-roaming-in-55-european-cities (accessed on 21 October 2020).
[28]
BEREC (2019), Report on the Impact of 5G on Regulation and the Role of Regulation in Enabling the 5G Ecosystem, Body of European Regulators for Electronic Communications, Riga, https://berec.europa.eu/eng/document_register/subject_matter/berec/reports/8910-report-on-the-impact-of-5g-on-regulation-and-the-role-of-regulation-in-enabling-the-5g-ecosystem.
[70]
BEREC (2016), BEREC Report on the Outcome of the Public Consultation on draft BEREC Guidelines on the Implementation by National Regulators of European Net Neutrality Rules, Body of European Regulators for Electronic Communications, Riga, https://berec.europa.eu/eng/document_register/subject_matter/berec/reports/6161-berec-report-on-the-outcome-of-the-public-consultation-on-draft-berec-guidelines-on-the-implementation-by-national-regulators-of-european-net-neutrality-rules.
[69]
BNetza (2018), Decision of the President’s Chamber of 26 November 2018 on the determinations and rules in detail (award rules) and on the determinations and rules for conduct of the proceedings (auction rules) to award spectrum in the 2 GHz and 3.6 GHz bands, Bundesnetzagentur für Elektrizität, Gas, Telekommunikation, Post und Eisenbahnen, Bonn, https://www.bundesnetzagentur.de/SharedDocs/Downloads/EN/Areas/Telecommunications/Companies/TelecomRegulation/FrequencyManagement/ElectronicCommunicationsServices/FrequencyAward2018/20181214_Decision_III_IV.pdf?__blob=publicationFile&v=3.
[55]
Bohn, D. (2019), “The T-Mobile–Sprint merger could mean the end of the physical SIM card”, The Verge, 26 July, https://www.theverge.com/2019/7/26/8931784/t-mobile-sprint-merger-esim-justice-department-requirement-sim-card.
[65]
BT (2020), “The facts about our network and Coronavirus”, BT Telecom, London, 20 March, https://newsroom.bt.com/the-facts-about-our-network-and-coronavirus/.
[39]
Cisco (2018), Cisco Visual Networking Index: Global Mobile Data Traffic Forecast Update, 2017–2022 White Paper - Cisco, Cisco Systems, San Jose, California, https://www.cisco.com/c/en/us/solutions/collateral/service-provider/visual-networking-index-vni/white-paper-c11-738429.html (accessed on 14 February 2020).
[9]
ComReg (2020), “ComReg to release more radio spectrum to boost mobile phone & broadband capacity”, press release, Commission for Communications Regulation, Dublin, 27 March, https://www.comreg.ie/comreg-to-release-more-radio-spectrum-to-boost-mobile-phone-broadband-capacity/ (accessed on 4 April 2020).
[77]
ComReg (2020), COVID-19 Temporary Spectrum Management Measures: Temporary ECS Licences Issued, Commission for Communications Regulation, Dublin, https://www.comreg.ie/industry/radio-spectrum/spectrum-awards/covid-19-temporary-spectrum-management-measures/.
[78]
CRC (2020), Condiciones de compartición de infraestructura pasiva de otros sectores: Resolución CRC No. 5 890 de 2020 [Conditions for Passive Infrastructure Sharing in Other Sectors: CRC Resolution No. 5 890 of 2020], Comisión de Regulación de Comunicaciones, Bogota, https://www.crcom.gov.co/es/pagina/condiciones-comparticion-infraestructura-pasiva.
[51]
CRC (2020), Reporte del tráfico de Internet durante la Emergencia Sanitaria declarada por el Ministerio de Salud y Protección Social [Internet Traffic Report during the Health Emergency declared by the Ministry of Health and Social Security], Comisión de Regulación de Comunicaciones, Bogota, https://www.crcom.gov.co/es/noticia/reporte-del-tr-fico-de-internet-durante-la-emergencia-sanitaria-declarada-por-el-ministerio-de-salud-y-protecci-n-social.
[35]
CRTC (2019), Communications Monitoring Report 2019: Figure 9.5, Canadian Radio-television and Telecommunications Commission, Ottawa-Gatineau, https://crtc.gc.ca/eng/publications/reports/policymonitoring/2019/cmr.htm.
[5]
CRTC (2016), Telecom Regulatory Policy CRTC 2016-496: Modern Telecommunications Services – The Path Forward for Canada’s Digital Economy, Canadian Radio-television and Telecommunications Commission, Ottawa-Gatineau, https://crtc.gc.ca/eng/archive/2016/2016-496.htm.
[63]
88 OECD DIGITAL ECONOMY OUTLOOK 2020 © OECD 2020
3. ACCESS AND CONNECTIVITY 3. ACCESS AND CONNECTIVITY
References and Notes
CWTA (2020), Managing Networks in Unprecedented Times, Canadian Wireless Telecommunications Association, Ottawa, https://www.cwta.ca/wp-content/uploads/2020/05/English-Managing-Networks-in-Unprecedented-Times-May-25.pdf (accessed on 2 July 2020).
[34]
Davidson, J. (26 March 2020), “Global traffic spikes. No panic at the Cisco!”, Cisco blogs, Executive Platform, https://blogs.cisco.com/news/global-traffic-spikes-no-panic-at-the-cisco.
[42]
DCMS (2018), Future Telecoms Infrastructure Review, Department for Digital, Culture, Media and Sport, United Kingdom, https://www.gov.uk/government/publications/future-telecoms-infrastructure-review (accessed on 21 October 2020).
[53]
Elisa (2017), Saunalahti-puhelinliittymät: Kotimainen liittymä aina ilman datakattoa, sitoutumispakkoa tai kytkykauppaa [Telephone Access: Domestic Subscription Always Without Data Ceiling, Commitment or Connection Trade], Elisa, Helsinki, https://elisa.fi/kauppa/#!/puhelinliittymat.
[14]
European Commission (2019), “Open Internet”, webpage, https://ec.europa.eu/digital-single-market/en/open-internet-net-neutrality (accessed on 21 October 2020).
[68]
European Commission (2019), Study on Broadband Coverage in Europe 2018, European Commission, Brussels, https://ec.europa.eu/digital-single-market/en/news/study-broadband-coverage-europe-2018 (accessed on 21 October 2020).
[21]
European Commission (2019), “Towards 5G”, webpage, https://ec.europa.eu/digital-single-market/en/towards-5g (accessed on 22 October 2020).
[57]
European Commission (2018), Directive (EU) 2018/1972 establishing the European Electronic Communications Code – European Sources Online, https://www.europeansources.info/record/directive-eu-2018-1972-establishing-the-european-electronic-communications-code/ (accessed on 26 March 2019).
[48]
European Commission (2015), Regulation (EU) 2015/758 of the European Parliament and of the Council of 29 April 2015 concerning type-approval requirements for the deployment of the eCall in-vehicle system based on the 112 service and amending Directive 2007/46/EC, European Commission, Brussels, https://eur-lex.europa.eu/legal-content/EN/TXT/?uri=celex:32015R0758.
[23]
FCC (2019), 2019 Broadband Deployment Report, Federal Communications Commission, Washington, DC, https://www.fcc.gov/reports-research/reports/broadband-progress-reports/2019-broadband-deployment-report.
[22]
FCC (2018), FCC Facilitates Wireless Infrastructure Deployment for 5G, Federal Communications Commission, Washington, DC, https://www.fcc.gov/document/fcc-facilitates-wireless-infrastructure-deployment-5g.
[52]
FCC (2018), “The FCC’s 5G FAST Plan”, webpage, https://www.fcc.gov/5G (accessed on 10 October 2018). [62]
Federal Government of Germany (2018), 5G-Strategie für Deutschland Eine Offensive für die Entwicklung Deutschlands zum Leitmarkt für 5G-Netze und-Anwendungen [5G Strategy for Germany: An offensive for the development of Germany as a lead market for 5G networks and applications], https://www.bmvi.de/blaetterkatalog/catalogs/350336/pdf/complete.pdf (accessed on 15 March 2019).
[60]
Government of Spain (2018), Orden ECE/1166/2018, de 29 de octubre, por la que se aprueba el Plan para proporcionar cobertura que permita el acceso a servicios de banda ancha a velocidad de 30 Mbps o superior, a ejecutar por los operadores titulares de concesiones demaniales en la banda de 800 Mhz [Order ECE/1166/2018, of October 29, approving the Plan to provide coverage that allows access to broadband services at speeds of 30 Mbps or higher, to be executed by operators holding demanial concessions in the 800 Mhz band], https://www.boe.es/diario_boe/txt.php?id=BOE-A-2018-15341.
[56]
GSMA (2020), “5G Global Launches & Statistics”, webpage, https://www.gsma.com/futurenetworks/ip_services/understanding-5g/5g-innovation/ (accessed on 30 June 2020).
[33]
Hölzle, U. (26 March 2020), “Keeping our network infrastructure strong amid COVID-19”, Google blog, https://www.blog.google/inside-google/infrastructure/keeping-our-network-infrastructure-strong-amid-covid-19 (accessed on 20 October 2020).
[44]
IMDA (2020), “Singapore forges ahead with nationwide 5G rollout”, news release, Infocomm Media Development Authority, Singapore, 29 April, https://www.imda.gov.sg/news-and-events/Media-Room/Media-Releases/2020/Singapore-Forges-Ahead-with-Nationwide-5G-Rollout.
[31]
ITU (2019), World Telecommunication/ICT Indicators Database 2019, International Telecommunication Union, Geneva, http://www.itu.int/pub/D-IND-WTID.OL (accessed on 21 October 2020).
[10]
Krzanich, B. (2016), “Data is the new oil in the future of automated driving”, editorial, Intel, Santa Clara, California, 15 November, https://newsroom.intel.com/editorials/krzanich-the-future-of-automated-driving/#gs.bizkkz (accessed on 21 October 2020).
[19]
La Nación (2020), ICE fortalece velocidad de Internet con ingreso a circuito de canje de datos [ICE strengthens Internet speeds by entering the IXP], La Nación, San José, Costa Rica, https://www.nacion.com/el-pais/servicios/ice-fortalece-velocidad-de-internet-con-ingreso-a/NAUB5VUERVHF5LSWLBC44V7ZVQ/story/ (accessed on 21 October 2020).
[75]
Leighton, T. (24 March 2020), “Working together to manage global Internet traffic increases”, Akamai blog, https://blogs.akamai.com/2020/03/working-together-to-manage-global-internet-traffic-increases.html.
[46]
MIC (2019), Interim Report on Study Group on Network Neutrality, Ministry of Internal Affairs and Communications of Japan. [71]
89OECD DIGITAL ECONOMY OUTLOOK 2020 © OECD 2020
3. ACCESS AND CONNECTIVITY 3. ACCESS AND CONNECTIVITY
References and Notes
Ministère de l’Économie et des Finances (2018), “Feuille de route sur la 5G : Consultation des acteurs du marché” [5G Roadmap: Market stakeholder public consultation], webpage, https://www.economie.gouv.fr/5g-france-feuille-route-quatre-chantiers-prioritaires (accessed on 21 October 2018).
[58]
Ministry of Science and ICT (2020), “Korea going beyond the world’s first to best in 5G”, press release, Ministry of Science and ICT, Government of Korea, 2 January, http://english.msip.go.kr/english/msipContents/contentsView.do?cateId=tst56&artId=2650472 (accessed on 21 October 2020).
[26]
M-Lab (2019), “Worldwide Broadband Speed League”, webpage, https://www.cable.co.uk/broadband/speed/worldwide-speed-league (accessed on 21 October 2020).
[12]
MSIT (2019), 5G+ Strategy to Realize Innovative Growth, Ministry of Science and ICT Policy Coordination Division of Korea, https://www.msit.go.kr/cms/english/pl/policies2/__icsFiles/afieldfile/2020/01/20/5G%20plus%20Strategy%20to%20Realize%20Innovative%20Growth.pdf.
[61]
Netflix (21 March 2020), “Reducing Netflix traffic where it’s needed while maintaining the member experience”, Netflix blog, https://media.netflix.com/en/company-blog/reducing-netflix-traffic-where-its-needed%E2%80%AC.
[45]
OECD (2020), Broadband Portal, (database), http://www.oecd.org/sti/broadband/oecdbroadbandportal.htm (accessed on 21 October 2020).
[8]
OECD (2020), “Keeping the Internet up and running in times of crisis”, webpage, http://www.oecd.org/coronavirus/policy-responses/keeping-the-internet-up-and-running-in-times-of-crisis-4017c4c9/.
[79]
OECD (2020), OECD Telecommunication and Internet Statistics, (database), http://dx.doi.org/10.1787/tel_int-data-en (accessed on 10 May 2020).
[6]
OECD (2019), Going Digital: Shaping Policies, Improving Lives, OECD Publishing, Paris, https://dx.doi.org/10.1787/9789264312012-en. [3]
OECD (2019), “The effects of zero rating”, OECD Digital Economy Papers, No. 285, OECD Publishing, Paris, https://dx.doi.org/10.1787/6eefc666-en.
[72]
OECD (2019), “The operators and their future: The state of play and emerging business models”, OECD Digital Economy Papers, No. 287, OECD Publishing, Paris, https://dx.doi.org/10.1787/60c93aa7-en.
[7]
OECD (2019), “The road to 5G networks: Experience to date and future developments”, OECD Digital Economy Papers, No. 284, OECD Publishing, Paris, https://dx.doi.org/10.1787/2f880843-en.
[2]
OECD (2018), “Bridging the rural digital divide”, OECD Digital Economy Papers, No. 265, OECD Publishing, Paris, https://dx.doi.org/10.1787/852bd3b9-en.
[64]
OECD (2018), “IoT measurement and applications”, OECD Digital Economy Papers, No. 271, OECD Publishing, Paris, https://dx.doi.org/10.1787/35209dbf-en.
[1]
OECD (2018), OECD Reviews of Digital Transformation: Going Digital in Sweden, OECD Publishing, Paris, https://dx.doi.org/10.1787/9789264302259-en.
[73]
OECD (2016), OECD Ministerial Declaration on the Digital Economy: Innovation, Growth and Social Prosperity (“Cancún Declaration”), OECD, Paris, https://www.oecd.org/internet/Digital-Economy-Ministerial-Declaration-2016.pdf.
[4]
OECD (2015), OECD Digital Economy Outlook 2015, OECD Publishing, Paris, https://dx.doi.org/10.1787/9789264232440-en. [67]
OECD (2013), OECD Communications Outlook 2013, OECD Publishing, Paris, https://dx.doi.org/10.1787/comms_outlook-2013-en. [80]
OECD (2012), “Machine-to-Machine Communications: Connecting Billions of Devices”, OECD Digital Economy Papers, No. 192, OECD Publishing, Paris, https://dx.doi.org/10.1787/5k9gsh2gp043-en.
[66]
Ofcom (2020), “Supercharging investment in fibre broadband”, News, Ofcom, London, 8 January, https://www.ofcom.org.uk/about-ofcom/latest/features-and-news/supercharging-investment-in-fibre-broadband (accessed on 21 October 2020).
[49]
Ookla (2020), “Ookla 5G Map: Tracking 5G Rollouts Around the World”, webpage, https://www.speedtest.net/ookla-5g-map (accessed on 21 October 2020).
[32]
Ookla (2019), Speedtest Global Index, (database), https://www.speedtest.net/global-index (accessed on 21 October 2020). [11]
Optus (2019), “5G Home Broadband Plan”, webpage, https://www.optus.com.au/for-you/broadband-nbn/5g-home-broadband/5g-home-broadband-plan#emailDetails (accessed on 21 October 2020).
[29]
Orange (2020), “Covid-19: How Orange is ensuring digital service continuity”, webpage, https://www.orange.com/en/news/2020/March/Covid-19-how-Orange-is-ensuring-digital-service-continuity (accessed on 21 October 2020).
[36]
Packet Clearing House (2020), “Internet Exchange Directory”, webpage, https://www.pch.net/ixp/dir (accessed on 21 October 2020).
[47]
PTS (2020), “Table 18, Machine-to-machine”, in Mobile Call Services and Mobile Data, The Swedish Post and Telecom Authority, Stockholm, https://statistik.pts.se/en/the-swedish-telecommunications-market/tables/mobile-call-services-and-mobile-data/table-18-machine-to-machine-m2m/.
[18]
90 OECD DIGITAL ECONOMY OUTLOOK 2020 © OECD 2020
3. ACCESS AND CONNECTIVITY 3. ACCESS AND CONNECTIVITY
References and Notes
https://www.orange.com/en/news/2020/March/Covid-19-how-Orange-is-ensuring-digital-service-continuity

PTS (2015), “SMP - Market reviews: Decision on Market 3a, 2015-02-19”, The Swedish Post and Telecom Authority, Stockholm, 19 February, https://pts.se/en/english-b/internet/smp---market-reviews/.
[54]
Steam (2019), “Steam global traffic map”, Steam Download Stats, (database), https://store.steampowered.com/stats/content (accessed on 21 October 2020).
[13]
Telecom Italia (2020), Telecom Italia SpA – Wholesale, https://www.wholesale.telecomitalia.com/it/home/-/public_news_list/publicNews/123395676 (accessed on 14 May 2020).
[74]
Telefónica (2020), “Telefónica against COVID-19”, webpage, https://www.telefonica.com/ext/westayconnected/ (accessed on 21 October 2020).
[38]
Telia (2020), “The network of the future”, webpage, https://www.telia.se/privat/om/framtidensnat (accessed on 21 October 2020). [24]
Teligen/Strategy Analytics (2020), “Teligen tariff & benchmarking market data using the OECD methodology”, https://www.strategyanalytics.com/access-services/service-providers/tariffs---mobile-and-fixed/ (accessed on 21 October 2020).
[17]
The New York Times (2020), “Facebook Is ‘Just Trying to Keep the Lights On’ as Traffic Soars in Pandemic”, The New York Times, 24 March, https://www.nytimes.com/2020/03/24/technology/virus-facebook-usage-traffic.html (accessed on 21 October 2020).
[43]
Verizon (2020), “How Americans are spending their time in the temporary new normal NYSE:VZ”, Verizon, 17 March, https://www.globenewswire.com/news-release/2020/03/17/2002248/0/en/How-Americans-are-spending-their-time-in-the-temporary-new-normal.html.
[40]
Verizon (2019), “Verizon 5G Home Internet”, webpage, https://www.verizonwireless.com/5g/home/ (accessed on 21 October 2020). [30]
Vodafone (2020), “An industrial 5G spectrum policy for Europe”, Public Policy Paper, November, Vodafone, Berkshire, United Kingdom, https://www.vodafone.com/content/dam/vodcom/files/public-policy/5g-report/an-industrial-5g-spectrum-policy-for-europe.pdf.
[27]
Wakefield, J. (2018), “Ten gigabit home broadband tested in UK”, BBC News, 13 February, https://www.bbc.com/news/technology-42974346 (accessed on 21 October 2020).
[25]
Waring, J. (2020), “SKT details next steps for 5G”, Mobile World Live, 30 March, https://www.mobileworldlive.com/featured-content/top-three/skt-details-next-steps-for-5g/.
[16]
Waring, J. (2019), “Data use surges on Korea 5G networks”, Mobile World Live, 28 May, https://www.mobileworldlive.com/asia/asia-news/data-use-surges-on-korea-5g-networks/.
[15]
Welch, C. (2020), “Dish is letting the major US carriers borrow spectrum during quarantine data crunch”, The Verge, 19 March, https://www.theverge.com/2020/3/19/21187378/dish-letting-att-verizon-tmobile-use-spectrum-coronavirus.
[76]
Woo-hyuan, S. (2020), “Internet traffic in Korea increases 13% in March as people self-quarantine”, The Korea Herald, 24 March, http://www.koreaherald.com/view.php?ud=20200324000656&ACE_SEARCH=1.
[37]
Notes
1. Total communication access paths = total access telephone lines + total fixed broadband subscriptions + cellular mobile subscriptions.
2. The baseline definition of broadband is an Internet connection above 256 kbps given that many OECD countries have different broadband definitions. One important way to visualise the data is the use of speed tiers. For more information on the methodology used to define the fixed and mobile broadband penetration indicator, visit the site: “OECD Broadband Portal: Methodology” at www.oecd.org/sti/broadband/broadband-methodology.htm
3. According to M-Lab data, mean download speeds in the OECD area have increased from 18.4 Mbps in July 2017 to 26.8 Mbps in July 2019 (M-Lab, 2019[12]).
4. M-Lab enables visualisation of the results of the Network Diagnostic Tool (NDT) test, which measures the maximum amount of data that can be transferred from an M-Lab server to the user’s device within a defined period of time (“download throughput”). Ookla employs a method for its speed tests that aims at “filling the pipe” of a testing user, to assess the capability of single computers to perform multiple downloads of one type or another simultaneously (OECD, 2013[80]).
A number of factors can be considered when comparing speed measurement based on voluntary tests by broadband customers. First, although speed tests are valuable tools to inform consumers of actual performance of broadband
91OECD DIGITAL ECONOMY OUTLOOK 2020 © OECD 2020
3. ACCESS AND CONNECTIVITY 3. ACCESS AND CONNECTIVITY
References and Notes

services, consumers may show different degrees of willingness or incentives across different countries to perform those tests. Second, speed tests are more or less popular depending on country, so the available sample may be significantly larger or smaller (OECD, 2013[80]).
5. Cisco VNI Mobile Highlights 2017-18 includes information for the United States, Canada, Chile, Mexico, Poland, France, Germany, Italy, Spain, Sweden, United Kingdom, Japan, Korea, Australia and New Zealand (Cisco, 2018[9]).
6. For the United States, the speed threshold is 25 Mbps.
7. Directive (EU) 2018/1972.
8. ICT Modernisation Law of Colombia, Law 1978 of 2019: www.funcionpublica.gov.co/eva/gestornormativo/norma.php?i=98210.
9. Decision AGCOM no. 348/19/CONS. There are two conditions to be met before announcing the decommissioning of a given local exchange: i) the coverage to be reached and ii) the percentage of accesses already migrated to Next Generation Access (NGA) networks from the given local exchange. As regards the coverage, 100% of NGA coverage needs to be reached. To this end, fixed wireless networks are also included in the coverage, but only to a limited extent. Take up of NGA has to be at least 60% of activated accesses on the given local exchange, both by SMP operator and alternative operators.
10. In the context of the European Electronic Communications Code (EECC), examples of co-investment include co-ownership, long-term risk sharing through co-financing or purchase agreements “giving rise to specific rights of a structural character”. Namely, the EECC establishes that an operator with Significant Market Power (SMP) will be able to propose commitments on offers for co-investment in new networks that consist of optical fibre elements up to the end-user premises or base station. In return for those commitments, an operator agrees to fulfil a number of criteria on access for co-investors and third parties. If the national regulatory authority makes these commitments binding, the operator with SMP would be exempted from ex-ante regulation.
11. PTS’s decision on Market 3a in 2015 stated the following. The SMP-operator should primarily provide backhaul connection by providing access to fibre-based network infrastructure (dark fibre). As an alternative, the SMP-operator should provide backhaul connection by providing optical wavelength or digital connection capacity, depending on the request from the wholesale buying operator (PTS, 2015[54])
12. Austria’s Broadband Strategy 2030 aligns with the European Commission’s strategic objectives for 2025. However, it surpasses its targets and draws a path through 2030. Its overall objective is to realise a nationwide coverage with gigabit connection (fixed and mobile) by 2030. To turn the vision of nationwide availability of gigabit-capable connection by the end of 2030 into reality, the rollout must advance in individual phases:
– phase 1: nationwide provision of ultrafast broadband connections (100 Mbit/s) by the end of 2020
– phase 2: market launch of 5G in all state capitals by the end of 2020
– phase 3: Austria as a 5G pilot country by the beginning of 2021
– phase 4: availability of 5G services along main transport paths by the end of 2023
– phase 5: availability of gigabit-capable connections nationwide by the end of 2025, including nationwide 5G coverage.
13. See the European Commission’s press release “Commission approves Hutchison/VimpelCom joint venture in Italy, subject to conditions” at https://ec.europa.eu/commission/presscorner/detail/en/IP_16_2932.
14. eSIMs represent the next generation of SIM technology, replacing physical cards with software capable of remotely switching a device between operators. The technology allows one device to host multiple connectivity providers. It is designed for use across the whole spectrum of wireless devices, including smartphones and IoT modules.
15. See decision 639/16/CONS, n. 161/17/CIR and n. 110/19/CIR.
16. In a detailed analysis in Colombia, the CRC found the end-user’s dimension was the main reason behind lack of adoption.
92 OECD DIGITAL ECONOMY OUTLOOK 2020 © OECD 2020
3. ACCESS AND CONNECTIVITY
References and Notes
Chapter 4DIGITAL UPTAKE, USAGE AND SKILLS
93OECD DIGITAL ECONOMY OUTLOOK 2020 © OECD 2020
KEY FINDINGS
�� Internet usage has significantly increased over the last decade but continues to vary widely across countries. In 2019, the proportion of adults accessing the Internet ranged from over 95% to less than 70% among OECD countries.
�� Internet use has become an everyday habit for most people in the OECD area, including seniors. In 2019, 58% of those aged 55-74 used the Internet frequently, up from only 30% in 2010. Yet this remains well below the average share of frequent Internet users aged 16-24, which was close to 95%.
�� Smartphones have become the favoured device for Internet use in many countries. For example, 75% of individuals in the European Union used a mobile phone or smartphone to connect to the Internet in 2018, up from 65% just two years earlier.
�� Mobile devices are also associated with longer time spent on line. In 2018, the average OECD student aged 15-16 spent 27 hours a week on the Internet outside school. However, time spent on the Internet daily varies significantly across countries.
�� The age of first access to the Internet has been decreasing in almost all countries in recent years. In 2018, 24% of 15 year-olds in the OECD area first accessed the Internet at the age of 6 or under compared to only 15% in 2012.
�� In 2019, on average 93% of enterprises in OECD countries had a broadband connection, up from 85% in 2010. The gap between large and small firms has narrowed to less than 7 percentage points, on average, compared to 15 percentage points in 2010. Yet the gap remains much larger in some countries.
�� Despite being a hallmark of the online age, e-commerce represents a much lower proportion of sales for firms. In 2019, e-commerce generated only 19% of total turnover on average. For those firms using e-commerce, up to 90% of revenue comes from business-to-business transactions. Large firms use e-commerce more than small ones, accounting for an average 24% of their turnover compared with just 9% in small firms.
�� By 2017, more than half of businesses in the OECD had a social media presence, up from one-third in 2013. However, this share ranges from nearly 80% to below 30% in individual countries. Fewer than one in three small firms used social media, compared to almost three-quarters of large firms. In 2017, on average, 12% of businesses in the countries for which data are available performed big data analytics, a share exceeding 20% in some countries.
�� About 12% of Internet users reported having received on-the-job training on information and communication technologies (ICTs) from co-workers or supervisors in 2018; 9% took part in an ICT-related training course paid for or directly provided by their employer.
�� The share of individuals using the Internet to interact with public authorities in OECD countries increased from 43% to 58% over 2010-19. However, this proportion is less than 40% among individuals with low or no formal education compared with 80% among those with tertiary education.
�� In 2019, around 14% of Internet users in the OECD area attended an online course. Differences across countries are notable with the share reaching 70% in Mexico and 37% in Brazil but less than 4% in Turkey.
IntroductionThis chapter provides an overview of recent developments in the use of digital technologies by individuals and businesses. It examines policies to support digital uptake based on countries’ responses to the 2019 OECD Digital Economy Policy Questionnaire. Further, it sheds light on individuals’ use of online public services and on the uptake of digital technologies by governments. It provides stylised facts on digital natives and the adult population, examines new facets of the digital divide and sheds light on ICT skills demand in the workplace and possible mismatches. Finally, it reviews policies to develop the skills required to prosper in the digital society.
94 OECD DIGITAL ECONOMY OUTLOOK 2020 © OECD 2020
4. DIGITAL UPTAKE, USAGE AND SKILLS 4. DIGITAL UPTAKE, USAGE AND SKILLS
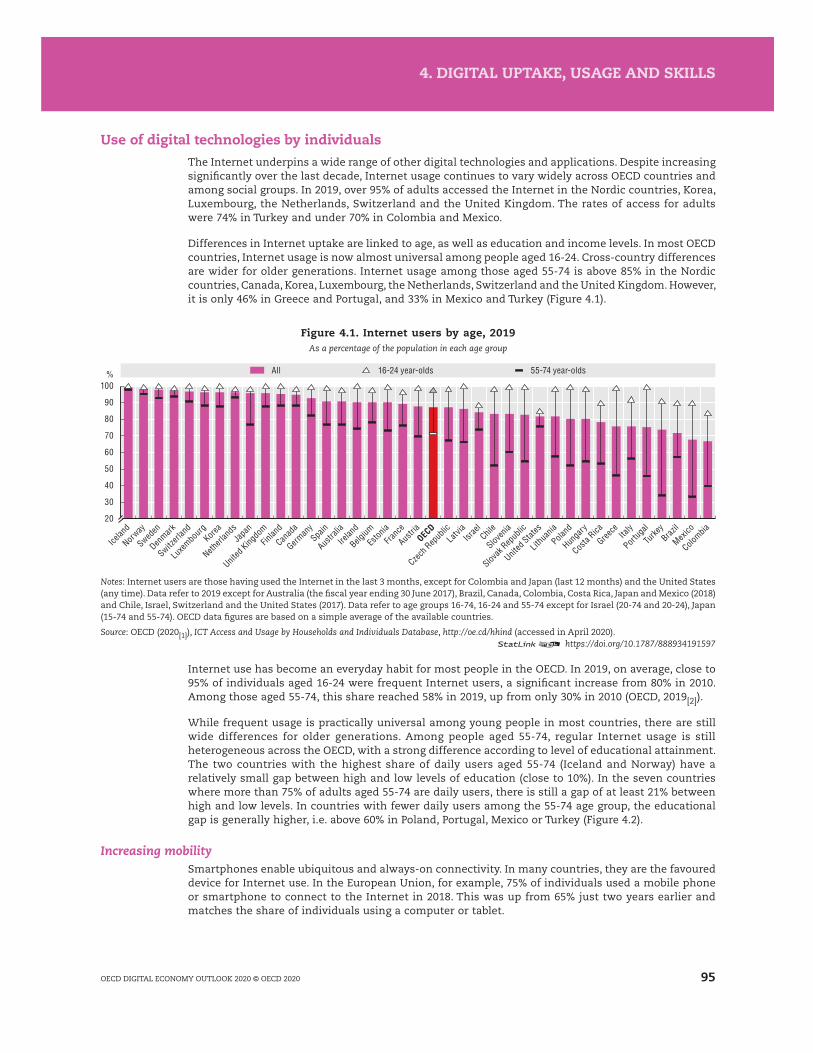
Use of digital technologies by individualsThe Internet underpins a wide range of other digital technologies and applications. Despite increasing significantly over the last decade, Internet usage continues to vary widely across OECD countries and among social groups. In 2019, over 95% of adults accessed the Internet in the Nordic countries, Korea, Luxembourg, the Netherlands, Switzerland and the United Kingdom. The rates of access for adults were 74% in Turkey and under 70% in Colombia and Mexico.
Differences in Internet uptake are linked to age, as well as education and income levels. In most OECD countries, Internet usage is now almost universal among people aged 16-24. Cross-country differences are wider for older generations. Internet usage among those aged 55-74 is above 85% in the Nordic countries, Canada, Korea, Luxembourg, the Netherlands, Switzerland and the United Kingdom. However, it is only 46% in Greece and Portugal, and 33% in Mexico and Turkey (Figure 4.1).
Figure 4.1. Internet users by age, 2019As a percentage of the population in each age group
%
20
30
40
50
60
70
80
90
100
All 16-24 year-olds 55-74 year-olds
Icelan
d
Norway
Sweden
Denmark
Switzerl
and
Luxem
bourg
Korea
Netherl
ands
Japan
United
Kingdo
mFin
land
Canad
a
German
ySpa
in
Australi
a
Irelan
d
Belgium
Eston
iaFra
nce
Austria
OECD
Czech R
epub
licLatv
iaIsr
aelChil
e
Sloven
ia
Slovak
Repub
lic
United
States
Lithua
nia
Poland
Hunga
ry
Costa Rica
Greece Ita
ly
Portug
al
Turke
yBraz
il
Mexico
Colombia
Notes: Internet users are those having used the Internet in the last 3 months, except for Colombia and Japan (last 12 months) and the United States (any time). Data refer to 2019 except for Australia (the fiscal year ending 30 June 2017), Brazil, Canada, Colombia, Costa Rica, Japan and Mexico (2018) and Chile, Israel, Switzerland and the United States (2017). Data refer to age groups 16-74, 16-24 and 55-74 except for Israel (20-74 and 20-24), Japan (15-74 and 55-74). OECD data figures are based on a simple average of the available countries.
Source: OECD (2020[1]), ICT Access and Usage by Households and Individuals Database, http://oe.cd/hhind (accessed in April 2020).12 https://doi.org/10.1787/888934191597
Internet use has become an everyday habit for most people in the OECD. In 2019, on average, close to 95% of individuals aged 16-24 were frequent Internet users, a significant increase from 80% in 2010. Among those aged 55-74, this share reached 58% in 2019, up from only 30% in 2010 (OECD, 2019[2]).
While frequent usage is practically universal among young people in most countries, there are still wide differences for older generations. Among people aged 55-74, regular Internet usage is still heterogeneous across the OECD, with a strong difference according to level of educational attainment. The two countries with the highest share of daily users aged 55-74 (Iceland and Norway) have a relatively small gap between high and low levels of education (close to 10%). In the seven countries where more than 75% of adults aged 55-74 are daily users, there is still a gap of at least 21% between high and low levels. In countries with fewer daily users among the 55-74 age group, the educational gap is generally higher, i.e. above 60% in Poland, Portugal, Mexico or Turkey (Figure 4.2).
Increasing mobilitySmartphones enable ubiquitous and always-on connectivity. In many countries, they are the favoured device for Internet use. In the European Union, for example, 75% of individuals used a mobile phone or smartphone to connect to the Internet in 2018. This was up from 65% just two years earlier and matches the share of individuals using a computer or tablet.
95OECD DIGITAL ECONOMY OUTLOOK 2020 © OECD 2020
4. DIGITAL UPTAKE, USAGE AND SKILLS 4. DIGITAL UPTAKE, USAGE AND SKILLS
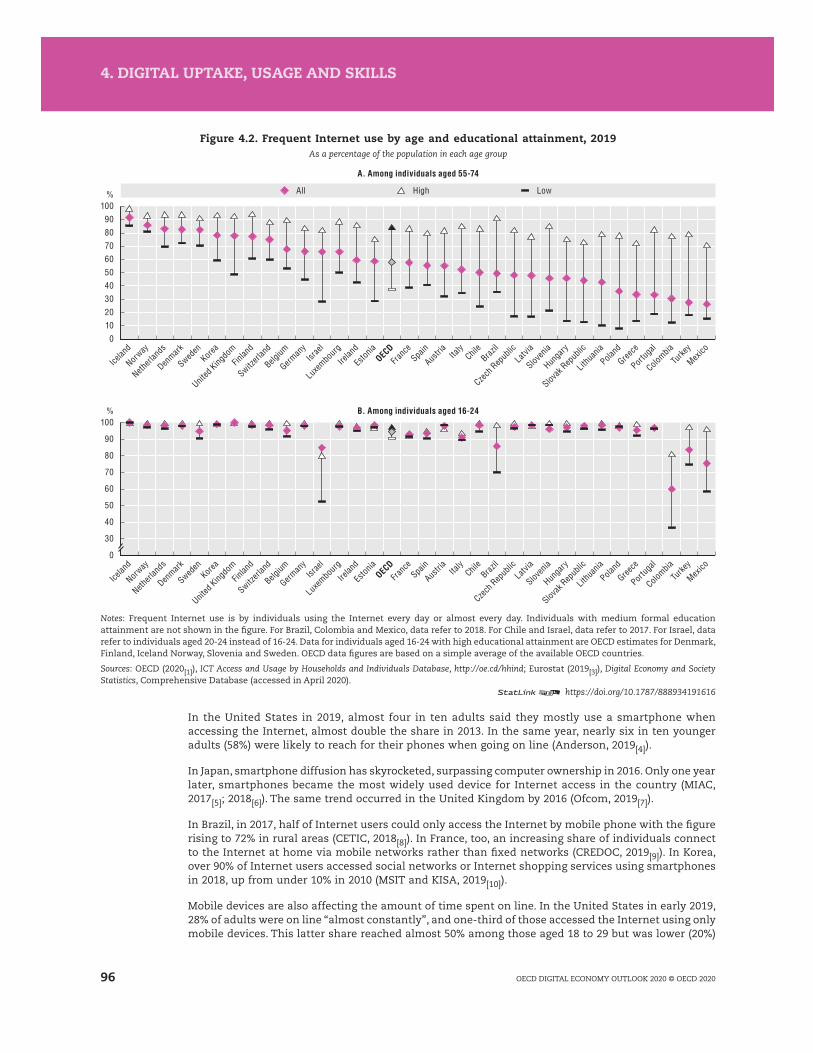
Figure 4.2. Frequent Internet use by age and educational attainment, 2019As a percentage of the population in each age group
%
%
0102030405060708090
100
30
40
50
60
70
80
90
100
0
HighAll Low
A. Among individuals aged 55-74
B. Among individuals aged 16-24
Icelan
d
Norway
Netherl
ands
Denmark
Sweden
Korea
United
Kingdo
mFin
land
Switzerl
and
Belgium
German
yIsr
ael
Luxem
bourg
Irelan
d
Eston
iaOECD
France
Spain
Austria
Italy
Chile
Brazil
Czech R
epub
licLatv
ia
Sloven
ia
Hunga
ry
Slovak
Repub
lic
Lithua
nia
Poland
Greece
Portug
al
Colombia
Turke
y
Mexico
Notes: Frequent Internet use is by individuals using the Internet every day or almost every day. Individuals with medium formal education attainment are not shown in the figure. For Brazil, Colombia and Mexico, data refer to 2018. For Chile and Israel, data refer to 2017. For Israel, data refer to individuals aged 20-24 instead of 16-24. Data for individuals aged 16-24 with high educational attainment are OECD estimates for Denmark, Finland, Iceland Norway, Slovenia and Sweden. OECD data figures are based on a simple average of the available OECD countries.
Sources: OECD (2020[1]), ICT Access and Usage by Households and Individuals Database, http://oe.cd/hhind; Eurostat (2019[3]), Digital Economy and Society Statistics, Comprehensive Database (accessed in April 2020).
12 https://doi.org/10.1787/888934191616
In the United States in 2019, almost four in ten adults said they mostly use a smartphone when accessing the Internet, almost double the share in 2013. In the same year, nearly six in ten younger adults (58%) were likely to reach for their phones when going on line (Anderson, 2019[4]).
In Japan, smartphone diffusion has skyrocketed, surpassing computer ownership in 2016. Only one year later, smartphones became the most widely used device for Internet access in the country (MIAC, 2017[5]; 2018[6]). The same trend occurred in the United Kingdom by 2016 (Ofcom, 2019[7]).
In Brazil, in 2017, half of Internet users could only access the Internet by mobile phone with the figure rising to 72% in rural areas (CETIC, 2018[8]). In France, too, an increasing share of individuals connect to the Internet at home via mobile networks rather than fixed networks (CREDOC, 2019[9]). In Korea, over 90% of Internet users accessed social networks or Internet shopping services using smartphones in 2018, up from under 10% in 2010 (MSIT and KISA, 2019[10]).
Mobile devices are also affecting the amount of time spent on line. In the United States in early 2019, 28% of adults were on line “almost constantly”, and one-third of those accessed the Internet using only mobile devices. This latter share reached almost 50% among those aged 18 to 29 but was lower (20%)
96 OECD DIGITAL ECONOMY OUTLOOK 2020 © OECD 2020
4. DIGITAL UPTAKE, USAGE AND SKILLS 4. DIGITAL UPTAKE, USAGE AND SKILLS

among those aged 50-64. Constant connectedness was also greater among those with higher levels of educational attainment, ranging from 23% for individuals with no more than a high school degree to 36% of those with a college degree or above (Perrin and Kumar, 2019[11]).
Between 2014 and 2019, the average daily time spent on the Internet worldwide is estimated to have increased from 6 hours 10 min to 6 hours 42 minutes. Almost half of this was via mobile devices, up from one-quarter in 2014. Social media is a key driver of online time, accounting for one-third on average in 2019. This illustrates the effectiveness of business models for social media platforms (Figure 4.3).
Figure 4.3. Average daily time spent on the Internet worldwide, 2014-19
0
7
2
1
4
3
6
5
Number of hours
2014 2015 2016 2017 2018 2019
Using Internet Of which, via mobile phones Using social media
Source: Datareportal (2019[12]), Digital 2019: Global Digital Overview, https://datareportal.com/reports/digital-2019-global-digital-overview. 12 https://doi.org/10.1787/888934191635
Nevertheless, the amount of time spent on the Internet daily varies significantly across countries – from around nine hours in Brazil and Colombia to below four hours in Japan. Mobile devices account for over half of time spent on line in Brazil and Turkey, but less than one-third in Germany and France. Daily time spent on social media varies from three and a half hours in Brazil to half an hour in Japan – the lowest among the countries presented, at just one-sixth of the daily time on line. By contrast, the highest shares, at near 40% of time on line, can be found in countries such as Mexico, Colombia and Turkey (Figure 4.4).
Figure 4.4. Average daily time spent using Internet, mobile Internet and social media, 2019
0
109
21
43
8765
Number of hours
Using Internet Of which, via mobile phones Using social media
Brazil
Colombia
Mexico
Turke
y
Portug
al
United
States Ita
ly
Poland
Sweden
New Ze
aland
Irelan
d
Canad
a
United
Kingdo
m
Denmark
Spain
Korea
Austra
lia
Austria
Belgium
Switzerl
and
Netherl
ands
Franc
e
German
yJa
pan
Source: Datareportal (2019[12]), Digital 2019: Global Digital Overview, https://datareportal.com/reports/digital-2019-global-digital-overview.12 https://doi.org/10.1787/888934191654
Screen time is now embedded in daily life in many OECD countries. In France, a recent study found that teenagers routinely breach recommended limits. Half of those studied spent more than three hours on screens every day during the week, and more than double that on the weekend (DREES, 2019[13]).
97OECD DIGITAL ECONOMY OUTLOOK 2020 © OECD 2020
4. DIGITAL UPTAKE, USAGE AND SKILLS 4. DIGITAL UPTAKE, USAGE AND SKILLS

Younger generations are especially likely to spend screen time on line. During the last decade, the amount of time that students aged 15-16 spent on line outside of school has increased considerably (OECD, 2019[14]). On average across the OECD, the time students spend on the Internet outside of school increased from 18 hours per week (including weekends) in 2012 to 23 hours in 2015 and 27 hours in 2018. The weekly time spent on line outside of school ranges from more than 32 hours in Sweden to 18 hours in Korea (Figure 4.5).
Figure 4.5. Weekly hours spent by students aged 15-16 on the Internet outside of school, 2012-18
0
5
10
15
20
25
30
35
2018 2015 2012
Number of hours
Sweden
Chile
Costa
Rica
United
Kingdo
m
United
States
Denmark
New Ze
aland
BelgiumSpa
in
Luxe
mbourg
Austra
lia
Irelan
d
Lithu
ania
Poland Ita
ly
Hunga
ryLatv
ia
Franc
e
Eston
ia
Finlan
dOEC
D
Icelan
d
Austria
Slovak
Repub
lic
Russia
n Fed
eratio
n
Netherl
ands
Israe
l
Greece
Switzerl
and
Czech R
epub
lic
Sloven
ia
Portug
al
Norway
Mexico
Turke
y
Colombia
Japa
n
German
yKore
a
Note: Based on the cumulated time spent on the Internet on weekdays and weekend days. For the Netherlands, Portugal and the United States, data did not meet technical standards but were accepted as largely comparable. For the United Kingdom, Scotland is not included.
Source: OECD calculations based on OECD (2019[14]), PISA 2018 Results (Volume III): What School Life Means for Students’ Lives, https://dx.doi.org/10.1787/acd78851-en.
12 https://doi.org/10.1787/888934191673
On weekdays, students now spend about 3 hours on line outside of school and almost 3.5 hours on weekend days on average across the OECD. In both cases, the time spent has increased by more than one hour per day between 2012 and 2018. Indeed, students in Ireland, Italy and Turkey more than doubled their time spent on line during the same period (OECD, 2019[15]).
Online activities On average, over 2018-19, 83% of Internet users in the OECD, Brazil and Costa Rica reported sending emails, 78% used the Internet to obtain information on goods and products, 73% used social networks and 72% read online news, and 42% used cloud technologies. While 55% of Internet users ordered products on line, only 20% sold products over the Internet (Figure 4.6).
The shares of Internet users performing relatively more complex activities tends to vary markedly across countries. This is the case, for example, for e-banking, online purchases, news reading and use of government services (e-government). On the other hand, activities such as sending emails, social networking or telephoning over the Internet show much less variation across all countries.
People buying and selling on lineAcross OECD countries, almost 60% of individuals bought products on line in 2019 on average, up from 38% in 2010 (Figure 4.7). The trend towards online shopping is likely to continue, especially in light of the COVID-19 pandemic. As with Internet use more generally, a growing number of individuals are buying products via mobile devices. The share of people buying on line still varies widely across countries, as well as across different product categories; age, education, income and experience all influence uptake. In Denmark, the Netherlands and the United Kingdom, more than 80% of adults shop on line. In Turkey and Costa Rica, the percentage is only 25%, while in Mexico and Colombia it is under 16% and 7%, respectively.
98 OECD DIGITAL ECONOMY OUTLOOK 2020 © OECD 2020
4. DIGITAL UPTAKE, USAGE AND SKILLS 4. DIGITAL UPTAKE, USAGE AND SKILLS
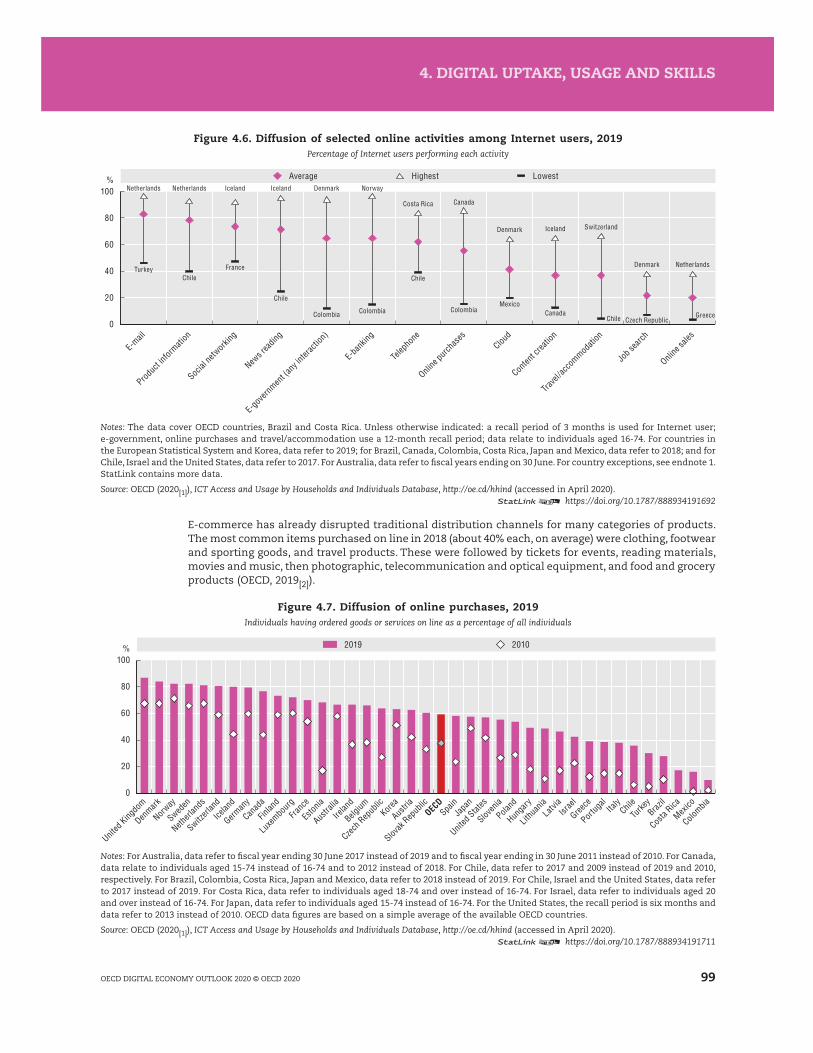
Figure 4.6. Diffusion of selected online activities among Internet users, 2019Percentage of Internet users performing each activity
%
0
20
40
60
80
100
HighestAverage Lowest
Produc
t infor
mation
Social n
etwork
ing
News r
eadin
g
E-gov
ernmen
t (any
inter
actio
n)
E-ban
king
Telep
hone
Online
purch
ases
Cloud
Conten
t crea
tion
Trave
l/acc
ommod
ation
Job s
earch
Online
sales
Netherlands Netherlands Iceland Iceland Denmark Norway
Costa Rica Canada
Denmark Iceland Switzerland
Denmark NetherlandsTurkey
ChileFrance
Chile
Colombia Colombia
Chile
ColombiaMexico
CanadaChile Czech Republic
Greece
Notes: The data cover OECD countries, Brazil and Costa Rica. Unless otherwise indicated: a recall period of 3 months is used for Internet user; e-government, online purchases and travel/accommodation use a 12-month recall period; data relate to individuals aged 16-74. For countries in the European Statistical System and Korea, data refer to 2019; for Brazil, Canada, Colombia, Costa Rica, Japan and Mexico, data refer to 2018; and for Chile, Israel and the United States, data refer to 2017. For Australia, data refer to fiscal years ending on 30 June. For country exceptions, see endnote 1. StatLink contains more data.
Source: OECD (2020[1]), ICT Access and Usage by Households and Individuals Database, http://oe.cd/hhind (accessed in April 2020). 12 https://doi.org/10.1787/888934191692
E-commerce has already disrupted traditional distribution channels for many categories of products. The most common items purchased on line in 2018 (about 40% each, on average) were clothing, footwear and sporting goods, and travel products. These were followed by tickets for events, reading materials, movies and music, then photographic, telecommunication and optical equipment, and food and grocery products (OECD, 2019[2]).
Figure 4.7. Diffusion of online purchases, 2019Individuals having ordered goods or services on line as a percentage of all individuals
%
0
20
40
60
80
100
2019 2010
United
Kingdo
m
Denmark
Norway
Sweden
Netherl
ands
Switzerl
and
Icelan
d
German
y
Canad
a
Finlan
d
Luxe
mbourg
Franc
e
Eston
ia
Austra
lia
Irelan
d
Belgium
Czech R
epub
licKore
a
Austria
Slovak
Repub
licOEC
DSpa
inJa
pan
United
States
Sloven
ia
Poland
Hunga
ry
Lithu
aniaLatv
iaIsr
ael
Greece
Portug
alIta
lyChil
eTu
rkeyBraz
il
Costa
Rica
Mexico
Colombia
Notes: For Australia, data refer to fiscal year ending 30 June 2017 instead of 2019 and to fiscal year ending in 30 June 2011 instead of 2010. For Canada, data relate to individuals aged 15-74 instead of 16-74 and to 2012 instead of 2018. For Chile, data refer to 2017 and 2009 instead of 2019 and 2010, respectively. For Brazil, Colombia, Costa Rica, Japan and Mexico, data refer to 2018 instead of 2019. For Chile, Israel and the United States, data refer to 2017 instead of 2019. For Costa Rica, data refer to individuals aged 18-74 and over instead of 16-74. For Israel, data refer to individuals aged 20 and over instead of 16-74. For Japan, data refer to individuals aged 15-74 instead of 16-74. For the United States, the recall period is six months and data refer to 2013 instead of 2010. OECD data figures are based on a simple average of the available OECD countries.
Source: OECD (2020[1]), ICT Access and Usage by Households and Individuals Database, http://oe.cd/hhind (accessed in April 2020).12 https://doi.org/10.1787/888934191711
99OECD DIGITAL ECONOMY OUTLOOK 2020 © OECD 2020
4. DIGITAL UPTAKE, USAGE AND SKILLS 4. DIGITAL UPTAKE, USAGE AND SKILLS
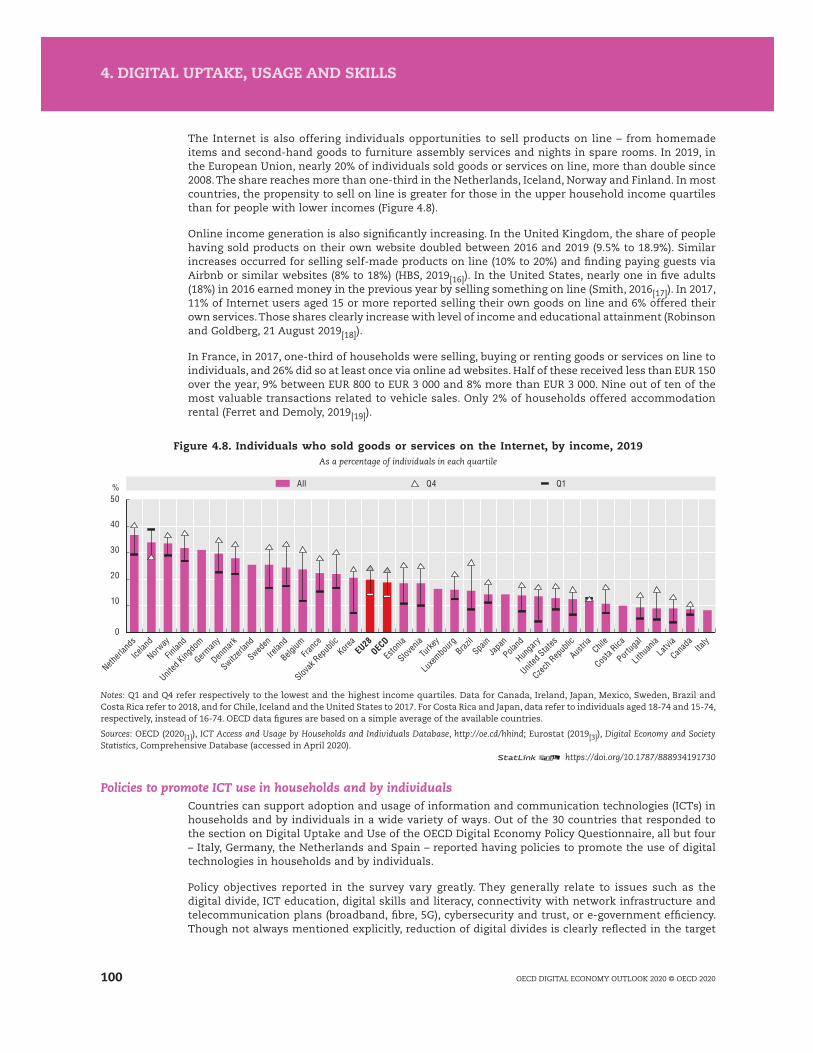
The Internet is also offering individuals opportunities to sell products on line – from homemade items and second-hand goods to furniture assembly services and nights in spare rooms. In 2019, in the European Union, nearly 20% of individuals sold goods or services on line, more than double since 2008. The share reaches more than one-third in the Netherlands, Iceland, Norway and Finland. In most countries, the propensity to sell on line is greater for those in the upper household income quartiles than for people with lower incomes (Figure 4.8).
Online income generation is also significantly increasing. In the United Kingdom, the share of people having sold products on their own website doubled between 2016 and 2019 (9.5% to 18.9%). Similar increases occurred for selling self-made products on line (10% to 20%) and finding paying guests via Airbnb or similar websites (8% to 18%) (HBS, 2019[16]). In the United States, nearly one in five adults (18%) in 2016 earned money in the previous year by selling something on line (Smith, 2016[17]). In 2017, 11% of Internet users aged 15 or more reported selling their own goods on line and 6% offered their own services. Those shares clearly increase with level of income and educational attainment (Robinson and Goldberg, 21 August 2019[18]).
In France, in 2017, one-third of households were selling, buying or renting goods or services on line to individuals, and 26% did so at least once via online ad websites. Half of these received less than EUR 150 over the year, 9% between EUR 800 to EUR 3 000 and 8% more than EUR 3 000. Nine out of ten of the most valuable transactions related to vehicle sales. Only 2% of households offered accommodation rental (Ferret and Demoly, 2019[19]).
Figure 4.8. Individuals who sold goods or services on the Internet, by income, 2019As a percentage of individuals in each quartile
%
0
10
20
30
40
50
All Q4 Q1
Netherl
ands
Icelan
d
Norway
Finlan
d
United
Kingdo
m
German
y
Denmark
Switzerl
and
Sweden
Irelan
d
Belgium
Franc
e
Slovak
Repub
licKore
aEU28
OECD
Eston
ia
Sloven
iaTu
rkey
Luxe
mbourg
Brazil
Spain
Japa
n
Poland
Hunga
ry
United
States
Czech R
epub
lic
Austria Chil
e
Costa
Rica
Portug
al
Lithu
ania
Latvia
Canad
aIta
ly
Notes: Q1 and Q4 refer respectively to the lowest and the highest income quartiles. Data for Canada, Ireland, Japan, Mexico, Sweden, Brazil and Costa Rica refer to 2018, and for Chile, Iceland and the United States to 2017. For Costa Rica and Japan, data refer to individuals aged 18-74 and 15-74, respectively, instead of 16-74. OECD data figures are based on a simple average of the available countries.
Sources: OECD (2020[1]), ICT Access and Usage by Households and Individuals Database, http://oe.cd/hhind; Eurostat (2019[3]), Digital Economy and Society Statistics, Comprehensive Database (accessed in April 2020).
12 https://doi.org/10.1787/888934191730
Policies to promote ICT use in households and by individualsCountries can support adoption and usage of information and communication technologies (ICTs) in households and by individuals in a wide variety of ways. Out of the 30 countries that responded to the section on Digital Uptake and Use of the OECD Digital Economy Policy Questionnaire, all but four – Italy, Germany, the Netherlands and Spain – reported having policies to promote the use of digital technologies in households and by individuals.
Policy objectives reported in the survey vary greatly. They generally relate to issues such as the digital divide, ICT education, digital skills and literacy, connectivity with network infrastructure and telecommunication plans (broadband, fibre, 5G), cybersecurity and trust, or e-government efficiency. Though not always mentioned explicitly, reduction of digital divides is clearly reflected in the target
100 OECD DIGITAL ECONOMY OUTLOOK 2020 © OECD 2020
4. DIGITAL UPTAKE, USAGE AND SKILLS 4. DIGITAL UPTAKE, USAGE AND SKILLS

groups and policy instruments implemented. This, in turn, reflects the multidimensional nature of this issue. Policy objectives are often set out in broad terms, most often under the umbrella of a digital roadmap or a digital agenda. In such cases, guiding principles or sub-objectives frequently relate to one of the issues previously mentioned.
As digital tools are pervasive, some objectives to promote usage overlap with other broad economic policy areas. In Latvia, for example, the digital agenda coincides with developing an inclusive labour market and improving health care efficiency through e-health. Similarly, objectives for the digital agenda and education overlap in the Czech Republic and the Russian Federation.
For connectivity, countries responding to the survey noted the goals of improving the communication infrastructure, deploying broadband, and enhancing speed and service quality. These belong to the policy toolkit often mentioned by countries to promote digital inclusion and reduce the digital divide.
These policies can be broad when taking the form of national plans. For example, they may seek to reduce the geographical divide between rural and urban areas, to deploy high-speed networks or to improve the quality and speed of communication networks at the country level. Such policies include the National Fiber Optic Project in Chile, the National Telecommunication Development Plan in Costa Rica, Telecom Plan in Iceland, the Next Generation Network in the Country Side in Sweden, Connectivity programmes in Colombia or the Fast Broadband project in Finland.
The coverage can also be more focused in terms of population targeted. Some programmes, for example, refer explicitly to affordability or universal service obligation. These include the ConnectHome Program or the Broadband ReConnect Program in the United States and the Last mile support in Estonia.
Digital security, trust and consumer protection are also ICT policy areas. Some countries have taken various measures to increase awareness, promote more effective data protection, develop knowledge or share experiences among households and individuals. A snapshot of policy instruments is presented below:
● In Austria, efforts are underway to increase awareness of the population as regards the possibilities and dangers of the information society. One key message is that individuals must take some responsibility for risk management. Austria also promotes more effective data protection, cybersecurity and consumer protection.
● In Colombia, the En TIC Confio (“ICT stand out, I trust”) programme helps people deal with threats to security and privacy that can occur in the digital environment.
● In Portugal, Safer Internet Centre campaigns target children and teenagers who are socially excluded or outside the influence of a school. At pedagogical centres, at-risk children and teenagers are invited to participate in activities about the benefits of safer use of the Internet. They are made aware of both potential risks of online use and of their right to protect personal data.
● In Singapore, the Media Literacy Council works in partnership with industry, the community and government to promote an astute and responsible digital citizenship. The Council seeks to cultivate and encourage the public to become discerning consumers who can evaluate content effectively, and use, create and share content safely and responsibly. It also advises the government on issues relating to the Internet and media content.
Most OECD countries implement ICT policies dedicated to specific groups and targeted populations. These are concerned with either connectivity and access, or content (use), digital skills and competences.
Targeted population groups can include both younger and older consumers. With respect to children, Chile has the I Chose My Personal Computer programme for children in vulnerable conditions; Japan has the Child Rearing One-stop Service; the Czech Republic has the Strategy of Digital Literacy to develop pupils’ computational thinking; and Portugal has the aforementioned Safer Internet Centres for at-risk children and teenagers. With respect to elderly people, Austria has the Be Connected programme, while Israel offers a Senior Citizens’ Digital Skills Course.
Programmes can also relate to specific population groups. These include disabled residents in the United States; persons at an economic disadvantage in Costa Rica, or with disabilities in Costa Rica
101OECD DIGITAL ECONOMY OUTLOOK 2020 © OECD 2020
4. DIGITAL UPTAKE, USAGE AND SKILLS 4. DIGITAL UPTAKE, USAGE AND SKILLS
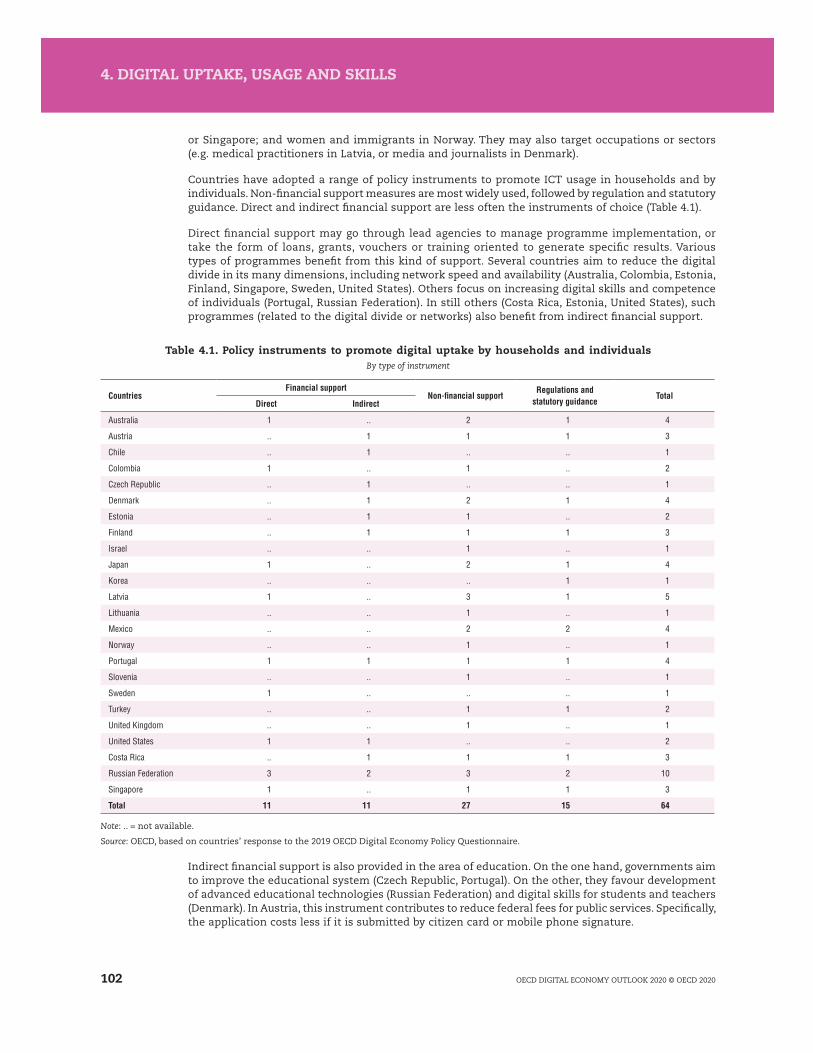
or Singapore; and women and immigrants in Norway. They may also target occupations or sectors (e.g. medical practitioners in Latvia, or media and journalists in Denmark).
Countries have adopted a range of policy instruments to promote ICT usage in households and by individuals. Non-financial support measures are most widely used, followed by regulation and statutory guidance. Direct and indirect financial support are less often the instruments of choice (Table 4.1).
Direct financial support may go through lead agencies to manage programme implementation, or take the form of loans, grants, vouchers or training oriented to generate specific results. Various types of programmes benefit from this kind of support. Several countries aim to reduce the digital divide in its many dimensions, including network speed and availability (Australia, Colombia, Estonia, Finland, Singapore, Sweden, United States). Others focus on increasing digital skills and competence of individuals (Portugal, Russian Federation). In still others (Costa Rica, Estonia, United States), such programmes (related to the digital divide or networks) also benefit from indirect financial support.
Table 4.1. Policy instruments to promote digital uptake by households and individualsBy type of instrument
CountriesFinancial support
Non-financial supportRegulations and
statutory guidanceTotal
Direct Indirect
Australia 1 .. 2 1 4
Austria .. 1 1 1 3
Chile .. 1 .. .. 1
Colombia 1 .. 1 .. 2
Czech Republic .. 1 .. .. 1
Denmark .. 1 2 1 4
Estonia .. 1 1 .. 2
Finland .. 1 1 1 3
Israel .. .. 1 .. 1
Japan 1 .. 2 1 4
Korea .. .. .. 1 1
Latvia 1 .. 3 1 5
Lithuania .. .. 1 .. 1
Mexico .. .. 2 2 4
Norway .. .. 1 .. 1
Portugal 1 1 1 1 4
Slovenia .. .. 1 .. 1
Sweden 1 .. .. .. 1
Turkey .. .. 1 1 2
United Kingdom .. .. 1 .. 1
United States 1 1 .. .. 2
Costa Rica .. 1 1 1 3
Russian Federation 3 2 3 2 10
Singapore 1 .. 1 1 3
Total 11 11 27 15 64
Note: .. = not available.
Source: OECD, based on countries’ response to the 2019 OECD Digital Economy Policy Questionnaire.
Indirect financial support is also provided in the area of education. On the one hand, governments aim to improve the educational system (Czech Republic, Portugal). On the other, they favour development of advanced educational technologies (Russian Federation) and digital skills for students and teachers (Denmark). In Austria, this instrument contributes to reduce federal fees for public services. Specifically, the application costs less if it is submitted by citizen card or mobile phone signature.
102 OECD DIGITAL ECONOMY OUTLOOK 2020 © OECD 2020
4. DIGITAL UPTAKE, USAGE AND SKILLS 4. DIGITAL UPTAKE, USAGE AND SKILLS
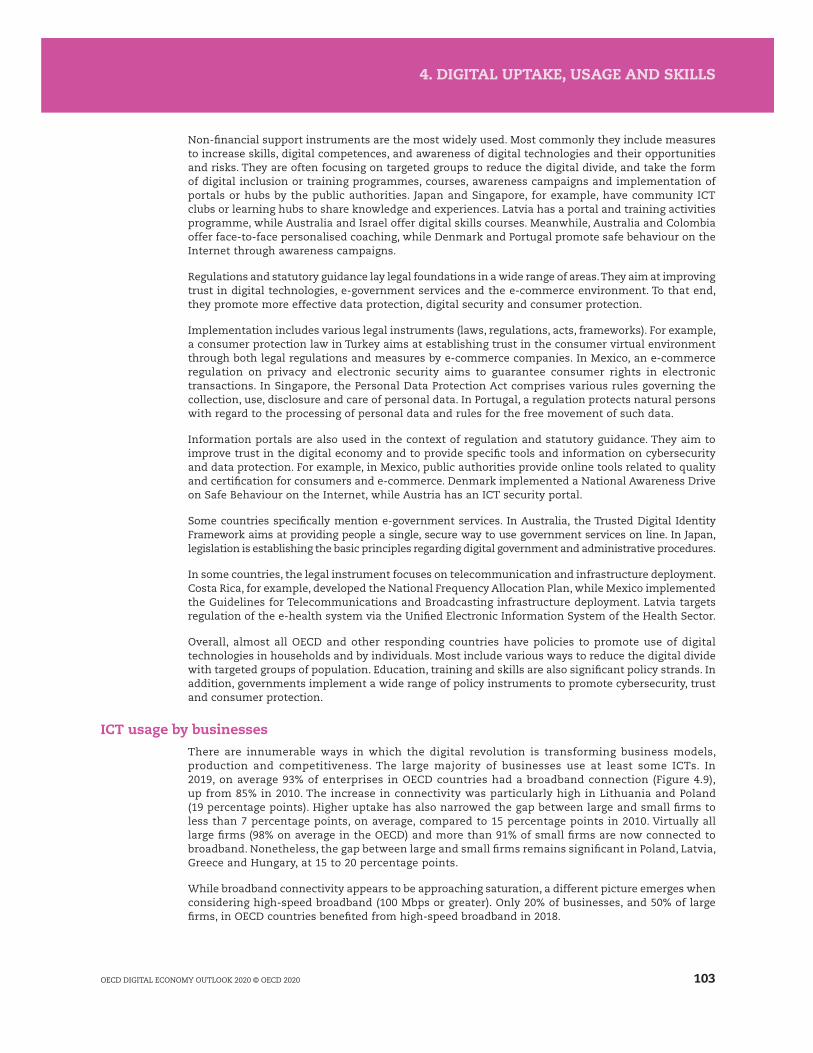
Non-financial support instruments are the most widely used. Most commonly they include measures to increase skills, digital competences, and awareness of digital technologies and their opportunities and risks. They are often focusing on targeted groups to reduce the digital divide, and take the form of digital inclusion or training programmes, courses, awareness campaigns and implementation of portals or hubs by the public authorities. Japan and Singapore, for example, have community ICT clubs or learning hubs to share knowledge and experiences. Latvia has a portal and training activities programme, while Australia and Israel offer digital skills courses. Meanwhile, Australia and Colombia offer face-to-face personalised coaching, while Denmark and Portugal promote safe behaviour on the Internet through awareness campaigns.
Regulations and statutory guidance lay legal foundations in a wide range of areas. They aim at improving trust in digital technologies, e-government services and the e-commerce environment. To that end, they promote more effective data protection, digital security and consumer protection.
Implementation includes various legal instruments (laws, regulations, acts, frameworks). For example, a consumer protection law in Turkey aims at establishing trust in the consumer virtual environment through both legal regulations and measures by e-commerce companies. In Mexico, an e-commerce regulation on privacy and electronic security aims to guarantee consumer rights in electronic transactions. In Singapore, the Personal Data Protection Act comprises various rules governing the collection, use, disclosure and care of personal data. In Portugal, a regulation protects natural persons with regard to the processing of personal data and rules for the free movement of such data.
Information portals are also used in the context of regulation and statutory guidance. They aim to improve trust in the digital economy and to provide specific tools and information on cybersecurity and data protection. For example, in Mexico, public authorities provide online tools related to quality and certification for consumers and e-commerce. Denmark implemented a National Awareness Drive on Safe Behaviour on the Internet, while Austria has an ICT security portal.
Some countries specifically mention e-government services. In Australia, the Trusted Digital Identity Framework aims at providing people a single, secure way to use government services on line. In Japan, legislation is establishing the basic principles regarding digital government and administrative procedures.
In some countries, the legal instrument focuses on telecommunication and infrastructure deployment. Costa Rica, for example, developed the National Frequency Allocation Plan, while Mexico implemented the Guidelines for Telecommunications and Broadcasting infrastructure deployment. Latvia targets regulation of the e-health system via the Unified Electronic Information System of the Health Sector.
Overall, almost all OECD and other responding countries have policies to promote use of digital technologies in households and by individuals. Most include various ways to reduce the digital divide with targeted groups of population. Education, training and skills are also significant policy strands. In addition, governments implement a wide range of policy instruments to promote cybersecurity, trust and consumer protection.
ICT usage by businessesThere are innumerable ways in which the digital revolution is transforming business models, production and competitiveness. The large majority of businesses use at least some ICTs. In 2019, on average 93% of enterprises in OECD countries had a broadband connection (Figure 4.9), up from 85% in 2010. The increase in connectivity was particularly high in Lithuania and Poland (19 percentage points). Higher uptake has also narrowed the gap between large and small firms to less than 7 percentage points, on average, compared to 15 percentage points in 2010. Virtually all large firms (98% on average in the OECD) and more than 91% of small firms are now connected to broadband. Nonetheless, the gap between large and small firms remains significant in Poland, Latvia, Greece and Hungary, at 15 to 20 percentage points.
While broadband connectivity appears to be approaching saturation, a different picture emerges when considering high-speed broadband (100 Mbps or greater). Only 20% of businesses, and 50% of large firms, in OECD countries benefited from high-speed broadband in 2018.
103OECD DIGITAL ECONOMY OUTLOOK 2020 © OECD 2020
4. DIGITAL UPTAKE, USAGE AND SKILLS 4. DIGITAL UPTAKE, USAGE AND SKILLS

Figure 4.9. Broadband connectivity by size, 2019As a percentage of enterprises in each employment size class
0
100
90
80
70
% All Large Small
Denmark
Netherl
ands
Korea
Sloven
ia
Switzerl
and
Finlan
dBraz
ilJa
pan
Lithua
nia
Belgium
Luxem
bourg
Eston
ia
Czech R
epub
lic
Portug
al
United
Kingdo
m
Australi
a
Sweden
France
Turke
yOECD
Spain
German
yIta
ly
Irelan
d
Norway
Austria
New Ze
aland
Poland
Slovak
Repub
lic
Colombia
Greece
Latvia
Hunga
ry
Notes: Except where otherwise stated, only enterprises with ten or more employees in manufacturing and non-financial market services industries are considered. Size classes are defined as: small (10-49 employees), medium (50-249 employees) and large (250 employees or more). Fixed broadband only except Canada, Japan, Korea and Switzerland, which include mobile broadband. For Australia, data refer to, respectively, the fiscal years ending on 30 June 2011 instead of 2010 and to the fiscal year ending on 30 June 2017 instead of 2019. For New Zealand, data refer to 2016 instead of 2018. For Japan and Korea, data refer to 2018 instead of 2019. For Brazil, Colombia and Switzerland, data refer to 2017 instead of 2018. For Japan, data refer to businesses with 100 or more employees instead of 10 or more; medium-sized enterprises have 100-299 employees and large ones 300 or more. Data include leased lines and mobile broadband in 2018, but not in 2010. For Switzerland, data refer to 2011 instead of 2010. In 2017, broadband refers to broadband connection of more than 10 Mbit/s. In 2017, total businesses with 5 or more employees instead of 10 or more, and 5-49 employees as opposed to 10-49 employees. In 2011, total businesses with ten or more employees. StatLink contains more data.
Source: OECD (2020[20]), ICT Access and Usage by Businesses Database, http://oe.cd/bus (accessed in April 2020). 12 https://doi.org/10.1787/888934191749
The digitalisation of business will continue apace. This will be facilitated by technological developments such as the rollout of 5G networks and increasing connectivity of objects through the Internet of Things (IoT). However, diffusion is likely to remain uneven across firms (Box 4.1). Beyond simple measures based on counting firms with Internet connections, the share of employees using Internet-connected devices offers a more nuanced indicator of the extent to which ICTs have been embedded throughout the activities of a business. The share of employees using computers with Internet access has significantly increased across the OECD during the last decade. It nevertheless remains slightly lower among small firms compared to large firms (Figure 4.10). In 2019, there remained considerable variation across countries. More than 70% of employees used computers with Internet access in the Nordic countries. However, only 38% did so in Greece and Portugal, and fewer than 25% did in Turkey.
Businesses can choose from a wide range of digital technologies. Websites follow broadband as the most widely diffused tools, with 78% of businesses having a website in 2019. Despite being a hallmark of the online age, a much lower proportion of firms make e-commerce sales. Across OECD countries for which data are available, 24% of firms with at least ten employees received electronic orders in 2019 (Figure 4.11). This share, which has remained stable since 2016, increased only 5 percentage points from 2010. In 2019, e-commerce generated 19% of total turnover on average. Up to 90% of e-commerce revenue comes from business-to-business transactions over electronic data interchange applications. These observed patterns are dominated by the economic weight of large enterprises. In these cases, e-commerce sales represent on average 24% of turnover compared to just 9% for small firms.
Digitalisation allows greater business integration, beyond the information flows management within companies, for a variety of business functions. Enterprise resource planning (ERP) allows firms to benefit from a higher integration of information and processing across their various business functions. Customer-relationship-management (CRM) tools allow firms, through intensive use of ICTs, to collect, integrate, process and analyse information related to their customers. ERP and CRM are now respectively adopted by 36% and 30% of firms on average across the OECD, an increase of more than 10 percentage points since 2010.
104 OECD DIGITAL ECONOMY OUTLOOK 2020 © OECD 2020
4. DIGITAL UPTAKE, USAGE AND SKILLS 4. DIGITAL UPTAKE, USAGE AND SKILLS
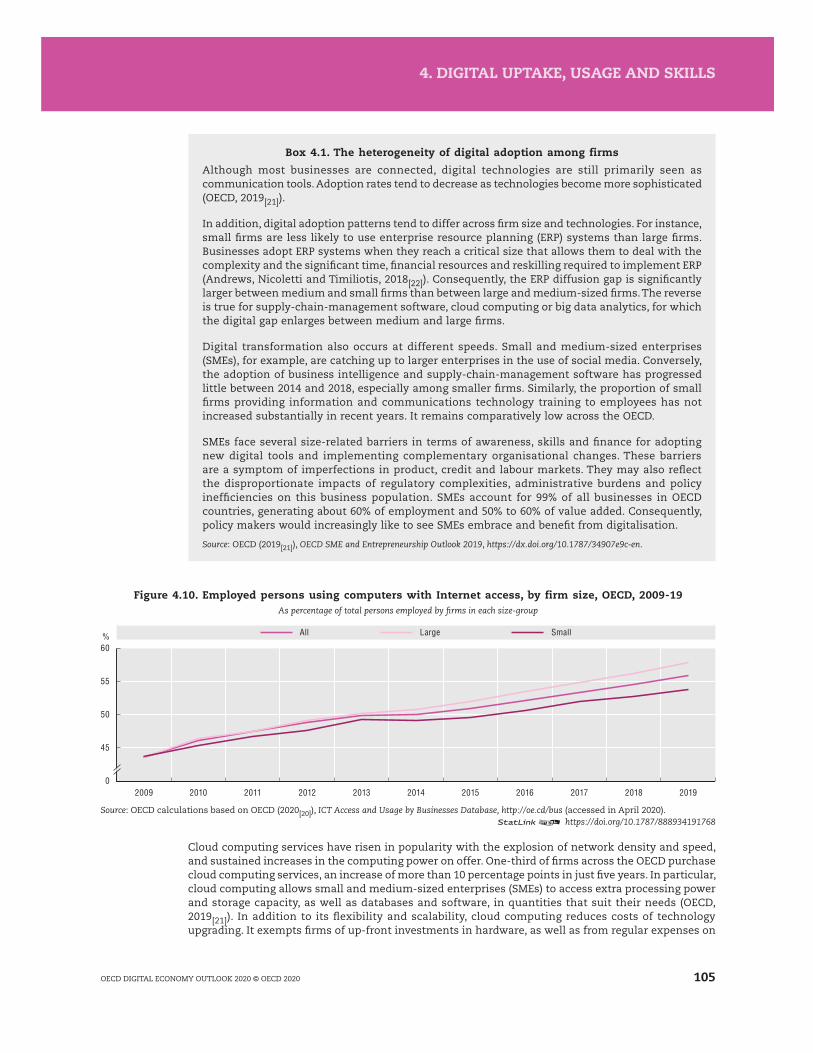
Box 4.1. The heterogeneity of digital adoption among firms
Although most businesses are connected, digital technologies are still primarily seen as communication tools. Adoption rates tend to decrease as technologies become more sophisticated (OECD, 2019[21]).
In addition, digital adoption patterns tend to differ across firm size and technologies. For instance, small firms are less likely to use enterprise resource planning (ERP) systems than large firms. Businesses adopt ERP systems when they reach a critical size that allows them to deal with the complexity and the significant time, financial resources and reskilling required to implement ERP (Andrews, Nicoletti and Timiliotis, 2018[22]). Consequently, the ERP diffusion gap is significantly larger between medium and small firms than between large and medium-sized firms. The reverse is true for supply-chain-management software, cloud computing or big data analytics, for which the digital gap enlarges between medium and large firms.
Digital transformation also occurs at different speeds. Small and medium-sized enterprises (SMEs), for example, are catching up to larger enterprises in the use of social media. Conversely, the adoption of business intelligence and supply-chain-management software has progressed little between 2014 and 2018, especially among smaller firms. Similarly, the proportion of small firms providing information and communications technology training to employees has not increased substantially in recent years. It remains comparatively low across the OECD.
SMEs face several size-related barriers in terms of awareness, skills and finance for adopting new digital tools and implementing complementary organisational changes. These barriers are a symptom of imperfections in product, credit and labour markets. They may also reflect the disproportionate impacts of regulatory complexities, administrative burdens and policy inefficiencies on this business population. SMEs account for 99% of all businesses in OECD countries, generating about 60% of employment and 50% to 60% of value added. Consequently, policy makers would increasingly like to see SMEs embrace and benefit from digitalisation.
Source: OECD (2019[21]), OECD SME and Entrepreneurship Outlook 2019, https://dx.doi.org/10.1787/34907e9c-en.
Figure 4.10. Employed persons using computers with Internet access, by firm size, OECD, 2009-19As percentage of total persons employed by firms in each size-group
0
60
55
50
45
%
2009 2010 2011 2012 2013 2014 2015 2016 2017 2018 2019
All Large Small
Source: OECD calculations based on OECD (2020[20]), ICT Access and Usage by Businesses Database, http://oe.cd/bus (accessed in April 2020).12 https://doi.org/10.1787/888934191768
Cloud computing services have risen in popularity with the explosion of network density and speed, and sustained increases in the computing power on offer. One-third of firms across the OECD purchase cloud computing services, an increase of more than 10 percentage points in just five years. In particular, cloud computing allows small and medium-sized enterprises (SMEs) to access extra processing power and storage capacity, as well as databases and software, in quantities that suit their needs (OECD, 2019[21]). In addition to its flexibility and scalability, cloud computing reduces costs of technology upgrading. It exempts firms of up-front investments in hardware, as well as from regular expenses on
105OECD DIGITAL ECONOMY OUTLOOK 2020 © OECD 2020
4. DIGITAL UPTAKE, USAGE AND SKILLS 4. DIGITAL UPTAKE, USAGE AND SKILLS

maintenance, IT team and certification. It also supports the diffusion of other technologies, as well as new organisational and marketing practices.
More sophisticated and specialist ICT technologies are less widely used. These include big data analytics (BDA) and radio frequency identification (RFID), where uptake is limited to certain types of businesses.
Figure 4.11. Diffusion of selected ICT tools and activities in enterprises, 2019As a percentage of enterprises with ten or more persons employed
0
100
80
60
40
20
%
Fixed
broad
band
Websit
e
Social
med
ia
E-purc
hase
sER
P
Cloud c
ompu
ting
CRM
High-sp
eed b
roadba
nd
E-sales
Supply
-chain
man
agem
ent
RFID
Big da
ta
Gap 1st and 3rd quartiles Average HighestLowest
DenmarkFinland
Norway
New Zealand
Belgium
Finland
NetherlandsDenmark New Zealand
Germany
Korea
Netherlands
Hungary
Turkey
Poland
Belgium IcelandPoland Hungary
Colombia Greece Latvia Canada Austria
Notes: CRM = customer-relationship management. Enterprise resource planning (ERP) systems are software-based tools that can integrate the management of internal and external information flows, from material and human resources to finance, accounting and customer relations. Here, only sharing of information within the firm is considered. Cloud computing refers to ICT services used over the Internet as a set of computing resources to access software, computing power, storage capacity and so on. Supply-chain management refers to the use of automated data exchange applications. Big data refers to the use of techniques, technologies and software tools for analysing big data. This, in turn, relates to the huge amount of data generated from activities that are carried out electronically and from machine-to-machine communications. Social media refer to applications based on Internet technology or communication platforms for connecting, creating and exchanging content on line with customers, suppliers or partners, or within the enterprise. Radio frequency identification (RFID) is a technology that enables contactless transmission of information via radio waves. For country exceptions, see endnote 2. StatLink contains more data.
Sources: OECD (2020[20]), ICT Access and Usage by Businesses Database, http://oe.cd/bus; Eurostat (2019[3]), Digital Economy and Society Statistics, Comprehensive Database (accessed in April 2020).
12 https://doi.org/10.1787/888934191787
Social media: A growing digital tool for businessesWith skyrocketing pervasiveness in society, social media have become a multidimensional vector of information diffusion. Social networks are the most popular online activity in most countries, used by nearly three-quarters of Internet users in the OECD in 2019. Businesses and other organisations are also increasingly using social networks to communicate with individuals (e.g. potential customers). By 2017, more than half of businesses in the OECD had a social media presence, up from one-third in 2013. Even so, there is still a marked contrast between countries. Usage ranges from nearly 80% in Iceland and above 66% in Norway, Brazil, the Netherlands, Ireland and Denmark to below 30% in Japan, Poland and Mexico. Medium and large enterprises are more likely to use social media. In 2017, fewer than one in three small firms in the OECD used social media compared to almost three-quarters of large firms.
Businesses primarily use social media for external interactions. These uses include developing the enterprise’s image and marketing products, as well as to obtain or respond to customer opinions, reviews or questions. Much less frequently, they use social media to involve customers in the development or innovation of goods or services. Social media are also used as a channel to collaborate with business partners, although there are other tools for this kind of interaction. Social media have also become an important tool to recruit employees. Within the European Union, more than half of large firms used it for recruitment in 2017.
106 OECD DIGITAL ECONOMY OUTLOOK 2020 © OECD 2020
4. DIGITAL UPTAKE, USAGE AND SKILLS 4. DIGITAL UPTAKE, USAGE AND SKILLS
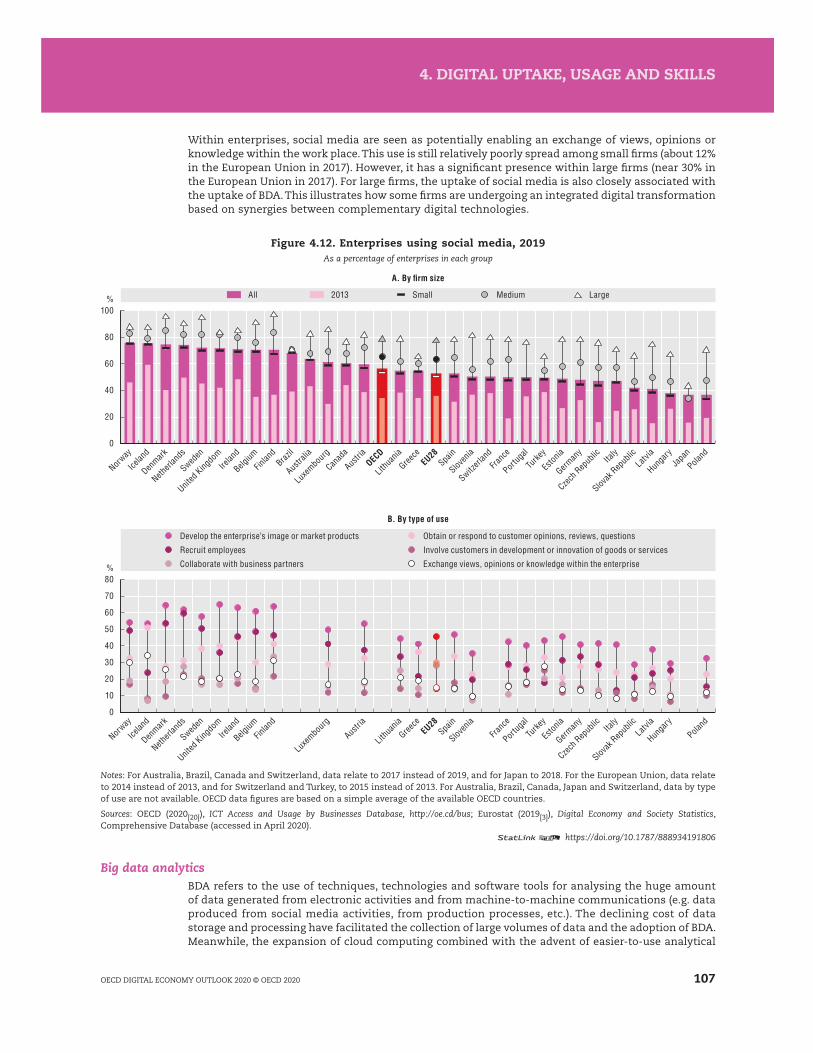
Within enterprises, social media are seen as potentially enabling an exchange of views, opinions or knowledge within the work place. This use is still relatively poorly spread among small firms (about 12% in the European Union in 2017). However, it has a significant presence within large firms (near 30% in the European Union in 2017). For large firms, the uptake of social media is also closely associated with the uptake of BDA. This illustrates how some firms are undergoing an integrated digital transformation based on synergies between complementary digital technologies.
Figure 4.12. Enterprises using social media, 2019As a percentage of enterprises in each group
%
%
0
20
40
60
80
100
10
20
30
40
50
60
70
80
0
Collaborate with business partnersRecruit employeesDevelop the enterprise’s image or market products
Exchange views, opinions or knowledge within the enterpriseInvolve customers in development or innovation of goods or servicesObtain or respond to customer opinions, reviews, questions
A. By firm size
B. By type of use
Norway
Icelan
d
Denmark
Netherl
ands
Sweden
United
Kingdo
mIre
land
Belgium
Finlan
dBraz
il
Australi
a
Luxem
bourg
Canad
a
Austria
OECD
Lithua
nia
Greece
EU28Spa
in
Sloven
ia
Switzerl
andFra
nce
Portug
al
Turke
y
Eston
ia
German
y
Czech R
epub
lic Italy
Slovak
Repub
licLatv
ia
Hunga
ryJa
pan
Poland
Norway
Icelan
d
Denmark
Netherl
ands
Sweden
United
Kingdo
mIre
land
Belgium
Finlan
d
Luxem
bourg
Austria
Lithua
nia
Greece
EU28Spa
in
Sloven
iaFra
nce
Portug
al
Turke
y
Eston
ia
German
y
Czech R
epub
lic Italy
Slovak
Repub
licLatv
ia
Hunga
ry
Poland
All 2013 Small Medium Large
Notes: For Australia, Brazil, Canada and Switzerland, data relate to 2017 instead of 2019, and for Japan to 2018. For the European Union, data relate to 2014 instead of 2013, and for Switzerland and Turkey, to 2015 instead of 2013. For Australia, Brazil, Canada, Japan and Switzerland, data by type of use are not available. OECD data figures are based on a simple average of the available OECD countries.
Sources: OECD (2020[20]), ICT Access and Usage by Businesses Database, http://oe.cd/bus; Eurostat (2019[3]), Digital Economy and Society Statistics, Comprehensive Database (accessed in April 2020).
12 https://doi.org/10.1787/888934191806
Big data analyticsBDA refers to the use of techniques, technologies and software tools for analysing the huge amount of data generated from electronic activities and from machine-to-machine communications (e.g. data produced from social media activities, from production processes, etc.). The declining cost of data storage and processing have facilitated the collection of large volumes of data and the adoption of BDA. Meanwhile, the expansion of cloud computing combined with the advent of easier-to-use analytical
107OECD DIGITAL ECONOMY OUTLOOK 2020 © OECD 2020
4. DIGITAL UPTAKE, USAGE AND SKILLS 4. DIGITAL UPTAKE, USAGE AND SKILLS
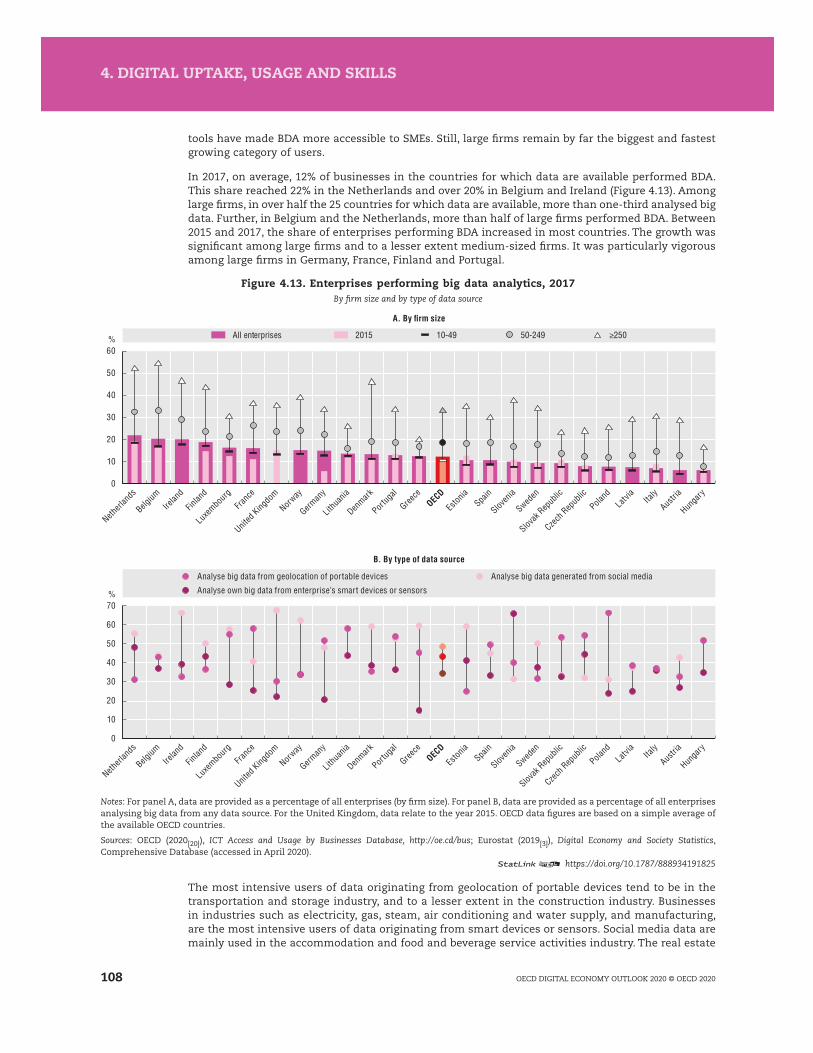
tools have made BDA more accessible to SMEs. Still, large firms remain by far the biggest and fastest growing category of users.
In 2017, on average, 12% of businesses in the countries for which data are available performed BDA. This share reached 22% in the Netherlands and over 20% in Belgium and Ireland (Figure 4.13). Among large firms, in over half the 25 countries for which data are available, more than one-third analysed big data. Further, in Belgium and the Netherlands, more than half of large firms performed BDA. Between 2015 and 2017, the share of enterprises performing BDA increased in most countries. The growth was significant among large firms and to a lesser extent medium-sized firms. It was particularly vigorous among large firms in Germany, France, Finland and Portugal.
Figure 4.13. Enterprises performing big data analytics, 2017By firm size and by type of data source
%
%
0
10
20
30
40
50
60
70
0
10
20
30
40
50
60
Analyse own big data from enterprise’s smart devices or sensorsAnalyse big data from geolocation of portable devices Analyse big data generated from social media
A. By firm size
B. By type of data source
All enterprises 2015 10-49 50-249 ≥250
Netherl
ands
Belgium
Irelan
d
Finlan
d
Luxe
mbourg
France
United
Kingdo
m
Norway
German
y
Lithu
ania
Denmark
Portug
al
Greece
OECD
Estonia
Spain
Sloven
ia
Sweden
Slovak
Repub
lic
Czech R
epub
lic
Poland
Latvia
Italy
Austria
Hunga
ry
Netherl
ands
Belgium
Irelan
d
Finlan
d
Luxe
mbourg
France
United
Kingdo
m
Norway
German
y
Lithu
ania
Denmark
Portug
al
Greece
OECD
Eston
iaSpa
in
Sloven
ia
Sweden
Slovak
Repub
lic
Czech R
epub
lic
Poland
Latvia
Italy
Austria
Hunga
ry
Notes: For panel A, data are provided as a percentage of all enterprises (by firm size). For panel B, data are provided as a percentage of all enterprises analysing big data from any data source. For the United Kingdom, data relate to the year 2015. OECD data figures are based on a simple average of the available OECD countries.
Sources: OECD (2020[20]), ICT Access and Usage by Businesses Database, http://oe.cd/bus; Eurostat (2019[3]), Digital Economy and Society Statistics, Comprehensive Database (accessed in April 2020).
12 https://doi.org/10.1787/888934191825
The most intensive users of data originating from geolocation of portable devices tend to be in the transportation and storage industry, and to a lesser extent in the construction industry. Businesses in industries such as electricity, gas, steam, air conditioning and water supply, and manufacturing, are the most intensive users of data originating from smart devices or sensors. Social media data are mainly used in the accommodation and food and beverage service activities industry. The real estate
108 OECD DIGITAL ECONOMY OUTLOOK 2020 © OECD 2020
4. DIGITAL UPTAKE, USAGE AND SKILLS 4. DIGITAL UPTAKE, USAGE AND SKILLS

activities industry uses social media data to a lesser extent. Data from other sources are most used in three industries: information and communication; professional, scientific and technical activities; and real estate activities.
Policies to promote ICT usage in businessesICT adoption and usage by business can be supported in a wide variety of ways. Out of the 30 countries that responded to the section on Digital Uptake and Use of the OECD Digital Economy Policy Questionnaire, all but three – Italy, the United Kingdom and the United States – reported having policies to promote the use of digital technologies by businesses.
Policy objectives reported in the survey vary greatly and are often set out in broad terms. Most often policies are directed at firms with aims relating implicitly or explicitly to enhancing firms’ profitability. These touch areas such as increasing sales, boosting competitiveness, lowering operating costs, reducing compliance costs and improving productivity. Policy objectives are also articulated at the more macro level in terms of driving growth and employment.
The uptake of digital tools and technologies is a stated means for achieving these aims. E-commerce, business tools and software, social media and online marketing, and security and privacy tools are all frequently noted. As such, policies tend to articulate intermediate objectives or targets around two outcomes. First, they want to ensure firms have access to the knowledge and skills needed to choose and use the tools that will most benefit them. Second, they want to help businesses adopt digital tools, which may include the need to fund investment expenditures.
Several countries support development and deployment of innovative products, especially digital services, to enhance competitiveness and thereby drive growth. The development and adoption of specific “frontier” technologies are a popular frame for policies. Artificial intelligence is most commonly mentioned, as well as 5G, IoT, blockchain, robotics, quantum technologies and others. Data generation, collation and analysis are also highlighted as important underpinning factors. Alongside this, several countries highlight the need to encourage efficient markets for technologies and for data.
Reducing digital divides is also a stated policy objective in some cases and can often be linked to high-level aims around well-being. Meanwhile, a number of countries highlighted policy strands around increasing government uptake of digital technologies to improve efficiency, including in modernising and automating tax systems. Several countries have targeted actions in “social sectors” where government is generally active, such as the promotion of e-health.
As they lag in terms of technology adoption, SMEs are the most common target for policies aiming to increase general digital skills, as well as technology awareness and adoption. The same is true of awareness campaigns around issues such as digital security and privacy, which many countries highlight as key areas of policy action. Policies related to developing specific technologies tend to be more narrowly targeted, focusing on specific companies or sectors, as well as on network operators and relevant researchers. Similarly, policies ultimately targeting wider social issues such as access to health care tend to focus on specific relevant sectors. Meanwhile, some policies are framed as being for the business community at large. However, SMEs may often be the most likely to benefit from the support offered.
Countries adopt a range of policy instruments to promote ICT usage in business (Table 4.2). Direct financial support measures are most widely used, followed by non-financial support. Indirect financial support, along with regulation and statutory guidance, are less often the instruments of choice.
Direct financial support includes grants to help targeted companies cover the costs of accessing digital technologies and tools. Korea, for example, offered grants for cloud services. For its part, Portugal offered direct financial support for website development and maintenance, e-commerce, online marketing and big data. In countries such as Denmark, Slovenia and Germany, direct financial support may also help businesses devise digitalisation strategies or augment digital capabilities and skills. While they do not directly promote the use of digital technologies by businesses, a considerable number of countries note the availability of grants or vouchers to support research and development (R&D) and other innovation activities. This support can contribute to technological advances and the development of innovative products for commercialisation. For example, in Germany, grant funding supports pre-commercial R&D projects in areas including big data, autonomous systems, IT security and service platforms.
109OECD DIGITAL ECONOMY OUTLOOK 2020 © OECD 2020
4. DIGITAL UPTAKE, USAGE AND SKILLS 4. DIGITAL UPTAKE, USAGE AND SKILLS

Table 4.2. Policy instruments to promote digital uptake by businessesBy type of instrument
CountriesFinancial support
Non-financial supportRegulations and
statutory guidanceTotal
Direct Indirect
Australia 2 2 2 1 7
Austria 1 1 1 1 4
Chile .. .. 1 1 2
Colombia 1 1 1 1 4
Czech Republic .. .. 1 2 3
Denmark 2 .. 3 2 7
Estonia 2 .. 2 .. 4
Finland 1 .. .. .. 1
Germany 2 .. 3 3 8
Israel 1 1 .. .. 2
Japan 1 2 .. .. 3
Korea 3 .. .. .. 3
Latvia 2 1 1 3 7
Lithuania 1 1 1 1 4
Mexico .. .. .. 1 1
Netherlands .. 1 .. .. 1
Norway 1 .. 1 1 3
Portugal 1 1 1 .. 3
Slovenia 1 .. 1 .. 2
Spain 1 .. .. .. 1
Sweden 2 0 2 1 5
Turkey 1 .. .. .. 1
Brazil .. 2 .. .. 2
Costa Rica .. .. 1 .. 1
Russian Federation 3 1 1 1 6
Singapore .. .. 1 1 2
Total 29 14 24 20 87
Note: .. = not available.
Source: OECD based on countries’ response to the 2019 OECD Digital Economy Policy Questionnaire.
Indirect financial support includes tax credits or other relief for ICT investment (as seen in Brazil and Japan, for example). It also includes broader schemes of tax support for R&D, including for digital technologies. Many OECD countries have such generic R&D supports, including some that stated they had no policies to promote use of digital technologies by businesses. The Russian Federation, for example, provides indirect support through subsidies to credit institutions. This enables them to provide loans at preferential rates to help priority sectors introduce digital products, services and platform solutions.
Competence Centres offer measures to increase knowledge and awareness of digital technologies and their accompanying opportunities and risks. Australia, Lithuania, Sweden and Singapore, for example, provide tailored business advice and counselling services. Turkey provides tailored advice on regulations relevant to new business models with responses co-ordinated across government, while Latvia and Norway offer training. Countries such as Portugal and Slovenia enable firms to share experiences through showcasing “digital champions”, group workshops, mentoring schemes and similar initiatives.
Regulations and statutory guidance are employed to lay legal foundations in a wide range of areas. The Czech Republic is co-ordinating efforts to enhance cybersecurity, including regulatory changes to codify the role of the National Cyber and Information Security Agency. Mexico focuses on financial technology, including creating regulations relating to financial technology institutions, crowdfunding
110 OECD DIGITAL ECONOMY OUTLOOK 2020 © OECD 2020
4. DIGITAL UPTAKE, USAGE AND SKILLS 4. DIGITAL UPTAKE, USAGE AND SKILLS

and e-money institutions. In Chile, regulations will make it easier and more common for businesses to accept electronic signatures (e.g. authorities, standards setting, education curricula, etc.). Meanwhile, Austria and Norway have mandated public sector suppliers to use e-invoices. Action in this area also includes establishing guiding principles and assessments to ensure regulation support and promote digitalisation. For example, in Denmark, authorities must assess regulation in accordance with stated principles. One such principle is to facilitate the integration of new business models in a technology-neutral manner to ensure user-friendly digitalisation.
Almost all OECD and other responding countries have policies to promote the use of digital technologies by businesses. In addition, many highlight policies that support technological advances and the development of innovative products, as well as their adoption. Policies are most commonly targeted towards SMEs. However, some policies are more inclusive in scope, while others are more narrowly targeted depending on the policy aims. Furthermore, countries use a wide range of policy instruments, even if different countries have similar intermediate and ultimate policy aims.
Digital governmentOver the past decades, large-scale reforms enabled greater efficiency and effectiveness of public services through digital transformation. As part of these efforts, governments made large investments to adopt new practices and modernise services to better respond to citizens’ needs. Online service platforms common to several public sector organisations have been established to simplify administrative processes and improve interaction with citizens.
Governments are embracing digital technologies to enhance access to services and information The share of individuals using the Internet to interact with public authorities in OECD countries has increased from 43% to 58% over 2010-19. Differences among countries remain large, however, ranging from over 80% in the Nordic countries to 8% in Colombia (Figure 4.14). The proportion of users with low or no formal education is about half that of individuals with tertiary education. Cross-country variations may reflect differences in various factors. These include Internet usage rates, the availability of e-government services, the propensity of users to perform administrative procedures on line, and data comparability.
Figure 4.14. Individuals who used the Internet to interact with public authorities, by educational attainment, 2019
As a percentage of individuals in each group
%
0
20
40
60
100
80
All 2010 Tertiary education Low or no formal education
Denmark
Icelan
d
Finlan
d
Norway
Sweden
Netherl
ands
Eston
ia
Switzerl
andFra
nce
Austria
Latvia
Canad
a
United
Kingdo
mIre
land
Luxem
bourg
German
y
Slovak
Repub
lic
Belgium OECD
Spain
Lithua
nia
Czech R
epub
lic
Sloven
ia
Hunga
ry
Greece
Turke
y
Portug
al
Poland
Israe
l
Costa Rica
Brazil
Chile
Mexico Ita
ly
Colombia
Notes: Unless otherwise stated, data refer to the respective online activities in the last 12 months. For Brazil and Colombia, data refer to 2018 instead of 2019. For Canada, data refer to 2018 instead of 2019 and to individuals aged 15-74 instead of 16-74, and 15-24 instead of 16-24. For Chile, data refer to 2009 and 2017. For Israel, data refer to 2017 instead of 2019 and to individuals aged 20 and more instead of 16-74, and 20-24 instead of 16-24. Data relate to Internet use for obtaining services online from government offices, including downloading or filling in official forms in the last three months. For Mexico, data refer to 2018 instead of 2019 and the interaction with public authorities includes the following categories: Communicate with the government, consult government information, download government formats, perform government procedures, and comment on government consultations. For Costa Rica, data refer to 2018 instead of 2018 and to individuals aged 18-74. OECD data figures are based on a simple average of the available countries. StatLink contains more data.
Source: OECD (2020[1]), ICT Access and Usage by Households and Individuals Database, http://oe.cd/hhind (accessed in April 2020). 12 https://doi.org/10.1787/888934191844
111OECD DIGITAL ECONOMY OUTLOOK 2020 © OECD 2020
4. DIGITAL UPTAKE, USAGE AND SKILLS 4. DIGITAL UPTAKE, USAGE AND SKILLS

Online tax filing is one important way that users have embraced digital government services. All OECD and BRIICS countries (Brazil, Russian Federation, India, Indonesia, the People’s Republic of China, South Africa) offer online tax filing for at least some types of tax. These range from personal and corporate income taxes to value-added tax filings by businesses. Taxpayers in Brazil, Costa Rica, Denmark, Italy, Mexico and Portugal must use online filing for both personal and corporate income taxes (Figure 4.15). In most countries, the share of corporate income tax returns filed on line is also above 80%. This trend is driven by a shift towards compulsory online filing. However, the share of businesses and especially of individuals required to file tax returns varies considerably between countries. In Estonia, online filing of personal income tax returns is not mandatory, but 96% of personal returns are filed via this channel.
Figure 4.15. Personal and corporate income tax returns filed on line, 2017As a percentage of all tax filings
%
0
20
40
60
100
80
Corporate tax returns Personal tax returns
Brazil
Costa Rica
Denmark
Eston
ia
Hunga
ryIta
ly
Lithua
nia
Mexico
Netherl
ands
Portug
alSpa
in
Sloven
ia
Irelan
d
Greece
Chile
Icelan
d
Belgium
United
Kingdo
m
Colombia
Austria
Norway
Russia
n Fed
eratio
n
Australi
aFra
nce
Canad
aIsr
ael
South Afri
ca
Indon
esia
Slovak
Repub
lic
Poland
Finlan
d
Czech R
epub
lic
Thailan
d
Luxem
bourg
Note: For Iceland, the corporate tax return data refer to 2014.
Source: OECD (2019[23]), Tax Administration 2019: Comparative Information on OECD and other Advanced and Emerging Economies, https://dx.doi.org/ 10.1787/74d162b6-en.
12 https://doi.org/10.1787/888934191863
In 2019, the share of individuals citing unavailability of online submission channels as a reason for not submitting online forms to public authorities was generally low. The share was around 2% or under in most countries with such data (Figure 4.16). Unavailability of online submission channels appears to have increased in several countries. However, this most likely reflects greater awareness of survey respondents about unavailability (as a result of being more likely to seek how to submit forms on line), rather than the closure of online submission channels.
Co-ordination is a key factor for digital governmentBecoming fully digital requires further coherence and integration of decisions and activities within and among public sector organisations (OECD, 2019[24]). This entails a shift from e-government (e.g. online tax payments systems) to digital government. The latter term refers to the use of digital technologies as an integrated part of governments’ modernisation strategies to create public value. It relies on a digital ecosystem comprised of government actors, non-governmental organisations, businesses, citizens’ associations and individuals. This ecosystem supports the production of and access to data, services and content through interactions with the government. For example, several governmental institutions might share an open data platform.
In 2014, OECD countries adopted the OECD Recommendation of the Council on Digital Government Strategies (OECD, 2014[25]). This aimed to support the development and implementation of digital government strategies that bring governments closer to citizens and businesses. Shortly after, the OECD Survey on Digital Government 1.0 was designed to monitor implementation of this Recommendation. It aims to assess progress of governments in their evolution from e-government to digital government.
112 OECD DIGITAL ECONOMY OUTLOOK 2020 © OECD 2020
4. DIGITAL UPTAKE, USAGE AND SKILLS 4. DIGITAL UPTAKE, USAGE AND SKILLS
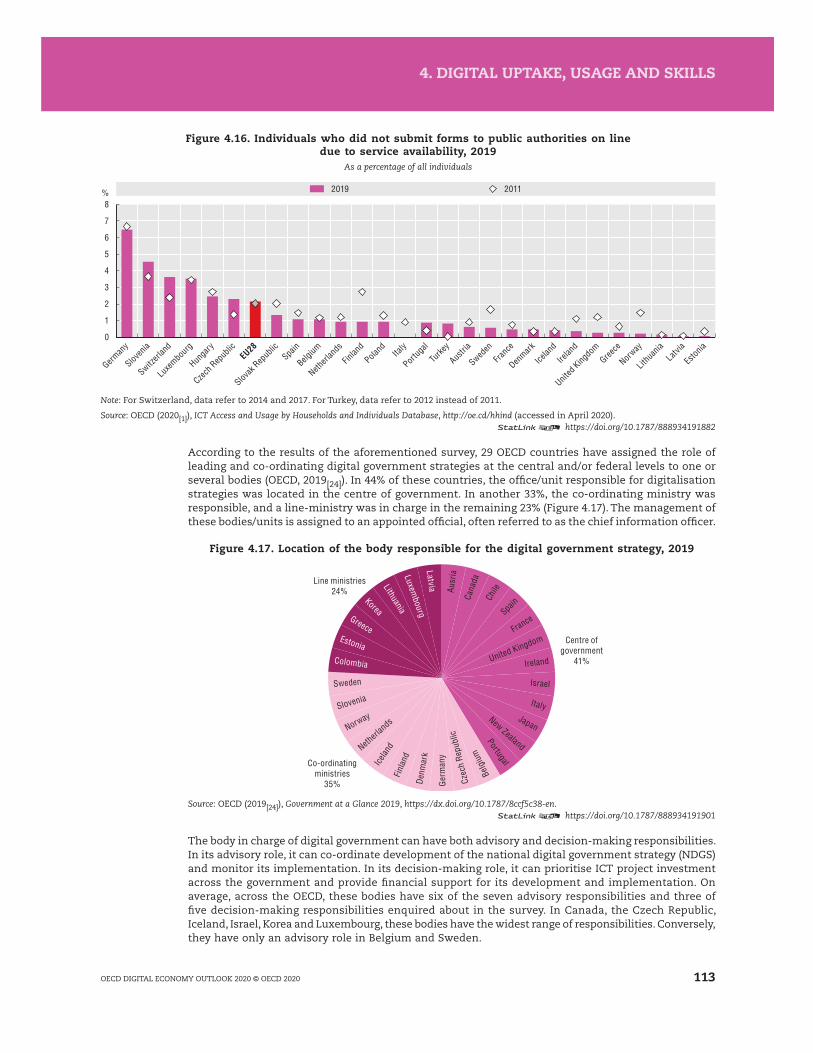
Figure 4.16. Individuals who did not submit forms to public authorities on line due to service availability, 2019
As a percentage of all individuals
%
0
1
2
3
4
5
6
7
8
2019 2011
German
y
Sloven
ia
Switzerl
and
Luxem
bourg
Hunga
ry
Czech R
epub
licEU28
Slovak
Repub
licSpa
in
Belgium
Netherl
ands
Finlan
d
Poland Ita
ly
Portug
al
Turke
y
Austria
Sweden
France
Denmark
Icelan
d
Irelan
d
United
Kingdo
mGree
ce
Norway
Lithua
niaLatv
ia
Eston
ia
Note: For Switzerland, data refer to 2014 and 2017. For Turkey, data refer to 2012 instead of 2011.
Source: OECD (2020[1]), ICT Access and Usage by Households and Individuals Database, http://oe.cd/hhind (accessed in April 2020).12 https://doi.org/10.1787/888934191882
According to the results of the aforementioned survey, 29 OECD countries have assigned the role of leading and co-ordinating digital government strategies at the central and/or federal levels to one or several bodies (OECD, 2019[24]). In 44% of these countries, the office/unit responsible for digitalisation strategies was located in the centre of government. In another 33%, the co-ordinating ministry was responsible, and a line-ministry was in charge in the remaining 23% (Figure 4.17). The management of these bodies/units is assigned to an appointed official, often referred to as the chief information officer.
Figure 4.17. Location of the body responsible for the digital government strategy, 2019
Co-ordinatingministries
35%
Line ministries24%
Centre ofgovernment
41%Ireland
Israel
ItalyJapan
New Zealand
Portugal
Belg
ium
Czec
h Re
publ
icGe
rman
y
Denm
ark
Finl
and
Icelan
dNetherl
ands
NorwaySlovenia
Sweden
Colombia
Estonia
Greece
Korea
LithuaniaLuxem
bourgLatvia
United KingdomFrance
SpainCh
ile
Cana
da
Ausr
ia
Source: OECD (2019[24]), Government at a Glance 2019, https://dx.doi.org/10.1787/8ccf5c38-en.12 https://doi.org/10.1787/888934191901
The body in charge of digital government can have both advisory and decision-making responsibilities. In its advisory role, it can co-ordinate development of the national digital government strategy (NDGS) and monitor its implementation. In its decision-making role, it can prioritise ICT project investment across the government and provide financial support for its development and implementation. On average, across the OECD, these bodies have six of the seven advisory responsibilities and three of five decision-making responsibilities enquired about in the survey. In Canada, the Czech Republic, Iceland, Israel, Korea and Luxembourg, these bodies have the widest range of responsibilities. Conversely, they have only an advisory role in Belgium and Sweden.
113OECD DIGITAL ECONOMY OUTLOOK 2020 © OECD 2020
4. DIGITAL UPTAKE, USAGE AND SKILLS 4. DIGITAL UPTAKE, USAGE AND SKILLS

A fully digital government is user-driven and features government as a platform When designing and delivering policies and public services, the governments of OECD countries are increasingly placing the needs of citizens and businesses at the core of design. The “user-driven” approach implies a profound shift from the traditional e-government model based on governments’ assumptions or understanding of users’ preferences. The OECD Survey on Digital Government 1.0 assesses the extent to which a government has adopted an open, inclusive, accessible, transparent and accountable process in the formulation of the NDGS. Questions focus on user engagement strategies, means to evaluate these strategies and initiatives to increase digital skills, notably for vulnerable segments (OECD, 2019[26]).
The user-driven index (Figure 4.18) shows large differences among countries, with the user-driven approach being the more advanced in Denmark, Colombia and the United Kingdom.
Figure 4.18. Governments with a user-driven approach, 2019
0
0.1
0.2
0.3
0.4
0.5
0.6
0.7
0.8
0.9Index
Denmark
Colombia
United
Kingdo
mKore
aJa
pan
Canad
a
New Ze
aland
Sloven
iaIta
lyFra
nce
Spain
Brazil
Luxe
mbourg
Norway
Israe
lOEC
D
Austria
Portug
alChil
e
Eston
ia
Netherl
ands
Czech R
epub
lic
Finlan
dLatv
ia
German
y
Belgium
Irelan
d
Lithu
ania
Icelan
d
Greece
Argentin
a
Sweden
Source: OECD calculations based on OECD Survey on Digital Government 1.0 (accessed in June 2020).12 https://doi.org/10.1787/888934191920
As part of their digital government strategies, OECD countries have been developing an ecosystem to support and equip public servants to make policy and deliver services. This approach to “government as a platform” further allows government to explore opportunities to collaborate with citizens, businesses, civil society and others. In this way, they can co-create services, solutions and public value more broadly.
The OECD Survey on Digital Government 1.0 assesses the extent to which a government uses technologies and data to harness the creativity and knowledge of people and facilitate collaborations to jointly address policy challenges. In particular, it involves measuring stakeholder engagement in various governmental policy processes with the use of digital technologies. Countries report offering, most commonly, a range of non-financial support, as well as data as an enabler for greater collaboration (OECD, 2019[26]).
The degree to which OECD countries have embraced the government as a platform approach vary significantly (Figure 4.19). The United Kingdom, Korea and Portugal seem to be leading in this area, while the approach seems less developed in Finland, Austria and Argentina.
Over the recent period, rapid technological progress has significantly increased the amount of data generated in societies, including by government organisations. Open government data (OGD) can be used to strengthen public governance in various ways. It can improve the design of public services with a citizen-driven approach. It can enhance public sector efficiency and responsiveness. Finally, it can spur public sector integrity and accountability. Similarly, ensuring OGD availability, accessibility and use by public, private and civic actors provides many benefits. Governments can design more evidence-based and inclusive policies. They can stimulate innovation inside and outside the public sector, and motivate data-driven civic engagement. They can also better inform citizens’ personal decisions and enhance public trust. Making data and evidence available across government departments
114 OECD DIGITAL ECONOMY OUTLOOK 2020 © OECD 2020
4. DIGITAL UPTAKE, USAGE AND SKILLS 4. DIGITAL UPTAKE, USAGE AND SKILLS

and ministries contributes to better policy making and greater co-ordination, and empowers businesses and civil society to also contribute (Chapter 5).
Figure 4.19. Countries with a government as a platform approach, 2019
Index
00.10.20.30.40.50.60.70.80.91.0
United
Kingdo
mKore
a
Portug
al
Canad
a
Colombia
Israe
l
New Ze
aland
Spain
Japa
n
Norway
Sloven
ia
Denmark
Irelan
dOEC
DFra
nce
Brazil
Netherl
ands
Czech R
epub
lic
Belgium
Luxe
mbourg Chil
e
Eston
iaIta
ly
Greece
Latvia
German
y
Lithu
ania
Sweden
Icelan
d
Argentin
a
Austria
Finlan
d
Source: OECD calculations based on OECD Survey on Digital Government 1.0 (accessed in June 2020).12 https://doi.org/10.1787/888934191939
Skills for the digital transformationSolid cognitive skills coupled with problem-solving skills and other competencies necessary to carry out tasks in online environments are key for enabling effective use of digital technologies and prospering in the digital society. This section provides some stylised facts on digital natives and the adult population. It examines new facets of the digital divide, shedding light on ICT skills demand in the workplace and possible mismatches. Finally, it reviews policies to develop the skills required to prosper in the digital society.
Connectivity at an early age does not always lead to higher skills An increasing number of online activities related to education are undertaken both at school and at home. Connectivity for younger generations gains additional importance when children cannot attend school for various reasons such as long-term hospital care or the containment measures applied in many countries during the COVID-19 pandemic. In such circumstances, governments foster the use of digital solutions for education. Beyond the effectiveness of such teaching methods, helping children stay connected with regular academic and social activities has been shown to reduce difficulties during school re-entry (Ratnapalan, Rayar and Crawley, 2009[27]).
According to results from the ICT familiarity module of the OECD Programme for International Student Assessment (PISA), the age of first access to the Internet has been decreasing in almost all countries over the recent period (Figure 4.20). In 2018, 24% of 15 year-olds in the OECD area first accessed the Internet at the age of 6 or under as opposed to 18% in 2015 and 15% in 2012. The share of such students was around 40% in Israel, Estonia and Denmark. Only 0.3% of students in OECD countries reported never having accessed the Internet.
Top performers (i.e. academic all-rounders) have the highest level of proficiency in PISA as they achieved Level 5 or 6 in science, reading and mathematics concomitantly. They can draw on and use information from multiple direct and indirect sources to solve complex problems, and can integrate knowledge from across different areas. Such exceptional skills can provide a significant advantage in a competitive, knowledge-based global economy as they allow adapting to the scale, speed and scope of digital transformations. Between 2012 and 2018, the share of top performers in science, mathematics and reading decreased in most countries with available data (Figure 4.21). Despite a drop of about 2 percentage points in 2018, Singapore remained the country with the highest share of top performers (15%), followed by Estonia, Korea and Japan.
115OECD DIGITAL ECONOMY OUTLOOK 2020 © OECD 2020
4. DIGITAL UPTAKE, USAGE AND SKILLS 4. DIGITAL UPTAKE, USAGE AND SKILLS

Figure 4.20. Students who first accessed the Internet at age 6 or under, 2018As a percentage of 15 year-old students
%
0
10
20
30
40
50
20152018 2012
Israe
l
Eston
ia
Denmark
Finlan
d
Icelan
d
Lithua
nia
United
Kingdo
mLatv
ia
United
States
Sweden
Poland
Australi
a
Sloven
iaSpa
inOECD
New Ze
aland
Hunga
ry
Czech R
epub
lic
Singap
oreKore
aBraz
ilChil
eTu
rkeyFra
nce
Austria
Greece
Belgium
Costa Rica
Japan
Switzerl
and
Slovak
Repub
lic
Russia
n Fed
eratio
n
Thailan
d
Luxem
bourg Ita
ly
Mexico
Irelan
d
Source: OECD calculations based on Programme for International Student Assessment (PISA) (database), www.oecd.org/pisa/data (accessed in February 2020).12 https://doi.org/10.1787/888934191958
Figure 4.21. Top performers in science, mathematics and reading, 2018As a percentage of 15 year-old students
%
0
2
4
6
8
10
12
14
16
18% Magnified
00.10.20.30.4
2018 2012
Singap
ore
Eston
iaKore
aJa
pan
Canad
a
Netherl
ands
Poland
Finlan
d
German
y
New Ze
aland
Sweden
United
Kingdo
m
United
States
Austra
lia
Belgium
Switzerl
and
Norway
Czech R
epub
lic
Sloven
iaOEC
DFra
nce
Austria
Irelan
d
Luxe
mbourg
Denmark
Israe
l
Portug
al
Icelan
d
Hunga
ry
Lithu
ania
Slovak
Repub
lic
Russia
n Fed
eratio
nLatv
iaIta
lyTu
rkey
Greece
ChileBraz
il
Mexico
Colombia
Thail
and
Costa
Rica
Indon
esia
ChileBraz
il
Mexico
Colombia
Thail
and
Costa
Rica
Indon
esia
Source: OECD calculations based on Programme for International Student Assessment (PISA) (database), www.oecd.org/pisa/data (accessed in February 2020).12 https://doi.org/10.1787/888934191977
Evidence from the OECD Programme for International Assessment of Adult Competencies (PIAAC) enables a similar view to be drawn for adults. Individuals with a well-rounded skill set in terms of literacy, numeracy and problem solving in technology-rich environments gain an advantage. They can be expected to use digital tools more efficiently, carry out more sophisticated activities on line and better adapt to digital transformations. Countries with higher shares of top-performing students also exhibit higher shares of adults with well-rounded skills (the same is true for lower performance). This underlines the importance of formal education. Furthermore, the share of individuals lacking basic skills in Chile and Turkey is comparable to that of individuals with a well-rounded skill set in Finland, Norway and Sweden, pointing to a skills gap among OECD countries (Figure 4.22).
Training is one crucial way to upskill and reskill individuals to meet their personal digital skills needs. With the widespread use of digital technologies, alternative training channels such as massive open online courses (MOOCs) have become popular, especially among younger people. MOOCs can
116 OECD DIGITAL ECONOMY OUTLOOK 2020 © OECD 2020
4. DIGITAL UPTAKE, USAGE AND SKILLS 4. DIGITAL UPTAKE, USAGE AND SKILLS
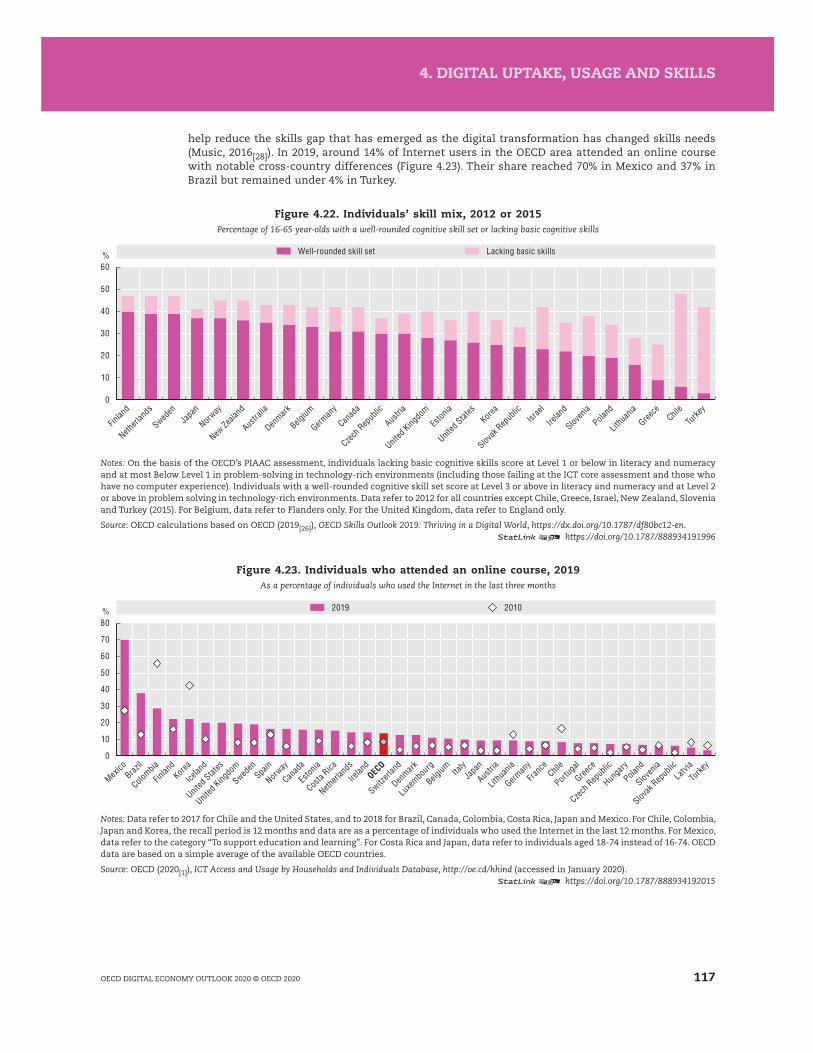
help reduce the skills gap that has emerged as the digital transformation has changed skills needs (Music, 2016[28]). In 2019, around 14% of Internet users in the OECD area attended an online course with notable cross-country differences (Figure 4.23). Their share reached 70% in Mexico and 37% in Brazil but remained under 4% in Turkey.
Figure 4.22. Individuals’ skill mix, 2012 or 2015Percentage of 16-65 year-olds with a well-rounded cognitive skill set or lacking basic cognitive skills
%
0
10
20
30
40
50
60
Well-rounded skill set Lacking basic skills
Finlan
d
Netherl
ands
Sweden
Japa
n
Norway
New Ze
aland
Austra
lia
Denmark
Belgium
German
y
Canad
a
Czech R
epub
lic
Austria
United
Kingdo
mEs
tonia
United
States
Korea
Slovak
Repub
licIsr
ael
Irelan
d
Sloven
ia
Poland
Lithu
ania
Greece
Chile
Turke
y
Notes: On the basis of the OECD’s PIAAC assessment, individuals lacking basic cognitive skills score at Level 1 or below in literacy and numeracy and at most Below Level 1 in problem-solving in technology-rich environments (including those failing at the ICT core assessment and those who have no computer experience). Individuals with a well-rounded cognitive skill set score at Level 3 or above in literacy and numeracy and at Level 2 or above in problem solving in technology-rich environments. Data refer to 2012 for all countries except Chile, Greece, Israel, New Zealand, Slovenia and Turkey (2015). For Belgium, data refer to Flanders only. For the United Kingdom, data refer to England only.
Source: OECD calculations based on OECD (2019[26]), OECD Skills Outlook 2019: Thriving in a Digital World, https://dx.doi.org/10.1787/df80bc12-en.12 https://doi.org/10.1787/888934191996
Figure 4.23. Individuals who attended an online course, 2019As a percentage of individuals who used the Internet in the last three months
%
0
10
20
30
40
50
60
70
80
2019 2010
Mexico
Brazil
Colombia
Finlan
dKore
a
Icelan
d
United
States
United
Kingdo
m
Sweden
Spain
Norway
Canad
a
Eston
ia
Costa Rica
Netherl
ands
Irelan
dOEC
D
Switzerl
and
Denmark
Luxem
bourg
Belgium Ita
lyJa
pan
Austria
Lithu
ania
German
yFra
nce
Chile
Portug
al
Greece
Czech R
epub
lic
Hunga
ry
Poland
Sloven
ia
Slovak
Repub
licLatv
iaTu
rkey
Notes: Data refer to 2017 for Chile and the United States, and to 2018 for Brazil, Canada, Colombia, Costa Rica, Japan and Mexico. For Chile, Colombia, Japan and Korea, the recall period is 12 months and data are as a percentage of individuals who used the Internet in the last 12 months. For Mexico, data refer to the category “To support education and learning”. For Costa Rica and Japan, data refer to individuals aged 18-74 instead of 16-74. OECD data are based on a simple average of the available OECD countries.
Source: OECD (2020[1]), ICT Access and Usage by Households and Individuals Database, http://oe.cd/hhind (accessed in January 2020).12 https://doi.org/10.1787/888934192015
117OECD DIGITAL ECONOMY OUTLOOK 2020 © OECD 2020
4. DIGITAL UPTAKE, USAGE AND SKILLS 4. DIGITAL UPTAKE, USAGE AND SKILLS
According to 2018 data from the European Community Survey on ICT Usage in Households and by Individuals, 11% of Internet users undertook free online training courses or self-studied to improve their skills related to the use of computers, software or applications; only 3% undertook self-paid training courses. About 12% of Internet users reported having received on-the-job training from co-workers or supervisors and 9% took part in a training course paid for or directly provided by their employer. Over the recent period, the participation of Internet users in online courses has been generally lower in European countries compared to Canada, Korea, Mexico or the United States.
The digital divide tends to strengthen socio-economic disparities As the Internet permeates every aspect of the economy and society, the digital divide has been evolving from one of Internet access to one of effective Internet use. Differences in people’s digital activities may not matter if they have no effect on other outcomes. There is significant evidence, however, that most types of digital uses reproduce and even amplify non-digital inequalities (van Deursen et al., 2017[29]).
Skills play a key role in the emergence and evolution of digital divides. People with higher skills can make better use of the Internet and online activities. By using the Internet to expand their knowledge, find better jobs more easily, follow online courses or secure faster access to health care, the highly skilled can obtain more opportunities. Conversely, if low-skilled people use the Internet more for chatting and entertainment, they risk amplifying existing inequalities and undermining their well-being. To design policies that bridge the digital divide, policy makers must understand what types of skills help people get the most out of the Internet, and how important those skills are in relation to other determinants.
OECD (2019[26]) investigates the relationship between skills and digital divides, based on individual-based data from the European Community Survey on ICT Usage in Households and by Individuals (2016) and the OECD Survey of Adult Skills, a product of PIAAC.
The analysis profiles four types of Internet use:
1. Diversified and complex use. Individuals in this profile perform on average the largest number and greatest variety of activities. They carry out the biggest share of online tasks linked to e-finance, learning and creativity, as well as activities performed by the smallest range of individuals and that can also be considered more complex.
2. Diversified and simple use. Individuals in this profile perform a range of activities, like those in profile 1, but fewer linked to finance, creativity and learning. Their main online activities revolve around communication, social networks, access to information and entertainment.
3. Use for practical reasons. Individuals in this profile use the Internet in diverse ways, albeit less so than individuals in profiles 1 and 2. They use the Internet mostly for communication, looking for information, e-health and Internet banking.
4. Use for communication and information. Individuals in this profile make the most specialised use of the Internet, mainly using communication tools and accessing the Internet to obtain information. These latter two activities combined make up for 70% of all activities performed on line by individuals in this user profile.
In 2016, in a majority of countries included in the sample, over half of individuals made “diversified and complex use” of the Internet (Figure 4.24). In Norway, the Netherlands and Sweden, about 80% of individuals engage in such activities, as opposed to less than 40% in Poland and Italy.
Socio-demographic characteristics appear to be related to the type of Internet uses. Individuals with diverse and complex Internet use are the most educated in the sample considered in the analysis: 39% have tertiary education and 41% have completed the upper-secondary education. Employed persons are also over-represented in this profile. They represent 70% of all individuals with a diverse and complex use. Finally, three out of four individuals in this Internet user profile are aged between 25 and 55, showing that young people (aged 16 to 24) and those aged 55 to 64 are less likely to make diverse and complex use of Internet (OECD, 2019[26]).
118 OECD DIGITAL ECONOMY OUTLOOK 2020 © OECD 2020
4. DIGITAL UPTAKE, USAGE AND SKILLS 4. DIGITAL UPTAKE, USAGE AND SKILLS

Figure 4.24. Individuals with diversified and complex use of the Internet, 2016As a percentage of all individuals
0
10
20
30
40
50
60
70
80
90%
Norway
Netherl
ands
Sweden
Luxe
mbourg
Finlan
d
Eston
ia
United
Kingdo
mLatv
ia
Belgium
Austria
Irelan
d
Lithu
ania
Spain
Portug
al
Franc
e
Hunga
ry
Sloven
ia
Slovak
Repub
lic
Czech R
epub
lic
Greece
Poland Ita
ly
Notes: The European Community Survey on ICT Usage in Households and by Individuals provides information on what actions individuals perform online grouped into 11 major activities: communication, social networks, access to information, entertainment, creativity, learning, e-health, e-banking, e-finance, e-government and e-commerce. The identification of individuals with diversified and complex use of Internet is based on a clustering algorithm (k-means) that groups individuals according to the similarity of their online activities. Individuals with diversified and complex use are individuals who perform, on average, the largest number (more than 8 out of the 11 types of major online activities) and variety of activities. They are also those who perform the bigger share of activities linked to e-finance, learning and creativity – activities performed by the smallest range of individuals which can also be considered more complex activities. The clustering algorithm is run on the entire sample of OECD countries with available data in the European Community Survey on ICT Usage in Households and by Individuals (2016).
Source: OECD (2019[26]), OECD Skills Outlook 2019: Thriving in a Digital World, https://dx.doi.org/10.1787/df80bc12-en.12 https://doi.org/10.1787/888934192034
Figure 4.25 shows that around 40% of individuals with diversified and complex use of the Internet also have a good level of both literacy and numeracy skills. The share of highly skilled individuals is substantially lower in the other profiles. Less than 10% of those who use the Internet mainly for information and communication have good literacy and numeracy skills. The share of those lacking basic skills is more evenly distributed across the different profiles at a rather lower level. When literacy and numeracy skills are considered separately, more than 9% of people in profiles 2, 3 and 4 appear to lack basic numeracy skills. This suggests that a lack of such skills is not a barrier to participation in Internet activities. However, the lack of both literacy and numeracy skills does seem to be a barrier.
Based on a more restricted sample of available data on individuals who can use ICT tools and applications, the skills mix of individuals includes literacy, numeracy and problem solving in technology-rich environments. The problem-solving skills assessed in the OECD Survey of Adult Skills (PIAAC) are not digital skills per se, but basic computer literacy skills (i.e. the capacity to use ICT tools and applications).
Individuals with a well-rounded skills set are over-represented in the diversified and complex use profile. However, fewer individuals are proficient in all three skills (34%) than those who are proficient in literacy and numeracy only (40%) (Figure 4.25). In general, the share of individuals with a good level of problem-solving skills in technology-rich environments is low across user profiles. Even among individuals with diversified and complex Internet use, almost one in five lacks basic skills to solve problems in a digital environment.
These results suggest that lacking problem-solving skills in technology-rich environments on its own might not be a barrier to participation in online activities, while lacking a mix of skills may be a strong barrier. Having a good level of cognitive skills seems to enable more diverse and complex Internet uses.
Therefore, digital inclusion policies should consider the acquisition of basic literacy and numeracy skills as they impact individuals’ use of Internet in addition to factors such as age or employment status.
119OECD DIGITAL ECONOMY OUTLOOK 2020 © OECD 2020
4. DIGITAL UPTAKE, USAGE AND SKILLS 4. DIGITAL UPTAKE, USAGE AND SKILLS

Figure 4.25. Skills of Internet users by profile, 2016Share of individuals in each skill level category, by online user profile
Problem solving in technology-rich environmentsNumeracyLiteracy
Skills mix (all skills)Skills mix (literacy and numeracy)
Profile 1: Diversified and complex use
Good l
evel
of sk
ills
Lackin
g bas
ic sk
ills
Good l
evel
of sk
ills
Lackin
g bas
ic sk
ills
Good l
evel
of sk
ills
Lackin
g bas
ic sk
ills
Good l
evel
of sk
ills
Lackin
g bas
ic sk
ills
Well-ro
unde
d skil
ls se
t
Lackin
g bas
ic sk
ills
Profile 2: Diversified and simple use
Profile 3: Use for practical reasons
Profile 4: Use for information and communication
Entire sample
Notes: The bars display the share of individuals in each skill level category. The maximum value of each share is 60%. For literacy and numeracy: individuals lacking basic skills score at most Level 1 (inclusive); individuals with a good level of skills score at least Level 3. For skills mix (literacy and numeracy): individuals lacking basic skills score at most Level 1 (inclusive) in literacy and numeracy; individuals with a good level of skills score at least Level 3 in literacy and numeracy. For problem solving in technology-rich environments: individuals lacking basic skills score at most Below Level 1 (inclusive) in problem solving (including failing ICT core and having no computer experience); individuals with a good level of skills score at least Level 2 (inclusive) in problem solving. For the skills mix (all skills): individuals lacking basic skills score at most Level 1 (inclusive) in literacy and numeracy and at most Below Level 1 (inclusive) in problem solving (including failing ICT core and having no computer experience); individuals with a well-rounded skill set score at least Level 3 (inclusive) in literacy and numeracy and at least Level 2 (inclusive) in problem solving. The analysis was performed on the file in which data from PIAAC was matched with that of the European Community Survey on ICT Usage in Households and by Individuals for seven countries (Czech Republic, Finland, France, Ireland, Italy, Lithuania and Spain). The sample for the analysis on the effect of good problem-solving skills includes individuals from the Czech Republic, Finland, Ireland and Lithuania. France, Italy and Spain did not participate in the problem-solving skills in technology-rich environments assessment. In the OECD Survey of Adult Skills (PIAAC): for Lithuania, data refer to 2015; for all other countries included in the analysis, data refer to 2012. For the European Community Survey on ICT Usage in Households and by Individuals, data refer to 2016. StatLink contains more data.
Source: OECD (2019[26]), OECD Skills Outlook 2019: Thriving in a Digital World, https://dx.doi.org/10.1787/df80bc12-en. 12 https://doi.org/10.1787/888934192053
Jobs are increasingly ICT-task intensive but there are signals of a skill mismatchIndividuals need the right mix of skills to succeed in technology-rich work environments and to be prepared for new and changing jobs. Evidence shows the importance of cognitive skills such as literacy, numeracy and problem solving for workers in any industry to thrive in a digital and interconnected global economy (Grundke et al., 2017[30]; 2018[31]). There is a growing consensus that transversal skills are critical. These include thinking critically and creatively, solving problems, making informed decisions while using technology and behaving collaboratively (OECD, 2016[32]).
Jobs differ in their ICT-task intensity – the frequency with which these tasks are undertaken. Software, finance, sales and marketing have generally more ICT task-intensive jobs. Conversely, jobs in areas such as accommodation and food, and health and social work tend to have relatively lower ICT-task
120 OECD DIGITAL ECONOMY OUTLOOK 2020 © OECD 2020
4. DIGITAL UPTAKE, USAGE AND SKILLS 4. DIGITAL UPTAKE, USAGE AND SKILLS

intensity. On the basis of the PIAAC data, the average ICT-task intensity of jobs ranges from around 40% in Russian Federation and Turkey to nearly 60% in Scandinavian countries (Figure 4.26). In almost all countries, the average ICT-task intensity of jobs held by women is greater than that of men, with differences being most pronounced in Eastern European countries, as well as in the Russian Federation. Japan and Korea are the only countries where the average ICT-task intensity of jobs held by men markedly exceeds that of women.
Figure 4.26. ICT-task intensity of jobs, by gender, 2012 or 2015Average scores
0
10
20
30
40
50
60Score
Average ICT-task intensity: Women Average ICT-task intensity: Men
Finlan
d
Denmark
Sweden
Norway
Netherl
ands
Austra
lia
New Ze
aland
United
States
United
Kingdo
mCan
ada
Belgium
Sloven
iaIsr
ael
Eston
ia
Austria
Franc
e
Irelan
d
German
y
Poland
Slovak
Repub
licKore
aSpa
in
Czech R
epub
licChil
eIta
ly
Lithu
ania
Japa
n
Greece
Russia
n Fed
eratio
nTu
rkey
Notes: ICT = information and communication technology. The ICT-task intensity of jobs indicator relies on exploratory state-of-the-art factor analysis and captures the use of ICTs on the job. It relies on 11 items from the OECD Survey of Adult Skills (PIAAC) ranging from simple use of the Internet to the use of a word processor, spreadsheet software or a programming language. The detailed methodology can be found in Grundke et al. (2017[30]). The data for the following 23 countries from the first round of PIAAC refer to the year 2012: Australia, Austria, Belgium (Flanders), Canada, Czech Republic, Denmark, Estonia, Finland, France, Germany, Ireland, Italy, Japan, Korea, the Netherlands, Norway, Poland, the Russian Federation (excluding Moscow), Slovak Republic, Spain, Sweden, the United Kingdom (England and Northern Ireland) and the United States. Data for the remaining countries refer to 2015 and are sourced from the second round of the first wave of the PIAAC survey. For the Russian Federation, the PIAAC sample does not include the population of the Moscow municipal area. The data published, therefore, do not represent the entire resident population aged 16-65, but rather the population of the Russian Federation excluding the population residing in the Moscow municipal area.
Source: OECD (2019[2]), Measuring the Digital Transformation: A Roadmap for the Future, https://dx.doi.org/10.1787/9789264311992-en.12 https://doi.org/10.1787/888934192072
In terms of ICT-related tasks performed at work, data from the 2018 European Community Survey on ICT Usage in Households and by Individuals show that “exchanging e-mails or entering data into databases” is the most common activity - undertaken at least once a week by over 80% of people who use computers or computerised equipment at work (OECD, 2019[2]). “Creating or editing electronic documents” is also commonplace, with over 60% of workers performing these tasks. Almost one-in-four workers in European Union countries use social media for work purposes at least once a week, although the data do not distinguish the active posting of content from more passive uses, such as using social media to follow news. On average, 30% of workers in the European Union use online applications to receive tasks or instructions for work, at least once a week. This includes those finding work through online platforms, as well as a wide range of situations such as workers in e-commerce fulfilment centres or hospital staff who receive instructions via apps on smart devices (e.g. the location of a product in a warehouse or of a patient in a hospital).
Self-assessments offer one perspective on the extent to which workers’ skills match the ICT-related tasks needed for their work. In 2018, about 64% of workers using computers or computerised equipment at work in the European Union reported that their skills corresponded well to ICT-related aspects of their work duties (Figure 4.27). Meanwhile, 11% reported needing further training to cope with the ICT-related demands of their job. This figure is lower than the share of people whose ICT skills may be under-used; on average 25% declared that their digital skills exceed the requirements of their jobs. Considerable variation exists between countries, however. In Spain, France and Italy, nearly 20% of workers feel they need further ICT training, while in Germany, Norway and Iceland, over a third report having more advanced ICT skills than those used in their work duties.
121OECD DIGITAL ECONOMY OUTLOOK 2020 © OECD 2020
4. DIGITAL UPTAKE, USAGE AND SKILLS 4. DIGITAL UPTAKE, USAGE AND SKILLS
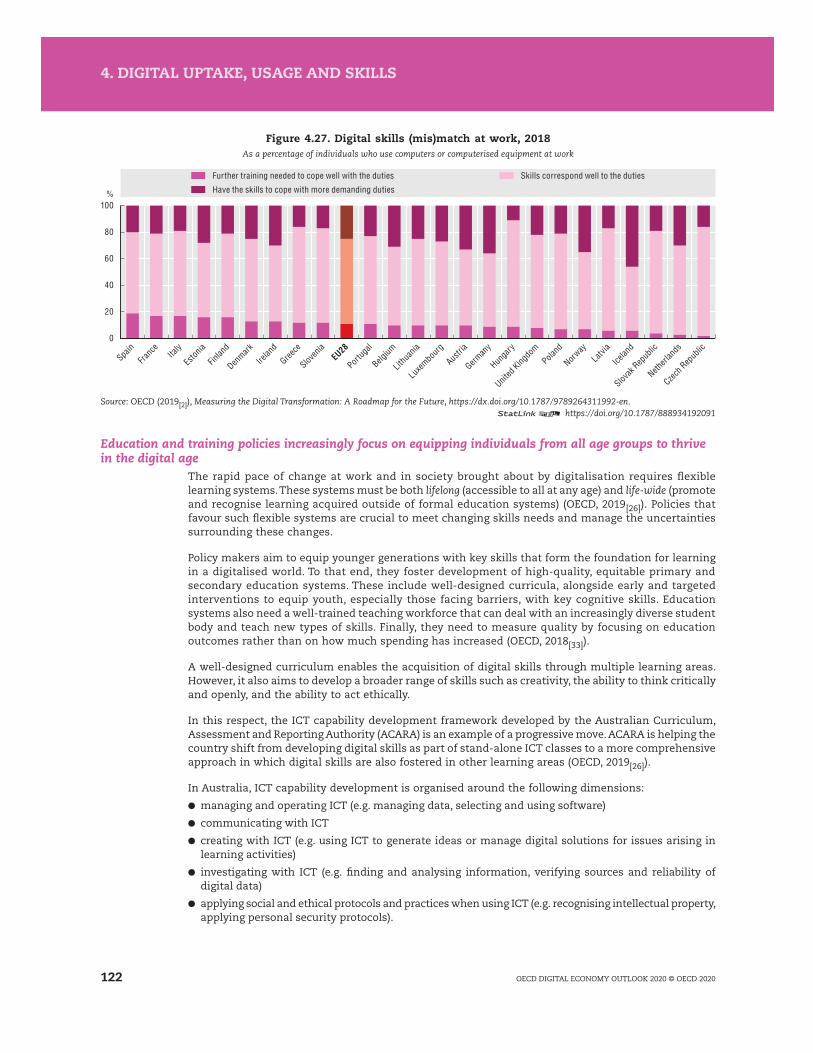
Figure 4.27. Digital skills (mis)match at work, 2018As a percentage of individuals who use computers or computerised equipment at work
%
0
20
40
60
80
100
Have the skills to cope with more demanding dutiesFurther training needed to cope well with the duties Skills correspond well to the duties
Spain
Franc
eIta
ly
Eston
ia
Finlan
d
Denmark
Irelan
d
Greece
Sloven
iaEU28
Portug
al
Belgium
Lithu
ania
Luxe
mbourg
Austria
German
y
Hunga
ry
United
Kingdo
mPola
nd
Norway
Latvia
Icelan
d
Slovak
Repub
lic
Netherl
ands
Czech R
epub
lic
Source: OECD (2019[2]), Measuring the Digital Transformation: A Roadmap for the Future, https://dx.doi.org/10.1787/9789264311992-en.12 https://doi.org/10.1787/888934192091
Education and training policies increasingly focus on equipping individuals from all age groups to thrive in the digital age
The rapid pace of change at work and in society brought about by digitalisation requires flexible learning systems. These systems must be both lifelong (accessible to all at any age) and life-wide (promote and recognise learning acquired outside of formal education systems) (OECD, 2019[26]). Policies that favour such flexible systems are crucial to meet changing skills needs and manage the uncertainties surrounding these changes.
Policy makers aim to equip younger generations with key skills that form the foundation for learning in a digitalised world. To that end, they foster development of high-quality, equitable primary and secondary education systems. These include well-designed curricula, alongside early and targeted interventions to equip youth, especially those facing barriers, with key cognitive skills. Education systems also need a well-trained teaching workforce that can deal with an increasingly diverse student body and teach new types of skills. Finally, they need to measure quality by focusing on education outcomes rather than on how much spending has increased (OECD, 2018[33]).
A well-designed curriculum enables the acquisition of digital skills through multiple learning areas. However, it also aims to develop a broader range of skills such as creativity, the ability to think critically and openly, and the ability to act ethically.
In this respect, the ICT capability development framework developed by the Australian Curriculum, Assessment and Reporting Authority (ACARA) is an example of a progressive move. ACARA is helping the country shift from developing digital skills as part of stand-alone ICT classes to a more comprehensive approach in which digital skills are also fostered in other learning areas (OECD, 2019[26]).
In Australia, ICT capability development is organised around the following dimensions:
● managing and operating ICT (e.g. managing data, selecting and using software)
● communicating with ICT
● creating with ICT (e.g. using ICT to generate ideas or manage digital solutions for issues arising in learning activities)
● investigating with ICT (e.g. finding and analysing information, verifying sources and reliability of digital data)
● applying social and ethical protocols and practices when using ICT (e.g. recognising intellectual property, applying personal security protocols).
122 OECD DIGITAL ECONOMY OUTLOOK 2020 © OECD 2020
4. DIGITAL UPTAKE, USAGE AND SKILLS 4. DIGITAL UPTAKE, USAGE AND SKILLS

Students’ proficiency is assessed in all these dimensions and across all school years as the development of ICT capability is considered to be a learning continuum. At the same time, ICT capability supports student learning in all subjects covered by the curriculum. For instance, students may use digital tools to create artworks, look for and critically analyse online information about historical events, or investigate mathematical concepts using multimodal technologies. A digital technologies learning area is also part of the curriculum, focusing on “understanding the characteristics of data, digital systems, audiences, procedures and computational thinking” (ACARA, n.d.[34]).
Over recent years, other countries have also been adapting the school curricula to changing skills requirements, including digital skills.
In Canada, several provincial governments have adopted a comprehensive approach to digital competence (OECD, 2019[26]). For example, the government of Manitoba has focused on developing “literacy with ICT”, which spans all curricular areas. In a similar vein to the ACARA framework, literacy with ICT requires “thinking critically and creatively, about information and about communication, as citizens of the global community, while using ICT safely, responsibly and ethically” (Manitoba Education and Training, n.d.[35]). Students are assessed based on a developmental learning continuum.
In the Czech Republic, the Digital Education Strategy for 2020 aims to i) open education to new methods and ways of learning through digital technologies; ii) improve pupils’ competences in information and digital technologies; and iii) develop pupils’ computational thinking.
In Denmark, efforts are devoted to development and dissemination of educational material on digital skills, and to improve digital judgement and skills among children.
In France, a mandatory course on computational sciences and technology was introduced in 2019 at the upper secondary level. The objective goes beyond teaching ICT as a science to also discussing the role of digital technologies in society (Ministère de l’Éducation nationale et de la Jeunesse, 2018[36]). The government is also encouraging the creation of coding workshops outside classes. It will progressively introduce a certification of digital skills for students in their last secondary school year.
In Portugal, the curriculum at the primary and secondary education has been broadened since 2017. A guidance document to be followed by all schools sets out the knowledge, competencies and values to be acquired by all students upon completing upper secondary education. The guidance focuses on the ability to navigate a complex world competently through critical thinking, resilience and the ability to learn throughout life (OECD, 2019[26]).
In countries that have incorporated ICT skills in the curriculum, teachers need training in ICTs and often report this need (OECD, 2019[26]). For instance, a review of the ICT curriculum in the United Kingdom highlighted several gaps. First, the teaching profession needed to be more attractive for professionals with ICT skills. Second, current teachers needed more relevant continuous training. Third, there was a need to create qualifications recognising immediate levels of ICT skills (The Royal Society, 2017[37]).
For over a decade, countries across the OECD have been tackling the need for teachers to develop ICT skills through a range of policies. These range from developing national plans promoting this goal to introducing compulsory training, national accreditation standards or national certification for teachers (OECD, 2019[26]). Denmark, for instance, has developed a voluntary Pedagogical ICT Licence that combines pedagogical knowledge of ICTs and basic ICT skills training. It has become a European standard in the provision of ICT skills to teachers. Implemented at first for in-service training, this approach was expanded to initial teacher education and general upper secondary education. While not mandatory, the licence is integrated into the curriculum of student teachers who graduate from teacher education colleges (Rizza, 2011[38]).
Portugal recently implemented a Train the Trainers programme to promote digital skills and a safer and responsible use of the Internet. In so doing, it became another example of a country that recognises how a well-trained teaching workforce is key to increasing quality in education systems.
In parallel, countries also set up policies to enable life-wide acquisition of skills to tackle digital inequalities among adults, especially for the most vulnerable groups.
123OECD DIGITAL ECONOMY OUTLOOK 2020 © OECD 2020
4. DIGITAL UPTAKE, USAGE AND SKILLS 4. DIGITAL UPTAKE, USAGE AND SKILLS

In Austria, the Pact for Digital Competence aims to foster development of digital competencies for comprehensive inclusion and for a beneficial increase in Internet use for all. Primary target groups are young career starters, off-liners, professionals aged 45 or more and seniors more generally.
In Colombia, the Digital Citizenship Strategy gives certification of digital skills, through face-to-face and virtual training for Colombian citizens, over the age of 13. Victims of armed conflict, persons with disabilities, communities social groups, detainees and Colombians residing abroad can also get this certification. In addition, the Digital Talent Strategy of the ICT ministry aims to design, include and promote programmes for the development of individuals’ digital talent. Ultimately, this would achieve digital transformation, improve quality of life and contribute to sustainable development.
In Israel, the National Program for Digital Literacy aims to reduce the digital gap among citizens. In this respect, a Senior Citizens’ Digital Skills Course is implemented for the elder generations. The Digital Community Initiative harnesses the power of the community structure to improve digital literacy among specific/targeted segments of the population.
In Latvia, a portal and training activities have been set up as part of the “My Latvia.lv. Do it digitally” programme to improve the skills of citizens and entrepreneurs to use public services digitally. Digital agents advise the public on the use of e-services in different life situations and how to operate safely on the Internet.
In Norway, the Digital Inclusion for All programme provides training to individuals who do not use ICT as part of their everyday life. It helps them acquire the skills needed to master these technologies with the elderly, women and immigrants as specific target groups.
In Portugal, the “National Digital Competences Initiative e.2030” aims to generalise digital access, use and literacy. At the same time, it seeks to stimulate employability and professional training and specialisation in digital technologies and applications. Further, it works to ensure strong participation in international R&D networks and the production of knowledge in digital areas. It assists both households and individuals in supplying digital competences that are essential both for exercising full citizenship and making a person more employable. To that end, it gives special attention to individuals with an identified need of digital competences.
In Sweden, the Digitalisation Strategy spans several social areas and provides a unified vision for a sustainable digitised country, which includes the National Digitalisation Strategy for the School System. The strategy aims at providing all children and pupils, young adults, with the skills they need for life and work life. In the long run, this will provide the basis to meet the future skills needs of the labour market. The curriculum for compulsory school and equivalent forms of education, upper secondary education and adult education have also changed to clarify the schools’ mission to strengthen pupils’ digital skills.
In the United Kingdom, a national entitlement to basic skills aims to reduce the number of adults who lack the essential digital skills for life and work. The Future Digital Inclusion Programme, funded by the Department for Education, supports adult learners to engage with digital technology and develop their digital skills in community settings. Through a network of 5 000 Online Centres, adults benefit from online courses and/or face-to-face delivery, either delivered in groups or one-to-one. The programme supports adults who are digitally excluded, and often unemployed, low skilled, disabled or with a learning difficulty. It also helps adults to gain the foundation skills needed to progress onto the new and essential digital skills qualifications that the Department for Education offers free to adults from 2020 onwards.
In Singapore, the TechSkills Accelerator (TeSA) offers various programmes to support ICT and non-ICT professionals. TeSA helps people upgrade and acquire new skills and domain knowledge that are in demand, to stay competitive and to meet the challenges of a fast-moving digital landscape. The programme is driven by the Infocomm Media Development Authority in partnership with Workforce Singapore and SkillsFuture Singapore. It also collaborates with industry partners and employers.
Finally, from the business perspective, additional policies to improve the skills for digital transformation include the following:
● technical assistance to SMEs through Business Digital Transformation Centers (Colombia)
● vouchers for raising digital competences (Slovenia)
124 OECD DIGITAL ECONOMY OUTLOOK 2020 © OECD 2020
4. DIGITAL UPTAKE, USAGE AND SKILLS 4. DIGITAL UPTAKE, USAGE AND SKILLS

Box 4.2. Ireland’s ICT Skills Action Plan
The development and attraction of high-level ICT skills is crucial to the growth of the Irish economy and job creation. This is especially true given the projected growth of the ICT sector and the digitalisation of the economy. Ireland has formally sought to meet these skill needs through the ICT Skills Action Plan process, introduced in 2012. Technology Skills 2022: Ireland’s Third ICT Skills Action Plan seeks to build on the momentum of the first two plans. This plan was devised with industry and the education and training sector. By 2022, planned interventions aim to deliver up to an additional 5 000 graduates annually through indigenous supply, with the remainder serviced by inward migration.
Although significant numbers of high-level ICT graduates are expected to enter the job market, the forecast level of demand for their skills to 2022 requires going beyond mainstream labour sources. The plan identifies priority actions for 2019-22 to meet this demand. It sets out to provide appropriate education and training pathways for people to train, learn and upskill in a variety of high-level ICT skills. These include data analytics, artificial intelligence, robotics, animation and gaming, among others.
Priority areas are as follows:
1. Expansion of provision in higher education – this plan places a strategic focus on fully utilising the range of learning opportunities available across the tertiary education system to deliver a range of pathways to meet skills needs now and into the future.
2. Pathways to ICT – the plan builds on existing partnerships between the further and higher education sectors to deliver a new reskilling pathway. It provides an entry point at the further education level and a defined progression pathway to higher education programmes for learners from diverse professional backgrounds, including those employed in industries at risk from technological advancements.
3. ICT apprenticeships – the continued growth of ICT apprenticeships can play a major role in meeting skills needs and the Irish government aims to expand the apprenticeship model into ICTs.
4. Skillnet Ireland – Ireland’s business support agency continues to expand and develop technology-focused business support networks. It has collaborated with the University of Limerick to launch Ireland’s first Master’s degree in Artificial Intelligence.
5. International talent – there is a continuing requirement to attract international talent, both from within the European Union and the European Economic Community (EEA) and through the Employment Permits System for skilled professionals outside the EEA.
These actions are implemented through a partnership between government, industry and the education and training system. They complement the ongoing upskilling of the country’s talent base by the business sector.
● competence centres and learning laboratories for cybersecurity (Germany)
● reskilling and upskilling workers (Portugal)
● ICT training for SMEs (Israel)
● promotion of training and support skills for the ICT industry (Latvia)
● business consultations for SMEs (Lithuania).
Linkages between education, training, but also between industrial and employment policies, are needed to allow individuals to prosper in the digital society. Consequently, countries should opt for a whole-of-government approach (OECD, 2019[39]) and co-ordinate policy “packages” to ensure they are mutually reinforcing. Without co-ordination, policies may not deliver results.
125OECD DIGITAL ECONOMY OUTLOOK 2020 © OECD 2020
4. DIGITAL UPTAKE, USAGE AND SKILLS 4. DIGITAL UPTAKE, USAGE AND SKILLS
References
ACARA (n.d.), “Information and communication technology (ICT) capability”, webpage, https://www.australiancurriculum.edu.au/f-10-curriculum/general-capabilities/information-and-communication-technology-ict-capability/ (accessed on 21 October 2020).
[34]
Anderson, M. (2019), Mobile Technology and Home Broadband 2019, Pew Research Center, Washington, DC, https://www.pewInternet.org/wp-content/uploads/sites/9/2019/06/PI_2019.06.13_Mobile-Technology-and-Home-Broadband_FINAL2.pdf.
[4]
Andrews, D., G. Nicoletti and C. Timiliotis (2018), “Digital technology diffusion: A matter of capabilities, incentives or both?”, OECD Economics Department Working Papers, No. 1476, OECD Publishing, Paris, http://dx.doi.org/10.1787/7c542c16-en.
[22]
CETIC (2018), ICT Households Survey on the Use of Information and Communication Technologies in Brazilian Households, 2017, Regional Center for Studies on the Development of the Information Society, São Paulo, https://www.cetic.br/media/docs/publicacoes/2/tic_dom_2017_livro_eletronico.pdf.
[8]
CREDOC (2019), Baromètre du numérique, Centre de Recherche pour l’Étude et l’Observation des Conditions de Vie, Paris, https://www.credoc.fr/download/pdf/Sou/Sou2019-4761.pdf.
[9]
Datareportal (2019), Digital 2019: Global Digital Overview, https://datareportal.com/reports/digital-2019-global-digital-overview. [12]
DREES (2019), “En 2017, des adolescents plutôt en meilleure santé physique mais plus souvent en surcharge pondérale”, Études et résultats, No. 1122, Direction de la Recherche, des Études, de l’Évaluation et des Statistiques, Ministère des Solidarités et de la Santé, Paris, https://drees.solidarites-sante.gouv.fr/IMG/pdf/er1122.pdf.
[13]
Eurostat (2019), Digital Economy and Society Statistics, Comprehensive Database. [3]
Ferret, A. and E. Demoly (2019), “Les comportements de consommation en 2017. Le transport pèse plus en milieu rural, le logement en milieu urbain”, Insee Première, No. 1749, Institut national de la statistique et des études économiques, Paris, https://www.insee.fr/fr/statistiques/4127596.
[19]
Grundke, R. et al. (2018), “Which skills for the digital era?: Returns to skills analysis”, OECD Science, Technology and Industry Working Papers, No. 2018/09, OECD Publishing, Paris, https://dx.doi.org/10.1787/9a9479b5-en.
[31]
Grundke, R. et al. (2017), “Skills and global value chains: A characterisation”, OECD Science, Technology and Industry Working Papers, No. 2017/05, OECD Publishing, Paris, https://dx.doi.org/10.1787/cdb5de9b-en.
[30]
HBS (2019), Platform Work in the UK 2016-2019, Hertfordshire Business School, Hatfield, United Kingdom, https://www.feps-europe.eu/attachments/publications/platform%20work%20in%20the%20uk%202016-2019%20v3-converted.pdf.
[16]
Manitoba Education and Training (n.d.), “Literacy with ICT – What is LwICT?”, webpage, https://www.edu.gov.mb.ca/k12/tech/lict/what/index.htm (accessed on 21 October 2020).
[35]
MIAC (2018), Japan White Paper on Information and Communications, Ministry of Internal Affairs and Communications, Tokyo, http://www.soumu.go.jp/main_sosiki/joho_tsusin/eng/whitepaper.html.
[6]
MIAC (2017), Japan White Paper on Information and Communications, Ministry of Internal Affairs and Communications, Tokyo, http://www.soumu.go.jp/main_sosiki/joho_tsusin/eng/whitepaper.html.
[5]
Ministère de l’Éducation nationale et de la Jeunesse (2018), “Le numérique au service de l’École de la confiance”, webpage, https://www.education.gouv.fr/le-numerique-au-service-de-l-ecole-de-la-confiance-3212 (accessed on 21 October 2020).
[36]
MSIT and KISA (2019), 2018 Survey on the Internet Usage, Ministry of Science and ICT, Korea Internet and Security Agency, Sejong City.
[10]
Music, A. (2016), Massive Open Online Courses (MOOCs): Trends and Future Perspectives, OECD, Paris. [28]
OECD (2020), ICT Access and Usage by Businesses Database, http://oe.cd/bus. [20]
OECD (2020), ICT Access and Usage by Households and Individuals Database, http://oe.cd/hhind. [1]
OECD (2019), Going Digital: Shaping Policies, Improving Lives, OECD Publishing, Paris, https://dx.doi.org/10.1787/9789264312012-en. [39]
OECD (2019), Government at a Glance 2019, OECD Publishing, Paris, https://dx.doi.org/10.1787/8ccf5c38-en. [24]
OECD (2019), Measuring the Digital Transformation: A Roadmap for the Future, OECD Publishing, Paris, https://dx.doi.org/ 10.1787/9789264311992-en.
[2]
OECD (2019), OECD Skills Outlook 2019: Thriving in a Digital World, OECD Publishing, Paris, https://dx.doi.org/10.1787/df80bc12-en. [26]
OECD (2019), OECD SME and Entrepreneurship Outlook 2019, OECD Publishing, Paris, https://dx.doi.org/10.1787/34907e9c-en. [21]
126 OECD DIGITAL ECONOMY OUTLOOK 2020 © OECD 2020
4. DIGITAL UPTAKE, USAGE AND SKILLS 4. DIGITAL UPTAKE, USAGE AND SKILLS
References and Notes
OECD (2019), PISA 2018 Results (Volume I): What Students Know and Can Do, PISA, OECD Publishing, Paris, https://dx.doi.org/10.1787/5f07c754-en.
[15]
OECD (2019), PISA 2018 Results (Volume III): What School Life Means for Students’ Lives, PISA, OECD Publishing, Paris, https://dx.doi.org/10.1787/acd78851-en.
[14]
OECD (2019), Tax Administration 2019: Comparative Information on OECD and other Advanced and Emerging Economies, OECD Publishing, Paris, https://dx.doi.org/10.1787/74d162b6-en.
[23]
OECD (2018), Education Policy Outlook 2018: Putting Student Learning at the Centre, OECD Publishing, Paris, https://dx.doi.org/10.1787/9789264301528-en.
[33]
OECD (2016), “New Skills for the Digital Economy: Measuring the demand and supply of ICT skills at work”, OECD Digital Economy Papers, No. 258, OECD Publishing, Paris, https://dx.doi.org/10.1787/5jlwnkm2fc9x-en.
[32]
OECD (2014), Recommendation of the Council on Digital Government Strategies, OECD, Paris, https://www.oecd.org/gov/digital-government/Recommendation-digital-government-strategies.pdf.
[25]
Ofcom (2019), Online Nation, 2019 Report, Ofcom, London, https://www.ofcom.org.uk/__data/assets/pdf_file/0025/149146/online-nation-report.pdf.
[7]
Perrin, A. and M. Kumar (2019), “About three-in-ten U.S. adults say they are ‘almost constantly’ online”, Fact Tank, Pew Research Center, Washington, DC, 25 July, https://www.pewresearch.org/fact-tank/2019/07/25/americans-going-online-almost-constantly.
[11]
Ratnapalan, S., M. Rayar and M. Crawley (2009), “Educational services for hospitalized children”, Paediatrics & Child Health, Vol. 14/7, pp. 433-436, http://dx.doi.org/10.1093/pch/14.7.433.
[27]
Rizza, C. (2011), “ICT and Initial Teacher Education: National Policies”, OECD Education Working Papers, No. 61, OECD Publishing, Paris, https://dx.doi.org/10.1787/5kg57kjj5hs8-en.
[38]
Robinson, A. and R. Goldberg (2019), “NTIA Data: Two-thirds of U.S. Internet users do not participate in the sharing economy”, NTIA blog, 21 August, https://www.ntia.doc.gov/blog/2019/ntia-data-two-thirds-us-internet-users-do-not-participate-sharing-economy.
[18]
Smith, A. (2016), Gig Work, Online Selling and Home Sharing, Pew Research Center, Washington, DC, https://www.pewresearch.org/Internet/wp-content/uploads/sites/9/2016/11/PI_2016.11.17_Gig-Workers_FINAL.pdf.
[17]
The Royal Society (2017), After the Reboot: Computing Education in UK Schools, The Royal Society, London, https://royalsociety.org/-/media/policy/projects/computing-education/computing-education-report.pdf.
[37]
van Deursen, A. et al. (2017), “The compoundness and sequentiality of digital inequality”, International Journal of Communication, Vol. 11, pp. 452-473, https://ijoc.org/index.php/ijoc/article/view/5739/1911.
[29]
Notes
1. For Colombia, Korea and Japan, the recall period is 12 months, and for the United States, 6 months.
For Canada and Japan, data refer to individuals aged 15-74 instead of 16-74, and for Costa Rica, to individuals aged 18-74 instead of 16-74.
For Canada, data for the Cloud category relate to individuals who used the Internet in the last 12 months.
For the e-government category, data relate to individuals who used the Internet in the last three months for Costa Rica, Israel and Mexico. For Costa Rica, it refers only to “obtaining information from public authorities”. For Mexico, it includes the following categories: “communicate with the government”, “consult government information”, “download government formats”, “fill out or send government forms”, “perform government procedures” and “comment on government consultations”.
For online purchases, the recall period is three months for Australia, and data relate to individuals who used the Internet in the last three months for Australia, Costa Rica, Israel, Mexico and the United States.
For travel and accommodation, data relate to individuals who used the Internet in the last three months for Australia, Mexico and Costa Rica. For Mexico, it refers to the following category: “reservations and tickets”.
127OECD DIGITAL ECONOMY OUTLOOK 2020 © OECD 2020
4. DIGITAL UPTAKE, USAGE AND SKILLS 4. DIGITAL UPTAKE, USAGE AND SKILLS
References and Notes

2. For countries in the European Statistical System, sector coverage consists of all activities in manufacturing and non-financial market services.
For Australia, data relate to the fiscal year 2016/17, ending on 30 June, instead of 2018. For Broadband, data include “DSL”, “fibre-to-the-premises”, “cable”, “fixed wireless”, “satellite” and “other”. For e-purchases, orders placed via email are also included. A broad definition of e-commerce transactions is used to include sales or purchases of goods or services via any other computer-mediated networks. For Cloud Computing, data refer to 2016.
For Canada, the North American Industry Classification System is used instead of ISIC Rev.4, and data relate to 2017 for ERP, Cloud Computing and Social Media, and to 2013 for the other items.
For Iceland, data relate to 2014 for Broadband, e-purchases and Cloud Computing, and to 2013 for High-Speed Broadband.
For Japan, JSIC Rev.13 division is used instead of ISIC Rev.4 and data include total businesses with 100 and more persons employed instead of 10 and more. Data for small firms (10-49) are not included. For large firms, data refer to 300 and more employees instead of 250 and more. Data refer to 2018.
For Korea, data refer to 2018 instead of 2019.
For Brazil, Colombia and the United States, data relate to 2017 instead of 2019.
For New Zealand, for industrial classification, ANZSIC06 division is used instead of ISIC Rev.4, and data refer to 2016 instead of 2019.
For Switzerland, data refer to 2017 and to firms with respectively 5 or more employees instead of 10 or more, 5-49 persons employed instead of 10-49, 50-299 employees instead of 50-249, and 300 and more employees instead of 250 and more. For e-sales, data refer to the proportion of total businesses making sales through the Internet and no recall period has been specified (instead of the last 12 months).
128 OECD DIGITAL ECONOMY OUTLOOK 2020 © OECD 2020
4. DIGITAL UPTAKE, USAGE AND SKILLS
References and Notes

Chapter 5ENHANCING DATA ACCESS, SHARING AND RE-USE
129OECD DIGITAL ECONOMY OUTLOOK 2020 © OECD 2020
KEY FINDINGS
�� Overall use of data has increased over time, but varies significantly across sectors, countries and – most significantly – by firm size.
�� More than 25% of all information and communication technology (ICT) firms in the European Union used big data in 2018 compared to 10% of all firms.
�� Besides the ICT sector, utilities, transportation and logistics are also highly intensive users of big data, with around 20% of firms in these sectors using big data in 2018.
�� Adoption has also increased in other sectors in a number of countries. In Germany, 12% of all manufacturing firms used big data in 2018 compared to 9% in the European Union. This uneven picture of diffusion has important implications for productivity performance.
�� While access and sharing can help increase the value of data to data holders, they can create 10 to 20 times more value to data users, and 20 to 50 times more value for the wider economy. In some cases, however, data access and sharing can also reduce the potential income of data holders. This underscores the incentive challenge for governments.
�� Among the 205 policy initiatives on data access and sharing (across 37 countries) that were analysed, 126 (61%) aimed at enhancing access to public sector data, 44 (21%) aimed at help share private-sector data across the economy and 24 (12%) improved data analytic capacities. Innovative mechanisms for the controlled sharing of sensitive data have aided in the response to COVID-19 and merit further analysis.
IntroductionData, and data access and sharing, have become fundamental for social and economic activities. In the context of the COVID-19 pandemic, leveraging data has been centre-stage in establishing effective frontline responses to the crisis. It will also be an essential part of the recovery and resilience-building phase.
This chapter underlines how fundamental data, and data access and sharing, have become for social and economic activities. It presents trends in data use across the economy, as well as recent empirical studies of their effects on productivity. It focuses on industries unrelated to information and communication technologies (ICTs).
While overall use of data increased between 2016-18, it still varies significantly across sectors, countries and – most significantly – by firm size. The ICT sector, and in particular large firms, remained by far the dominant users of data in 2018. More than 25% of all ICT firms in the European Union, for instance, used big data in 2018, compared to 10% of all firms. Besides the ICT sector, utilities, transportation and logistics are also highly intensive users of big data, engaging around 20% of these firms in 2018.
Adoption has also increased in other sectors in a number of countries. In Germany, for example, 12% of all manufacturing firms used big data in 2018 compared to 9% in the European Union. This uneven picture of diffusion has important implications for productivity performance.
The chapter also focuses on how data access and sharing can facilitate the use of data across societies, including across borders. It highlights promising venues to overcome the challenges to such outcomes such as risks to privacy, intellectual property rights and of losing control over data.
Studies show data access and sharing can increase the value of data for the wider economy. While they can help increase the value of data to data holders, they can create 10 to 20 times more value to data users, and 20 to 50 times more value for the wider economy. In some cases, however, data access and sharing can also reduce the potential income of data holders, which underscores the incentive challenge facing governments.
130 OECD DIGITAL ECONOMY OUTLOOK 2020 © OECD 2020
5. ENHANCING DATA ACCESS, SHARING AND RE-USE 5. ENHANCING DATA ACCESS, SHARING AND RE-USE

More differentiated and balanced data governance approaches are needed. These should better leverage technological solutions for privacy protection and enhanced control over data and information, such as cryptography and data sandboxes. This, in turn, would protect data confidentiality, give stakeholders more control over their data and incentivise data access and sharing. Further research into the concept of “data ownership” and its relationship to different types of data will also be critical to formulating effective policy.
The chapter concludes with an overview of government initiatives to facilitate data access and sharing, including across borders. Many of these initiatives also aim to address the challenges associated with protection of privacy, intellectual property rights and data control. All surveyed countries had initiatives that foster and enhance access to and sharing of public sector data in 2018. However, significantly fewer countries targeted private-sector data. Even fewer governments had initiatives to improve the capacity to analyse data in their countries. Of 205 policy initiatives across 37 countries, 61% aimed at enhancing access to public sector data, while 21% aimed to help share private-sector data.
Governments have recognised the availability of data-related skills and competences can be a critical bottleneck for the effective re-use as well as provision of data in both the private and public sectors. However, only 12% focused on improving data analytic capabilities across society. Innovative mechanisms for the controlled sharing of sensitive data have aided the response to COVID-19 and merit further analysis.
Trends in the use of data and data analytics
Data and (big) data analytics can boost productivity and innovationThe effective use of data can help boost productivity and improve or foster new products, processes, organisational methods and markets. There is still little reliable quantification of the economic effects of data use. However, firms that use data exhibit faster labour productivity growth than those that do not by approximately 5% to 10% (OECD, 2015[1]). In addition, findings from McKinsey & Company (2017[2]) suggest that data monetisation is an increasingly important driver of revenue growth. The monetisation of data reportedly contributes to 10% or more of the total revenue for 32% of high-performing businesses and 9% of all other businesses.1
In manufacturing, data are typically obtained through sensors that are increasingly used to monitor and analyse the efficiency of machines, optimise their operations and provide after sale services, including preventive maintenance. The data are sometimes also used to work with suppliers. In some cases, they are even commercialised through new services such as optimising production control (OECD, 2017[3]). Increasingly, manufacturing activities rely on data flows that connect geographically dispersed stages of production across global value chains (see section below). This has significant impact on the productivity and innovation capacity of manufacturing firms.
In the United States, for instance, Brynjolfsson and McElheran (2019[4]) estimate that being at the frontier of data-driven decision in manufacturing is linked with improvements in revenue-based productivity of 4% to 8%. The authors show that timing, however, is essential. Leading adopters of data analytics are receiving the biggest gains, while laggards that reach the frontier later tend to have lower net benefits or none at all.
Based on German firm-level data, Niebel, Rasel and Viete (2018[5]) find evidence that use of data and analytics increases the likelihood of a firm becoming a product innovator, as well as for the market success of product innovations. These results hold for both manufacturing and service sectors, but are contingent on firms’ investment in IT-specific skills (Niebel, Rasel and Viete, 2018[5]). Others have documented similar findings (Bajari et al., 2019[6]; Wamba et al., 2017[7]; Brynjolfsson and McElheran, 2016[8]; Bakhshi, Bravo-Biosca and Mateos-Garcia, 2014[9]).
In agriculture, data captured by sensors on farm equipment are combined with weather, climate and soil data, to provide information about production processes. This often involves transfers of different types of data, including personal or commercially sensitive information, from and to other countries. The use of all this data together with data analytics (i.e. precision agriculture) provides productivity gains by optimising the use of agriculture-related resources. These include, but are not limited to,
131OECD DIGITAL ECONOMY OUTLOOK 2020 © OECD 2020
5. ENHANCING DATA ACCESS, SHARING AND RE-USE 5. ENHANCING DATA ACCESS, SHARING AND RE-USE
savings on seed, fertiliser and irrigation, as well as farmers’ savings in time (OECD, 2017[3]). By some estimates the economic benefits from precision agriculture can be around USD 12 billion annually for the United States. This represents about 7% of the total value added of USD 177 billion contributed by farms to the gross domestic product (GDP) of the United States in 2014 (Schimmelpfennig and Ebel, 2016[10]).
Data and data analytics enable the business models of online platforms Online platforms have become a key element of the digital economy as they support many economic and social activities on line. Most of them are large ICT companies such as Apple and Google. However, increasingly traditional (non-ICT) companies such as Nike and TomTom have established online platforms. These firms generate data as a by-product of their actual business activity to support the sales of goods and services. Companies such as John Deere and DuPont Pioneer, for example, take advantage of the “industrial Internet”. They integrate sensors with their latest equipment to build online platforms that help farmers manage their fleet and decrease downtime of their tractors, as well as save on fuel (OECD, 2017[3]).
As a common and major characteristic, all online platforms benefit from data-enabling multi-sided markets. Activities on one side of the market go hand in hand with the collection of data, which is exploited and used on the other side of the market (OECD, 2015[1]) These online platforms also take advantage of network effects emerging on at least one side (OECD, 2019[14]).
The business model of online platforms therefore relies heavily on the combination of the use of data and these network effects that typically affect all sides of the market. As the utility for users on all sides of the market increases with the increase in their numbers, users are more willing to pay for access to a bigger network and/or to contribute with their own data. Combined with the increasing returns to scale and scope the data enable, these network effects can lead to huge profit margins for platform providers (OECD, 2015[1]; OECD, 2019[14]).
Online platform providers can combine various revenue models and data-enabled services across all sides of the markets of their platforms. Li et al. (2019[12]), for instance, show that the online platform Amazon Marketplace generates revenue through a wide number of data-enabled services. These include the following:
● a buyer-seller matching service
● a service to sellers to promote their products to some individuals2
● the licensing of access to its internally collected customer behaviour data
● the use of data to improve its own algorithms.
In addition, based on its data-driven understanding of customer needs, Amazon is also offering its own products that compete directly with independent sellers on its platform. Based on the vast amounts of data it can access, these products can be customised and priced to meet specific groups of consumers.3
Private equity investments in data and (big) data analytics continue to increaseThe importance of data and data analytics is reflected in the growing number of mergers and acquisitions of data-intensive firms. In 2013, for example, Monsanto acquired the Climate Corporation, an agriculture analytic firm, for USD 1.1 billion. In 2015, IBM acquired a majority share of the Weather Company, a weather forecasting and analytic company, for over USD 2 billion (Waters, 2015[13]). Meanwhile, Alibaba invested USD 4 billion between 2016 and 2018 to acquire Lazada, a leading e-commerce platform. The annual number of acquisitions increased from more than 100 in 2013 to more than 400 in 2017, with the average price paid exceeding USD 1 billion in some quarters (Figure 5.1).
Business adoption of big data is growing but varies by sector and type of dataThe ICT sector remains the most intensive user of big data, with social media data playing the most important role. More than half of all ICT firms in the European Union used social media data in 2018 (Figure 5.2). Besides the ICT sector, utilities (including electricity, gas, steam, air conditioning and water supply businesses) and transportation & logistics are also highly intensive users of big data. Around 20%
132 OECD DIGITAL ECONOMY OUTLOOK 2020 © OECD 2020
5. ENHANCING DATA ACCESS, SHARING AND RE-USE 5. ENHANCING DATA ACCESS, SHARING AND RE-USE

of these firms used big data in 2018, focusing on geolocation data of portable devices. Utility businesses, in addition, also use data originating from smart devices or sensors intensively. These two sectors also had the biggest increase in big data adoption between 2016 and 2018 with around 25% more of their businesses adopting the technologies in the European Union.
Figure 5.1. Trends in the acquisition of big-data and analytics firms, Q1 2013-Q2 2018
USD billion
0
1
2
3
4
5
6
7
0
20
40
60
80
100
120
140
Q1 Q2 Q3 Q4 Q1 Q2 Q3 Q4 Q1 Q2 Q3 Q4 Q1 Q2 Q3 Q4 Q1 Q2 Q3 Q4 Q1 Q22013 2014 2015 2016 2017 2018
Number of acquisitions
Number of acquisitions Average acquisition price (right axis)
Notes: In the figures presented here, the sample is restricted to firms founded after 2010 (i.e. no more than five years-old in 2016) that attracted equity funding over 2011-16. Equity funding includes venture capital and other risk finance such as business angel investments or debt financing. Digital-related sectors are identified on the basis of correspondence between the sectors available in the database with the ISIC Rev.4 industry list.
Source: OECD (2019[14]), Enhancing Access to and Sharing of Data: Reconciling Risks and Benefits for Data Re-use across Societies, https://doi.org/10.1787/276aaca8-en.12 https://doi.org/10.1787/888934192110
Figure 5.2. Business use of big data by data source and industry in the European Union, 2018As a percentage of enterprises
0
5
10
15
20
25
30%
Smart devices or sensorsOther
Any data sourceSocial media
Geolocation of portable devices2016
All ente
rprise
sICT
Utilitie
s
Trans
porta
tion a
nd lo
gistic
s
Profes
siona
l, scie
ntific a
nd
techn
ical a
ctivit
ies
Accom
modati
on
Admini
strati
ve an
d
supp
ort se
rvice
s
Wholes
ale an
d reta
il trad
e
Constr
uctio
n
Manufac
turing
Real e
state
Source: OECD based on Eurostat, Digital Economy and Society Statistics (database), http://ec.europa.eu/eurostat/web/digital-economy-and-society/data/comprehensive-database (accessed in December 2019).
12 https://doi.org/10.1787/888934192129
Other sectors also saw a significant increase in big data adoption. However, adoption of big data in the real estate and accommodation sector either stagnated or even fell slightly in 2018. That said, the adoption of big data can vary significantly across countries. As highlighted in Chapter 4, adoption of data analytics by businesses has increased, particularly among large firms in Germany, France, Finland, Korea and Portugal.
133OECD DIGITAL ECONOMY OUTLOOK 2020 © OECD 2020
5. ENHANCING DATA ACCESS, SHARING AND RE-USE 5. ENHANCING DATA ACCESS, SHARING AND RE-USE
The geographic difference is particularly noticeable in the manufacturing sector. The adoption of big data analytics has increased by around 30% on average in manufacturing across the European Union between 2016 and 2018. However, Germany’s manufacturing sector experienced an increase of 140% within this same period. In 2018, 12% of all manufacturing firms in Germany used big data (compared to 9% in the European Union). In the United States, the share of manufacturing plants that adopted data-driven decision making nearly tripled between 2005 and 2010, jumping from 11% to 30% (Brynjolfsson and McElheran, 2019[4]). The authors note this rapid diffusion was uneven and that economies of scale (firm size), as well as complementarities between investments in skills and competences, can explain to a significant extent the variation.
Data and data analytics can help enhance well-being and address global challenges, including the COVID-19 crisis
The full impact of data and data analytics goes beyond its positive effects on productivity growth and innovation. The use of data can also contribute directly to the well-being of citizens. Quantification remains challenging, however, because market transactions do not capture many if not most of the benefits related to use of data (OECD, 2015[1]).
4 For example, data access and sharing are needed to enhance public service delivery; tackle longstanding issues that require new ways and tools to leverage data; and identify and address emerging governmental and societal needs and emergencies. In science and technology, data access and sharing provide a range of benefits to society such as reproducibility of scientific results, facilitating cross-disciplinary co-operation (OECD, 2020[15]). Data have also been critical during emergency response such as during the 2011 Fukushima nuclear incident, the 2014-16 Ebola outbreak in West Africa and, more recently, during the COVID-19 crisis.
At the early stage of the COVID-19 pandemic, the collection and sharing of data became essential to understand and respond to the scale of the public health challenge. Of particular importance to an effective frontline response are data concerning the spread of the virus. These include the location and number of new confirmed cases, rates of recoveries and deaths, and the source of new cases (international arrivals or community transmission). Access to and sharing of data are also crucial to assess and improve the capacity of the health care system to address the crisis and the effectiveness of containment and mitigation policies that restrict the movement of individuals. Transborder co-operation in the collection, processing and sharing of these data (subject to necessary and proportionate safeguards) may expedite effective and united global frontline responses.
Governments are turning to a wide array of digital technologies and advanced analytics to collect, analyse and share data for frontline response to the COVID-19 crisis (Dunant, 2020[16]). Above all, most countries are leveraging the widespread use of mobile phones given the more than 7.85 billion subscriptions worldwide as of 2018 (ITU, 2020[17]). This includes in particular the collection and sharing of geolocation and proximity data. These data are generated in two ways. On the one hand, they can be derived from mobile call data records, i.e. data produced by telecommunication service providers on telephone call or other telecommunications transactions. On the other, they can be collected from mobile applications (apps) made for COVID-19 response. Government initiatives to improve the effectiveness of frontline responses to COVID-19 are explored later in this chapter.
In addition, symptom tracking apps are being deployed to help slow the outbreak. They help researchers better understand symptoms linked to underlying health conditions. This, in turn, helps identify i) how fast the virus is spreading in different areas; ii) high-risk areas; and iii) who is most at risk. According to researchers, the C-19 COVID Symptom Tracker app, developed in the United Kingdom, can help collect data to reveal essential information about the symptoms and progress of COVID-19 infection in different people. It can also help researchers understand why some individuals develop more severe or fatal disease, while others have only mild symptoms due to COVID-19 (King’s College London et al., 2020[18]). Data and data analytics can provide valuable indicators on population movements and infections over time, especially when mobility and contact tracing data are poor. However, their mass collection and analysis raise data governance and privacy concerns. These issues are discussed in more detail in Chapter 6.
134 OECD DIGITAL ECONOMY OUTLOOK 2020 © OECD 2020
5. ENHANCING DATA ACCESS, SHARING AND RE-USE 5. ENHANCING DATA ACCESS, SHARING AND RE-USE

Data sharing and re-use beyond bordersA significant share of the global volume of data and its processing will rarely be located within just one organisation or even a single country. They will instead be distributed around the globe, reflecting the global distribution of economic and social online activities. Data flows, including across borders, are critical for two reasons. On the one hand, they are a condition for information and knowledge exchange. On the other, they are also vital for the functioning of a globally distributed digital economy. In addition, data flows can facilitate collaboration between governments to improve their policy making at international level. Finally, they can help address global challenges such as the Sustainable Development Goals or the management of pandemics such as COVID-19.5
Different approaches can enhance data access and sharing Three approaches to enhancing data access and sharing have been most prominently discussed in the literature and by policy makers: open data, and more recently data markets and data portability. Besides these three, a wide range of other approaches exist with different degrees of data openness. The level of access responds to the various interests of stakeholders and their risks in data sharing such as (bilateral or multilateral) engagements in data partnerships. Many approaches are based on voluntary and mutually agreed terms between organisations. Others are mandatory, such as the Right to Data Portability under the European Union (European Union, 2016[19]) General Data Protection Regulation (GDPR) (Art. 20) or Australia’s recently proposed Consumer Data Right (see OECD (2019[14]) for more examples).
Contractual agreements and data marketsIncreasingly, businesses are recognising the opportunities of commercialising their proprietary data (OECD, 2015[1]). Some organisations offer their data for free (via open access), especially non-governmental organisations and governments as highlighted below. However, many businesses engage in bilateral arrangements to sell or license their data. For example, the French mobile ISP Orange acts as a data provider. Its Floating Mobile Data technology collects mobile telephone traffic data, which determine speeds and traffic density at a given point in the road network. The anonymised mobile telephone traffic data are sold to third parties to identify “hot spots” for public interventions or to provide traffic information services.
Data commercialisation remains below its potential, even among data-intensive firms, despite the increasing interest of organisations to commercialise their data and meet the growing demand for data. In a Forrester Research survey of almost 1 300 data and analytics businesses across the globe, only one-third of respondents reported commercialising their data. High tech, utilities and financial services rank among the top industries commercialising their data, while pharmaceuticals, government and health care were at the bottom of the list (Belissent, 8 March 2017[20]).
With the emergence of data intermediaries, the commercialisation could become more mainstream. Data intermediaries provide potential sellers and buyers with services such as standard licence schemes, and a payment and data exchange infrastructure. With more such intermediaries, even less data-savvy firms may find it easier to commercialise their data.
Data portabilityData portability is often regarded as a promising means for promoting cross-sectoral re-use of data and for strengthening control rates of data for both individuals and businesses. For individuals, data portability could help strengthen control rights over personal data. It could do the same for businesses for their data, especially small and medium-sized enterprises (SMEs) (Productivity Commission, 2017[21]). Data portability provides restricted access through which data holders can provide customer data in a commonly used, machine-readable structured format. These data are delivered either to the customer or to a third party chosen by the customer.
Several countries have prominent data portability initiatives. In 2010, the United States initiated My Data, which includes the Green Button (US Department of Energy, n.d.[22]). In 2011, the United Kingdom launched the Midata data portability initiative (BIS, 2011[23]). In 2016, the European Union approved the
135OECD DIGITAL ECONOMY OUTLOOK 2020 © OECD 2020
5. ENHANCING DATA ACCESS, SHARING AND RE-USE 5. ENHANCING DATA ACCESS, SHARING AND RE-USE
Right to Data Portability (Art. 20) (European Union, 2016[19]) GDPR. Most recently, Australia proposed its Consumer Data Right (CDR).
Data portability initiatives may vary significantly in terms of their nature and scope across jurisdictions. The GDPR Right to Data Portability (Art. 20), for instance, states that
the data subject shall have the right to receive the personal data concerning him or her, which he or she has provided to a controller, in a structured, commonly used and machine-readable format and have the right to transmit those data to another controller without hindrance.
This GDPR differs in important ways from the “data portability” concept explored in the voluntary-based Midata initiative in the United Kingdom.
To what extent data portability may effectively empower individuals and foster competition and innovation remains to be seen. Estimates on the costs and benefits of data portability are still rare. Although not specific to data, other portability studies suggest that data portability may have overall positive economic effects, specifically by reducing switching costs. One study on limitations to move mobile apps across platforms (such as changing from the operating system of Apple to one of another smartphone) can be a barrier. Enabling app portability would help reduce switching costs, which are estimated to be between USD 122 and USD 301 per device (OECD, 2013[24]; iClarified, 2012[25]).
Open dataOpen data is the most prominent approach to enhance access to data and the most extreme form of data openness (OECD, 2015). In the public sector, open government data has been promoted for many years by initiatives such as data.gov (United States), data.gov.uk (United Kingdom), data.gov.fr (France) or data.go.jp (Japan) (Ubaldi, 2013[26]).
Open data should be accessed on “equal or non-discriminatory terms” (OECD, 2006[27]), limiting the conditions under which data can be provided via open access. In most cases, for instance, confidential data such as personal data cannot be shared via open access. Furthermore, as highlighted above, open data is expected to be provided for free or at no more than the marginal cost of production and dissemination. Therefore, businesses that want to commercialise their data, either directly (by selling data) or indirectly (by providing value-added services), may find open data less attractive.
Organisations in the public and private sector increasingly recognise that non-discriminatory access is crucial for maximising the (social) value of data: it creates new business opportunities, as well as economic and social benefits. Assessing the resulting economic and social benefits of moving towards open data, however, remains challenging. As highlighted by Dan Meisner, Thomson Reuters’ Head of Capability for Open Data, indirect benefits and network effects at play “don’t really fit very well into an Excel model for calculating your internal rate of return” (ODI, 2016[28]).
Restricted data-sharing arrangements can sometimes be more appropriate. In some cases, data are considered too confidential to be shared openly with the public. In others, there are legitimate (commercial and non-commercial) interests that oppose such sharing. Privacy, intellectual property (e.g. copyright and trade secrets), and organisational or national security concerns, legitimately prevent open sharing of data. In these cases, however, data users within a restricted community may still have a strong economic and/or social rationale for sharing data, under voluntary and mutually agreed terms.
It is common to find restricted data-sharing agreements in several areas. These include digital security, science and research, and as part of business arrangements for shared resources (e.g. within joint-ventures). These voluntary data-sharing arrangements can be based on commercial or non-commercial terms depending on the context. The following sections highlight two types of arrangements. First, data partnerships recognise that data sharing provides significant economic benefit both to data users and data holders. Second, data for societal objectives initiatives share data to support societal objectives.
Data partnerships (including data public-private partnerships) In data partnerships, organisations agree to share and mutually enrich their data sets, including through cross-licensing agreements. One big advantage is the facilitation of joint production or co-operation with suppliers, customers (consumers) or even potential competitors. This also enables the
136 OECD DIGITAL ECONOMY OUTLOOK 2020 © OECD 2020
5. ENHANCING DATA ACCESS, SHARING AND RE-USE 5. ENHANCING DATA ACCESS, SHARING AND RE-USE

data holder to create additional value and insights that a single organisation would not be able to create. This provides opportunities “to join forces without merging” (Konsynski and McFarlan, 1990[29]). Examples include the following:
● Nectar, a UK-based programme for loyalty cards, pooled data with firms such as Sainsbury (groceries), BP (gasoline) and Hertz (car rentals). “Sharing aggregated data allows the three companies to gain a broader, more complete perspective on consumer behaviour, while safeguarding their competitive positions” (Chui, Manyika and Kuiken, 2014[30]).
● DuPont Pioneer and John Deere launched a joint venture in 2014. It aimed to develop a joint agricultural data tool and link Pioneer’s Field360 services, a suite of precision agronomy software, with John Deere Wireless Data Transfer architecture, JDLink and MyJohnDeere (Banham, 2014[31]).
● Telefónica collaborated with organisations such as Facebook, Microsoft and UNICEF to exchange data of common customers (based on customers’ consent) for Telefónica’s personalised AI-enabled service Aura. Thanks to this collaboration, customers will be able to talk to Aura through Telefónica’s own channels and some third-party platforms like Facebook Messenger. In the future, they will also be able to talk through Google Assistant and Microsoft Cortana.
Similar arrangements exist in the form of public-private partnerships. For example, Transport for London (TfL), a local government body responsible for the transport system in Greater London (United Kingdom), forged new strategic partnerships with major data, software and Internet services providers such as Google, Waze, Twitter and Apple. In some cases, this partnership enabled TfL to access new data sources and crowdsource new traffic data (“bringing new data back”), to undertake new analysis. In doing so, TfL could gain access to updated navigation information (on road works and traffic incidents) and could enhance the efficiency of its planning and operation.
Data partnerships (including data public-private partnerships) raise several challenges (OECD, 2019[14]). Ensuring a fair data-sharing agreement between partners can sometimes be challenging, particularly when they have different market power. Considerations of privacy and international property rights may also limit the potential of data partnerships. These considerations can make it harder to sustain data sharing (see for comparison barriers to knowledge sharing during pre-competitive drug discovery). Where data partnerships involve competing businesses, data sharing may increase the risk of (implicit) collusion, including the formation of cartels and price fixing. In the case of data public-private partnerships, the double role of governments as an authority and service (data) provider may also create challenges. In this case, questions have been raised about what types of rules should apply for this type of data sharing, and what should the private sector exchange in return for the data.
Data for social good initiativesPrivate-sector data can also be provided (donated) to support societal objectives, ranging from science- and health care research to policy making. In an era of declining responses to national surveys, the re-use of public- and private-sector data can significantly improve the power and quality of statistics. This is true for both OECD countries and developing economies (Reimsbach-Kounatze, 2015[32]).
The re-use of private-sector data also provides new opportunities to better inform public policy making. Close to real-time evidence, for instance, can be made available to “nowcast” policy relevant trends (Reimsbach-Kounatze, 2015[32]). Other examples range from trends in the consumption of goods and services to flu epidemics and employment/unemployment trends. The monitoring of information systems and networks can also identify malware and cyberattack patterns (Choi and Varian, 2009[33]; Harris, 18 April 2011[34]; Carrière-Swallow and Labbé, 2013[35]). Some of these arrangements have been classified as “data philanthropy” to highlight the gains from the charitable sharing of private-sector data for public benefit (United Nations Global Pulse, 2012[36]).
6
Data access and sharing can generate significant positive social and economic benefitsAvailable evidence shows that enhancing data access and sharing can generate positive social and economic benefits for data providers (direct impact), their suppliers and data users (indirect impact) and for the wider economy (induced impact). These benefits are generated thanks to the following:
● greater transparency, accountability and empowerment of users, for instance, when open data is used for (cross-subsidising) the production of public and social goods
137OECD DIGITAL ECONOMY OUTLOOK 2020 © OECD 2020
5. ENHANCING DATA ACCESS, SHARING AND RE-USE 5. ENHANCING DATA ACCESS, SHARING AND RE-USE

● new business opportunities, including for the creation of start-ups and in particular for data intermediaries and mobile app developers
● competition and co-operation within and across sectors and nations, and including the integration of value chains
● crowdsourcing and user-driven innovation
● increasing efficiency due to linkage and integration of data across multiple sources (OECD, 2019[14]).
The quantification of the overall benefits of enhancing data access and sharing remains challenging.7 Recent available studies by sector (public vs. private sector) provide a rough estimate of the magnitude of the relative effects of enhancing data access and sharing. Overall they suggest that enhancing data access and sharing can increase the value of data to holders (direct impact). Further, it can help create 10 to 20 times more value to data users (indirect impact) and 20 to 50 times more value for the wider economy (induced impact). In some cases, however, enhancing data access and sharing may also reduce the producer surplus of data holders.
Deloitte (2013[37]), which was used as basis for the Shakespeare Review of the United Kingdom (BIS, 2013[38]), assessed the economic impact of access to public sector information (PSI) in the United Kingdom.8 The direct economic impact (as revenues of PSI holders) is estimated at GBP 0.1 billion (USD 0.13 billion). Meanwhile, the indirect impact (on data users and suppliers of private sector in health data) is estimated to be between GBP 1.2 billion (USD 1.6 billion) to GBP 1.8 billion (USD 2.4 billion) per year.9 The wider indirect and induced impact of PSI was conservatively estimated at around GBP 5 billion (USD 6.5 billion) per year. This included, for instance, time saved as a result of access to real-time travel data, which is valued at GBP 15 million (USD 19.5 million) to GBP 58 million (USD 75 million). Overall, this led to an estimate of between GBP 6 billion (USD 8 billion) to GBP 7 billion (USD 9 billion), or around 0.5% of GDP.
A study by the McKinsey & Company (2013[39]) looks at the benefits of re-using both public and private-sector data. The study examines seven areas of the global economy: education, transportation, consumer products, electricity, oil and gas, health care and consumer finance. It estimates that re-use of data across these seven areas could help create value worth USD 3 trillion a year worldwide.10 By scaling the results of this study to the G20 economies, Lateral Economics (2014[40]) estimates that open data could increase G20 output by around USD 13 trillion over the next five years. The authors note this increase “would boost cumulative G20 GDP by around 1.1 percentage points of the 2% growth target over five years” (Lateral Economics, 2014[40]). Similar scaling for Australia suggests that “more vigorous open data policies could add around AUD 16 billion per annum to the Australian economy” (this would represent almost 1% of GDP or USD 13 billion).
More recent studies are available at organisational level. Recent estimates based on open data provided by TfL, for instance, strongly confirm the positive net benefits of open data (Deloitte, 2017[41]). The Deloitte study shows that re-use of TfL’s open data was generating annual economic benefits and savings of up to GBP 130 million (USD 168 million) for TfL customers, road users, London and TfL itself. This includes a gross value added of GBP 12 million to GBP 15 million (USD 15 million to USD 19 million) per year for businesses, which also directly created more than 500 jobs. However, this does not account for the significant contribution of TfL’s open data to improving societal outcomes, facilitating innovation and improving the wider environment (e.g. air quality and lower emissions).
IDC and the Lisbon Council (2018[42]) assess the data market size and the GDP impact of the data economy in the European Union. They focus on the value added created from data re-use, including the provision of data and its exploitation in the private sector.11 The direct impact is estimated by the volume of the data market as a proxy (i.e. revenues of data suppliers and adjusted through including imports and excluding exports). According to the study, the data market volume in the European Union was estimated at EUR 59 billion in 2016 and EUR 65 billion in 2017 (an increase of roughly 20% year on year). The indirect impact (i.e. the impact on data suppliers and the impact on data users through innovation and efficiency gains) was more than 50% of total impact in 2017. Overall, the study suggests an overall impact of the data economy on GDP of 2.2% (EUR 306 billion) in 2016 and 2.4% (EUR 336 billion) in 2017.
Overall, these and other similar studies suggest that enhancing data access and sharing can help generate social and economic benefits. For the public sector, these benefits are worth between 0.1%
138 OECD DIGITAL ECONOMY OUTLOOK 2020 © OECD 2020
5. ENHANCING DATA ACCESS, SHARING AND RE-USE 5. ENHANCING DATA ACCESS, SHARING AND RE-USE
and 1.5% of GDP. When they include private-sector data, the benefits range from 1% and 2.5% of GDP. In a few studies, they rise up to 4% of GDP (OECD, 2019[14]).
Social and economic activities increasingly rely on transborder flowsThe creation of economic and social value increasingly depends on the ability to move and aggregate data across a number of locations scattered around the globe. These data flows enable firms to co-ordinate their research and development (R&D), supply, production, sales and post-sales processes effectively (United States Department of Commerce, 2016[43]; Casalini and López González, 2019[44]). Many manufacturing companies, for instance, use data flows to monitor the status, performance and condition of their machines in different locations. Boeing, for example, uses data generated by its 737 models, around 20 terabytes of data for every inflight hour, to diagnose problems in real time (Pepper and Garrity, 2014[45]). Volkswagen and Amazon Web Services, as another example, announced the co-development of the “industrial cloud” in March 2019 to connect “data from all machines, plants and systems in all factories”.12 Real-time data are then aggregated at a global level and potentially monetised via a new service.
Transborder data flows are especially important for SMEs, enabling a new breed of “micro multinationals” that is “born global” and constantly connected (MGI, 2016[46]). Start-ups, for example, rely on cross-border data flows to deliver their digital services as a platform. At the same time, they also collect transaction and consumer behaviour data in various locations. These data must then be transferred across borders to be stored, aggregated and analysed. Finally, insights based on aggregated global data serve as the basis for commercial services that can be delivered in multiple locations (e.g. targeted advertising, or demand forecasting, and price elasticities of consumers).
Transborder data access and sharing is also relevant for improving well-being. For example, the National Health Service in England outsourced the processing of MRI scans using the company Alliance Medical, which has around 200 imaging sites across Europe. Meanwhile, the Swedish company Hermes Medical Solutions offers cloud-based software applications to share medical images across 30 countries, though 95% of patient data are stored in Sweden.
Overall, this means that data also increasingly underpin international trade, reducing trade costs. In so doing, they support growing trade in goods and enable trade in services previously considered non-tradeable (OECD, 2017[47]; 2018[48]; 2019[49]).
13 Some estimates suggest that the value of cross-border data flows has exceeded the value of cross-border merchandise trade. MGI (2016[46]), for instance, estimates the international flow of data added USD 2.8 trillion to the global economy (more than trade in goods); this was expected to grow to USD 11 trillion by 2025.14
Estimates based on volume (i.e. measured in bytes) can only partially help assess the real value of data and data flows given they have little connection with the information contained within each data “unit” (OECD, 2019[50]). The transfer of a megabyte of new car design, for example, carries a different value than a megabyte of an individual’s purchase history. Cisco (2018[51]) shows that video accounted for 75% of all Internet Protocol traffic in 2017, the greatest single category of online data flow (Chapter 3).15
Other estimates of the “value” of transborder data flows are based on costs associated with restricting them (lower costs would suggest a lower value). For example, the US International Trade Commission (2014[52]) estimates the GDP of the United States would be 0.1% to 0.3% higher if foreign digital trade barriers were removed. Similarly, for the European Union, barriers to transborder data flows are estimated to reduce GDP by 0.4% to 1.1%, depending on the strength of data localisation requirements (van der Marel, Lee-Makiyama and Bauer, 2011[53]). Another study suggests that data regulations lead to a reduction of real GDP in the European Union by 0.48% (Bauer, Ferracane and van der Marel, 2016[54]).
Connectivity, understood as high-quality access to communication services at competitive prices, is the key enabler of data flows among countries. As discussed in Chapter 3, continued investment in backbone connectivity, including in submarine cables, is essential. This allows countries to keep pace with data transmission requirements and to support data flows with each other.
The installed capacity of submarine cables can provide a complementary, although only indicative, view on which global regions are most integrated in terms of cross-border data flows. Available evidence from TeleGeography (n.d.[55]) suggests that some parts of the globe are much more connected than
139OECD DIGITAL ECONOMY OUTLOOK 2020 © OECD 2020
5. ENHANCING DATA ACCESS, SHARING AND RE-USE 5. ENHANCING DATA ACCESS, SHARING AND RE-USE
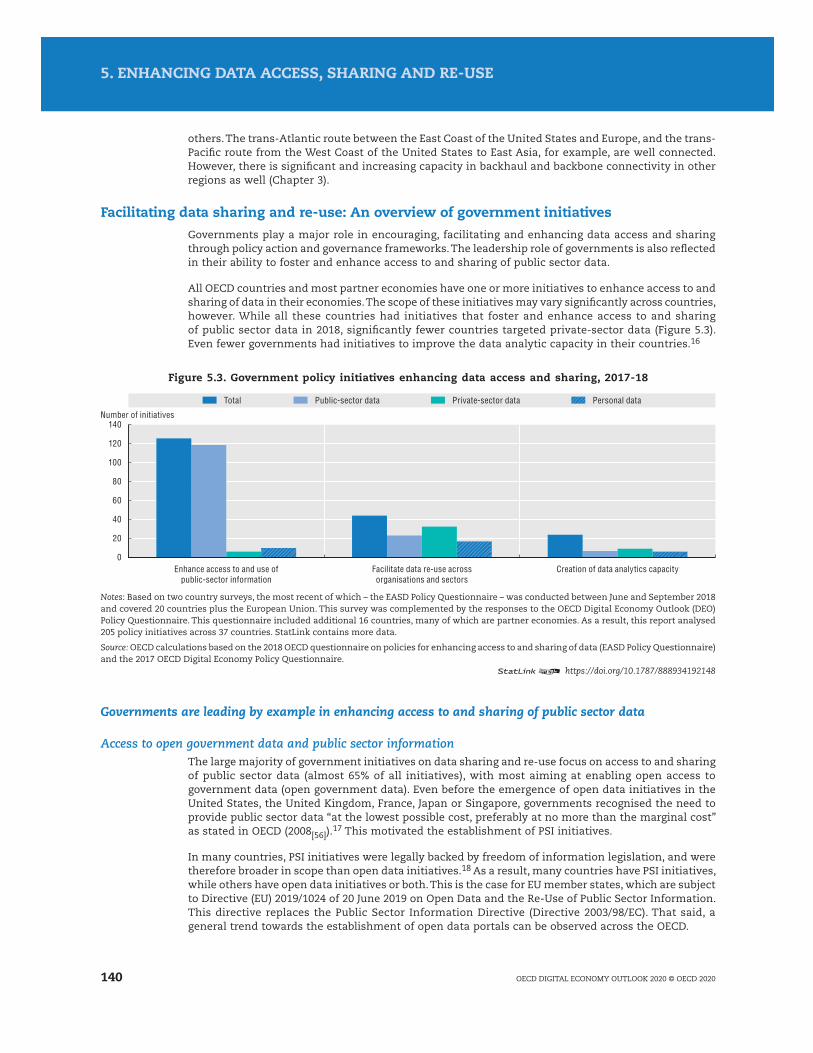
others. The trans-Atlantic route between the East Coast of the United States and Europe, and the trans-Pacific route from the West Coast of the United States to East Asia, for example, are well connected. However, there is significant and increasing capacity in backhaul and backbone connectivity in other regions as well (Chapter 3).
Facilitating data sharing and re-use: An overview of government initiativesGovernments play a major role in encouraging, facilitating and enhancing data access and sharing through policy action and governance frameworks. The leadership role of governments is also reflected in their ability to foster and enhance access to and sharing of public sector data.
All OECD countries and most partner economies have one or more initiatives to enhance access to and sharing of data in their economies. The scope of these initiatives may vary significantly across countries, however. While all these countries had initiatives that foster and enhance access to and sharing of public sector data in 2018, significantly fewer countries targeted private-sector data (Figure 5.3). Even fewer governments had initiatives to improve the data analytic capacity in their countries.16
Figure 5.3. Government policy initiatives enhancing data access and sharing, 2017-18
0
20
40
60
80
100
140
120
Public-sector dataTotal Personal dataPrivate-sector data
Number of initiatives
Enhance access to and use ofpublic-sector information
Facilitate data re-use acrossorganisations and sectors
Creation of data analytics capacity
Notes: Based on two country surveys, the most recent of which – the EASD Policy Questionnaire – was conducted between June and September 2018 and covered 20 countries plus the European Union. This survey was complemented by the responses to the OECD Digital Economy Outlook (DEO) Policy Questionnaire. This questionnaire included additional 16 countries, many of which are partner economies. As a result, this report analysed 205 policy initiatives across 37 countries. StatLink contains more data.
Source: OECD calculations based on the 2018 OECD questionnaire on policies for enhancing access to and sharing of data (EASD Policy Questionnaire) and the 2017 OECD Digital Economy Policy Questionnaire.
12 https://doi.org/10.1787/888934192148
Governments are leading by example in enhancing access to and sharing of public sector data
Access to open government data and public sector informationThe large majority of government initiatives on data sharing and re-use focus on access to and sharing of public sector data (almost 65% of all initiatives), with most aiming at enabling open access to government data (open government data). Even before the emergence of open data initiatives in the United States, the United Kingdom, France, Japan or Singapore, governments recognised the need to provide public sector data “at the lowest possible cost, preferably at no more than the marginal cost” as stated in OECD (2008[56]).
17 This motivated the establishment of PSI initiatives.
In many countries, PSI initiatives were legally backed by freedom of information legislation, and were therefore broader in scope than open data initiatives.18 As a result, many countries have PSI initiatives, while others have open data initiatives or both. This is the case for EU member states, which are subject to Directive (EU) 2019/1024 of 20 June 2019 on Open Data and the Re-Use of Public Sector Information. This directive replaces the Public Sector Information Directive (Directive 2003/98/EC). That said, a general trend towards the establishment of open data portals can be observed across the OECD.
140 OECD DIGITAL ECONOMY OUTLOOK 2020 © OECD 2020
5. ENHANCING DATA ACCESS, SHARING AND RE-USE 5. ENHANCING DATA ACCESS, SHARING AND RE-USE
Facilitating data sharing within the public sectorThere is a noticeable trend towards facilitating data sharing within the public sector (almost 15% of all initiatives on public sector data). This trend is motivated by governments’ commitment to become more data-driven and to exploit technological trends such as big data and artificial intelligence (AI). Australia’s data sharing and release legislation (DS&R legislation) (Box 5.1) is a prominent example. Estonia’s Information Sharing Data Sheet (X-Road) initiative aims to facilitate data exchange and linkage by interconnecting the country’s main national databases. It is motivated by the “once only” principle according to which public agencies should only collect data not previously maintained in any other public sector databases (Information System Authority [Estonia], 2019[57]). Similarly, Singapore set up the Government Data Architecture on 1 October 2019 to improve data quality and speed of access to data and to facilitate the secure use and sharing of data across public agencies.19 Another example, but with a focus on capacity building includes the United Kingdom Government Data Ethics Framework. It aims to ensure that public servants from across disciplines understand insights from data and emerging technologies and use data-informed insight responsibly (DCMS, 2018[58]).
20
Box 5.1. Balancing the benefits with the risks: Australia’s data sharing and release legislation
On 1 May 2018, in response to recommendations from the Productivity Commission Data Availability and Use Inquiry, the Australian government committed to reforming its national data governance framework. To that end, it developed new data sharing and release legislation (DS&R legislation) with five goals. It sought to i) promote better sharing of public sector data; ii) build trust in use of this data; iii) establish consistent and appropriate data safeguards that dial up or down depending on sensitivity of data; iv) enhance the integrity of the data system; and v) establish institutional arrangements.
The DS&R legislation recognises that greater sharing of data can lead to a variety of benefits. These include more efficient and effective government services for citizens; better informed government programmes and policies; greater transparency around government activities and spending; economic growth from innovative data use; and research solutions to current and emerging social, environmental and economic issues.
To balance these benefits with the risks and enhance trust in data sharing and re-use, Australia established the Office of the National Data Commissioner and the Data Integration Partnership for Australia, among other entities.
Geospatial and transportation data: A highly valued public sector dataOpening geospatial data (e.g. maps) and transportation data ranked high on the agenda of public sector data initiatives (representing almost 8% of the initiatives). Geospatial (geo-) data provide information about specific geographic locations. They are typically used for geographic information systems (GIS).21
The most prominent examples of GIS are digital maps, but geo-data may also include data on addresses, cadastral parcels, administrative units, geology, and agri- and aqua-cultural facilities. Further, it may include transportation data to the extent that data cover geolocation information (e.g. data on traffic flows and public transportation schedules). The combination of all these data has become the foundation for many location-based services and therefore recognised as critical for the functioning of multimodal transport. This may explain why many countries have classified geospatial and/or transportation data among their high-value data sets, such as the Geocoded National Address File in Australia. In Switzerland, the Federal Office of Transport is looking to facilitate the exchange of data between the various public and private actors active in the Swiss public transport system. It is therefore focusing on geo-data, price data of transportation services and operational data.
Few countries are facilitating or regulating data access and sharing within the private sectorFew countries have initiatives to facilitate data sharing within the private sector (almost 15% of all initiatives). However, sharing and re-use of private-sector data was the most frequently cited emerging challenge (followed by public-private partnerships) among countries that responded to the 2018 OECD questionnaire on policies for enhancing access to and sharing of data (EASD Policy Questionnaire).
141OECD DIGITAL ECONOMY OUTLOOK 2020 © OECD 2020
5. ENHANCING DATA ACCESS, SHARING AND RE-USE 5. ENHANCING DATA ACCESS, SHARING AND RE-USE
Voluntary and collaborative approachesMost initiatives (around 55%) to facilitate or regulate data access and sharing within the private sector are voluntary. These initiatives tend to be used where the risks of detrimental consequences of mandatory access and sharing outweigh the expected public benefits. Data access regulation, for example, could undermine incentives to invest in data. In other cases, regulation might not be granular enough for specific issues, and would thus reduce innovation and competition. Against these risks, and to incentivise and co-ordinate actions that facilitate data access and sharing in the private sector, many governments have incentives for voluntary initiatives. Two major types of voluntary government-led initiatives are among the most cited by survey respondents: i) contract guidelines; and ii) data partnerships, including public-private partnerships.
Contract guidelines define a set of contractual clauses based on defined principles. They constitute the default position for parties when negotiating their data-sharing agreements, with a focus on potentially contentious issues. Since the guidelines are voluntary, parties can deviate from the proposed contractual clauses at their will (freedom of contract). Parties would typically do so if such deviation would better reflect their common interests and the context of their agreements.
Examples of government initiatives include the Contract Guidance on Utilisation of AI and Data, formulated by Japan’s Ministry of Economy, Trade and Industry. This guidance elaborates issues and factors to be considered when drafting a contract on the utilisation of data and AI. It is intended to be used as a reference when private businesses conclude contracts related to data sharing (Data Section) or development and use of AI-based software (AI Section). The Data Section categorises data utilisation contracts into three types: i) data provision contracts; ii) data creation contracts; and iii) data sharing (platform) contracts.22 In this context, Japan also revised the Unfair Competition Prevention Act in 2018 to develop an environment where data can be exchanged with confidence. The act defines unauthorised acquisition, use and disclosure of “protected data” that meet the statutory requirements as unfair competition and provides civil measures against such misappropriation.
In the United States, as another example, the American Farm Bureau Federation (AFBF), together with commodity groups, farm organisations and agriculture technology providers, helped establish the Privacy and Security Principles for Farm Data to address controversial issues related to questions of the “ownership” of agricultural data. As of 1 April 2020, 37 organisations had signed onto the Core Principles, pledging to incorporate them into their contracts with farmers. To verify compliance with the Core Principles, AFBF and the other interested stakeholder groups formed a non-profit organisation, AG Data Transparency Evaluator. This entity audits companies’ agricultural data contracts and offers a seal of approval for those that meet the criteria (AG Data Transparent, 2016[59]).
Singapore, as another example, launched the Trusted Data Sharing Framework in June 2019. It lays out key risk-based business, legal, technical and operational considerations to guide businesses when exploring data partnerships, including involving third-party intermediaries. The framework is intended to establish a set of baseline practices by providing a common “data sharing language”. It suggests a systematic approach to the broad considerations for establishing trusted data-sharing partnerships. Legal templates are provided to kick-start discussions in response to industry feedback that businesses often go into protracted legal negotiations in setting up their data-sharing partnerships.
Aside from contract guidelines, Singapore also provides a regulatory “sandbox” as a safe environment for industry to engage the regulators on novel use of data. The sandbox allows companies to engage the regulator on new ways to use data. At the same time, it allows the regulator to be in line with industry development on data use. This could manifest either through new data generated by new technology, new technology enabling new uses of data or new application(s) of existing technology. This approach also informs the regulator and new developments in industry. Finally, it assesses the need for policy review to ensure a supportive regulatory environment for growth of data ecosystem.
Data partnerships enable organisations to share and mutually enrich their data sets, including through cross-licensing agreements. A number of governments encourage the establishment of data partnerships, both within the private sector and/or between the private and public sectors. Many of these initiatives are enabled by open access to public sector data. In Chile, for instance, the government has engaged in agreements on open data with academic and research institutions for the re-use of data in open format.
142 OECD DIGITAL ECONOMY OUTLOOK 2020 © OECD 2020
5. ENHANCING DATA ACCESS, SHARING AND RE-USE 5. ENHANCING DATA ACCESS, SHARING AND RE-USE

Other data partnerships are incentivised through research-related funding. Industrial Data Space (IDS), for example, enables better data control and agency across all domains. Co-ordinated by the Fraunhofer Gesellschaft, IDS uses an open, vendor-independent architecture of a peer-to-peer network. IDS has been funded by the German Federal Ministry of Education and Research since 2015 with approximately EUR 13 million.
In some other initiatives, the government’s role has been to incentivise and “orchestrate” data partnerships. Either it acts as (independent) trusted third party or it engages the private sector in public-private partnerships. The Data Integration Partnership for Australia, “an investment to maximise the use and value of the Government’s data assets” (Australian Government, 2017[60]), was presented earlier.
Another example is Japan’s Certification System for data sharing, which allows data-sharing companies to request data provided to relevant ministries and agencies. The government then provides support, in particular through tax incentives and administrative guidance. However, it could also revoke accreditation in some cases. The Digital Hub Denmark is an example for data public-private partnerships, where both public and private-sector actors agree to mutually share their data. The partners comprise the government, the Confederation of Danish Industry, the Danish Chamber of Commerce and Finance Denmark. The partnership aims to make Denmark one of the main European tech-hubs within AI, Internet of Things and big data. The Digital Hub will improve companies’ access to talent and investments, and facilitate the matchmaking between larger companies, start-ups and universities. Access to data thus constitutes just one element of the overall objective of the partnership.
Data of public interest Among the mandatory approaches, the most common are data-sharing agreements restricted to trusted users (restricted data sharing). These include promoting data sharing between the private and public sector with a focus on “data of public interests” or within network industries such as transportation and energy for ensuring interoperability of smart services. A number of countries have adopted the concept of data of public interest, but its scope varies significantly.
In some countries, data of public interest explicitly refers to private-sector data (of public interest), while in others it refers to public sector data. Sometimes both private and public sector data, as well as personal and non-personal data, are included.
Australia is considering the establishment of a framework to identify “National Interest Datasets” or “designated datasets” (Australian Government, n.d.[61]; 2018[62]). These datasets would primarily include public sector data, but may also include private-sector data controlled by the public sector under certain conditions.
In France, the Law for a Digital Republic (Loi pour une République numérique) defines “data of general interest” as including: i) private-sector data from delegated public services such as utility or transportation services; ii) private-sector data that are essential for granting subsidies’ and iii) private-sector data needed for national statistics (Government of France, 2016[63]).
Under the concept of “private-sector data for public interest purposes”, the European Commission is examining data sharing between the private and public sector to guide policy making and the improvement of public services (European Commission, 2018[64]).
Data of public interest are typically intended to be used mainly by governments or public sector institutions. However, in some cases, access to data is regulated based on competition and (system) efficiency considerations. This is particularly the case in network industries such as telecommunication, energy and transport. Finland’s 2018 Act on Transport Services is a three stage legislative project to streamline all transport market regulations into one package. The act introduces significant changes to transport markets that have so far been strictly regulated and steered by public measures. It promotes customer-oriented, market-based transport services on the basis of sound competition. The act’s goals are twofold. First, through deregulation, it gives more room to develop innovative, digitally enabled services. Second, it obliges all service providers to open certain essential data to all and to open ticketing and payments APIs (application programming interfaces) for single trip/ticket to third parties. The act makes it possible to examine transport as a whole, i.e. as one service.
143OECD DIGITAL ECONOMY OUTLOOK 2020 © OECD 2020
5. ENHANCING DATA ACCESS, SHARING AND RE-USE 5. ENHANCING DATA ACCESS, SHARING AND RE-USE

The Finnish Act on Transport Services assumes that future transport will rely on open access to necessary data, the interoperability of information and information systems through APIs and the openness of these interfaces. By the end of 2018, around 5 200 companies in the Finnish transportation sector had made their data available, mostly via APIs, since the adoption of the act. Estimates suggest that this amount covers around 80% of transportation services used in Finland. These include taxi services (with more than 1 400 datasets), on-demand transportation services (around 400 datasets), timetable-bound public transportation services (around 240 datasets), rental services and commercial car-sharing services (around 20 datasets) and commercial parking services. In addition, the most important actors have opened their ticketing and payment system APIs, particularly those within the largest cities.23
Data portability Data portability with a focus on (consumer) personal data is another means to promote access and sharing in the private sector. These different types of initiatives are discussed in the following sections.
Data portability is often regarded as a promising means for promoting cross-sectoral re-use of data. At the same, it may strengthen control rights of individuals over their personal data and of businesses (in particular SMEs) over their business data (Productivity Commission, 2017[21]). Prominent data portability initiatives include the Green Button in the United States (US Department of Energy, n.d.[22]), which is part of the country’s “My Data” initiative (launched in 2010). In 2011, the United Kingdom began its Midata data portability initiative (BIS, 2011[23]). The European Union approved the Right to Data Portability (Art. 20 of the GDPR) (European Union, 2016[19]). Most recently, Australia proposed its CDR.
The entry into force of the GDPR in May 2018 formalised the right of data portability within the European Union. Whereas the directive that preceded the GDPR gave data subjects the right to access their data,24 the GDPR granted them a separate, distinct right of personal data portability. That right, in Article 20 of the GDPR, provides that the data subject “shall have the right to receive the personal data concerning him or her, which he or she has provided to a controller, in a structured, commonly used and machine-readable format and have the right to transmit those data to another controller without hindrance…”. “Data subject” only includes natural persons – corporations cannot take advantage of the right to data portability (Art. 4[1]). The right applies where processing is based on consent or another legitimate category (Art 9[2]) is necessary for the performance of a contract, or when the processing is carried out by automated means (Art. 20[1]). Recital 68 explains that data controllers “be encouraged to develop interoperable formats that enable data portability” but that the right does not oblige controllers to adopt or maintain processing systems that are technically compatible.
In August 2019, Australia introduced a CDR. This legislation enabled consumers in designated sectors of the Australian economy (a “CDR consumer”) to have certain information disclosed to them or to accredited persons.25 The right applies in respect of “CDR data”. This is intended either to include information relating to the CDR consumer or information that is about goods or services in a particular sector that does not relate to any identifiable consumer.
The legislation defines three categories of actors. The first category is data holders, who are the original holders of CDR data. The second category is CDR consumers, who can be either individuals or small businesses26 that hold rights to access data held by data holders and direct that data be shared with an accredited person. The third category is accredited data recipients are individuals or businesses that meet a series of criteria for accreditation to be further specified in the consumer data rules. In particular, accredited data recipients must comply with safeguards to protect the privacy or confidentiality of CDR data (Division 5). Those safeguards include requirements that accredited persons do not solicit CDR data or use it for direct marketing, that they manage the data openly and transparently, and that they comply with notification processes. The right, which will initially apply in the banking sector, will progressively extend to other sectors such as energy and telecommunications (Parliament of Australia, 2019[78]).
Singapore’s Personal Data Protection Commission introduced data portability obligation in legislation in 2019. Under the proposed obligation, an organisation must, at the request of the individual, transmit their data in the organisation’s possession or under its control to another organisation in a commonly machine-readable format. This would enable greater data flows in the digital economy and encourage business innovation to bring to market innovative products/services. Singapore planned to clarify data portability for white-listed datasets, and to pilot, test and fine-tune the mechanisms and processes with industry to make data porting easy, safe and consistent for consumers.
144 OECD DIGITAL ECONOMY OUTLOOK 2020 © OECD 2020
5. ENHANCING DATA ACCESS, SHARING AND RE-USE 5. ENHANCING DATA ACCESS, SHARING AND RE-USE
Increasing data analytic capacities across society is addressed by a minority of governmentsIncreasing data analytic capacities, either in the public or private sector, was not considered a priority by countries responding to the 2018 EASD Policy Questionnaire. Only 12% of all policy initiatives cited by respondents to the questionnaire addressed data analytic capacities. A quarter of those initiatives focused on establishment of technology centres that support and/or guide in the re-use and analysis of data for public and/or private-sector entities. Some have also supported investments in data-related innovation and R&D.
Supporting the development of data-related skills and infrastructuresGovernments have recognised that availability of data-related skills and competences can be a critical bottleneck for the effective re-use and provision of data in both the private and public sectors. Some have established dedicated initiatives to support development of data-related skills and infrastructures.
● The United Kingdom supports skill development in the private and public sectors in several ways. The Digital Skills Partnership, for instance, brings together public, private and charity sector organisations to boost skills for a world-leading, inclusive digital economy. The United Kingdom also has initiatives related to data ethics and AI such as the Data Ethics Framework and the Centre for Data Ethics and Innovation. In addition, it established a Data Skills Taskforce with the help of the Department of Digital, Culture, Media and Sport, Tech Partnership and Accenture to enhance data analytic skills in the workforce.
● Estonia’s Digital Solutions seminars target industrial companies keen to improve production efficiency via digital solutions, including use of data. They aim to enhance knowledge and skills on the collection and use of data and information. The initiative was funded with EUR 200 000 between 2017 and 2020.
● The Ministry of Education of the People’s Republic of China (hereafter “China”) has supported the development of data-related skills through data analytics competitions with the Internet firm, Alibaba. This competition, held every year since 2010, helps partners identify the most talented data scientists in China.
A significant share of initiatives addresses public servants. Slovenia’s education and training programmes, for example, increase data-related skills and competencies among public servants. The Ministry of Public Administration has funded these programmes since 2016.
Establishing and collaborating with data (analytics) support centresSome governments have established data analytic and innovation centres to support their agencies in the sharing and re-use of data. Others have created and strengthened partnerships with such centres.
In 2013, Ireland’s Department of Jobs, Enterprise and Innovation, through the state agency Science Foundation Ireland (SFI), established Insight – the SFI Research Centre for Data Analytics. This centre is considered one of Europe’s largest data analytics research organisations and involves significant co-funding from and collaboration with industry partners. Insight undertakes high-impact research and seeks to derive value from big data. By enabling better decision making, it provides innovative technology solutions for industry and society. In addition to more than EUR 120 million from SFI, the centre also received cash and in-kind commitments of more than EUR 24 million from close to 90 companies.
Australia’s data innovation centre, Data61, which is part of Australia’s Commonwealth Scientific and Industrial Research Organisation, has partnered with government agencies. Together, they build new technologies that make high-value government data available to more people, while preserving privacy. In close collaboration with partner agencies, Data61 has developed a suite of new tools and technologies to enhance open data access, data sharing between agencies and managing privacy risks with sensitive data. The Confidential Computing Platform uses distributed machine learning – as well as homomorphic encryption and secure multi-party computing – to provide insights without organisations disclosing any data. This keeps the source data secure, private and up to date (Data61, n.d.[65]).
The European Commission is working towards a support centre for data sharing under the Connecting Europe Facility Programme. This centre was expected to facilitate sharing of both private and public sector data. “It will offer know-how and assistance on data sharing by providing best practice examples and information on APIs, existing model contracts and other legal and technical aspects” (European
145OECD DIGITAL ECONOMY OUTLOOK 2020 © OECD 2020
5. ENHANCING DATA ACCESS, SHARING AND RE-USE 5. ENHANCING DATA ACCESS, SHARING AND RE-USE

Commission, 2017[66]). This would include further improving the Guidance on Private Sector Data Sharing (European Commission, 2018[67]) discussed above.
Supporting innovation and R&D in data analytics and related technologiesA number of countries support innovation and R&D in data analytics and related technologies. Many of these policies are part of broader initiatives to support the digital economy or innovation. Few initiatives are solely dedicated to data analytics and data sharing.
The European Commission has put in place three funding mechanisms for data-related innovation:
● Funding for data innovation incubators connect data providers to data users. Three consortia composed of businesses and research organisations have been funded for three years with EUR 15 million.
● Funding of pan-European aggregators of public sector information (European Data Portal) aims to develop common metadata catalogues of all public sector information published in EU member states, searchable in multiple languages. This initiative, funded with EUR 10 million since 2015, continues until 2020.
● Privacy-enhancing technologies, including five consortia composed of businesses and research organisations, received EUR 65.5 million over three years.
Governments are turning to data-related initiatives to improve the effectiveness of their frontline responses to COVID-19
Governments are turning to a wide array of digital technologies and advanced analytics to collect, analyse and share data for frontline response to the COVID-19 crisis (Dunant, 2020[16]). Above all, most countries are leveraging the widespread use of mobile phones.
Telecommunication service providers serve substantial portions of the population across entire nations. Thanks to mobile call data records, the movements of millions of people at fine spatial and temporal scales can be measured in near real time. This can provide useful information on trends and fluctuations over time, helping reduce uncertainties attached to outbreak detection and response.
In several OECD countries, telecommunication service providers share geolocation data based on mobile call data records with health officials in an aggregated, anonymised format. For example, the main German telecommunications provider, Deutsche Telekom, is providing anonymised “movement flows” data of its users to the Robert Koch Institute, a government research agency responsible for disease control and prevention (Politik, 2020[68]). Vodafone Group’s Five Point Plan to address COVID-19 includes providing governments with large anonymised data sets. For example, it has an aggregated and anonymous heat map for the Lombardy region in Italy. These data sets will help authorities better understand population movements (Vodafone, 2020[69]).
Governments use information from these data sets to track the COVID-19 outbreak, warn vulnerable communities and understand the impact of policies such as social distancing and confinement. The European Commission, for instance, has been liaising with eight European telecommunications operators to obtain anonymised aggregate mobile location data to co-ordinate monitoring of the spread of COVID-19 (European Commission, 2020[70]). To address privacy concerns, the data were to be deleted at the end of the crisis (Chee, 2020[71]).
Governments are also fostering the development and use of smart applications to respond to COVID-19, including specific mobile apps for tracking and tracing infections. Some of these applications rely on GPS-based geolocation data or Bluetooth-based proximity data. In Korea, for instance, the government funded a GPS-based Self-quarantine Safety App, which is used by public authorities to effectively support the monitoring of those under self-quarantine. This app has three key features: (i) a self-diagnosis feature for users to conduct a self-assessment of their possible COVID-19 infection and to share the results with their assigned local government officer; (ii) a GPS-based geolocation tracking feature to prevent possible violation of self-quarantine orders; and (iii) an information feature to provide necessary information including self-quarantine guidelines and the contact information of the assigned local government officer. The data collected by the Self-quarantine Safety App is not shared with third parties. In addition, Korea has also deployed an Epidemiological Investigation Support System (EISS) to
146 OECD DIGITAL ECONOMY OUTLOOK 2020 © OECD 2020
5. ENHANCING DATA ACCESS, SHARING AND RE-USE 5. ENHANCING DATA ACCESS, SHARING AND RE-USE

trace contacts and movements of confirmed COVID-19 patients. This system, which operates in a strict manner to protect the privacy of individuals, can help public health officials locate possible sources of COVID-19 infections, identify hot beds of infections and warn citizens.
Epidemiologists confirmed these type of applications are crucial in providing detailed information about the movements of infected people, their possible infected contacts and can thus help track and control the pandemic. However, it remains controversial whether making data on e.g. hot beds of infections available to the public is the right choice (Everett, Hudson and Collins, 18 March 2020[72]). When an individual tests positive for COVID-19, for instance, their city or district might alert people who live nearby about the movements of potentially infected individuals prior to their diagnosis.27 While the World Health Organization praised Korea’s extensive tracing measures, some uses by designated local authorities of the data collected through the EISS on the movements of persons with confirmed cases have raised privacy concerns (Zastrow, 2020[73]; Nemo, 2020[74]). In response, the Korean government recently published guidance related to the disclosure of the movements of persons with confirmed cases based on the Infectious Disease Control and Prevention Act passed in 2015 which does not allow any information specific to the data subject to be disclosed.
Proximity data collected from contact tracing apps can provide even more granular enriched data on individuals with a potential COVID-19 infection. Singapore, for example, initiated contact tracing for all confirmed cases from the early days of the outbreak. Specifically, it traced contacts of confirmed cases during their infectious period and followed up accordingly. To support the work of contact tracers, Singapore has rolled out digital track and tracing tools and solutions developed by the government. This includes the TraceTogether app, a smartphone app that uses short-distance Bluetooth signals between phones to detect other TraceTogether users in close proximity. To enhance the effectiveness of this initiative, and in particular to include the digitally excluded population, it also introduced a dedicated TraceTogether portable device – TraceTogether Token.28
The developers of TraceTogether (app and token) have put in place a number of privacy safeguards. For instance, TraceTogether does not collect or use location data. As well, data logs are stored in an encrypted form on the device. Authorities can only access the Bluetooth proximity data if a user tests positive for COVID-19. TraceTogether works in tandem with the SafeEntry national digital check-in system that logs the entry and exit of individuals entering and exiting public venues. This reduces the time required for contact tracing to perform activity mapping. This, in turn, allows authorities to alert close contacts of those infected with COVID-19 more quickly. As of June 2020, 35% of the population (more than 2.1 million) in Singapore have downloaded the app according to information provided by the Government of Singapore.
147OECD DIGITAL ECONOMY OUTLOOK 2020 © OECD 2020
5. ENHANCING DATA ACCESS, SHARING AND RE-USE 5. ENHANCING DATA ACCESS, SHARING AND RE-USE
References
AG Data Transparent (2016), “AG Data’s core principles: The privacy and security principles for farm data”, webpage, http://www.agdatatransparent.com/principles/ (accessed on 21 October 2020).
[59]
Australian Government (2018), “New Australian government data sharing and release legislation”, Issues Paper for Consultation, Department of the Prime Minister and Cabinet, Canberra, http://www.pmc.gov.au/resource-centre/public-data/issues-paper-data-sharing-release-legislation.
[62]
Australian Government (2017), Information about the Data Integration Partnership for Australia, Brochure, Department of the Prime Minister and Cabinet, Data and Digital Branch, Canberra, http://www.pmc.gov.au/sites/default/files/publications/DIPA-information.pdf.
[60]
Australian Government (n.d.), “Designated Datasets — a special class of high-value dataset: Australian government’s response to Productivity Commission Recommendations: 7.1 and 7.2”, webpage, https://dataavailability.pmc.gov.au/designated-datasets.html (accessed on 21 October 2020).
[61]
Bajari, P. et al. (2019), “The impact of big data on firm performance: An empirical investigation”, AEA Papers and Proceedings, Vol. 109, pp. 33-37, http://dx.doi.org/10.1257/pandp.20191000.
[6]
Bakhshi, H., A. Bravo-Biosca and J. Mateos-Garcia (2014), “The analytical firm: Estimating the effect of data and online analytics on firm performance”, Working Paper, No. 14/05, Nesta, London, https://media.nesta.org.uk/documents/1405_the_analytical_firm_-_final.pdf.
[9]
Banham, R. (2014), “Who owns farmers’ big data?”, Forbes, 8 July, https://www.forbes.com/sites/emc/2014/07/08/who-owns- farmers-big-data/.
[31]
Bauer, M., M. Ferracane and E. van der Marel (2016), Tracing the Economic Impact of Regulations on the Free Flow of Data and Data Localization, Centre for International Governance Innovation (CIGI), Waterloo, Canada, https://www.cigionline.org/publications/tracing-economic-impact-regulations-free-flow-data-and-data-localization (accessed on 21 October 2020).
[54]
Belissent, J. (2017), “Insights services drive data commercialization”, Featured Insights blog, 8 March, https://go.forrester.com/blogs/17-03-08-insights_services_drive_data_commercialization/.
[20]
BIS (2013), Shakespeare Review: An Independent Review of Public Sector Information, UK Department for Business Innovation & Skills, London, http://www.gov.uk/government/uploads/system/uploads/attachment_data/file/198752/13-744-shakespeare-review-of-public-sector-information.pdf.
[38]
BIS (2011), Better Choices: Better Deals – Consumers Powering Growth, UK Department for Business Innovation & Skills, London, https://assets.publishing.service.gov.uk/government/uploads/system/uploads/attachment_data/file/294798/bis-11-749-better-choices-better-deals-consumers-powering-growth.pdf.
[23]
Brynjolfsson, E. and K. McElheran (2019), “Data in action: Data-driven decision making and predictive analytics in U.S. manufacturing”, Working Paper, No. 3422397, Rotman School of Management, Toronto, https://papers.ssrn.com/sol3/papers.cfm?abstract_id=3422397.
[4]
Brynjolfsson, E. and K. McElheran (2016), “The rapid adoption of data-driven decision-making”, American Economic Review, Vol. 106/5, pp. 133-39, http://dx.doi.org/10.1257/aer.p20161016.
[8]
Carrière-Swallow, Y. and F. Labbé (2013), “Nowcasting with Google trends in an emerging market”, Journal of Forecasting, Vol. 32/4, pp. 289-298.
[35]
Casalini, F. and J. López González (2019), “Trade and Cross-Border Data Flows”, OECD Trade Policy Papers, No. 220, OECD Publishing, Paris, https://dx.doi.org/10.1787/b2023a47-en.
[44]
Chee, F. (2020), “Vodafone, Deutsche Telekom, 6 other telcos to help EU track virus”, Reuters Technology News, 25 March, https://www.reuters.com/article/us-health-coronavirus-telecoms-eu/vodafone-deutsche-telekom-6-other-telcos-to-help-eu-track-virus-idUSKBN21C36G.
[71]
Choi, H. and H. Varian (2009), “Predicting the present with Google trends”, SSRN, http://dx.doi.org/10.2139/ssrn.1659302. [33]
Chui, M., J. Manyika and S. Kuiken (2014), “What executives should know about open data”, Our Insights, McKinsey & Company, New York, 1 January, http://www.mckinsey.com/industries/high-tech/our-insights/what-executives-should-know-about-open-data (accessed on 21 October 2020).
[30]
Cisco (2018), Cisco Visual Networking Index: Global Mobile Data Traffic Forecast Update, 2017–2022 White Paper - Cisco, Cisco Systems, San Jose, California, https://www.cisco.com/c/en/us/solutions/collateral/service-provider/visual-networking-index-vni/white-paper-c11-738429.html (accessed on 21 October 2020).
[51]
148 OECD DIGITAL ECONOMY OUTLOOK 2020 © OECD 2020
5. ENHANCING DATA ACCESS, SHARING AND RE-USE 5. ENHANCING DATA ACCESS, SHARING AND RE-USE
References and Notes

Data61 (n.d.), “Confidential Computing – Insights from Data Without Seeing the Data”, webpage, https://data61.csiro.au/en/Our-Research/Focus-Areas/Privacy-Preserving-Technologies (accessed on 21 October 2020).
[65]
DCMS (2018), “Guidance Data Ethics Framework”, webpage, http://www.gov.uk/government/publications/data-ethics-framework/data-ethics-framework (accessed on 21 October 2020).
[58]
Deloitte (2017), “Assessing the value of TfL’s open data and digital partnerships”, report commissioned for Transport for London, http://content.tfl.gov.uk/deloitte-report-tfl-open-data.pdf.
[41]
Deloitte (2013), “Market assessment of public sector information”, report commissioned by the UK Department for Business, Innovation & Skills, https://assets.publishing.service.gov.uk/government/uploads/system/uploads/attachment_data/file/198905/bis-13-743-market-assessment-of-public-sector-information.pdf.
[37]
Dunant, R. (2020), “Open letter: Contact tracking and NHSX”, Medium, 23 March, https://medium.com/@rachelcoldicutt/open-letter-contract-tracking-and-nhsx-e503325b2703?sk=4e6097dea429498f20d5e33b0cfc2436.
[16]
European Commission (2020), Commission Recommendation (EU) 2020/518 of 8 April 2020 on a common Union toolbox for the use of technology and data to combat and exit from the COVID-19 crisis, in particular concerning mobile applications and the use of anonymised mobility data, European Commission, Brussels, https://eur-lex.europa.eu/legal-content/EN/TXT/?uri=CELEX:32020H0518.
[70]
European Commission (2018), “Guidance on sharing private sector data in the European data economy”, Accompanying the document Communication from the Commission to the European Parliament, the Council, the European Economic and Social Committee and the Committee of the Regions, “Towards a common European data space,” COM(2018), 125, Final, European Commission, Brussels.
[67]
European Commission (2018), “Towards a common European data space”, Communication from the Commission to the European Parliament, the Council, the European Economic and Social Committee and the Committee of the Regions, COM(2018), 232, Final, European Commission, Brussels, https://eur-lex.europa.eu/legal-content/EN/ALL/?uri=COM:2018:0232:FIN.
[64]
European Commission (2017), Communication from the Commission to the European Parliament, the Council, the European Economic and Social Committee and the Committee of the Regions “Building a European Data Economy”, European Commission, Brussels, http://eur-lex.europa.eu/legal-content/EN/TXT/?uri=COM%3A2017%3A9%3AFIN.
[66]
European Union (2016), Regulation (EU) 2016/679 of the European Parliament and of the Council of 27 April 2016 on the protection of natural persons with regard to the processing of personal data and on the free movement of such data, and repealing Directive 95/46/EC, European Union, Brussels, http://data.europa.eu/eli/reg/2016/679/oj.
[19]
Everett, M., L. Hudson and K. Collins (18 March 2020), “COVID-19: When public health and privacy collide?”, Data Notes blog, https://hsfnotes.com/data/2020/03/18/covid-19-when-public-health-and-privacy-collide/.
[72]
Government of France (2016), Loi pour une République numérique, Paris, http://www.senat.fr/leg/pjl15-744.html. [63]
Harris, D. (2011), “Hadoop kills zombies too! Is there anything it can’t solve?”, Gigaom blog, 18 April, http://gigaom.com/cloud/hadoop-kills-zombies-too-is-there-anything-it-cant-solve/.
[34]
iClarified (2012), “Goldman Sachs values iPhone/iPad customer base at $295 billion”, iClarified, 29 June, https://www.iclarified.com/22914/goldman-sachs-values-iphoneipad-customer-base-at-295-billion.
[25]
IDC and Lisbon Council (2018), “Updating the European data market monitoring tool”, a report commissioned for the European Commission, Brussels, http://datalandscape.eu/study-reports/first-report-facts-and-figures-updating-european-data-market-monitoring-tool.
[42]
Information System Authority [Estonia] (2019), “Data Exchange Layer X-tee”, webpage, http://www.ria.ee/en/state-information-system/x-tee.html (accessed on 21 October 2020).
[57]
ITU (2020), “Mobile cellular subscriptions”, World Telecommunication/ICT Development Report, (database), International Telecommunication Union, Geneva, https://data.worldbank.org/indicator/IT.CEL.SETS (accessed on 21 October 2020).
[17]
King’s College London et al. (2020), C-19 Covid Symptom Tracker, website, https://covid.joinzoe.com/ (accessed on 21 October 2020). [18]
Konsynski, B. and F. McFarlan (1990), “Information partnerships – shared data, shared scale”, Harvard Business Review, September-October, https://hbr.org/1990/09/information-partnerships-shared-data-shared-scale.
[29]
Lateral Economics (2014), “Open for business: How open data can help achieve the G20 growth target”, report commissioned by Omidyar Network, Redwood City, California.
[40]
Li, W., M. Nirei and K. Yamana (2019), “Value of data: There’s no such thing as a free lunch in the digital economy”, Working Paper, US Bureau of Economic Analysis, Washington, DC.
[12]
Mandel, M. (2012), Beyond Goods and Services: The (Unmeasured) Rise of the Data-Driven Economy | Progressive Policy Institute, Progressive Policy Institute, https://www.progressivepolicy.org/publication/beyond-goods-and-services-the-unmeasured-rise-of-the-data-driven-economy/ (accessed on 21 October 2020).
[77]
McKinsey & Company (2017), Fueling Growth through Data Monetization, McKinsey & Company, New York, http://www.mckinsey.com/business-functions/mckinsey-analytics/our-insights/fueling-growth-through-data-monetization.
[2]
149OECD DIGITAL ECONOMY OUTLOOK 2020 © OECD 2020
5. ENHANCING DATA ACCESS, SHARING AND RE-USE 5. ENHANCING DATA ACCESS, SHARING AND RE-USE
References and Notes
McKinsey & Company (2013), Open Data: Unlocking Innovation and Performance with Liquid Information, McKinsey & Company, New York, http://www.mckinsey.com/insights/business_technology/open_data_unlocking_innovation_and_performance_with_liquid_information.
[39]
MGI (2016), Digital Globalisation: The New Era of Global Flows, McKinsey Global Institute, New York, https://www.mckinsey.com/~/media/McKinsey/Business%20Functions/McKinsey%20Digital/Our%20Insights/Digital%20globalization%20The%20new%20era%20of%20global%20flows/MGI-Digital-globalization-Full-report.ashx.
[46]
Nemo, K. (2020), “’More scary than coronavirus’: South Korea’s health alerts expose private lives”, The Guardian, 6 March, https://www.theguardian.com/world/2020/mar/06/more-scary-than-coronavirus-south-koreas-health-alerts-expose-private-lives.
[74]
Niebel, T., F. Rasel and S. Viete (2018), “BIG data – BIG gains? Understanding the link between big data analytics and innovation”, Economics of Innovation and New Technology, July, http://dx.doi.org/10.1080/10438599.2018.1493075.
[5]
ODI (2016), Open Enterprise: How Three Big Businesses Create Value with Open Innovation, https://theodi.org/article/open-enterprise-how-three-big-businesses-create-value-with-open-innovation/ (accessed on 21 October 2020).
[28]
OECD (2020), “OECD Competition Assessment Toolkit”, webpage, https://www.oecd.org/competition/assessment-toolkit.htm (accessed on 21 October 2020).
[15]
OECD (2019), Enhancing Access to and Sharing of Data: Reconciling Risks and Benefits for Data Re-use across Societies, OECD Publishing, Paris, https://doi.org/10.1787/276aaca8-en.
[14]
OECD (2019), Measuring the Digital Transformation: A Roadmap for the Future, OECD Publishing, Paris, https://dx.doi.org/ 10.1787/9789264311992-en.
[50]
OECD (2019), “Trade and Cross-Border Data Flows”, OECD Trade Policy Papers, No. 220, OECD Publishing, Paris, https://doi.org/ 10.1787/b2023a47-en.
[49]
OECD (2018), “Digital Trade and Market Openness”, OECD Trade Policy Papers, No. 217, OECD Publishing, Paris, https://doi.org/ 10.1787/1bd89c9a-en.
[48]
OECD (2017), OECD Digital Economy Outlook 2017, OECD Publishing, Paris, https://dx.doi.org/10.1787/9789264276284-en. [47]
OECD (2017), The Next Production Revolution: Implications for Governments and Business, OECD Publishing, Paris, http://dx.doi.org/10.1787/9789264271036-en.
[3]
OECD (2015), Data-Driven Innovation: Big Data for Growth and Well-Being, OECD Publishing, Paris, http://dx.doi.org/ 10.1787/9789264229358-en.
[1]
OECD (2013), “The App Economy”, OECD Digital Economy Papers, No. 230, OECD Publishing, Paris, http://dx.doi.org/ 10.1787/5k3ttftlv95k-en.
[24]
OECD (2008), Recommendation of the Council for Enhanced Access and More Effective Use of Public Sector Information, OECD, Paris, https://legalinstruments.oecd.org/en/instruments/OECD-LEGAL-0362.
[56]
OECD (2006), Recommendation of the Council concerning Access to Research Data from Public Funding, OECD, Paris, https://legalinstruments.oecd.org/en/instruments/OECD-LEGAL-0347.
[27]
OFT (2006), The Commercial Use of Public Information, Office of Fair Trading, London, https://ec.europa.eu/digital-single-market/en/news/commercial-use-public-information-oft-study.
[75]
Parliament of Australia (2019), Cth. Parliamentary Debates, House of Representatives, Canberra, 30 July, pp. 1379, http://www.aph.gov.au/Parliamentary_Business/Hansard/.
[78]
Pepper, R. and J. Garrity (2014), “The Internet of everything: how the network unleashes the benefits of big data”, The Global Information Technology Report, pp. 35-42, https://alln-extcloud-storage.cisco.com/ciscoblogs/GITR-2014-Cisco-Chapter.pdf (accessed 21 October 2020).
[45]
Politik (2020), Telekom teilt Daten über „Bewegungsströme“ von Handynutzern mit RKI [Telekom shares Data about Movement Flows of Mobile Phone Users with the Robert Koch Institute], Welt, 8 March, https://www.welt.de/politik/deutschland/article206624141/Coronavirus-Telekom-teilt-Bewegungsstroeme-von-Handynutzern-mit-RKI.html.
[68]
Productivity Commission (2017), Productivity Commission Inquiry Report: Data Availability and Use, Productivity Commission, Government of Australia, Melbourne, https://www.pc.gov.au/inquiries/completed/data-access/report/data-access.pdf.
[21]
Reimsbach-Kounatze, C. (2015), “The Proliferation of “Big Data” and Implications for Official Statistics and Statistical Agencies: A Preliminary Analysis”, OECD Digital Economy Papers, No. 245, OECD Publishing, Paris, http://dx.doi.org/10.1787/5js7t9wqzvg8-en.
[32]
Schimmelpfennig, D. and R. Ebel (2016), “Sequential adoption and cost savings from precision agriculture”, Journal of Agricultural and Resource Economics, Vol. 41/1, pp. 97-115, http://dx.doi.org/www.waeaonline.org/UserFiles/file/JARE January20166Schimmelpfennigpp97-115.pdf.
[10]
Shapiro, R. and S. Aneja (2019), Who Owns Americans’ Personal Information and What Is It Worth?, Future Majority, https://www.futuremajority.org/pages/who-owns-americans-personal-information (accessed on 21 October 2020).
[76]
150 OECD DIGITAL ECONOMY OUTLOOK 2020 © OECD 2020
5. ENHANCING DATA ACCESS, SHARING AND RE-USE 5. ENHANCING DATA ACCESS, SHARING AND RE-USE
References and Notes
TeleGeography (n.d.), Submarine Cable Map, website, http://www.submarinecablemap.com (accessed on 3 August 2020). [55]
Ubaldi, B. (2013), “Open Government Data: Towards Empirical Analysis of Open Government Data Initiatives”, OECD Working Papers on Public Governance, No. 22, OECD Publishing, Paris, http://dx.doi.org/10.1787/5k46bj4f03s7-en.
[26]
United Nations Global Pulse (2012), Big Data for Development: Opportunities & Challenges, United Nations Global Pulse, New York, http://www.unglobalpulse.org/sites/default/files/BigDataforDevelopment-UNGlobalPulseJune2012.pdf.
[36]
United States Department of Commerce (2016), Measuring the Value of Cross-Border Data Flows | U.S. Department of Commerce, https://www.commerce.gov/news/reports/2016/09/measuring-value-cross-border-data-flows (accessed on 15 September 2020).
[43]
United States International Trade Commission (2014), Digital Trade in the U.S. and Global Economies, Part 2, https://www.usitc.gov/publications/332/pub4485.pdf (accessed on 21 October 2020).
[52]
United States Department of Energy (n.d.), “Green button: Open energy data”, webpage, https://www.energy.gov/data/green-button (accessed on 21 October 2020).
[22]
van der Marel, E., H. Lee-Makiyama and M. Bauer (2011), The Costs of Data Localisation: A Friendly Fire on Economic Recovery, European Centre for International Political Economy (ECIPE), https://ecipe.org/publications/dataloc/ (accessed on 15 September 2020).
[53]
Vodafone (2020), “An industrial 5G spectrum policy for Europe”, Public Policy Paper, Vodafone, Berkshire, United Kingdom, https://www.vodafone.com/content/dam/vodcom/files/public-policy/5g-report/an-industrial-5g-spectrum-policy-for-europe.pdf.
[69]
Wamba, S. et al. (2017), “Big data analytics and firm performance: Effects of dynamic capabilities”, Journal of Business Research, Vol. 70, pp. 356-365, http://dx.doi.org/10.1016/j.jbusres.2016.08.009.
[7]
Waters, R. (2015), “IBM’s latest deal is a new test case for the big data economy”, Financial Times, 29 October, http://www.ft.com/content/0fe3ac2e-7e22-11e5-a1fe-567b37f80b64.
[13]
Zastrow, M. (2020), “South Korea is reporting intimate details of COVID-19 cases: Has it helped?”, Nature, 18 March, https://www.nature.com/articles/d41586-020-00740-y.
[73]
Notes
1. High performers are defined as companies that had annual growth rates of 10% or more over the past three years.
2. Shapiro and Aneja (2019[76]) provide estimates of the value of American personal data based on the digital advertising revenue of the major online platforms. In 2018, based on these companies’ financial statements, the platforms earned USD 111.1 billion from US advertisers targeting American consumers. Moreover, the authors note that, “Google and Facebook dominated this area in 2018, accounting respectively for 37.1 percent ($41.3 billion) and 20.6 percent ($22.9 billion) of total digital advertising revenues” (p. 9).
3. According to TJI Research, Amazon sells products using 139 private label brands (update April 2019), across different product categories, including clothing, electronics, food, furniture, household goods and health care.
4. As Mandel (2012[77]) highlights: “[…] economic and regulatory policymakers around the world are not getting the data they need to understand the importance of data for the economy. Consider this: The Bureau of Economic Analysis […] will tell you how much Americans increased their consumption of jewellery and watches in 2011, but offers no information about the growing use of mobile apps or online tax preparation programs. Eurostat […] reports how much European businesses invested in buildings and equipment in 2010, but not how much those same businesses spent on consumer or business databases. And the World Trade Organization publishes figures on the flow of clothing from Asia to the United States, but no official agency tracks the very valuable flow of data back and forth across the Pacific.”
5. While data flow plays a vital role in the digital economy, legal and regulatory frameworks enable such cross-border data flows with trust. This is especially true of privacy and data protection regulation as discussed in Chapter 6.
6. In this context, two ideas are debated: i) “data commons”, where some data are shared publicly after adequate anonymisation and aggregation; and ii) “digital smoke signals”, where companies analyse sensitive data but share results with governments.
151OECD DIGITAL ECONOMY OUTLOOK 2020 © OECD 2020
5. ENHANCING DATA ACCESS, SHARING AND RE-USE 5. ENHANCING DATA ACCESS, SHARING AND RE-USE
References and Notes
7. Studies differ significantly in terms of the scope of the sectors (e.g. public sector and/or private sector), types of data (e.g. personal, proprietary or public), and degrees of data openness (and arrangements included, such as open data), as well as the methodologies, including the different level of impact assessed (i.e. organisational, sectoral or macroeconomic).
8. The study was based on the methodology in OfT (2006[75]) but with a more expanded scope. It focuses particularly on trading funds such as the HM Land Registry, the Registers of Scotland, the Companies House, the Ordnance Survey, the UK Hydrographic Office, the Environment Agency, the Met Office, and the Office of National Statistics.
9. These are based on 2011 data and include around GBP 100 million in revenues generated from sales of public sector information (PSI); GBP 100 million through supply-chain effects from increased jobs and related consumer spending from the production of PSI; and GBP 1.6 billion through consumer surplus from direct use and consumption of PSI-related products.
10. Altogether, it is estimated that consumer and customer surplus generate over half of the total potential value of open data (McKinsey & Company, 2013[39]). The largest share of the total benefits of open data is attributed to better benchmarking, “an exercise that exposes variability and also promotes transparency within organisations” (McKinsey & Company, 2013[39]). Better benchmarking would enable “fostering competitiveness by making more information available and creating opportunities to better match supply and demand” as well as “enhancing the accountability of institutions such as governments and businesses [to] raise the quality of decision [making] by giving citizens and consumers more tools to scrutinise business and government” (McKinsey & Company, 2013[39]).
11. The data market is defined as the marketplace where digital data is exchanged as “products” and “services” as a result of the (re-)processing of raw data. The impact on the data economy is defined more broadly as the overall effects of the data market on the economy, involving generation, collection, storage, processing, distribution, analysis elaboration, delivery and exploitation of data enabled by digital technologies. Therefore, the overall impact is estimated by summing up the direct, indirect and induced impact. For the estimation of data market and the data economy, IDC and the Lisbon Council (2018[42]) identify data companies that have both data suppliers and data users. Data suppliers have, as their main activity, the production and delivery of digital data-related products, services and technologies, while data users are organisations that generate, exploit, collect and analyse digital data intensively to improve their business activities.
12. See www.volkswagenag.com/en/news/stories/2019/03/volkswagen-industrial-cloud.html.
13. That is why impediments to international data transfers can have severe negative economic impacts on businesses and ultimately on complex value chains and trade.
14. The MGI model estimates the contribution of various flows – including data – to approximate their impact on real GDP. Data flows are approximated by cross-border used bandwidth from TeleGeography (sum of capacity for Internet backbones, private networks and switched voice networks). They ran the model for 97 countries for 1995-2013 and found that a 10% increase in cross-border data flows raises GDP by 0.2.
15. The use of data volume is also further complicated by the use of data compression techniques widely applied to flows of data.
16. This section assesses policy trends related to enhancing data access and sharing based on two country surveys, the most recent of which, the EASD Policy Questionnaire, was conducted between June and September 2018 and covered 20 countries plus the European Union. This survey was complemented by the responses to the Digital Economy Policy Questionnaire, which included additional 16 countries, many of which are partner economies. As a result, it analysed 205 policy initiatives across 37 countries.
17. The OECD Recommendation of the Council for Enhanced Access and More Effective Use of Public Sector Information (OECD PSI Recommendation) (OECD, 2008[56]) defines public sector (government) data as a subset of PSI, which includes not only data but also digital content, such as text documents and multimedia files. The terms “public sector data” and “government data” are used as synonyms. The oft-used term “open government data” refers to public sector data made available as open data. These data are i) dynamic and continuously generated; ii) often directly produced by the public sector; or iii) associated with the functioning of the public sector (e.g. meteorological data, geo-spatial data, business statistics); and iv) often readily useable in commercial applications with relatively little transformation, as well as being the basis of extensive elaboration.
18. PSI typically includes not only data but also digital content, such as text documents and multimedia files.
19. Government agencies are appointed to acquire, maintain, fuse and distribute quality data securely; centralised infrastructure, with in-built safeguards, is put in place to enable data discoverability, secure access to data and data analytics. The GDA will enable government agencies to access commonly used data within seven working days, and obtain insights more expeditiously and readily. In addition, Singapore introduced the Public Sector
152 OECD DIGITAL ECONOMY OUTLOOK 2020 © OECD 2020
5. ENHANCING DATA ACCESS, SHARING AND RE-USE 5. ENHANCING DATA ACCESS, SHARING AND RE-USE
References and Notes

(Governance) Act, which came into effect in April 2018, to formalise the data sharing framework between public sector agencies. The act makes clear that public sector agencies may share data with each other for seven specific purposes. Among these purposes are improving the efficiency or effectiveness of policy planning and service delivery, but this would not overcome confidentiality obligations set out in legislation or contracts. The act also includes safeguards for data protection, including setting out criminal penalties for those who make use of data to benefit themselves, re-identify anonymised data without authorisation and public sector officers who disclose the personal data of Singaporeans without authorisation.
20. The framework includes a Data Ethics Workbook with questions to probe ethical, information assurance and methodological considerations when building or buying new technology.
21. These include a database, geodatabase, shape-file, coverage, raster image or dbf table.
22. The AI section proposes to conclude contracts along with “Exploratory Multi-phased” AI development processes, which consists of assessment, proof of concept, development and retraining.
23. To support the interoperability of ticketing and payment system APIs, the Lippu Network was established.
24. Directive 95/46/EC of the European Parliament and of the Council of 24 October 1995 on the protection of individuals with regard to the processing of personal data and on the free movement of such data (OJ L 281, 23.11.1995), Art. 12.
25. Treasury Laws Amendment (Consumer Data Right) Act 2019 (Cth).
26. “Small business” is defined in the Privacy Act 1988 (Cth) as follows: “[a] business is a small business … in a financial year … if its annual turnover for the previous financial year is $3,000,000 or less”, with some exceptions (see section 6D).
27. The alert can provide details about the infected person’s age, gender and a detailed log of their movements – even about the time and names of businesses visited.
28. Functioning in the same way as the TraceTogether app, the TraceTogether Token uses Bluetooth signals to record other nearby TraceTogether apps or tokens. By increasing the overall pool of participants, every user of the app or token would benefit by being informed as early as possible, if/when they have been exposed to COVID-19.
153OECD DIGITAL ECONOMY OUTLOOK 2020 © OECD 2020
5. ENHANCING DATA ACCESS, SHARING AND RE-USE 5. ENHANCING DATA ACCESS, SHARING AND RE-USE
References and Notes


Chapter 6PRIVACY AND DATA PROTECTION
155OECD DIGITAL ECONOMY OUTLOOK 2020 © OECD 2020

KEY FINDINGS
�� All 29 countries that responded to the OECD’s 2019 Privacy Guidelines Questionnaire have in place some form of legislation for privacy and personal data protection. Of these, 17 reported their main privacy legislation was adopted after 2013. In addition, 10 countries reported they are revising their privacy and data protection legislation, and eight countries reported plans for revisions.
�� Timely, secure and reliable data access and sharing – within and outside borders – is critical to understanding COVID-19 and its spread, enhance government policies and foster global co-operation in the development and distribution of a vaccine.
�� Global sharing and collaboration of research data have reached unprecedented levels. Clinical, and epidemiological and laboratory data about COVID-19, are today widely available. Similar efforts may also be needed for other types of data.
�� Many governments have passed or are about to pass laws specifying how data collection will be restricted to a certain population, for what time and for what purpose.
�� Privacy frameworks generally facilitate data sharing in the interests of national and public security, including public health and welfare. However, countries have not always embraced these frameworks.
�� Privacy enforcement authorities across much of the OECD have endorsed a pragmatic and contextual approach to data sharing, including discretion in enforcement. Many jurisdictions are also issuing guidance on the collection, processing and sharing of personal data to support COVID-19 contact tracing and other response measures. Use of privacy-enhancing solutions such as homomorphic encryption and data sandboxes may add protection.
IntroductionIn recent years, the generation and sharing of personal data have increased. This has been driven by, and in turn contributed to, changes in organisational practices and the data-sharing behaviours of individuals. This chapter delves into recent trends and challenges in privacy and personal data protection, and analyses evolving national and international regulatory and policy responses.
With the rapid emergence of data-rich technologies such as artificial intelligence (AI), the Internet of Things (IoT) and big data analytics, it is increasingly clear that trust remains a critical factor in the digital transformation of economies and societies (OECD, 2015[1]). Individuals and organisations must feel confident their privacy is respected to take advantage of the benefits arising from technological developments.
However, fuelled by high-profile data breaches such as in Cambridge Analytica, individuals are increasingly concerned about digital risks. This is particularly true with respect to the expanded uses of their personal data. These concerns can pose a serious barrier to the adoption of digital technologies and applications (OECD, 2017[2]).
There is strong evidence that governments are responding to the challenges. Over the past two years, countries around the world have developed significant regulations. In particular, the number of international, regional and national privacy and data protection frameworks enacted or amended since 2013 has increased substantially. All 29 countries that responded to the OECD’s 2019 Privacy Guidelines Questionnaire have in place some form of legislation for privacy and personal data protection. Of these, 17 reported their main privacy legislation was adopted after 2013. In addition, 10 countries reported they are revising their privacy and data protection legislation, and eight countries reported plans for revisions. Countries consider that catching up with technological developments – particularly AI and big data analytics – is the biggest challenge they face with regard to those frameworks.
Countries’ attention is now shifting towards strengthening compliance with, and enforcement of, privacy and data protection frameworks. In particular, governments are investing in policy measures
156 OECD DIGITAL ECONOMY OUTLOOK 2020 © OECD 2020
6. PRIVACY AND DATA PROTECTION 6. PRIVACY AND DATA PROTECTION

to enhance awareness of the frameworks and what they require of organisations that collect, process and share personal data. There is also growing emphasis on promoting the accountability of data controllers, and engaging in international enforcement co-operation.
Recent legal and policy responses recognise that children are particularly vulnerable in the digital environment. As such, they merit special protection in regard to their privacy and personal data. The disproportionate risk faced by children in the digital environment will likely only become more evident with time, and policy makers will have to respond accordingly.
The proliferation of frameworks presents its own challenges, such as the uncertainty that occurs when frameworks conflict. However, clear rules, guidance and levels of compliance could markedly improve overall trust in the digital economy. Efforts to increase the interoperability of privacy frameworks will likely be a positive step to enhance trust in data flows and ensure benefits from technological developments.
The COVID-19 crisis has been an important reminder of why such data flows are critical. Timely, secure and reliable data access and sharing – within and outside borders – can help understand the virus and its spread, enhance government policies and foster global co-operation in the development and distribution of a vaccine.
Data, privacy and the fight against the COVID-19 pandemicAt the time of publication, the gravity of COVID-19 had taken form in the collective minds of governments and policy makers, businesses and individuals. Timely, secure and reliable data access and sharing – within and outside borders – is critical to understanding the virus and its spread. It can also improve the effectiveness of government policies and foster global co-operation in the race to develop and distribute a vaccine. In particular, lessons from previous outbreaks have underscored the importance of data concerning the spread of virus infections. This includes the location and number of new confirmed cases, rates of recoveries and deaths, and the source of new cases (international arrivals or community transmission).
Knowing how a virus mutates as it moves through a population is also vital. Such information can help policy makers understand possible changes in disease severity or transmissibility, its amenity to diagnosis and its responsiveness to vaccine. In addition, accurate information on population movements helps monitor the progression of an outbreak and predict its spread, set priorities for interventions and design effective containment strategies. Armed with these data, governments are rapidly introducing a wide range of measures to contain outbreaks, protect the vulnerable and limit community transmission.
In the current global health emergency, scientific discovery has progressed much more rapidly than before. Barely a month after the first patient was admitted into Wuhan hospital, researchers shared the full genome of COVID-19 as an open-access publication. Full viral genome sequences were released through public access platforms, leading to polymerase chain reaction assay protocols. These made it possible to accurately diagnose infections early during the pandemic.
Global sharing and collaboration of research data have reached unprecedented levels. Clinical, and epidemiological and laboratory data about COVID-19 are widely available. However, similar efforts may also be needed for other types of data.
Privacy frameworks generally facilitate data sharing in the interests of national and public security, including public health and welfare. These include the 1980 OECD Guidelines governing the Protection of Privacy and Transborder Flows of Personal Data (Privacy Guidelines).
More recent OECD work suggests countries have not always taken up these frameworks. Few countries have policy initiatives to facilitate data sharing within the private sector. Even fewer have data governance frameworks to support such extraordinary data collection and sharing measures in ways that are fast, secure, trustworthy, scalable and in compliance with the relevant privacy and data protection regulations (OECD, 2019[3]).
157OECD DIGITAL ECONOMY OUTLOOK 2020 © OECD 2020
6. PRIVACY AND DATA PROTECTION 6. PRIVACY AND DATA PROTECTION
Many countries have recently sought advice from privacy enforcement authorities (PEAs), private-sector law firms, civil society, academics and other actors. They want to ensure their actions are necessary and proportionate, and that they fully understand their potential implications. Many governments have passed or are about to pass laws specifying how data collection will be restricted to a certain population, for what time and for what purpose.
PEAs across many OECD countries have generally endorsed a pragmatic and contextual approach, including discretion in enforcement. They point out that respect for fundamental data protection and privacy principles does not stand in the way of necessary and proportionate frontline responses to COVID-19.
Additionally, PEAs in many jurisdictions are issuing advisory guidance on the collection, processing and sharing of personal data to support COVID-19 contact tracing and other response measures. Much of this guidance relates to how privacy-by-design features can be incorporated into “track and trace” applications to ensure that personal data collected are protected.
The European Data Protection Board and the Council of Europe have released similar statements. These explain that the General Data Protection Regulation (GDPR) and Convention 108 do not hinder measures taken in the fight against the pandemic. Further, they require that emergency restrictions on freedoms be proportionate and limited to the emergency period (Council of Europe, 2020[4]; EDPB, 2020[5]). Indeed, many data governance and privacy frameworks expressly permit data processing for legitimate public interests, including public health, provided necessary safeguards are maintained.
The use of privacy-enhancing solutions may add protection (OECD, 2019[3]). These can include homomorphic encryption, which allows processing of encrypted data without revealing its embedded information. They also include data sandboxes that grant access to highly sensitive (personal) data within a restricted digital and/or physical environment to trusted users.
Technological developments and implications for privacyThe advancement of computing capabilities and the increased availability of storage have fuelled widespread adoption of Internet and personal computing devices. This, in turn, has increased the creation of data and the possibility for its analysis. Data have never been so prevalent: the volume of data produced globally is forecast to grow from 33 to 175 zettabytes over 2018-25, a compounded annual growth rate of 61% (European Commission, 2020[6]).
Increasingly, organisations and individuals are using third-party cloud-based data storage services that may be located outside their country. Data processing and analytical software have also become increasingly powerful, sophisticated, ubiquitous and inexpensive, making information easily searchable, linkable and traceable. This means that personal data are both more valuable and more likely to have unanticipated uses, increasing the incentive to collect and store them. Emerging technologies, particularly AI and IoT, are a compelling demonstration of these interdependencies. They are generally based on the abundance of data, and the gathering, linking and processing of that data, which increases their value.
This increase in the generation and sharing of personal data has been driven by, and in turn contributed to, related changes in organisations’ practices and individuals’ data-sharing behaviours. Individuals, knowingly or not, share more personal data today than ever. For their part, a growing number of entities such as online retailers, Internet service providers, financial service providers and governments is increasingly collecting vast amounts of personal data, usually spanning a wide range of economic and social activities (OECD, 2015[1]). For an increasing number of companies, the very use of personal data – whether for sale to third parties, advertising or for tailoring their own services – is a core element of their business model. This, in turn, leads to a rise in the value of personal data (“personal data as resource or commodity”). Similarly, the value rises for the generation and processing of data; the use of technologies that link datasets and extract further value from them; and transborder data flows.
158 OECD DIGITAL ECONOMY OUTLOOK 2020 © OECD 2020
6. PRIVACY AND DATA PROTECTION 6. PRIVACY AND DATA PROTECTION

Countries consider that catching up with technological developments is the main challenge to their privacy and data protection regulatory frameworks
In 2019, countries reported that catching up with technological developments was the main challenge to their privacy and data protection regulatory framework. They identified related challenges of “business models of online platforms” and the “need for technical knowledge” as the next most pressing challenges (Figure 6.1).
Figure 6.1. Main challenges to regulatory frameworks, 2019
0
30
25
20
5
15
10
Number of countries
Catchin
g up w
ith
techn
ologic
al
deve
lopmen
ts
Busine
ss mod
els of
onlin
e plat
forms
Need f
or tec
hnica
l
know
ledge
Catchin
g up w
ith re
gulat
ory
deve
lopmen
ts
Determ
ining
who
are t
he da
ta
contr
ollers
and p
roces
sors
Lack o
f or o
bsole
te reg
ulatio
n
Acces
s to d
ata fo
r nati
onal-
secu
rity
or law
-enfor
cemen
t purp
oses
Lack o
f co-o
perat
ion w
ith
other
regula
tors
Determ
ining
whe
n data
are pe
rsona
l data
Other
Source: 2019 OECD Privacy Guidelines Questionnaire.12 https://doi.org/10.1787/888934192167
The 2019 OECD Privacy Guidelines Questionnaire1 provided much insight into privacy questions. With respect to technological developments posing the biggest challenges to privacy and personal data protection, over 80% of 29 countries mentioned AI and big data analytics, followed closely by the IoT and biometrics (Figure 6.2). Facial recognition and FinTech (particularly new payment methods such as Libra) were mentioned in comments. With respect to challenges related to emerging technologies, all but two respondents noted ethical issues, including bias and discrimination, as a main concern. The increasing risk of re-identification and the use of personal data with societal implications (such as targeted online advertising campaigns) followed as the next most pressing concerns.
Figure 6.2. Emerging technologies that pose the main challenges for privacy and personal data protection, 2019
0
30
25
20
5
15
10
Number of countries
Artificial intelligence Big data analytics Internet of Things Biometrics Cloud computing Blockchain Other
Source: 2019 OECD Privacy Guidelines Questionnaire.12 https://doi.org/10.1787/888934192186
159OECD DIGITAL ECONOMY OUTLOOK 2020 © OECD 2020
6. PRIVACY AND DATA PROTECTION 6. PRIVACY AND DATA PROTECTION

Big data analytics and AI pose challenges to privacy frameworks in part because of the wealth of data they generally require. With technological advances to date, they can increasingly identify specific individuals and reveal sensitive personal information (including when paired with other information). This means the data supporting these technologies increasingly fall within the ambit of privacy frameworks. These generally apply to information relating to an identified or identifiable individual (data subject). Applying frameworks to masses of data can become unwieldy without clear guidance, co-operation and communication.
There is a movement underway concerning the development and use of privacy-respecting and privacy-enhancing technologies. These could increase compliance with privacy frameworks and foster trust in digital society, organisations and specific technologies. Numerous privacy-enhancing tools for online and mobile protection exist. These include “small data” AI, anonymisation, anti-tracking, encryption, hashing, secure file sharing and secure communication tools. Efficient privacy-enhancing approaches often combine one or more advanced technologies such as synthetic data, homomorphic encryption, blockchain or differential privacy. Still, more work can be done in several areas. Policy makers need to evaluate the relative strengths and weaknesses of these technologies. They need to develop new ones or improve effectiveness of existing ones. Finally, they need to better understand barriers to their deployment and adoption in the online global marketplace.
Privacy and data protection concerns
The number and severity of data breaches, including high-profile cases, has risenTechnological advancement goes hand in hand with increased global data flows. Data are more valuable (and “big data” especially so), thus increasing incentives to share them, including across borders. Moreover, it is increasingly faster and cheaper to do so. However, as the quantity of data collected and stored increases, so too does the prevalence of data breaches. Such breaches can result from accidents, malicious hacking, unauthorised access or disclosure, phishing and denial-of-service attacks.
Between 2018 and 2019, over 89 000 data breaches were registered in the European Union (EU), representing an increase of 20% from 2015 (EDPB, 2019[7]). It is likely, however, that the GDPR’s mandatory data breach reporting requirement contributed to this substantial increase.
In recent years, the private sector has been involved in high-profile data breaches. In October 2018, Facebook was fined GBP 500 000, the maximum fine possible by the Information Commissioner’s Office of the United Kingdom. It was charged for “unfairly process[ing] personal data” and “fail[ing] to take appropriate technical and organisational measures against unauthorised or unlawful processing of personal data” (Information Commissioner’s Office, 2018[8]). This incident involved more than 87 million personal records that were unlawfully used by Cambridge Analytica (Granville, 2018[9]; Graham-Harrison and Cadwalladr, 2018[10]; Hern and Pegg, 2018[11]).
Data breaches are not limited to data held by the private sector. In 2015, for example, more than 21 million records stored by the US Office of Personnel Management were stolen, including 5.6 million fingerprints. The same year, a breach in the Japanese Pension Service affected 1.25 million people (Otaka, 2015[12]).
Data breaches violate the privacy of individuals concerned (leading possibly to identity theft), and can also cause significant economic losses to affected organisations. A 2019 IBM study indicated the cost of a data breach had risen 12% over the previous five years and costs USD 3.92 million on average per organisation. The report also revealed that organisations feel the effects of a data breach for years (IBM Security, 2019[13]).
Individuals are increasingly concerned about the use of their personal data The increasing prevalence and cost of data breaches have contributed to changing public awareness and perceptions of the importance of privacy. Public perception studies in the last few years suggest that individuals are increasingly concerned about the use and protection of their personal data. Indeed, these concerns may prevent many people from going on line.
160 OECD DIGITAL ECONOMY OUTLOOK 2020 © OECD 2020
6. PRIVACY AND DATA PROTECTION 6. PRIVACY AND DATA PROTECTION

This trend towards greater concern about use of personal data is particularly apparent in studies that followed the 2018 Cambridge Analytica data breach. Half of the countries responding to the 2019 OECD Privacy Guidelines Questionnaire said they conduct surveys or otherwise regularly gather and analyse data from individuals on their public perception of privacy and personal data mechanisms. Figure 6.3 depicts the findings from surveys in two respondents to the OECD questionnaire. In Canada, the percentage of individuals “extremely concerned” about the protection of their personal privacy grew from 25% to 37% between 2012 and 2018; only 8% of individuals were not concerned at all (OPC, 2019[14]). In New Zealand, more than half of all New Zealanders are more concerned about their privacy than they were in 2012. Separately, in the United States, most Americans reported they are concerned by how companies and the government use their data (Auxier et al., 2019[15]). Indeed, 81% of Americans believe their potential risks from data collection by companies outweigh the benefits (Auxier et al. 2019[15]).
Figure 6.3. Sample of privacy enforcement authority public surveys, 2012-18Percentage of individuals concerned about protecting personal privacy
40
45
50
55
60
65
70%
2012 2014 2016 2018
New ZealandCanada
Sources: 2018-19 Survey of Canadians on Privacy, www.priv.gc.ca/en/opc-actions-and-decisions/research/explore-privacy-research/2019/por_2019_ca/#fig03; New Zealand Privacy Survey 2018 www.privacy.org.nz/news-and-publications/surveys/privacy-survey-2018 (accessed on 31 March 2020).
12 https://doi.org/10.1787/888934192205
In the European Union, in all but four countries at least half of all respondents to a survey were concerned about lacking complete control over information provided on line (European Commission, 2019, p. 40[17]). In 2019, Eurostat reported that 44% of EU citizens aged 16 to 74 claimed to have limited their private Internet activities in the previous 12 months due to security concerns. The survey asked individuals about potential security-related issues when accessing the Internet on any connected device, such as a desktop, laptop, tablet or smartphone. Due to security concerns, people appeared to have mostly avoided providing personal information to social or professional networking services (25% of those surveyed). These security concerns also reportedly limited or prevented 19% of people from using public Wi-Fi and 17% from downloading software, apps, music, video files, games or other files. Meanwhile, 16% and 13%, respectively, reported avoiding online shopping and Internet banking (IDC and Lisbon Council, 2018[18]). The results are based on self-reporting and may suffer from various biases.
In Australia, a government survey revealed that 69% of citizens were more concerned about their privacy in 2017 compared to 2012. Most reported concerns about their privacy in the digital environment (Australian Government, 2017[19]).
The privacy concerns of individuals may be partly related to confusion about their rights and ability to give fully informed, specific consent before their personal data are collected, processed and shared. The processing of personal data is becoming more complex and has more unanticipated uses, particularly in the case of AI. As it does, those activities become less transparent to users and more difficult to understand.
The same is true for IoT devices, whose ubiquity and discreteness can mask how they are constantly gathering data. Indeed, often people have no easy way to set preferences for how these technologies gather personal data. Consent is evidently more difficult to give when personal data can be used in unanticipated ways, or where processing is less transparent and more complex.
161OECD DIGITAL ECONOMY OUTLOOK 2020 © OECD 2020
6. PRIVACY AND DATA PROTECTION 6. PRIVACY AND DATA PROTECTION
In this context, increased disclosure to individuals about an organisation’s privacy practices and personal data usage may not always compensate for the information asymmetry. Facing arcane and legalistic explanations, many individuals cannot choose or consent meaningfully or even simply grasp how personal data are used. The choice is even less meaningful when users must accept the “terms of use” to use the service. Added to this, data subjects are not always immediately concerned about protecting their data. Nor are they always willing to make sense of different consents when they need or want to access a particular product or service quickly (consent fatigue). As a result, the problems associated with relying on consent as a legitimate basis for the collection, processing and sharing of personal data will likely become more apparent over the next few years. Policy makers will have to respond accordingly.
There is also increased concern regarding the protection of children’s privacy in the digital environmentDue to the increase in time spent in the digital environment and from a wide range of devices, privacy has also become a central issue for children. Children are part of all kinds of databases, and subject to the data economy irrespective of whether they are active users. Their activities are the focus of commercial interests, as well as a multitude of monitoring and data-generating processes.
Children’s personal information and their data go beyond what they knowingly share. Information can also be gleaned from their actions or even from disclosures that parents and friends may make on line. These disclosures may follow children into their adulthood. The unlawful collection of data can lead to privacy violations; disclosure or inappropriate use can lead to harmful and (in a number of cases) irreversible consequences for the child.
Children have a fluid understanding of their privacy, which reflects the complexity of the digital ecosystem (OECD, 2019[20]). As children do not have fully developed cognitive abilities, their lack of experience and limited awareness of privacy risks make it difficult for them to protect their personal data, manage privacy settings and understand complicated privacy policies. As children grow, however, they tend to care a lot more about their privacy than parents or caregivers would assume. Yet, in many cases, children are still generally not consulted on this issue. Evolving trends, such as multiplication of social media accounts, can greatly affect children’s privacy. The same is true for technological advancements like AI, IoT, cloud computing and facial recognition. Children’s own actions can also influence the privacy of third parties, including in cases when they post pictures or information about other children.
Researchers at the London School of Economics and Political Science noted the importance of distinguishing between three types of data (Livingstone, Stoilova and Nandagiri, 2018[21]). These can summarise how children of different ages understand the impacts of their online activities on their privacy:
● “Data given”: data provided by individuals (about themselves or about others), usually knowingly though not necessarily intentionally while they are on line.
● “Data traces”: data left by participation on line (usually without the user`s knowledge) and captured via data-tracking technologies such as web, beacons or device browser fingerprinting, cookies, location data and other metadata.
● “Inferred data”: data derived from analysing data traces and data given, frequently by algorithms (also referred to as “profiling”). These can also be combined with other data sources (Livingstone, Stoilova and Nandagiri, 2018[21]).
Research reveals that children are aware they may have contributed data about themselves or about third parties as a result of their actions in the digital environment. However, the extent to which they will understand the consequences for their privacy will depend on their age, maturity and individual circumstances and their understanding of interpersonal relationships (OECD, 2019[22]).
Children are aware of “data given”, particularly in interpersonal contexts. For example, they may share data themselves or are aware that their friends and family do, too. In such cases, children most likely consciously decide whether and with whom they are choosing to share data (Hof, 2017[23]).
Children are becoming increasingly aware of the commercial uses of “data traces”. However, their understanding of “inferred data” and its value to businesses relies on their comprehension of business
162 OECD DIGITAL ECONOMY OUTLOOK 2020 © OECD 2020
6. PRIVACY AND DATA PROTECTION 6. PRIVACY AND DATA PROTECTION

models in institutional and commercial contexts (Livingstone, Stoilova and Nandagiri, 2018[21]). They are rarely educated about such issues.
At the same time, commercial uses of children’s data are becoming a more visible concern. The privacy risks of connected smart toys and apps designed for, and targeted towards, children create more opportunities for the collection and use of children’s data. In many cases, this type of activity conflicts with measures designed to protect children’s privacy (Norwegian Consumer Council, 2017[24]; Irwin Reyes et al., 2018[25]).
New regulations under international, regional and national frameworks for cross-border data flows, privacy and personal data protection
Over the past two years, a number of significant regulatory developments have taken place worldwide. On 25 May 2018, for example, the European Union’s GDPR entered into force (European Union, 2016[26]). By replacing the Data Protection Directive (European Union, 1995[27]), the GDPR introduced new rules governing the collection, processing and free flow of personal data regarding data subjects in the European Union.
The GDPR champions data subject rights. When data originating in EU member states are transferred abroad, the GDPR ensures that personal data protections travel with them. This is made possible through the use of different tools, some of which pre-dated the GDPR. These include “adequacy decisions” in respect of recipients and when “appropriate safeguards” are in place for the data (such as model clauses, binding corporate rules, codes of conduct and certification). The GDPR aims to ensure a consistent and high level of protection and remove obstacles to the free flow of data within the Union (European Union, 2016[26]).
Further, the Council of Europe has recently engaged in an extensive review and revision of its 1985 Convention for the Protection of Individuals with regard to Automatic Processing of Personal Data (Convention 108) (Council of Europe, 1981[28]). The Convention generally permits or encourages transborder personal data flows when privacy is protected. It provides that Parties shall not prohibit or limit the transfer of personal data to a recipient who is subject to the jurisdiction of another Party to the Convention. The Convention further provides that transfers to recipients in states not parties to the Convention may generally only take place with an appropriate level of protection (Council of Europe, 1981[28]). In October 2018, a Protocol to amend Convention 108 opened for signature. The amendments are designed to ensure the Convention applies to new information and communications technologies, and to strengthen its implementation. The modernised instrument, Convention 108+, will enter into force in October 2023.
The OECD is also reviewing implementation of the 2013 revisions to the 1980 OECD Privacy Guidelines (OECD, 2013[36]). The guidelines are intended as minimum standards for adoption in domestic legislation regarding the protection of personal data, and have influenced legislation and policy in OECD countries and beyond. However, the 2013 review process identified profound changes of scale. These related to the role of personal data in economies, societies and daily lives since 1980. The current review aims to monitor implementation of the 2013 guidelines, identify gaps and suggest possible next steps to ensure the guidelines remain relevant.
More trade agreements and other frameworks that seek to promote trust in transborder flows of personal data have also been approved. These contribute to the complexity of the legal landscape in which countries, organisations and other bodies are transferring personal data across borders. These instruments sit alongside others that continue to shape privacy and global data transfers. The EU-US Privacy Shield Framework, for example, facilitates the transfer of personal data from the European Union to certified companies in the United States to support transatlantic commerce. Other agreements and frameworks include the Asia-Pacific Economic Cooperation (APEC) Privacy Framework,2 the African Union Convention on Cyber Security and Personal Data Protection, and the Supplementary Act on Personal Data Protection within the Economic Community of West African States. In addition, the G20 Leader’s Declaration in Osaka in June 2019 provides that domestic and international legal frameworks should be respected to facilitate data flows and strengthen consumer and business trust. In this way, it can help industry harness opportunities of the digital economy.
163OECD DIGITAL ECONOMY OUTLOOK 2020 © OECD 2020
6. PRIVACY AND DATA PROTECTION 6. PRIVACY AND DATA PROTECTION

Significant challenges to transborder data flows are associated with recent international and regional developments
Over 86% of respondents to the 2019 OECD Privacy Guidelines Questionnaire are Parties to at least one multilateral agreement or legal framework that defines or overcomes legitimate restrictions on transborder flows of personal data. Those agreements and frameworks included the GDPR, Convention 108, the APEC Privacy Framework and the Privacy Shield. These evolving regulatory developments indicate that countries are adapting to the challenges posed by increased transborder data flows. However, they have also produced a degree of uncertainty as governments, organisations and individuals try to adapt. Countries are reporting that greater privacy interoperability is needed to reap the benefits from technological developments and transborder data flows.
Indeed, in identifying the main challenges to transborder data flows, questionnaire respondents most often noted uncertainty regarding legal privacy regimes. This was followed by incompatibility of legal regimes (Figure 6.4). One country, for example, had challenges stemming from the uncertainty of PEAs in the European Union about sharing information with authorities outside the Union. Other popular responses from countries with respect to challenges include time and resources required to enable transborder data flows and recent trends in favour of data localisation.
Figure 6.4. Main challenges to transborder data flows, 2019
02
20
1618
46
1214
810
Number of countries
Uncertaintyregarding legalprivacy regimes
Incompatibilityof legal regimes
Time andresourcesrequired
Data localisationtrends
Need to involveother authorities
Insufficientco-operation
Other
Source: 2019 OECD Privacy Guidelines Questionnaire.12 https://doi.org/10.1787/888934192224
National regulatory activity relating to privacy and personal data protection has increased markedly At a national level, an increasing number of countries around the world (including OECD countries) are putting in place modern data protection frameworks and policies. These combine openness for international data flows with safeguards ensuring the highest level of privacy and data protection for individuals. Many governments have been introducing and modifying data-related policies. They aim to adapt policies to the digital age, place conditions on the transfer of data across borders or require that data be stored locally (OECD, 2019[29]).
Additionally, all 29 countries that responded to the OECD’s 2019 Privacy Guidelines Questionnaire have some form of legislation for privacy and personal data protection. Of these, 17 reported adopting their main privacy legislation after 2013. Ten countries reported they are revising their privacy and data protection legislation, while eight reported plans for revisions. This activity reflects countries’ attempts to adapt their national legislative frameworks to developments in the privacy landscape.
In enacting or revising privacy legislation, all countries but one clearly consider regulatory developments at the international level. This includes the OECD Privacy Guidelines, GDPR, APEC Privacy Framework or the Council of Europe’s Convention 108. Notwithstanding, countries noted the challenge of understanding how privacy laws apply to emerging technologies, such as AI, and their impact on consumers. To deal with these challenges, countries are developing dedicated regulation and guidance.
164 OECD DIGITAL ECONOMY OUTLOOK 2020 © OECD 2020
6. PRIVACY AND DATA PROTECTION 6. PRIVACY AND DATA PROTECTION

Table 6.1. Amendments to countries’ privacy and data protection legislation
Country Revised since 2013Under revision
(Nov 2019-Feb 2020)Planned revision
Australia
Brazil
Canada (public sector)
Canada (private sector)
Chile
Colombia
Denmark
Estonia
Finland
France
Iceland
Israel
Italy
Japan
Korea
Latvia Do not know Do not know
Lithuania
Luxembourg
Mexico Do not know
New Zealand
Norway
Portugal
Singapore
Slovak Republic Do not know
Slovenia
Switzerland
Thailand
Turkey
United Kingdom
United States
Source: 2019 OECD Privacy Guidelines Questionnaire.
Just over half of the respondents to the 2019 OECD Privacy Guidelines Questionnaire reported additional laws or regulations in place or under development, or plan to revise privacy legislation. Other key actions reported were strengthening privacy and personal data protection in the context of social media and online platforms (eight respondents), emerging technologies (seven respondents) and targeted advertising or pricing (seven respondents).
Countries are also employing, developing or considering the development of measures for regulatory innovation in the context of emerging technologies. Most commonly (25%), they are using regulatory sandboxes and experimentation. Other measures reported include development of international standards for specific technologies (such as blockchain), a Digital Charter, a privacy research grants programme and an AI auditing framework.
Some national privacy developments are particularly notable. The California Consumer Privacy Act (CCPA), enacted in 2018 and effective since 1 January 2020, creates new consumer rights for the collection, processing, retention and sharing of personal data (OAG, 2020[30]). It has prompted a fundamental re-thinking of privacy rights in the United States, which does not have comprehensive or overarching federal privacy law. Businesses subject to the CCPA are bound by strict new requirements. For example,
165OECD DIGITAL ECONOMY OUTLOOK 2020 © OECD 2020
6. PRIVACY AND DATA PROTECTION 6. PRIVACY AND DATA PROTECTION

they are obliged to provide notice to consumers at or before data collection, respond to consumer requests, disclose financial incentives offered in exchange for personal information and maintain detailed records.
Brazil also enacted a General Data Protection Law in 2018 (Lei Geral de Proteção de Dados Pessoais, LGPD). Initially developed by the Ministry of Justice and Public Security, the LGPD underwent extensive public consultation with stakeholders from civil society, academia and the business community over seven years. The law creates a new framework for online and offline personal data applicable to the public and private sectors. It has a strong focus on individual rights, including the right to access data, rectification, explanation and data portability. However, it was also designed to create greater consistency and uniformity regarding data protection and data processing. To that end, it covers international data transfers and mandatory data breach notification requirements. Like the GDPR, the law has extraterritorial reach. As such, organisations based outside of Brazil must comply with the law if they are processing the personal data of Brazilian citizens.
In India, long-awaited national data protection legislation is before parliament. Like the GDPR, it aims to protect the privacy of individuals relating to their personal data. It also confers certain rights on data subjects, including the right to be forgotten and the right to data portability. It also creates rules for cross-border transfers and establishes a Data Protection Authority of India. Yet the legislation has been criticised for exempting government agencies. In an example of data localisation, it also requires sensitive personal information to be stored on servers located in India.
Countries tend to have provisions in their national legislation regulating the free flow of data Responses to the 2019 OECD Privacy Guidelines Questionnaire suggest that countries generally enable the free flow of personal data across borders when safeguards protect the privacy of persons whose personal data are being transferred. Countries also reported having various mechanisms to promote transborder flows. These include consultations, workshops and participation in international fora (such as entering into trade agreements).
Nevertheless, over 73% of respondents said provisions in their privacy and personal data legislation restrict transborder data flows. Some countries were referring to the GDPR, which has strengthened the rules governing transfers of personal data regarding data subjects who are in the European Union. Others have enacted their own frameworks to regulate data flows, some of which are still evolving. Some 40% of respondents added they have provisions in their regulatory framework concerning data localisation (Figure 6.5). In some of these countries, only specific types of personal data were subject to a localisation requirement. These include, for example, health records, national archives or data relevant to national security.
Figure 6.5. Countries with provisions requiring some form of data localisation in their regulatory framework, 2019
11
18
Yes No
Source: 2019 OECD Privacy Guidelines Questionnaire.12 https://doi.org/10.1787/888934192243
166 OECD DIGITAL ECONOMY OUTLOOK 2020 © OECD 2020
6. PRIVACY AND DATA PROTECTION 6. PRIVACY AND DATA PROTECTION

Additionally, in the case of 11 respondents, organisations are required to report on transborder flows of personal data. The content of these requirements, however, varies. For example, organisations in one country must report all data transfers (regardless of where the data are being transferred). Organisations subject to the GDPR, conversely, must report to and obtain permission from supervisory authorities for data transfers to non-EU countries under certain circumstances. It is an additional burden for data controllers to demonstrate compliance with data protection rules. The authorisation for personal data transfers abroad depends on different factors such as reciprocity, national personal data protection law limitations (including non-EU countries) and so on.
Yet few countries have a national privacy strategy or whole-of-government approach to privacy The 2013 revision of the OECD Privacy Guidelines (OECD, 2013[36]) calls on governments to “develop national privacy strategies that reflect a co-ordinated approach across governmental bodies.” The importance of such strategies has also been stressed in the 2016 OECD Ministerial Declaration on the Digital Economy (Cancún Declaration) and in the Digital Economy Ministerial Declaration of the G20 Ministerial adopted in April 2017. The prevalence of national privacy strategies and their components was explored in depth in OECD (2018[37]), which concludes that most countries did not have national privacy strategies. However, countries also understood the term in different ways, and did have some basic elements in place (OECD, 2017[2]).
The findings from the 2019 OECD Privacy Guidelines Questionnaire underscore these findings, focusing on the whole-of-government approach. Just under half of the 29 respondents reported a national privacy strategy or whole-of-government approach to privacy (Figure 6.6). Of those countries, only four positively stated they have a national privacy strategy. Other countries noted alternative means of whole-of-government co-ordination, such as through legislation, the privacy enforcement authority or other dedicated entity or forum, or other policy instruments. Respondents also described several other co-ordination mechanisms. These included a joint statement of PEAs in the country to improve co-ordination of complaint handling and enforcement, as well as model clauses for ordinances on the protection of personal information.
Figure 6.6. Countries with a national strategy for privacy or a whole-of-government approach to it, 2019
1412
3
Yes No Do not know
Note: Of the countries that responded “yes”, four had a national strategy for privacy and the remaining ten adopted a whole-of-government approach to privacy.
Source: 2019 OECD Privacy Guidelines Questionnaire.12 https://doi.org/10.1787/888934192262
Countries are adopting policy measures tailored to specific emerging technologies Legislation and regulation are often the primary response to privacy and data protection in emerging technologies. However, with the progressive digitalisation of the economy and society, legal protection is increasingly recognised as only one element in the toolkit. Policy measures are also needed ranging from education and innovation to self-regulation. In addition to regulatory reforms and innovation,
167OECD DIGITAL ECONOMY OUTLOOK 2020 © OECD 2020
6. PRIVACY AND DATA PROTECTION 6. PRIVACY AND DATA PROTECTION
countries are thus developing new data governance frameworks, creating new bodies or institutions, and offering guidance on specific technologies.
● New frameworks. Twelve countries responding to the 2019 OECD Privacy Guidelines questionnaire reported they are addressing, or are planning to address, technological challenges through new national data governance frameworks. For example, they are setting additional norms on the management of the availability, accessibility, usability, quality, interoperability and ownership of the data collected, processed and stored. Nine of those 12 countries have or are developing sector-specific data strategies or a national data strategy. Respondents had different perceptions of what data governance frameworks encompass. Some had a more limited scope, such as Notifiable Data Breach schemes and frameworks for specific technologies including AI.3 Others had more holistic approaches such as national data strategies and Digital Charters.
● New bodies or institutions. Just over a quarter of the respondents reported establishing new institutions, bodies or centres to address the privacy and data protection challenges posed by technology. For example, the United Kingdom recently established a Centre for Data Ethics and Innovation. It identifies ethical issues raised by emerging technologies, agrees on best practices around data use and develops potential new regulations to “build trust and enable innovation in data-driven technologies” (UK Department for Digital, Culture, Media & Sport, 2018[31]). Singapore, Canada and Slovenia have recently established AI advisory councils, research centres or institutes to advise their governments on issues that arise from AI and may require policy intervention.
● Guidance on specific technologies. Most respondents reported having issued guidance on technology-related aspects of privacy and personal data protection. This included privacy or data protection impact assessments, targeted advertising, AI, IoT and app development. Certain countries also mentioned areas for guidance such as data analytics, connected cars, data protection by design, direct-to-consumer genetic testing, smart cities and drones, blockchain and data sharing.
Countries are protecting children’s privacy in the digital environment through legislation and policyData protection and privacy legislation provides for a variety of ways to protect individuals’ – including children’s – right to privacy. Countries are striving to provide additional and complementary policy responses to enhance the protection of children’s privacy (OECD, 2019[22]). At the domestic level, in response to a 2017 OECD survey, almost all countries reported their privacy laws include specific provisions regarding the protection of children.
The entry into force of the GDPR is an important development for children’s privacy at the international and regional level. It recognises that children merit special protection in regard to their personal data, particularly in relation to marketing and the collection of data. The GDPR states that children should be able to understand any communication and information addressed to them. It also grants data subjects the right to request erasure of their personal data (the “right to be forgotten”). This can be an especially important right for children, given their digital identity is increasingly cultivated from a very young age.
The European Union’s Audio-visual Media Services Directive, amended in 2018, provides special protection for children in the processing of their data. It states that the personal data of minors generated by media service providers should not be processed for commercial purposes. This includes uses such as profiling, marketing and behaviourally targeted advertising.
The Council of Europe recently approved guidelines to respect, protect and fulfil the rights of the child in the digital environment. They also guide member states on the data protection and privacy of children. In addition, they underline that the protective responsibility of actors is tied to how children themselves can manage and protect their own privacy (Council of Europe, 2018[32]).
OECD countries differ in approaches to notice and consent for the collection, processing and sharing of children’s personal data. In most countries, a data processor has to obtain parental consent before processing a child’s data, although the age of legal obligation for parental consent varies (OECD, 2019[22]). According to the GDPR, the processing of personal data of a child under the age of 16 is lawful “only if and to the extent that consent is given or authorised by the holder of parental responsibility over the child. Member States may provide by law for a lower age for those purposes provided that such lower age is not below 13 years.” In the United States, the Children’s Online Privacy Protection Act prevents the collection, use or disclosure of personal information of children under the age of 13 without parental consent.
168 OECD DIGITAL ECONOMY OUTLOOK 2020 © OECD 2020
6. PRIVACY AND DATA PROTECTION 6. PRIVACY AND DATA PROTECTION

Ongoing efforts to strengthen compliance with, and enforcement of, privacy and data protection frameworks
As more privacy and data protection frameworks are enacted, attention has begun to shift to enhancing compliance with those frameworks, including by strengthening enforcement. In particular, governments are investing in policy measures to enhance awareness of requirements in privacy and data protection frameworks. There is also a strong emphasis on promoting data controllers’ accountability, along with engaging in international enforcement co-operation. These are discussed in turn below.
Raising awarenessThe vast majority of countries implement measures to enhance individuals’ awareness and understanding of their personal data rights. Results from the 2019 OECD Privacy Guidelines Questionnaire indicate that measures include education and awareness-raising campaigns, online trainings, social media, educational material, dedicated sessions or workshops and general campaigns. A large majority of countries also conducted education programmes and informed the public on the role of the PEA. And over a third of countries said their PEAs issued guidance to consumers regarding redress for possible privacy violations.
Countries also reported deploying an array of policy measures to promote businesses’ awareness of and compliance with privacy and data protection frameworks. These are primarily public awareness campaigns and good practice guidelines (Figure 6.7).
Figure 6.7. Policy measures by governments or PEAs to further privacy and data protection by businesses, 2019
0
30
25
20
5
15
10
Number of countries
Public awarenesscampaigns
Good practiceguidelines
Training Certificationschemes
Incentives fordata controllers’accountability
Incentives forself-regulation
Privacy as abusiness priority
Promote R&D forprivacy-enhancing
technologies
Source: 2019 OECD Privacy Guidelines Questionnaire.12 https://doi.org/10.1787/888934192281
In more than 82% of responding countries, PEAs have issued guidance or official position papers in relation to privacy or data protection impact assessments (15 countries), consent forms (12 countries), guidance to consumers for redress on possible privacy violations (11 countries), targeted advertising and AI (9 countries each). In addition, 38% of responding countries are implementing incentives for self-regulation by businesses. Only four respondents reported having mechanisms to assess the impact or success of the measures deployed. Such mechanisms include quarterly statistics on specific policies, regular surveys and analysis of web traffic (including of social media awareness-raising campaigns).
The Privacy Guidelines mention in particular “the promotion of technical measures which help to protect privacy” as one means of national implementation (paragraph 19 g). Here, the picture is mixed. A quarter of respondents have no guidance or other means to encourage adoption of technical measures for privacy protection. These could include anonymisation, cryptography, de-identification, differential privacy and pseudonymisation. Generally, national implementation involves guidance, recommendations or reports by PEAs on the application of privacy-enhancing technologies, primarily pseudonymisation and anonymisation.
Respondents mentioned several other measures related to the business sector. PEAs conducted privacy compliance assessments or audits to raise awareness, provided self-assessment tools to organisations and offered training and educational resources on their websites. Respondents also operated an
169OECD DIGITAL ECONOMY OUTLOOK 2020 © OECD 2020
6. PRIVACY AND DATA PROTECTION 6. PRIVACY AND DATA PROTECTION
enquiries or reporting line. They convened multi-stakeholder dialogues on specific issues and held workshops, briefing sessions and town-hall meetings. Almost half of responding countries mentioned certification schemes to further privacy and data protection by businesses.
Promoting accountability As mentioned above, countries and PEAs are increasingly looking towards data controllers’ accountability to promote compliance with privacy and data protection frameworks. Accountability was one of eight basic principles in the original 1980 Privacy Guidelines. It requires data controllers to be accountable for complying with privacy protection rules and decisions, irrespective of whether another party processes the data on their behalf. Still, nothing in the Privacy Guidelines prevents others from also being accountable (OECD, 2013[33]).
Unlike in 1980, accountability is no longer synonymous with compliance with legal obligations. Accountability now entails a risk-based approach to privacy and implementing a comprehensive privacy management programme. The 2013 revision of the Privacy Guidelines (OECD, 2013[36]) introduced this concept along with other safeguards to comply with privacy best practices. Countries consider accountability to have an important role in personal data protection, and this will only continue to grow as accountability can aid enforcement.
Nonetheless, the exact meaning and requirements of accountability are unclear. There is growing consensus that accountability should also be about organisations being responsive. It should create value for individuals and society, as well as for one’s own organisation. The concept of “accountability 2.0” or “ethical accountability” has recently emerged. This reflects the need for data controllers to be aware of and accountable for the broader social implications of data processing.4
Policy measures are being adopted to promote accountabilityIn their responses to the 2019 OECD Privacy Guidelines Questionnaire, 38% of countries said they were applying “incentives for data controllers’ accountability” as part of their policy measures to further privacy and data protection by businesses. These included measures on transparency reporting and enforcement of personal data breach notifications. Answers also referred to accountability and good practice guides. These focused on data protection-management programmes and on managing data breaches (including a focus on small and medium-sized enterprises or on specific sectors). In addition, respondents mentioned software to promote data protection impact assessments. Some countries expressed a need for further clarity on other areas. They sought guidance on practical mechanisms to implement accountability, including to whom data controllers are accountable. They also noted the need for more information on the impact of emerging technologies on organisational accountability.
Personal data breach notification (PDBN) is another important aspect of accountability. In a 2019 OECD survey of PEAs, many countries said they had introduced mechanisms for mandatory PDBN reporting. Of the 35 respondent authorities, all EU authorities answered they have mandatory PDBN reporting to one or more authorities (compulsory under the GDPR). Half of the non-EU/GDPR countries have introduced mandatory PDBN reporting to the authority, while four said they expected to introduce such a law within the next two years. For example, through the Notifiable Data Breach scheme in Australia, entities are legally obliged to carry out an assessment whenever they suspect a data breach. They are also required to notify affected individuals and the Office of the Australian Information Commissioner (OAIC) (OAIC, 2019[34]).
Enforcement All but two respondents to the 2019 OECD Privacy Guidelines Questionnaire reported having established PEAs, generally to oversee both the private and public sectors. Two countries from outside the OECD reported passing relevant legislation, but had not yet established a national PEA. All countries reported their PEAs collaborate with other authorities, notably those addressing consumer protection and digital or cybersecurity issues. And all but one country have given their PEA and other enforcement authorities key powers. These are the ability to implement sanctions; award remedies; and employ other enforcement mechanisms in cases of failure to comply with privacy and data protection laws. Countries generally apply monetary sanctions and enforcement notices, as well as enforce corrective action and restrict data processing.
170 OECD DIGITAL ECONOMY OUTLOOK 2020 © OECD 2020
6. PRIVACY AND DATA PROTECTION 6. PRIVACY AND DATA PROTECTION

When asked about enforcement challenges, countries most often cited insufficient resources, followed by uncertainty in interpreting regulatory frameworks (Figure 6.8). Nearly 45% of respondents considered the need for collaboration with other regulatory authorities, such as competition or consumer protection, as an enforcement challenge. At the same time, all reported that such collaboration was taking place.
Figure 6.8. Main challenges to enforcement, 2019
02
20
1618
46
1214
810
Number of countries
Insufficient resources Uncertainties regardingregulatory interpretation
Need for collaborationwith other regulatory
entities
Lack of awarenessby organisationsand individuals
Multitude of stakeholders Other
Source: 2019 OECD Privacy Guidelines Questionnaire.12 https://doi.org/10.1787/888934192300
A related challenge involves increasing complexities associated with the types of actors involved in data collection, processing and use. The traditional concepts of a data controller and processor may not encompass all actors that play a role in data protection. In particular, national legislation and other frameworks are increasingly allocating responsibilities among data processors, data controllers, agents, supervisory authorities and other actors.
Policy makers need to strike a fine balance between flexibility and accountability. On the one hand, they need to remain flexible in terms of allocating responsibilities to other actors in accordance to their roles. On the other, they must ensure all actors are held to account in their collection, processing and use of personal data. The responsibility of actors other than data controllers will likely continue to be an open question in 2020 and beyond.
International enforcement co-operation There is increasing emphasis on international enforcement co-operation, particularly in light of the increased frequency and volume of transborder data flows and influence of regional data protection frameworks. With one exception, all respondents to the 2019 OECD Privacy Guidelines Questionnaire participate in regional and international fora to facilitate co-operation and share information on privacy enforcement (particularly to seek assistance with privacy violations). Participation in the Global Privacy Enforcement Network5 was the most popular response. This was followed by the International Conference of Data Protection and Privacy Commissioners (now the Global Privacy Assembly) Enforcement Cooperation Arrangement and the APEC Privacy Cross-border Privacy Enforcement Arrangement.
Despite progress, countries also consider that incompatibility of legal privacy regimes is one of the main reasons that enforcement co-operation has not improved (Figure 6.9). Most countries are also dealing with restrictions on sharing information and insufficient resources for enforcement.
Approximately two-thirds of countries responding to the questionnaire said their PEA had sought assistance from, or referred a privacy violation complaint to, a PEA in another country and/or vice versa. Only four countries reported their PEA had declined another country’s request for assistance. One country explained that its PEA cannot always provide the full assistance requested but will generally try to assist within the scope of its legal abilities.
171OECD DIGITAL ECONOMY OUTLOOK 2020 © OECD 2020
6. PRIVACY AND DATA PROTECTION 6. PRIVACY AND DATA PROTECTION

Figure 6.9. Main challenges to cross-border enforcement co-operation, 2019
0
25
20
5
15
10
Number of countries
Incompatibilityof legal regimes
Restrictions onsharing information
Insufficientresources
Lack oflegal authority
Languagebarriers
Other
Source: 2019 OECD Privacy Guidelines Questionnaire.12 https://doi.org/10.1787/888934192319
172 OECD DIGITAL ECONOMY OUTLOOK 2020 © OECD 2020
6. PRIVACY AND DATA PROTECTION 6. PRIVACY AND DATA PROTECTION
References
Australian Government (2017), Information about the Data Integration Partnership for Australia, Department of the Prime Minister and Cabinet, Data and Digital Branch, http://www.pmc.gov.au/sites/default/files/publications/DIPA-information.pdf.
[19]
Auxier, B. et al. (2019), Americans and Privacy: Concerned, Confused and Feeling Lack of Control over their Personal Information, Pew Research Center, Internet & Tech, 15 November, https://www.pewresearch.org/internet/2019/11/15/americans-and-privacy-concerned-confused-and-feeling-lack-of-control-over-their-personal-information/.
[15]
Burns, T. (ed.) (2019), Educating 21st Century Children: Emotional well-being in the digital age, Educational Research and Education, OECD Publishing, Paris, https://doi.org/10.1787/b7f33425-en.
[22]
Centre for Information Policy Leadership (2018), The Case for Accountability: How it Enables Effective Data Protection and Trust in the Digital Society, July, http://bit.ly/2koS7IT.
[39]
Council of Europe (2020), Joint Statement by Alessandra Pierucci and Jean-Philippe Walter on the Right to Data Protection in the Context of the COVID-19 Pandemic, Council of Europe, Strasbourg, https://www.coe.int/en/web/data-protection/statement-by-alessandra-pierucci-and-jean-philippe-walter.
[4]
Council of Europe (2018), Guidelines to Respect, Protect and Fulfil the Rights of Children in the Digital Environment, Council of Europe, Strasbourg, https://edoc.coe.int/en/children-and-the-internet/7921-guidelines-to-respect-protect-and-fulfil-the-rights-of-the-child-in-the-digital-environment-recommendation-cmrec20187-of-the-committee-of-ministers.html.
[32]
Council of Europe (1981), Convention for the Protection of Individuals with Regard to Automatic Processing of Personal Data, ETS No. 108, Council of Europe, Strasbourg.
[28]
Docksey, C. (2019), “Keynote on accountability”, 41st Conference of Data Protection and Privacy Commissioners, Tirana, 24 October.
[38]
EDPB (2020), Statement on the Processing of Personal Data in the Context of the COVID-19 Outbreak, adopted on 19 March, European Data Protection Board, Brussels, https://edpb.europa.eu/sites/edpb/files/files/news/edpb_statement_2020_processingpersonaldataandcovid-19_en.pdf.
[5]
EDPB (2019), 1 Year GDPR - Taking Stock, European Data Protection Board, Brussels, 22 May, https://edpb.europa.eu/news/news/2019/1-year-gdpr-taking-stock_en.
[7]
European Commission (2020), A European Strategy for Data, European Commission, Brussels, https://ec.europa.eu/info/sites/info/files/communication-european-strategy-data-19feb2020_en.pdf.
[6]
European Commission (2019), Study on Broadband Coverage in Europe 2018, European Commission, Brussels, https://ec.europa.eu/digital-single-market/en/news/study-broadband-coverage-europe-2018 (accessed on 21 October 2020).
[17]
European Union (2016), Regulation (EU) 2016/679 of the European Parliament and of the Council of 27 April 2016 on the protection of natural persons with regard to the processing of personal data and on the free movement of such data, and repealing Directive 95/46/EC (GDPR), O.J. (L 119) 32, European Union, Brussels, http://data.europa.eu/eli/reg/2016/679/oj.
[26]
European Union (1995), Directive 95/46/EC of the European Parliament and of the Council of 24 October 1995 on the protection of individuals with regard to the processing of personal data and on the free movement of such data, O.J. (L 281), European Union, Brussels.
[27]
GPEN (2018), GPEN Sweep 2018: Privacy Accountability, Office of the Privacy Commissioner, New Zealand and Information Commissioner’s Office, United Kingdom, October, https://ico.org.uk/media/about-theico/documents/2614435/gpen-sweep-2018-international-report.pdf (accessed on 28 October 2020).
[40]
Graham-Harrison, E. and C. Cadwalladr (2018), “Revealed: 50 million Facebook profiles harvested for Cambridge Analytica in major data breach”, The Guardian, 17 March, https://www.theguardian.com/news/2018/mar/17/cambridge-analytica-facebook-influence-us-election (accessed 21 October 2020).
[10]
Granville, K. (2018), “Facebook and Cambridge Analytica: What you need to know as fallout widens”, The New York Times, 19 March, https://www.nytimes.com/2018/04/04/us/politics/cambridge-analytica-scandal-fallout.html (accessed 21 October 2020).
[9]
Hern, A. and D. Pegg (2018), “Facebook fined for data breaches in Cambridge Analytica scandal”, The Guardian, 11 July, https://www.theguardian.com/technology/2018/jul/11/facebook-fined-for-data-breaches-in-cambridge-analytica-scandal.
[11]
Hof, S. (2017), “I agree...or do I? - A rights based analysis of the law on children’s consent in the digital world”, Wisconsin International Law Journal, Vol. 34, https://openaccess.leidenuniv.nl/bitstream/handle/1887/58542/S_van_der_Hof_-_I_AGREE._._._OR_DO_Ioe1oe.pdf?sequence=1.
[23]
173OECD DIGITAL ECONOMY OUTLOOK 2020 © OECD 2020
6. PRIVACY AND DATA PROTECTION 6. PRIVACY AND DATA PROTECTION
References and Notes
https://www.coe.int/en/web/data-protection/statement-by-alessandra-pierucci-and-jean-philippe-walter

IBM Security (2019), Cost of a Data Breach Report, IBM, Armonk, New York, https://databreachcalculator.mybluemix.net/. [13]
IDC and Lisbon Council (2018), Updating the European Data Market Monitoring Tool, https://datalandscape.eu/sites/default/files/report/EDM_D2.1_1stReport-FactsFigures_revised_21.03.2018.pdf (accessed 21 October 2020).
[18]
Information Commissioner’s Office (2018), Monetary Penalty Notice to Facebook Ireland Ltd, 24 October, Information Commissioner’s Office, Wilmslow, United Kingdom, https://ico.org.uk/media/action-weve-taken/mpns/2260051/r-facebook- mpn-20181024.pdf.
[8]
Irwin Reyes et al. (2018), “‘Won’t somebody think of the children?’: Examining COPPA compliance at scale”, Proceedings on Privacy Enhancing Technologies, Vol. 3, pp. 63-83, https://petsymposium.org/2018/files/papers/issue3/popets-2018-0021.pdf.
[25]
Livingstone, S., M. Stoilova and R. Nandagiri (2018), “Conceptualising privacy online: What do, and what should, children understand?”, LSE blog, https://blogs.lse.ac.uk/medialse/2018/09/07/conceptualising-privacy-online-what-do-and-what-should-children-understand/.
[21]
Norwegian Consumer Council (2017), “Significant security flaws in smartwatches for children”, Forbrukerradet, 18 October, https://www.forbrukerradet.no/side/significant-security-flaws-in-smartwatches-for-children/.
[24]
OAG (2020), “California Consumer Privacy Act (CCPA)”, webpage, https://oag.ca.gov/privacy/ccpa (accessed on 21 October 2020). [30]
OAIC (2019), Notifiable Data Breaches Scheme 12-month Insights Report, Office of the Australian Information Commissioner, Sydney, https://www.oaic.gov.au/privacy/notifiable-data-breaches/notifiable-data-breaches-statistics/notifiable-data-breaches-scheme-12month-insights-report/.
[34]
OECD (2019), Artificial Intelligence in Society, OECD Publishing, Paris, https://dx.doi.org/10.1787/eedfee77-en. [35]
OECD (2019), Enhancing Access to and Sharing of Data: Reconciling Risks and Benefits for Data Re-use across Societies, OECD Publishing, Paris, https://dx.doi.org/10.1787/276aaca8-en.
[3]
OECD (2019), “Protection of Children in a Connected World”, OECD– University of Zurich Expert Consultation 15-16 October, University of Zurich, internal document.
[20]
OECD (2019), “Trade and Cross-Border Data Flows”, OECD Trade Policy Papers, No. 220, OECD Publishing, Paris, https://doi.org/10.1787/b2023a47-en.
[29]
OECD (2018), Towards National Privacy Strategies (NPS), Final report, internal document, OECD, Paris. [37]
OECD (2017), OECD Digital Economy Outlook 2017, OECD Publishing, Paris, https://dx.doi.org/10.1787/9789264276284-en. [2]
OECD (2015), “Assessing government initiatives on public sector information: A review of the OECD Council Recommendation”, OECD Digital Economy Papers, No. 248, OECD Publishing, Paris, http://dx.doi.org/10.1787/5js04dr9l47j-en.
[1]
OECD (2013), The Evolving Privacy Landscape: 30 years after the OECD Privacy Guidelines, OECD, Paris, https://www.oecd.org/sti/ieconomy/oecd_privacy_framework.pdf.
[33]
OECD (2013), OECD Privacy Framework, OECD Publishing, Paris, www.oecd.org/internet/ieconomy/privacy-guidelines.htm. [36]
OPC (2019), 2018-2019 Survey of Canadians on Privacy, Office of the Privacy Commissioner of Canada, Ottawa, https://www.priv.gc.ca/en/opc-actions-and-decisions/research/explore-privacy-research/2019/por_2019_ca/#fig03.
[14]
Otaka, T. (2015), “Japan Pension Service hack used classic attack method”, The Japan Times, 2 June. [12]
UK Department for Digital, Culture, Media & Sport (2018), Centre for Data Ethics and Innovation Consultation - Consultation Outcome, https://www.gov.uk/government/consultations/consultation-on-the-centre-for-data-ethics-and-innovation/centre-for-data-ethics-and-innovation-consultation.
[31]
174 OECD DIGITAL ECONOMY OUTLOOK 2020 © OECD 2020
6. PRIVACY AND DATA PROTECTION 6. PRIVACY AND DATA PROTECTION
References and Notes
Notes
1. This questionnaire was conducted as part of the current review of the implementation of the OECD Privacy Guidelines. It asked countries questions pertaining to national and international privacy and data protection developments (regulations, policies and technology) and on the relevance of the guidelines. Twenty-nine countries responded by the due date, 14 February 2020: 26 OECD countries (Australia, Canada, Chile, Colombia, Denmark, Estonia, Finland, France, Iceland, Israel, Italy, Japan, Korea, Latvia, Lithuania, Luxembourg, Mexico, New Zealand, Norway, Portugal, the Slovak Republic, Slovenia, Switzerland, Turkey, the United Kingdom and the United States) and three partner economies (Brazil, Singapore and Thailand).
2. The 2005 APEC Privacy Framework, revised in 2015, was drafted to protect information privacy, while maintaining information flows among economies in the Asia-Pacific region and their trading partners. It provides that member economies should take all reasonable and appropriate measures to remove unnecessary barriers to data flows and avoid the creation of such barriers.
3. Chapter 5 of OECD (2019[35]) provides a general overview of countries’ AI policies and initiatives. The OECD AI Policy Observatory (OECD.AI, launched in February 2020) hosts a database of national AI strategies and policies.
4. See further, for example, Docksey, C. (2019[38]); Centre for Information Policy Leadership (2018[39]); and GPEN (2018[40]).
5. The Global Privacy Enforcement Network (GPEN) is an informal group that facilitates co-operation and the sharing of information between privacy enforcement authorities. Created by the OECD in 2010, the GPEN has 50 members that navigate the practical aspects of privacy enforcement co-operation. This includes issues in relation to cross-border investigations, joint enforcement and awareness campaigns and effective communication between the public and private sectors.
175OECD DIGITAL ECONOMY OUTLOOK 2020 © OECD 2020
6. PRIVACY AND DATA PROTECTION 6. PRIVACY AND DATA PROTECTION
References and Notes


Chapter 7DIGITAL SECURITY
177OECD DIGITAL ECONOMY OUTLOOK 2020 © OECD 2020

KEY FINDINGS
�� Digital security incidents harm businesses, governments and individuals by undermining the availability, integrity and/or confidentiality of their data, information systems and networks. With the advent of the consumer and industrial Internet of Things bridging the online and offline worlds, damages can extend to the physical environment and affect safety.
�� Threats such as phishing, denial of service and ransomware attacks are becoming increasingly targeted and sophisticated. Cryptocurrencies continue to attract cybercriminals. Dozens of successful attacks have stolen more than USD 1 billion worth of cryptocurrencies from coin exchanges.
�� High-profile attacks have highlighted significant digital security gaps, especially to end-of-life of products that contain software code. OECD countries are increasingly developing digital security labels and regulatory requirements.
�� Artificial intelligence and other emerging technologies are a double-edged sword. They hold great promise for better protection, but can also be used to bypass traditional digital security measures. Emerging best practices illustrate the need for more co-operation among stakeholders.
�� In 2020, most OECD countries had whole-of-government digital security strategies. However, too often, these strategies lack an autonomous budget, evaluation tools and metrics, and integration into overall national digital plans. The emergence of digital security innovation hubs suggests that governments may increasingly harness digital security for economic development rather than see it only as a cost or a threat.
�� The COVID-19 outbreak created a fertile environment for cybercriminals. Massive numbers of people and organisations switched to telework, using new tools for the first time. Malicious actors took advantage of lax security to increase scams and phishing campaigns related to the pandemic.
�� Ransomware and distributed denial of service attacks targeted hospitals, but no more than before the COVID-19 crisis. Digital security agencies have raised awareness and aided operators of critical activities, particularly in the health sector.
IntroductionDigital security incidents harm businesses, governments and individuals by undermining the availability, integrity and/or confidentiality of their data, information systems and networks. Victims can face tangible and intangible damages, including monetary losses, reduced competitiveness, reputational damages, interruption of operations and privacy breaches. With the advent of the consumer and industrial Internet of Things (IoT) bridging the online and offline worlds, damages can extend to the physical environment and affect safety.
This chapter reviews trends in digital security risk and digital security policies. It focuses on policies to encourage digital security innovation, improve digital security of products and enhance vulnerability management. Lastly, it introduces challenges and opportunities arising from artificial intelligence (AI) for digital security.
Trends in digital security risk Digital security risk arises from incidents caused by threats exploiting vulnerabilities. Threat sources include governments, groups and individuals with malicious or ill-intentioned and/or criminal purposes. Their motivations vary, but typically include geopolitical goals for governments, profit making for criminals, ideology for hacktivists, violence for terrorists, personal aims for thrill seekers and discontent for insider threats. Incidents can also result from unintentional threats, such as a human error or a power cut.
178 OECD DIGITAL ECONOMY OUTLOOK 2020 © OECD 2020
7. DIGITAL SECURITY 7. DIGITAL SECURITY
Distributed denial of service attacks are still common, but large-scale ones are rarerDistributed denial of service (DDoS) attacks are a common type of incident that disrupts the operation of an online service by flooding it with illegitimate requests, most often to extort money from victims. To launch these attacks, malicious actors often leverage botnets, i.e. large networks of compromised devices called drones or zombies. In 2016, attackers behind the Mirai botnet took down dozens of the largest North American websites for a few hours. They leveraged over 100 000 endpoints to aggregate over 1.2 Terabits per second (Tbps) of bandwidth.
Data on DDoS attacks generally come from companies offering DDoS mitigation services. They do not have a comprehensive picture of the landscape, but can provide useful insights on key trends. For example, according to Netscout, the magnitude of the largest DDoS attacks has increased over time. In 2005, the largest attacks reached 11 Gigabits per second (Gbps), 50 Gbps in 2009, 100 Gbps in 2010, 500 Gbps in 2015 and 800 Gbps in 2016. In 2018, one reached 1.7 Tbps (Netscout, 2019[1]).
In 2019, such spectacularly large DDoS attacks were not detected. This reveals perhaps attackers’ reluctance to attract attention from law enforcement for attacks that are disproportionate in light of their (malicious) benefits. However, the number of common DDoS attacks detected by Netscout is still high, with 6.91 million attacks in 2018, 4% less than in 2017 (Netscout, 2019[1]).
In 2018, the frequency of large-scale DDoS attacks decreased year on year, while attackers multiplied smaller attacks in the 100 Gbps to 200 Gbps range (Netscout, 2020[2]). This is still high for most online services. DDoS attacks do not need to use such massive amount of bandwidth to block online services. In 96% of cases, DDoS attacks in 2018 consumed less than 10 Gbps (NexusGuard, 2019[3]). Meanwhile, 91% of enterprises that experienced a DDoS attack indicated that at least one attack completely saturated their Internet bandwidth (Netscout, 2019[1]). While the longest attack in Q3 2019 lasted more than 20 hours, 85% of attacks lasted fewer than 90 minutes; only 0.78% lasted over 20 hours (NexusGuard, 2019[3]).
The People’s Republic of China (hereafter “China”) (19.87%), Turkey (15.25%), the United States (15.24%) and Korea (12.33%) accounted for over 60% of the devices involved in DDoS attacks detected by NexusGuard in Q3 2019. This figure indicates the location of the compromised zombie hosts participating in the attack rather than that of the criminals controlling them (NexusGuard, 2019[3]). However, these figures only account for DDoS attacks that can be traced back to the compromised hosts.
Phishing remains high and is becoming more difficult for humans to detect In phishing, one of the main vectors, attackers disguise themselves as a trustworthy entity in an online communication. In this way, they obtain sensitive information, such as usernames and passwords, or deliver malicious code (“malware”). There are different types of phishing attacks. Phishing messages often include links to malicious sites that are increasingly difficult for end-users to detect without using some automated protection. Broad untargeted campaigns aim to collect credentials by directing users to fake e-commerce or financial websites. More sophisticated emails target specific individuals to plant malware in their organisation’s information system (spear-phishing).
In European Union (EU) countries, phishing and pharming (being redirected to fake websites that ask for personal information) vary greatly between countries (Figure 7.1). Based on surveys of individuals and households, 60% of Internet users in Norway have experienced phishing, but the figure drops to less than 10% in Greece, Poland, Latvia or Lithuania. More than 25% of Internet users in Iceland and the United Kingdom and 30% in Norway have experienced pharming, but less than 10% in 13 other EU countries. Various factors might contribute to explain those differences. These include lack of awareness/understanding of phishing attempts and/or the inability to identify them, national languages, security measures offered by email and Internet service providers (ISPs), etc.
According to Symantec, spear-phishing remained the most popular avenue for targeted attacks in 2018. It was used by 65% of all known cybercrime and state-sponsored groups (Symantec, 2019[5]). According to Verizon, 32% of data breaches in 2018 involved phishing activity. Phishing was present in 78% of digital security espionage incidents, including the installation and use of backdoors (Verizon, 2019[6]).
179OECD DIGITAL ECONOMY OUTLOOK 2020 © OECD 2020
7. DIGITAL SECURITY 7. DIGITAL SECURITY
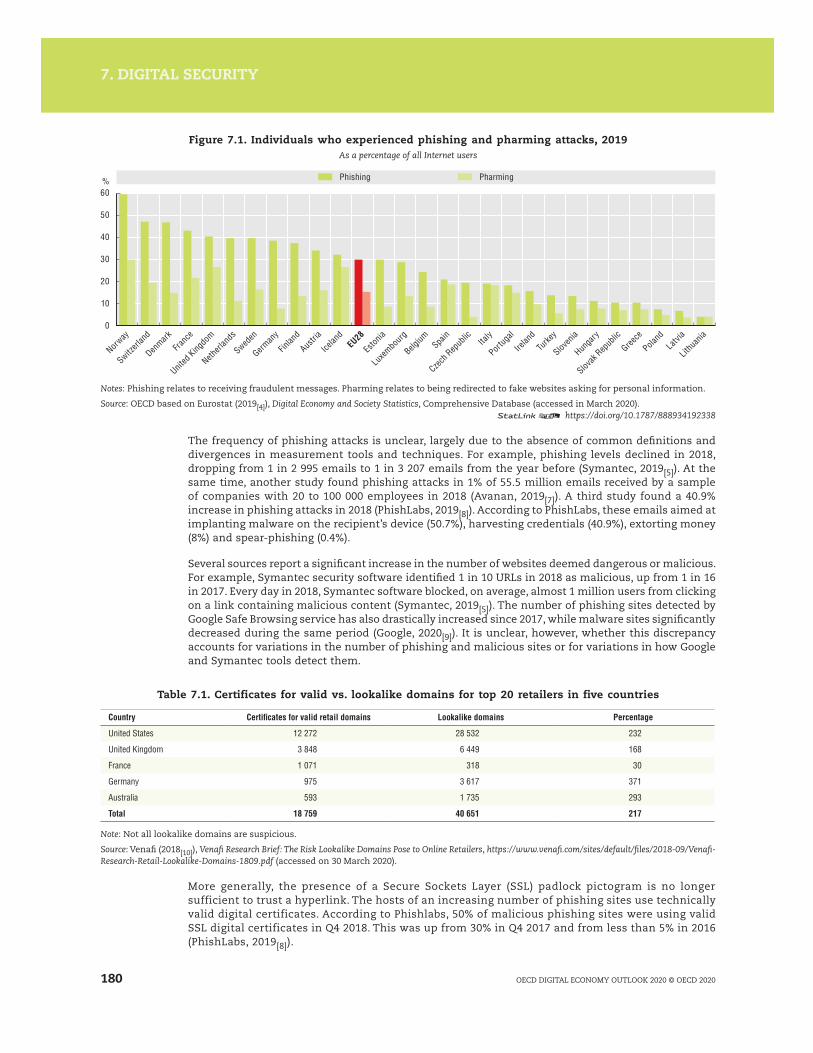
Figure 7.1. Individuals who experienced phishing and pharming attacks, 2019As a percentage of all Internet users
0
60
10
20
30
40
50
% Phishing Pharming
Norway
Switzerl
and
Denmark
France
United
Kingdo
m
Netherl
ands
Sweden
German
y
Finlan
d
Austria
Icelan
dEU28
Eston
ia
Luxem
bourg
Belgium Spa
in
Czech R
epub
lic Italy
Portug
al
Irelan
dTu
rkey
Sloven
ia
Hunga
ry
Slovak
Repub
lic
Greece
Poland
Latvia
Lithua
nia
Notes: Phishing relates to receiving fraudulent messages. Pharming relates to being redirected to fake websites asking for personal information.
Source: OECD based on Eurostat (2019[4]), Digital Economy and Society Statistics, Comprehensive Database (accessed in March 2020).12 https://doi.org/10.1787/888934192338
The frequency of phishing attacks is unclear, largely due to the absence of common definitions and divergences in measurement tools and techniques. For example, phishing levels declined in 2018, dropping from 1 in 2 995 emails to 1 in 3 207 emails from the year before (Symantec, 2019[5]). At the same time, another study found phishing attacks in 1% of 55.5 million emails received by a sample of companies with 20 to 100 000 employees in 2018 (Avanan, 2019[7]). A third study found a 40.9% increase in phishing attacks in 2018 (PhishLabs, 2019[8]). According to PhishLabs, these emails aimed at implanting malware on the recipient’s device (50.7%), harvesting credentials (40.9%), extorting money (8%) and spear-phishing (0.4%).
Several sources report a significant increase in the number of websites deemed dangerous or malicious. For example, Symantec security software identified 1 in 10 URLs in 2018 as malicious, up from 1 in 16 in 2017. Every day in 2018, Symantec software blocked, on average, almost 1 million users from clicking on a link containing malicious content (Symantec, 2019[5]). The number of phishing sites detected by Google Safe Browsing service has also drastically increased since 2017, while malware sites significantly decreased during the same period (Google, 2020[9]). It is unclear, however, whether this discrepancy accounts for variations in the number of phishing and malicious sites or for variations in how Google and Symantec tools detect them.
Table 7.1. Certificates for valid vs. lookalike domains for top 20 retailers in five countries
Country Certificates for valid retail domains Lookalike domains Percentage
United States 12 272 28 532 232
United Kingdom 3 848 6 449 168
France 1 071 318 30
Germany 975 3 617 371
Australia 593 1 735 293
Total 18 759 40 651 217
Note: Not all lookalike domains are suspicious.
Source: Venafi (2018[10]), Venafi Research Brief: The Risk Lookalike Domains Pose to Online Retailers, https://www.venafi.com/sites/default/files/2018-09/Venafi-Research-Retail-Lookalike-Domains-1809.pdf (accessed on 30 March 2020).
More generally, the presence of a Secure Sockets Layer (SSL) padlock pictogram is no longer sufficient to trust a hyperlink. The hosts of an increasing number of phishing sites use technically valid digital certificates. According to Phishlabs, 50% of malicious phishing sites were using valid SSL digital certificates in Q4 2018. This was up from 30% in Q4 2017 and from less than 5% in 2016 (PhishLabs, 2019[8]).
180 OECD DIGITAL ECONOMY OUTLOOK 2020 © OECD 2020
7. DIGITAL SECURITY 7. DIGITAL SECURITY
Furthermore, a security firm analysis of over 32 billion URLs found that 40% of malicious URLs were on legitimate websites compromised to host malicious content. The study underlined that users clicking on short links using URL shorteners such as bit.ly had a 1 in 130 chance of landing on a malicious page in 2018 (Webroot, 2019[11]).
Ransomware attacks become more targeted Ransomware is a type of malicious software that uses cryptography to limit or disable the accessibility of data and demands a ransom for recovery. Ransomware attacks are a form of digital extortion (ANSSI and BSI, 2018[12]). Although ransomware has been around for many years, it hit mainstream headlines in 2017.
The WannaCry and NotPetya attacks used malware designed to spread rapidly inside and outside victims’ networks, to encrypt files and to ask for a ransom in exchange for a decryption key. WannaCry infected over 100 000 systems globally, while NotPetya initially infected devices in Ukraine prior to rapidly spreading globally.
Together, these two ransomware caused billions of dollars of damage to businesses such as Boeing, Beiersdorf (Nivea), Deutsche Bahn, DHL, DLA-Piper, FedEx (USD 400 million), Honda, Renault, Merck (USD 870 million), Mondelez, Petrobras, PetroChina, Reckitt Benckiser, Rosneft, Saint-Gobain (USD 384 million) and AP Moller Maersk (USD 300 million) (Greenberg, 2018[13]). They also affected public sector organisations such as the National Health Service in the United Kingdom and the Russian Interior Ministry (RT World News, 2017[14]). The total cost of these attacks is unclear because a large number of small and medium-sized enterprises (SMEs) were also likely affected.
These high-profile attacks helped raise awareness about digital security and encouraged many businesses and organisations to enhance their basic security measures, including backup and recovery plans. As a result, ransomware attacks evolved in 2018 to become more targeted. For example, security firms observed a 20% decrease in ransomware activity (Symantec, 2019[5]). To increase the likelihood of receiving a ransom, cybercriminals have been increasingly choosing their victims among organisations that heavily rely on information and communication technologies (ICTs) and are known to pay less attention to digital security. Examples included in 2018 and 2019:
● Ports in Barcelona (Tsonchev, 2018[15]) (Spain), San Diego (Senzee, 2019[16]) and Long Beach (United States).
● Airports in Bristol (Cimpanu, 2018[17]) (United Kingdom), as well as Atlanta (Saraogi, 2019[18]), Cleveland (Goud, n.d.[19]) and New York (Insurance Journal, 2020[20]) (United States).
● Hospitals and health care organisations in the United States, including 17 hospitals tied to New Jersey’s Hackensack Meridian Health (Eddy, 2020[21]); and hospitals in in Alabama, Washington, California, Ohio, Hawaii, as well as others in Australia, Romania and France (CISO MAG, 2019[22]; Garrity, 2019[23]; Eddy, 2020[21]). In February 2020, NRC Health in the United States had to shut down its systems due to a ransomware attack. The company sells patient administration tools to 9 000 health care institutions, including 75% of the 200 largest hospital chains (DARK Reading, 2020[24]).
● Local governments. At least 174 municipal organisations were targeted by ransomware in 2019, a 60% increase from 2018 (Kaspersky, 2019[25]). Examples include cities and regions in Canada – Nunavut (Osborne, 2019[26]); France – Grand Est region (Vitard, 2020[27]) and Sarrebourg (Héritier, 2019[28]); United States – Baltimore (Chokshi, 2019[29]), New Orleans City (Korosec, 2019[30]), State of Louisiana (Gallagher, 2019[31]) and 23 local governments in Texas; and South Africa – Johannesburg (Goodin, 2019[32]).
In all these cases, the scenario is often the same: the entity under attack is paralysed, the leadership contacts emergency response services and evaluates whether to pay the ransom. The demand for ransom ranged from USD 5 000 to USD 5 million. On average, it was equal to around USD 1 million, with great variations depending on the size of the city (Kaspersky, 2019[25]).
According to limited data gathered by a US security firm, only 17.1% of state and local government entities hit by ransomware paid the ransom. Meanwhile, 70.4% of agencies confirmed they did not pay the ransom (Liska, 2019[33]). For example, the city of Baltimore refused to pay the USD 114 000 ransom and spent USD 18 million to restore its infrastructure.
181OECD DIGITAL ECONOMY OUTLOOK 2020 © OECD 2020
7. DIGITAL SECURITY 7. DIGITAL SECURITY

Ransomware can paralyse physical operations in plants and manufacturing environments. If attackers obtain access to the information technology (IT) system, they may successfully pivot their attack towards the operational technology (OT) infrastructure that manages physical installations.
In February 2020, for example, a natural gas facility was forced to shut down operations for two days after becoming infected with commodity ransomware (CISA, 2020[34]). Attackers first targeted the plant with a spear-phishing email, through which they accessed the OT network.
The ransomware used to attack the gas plant was not specially designed to paralyse industrial control systems (ICS). However, in December 2019, a security firm identified a new ransomware called Ekans or Snake that could paralyse such systems. It targets ICS such as manufacturing, product handling, production and distribution in plants, factories, along pipelines and rail tracks, on oil platforms, solar panels, etc. (Palmer, 2020[35]).
Cryptocurrencies continue to attract cybercriminalsMalicious actors have employed different means over the last five years to exploit a growing interest in cryptocurrencies.
Most commonly, cryptocurrencies are stolen from cryptocurrency exchanges. Between 2012 and 2019, at least 42 successful attacks hit exchanges. In 2019, for example, 12 attacks resulted in the theft of USD 292 million worth of cryptocurrencies. In 2018, eight attacks resulted in the theft of USD 844 million (Table 7.2).
Some of these attacks led affected companies to bankruptcy (e.g. Mt. Gox, Cryptopia, Youbit). In some cases, partial amounts were recovered or reimbursed to clients. Some exchanges have been successfully attacked several times, such as Bithumb (Cimpanu, 2019[36]). The exact circumstances of attacks are often described as unclear.
Some attackers choose to exploit vulnerabilities in cryptocurrency software. In February 2020, for example, the entire network of the non-profit organisation behind the IOTA cryptocurrency was shut down. This was in response to criminals exploiting a vulnerability in the official IOTA wallet app to steal users’ funds. The losses are estimated to be around USD 1.6 million worth of IOTA coins (Cimpanu, 2020[38]).
Other attackers take control of the blockchain supporting a cryptocurrency. In 2018, Bitcoin Gold (BTG) was delisted from cryptocurrency exchange Bittrex following an initial 51% attack. Attackers had assumed a majority of the network’s processing power to reorganise the blockchain allowing for a USD 18 million worth of double spending (Canellis, 2018[39]). In January 2020, another 51% attack allowed for double spending USD 72 000 worth of BTG. In 2018, Ethereum Classic suffered a similar 51% attack totalling USD 1.1 million worth of double spending of ETC coins (Beedham, 2019[40]).
Over the last three years, malicious actors have also developed more inconspicuous techniques called cryptomining and cryptojacking. Cryptomining occurs when criminals install malware that usurps a user’s processing power to mine cryptocurrency. Cryptojacking is cryptomining through scripts inserted in web content running in the user’s browser.
According to several sources, both cryptomining and cryptojacking have grown rapidly to become major threats. For example, in 2018, Symantec blocked 69 million cryptojacking events, four times as many events as in 2017 (Symantec, 2019[5]). In late 2017, cryptojacking started with Coinhive that was promoted as a means for website owners to make money without advertising. Criminals quickly diverted Coinhive and attacked legitimate sites. They then inserted the script in pages to retrieve the resulting coins it would mine from users visiting the site. Later, many other cryptojacking scripts were found on line. In Brazil, the vulnerable MikroTik routers were massively attacked to insert a cryptojacking script onto every webpage browsed via the router (Trustwave, 2019[41]). However, the cryptomining rush of 2018 may have dried out in 2019 (Malwarebytes Labs, 2020[42]).
182 OECD DIGITAL ECONOMY OUTLOOK 2020 © OECD 2020
7. DIGITAL SECURITY 7. DIGITAL SECURITY

Table 7.2. Cryptography exchanges affected by digital security attacks
Exchange Location USD stolen
2019
Upbit Korea 51 million
VinDAX Viet Nam 500 000
Bitpoint Japan 30 million
Bitrue Unknown 5 million
GateHub United Kingdom, Slovenia 10 million
Binance China 40 million
DragonEx Unknown 7 million
Bithumb Korea 20 million
CoinBene Unknown > 100 million
Coinbin Korea 30 million
Coinmama Slovak Republic Unknown
Cryptopia New Zealand 3 million
2018
MapleChange Canada 5.7 million
Zaif Japan 60 million
Coinrail Korea 40 million
Bithumb Korea 31 million
Taylor Estonia 1.5 million
CoinSecure India 3.5 million
Bitgrail Italy 170 million
Coincheck Japan 533 million
2017
NiceHash Slovenia 62 million
Youbit Korea Unknown
Bithumb Korea 7 million
Yapizon Korea 5 million
2016
Bitfinex Hong Kong, China 72 million
GateCoin Hong Kong, China 2 million
ShapeShift Switzerland 230 000
2015
BTER China 1.5 million
KipCoin China Unknown
Bitstamp United Kingdom, Slovenia, Luxembourg 5.1 million
LocalBitcoins Finland Unknown
Notes: Many of these cases are still under investigation. Estimates of amounts stolen are based on available information. They reflect the value of the stolen coins when the attack was first made public. Location can be unknown or vary across time.
Source: OECD based on SelfKey (13 February 2020[37]), “A comprehensive list of cryptocurrency exchange hacks”, https://selfkey.org/list-of-cryptocurrency-exchange-hacks/ and additional research.
Malware is increasingly sophisticatedMalicious actors demonstrate considerable agility and innovation, adapting malware to evade detection and target new technologies. Between 2018-19, for example, security company TrendMicro noted an 18% increase in the prevalence of fileless techniques (Trend Micro, 2019[43]). Fileless malware is less visible since the code is only executed in a system’s memory or leverages normally allowed tools installed in a system. Cryptojacking malware fall into this category as they are executed in the user’s browser without leaving any trace on the hard drive.
183OECD DIGITAL ECONOMY OUTLOOK 2020 © OECD 2020
7. DIGITAL SECURITY 7. DIGITAL SECURITY
Malware has evolved from encrypted to oligomorphic to polymorphic and metamorphic. Over time, malicious actors have considerably improved their techniques to develop malware that can better evade detection.
Encrypted malware is the first step to evade signature-based detection. At each infection, the malware is encrypted with a different key, making each file unique. However, security tools can still detect the decryptor included in the code that decrypts it and remains the same across infections.
Oligomorphic malware can change its decryptor at each generation of the malware code, i.e. each time the code is spreading to a different place. But this technique can only produce a few hundred different generations, which is not sufficient to evade security tools.
Polymorphic malware can create a countless number of decryptors using a mutation engine. It is impossible to be detected by simple signature-based security tools. According to Webroot (2019[11]), 93% of malware was polymorphic in 2017 and 2018.
Metamorphic malware can completely rewrite its code. In this way, each new version of itself propagated elsewhere no longer matches its previous iteration without using encryption (You and Yim, 2010[44]). The morphing engine code can take up to 80% of the overall malware code, versus 20% only for the actual malicious payload (Crane, 21 May 2019[45]).
Box 7.1. Emotet, the tenacious multi-purpose malware
Malware can live long and evolve over time. For example, the Emotet Trojan, discovered in 2014, continued to spread and create harm in 2020. A Trojan is a type of malware that conceals its true content to fool a user into thinking it is a harmless file. Emotet is among the most costly and destructive malware affecting the public and private sector (CISA, 2018[46]). For example, the city of Allenton, Pennsylvania, spent USD 1 million to eliminate it from its systems (The Morning Call, 2018[47]).
Emotet is a polymorphic banking Trojan that can evade typical signature-based detection. It uses several methods such as remote command and control servers to maintain persistence, continuously evolve and update its capabilities. Furthermore, it is Virtual Machine-aware and can generate false indicators if run in a virtual environment (a common way for security experts to contain and analyse malware without exposing sensitive information). It is disseminated through spam with malicious attachments or links that use branding familiar to the recipient.
Emotet uses a victim’s contact list to send itself to other people, sometimes sending a message that includes the contents of a previous email exchange between the victim and the recipient. Once downloaded, Emotet establishes persistence and attempts to propagate the local networks.
Between 2014 and 2020, Emotet evolved to integrate new features. From initially stealing bank account details, it began transferring money, sending spam and installing other malware to infected machines, such as other Trojans and ransomware. For example, Lake City, Florida, was infected by Emotet, which installed a ransomware forcing the city to pay USD 460 000. In January 2020, a concerted phishing campaign used emails purporting to be from the Permanent Mission of Norway to the United Nations. The emails, sent to 600 staffers and officials across the United Nations, tried to trick recipients into installing Emotet.
Sources: Seals (2020[48]), “U.N. weathers storm of Emotet-TrickBot malware”, https://threatpost.com/un-weathers-emotet-trickbot-malware/151894/; McKay (2019[49]), “Florida City fires IT employee after paying $460,000 bitcoin ransom to hackers”, https://gizmodo.com/florida-city-fires-it-employee-after-paying-460-000-in-1836031022 (accessed on 6 April 2020).
Malicious actors leveraged the COVID-19 crisis to make their attacks more successfulMalicious actors leveraged the coronavirus epidemic to make their attacks more successful, especially phishing campaigns using COVID-19 content. Emails with a coronavirus theme in the subject field or as an attachment filename, for example, have circulated. Attackers have also sent emails or SMS impersonating governments in Australia and the United Kingdom, as well as leaders or institutions such as the World Health Organization. In addition, they have sent emails, links or web applications
184 OECD DIGITAL ECONOMY OUTLOOK 2020 © OECD 2020
7. DIGITAL SECURITY 7. DIGITAL SECURITY
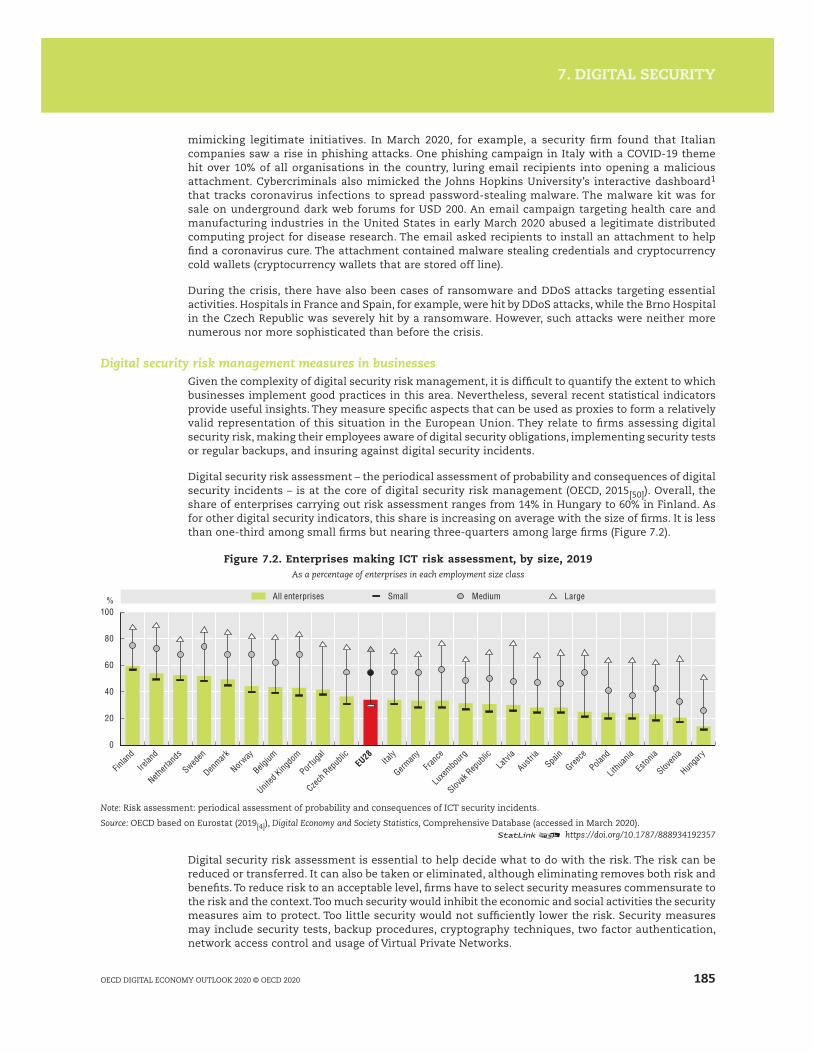
mimicking legitimate initiatives. In March 2020, for example, a security firm found that Italian companies saw a rise in phishing attacks. One phishing campaign in Italy with a COVID-19 theme hit over 10% of all organisations in the country, luring email recipients into opening a malicious attachment. Cybercriminals also mimicked the Johns Hopkins University’s interactive dashboard1 that tracks coronavirus infections to spread password-stealing malware. The malware kit was for sale on underground dark web forums for USD 200. An email campaign targeting health care and manufacturing industries in the United States in early March 2020 abused a legitimate distributed computing project for disease research. The email asked recipients to install an attachment to help find a coronavirus cure. The attachment contained malware stealing credentials and cryptocurrency cold wallets (cryptocurrency wallets that are stored off line).
During the crisis, there have also been cases of ransomware and DDoS attacks targeting essential activities. Hospitals in France and Spain, for example, were hit by DDoS attacks, while the Brno Hospital in the Czech Republic was severely hit by a ransomware. However, such attacks were neither more numerous nor more sophisticated than before the crisis.
Digital security risk management measures in businessesGiven the complexity of digital security risk management, it is difficult to quantify the extent to which businesses implement good practices in this area. Nevertheless, several recent statistical indicators provide useful insights. They measure specific aspects that can be used as proxies to form a relatively valid representation of this situation in the European Union. They relate to firms assessing digital security risk, making their employees aware of digital security obligations, implementing security tests or regular backups, and insuring against digital security incidents.
Digital security risk assessment – the periodical assessment of probability and consequences of digital security incidents – is at the core of digital security risk management (OECD, 2015[50]). Overall, the share of enterprises carrying out risk assessment ranges from 14% in Hungary to 60% in Finland. As for other digital security indicators, this share is increasing on average with the size of firms. It is less than one-third among small firms but nearing three-quarters among large firms (Figure 7.2).
Figure 7.2. Enterprises making ICT risk assessment, by size, 2019As a percentage of enterprises in each employment size class
0
100
20
40
60
80
%
Finlan
d
Irelan
d
Netherl
ands
Sweden
Denmark
Norway
Belgium
United
Kingdo
m
Portug
al
Czech R
epub
licEU28
Italy
German
yFra
nce
Luxem
bourg
Slovak
Repub
licLatv
ia
Austria
Spain
Greece
Poland
Lithua
nia
Eston
ia
Sloven
ia
Hunga
ry
All enterprises Small Medium Large
Note: Risk assessment: periodical assessment of probability and consequences of ICT security incidents.
Source: OECD based on Eurostat (2019[4]), Digital Economy and Society Statistics, Comprehensive Database (accessed in March 2020).12 https://doi.org/10.1787/888934192357
Digital security risk assessment is essential to help decide what to do with the risk. The risk can be reduced or transferred. It can also be taken or eliminated, although eliminating removes both risk and benefits. To reduce risk to an acceptable level, firms have to select security measures commensurate to the risk and the context. Too much security would inhibit the economic and social activities the security measures aim to protect. Too little security would not sufficiently lower the risk. Security measures may include security tests, backup procedures, cryptography techniques, two factor authentication, network access control and usage of Virtual Private Networks.
185OECD DIGITAL ECONOMY OUTLOOK 2020 © OECD 2020
7. DIGITAL SECURITY 7. DIGITAL SECURITY
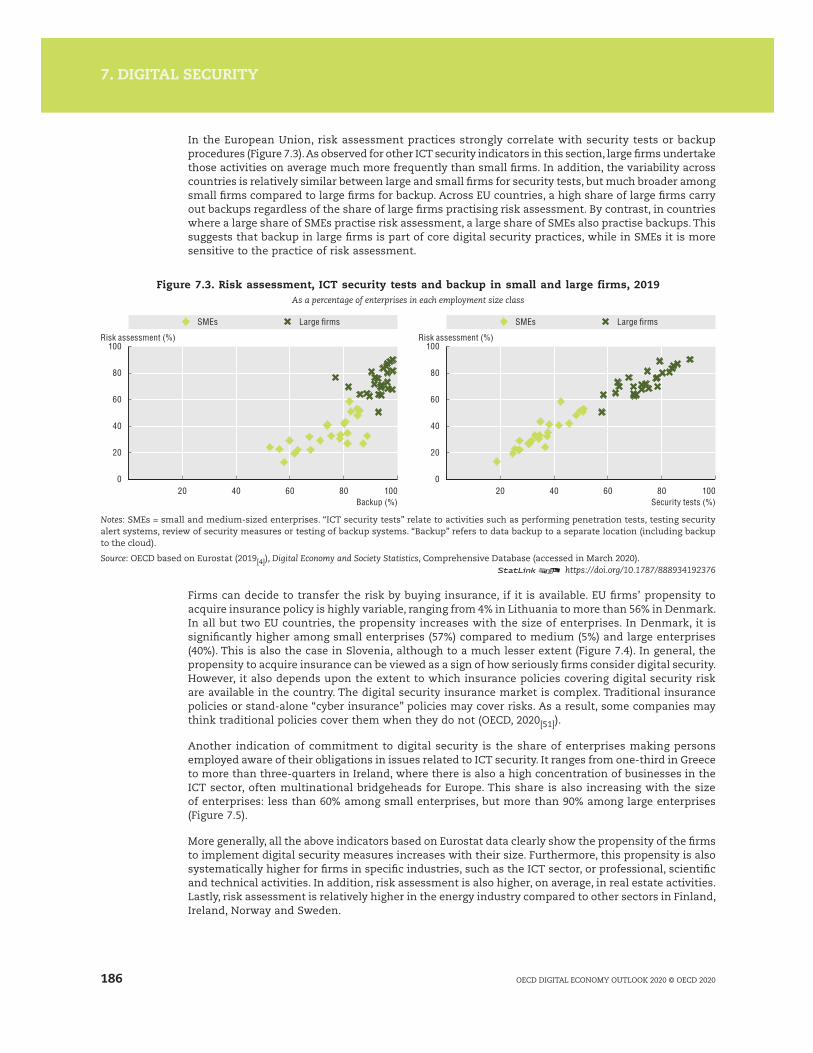
In the European Union, risk assessment practices strongly correlate with security tests or backup procedures (Figure 7.3). As observed for other ICT security indicators in this section, large firms undertake those activities on average much more frequently than small firms. In addition, the variability across countries is relatively similar between large and small firms for security tests, but much broader among small firms compared to large firms for backup. Across EU countries, a high share of large firms carry out backups regardless of the share of large firms practising risk assessment. By contrast, in countries where a large share of SMEs practise risk assessment, a large share of SMEs also practise backups. This suggests that backup in large firms is part of core digital security practices, while in SMEs it is more sensitive to the practice of risk assessment.
Figure 7.3. Risk assessment, ICT security tests and backup in small and large firms, 2019As a percentage of enterprises in each employment size class
0
100
80
60
40
20
0
100
80
60
40
20
20 40 60 80 100 20 40 60 80 100
Risk assessment (%) Risk assessment (%)
SMEs Large firms SMEs Large firms
Backup (%) Security tests (%)
Notes: SMEs = small and medium-sized enterprises. “ICT security tests” relate to activities such as performing penetration tests, testing security alert systems, review of security measures or testing of backup systems. “Backup” refers to data backup to a separate location (including backup to the cloud).
Source: OECD based on Eurostat (2019[4]), Digital Economy and Society Statistics, Comprehensive Database (accessed in March 2020).12 https://doi.org/10.1787/888934192376
Firms can decide to transfer the risk by buying insurance, if it is available. EU firms’ propensity to acquire insurance policy is highly variable, ranging from 4% in Lithuania to more than 56% in Denmark. In all but two EU countries, the propensity increases with the size of enterprises. In Denmark, it is significantly higher among small enterprises (57%) compared to medium (5%) and large enterprises (40%). This is also the case in Slovenia, although to a much lesser extent (Figure 7.4). In general, the propensity to acquire insurance can be viewed as a sign of how seriously firms consider digital security. However, it also depends upon the extent to which insurance policies covering digital security risk are available in the country. The digital security insurance market is complex. Traditional insurance policies or stand-alone “cyber insurance” policies may cover risks. As a result, some companies may think traditional policies cover them when they do not (OECD, 2020[51]).
Another indication of commitment to digital security is the share of enterprises making persons employed aware of their obligations in issues related to ICT security. It ranges from one-third in Greece to more than three-quarters in Ireland, where there is also a high concentration of businesses in the ICT sector, often multinational bridgeheads for Europe. This share is also increasing with the size of enterprises: less than 60% among small enterprises, but more than 90% among large enterprises (Figure 7.5).
More generally, all the above indicators based on Eurostat data clearly show the propensity of the firms to implement digital security measures increases with their size. Furthermore, this propensity is also systematically higher for firms in specific industries, such as the ICT sector, or professional, scientific and technical activities. In addition, risk assessment is also higher, on average, in real estate activities. Lastly, risk assessment is relatively higher in the energy industry compared to other sectors in Finland, Ireland, Norway and Sweden.
186 OECD DIGITAL ECONOMY OUTLOOK 2020 © OECD 2020
7. DIGITAL SECURITY 7. DIGITAL SECURITY

Figure 7.4. Enterprises with insurance against ICT security incidents by size, 2019As a percentage of enterprises in each employment size class
0
80
20
10
40
30
60
50
70
% All enterprises Small Medium Large
Denmark
United
Kingdo
mFra
nce
Irelan
d
Sweden
Norway
Spain
Finlan
d
Luxem
bourg
Netherl
ands
Greece
Belgium EU28
German
y
Austria
Italy
Latvia
Poland
Portug
al
Czech R
epub
lic
Slovak
Repub
lic
Estonia
Sloven
ia
Hunga
ry
Lithua
nia
Source: OECD based on Eurostat (2019[4]), Digital Economy and Society Statistics, Comprehensive Database (accessed in March 2020).12 https://doi.org/10.1787/888934192395
Figure 7.5. Enterprises making persons employed aware of their obligations in issues related to ICT security, by size, 2019
As a percentage of enterprises in each employment size class
0
100
20
40
60
80
% All enterprises Small Medium Large
Irelan
d
Czech R
epub
lic Italy
Denmark
United
Kingdo
mLatv
ia
German
y
Lithua
nia
Finlan
d
Sweden
Slovak
Repub
lic
Austria
EU28
Norway
Belgium
Netherl
ands
Eston
iaFra
nce
Portug
alSpa
in
Sloven
ia
Luxem
bourg
Poland
Hunga
ry
Greece
Source: OECD based on Eurostat (2019[4]), Digital Economy and Society Statistics, Comprehensive Database (accessed in March 2020).12 https://doi.org/10.1787/888934192414
Evolution of digital security policies This section provides information about public policy initiatives by OECD countries in the area of digital security. It is based on the responses of the 12 countries that completed a questionnaire on digital security circulated during the summer of 2019. The term “countries” therefore refers to the countries that have completed the questionnaire.
Digital security strategies have become the norm in OECD countries as a whole-of-government challengeIn 2020, most OECD countries had a national digital security strategy. For most strategies, the overarching vision is to protect national and international security, support economic and social prosperity and/or foster trust and confidence in the digital environment. Preserving human rights and enhancing governmental co-ordination are less likely to be part of the strategy’s overarching vision.
Capacity building and protecting critical infrastructures are usually the main pillars of the national digital strategies, as well as information sharing and international co-operation. For instance, in Denmark, as part of the digital security strategy, the government has established a portal
187OECD DIGITAL ECONOMY OUTLOOK 2020 © OECD 2020
7. DIGITAL SECURITY 7. DIGITAL SECURITY

(https://sikkerdigital.dk/) dedicated to information sharing and co-operation. It provides information and specific tools for citizens, businesses and authorities regarding digital security, as well as advice on how to comply with legislation. The portal is regularly updated with warnings regarding current threats (e.g. ongoing phishing campaigns).
Most countries recognise that digital security is a whole-of-government challenge. Its implications range from technology and law enforcement to national security and economic and social prosperity. Therefore, the development of the digital security strategy typically involves several ministries and agencies across government.
To ensure policy coherence and reduce overlap across parties, digital security policies usually acknowledge the need for a co-ordination mechanism. However, there is no one-size-fits-all model. In Denmark, for example, the Agency for Digitisation (within the Ministry of Finance) and the Centre for Cyber Security (Ministry of Defence) jointly manage digital security. This role is handled in the Netherlands by the Ministry of Justice. In countries such as the United States, Latvia and Spain, a national council gathers representatives of all ministries and agencies involved.
Most countries acknowledge the importance of multi-stakeholder co-operation for successful implementation of a digital security strategy. However, such co-operation varies greatly across countries. Some governments co-operate only on an ad-hoc basis with specific trade associations, while others involve stakeholders more broadly from the design phase. For instance, Brazil created three working groups to help design the strategy. These focused on digital governance (regulation, research, education and innovation); prevention and mitigation of threats; and protection of government and critical infrastructures. Each group gathered experts from the government, academia and the private sector.
Among OECD countries, the scope of the co-operation varies. Overall, operators of critical infrastructures and organisations representing the technical community are often involved in developing the digital security strategy, as well as businesses more broadly. Civil society and SMEs are less often part of the process.
Digital security strategies have significant challenges for implementation and evaluationMost countries recognise the need to articulate the digital security strategy with other high-level policy planning such as digital transformation and national security. However, these strategies are typically designed in silos, and often linked as an afterthought. This limits the ability of governments to articulate a strategic and comprehensive approach. In Japan, the government has integrated the digital security strategy into the framework of “Society 5.0”. This consists of achieving a human-centred society that balances economic advancement with the resolution of social problems by a system that highly integrates the digital and physical spaces.
Most countries declare they regularly assess progress on the implementation of their digital security strategies. However, few have comprehensively measured activities related to digital security. Without stronger evidence, it is difficult to fully analyse the results of digital security strategies and identify their shortcomings.
Similarly, few countries have allocated a specific budget to implement their digital security strategy. Their ministries and agencies are expected to carry out digital security within their existing budget. As a result, many countries find it difficult to determine how much budget is dedicated to implement their digital security strategy overall.
Most countries have prioritised the need to increase the pool of digital security and risk management graduates and practitioners. However, this typically requires co-ordination with other ministries not often involved in digital security policy, such as education or research portfolios. In the United States, the National Institute of Standards and Technology (NIST), within the Department of Commerce, has launched the National Initiative for Cybersecurity Education (NICE). The initiative is a partnership between government, academia and the private sector to close the hiring gap in the cybersecurity workforce. To that end, it organises events such as the NICE Conference and expositions, working group meetings and free webinars.
Other key challenges for policy makers are promoting digital security risk management as a business priority for leaders in public and private organisations and encouraging greater information sharing.
188 OECD DIGITAL ECONOMY OUTLOOK 2020 © OECD 2020
7. DIGITAL SECURITY 7. DIGITAL SECURITY

To address those risks, and increase the level of risk ownership by the private sector, governments need to facilitate effective and trust-based multi-stakeholder partnerships.
Few governments have policies to support a digital security industry. This shows that digital security is still mainly perceived as a cost or a risk, and much less as an opportunity. More detail on such initiatives is provided below.
Beyond national strategies and policies, governments across the OECD are facilitating new forms of multi-stakeholder and international partnerships to enhance digital security. For example, the Paris Call for Trust and Security in Cyberspace was launched in 2018. As of March 2020, it had the support of 78 governments, 633 companies, 343 organisations and members of civil society, and 29 public authorities and local governments. This high-level declaration calls for increased co-operation to develop common principles in tackling new challenges, such as the digital security of products and the management of vulnerabilities. Similarly, groups of businesses launched both the Charter of Trust (Charter of Trust, n.d.[52]) and the Cybersecurity Tech Accord (Cybersecurity Tech Accord, n.d.[53]) in 2018. They call for increased co-operation to enhance the digital security of products (see below).
Digital security agencies have taken steps to counter digital security risk related to COVID-19Government agencies in charge of digital security across OECD countries have responded to the coronavirus crisis in several ways. They have raised awareness, monitored the threat landscape, provided assistance where appropriate and co-operated with all relevant stakeholders, including at the international level:
● The United States’ Cyber and Infrastructure Security Agency (CISA) set up a new section on its website dedicated to security risks related to the COVID-19 crisis (www.cisa.gov/coronavirus).
● The European Commission, European Union Agency for Cybersecurity, Europol and the Computer Emergency Response Team for the EU Institutions, bodies and agencies co-operated to track malicious activities related to COVID-19 and alert their respective communities.
● The Canadian Centre for Cybersecurity published an alert recommending that Canadian health organisations involved in the national response to the pandemic remain vigilant and ensure they are engaged in digital security best practices.
● The Czech National Office for Cyber and Information Security (NÚKIB) ordered selected health care entities to enhance the security of key ICT systems. The agency offered consultations and support to these entities.
In addition, many businesses, as well as industry and professional groups, communicated to the public about digital security risks related to the COVID-19 crisis. Many of them created one-stop shops and resource libraries. This allows them to advise on specific topics such as secure telework.
Policies to encourage digital security innovationDigital security innovation is an emerging trend in the OECD and other countries. More and more governments are implementing national strategies and opening centres to encourage innovation. Examples include Israel, Australia, the United Kingdom, Singapore, Germany, France and the European Union.
In 2014, Israel created CyberSpark, a digital security innovation campus located in Be’er Sheva (CyberSpark, n.d.[54]). CyberSpark brings together major stakeholders – academia, industry, venture capital and government – on the same campus to collaborate and share ideas. By working so closely, stakeholders can learn from one another. For example, it can often be difficult for academia to keep up with the pace of change in industry. If academia and industry reside together and speak regularly, they can learn from one another and find out what they need. As industry progresses, the campus can keep its curriculum up to date and graduates are more mature and better placed to contribute to the workforce. The government intends to grow the workforce in CyberSpark to 2 500 employees by 2026 and to attract the top global companies. EMC, Deutsche Telekom, PayPal, Oracle, IBM and Lockheed Martin have already set up offices (Israel Ministry of Foreign Affairs, 2015[55]).
Launched in 2017, the Australian Cyber Security Growth Network is an independent organisation, fully funded by government, which supports the development of a vibrant and globally competitive digital
189OECD DIGITAL ECONOMY OUTLOOK 2020 © OECD 2020
7. DIGITAL SECURITY 7. DIGITAL SECURITY
security sector (AustCyber, n.d.[56]). It advises digital security companies, helping them identify sectoral challenges. In total, there are 300 digital security companies in its ecosystem, and the organisation provides USD 50 million to 15 projects.
In 2018, the United Kingdom’s Department for Digital, Culture, Media & Sport, launched the London Office for Rapid Cybersecurity Advancement (LORCA), in partnership with Plexal, Deloitte and Queen’s University Belfast. LORCA hosts digital security start-ups on its campus at Here East in London. Its mission is to support digital security innovators in scaling and developing solutions to meet industry’s biggest challenges (LORCA, n.d.[57]). To that end, it selects start-ups for a 12-month scale-up programme that helps small and large organisations, investors, academics and the international community connect with each other. In 2020, LORCA had supported 45 start-ups since its creation, from 9 in its first cohort to 20 in its fourth cohort (2020).
Singapore established the region’s first digital security entrepreneur hub, the Innovation Cybersecurity Ecosystem (ICE71), in 2018. Based in Singapore, ICE71 is a partnership between Singtel Innov8 (the venture capital arm of the Singtel Group) and the National University of Singapore (NUS) through its entrepreneurial arm NUS Enterprise (ICE71, n.d.[58]). ICE71 strengthens the region’s growing digital security ecosystem by attracting and developing technologies to mitigate the rapidly increasing digital security risk. ICE71 runs programmes to support digital security start-ups from idea development to scaling, supported by the Cyber Security Agency of Singapore and the Info-Communications Media Development Authority. It has supported and empowered over 70 start-ups since its launch in March 2018 (ICE71, n.d.[58]).
The German government set up the Agency for Innovation in Cyber Security in 2018 to fund and promote ambitious research and development projects with high innovation potential in the area of digital security. Inspired by the Defense Advanced Research Projects Agency in the United States, the German agency was created under the leadership of the interior and defence ministries. It focuses on technologies for both civilian and defence uses to increase the country’s independence in this area (BMI, 2020[59]). In addition, the German government has been funding Self-determined and Secure in the Digital World 2015-2020, a research programme on digital security involving the private sector.
France released a Cyber Campus Report in 2020, outlining plans for a centre for digital security and trust in France and in Europe (Van Den Berghe, 2020[60]). The Cyber Campus will aim to provide a multi-stakeholder platform to facilitate digital security innovation. It will involve actors from academia, the private sector, the government and start-ups. The digital security ecosystem campus, expected to open in 2021, is being developed with France’s national digital security agency (Agence nationale de la sécurité des systèmes d’information).
In 2016, the European Union created the European Cyber Security Organisation (ECSO), a public-private partnership that co-ordinates EU innovation roadmaps and investments. It brings many different voices into the discussion: academia, industry, SMEs and member states (ECSO, n.d.[61]). ECSO helps identify priorities at European level, building on European strengths and focusing on European issues and impacts. It prioritises investments across many technical areas, such as AI, quantum computing and blockchain, as well as non-technical areas such as SMEs, women in cyber and youth in cyber.
An effective and comprehensive ecosystem is required to support digital security innovation. However, it can take time to build, particularly with technological development and disruptive technologies rising at exponential speed. Several ingredients make a successful digital security ecosystem: human capital, venture capital, strong linkages between key stakeholders and a supportive regulatory environment.
In most of these initiatives, the government plays a key role in establishing the ecosystems and ensuring co-ordination among the various stakeholders. Government can also support innovation by addressing the growing shortage of digital security professionals. For example, Canada promotes talent development by teaching programming and digital skills to children from a young age. This is part of its initiative to connect these students to industry (Public Safety Canada, 2018[62]).
Government can also promote sustainable linkages between academia, industry, government itself, entrepreneurs and financial actors. Regular communication between different stakeholders is key for the success of a digital security innovation ecosystem. This is especially true for communication that
190 OECD DIGITAL ECONOMY OUTLOOK 2020 © OECD 2020
7. DIGITAL SECURITY 7. DIGITAL SECURITY

delves deeply into an issue to find problems that need solving. In that respect, physical proximity is important, even in an age of online connectivity. Moreover, co-operation is crucial, not just within ecosystems but also between them. Ecosystems can work together to reduce national, regional and global risk. Global EPIC (Box 7.2) is an initiative to connect such ecosystems together across borders.
Box 7.2. Global EPIC, an international initiative to co-ordinate digital security innovation ecosystems
The Global Ecosystem of Ecosystems Partnership in Innovation and Cybersecurity (Global EPIC) promotes co-operation between digital security ecosystems across the world. What began with leaders of ecosystems coming together to discuss best practices today has over 27 members from 15 different countries and 3 continents. Its members’ ecosystems were formed through academia, local government, industry hubs and sometimes a combination of the three. Through the organisation, ecosystem leaders can compare one another’s frameworks and figure out what ideas are worth taking to their own ecosystems. The Global EPIC Soft-Landing Program is a means to strengthen ties between the ecosystems. It offers companies and entrepreneurs an opportunity to “soft land” in one of the Global EPIC ecosystems, providing a low-risk trial to companies and entrepreneurs entering a new international market. This allows them to access the resources needed to tap into commercial opportunities more readily.
Source: Global EPIC (n.d.[63]), Global EPIC, https://globalepic.org/ (accessed on 6 April 2020).
Initiatives to improve digital security of products and better manage vulnerabilities
All products that contain code are vulnerable, to some extentWith the digital transformation, more and more products contain code and can interconnect. Any product that contains code also contains vulnerabilities. According to estimates, there are between 20 and 100 flaws in every 2 000 lines of code (Dean, 2018[64]). This can come down to one flaw in every 2 000 lines if “security-by-design” guidelines are followed (DCMS, 2018[65]). To put things in perspective, an average iPhone app has around 50 000 lines of code. Meanwhile, Android has around 12 million lines and Windows 10 counts more than 50 million. On average, 46 vulnerabilities were discovered and publicly disclosed every day on the United States’ National Vulnerability Database in 2018 and 2019, including for widely used products such as Android, iOS or Windows (NIST, 2020[66]).
However, all vulnerabilities are not critical. According to an automatic analysis of 1.4 million software applications, 85% contain at least one vulnerability, but it is critical in only 13% of cases (Veracode, 2019[67]). Similarly, not all vulnerabilities are easily exploitable. For some, exploitation requires physical presence and human interaction, while others can be exploited remotely.
Several high-profile attacks have highlighted significant gaps in the digital security of products. They showed the damages that can result from the exploitation of critical vulnerabilities if these are not timely and appropriately mitigated.
In 2016, the Mirai malware enrolled millions of connected devices, from routers to security cameras and printers, into a botnet. The botnet was then used to launch massive DDoS attacks. This affected actors of the Internet infrastructure such as Domain Name System service provider Dyn and cloud provider OVH. Mirai leveraged the lack of basic features of many IoT products, which often let users keep weak and factory default passwords.
In 2017, WannaCry and NotPetya affected thousands of organisations in OECD countries, including Renault, Honda, Boeing, Merck, Maersk and the United Kingdom’s National Health Service. Total costs amounted to several billion euros. Both malwares leveraged vulnerabilities in Windows operating systems. For the products it still supported at the time, Microsoft provided a patch fixing the vulnerability several weeks before the attack began. This, however, did not stop the global spread of the virus. In fact, many organisations did not deploy the security update in a timely manner, leaving their information systems vulnerable.
191OECD DIGITAL ECONOMY OUTLOOK 2020 © OECD 2020
7. DIGITAL SECURITY 7. DIGITAL SECURITY

In other cases, the organisations that fell victim to WannaCry were using an operating system (e.g. Windows XP) that had reached its “end of life” (i.e. the end of commercial support). For these products, no security updates were available before the attack. Facing considerable pressure from public opinion, the company considered it had a responsibility to protect the thousands of organisations left vulnerable to the malware. Therefore, the day after the WannaCry attack began, Microsoft provided an emergency update for products it no longer supported.
The decision was controversial. Some experts believed it could give end-users added incentive to continue using products after the end of commercial support. Others consider the source code of products that have reached their end of life should be released to the public, allowing the community of users to maintain it.
WannaCry highlighted the considerable gap between the end of commercial support and when users actually stop using their systems. The gap leaves many products vulnerable since security updates are no longer available. While the effects of this gap have mostly affected the software industry to date, they will also be significant for IoT products in years to come.
A market failure prevents optimal outcomes to emergeAcross the product ecosystem, stakeholders’ incentives to take responsibility for the digital security of products are often misaligned. Digital security features are often at odds with other factors such as usability and price, which consumers may value more. In innovative and emerging markets such as the IoT, producers typically value time-to-market and cost reduction over digital security. Following security-by-design and by-default guidelines requires resources, including time, talent and money. Smaller or less digitally mature companies may lack these funds or be unwilling to invest in digital security. In more mature markets such as computers or smartphones, producers are likely to shorten their products’ lifecycle and accelerate their “end of life”. This allows them to focus resources on developing new products rather than maintaining those that have been on the market for a few years already.
The Mirai malware highlighted significant information asymmetries and negative externalities in the IoT market. In the absence of clear information (e.g. labels), customers often struggle to assess the level of digital security of purchased products. In the long term, this may lead to adverse selection. Producers who invest in digital security, unable to differentiate their products from competitors, might exit the market. The case of DDoS attacks also illustrates the impact of negative externalities. Product owners are often unaware their devices are enrolled in a botnet, and do not bear the costs of the attacks.
These elements typically lead to a market failure, which could explain why many products have a suboptimal level of digital security.
Stakeholders are taking steps to address product-related challengesSeveral industry players have established multi-stakeholder coalitions to address gaps in digital security.
The Charter of Trust, launched in 2018, gathers companies with different roles along the value chain. They aim to create a reliable foundation for trust in the digital environment on the basis of ten shared principles. These companies include Airbus, Allianz, Dell, IBM, Mitsubishi Heavy Industry, SGS, Siemens, Total and TÜV SÜD.
In parallel, 120 ICT sector companies such as ARM, Cap Gemini, Cisco, Cloudfare, HP, Hitachi, Microsoft, Salesforce and Telefónica joined the Cybersecurity Tech Accord to partner on initiatives that improve the security, stability and resilience of cyberspace. Lastly, supporters of the Paris Call for Trust and Security in Cyberspace launched by France at the 2018 Internet Governance Forum agreed to strengthen the security of digital processes, products and services, throughout their lifecycle and supply chain.
In OECD countries, governments increasingly recognise the need to improve product transparency to reduce information asymmetries. Some governments have encouraged voluntary labelling to help consumers choose products with a higher level of digital security. At the same time, the labels aim to incentivise manufacturers and designers to follow industry best practices.
Finland, Japan and Germany have all begun to promote labels. In November 2019, the Finnish government partnered with industry to launch an IoT security label. The German government also plans to launch a
192 OECD DIGITAL ECONOMY OUTLOOK 2020 © OECD 2020
7. DIGITAL SECURITY 7. DIGITAL SECURITY

labelling scheme in 2020 for routers. In other countries, governments are considering the generalisation of product certifications to reduce information asymmetries. In Japan, the Connected Consumer Device Security Council (CCDS), a business association to improve the security of consumer devices including IoT devices, started a voluntary labelling program for IoT devices in October 2019.
Facilitating multi-stakeholder partnerships is also an important tool for governments in countries such as the United States and the Netherlands.
In the United States, the National Telecommunications and Information Administration (NTIA) holds multi-stakeholder discussions to encourage software developers to provide a “software bill of materials”. This is similar to a list of ingredients that would indicate the code components of a product.
The Dutch government has launched a multi-stakeholder initiative to monitor and enhance the digital security of connected devices. The initiative enables information sharing between stakeholders, including manufacturers/vendors and end-users. In this way, distributors can consider removing products from the shelves. For their part, consumers can be incentivised to patch or deactivate their products if critical vulnerabilities are discovered. The partnership involves actors such as the University of Delft, the Dutch Ministry of Economic Affairs and a non-profit association of Dutch ISPs.
Other governments in the OECD have funded and/or facilitated the development of multi-stakeholder partnerships to tackle the issue of botnet. These include botfrei in Germany and the National Operation Towards IoT Clean Environment in Japan. At the European level, the Cybersecurity Act (Regulation (EU) 2019/881) is a key EU initiative to improve the digital security of ICT products, services and processes by creating a voluntary cybersecurity certification framework.
Finally, some governments are willing to go beyond voluntary frameworks. They recognise a suboptimal level of digital security in many products would pose significant risks to consumers, SMEs and the economy more broadly. These governments are mandating basic security features for all IoT products through regulatory requirements.
Both the United Kingdom and Japan have gone beyond voluntary frameworks. In the United Kingdom, the government plans to mandate manufacturers and vendors to implement the first three principles of the government’s guidelines for IoT security. These guidelines, developed in 2018, are “no default passwords”, “updatability” and “vulnerability disclosure policy”. In Japan, the regulator has also imposed regulatory requirements. Since April 2020, IoT products connected directly to the networks of telecommunications operators in Japan are required to incorporate certain basic functions (e.g. a firmware update mechanism, access control and incentives for users to change default passwords and IDs).
Responsible vulnerability management and disclosure is receiving increased policy attentionEvery piece of software has undiscovered or latent vulnerabilities. Threat actors, such as criminals and other ill-intentioned players, are eager to discover those vulnerabilities through exploiting them through malware. Therefore, discovering vulnerabilities, fixing them and reducing their overall number is equally important for digital security risk mitigation as tackling threats (i.e. arresting cybercriminals). Both approaches are necessary and complementary.
Vulnerabilities can affect the code of a product. When a vendor becomes aware of a vulnerability in its product’s code, it can develop a patch (or fix) that modifies this code. It can then distribute the patch to users through security updates. However, product users remain potentially vulnerable to an incident exploiting the vulnerability until they apply the patch, either automatically or manually.
Vulnerabilities can also be specific to the way a user implements the product, such as its configuration and settings. For example, if a user sets a weak password in equipment, it creates a vulnerability that can be exploited. An important number of such vulnerabilities are also found where users do not use patches to fix their products’ vulnerabilities. In 2018, according to one security product vendor, 81% of systems had at least one known vulnerability, 72% had more than one and 20% of systems had more than ten (Edgescan, 2019[68]).
Malicious actors are actively searching for both types of vulnerabilities. Product vulnerabilities for which no patch or mitigation technique is available are called “zero-days”. Attacks leveraging zero-
193OECD DIGITAL ECONOMY OUTLOOK 2020 © OECD 2020
7. DIGITAL SECURITY 7. DIGITAL SECURITY
days are significantly more likely to succeed because they are more difficult to detect and mitigate. Since zero-days are rare and highly effective, they have a high value for attackers. They use them only against targets worth the risk of detection; once the vulnerability is discovered, it spoils the possibility of future attacks. Attackers generally prefer to exploit known product vulnerabilities for which a patch may be available but not implemented by users.
Therefore, both vendors and users share a responsibility to mitigate vulnerabilities. However, they also face obstacles. For example, vendors can view the discovery of vulnerabilities, as well as developing and distributing patches, as less profitable than developing new features. For some organisations, patch management is costly, complex and risky. It can potentially destabilise their information systems by introducing new code that has not been sufficiently tested in their environment.
Fortunately, a large community of security researchers, often called “white hats” or “ethical hackers”, are also hunting vulnerabilities and eager to disclose them to help reduce digital security risk. Security researchers can significantly contribute to increasing digital security of products. According to a 2016 survey in the United States, the vast majority of researchers (92%) generally engage in some form of co-ordinated vulnerability disclosure (NTIA, 2016[69]). This represents a huge potential resource for vendors.
Although many white hats hunt vulnerabilities as a hobby or for the common good, many others do it as part of their professional security work. They can belong to the private sector or civil society. The survey shows that most researchers are interested in receiving some sort of reward. These range from simple acknowledgements, to the possibility of communicating about it publicly (e.g. in conferences, academic publications, etc.), to financial retribution and, possibly, job offers (NTIA, 2016[69]).
However, vulnerability disclosure can become counterproductive if not carried out appropriately. If security researchers publicly disclose a vulnerability, malicious actors can exploit it for offensive purposes. If patches are not yet ready, or products are not yet patched on the users’ side, attacks are most likely to be successful. Furthermore, researchers may offer vulnerabilities on the black market rather than disclosing them to vendors in view of being fixed. This enables actors to purchase and operationalise them for offensive purposes, increasing digital security risk for all legitimate actors.
Product vendors can also fail to handle a vulnerability reported to them by a security researcher. The researcher may then consider public disclosure to put pressure on the vendor to fix the vulnerability. For example, a security researcher reported a serious vulnerability in the Myspace website in 2017. The vulnerability allowed an attacker to log in to any one of the 3.6 million Myspace active users’ accounts in a few easy steps. After three months of inaction from the company, the researcher publicly disclosed the vulnerability in a blog post. The vulnerability was fixed within a few hours. The company never got back to the researcher (Spring, 2018[70]). A 2019 report shows that 93% of the Forbes Global 2000 do not offer a means for contacting them to disclose a critical vulnerability (HackerOne, 2019[71]).
Through co-ordinated vulnerability disclosure (CVD), product vendors and users, as well as security researchers, work co-operatively to find solutions that reduce the risk associated with a vulnerability. CVD aims for public disclosure of a vulnerability only after mitigations are available to end-users to reduce their window of exposure. CVD is widely recognised as a good practice to ensure that researchers and vendors act in a responsible manner for vulnerability disclosure. It is detailed in international standards such as ISO/IEC 29147 and 30111.
Unfortunately, there are obstacles to broad adoption of CVD. Many policy makers are not yet sufficiently aware of the need to remove such obstacles and encourage responsible behaviour by all stakeholders. For example, discovering vulnerabilities can expose researchers to legal risks and threats of proceedings by vendors; they have been accused of breaching terms of services, or having committed a cybercrime. There are numerous cases of vendors or service providers threatening researchers with legal proceedings after they have reported a vulnerability instead of co-operating with them to fix it as soon as possible.
In the above-mentioned survey, 60% of researchers cited the threat of legal action as a reason they might not work with a vendor to disclose a vulnerability (NTIA, 2016[69]). In 2016, for example, researchers at a US security company reported a serious vulnerability to one of the largest global consulting and auditing companies. Three days later they received a cease-and-desist letter (Whittaker, 2018[72]). In another case, a researcher reported a dental software company in the United States had left unencrypted
194 OECD DIGITAL ECONOMY OUTLOOK 2020 © OECD 2020
7. DIGITAL SECURITY 7. DIGITAL SECURITY

sensitive health information of 22 000 patients at risk of access by others. The US Federal Bureau of Investigation raided the researcher’s home and arrested him (Doe, 2016[73]).
A number of policy initiatives are encouraging the adoption of CVD. The Dutch National Cybersecurity Centre (NCSC-NL, 2018[74]), for example, adopted CVD guidelines. In addition, both the United States NIST Cybersecurity Framework (version 1.1) and the European Union Cybersecurity Act (European Union, 2019[75]) have included CVD guidelines.
At the time of writing, the United States Department of Homeland Security was also developing a binding operational directive. It would require each federal government agency to develop and publish a vulnerability disclosure policy and maintain supporting procedure (DHS, 2019[76]). The OECD also recommends operators of critical activities adopt such a policy (OECD, 2019[77]) (Box 7.3).
Box 7.3. The OECD Recommendation of the Council on Digital Security of Critical Activities
Adopted in December 2019, the OECD Recommendation of the Council on Digital Security of Critical Activities sets out a range of policy recommendations. They aim to ensure that policies targeting operators of critical activities focus on what is critical for the economy and society without imposing unnecessary burdens on the rest. These recommendations support adherents in:
● adapting their overarching policy framework
● ensuring that operators reduce the digital security risk to critical functions to a level acceptable for society in an effective manner
● promoting and building trust-based partnerships
● improving co-operation at the international level.
The Recommendation also clarifies how this public policy area relates to broader national risk management/critical infrastructure protection policy.
Source: OECD (2019[77]), Recommendation of the Council on Digital Security of Critical Activities, https://legalinstruments.oecd.org/en/instruments/OECD-LEGAL-0456.
Digital security and artificial intelligence An AI system is defined as a machine-based system that can, for a given set of human-defined objectives, make predictions, recommendations or decisions influencing real or virtual environments (OECD, 2019[78]). According to security expert Bruce Schneier, “there is no doubt that AI will transform digital security. We just don’t know how and when” (Schneier, 8 January 2019[79]).
Some elements confirm that we may be on the verge of a transformation in digital security through AI. However, it is still difficult to distinguish facts from marketing-driven speculations, and assess where the industry stands on the hype cycle. It seems too early to presume that AI has created a paradigm shift in digital security. Such a transformation may take place step-by-step rather than through a single brutal and radical change. Nevertheless, if AI is to transform digital security, it will likely do so by both supporting and challenging it.
AI can help improve digital security There can be many benefits to the use of AI to protect information systems. For example, AI-enabled digital security systems can be trained to identify behaviour of malware before entering IT systems. It can also be taught to detect such malware before they inflict damages. In that respect, these systems can be faster than traditional approaches and research on AI for digital security is becoming an important trend.
In addition to helping manage the increasing volume of vulnerabilities, AI can assist stretched and overworked digital security teams. This is especially useful given the shortage of skilled digital security professionals. AI can automate basic digital security tasks such as identifying the nature, source and
195OECD DIGITAL ECONOMY OUTLOOK 2020 © OECD 2020
7. DIGITAL SECURITY 7. DIGITAL SECURITY

intent of attacks and monitoring of high volumes of security data. In this way, security teams can devote more time to more sophisticated threats. Automation can also decrease the likelihood of human errors and negligence occurring.
Despite the efficacy of AI and automation in helping understaffed digital security teams, highly skilled employees will still be required for high-level analysis. For example, AI can help detect anomalous behaviours in a system. This may reveal the presence of a sophisticated intruder that a classic security system or a trained human would not otherwise notice. However, humans will still be needed to eliminate false positives. They will also need to determine the appropriate response to detected sophisticated attacks. In addition, AI’s abstract and highly dimensional nature may make it unclear why or how something was detected. For this reason as well, human oversight is important (National Academies of Sciences, Engineering, and Medicine, 2019[80]).
Digital security efforts by governments can benefit from using AI. For example, since 2018, the Korean Ministry of Science and ICT (MSIT) has been establishing an AI-based cyber incident response system. MSIT applies AI to systems such as detection, analysis and information sharing to help humans respond to security alerts and incidents.
According to some experts, the deployment of AI-powered security applications can reduce costs. In a survey of 850 IT executives, covering 7 sectors and 10 countries, 64% said that AI lowers the cost to detect and respond to breaches. This, in turn, reduces the overall time taken to detect threats and breaches by 12%, on average (Capgemini Research Institute, 2019[81]). Almost two in three security executives said they are planning to employ AI by 2020, compared to one in five organisations pre-2019. This indicates that AI in security is rapidly becoming more widespread. Meanwhile, 69% of organisations said that employing AI is necessary to respond to digital security attacks. A Ponemon Institute survey sponsored by IBM found that AI significantly reduced the time and cost of dealing with digital security threats. It indicated that deploying AI could save more than USD 2.5 million in operating costs (Ponemon Institute, 2018[82]). These surveys, however, are sponsored by companies with a vested interest in deploying AI solutions or renewing the market for IT security products.
AI can also help develop code with fewer vulnerabilities. Computer code is prone to human error; many digital security attacks result from flaws in software code. Given the billions of lines of code written every year and the re-use of third-party proprietary libraries, detecting and correcting errors in software code is a daunting task for the human eye.
Some research projects use AI systems to prevent or detect software security vulnerabilities. Mozilla, for example, uses an AI coding assistant developed by Ubisoft, the gaming company. It aims to make the Firefox code-writing process more efficient and prevent introduction of bugs (Zorz, 2019[83]).
AI techniques related to products’ digital security vulnerabilities can be grouped in three categories: detection, repair and specification analysis. While AI techniques have become quite useful in this area, researchers have found they still tend to be limited in scope. As a result, they provide a collection of tools that can augment, but not replace, careful system development to reduce vulnerability risks (Kommrusch, 2018[84]).
AI can also create new digital security challengesNotwithstanding the benefits of AI for digital security, the technology also introduces new risks. Like many tools, AI can be weaponised in various ways. In that sense, it can be viewed as a double-edged sword.
AI-powered security techniques are not perfect and sophisticated attackers can bypass them. Researchers assessed machine and deep learning approaches to problems in digital security, such as intrusion detection, malware analysis and spam detection. They found that, while these techniques support security, each approach was vulnerable to adversarial attacks (Apruzzese et al., 2018[85]). In addition, attackers can also use AI technologies meant to identify and fix vulnerabilities in software to hunt for new vulnerabilities. They then exploit these gaps to attack information systems.
Digital security incidents can affect all information systems, including those relying on AI. However, AI systems may also be vulnerable to new types of attack techniques that leverage the specificity of AI. For example, machine learning relies on data for its system to train itself.
196 OECD DIGITAL ECONOMY OUTLOOK 2020 © OECD 2020
7. DIGITAL SECURITY 7. DIGITAL SECURITY
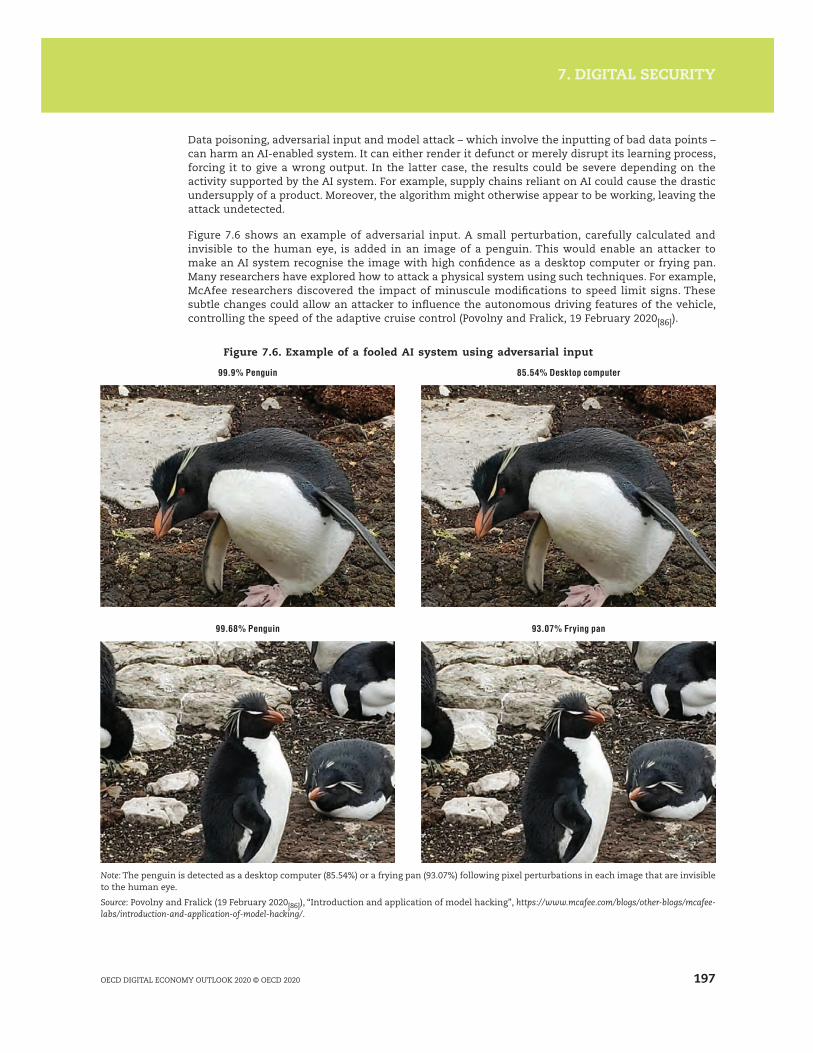
Data poisoning, adversarial input and model attack – which involve the inputting of bad data points – can harm an AI-enabled system. It can either render it defunct or merely disrupt its learning process, forcing it to give a wrong output. In the latter case, the results could be severe depending on the activity supported by the AI system. For example, supply chains reliant on AI could cause the drastic undersupply of a product. Moreover, the algorithm might otherwise appear to be working, leaving the attack undetected.
Figure 7.6 shows an example of adversarial input. A small perturbation, carefully calculated and invisible to the human eye, is added in an image of a penguin. This would enable an attacker to make an AI system recognise the image with high confidence as a desktop computer or frying pan. Many researchers have explored how to attack a physical system using such techniques. For example, McAfee researchers discovered the impact of minuscule modifications to speed limit signs. These subtle changes could allow an attacker to influence the autonomous driving features of the vehicle, controlling the speed of the adaptive cruise control (Povolny and Fralick, 19 February 2020[86]).
Figure 7.6. Example of a fooled AI system using adversarial input
99.9% Penguin
99.68% Penguin 93.07% Frying pan
85.54% Desktop computer
Note: The penguin is detected as a desktop computer (85.54%) or a frying pan (93.07%) following pixel perturbations in each image that are invisible to the human eye.
Source: Povolny and Fralick (19 February 2020[86]), “Introduction and application of model hacking”, https://www.mcafee.com/blogs/other-blogs/mcafee-labs/introduction-and-application-of-model-hacking/.
197OECD DIGITAL ECONOMY OUTLOOK 2020 © OECD 2020
7. DIGITAL SECURITY 7. DIGITAL SECURITY

AI-powered deep fakes can be generated using a sample of data based on machine learning. For example, a malicious actor could mine information about someone on the Internet through social media to generate email messages for phishing attacks that are difficult to detect (National Academies of Sciences, Engineering, and Medicine, 2019[80]). LyreBird is a company that uses AI to generate fake audio of an individual using sample recordings (WIRED, 2018[87]). Malicious actors could use such technologies to support social engineering techniques, deceiving employees into providing their credentials to attackers or transferring money into the bank account of someone pretending to be their boss. This practice, carried out mostly by email, is called “business email compromise” (BEC). The total known worldwide losses to BEC scams hit USD 12.5 billion between October 2013 and May 2018, with a total number of known victims reaching 78 617 (FBI, 2018[88]). AI could significantly increase this dangerous trend.
The use of AI for digital security can raise costs for adversaries, forcing them to find more sophisticated techniques that might be more susceptible to discovery (National Academies of Sciences, Engineering, and Medicine, 2019[80]). Adversaries are not yet using much AI, primarily because other cheaper techniques continue to be effective (National Academies of Sciences, Engineering, and Medicine, 2019[80]). As the cost of AI drops, it is likely that malicious actors will increasingly leverage AI to enhance their attack potential, starting with sophisticated cybercrime and state-sponsored groups. The outcome of both defenders and attackers using AI techniques is not yet clear. However, it may accelerate the digital security arms race between malicious and legitimate actors.
198 OECD DIGITAL ECONOMY OUTLOOK 2020 © OECD 2020
7. DIGITAL SECURITY 7. DIGITAL SECURITY

References
ANSSI and BSI (2018), ANSSI/BSI Common Situational Picture, Vol. 1, Agence nationale de la sécurité des systèmes d’information, Paris and Bundesamt für Sicherheit in der Informationstechnik, Bonn, https://www.ssi.gouv.fr/uploads/2018/07/bilateral-french-german-it-security-situation-report.pdf.
[12]
Apruzzese, G. et al. (2018), “On the effectiveness of machine and deep learning for cyber security”, 2018 10th International Conference on Cyber Conflict (CyCon), http://dx.doi.org/10.23919/cycon.2018.8405026.
[85]
AustCyber (n.d.), AustCyber, website, https://www.austcyber.com/ (accessed on 21 October 2020). [56]
Avanan (2019), Global Phish Report, Avanan, New York, https://www.avanan.com/hubfs/2019-Global-Phish-Report.pdf. [7]
Beedham, M. (2019), “Ethereum Classic hackers steal over $1.1M with 51% attacks”, The Next Web, 8 January, https://thenextweb.com/hardfork/2019/01/08/ehtereum-classic-51-percent-attack/.
[40]
BMI (2020), “Agentur für Innovation in der Cybersicherheit” [“Agency for Innovation in Cybersecurity”], Bundesministerium des Innern, für Bau und Heimat, Berlin, 29 August, https://www.bmi.bund.de/SharedDocs/kurzmeldungen/DE/2018/08/cyberagentur.html.
[59]
Canellis, D. (2018), “Major cryptocurrency exchange delists Bitcoin Gold following $18M hack”, The Next Web, 3 September, https://thenextweb.com/hardfork/2018/09/03/bittrex-delists-bitcoin-gold/.
[39]
Capgemini Research Institute (2019), Reinventing Cybersecurity with Artificial Intelligence, Capgemini Research Institute, Paris, https://www.capgemini.com/wp-content/uploads/2019/07/AI-in-Cybersecurity_Report_20190711_V06.pdf.
[81]
Charter of Trust (n.d.), Charter of Trust, website, https://www.charteroftrust.com/ (accessed on 31 March 2020). [52]
Chokshi, N. (2019), “Hackers are holding Baltimore hostage: How they struck and what’s next”, The New York Times, 22 May, https://www.nytimes.com/2019/05/22/us/baltimore-ransomware.html.
[29]
Cimpanu, C. (2020), “IOTA cryptocurrency shuts down entire network after wallet hack”, ZDNet, 16 February, https://www.zdnet.com/article/iota-cryptocurrency-shuts-down-entire-network-after-wallet-hack/.
[38]
Cimpanu, C. (2019), “Bithumb cryptocurrency exchange hacked a third time in two years”, ZDNet, 30 March, https://www.zdnet.com/article/bithumb-cryptocurrency-exchange-hacked-a-third-time-in-two-years/.
[36]
Cimpanu, C. (2018), “Ransomware attack blacks out screens at Bristol Airport”, ZDNet, 16 September, https://www.zdnet.com/article/ransomware-attack-blacks-out-screens-at-bristol-airport/.
[17]
CISA (2020), “Alert (AA20-049A) Ransomware impacting pipeline operations”, webpage, https://www.us-cert.gov/ncas/alerts/aa20-049a (accessed on 21 October 2020).
[34]
CISA (2018), “Alert (TA18-201A) Emotet malware”, webpage, https://www.us-cert.gov/ncas/alerts/TA18-201A (accessed on 21 October 2020).
[46]
CISO MAG (2019), 7 Times Ransomware Became a Major Healthcare Hazard, CISO MAG, https://www.cisomag.com/7-times-ransomware-became-a-major-healthcare-hazard/ (accessed on 21 October 2020).
[22]
Crane, C. (2019), “Polymorphic malware and metamorphic malware: What you need to know”, The SSL Store hashed out blog, 21 May, https://www.thesslstore.com/blog/polymorphic-malware-and-metamorphic-malware-what-you-need-to-know/.
[45]
Cybersecurity Tech Accord (n.d.), Cybersecurity Tech Accord, website, https://cybertechaccord.org/ (accessed on 21 October 2020). [53]
CyberSpark (n.d.), CyberSpark, website, http://cyberspark.org.il/ (accessed on 31 March 2020). [54]
DARK Reading (2020), “NRC health ransomware attack prompts patient data concerns”, DARK Reading, 21 February, https://www.darkreading.com/attacks-breaches/nrc-health-ransomware-attack-prompts-patient-data-concerns/d/d-id/1337116.
[24]
DCMS (2018), “Guidance data ethics framework”, webpage, http://www.gov.uk/government/publications/data-ethics-framework/data-ethics-framework (accessed on 21 October 2020).
[65]
Dean, B. (2018), Strict Products Liability and the Internet of Things, Center for Democracy and Technology, Washington, DC, https://cdt.org/wp-content/uploads/2018/04/2018-04-16-IoT-Strict-Products-Liability-FNL.pdf.
[64]
DHS (2019), Draft Binding Operational Directive 20-01 – Develop and Publish a Vulnerability Disclosure Policy, Cybersecurity and Infrastructure Security Agency, Washington, DC, 27 November, https://cyber.dhs.gov/bod/20-01/ (accessed on 21 October 2020).
[76]
Doe, D. (2016), “FBI raids dental software researcher who discovered private patient data on public server”, The Daily Dot, 29 February, https://www.dailydot.com/layer8/justin-shafer-fbi-raid/.
[73]
199OECD DIGITAL ECONOMY OUTLOOK 2020 © OECD 2020
7. DIGITAL SECURITY 7. DIGITAL SECURITY
References and Notes
ECSO (n.d.), “ECSO Cybersecurity Response Package”, webpage, https://ecs-org.eu/ (accessed on 21 October 2020). [61]
Eddy, N. (2020), “Ransomware attacks in 2019 forced some health systems to pay up”, Healthcare IT News, 2 January, https://www.healthcareitnews.com/news/ransomware-attacks-2019-forced-some-health-systems-pay.
[21]
Edgescan (2019), 2019 Vulnerability Statistics Report, Edgescan, Dublin, https://www.edgescan.com/wp-content/uploads/2019/02/edgescan-Vulnerability-Stats-Report-2019.pdf.
[68]
European Union (2019), Regulation (EU) 2019/881 of the European Parliament and of the Council of 17 April 2019 on ENISA (the European Union Agency for Cybersecurity) and on information and communications technology cybersecurity certification and repealing Regulation (EU) No 526/2013 (Cybersecurity Act), https://eur-lex.europa.eu/eli/reg/2019/881/oj (accessed on 21 October l 2020).
[75]
Eurostat (2019), Digital Economy and Society Statistics, Comprehensive Database. [4]
FBI (2018), “Business e-mail compromise the 12 billion dollar scam”, Public Service Announcement, Federal Bureau of Investigation, Washington, DC, 12 July, https://www.ic3.gov/media/2018/180712.aspx.
[88]
Gallagher, S. (2019), “Louisiana was hit by Ryuk, triggering another cyber-emergency”, Ars Technica, 21 November, https://arstechnica.com/information-technology/2019/11/louisiana-was-hit-by-ryuk-triggering-another-cyber-emergency/.
[31]
Garrity, M. (2019), “15 notable ransomware attacks on healthcare providers in 2019”, Becker’s Health IT, 18 December, https://www.beckershospitalreview.com/cybersecurity/15-notable-ransomware-attacks-on-healthcare-providers-in-2019.html (accessed on 21 October 2020).
[23]
Global EPIC (n.d.), Global EPIC, website, https://globalepic.org/ (accessed on 21 October 2020). [63]
Goodin, D. (2019), “Johannesburg’s network shut down after second attack in 3 months”, Ars Technica, 25 October, https://arstechnica.com/information-technology/2019/10/johannesburgs-network-shut-down-after-second-attack-in-3-months/.
[32]
Google (2020), “Safe Browsing”, webpage, https://transparencyreport.google.com/safe-browsing/overview?unsafe=dataset:1; series:malwareDetected,phishingDetected;start:978220800000;end:1581840000000&lu=unsafe (accessed on 21 October 2020).
[9]
Goud, N. (n.d.), “Ransomware attack on Cleveland Hopkins International Airport”, Cybersecurity Insiders, https://www.cybersecurity-insiders.com/ransomware-attack-on-cleveland-hopkins-international-airport/ (accessed on 21 October 2020).
[19]
Greenberg, A. (2018), “The untold story of NotPetya, the most devastating cyberattack in history”, WIRED, 22 September, https://www.wired.com/story/notpetya-cyberattack-ukraine-russia-code-crashed-the-world/.
[13]
HackerOne (2019), The Hacker-Powered Security Report 2019, HackerOne, San Francisco, https://www.hackerone.com/resources/reporting/the-hacker-powered-security-report-2019.
[71]
Héritier, C. (2019), “Protéger nos villes des cyberattaques”, Les Echos, 25 October, https://www.lesechos.fr/idees-debats/cercle/opinion-proteger-nos-villes-des-cyberattaques-1143037.
[28]
ICE71 (n.d.), ICE71, website, https://ice71.sg/ (accessed on 21 October 2020). [58]
Insurance Journal (2020), “Christmas ransomware attack hit New York airport servers”, Insurance Journal, 15 January. [20]
Israel Ministry of Foreign Affairs (2015), “Cabinet approves benefits for National Cyber Park in Be’er Sheva”, Government of Israel, Jerusalem, 6 September, https://mfa.gov.il/MFA/InnovativeIsrael/Economy/Pages/Cabinet-approves-benefits-for-National-Cyber-Park-in-Beer-Sheva-6-Sep-2015.aspx.
[55]
Kaspersky (2019), Story of the Year 2019: Cities under Ransomware Siege, Securelist, https://securelist.com/story-of-the-year-2019-cities-under-ransomware-siege/95456/ (accessed on 21 October 2020).
[25]
Kommrusch, S. (2018), “Artificial intelligence techniques for security vulnerability prevention”, ArXiv.org, 14 December, https://arxiv.org/pdf/1912.06796.pdf.
[84]
Korosec, K. (2019), “New Orleans declares state of emergency following ransomware attack”, Tech Crunch, 14 December, https://techcrunch.com/2019/12/14/new-orleans-declares-state-of-emergency-following-ransomware-attack/.
[30]
Liska, A. (2019), Early Findings: Review of State and Local Government Ransomware Attacks, Recorded Future, Boston, Massachusetts, http://www.recordedfuture.com.
[33]
LORCA (n.d.), LORCA, website, https://www.lorca.co.uk/ (accessed on 21 October 2020). [57]
Malwarebytes Labs (2020), 2020 State of Malware Report, Malwarebytes Labs, Santa Clara, California, https://resources.malwarebytes.com/files/2020/02/2020_State-of-Malware-Report.pdf.
[42]
McKay, T. (2019), “Florida City fires IT employee after paying $460,000 bitcoin ransom to hackers”, Gizmodo, 1 July, https://gizmodo.com/florida-city-fires-it-employee-after-paying-460-000-in-1836031022 (accessed on 21 October 2020).
[49]
National Academies of Sciences, Engineering, and Medicine (2019), Implications of Artificial Intelligence for Cybersecurity, National Academies Press, Washington, DC, http://dx.doi.org/10.17226/25488.
[80]
200 OECD DIGITAL ECONOMY OUTLOOK 2020 © OECD 2020
7. DIGITAL SECURITY 7. DIGITAL SECURITY
References and Notes
https://www.cybersecurity-insiders.com/ransomware-attack-on-cleveland-hopkins-international-airport/

NCSC-NL (2018), Coordinated Vulnerability Disclosure: The Guideline, National Cyber Security Centre, Ministry of Justice and Security, The Hague, https://english.ncsc.nl/binaries/ncsc-en/documents/publications/2019/juni/01/coordinated-vulnerability-disclosure-the-guideline/WEB_Brochure-NCSC_EN.pdf.
[74]
Netscout (2020), “Cloud in the crosshairs”, Netscout Threat Intelligence Report 15th Annual Worldwide Infrastructure Security Report, Netscout, Westford, Massachusetts, https://www.netscout.com/sites/default/files/2019-03/SECR_005_EN-1901%E2%80%93WISR.pdf#page=9&zoom=auto,-123,360.
[2]
Netscout (2019), Worldwide Infrastructure Security Report, Issue 4, Netscout, Westford, Massachusetts, https://www.netscout.com/sites/default/files/2020-02/SECR_001_EN-2001_Web.pdf.
[1]
NexusGuard (2019), Threat Report: Distributed Denial of Service (DDoS) Q3, NexusGuard, San Francisco, https://www.nexusguard.com/hubfs/Q3%202019%20Threat%20Report/2019Q3_Threat%20Report.pdf.
[3]
NIST (2020), National Vulnerability Database, (database), https://nvd.nist.gov/vuln/search/statistics?form_type=Basic&results_type=statistics&search_type=last3years (accessed on 21 October 2020).
[66]
NTIA (2016), Vulnerability Disclosure Attitudes and Actions, National Telecommunications and Information Administration, Washington, DC, https://www.ntia.doc.gov/files/ntia/publications/2016_ntia_a_a_vulnerability_disclosure_insights_report.pdf.
[69]
OECD (2020), The Role of Public Policy and Regulation in Encouraging Clarity in Cyber Insurance Coverage, OECD, Paris, http://www.oecd.org/finance/insurance/The-Role-of-Public-Policy-and-Regulation-in-Encouraging-Clarity-in-Cyber-Insurance-Coverage.pdf.
[51]
OECD (2019), Artificial Intelligence in Society, OECD Publishing, Paris, https://dx.doi.org/10.1787/eedfee77-en. [78]
OECD (2019), Recommendation of the Council on Digital Security of Critical Activities, OECD, Paris, https://legalinstruments.oecd.org/en/instruments/OECD-LEGAL-0456.
[77]
OECD (2015), Digital Security Risk Management for Economic and Social Prosperity: OECD Recommendation and Companion Document, OECD Publishing, Paris, https://dx.doi.org/10.1787/9789264245471-en.
[50]
Osborne, C. (2019), “Canadian Nunavut government systems crippled by ransomware”, ZDNet, 5 November, https://www.zdnet.com/article/canadian-nunavut-government-systems-crippled-by-ransomware/.
[26]
Palmer, D. (2020), “Ransomware attacks are now targeting industrial control systems”, ZDNet, 4 February, https://www.zdnet.com/article/ransomware-attacks-are-now-targeting-industrial-control-systems/.
[35]
PhishLabs (2019), 2019 Phishing Trends and Intelligence Report: The Growing Social Engineering Threat, PhishLabs, Charleston, South Carolina, https://info.phishlabs.com/hubfs/2019%20PTI%20Report/2019%20Phishing%20Trends%20and%20Intelligence%20Report.pdf (accessed on 21 October 2020).
[8]
Ponemon Institute (2018), The Value of Artificial Intelligence in Cybersecurity, Ponemon Institute, Traverse City, Michigan, https://www.themsphub.com/app/uploads/2018/09/ibm-ai-report-final-1_41017541USEN.pdf.
[82]
Povolny, S. and C. Fralick (19 February 2020), “Introduction and application of model hacking”, McAfee blogs, https://www.mcafee.com/blogs/other-blogs/mcafee-labs/introduction-and-application-of-model-hacking/.
[86]
Public Safety Canada (2018), National Cyber Security Action Plan (2019-2024), Public Safety Canada, Ottawa, https://www.publicsafety.gc.ca/cnt/rsrcs/pblctns/ntnl-cbr-scrt-strtg-2019/index-en.aspx.
[62]
RT World News (2017), “Ransomware virus plagues 100k computers across 99 countries”, RT World News, 12 May, https://www.rt.com/news/388153-thousands-ransomeware-attacks-worldwide/.
[14]
Saraogi, V. (2019), “Five times airports were involved in cyberattacks and data breaches”, Airport Technology, 24 July, https://www.airport-technology.com/features/five-times-airports-were-involved-in-cyberattacks-and-data-breaches/.
[18]
Schneier, B. (2019), “Machine learning to detect software vulnerabilities”, Schneier on Security blog, 8 January, https://www.schneier.com/blog/archives/2019/01/machine_learnin.html.
[79]
Seals, T. (2020), “U.N. weathers storm of Emotet-TrickBot malware”, threatpost, 15 January, https://threatpost.com/un-weathers-emotet-trickbot-malware/151894/.
[48]
SelfKey (2020), “A comprehensive list of cryptocurrency exchange hacks”, SelfKey, 13 February, https://selfkey.org/list-of-cryptocurrency-exchange-hacks/.
[37]
Senzee, T. (2019), “What happened in ransomware attack on Port of San Diego”, San Diego Reader, 10 April, https://www.sandiegoreader.com/news/2019/apr/10/city-lights-happened-ransomware-port-san-diego/.
[16]
Spring, T. (2018), “The vulnerability disclosure process: Still broken”, threatpost, 5 September, https://threatpost.com/the-vulnerability-disclosure-process-still-broken/137180/ (accessed on 21 October 2020).
[70]
Symantec (2019), ISTR Internet Security Threat Report Volume 24, Symantec, Tempe, Arizona, https://docs.broadcom.com/doc/istr-24-2019-en (accessed on 21 October 2020).
[5]
The Morning Call (2018), “City of Allentown computer systems hit by virus that will require nearly $1M fix”, 20 February. [47]
201OECD DIGITAL ECONOMY OUTLOOK 2020 © OECD 2020
7. DIGITAL SECURITY 7. DIGITAL SECURITY
References and Notes

Trend Micro (2019), 2019 Midyear Security Roundup: Evasive Threats, Pervasive Effects, Trend Micro, Tokyo, https://documents.trendmicro.com/assets/rpt/rpt-evasive-threats-pervasive-effects.pdf (accessed on 21 October 2020).
[43]
Trustwave (2019), Trustwave Global Security Report 2019, Trustwave, Chicago, http://trustwave.azureedge.net/media/16096/2019-trustwave-global-security-report.pdf (accessed on 21 October 2020).
[41]
Tsonchev, A. (2018), “Troubled waters: Cyber-attacks on San Diego and Barcelona’s ports show risk of IT/OT convergence”, Computing, https://www.computing.co.uk/sponsored/3064194/troubled-waters-cyber-attacks-on-san-diego-and-barcelonas-ports-show-risk-of-it-ot-convergence (accessed on 30 October 2020).
[15]
Van Den Berghe, M. (2020), Campus Cyber: Fédérer et faire rayonner l’écosystème de la cybersécurité, Agence nationale de la sécurité des systèmes d’information, Paris, https://www.ssi.gouv.fr/uploads/2019/10/campuscyber-rapport.pdf (accessed on 21 October 2020).
[60]
Venafi (2018), Venafi Research Brief: The Risk Lookalike Domains Pose to Online Retailers, Venafi, Salt Lake City, https://www.venafi.com/sites/default/files/2018-09/Venafi-Research-Retail-Lookalike-Domains-1809.pdf (accessed on 20 October 2020).
[10]
Veracode (2019), The State of Software Security Today Volume 9, Veracode, Burlington, Massachusetts, https://www.veracode.com/sites/default/files/pdf/resources/reports/state-of-software-security-volume-9-veracode-report.pdf.
[67]
Verizon (2019), “2019 Data Breaches Investigations Report”, webpage, http://veriscommunity.net/veris_webapp_min.html (accessed on 21 October 2020).
[6]
Vitard, A. (2020), “Les services administratifs du Grand Est sont paralysés par une cyberattaque depuis une semaine”, L’Usine digitale, 21 February, https://www.usine-digitale.fr/article/les-services-administratifs-du-grand-est-sont-paralyses-par-une-cyberattaque-depuis-une-semaine.N932494 (accessed on 21 October 2020).
[27]
Webroot (2019), 2019 Webroot Threat Report, Webroot, Broomfield, Colorado, https://www-cdn.webroot.com/9315/5113/6179/2019_Webroot_Threat_Report_US_Online.pdf (accessed on 21 October 2020).
[11]
Whittaker, Z. (2018), “Lawsuits threaten infosec research — just when we need it most”, ZDNet, 19 February, https://www.zdnet.com/article/chilling-effect-lawsuits-threaten-security-research-need-it-most/ (accessed on 21 October 2020).
[72]
WIRED (2018), “How Lyrebird uses AI to find Its (artificial) voice”, WIRED, https://www.wired.com/brandlab/2018/10/lyrebird-uses-ai-find-artificial-voice/ (accessed on 30 October 2020).
[87]
You, I. and K. Yim (2010), “Malware obfuscation techniques: A brief survey”, 2010 International Conference on Broadband, Wireless Computing, Communication and Applications, http://dx.doi.org/10.1109/BWCCA.2010.85.
[44]
Zorz, Z. (2019), “Mozilla will use AI coding assistant to preemptively catch Firefox bugs”, Help Net Security, 15 February, https://www.helpnetsecurity.com/2019/02/15/mozilla-ubisoft-ai-coding-assistant/ (accessed on 21 October 2020).
[83]
Note
1. https://coronavirus.jhu.edu/map.html.
202 OECD DIGITAL ECONOMY OUTLOOK 2020 © OECD 2020
7. DIGITAL SECURITY
References and Notes
https://www.venafi.com/sites/default/files/2018-09/Venafi-Research-Retail-Lookalike-Domains-1809.pdf

Chapter 8CONSUMER POLICY IN THE DIGITAL
TRANSFORMATION
203OECD DIGITAL ECONOMY OUTLOOK 2020 © OECD 2020

KEY FINDINGS
�� The digital transformation is rapidly impacting the consumer marketplace, enabling purchases in multiple channels, contexts and settings. The COVID-19 crisis has accelerated these trends by leading more consumers and businesses on line.
�� New technologies, such as artificial intelligence (AI) and the Internet of Things (IoT) offer greater consumer choice and personalisation, cost savings, and more convenience. At the same time, they pose new risks to safety, privacy and security, have the potential for discrimination against disadvantaged groups, and may undermine consumer trust if they are inadequately explained or if their use is not transparent. Other issues include interoperability, accountability and liability for interconnected devices, licensing and ownership, and the impact of planned obsolescence.
�� Consumer policy makers are increasingly recognising the need to keep pace with technological developments and to work with counterparts in other relevant policy areas to ensure that consumers are adequately protected from unfair practices and unsafe products. They are also increasingly adopting a multidisciplinary approach to identify and address consumer policy issues, incorporating learnings from economics, psychology, cognitive and social sciences and empirically tested results in order to understand and guide consumer behaviour.
IntroductionThis chapter outlines some of the key technological trends and developments affecting consumer policy in the digital transformation. It provides an overview of consumer benefits and risks associated with new technologies, including the Internet of Things and artificial intelligence. It discusses how these new technologies can, or could, be employed to enhance consumer protection and product safety. It also examines how consumer biases impact consumer behaviour online. It highlights policy makers’ growing recognition of the need to consider behavioural insights in designing more effective consumer policies. It reflects on how policies can enhance consumer trust and thereby maximise the development and adoption of new technologies.
Technological trends and developmentsE-commerce is in transition. Traditional e-commerce “storefronts” and marketplaces are moving to environments that enable consumers to make purchases in multiple channels, contexts and settings. These range from social media marketplaces to voice-activated transactions. In addition, digital and mobile payment is providing consumers with greater convenience and new types of consumer-facing products fuelled by consumer data and incorporating new technologies continue to emerge.
The COVID-19 crisis has accelerated these trends, and associated challenges, leading more consumers to access goods and services on line. This has caused many businesses to rapidly adopt a digital model in response (OECD, 2020[1]). Many of these online shifts will likely remain once the health crisis dissipates, as consumers and businesses grow used to the convenience of online channels.
Benefits and risks of new technologiesBusinesses are increasingly using new technologies in a range of innovative consumer products. These developments could benefit consumers by offering the following:
● New and innovative goods and services, providing greater choice for consumers. For example, many IoT products bring entirely new services and functionalities (OECD, 2018[2]; 2018[3]).
● Cost savings, including reduced transaction and search costs.
● Greater personalisation, building on the wealth of consumer data collected online, to constantly offer more tailored products and services to consumers (OECD, 2019[4]; Consumers International, 2019[5]).
204 OECD DIGITAL ECONOMY OUTLOOK 2020 © OECD 2020
8. CONSUMER POLICY IN THE DIGITAL TRANSFORMATION 8. CONSUMER POLICY IN THE DIGITAL TRANSFORMATION

● Convenience, customisation and remote control, especially for a number of IoT products in the smart home (OECD, 2018[2]; 2018[3]).
● Support for biased-free decisions. Products powered by AI, such as digital assistants, can theoretically make suggestions free from consumers’ behavioural biases (OECD, 2019[4]).
However, a number of new consumer risks are associated with new technologies:
● Transparency and disclosure. Adequate disclosures and transparency are important to building consumer trust and effective competition in the digital transformation (OECD, 2010[6]). Lack of transparency and overly complex, legalistic or otherwise inadequate disclosures, especially about how consumer data are collected, used and shared, appears to be common (OECD, 2018[3]; OECD, 2017[7]; Consumers International and The Internet Society, 2019[8]; OECD, 2019[9]). A similar lack of transparency may exist in regard to when and how AI is used in consumer goods and services. Consumers may also be kept in the dark about planned obsolescence of products relying on aftermarket support. This may create unexpected costs for consumers who need to replace devices.
● Discrimination and choice. More collection and use of consumer data, coupled with the use of AI could lead businesses to discriminate against consumers. This could manifest in pricing, or in presentation of offers and information (Richmond, 2019[10]; OECD, 2019[11]). It also presents the risk of unfair or discriminatory outcomes or perpetuation of socio-economic disparities (Smith, 8 April 2020[12]). This may involve discrimination against already disadvantaged groups of consumers, such as women and ethnic minorities.
● Privacy and security. Personal data are increasingly collected and used. Meanwhile, IoT products, such as digital assistants, health tracking devices and “smart home” appliances, continue to proliferate and are increasingly interconnected. This can increase threats to privacy and security (OECD, 2018[2]; 2018[3]).
● Interoperability. Interoperability is key to ensuring that different systems and devices can work together. Some restrictions on interoperability may spur innovation, and improve privacy and security. However, a degree of interoperability is needed to avoid “lock-in” and support choice and competition (OECD, 2018[3]).
● Accountability. Consumers may struggle to understand who is accountable and liable for interconnected IoT devices and ecosystems. It may not be clear to consumers which part of the ecosystem (or service support) caused the issue or fault with their device (OECD, 2018[2]; 2018[3]). Accountability is also a key issue for AI. The OECD Recommendation of the Council on Artificial Intelligence requires that AI actors be accountable for the proper functioning of their systems, and for respect of the principles in the Recommendation (OECD, 2019[13]).
● Ownership. When a consumer buys an IoT device (or a product using AI), they buy the device itself (the hardware), and a licence granting the right to use the software. The licensing conditions may limit the degree to which a product may be repaired, modified or resold, undermining traditional assumptions regarding product ownership (OECD, 2018[3]).
● Need for aftermarket support. Most IoT devices require software support and Internet connection to work effectively. If a manufacturer withdraws support, a device may not function as intended. Further, a lack of support could make a device vulnerable to security breaches. This could result in risks to privacy, security or safety (OECD, 2018[3]).
Enhancing consumer protection with new technologiesNew technologies provide new benefits and risks for consumers. At the same time, they offer new opportunities for policy makers, enforcement agencies and civil society in tracking and identifying emerging consumer issues and violations of the law. They also offer new ways of potentially protecting consumers from certain threats, including unsafe products.
AI could help consumer protection authorities identify “dark patterns” and fake consumer ratings and reviews on line. In addition, it could be used to scan online ratings and reviews, as well as comments on social media and other websites, such as marketplaces. This could identify recurring themes and issues that represent consumer problems.
A recent study by Mathur et al. (Mathur et al., 2019[14]) of Princeton University’s Center for Information Technology used AI to identify “dark patterns” in a survey of 53 000 product pages from 11 000 shopping websites. Dark patterns are tactics employed by businesses in websites and apps to coerce, steer, or
205OECD DIGITAL ECONOMY OUTLOOK 2020 © OECD 2020
8. CONSUMER POLICY IN THE DIGITAL TRANSFORMATION 8. CONSUMER POLICY IN THE DIGITAL TRANSFORMATION

deceive consumers into making unintended and potentially harmful decisions (Mathur et al., 2019[14]; Dark Patterns, n.d.[15]). Dark patterns may take various forms. Examples include using opt-out check boxes to sneak unwanted items into online shopping carts, subscriptions that are easy to start but difficult to cancel or using language to shame a consumer into opting into something (Dark Patterns, n.d.[15]). The technology and methodology used by Mathur et al. could presumably be adapted and used by consumer agencies or other interested parties to scan and identify certain forms of concerning conduct used by online businesses.
The identification of fake reviews, which may also constitute a dark pattern, is another area in which there could be a role for AI or related technologies. Consumers are indeed increasingly relying on online ratings and reviews despite concerns about the truthfulness of some online ratings and reviews (Ofcom, 2017[16]; Lester, 2019[17]). In the OECD’s survey on consumer trust in peer-platform marketplaces, 73% of consumers identified the ability to see ratings and reviews as an important trust mechanism (OECD, 2017[7]). Methodologies that could help identify fake reviews would be useful in improving the overall reliability and trustworthiness of online ratings and reviews, which is important to consumer trust in e-commerce.
Such uses of AI for enforcement and policymaking purposes, however, could raise legal, ethical, or other challenges for consumer authorities, and there may be, for example, limitations imposed by data protection laws. Consumer authorities are beginning to consider how to deal with these and other issues (i.e. privacy and data security) including through exchanges in international enforcement networks.
New technologies also underpin development of a range of new goods and services to protect consumers on line. Some envision a world where algorithms can do everything for the consumer – from identifying a need to selecting the best deal to ordering and paying for a product or service on line (Gal and Elkin-Koren, 2017[18]). The development of algorithmic consumers is in its infancy, but online price comparison sites based on algorithms are well established. Other new consumer tools are also being developed, including tools to assist consumers in identifying potentially problematic terms and conditions in end-user license agreements.
Enhancing consumer product safety with new technologiesNew technologies, such as the IoT and AI, may also be used in innovative ways to enhance consumer product safety.
The Internet of ThingsThe IoT includes all devices and objects whose state can be altered via the Internet, with or without the active involvement of individuals (OECD, 2018[19]). While connected objects may require the involvement of devices considered part of the “traditional Internet”, this definition excludes laptops, tablets and smartphones already accounted for in current OECD broadband metrics. The range and number of devices incorporating IoT technology is growing rapidly across OECD countries (OECD, 2018[2]). It increasingly includes many non-traditional devices (including household locks, cameras, and automobiles) connected en masse in order to deliver seamlessly connected experiences in households and businesses.
Manufacturers may be able to identify and remedy product safety issues in IoT products more efficiently due to their Internet connection. Some examples follow:
● Tracking and tracing products in the market may help identify affected consumers in the context of a product safety recall.
● Remote monitoring may enable quicker detection of safety defects in products. In some cases, defects can be remedied via remote software patches. This would avoid the need for recalls and reduce consumer inconvenience and recall fatigue.
● Consumers could receive real-time alerts of product recalls via their display screen or audio capability.
● Manufacturers could power down or switch off recalled products remotely while the products remain in the consumers’ hands.
A recent example of the capabilities of IoT technology to enhance product safety occurred in the recall by Samsung of 4.6 million Galaxy Note7 phones. In 2016, Samsung conducted a software update that
206 OECD DIGITAL ECONOMY OUTLOOK 2020 © OECD 2020
8. CONSUMER POLICY IN THE DIGITAL TRANSFORMATION 8. CONSUMER POLICY IN THE DIGITAL TRANSFORMATION

reduced the battery capacity of the phones that were still in consumers’ hands down to 0%. It also sent more than 23 million recall alerts and push notifications to its customers on their affected phones (OECD, 2018[20]).
Despite these benefits, the IoT market may also bring new safety risks due to the increasing complexity of products and the growing and competitive environment that has pushed businesses to get IoT products to market as quickly and inexpensively as possible. An IoT product may be unsafe when entering the market due to a latent software defect, but may also become unsafe once placed on the market following a software update. The integrity and quality of input data may also impact the safety of those IoT products that rely on data inputs. For example, an automated vehicle may rely on input data to detect safety and performance issues and to schedule maintenance. IoT products may also present a safety risk if they lose Internet connectivity during use. Safety risks may also emerge if consumers continue to use IoT devices that are considered “end-of-life” and are no longer monitored or serviced by the manufacturer.
In addition, there is growing recognition of the convergence between product safety, privacy and digital security in the IoT. Given that all software contains vulnerabilities, malicious actors could exploit or hack IoT devices. For example, they may use IoT devices to track an individual’s location for surreptitious surveillance.
Concerns with consumer security and safety are growing, and many private-sector initiatives are underway to keep up with IoT safety and security challenges. The dynamic risk environment also requires proactive engagement from consumers and governments to address cross-cutting cyber resilience challenges as government regulatory efforts in this space are still nascent.
Indeed, as the IoT continues to grow and permeate our lives, complex consumer policy issues continue to emerge that may raise competing interests. For example, the ability for manufacturers to remotely power down products already in the market in order to address hardware/software issues may provide obvious benefits to product safety, but has also been criticised given the impact on a product’s performance and value.
Artificial intelligenceAI has the potential to improve consumer product safety in the near future. AI-embedded products with the capabilities to learn based on the collection of consumer data may be designed to adapt to consumer behaviour, within the limits of applicable data protection laws. In theory, such products could detect consumer behaviour patterns. For example, they may identify an unintended use of the product, one not anticipated by the designer that may create a safety risk. In such cases, the product may adapt its own performance to reduce or eliminate the risk. AI may also enable products to predict the need for servicing or maintenance based on their use over time.
AI also has other uses in post-market product safety surveillance of both connected and unconnected products. AI may help identify safety risks by analysing usage data collected from products across complex and global supply chains, enabling early detection of product defects and earlier interventions in the form of product recalls and improvements to safety features if the product is still in production. AI may also interrogate data collected from other sources, such as product review sites, to identify new and emerging product safety risks. Some online marketplaces are already using AI to block or remove banned and recalled products from their sites by identifying keywords used in product descriptions.
On the other hand, AI may also bring new risks of manipulation of consumer preferences or failure of the AI-embedded product through biases and system vulnerabilities. That is why an AI system’s robustness, security and safety must be ensured not only at the time of creation or launching of the system, but over its entire life cycle (OECD, 2019[13]).
Key challenges for governmentsGovernments need to consider how to adapt, change, and implement consumer policy in this age of rapid technological progress. While consumer policy is generally broad enough to cover new technologies and business models, governments should ensure that there are no gaps in government
207OECD DIGITAL ECONOMY OUTLOOK 2020 © OECD 2020
8. CONSUMER POLICY IN THE DIGITAL TRANSFORMATION 8. CONSUMER POLICY IN THE DIGITAL TRANSFORMATION

policy and competency that leave consumers exposed (OECD, 2019[21]). Governments have a key role in ensuring that new technologies are being used in a human-centric, ethical, and sustainable way to maintain consumer trust.
Another key challenge for governments is to ensure they have the necessary technical expertise to understand these emerging issues. This will allow them to make and enforce policy effectively. In addition, many risks span several areas, including data protection, privacy, consumer protection, competition, intellectual property and security. Therefore, consumer authorities need to co-operate and co-ordinate with their counterparts in other relevant disciplines. Furthermore, the global nature of the digital transformation implies that governments increasingly need to co-operate across borders. They should enhance their authority to do so, including by implementing the co-operation provisions of the 2016 Recommendation of the Council on Consumer Protection in E-commerce (hereafter “E-commerce Recommendation”) (OECD, 2016[22])and the 2003 OECD Guidelines for Protecting Consumers from Fraudulent and Deceptive Commercial Practices Across Borders (OECD, 2019[21]).
When it comes to risks associated with new technologies, there is scope for consumer policy to consider the vulnerabilities of different groups of consumers, including the elderly and children, to target protections and awareness accordingly. In this way, they can ensure the benefits of new technologies are shared across society. Some consumer groups, such as the elderly, may be more prone to online scams (ACCC, 2020[23]) and data protection and privacy concerns may be more sensitive when it comes to IoT products used by, and aimed at, children who may be less aware of the risks (OECD, 2018[2]).
In addition, the COVID-19 crisis shows that policy makers should also consider whether large-scale events, such as pandemic or natural disaster, might render wider groups of consumers vulnerable to online commercial exploitation. For example, the pandemic has made many mainstream groups of consumers more vulnerable. Job and financial losses, along with fear and anxiety regarding the virus, may open consumers to risk from exploitative practices on line, such as price gouging of essential or in-demand products (OECD, 2020[1]).
Encouraging businesses and industry associations, as well as consumer and other civil society organisations, to provide input into policies regarding the incorporation of new technologies in consumer products is important. This will help ensure that new products benefit consumers without harming them economically, compromising the privacy or security of their personal information, or otherwise putting them at risk.
Using behavioural insights to address consumer policy challenges in the digital transformation
Consumer policy has often been justified as a response to market failures. For example, requirements around information provision and protections against false or misleading information are intended, among other things, to address market failures associated with imperfect and/or asymmetric information. These objectives remain paramount, particularly in the face of digital transformation. However, improved understanding of consumer behaviour through behavioural insights and empirical studies have added new dimension to, and justifications for, consumer policy.
Behavioural insights is a multidisciplinary approach to policy making. It combines insights from psychology, cognitive science, economics and social science with empirically tested results to discover how humans actually make choices. To that end, it incorporates methodologies from behavioural economics, including psychological insights into the study of economic problems. It also embraces information economics, which focuses on the quality, quantity, costs and accessibility of information available to consumers.
Behavioural insights have shown that consumers can be subject to biases that might limit the effectiveness of some consumer policy. This is especially the case for information disclosures, pricing information and informed consent (OECD, 2018[24]; 2017[25]). Further, behavioural insights can highlight how certain businesses can provoke consumers to act in ways that may conflict with their own best interests. Box 8.1 outlines some key behavioural biases relevant to consumer policy.
Understanding consumers and policy impacts in this way provides the depth of insight needed for the increasingly complex policy decisions required in the digital transformation. Many behavioural insights
208 OECD DIGITAL ECONOMY OUTLOOK 2020 © OECD 2020
8. CONSUMER POLICY IN THE DIGITAL TRANSFORMATION 8. CONSUMER POLICY IN THE DIGITAL TRANSFORMATION

show how consumers form trust relationships with industry, specific brands and governments. These, in turn, provide tools for policy makers to understand behavioural and social needs.
The COVID-19 crisis has underscored the importance of incorporating behavioural insights into consumer policy. The crisis has undeniably exacerbated a number of key consumer behavioural biases (OECD, 2020[1]). For example, the panic buying in many countries during the earlier stages of the crisis highlights the power of a number of the common behavioural biases outlined in Box 8.1. Loss aversion is particularly important, as well as social and cultural norms as the actions of peers often guide consumer behaviour.
Box 8.1. Behavioural biases relevant to consumer policy and consumer product safety
Information overload. When faced with complex products or a bewildering array of choices, consumers may ignore possible choices or choose not to choose. Consumers may also rely on simple “rules of thumb” or “heuristics”.
Default and status quo effect. Presenting one choice as a default option can induce consumers to choose that option. The power of the default setting relates to the status quo effect, where consumers have a strong tendency not to change.
Endowment effect. Consumers often demand much more to give up an object than they would be willing to pay to acquire it: consumers value a product more highly when it becomes part of their endowment. This is because consumers tend to be loss averse.
Framing. The presentation of information affects how consumer perceive and interpret it. Presenting an option in a certain way may induce consumers to evaluate the choice from a particular reference point.
Anchoring. Consumers can “anchor” decisions around information they think is most important. This means consumers may not change their minds about the value of an offer, even when they receive additional information.
Priming effect. When consumers are repeatedly exposed to something, for example, through publicity, certain attributes of the product can “prime” the consumer towards a decision to purchase. Priming can influence preferences by making certain attributes appear more important than they should be.
Overconfidence. Consumers tend to think they are more likely to experience an outcome from some action that is better than the average expected outcome. For example, most drivers think they are safer than the average driver.
Hyperbolic discounting and myopia. Consumers tend to treat the present with much more importance than the future. This explains outcomes such as low voluntary retirement savings.
Time-inconsistency. Consumers may make choices inconsistent across time due to conflicts between short-term urges and long-term interests.
Social and cultural norms. Consumers are often guided by the values, actions and expectations of a particular society or group. For example, when people are made aware of what others are doing, it can reinforce individuals’ underlying motivations.
Source: Adapted from OECD (2018[24]), “Improving online disclosures with behavioural insights”, https://dx.doi.org/10.1787/ 39026ff4-en.
Improving online disclosuresThere are a number of ways in which consumer agencies and international organisations, such as the OECD, have been incorporating behavioural insights into consumer policymaking, however a key area in which this is occurring is in relation to online disclosures. For example, in 2018, the OECD published a report on improving online disclosures with behavioural insights (OECD, 2018[24]). The purpose of
209OECD DIGITAL ECONOMY OUTLOOK 2020 © OECD 2020
8. CONSUMER POLICY IN THE DIGITAL TRANSFORMATION 8. CONSUMER POLICY IN THE DIGITAL TRANSFORMATION
the report was to assess ways in which consumers’ behavioural biases may impact the effectiveness of online disclosures, and to suggest ways in which to develop online information disclosures that incorporate behavioural insights. The Netherlands Authority for Consumers and Markets also calls for greater transparency in online disclosures in its recently released guidelines on the boundaries of online persuasion, which incorporate learnings from behavioural insights (ACM, 2019[26]).
Policy makers have long understood the importance of helping consumers overcome imperfect and asymmetric information (OECD, 2016[22]). As the 2016 E-commerce Recommendation underscores,
[o]nline disclosures should be clear, accurate, easily accessible and conspicuous so that consumers have information sufficient to make an informed decision regarding a transaction. Such disclosures should be made in plain and easy-to-understand language, at a relevant time, and in a manner that enables consumers to retain a complete, accurate and durable record of such information. (Principle 21)
Relevant information can include background on the seller, the goods and services on offer, and the transaction itself, including payment methods, privacy policies and available dispute resolution and redress options. It can be provided in different ways and at various times in a transaction. This includes through advertising and marketing, contractual terms and conditions, and legally required notices. In addition to disclosure requirements, many jurisdictions have prohibitions on the provision of false and misleading information to consumers (OECD, 2016[22]).
While information disclosure requirements remain a key policy tool for empowering consumers on line, findings from behavioural insights raise concerns about their effectiveness in some circumstances.
First, consumers can be subject to information overload. When confronted with complex products or a large range of choices, consumers can struggle to decide. Ultimately, information overload can lead to consumer detriment if it makes them defer a decision or make the wrong choice based on relatively simple “rules of thumb”.
Numerous studies have found that consumers are particularly prone to information overload when shopping on line, such as Benartzi and Lehrer (2017[27]), and Office of Fair Trading (United Kingdom) (2007[28]). Information overload is one reason why few consumers read online terms and conditions (T&Cs) in full. Estimates of readership vary dramatically, suggesting between 0.2% and 77.9% of consumers read at least some online T&Cs (European Commission, 2016[29]; Stark and Choplin, 2009[30]; Bakos, Marotta-Wurgler and Trossen, 2014[31]; OECD, 2017[7]). Online readership depends on the way T&Cs are presented, the product they relate to and how readership is measured. Further, businesses can potentially take advantage of information overload by making their goods, services or prices more complex than required. Bar-Gill (2012[32]) has raised concerns about this in the credit card, mortgage and mobile phone markets.
Second, framing and anchoring effects can influence a consumer’s ability to understand online information disclosures.
Through framing, consumers are influenced by both the content and presentation of the information provided (Tversky and Kahneman, 1981[33]). The visual presentation of websites and mobile apps, timing of disclosure, text font and size, and use of colour, images and video, all affect how consumers absorb information. This has been demonstrated in a number of studies (FTC, 2013[34]; 2017[35]; 2016[36]). For example, the Behavioural Insights Team in the United Kingdom suggested that framing can improve both consumer understanding of, and interaction with, T&Cs and privacy policies (Box 8.2).
Anchoring occurs when consumers weigh one piece of information too heavily when making a decision, often at the expense of other information (Tversky and Kahneman, 1981[33]). This can mean that consumers do not evaluate the entire offer properly, even when additional information is provided, which can lead to consumer detriment.
Third, in some markets, the information required to make sound decisions overwhelms many consumers. In many cases, comparator websites and other intermediary services have emerged to address this problem. However, consumers often require complex information (e.g. about their usage) to take advantage of these services. Policies that enable more complex information to be accessed in a machine-readable format could allow consumers to make better use of services offered by intermediaries.
210 OECD DIGITAL ECONOMY OUTLOOK 2020 © OECD 2020
8. CONSUMER POLICY IN THE DIGITAL TRANSFORMATION 8. CONSUMER POLICY IN THE DIGITAL TRANSFORMATION

Box 8.2. Improving terms and conditions with behavioural insights
The United Kingdom’s Department of Business, Energy and Industrial Strategy commissioned the Behavioural Insights Team (BIT) to create a best practice guide for businesses on improving consumer understanding of contractual terms and privacy policies. Based on a literature review and behavioural experiments, the guide indicates that a small proportion of consumers properly read or understand T&Cs when buying on line. To improve consumer understanding, it recommends that businesses:
● Use a question and answer format to present the key terms.
● Summarise key terms and illustrate them with explanatory icons, to reduce the amount of information given in one go.
● Use a scrollable text box instead of requiring consumers to click through to view T&Cs.
● Provide information in short chunks at the right time.
● Use comics and illustrations to explain step-by-step actions and processes.
In addition, BIT suggested that businesses can increase the chance of consumers opening T&Cs and/or privacy policies by:
● telling them how long a policy normally takes to read
● announcing their last chance to read information before deciding.
Source: Bohn (2019[37]), “The T-Mobile–Sprint merger could mean the end of the physical SIM card”, https://www.theverge.com/2019/7/26/8931784/t-mobile-sprint-merger-esim-justice-department-requirement-sim-card.
Encouraging meaningful consumer consentIn one key lesson from behavioural insights, consumers tend to stick with the default option (or status quo) rather than actively choosing another alternative or opting-out of the default (Kahneman et al., 1991[38]; Sunstein, 2013[39]). This can potentially lead to consumer harm if they stick with a default although it is not in their best interests. The issue of default settings has been widely researched across a range of areas including savings plans (Carroll et al., 2009[40]), organ donation (Johnson and Goldstein, 2004[41]), retirement plans (Samuelson and Zeckhauser, 1988[42]), insurance (Johnson et al., 1993[43]) and privacy (Johnson, Bellman and Lohse, 2002[44]).
In a consumer context, default settings can undermine meaningful consent. In negative option marketing, for example, a customer’s failure to take affirmative action to reject or cancel an agreement is taken as assent. Consumers can thus unwittingly opt in for additional goods or services with associated fees or charges (OECD, 2019[4]). This is because consumers tend to ignore pre-checked boxes, especially on line (FTC, 2009[45]). Pre-checked boxes or other default settings can automatically sign consumers up for additional goods or services, financial commitments, disclosure of personal data or marketing material. A significant proportion of consumers will likely fail to uncheck these options or change the default despite not actually wanting them or agreeing with them. This has a great potential to result in consumer detriment.
In recognition of this, the European Union has banned pre-ticked boxes on line under its Consumer Rights Directive (2011[46]). The European Commission did not undertake a specific trial before banning pre-checked boxes since “available evidence was considered compelling enough to support the policy initiative” (Sousa Lourenço et al., 2016, p. 16[47]). Similarly, British consumers are not bound by charges for any goods that are sold by way of pre-ticked boxes (The Consumer Contracts [Information, Cancellation and Additional Charges] Regulations 2013). Similarly, under the Restore Online Shoppers’ Confidence Act in the United States, enacted in 2010, businesses must obtain a consumer’s express consent before charging for any goods or services purchased on line. In addition, for online goods or services sold through a negative option feature, businesses must also provide consumers with details of the transaction and a simple means to opt-out of any reoccurring charges. Such negative option features include a continuity plan, “free trial” conversion or automatic renewal programme.
211OECD DIGITAL ECONOMY OUTLOOK 2020 © OECD 2020
8. CONSUMER POLICY IN THE DIGITAL TRANSFORMATION 8. CONSUMER POLICY IN THE DIGITAL TRANSFORMATION

Similarly, automatic renewal of contracts, which preys on consumers’ status quo biases, have been viewed unfavourably by a number of consumer agencies across the OECD. In many cases, they have been found to be unfair practices, and hence, unlawful (Kovac and Vandenberghe, 2015[48]). Businesses should ensure they receive meaningful consent from consumers. In this regard, pre-checked boxes and negative option marketing strategies are insufficient.
Default and status quo biases may also lead consumers to disclose and share more personal information than they would otherwise choose. Default privacy settings lead to a high level of disclosure and sharing. Therefore, consumers could disclose and share more personal information than they would otherwise choose, had they actively considered the choice (Calo, 2014[49]). Conversely, default privacy settings that are more protective of consumers may be an effective way to improve their privacy. Meaningful consent provides a “first step” to the consumer experience. A consumer can consent to the myriad of pricing practices listed below. However, they must feel empowered to have subjected themselves to this practice willingly, with a reasonable understanding of the benefits and risks therein. In this way, meaningful consent is closely related to consumer trust.
Better understanding the impact of personalised pricingPersonalised pricing is another issue that relates to online disclosures and that is attracting increasing attention from policy makers across the areas of consumer and competition policy (OECD, 2018[50]). For example, in October 2019, an EU Directive was adopted on the better enforcement and modernisation of EU consumer protection rules providing for enhanced transparency in the use of personalised pricing in online transactions (European Commission, 2019[51])
Personalised pricing involves the use of personal data to charge consumers different prices based on their personal characteristics (OECD, 2018[50]). It can be distinguished from dynamic pricing, where prices may fluctuate at different times due to supply and demand differences, or personalised ranking, whereby following a transaction a consumer may be presented with recommended products that were purchased by other consumers who also purchased that other product. It has been defined as
[…] the practice where businesses may use information that is observed, volunteered, inferred, or collected about individuals’ conduct or characteristics, to set different prices to different consumers (whether on an individual or group basis), based on what the business thinks they are willing to pay. (CMA, 2018, p. 36[52])
While, to date, there is no systematic evidence of personalised pricing, growing use of data analytics and pricing algorithms mean that businesses have the ability to engage in personalised prices, especially in e-commerce. Despite this technological feasibility, consumer discomfort with personalised pricing may be the reason why there appear to be so few documented cases of personalised pricing (OECD, 2018[53]).
From a policy perspective, the impacts of personal pricing are ambiguous. On the one hand, from a competition perspective, personalised pricing could in some cases enhance competition, increasing both total and consumer welfare. In particular, personalised pricing may intensify competition by allowing firms to target prices to poach their rivals’ customers (OECD, 2018[50]). Personalised pricing has the potential to improve consumer welfare through allocative efficiency and benefit low-end consumers who would otherwise be underserved by the market. On the other hand, in some circumstances, personalised pricing can lead to a loss in total consumer welfare, where businesses benefit at the expense of consumers. Even where consumers as a whole are not worse off, some consumers may benefit at the expense of others.
Notwithstanding this, if personalised pricing is undertaken using non-transparent or deceptive means, or otherwise violates privacy, data protection, or anti-discrimination laws, it could reduce market trust and create a perception of unfairness, potentially dampening consumer participation in digital markets (OECD, 2018[50]). Given this, the OECD has developed work to understand the impact of disclosures about online personalised pricing on consumer awareness and behaviour. To test this, the CCP engaged the Behavioural Research Unit of the Economic and Social Research Institute (ESRI) to undertake a laboratory experiment in their offices in Dublin, Ireland. The purpose of the experiment was to test: i) whether disclosure enables consumers to identify and comprehend personalised pricing; and ii) what impact disclosure has on consumer behaviour and decision making. Additionally, a survey was added, among other things, to learn more about consumers’ fairness perception of personalised pricing. In March 2020, ESRI repeated the experiment and survey in Chile to test for country differences.
212 OECD DIGITAL ECONOMY OUTLOOK 2020 © OECD 2020
8. CONSUMER POLICY IN THE DIGITAL TRANSFORMATION 8. CONSUMER POLICY IN THE DIGITAL TRANSFORMATION

According to the survey results, most consumers in Ireland did not think online personalised pricing should be allowed, with perceived fairness affected by whether a discount or a price hike was involved. The preliminary results for Chile seem to support this result on average, though the acceptance of personalised pricing was slightly higher. However, results from the experiment in both countries suggest that disclosures about personalised pricing do not have a significant effect on consumers’ practical purchase choices. Moreover, a minority of participants recalled seeing a disclosure (amounting in Ireland to between 6% and 21% for the weak disclosure and 22% to 38% for the strong disclosure, and in Chile, between 0% and 7% and 4% to 10%, respectively). These results raise important questions not only about the behavioural response of consumers to personalised pricing in practice, but also the limitations of even clear and salient disclosures as a consumer protection tool. Further experiments with more dynamic forms of disclosure (e.g. with different timing, placement, colours, or wording) and even more explicit information about personalisation of prices and pricing strategies may be beneficial. This work highlights the question of how to increase disclosure effectiveness more generally, an issue highly relevant for consumer behavioural work overall.
Better understanding the impact of online advertising Advertising is always seeking to influence consumers into making purchases (OECD, 2019[54]). To that end, it has long employed psychologists and other behavioural scientists (Packard, 1957[55]; OECD, 2019[4]) However, digital technologies and web design open up new possibilities to control and manipulate consumers on an unprecedented scale.
Developments in AI and machine learning, coupled with online data collection, have enabled cost-effective, precision-targeted (and retargeted) advertising at an unprecedented scale (OECD, 2019[4]). This has been called online behavioural advertising, online profiling and behavioural targeting. Such advertising uses information such as age, gender, location, education level, interests, online shopping behaviour and search history. Complementary technologies track user interaction with online ads to determine the effectiveness of advertising campaigns. They also provide the infrastructure for advertising payments to be tied to specific user outcomes such as “clicks”, webpage visits or purchases (OECD, 2019[4]).
These developments can provide both benefits and risks for consumers (OECD, 2019[4]). Benefits include more targeted, relevant and timely ads. These could reduce search costs and improve awareness of relevant products and identification of, and access to, better deals. Online advertising also funds a range of nominally free online services, including search services, social networking services and digital news outlets. Risks include longstanding concerns around advertising’s potential to mislead or deceive, as well as new concerns. Emerging issues include i) consumers’ (in)ability to identify some forms of online advertising; ii) impacts on consumer trust on line; iii) the ability for online advertising to prey on consumer biases and vulnerabilities; iv) threats from “malvertising”; and v) threats associated with increased data collection (OECD, 2019[4]).
Anchoring and framing effects may inhibit a consumer’s ability to identify online advertising. In particular, native and user-generated advertising can be difficult to identify. If consumers do not identify such content as advertising, they may give it greater weight than if they had known. Anchoring could also lead consumers to make mistakes in valuing an offer or in comparing offers. Personalised advertising can anchor or frame an advertisement to highlight characteristics of the product or service valued by the consumer, while downplaying others. This could also raise issues, especially if it misleads or deceives consumers.
Many jurisdictions have long had safeguards against risks associated with advertising and marketing. The 2016 E-commerce Recommendation, for example, includes provisions relating to advertising and marketing. These provisions ensure that consumers understand when they are dealing with online advertising and that such advertising is not false or misleading.
The ability of online advertising to exploit consumer biases at scale is a new issue. It arises from the increased ability of businesses to engage in targeted online advertising. Consumer decisions may be more prone to manipulation through online advertising than through other forms (Richmond, 2019[10]). Some commentators have also raised concerns about online advertisers using “persuasion profiling” to use the social norms that resonate best with a particular consumer. This could be used to target a
213OECD DIGITAL ECONOMY OUTLOOK 2020 © OECD 2020
8. CONSUMER POLICY IN THE DIGITAL TRANSFORMATION 8. CONSUMER POLICY IN THE DIGITAL TRANSFORMATION
consumer in real time based on a consumer’s habits, location and general vulnerabilities (Calo, 2014[49]). Using this form of targeting to mislead consumers could potentially harm them.
Designing more effective product recall notices The number of product recalls is growing worldwide (OECD, 2018[56]). Accordingly, the need to communicate product recalls effectively to consumers has never been more important. In recent years, the OECD has examined how consumer biases inhibit recall effectiveness and how behavioural insights can help inform the practical implementation of recalls to improve their effectiveness (OECD, 2018[56]).
According to a number of studies, several factors inhibit the effectiveness of product recalls. For example, consumers often do not spend time reading product recall notices. Even when they do, they either do not understand them or simply choose not to react. In some cases, consumers’ lack of response has resulted in serious injury and death. These outcomes can take place years after a recall and despite repeated attempts from businesses and authorities to alert consumers about the need to return their product (OECD, 2018[56]).
Consumers tend to be confident that products sold in physical stores and online shops are safe (Wood, 2016[57]). As a result, they generally do not read, or fail to act upon, product safety instructions (CPSC, 2003[58]). Several other factors may explain consumer inaction to recall notices. These include the combination of consumer biases and the low value and/or short lifespan of a particular product; the level of severity of the hazard; remedies offered to consumers; and ways in which consumers are contacted.
Better understanding of consumer biases can help businesses and governments develop more effective communication strategies to increase consumer engagement with product recalls. Use of multiple channels to communicate a recall may overcome some consumer biases. Multiple channels should include both direct communication methods (email, letter, phone, SMS, in-person visits) as well as broader advertising campaigns (posters, television, radio, websites, social media, influencers).
The content of recall communications should also incorporate learnings from behavioural insights. To motivate consumer action, recall communications should give consumers a sense of urgency and severity. They should use well-understood words such as “Urgent” and “Danger”. They should also show pictures of the risk. As well, they should avoid technical jargon and misleading phrases about the severity of the risk such as “voluntary recall”. Recall communications may also include behavioural “nudges” to motivate consumer reaction such as the following:
● References to social norms. Highlighting that most people engage in or approve the same behaviour.
● Reciprocity. Providing consumers with an unexpected gift to induce compliance with the notice (in addition to the remedy for the unsafe product).
● Personalisation. Attracting attention by using the recipient’s name in the communication.
● Simplification. Making the recall easy to understand and allowing consumers a simple option for following up on the recall.
The OECD is developing policy guidance for governments and businesses on maximising recall effectiveness. This work, which will draw on learnings from behavioural insights, was expected to be released by the end of 2020.
Consumers around the globe are experiencing rapid change due to the digital transformation, especially with the arrival of AI and the IoT. These, and other new technologies, are making possible a range of innovative goods and services, even as they radically transform existing ones. The COVID-19 crisis has heavily accelerated consumer adoption of new technologies, e-commerce and online models. These shifts will likely remain even after it is safe for consumers to engage fully with the brick-and-mortar experience again.
While these new technologies provide consumers a wealth of benefits, they also bring a number of new and emerging risks. These include risks to privacy and security, misleading and deceptive designs, the potential for diminished choice and product discrimination, as well as uncertainty around accountability, liability and ownership.
214 OECD DIGITAL ECONOMY OUTLOOK 2020 © OECD 2020
8. CONSUMER POLICY IN THE DIGITAL TRANSFORMATION 8. CONSUMER POLICY IN THE DIGITAL TRANSFORMATION

Consumer policy makers have recognised the need to keep up with the pace of change inherent to digital transformation. They want to provide well-tailored protections and adequate tools so that consumers can participate effectively in the digital era. Moreover, they increasingly recognise the need to consider behavioural insights and empirical evidence in the design of consumer policies fit for the digital age. To that end, they are drawing on growing evidence that commercial practices exploiting consumer behavioural biases are particularly prevalent on line, especially during the COVID-19 crisis. In this regard, the OECD’s consumer behavioural insights work, most recently on personalised pricing and disclosures, can serve as a useful tool for consumer policy makers.
215OECD DIGITAL ECONOMY OUTLOOK 2020 © OECD 2020
8. CONSUMER POLICY IN THE DIGITAL TRANSFORMATION 8. CONSUMER POLICY IN THE DIGITAL TRANSFORMATION

References
ACCC (2020), “Advice for older Australians”, webpage, https://www.scamwatch.gov.au/get-help/advice-for-older-australians (accessed on 21 October 2020).
[23]
ACM (2019), Protection of the Online Consumer: Boundaries of Online Persuasion, The Netherlands Authority for Consumers & Markets, The Hague, https://www.acm.nl/sites/default/files/documents/2020-02/acm-guidelines-on-the-protection-of-the-online-consumer.pdf (accessed on 21 October 2020).
[26]
Bakos, Y., F. Marotta-Wurgler and D. Trossen (2014), “Does anyone read the fine print? Consumer attention to standard-form contracts”, The Journal of Legal Studies, Vol. 43/1, pp. 1-35, http://dx.doi.org/10.1086/674424.
[31]
Bar-Gill, O. (2012), Seduction by Contract: Law, Economics and Psychology in Consumer Markets, Oxford University Press, Oxford. [32]
Benartzi, S. and J. Lehrer (2017), The Smarter Screen: Surprising Ways to Influence and Improve Online Behavior, Penguin, New York. [27]
Bohn, D. (2019), “The T-Mobile–Sprint merger could mean the end of the physical SIM card”, The Verge, 26 July, https://www.theverge.com/2019/7/26/8931784/t-mobile-sprint-merger-esim-justice-department-requirement-sim-card.
[37]
Calo, R. (2014), “Digital market manipulation”, The George Washington Law Review, Vol. 82/4, pp. 995-1051, http://www.gwlr.org/wp-content/uploads/2014/10/Calo_82_41.pdf.
[49]
Carroll, G. et al. (2009), “Optimal defaults and active decisions”, Quarterly Journal of Economics, Vol. 124/4, pp. 1639-1674, http://dx.doi.org/10.1162/qjec.2009.124.4.1639.
[40]
CMA (2018), “Pricing algorithms: Economic working paper on the use of algorithms to facilitate collusion and personalised pricing”, Working Paper, No. 94, Competition & Markets Authority, London, https://assets.publishing.service.gov.uk/government/uploads/system/uploads/attachment_data/file/746353/Algorithms_econ_report.pdf.
[52]
Consumers International (2019), Artificial Intelligence: Consumer Experiences in New Technology, Consumers International, London, https://www.consumersinternational.org/media/261949/ai-consumerexperiencesinnewtech.pdf.
[5]
Consumers International and The Internet Society (2019), The Trust Opportunity: Exploring Consumers’ Attitudes to the Internet of Things, Consumers International, London and The Internet Society, Reston, Virginia, https://www.consumersinternational.org/media/261950/thetrustopportunity-jointresearch.pdf.
[8]
CPSC (2003), Recall Effectiveness Research: A Review and Summary of the Literature on Consumer Motivation and Behavior, Consumer Product Safety Commission, Washington, DC, http://www.cpsc.gov.
[58]
Dark Patterns (n.d.), Dark Patterns, website, https://www.darkpatterns.org/ (accessed on 21 October 2020). [15]
European Commission (2019), Directive of the European Parliament and of the Council amending Council Directive 93/13/EEC and Directives 98/6/EC, 2005/29/EC and 2011/83/EU as regards the better enforcement and modernisation of Union consumer protection rules, European Commission, Brussels, https://data.consilium.europa.eu/doc/document/PE-83-2019-INIT/en/pdf.
[51]
European Commission (2016), Study on Consumers’ Attitudes Towards Terms and Conditions, European Commission, Brussels, http://ec.europa.eu/consumers/consumer_evidence/behavioural_research/docs/terms_and_conditions_final_report_en.pdf.
[29]
European Commission (2011), “Directive 2011/83/EU of the European Parliament and of the Council on Consumer Rights”, Official Journal of the European Union, No. 22/11, European Commission, Brussels, http://eur-lex.europa.eu/legal-content/EN/TXT/PDF/?uri=CELEX:32011L0083&rid=1.
[46]
FTC (2017), Blurred Lines: An Exploration of Consumers’ Advertising Recognition in the Contexts of Search Engines and Native Advertising, Federal Trade Commission, Washington, DC, https://www.ftc.gov/system/files/documents/reports/blurred-lines-exploration-consumers-advertising-recognition-contexts-search-engines-native/p164504_ftc_staff_report_re_digital_advertising_and_appendices.pdf.
[35]
FTC (2016), “Putting disclosures to the test”, Workshop: Staff Summary, Federal Trade Commission, Washington, DC, https://www.ftc.gov/system/files/documents/reports/putting-disclosures-test/disclosures-workshop-staff-summary-update.pdf.
[36]
FTC (2013), .com Disclosures: How to Make Effective Disclosures in Digital Advertising, Federal Trade Commission, Washington, DC, https://www.ftc.gov/sites/default/files/attachments/press-releases/ftc-staff-revises-online-advertising-disclosure-guidelines/130312dotcomdisclosures.pdf.
[34]
FTC (2009), Negative Options: A Report by the Staff of the FTC’s Division of Enforcement, Federal Trade Commission, Washington, DC, https://www.ftc.gov/sites/default/files/documents/reports/negative-options-federal-trade-commission-workshop-analyzing-negative-option-marketing-report-staff/p064202negativeoptionreport.pdf.
[45]
Gal, M. and N. Elkin-Koren (2017), “Algorithmic consumers”, Harvard Journal of Law & Technology, Vol. 30/2, pp. 309-353. [18]
216 OECD DIGITAL ECONOMY OUTLOOK 2020 © OECD 2020
8. CONSUMER POLICY IN THE DIGITAL TRANSFORMATION 8. CONSUMER POLICY IN THE DIGITAL TRANSFORMATION
References and Notes

Johnson, E., S. Bellman and G. Lohse (2002), “Defaults, framing and privacy: Why opting In-opting out”, Marketing Letters, Vol. 13/1, pp. 5-15, https://www0.gsb.columbia.edu/mygsb/faculty/research/pubfiles/1173/defaults_framing_and_privacy.pdf.
[44]
Johnson, E. and D. Goldstein (2004), “Defaults and donation decisions”, Transplantation, Vol. 78/12, pp. 1713-1716, http://dx.doi.org/10.1097/01.TP.0000149788.10382.B2.
[41]
Johnson, E. et al. (1993), “Framing, probability distortions and insurance decisions”, Journal of Risk and Uncertainty, Vol. 7, pp. 35-51, https://www8.gsb.columbia.edu/decisionsciences/sites/decisionsciences/files/files/Framing_Probability_Distortions-3.pdf.
[43]
Kahneman, D. et al. (1991), “Anomalies: The endowment effect, loss aversion and status quo bias”, The Journal of Economic Perspectives, Vol. 5/1, pp. 193-206, https://scholar.princeton.edu/sites/default/files/kahneman/files/anomalies_dk_jlk_rht_1991.pdf.
[38]
Kovac, M. and A. Vandenberghe (2015), “Regulation of automatic renewal clauses: A behavioural law and economics approach”, Journal of Consumer Policy, Vol. 38, pp. 287-313, http://dx.doi.org/10.1007/s10603-015-9286-4.
[48]
Lester, P. (2019), “Why you can’t always trust online customer reviews”, Which?, 15 March, https://www.which.co.uk/news/2019/03/why-you-cant-always-trust-online-customer-reviews/.
[17]
Mathur, A. et al. (2019), “Dark patterns at scale: Findings from a crawl of 11K shopping websites”, Proceedings of the ACM on Human-Computer Interaction, Vol. CSCW/81, https://doi.org/10.1145/3359183.
[14]
OECD (2020), Protecting Online Consumers During the Covid-19 Crisis, webpage, http://www.oecd.org/coronavirus/policy-responses/protecting-online-consumers-during-the-covid-19-crisis-2ce7353c/ (accessed on 21 October 2020).
[1]
OECD (2019), An Introduction to Online Platforms and Their Role in the Digital Transformation, OECD Publishing, Paris, https://doi.org/10.1787/53e5f593-en.
[9]
OECD (2019), Challenges to Consumer Policy in the Digital Era: Background Report, G20 International Conference on Consumer Policy, Tokushima, Japan, 5-6 September, OECD, Paris, http://www.oecd.org/sti/consumer/challenges-to-consumer-policy-in-the-digital-age.pdf.
[21]
OECD (2019), Delivering Better Policies Through Behavioural Insights: New Approaches, OECD Publishing, Paris, https://dx.doi.org/10.1787/6c9291e2-en.
[54]
OECD (2019), Recommendation of the Council on Artificial Intelligence, OECD, Paris, http://dx.doi.org/OECD/LEGAL/0449. [13]
OECD (2019), “The road to 5G networks: Experience to date and future developments”, OECD Digital Economy Papers, No. 284, OECD Publishing, Paris, https://dx.doi.org/10.1787/2f880843-en.
[4]
OECD (2019), “Using digital technologies to improve the design and enforcement of public policies”, OECD Digital Economy Papers, No. 274, OECD Publishing, Paris, https://dx.doi.org/10.1787/99b9ba70-en.
[11]
OECD (2018), “Consumer policy and the smart home”, OECD Digital Economy Papers, No. 268, OECD Publishing, Paris, https://dx.doi.org/10.1787/e124c34a-en.
[3]
OECD (2018), “Consumer product safety in the Internet of Things”, OECD Digital Economy Papers, No. 267, OECD Publishing, Paris, https://dx.doi.org/10.1787/7c45fa66-en.
[2]
OECD (2018), “Enhancing product recall effectiveness: OECD background report”, OECD Science, Technology and Industry Policy Papers, No. 58, OECD Publishing, Paris, https://doi.org/10.1787/ef71935c-en.
[56]
OECD (2018), “Improving online disclosures with behavioural insights”, OECD Digital Economy Papers, No. 269, OECD Publishing, Paris, https://dx.doi.org/10.1787/39026ff4-en.
[24]
OECD (2018), “IoT measurement and applications”, OECD Digital Economy Papers, No. 271, OECD Publishing, Paris, https://dx.doi.org/10.1787/35209dbf-en.
[19]
OECD (2018), “Measuring and maximising the impact of product recalls globally: OECD workshop report”, OECD Science, Technology and Industry Policy Papers, No. 56, OECD Publishing, Paris, https://dx.doi.org/10.1787/ab757416-en.
[20]
OECD (2018), Personalised Pricing in the Digital Era - Note by the United States, OECD, Paris, https://www.ftc.gov/system/files/attachments/us-submissions-oecd-2010-present-other-international-competition-fora/personalized_pricing_note_by_the_united_states.pdf.
[53]
OECD (2018), Personalised Pricing in the Digital Era, background note by the Secretariat, http://www.oecd.org/daf/competition/personalised-pricing-in-the-digital-era.htm.
[50]
OECD (2017), “Trust in peer platform markets: Consumer survey findings”, OECD Digital Economy Papers, No. 263, OECD Publishing, Paris, https://dx.doi.org/10.1787/1a893b58-en.
[7]
OECD (2017), “Use of Behavioural Insights in Consumer Policy”, OECD Science, Technology and Industry Policy Papers, No. 36, OECD Publishing, Paris, https://dx.doi.org/10.1787/c2203c35-en.
[25]
OECD (2016), Recommendation of the Council on Consumer Protection in E-Commerce, OECD, Paris, https://legalinstruments.oecd.org/en/instruments/OECD-LEGAL-0422.
[22]
217OECD DIGITAL ECONOMY OUTLOOK 2020 © OECD 2020
8. CONSUMER POLICY IN THE DIGITAL TRANSFORMATION 8. CONSUMER POLICY IN THE DIGITAL TRANSFORMATION
References and Notes
OECD (2010), Consumer Policy Toolkit, OECD Publishing, Paris, https://dx.doi.org/10.1787/9789264079663-en. [6]
Ofcom (2017), Adults’ Media Use and Attitudes, Ofcom, London, https://www.ofcom.org.uk/__data/assets/pdf_file/0020/102755/adults-media-use-attitudes-2017.pdf.
[16]
OFT (2007), “Internet Shopping: An OFT Market Study”, webpage, http://webarchive.nationalarchives.gov.uk/20140402163042/http://oft.gov.uk/OFTwork/markets-work/internet.
[28]
Packard, V. (1957), The Hidden Persuaders, Ig Publishing, New York. [55]
Richmond, B. (2019), A Day in the Life of Data, Consumer Policy Research Centre, Melbourne. [10]
Samuelson, W. and R. Zeckhauser (1988), “Status quo bias in decision making”, Journal of Risk and Uncertainty, Vol. 1, pp. 7-59. [42]
Smith, A. (8 April 2020), “Using artificial intelligence and algorithms”, Federal Trade Commission, Business blog, https://www.ftc.gov/news-events/blogs/business-blog/2020/04/using-artificial-intelligence-algorithms.
[12]
Sousa Lourenço, J. et al. (2016), Behavioural Insights Applied to Policy: European Report 2016, European Commission, Brussels, http://dx.doi.org/10.2760/903938.
[47]
Stark, D. and J. Choplin (2009), “A license to deceive: Enforcing contractual myths despite consumer psychological realities”, NYU Journal of Law & Business, Spring, https://papers.ssrn.com/sol3/papers.cfm?abstract_id=1340166.
[30]
Sunstein, C. (2013), “Deciding by default”, University of Pennsylvania Law Review, Vol. 162/1, pp. 1-57, http://scholarship.law.upenn.edu/cgi/viewcontent.cgi?article=1000&context=penn_law_review.
[39]
Tversky, A. and D. Kahneman (1981), “The framing of decisions and the psychology of choice”, Science, Vol. 211/4481, pp. 453-458, http://links.jstor.org/sici?sici=0036-8075%2819810130%293%3A211%3A4481%3C453%3ATFODAT%3E2.0.CO%3B2-3.
[33]
Wood, L. (2016), UK Consumer Product Recall: An Independent Review, Department of Business Innovation and Skills, Government of the United Kingdom, London, https://assets.publishing.service.gov.uk/government/uploads/system/uploads/attachment_data/file/509125/ind-16-4-consumer-product-recall-review.pdf.
[57]
218 OECD DIGITAL ECONOMY OUTLOOK 2020 © OECD 2020
8. CONSUMER POLICY IN THE DIGITAL TRANSFORMATION
References and Notes

Chapter 9DIGITAL INNOVATION
219OECD DIGITAL ECONOMY OUTLOOK 2020 © OECD 2020

KEY FINDINGS
�� Around one-third of patents owned in OECD countries are related to information and communication technologies. This share has fallen over the last decade but has increased markedly in the People’s Republic of China (hereafter “China”), India and the Russian Federation.
�� China has rapidly increased its contributions to the science underpinning digital technologies, overtaking the United States in the volume of contributions to computer science journals. However, the United States remains ahead in terms of highly cited work.
�� Two-thirds of academic authors create new data or code as part of their published scientific work. However, barriers to sharing limit re-usability. Additionally, the technologies used and the resulting benefits vary greatly between scientific fields and across countries.
�� The research community is using unique, persistent and pervasive international digital identification (UPPI) systems as one way to join relevant data held in different digital systems (e.g. those for funding applications and published outputs). However, only widespread adoption and use of these UPPIs can maximise their benefits.
�� Digital technologies are playing a direct role in efforts to manage the COVID-19 pandemic and find a vaccine. In particular, artificial intelligence (AI) and associated technologies such as machine learning are finding innovative applications to a wide array of challenges driven by COVID-19. However, such applications work by identifying patterns in data. They require large amounts of data to find these patterns; the outputs are only as good as the training data.
�� Open and collaborative approaches will allow the widest pool of researchers possible to access the tools and data needed. In this way, they can devise innovative uses of AI and maximise the chances of finding effective containment measures and treatments. Innovative incentives, such as research prizes and hackathons, can also help focus resources on this pressing societal challenge.
IntroductionDigital technologies are both a key area of research and innovation and themselves a key foundation for developments in research and innovation. This chapter looks at recent trends in innovation in digital technologies before examining how digitalisation and data are profoundly impacting the science, research and innovation that help drive those technological developments. Subsequently, it looks at how digital technologies, and particularly artificial intelligence (AI), are helping search for ways to manage and treat the COVID-19 pandemic. Finally, the chapter touches upon the increasing role of digital technologies in managing national science and innovation systems and policy.
Around one-third of patents owned in OECD countries are related to information and communication technologies (ICTs). This share has fallen over the last decade but has increased markedly in China, India and the Russian Federation. These three countries have moved from being mainly specialised in ICT manufacturing and software production to other parts of the value chain, including product and component design.
China has also rapidly increased its contributions to the science underpinning digital technologies. Indeed, it has overtaken the United States in the volume of contributions to computer science journals. However, when citation levels – which provide one indication of impact – are considered, the United States remains ahead.
Digital technologies and data are increasingly shaping and facilitating scientific research. Scientists are generally positive about the impacts of digitalisation on their work, with digital technologies facilitating science across borders, collaboration and efficiency. On average, two-thirds of academic authors create new data or code as part of their published scientific work. However, barriers to sharing limit re-usability. Furthermore, the technologies used and the resulting benefits vary greatly between scientific fields and across countries. Policy makers can help identify and mainstream best practices across disciplines.
220 OECD DIGITAL ECONOMY OUTLOOK 2020 © OECD 2020
9. DIGITAL INNOVATION 9. DIGITAL INNOVATION

The research community is overcoming the challenges of joining up relevant data held in different digital systems (e.g. those for funding applications and published outputs). This helps reduce reporting burdens on scientists and to better understand and monitor national and international science and innovation systems. Establishing unique, persistent and pervasive international digital identification (UPPI) systems for researchers and research organisations is one example of these practices. However, only widespread adoption and use of these UPPIs can maximise their benefits. Policy makers can drive uptake by promoting their use in interactions such as research funding applications and research outputs, including journal articles and academic papers.
Digital technologies are also playing a direct role in efforts to manage the COVID-19 pandemic and find a vaccine. In particular, AI and associated technologies such as machine learning are finding innovative applications to a wide array of challenges driven by COVID-19. However, such applications work by identifying patterns in data. They require large amounts of data to find these patterns; the outputs are only as good as the training data.
Open and collaborative approaches will allow the widest pool of researchers possible to access the tools and data needed. In this way, they can devise innovative uses of AI and maximise the chances of finding effective containment measures and treatments. Innovative incentives, such as research prizes and hackathons, can also help focus resources on this pressing societal challenge.
Innovation in digital technologies Rapid innovation can be readily observed in many digital products in daily use. For example, smartphones and the networks they rely on are moving to implement 5G technology despite 4G (LTE) networks only beginning commercial rollout a decade ago. At the same time, online email and video streaming services are implementing increasingly sophisticated features underpinned by machine learning and AI. These advances culminate from a vast array of research and innovation activities.
Patents are often used to protect ICT-related technologies in relevant areas. These include high-speed networks, mobile communication, digital security, sensor and device networks, high-speed computing, large-capacity and high-speed storage, large-capacity information analysis, cognition and meaning understanding, human interface, and imaging and sound technologies (Inaba and Squicciarini, 2017[1]). Importantly, patent protection is granted only for a product or a process that brings a novel technical solution. As such, looking at the volumes of such patents granted can offer one indication of the extent of innovation in ICT-related technologies.
Over 2014-17, ICT-related technologies accounted for about one-third of all IP5 patent families filed by owners in OECD countries (Figure 9.1). These data refer to filings in at least two intellectual property offices, including at least one of the five largest offices globally. This represents a decrease on the share observed a decade earlier (37%). In contrast, the ICT-related share of IP5 patent families owned in China increased by one-fifth. This makes China’s IP5 patent portfolio the most specialised in ICT. In the Russian Federation, India and Portugal, the share of patents related to ICT more than doubled. Meanwhile, it increased by almost two-thirds in Ireland, aided by several large technology companies establishing operations there.
Design patents protect the “look and feel of products”. A significant portion of these patents can relate to ICT product designs. ICT designs, for example, comprise almost half of the average design portfolio held by Korean firms across the European Union Intellectual Property Office, the Japan Patent Office and the United States Patent and Trade Office. For other countries, these average shares are much lower. However, they still reach 10% to 20% in China, Sweden, Finland and the United States, showing the importance of ICT product design. In comparison to 2004-07, ICT designs in 2014-17 maintained their share, relative to designs in general in the US market (+0.1 percentage point). In contrast, they declined as a share of all design filings in Europe (-0.8 percentage points) and in Japan (-2.5 percentage points).
Meanwhile, China has moved beyond ICT manufacture to aspects of design. It doubled its share of ICT design patents filed in the United States (from 13% to 26%). It also increased its share of ICT designs registered in Japan by almost one-third (to 21%). Finally, it maintained its registered design share in European markets (16%).
221OECD DIGITAL ECONOMY OUTLOOK 2020 © OECD 2020
9. DIGITAL INNOVATION 9. DIGITAL INNOVATION

Figure 9.1. ICT-related patents, trademarks and designs, 2014-17As a percentage of total IP5 patent families or total trademarks and total design patents at the EUIPO, JPO and USPTO, by country of ownership
0
10
20
30
40
50
60
ChinaKore
a
Sweden
Irelan
d
Russia
n Fed
eratio
n
Finlan
dInd
iaWorld
Japan
United
States
OECDIsr
ael
Netherl
ands
United
Kingdo
mFra
nce
Canad
a
Australi
aEU28
Belgium
South Afric
aTu
rkey
Austria
Denmark
German
y
Portug
al
Norway
Luxem
bourg
Poland
Switzerl
and
New Ze
aland
Brazil
Hunga
rySpa
in
Greece Ita
ly
Sloven
ia
Czech R
epub
lic
Mexico Chil
e
%
Average trademark portfolio at EUIPO, JPO and USPTOAverage design portfolio at EUIPO, JPO and USPTOPatents in ICT-related technologies (IP5 patent families)
Notes: Patents protect technological inventions (i.e. products or processes providing new ways of doing something or new technological solutions to problems). IP5 patent families are patents filed in at least two offices worldwide, including one of the five largest IP offices: the European Patent Office (EPO), the Japan Patent Office (JPO), the Korean Intellectual Property Office (KIPO), the US Patent and Trademark Office (USPTO) and the National Intellectual Property Administration of the People’s Republic of China (NIPA). Data refer to IP5 families, by filing date, according to the applicants’ residence using fractional counts. Patents in ICT are identified using the list of IPC codes in Inaba and Squicciarini (2017[1]). Only economies with more than 250 patent families in the periods considered are included. Data for 2016 and 2017 are incomplete. StatLink contains more data.
Source: OECD based on OECD, STI Micro-data Lab: Intellectual Property Database, http://oe.cd/ipstats (accessed in March 2020). 12 https://doi.org/10.1787/888934192433
The share of trademarks that are ICT-related and registered by organisations in OECD countries grew in all markets considered. The highest increase was observed in 2014-17 in the European market (up six percentage points to 37% from 2004 to 2007). There was similar growth in the US market (up five percentage points to 24%). Trademarks filed in the Japanese market also increased significantly (up 23 percentage points to 36%).
Overall, OECD countries seem to move progressively towards ICT IP bundling strategies. Such approaches place relatively more emphasis on the look and feel of products and on extracting value from branding. The reverse is true in countries such as China, India and the Russian Federation, which appear to be pursuing technological catch-up strategies, and to be protecting their products through designs and brands (OECD, 2017[2]).
It is generally accepted that computer programs should be protected by copyright, whereas apparatus using computer software or software-related inventions should be protected by patent (WIPO, n.d.[3]). As such, copyright is relevant in protecting certain elements related to digital technologies – notably software code. Even free and open-source licences rely on copyright law to enforce their terms. However, copyright protection is formality-free in the 178 countries party to the Berne Convention for the Protection of Literary and Artistic Works. This means that protection does not depend on compliance with formalities such as registration or deposit of copies. As such, there are no structured registers or databases for copyrights analogous to those for patents from which to derive similar statistics. Nevertheless, the OECD has started developing experimental approaches to measure contributions to open source software (OECD, 2019[4]).
In addition, patent applications have increased in-step with the digital transformation. This has increased both the volume and complexity of patent examinations. This, in turn, has led to longer lags between application and any eventual granting of patents (WIPO, 2019[5]). This may particularly create frictions in the area of digital technology and especially in ICTs, given the speed and complexity of technological development.
222 OECD DIGITAL ECONOMY OUTLOOK 2020 © OECD 2020
9. DIGITAL INNOVATION 9. DIGITAL INNOVATION

Research and development (R&D) is important in driving these advances in digital technologies. Businesses undertake the majority of R&D. The “information industries” – which comprise producers of ICT goods and services, as well as producers of digital content – contribute strongly in Israel and Korea. These countries have particularly high business R&D intensity (R&D expenditure as a share of gross domestic product), with the information industries accounting for over half of this (Figure 9.2). Firms in the information industries also undertake over 40% of all business R&D in Finland, Estonia, Turkey and the United States, confirming the knowledge-intensive nature of these industries.
Figure 9.2. Business R&D expenditure, total and information industries, 2017As a percentage of gross domestic product
%
0
1
2
3
4
5%
South
Africa
Lithu
ania
Latvia
Argenti
naChil
e
Mexico
00.10.20.30.4
Magnified
Business expenditure on R&D Of which, information industries
Israe
lKore
aJa
pan
Sweden
Switzerl
and
Austria
German
y
United
States
Denmark
Belgium
Finlan
dOEC
DChin
aFra
nce
Sloven
ia
Icelan
dEU28
Singap
ore
Netherl
ands
Czech R
epub
lic
United
Kingdo
m
Norway
Hunga
ry
Australi
a
Irelan
d
Canad
aIta
ly
New Ze
aland
Luxe
mbourg
Poland
Russia
n Fed
eratio
nSpa
in
Portug
al
Estonia
GreeceTu
rkey
Slovak
Repub
lic
South Afric
a
Lithua
niaLatv
ia
Argentin
aChil
e
Mexico
Notes: R&D = research and development. “Information industries” comprise ISIC Rev.4 divisions: “Computer, electronic and optical products” (26), “Publishing, audiovisual and broadcasting activities” (58 to 60), “Telecommunications” (61) and “IT and other information services” (62 to 63). Zone estimates (OECD and EU28) correspond to member countries’ R&D intensity averages weighted by GDP in purchasing power parity. For information industries, they exclude countries where no data are available: Australia, Mexico, Luxembourg, New Zealand and Switzerland for the OECD aggregate, and Bulgaria, Croatia, Cyprus,1 Luxembourg and Malta for EU28. Data on total business expenditure on R&D (BERD) refer to 2017 except for South Africa (2016). Information industries values relate to the same reference year where possible or are based on shares for the most recent available year: Chile (2015), Korea (2015) and the United Kingdom (2016). Not available for Australia, China, Luxembourg, Mexico, New Zealand, the Russian Federation, South Africa and Switzerland. For Singapore, data that refer to the information industry component is estimated based on 2013 shares. 1. Note by TurkeyThe information in this document with reference to “Cyprus” relates to the southern part of the Island. There is no single authority representing both Turkish and Greek Cypriot people on the Island. Turkey recognises the Turkish Republic of Northern Cyprus (TRNC). Until a lasting and equitable solution is found within the context of the United Nations, Turkey shall preserve its position concerning the “Cyprus issue”.Note by all the European Union Member States of the OECD and the European UnionThe Republic of Cyprus is recognised by all members of the United Nations with the exception of Turkey. The information in this document relates to the area under the effective control of the Government of the Republic of Cyprus.
Source: OECD based on OECD, ANBERD (database), http://oe.cd/anberd and OECD, Main Science and Technology Indicators (database), http://oe.cd/msti (accessed in March 2020).
12 https://doi.org/10.1787/888934192452
Software development and R&D are closely intertwined (OECD, 2015[6]; OECD/Eurostat, 2018[4]). Firms mainly producing software, a component of the wider information and communication services sector,1 are among the most R&D-intensive firms across most countries (Figure 9.3). Similarly, the ICT manufacturing industry is above the average R&D intensity in all the OECD countries presented. In general, both ICT manufacturing and information and communication services report higher than average incidence of innovation activities more broadly2 (Figure 9.4).
Advances in scientific knowledge underpin developments in a wide range of digital technologies and techniques. The field of computer science, which contributes towards advances in areas such as machine learning and AI, is just one example. Over the last decade, China almost trebled its contribution to computer science journals. In so doing, it overtook the United States in the production of scientific documents in this field. However, China’s share in the world’s top-cited documents (top 10%, normalised by type of document and field) is close to 9%, remaining well below the United States at 15%. The share of highly cited papers published by authors based in China has nonetheless more than doubled since 2008 (Figure 9.5).
223OECD DIGITAL ECONOMY OUTLOOK 2020 © OECD 2020
9. DIGITAL INNOVATION 9. DIGITAL INNOVATION

Figure 9.3. R&D intensity of ICT and other industries, 2016As a percentage of gross value added in each industry, log scale
%
0
0.0001
0.0010
0.0100
0.1000
1.0000
10.0000
100.0000
Other industries Total economyICT manufacturing Information and communication services (including software)
Korea
Japa
n
Sweden
Finlan
d
Austria
German
y
Sloven
ia
Denmark
United
States
Belgium
Icelan
dFra
nce
Austra
lia
Netherl
ands
United
Kingdo
mIre
land
Czech R
epub
lic
Norway
Hunga
ry
Canad
aIta
ly
Eston
iaSpa
in
Portug
al
Turke
y
Poland
Slovak
Repub
lic
Greece
Mexico Chil
e
Notes: ICT = information and communication technology. For Korea, Sweden, Germany, Denmark, Island, Spain, Portugal and Turkey, data refer to 2015. For Chile and Canada, data refer to 2014. For Poland and Norway, data refer to 2017. Figures are based on estimates of business R&D by industry reported on a main activity basis according to ISIC Rev.4. R&D intensity has been calculated for each industry, where both R&D and Value Added (VA) data were available. These ratios are sensitive to the statistical units used in both frameworks. A broader discussion is available in Galindo-Rueda and Verger (2016[7]). In particular, national practices differ in respect to the treatment of large and complex multi-activity enterprises and those firms specialised in providing R&D services. StatLink contains more data.
Source: OECD based on OECD, ANBERD (database), http://oe.cd/anberd, OECD, STAN (database), http://oe.cd/stan, OECD, National Accounts (database) and OECD, Research and Development Statistics (database), http://oe.cd/rds (accessed in March 2020).
12 https://doi.org/10.1787/888934192471
Figure 9.4. Businesses that have either introduced an innovation or have any kind of innovation activity, 2016As a percentage of all businesses in the relevant sector
%
0
20
40
60
80
100
Information and communication servicesICT manufacturingAll firms
Switzerl
and
Austria
Belgium
Norway
Portug
al
Finlan
d
German
y
Netherl
ands
France Ita
ly
Luxe
mbourg
Turke
y
Icelan
d
Irelan
d
Denmark
United
Kingdo
m
Lithu
ania
Sweden
Czech R
epub
licEU28
Eston
ia
Greece
Sloven
iaSpa
in
Hunga
ryLatv
ia
Slovak
Repub
lic
Poland
Notes: ICT = information and communication technology. ICT manufacturing is unavailable for Luxembourg, Iceland, EU28 and Slovenia. “All firms” refers to “Innovation core activities”, defined by European Commission ruling 995/2012, to comprise NACE activities: B (Industry), C (Manufacturing), D (Electricity, gas, steam and air conditioning supply), E (Construction), G46 (Wholesale trade except motor vehicles), H (Transportation and storage), J (Information and communication), K (Financial and insurance services), M71 (Architectural and engineering activities; technical testing and analysis), M72 (Scientific research and development), M73 (Advertising, market research). “ICT manufacturing” refers to “Manufacture of computer, electronic and optical products”.
Source: OECD based on Eurostat, Community Innovation Survey (database) (accessed in March 2020).12 https://doi.org/10.1787/888934192490
In countries including Hungary, the Russian Federation, Poland, the Czech Republic, India and Brazil, scientific research in the computer science field has a much higher citation rate than overall scientific production. In 2018, over 16% of computer science publications by Australia-based authors featured among the world’s top 10% cited scientific documents. This figure reaches 19% for Luxembourg, although based upon a much smaller number of scientific outputs.
224 OECD DIGITAL ECONOMY OUTLOOK 2020 © OECD 2020
9. DIGITAL INNOVATION 9. DIGITAL INNOVATION
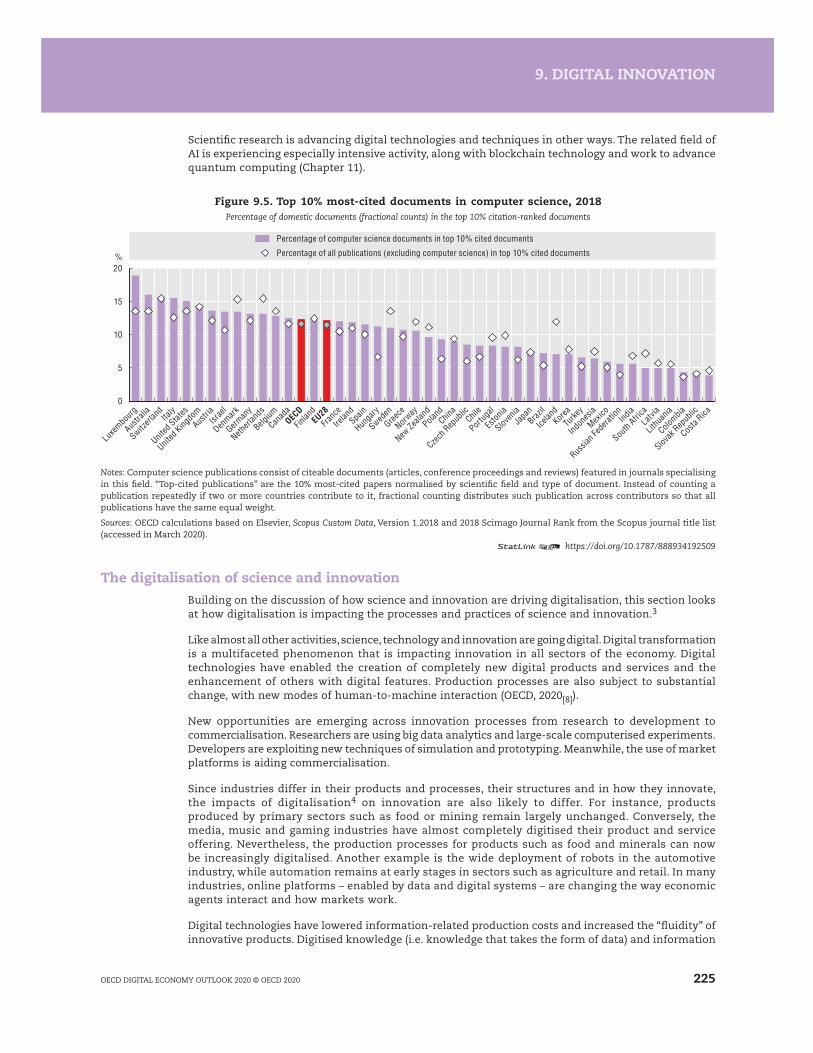
Scientific research is advancing digital technologies and techniques in other ways. The related field of AI is experiencing especially intensive activity, along with blockchain technology and work to advance quantum computing (Chapter 11).
Figure 9.5. Top 10% most-cited documents in computer science, 2018Percentage of domestic documents (fractional counts) in the top 10% citation-ranked documents
%
0
5
10
15
20
Percentage of all publications (excluding computer science) in top 10% cited documents
Percentage of computer science documents in top 10% cited documents
Luxe
mbourg
Austra
lia
Switzerl
and
Italy
United
States
United
Kingdo
mAus
triaIsr
ael
Denmark
German
y
Netherl
ands
BelgiumCan
adaOEC
D
Finlan
dEU
28Fra
nce
Irelan
dSpa
in
Hunga
ry
Sweden
Greece
Norway
New Ze
aland
Poland
China
Czech R
epub
licChil
e
Portug
al
Eston
ia
Sloven
iaJa
panBraz
il
Icelan
dKore
aTu
rkey
Indon
esia
Mexico
Russia
n Fed
eratio
nInd
ia
South
AfricaLatv
ia
Lithu
ania
Colombia
Slovak
Repub
lic
Costa
Rica
Notes: Computer science publications consist of citeable documents (articles, conference proceedings and reviews) featured in journals specialising in this field. “Top-cited publications” are the 10% most-cited papers normalised by scientific field and type of document. Instead of counting a publication repeatedly if two or more countries contribute to it, fractional counting distributes such publication across contributors so that all publications have the same equal weight.
Sources: OECD calculations based on Elsevier, Scopus Custom Data, Version 1.2018 and 2018 Scimago Journal Rank from the Scopus journal title list (accessed in March 2020).
12 https://doi.org/10.1787/888934192509
The digitalisation of science and innovationBuilding on the discussion of how science and innovation are driving digitalisation, this section looks at how digitalisation is impacting the processes and practices of science and innovation.3
Like almost all other activities, science, technology and innovation are going digital. Digital transformation is a multifaceted phenomenon that is impacting innovation in all sectors of the economy. Digital technologies have enabled the creation of completely new digital products and services and the enhancement of others with digital features. Production processes are also subject to substantial change, with new modes of human-to-machine interaction (OECD, 2020[8]).
New opportunities are emerging across innovation processes from research to development to commercialisation. Researchers are using big data analytics and large-scale computerised experiments. Developers are exploiting new techniques of simulation and prototyping. Meanwhile, the use of market platforms is aiding commercialisation.
Since industries differ in their products and processes, their structures and in how they innovate, the impacts of digitalisation4 on innovation are also likely to differ. For instance, products produced by primary sectors such as food or mining remain largely unchanged. Conversely, the media, music and gaming industries have almost completely digitised their product and service offering. Nevertheless, the production processes for products such as food and minerals can now be increasingly digitalised. Another example is the wide deployment of robots in the automotive industry, while automation remains at early stages in sectors such as agriculture and retail. In many industries, online platforms – enabled by data and digital systems – are changing the way economic agents interact and how markets work.
Digital technologies have lowered information-related production costs and increased the “fluidity” of innovative products. Digitised knowledge (i.e. knowledge that takes the form of data) and information
225OECD DIGITAL ECONOMY OUTLOOK 2020 © OECD 2020
9. DIGITAL INNOVATION 9. DIGITAL INNOVATION

can circulate and be reproduced, shared or manipulated instantaneously anywhere by any number of actors. As a consequence of changes in costs and fluidity, four trends affect innovation practices across all sectors of the economy in the digital age, as summarised in Figure 9.6.
Figure 9.6. Characteristics of innovation in the digital age
Data from a variety of sources (e.g. consumer behaviour, business processes, research) are a key input for innovation – they enable developing new and highly customised products, and optimising processes. Artificial intelligence and machine learning tools critically rely on big data.
Data as core input
1
Digital technologies offer opportunities for innovative services. They lead to a blurring of the boundaries between services and manufacturing as manufacturers develop services to complement their products while service providers enter manufacturing.
Servitisation
2
Digital technologies accelerate innovation cycles. Virtual simulation and 3D printing speed up design, prototyping and testing, reducing costs and time-to-market. Direct releases of product upgrades on easily accessible online markets have also become more frequent.
Faster innovation cycles
3
Characteristics of innovation in the digital age
Innovation is more collaborative as innovation requires mixing skills, expertise and technologies. New tools for open innovation (e.g. industry platforms) facilitate such collaborations.
Collaborative innovation
4
Source: OECD (2019[9]), Digital Innovation: Seizing Policy Opportunities, https://dx.doi.org/10.1787/a298dc87-en.
Given the considerable variety in sectors’ products and processes, digital technologies (e.g. AI, Internet of Things, drones, virtual reality, 3D printing) will create varying opportunities for innovation, including the following (OECD, 2020[8]):
● Digitalisation of final products and services. Some industries have almost completely digitised their products over past decades (e.g. the media, music and gaming industries). Others by their nature remain mainly physical, such as food and consumer products. Many industries present a mix of digital and physical components in their final products, with the digital elements often becoming progressively more important. In the automotive industry, vehicles increasingly integrate digital features.
● Digitalisation of business processes. Digitalisation may affect sectors’ business processes differently. It depends on the nature of the activities and the characteristics of production (e.g. whether it involves the assembly of physical products, if the sector has long supply chains, etc.). In particular, digital technologies offer opportunities for digitalisation (and automation) of production processes; for interconnecting supply chains; and, for improving interactions with the final consumer.
226 OECD DIGITAL ECONOMY OUTLOOK 2020 © OECD 2020
9. DIGITAL INNOVATION
● Creating new digitally enabled markets and business models. New markets or market segments enabled by digital technologies, often adjacent to traditional sectors, have been created over recent years. E-commerce, car-sharing services and FinTech services are well-known examples. While new business models are emerging across the economy, the scale and disruption potential of these trends vary across sectors. In some cases, those business models may displace traditional ones (e.g. travel agencies). In other cases, the two models may co-exist and expand the product or service offering (e.g. brick-and-mortar existing simultaneously with online retail stores).
Links between digitalisation and innovation in business Although the ways in which innovation responds to and influences digitalisation can be mediated by R&D and invention, they are different concepts. The Oslo Manual definition of an innovation (OECD, 2018[10]) refers to a new or improved product or process (or combination of both). It must differ significantly from a unit’s previous products and processes and be available to potential users or brought into use by the unit. Importantly, innovation requires that implementation takes place – moving beyond the realm of ideas and inventions. At a minimum, the innovation has to be new to the organisation in question. Thus, this is a broad concept that also encompasses the diffusion of digital technologies where this involves a significant change from the viewpoint of the business adopting them.
Data from business innovation surveys show the information services industry5 generally exhibits the greatest rates of reported innovation (e.g. 75% in the case of France). This may partly reflect relatively higher rates of obsolescence for certain types of digital technologies (e.g. hand-held devices). Such rates of obsolescence drive more rapid innovation cycles (as highlighted in Figure 9.6).
Digital innovations can be found in any sector. They comprise product or process innovations that incorporate ICTs and also innovations that rely significantly on ICTs for their development or implementation. A wide range of business process innovations can entail fundamental changes in the organisation’s ICT functions and their interaction with other business functions and the products delivered.
Figure 9.6 also notes that data are now a core element of the innovative process. The Oslo Manual recognises developing data and software as a potential innovation activity. Data accumulation by companies can entail significant direct or indirect costs.
One recent OECD-Statistics Canada study examined patterns of advanced technology use and business practices (ATBPs) among Canadian firms using the Statistics Canada 2014 Survey of Advanced Technology. Mapping ATBP portfolios through factor analysis has helped reveal seven main categories of ATBP specialisation (Galindo-Rueda, Verger and Ouellet, 2020[11]). These categories are logistics software technologies; management practices and tools; automated production process technologies; geomatics and geospatial technologies; bio-and-environmental technologies; software and infrastructure-as-a-service; and additive and micro manufacturing technologies. The data indicate a strong complementarity between management practices and production, and adoption of logistics technologies.
The study also found that innovation is highly correlated with the use of certain business practices and advanced technologies (Figure 9.7). Regression results suggest that using advanced technologies doubles the odds of reporting innovations. The results also indicate complementarity between technology and management in explaining innovation. A positive relationship is also found between the development of technologies and innovation, especially for products, pointing at the advantages of being lead adopters.
Digital technology as an enabler of scientific research Research is a key driver of technological developments and a foundation for product and process innovations. Digitalisation is changing the ways research is conducted and disseminated – both in businesses and in other organisations such as universities. The International Survey of Scientific Authors (ISSA) asked a global sample of scientists how digitalisation is impacting their work (Bello and Galindo-Rueda, 2020[12]). It assessed whether digital tools make scientists more productive; to what extent they rely on big data analytics, or share data and source codes developed through their research; and to what degree they rely on a digital identity and presence to communicate their research. Preliminary results reveal contrasting patterns of digitalisation across fields.
227OECD DIGITAL ECONOMY OUTLOOK 2020 © OECD 2020
9. DIGITAL INNOVATION 9. DIGITAL INNOVATION

Figure 9.7. The link between innovation and the adoption of technology and business practices, Canada, 2014
Estimated log odds ratios of reporting an innovation between technology and/or practice users and non-users
-0.5
0
0.5
1.0
1.5
2.0
2.5
3.0
3.5
4.0Log ratio
Any innovation Product innovation Business process innovation
Logisticssoftware
technologies
Managementpractices and
tools
Automatedproduction
processtechnologies
Geomatics andgeospatial
technologies
Bio- andenvironmentaltechnologies
Software andinfrastructureas a service
Additive andmicro
manufacturingtechnologies
Note: Estimates control for technology development activity, country of ultimate ownership control, and business size and industry.
Source: Galindo-Rueda, Verger and Ouellet (2020[11]), “Patterns of innovation, advanced technology use and business practices in Canadian firms”, https://doi.org/10.1787/6856ab8c-en.
12 https://doi.org/10.1787/888934192528
Use of advanced digital tools, including big data analytics, is a defining feature of the computer sciences, followed by multidisciplinary research, mathematics, earth and materials sciences, and engineering (Figure 9.8). The life sciences (with the exception of pharmaceuticals) and the physical sciences (other than engineering) report the largest relative efforts to make data and/or code usable by others. Digital productivity tools have much broader adoption. Interestingly, the fields making less use of advanced digital and data/code dissemination tools – namely those in the social sciences, arts and humanities – are more likely to engage in activities that enhance their digital presence and external communication (e.g. use of social media).
Younger scientists are more likely to engage in all dimensions of digital behaviour, just as ICT-use surveys find younger individuals generally make greater use of digital technologies. Women scientists are less likely than their male counterparts to use and develop advanced digital tools. However, they are more likely to engage in enhancing their digital presence, identity and communication. Scientific authors working in the business sector are also more likely than those in other sectors to use advanced digital tools linked to big data. At the same time, they are less likely to engage in data/code dissemination activities and online presence and communication. By contrast, authors in the higher education sector use digital productivity tools more (with most tools asked about in the survey relating to academic tasks), and also had a greater online presence and use of digital communication tools (Bello and Galindo-Rueda, 2020[12]).
Research paradigms and digitalisation Since digital tools can transform how scientific research is conducted, ISSA survey respondents were asked to describe their scientific research work with respect to the use of theory, simulations, empirical non-experimental and experimental activity. Scientific research practices correlate with digital practices in complex ways. Researchers engaged in computational and modelling work (37% of the sample) are most likely to use advanced digital tools. However, they are also less likely to engage in online presence and communication activities. Together with researchers involved in experimental work (49%), they are also the most likely to engage in data and code dissemination practices, for example through online platforms such as GitHub.
Those reporting work on gathering information (37%) are surprisingly not among those most likely to disseminate data and code. This suggests considerable scope for digitalisation of their data diffusion activities. Among this group, the use of digital productivity tools is nonetheless high. Those involved
228 OECD DIGITAL ECONOMY OUTLOOK 2020 © OECD 2020
9. DIGITAL INNOVATION 9. DIGITAL INNOVATION
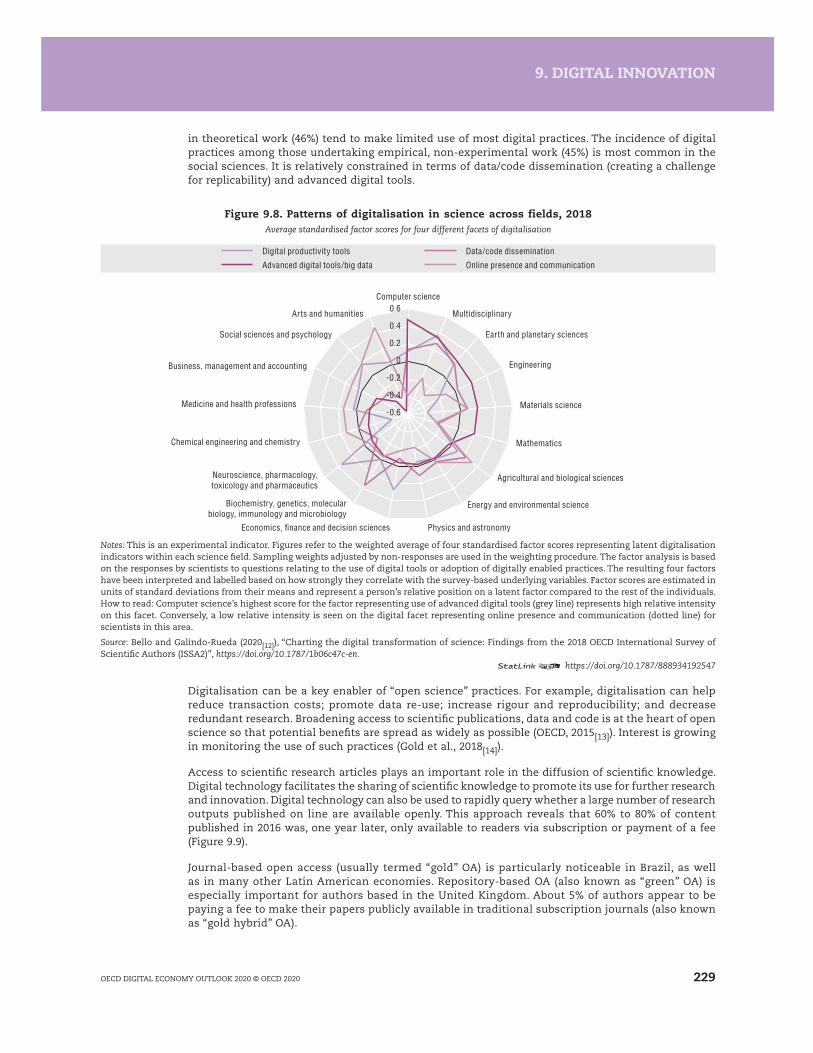
in theoretical work (46%) tend to make limited use of most digital practices. The incidence of digital practices among those undertaking empirical, non-experimental work (45%) is most common in the social sciences. It is relatively constrained in terms of data/code dissemination (creating a challenge for replicability) and advanced digital tools.
Figure 9.8. Patterns of digitalisation in science across fields, 2018Average standardised factor scores for four different facets of digitalisation
-0.6
-0.4
-0.2
0
0.2
0.4
0.6
Digital productivity tools Advanced digital tools/big data
Data/code dissemination Online presence and communication
Computer science
Multidisciplinary
Earth and planetary sciences
Engineering
Materials science
Mathematics
Agricultural and biological sciences
Energy and environmental science
Physics and astronomyEconomics, finance and decision sciences
Biochemistry, genetics, molecularbiology, immunology and microbiology
Neuroscience, pharmacology,toxicology and pharmaceutics
Chemical engineering and chemistry
Medicine and health professions
Business, management and accounting
Social sciences and psychology
Arts and humanities
Notes: This is an experimental indicator. Figures refer to the weighted average of four standardised factor scores representing latent digitalisation indicators within each science field. Sampling weights adjusted by non-responses are used in the weighting procedure. The factor analysis is based on the responses by scientists to questions relating to the use of digital tools or adoption of digitally enabled practices. The resulting four factors have been interpreted and labelled based on how strongly they correlate with the survey-based underlying variables. Factor scores are estimated in units of standard deviations from their means and represent a person’s relative position on a latent factor compared to the rest of the individuals. How to read: Computer science’s highest score for the factor representing use of advanced digital tools (grey line) represents high relative intensity on this facet. Conversely, a low relative intensity is seen on the digital facet representing online presence and communication (dotted line) for scientists in this area.
Source: Bello and Galindo-Rueda (2020[12]), “Charting the digital transformation of science: Findings from the 2018 OECD International Survey of Scientific Authors (ISSA2)”, https://doi.org/10.1787/1b06c47c-en.
12 https://doi.org/10.1787/888934192547
Digitalisation can be a key enabler of “open science” practices. For example, digitalisation can help reduce transaction costs; promote data re-use; increase rigour and reproducibility; and decrease redundant research. Broadening access to scientific publications, data and code is at the heart of open science so that potential benefits are spread as widely as possible (OECD, 2015[13]). Interest is growing in monitoring the use of such practices (Gold et al., 2018[14]).
Access to scientific research articles plays an important role in the diffusion of scientific knowledge. Digital technology facilitates the sharing of scientific knowledge to promote its use for further research and innovation. Digital technology can also be used to rapidly query whether a large number of research outputs published on line are available openly. This approach reveals that 60% to 80% of content published in 2016 was, one year later, only available to readers via subscription or payment of a fee (Figure 9.9).
Journal-based open access (usually termed “gold” OA) is particularly noticeable in Brazil, as well as in many other Latin American economies. Repository-based OA (also known as “green” OA) is especially important for authors based in the United Kingdom. About 5% of authors appear to be paying a fee to make their papers publicly available in traditional subscription journals (also known as “gold hybrid” OA).
229OECD DIGITAL ECONOMY OUTLOOK 2020 © OECD 2020
9. DIGITAL INNOVATION 9. DIGITAL INNOVATION

Figure 9.9. Open access of scientific documents, 2017As a percentage of a random sample of 100 000 documents published in 2016, by country of affiliation
0
100
20
40
60
80
%
United
Kingdo
m
Switzerl
andBraz
ilChil
e
Colombia
Poland
Austria
Sweden
Netherl
ands Ita
ly
Norway
Luxe
mbourg
German
y
Slovak
Repub
lic
Hunga
ryIsr
ael
Mexico
Spain
United
States
Denmark
South
Africa
Czech R
epub
lic
Belgium
Sloven
ia
Franc
eKore
a
Finlan
d
Canad
a
Greece
Eston
iaJa
panLatv
ia
Russia
n Fed
eratio
n
Indon
esia
Irelan
d
Austra
lia
Portug
al
Icelan
dTu
rkeyInd
iaChin
a
New Ze
aland
Closed Gold open-access journal Gold hybrid Green open-access only No information
Notes: This is an experimental indicator based on an automated query of a random (non-stratified) sample of 100 000 citable documents (articles, reviews and conference proceedings) published in 2016 and indexed in the Scopus database, with valid DOIs associated to them (more than 90% of cases). The open-access status of the documents has been assessed using the R wrapper for the oaDOI API produced by ImpactStory, an open source website that aims to help researchers explore and share the online impact of their research. The API returns information on the different mechanisms by which to access legal copies of each document. StatLink contains more data.
Sources: OECD (2017[2]), OECD Science, Technology and Industry Scoreboard 2017: The Digital Transformation, https://doi.org/10.1787/9789264268821-en.12 https://doi.org/10.1787/888934192566
Citations provide one indicator of the “impact” of scientific work. It might be expected that open-access publications would be more likely to be cited due to ease of access. However, bibliometric analysis confirms previous findings of a mixed picture (OECD, 2015[15]; Boselli and Galindo-Rueda, 2016[16]), as not all forms of OA appear to confer a citation advantage. Results from the ISSA confirm that authors of documents in gold OA journals tend to report significantly lower earnings. This points to strong and self-reinforcing prestige effects that are dissociated from dissemination objectives in the digital era (Fyfe et al., 2017[17]). Nevertheless, evidence points to OA increasingly becoming the norm. This provides just one illustration of how the “promise” of digital advances can come up against challenges arising from entrenched behaviours and ways of working.
Open access to data and code With data as a core element of innovative activities (Figure 9.6), measuring and understanding access to data and code are also important for mapping open science practices. The latest ISSA study goes beyond considering only the access status of publications to examine the accessibility of the code and data developed as part of the published research. The study shows that, on average, two-thirds of respondents create new data, code, or both as part of their published scientific work (Figure 9.10).
The use of repositories for data archiving and dissemination seems to be most common among respondents in the life sciences. Informal data or code sharing among peers seems to be the main way researchers in all fields make data available to others. Nevertheless, the publication of research data or code does not automatically imply that other researchers can easily use and re-use them. Barriers include access costs or challenges such as not knowing the coding language or software used. Standard mechanisms for requesting and securing data access appear uncommon across all disciplines, being used by fewer than 30% of respondents when sharing data or code. Likewise, only about 10% of respondents applied a data usage licence to their data. Re-usability of data seems to be supported mainly through the provision of detailed metadata, especially in the physical sciences and engineering. Compliance with standards that facilitate data combination across sources is more common in health and life science but less so in physical sciences and engineering.
In all fields, authors tend to report several barriers to access of scientific outputs. These include formal sharing requirements set by publishers, funders or the respondent’s organisation; or intellectual property protection (Bello and Galindo-Rueda, 2020[12]). Career objects and peer expectations were
230 OECD DIGITAL ECONOMY OUTLOOK 2020 © OECD 2020
9. DIGITAL INNOVATION 9. DIGITAL INNOVATION
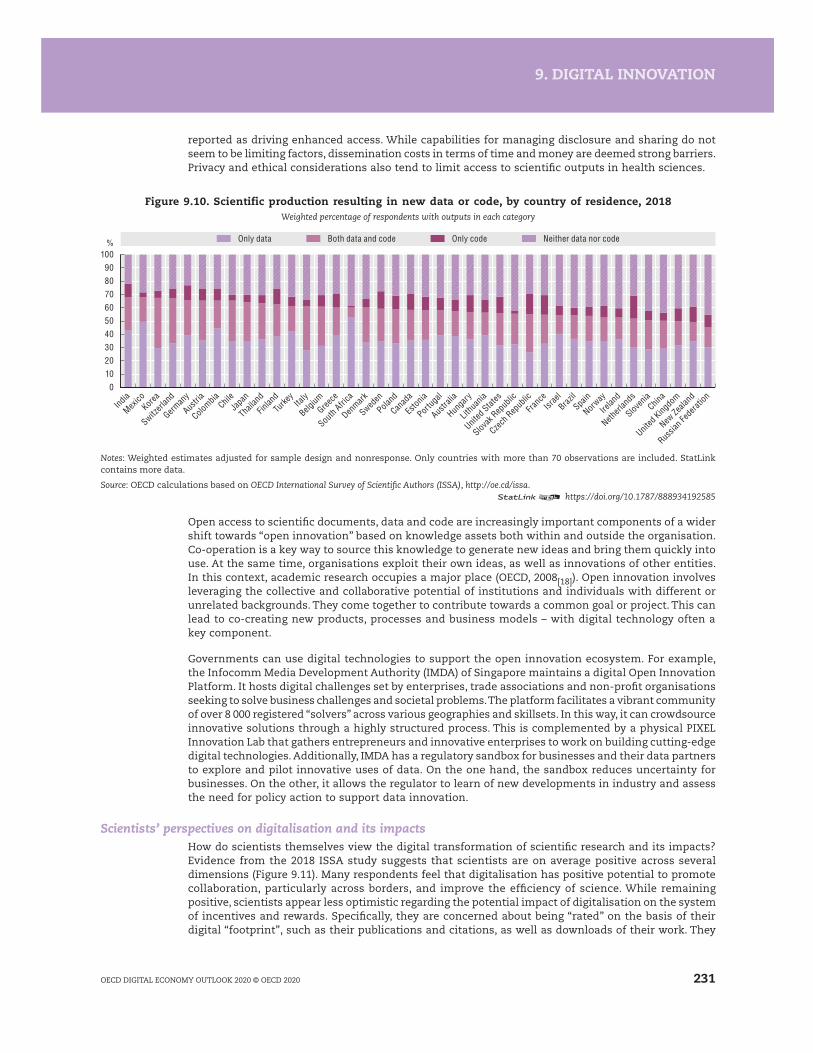
reported as driving enhanced access. While capabilities for managing disclosure and sharing do not seem to be limiting factors, dissemination costs in terms of time and money are deemed strong barriers. Privacy and ethical considerations also tend to limit access to scientific outputs in health sciences.
Figure 9.10. Scientific production resulting in new data or code, by country of residence, 2018Weighted percentage of respondents with outputs in each category
0
10090
2010
4030
6050
8070
% Only data Both data and code Only code Neither data nor code
India
Mexico
Korea
Switzerl
and
German
y
Austria
Colombia Chil
eJa
pan
Thailan
d
Finlan
dTu
rkey
Italy
Belgium
Greece
South Afri
ca
Denmark
Sweden
Poland
Canad
a
Eston
ia
Portug
al
Australi
a
Hunga
ry
Lithua
nia
United
States
Slovak
Repub
lic
Czech R
epub
licFra
nceIsr
aelBraz
ilSpa
in
Norway
Irelan
d
Netherl
ands
Sloven
iaChin
a
United
Kingdo
m
New Ze
aland
Russia
n Fed
eratio
n
Notes: Weighted estimates adjusted for sample design and nonresponse. Only countries with more than 70 observations are included. StatLink contains more data.
Source: OECD calculations based on OECD International Survey of Scientific Authors (ISSA), http://oe.cd/issa. 12 https://doi.org/10.1787/888934192585
Open access to scientific documents, data and code are increasingly important components of a wider shift towards “open innovation” based on knowledge assets both within and outside the organisation. Co-operation is a key way to source this knowledge to generate new ideas and bring them quickly into use. At the same time, organisations exploit their own ideas, as well as innovations of other entities. In this context, academic research occupies a major place (OECD, 2008[18]). Open innovation involves leveraging the collective and collaborative potential of institutions and individuals with different or unrelated backgrounds. They come together to contribute towards a common goal or project. This can lead to co-creating new products, processes and business models – with digital technology often a key component.
Governments can use digital technologies to support the open innovation ecosystem. For example, the Infocomm Media Development Authority (IMDA) of Singapore maintains a digital Open Innovation Platform. It hosts digital challenges set by enterprises, trade associations and non-profit organisations seeking to solve business challenges and societal problems. The platform facilitates a vibrant community of over 8 000 registered “solvers” across various geographies and skillsets. In this way, it can crowdsource innovative solutions through a highly structured process. This is complemented by a physical PIXEL Innovation Lab that gathers entrepreneurs and innovative enterprises to work on building cutting-edge digital technologies. Additionally, IMDA has a regulatory sandbox for businesses and their data partners to explore and pilot innovative uses of data. On the one hand, the sandbox reduces uncertainty for businesses. On the other, it allows the regulator to learn of new developments in industry and assess the need for policy action to support data innovation.
Scientists’ perspectives on digitalisation and its impactsHow do scientists themselves view the digital transformation of scientific research and its impacts? Evidence from the 2018 ISSA study suggests that scientists are on average positive across several dimensions (Figure 9.11). Many respondents feel that digitalisation has positive potential to promote collaboration, particularly across borders, and improve the efficiency of science. While remaining positive, scientists appear less optimistic regarding the potential impact of digitalisation on the system of incentives and rewards. Specifically, they are concerned about being “rated” on the basis of their digital “footprint”, such as their publications and citations, as well as downloads of their work. They
231OECD DIGITAL ECONOMY OUTLOOK 2020 © OECD 2020
9. DIGITAL INNOVATION 9. DIGITAL INNOVATION

also have reservations about whether digitalisation can bring scientific communities and scientists together with the public (inclusiveness). Finally, they sometimes question the role of the private sector in providing digital solutions to assist their work. Younger authors are generally more positive than older peers, except regarding the impacts of digitalisation on the incentive system; this may reflect concerns about their future careers.
Across countries, the average sentiment towards the impacts of digitalisation (Figure 9.12) appears consistent overall with results from broader population surveys on attitudes towards science and technology (OECD, 2015[19]). Scientists in emerging and transition economies appear to be more positive on average towards the impacts of digitalisation on science. The position of scientists in the most R&D-intensive European economies is more reserved, while still positive in the main. These results do not imply that scientists are by and large dismissive of the potential pitfalls of digitalisation. A significant minority of respondents tended to agree with “negative” statements about the impacts of digitalisation on science. They were concerned, for example, about the promotion of hypothesis-free research in computationally intensive data-driven science. For these respondents, digitalisation could also accentuate divides in research between those with advanced digital competences and those without. It could also encourage a celebrity culture in science, premature diffusion of findings and individual exposure to pressure groups. Digitalisation could also lead to use of readily available but inappropriate indicators for monitoring and incentivising research. Finally, authors agreed with the statement that digitalisation could concentrate workflows and data in the hands of a few companies providing digital tools.
Figure 9.11. Scientific authors’ views on potential impacts of the digitalisation of science, 2018Average sentiment towards “positive” digitalisation scenarios, as percentage deviation from the mid-range of possible responses
%
-10-505
10152025303540
Science acrossborders
Efficiency ofscientific work
Collaborative andinteractive science
Overall view(average across
dimensions)
Quality ofscientificresearch
Private sectorengagement in
digital solutionsfor science
Inclusivenessof research
opportunities andpublic engagement
Functioning ofincentives and
rewards inscience
Leaning towards a positive view
Leaning towards a negative view
Notes: This is an experimental indicator. Survey respondents were asked to rate opposing scenarios on different dimensions from (1 = fully agree with a negative view) to (10 = fully agree with a positive view). For interpretability, weighted average scores on each dimension and the general summary view (weighted average across dimensions) are presented as percentage deviations from the midpoint. This means, for example, that with respect to the subject of “Science across borders”, respondents are on average 32% oriented towards the positive outcome, relative to the neutral perspective. Weighted average scores consider the sample design and non-response.
Source: OECD (2019[4]), Measuring the Digital Transformation: A Roadmap for the Future, https://dx.doi.org/10.1787/9789264311992-en.12 https://doi.org/10.1787/888934192604
Digital technology in research against COVID-19Digital technologies are playing a direct role in efforts to manage the COVID-19 pandemic and find a vaccine. In particular, AI and associated technologies such as machine learning are finding innovative applications to a wide array of COVID-19 driven challenges.6
Before the world was even aware of the threat posed by COVID-19, AI systems had detected the outbreak of an unknown type of pneumonia in China. As the outbreak turned into a global pandemic, AI tools and technologies can support policy makers, the medical community and society at large to manage every stage of the crisis and its aftermath (detection, prevention, response, recovery) and to accelerate research (Chapter 11).
232 OECD DIGITAL ECONOMY OUTLOOK 2020 © OECD 2020
9. DIGITAL INNOVATION 9. DIGITAL INNOVATION
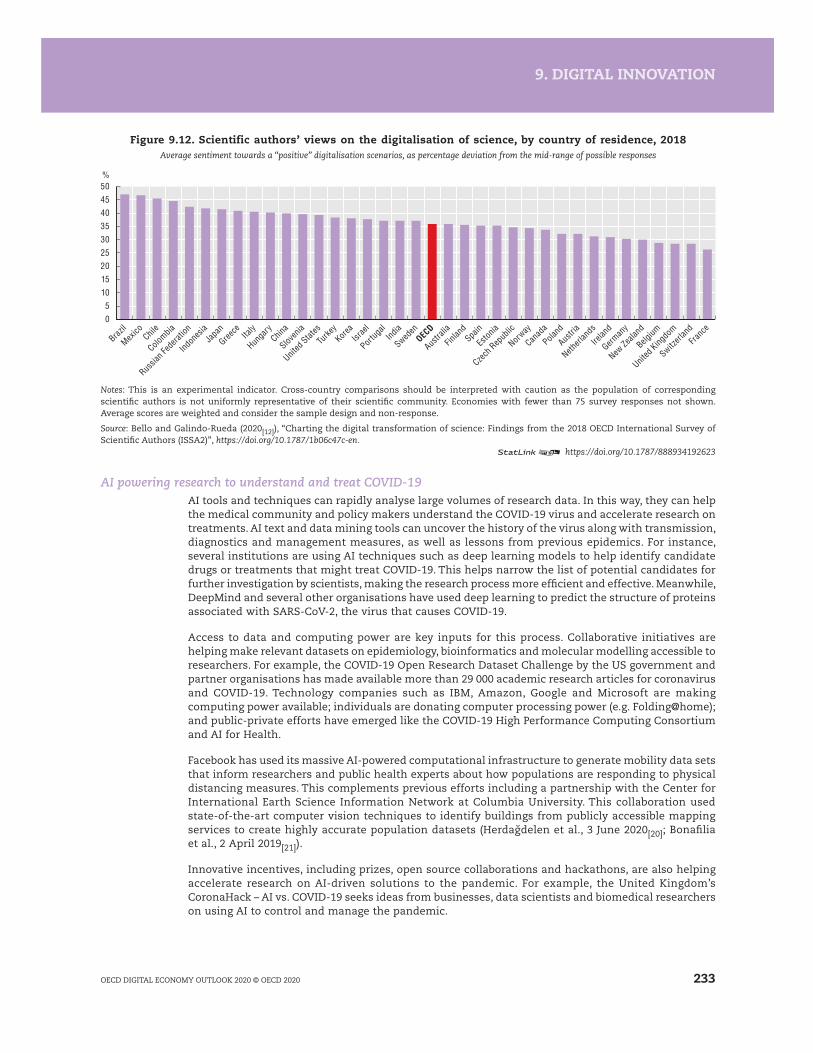
Figure 9.12. Scientific authors’ views on the digitalisation of science, by country of residence, 2018Average sentiment towards a “positive” digitalisation scenarios, as percentage deviation from the mid-range of possible responses
0
5045
105
2015
3025
4035
%
Brazil
Mexico Chil
e
Colombia
Russia
n Fed
eratio
n
Indon
esia
Japan
Greece Ita
ly
Hunga
ryChin
a
Sloven
ia
United
States
Turke
yKore
aIsr
ael
Portug
alInd
ia
Sweden
OECD
Australi
a
Finlan
dSpa
in
Eston
ia
Czech R
epub
lic
Norway
Canad
a
Poland
Austria
Netherl
ands
Irelan
d
German
y
New Ze
aland
Belgium
United
Kingdo
m
Switzerl
andFra
nce
Notes: This is an experimental indicator. Cross-country comparisons should be interpreted with caution as the population of corresponding scientific authors is not uniformly representative of their scientific community. Economies with fewer than 75 survey responses not shown. Average scores are weighted and consider the sample design and non-response.
Source: Bello and Galindo-Rueda (2020[12]), “Charting the digital transformation of science: Findings from the 2018 OECD International Survey of Scientific Authors (ISSA2)”, https://doi.org/10.1787/1b06c47c-en.
12 https://doi.org/10.1787/888934192623
AI powering research to understand and treat COVID-19AI tools and techniques can rapidly analyse large volumes of research data. In this way, they can help the medical community and policy makers understand the COVID-19 virus and accelerate research on treatments. AI text and data mining tools can uncover the history of the virus along with transmission, diagnostics and management measures, as well as lessons from previous epidemics. For instance, several institutions are using AI techniques such as deep learning models to help identify candidate drugs or treatments that might treat COVID-19. This helps narrow the list of potential candidates for further investigation by scientists, making the research process more efficient and effective. Meanwhile, DeepMind and several other organisations have used deep learning to predict the structure of proteins associated with SARS-CoV-2, the virus that causes COVID-19.
Access to data and computing power are key inputs for this process. Collaborative initiatives are helping make relevant datasets on epidemiology, bioinformatics and molecular modelling accessible to researchers. For example, the COVID-19 Open Research Dataset Challenge by the US government and partner organisations has made available more than 29 000 academic research articles for coronavirus and COVID-19. Technology companies such as IBM, Amazon, Google and Microsoft are making computing power available; individuals are donating computer processing power (e.g. Folding@home); and public-private efforts have emerged like the COVID-19 High Performance Computing Consortium and AI for Health.
Facebook has used its massive AI-powered computational infrastructure to generate mobility data sets that inform researchers and public health experts about how populations are responding to physical distancing measures. This complements previous efforts including a partnership with the Center for International Earth Science Information Network at Columbia University. This collaboration used state-of-the-art computer vision techniques to identify buildings from publicly accessible mapping services to create highly accurate population datasets (Herdagdelen et al., 3 June 2020[20]; Bonafilia et al., 2 April 2019[21]).
Innovative incentives, including prizes, open source collaborations and hackathons, are also helping accelerate research on AI-driven solutions to the pandemic. For example, the United Kingdom’s CoronaHack – AI vs. COVID-19 seeks ideas from businesses, data scientists and biomedical researchers on using AI to control and manage the pandemic.
233OECD DIGITAL ECONOMY OUTLOOK 2020 © OECD 2020
9. DIGITAL INNOVATION 9. DIGITAL INNOVATION

AI helping to detect, diagnose and prevent the spread of the coronavirusAI can also help detect, diagnose and prevent the spread of the virus. Algorithms that identify patterns and anomalies are already working to detect and predict the spread of COVID-19. Meanwhile, image recognition systems are speeding up medical diagnosis:
● AI-powered early warning systems can help detect epidemiological patterns by mining mainstream news, online content and other information channels in multiple languages to provide early warnings. This can complement syndromic surveillance and other health care networks and data flows (e.g. World Health Organization Early Warning System, Bluedot).
● AI tools can help identify virus transmission chains and monitor broader economic impacts. In several cases, AI technologies have demonstrated their potential to infer epidemiological data more rapidly than traditional reporting of health data. Institutions such as Johns Hopkins University and the OECD (OECD.AI)7 have also made available interactive dashboards that track spread of the virus through live news and real-time data on confirmed coronavirus cases, recoveries and deaths.
● Rapid diagnosis is key to limiting contagion and understanding the way COVID spreads. Applied to images and symptom data, AI could help rapidly diagnose COVID-19 cases. Attention must be given to collecting data representative of the whole population to ensure scalability and accuracy.
Limiting contagion is a priority in all countries and AI applications are also helping to slow spread of the virus:
● A number of countries are using AI technology in population surveillance to monitor COVID-19 cases. In Korea, for example, algorithms use geolocation data, surveillance-camera footage and credit card records to trace coronavirus patients. China assigns a colour code (red, yellow or green) to each person indicating contagion risk using cell phone software. Machine-learning models use travel, payment and communications data to predict the location of the next outbreak and inform border checks. Meanwhile, search engines and social media are helping track the disease in real time.
● Many countries, including Austria, China, Israel, Poland, Singapore and Korea have set up contact tracing systems to identify possible infection routes. Israel, for example, used geolocation data to identify people coming into close contact with known virus carriers. It then sent text messages directing them to isolate themselves immediately.
● AI is identifying, finding and contacting vulnerable, high-risk individuals. For example, Medical Home Network, a Chicago-based non-profit, has an AI platform to identify Medicaid patients most at risk from COVID-19 based on risk of respiratory complications and social isolation.
● Semi-autonomous robots and drones are responding to immediate needs in hospitals. They deliver food, medications and equipment; clean and sterilise; and aid doctors and nurses.
AI technologies have great potential to help policy makers and the health community develop ways to slow the spread of COVID-19 and to aid the search for treatments, including for vaccines. Multidisciplinary and multi-stakeholder co-operation and data exchange both nationally and internationally can boost this contribution. The AI community, medical community, developers and policy makers, for example, can formulate the problem, identify relevant data and open datasets, share tools and train models.
However, AI is not a silver bullet. AI systems based on machine-learning work by identifying patterns in data, and require large amounts of data to find these patterns. The outputs are only as good as the training data. In some cases, diagnostic claims have been called into question and some chatbots have given different responses to questions on symptoms (OECD, 2020[22]). This further emphasises the general point that the data used to train AI need to have the appropriate qualities to draw robust and generalised conclusions – including being designed to avoid biases related to race and gender.
Nevertheless open and collaborative approaches will allow the widest pool of researchers possible to access the tools and data needed to devise innovative uses of AI and maximise the chances of finding effective containment measures and treatments.
The digitalisation of science and innovation policyAs well as profoundly affecting science, research, and innovation processes, digitalisation is also beginning to impact the way in which policy is made in these areas.8 Scientific research and innovation increasingly leave digital “footprints”, in datasets that are becoming ever larger, more complex and
234 OECD DIGITAL ECONOMY OUTLOOK 2020 © OECD 2020
9. DIGITAL INNOVATION 9. DIGITAL INNOVATION
available at higher speed. At the same time, technological advances – in machine learning and natural language processing, for example – are opening new analytical possibilities.
Science, technology and innovation (STI) can harness the power of digitalisation to link and analyse datasets covering diverse areas of policy activity and impact. For example, Digital Science and Innovation Policy (DSIP) initiatives already experiment with semantic technologies. On the one hand, they link datasets with AI to support big data analytics. On the other, they link datasets with interactive visualisation and dashboards to promote data use in the policy process. Other policy areas and government services can similarly benefit from data and digitalisation (Chapter 4).
An overarching aim is to increase the effectiveness of national research and innovation ecosystems. In particular, data linking and synchronisation across digital systems can help optimise administrative workflows to reduce reporting burdens. It can support performance monitoring and management. Finally, it can provide anticipatory intelligence to identify needs for support or policy interventions. The insights gained support improved policy formulation and design in various ways.
Figure 9.14 provides a stylised conceptual view of a DSIP initiative and its main components. All of these elements interact in ways reflecting each country’s institutional set-up. The main elements consist of various input data sources that feed into a “data cycle” enabled by interoperability standards. These standards include unique, persistent and pervasive identifiers (UPPIs). DSIP systems can perform various functions catering to various users’ needs.
Data are predominantly sourced from administrative databases held by funding agencies (e.g. databases of grant awards) and organisations that perform research, development and innovation (RD&I). These include current research information systems in universities, and proprietary bibliometric and patent databases. Some DSIP systems have grown out of these databases. Through integration with external platforms or development of add-on services, they have evolved into infrastructures that can deliver comprehensive data analysis on RD&I activities. Other systems have been established from the ground up. Several DSIP systems harvest data from the web to build a picture of the incidence and impacts of science and innovation activities. Web sources include, but are not limited to, company websites and social media.
DSIP infrastructures can increase the scope, granularity, verifiability, communicability, flexibility and timeliness of policy analyses. They can lead to the development of new STI indicators (Bauer and Suerdem, 2016[23]), the assessment of innovation gaps (Kong et al., 2017[24]), strengthened technology foresight (Kayser and Blind, 2017[25]) and the identification of leading experts and organisations (Shapira and Youtie, 2006[26]; Johnson, Fernholz and Fosci, 2016[27]; Gibson et al., 2018[28]). Furthermore, in some countries, researchers and policy makers have started to experiment with natural language processing and machine learning. They are using it to track emerging research topics and technologies (Wolfram, 2016[29]; Mateos-Garcia, 6 April 2017[30]) and to support RD&I decisions and investments (Yoon and Kim, 2012[31]; Yoon, Park and Kim, 2013[32]).
Realising the potential of DSIP involves overcoming several possible barriers. The OECD DSIP survey received responses from 39 initiatives in the OECD countries and partner economies. Drawing on these responses, DSIP administrators identified data quality, interoperability, sustainable funding and data protection regulations as the biggest challenges facing their initiatives.
Other challenges cited less often were access to data, the availability of digital skills and trust in digital technologies. Policy makers wishing to promote DSIP face further systemic challenges. These include overseeing fragmented DSIP efforts and multiple (often weakly co-ordinated) initiatives; ensuring responsible use of data generated for other purposes; and balancing the benefits and risks of private-sector involvement in providing DSIP data, components and services.
Data interoperability, in particular, is a challenge to which digital tools may help to provide a solution. Research and innovation activities, by their nature, are shaped by a large number of actors. As a result, data on the incidence and impacts of research and innovation are dispersed across a variety of public and private databases and the web. Harvesting these datasets from external sources requires the development of common data formats and other interoperability enablers including, but not limited to, application programming interfaces (APIs), ontologies, protocols and UPPIs for RD&I actors.
235OECD DIGITAL ECONOMY OUTLOOK 2020 © OECD 2020
9. DIGITAL INNOVATION 9. DIGITAL INNOVATION

Figure 9.13. Main challenges facing DSIP initiatives, 2018Percentage of surveyed DSIP systems
0
60
20
10
30
40
50
%
Data quality Interoperability Funding Regulations ondata protection
Digital skills Other Access to data Trust in digitaltechnologies
Note: Questionnaire respondents could select more than one challenge facing their DSIP initiatives.
Source: OECD (2018[33]), OECD Science, Technology and Innovation Outlook 2018: Adapting to Technological and Societal Disruption, https://doi.org/10.1787/sti_in_outlook-2018-en.
12 https://doi.org/10.1787/888934192642
An integrated and interoperable system can considerably reduce the reporting and compliance burden on RD&I actors, freeing up time and money for research and innovation. In addition, it allows quicker, cheaper and more accurate data matching that can, in turn, enable cheaper, more timely and more detailed insights. This can allow for more responsive and tailored policy design. Furthermore, the gradual emergence of internationally recognised identifiers makes it easier to track the impacts of research and innovation activities across borders and map international partnerships.
However, interoperability issues raise important questions. On a technical level, policy makers must ask what kind of digital system can make existing and new data interoperable. On a semantic level, they must grapple with metadata and language issues. With respect to governance, they must reflect on how all stakeholders can be aligned to agree upon an interoperability system. A specific issue concerns the role and effectiveness of data standards, particularly in a mixed ecosystem containing both legacy and new systems.
Many DSIP systems use national identifications (IDs) – e.g. business registration and social security numbers – as well as country-specific IDs for researchers. Nevertheless, attempts are being made to establish international standards and vocabularies to improve the international interoperability of DSIP infrastructures. These include UPPIs, which assign a standardised code unique to each RD&I entity (e.g. researcher, research organisation, funder, project or outputs such as publications). These are designed to be persistent over time and pervasive across various datasets.
Some UPPIs exist as an integral part of, or support for, commercial products. These include publication/citation databases, research information systems and supply-chain-management services. Others exist solely to provide a system of identifiers for wide adoption and use. Open Researcher and Contributor ID (ORCID), for example, aims to resolve name ambiguity in scientific research through a digital register of unique identifiers and basic associated identity information for individual researchers. Registers often incorporate links to a wide range of further information. For example, ORCID records allow details of education, employment, funding and research works to be added manually or brought in by linking to other systems, including Scopus and ResearcherID.
As a UPPI system gains traction there may be a “network effect”, whereby each additional registrant increases the value of the system to all users. Eventually, the UPPI system may become an expected way for entities to unambiguously identify each other. This results in strong incentives for those not yet registered to join.
Besides UPPIs, APIs have become a standard for enabling machine-to-machine interactions and data exchanges. Several countries have started to proliferate APIs across the whole landscape of government websites and databases, improving data re-use. Improvements in access to administrative datasets have positive impacts on the functionality and reliability of the results of analyses delivered by DSIP systems.
236 OECD DIGITAL ECONOMY OUTLOOK 2020 © OECD 2020
9. DIGITAL INNOVATION 9. DIGITAL INNOVATION
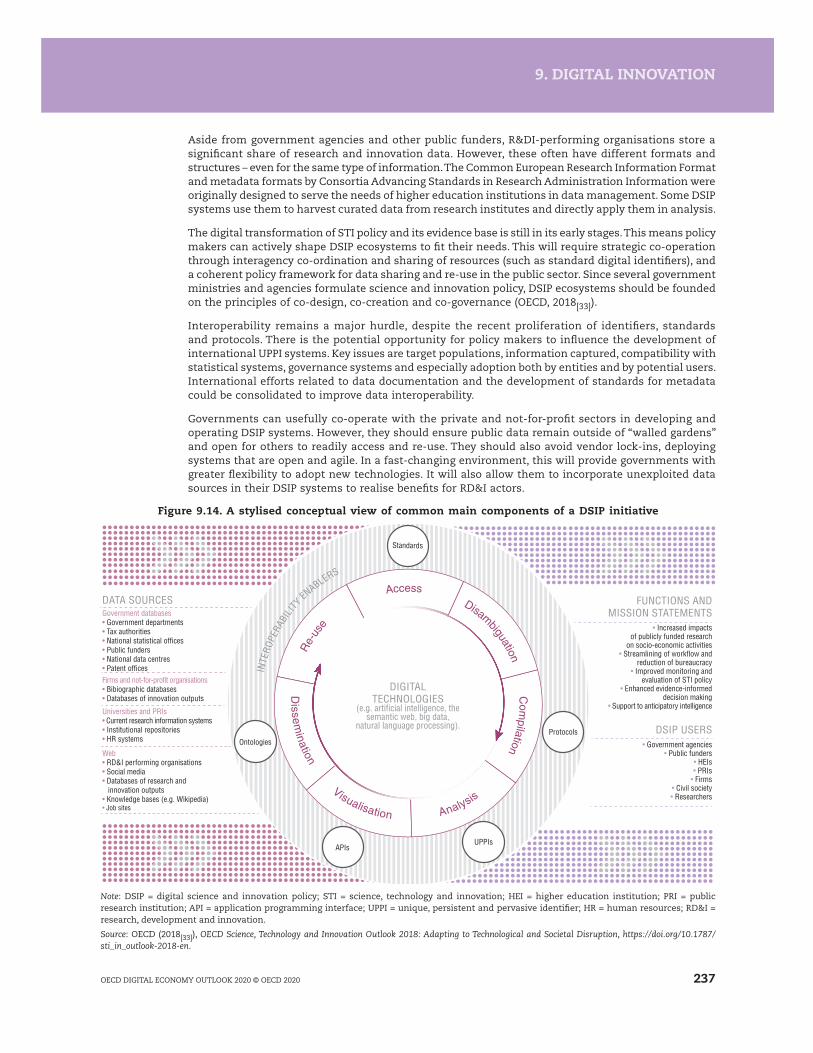
Aside from government agencies and other public funders, R&DI-performing organisations store a significant share of research and innovation data. However, these often have different formats and structures – even for the same type of information. The Common European Research Information Format and metadata formats by Consortia Advancing Standards in Research Administration Information were originally designed to serve the needs of higher education institutions in data management. Some DSIP systems use them to harvest curated data from research institutes and directly apply them in analysis.
The digital transformation of STI policy and its evidence base is still in its early stages. This means policy makers can actively shape DSIP ecosystems to fit their needs. This will require strategic co-operation through interagency co-ordination and sharing of resources (such as standard digital identifiers), and a coherent policy framework for data sharing and re-use in the public sector. Since several government ministries and agencies formulate science and innovation policy, DSIP ecosystems should be founded on the principles of co-design, co-creation and co-governance (OECD, 2018[33]).
Interoperability remains a major hurdle, despite the recent proliferation of identifiers, standards and protocols. There is the potential opportunity for policy makers to influence the development of international UPPI systems. Key issues are target populations, information captured, compatibility with statistical systems, governance systems and especially adoption both by entities and by potential users. International efforts related to data documentation and the development of standards for metadata could be consolidated to improve data interoperability.
Governments can usefully co-operate with the private and not-for-profit sectors in developing and operating DSIP systems. However, they should ensure public data remain outside of “walled gardens” and open for others to readily access and re-use. They should also avoid vendor lock-ins, deploying systems that are open and agile. In a fast-changing environment, this will provide governments with greater flexibility to adopt new technologies. It will also allow them to incorporate unexploited data sources in their DSIP systems to realise benefits for RD&I actors.
Figure 9.14. A stylised conceptual view of common main components of a DSIP initiative
UPPI
Standards
UPPIs
DATA SOURCESGovernment databases• Government departments • Tax authorities • National statistical offices• Public funders• National data centres• Patent officesFirms and not-for-profit organisations• Bibiographic databases• Databases of innovation outputs
Universities and PRIs• Current research information systems• Institutional repositories• HR systems
Web• RD&I performing organisations• Social media• Databases of research and innovation outputs• Knowledge bases (e.g. Wikipedia)• Job sites
FUNCTIONS AND MISSION STATEMENTS
• Increased impacts of publicly funded research
on socio-economic activities• Streamlining of workflow and
reduction of bureaucracy• Improved monitoring and
evaluation of STI policy• Enhanced evidence-informed
decision making• Support to anticipatory intelligence
DSIP USERS• Government agencies
• Public funders• HEIs• PRIs
• Firms• Civil society• Researchers
DIGITAL TECHNOLOGIES
(e.g. artificial intelligence, the semantic web, big data,
natural language processing).
Re-
use
Visualisation
Dissem
ination
Analysis
Com
pilation
Disambiguation
Access
OntologiesProtocols
APIsUPPIs
INTE
ROPE
RABI
LITY
ENABLERS
Note: DSIP = digital science and innovation policy; STI = science, technology and innovation; HEI = higher education institution; PRI = public research institution; API = application programming interface; UPPI = unique, persistent and pervasive identifier; HR = human resources; RD&I = research, development and innovation.
Source: OECD (2018[33]), OECD Science, Technology and Innovation Outlook 2018: Adapting to Technological and Societal Disruption, https://doi.org/10.1787/sti_in_outlook-2018-en.
237OECD DIGITAL ECONOMY OUTLOOK 2020 © OECD 2020
9. DIGITAL INNOVATION 9. DIGITAL INNOVATION

References
Bauer, M. and A. Suerdem (2016), “Relating science culture and innovation”, presentation at the OECD blue sky meeting on science and innovation indicators, Ghent, 19-21 September 2016, https://www.oecd.org/sti/097%20-%20OECD%20Paper%20attitudes%20and%20innovation_v4.0_MB.pdf.
[23]
Bello, M. and F. Galindo-Rueda (2020), “Charting the digital transformation of science: Findings from the 2018 OECD International Survey of Scientific Authors (ISSA2)”, OECD Science, Technology and Industry Working Papers, No. 2020/3, OECD Publishing, Paris, https://doi.org/10.1787/1b06c47c-en.
[12]
Bonafilia, D. et al. (2 April 2019), “Mapping the world to help aid workers, with weakly, semi-supervised learning”, Computer Visions - ML Applications blog, https://ai.facebook.com/blog/mapping-the-world-to-help-aid-workers-with-weakly-semi-supervised-learning.
[21]
Boselli, B. and F. Galindo-Rueda (2016), “Drivers and Implications of Scientific Open Access Publishing: Findings from a Pilot OECD International Survey of Scientific Authors”, OECD Science, Technology and Industry Policy Papers, No. 33, OECD Publishing, Paris, https://dx.doi.org/10.1787/5jlr2z70k0bx-en.
[16]
Fyfe, A. et al. (2017), “Untangling academic publishing: A history of the relationship between commercial interests, academic prestige and the circulation of research”, Briefing Paper, University of St. Andrews, https://doi.org/10.5281/zenodo.546100.
[17]
Galindo-Rueda, F. and F. Verger (2016), “OECD Taxonomy of Economic Activities Based on R&D Intensity”, OECD Science, Technology and Industry Working Papers, No. 2016/4, OECD Publishing, Paris, https://dx.doi.org/10.1787/5jlv73sqqp8r-en.
[7]
Galindo-Rueda, F., F. Verger and S. Ouellet (2020), “Patterns of innovation, advanced technology use and business practices in Canadian firms”, OECD Science, Technology and Industry Working Papers, No. 2020/02, OECD Publishing, Paris, https://doi.org/10.1787/6856ab8c-en.
[11]
Gibson, E. et al. (2018), “Technology foresight: A bibliometric analysis to identify leading and emerging methods”, Foresight and STI Governance, Vol. 12/1, pp. 6-24, https://foresight-journal.hse.ru/en/2018-12-1/217552882.html.
[28]
Gold, E. et al. (2018), “An open toolkit for tracking open science partnership implementation and impact [version 1; not peer-reviewed]”, Gates Open Research 2/54, https://doi.org/10.21955/gatesopenres.1114891.1.
[14]
Herdagdelen, A. et al. (3 June 2020), “Protecting privacy in Facebook mobility data during the COVID-19 response”, Facebook Research blog, https://research.fb.com/blog/2020/06/protecting-privacy-in-facebook-mobility-data-during-the-covid-19-response/.
[20]
Inaba, T. and M. Squicciarini (2017), “ICT: A new taxonomy based on the international patent classification”, OECD Science, Technology and Industry Working Papers, No. 2017/01, OECD Publishing, Paris, https://doi.org/10.1787/18151965.
[1]
Johnson, R., O. Fernholz and M. Fosci (2016), “Text and data mining in higher education and public research: An analysis of case studies from the United Kingdom and France”, report commissioned by the Association des directeurs et personnels de direction des bibliothèques universitaires et de la documentation, Paris, https://adbu.fr/competplug/uploads/2016/12/TDM-in-Public-Research-Final-Report-11-Dec-16.pdf.
[27]
Kayser, V. and K. Blind (2017), “Extending the knowledge base of foresight: The contribution of text mining”, Technological Forecasting and Social Change, Vol. 116, pp. 208-215.
[25]
Kong, D. et al. (2017), “Using the data mining method to assess the innovation gap: A case of industrial robotics in a catching-up country”, Technological Forecasting and Social Change, Vol. 119, pp. 80-97.
[24]
Mateos-Garcia, J. (2017), “We are building a formidable system for measuring science – but what about innovation?”, Nesta blog, 26 July, http://www.nesta.org.uk/blog/we-are-building-a-formidable-system-for-measuring-science-but-what-about-innovation/.
[30]
OECD (2020), “OECD Competition Assessment Toolkit”, webpage, https://www.oecd.org/competition/assessment-toolkit.htm (accessed on 21 October 2020).
[22]
OECD (2020), Protecting Online Consumers During the Covid-19 Crisis, webpage, http://www.oecd.org/coronavirus/policy-responses/protecting-online-consumers-during-the-covid-19-crisis-2ce7353c/ (accessed on 21 October 2020).
[8]
OECD (2019), Digital Innovation: Seizing Policy Opportunities, OECD Publishing, Paris, https://dx.doi.org/10.1787/a298dc87-en. [9]
OECD (2019), Enhancing Access to and Sharing of Data: Reconciling Risks and Benefits for Data Re-use across Societies, OECD Publishing, Paris, https://doi.org/10.1787/276aaca8-en.
[34]
OECD (2019), Measuring the Digital Transformation: A Roadmap for the Future, OECD Publishing, Paris, https://dx.doi.org/ 10.1787/9789264311992-en.
[4]
238 OECD DIGITAL ECONOMY OUTLOOK 2020 © OECD 2020
9. DIGITAL INNOVATION 9. DIGITAL INNOVATION
References and Notes
OECD (2018), “Enhancing product recall effectiveness: OECD background report”, OECD Science, Technology and Industry Policy Papers, No. 58, OECD Publishing, Paris, https://doi.org/10.1787/ef71935c-en.
[10]
OECD (2018), OECD Science, Technology and Innovation Outlook 2018: Adapting to Technological and Societal Disruption, OECD Publishing, Paris, https://doi.org/10.1787/sti_in_outlook-2018-en.
[33]
OECD (2017), OECD Science, Technology and Industry Scoreboard 2017: The Digital Transformation, OECD Publishing, Paris, https://doi.org/10.1787/9789264268821-en.
[2]
OECD (2015), “Assessing government initiatives on public sector information: A review of the OECD Council Recommendation”, OECD Digital Economy Papers, No. 248, OECD Publishing, Paris, http://dx.doi.org/10.1787/5js04dr9l47j-en.
[13]
OECD (2015), Frascati Manual 2015: Guidelines for Collecting and Reporting Data on Research and Experimental Development, The Measurement of Scientific, Technological and Innovation Activities, OECD Publishing, Paris, https://dx.doi.org/ 10.1787/9789264239012-en.
[6]
OECD (2015), “Making Open Science a Reality”, OECD Science, Technology and Industry Policy Papers, No. 25, OECD Publishing, Paris, https://dx.doi.org/10.1787/5jrs2f963zs1-en.
[15]
OECD (2015), OECD Science, Technology and Industry Scoreboard 2015: Innovation for growth and society, OECD Publishing, Paris, https://doi.org/10.1787/sti_scoreboard-2015-en.
[19]
OECD (2008), Recommendation of the Council for Enhanced Access and More Effective Use of Public Sector Information, OECD, Paris, https://legalinstruments.oecd.org/en/instruments/OECD-LEGAL-0362.
[18]
Shapira, P. and J. Youtie (2006), “Measures for knowledge-based economic development: Introducing data mining techniques to economic developers in the state of Georgia and the US South”, Technological Forecasting and Social Change, Vol. 73/8, pp. 950-965.
[26]
United Nations (2008), International Standard Industrial Classification of all Economic Activities (ISIC), Rev. 4, Statistical Papers, Series M, No. 4, Rev. 4, Department of Statistical and Economic Affairs, United Nations, New York, https://unstats.un.org/unsd/publication/seriesM/seriesm_4rev4e.pdf.
[35]
WIPO (2019), World Intellectual Property Indicators 2019, World Intellectual Property Organization, Geneva, https://www.wipo.int/edocs/pubdocs/en/wipo_pub_941_2019.pdf.
[5]
WIPO (n.d.), “Copyright protection of computer software”, webpage, https://www.wipo.int/copyright/en/activities/software.html (accessed on 21 October 2020).
[3]
Wolfram, D. (2016), “Natural synergies to support digital library research”, presentation at the joint workshop on bibliometric-enhanced information retrieval and natural language processing for digital libraries, 3 July, https://www.aclweb.org/anthology/attachments/W16-1501.Presentation.pdf.
[29]
Yoon, J. and K. Kim (2012), “Detecting signals of new technological opportunities using semantic patent analysis and outlier detection”, Scientometrics, Vol. 90/2, pp. 445-61.
[31]
Yoon, J., H. Park and K. Kim (2013), “Identifying technological competition trends for R&D planning using dynamic patent maps: SAO-based content analysis”, Scientometrics, Vol. 94/1, pp. 313-31.
[32]
Notes
1. Information and communication services comprises the following ISIC Rev.4 industries: Publishing activities; Motion picture, video and television programme production, sound recording and music publishing activities; Programming and broadcasting activities; Telecommunications; Computer programming, consultancy and related activities; Information service activities (United Nations, 2008[35]). Software publishing is a subset of the first category but cannot be presented separately in the figure since many countries do not break these down.
2. Innovation activities include all developmental, financial and commercial activities by a firm that are intended to result in a new or improved product or business process (or combination thereof) that differs significantly from the firm’s previous products or business processes and that has been introduced on the market or brought into use by the firm (OECD, 2018[10]).
3. This section draws upon Chapters 2 and 4 of OECD (2020[8]) authored respectively by Fernando Galindo-Rueda and Dominique Guellec; and Caroline Paunov and Sandra Planes-Satorra.
239OECD DIGITAL ECONOMY OUTLOOK 2020 © OECD 2020
9. DIGITAL INNOVATION 9. DIGITAL INNOVATION
References and Notes

4. Digitisation is the conversion of analogue data and processes into a machine-readable format. Digitalisation is the use of digital technologies and data, as well as interconnection, that results in new or changes to existing activities. Digital transformation refers to the economic and societal effects of digitisation and digitalisation (OECD, 2019[34]).
5. Information service activities (ISIC Rev.4, division 63) comprises the following industries: Data processing, hosting and related activities; Web portals; News agency activities; Other information service activities not elsewhere classified (United Nations, 2008[35]).
6. This section draws upon OECD (2020[22]).
7. https://www.oecd.ai/.
8. This section draws upon Chapter 12 of OECD (2018[33]) and Chapter 7 of OECD (2020[8]), authored by Michael Keenan, Dmitry Plekhanov, Fernando Galindo-Rueda and Daniel Ker.
240 OECD DIGITAL ECONOMY OUTLOOK 2020 © OECD 2020
9. DIGITAL INNOVATION
References and Notes

Chapter 10EVOLVING BUSINESS MODELS
241OECD DIGITAL ECONOMY OUTLOOK 2020 © OECD 2020
KEY FINDINGS
�� Three thriving e-commerce business models include those that use online platforms, offer subscription services and incorporate online-offline models. As digital transformation and the pandemic evolve, new e-commerce business models are difficult to predict.
�� Policy can support e-commerce innovation by removing regulatory barriers that preserve artificial distinctions between online and offline commerce and encouraging regulatory flexibility, experimentation and transparency.
�� They vary widely in terms of size, functionality and profitability. Consequently, they cannot be reduced to a few categories, let alone a single sector. No one size fits all.
�� Online platforms share a number of economic characteristics. These include positive direct and indirect network effects, cross-subsidisation, scale without mass, potentially global reach, panoramic scope, disruptive innovation, switching costs and, in some markets, winner-take-all or winner-take-most tendencies.
�� Different platforms succeed for different reasons. Some correctly anticipate key market trends, while others strengthen trust. Still others focus on expansion, customer loyalty and innovation more than profit for many years. Several leading platforms gained momentum by building on the foundation of more established platforms.
�� During the COVID-19 pandemic, many businesses have embraced digital tools to help them implement and increase teleworking. In France, industries with the highest levels of teleworking maintained business activity at 70% to 80% of the normal level in April 2020. This was higher than in other industries.
�� The COVID-19 crisis is challenging the survival and growth of start-ups, which typically play a key role to create jobs, innovation and long-run growth in the OECD. Nevertheless, the pandemic is creating business opportunities to use digital technologies to address the challenges arising from the pandemic.
�� New business models driven by digitalisation have contributed to an increase in non-standard forms of work, such as temporary jobs, part-time contracts and self-employment. At the same time, digitalisation has also enabled new forms of work, such as jobs mediated by online platforms. More than one-third of the labour force in most OECD countries are employed in non-standard forms of work.
�� Non-standard workers can enjoy higher flexibility and autonomy, but also lack the same rights and protection as standard workers. The COVID-19 pandemic has hit non-standard workers more severely. They are more exposed to health risks, unable to telework and often receive less government support than employees.
IntroductionDigital technologies are enabling business models and organisations. In some cases, firms are creating entirely new markets. In others, new players are shaking up the terrain, forcing traditional businesses to reinvent themselves to survive. This chapter examines new e-commerce business models and their implications for policy. It discusses the variety of business models adopted by online platforms, as well as implications for work in the digital era. Finally, it sheds light on the changes in business models and work practices implied by the COVID-19 pandemic.
The rise of new e-commerce business modelsE-commerce facilitates trade across borders, increases convenience for consumers and enables firms to reach new markets. Digital technologies enable e-commerce innovations and often serve as the backbone of business model developments. Some of these technologies, like smart assistants enabled by artificial intelligence (AI), constitute new channels for selling or purchasing products over electronic networks. Other emerging technologies, like big data analytics, foster the growth of new data-driven business models for e-commerce and can support transactions moving on line.
E-commerce has taken on new importance as the health and economic crisis related to the COVID-19 pandemic unfolds. In countries with lockdowns and stay-at-home orders, firms that operated only physically before the pandemic have turned to e-commerce as a way to survive. At the same time, firms
242 OECD DIGITAL ECONOMY OUTLOOK 2020 © OECD 2020
10. EVOLVING BUSINESS MODELS 10. EVOLVING BUSINESS MODELS

that engaged in e-commerce prior to the pandemic are not only finding themselves with a competitive advantage, but are also innovating in what and how they sell on line.
New business models push out the e-commerce frontier in two ways (OECD, 2019[1]). First, new business models can enable more transactions to move online in a given market or for a given set of participants, an effect referred to as the “intensive margin” of e-commerce. Second, new business models can enable whole new markets to emerge for goods and services not previously available on line, or allow new participants to enter the market. This effect is referred to as the “extensive margin” of e-commerce (OECD, 2019[1]). Three e-commerce business models that have been particularly transformative are those that: i) use online platforms; ii) offer subscription services; and iii) incorporate online-offline models (OECD, 2019[1]).
E-commerce business models that use online platforms are thrivingThe most common type of e-commerce business model uses online platforms, and they are thriving during the COVID-19 crisis. Amazon, for example, has been experiencing Black Friday-like demand since the onset of the pandemic. It hired an extra 75 000 workers in the United States to help process the increase in orders (Neate, 2020[2]).
As multi-sided markets, online platforms benefit from both direct and indirect network effects, whereby economies of scale benefit users on both sides of the market. In the context of e-commerce, these sides can be understood as buyers and sellers. Typically, buyers gain utility from the presence of more sellers, assuming there is an expansion in the scope and/or variety of products for sale. Similarly, sellers benefit from a large number of potential buyers. As digital services, platforms are characterised by relatively higher fixed costs and comparatively lower marginal costs. This means the additional cost of hosting another buyer or seller can be close to zero.
In the context of e-commerce, online platforms act as intermediaries between buyers and sellers to facilitate the exchange of goods and services over the Internet. The large number of actors in a digital marketplace allows a potentially infinite variety of goods and services available for sale, in contrast to the more limited scope of products available in physical stores. In particular, a large number of potential buyers and low marginal costs pushes out the extensive margin of e-commerce because it enables sales of previously unprofitable (e.g. niche) products (Ellison and Ellison, 2018[3]).
Big data analytics and AI can improve matching buyers and sellers, or indeed the match between consumers and content. E-commerce firms can use data gleaned from their customers to algorithmically optimise and personalise matching and product recommendations. Such data includes browsing patterns, the length and nature of user engagement with particular features, responsiveness to design or format changes, and the behaviour of similar users. Researchers have found changes in algorithmic design can alter the rate of matching between buyers and sellers in the context of online platforms (Fradkin, 2017[4]). This, in turn, improves overall engagement and the likelihood of matches.
E-commerce platforms bring together buyers and sellers who may be dispersed geographically and involve parties that have not met before. Some sellers on online platforms are large and may have established brands that buyers trust. In contrast, smaller, potentially unknown vendors may have more difficulty establishing conditions that would lead buyers to transact willingly with them. In addition, third-party providers and sellers operating on multi-sided markets may be unsure about payment or buyers’ reliability.
Online platforms can provide mechanisms that help resolve information asymmetries, build trust on both sides of the market, and ensure that transactions are safe and reliable to foster e-commerce. They can easily collect, store, communicate and verify information on both sides of the market, particularly following repeated transactions. This can create trust based on the transaction history of all users on the platform rather than between one particular buyer and seller. Common trust-building mechanisms include minimum quality standards, reputation and review systems, digital identity authentication and provision of insurance (OECD, 2019[5]).
Blockchain technology can also help improve trust in e-commerce. Blockchain removes the need for an intermediary for third-party verification for trusted transactions. This could help develop distributed, peer-to-peer networks with multiple sides without the need for a centralised online
243OECD DIGITAL ECONOMY OUTLOOK 2020 © OECD 2020
10. EVOLVING BUSINESS MODELS 10. EVOLVING BUSINESS MODELS

marketplace. OpenBazaar, for example, has no fees for listings, selling or commissions, and accepts over 50 cryptocurrencies as payment (OECD, 2017[6]). Other potential applications of blockchain related to trust could involve the development of a portable and decentralised reputation system.
The COVID-19 pandemic has shown that e-commerce business models using online platforms can help increase participation of firms in e-commerce, both domestically and across borders. While online platforms differ, each offers incentives to add users, which typically means low entry costs for sellers. As a result, SMEs and, in some cases sole traders, can compete alongside more established firms on online platforms. SMEs have been among the many firms that have turned to e-commerce during the COVID-19 pandemic. When online platforms operate in multiple international markets, being active on the platform can give sellers access to new markets overseas.
However, sellers may need to make a range of complementary investments to buy and sell on line effectively. Trading at a distance, including potentially across borders, requires significant upstream and downstream investments in several areas. These include supply-chain management; secure payment systems; delivery and fulfilment mechanisms; and customer-facing services like dispute resolution mechanisms and customer service. E-commerce across borders may also require communication in foreign languages.
As a result, online platforms have begun to offer complementary services for firms that trade on their platform. Such services include fulfilment, logistics, customer service and software-as-a-service offerings. SMEs disproportionately benefit from these services. Without them, they would require significant up-front fixed costs that can be difficult for a small firm to cover. Platform-enabled services can transform this fixed cost into a variable cost, easing the financial burden. These new solutions push out the extensive margin of e-commerce, enabling new participants to enter the marketplace.
E-commerce subscription services are becoming more popularSubscriptions are becoming an increasingly popular business model for e-commerce, including in the context of the COVID-19 pandemic. This business model is characterised by regular and recurring payments for the repeated provision of a good or service. In the e-commerce context, this encompasses a range of new and emerging businesses, from streaming services like Netflix to recurring purchases of consumer goods such as the Dollar Shave Club. In the first three months of 2020, almost 16 million people created Netflix accounts, a marked increase caused in part by lockdown and stay-at-home measures (BBC, 2020[7]). The subscription model can also relate to recurring purchases of a combination of digital and tangible products. For example, a subscriber to a printed newspaper could receive access to its digital content.
Subscription e-commerce business models typify a broader trend towards more continuous, digitally enabled access to or provision of goods and services. Digital technologies enable easy ordering of goods and services, removing associated transaction costs and thus improving convenience for consumers. Firms benefit from regular and ongoing revenue streams. Many subscription business models relate to products that deplete with use and require replenishment (Chen et al., 2017[8]). Interestingly, connected devices that use streams of data through sensors, software and network connections have become associated with physical goods to make continuous or recurring purchases.
Many emerging subscription services offer access to digital products that are only tradeable as a result of digital transformation, like software services. The pricing of non-rivalrous digital goods with low or zero marginal costs can be difficult for firms. One solution is bundling many digital products and charging a single price (Bakos and Brynjolfsson, 1999[9]; Bakos and Brynjolfsson, 2000[10]). E-commerce subscription business models, such as Spotify or Netflix, are examples of this theory in practice (Goldfarb and Tucker, 2017[11]).
Some digitalised subscription models pursue a “freemium strategy” that limits use of or access to content. Those who pay the relevant subscription fee enjoy a higher quality service, which may include additional content or the absence of advertising. This model can help new and small firms gain market share by enabling the consumer to experience the service without initial up-front costs. As those users who pay for premium services are also likely to use the service more, firms can respond appropriately (European Commission, 2015[12]).
244 OECD DIGITAL ECONOMY OUTLOOK 2020 © OECD 2020
10. EVOLVING BUSINESS MODELS 10. EVOLVING BUSINESS MODELS

Cloud computing technology has spurred e-commerce through subscription business models. Cloud computing enables individuals and organisations to access resources through an online interface. Such resources include software applications, storage capacity, and networking and computing power. Some well-known variants of this model include infrastructure-as-a-service, platform-as-a-service and software-as-a-service.
Such cloud computing resources can be priced on demand and used in a flexible, scalable and adaptable manner. This enables users to reduce the costs of fixed investment in information and communication technologies (ICTs). This, in turn, allows users, including SMEs and individuals, to access computing resources that would otherwise be prohibitively expensive. As cloud computing increases the availability, capacity and ubiquity of computing resources, it also enables the diffusion of sophisticated digital technologies (e.g. AI and big data analytics) that would otherwise have been prohibitively expensive.
Experimentation with online-offline e-commerce business models is increasingAs e-commerce has become more prevalent, many conventional firms and retailers are experimenting with the inclusion of online distribution channels alongside their brick-and-mortar operations. In the context of the pandemic, this includes smaller retailers that are trying to survive during the total drop off of sales in physical stores. However, leveraging the Internet, or other electronic networks, to integrate e-commerce into an existing firm-level business model often requires complementary investments and capacities. This can include supply-chain and fulfilment arrangements, as well as consolidated inventory systems.
For example, many firms have developed “click-and-collect” mechanisms to enable consumers to order and purchase on line. Consumers then collect the relevant items in a local brick-and-mortar store; in another location such as a locker; or kerbside. This allows consumers to immediately purchase the good or service at a distance, but to save on shipping costs, delays and inconveniences associated with delivery. Notably, this mechanism enables firms to retain their current centralised inventory system. It reduces their operational costs associated with physical brick-and-mortar stores. Furthermore, it enables them to acquire useful data about users.
To the extent that click-and-collect mechanisms are located in a brick-and-mortar store, they may allow consumers to check quality and assess the colour, style and size of the product within the store itself. In addition, consumers can make returns in store, which may encourage them to purchase on line. One survey found consumers were more willing to purchase on line if they could return in a brick-and-mortar store (United Postal Service, 2018[13]). Other developments in this space include kerbside fulfilment, whereby consumers can order groceries on line and then drive to their local brick-and-mortar store to pick them up immediately (Howland, 2016[14]). This model enables consumers to shop at a distance and retailers to minimise expensive investments in home-delivery supply and logistics systems. Major retailers like Walmart, Amazon, Target and Nordstrom have all adopted such systems.
In one emerging e-commerce business model, online fashion businesses and others are including offline features to enable the sale of fit-critical goods and services on line. On the one hand, an offline distribution channel re-introduces frictions to the business model and may increase costs. On the other, it can increase the extensive margin of e-commerce by enabling new types of products to be sold on line.
Firms that sell heterogeneous or bespoke products like clothing may benefit from consumers’ ability to physically inspect the product before purchase. For example, several online apparel retailers have opened brick-and-mortar stores that allow consumers to try on products before ordering them on line. Bonobos has opened over 30 “guide shops” to enable consumers to try the product for fit and quality. Consumers then place their order on line, a process that increases conversion, minimises returns and increases the average purchase value. Online brands such as Birchbox, Daniel Wellington, Harry’s and Warby Parker have also added a physical component to the traditional e-commerce experience.
Other firms are increasingly experimenting with online ordering mechanisms within or near brick-and-mortar stores themselves to boost sales, enable customisation and increase efficiency. For example, many restaurants have adopted ordering, purchasing and paying by application or kiosk for almost immediate pick-up. Indeed, the fast food chain McDonald’s has installed digital self-order kiosks in all 14 000 of its US stores (Hafner and Limbachia, 2018[15]). These kiosks rely on touch-screen technology
245OECD DIGITAL ECONOMY OUTLOOK 2020 © OECD 2020
10. EVOLVING BUSINESS MODELS 10. EVOLVING BUSINESS MODELS
to relay information via wireless networks from customer orders to the kitchen, where the meals are made on demand. Users tend to spend more time considering their options when using an automated kiosk, which can result in selecting more items for purchase (Houser, 2018[16]). Similarly, increased revenues may result because users are more likely to customise their orders, which typically carries an additional fee. One study found that online ordering resulted in 14% more customisation requests than orders made in person (Goldfarb et al., 2015[17]).
An emerging and innovative example of embedding online ordering mechanisms within brick-and-mortar stores is the partially automated grocery store pioneered by Amazon (Amazon, 2019[18]). After entering the store via a mobile application, consumers can simply select the desired products and then immediately leave the store without a formal checkout. While the aim of their business model is to increase the efficiency of the shopping experience by partially automating the payment process, it can also help foster social distancing.
Innovative payment mechanisms boost e-commerce and social distancingOnline payment innovations help unlock e-commerce potential by promoting trusted online transactions between unknown parties, and also support social distancing. Three innovative forms of holding and conducting payments that can facilitate e-commerce include: digital wallets, mobile money and cryptocurrencies. These mechanisms are not necessarily discrete – indeed, mobile money and cryptocurrencies are both stored in forms of digital wallets. However, together they have the potential to drive future developments in the e-commerce landscape.
Digital wallets, also known as “e-wallets” or “electronic wallets”, are one mechanism of enabling online payments. Such wallets act as intermediating application layers that hold financial information about the relevant funding source on both sides of the transaction (e.g. credit card details) (Cheok, Huiskamp and Malinowski, 2014[19]). Essentially, digital wallets tokenise financial information such that it does not need to be directly shared with an unknown party.
Digital wallets vary in their service offerings and features. Some wallets directly process payments, transferring money between buyers and sellers (e.g. PayPal); others transfer financial details between the payment processors of either party (e.g. Google Wallet). Digital wallets can hold a variety of currencies, including cryptocurrencies (see below). They can be used from any connected device, including mobile phones and other smart devices (e.g. smart watches). Mobile wallets are a sub-type of digital wallet, with mobile-specific features and services, that can be used to make purchases on line. However, they are also increasingly used in point-of-sale transactions, for example by street vendors or in brick-and-mortar stores, using connected devices.
Mobile payments, or mobile money, is a second form of payment innovation that enables e-commerce. It is useful particularly for the unbanked (i.e. those without access to financial services). Mobile money differs from digital wallets in that payment is made via mobile communication networks. It does not necessarily require an existing relationship with a financial services provider.
Mobile money is mediated by mobile network operators who use a system of agents to accept regular (fiat) currency in the form of cash. They store an equivalent value in a digital wallet, which can then be transferred to other users or withdrawn later. Mobile money is typically associated with a mobile phone number and often uses two-factor authentication through a personal identification number issued at the point of registration. Mobile money can typically be transferred to others who are registered with the same mobile money system, including to merchants in exchange for goods and services.
A third emerging payment mechanism involves distributed ledger technologies (DLTs), also known as cryptocurrencies. Cryptocurrencies like bitcoin operate through a distributed database independent of central banks or financial institutions. They provide a means of making anonymous, validated transfers of value. However, other extensions of blockchain-enabled payments may hold more potential for e-commerce. These include use of “smart contracts”, namely self-executing and deterministic software protocols that only transfer value after particular conditions are met.
Smart contracts could hold particular promise for e-commerce when combined with connected devices. For example, a blockchain-enabled, connected washing machine could initiate an e-commerce transaction through a smart contract when it detects that it is out of detergent (OECD, 2017[6]).
246 OECD DIGITAL ECONOMY OUTLOOK 2020 © OECD 2020
10. EVOLVING BUSINESS MODELS 10. EVOLVING BUSINESS MODELS

Connected devices could also potentially transact with each other in an autonomous fashion using smart contracts, thereby facilitating a completely new kind of e-commerce. A bitcoin-based start-up called 21 has outlined a model whereby environmental sensors could passively collect data and sell it to other machines or institutions for micropayments of cryptocurrencies, like bitcoin (Pate, Kun and Srinivasan, 2016[20]). Blockchain technology could therefore enable e-commerce transactions between connected devices rather than simply between individuals and firms.
Public policies can foster e-commerce innovation As digital transformation and the COVID-19 pandemic evolves, new business models will arise in ways that are difficult to predict. Business model innovations that make use of data and digital technologies often challenge traditional policy frameworks. Policy can support e-commerce innovation in two important ways.
First, governments can remove regulatory barriers that preserve artificial distinctions between online and offline commerce. Technological changes have blurred the boundaries between online and offline activities, as well as between goods and services. This has an impact on policy settings that often rely on an increasingly artificial distinction between traditional commerce and e-commerce.
Indeed, firms are increasingly combining the most promising aspects of both traditional commerce and e-commerce. As a result, ambiguity will rise, especially as firms increasingly seek an online presence during the COVID-19 pandemic. The mix of online and offline distribution models means, for example, that brick-and-mortar stores increasingly go beyond the simple point-of-service purchase of products. Instead, physical stores often extend the online experience facilitated by e-commerce, and vice versa.
Innovative business models may use brick-and-mortar stores as a point of collection or return of products bought on line, or as a temporary storage facility before delivery. Existing licensing, permitting or zoning rules – particularly at the local level – may not allow such functions. In so doing, they constrains the development of promising e-commerce business models (e.g. omni-channel models) (OECD, 2019[5]). At the same time, road and sidewalk rules, many of which are local, usually do not account for the potential use of autonomous robots and unmanned aerial vehicles to deliver e-commerce products over the last mile. This inhibits new forms of delivery or raises uncertainty.
Policy can also support e-commerce by encouraging regulatory flexibility, experimentation and transparency. Policy experimentation can help ensure a firm’s ability to innovate, while remaining within the spirit of existing laws. Outcome- or performance-based regulations, as well as regulatory sandboxes, can enable firms to test innovative products or services in a contained environment (Attrey, Lesher and Lomax, 2020[21]). In the e-commerce context, such sandboxes have been used to test the use of drones for delivery and digital payment mechanisms (OECD, 2019[5]), two innovations that can contribute to social distancing. Regulatory sandboxes are also an important instrument for “regulatory learning”.
At the same time, policy makers should avoid focusing on a particular type of e-commerce business model. For example, while e-commerce business models that use online platforms are among the most prominent today, advances in digital technologies such as DLTs may ultimately diminish the role of such platforms. Increased transparency, including through better communication of existing regulations and their specific application to e-commerce, is another important step in reducing uncertainty for innovative e-commerce firms.
Online platformsAlthough the previous section includes a focus on third-party business-to-consumer (B2C) and consumer-to-consumer (C2C) platforms for e-commerce, the range of online platforms is far broader. Other platforms differ in functionality, encompassing everything from carpooling services and app stores to superplatforms. On superplatforms, for example, users can accomplish most or even all of what they might want to do with a smartphone without ever leaving the app. The platforms also differ in how they generate revenue. Some draw revenue from advertisers, others from transaction fees and still others from subscriptions. Some use a combination of the three.
There is wide variation among even the leading online platforms in their profitability per employee. Facebook, for example, with its work force of about 25 000, looks extremely profitable on a per-employee
247OECD DIGITAL ECONOMY OUTLOOK 2020 © OECD 2020
10. EVOLVING BUSINESS MODELS 10. EVOLVING BUSINESS MODELS
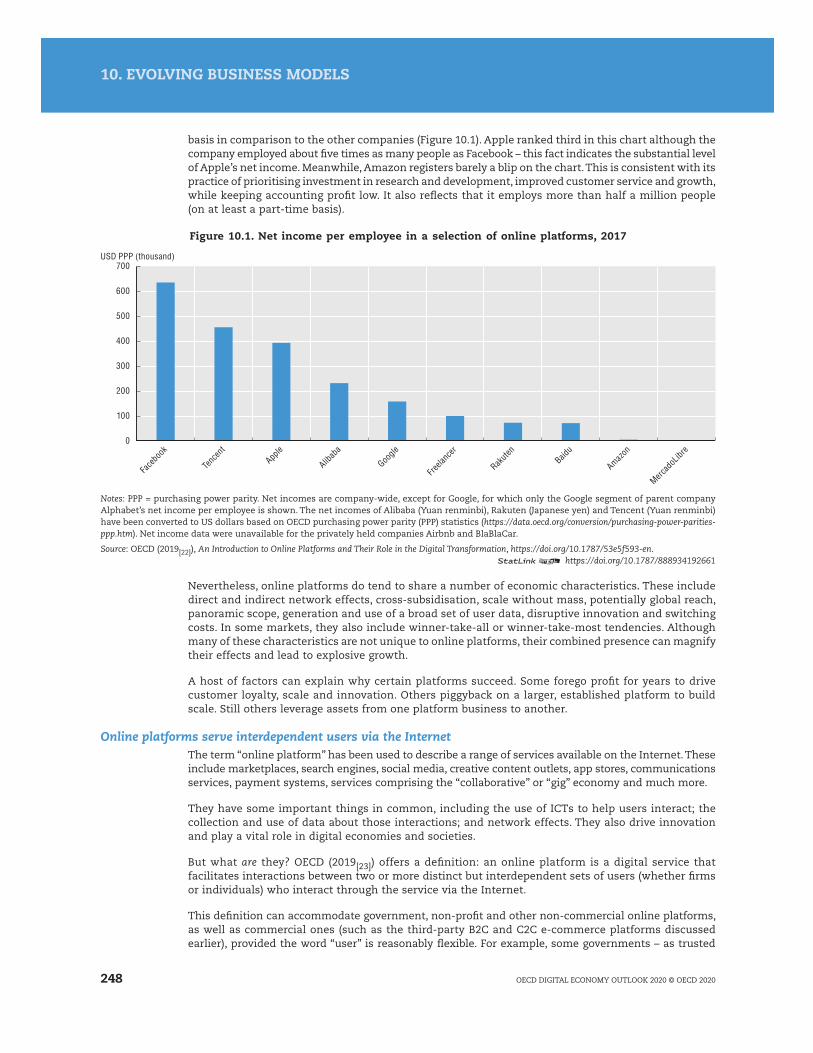
basis in comparison to the other companies (Figure 10.1). Apple ranked third in this chart although the company employed about five times as many people as Facebook – this fact indicates the substantial level of Apple’s net income. Meanwhile, Amazon registers barely a blip on the chart. This is consistent with its practice of prioritising investment in research and development, improved customer service and growth, while keeping accounting profit low. It also reflects that it employs more than half a million people (on at least a part-time basis).
Figure 10.1. Net income per employee in a selection of online platforms, 2017
0
100
200
300
400
500
600
700
Face
book
Tenc
ent
Apple
Alibab
a
Freela
ncer
Rakute
nBaid
u
Amazon
Mercad
oLibr
e
USD PPP (thousand)
Notes: PPP = purchasing power parity. Net incomes are company-wide, except for Google, for which only the Google segment of parent company Alphabet’s net income per employee is shown. The net incomes of Alibaba (Yuan renminbi), Rakuten (Japanese yen) and Tencent (Yuan renminbi) have been converted to US dollars based on OECD purchasing power parity (PPP) statistics (https://data.oecd.org/conversion/purchasing-power-parities-ppp.htm). Net income data were unavailable for the privately held companies Airbnb and BlaBlaCar.
Source: OECD (2019[22]), An Introduction to Online Platforms and Their Role in the Digital Transformation, https://doi.org/10.1787/53e5f593-en.12 https://doi.org/10.1787/888934192661
Nevertheless, online platforms do tend to share a number of economic characteristics. These include direct and indirect network effects, cross-subsidisation, scale without mass, potentially global reach, panoramic scope, generation and use of a broad set of user data, disruptive innovation and switching costs. In some markets, they also include winner-take-all or winner-take-most tendencies. Although many of these characteristics are not unique to online platforms, their combined presence can magnify their effects and lead to explosive growth.
A host of factors can explain why certain platforms succeed. Some forego profit for years to drive customer loyalty, scale and innovation. Others piggyback on a larger, established platform to build scale. Still others leverage assets from one platform business to another.
Online platforms serve interdependent users via the InternetThe term “online platform” has been used to describe a range of services available on the Internet. These include marketplaces, search engines, social media, creative content outlets, app stores, communications services, payment systems, services comprising the “collaborative” or “gig” economy and much more.
They have some important things in common, including the use of ICTs to help users interact; the collection and use of data about those interactions; and network effects. They also drive innovation and play a vital role in digital economies and societies.
But what are they? OECD (2019[23]) offers a definition: an online platform is a digital service that facilitates interactions between two or more distinct but interdependent sets of users (whether firms or individuals) who interact through the service via the Internet.
This definition can accommodate government, non-profit and other non-commercial online platforms, as well as commercial ones (such as the third-party B2C and C2C e-commerce platforms discussed earlier), provided the word “user” is reasonably flexible. For example, some governments – as trusted
248 OECD DIGITAL ECONOMY OUTLOOK 2020 © OECD 2020
10. EVOLVING BUSINESS MODELS 10. EVOLVING BUSINESS MODELS
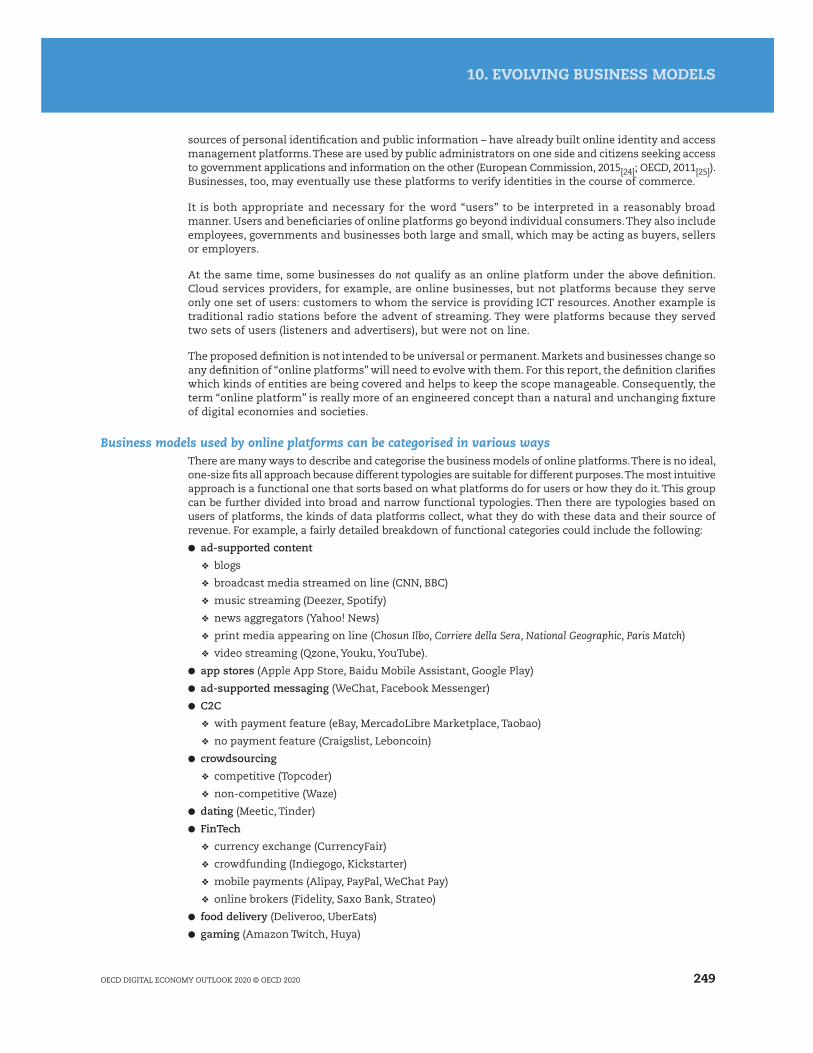
sources of personal identification and public information – have already built online identity and access management platforms. These are used by public administrators on one side and citizens seeking access to government applications and information on the other (European Commission, 2015[24]; OECD, 2011[25]). Businesses, too, may eventually use these platforms to verify identities in the course of commerce.
It is both appropriate and necessary for the word “users” to be interpreted in a reasonably broad manner. Users and beneficiaries of online platforms go beyond individual consumers. They also include employees, governments and businesses both large and small, which may be acting as buyers, sellers or employers.
At the same time, some businesses do not qualify as an online platform under the above definition. Cloud services providers, for example, are online businesses, but not platforms because they serve only one set of users: customers to whom the service is providing ICT resources. Another example is traditional radio stations before the advent of streaming. They were platforms because they served two sets of users (listeners and advertisers), but were not on line.
The proposed definition is not intended to be universal or permanent. Markets and businesses change so any definition of “online platforms” will need to evolve with them. For this report, the definition clarifies which kinds of entities are being covered and helps to keep the scope manageable. Consequently, the term “online platform” is really more of an engineered concept than a natural and unchanging fixture of digital economies and societies.
Business models used by online platforms can be categorised in various ways There are many ways to describe and categorise the business models of online platforms. There is no ideal, one-size fits all approach because different typologies are suitable for different purposes. The most intuitive approach is a functional one that sorts based on what platforms do for users or how they do it. This group can be further divided into broad and narrow functional typologies. Then there are typologies based on users of platforms, the kinds of data platforms collect, what they do with these data and their source of revenue. For example, a fairly detailed breakdown of functional categories could include the following:
● ad-supported content
❖ blogs
❖ broadcast media streamed on line (CNN, BBC)
❖ music streaming (Deezer, Spotify)
❖ news aggregators (Yahoo! News)
❖ print media appearing on line (Chosun Ilbo, Corriere della Sera, National Geographic, Paris Match)
❖ video streaming (Qzone, Youku, YouTube).
● app stores (Apple App Store, Baidu Mobile Assistant, Google Play)
● ad-supported messaging (WeChat, Facebook Messenger)
● C2C
❖ with payment feature (eBay, MercadoLibre Marketplace, Taobao)
❖ no payment feature (Craigslist, Leboncoin)
● crowdsourcing
❖ competitive (Topcoder)
❖ non-competitive (Waze)
● dating (Meetic, Tinder)
● FinTech
❖ currency exchange (CurrencyFair)
❖ crowdfunding (Indiegogo, Kickstarter)
❖ mobile payments (Alipay, PayPal, WeChat Pay)
❖ online brokers (Fidelity, Saxo Bank, Strateo)
● food delivery (Deliveroo, UberEats)
● gaming (Amazon Twitch, Huya)
249OECD DIGITAL ECONOMY OUTLOOK 2020 © OECD 2020
10. EVOLVING BUSINESS MODELS 10. EVOLVING BUSINESS MODELS

● job platforms
❖ full-time, traditional jobs (Careerbuilder, LinkedIn, Monster)
❖ freelancing/crowdsourcing (Freelancer, Mechanical Turk, TaskRabbit)
● maps (Baidu Maps, Bing Maps, Google Maps)
● online literature (Amazon Self-Publishing, Qidian)
● repositories for scholarly research (SSRN)
● search advertising
❖ general, or “horizontal”, search (Baidu, Google, Yahoo!)
❖ price comparison sites (PriceGrabber, PriceMinister, ShopZilla)
❖ other specialised, or “vertical”, search (Amazon for products, LexisNexis for lawyers, PogoFrog for physicians)
● short-term accommodation (Airbnb, HomeAway)
● social media
❖ general social media (Baidu Post Bar, Facebook, WeChat)
❖ microblogging (Sina Weibo, Twitter)
❖ professional networking (LinkedIn)
❖ photo sharing (Flickr, Instagram)
❖ video-sharing sites (iQIYI, TikTok, Youku, YouTube)
❖ special-interest sites (such as Ping for music, Kidzworld for children and Ravelry for knitting)
● superplatforms, or “platforms of platforms” (WeChat, QQ)
● third-party B2Bs (Alibaba, Amazon Business)
● third-party B2Cs
❖ tangible goods (Amazon Marketplace, eBay, Tmall)
❖ services (Jianke)
● transportation
❖ long-distance carpooling (BlaBlaCar)
❖ on-demand ride service (Lyft, Uber)
● travel booking
❖ cruises (Vacationstogo.com)
❖ rental cars, flights and hotels (Booking.com, Ctrip, Expedia, Opodo)
❖ short-term home rentals (Airbnb, Atraveo, Homeaway).
Many more functional categories could be added, depending on how narrow and comprehensive one wishes the descriptions to be.
Another basis for describing and categorising online platform business models is the source(s) of their revenue. Leading possibilities include the following:
● Advertisers who pay fees to the platform for placing (“serving”) text, display or banner advertisements on web pages, or when users click on an ad, or for higher positions in keyword search rankings.
● Sellers who pay transaction fees (commissions charged when a transaction is completed on the platform, e.g. transaction fees paid by B2C sellers, commissions paid by developers who sell apps on an app store and transaction fees paid by sellers or service providers who accept mobile online payments); and sellers who pay subscription fees (B2C platforms may charge some of their third-party sellers a monthly or annual membership fee). It also includes listing fees and/or additional service fees for complementary services connected to the platform. These could include customs clearance and value-added tax refund services for third-party sellers, interest-bearing loans to SMEs with a solid track record of sales on a platform and fulfilment services).
● Buyers who pay transaction fees and/or additional service fees for complementary services connected to the platform (such as interest-bearing loans to individuals who have a solid track record of paying for goods on a marketplace platform).
250 OECD DIGITAL ECONOMY OUTLOOK 2020 © OECD 2020
10. EVOLVING BUSINESS MODELS 10. EVOLVING BUSINESS MODELS
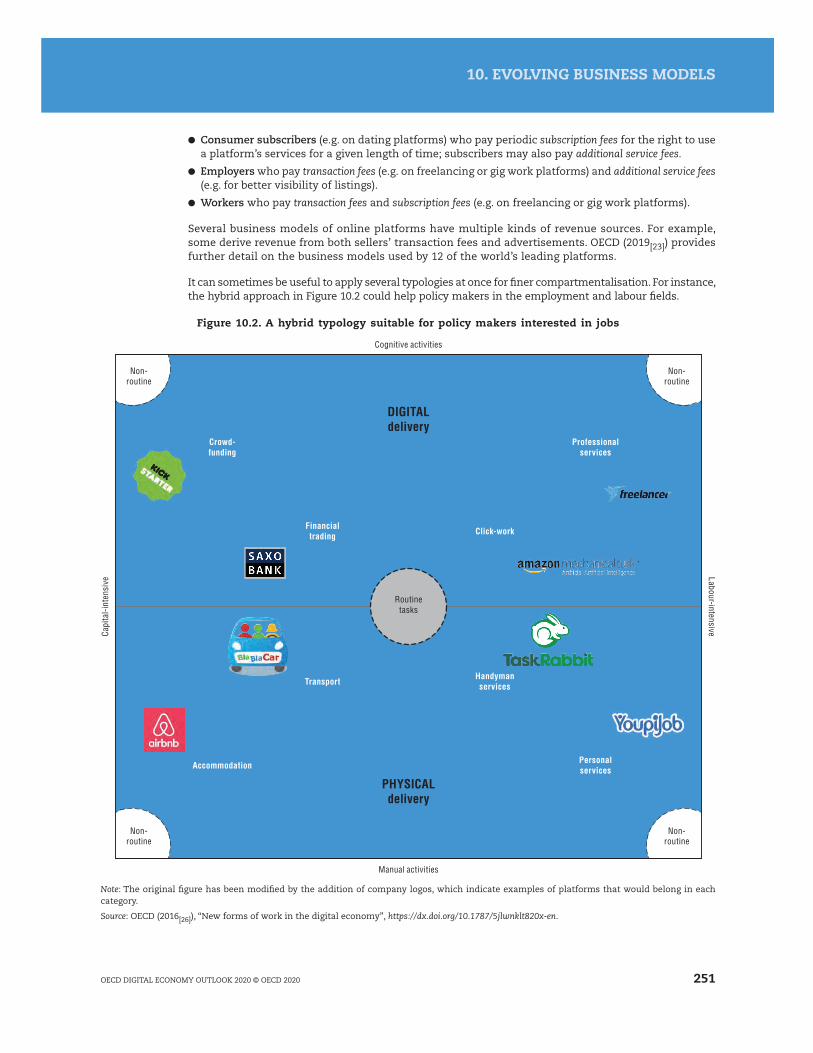
● Consumer subscribers (e.g. on dating platforms) who pay periodic subscription fees for the right to use a platform’s services for a given length of time; subscribers may also pay additional service fees.
● Employers who pay transaction fees (e.g. on freelancing or gig work platforms) and additional service fees (e.g. for better visibility of listings).
● Workers who pay transaction fees and subscription fees (e.g. on freelancing or gig work platforms).
Several business models of online platforms have multiple kinds of revenue sources. For example, some derive revenue from both sellers’ transaction fees and advertisements. OECD (2019[23]) provides further detail on the business models used by 12 of the world’s leading platforms.
It can sometimes be useful to apply several typologies at once for finer compartmentalisation. For instance, the hybrid approach in Figure 10.2 could help policy makers in the employment and labour fields.
Figure 10.2. A hybrid typology suitable for policy makers interested in jobs
Cognitive activities
Manual activities
PHYSICALdelivery
Non-routine
Non-routine
Non-routine
Non-routine
DIGITALdelivery
Crowd-funding
Professionalservices
Financialtrading
Transport
Accommodation Personalservices
Handymanservices
Click-work
Capi
tal-i
nten
sive
Labour-intensive
Routinetasks
Note: The original figure has been modified by the addition of company logos, which indicate examples of platforms that would belong in each category.
Source: OECD (2016[26]), “New forms of work in the digital economy”, https://dx.doi.org/10.1787/5jlwnklt820x-en.
251OECD DIGITAL ECONOMY OUTLOOK 2020 © OECD 2020
10. EVOLVING BUSINESS MODELS

This hybrid approach simultaneously uses six criteria to categorise platforms: functionality (the descriptors in the blue circles), the medium of work delivery (physical versus digital); and whether the work is routine, manual or cognitive, and labour- or capital-intensive. The sixth criterion – more subtle because not overtly identified – is a broader version of functionality. It is responsible for the limitation of the universe of online platforms to just the types represented by the blue circles: platforms that facilitate the delivery of a (usually paid) service.
The use of so many sorting mechanisms enables a tight compartmentalisation of online platforms. In so doing, it gives policy makers a more accurate and detailed view of the platforms’ traits, similarities and differences. This demonstrates that even broad typological approaches can be effective at classifying platforms when used with other approaches.
Online platforms share certain economic characteristics Positive direct network effects. For certain kinds of online platforms, the utility for users on one side depends on the number of other users on that same side. This is called a direct network effect. The effect is both positive and direct when utility increases as the user base on the same side of the platform grows. Examples of online platforms with positive direct network effects include social media and instant messaging (IM) platforms. Both applications are useless to the consumer if he or she is the only person using them, but their value increases as the number of other users grows. Positive direct network effects can lead to rapid and formidable growth, as they create a kind of virtuous circle: the more users on one side, the more valuable the service becomes, which attracts even more users to that side, etc. Incidentally, not all platforms have positive direct network effects. Some (e.g. dating platforms) even have negative direct network effects (utility on one side decreases as the user base on the same side increases).
Positive indirect network effects. In contrast, all platforms have positive indirect network effects. When indirect network effects exist, the entity or market in question must be two-sided or multi-sided. Positive indirect network effects occur when a group of users (say, third-party sellers on a B2C platform) benefits more as the number of people in another group of users (buyers who use the same platform) increases, and possibly vice versa. Thus, if a platform provides better service to one side of its market, it increases the demand for its service on the other side(s). When indirect network effects operate in both directions of a two-sided market, another type of growth-driving virtuous circle arises. As more users join one side, the platform becomes more attractive to users on the other side(s). This, in turn, leads more users to join that side, thereby increasing the appeal of the first side, etc. Where positive indirect network effects exist, platforms provide a valuable service. They solve a co-ordination problem between two or more sides that stand to benefit if they can be united and helped to interact. That, in turn, can be a lucrative business for the platforms.
Cross-subsidisation. Online platforms commonly try to reach at least a viable size by capitalising on the multi-sided nature of their markets. Specifically, to increase the user base on one side of their business, many platforms subsidise it. At first, they might take on debt as a strategy. However, if the business grows enough, they will rely on revenues from the other side. In many cases, this subsidy is absolute in a pecuniary sense. In other words, subsidised users do not pay any monetary price to use the platform. Among the types of platforms that employ this strategy are, for example, most or all of the leading search engines, social media platforms and IM platforms. Advertising revenues make it possible to offer free services to users on the other side of the platform’s business.
Scale without mass. This term reflects the possibility to grow extensively, and to do so quickly and inexpensively compared to scaling up in physical goods markets, due to the extremely low and still dwindling unit costs for processing, storing, replicating and transmitting data (OECD, 2019[27]). That cost structure means that once online platforms absorb fixed costs for things like computer hardware and initial software development, they can serve many additional users while incurring extremely low or negligible marginal costs. That enables the platforms to grow – even to the point where they are serving hundreds of millions or possibly billions of people – without increasing investments in tangible assets or taking on new employees at anywhere near the same growth rate.
Potentially global reach. This is possible thanks to the end-to-end interoperable design of the Internet. To the extent that technical Internet openness is respected, online platforms can attract customers all over the world.
252 OECD DIGITAL ECONOMY OUTLOOK 2020 © OECD 2020
10. EVOLVING BUSINESS MODELS 10. EVOLVING BUSINESS MODELS

Panoramic scope. Some platform companies benefit from economies of scope because of complementarities between two or more of their services on a given platform or across platforms. In some cases, development costs and/or data can be shared across business lines. Applications can be given a common look and feel so that users gain familiarity with “sister” platforms more quickly. That can help a company’s newer platforms to gain users faster, giving them a potential competitive advantage over new “solo” platform companies. Offering more services may also keep users connected to a particular company’s offerings. That, in turn, means the company can collect more user data. These may be used to further refine the platforms’ services or to enable the company to enter another market more easily and effectively.
Generation and use of user data. Online platforms are by no means the only types of businesses that generate and capitalise on user data. However, they may be distinguished by the richness of their user data, the sheer amount at their disposal and the sophisticated ways in which they use that data. Various platforms create and rely on user data, and share them, to different degrees. Some use them only to improve their own service. Others make insights gleaned from the data, or even the data themselves, available to others.
Switching costs. Some, but not all, online platforms require or encourage investments by users that, once made, are not easily transferable to other platforms. In the context of social media, for example, such investments may include setting up and personalising an account profile, uploading content (including photos, videos, posts or product information and offers) and establishing a community of friends, followers or customers. More broadly, these investments may include simply becoming familiar with a platform’s look and feel, and developing trust or confidence in it. When such investments are not easily transferable and are substantial enough, they could discourage users from switching to another platform. This is true even if prices rise, quality declines or the service provides less privacy (OECD, 2012[28]). Furthermore, when their data is tied not only to a particular platform, but to a whole ecosystem of which the platform is just one part, users may be even less willing to switch.
Winner-take-all or winner-take-most. Some markets in which online platforms operate exhibit winner-take-all or winner-take-most tendencies (Iansiti and Lakhani, 2017[29]; Frank and Cook, 1996[30]). This is primarily due to the confluence of positive network effects and economies of scale and scope. Successful platforms in such markets can experience hyper growth that is all but impossible for even innovative companies to achieve in physical product markets. Facebook, for example, reached 100 million users just 4.5 years after its launch. In comparison, it took 16 years for mobile phones to gain 100 million users, while wired telephones needed 75 years to reach that mark (Dreischmeier, Close and Trichet, 2015[31]). However, not all markets in which online platforms operate have winner-take-all or winner-take-most characteristics. Network effects need to be strong; switching costs must be high; and users must find it difficult or undesirable to multi-home (which means they tend not to use multiple, rival platforms simultaneously).
The world’s leading online platforms succeeded for different reasons ● Business acumen. All of the leading platform companies are successful because they are well managed, although this acumen may manifest in different ways. Some can anticipate market trends or drive them in the first place. Others have a knack for continually raising efficiency and customer loyalty, hiring talented personnel, building trust, making smart acquisitions or increasing convenience for their users.
● Foregoing profit for many years in favour of building customer loyalty, scale and funding innovation. Some platforms use their income to improve their services and grow their customer base for more than a decade before ever taking any of it in the form of profit. Such investments can pay off over the long term.
● High-quality design and photography as a competitive advantage. Some platforms have succeeded in distinguishing themselves with aesthetically advanced web designs that attract and retain users.
● Intense focus on customer service. Zealously and continuously improving customer service has been a key element of success for some of the world’s major platforms.
● Low-overhead business model, or “scale without mass”. This is a common success factor among the major online platforms. In principle, virtually every online platform has the potential to capitalise on scale without mass, but the leading firms excel at it.
253OECD DIGITAL ECONOMY OUTLOOK 2020 © OECD 2020
10. EVOLVING BUSINESS MODELS 10. EVOLVING BUSINESS MODELS

● Piggybacking on a larger, established platform to build scale. Several of the major online platforms received an important, early boost to their user bases by riding on top of an existing platform. In some cases, that existing platform was owned by the same company as the new platforms; in others, it was owned by a different firm.
● Leveraging assets from one platform market to succeed in others. Some online platform companies have built new businesses by taking the assets (not only physical infrastructure, but also users, data, software, know-how) developed in one market where they are operating at scale and using them in new ways to enter another market.
● Protectionism. Some Chinese platforms scaled up to hundreds of millions of domestic users without serious competition from large foreign platforms because the key players were blocked in the People’s Republic of China (hereafter “China”).
OECD (2019[23]) provides examples of all the factors just mentioned.
Digital business models and work
Digital transformation has contributed to an increase in non-standard forms of workIn recent years, new business models enabled by digitalisation have contributed to an increase in non-standard forms of work. This is an umbrella definition that includes several contractual arrangements such as temporary jobs, part-time contracts and self-employment. As their common feature, such non-standard jobs differ from the “standard” of full-time, open-ended contracts with a single employer. Although some of these forms are not new, digitalisation, together with globalisation and changes in regulations and policies, have contributed to their diffusion. Digital technologies have also enabled new forms of work, such as jobs mediated by online platforms. Although recent trends have not been uniform, non-standard work encompasses over a third of the labour force in a majority of OECD countries (OECD, 2019[32]).
Temporary and part-time employment are on the rise in many countriesBetween 1986 and 2018, temporary employment increased in around half of OECD countries, with some showing a marked upward trend (Figure 10.3). Part-time employment has risen in most of the OECD, with some exceptions such as Iceland, Poland and Sweden. The share of involuntary part-time in total part-time employment has increased in two-thirds of them, although it has declined in some others (OECD, 2019[32]).
Working part-time is an arrangement that concerns more women than men. One in four employed women works part-time. The share of men working part-time – although increasing – is still relatively low, at 9% (up from 5% in 1986). Two-thirds of involuntarily part-time workers are women.
In about half of OECD countries, “short part-time” work (i.e. individuals working no more than 20 hours per week) has also grown (Figure 10.4). Part of this increase may reflect workers’ preference for greater flexibility; part of it has also been driven by the rise in atypical contracts, e.g. on-call and zero-hour work contracts. In 2016, on-call work affected about 8% of the workforce in the Netherlands, whereas 3% of British workers were on a zero-hour contract in the same year (OECD, 2019[32]).
The growth of self-employed workers has not been uniform across the OECD Self-employment has had a stable incidence over total employment since 2000 in most OECD countries. The COVID-19 pandemic may affect this trend, as laid-off workers turn to self-employment to ensure an income. In most EU countries, there has been a sectoral shift. Self-employment in agriculture has declined, while it has increased in construction and knowledge-intensive services (European Commission, 2020[33]). Countries like the Netherlands, the Czech Republic, the Slovak Republic and the United Kingdom have also seen substantial increases in the share of own-account workers (i.e. self-employed without employees) in total employment in recent decades. Conversely, the overall share for the OECD is not uniform (OECD, 2018[34]). Self-employment may signal a shifting preference towards entrepreneurship. However, in the four countries noted above, policies (and, in particular, tax incentives for self-employment) have tended to play an important role in the rise of self-employment.
254 OECD DIGITAL ECONOMY OUTLOOK 2020 © OECD 2020
10. EVOLVING BUSINESS MODELS 10. EVOLVING BUSINESS MODELS
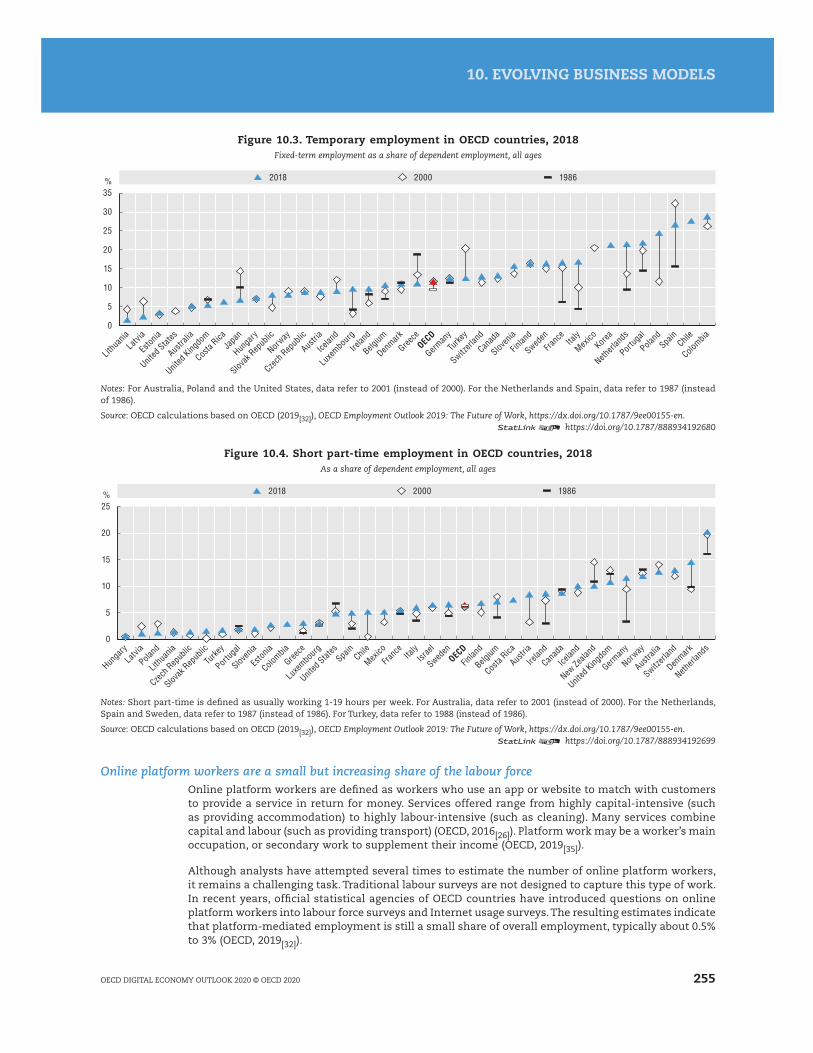
Figure 10.3. Temporary employment in OECD countries, 2018Fixed-term employment as a share of dependent employment, all ages
%
0
5
15
10
25
20
35
30
20002018 1986
Lithua
niaLatv
ia
Eston
ia
United
States
Australi
a
United
Kingdo
m
Costa Rica
Japan
Hunga
ry
Slovak
Repub
lic
Norway
Czech R
epub
lic
Austria
Icelan
d
Luxem
bourg
Irelan
d
Belgium
Denmark
Greece
OECD
German
yTu
rkey
Switzerl
and
Canad
a
Sloven
ia
Finlan
d
Sweden
France Ita
ly
Mexico
Korea
Netherl
ands
Portug
al
Poland
Spain
Chile
Colombia
Notes: For Australia, Poland and the United States, data refer to 2001 (instead of 2000). For the Netherlands and Spain, data refer to 1987 (instead of 1986).
Source: OECD calculations based on OECD (2019[32]), OECD Employment Outlook 2019: The Future of Work, https://dx.doi.org/10.1787/9ee00155-en.12 https://doi.org/10.1787/888934192680
Figure 10.4. Short part-time employment in OECD countries, 2018As a share of dependent employment, all ages
%
0
5
15
10
20
25
20002018 1986
Hunga
ryLatv
ia
Poland
Lithua
nia
Czech R
epub
lic
Slovak
Repub
licTu
rkey
Portug
al
Sloven
ia
Eston
ia
Colombia
Greece
Luxem
bourg
United
States
Spain
Chile
Mexico
France Ita
lyIsr
ael
Sweden
OECD
Finlan
d
Belgium
Costa Rica
Austria
Irelan
d
Canad
a
Icelan
d
New Ze
aland
United
Kingdo
m
German
y
Norway
Australi
a
Switzerl
and
Denmark
Netherl
ands
Notes: Short part-time is defined as usually working 1-19 hours per week. For Australia, data refer to 2001 (instead of 2000). For the Netherlands, Spain and Sweden, data refer to 1987 (instead of 1986). For Turkey, data refer to 1988 (instead of 1986).
Source: OECD calculations based on OECD (2019[32]), OECD Employment Outlook 2019: The Future of Work, https://dx.doi.org/10.1787/9ee00155-en.12 https://doi.org/10.1787/888934192699
Online platform workers are a small but increasing share of the labour force Online platform workers are defined as workers who use an app or website to match with customers to provide a service in return for money. Services offered range from highly capital-intensive (such as providing accommodation) to highly labour-intensive (such as cleaning). Many services combine capital and labour (such as providing transport) (OECD, 2016[26]). Platform work may be a worker’s main occupation, or secondary work to supplement their income (OECD, 2019[35]).
Although analysts have attempted several times to estimate the number of online platform workers, it remains a challenging task. Traditional labour surveys are not designed to capture this type of work. In recent years, official statistical agencies of OECD countries have introduced questions on online platform workers into labour force surveys and Internet usage surveys. The resulting estimates indicate that platform-mediated employment is still a small share of overall employment, typically about 0.5% to 3% (OECD, 2019[32]).
255OECD DIGITAL ECONOMY OUTLOOK 2020 © OECD 2020
10. EVOLVING BUSINESS MODELS 10. EVOLVING BUSINESS MODELS

Using tax data, researchers estimated the share of gig workers among Canadian workers at about 1.7 million (8.2%) in 2016, up from 1 million (5.5%) in 2005 (Jeon, Liu and Ostrovsky, 2019[36]). This figure includes unincorporated self-employed freelancers, day labourers, and on-demand or platform workers. The study observed an increase in gig workers in 2012-13. It noted the increase coincided with the proliferation of online platforms in Canada that started at that time.
The Online Labour Index produced by the Oxford Internet Institute provides an indication of trends in platform work (Kässi and Lehdonvirta, 2016[57]). The index tracks projects and posts for freelance online workers in real time from five of the world’s largest English-language online labour platforms. This only represents a subset of platform work. Specifically, it shows work carried out entirely on line but not work obtained on line and carried out locally (like ridesharing and delivery). Nonetheless, it can indicate the general trend in platform work.
Data over recent years showed a stabilising trend for platform work between May 2016 and the end of 2019, followed by an upward trend in 2020 compared with the previous year. In the aftermath of the COVID-19 pandemic, the demand for online platform workers dropped dramatically. However, this trend seems to have reversed. Based on postings, the demand for platform workers was 30% higher over the previous year. This increase was driven mainly by “software development & technology” jobs, as documented in the iLabourProject (Figure 10.5).
Figure 10.5. New vacancies listed on the top five English-language online working platforms, 2016-20Index time series (May 2016 = 100; monthly average)
Index
100
110
120
130
140
150
160
170
May 20
16
July
2016
Sept 2
016
Nov 20
16
Jan 2
017
Mar 20
17
May 20
17
July
2017
Sept 2
017
Nov 20
17
Jan 2
018
Mar 20
18
May 20
18
July
2018
Sept 2
018
Nov 20
18
Jan 2
019
Mar 20
19
May 20
19
July
2019
Sept 2
019
Nov 20
19
Jan 2
020
Mar 20
20
May 20
20
Source: OECD based on Online Labour Index (database), http://ilabour.oii.ox.ac.uk/online-labour-index/ (accessed on 5 May 2020).12 https://doi.org/10.1787/888934192718
Non-standard jobs may result in lower quality jobsNon-standard work may offer advantages such as greater flexibility and autonomy, a better work-life balance and opportunities for additional sources of income. However, some factors may limit workers’ flexibility and autonomy. Some workers will be “falsely self-employed”. In other words, their income depends on a single employer; they cannot set their remuneration or choose their working time. In principle, platform workers can choose their own hours. However, in practice, demand may be highly concentrated in certain parts of the day. Furthermore, the platform sets the pay rate for many of these workers. They may also face other restrictions, including the use of uniforms and stringent instructions on how to do their job.
Increased job instability that often characterises new, non-standard forms of employment may result in reduced well-being for workers in the absence of policies that guarantee adequate rights and protections. This is all the more relevant in the context of the emerging impact of the COVID-19 pandemic, which severely affected many non-standard workers. They may represent up to 40% of total employment in sectors most affected by containment measures across European OECD countries (OECD, 2020[37]). Furthermore, non-standard workers in many countries have limited access to paid sick leave. They may also lack access to income support during quarantine periods or job loss (OECD, 2020[38]). Careful policy action can help overcome the risks associated with non-standard work. Recent OECD research offers policy directions to address the potential drawbacks of a changing labour market (OECD, 2019[32]).
256 OECD DIGITAL ECONOMY OUTLOOK 2020 © OECD 2020
10. EVOLVING BUSINESS MODELS 10. EVOLVING BUSINESS MODELS

Employment status is a gateway to worker rights and protections, but some workers fall in a “grey zone”Ensuring correct classification, thus also tackling misclassification, is essential to guaranteeing that workers have access to labour and social protection, collective bargaining and lifelong learning. In recent years, countries have adopted several measures to strengthen compliance with regulations (OECD, 2019[32]). However, ambiguity persists regarding workers who appear to fall somewhere in the grey zone between dependent and self-employment. This is particularly true for workers in the platform economy. They are typically classified as own-account workers, but share to varying degrees characteristics of employees, depending on the work performed through the platform. In many instances, employer-worker relationships are difficult to classify. They may require a revision of the legislation and, in particular, of what it means to be “an employee”, “self-employed” and/or “an employer”.
Several OECD countries consider classification of platform workers as a policy priority. They are actively addressing the issue through analysis and adaptation of their legislation or through other actions (OECD, 2019[39]). In Portugal, for instance, the “Uber law” adopted in 2018 establishes that platforms operating in the passenger transport sector are employers, not just intermediaries. In the United States, several state laws provide that workers are self-employed, rather than employees, of platforms, if several conditions are met (OECD, 2019[39]). The state of California, on the other hand, adopted a bill that qualifies platform workers as employees. In countries such as Australia, Canada, Spain and the United Kingdom, numerous platform workers have challenged their employment status by taking their work platform to court, particularly in the delivery and passenger transport sector (OECD, 2019[39]).
Some countries, using various approaches, have identified subgroups of non-standard workers. They have awarded these subgroups the rights and protections hitherto granted only to employees. For instance, some have targeted the financially dependent self-employed, while others have created a “third category” of workers (with the risk of increasing ambiguity). Even where individuals are correctly classified and genuinely self-employed, there may be a case for government intervention to improve their labour market outcomes. For example, these workers may be in a position where there is only one buyer (OECD, 2019[32]). Governments should consider policy avenues to give non-standard workers greater adequate employment protection, access to collective representation, better training opportunities and stronger social security.
Policy responses
Strengthen the rights and benefits of non-standard workersSeveral countries, including the United Kingdom, the Netherlands and Poland, have considered introducing minimum rates for some groups of self-employed workers (OECD, 2019[32]). In other cases, governments or the platforms themselves have set minimum wages for platform workers. Since January 2018, for example, New York City has imposed a minimum wage for Uber and Lyft drivers. The platforms Favor, a delivery platform in the United States, as well as Upwork and Prolific in the United Kingdom, have established minimum wages. Meanwhile, the Czech Topdesigner.cz and the Spanish adtriboo.com, have set a minimum or a fixed price for certain tasks. These rates are based on the average number of hours that workers spend on them (OECD, 2019[32]).
As an alternative (or complement) to setting minimum wages, countries including Canada and Sweden have extended collective bargaining rights to certain groups of self-employed workers. In France, the El Khomri law adopted in 2016 allowed platform workers to form and join a trade union organisation, and to assert their collective interests through it. Collective bargaining can help shape the future of work, supporting and complementing public policy. The role of social partners and their ability to work co-operatively is crucial in this regard. Trade unions are expanding their membership to workers in non-standard forms of employment and developing new strategies to negotiate with employers. In Sweden and Denmark, such actions have led to the signature of collective agreements between platforms and trade unions. In Germany, they have spurred the creation of a work council, which will be able to negotiate a collective agreement on working conditions for Foodora couriers. Following an agreement with trade unions in 2018, employee representatives joined the supervisory board of European Company (Societas Europaea, SE) Delivery Hero, a publicly listed online food-delivery service active in several European countries. In addition to worker-led initiatives, some platforms have also begun to address platform workers’ limited access to representation and social dialogue, mostly in response to government threats to reclassify their activities (OECD, 2019[32]).
257OECD DIGITAL ECONOMY OUTLOOK 2020 © OECD 2020
10. EVOLVING BUSINESS MODELS 10. EVOLVING BUSINESS MODELS
Typically, regulations aim to limit excessive working hours by establishing, for instance, compulsory resting times and paid annual leave. Extending such requirements to non-standard forms of work may affect the ability of workers to choose their working hours and time flexibly and autonomously. Government action has therefore rather focused on regulating atypical contracts, such as those with “zero-hours”.
Such reforms aim to reduce unpredictability in working hours, and its impact on overall earnings and the worker’s ability to plan ahead. Finland, for example, restricts this type of contract to situations where employers truly have a variable need for labour. Along with Ireland and Norway, Finland also requires employers to provide information (such as the minimum number of hours) up-front or in the employment contract. These three countries, along with the Netherlands and the state of Oregon in the United States, require advance notice of work schedules. Australia and the United Kingdom give employees the right to request a more predictable contract after a certain period of time (OECD, 2019[32]).
Self-employed workers generally take responsibility for ensuring their own safety and health. New forms of work, such as online platform work, also bring new or increased risks. These are due to their tasks (e.g. transport), as well as the high levels of competition they face. Countries have taken steps to extend occupational and safety health protection to non-employees. Some, for example, have decoupled such protections from the employment relationship (Australia, Ireland, Lithuania, Malta, Turkey and the United Kingdom). Some countries have also connected related regulation to the workplace rather than to any specific contract type (Australia, Bulgaria, Canada and Poland). Korea plans to extend the Occupational Safety and Health Act to “all working people”. It also requires employers to take specific health and safety measures for non-regular workers, including dependent contractors and delivery workers. In France, the El Khomri law foresees that the platform must reimburse workers if they voluntarily insure themselves against the risk of occupational accident or illness.
Reform social protection as to ensure better coverageSelf-employed workers in many countries do not have access to the same social protection benefits as employees, such as those concerning unemployment, incapacity or old age. In recent years, governments have responded with different policy approaches. These range from extending social protection rights to certain groups of workers in the “grey zone” to broader reforms of social protection systems targeting self-employed workers at large (OECD, 2019[39]).
Denmark and France have introduced significant reforms to their social protection system. These aim to establish portability of entitlements for individuals moving between (or even combining) employee status and self-employment. In 2018, Denmark introduced a new unemployment benefit system that treats all income sources equivalently. The system has three aims. First, it seeks to increase access to unemployment insurance for self-employed, non-standard workers and on-demand employees. Second, it aims to make it easier to combine self-employment and employment income. Finally, it wants to make it simpler for self-employed individuals to prove discontinuation of operations. In France, social protection reform brings coverage of the self-employed under the general social protection scheme. This limits the administrative changes required if a person moves between employment and self-employment. Among its goals, the reform aims to ensure continued social security coverage throughout people’s careers.
The European Union adopted a Council Recommendation on Access to Social Protection for Workers and the Self-Employed in November 2019 (European Commission, 2019[58]). It aims to encourage EU member states to adopt policy in four areas. First, they could allow non-standard workers and the self-employed to adhere to social security schemes (closing formal coverage gaps). Second, they could allow these workers to build up and take up adequate social benefits as members of a scheme (adequate effective coverage) and help them transfer social security benefits between schemes. Third, they could increase adequacy of social security systems and rights. Fourth, they could increase transparency of social security systems and rights.
Extend training rights beyond standard employeesWith the rise of non-standard work, many workers face more fragmented careers, and may thus change jobs and employment types several times. These changes often demand reskilling and upskilling opportunities, which typically are not available or accessible for non-standard workers. As employers
258 OECD DIGITAL ECONOMY OUTLOOK 2020 © OECD 2020
10. EVOLVING BUSINESS MODELS 10. EVOLVING BUSINESS MODELS

typically provide training, these workers, and particularly own-account workers (thus including platform workers), are often excluded. This results in lower participation in training (Figure 10.6). As they lack representation in trade unions, they are also not entitled to training rights negotiated through collective bargaining.
The other main barriers to training are lack of time and of financial resources. These issues may be common to other work categories, but are worse for non-standard workers, who have to invest time in looking for jobs. Platform workers may be at a greater disadvantage in this regard. For example, they may be working to tight deadlines or on low piece-rates for micro-tasks, which may leave them little time for training. This is particularly true for platform workers on low incomes. In addition, many online platform workers have little scope for career development where they work. This may discourage both platforms and workers themselves to invest in training.
Figure 10.6. Participation in job-related training by group, OECD average, 2012 or 2015Adults (aged 16-65) in each group that participate in training
%
0
10
20
30
40
50
60
70
80
Low-skilled Older (55-64)
High automation Own-accountself-employed
Temporary
Part-time
Displaced
High-skilled
Young (25-34)
Low automationFull-time permanent Full-time permanent Full-time permanent
Unemployed
Breakdown 1 Breakdown 2 Breakdown 3 Breakdown 4 Breakdown 5 Breakdown 6 Breakdown 7
OECD average
Notes: Share of adults who participated in formal or non-formal job-related training over the previous 12 months. Data refer to 2012 for most countries, except for Chile, Greece, Israel, Lithuania, New Zealand, Slovenia and Turkey where they refer to 2015. Low (high) skilled refers to adults who score at level 1 or below (levels 4 or 5) on the Survey for Adults (PIAAC) literacy scale. High (low) automation refers to adults at high (low) risk of automation. Own-account workers are the self-employed without employees. Temporary refers to workers on fixed-term or temporary work-agency contracts. Part-time refers to adults who work fewer than 30 hours per week. Full-time permanent are adults in full-time jobs with an indefinite work contract. Unemployed refers to all unemployed who have not been dismissed for economic reasons in their last job; displaced refers to unemployed adults who have been dismissed for economic reasons in the last job. The OECD average (41%) refers to the unweighted average participation in job-related training among all adults among OECD countries participating in PIAAC.
Source: OECD (2019[32]), OECD Employment Outlook 2019: The Future of Work, https://dx.doi.org/10.1787/9ee00155-en.12 https://doi.org/10.1787/888934192737
Some OECD countries have extended available financial incentives, such as tax deductions and subsidies, to support training for the self-employed, including own-account workers. Since January 2018, France has extended entitlements to the Individual Learning Account (ILA) to self-employed workers. In Ireland, the Springboard+ programme offers free courses leading to qualification. In 2017, the programme was extended to the self-employed who want to upskill in biopharma/med tech, and ICT sectors. As other examples of supporting the cost of training, Korea, Austria and Belgium make certain subsidies dependent on the payment of social security contributions, or conditional on enrolment in an employment insurance plan. Lastly, countries like Austria, Finland and Luxembourg provide wage replacements schemes to self-employed enrolled in training.
Specific training obligations for platforms are limited. The El Khomri law in France requires platforms to pay employers’ contributions for training, cover expenses for the recognition of prior learning and provide a training indemnity for all gig workers above a certain revenue. In August 2018, France passed another relevant law: “For the freedom to choose one’s professional future” (Pour la liberté de choisir son avenir professionnel). It requires platforms to contribute financially to the ILA when workers earn at least half of the minimum wage per month.
Several countries acknowledge the need for systems of lifelong learning that could deal with increasingly non-linear career paths and support individuals as they move between jobs throughout their lives (OECD, 2019[39]). Individual learning schemes (ILS), for example, are attached to individuals rather than to a specific employer or employment status. Under ILS, individuals can undertake continuous training throughout their working lives and at their own initiative.
259OECD DIGITAL ECONOMY OUTLOOK 2020 © OECD 2020
10. EVOLVING BUSINESS MODELS 10. EVOLVING BUSINESS MODELS
The OECD distinguishes three types of ILS (OECD, 2019[40]). First, ILAs are virtual individual accounts that accumulate training rights over time. Second, individual savings accounts for training are real, physical accounts in which individuals accumulate resources over time for training. Third, training vouchers provide individuals with direct subsidies for training purposes, often with co-financing from the individual.
Of the three types, vouchers are the most popular. Individual savings accounts for training are rarely used, while the French Compte personnel de formation (CPF), established in 2015, is the only example of an ILA. The CPF allows any active person, from first entry into the labour market until retirement, to acquire training rights that can be mobilised throughout their professional life. Training rights are maintained across different forms of employment. They extend through periods of non-employment and are transferrable between employers. Participation in the CPF has increased continuously since its creation in 2015. However, it remains limited, at 2.1% of the labour force in 2018. This is mainly due to the complexity of the system, which a recent reform has tried to address.
Design is critical in ensuring effectiveness of ILAs (OECD, 2019[41]). The features of a well-designed ILA comprise simplicity; adequate and predictable funding; greater generosity for those most in need; provision of effective information, advice and guidance; a guarantee of access to quality training; and explicit account of the links with employer-provided training (OECD, 2019[41]).
Adapt activation policies to their needsSome OECD countries have also taken steps to ensure own-account workers can receive skills advice and guidance. This has mainly occurred by extending skills advice and guidance services provided by public employment services (PES). In Germany, the Federal Employment Agency enhanced the range of counselling services available for all adults (including the self-employed), going beyond the traditional focus given to the unemployed population. In Flanders (Belgium), both employees and self-employed workers can apply to the PES for career guidance vouchers. In Latvia, the PES provides career consultations free of charge not only to the unemployed, but also to the self-employed.
Digital transformation during COVID-19: Business models and work practicesThe COVID-19 crisis has taken a terrible human toll and the necessary containment measures have battered OECD economies and societies. Fortunately, digital technologies, business models and work practices are playing a crucial role in helping avoid a complete standstill. This is accelerating ongoing processes of technology proliferation and adoption across businesses, as well as the intensity and extent to which businesses use digital technologies to maintain operations.
The economic threats from the crisis need to be mitigated to avoid damaging business dynamism, and thereby employment and innovation, during the recovery.
COVID-19 as an accelerator of technology adoption by businessBroad and representative surveys of ICT usage in business will not deliver data covering the pandemic period until 2021. However, various evidence suggests that many firms (and other organisations) are taking up digital tools, or further deploying and making greater use of them. This is allowing them to operate during the pandemic.
If they can, businesses have rapidly altered their way of working to allow employees to telework. Estimates for various OECD countries suggest that a significant minority of jobs – between about one-quarter and one-third – can plausibly be performed from home (Dingel and Neiman, 2020[42]; Boeri, Caiumi and Paccagnella, 2020[43]). Others estimate that “around 30% of North American and Western European workers are in occupations that allow home-based work” (ILO, 2020[44]). These shares are markedly higher than other regions, including Latin America (23%), Eastern Asia (19%) and Eastern Europe (18%); the global estimate is 18%. Only 10% to 15%, or fewer, of workers in OECD countries were estimated to have been home-based in 2019 (ILO, 2020[44]). Consequently, COVID-related restrictions on movement are likely to have incited a significant additional portion of workers to telework if they could.
260 OECD DIGITAL ECONOMY OUTLOOK 2020 © OECD 2020
10. EVOLVING BUSINESS MODELS 10. EVOLVING BUSINESS MODELS
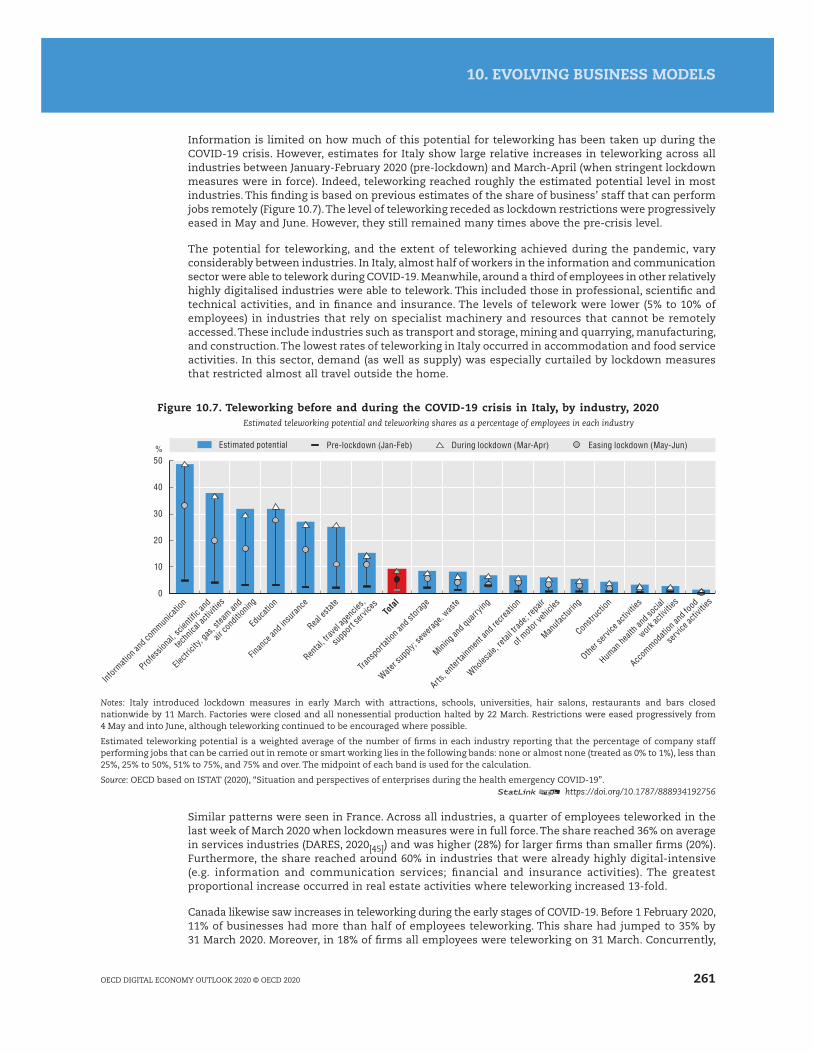
Information is limited on how much of this potential for teleworking has been taken up during the COVID-19 crisis. However, estimates for Italy show large relative increases in teleworking across all industries between January-February 2020 (pre-lockdown) and March-April (when stringent lockdown measures were in force). Indeed, teleworking reached roughly the estimated potential level in most industries. This finding is based on previous estimates of the share of business’ staff that can perform jobs remotely (Figure 10.7). The level of teleworking receded as lockdown restrictions were progressively eased in May and June. However, they still remained many times above the pre-crisis level.
The potential for teleworking, and the extent of teleworking achieved during the pandemic, vary considerably between industries. In Italy, almost half of workers in the information and communication sector were able to telework during COVID-19. Meanwhile, around a third of employees in other relatively highly digitalised industries were able to telework. This included those in professional, scientific and technical activities, and in finance and insurance. The levels of telework were lower (5% to 10% of employees) in industries that rely on specialist machinery and resources that cannot be remotely accessed. These include industries such as transport and storage, mining and quarrying, manufacturing, and construction. The lowest rates of teleworking in Italy occurred in accommodation and food service activities. In this sector, demand (as well as supply) was especially curtailed by lockdown measures that restricted almost all travel outside the home.
Figure 10.7. Teleworking before and during the COVID-19 crisis in Italy, by industry, 2020Estimated teleworking potential and teleworking shares as a percentage of employees in each industry
%
0
10
20
30
40
50
During lockdown (Mar-Apr) Easing lockdown (May-Jun)Pre-lockdown (Jan-Feb)Estimated potential
Informati
on an
d com
munica
tion
Profes
siona
l, scie
ntific
and
techn
ical a
ctivit
ies
Electr
icity,
gas,
steam
and
air co
nditio
ning
Educ
ation
Finan
ce an
d ins
uranc
e
Real e
state
Rental
, trav
el ag
encie
s,
supp
ort se
rvice
sTo
tal
Trans
porta
tion a
nd st
orage
Water s
upply
; sew
erage
, was
te
Mining
and q
uarry
ing
Arts, e
nterta
inmen
t and
recre
ation
Wholes
ale, re
tail tr
ade;
repair
of moto
r veh
icles
Manufac
turing
Constr
uctio
n
Other s
ervice
activ
ities
Human
healt
h and
socia
l
work ac
tivitie
s
Accom
modati
on an
d foo
d
servi
ce ac
tivitie
s
Notes: Italy introduced lockdown measures in early March with attractions, schools, universities, hair salons, restaurants and bars closed nationwide by 11 March. Factories were closed and all nonessential production halted by 22 March. Restrictions were eased progressively from 4 May and into June, although teleworking continued to be encouraged where possible.
Estimated teleworking potential is a weighted average of the number of firms in each industry reporting that the percentage of company staff performing jobs that can be carried out in remote or smart working lies in the following bands: none or almost none (treated as 0% to 1%), less than 25%, 25% to 50%, 51% to 75%, and 75% and over. The midpoint of each band is used for the calculation.
Source: OECD based on ISTAT (2020), “Situation and perspectives of enterprises during the health emergency COVID-19”.12 https://doi.org/10.1787/888934192756
Similar patterns were seen in France. Across all industries, a quarter of employees teleworked in the last week of March 2020 when lockdown measures were in full force. The share reached 36% on average in services industries (DARES, 2020[45]) and was higher (28%) for larger firms than smaller firms (20%). Furthermore, the share reached around 60% in industries that were already highly digital-intensive (e.g. information and communication services; financial and insurance activities). The greatest proportional increase occurred in real estate activities where teleworking increased 13-fold.
Canada likewise saw increases in teleworking during the early stages of COVID-19. Before 1 February 2020, 11% of businesses had more than half of employees teleworking. This share had jumped to 35% by 31 March 2020. Moreover, in 18% of firms all employees were teleworking on 31 March. Concurrently,
261OECD DIGITAL ECONOMY OUTLOOK 2020 © OECD 2020
10. EVOLVING BUSINESS MODELS 10. EVOLVING BUSINESS MODELS

the share of firms in which 10% or fewer workers teleworked fell from 78% of businesses prior to 1 February to 51% on 31 March 2020 (Statistics Canada, 2020[46]).
The ability to maintain business activity appears strongly associated with the ability for workers to telework (Figure 10.8). Together, these data provide a strong indication of the contribution digital technologies can make to resilience in times of crisis.
Figure 10.8. Business activity and teleworking, services industries in France, April 2020Percentage of workers teleworking and activity as a share of usual level
0
20
60
40
100
80
10 20 30 40 50 60 70 80 90 100Activity in April 2020 (% of usual level)
Teleworking (%)
Repair of motor vehicles and motorcyclesTransportation and storage
Accommodation
Food andbeverageserviceactivities
Publishing activitiesComputer
programming,consultancy andrelated activities
Informationserviceactivities
Legal andaccountingactivities
Managementconsultancy
activitiesArchitecturaland engineeringactivities; technicaltesting and analysis
Advertising andmarket research
Rental and leasing
Temporaryemployment
Cleaning activities
Other serviceactivities
Note: Data are from a survey of business managers’ perceptions (e.g. of how the level of activity of their business in April 2020 compares to a typical recent period before the COVID-19 crisis).
Source: OECD based on Banque de France (2020[47]), “Point de conjoncture”, https://www.banque-france.fr (accessed on 14 May 2020).12 https://doi.org/10.1787/888934192775
Following from the above, a significant portion of companies in OECD countries will likely have faced strong incentives to adopt teleworking practices, or to expand them across employees as far as possible. This appears to accord with exponential increases in downloads of videoconferencing apps, which are crucial in helping people learn and work from home (Figure 10.9). Nevertheless, these services are available for both personal and business use. Videoconferencing and teleworking tools have undoubtedly helped many businesses continue to operate during the COVID-19 pandemic. However, firms may have also faced the need to understand and manage additional risks. These risks could include ensuring appropriate security, privacy and confidentiality of data transiting remote connections or transmitted via such online tools. Firms can vary in their level of cybersecurity and the geographical locations in which data are stored. SMEs may be especially likely to need support to use digital tools to keep operating during the COVID-19 crisis. Moreover, they may need more help than other businesses to follow safe online working practices and adhere to relevant privacy and security requirements.
Figure 10.9. Growth in downloads of selected video conferencing apps, 2019-2015-21 March 2020 compared to Q4 2019 weekly average
0
5
10
15
20
25
30
35Multiple of Q4 2019 downloads
Google Hangouts Meet Zoom Cloud Meetings Microsoft Teams
United States United Kingdom France Germany
Source: OECD based on App Annie, www.appannie.com/en/insights/market-data/video-conferencing-apps-surge-coronavirus/ (accessed on 31 May 2020).12 https://doi.org/10.1787/888934192794
262 OECD DIGITAL ECONOMY OUTLOOK 2020 © OECD 2020
10. EVOLVING BUSINESS MODELS 10. EVOLVING BUSINESS MODELS

Figure 10.10 shows that, alongside video conferencing, online tools such as Trello and Slack have experienced marked increases in use in countries for which data are available (France, Hungary and Poland). Such tools help teams share information, co-ordinate and collaborate.
Figure 10.10. Monthly traffic on remote working platforms during COVID-19, October 2019-April 2020Users per thousand employment
0
50
100
150
200
250
0
50
100
150
200350
450 250
0
50
100
150
200
250
300
400
‰ ‰ ‰
trello.com zoom.usskype.com slack.com
Oct 20
19
Nov 20
19
Dec 20
19
Jan 2
020
Feb 2
020
Mar 20
20
Apr 20
20
Oct 20
19
Nov 20
19
Dec 20
19
Jan 2
020
Feb 2
020
Mar 20
20
Apr 20
20
Oct 20
19
Nov 20
19
Dec 20
19
Jan 2
020
Feb 2
020
Mar 20
20
Apr 20
20
A. France B. Hungary C. Poland
Notes: Employment figures relate to Q1 2020 for France and Hungary, and Q4 2018 for Poland. StatLink contains more data.
Source: OECD based on Statista (database), www.statista.com/statistics/1117774/france-traffic-remote-working-platforms-during-covid-19/, www.statista.com/statistics/1117751/hungary-traffic-on-remote-working-platforms-during-covid-19/, www.statista.com/statistics/1118027/poland-remote-working-platform- traffic- during-covid-19/) and OECD, “Employment rate” (dataset), https://data.oecd.org/emp/employment-rate.htm (accessed on 29 June 2020).
12 https://doi.org/10.1787/888934192813
Some businesses have previously hesitated to embrace teleworking. However, the COVID-19 crisis has given businesses a direct interest in the practice to maintain operations and reduce employees’ exposure to the virus. Governments are supporting this change, especially among SMEs, helping them quickly develop teleworking capabilities. Japan has expanded support for SMEs to introduce teleworking in the office environment. Meanwhile, Korea has developed digital infrastructure to help SMEs work remotely and to allow investor relations on line rather than in person. Italy set up a website to help businesses and education institutions understand and choose between relevant web-based tools. Spain introduced the Talent Accelerate programme to strengthen digital skills in SMEs through training.
Private initiatives can also support SMEs. In France, industry associations support SMEs through a toolkit on teleworking and advice to companies. Singapore worked with industry partners to curate a list of digital solutions to help businesses cope with COVID-19 challenges. Items on the list range from remote working and visitor management to selling on line, billing and online payments. Industry partners offer these solutions to businesses free of charge for a limited time. Singapore also supports industry by providing government grants to consider additional digital solutions such as online collaboration and virtual meetings (for remote work) and temperature screening and queue management (for visitor management).
Videoconferencing and teleworking tools have undoubtedly helped many businesses continue to operate during the COVID-19 pandemic. However, firms may have also faced the need to understand and manage additional risks. These risks could include ensuring appropriate security, privacy and confidentiality of data transiting remote connections or transmitted via such online tools. Firms can vary in their level of cybersecurity and the geographical locations in which data are stored. SMEs may be especially likely to need support to use digital tools to keep operating during the COVID-19 crisis. Moreover, they may need more help than other businesses to follow safe online working practices and adhere to relevant privacy and security requirements.
As well as using digital technologies to help employees stay in touch and work together through confinement, businesses may also use them to communicate with and sell to customers. Many countries have new or enhanced initiatives to help firms engage in e-commerce and online business models
263OECD DIGITAL ECONOMY OUTLOOK 2020 © OECD 2020
10. EVOLVING BUSINESS MODELS 10. EVOLVING BUSINESS MODELS

or to access new markets through digital tools. For example, Korea is encouraging brick-and-mortar shops to open their businesses on line through a dedicated support programme. Japan has offered subsidies to support firms to adopt IT solutions and develop e-commerce sales channels. Broader support programmes for SMEs, such as the “France Num” initiative, also helped SMEs transition to an online business model. Some countries, such as Mexico and Turkey, also promoted solidarity campaigns to provide SMEs with essential cash flow during the COVID-19 crisis or encouraged online sales (Mexico). Other countries helped SMEs with access to essential services related to their online business model. Switzerland, for example, offered e-customs processing, while Spain offered strategic consulting to strengthen SME’s online presence for the international market.
For SMEs, online marketplace platforms are likely to offer a comparatively straightforward route to engaging in e-commerce. Amazon Marketplace, Rakuten, Walmart Marketplace, Mercado Libre and many others facilitate millions of businesses in selling on line. Delivery services such as Uber Eats and Postmates can also provide certain types of businesses – such as those selling food and groceries – with a one-stop solution for selling on line and delivering purchases to customers.
The COVID-19 crisis might be expected to have fuelled an increase in companies selling through on line marketplace platforms, but indicators are scarce. Estimates on sign-ups to Amazon Marketplace show that 384 000 new sellers signed up on Amazon’s 16 marketplaces worldwide1 in the first three months of 2020. Amazon.com (United States), Amazon.in (India), Amazon.co.uk (United Kingdom) and Amazon.es (Spain) accounted for around half of this increase (Marketplace Pulse, 2020[48]).
2 However, this is projected to lead to around 1 million additions by the end of 2020, a decrease from the 1.2 million added in 2019 (Marketplace Pulse, 2020[49]).
Furthermore, many of these additional seller accounts may end up inactive. Of 8.4 million total seller accounts worldwide, only about 2 million have products listed for sale (Marketplace Pulse, 2020[48]). The COVID-19 pandemic may encourage sellers with previously dormant Amazon Marketplace accounts to make sales. In this way, a larger share of businesses could be using e-commerce as part of their business model. Once available, data from the 2020 surveys of ICT usage in businesses will help identify any acceleration of e-commerce uptake by businesses.
Initiatives to accelerate the uptake of electronic payment methods go hand in hand with the uptake of e-commerce and online business models. They have grown in importance as traditional forms of payment have become less desirable with growing requirements for social distancing. For example, the Bank of Mexico adjusted its collection and payments platform CoDi to the COVID-19 crisis to help users process e-payments. In Turkey, the government worked with telecommunications operators to improve and facilitate electronic payments.
A third example of technology adoption relates to chatbot services. During the pandemic, businesses have experienced increasing levels of telephone and online enquiries. At the same time, social distancing and other measures reduced the number of staff available to deal with these requests. In response, private and public sector organisations have rapidly implemented and customised chatbot services, which are available off-the-shelf from companies such as IBM and Google. Chatbots use AI to parse the meaning of spoken or written requests and provide the answer if possible or pass on to human agents where necessary (Hao, 2020[50]).
The COVID-19 crisis has suddenly and strongly changed the way environment in which businesses, and their employees, operate. For many, digital technologies are likely proving critical to their activities during the crisis. The pandemic is also demonstrating the potential, and pitfalls, of certain digital technologies on an unprecedented scale.
It is unknown to what degree these changes will persist. Will firms shift towards using chatbots more heavily and relying less on humans to answer enquiries? Will employees and businesses adopt teleworking more widely on an ongoing basis? Will more SMEs move towards selling on line? As the recovery evolves, robust survey sources will be needed, including those of ICT usage by businesses and by households and individuals. Policy makers should use these surveys flexibly to identify accelerations and new dynamics.
264 OECD DIGITAL ECONOMY OUTLOOK 2020 © OECD 2020
10. EVOLVING BUSINESS MODELS 10. EVOLVING BUSINESS MODELS

COVID-19: Risks to business dynamicsWhile the COVID-19 crisis is undoubtedly challenging many firms to modify their business practices to continue operating, it poses additional challenges for young firms.3
In recent years, start-ups have emerged as key drivers of economic growth and job creation. Indeed, they are often a catalyst for radical innovation. Young firms account for about 20% of employment, but create almost half of new jobs on average across OECD countries. Moreover, innovation by young firms significantly contributes to aggregate productivity growth, accounting for half of it in the United States (Klenow and Li, 2020[51]).
During the COVID-19 crisis, start-ups have continued to play a critical economic role. Some innovative young firms have reacted quickly and flexibly to the pandemic. As a result, they have been critical in helping many countries shift towards fully digital work, education and health services. They have also provided innovations in medical goods and services. Such innovations include launching a range of digital health services such as COVID-19 trackers, remote patient monitoring and remote consultation tools. Other examples include innovative remote working, online learning and entertainment products; “no-contact” food delivery; and AI solutions for researchers and scientists.
However, many start-ups face significant challenges as they are more vulnerable than incumbents to the shocks brought by COVID-19. They tend to engage in higher-risk activities in comparison to other SMEs, face constraints in accessing finance through traditional channels, and have a formative relationship with suppliers and customers.
Start-ups may become even more financially fragile given the significant economic uncertainty, the impact of containment measures on revenues and a significant drop in demand. As a result, they will need support for short-term liquidity needs, which are critical for survival. An early assessment based on data for the United Kingdom suggests that young firms (between one and five years old) account for three-quarters of the 70% increase in the number of company dissolutions in March 2020 relative to March 2019 (Prashar et al., 2020[52]).
A reduced number of new firms, even in a single year, has sizeable and persistent effects on different social and economic outcomes, including innovation and notably aggregate employment. Simulations based on the OECD DynEmp3 database show that a 20% decline in the number of new firms – a drop similar to that experienced during the global financial crisis – leads to an employment loss of 0.7% of aggregate employment three years after the shock. This loss endures at 0.5% as long as 14 years after. Furthermore, a lower number of new firms may further amplify pre-existing long-term declining trends in business dynamism seen in many countries.
Notwithstanding the significant economic disruption caused by the COVID-19 crisis (OECD, 2019[53]), support for start-ups and creation of new firms could mitigate long-term effects on business innovation. Some countries are already introducing additional policy measures focused on shielding start-ups. For example, France set up a EUR 4 billion fund to support start-up liquidity, including bridging start-up funding rounds. Germany announced a tailored start-up aid programme, expanding and facilitating venture capital financing. For its part, the United Kingdom announced a co-financing fund for innovative companies facing financial difficulties.
Recessions are often times of heightened restructuring that may ultimately lead to a stronger and more resilient economy. In fact, even as the number of new business registrations generally drops during recessions, many successful innovative start-ups or businesses emerged from periods of crisis. These tend to rely heavily on digital technologies. Dropbox, Uber, Airbnb, WhatsApp, Groupon and Pinterest, for example, were all founded during or just after the global financial crisis. Meanwhile, Alibaba’s Taobao was founded during the SARS outbreak in China in 2003.
This confirms that periods of crisis are not only a challenge, but also provide new opportunities for entrepreneurship. Start-ups can help address the constraints created by difficult health or economic conditions, and respond to changing preferences and needs. Furthermore, the COVID-19 outbreak may induce persistent changes in societies, consumer habits or needs. These could create valuable business opportunities for start-ups that can anticipate these changes.
265OECD DIGITAL ECONOMY OUTLOOK 2020 © OECD 2020
10. EVOLVING BUSINESS MODELS 10. EVOLVING BUSINESS MODELS
Products and business models will likely need digital technologies at their centre to meet these challenges and opportunities. Demand for remote working technologies, e-commerce, remote learning and telemedicine services, for example, have been supercharged during the COVID-19 crisis. This demand may well be sustained in the longer term, transforming global value chains and cities.
Policy interventions should aim at providing the right conditions and incentives for innovative start-ups and potential entrepreneurs, and boost their potential and capabilities to grasp them. Key actions could limit the detrimental effects on employment and innovation for a missing generation of new firms and help speed recovery. Policy makers could reduce barriers to entrepreneurship such as administrative burdens, for example, by accelerating the transition to e-government. They could provide incentives for start-ups and entrepreneurs. They could ensure funding remains available. Finally, they could boost entrepreneurial potential and training. Furthermore, fast and resilient infrastructure must be available to underpin digital technology solutions to the challenges and opportunities created by the COVID-19 crisis (OECD, 2020[54]). In addition, policy makers should help more members of the workforce gain the digital and complementary skills needed to design and build these into world-class products (OECD, 2019[55]).
The COVID-19 crisis will undoubtedly be a great disrupting force and source of economic challenges. However, the adversity it creates could give birth to a wide range of technology-driven innovations. Government actions now, and in the recovery, will help maximise the potential for national innovation.
266 OECD DIGITAL ECONOMY OUTLOOK 2020 © OECD 2020
10. EVOLVING BUSINESS MODELS 10. EVOLVING BUSINESS MODELS

References
Amazon (2019), “Amazon Go”, webpage, https://www.amazon.com/b?ie=UTF8&node=16008589011 (accessed on 21 October 2020). [18]
Attrey, A., M. Lesher and C. Lomax (2020), “The role of sandboxes in promoting flexibility and innovation in the digital age”, Going Digital Toolkit Policy Note, No. 2, https://goingdigital.oecd.org/toolkitnotes/the-role-of-sandboxes-in-promoting-flexibility-and-innovation-in-the-digital-age.pdf.
[21]
Bakos, Y. and E. Brynjolfsson (2000), “Bundling and competition on the Internet”, Marketing Science, Vol. 19/1, pp. 63-82, https://doi.org/10.1287/mksc.19.1.63.15182.
[10]
Bakos, Y. and E. Brynjolfsson (1999), “Bundling information goods: Price, profits and efficiency”, Management Science, Vol. 45/12, pp. 1613-1630, http://dx.doi.org/10.1287/mnsc.45.12.1613.
[9]
Banque de France (2020), “Point de Conjoncture”, webpage, https://www.banque-france.fr/statistiques/conjoncture/enquetes-de-conjoncture/point-de-conjoncture (accessed on 21 October 2020).
[47]
BBC (2020), “Netflix gets 16 million new sign-ups thanks to lockdown”, BBC News, 22 April, https://www.bbc.com/news/business-52376022.
[7]
Boeri, T., A. Caiumi and M. Paccagnella (2020), “Mitigating the work-safety trade-off”, Covid Economics 2, pp. 60-66, https://cepr.org/sites/default/files/news/CovidEconomics2.pdf.
[43]
Chen, T. et al. (2017), “Thinking inside the subscription box: New research on e-commerce consumers”, Our Insights, McKinsey and Company, New York, 9 February, https://www.mckinsey.com/industries/technology-media-and-telecommunications/our-insights/thinking-inside-the-subscription-box-new-research-on-ecommerce-consumers?cid=other-eml-alt-mip-mck-oth-1802&hlkid=33f0e490745146d08a50a70943d86845&hctky=10178627&hdpi.
[8]
Cheok, L., W. Huiskamp and A. Malinowski (2014), “Beyond payment – E-commerce trends and payment challenges for online merchants expanding e-commerce operations internationally”, White Paper, ModusLink Global Solutions, Waltham, Massachusetts, https://www.moduslink.com/wp-content/uploads/2014/07/WhitePaper_eCommerce-Trends-and-Payment-Challenges.pdf.
[19]
DARES (2020), Activité et conditions d’emploi de la main-d’oeuvre pendant la crise sanitaire Covid-19, Synthèse des résultats de l’enquête flash [Workforce activity and conditions of employment during the Covid-19 health crisis, Summary of the results of the flash survey], Direction de l’Animation de la Recherche, des Études et des Statistiques, Paris, April, https://dares.travail-emploi.gouv.fr/IMG/pdf/dares_acemo_covid19_synthese_17-04-2020.pdf.
[45]
Dingel, J. and B. Neiman (2020), “How many jobs can be done at home?”, NBER Working Paper, No. 26948, National Bureau of Economic Research, Cambridge, Massachusetts, https://dx.doi.org/10.3386/w26948.
[42]
Dreischmeier, R., K. Close and P. Trichet (2015), The Digital Imperative, Boston Consulting Group, 2 March, https://www.bcg.com/publications/2015/digital-imperative.aspx.
[31]
Ellison, G. and S. Ellison (2018), “Match quality, search, and the Internet market for used books”, NBER Working Paper, No. 24197, National Bureau of Economic Research, Cambridge, Massachusetts, http://dx.doi.org/10.3386/w24197.
[3]
European Commission (2020), A European Strategy for Data, European Commission, Brussels, https://ec.europa.eu/info/sites/info/files/communication-european-strategy-data-19feb2020_en.pdf.
[33]
European Commission (2019), Council Recommendation on Access to Social Protection for Workers and the Self-Employed, 2019/C 387/01, ST/12753/2019/INIT, Brussels, https://eur-lex.europa.eu/legal-content/EN/TXT/?uri=uriserv:OJ.C_.2019.387.01.0001.01.ENG&toc=OJ:C:2019:387:TOC.
[58]
European Commission (2015), Freemium: Zero Marginal Cost, European Commission, Brussels, http://ec.europa.eu/DocsRoom/documents/13421/attachments/1/translations.
[12]
European Commission (2015), Regulation (EU) 2015/758 of the European Parliament and of the Council of 29 April 2015 concerning type-approval requirements for the deployment of the eCall in-vehicle system based on the 112 service and amending Directive 2007/46/EC, European Commission, Brussels, https://eur-lex.europa.eu/legal-content/EN/TXT/?uri=celex:32015R0758.
[24]
Fradkin, A. (2017), “Search, matching, and the role of digital marketplace design in enabling trade: Evidence from Airbnb”, MIT Sloan School of Management, Cambridge, Massachusetts, http://ide.mit.edu/sites/default/files/publications/SearchMatchingEfficiency.pdf.
[4]
Frank, R. and P. Cook (1996), The Winner-Take-All Society, Penguin Random House, New York. [30]
Goldfarb, A. et al. (2015), “The effect of social interaction on economic transactions: Evidence from changes in two retail formats”, Management Science, Vol. 61/12, pp. 2825-3096, https://pubsonline.informs.org/doi/10.1287/mnsc.2014.2030.
[17]
267OECD DIGITAL ECONOMY OUTLOOK 2020 © OECD 2020
10. EVOLVING BUSINESS MODELS 10. EVOLVING BUSINESS MODELS
References and Notes

Goldfarb, A. and C. Tucker (2017), “Digital economics”, NBER Working Paper, No. 23684, National Bureau of Economic Research, Cambridge, Massachusetts, http://dx.doi.org/10.3386/w23684.
[11]
Hafner, J. and D. Limbachia (2018), “McDonald’s: You buy more from touch-screen kiosks than a person. So expect more kiosks”, USA Today, 7 June, https://eu.usatoday.com/story/money/nation-now/2018/06/07/mcdonalds-add-kiosks-citing-better-sales-over-face-face-orders/681196002/.
[15]
Hao, K. (2020), “The pandemic is emptying call centers. AI chatbots are swooping in”, MIT Technology Review, 14 May, https://www.technologyreview.com/2020/05/14/1001716/ai-chatbots-take-call-center-jobs-during-coronavirus-pandemic/.
[50]
Houser, K. (2018), “Ordering food via touchscreen is so fun you spend more money when you do it”, Futurism, 7 June, https://futurism.com/self-serve-kiosks-mcdonalds.
[16]
Howland, D. (2016), “How retailers can use curb side pickup to build customer loyalty”, Retail Dive, 16 May, https://www.retaildive.com/news/how-retailers-can-use-curbside-pickup-to-build-customer-loyalty/418801/.
[14]
Iansiti, M. and K. Lakhani (2017), “Managing our hub economy”, Harvard Business Review, No. September-October, https://hbr.org/2017/09/managing-our-hub-economy.
[29]
ILO (2020), “Working from home: Estimating the worldwide potential”, Briefing Note, International Labour Organization, Geneva, 7 May, https://www.ilo.org/global/topics/non-standard-employment/publications/WCMS_743447/lang--en/index.htm.
[44]
Jeon, S., H. Liu and Y. Ostrovsky (2019), Measuring the Gig Economy in Canada Using Administrative Data, Analytical Studies Branch Research Paper Series, Statistics Canada, Ottawa, https://www150.statcan.gc.ca/n1/pub/11f0019m/11f0019m2019025-eng.htm.
[36]
Kässi, O. and V. Lehdonvirta, (2016), “Online labour index: Measuring the online gig economy for policy and research”, MPRA Paper, No. 74943, https://mpra.ub.uni-muenchen.de/74943 (accessed on 28 October 2020).
[57]
Klenow, P. and H. Li (2020), “Innovative growth accounting”, NBER Working Paper, No. 27015, National Bureau of Economic Research, Cambridge, Massachusetts, https://dx.doi.org/10.3386/w27015.
[51]
Marketplace Pulse (2020), Marketplaces Year in Review 2019, Marketplace Pulse, https://www.marketplacepulse.com/marketplaces-year-in-review-2019#sellersgrowth.
[49]
Marketplace Pulse (2020), “Number of Sellers on Amazon Marketplace”, webpage, https://www.marketplacepulse.com/amazon/number-of-sellers (accessed on 15 May 2020).
[48]
Neate, R. (2020), “Amazon reaps $11,000-a-second coronavirus lockdown bonanza”, The Guardian, 15 April, https://www.theguardian.com/technology/2020/apr/15/amazon-lockdown-bonanza-jeff-bezos-fortune-109bn-coronavirus.
[2]
OECD (2020), “Distributional risks associated with non-standard work: Stylised facts and policy considerations”, OECD Policy Responses to Coronavirus (COVID-19), OECD, Paris, http://www.oecd.org/coronavirus/policy-responses/distributional-risks-associated-with-non-standard-work-stylised-facts-and-policy-considerations-68fa7d61/.
[38]
OECD (2020), “Keeping the Internet up and running in times of crisis”, OECD, Paris, http://www.oecd.org/coronavirus/policy-responses/keeping-the-internet-up-and-running-in-times-of-crisis-4017c4c9/.
[54]
OECD (2020), “Supporting people and companies to deal with the COVID-19 virus: Options for an immediate employment and social-policy response”, OECD Policy Responses to Coronavirus (COVID-19), OECD Publishing, Paris, http://oe.cd/covid19briefsocial.
[37]
OECD (2020), “Start-ups in the time of COVID-19: Facing the challenges, seizing the opportunities”, OECD, Paris, http://www.oecd.org/coronavirus/policy-responses/start-ups-in-the-time-of-covid-19-facing-the-challenges-seizing-the-opportunities-87219267/.
[56]
OECD (2019), An Introduction to Online Platforms and Their Role in the Digital Transformation, OECD Publishing, Paris, https://doi.org/10.1787/53e5f593-en.
[22]
OECD (2019), Challenges to Consumer Policy in the Digital Era: Background Report, G20 International Conference on Consumer Policy, Tokushima, Japan, 5-6 September, OECD, Paris, http://www.oecd.org/sti/consumer/challenges-to-consumer-policy-in-the-digital-age.pdf.
[5]
OECD (2019), Going Digital: Shaping Policies, Improving Lives, OECD Publishing, Paris, https://doi.org/10.1787/9789264312012-en. [55]
OECD (2019), “Individual learning accounts: Design is key for success”, Policy Brief on the Future of Work, OECD, Paris, https://www.oecd.org/employment/individual-learning-accounts.pdf.
[41]
OECD (2019), Individual Learning Accounts: Panacea or Pandora’s Box?, OECD Publishing, Paris, https://dx.doi.org/10.1787/203b21a8-en. [40]
OECD (2019), “Measuring platform mediated workers”, OECD Digital Economy Papers, No. 282, OECD Publishing, Paris, https://dx.doi.org/10.1787/170a14d9-en.
[35]
OECD (2019), “Measuring the Economic Value of Data and Data Flows”, OECD Digital Economy Papers, No. 297, OECD Publishing, Paris, https://doi.org/10.1787/6345995e-en.
[53]
OECD (2019), OECD Employment Outlook 2019: The Future of Work, OECD Publishing, Paris, https://dx.doi.org/10.1787/9ee00155-en. [32]
268 OECD DIGITAL ECONOMY OUTLOOK 2020 © OECD 2020
10. EVOLVING BUSINESS MODELS 10. EVOLVING BUSINESS MODELS
References and Notes

OECD (2019), OECD Skills Outlook 2019: Thriving in a Digital World, OECD Publishing, Paris, https://dx.doi.org/10.1787/df80bc12-en. [23]
OECD (2019), Policy Responses to New Forms of Work, OECD Publishing, Paris, https://dx.doi.org/10.1787/0763f1b7-en. [39]
OECD (2019), Unpacking E-Commerce: Business Models, Tends and Policies, OECD Publishing, Paris, https://doi.org/10.1787/ 23561431-en.
[1]
OECD (2019), “Vectors of digital transformation”, OECD Digital Economy Papers, No. 273, OECD Publishing, Paris, https://doi.org/10.1787/5ade2bba-en.
[27]
OECD (2018), Good Jobs for All in a Changing World of Work: The OECD Jobs Strategy, OECD Publishing, Paris, https://dx.doi.org/10.1787/9789264308817-en.
[34]
OECD (2017), OECD Science, Technology and Industry Scoreboard 2017: The digital transformation, OECD Publishing, Paris, https://doi.org/10.1787/9789264268821-en.
[6]
OECD (2016), “New Forms of Work in the Digital Economy”, OECD Digital Economy Papers, No. 260, OECD Publishing, Paris, https://dx.doi.org/10.1787/5jlwnklt820x-en.
[26]
OECD (2012), The Digital Economy, OECD, Paris, https://www.oecd.org/daf/competition/The-Digital-Economy-2012.pdf. [28]
OECD (2011), Digital Identity Management: Enabling Innovation and Trust in the Internet Economy, OECD Publishing, Paris, https://www.oecd.org/sti/ieconomy/49338380.pdf.
[25]
Pate, T., J. Kun and B. Srinivasan (2016), “Sensor21: Earn bitcoin by collecting environmental data”, Medium, 25 May, https://medium.com/@earndotcom/sensor21-earn-bitcoin-by-collecting-environmental-data-218a4132ca70.
[20]
Prashar, N. et al. (2020), “Business dynamism and COVID-19 – an early assessment”, Insight Paper, Enterprise Research Centre, April, https://www.enterpriseresearch.ac.uk/wp-content/uploads/2020/04/ERC-Insight-Business-Dynamics-and-COVID-19-FINAL.pdf.
[52]
Statistics Canada (2020), “Percentage of workforce teleworking or working remotely, and percentage of workforce able to carry out a majority of duties during the COVID-19 pandemic, by business characteristics”, Table 33-10-0228-01, Statistics Canada, Ottawa, https://doi.org/10.25318/3310022801-eng.
[46]
United Postal Service (2018), “UPS Pulse of the Online Shopper Survey”, https://www.ups.com/assets/resources/media/knowledge-center/ups-pulse-of-the-online-shopper.PDF (accessed on 21 October 2020).
[13]
Notes
1. Amazon: .com (United States), .in (India), .co.uk (United Kingdom), .es (Spain), .it (Italy), .de (Germany), .fr (France), .ca (Canada), .co.jp (Japan), .com.mx (Mexico), .ae (UAE), .com.au (Australia), .com.br (Brazil) .sg (Singapore), .com.tr (Turkey) and .cn (China).
2. Amazon sellers can be based in any country.
3. This section draws upon OECD (2020[56]).
269OECD DIGITAL ECONOMY OUTLOOK 2020 © OECD 2020
10. EVOLVING BUSINESS MODELS 10. EVOLVING BUSINESS MODELS
References and Notes

Chapter 11ARTIFICIAL INTELLIGENCE, BLOCKCHAIN
AND QUANTUM COMPUTING
271OECD DIGITAL ECONOMY OUTLOOK 2020 © OECD 2020

KEY FINDINGS
�� By June 2020, over 60 countries had developed a national AI strategy or policies on AI and others were following. Countries were promoting AI research and development, data access and skills. At the same time, they were exploring approaches to ensure trustworthy AI and to mitigate risks associated with AI systems.
�� Investment and research on artificial intelligence (AI) have been growing fast in recent years. The total number of AI-related scientific publications quadrupled over 1999-2019, mainly driven by the United States, the People’s Republic of China (hereafter “China”) and the European Union. AI-related scientific publications co-authored by the United States and China more than doubled between 2014 and 2020.
�� Countries are using AI tools widely to help monitor and predict the spread of COVID-19 in real time, speed diagnosis and search for treatments at an unprecedented pace and scale.
�� Distributed ledger technologies (DLTs) offer a new way of securing data and transaction records for use by multiple parties without reliance on a trusted, central authority. Among DLTs, blockchain has gained fast notoriety in financial markets. However, countries are developing DLT-based solutions in a wider range of activities, including transport, energy and government services.
�� Several countries (e.g. Australia, China, Germany, India and Switzerland) have recently issued some blockchain strategy, while others (e.g. France and Italy) are developing it. International initiatives, like the OECD Blockchain Policy Centre, aim to help governments better understand this technology, address the challenges raised by DLTs and their applications, and seize opportunities to achieve policy objectives and deliver more effective government services.
�� Quantum computing brings the promise of addressing computational problems that are intractable on any classical computer. It could also accelerate innovation in a wide range of areas, including agriculture, drug development and energy, as well as auto and airplane manufacturing.
�� Research on quantum technologies is a global field. The three leaders are the United States (quantum computing), Europe (quantum mechanics) and China (quantum communication and cryptography).
IntroductionThis chapter explores three technologies that are – or have the potential to become – key drivers of digital transformation: artificial intelligence (AI), distributed ledger technologies (DLTs) and quantum computing.
AI has risen to the top of the innovation and policy agendas of many OECD countries and partner economies. AI tools are being used widely to help monitor and predict the spread of COVID-19 in real time, speed diagnosis and search for treatments at an unprecedented pace.
DLTs offer a new way of securing data and transaction records for use by multiple parties without reliance on a trusted, central authority. Among DLTs, blockchain has gained notoriety following its rapid diffusion in financial markets. However, countries are developing a wider range of DLT-based solutions to facilitate access to finance by small and medium-sized enterprises (SMEs), allow better integration of transport services, improve efficiency in the public sector and develop low-carbon infrastructure models.
Quantum computing brings the promise to increase computing capacities enormously and address problems that are intractable on any classical computer. In particular, it is expected to accelerate research and innovation in agriculture, drug development and energy, as well as in auto and airplane manufactures. At the same time, quantum computing may be able to break many current cryptography methods.
272 OECD DIGITAL ECONOMY OUTLOOK 2020 © OECD 2020
11. ARTIFICIAL INTELLIGENCE, BLOCKCHAIN AND QUANTUM COMPUTING 11. ARTIFICIAL INTELLIGENCE, BLOCKCHAIN AND QUANTUM COMPUTING
Artificial intelligenceWhile the development of national policies on AI is relatively new, countries have set ambitious targets. This section examines trends in national AI strategies and policies, which aim to support innovation and the development and adoption of AI systems that are trustworthy and human-centred. It builds on data and evidence from the OECD AI Policy Observatory (www.oecd.ai). AI policy initiatives are structured according to the 2019 OECD Recommendation of the Council on Artificial Intelligence (hereafter “the OECD AI Principles”) (OECD, 2019[1]). First, they draw on the five values-based principles for the responsible stewardship of trustworthy AI. Second, they refer to policy recommendations pertaining to national policies and international co-operation for trustworthy AI.
AI promises to increase the efficiency and effectiveness of entire sectors, including the delivery of public services. Applied wisely, AI can improve well-being in areas like education, public safety and health. It can also help address pressing global problems, such as climate change and wider access to health care and mobility. Governments are planning to invest in and develop AI for its many benefits.
Yet alongside benefits, AI raises new or heightened types of ethical and fairness concerns. Chief among them are questions of respect for human rights and democratic values, and the dangers of transferring biases from the analogue into the digital world. Designing systems that are transparent about the use of AI and accountable for their outcomes is critical. AI systems must function properly and in a secure and safe manner.
National AI policies must build on international agreements. Over 40 governments signed up to the OECD AI Principles in May 2019, thereby agreeing to ensure trustworthy, human-centred AI systems. National policies are needed to put these principles into action, including those that encourage investment in responsible AI research and development (R&D).
In addition to AI technology and computing capacity, AI leverages vast quantities of data. This increases the need for a digital environment that enables access to data, alongside strong personal data and privacy protections, notably for systems that use sensitive personal data.
AI-enabling ecosystems can also support SMEs as they navigate the AI transition and ensure a competitive environment. AI will change the nature of work as it replaces and alters components of human labour. Policies will need to facilitate transitions as people move from one job to another, and ensure continuous education, training and skills development.
While approaches differ, national AI policies aim to serve all of society In 2017, Canada became the first country to launch a national AI strategy. By April 2020, more than 60 countries had national AI policies and others were following suit. Italy was the most recent country to adopt a national AI policy in July 2020.
Some countries included policies for AI within their broader digital strategies. Countries such as Korea, Spain and the United States created AI R&D strategies. A few countries, such as China, France, the Russian Federation and the United States focused part of their AI strategies on the defence sector. The European Union’s Co-ordinated Plan on AI of December 2018 encouraged member states to set up national AI strategies outlining investments and implementation measures.
National AI strategies and policies have ambitious targets. However, they differ in terms of objectives, timeframe for implementation, budgets and associated policy instruments for implementation (Figure 11.1). They articulate priorities for public investment and public R&D on AI, sectoral focus, education and employment, regulation and international co-operation. At the same time, national AI policies consider AI-related risks and challenges. Many countries have issued ethical guidance for AI systems and are reviewing and adapting policy and regulatory frameworks.
Effective implementation of national AI initiatives hinges on co-ordination Different countries are pursuing varying national governance approaches to co-ordinate implementation of their national AI policies across government and offer regulatory and ethical oversight:
● Government or independent bodies co-ordinate implementation of national AI strategies in several countries. France co-ordinates AI within the Prime Minister’s Office; the United Kingdom has an
273OECD DIGITAL ECONOMY OUTLOOK 2020 © OECD 2020
11. ARTIFICIAL INTELLIGENCE, BLOCKCHAIN AND QUANTUM COMPUTING 11. ARTIFICIAL INTELLIGENCE, BLOCKCHAIN AND QUANTUM COMPUTING

Office for AI; the United States has an AI Interagency Working Group; Egypt has a National Council for Artificial Intelligence headed by the Minister of Communications and Information Technology; and the Canadian Institute for Advanced Research co-ordinates implementation of Canada’s AI strategy.
● Expert advisory bodies conduct technology foresight and impact assessment on AI in work and society and provide recommendations to the government. These include Austria’s Council on Robotics and AI; Canada’s Advisory Council on AI; Spain’s Artificial Intelligence Advisory Council; the United Kingdom’s AI Council; and the United States’ Select Committee on AI under the National Science and Technology Council.
● Some countries have oversight and advisory bodies. These include the Data Ethics Advisory Group in New Zealand, the United Kingdom’s Centre for Data Ethics and Innovation, and Singapore’s Advisory Council on the Ethical Use of AI and Data.
The design of most national AI strategies underwent formal public consultations and involved numerous stakeholders, including key industry consortia, academia, trade unions and civil society.
Figure 11.1. Policy instruments used in national AI policies, 2020By type
51%
23%
1%
14%
11%
Collaborative infrastructures Governance
Guidance, regulation and incentivesDirect financial support Indirect financial support
Note: Data refer to a total of 538 policy instruments used by 60 countries, including the European Union. StatLink contains more data.
Source: OECD AI Policy Observatory, https://oecd.ai (accessed in April 2020).12 https://doi.org/10.1787/888934192832
Countries have begun to monitor implementation of AI policies Countries such as Canada, the United Kingdom and the United States have started to conduct policy intelligence activities and issue annual reports to evaluate implementation of their national AI strategies.
In addition, to oversee implementation of national AI strategies and policies, a few national or regional institutions have established AI observatories. For example, Germany’s Labour Ministry launched the KI-Observatorium in March 2020. It aims to help implement parts of Germany’s AI strategy and encourage the responsible, people-centred and participatory use of AI in the world of work and society. Other observatories include Quebec’s International Observatory on the Social Impacts of Artificial and Digital Intelligence in Canada; France’s Observatory on the Economic and Social Impact of Artificial Intelligence; the Italian Observatory on Artificial Intelligence; and the Czech Republic’s AI Observatory and Forum.
The European Union has planned joint monitoring to take stock of accomplishments and evaluate potential actions for next year’s co-ordinated plan. AI Watch is a joint programme of DG Connect and the Joint Research Centre (JRC) to monitor and evaluate the uptake and impact of AI in Europe. They are developing indicators with member states to calculate, monitor, target and assess investments proportionally. In February 2020, the OECD launched the AI Policy Observatory (OECD.AI),1 a platform for policy makers to monitor developments in the AI policy landscape. Among other features, the Observatory includes an open and comprehensive database of AI policy initiatives, regularly updated in collaboration with the JRC.
274 OECD DIGITAL ECONOMY OUTLOOK 2020 © OECD 2020
11. ARTIFICIAL INTELLIGENCE, BLOCKCHAIN AND QUANTUM COMPUTING 11. ARTIFICIAL INTELLIGENCE, BLOCKCHAIN AND QUANTUM COMPUTING

Most national AI policies focus on a handful of sectors, including health care and mobility National AI strategies and policies outline how countries plan to invest in AI to build or leverage their comparative advantages. They also encourage businesses to develop solutions that will boost growth and well-being. Countries tend to prioritise a handful of economic sectors, including mobility – logistics and transportation – and health (Table 11.1). In mobility, AI applications can help governments improve road safety, enhance public transportation efficiency, manage traffic and reduce carbon emissions. In health care, AI can help governments harness the latest breakthroughs to help detect health conditions early or remotely. They can also help deliver preventive services, optimise clinical decision making and discover new treatments and medications (OECD, 2020[2]). The OECD’s Committee on Digital Economy Policy has created the OECD Network of Experts (ONE AI). As a major part of its role, ONE AI analyses the pros and cons of focusing national AI policies on specific sectors and/or of adopting horizontal approaches.
Table 11.1. Countries’ AI policies focus on a handful of sectors, selected countries
Sector(s) targeted
Aust
ralia
Czec
h Re
publ
ic
Denm
ark
Fran
ce
Finl
and
Japa
n
Neth
erla
nds
Norw
ay
Swed
en
Unite
d Ki
ngdo
m
Unite
d St
ates
Chin
a
Indi
a
Sing
apor
e
Turk
ey
Mal
ta
Saud
i Ar
abia
Unite
d Ar
ab
Emira
tes
Agriculture and food
Cybersecurity
Defense/security
Education
Energy
Environment
Health care
Manufacturing
Mobility and transportation
Productivity
Public administration
Seas and oceans
Smart cities
Space
Telecommunications
Note: The Pan-Canadian AI Strategy and the German AI strategy do not have a significant focus on specific sectors.
Source: OECD AI Policy Observatory, https://oecd.ai (accessed in April 2020).
AI promises to make government services “smarter”: more agile, efficient and user-friendly. For instance, AI can help deliver personalised services to citizens. It can also enhance the efficiency and quality of administrative procedures by automating physical and digital tasks. In addition, it can improve decisions through better predictions based on patterns in large volumes of data (Ubaldi et al., 2019[3]).
Building on their digital government approaches, many national AI strategies and policies explicitly encourage adoption of AI in the public sector. For example, the EU Co-ordinated Plan on AI plans to “make public administrations in Europe frontrunners in the use of AI”. Denmark aims for the public sector to use AI to offer world-class services for the benefit of citizens and society. Finland’s AuroraAI project aims to use AI to provide personalised, one-stop-shop and human-centric AI-driven public services. Public entities can also use AI to strengthen law enforcement capabilities and to improve policy implementation. AI is also expected to free up public servants’ time and allow them to shift to higher value work (Berryhill et al., 2019[4]).
275OECD DIGITAL ECONOMY OUTLOOK 2020 © OECD 2020
11. ARTIFICIAL INTELLIGENCE, BLOCKCHAIN AND QUANTUM COMPUTING 11. ARTIFICIAL INTELLIGENCE, BLOCKCHAIN AND QUANTUM COMPUTING

Many countries aim to leverage AI to pursue grand challenges or “moonshot” projects that address high-impact societal challenges. These include climate change, ageing populations, health, inclusiveness, food, energy and environmental security, and other objectives set out in the United Nations’ 2030 Agenda for Sustainable Development.
The COVID-19 crisis is generating significant AI R&D. Countries have turned to AI tools to help monitor and predict the spread of the virus in real time and speed diagnosis. They also use AI to gain insights and search for treatments at an unprecedented pace and scale (Box 11.1).
Box 11.1. AI-powered responses to combat COVID-19
Before the world was even aware of the threat posed by COVID-19, AI systems had detected the outbreak of an unknown type of pneumonia in China. AI technologies and tools were employed to support efforts of policy makers, the medical community and society at large to manage every stage of the pandemic crisis management and its aftermath (Figure 11.2):
1. understanding the virus and accelerating medical research on drugs and treatments
2. detecting and diagnosing the virus, and predicting its evolution
3. assisting in preventing or slowing the spread of the virus through surveillance and contact tracing
4. responding to the health crisis through personalised information and learning
5. monitoring the recovery and improving early warning tools.
Figure 11.2. Examples of AI applications at different stages of the COVID-19 crisis
Note: CT = computerised tomography; GPS = global positioning system.
Sources: OECD (2020[5]), Using Artificial Intelligence to Help Combat COVID-19, https://read.oecd-ilibrary.org/view/?ref=130_130771-3jtyra9uoh&title=Using-artificial-intelligence-to-help-combat-COVID-19.
276 OECD DIGITAL ECONOMY OUTLOOK 2020 © OECD 2020
11. ARTIFICIAL INTELLIGENCE, BLOCKCHAIN AND QUANTUM COMPUTING 11. ARTIFICIAL INTELLIGENCE, BLOCKCHAIN AND QUANTUM COMPUTING
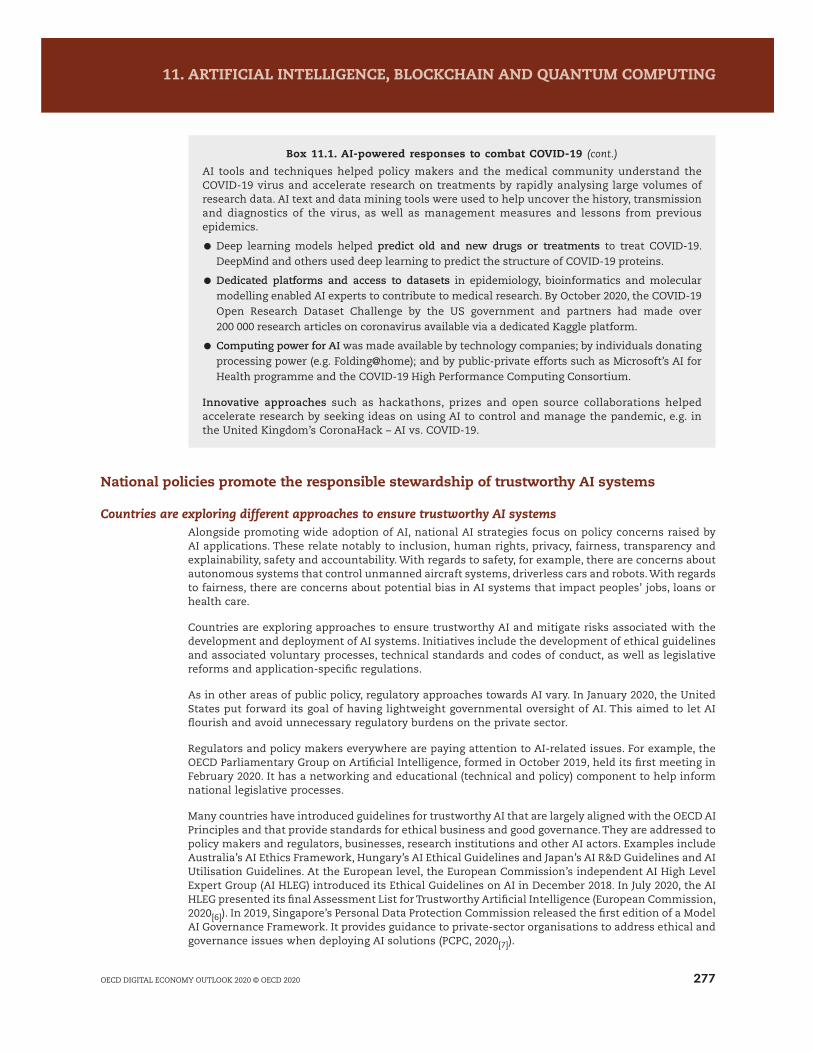
National policies promote the responsible stewardship of trustworthy AI systems
Countries are exploring different approaches to ensure trustworthy AI systems Alongside promoting wide adoption of AI, national AI strategies focus on policy concerns raised by AI applications. These relate notably to inclusion, human rights, privacy, fairness, transparency and explainability, safety and accountability. With regards to safety, for example, there are concerns about autonomous systems that control unmanned aircraft systems, driverless cars and robots. With regards to fairness, there are concerns about potential bias in AI systems that impact peoples’ jobs, loans or health care.
Countries are exploring approaches to ensure trustworthy AI and mitigate risks associated with the development and deployment of AI systems. Initiatives include the development of ethical guidelines and associated voluntary processes, technical standards and codes of conduct, as well as legislative reforms and application-specific regulations.
As in other areas of public policy, regulatory approaches towards AI vary. In January 2020, the United States put forward its goal of having lightweight governmental oversight of AI. This aimed to let AI flourish and avoid unnecessary regulatory burdens on the private sector.
Regulators and policy makers everywhere are paying attention to AI-related issues. For example, the OECD Parliamentary Group on Artificial Intelligence, formed in October 2019, held its first meeting in February 2020. It has a networking and educational (technical and policy) component to help inform national legislative processes.
Many countries have introduced guidelines for trustworthy AI that are largely aligned with the OECD AI Principles and that provide standards for ethical business and good governance. They are addressed to policy makers and regulators, businesses, research institutions and other AI actors. Examples include Australia’s AI Ethics Framework, Hungary’s AI Ethical Guidelines and Japan’s AI R&D Guidelines and AI Utilisation Guidelines. At the European level, the European Commission’s independent AI High Level Expert Group (AI HLEG) introduced its Ethical Guidelines on AI in December 2018. In July 2020, the AI HLEG presented its final Assessment List for Trustworthy Artificial Intelligence (European Commission, 2020[6]). In 2019, Singapore’s Personal Data Protection Commission released the first edition of a Model AI Governance Framework. It provides guidance to private-sector organisations to address ethical and governance issues when deploying AI solutions (PCPC, 2020[7]).
Box 11.1. AI-powered responses to combat COVID-19 (cont.)
AI tools and techniques helped policy makers and the medical community understand the COVID-19 virus and accelerate research on treatments by rapidly analysing large volumes of research data. AI text and data mining tools were used to help uncover the history, transmission and diagnostics of the virus, as well as management measures and lessons from previous epidemics.
● Deep learning models helped predict old and new drugs or treatments to treat COVID-19. DeepMind and others used deep learning to predict the structure of COVID-19 proteins.
● Dedicated platforms and access to datasets in epidemiology, bioinformatics and molecular modelling enabled AI experts to contribute to medical research. By October 2020, the COVID-19 Open Research Dataset Challenge by the US government and partners had made over 200 000 research articles on coronavirus available via a dedicated Kaggle platform.
● Computing power for AI was made available by technology companies; by individuals donating processing power (e.g. Folding@home); and by public-private efforts such as Microsoft’s AI for Health programme and the COVID-19 High Performance Computing Consortium.
Innovative approaches such as hackathons, prizes and open source collaborations helped accelerate research by seeking ideas on using AI to control and manage the pandemic, e.g. in the United Kingdom’s CoronaHack – AI vs. COVID-19.
277OECD DIGITAL ECONOMY OUTLOOK 2020 © OECD 2020
11. ARTIFICIAL INTELLIGENCE, BLOCKCHAIN AND QUANTUM COMPUTING 11. ARTIFICIAL INTELLIGENCE, BLOCKCHAIN AND QUANTUM COMPUTING

There are no general mandatory governance instruments specific for AI. However, several governments and intergovernmental bodies are considering or have adopted binding legislation for specific areas of AI technology. For example, Belgium has adopted resolutions to prohibit use of lethal autonomous weapons by local armed forces. Similar application-specific regulations address autonomous vehicles. The Danish ROAD Directorate, for example, has issued a binding guide on driverless cars. In June 2017, Germany allowed drivers to transfer control of vehicles to highly or fully automated driving systems and for those vehicles to be used on public roads. In the United States, the Federal Aviation Administration has been rolling out new regulations, rule-makings and pilot programmes. These aim to speed the integration of unmanned aircraft systems into the national airspace system. In 2020, the US Food and Drug Administration was considering regulation of certain AI-powered medical diagnostic systems (FDA, 2020[8]).
Moreover, certain AI applications deemed to be high risk in terms of their impact on people’s lives and liberty are attracting wide regulatory focus across countries. In February 2020, the EC issued a White Paper on Artificial Intelligence – A European Approach to Excellence and Trust. The paper considers requiring a pre-marketing conformity assessment for “high-risk” AI applications such as facial recognition, as a core element of a potential regulatory framework for AI. In addition, the white paper proposes a voluntary “quality label” for AI applications considered not to be high risk (European Commission, 2020[73]). In parallel, the European Commission is reviewing EU product safety and liability regimes in light of AI (European Commission, 2020[10]).
Experimentation allows policy makers to better understand AI impactsMany countries are considering co-regulatory approaches. These approaches aim to allow experimentation to better understand the effects of AI systems and provide controlled environments to facilitate the scale-up of new business models (see below the section on regulatory sandboxes) (OECD, 2019[11]; Planes-Satorra and Paunov, 2019[12]). These take place in parallel to regulatory approaches to help create a policy environment that can support the transition from research to deployment of trustworthy AI systems.
Standards can help foster interoperable and trustworthy AI systemsSome countries are developing technical standard frameworks to support implementation of the OECD AI principles. Countries including Australia, Canada, China, Germany and the United States emphasise the need for common standards, including to address security issues. For example, the US National Institute of Standards and Technology developed a plan for prioritising federal agency engagement in the development of standards for AI, with public and private-sector involvement. Standards Australia launched Australia’s AI Standards Roadmap in March 2020. The roadmap provides a framework for Australians to shape the development of standards for AI internationally. It explores standards that can promote, develop and realise the opportunities of responsible AI, delivering business growth, improving services and protecting consumers (Statistics Canada, 2020[13]).
Several cross-sector (horizontal) and sector-specific (vertical) AI standards are becoming available. Meanwhile, others are being developed by organisations such as the International Organization for Standardization and the Institute of Electrical and Electronics Engineers. Countries, including Denmark, Malta and Sweden, plan to establish AI certification programmes. The Danish government, alongside the Confederation of Danish Industry, the Danish Chamber of Commerce, SMEdenmark and the Danish Consumer Council, has created an independent labelling scheme: the Joint Cybersecurity and Data Ethics Seal. The seal will be granted to companies that meet requirements for cybersecurity and responsible handling of AI-related data (Larsen, 2020[14]).
National policies seek to leverage AI for societies and economiesAI policy initiatives are growing in OECD countries and partner economies. They can be usefully clustered according to the five recommendations to governments for the promotion and development of trustworthy AI in the 2019 OECD AI Principles: facilitating public and private investment in AI R&D; fostering a digital ecosystem for AI; shaping an enabling policy environment for AI; equipping people with the skills necessary to succeed as jobs evolve; and international co-operation for trustworthy AI. However, in a number of cases, AI initiatives address several OECD AI recommendations. In addition, a number of AI policy goals and national policy instruments are aligned with the 2019 OECD AI Principles
278 OECD DIGITAL ECONOMY OUTLOOK 2020 © OECD 2020
11. ARTIFICIAL INTELLIGENCE, BLOCKCHAIN AND QUANTUM COMPUTING 11. ARTIFICIAL INTELLIGENCE, BLOCKCHAIN AND QUANTUM COMPUTING

but not directly addressed in them. These goals relate to AI governance approaches, data governance frameworks, human-machine interaction and AI-related skills migration policies.
Investment in public research features prominently in AI policies Enhancing national AI R&D capabilities is a key feature of many national AI policies and strategies. AI is considered to be a general-purpose technology that could impact a large number of industries. It is also called an “invention of a method of invention” (Cockburn, 2018[15]) and already widely used by scientists and inventors to facilitate innovation. Entirely new industries could be created based on the scientific breakthroughs enabled by AI. This underscores the importance of basic research and of considering long time horizons in research policy (Figure 11.3). AI calls for policy makers to reconsider the appropriate level of government involvement in AI research to address societal challenges, especially in promising areas underserved by market-driven investments. In addition, research institutions in all areas will require capable AI systems to remain competitive, particularly in biomedical science and life science fields.
Governments have taken varied action to support AI. They have allocated direct funding for AI research institutes and project grants for AI research projects. They have also established AI centres of excellence to strengthen AI research schemes and create interdisciplinary research communities. Finally, they have launched procurement programmes and innovation vouchers, among others. While there are no official, comparable estimates of public investment in non-defence AI R&D, several budget elements are provided below.
Figure 11.3. AI publications by country, 1980-2020For top 50% quality rankings, numbers
0
10 000
20 000
30 000
40 000
50 000
60 000Number of publications
United States China EU27 UnitedKingdom
Canada Australia Japan Korea Switzerland India
Notes: EU27 = European Union minus the United Kingdom. Top 50% of AI publications. The “cumulative” option displays aggregate results since 1980. For more information, please see the methodological note at www.oecd.ai.
Source: OECD AI Policy Observatory, www.oecd.ai (accessed in June 2020).12 https://doi.org/10.1787/888934192851
In North America, Canada’s federal and provincial governments have dedicated over CAD 300 million (USD 227 million) to AI research over 2017-22, anchored in the three AI institutes of the Pan-Canadian AI Strategy. The United States’ AI R&D budget for the fiscal year (FY) 2021 plans a significant increase in non-defence AI funding over the FY2020 budget of USD 1 billion (NCO et al., 2019[16]). It includes over USD 850 million for AI activities funded by the National Science Foundation (NSF), an increase of more than 70% over the FY2020 budget. The NSF will invest in both foundational and translational AI research and plans to create national AI research institutes in collaboration with the departments of Agriculture, Homeland Security, Transportation and Veterans Affairs. The objective is to convene multisector, multidisciplinary research and workforce efforts. The US FY2021 budget also includes an increase of USD 54 million in core AI research at the Department of Energy. Finally, the National Institutes of Health is investing an additional USD 50 million for new research on using AI to help tackle chronic diseases (United States, 2020[17]).
In China, the State Council released the Guideline on Next Generation AI Development Plan in 2017. This aims to achieve: i) AI-driven economic growth in China by 2020; ii) major breakthroughs in basic theories by 2025 and in building an intelligent society; and iii) for China to be a global AI innovation
279OECD DIGITAL ECONOMY OUTLOOK 2020 © OECD 2020
11. ARTIFICIAL INTELLIGENCE, BLOCKCHAIN AND QUANTUM COMPUTING 11. ARTIFICIAL INTELLIGENCE, BLOCKCHAIN AND QUANTUM COMPUTING

centre by 2030 and to build up an AI industry of CNY1 trillion (USD 150 billion) (China, 2017[18]). Data on Chinese public investment in AI R&D are not readily available. However, researchers at Georgetown’s Centre for Security and Emerging Technology estimated that public AI R&D in 2018 was comparable to the planned spending of the United States for FY2020. They also put forward that Chinese public AI R&D spending likely focuses on applied research and experimental development rather than basic research (Acharya and Arnold, 2019[19]).
The European Commission, which has committed EUR 1.5 billion to AI research over two years as part of its Horizon 2020 programme, launched a new call for research into COVID-19. This contributes to its EUR 1.4 billion pledge to the Coronavirus Global Response initiative, launched by President Ursula von der Leyen on 4 May 2020. The European Union expects the private sector and its member states at the national level to complement this investment, reaching at least EUR 20 billion invested by the end of 2020. It also expected the private sector and member states to continue investing at least EUR 20 billion annually for the next ten years in AI R&D. Funding through Horizon Europe and the new Digital Europe programme targets AI research, innovation and deployment, and the development of digital skills. Support for AI R&D also includes grants to establish centres of excellence. This includes EUR 20 million to build the European Network of AI Excellence Centres (AI4EU), a European online platform that allows the exchange of AI tools and resources.
At the European national level, Germany had set aside EUR 3 billion for 2019-25 for the implementation of its national AI strategy. Germany expects a leverage effect on business, science and the Länder (states) that will at least double the overall amount available. The French AI strategy dedicates EUR 700 million for public AI research over five years from 2021-22. This amount is part of the EUR 1.5 billion for development of AI, notably in AI research institutes in Grenoble, Nice, Paris and Toulouse. In the 2019 State Budget, the Danish government allocated DKK 215 million (EUR 27 million) to the Innovation Fund Denmark to research technological possibilities offered by AI. The Finnish Centre for AI, a nationwide competence centre for AI with Academy of Finland flagship status, has been allocated EUR 250 million funding for the next eight years. Singapore will invest up to USD 150 million over five years in “AI Singapore”.
AI uptake requires accessible data, technologies and infrastructure
Data access and sharing are key to accelerate AI uptakeMany countries continue to focus on providing access to public sector data, including open government data, geo-data (e.g. maps) and transportation data. Similarly, they also emphasise data sharing within the public sector (Chapter 5). Countries are building on their open data access policies and strategies to promote data access and sharing for AI. For example, Denmark plans to provide open access to weather, climate and marine data from the Danish Meteorological Institute, in addition to European co-operation on space data. The United Kingdom is making available high-quality public data in an open, reusable and accessible format for machine learning. The United Kingdom’s Geospatial Commission aims to improve access to geospatial data, including for AI uses. In light of the United States’ Executive Order on Maintaining American Leadership in AI, the Office of Management and Budget is consulting the public on needs for additional access to, or improvements in the quality of, federal data and models that would improve AI R&D and testing efforts.
Several national AI policies plan to develop centralised, accessible repositories of open public data. In Norway, the Brønnøysund Register Centre and the Norwegian Digitalisation Agency have established a national directory of data held by different public agencies, their relationships, what they mean and whether data can be shared and on what terms. Portugal also plans to create a centralised repository for administrative data.
Organisations focused on data have also been created or are being considered. The Spanish AI strategy, for example, recommends the creation of a National Data Institute. Countries and regional institutions also seek to incentivise data sharing in the private sector. The United Kingdom in collaboration with the Open Data Institute and Innovate UK has launched three pilot projects to explore data trust frameworks for safe, secure and equitable data transfer. The European Union is creating a European data space, which will include private and public data. In February 2020, the European Union launched the EU
280 OECD DIGITAL ECONOMY OUTLOOK 2020 © OECD 2020
11. ARTIFICIAL INTELLIGENCE, BLOCKCHAIN AND QUANTUM COMPUTING 11. ARTIFICIAL INTELLIGENCE, BLOCKCHAIN AND QUANTUM COMPUTING

data strategy together with the White Paper on AI as the first pillar of the European Commission’s new digital strategy (European Commission, 2020[20]).
Uptake also requires AI technologies and infrastructure Developing and using AI requires access to AI technologies and infrastructure. This supposes affordable high-speed broadband networks and services, computing power and data storage, as well as supporting data-generating technologies such as the Internet of Things (IoT). In terms of network infrastructure, many countries are setting up high-quality connectivity and have or plan to deploy nationwide 5G technology and 5G networks (Chapter 3). The United Kingdom’s AI strategy mentions public investment of GBP 1 billion (USD 1.24 billion) to boost digital infrastructure, including GPB 176 million (USD 219 million) for 5G and GBP 200 million (USD 249 million) for full-fibre networks.
Many software tools to manage and use AI exist as open source resources, which facilitates their adoption and allows for crowdsourcing solutions to software bugs. Tools include TensorFlow (Google) and Cognitive Toolkit (Microsoft). Some researchers and companies share curated training datasets and training tools publicly to help diffuse AI technology.
Algorithms and data play strong roles in the development and performance of AI systems. However, as AI projects move from concept to commercial application, they often need specialised and expensive cloud computing and graphic-processing unit resources. Several economies allocate high-performance and cloud computing resources to AI-related applications and R&D (United States, 2019[21]). Some are setting up supercomputers designed for AI use and devoted to research and/or providing financial support to develop the national high-performance computing infrastructure (Figure 11.4).
The European High-Performance Computing Joint Undertaking (EuroHPC) is a EUR 1 billion undertaking by the European Union and other European countries. They aim to develop a peta-scale and pre-exa-scale supercomputing and data infrastructure to support European scientific and industrial research and innovation. In Japan, the RIKEN Center for Computational Science in Kobe and Fujitsu are developing a supercomputer named Fugaku. In addition to its Summit scientific supercomputer launched in June 2018, the US Department of Energy is building the Frontier supercomputer, expected to debut in 2021 as the world’s most powerful high-performance computer for AI. The NSF also invests significantly in next-generation supercomputers for AI R&D such as Frontera. The National Aeronautics and Space Administration also has a strong high-end computing program. Moreover, it is augmenting its Pleiades supercomputer with new nodes specifically designed for MLAI workloads (United States, 2019[21]).
Figure 11.4. The 500 most powerful non-distributed computer systems, by location, July 2020
0
50 000
100 000
150 000
200 000
250 000
415
530
513
855
RpeakRmaxTflops/s
Superc
ompu
ter
Fuga
ku (J
apan
)
Summit (
United
States
)
Sierra
(Unit
ed Stat
es)
Sunway
Taihu
Light (C
hina)
Tianh
e-2A (C
hina)
HPC5 (Ita
ly)
Selene
(Unit
ed Stat
es)
Fronter
a (Unit
ed Stat
es)
Marcon
i-100 (
Italy)
Piz Dain
t (Switz
erlan
d)
Trinit
y (Unit
ed Stat
es)
AI Brid
ging C
loud
Infras
tructu
re (Ja
pan)
SuperM
UC-NG (G
erman
y)
Lasse
n (Unit
ed Stat
es)
PANGEA III (F
rance
)
Cori (U
nited
States
)
Nurion
(Kore
a)
Oakfor
est-P
ACS (Jap
an)
HPC4 (Ita
ly)
Tera-1
000-2 (Fr
ance
)
Notes: This figure clusters the 500 most powerful non-distributed computer systems based on data from TOP500 from July 2020. A system’s Rmax score describes its maximal achieved performance. A system’s Rpeak score describes its theoretical peak performance. Tflop/s is a rate of execution, i.e. of trillions of floating point operations per second. StatLink contains more data.
Source: OECD based on TOP500, www.top500.org/lists/top500/2020/06/ (accessed on 10 September 2020).12 https://doi.org/10.1787/888934192870
281OECD DIGITAL ECONOMY OUTLOOK 2020 © OECD 2020
11. ARTIFICIAL INTELLIGENCE, BLOCKCHAIN AND QUANTUM COMPUTING 11. ARTIFICIAL INTELLIGENCE, BLOCKCHAIN AND QUANTUM COMPUTING

AI needs an enabling policy environment to generate benefitsCountries seek to support an agile transition from R&D to real use of AI in four ways. First, they provide controlled environments for experimentation and testing of AI systems. Second, they seek to improve access of companies to funding, including SMEs and start-ups. Third, they connect emerging companies with business opportunities. Fourth, they provide tailored advisory to support their scale-up.
These controlled environments for AI experimentation and testing facilitate the timely identification of potential technical flaws and governance challenges. In so doing, they can reveal potential public concerns through testing under quasi real-world conditions (OECD, 2017[9]). Such environments include innovation centres, policy labs and regulatory sandboxes. The latter are a form of limited regulatory testing for innovative applications not intended to enable permanent regulatory waivers or exemptions (OECD, 2020[22]). Experiments can operate in “start-up mode” whereby they are deployed, evaluated and modified, and then scaled up or down, or abandoned quickly (OECD, 2020[22]). Co-creation governance models involving both governments and private stakeholders already play an important role in many national AI strategies, such as those of Germany, New Zealand, Korea, the United Kingdom and the United States.
Germany’s AI strategy plans the establishment of AI living labs and testbeds, such as the living lab on the A9 autobahn. These make it possible to test technologies in a real-life setting and to screen the regulatory environment and make adjustments (Federal Government of Germany, 2018[23]). Lithuania plans to create a regulatory sandbox that will allow the use and testing of AI systems in the public sector. The United Arab Emirates launched an AI Lab in 2017. Led by Smart Dubai, the lab is testing use cases across all types of city services – from police and security to land development, education and environment. The European Commission is considering development of large-scale AI testing and experimentation facilities, which will be available to all actors across Europe to help avoid duplication of efforts. These testing facilities may include regulatory sandboxes in selected areas (European Commission, 2020[24]).
To spur private-sector investment in AI projects, some countries have created financial incentives. Since January 2018, the United Kingdom has provided an AI R&D Expenditure Credit (12% tax credit) designed to stimulate uptake of AI, including within the public sector. Malta has also reformed the Seed Investments Scheme with more favourable tax credit conditions for innovative AI firms. In Italy, the Ministry for Economic Development has provided funding for Telecom Italia to scale up several AI solutions, including in the areas of conversational virtual assistants and anomaly detection for alarm systems and predictive maintenance.
Another way that countries boost the development of innovative AI research ecosystems is by establishing networking and collaborative platforms, such as AI hubs, AI labs and AI accelerator programmes. They facilitate co-operation between industry, academia and public research institutes. Canada’s Innovation Superclusters Initiative invites industry-led consortia to invest in regional innovation ecosystems. It also supports partnerships between large firms, SMEs and industry-relevant research institutions. Denmark’s national AI strategy plans a Digital Hub for public-private partnerships.
Finland’s AI Business programme encourages new AI business ecosystems and investments in Finland. In Hungary, the AI in practice self-service online platform allows developers to showcase technologies and local case studies to foster collaboration and awareness. The United Arab Emirates’ Dubai AI lab – a partnership between different parts of government, IBM and other partners – provides essential tools and go-to-market support to implement AI services and applications in different areas. Portugal has established Digital Innovation Hubs on production technologies, manufacturing and agriculture, as well as collaborative laboratories (CoLabs) (Portugal, 2019[25]). The Czech Republic is developing specific support grants and investment programmes for SMEs, start-ups and spinoffs with innovative services and business models.
Countries are introducing a wide range of policy measures and initiatives to spur innovation and AI adoption by SMEs (OECD, forthcoming[26]). The European Commission’s AI4EU project is an AI-on-demand platform to help EU SMEs adopt AI. Canada has invested CAD 950 million (EUR 608 million) in five regional Innovation Superclusters, one of which focuses on accelerating the application of AI for supply chains (SCALE.AI). Finland’s AI Accelerator, initiated by the Ministry of Economy and Employment with Technology Industries of Finland, spurs AI use in SMEs. In the United Arab Emirates, Dubai Future
282 OECD DIGITAL ECONOMY OUTLOOK 2020 © OECD 2020
11. ARTIFICIAL INTELLIGENCE, BLOCKCHAIN AND QUANTUM COMPUTING 11. ARTIFICIAL INTELLIGENCE, BLOCKCHAIN AND QUANTUM COMPUTING
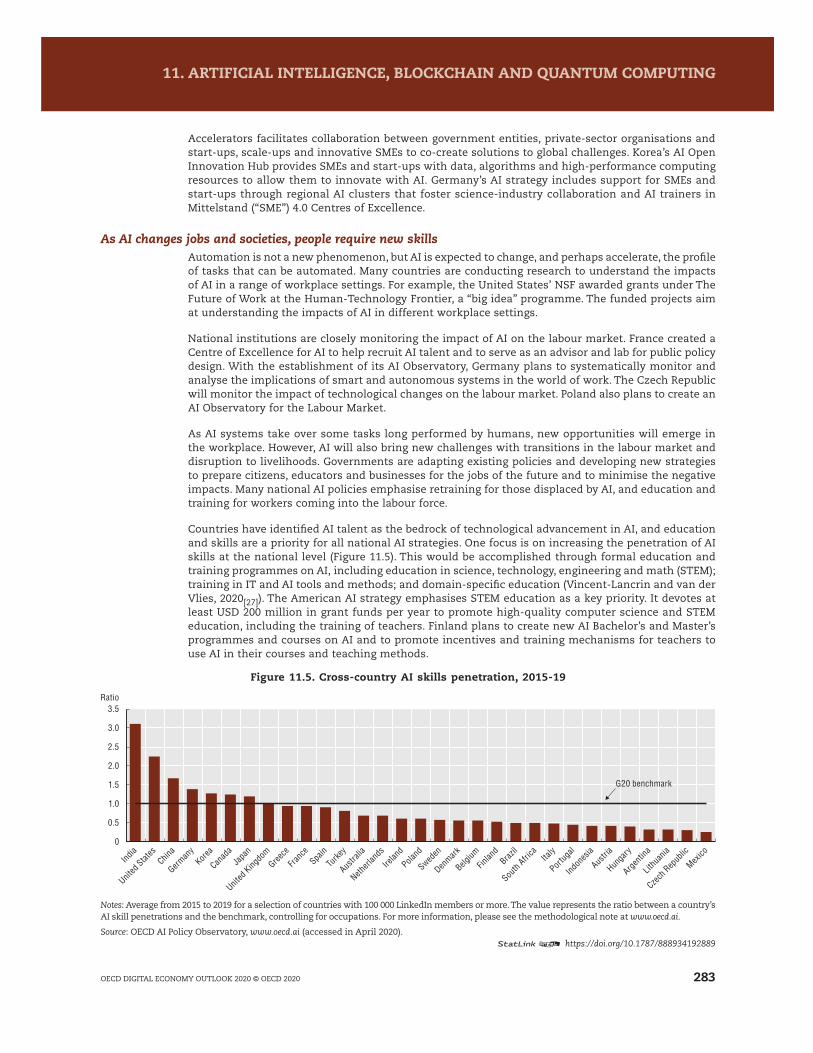
Accelerators facilitates collaboration between government entities, private-sector organisations and start-ups, scale-ups and innovative SMEs to co-create solutions to global challenges. Korea’s AI Open Innovation Hub provides SMEs and start-ups with data, algorithms and high-performance computing resources to allow them to innovate with AI. Germany’s AI strategy includes support for SMEs and start-ups through regional AI clusters that foster science-industry collaboration and AI trainers in Mittelstand (“SME”) 4.0 Centres of Excellence.
As AI changes jobs and societies, people require new skills Automation is not a new phenomenon, but AI is expected to change, and perhaps accelerate, the profile of tasks that can be automated. Many countries are conducting research to understand the impacts of AI in a range of workplace settings. For example, the United States’ NSF awarded grants under The Future of Work at the Human-Technology Frontier, a “big idea” programme. The funded projects aim at understanding the impacts of AI in different workplace settings.
National institutions are closely monitoring the impact of AI on the labour market. France created a Centre of Excellence for AI to help recruit AI talent and to serve as an advisor and lab for public policy design. With the establishment of its AI Observatory, Germany plans to systematically monitor and analyse the implications of smart and autonomous systems in the world of work. The Czech Republic will monitor the impact of technological changes on the labour market. Poland also plans to create an AI Observatory for the Labour Market.
As AI systems take over some tasks long performed by humans, new opportunities will emerge in the workplace. However, AI will also bring new challenges with transitions in the labour market and disruption to livelihoods. Governments are adapting existing policies and developing new strategies to prepare citizens, educators and businesses for the jobs of the future and to minimise the negative impacts. Many national AI policies emphasise retraining for those displaced by AI, and education and training for workers coming into the labour force.
Countries have identified AI talent as the bedrock of technological advancement in AI, and education and skills are a priority for all national AI strategies. One focus is on increasing the penetration of AI skills at the national level (Figure 11.5). This would be accomplished through formal education and training programmes on AI, including education in science, technology, engineering and math (STEM); training in IT and AI tools and methods; and domain-specific education (Vincent-Lancrin and van der Vlies, 2020[27]). The American AI strategy emphasises STEM education as a key priority. It devotes at least USD 200 million in grant funds per year to promote high-quality computer science and STEM education, including the training of teachers. Finland plans to create new AI Bachelor’s and Master’s programmes and courses on AI and to promote incentives and training mechanisms for teachers to use AI in their courses and teaching methods.
Figure 11.5. Cross-country AI skills penetration, 2015-19
0
0.5
1.0
1.5
2.0
2.5
3.0
3.5Ratio
India
United
States
China
German
yKore
a
Canad
aJa
pan
United
Kingdo
mGree
ceFra
nce
Spain
Turke
y
Austra
lia
Netherl
ands
Irelan
d
Poland
Sweden
Denmark
Belgium
Finlan
dBraz
il
South
Africa Ita
ly
Portug
al
Indon
esia
Austria
Hunga
ry
Argentin
a
Lithu
ania
Czech R
epub
lic
Mexico
G20 benchmark
Notes: Average from 2015 to 2019 for a selection of countries with 100 000 LinkedIn members or more. The value represents the ratio between a country’s AI skill penetrations and the benchmark, controlling for occupations. For more information, please see the methodological note at www.oecd.ai.
Source: OECD AI Policy Observatory, www.oecd.ai (accessed in April 2020).12 https://doi.org/10.1787/888934192889
283OECD DIGITAL ECONOMY OUTLOOK 2020 © OECD 2020
11. ARTIFICIAL INTELLIGENCE, BLOCKCHAIN AND QUANTUM COMPUTING 11. ARTIFICIAL INTELLIGENCE, BLOCKCHAIN AND QUANTUM COMPUTING
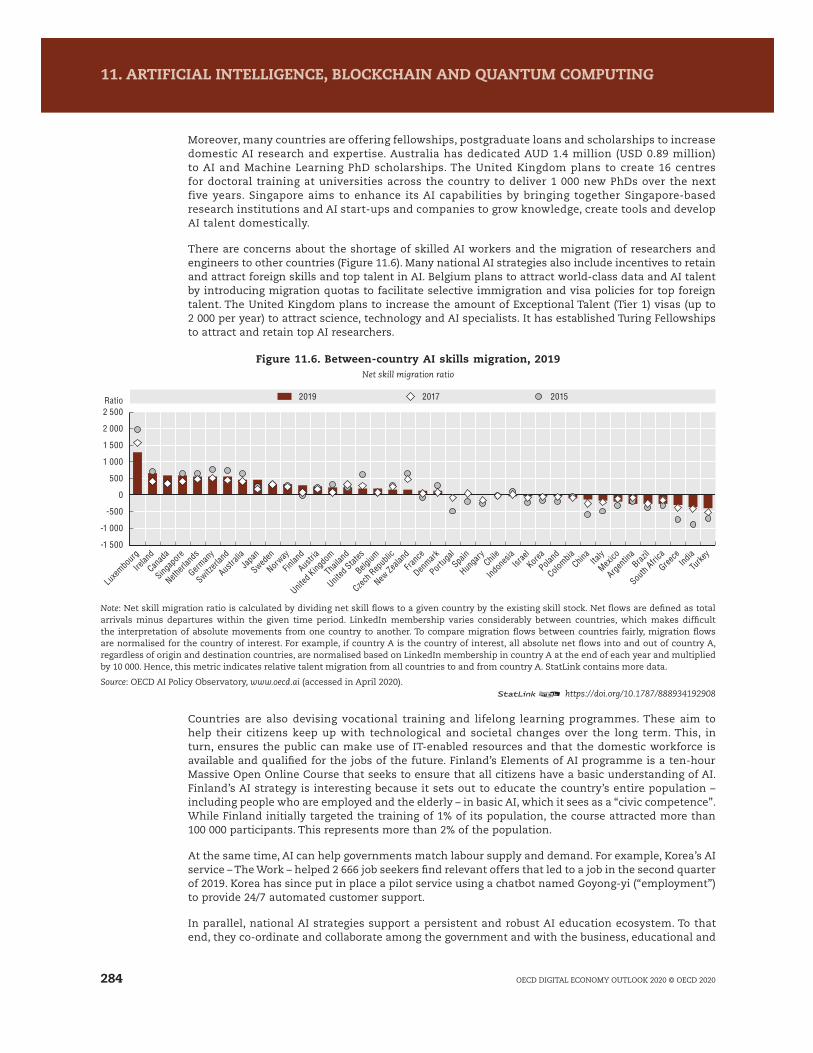
Moreover, many countries are offering fellowships, postgraduate loans and scholarships to increase domestic AI research and expertise. Australia has dedicated AUD 1.4 million (USD 0.89 million) to AI and Machine Learning PhD scholarships. The United Kingdom plans to create 16 centres for doctoral training at universities across the country to deliver 1 000 new PhDs over the next five years. Singapore aims to enhance its AI capabilities by bringing together Singapore-based research institutions and AI start-ups and companies to grow knowledge, create tools and develop AI talent domestically.
There are concerns about the shortage of skilled AI workers and the migration of researchers and engineers to other countries (Figure 11.6). Many national AI strategies also include incentives to retain and attract foreign skills and top talent in AI. Belgium plans to attract world-class data and AI talent by introducing migration quotas to facilitate selective immigration and visa policies for top foreign talent. The United Kingdom plans to increase the amount of Exceptional Talent (Tier 1) visas (up to 2 000 per year) to attract science, technology and AI specialists. It has established Turing Fellowships to attract and retain top AI researchers.
Figure 11.6. Between-country AI skills migration, 2019Net skill migration ratio
-1 500
-1 000
-500
0
500
1 000
1 500
2 000
2 500
2019 20152017Ratio
Luxe
mbourg
Irelan
d
Canad
a
Singap
ore
Netherl
ands
German
y
Switzerl
and
Austra
liaJa
pan
Sweden
Norway
Finlan
d
Austria
United
Kingdo
m
Thail
and
United
States
Belgium
Czech R
epub
lic
New Ze
aland
Franc
e
Denmark
Portug
alSpa
in
Hunga
ryChil
e
Indon
esia
Israe
lKore
a
Poland
Colombia
China
Italy
Mexico
Argenti
naBraz
il
South
Africa
Greece
IndiaTu
rkey
Note: Net skill migration ratio is calculated by dividing net skill flows to a given country by the existing skill stock. Net flows are defined as total arrivals minus departures within the given time period. LinkedIn membership varies considerably between countries, which makes difficult the interpretation of absolute movements from one country to another. To compare migration flows between countries fairly, migration flows are normalised for the country of interest. For example, if country A is the country of interest, all absolute net flows into and out of country A, regardless of origin and destination countries, are normalised based on LinkedIn membership in country A at the end of each year and multiplied by 10 000. Hence, this metric indicates relative talent migration from all countries to and from country A. StatLink contains more data.
Source: OECD AI Policy Observatory, www.oecd.ai (accessed in April 2020).12 https://doi.org/10.1787/888934192908
Countries are also devising vocational training and lifelong learning programmes. These aim to help their citizens keep up with technological and societal changes over the long term. This, in turn, ensures the public can make use of IT-enabled resources and that the domestic workforce is available and qualified for the jobs of the future. Finland’s Elements of AI programme is a ten-hour Massive Open Online Course that seeks to ensure that all citizens have a basic understanding of AI. Finland’s AI strategy is interesting because it sets out to educate the country’s entire population – including people who are employed and the elderly – in basic AI, which it sees as a “civic competence”. While Finland initially targeted the training of 1% of its population, the course attracted more than 100 000 participants. This represents more than 2% of the population.
At the same time, AI can help governments match labour supply and demand. For example, Korea’s AI service – The Work – helped 2 666 job seekers find relevant offers that led to a job in the second quarter of 2019. Korea has since put in place a pilot service using a chatbot named Goyong-yi (“employment”) to provide 24/7 automated customer support.
In parallel, national AI strategies support a persistent and robust AI education ecosystem. To that end, they co-ordinate and collaborate among the government and with the business, educational and
284 OECD DIGITAL ECONOMY OUTLOOK 2020 © OECD 2020
11. ARTIFICIAL INTELLIGENCE, BLOCKCHAIN AND QUANTUM COMPUTING 11. ARTIFICIAL INTELLIGENCE, BLOCKCHAIN AND QUANTUM COMPUTING

non-profit communities in developing educational programmes, tools and technologies. Korea’s Smart Training Education Platform will allow people to take training programmes that combine theory and field experience. Through its learning platform on artificial intelligence (KI-Campus) Germany’s Federal Ministry of Education and Research brings together expertise from science, industry and society. It is a forum for exchange and co-operation on technological, economic and societal challenges regarding the research and application of AI.
International co-operation initiatives are proliferating Cross-border research on AI is significant (Figure 11.7). For example, the French National Research Agency, the German Research Foundation and the Japan Science and Technology Agency have called for trilateral French-German-Japanese collaborative research on AI over three years. Many EU countries are also participating in European AI research projects and networks such as BVDA/EURobotics, the Confederation of Laboratories for Artificial Intelligence Research in Europe (CLAIRE) and the European Laboratory for Learning and Intelligent Systems (ELLIS). AI is also a priority in Horizon Europe, the European Union’s next framework programme for research and innovation.
Figure 11.7. Domestic and international AI research collaboration, 1980-2020
North America East Asia and Pacific Europe South Asia Middle East
Notes: EU27 = the European Union minus the United Kingdom. The thickness of a connection represents the number of joint AI publications between two countries since 1980. “Domestic collaboration” shows co-authorship involving different institutions within the same country. For more information, please see the methodological note at www.oecd.ai. StatLink contains more data.
Source: OECD AI Policy Observatory, www.oecd.ai (accessed in July 2020).12 https://doi.org/10.1787/888934192927
There are numerous international co-operation initiatives at the regional level. For example, the Arab AI Working Group, formed in 2019 by the Arab League members, has four goals. First, it aims to develop a joint framework for capacity building in the Arab region. Second, it raises awareness of the opportunities and challenges of AI. Third, it trains youth to compete in AI jobs. Finally, it works to establish a common Arab Strategy, which includes a regulatory framework for AI and guidance on using AI to serve the goals of Arab countries. Meanwhile, under Egypt’s presidency in 2020, the African Union set up a working group on AI. The working group plans to create a joint capacity-building framework across the continent. This will address skills gaps and prepare African youth for future jobs; identify and initiate AI projects across Africa to serve the Sustainable Development Goals (SDGs); and establish a common AI strategy for Africa.
285OECD DIGITAL ECONOMY OUTLOOK 2020 © OECD 2020
11. ARTIFICIAL INTELLIGENCE, BLOCKCHAIN AND QUANTUM COMPUTING 11. ARTIFICIAL INTELLIGENCE, BLOCKCHAIN AND QUANTUM COMPUTING
International co-operation for AI is also taking place in fora including the OECD, the Group of Seven (G7), the Group of Twenty (G20), the European Union, the Council of Europe and the United Nations Educational Scientific and Cultural Organization (UNESCO).
● OECD countries adopted the OECD AI Principles in May 2019, the first set of intergovernmental principles and recommendations to governments for trustworthy AI. In July 2019, the OECD’s Committee on Digital Economy Policy agreed to form a multidisciplinary and multi-stakeholder OECD Network of Experts on AI (ONE AI) to develop practical guidance for implementing the OECD AI Principles for trustworthy AI. In February 2020, the OECD launched the OECD AI Policy Observatory (OECD.AI),2 a platform to share and shape AI policies (OECD, 2020[28]) that provides data and multidisciplinary analysis on artificial intelligence.
● The Global Partnership on AI (GPAI) is a voluntary multi-stakeholder effort launched in June 2020 to promote responsible AI use that respects human rights and democratic values. The Partnership was conceived by Canada and France during their G7 presidencies and at its launch counted 13 other founding members: Australia, the European Union, Germany, India, Italy, Japan, Korea, Mexico, New Zealand, Singapore, Slovenia, the United Kingdom and the United States. The GPAI brings together experts from industry, government, civil society and academia, to advance to advance cutting-edge research and pilot projects on AI priorities.
● In 2020, the Saudi G20 presidency steered the G20’s AI work towards a policy of Realizing Opportunities of the 21st Century for All (G20, 2019[29]). This work built on the legacy of the Japanese 2019 presidency under which the G20 adopted human-centred AI principles that draw from the OECD AI Principles. AI was part of the 2020 discussions under the G20 Digital Economy Task Force, as well as during an Extraordinary G20 Digital Economy Ministerial Meeting. This latter meeting recognised AI as having potential to contribute to the fight against pandemics (G20, 2020[30]).
● In September 2019, the Committee of Ministers of the Council of Europe (CoE) set up the Ad Hoc Committee on Artificial Intelligence. This committee was examining the feasibility of developing a legal framework for the development, design and application of AI, based on CoE standards on human rights, democracy and rule of law. In April 2020, the same Committee of Ministers issued a set of guidelines calling on governments to take a precautionary approach to development and use of algorithmic systems. It further called for adoption of legislation, policies and practices that fully respect human rights (Council of Europe, 2020[31]).
● In his Roadmap for Digital Cooperation, the United Nations Secretary General called for the establishment of a multi-stakeholder advisory body on global AI co-operation. The body will provide guidance on artificial intelligence that is trustworthy, human rights-based, safe, sustainable, and promotes peace, by bringing together a diverse group of relevant entities in the AI landscape to address issues around inclusion, co-ordination, capacity-building, sharing and promoting best practices, as well as exchanging views on artificial intelligence standardisation and compliance efforts.
● Many other UN institutions are also engaged in initiatives to address AI challenges (ITU, 2019[32]). UNESCO launched a global dialogue on the ethics of AI due to its complexity and impact on society and humanity. In November 2019, UNESCO’s 40th General Conference mandated the organisation to develop a recommendation on the ethics of AI, which will be considered for adoption in November 2021 (UNESCO, 2020[33]).
Blockchain and other distributed ledger technologies Blockchain, and other distributed ledger technologies (DLTs3), offer an alternative way of securing data and transaction records for use by multiple parties without reliance on a trusted, central authority. DLTs allow an immediate and secure digital transfer of value and ownership within a network, in total transparency. Consequently, they could profoundly reshape economic transactions. The technology has all the characteristics of a general-purpose technology, which means it is pervasive, improvable over time and allows complementary innovations (Box 11.2).
DLTs have growing implications. Initially, DLTs emerged as the technology behind cryptocurrencies such as Bitcoin and Ether. Today, DLTs are changing business models and offering new ways to exchange value and trace its creation, with impacts across a wide range of policy areas.
286 OECD DIGITAL ECONOMY OUTLOOK 2020 © OECD 2020
11. ARTIFICIAL INTELLIGENCE, BLOCKCHAIN AND QUANTUM COMPUTING 11. ARTIFICIAL INTELLIGENCE, BLOCKCHAIN AND QUANTUM COMPUTING

Box 11.2. Key features of blockchain
Distributed. In a blockchain, each node independently constructs its own record of transactions. This means, at all times, each node maintains copies of the same ledger. As such, the record is highly secure since, to change the ledger, each version held by the different nodes would need to be changed. In other words, a malicious actor would need to attack all, or at least a majority, of the nodes rather than just one single, centralised record-keeper. In other systems, different parties to a transaction would maintain multiple different records, which would then need to be cross-checked for verification. With blockchain, the ledgers automatically synchronise through a consensus mechanism.
Immutable. Given its use of cryptography, once a transaction is added to blockchain it generally cannot be undone. As such, all users can have confidence in the transaction. Unlike in a centralised database, the record cannot be altered, whether through error or misfeasance.
Source: OECD (2019)[34], “Blockchain at the OECD”, https://www.oecd.org/going-digital/blockchain-at-the-oecd.pdf.
The promise of blockchain adoption brings policy challenges
Asset tokenisation disrupts the financial markets in multiple waysDespite reaching a peak in the technology “hype cycle”, DLT is still in its infancy in terms of both development and adoption (OECD, 2019)[34]. The pace of change is rapid, however. Further, some applications, particularly DLT-based digital financial assets (Box 11.3) already in use. Consequently, policy makers require a clear understanding of the technology and the challenges arising from its adoption (OECD, 2020[22]).
Box 11.3. Digital financial assets
Tokenisation describes the process of transferring rights to a physical or digital asset into a digital representation – or token – on a blockchain. Being in possession of that digital token provides the right to that asset, and the ability to trade and track it digitally. In addition to tokenisation of physical assets, there are three main types of DLT-based digital financial assets:
1. Payment tokens. Intended to operate like traditional, fiat currencies (legal tender backed by the issuing government), payment tokens are usable as a means of exchange for any goods or services, and possibly also as a store of value. Bitcoin is the most well-known example.
2. Security (or asset and financial) tokens. These are designed as tradeable assets held for investment purposes and classified as a security (or equivalent) under applicable laws. BCAP tokens issued by Blockchain Capital are an example. Through investments in the fund, token holders gain exposure to the venture capital market.
3. Utility (or consumer) tokens. Their primary use is to facilitate exchange of, or access to, specific goods or services. They may act as a licence to allow the holder access to a particular service. They can function as a pre-payment or voucher for a good or service (and may be issued even before the relevant good or service is available). Storj, for example, provides access to a peer-to-peer network cloud storage service. Meanwhile, the Brave search engine uses the Basic Attention Token to reward users for their search data.
Source: OECD (2019)[34], “Blockchain at the OECD”, https://www.oecd.org/going-digital/blockchain-at-the-oecd.pdf.
In terms of trading implications, disintermediation enabled by DLTs may affect the traditional market-making function as it removes the need for dealer intermediation. Buyers and sellers in a decentralised market for “tokens” (i.e. a digital representation of the rights to an asset) are matched automatically. The growth of asset tokenisation activity could also have an impact on the repurchasing (repo) activity for the funding of positions. In addition, it could affect securities lending activities used as part of
287OECD DIGITAL ECONOMY OUTLOOK 2020 © OECD 2020
11. ARTIFICIAL INTELLIGENCE, BLOCKCHAIN AND QUANTUM COMPUTING 11. ARTIFICIAL INTELLIGENCE, BLOCKCHAIN AND QUANTUM COMPUTING

trading strategies. The shift of the above activities on to a DLT-based system has the potential for faster and less costly securities lending. Fewer steps are involved in the process and transfer/unwinding of collateral is direct and instantaneous.
Any asset can theoretically be tokenised. Therefore, the number and diversity of assets that would trade in public markets and gain liquidity could increase as per the liquidity implications in a scenario of proliferation of asset tokenisation.
Furthermore, trading in a tokenised environment can benefit from the enhanced transparency provided in DLT-based networks. An advantage of improved transparency is fewer information asymmetries, which could improve the price discovery mechanism. This, in turn, would provide investors with incentives to increase their participation and bring additional liquidity in the market. It would also improve competition conditions in the market.
Traditional post-trade processes have three inefficiencies. First, both sides of the trade need to maintain records of the information around the transaction. Second, the need to maintain this information generates counterparty risks. Finally, it costs money to reconcile each party’s data with the data of the counterparty at each step of the contract execution (Mainelli and Milne, 2016[35]).
The use of blockchain in post-trade addresses these inefficiencies. It allows for the maintenance of a single, shared, immutable ledger of transaction information. This ledger is updated at each step of the process and can be instantly accessed by all involved parties. DLT-enabled systems and the use of smart contracts for clearing and settlement of tokenised assets can verify ownership, confirm trade matching and record transactions in an automated, immutable, transparent and near-immediate way. Therefore, the distributed ledger can act as a decentralised registry of data on transactions, and a counterparty to all transacting parties.
From a policy perspective, tokenised markets should comply with regulatory requirements that promote financial consumer and investor protection, market integrity and competition, and seek to guard against build-up of systemic risks (OECD, 2020[22]). Tokenised assets can be seen as cryptography-enabled, dematerialised securities based on DLT-enabled networks. Instead of electronic book-entries in securities registries of central securities depositories, DLT-enabled networks merely replace one digital technology with another. Therefore, they do not raise issues in jurisdictions with a technology-neutral approach to regulation. Nevertheless, it can sometimes be difficult to be certain whether tokenisation falls within or is fully captured by the regulatory perimeter. This is especially true given the novel nature of some new business models and processes involved in tokenised markets.
The full implications of tokenised assets, tokenisation processes, the markets in which they trade and the processes involved are not understood. For example, it is not clear if they fully comply with the regulatory and supervisory framework covering the corresponding asset markets, particularly for digitally native assets. Given the inherent global nature of decentralised networks enabled by DLTs, such gaps would need to be examined both on a national and cross-jurisdictional basis. In addition, the absence of a central point of accountability due to the decentralised nature of the network may impede regulatory action when such mechanisms are used.
At the same time, market participants may not fully understand tokenised assets that fall within the legal and regulatory perimeters of policy frameworks and regulatory regimes. Regulatory or legal ambiguity around asset tokenisation can create uncertainties and risks for participants in tokenisation markets. This can undermine the smooth functioning of such marketplaces. Further, it could have potential indirect impact on the conventional, off-chain markets (traditional assets and financial management institutes) for such assets. Legal and regulatory ambiguity also slow down the adoption rate of such technologies. Individuals are uncertain of the conditions under which they can participate in such markets and/or engage investors.
Greater clarity around the regulatory and supervisory frameworks applied to tokenised assets and markets is a stepping stone to their safe development and use. Existing regulation may need to apply to new actors. For example, a trusted third party could guarantee the accuracy of information at the onboarding of the asset on to the DLT system (“on-chain”) and safeguard the asset. In addition, new
288 OECD DIGITAL ECONOMY OUTLOOK 2020 © OECD 2020
11. ARTIFICIAL INTELLIGENCE, BLOCKCHAIN AND QUANTUM COMPUTING 11. ARTIFICIAL INTELLIGENCE, BLOCKCHAIN AND QUANTUM COMPUTING

requirements may be needed. These might cover interoperability between DLTs, or the interaction or gateways linking the on-chain and off-chain environments. New risks may arise for the application of DLT technologies related to operations or digital identities. These will need to be appropriately supervised. Different institutions regulate and supervise virtual assets at the national level. They need a co-ordinated approach to cover all facets of such activity. These range from payments, investments, taxes and accounting to compliance with anti-money laundering and combating the financing of terrorism policies, law enforcement and other crime prevention (OECD, 2020[22]).
Other policy implications of tokenised assets relate to international co-operation to limit regulatory arbitrage. They also relate to the smooth operation of cross-border transactions, financial consumer protection, market integrity and financial education for the protection of investors in tokenised markets.
Access to finance for SMEsDLTs bring new alternatives for SMEs to access finance. SMEs are the backbone of most economies, accounting for nearly 99% of all firms in OECD countries. Young innovative firms are crucial for economic growth and job creation. This is especially the case during post-crisis recovery periods such as the one that will follow the COVID-19 pandemic. However, SMEs often lack collateral or a business track record so they can encounter obstacles when seeking finance. Not all start-ups require (or deserve) external capital. However, they often encounter difficulties in obtaining seed and early stage financing because of uncertain profit expectations and riskier growth perspectives.
The use of initial coin offerings (ICOs) for financing SMEs gained interest recently. An ICO is the cryptocurrency industry’s equivalent to an initial public offering. A company looking to raise money to create a new coin, app or service launches an ICO. Interested investors can buy into the offering and receive a new cryptocurrency token issued by the company. This token may have some value in using the company’s product or service, or it may just represent a stake in the company or project.
ICOs facilitate the exchange of value without the need for a trusted central authority or intermediary (government, bank), which enhances efficiency. The disintermediation that occurs in ICOs could “democratise” SME financing, distributing control among SMEs and participants/token-holders. This would be in contrast to concentrating decision power in the hands of financiers, as is the case with banks in traditional debt financing. At the same time, SMEs diversify their financing options. This allows them to base their appeal on both profit potential and other characteristics of their project. This, in turn, could encourage banks to seek alternative ways to determine their SME financing methods (OECD, 2019[36]).
ICOs offer an innovative way to raise capital for young and innovative SMEs, enabled by DLTs. Under specific caveats, regulated forms of ICOs could become an alternative financing mechanism for young SMEs with DLT-related projects. On the one hand, they could improve competition in the SME financing space. On the other, they could facilitate faster financing of SMEs at a lower cost compared to most traditional financing mechanisms. In this way, they would benefit from cost efficiencies derived from automation and disintermediation through the use of DLTs and the blockchain.
The ICO “hype” in the second half of 2017 and first half of 2018 was followed by a decline. This opened the field for security token offering (STOs); simple agreements for future tokens (SAFTs) that refer to agreements for the future transfer of tokens from cryptocurrency developers to investors; and normal equity rounds (Bianchini and Kwon, 2020[37]).
Various factors contribute to the increasingly scarce use of this instrument. Many projects were not able to deliver on the promises of their white paper. The technology was still not at the necessary level of maturity. At the same time, regulations caught up, clarifying the necessary compliance for different type of tokens and initiatives. Institutional investors may not have opened large positions in the crypto-assets space.
Stakeholders such as venture capitalist and hedge funds have started using different means to secure early access to promising blockchain projects. SAFTs, for example, ensure conversion of the investors’ assets in tokens once the company issues them. Another example are STOs, a regulated version of ICOs in which the issue of tokens is considered a security event that falls under traditional security regulations and taxation rules.
289OECD DIGITAL ECONOMY OUTLOOK 2020 © OECD 2020
11. ARTIFICIAL INTELLIGENCE, BLOCKCHAIN AND QUANTUM COMPUTING 11. ARTIFICIAL INTELLIGENCE, BLOCKCHAIN AND QUANTUM COMPUTING
Together with usual equity rounds, financing of innovative start-ups in the blockchain space is going back to the more traditional start-ups investment patterns. In this scenario, early access is open only to professional investors. This calls for particular attention by policy makers.
Traceability in supply chains Blockchain applications are also garnering wide interest beyond the financial sector. The properties of decentralisation and immutability of data stored on the blockchain make the technology suitable for use in industrial processes where transparency and traceability is crucial. For example, a number of blockchain platforms are being developed to facilitate supply-chain tracing of products ranging from diamonds to cheese. Detailed information of products are stored on blockchain throughout their journey, while leveraging complementary technologies such as the IoT. Data stored on the blockchain typically refer to sourcing and treatment of material, as well as logistics. Such systems enable businesses to see their supply chain better, and also provide more transparency to the end-consumers on the products they choose. The use of blockchain also makes it easier to verify authenticity of the products through the scanning of QR code or radio frequency identification. This, in turn, helps fight counterfeiting and violations of intellectual property. The verification function of blockchain could also promote sustainability, where the information regarding products’ compliance to labour or environmental standards within supply chains can be verified.
Better integrated transport servicesAs in several sectors of the economy, digital transformation continues to reshape the transport industry, supporting a system based on deeper co-ordination of urban mobility services. DLTs have the potential to support broader co-ordination of seamless urban mobility services and the delivery of Mobility as a Service (MaaS) in urban settings (ITF, 2018[38]). Like other sectors, transport could be profoundly transformed by blockchain, and other novel DLTs that allow decentralised applications to run in peer-to-peer networks. These technologies allow agents to enter into direct relationships with each other. Agents adhere to a common set of rules and a high degree of trust without passing through a central authority. Combining a common language and syntax for the “Internet of mobility” and new means of deriving insight from previously siloed data opens up new possibilities for applications. Specifically, they may help redefine how people access, pay for and use transport in their everyday lives.
Although deployment of DLTs is only starting to support MaaS, DLT adoption in the transport sector can be highly relevant for several issues. These include the management of secure identity (of users, operators and service providers) and access management (linked to payment data, certificate or licence information). It also includes authentication, asset identification (available capacity, location, vehicle condition and type, state of repair, etc.) and efficient and secure distribution of information in the MaaS ecosystem.
To maximise the benefits of such a new model, the regulatory framework also needs to evolve. Traditional regulatory approaches focus on transport operators and modes in isolation. These approaches are increasingly out of step with recent market offers and how many people make travel decisions. Public authorities need to adapt their regulatory framework to this emerging and interconnected “mesh-y” urban mobility ecosystem. Legislation has to set the framework for interoperable MaaS but standardisation bodies must still address technical details. The process for setting these standards must be inclusive, transparent and technically thorough. Governments are also called to:
● account for changes in data science and technology when developing MaaS
● look beyond initial cryptocurrency applications of DLTs
● help deploy the building blocks that enable wider uptake of distributed ledgers
● apply blockchain technology now for slow and relatively small transport use cases
● anticipate next-generation DLTs for “big and fast” applications to be deployed later
● develop algorithmic code-based regulation to accompany the uptake of DLTs.
Improved efficiency in the public sectorThe use of DLTs in the public sector brings new opportunities for government services. There are around 50 jurisdictions worldwide launching more than 200 DLT-based initiatives (Berryhill, Bourgery and Hanson, 2018[39]). Some of the most common use cases include identity (e.g. credentials or licences),
290 OECD DIGITAL ECONOMY OUTLOOK 2020 © OECD 2020
11. ARTIFICIAL INTELLIGENCE, BLOCKCHAIN AND QUANTUM COMPUTING 11. ARTIFICIAL INTELLIGENCE, BLOCKCHAIN AND QUANTUM COMPUTING

personal records (e.g. health, insurance or financial), land title registries and asset inventory. The public sector can further benefit from the adoption of DLTs in a number of areas. These include supply-chain management, asset tracking and inventorying of goods (e.g. food, medicines or natural resources); management of social benefits, entitlements and aid; management of utilities through smart energy grids; copyrights management; voting; and mitigating and identifying fraud.
Blockchain technology could allow the public service to improve effectiveness, reduce friction between agencies, reduce bureaucratic barriers, better share knowledge and foster automation through smart contracts. However, it also poses challenges to public administrations. Its limitations may render the technology unsuitable for certain uses. The most common challenge relates to data protection, governance and confidentiality of information. Coding constraints and governance decisions also add to the complexity. Finally, the formats of some blockchains have inherent limitations. These include the high levels of energy required to power certain systems, and in some cases the slow pace of transaction processes. Policy makers need to consider these challenges and limitations as DLTs continue to expand in the public sector.
Towards low-carbon infrastructure modelsCarbon neutrality is not the most common factor of individuals’ perception of blockchain technologies. Bitcoin, blockchain’s first application, is widely known as an environmental polluter. It consumes massive amounts of energy and emits vast amounts of CO2 to validate transactions and sustain the network.
However, concerns of this nature hold true only for certain specific mechanisms in the underlying technology. Depending on network architecture and choice of protocols, blockchain can be deployed in more energy-efficient ways. For example, private blockchains using consensus algorithms like proof-of-authority, when set up properly, do not consume more energy than traditional database solutions. From this perspective, the core competencies of blockchain technology – transparency, data auditability, privacy, value transfer, and process efficiency and automation – can potentially drive the systemic changes needed to deliver sustainable infrastructure (OECD, 2019[40]).
Blockchain technology can unlock new sources of financing and mobilise industry pledges to carbon reduction through new financing platforms. The technology can also bring visibility to alignment with sustainability goals by enabling countries and stakeholders to track data and information on infrastructure projects. Blockchain-enabled platforms are a way to standardise data, assess asset performance and enhance compliance (such as to sustainability or to standards for economic, social and corporate governance). These may be further augmented when integrated with remote sensors (IoT) or linked to deep analytics such as AI applications. Finally, blockchain and DLTs can enhance awareness and access by acting as a transaction-enabling infrastructure of new market models. This can incentivise and increase the willingness and ability of institutions and consumers to help build long-term sustainability, while driving changes within industries to adapt to shifting consumer demand.
To promote this new model, policy makers need to promote an openly accessible, standardised “toolbox” and education materials on blockchain. To that end, they need to facilitate further R&D in the field. They also need to clarify regulatory treatment, particularly in the realm of securities law, tax law, the legal recognition of data stemming from blockchain databases, data privacy and consumer protection. Finally, they need to foster both knowledge transfer to developing economies to generate buy-in from related stakeholders and international collaboration and knowledge sharing more generally (OECD, 2019[40]).
Adaptation of national blockchain strategies across countries calls for a globally coherent approach to DLT innovation and adoption
Governments have evidenced a growing interest in how DLTs are transforming their economies and societies, as well as their use as a tool to deliver policy objectives. A number of countries, both OECD counties and partner economies alike, have already issued overarching blockchain strategies, including Australia, China, Germany, India and Switzerland. Others, including France and Italy, are developing such strategies.
291OECD DIGITAL ECONOMY OUTLOOK 2020 © OECD 2020
11. ARTIFICIAL INTELLIGENCE, BLOCKCHAIN AND QUANTUM COMPUTING 11. ARTIFICIAL INTELLIGENCE, BLOCKCHAIN AND QUANTUM COMPUTING

Australia released its National Blockchain Roadmap in February 2020 (Department of Industry, Science, Energy and Resources, 2020[41]). It details how the country plans to realise the (potential future) benefits of blockchain technology. The National Blockchain Roadmap Steering Committee, which includes Australian regulators, will oversee the roadmap.
The roadmap identifies three areas foundational for success with blockchain:
● effective, efficient and appropriate regulation and standards
● skills and capabilities that can drive innovation
● strong international investment and collaboration.
It details the status quo, suggests measures and policies under each area, and provides examples of how the government is using the technology. For instance, the Australian Border Force created the Inter-Government Ledger to enable electronic sharing of import/export documentation internationally. This helps border and customs officials verify the contents of shipments more quickly and to facilitate trade flows (Department of Industry, Science, Energy and Resources, 2020, p. 28[41]).
The Australian roadmap also includes a number of sectoral case studies that demonstrate applications of the technology. It also highlights how the case studies help meet policy requirements. They consider areas such as wine exports; issuance and management of education credentials; and sharing of Know Your Customer information among financial institutions.
Germany released its Blockchain Strategy of the Federal Government in September 2019 (BMWi and BMF, 2019[42]). The strategy identifies blockchain as a tool for the digital transformation and sovereignty of both Germany and the European Union. It aims to become a hub for blockchain development and financing, highlighting the roles of all members of society in its execution (BMWi and BMF, 2019[42]). The German strategy has five pillars, under which 44 measures are to be launched by 2022 with the following aims:
● Secure stability and promote innovations: adopt blockchain in the financial sector.
● Bring innovations to maturity: advance projects and regulatory sandboxes.
● Make investments possible: develop clear, reliable framework conditions.
● Apply technology: digitise public administration services.
● Distribute information: share knowledge, network and co-operate.
Germany aims to use the opportunities in blockchain technology and mobilise areas of potential for digital transformation. It will maintain and grow its young, innovative blockchain ecosystem to make the country an attractive base for development of blockchain applications and for investments in scaling them up. Germany also aims to create a regulatory framework directed at investment and growth, one that enables market processes to work without state interventions and safeguards the sustainability principle. Where blockchain applications can make solutions more user-friendly for individuals and companies, public administration will be the lead application user in individual cases; as a precondition, this should not adversely affect trust in safe, reliable action.
Switzerland released a report – Legal Framework for Distributed Ledger Technology and Blockchain in Switzerland – in December 2018 (The Federal Council, Swiss Government, 2018[43]). Focusing on the financial sector, the Swiss DLT Report describes legal and regulatory frameworks, and outlines a plan to amend them. Among other actions, it proposes to build on the country’s status as a hub for FinTech, blockchain and DLT. It also explores the operation and (potential) amendment of civil and insolvency laws, financial market laws and laws combating financial crimes.
This focus is in keeping with the government’s efforts to exploit the benefits offered by digitalisation more broadly and make the economy more competitive. The report is guided by the need for relevant frameworks to encourage innovation through market forces. These frameworks should also be based on principles, be technology- and competition-neutral, provide legal certainty and be efficient in their operation.
Switzerland also intends regulatory agencies to be highly receptive to emerging technologies like blockchain and develop close relations with the blockchain sector. In line with the Swiss DLT Report,
292 OECD DIGITAL ECONOMY OUTLOOK 2020 © OECD 2020
11. ARTIFICIAL INTELLIGENCE, BLOCKCHAIN AND QUANTUM COMPUTING 11. ARTIFICIAL INTELLIGENCE, BLOCKCHAIN AND QUANTUM COMPUTING
the Federal Council submitted a proposal to the Swiss parliament in November 2019 to amend banking, corporate and financial infrastructure laws. This move aims to ensure that frameworks can better accommodate blockchain-based systems and assets (The Federal Council, Swiss Government, 2019[44]).
India released Part 1 of Blockchain: The India Strategy in January 2020 (NITI Aayog, Indian Government, 2020[45]). The strategy points to the transformative role of blockchain to deliver public services more efficiently and make it easier to do business. It also highlights how India can deploy blockchain on its digital infrastructure and contains recommendations – which Part 2 of the strategy will describe in more detail – targeted at building India’s blockchain ecosystem. The recommendations include creating a “national infrastructure” for blockchain deployment, making India a blockchain research, development and skills hub, and using blockchain in government procurement (NITI Aayog, Indian Government, 2020, p. 52[45]).
The strategy details certain use cases such as land titles management, pharmaceutical supply-chain management, credentialing in the higher education sector and energy trading. In addition, it provides a schema to help identify further use cases for which blockchain would be suitable. In this regard, it states that blockchain is not a catch-all solution for every problem, and devotes a section to “Challenges in blockchain implementation” (NITI Aayog, Indian Government, 2020, p. 26[45]).
In recent years, the Chinese government has also recognised, and worked towards the country’s realisation of, the benefits of blockchain. For example, in 2016, it released the White Paper on China’s Blockchain Technology and Application Development. It has also included blockchain in the 13th Five-Year National Informatization Plan (Zhao and He, 2020[46]).
In October 2019, President Xi Jinping reinforced the importance of blockchain for China. He stressed the importance of blockchain as a driver of innovation and economic growth, and called for greater investment in, and development of, blockchain applications. The white paper identified building of skills and competencies in blockchain as key, as well as integration of blockchain into the economy with other emerging technologies. Xi emphasised that legal and regulatory frameworks should be conducive to blockchain development and governance embedded into blockchains to prevent misuse (Xinhuanet, 2019[47]).
China has taken additional steps to bolster its blockchain ecosystem. The National Development and Reform Commission announced in April 2020 that blockchain will, among other technologies, soon underpin Chinese information technology systems (Baker, 2020[48]). China launched its Blockchain Services Network – an infrastructure that enables the cheaper, easier development of blockchain applications – for enterprise use around the world (Musharraf, 2020[49]). Further, the Chinese central bank is poised to launch the nation’s central bank digital currency, the DC/EP (Zhao and He, 2020[46]; Ledger Insights, 2020[50]).
Several other countries have dedicated regulatory frameworks for blockchain and DLTs under broader national digital strategies (e.g. Mexico, Russian Federation). Estonia identified blockchain as a key enabling technology to implement a national e-Estonia vision outlined in Digital Agenda for Estonia 2020.
At the European level, the EU National Blockchain Strategy was released in September 2019 as part of the EU Digital Strategy and the Digital Single Market. The strategy has five pillars:
● joined-up political vision
● public-private partnerships
● connection of global expertise
● investment in innovation and start-ups
● promotion and enabling of a Digital Single Market framework, interoperable standards and skills development.
Policy makers and regulators need to stay abreast of, and responsive to, the implications of this emerging technological area. On the one hand, it may imply higher productivity, fostering trust and confidence in institutions, and creating highly skilled jobs. On the other, it could enable highly distributed and completely decentralised governance and ease of operation across borders. Further, it may pose
293OECD DIGITAL ECONOMY OUTLOOK 2020 © OECD 2020
11. ARTIFICIAL INTELLIGENCE, BLOCKCHAIN AND QUANTUM COMPUTING 11. ARTIFICIAL INTELLIGENCE, BLOCKCHAIN AND QUANTUM COMPUTING

important challenges to traditional policy and regulatory frameworks, and governments’ ability to control risks for end-users and provide certainty. Providing a timely, global response to these challenges is key. Lack of regulatory certainty was already identified as one of the leading impediments to greater blockchain innovation and mainstream adoption, while lack of global coherency opens opportunities for regulatory arbitrage.
In 2018, driven by this growing international interest and the OECD’s own research and analysis from the perspective of government, OECD countries agreed to establish the Global Blockchain Policy Centre. The centre aims to support governments to better understand this technology; address the challenges raised by DLTs and their applications; and seize opportunities to achieve policy objectives and deliver more effective government services.
Quantum computing
The theory of quantum mechanics opens a door to new technologiesThe theory of quantum mechanics is fundamentally different from the laws of nature commonly accepted as inarguable truths. It has peculiar features and nuances, such as the theories of superposition and non-locality. This is often explained in lay terms as particles being “in different places at the same time”.
Initially founded in quantum mechanical theories, the notion of a quantum computer arose from the idea that humanity could use these more complex laws of nature to develop technology that could solve problems beyond the capacity of “normal” or “classical” computers.
Quantum mechanics opens a door to a range of new technologies for different purposes. One such purpose is “sensing”, the field that uses quantum systems for high precision measurements of magnetic fields, electrical fields, gravity and temperature. Other potential targets are quantum timekeeping, global positioning, signal processing, cryptography and solutions to computational problems. This section will focus on the latter (Box 11.4).
Quantum computers provide an advantage for specific computational tasksAccording to scientific consensus, a (universal) quantum computer should be programmable to perform any computational task allowed by the laws of physics. This notion can be best understood by comparing a classical computer to a calculator. A classical computer can be programmed to perform any desired task, while a calculator can only perform limited predefined calculations. The news media define a quantum computer more broadly to include machines that only perform a set of predetermined tasks. In one example of such a machine, the Canadian company D-Wave Systems commercialised the quantum annealer. This section will use the term quantum computer widely to refer to any form of quantum technology designed to perform computational tasks.
Box 11.4. Qubits
The unit for data storage in a quantum computer is called a qubit. This is an extension of the bit, which is the unit for data storage of a classical computer. A qubit can take the two binary values 0 and 1, as well as a range of values in between, through the quantum mechanical phenomenon of superposition.
To solve computational problems that are of interest, a quantum computer needs a minimum number of qubits. This number depends on the complexity of the problem and the efficiency of the algorithm.
To achieve impact, a quantum computer needs sufficient computational power (Box 11.5). Current quantum computers serve as a proof-of-concept that the technology can be built. However, they lack the power to offer an advantage over classical computers for any real-world application. Furthermore, errors occur frequently. This is referred to as “noise” in the computation. To distinguish the current small-scale quantum computers from ideal quantum computers, the latter will be labelled as “large-scale fault-tolerant quantum computers”.
294 OECD DIGITAL ECONOMY OUTLOOK 2020 © OECD 2020
11. ARTIFICIAL INTELLIGENCE, BLOCKCHAIN AND QUANTUM COMPUTING 11. ARTIFICIAL INTELLIGENCE, BLOCKCHAIN AND QUANTUM COMPUTING

Unlike some popular science reports might suggest, a quantum computer is not a magic machine that provides additional computational power. It is faster than classical computers only at performing specific tasks. As a result, it has the potential to address certain computational problems, which are intractable on the most powerful supercomputer, and any future classical computer. For other tasks, discussed below, it could provide a significant speed-up.
Quantum computers are not the answer to all computational problems. Some tasks have good solutions on neither a classical nor a quantum computer. This class of problems is called “NP-hard” problems.
An example of such tasks is the famous travelling salesman problem. One solution would be to find the shortest possible route that visits each of a number of selected cities and ends at the city of origin. One could check the length of every possible route, but this takes too long as the list grows broader and broader. As the theory suggests, quantum algorithms that tackle this problem have only a small computational benefit over classical ones (Moylett, Linden and Montanaro, 2017[51]).
Other tasks that are simple on a classical computer, such as copying a piece of data, are complex and difficult on quantum computers. Therefore, quantum computers are unlikely to become machines that consumers will buy individually; instead, they will be used in combination with classical computers and purchased by governments and corporations to perform those tasks for which they offer a competitive advantage.
Box 11.5. Computational power
Most applications need a high number of qubits that operate together in a controlled way. This is a huge technological challenge. A qubit needs to be isolated from any outside interference to maintain its quantum features. The more qubits need to operate together, the harder this task becomes. Failing to achieve sufficient isolation or control, results in errors in the computation, also referred to as “noise”.
If individual qubits are sufficiently accurate, there are various techniques to detect and correct errors. These error correction codes use up some of the available qubits, causing fewer qubits to be available for the actual computation. The power of a quantum device therefore depends on the combination of the number of qubits and their reliability. This determines the amount of “fault-tolerant” or “logical” qubits: the qubits available for computation after the error correction. A quantum computer with error rate of 0.1% per computational step requires about 15 000 physical qubits to obtain one fault-tolerant qubit (National Academies of Sciences, Engineering, and Medicine, 2019[52]).
Hundreds to thousands of qubits are required to run interesting quantum algorithms. To run the same algorithm without errors, even more qubits are needed to account for the error correction.
Quantum computers promise both economic gains and political disruptionThe development of quantum computers is expected to have a substantial effect both socially and economically throughout the world. A report by the Boston Consulting Group predicts productivity gains by end-users of quantum computing to surpass USD 450 billion annually, reaching USD 850 billion in 2050. These predicted gains include both cost savings and revenue opportunities. They assume that significant technological hurdles can be overcome, and that power and reliability of quantum processors will continue to increase. In the short term (2020-24), they anticipate gains between USD 2 billion and USD 5 billion (Langione et al., 2019[53]).
Long-term benefits are expected in multiple industries, beginning with the financial sector. Big gains are also expected in industries that rely on material design, such as chemical and pharmaceutical companies. Additionally, major disruptions are expected in the area of (cyber) security and defence.
Quantum computers are expected to accelerate chemical research, leading to advancements in commercial areas such as agriculture, drug development and energy, as well as auto and airplane manufactures (Box 11.6).
295OECD DIGITAL ECONOMY OUTLOOK 2020 © OECD 2020
11. ARTIFICIAL INTELLIGENCE, BLOCKCHAIN AND QUANTUM COMPUTING 11. ARTIFICIAL INTELLIGENCE, BLOCKCHAIN AND QUANTUM COMPUTING

Understanding and predicting the behaviour of substances on the atomic level is essential for the design of new materials and chemical compounds. Chemical experiments are often expensive and sometimes dangerous. Effective computer simulation of chemical processes would allow researchers to test high numbers of potential methods in a short period at low cost. This would allow researchers to focus on the most promising approaches.
Such physical and chemical simulations have been proven impossible on classical computers on cases involving roughly more than a hundred atoms. Quantum computers are naturally better suited for this task due to their quantum mechanical nature. In recent years, effective quantum methods for physical and chemical simulation have been discovered (Hamiltonian simulation). This could solve some of the most challenging problems in theoretical chemistry and physics, including the elucidation of various complex reaction mechanisms. Deploying quantum computers for physics and chemistry simulation would lead to large economical gains. These gains are achieved through cost savings due to more efficient R&D and manufacturing, as well as higher revenue from superior products.
Before physics and chemistry can be simulated on a quantum computer, further development of quantum hardware is needed. This is still on the horizon as it requires large-scale, fault-tolerant quantum computers. For specific tasks, the algorithms may be improved so that they can be run on near-term quantum computers. This is the case for certain materials, where some interactions between electrons can be ignored or easily approximated.
Quantum computing remains at an early stage for many sectorsQuantum computing holds promise for many sectors, including agriculture, energy and health care, but further research is needed.
In agriculture, access to fertilisers is essential for producing enough food for a growing population. Nearly all fertilisers are made out of ammonia, which requires high heat and pressure to produce. More efficient production of ammonia (or a substitute) would make fertilisers cheaper and could save energy. Little progress has been made because the number of possible catalyst combinations to do so is infinite. While quantum computing could lead to new discoveries, algorithms for this task have not been developed yet.
Improving the capacity, cost, size and charging speed of batteries is essential for renewable energy to replace fossil fuels. Batteries are needed to store solar and wind energy and to power electric cars. Many battery materials pose environmental and humanitarian risks. Various simulation algorithms for small molecules have been developed and tested on quantum computers as a proof-of-concept. However, results simply replicate those achieved on a classical computer. IBM and Daimler, as well as Mitsubishi Chemical and various start-ups, are conducting research in this area.
Efficient molecular simulation could increase our understanding of the interactions and effects of drugs on a range of diseases. In future, this could consider each person’s unique genetic composition, potentially leading to more personalised medicine. As genes are unique, this process is not suitable for traditional medical experiments. In the longer term, quantum computing could provide the answer.
Many other sectors would benefit from enhancement of the materials used, such as transport, aerospace, (renewable) energy, consumer goods and packaging. The design of new materials requires understanding of their structure at the atomic level. Simulation of these materials by quantum computers allows researchers to test various possibilities before building them in the lab. This makes progress cheaper and faster. Interest in quantum computers in these sectors is slower than in the chemical and pharmaceutical industry. However, Airbus has invested in quantum software and hardware, and a handful of start-ups is dedicated to relevant industry-specific software.
Major reforms are needed to protect national and cybersecurity from quantum computersSuccessful development of powerful quantum computers will break widely used encryption protocols for data authenticity and security. It requires large-scale reform to ensure national and cybersecurity throughout the world.
Once they are powerful enough, quantum computers can be used to break Rivest-Shamir-Adleman (RSA) cryptography and other encryption methods. RSA cryptography is based on finding prime factors
296 OECD DIGITAL ECONOMY OUTLOOK 2020 © OECD 2020
11. ARTIFICIAL INTELLIGENCE, BLOCKCHAIN AND QUANTUM COMPUTING 11. ARTIFICIAL INTELLIGENCE, BLOCKCHAIN AND QUANTUM COMPUTING
of large numbers, which is hard to do on a classical computer. In the mid-1990s, Peter Shor designed a quantum algorithm that can perform prime factorisation efficiently (Shor, 1994[54]). Using this algorithm can break RSA cryptography and other popular methods of cryptography. Other encryption protocols are believed to be relatively secure against attacks by a quantum computer. In recent years, much interest exists in such “post-quantum” cryptography methods.
Quantum computers powerful enough to run Shor’s algorithm are still far away. Many encryption protocols use numbers with 1 024 to 2 048 bits. According to experts (National Academies of Sciences, Engineering, and Medicine, 2019[52]), it will take at least a decade to break protocols based on 2 048 bits.
Various other quantum technologies could play a key role in defence, such as quantum radars. A quantum radar is an emerging technology to detect objects such as stealth aircraft despite background noise. It is robust against radio frequency signals emitted to saturate the radar with noise or false information. The United States, Canada and China have explored quantum radars.
Quantum mechanics gives rise to a new form of encryption which is, in theory, unbreakable. This contrasts with classical encryption methods, which rely on mathematical problems that can be solved, but are too hard to solve within a reasonable time.
Quantum encryption methods use the quantum mechanical phenomenon of “entanglement” between particles to establish a shared “random secret key” between two distant parties. This key, known only to them, is used to encrypt and decrypt messages.
Financial institutions, telecom companies and governments have developed quantum encryption devices for data centres. While the mathematical protocol for encryption is unbreakable, the underlying technology may still be vulnerable to attacks. The first prototype of quantum encryption was developed in 1984 but could be hacked by interpreting the sounds made by the power supplies to control the different settings. As explained by one of its inventors, Gilles Brassard: “So, we could literally hear the photons as they flew, and zeroes and ones made different noises. Thus, our prototype was unconditionally secure against any eavesdropper who happened to be deaf!” (Brassard, 2005[55]). Technology has developed since, making it harder for hackers, but this illustrates the vulnerability of implementing advanced technology in the real world. Ensuring the security of encryption methods and trying to break them is ongoing.
Box 11.6. Analogue and gate-based quantum computers
There are two types of universal quantum computers. Analogue quantum computers include quantum annealers, adiabatic quantum computers and direct quantum simulation. They perform computations by manipulating quantum systems without breaking these up into primitive operations. For their part, gate-based quantum computers break down the computation into a number of primitive operations that can be performed; such computers are analogous to classical computers.
There are two drawbacks to analogue quantum computers. First, the theoretical analysis of the computation speed turns out to be challenging for certain analogue algorithms. As a result, the actual benefit is still unknown. Second, it is not well understood how to guard analogue quantum computers from errors that naturally occur in any real-life set-up.
In addition to general-purpose quantum computers, there are dedicated analogue machines, such as quantum annealers. These are built to solve specific problems, like the simulation of certain chemical processes. Such hardware can be much simpler, but the application and the simulator need to be co-designed.
Quantum computing could increase efficiency of data analysis, forecasting and machine learning Machine-learning algorithms handle large amounts of data and require a lot of computational power. Therefore, certain tasks may take days, if not weeks or months, to complete. Quantum computers are more efficient at particular subroutines that often occur in machine-learning algorithms (e.g. data
297OECD DIGITAL ECONOMY OUTLOOK 2020 © OECD 2020
11. ARTIFICIAL INTELLIGENCE, BLOCKCHAIN AND QUANTUM COMPUTING 11. ARTIFICIAL INTELLIGENCE, BLOCKCHAIN AND QUANTUM COMPUTING
classification, regression and principal component analysis). It is therefore believed they will accelerate the field of machine learning in the future.
An example of a quantum application for machine learning is a “recommendation” algorithm that recommends products to an Internet user, based on the preference of other users with similar preferences or online behaviour (Kerenidis and Prakash, 2016[56]). Another application is image recognition, which would allow computers to recognise handwritten symbols, for example (Kerenidis and Luongo, 2018[57]). This has been implemented successfully for a small set of input data on a quantum computer (Li et al., 2015[58]).
There is no indisputable scientific evidence (yet) of quantum machine-learning algorithms that are superior to classical algorithms for real-life purposes. Quantum algorithms improve subroutines, but some benefits are lost for two reasons. First, encoding input data into the quantum computer is inefficient. Second, extracting information from the quantum algorithm is difficult. It is unknown if some algorithms, including those mentioned above, are more efficient than any known classical alternative.
Improvement of such algorithms may accelerate due to developments in quantum software that make the design of quantum code more intuitive. The software company Xanadu has developed a platform for the programming language Python for hybrid quantum-classical computations. This platform makes quantum computing accessible to programmers and allows them to combine machine-learning and quantum algorithms in the same program.
Quantum computers could help solve difficult problems through optimisationOptimisation is the task to find the best solution among a set of possible solutions. This type of problem is found in various industries – from manufacturing and logistics to financial services. Quantum computers may be better at optimisation problems with a large input set.
Volkswagen launched a pilot project for traffic optimisation using the same techniques. The project uses a quantum computer to calculate the fastest route for nine participating buses in almost real time to reduce passengers’ travel time. In contrast to conventional navigation services, the quantum algorithm assigns each bus an individual route. This way, each bus can drive around traffic bottlenecks along the route, avoiding traffic jams before they arise. Further development in this area could help improve general traffic flow within cities. The team found the quantum algorithm for their purpose was shorter than any classical algorithm. However, it took longer to reach the result than using classical means due to time required for encoding the problem onto the quantum computer (Feld, 2019[59]).
A recently developed quantum algorithm (Montanaro, 2015[60]) improves the efficiency of “Monte Carlo simulations”. This is a mathematical technique to determine the range of possible outcomes of a decision or a situation, together with the probabilities at which they will occur. It provides a tool to gauge the consequences of different decisions, including the most extreme potential outcomes. Forecasting of multiple scenarios is used in a number of different areas, where classical computing is at its limits.
Telecom providers use forecasting techniques to assess network performance in multiple scenarios aiming to optimise their network infrastructure. Another example are estimates of the probability of cost overruns in megaprojects, and weather forecasting.
In many examples, a lot of value is at stake. Incremental improvements of forecasting models through more efficient quantum algorithms may substantially reduce costs.
Various parties have shown interest in using quantum computing. The Dubai Electricity and Water Authority announced a partnership with Microsoft to develop new quantum-based solutions. They will address energy optimisation and other challenges where classical computers have serious limitations. Despite the interest, no concrete results have been announced. Various telecommunications providers have expressed an interest in quantum computing research, such as Ericsson.
298 OECD DIGITAL ECONOMY OUTLOOK 2020 © OECD 2020
11. ARTIFICIAL INTELLIGENCE, BLOCKCHAIN AND QUANTUM COMPUTING 11. ARTIFICIAL INTELLIGENCE, BLOCKCHAIN AND QUANTUM COMPUTING

All of the areas mentioned play a role in the financial services sector. Monte Carlo simulation is a common method for determining the Value at Risk, a widely used risk metric for asset portfolios. Depending on the portfolio, this could reduce the run-time from days to hours. Similarly, quantum computers could be used for the optimisation of financial portfolios, trading trajectories and arbitrage opportunities. They can also help determine the likelihood of future asset prices.
Corporations in the financial sector have invested in quantum computingVarious corporations in the financial sector are already investing in quantum computing. Goldman Sachs and Fidelity have invested in the hardware company D-Wave Systems, while RBS, Allianz and Citigroup have invested in software start-ups. Other financial institutions, such as JPMorgan and Chase, have entered a partnership with IBM, while BMO Financial Group and Scotiabank have partnered with Xanadu.
The partnerships aim to build a knowledge base, as well as develop and test quantum algorithms on quantum simulators. In this way, they can be ahead of the curve when quantum hardware has sufficiently matured (Konrad, 2017[61]). Various start-ups operate in the field of financial services. The first software tool, the Quantum Asset Allocator, is already on the market.
More research is needed to prove the value of quantum computing
Determining the actual advantage of a quantum computer in the area of machine learning and data analysis is tedious. Evidence of a quantum advantage in this area is much weaker than in the area of physics simulations and decryption. Projects like Volkswagen’s traffic optimisation pilot may give the impression that quantum computers are already changing society. However, more research is needed to determine if the quantum advantage really makes the difference. Just because a quantum computer can be used for a specific task does not mean it is the optimal method. In fact, it may be a complicated way of doing something simple, like purchasing a smart phone to use as a flashlight.
There are ways to prove mathematically that a specific quantum algorithm is superior to any possible algorithm on a classical computer. However, such arguments are hard to prove. Such proof exists for Shor’s prime factorisation algorithm and for methods of physics simulation. For most other applications of quantum computers, however, there is only some evidence that the quantum algorithm is more efficient than all known classical algorithms. Since classical computers and algorithms are evolving too, there may be classical solutions developed that perform the same task equally well. In fact, various discoveries of quantum algorithms have led to improvements to classical algorithms for the same task, such as the “recommendation” algorithm described earlier (Tang, 2014[62]).
The examples above also differ from physics simulations and decryption methods in their type of advantage. In some areas, such as physics simulations and decryptions, fault-tolerant quantum computers can solve tasks that are intractable on a classical computer. In other areas, the advantage mostly amounts to a potential increase in speed. In areas with large volumes of input data, even a small increase may enable real-life applications to tasks that would otherwise be too costly or too slow.
While effective quantum computers are on the horizon, further development is needed for real-world applications
The US National Academies of Science published an extensive report on the current state and future potential of quantum computing in 2019. The report identifies key challenges, milestones and conditions for the realisation of the full potential of quantum computers (National Academies of Sciences, Engineering, and Medicine, 2019[52]).
Since 2017, general-purpose quantum computers, with limited computational power and error rates of around 5%, have been available on the market. This is a major milestone in the development of quantum computers, demonstrating it is physically possible to build this type of hardware. Specific-purpose quantum computers (quantum annealers) have been on the market since 2011 and have scaled more rapidly.
Despite these recent breakthroughs in quantum hardware, most applications described in the previous section require more powerful and more reliable quantum computers than currently exist. In fact,
299OECD DIGITAL ECONOMY OUTLOOK 2020 © OECD 2020
11. ARTIFICIAL INTELLIGENCE, BLOCKCHAIN AND QUANTUM COMPUTING 11. ARTIFICIAL INTELLIGENCE, BLOCKCHAIN AND QUANTUM COMPUTING

powerful classical computers can perform all meaningful tasks at least as well as a quantum computer, including applications for quantum annealers. Hence, there is no real advantage at present in using a quantum computer – special or general purpose – over a classical computer.
Will quantum computers ever become a game changer in our societies and economies? Governments and investors repeatedly ask this question. Given the number of uncertainties on how to build and use a quantum computer of sufficient scale, even a rough estimate would require a crystal ball. Engineering approaches cannot directly scale to the size needed for quantum computers to run known quantum algorithms. This means that many unanticipated challenges may pop up that may not be possible to solve. With this in mind, it is impossible to project a meaningful timeframe. The absence of industry-wide reporting standards also make it difficult to track progress. Nevertheless, it is unlikely that development is fast enough for quantum computers to break cryptography standards within the next decade.
While industry estimates are often more optimistic, large-scale, fault-tolerant quantum computers seem years away. IBM has set yearly targets for achieving a quantum advantage in the next decade. They define such an advantage as a definite demonstration that a quantum computer offers a significant performance advantage over today’s classical computers at a practical level (Gambetta and Sheldon, 4 March 2019[63]).
There are various ways to use quantum mechanical systems (see Boxes 11.6, 11.7 and 11.8) to build quantum computers. Each has its own benefits and challenges. It is unclear which will be the most successful and cost-effective; investment in various options is necessary.
Achieving three milestones would advance the potential of quantum computersRealising the potential of quantum computers requires achieving several intermediate milestones. First, researchers must demonstrate an advantage for the quantum computer by using it to solve a problem that stumps a classical computer. Second, it must achieve commercial success by demonstrating a quantum advantage for a task that has a practical purpose. Finally, it must achieve successful error correction for limited quantum devices.
Demonstrating a quantum advantage is around the corner. In 2019, Google announced it had executed a computational task on its quantum computer in 200 seconds. The same task on a state-of-the-art classical supercomputer would take 10 000 years. Some caution is needed with such claims. As Google points out, a classical computer may be able to perform the same task using sophisticated ways that have not yet been discovered. In fact, IBM claims it can perform the same task in 2.5 days, taking advantage of untapped potential in classical computers (Pednault et al., 21 October 2019[64]). Hence, a definite proof of quantum supremacy may require stronger evidence, but seems within reach.
While hardware is developed further, researchers need to adapt algorithms to be suitable for the limited quantum computers of the near future. On the one hand, algorithms should be robust to noise and require limited computational power. On the other, they must be sophisticated enough that a classical computer cannot simulate them. They will most likely be adaptations of existing algorithms for specific applications. Instead of finding an exact solution, they use an approximate or heuristic approach. This way, a small error rate may still result in a good solution.
First results are expected in the area of chemistry and physics simulation, optimisation and machine learning. These are areas where non-optimal solutions due to errors are not always a problem.
Machine learning is not an exact science that provides solutions that are either right or wrong. It handles large amounts of real-life data, of which only a fraction captures information essential for the algorithm. Through trial and error, the algorithm distils this useful fraction from the redundant data. For this reason, machine-learning algorithms can handle outputs from quantum algorithms that have some degree of error.
In the area of physics simulations, approximate solutions are the norm due to limitations of classical computers. Many methods for determining certain physical properties, such as energy levels, are based on iterative methods. These turn a crude guess into a more and more improved solution. The iterative process allows to break the algorithm into small steps that require limited computational power. These steps could be enhanced by a near-term quantum computer.
300 OECD DIGITAL ECONOMY OUTLOOK 2020 © OECD 2020
11. ARTIFICIAL INTELLIGENCE, BLOCKCHAIN AND QUANTUM COMPUTING 11. ARTIFICIAL INTELLIGENCE, BLOCKCHAIN AND QUANTUM COMPUTING

In the area of optimisation, similar methods are used, such as the quantum approximate optimisation algorithm (Farhi, Goldstone and Gutmann, 2014[65]). Depending on the application, an interim solution may be good enough, even if a better solution exists. Horowitz (2019[52]) gives an overview of these results.
Achieving this milestone is of vital importance for the entire ecosystem of quantum computing to stimulate the availability of funding necessary for further research.
To unlock the full potential of quantum computers, methods are needed to eliminate or correct unwanted variations in the physical operations of a quantum computer. For this purpose, a quantum error correction algorithm can emulate a noise-free quantum computer. However, this takes up a substantial amount of the computational power of the device, which is larger when the level of physical noise is higher.
Achieving this, even for small quantum computers, requires lower error rates in quantum hardware, more effective error correction algorithms and more computational power than is available. The first and the last improvements are a matter of engineering, while the design of better error correction codes requires theoretical progress.
Development of small-scale error-corrected quantum computers is a major milestone. They provide the basis for effective development and testing of quantum software. Furthermore, they provide a measure to compare computational power across different hardware technologies (Box 11.7).
Box 11.7. Quantum hardware
To build a gate-based quantum computer, one needs to create physical systems that encode qubits, over which one has sufficient control to carry out computations. There are various potential candidates, out of which two seem particularly promising.
The first is called a “trapped ion system”. An ion is an atom or molecule that has a net electrical charge, due to an uneven number of electrons compared to protons. The charge of the ion allows it to be controlled by an electromagnetic field. Qubits are encoded as two internal states of the ion.
The second candidate is a “superconducting qubit”. This approach uses the unique properties of superconducting materials to create a circuit that acts as an artificial atom. Isolating superconducting qubits requires them to be cooled to temperatures near absolute zero.
The commercial quantum computing ecosystem is growing due to recent investmentsAs quantum technology has substantial barriers to adoption, economic benefits are not expected to be spread equally. Besides substantial capital, in-depth technical knowledge is required to put quantum computers to use. Early adopters have the advantage of being able to acquire relevant capabilities and talent. They can also integrate technology into their processes in a timely manner. In this way, they can take full advantage of the benefits following a breakthrough. In recent years, more companies have wanted to get involved in quantum computing.
Three kinds of companies benefit most from quantum computing. The first group spends money or other resources to tackle problems with a high-performance computer. A second group comprises companies where the difficulty of solving simulation or optimisation problems prevent the use of high-performance computing or other computational solutions. The third group spends resources on inefficient trial-and-error alternatives, such as wet-lab experiments or physical prototyping.
As of the beginning of 2020, over 175 public and private companies worldwide were operating in the field of quantum technology. This includes quantum computing consulting firms, manufacturers of components for quantum hardware and classical software for the simulation of quantum computers. Most of these companies were founded in the last five years.4
301OECD DIGITAL ECONOMY OUTLOOK 2020 © OECD 2020
11. ARTIFICIAL INTELLIGENCE, BLOCKCHAIN AND QUANTUM COMPUTING 11. ARTIFICIAL INTELLIGENCE, BLOCKCHAIN AND QUANTUM COMPUTING

Europe, the United States and China are global leaders in quantum technology Quantum technology is a global field, with North America and Europe at the forefront. US IT giants IBM, Google and Microsoft, together with a handful of US-based start-ups such as Rigetti Computing and Xanadu, are leading the market in quantum hardware. Canada has a strong presence commercially, with about 20 start-ups, including quantum annealing pioneer D-Wave Systems. Europe has a booming ecosystem of over 60 quantum-related start-ups both in quantum hardware and software. Most start-ups are in Western Europe, with a high concentration (20) in the United Kingdom. There is a handful of quantum-related companies in Asia, most of which are in Japan, China and Singapore. Commercial quantum computing is almost non-existent in South America and Africa.
The commercial activity reflects the global investment. In 2015, the estimated global budget for quantum computing research was EUR 1.5 billion (The Economist, 2017[66]). These investments were concentrated in Europe (EUR 550 million), the United States (EUR 360 million) and China (EUR 220 million).
Since 2015, budgets have increased significantly. In 2019, China announced an investment of CNY 17 billion (EUR 2.2 billion) in a national laboratory for quantum information science (China Daily, 2019[67]). The United States has announced doubling its 2019 annual spending on AI and quantum computing, with a budget of USD 2 billion (EUR 1.8 billion) per year. Various European countries, including the Netherlands, Germany, France and Sweden, as well as the Russian Federation and India, have announced additional investments of several hundred million to billions of euro. In addition to government spending, quantum computing start-ups have received EUR 100 million in private investor capital.
Most market leaders in quantum hardware have programmes to stimulate the development, adoption and knowledge of quantum computing across the world. These programmes provide access to their processors, set up networks for collaboration and offer research grants. In this way, they aim to accelerate development of applications for near-term quantum computers and grow the pool of quantum computing talent.
Leaders offer start-ups access to quantum technology In a major stimulant to the growing ecosystem of quantum start-ups, some quantum hardware companies offer free access to their quantum processor to research institutions and start-ups. Since 2018, IBM has been offering access to their processors, open source quantum software and developer tools to start-ups. As of 2020, they have established global hubs at research institutions in nine different countries, providing each one with a quantum processor. The hubs disseminate the technology to their own members and provide support in advancing and experimenting with quantum computing.
The development of quantum hardware requires a significant amount of resources, specialised knowledge and space. Therefore, it is not likely that most companies and organisations will have physical access to a quantum computer in the near future. However, various companies, such as Rigetti, IBM, Alibaba and D-Wave Systems, provide access to their quantum computers remotely through the cloud. A quantum algorithm can be sent through the Internet to be run on a quantum computer elsewhere, after which the output is sent back. This makes quantum computers accessible anywhere in the world. In 2018, IBM reported 80 000 users of its cloud quantum computing resources, having produced 60 research applications since its launch in 2016 (IBM Research Editorial Staff, 5 April 2018[68]).
Microsoft and Amazon have announced plans to launch cloud-based quantum computing platforms through which users can access different quantum machines. This provides users the flexibility to try out different types of hardware without a commitment. With this growing competition, access and support is likely to become more widespread.
Classical computers have scaled in performance over the last decades. This scaling was fuelled by returns made within the industry. These returns were reinvested in the development of better technology, resulting in higher yields. Long-term funding is necessary to make quantum computers profitable. Until then, funding by governments and investors is required.
302 OECD DIGITAL ECONOMY OUTLOOK 2020 © OECD 2020
11. ARTIFICIAL INTELLIGENCE, BLOCKCHAIN AND QUANTUM COMPUTING 11. ARTIFICIAL INTELLIGENCE, BLOCKCHAIN AND QUANTUM COMPUTING
Development in quantum computers may be delayed if interest and funding in quantum computing diminishes due to lagging results. This occurred in AI research. In the 1960s, experts predicted intelligent machines would exist within a generation. By the 1970s, however, various governments and investors became disillusioned by the required computer power and stopped funding. The field revived and became successful only when computer hardware had progressed sufficiently at the start of the 21st century.
To maintain the pace of progress, commercial revenue from quantum computers needs to be generated as soon as possible. To this end, real-world applications need to be developed for intermediate-scale quantum computers. That requires algorithms that are robust against noise and require limited computational power. Currently, these do not exist. Until this is achieved, government funding will be essential to prevent a significant decline in development.
Governments stimulate development and prepare for disruptionsThe United States is the world leader in quantum computing research, with billions of dollars in funding and around 50 companies and start-ups in quantum technology and services. Various governmental agencies offer funding for quantum computing, including the US Army, the National Security Agency (NSA) and the Department of Energy.
Funding is aimed at practical and commercial uses, as well as fundamental scientific research. Topics range from verifying the fidelity and functionality of intermediate-sized quantum computers to quantum Internet. While most governments only fund domestic research, some US grants are also open to foreign research.
Europe has a long academic tradition of quantum mechanics research, with funding from the European Commission since 1998. In 2018, the Quantum Technology Flagship research initiative was established to develop a solid industrial base to exploit its scientific leadership. The Quantum Technology Flagship has an expected budget of EUR 1 billion over ten years. This complements the spending of individual countries and stimulates international collaboration. The focus is on applications, as well as the basic science behind the technologies.
China is behind the United States on developing universal quantum computers. However, it is on the forefront of space-based quantum communication and cryptography through their Quantum Experiments at Space Scale project. In 2016, the Chinese Academy of Sciences launched the world’s first “quantum satellite”. The satellite, called Micius, emits signals to different receiving stations in the world to establish a shared random secret key. Initial experiments in China were soon followed by intercontinental quantum cryptography between China and five ground stations in Europe. A team from the University of Vienna and the Austrian Academy of Sciences oversaw the European ground stations (OeAW, 2016[69]).
Since the start of 2020, quantum-enabled secure communication has taken place through a mobile receiving station. Such a station is only 80 kilogrammes in weight and small enough to fit on top of a car. The development of mobile receiving stations was motivated by the demand from users, such as the Industrial and Commercial Bank of China, which already use satellite-based quantum encryption methods. The team plans to make the technology available for commercial clients through the launch of a quantum nanosatellite in the next two years.
China has reportedly made breakthroughs in the area of quantum radars (Thurlby, 2016[70]), which allow detection of stealth aircrafts. According to Chinese state media, China developed and tested the first quantum radar in a real-world environment in August 2016; however, this information cannot be verified.
When it comes to the development of universal quantum computing, China is racing to catch up. The country’s 13th Five-Year Plan identifies quantum technology as a focal point for R&D (Wong, 2016[71]). In 2015, the Chinese Academy of Sciences and Alibaba Cloud jointly established the Alibaba Quantum Laboratory, the first quantum computing laboratory in Asia. In 2018, they launched the first free public quantum computing service, accessible through the cloud. Their processor, however, has only a fraction of the computational power of rival services by Google and IBM.
303OECD DIGITAL ECONOMY OUTLOOK 2020 © OECD 2020
11. ARTIFICIAL INTELLIGENCE, BLOCKCHAIN AND QUANTUM COMPUTING 11. ARTIFICIAL INTELLIGENCE, BLOCKCHAIN AND QUANTUM COMPUTING
Alibaba’s competitor Baidu reportedly announced a USD 15 billion investment in 2018 in its own institute for quantum computing. It is dedicated to the application of quantum computing software and information technology with the aim to become a world-class institution within five years (Borak, 2018[72]).
In addition to the United States, Europe and China, other countries, including India, Israel, Japan, Korea, the Russian Federation and Singapore, have a national agenda to develop quantum computing.
Diverse collaborations spur development of quantum computingThe development of quantum hardware requires significant funds. Consequently, some countries with smaller budgets and less human capital seek to benefit from scientific progress made elsewhere rather than lead scientific development. As such, Israel plans to invest in applications of quantum technology and peripheral hardware. India has announced investment in quantum computing to maintain its technological edge and attract related investments. Such funding programmes are initially geared towards academic research, where most of the knowledge is concentrated.
Developing quantum computers requires a multidisciplinary venture. From building the hardware to implementing the goal functionality, it requires specialised knowledge of material science and engineering, theoretical and experimental physics, as well as software design and programming skills.
As specialised knowledge is concentrated in different places, projects in quantum computing are often collaborations between different research groups from multiple universities and industry partners. This is reflected in national policy for quantum computing. The Russian national strategy, for example, involves over nine universities in different cities. The UK National Quantum Technologies Program funds four dedicated quantum technologies research hubs. These hubs, which collaborate with 26 universities, form the centre of expertise for four different focus areas.
On top of collaborations within the scientific community, quantum computing strategies often involve close ties with industrial partners. Quantum Alliance, for example, is a collaboration between the University of Waterloo and various industry partners. Together, they exchange research ideas and collectively develop quantum technology through focused workshops. In another example, the Quantum Technology Innovation Centre Bristol is a dedicated open-access innovation facility. Businesses can access “pay-as-you-go” incubator labs, office space and state-of-the-art equipment, while being supported by experts in a range of business, technology and manufacturing areas.
Besides national initiatives, international collaborations are sought. As an example, various governments worldwide have entered a partnership with IBM, which installed its machine at the respective governments’ university campuses. Through this initiative, IBM hopes to foster quantum computing talent worldwide by providing access to the newest quantum technology.
The collaborative attitude of quantum developers worldwide is beneficial to the speed at which the field develops. For quantum computing to become successful, every aspect of the ecosystem needs to be fully developed.
Quantum technology entails a trade-off between computing power and securityCryptographic algorithms are essential in e-commerce, mobile and online communication, online banking and cloud computing. As described in the previous section, many methods for cryptography that are effective today may be easy to break once large quantum computers are developed. This poses a risk for confidential information. Further, it threatens the integrity and authenticity of public communications, as tampered data could go undetected.
Measures are needed to secure sensitive data against quantum attacks. This is particularly important for data that needs to be kept for years, such as confidential state documents and health care records. Protective measures also prevent intruders from saving data for possible decryption in the future.
Various methods using quantum and classical technology to provide encryption are believed to be secure, even against quantum computers. Confirmation of security would require testing against any possible attack, which is not realistic. In the absence of quantum computers to test the effectiveness of protocols, there is no guarantee of security.
304 OECD DIGITAL ECONOMY OUTLOOK 2020 © OECD 2020
11. ARTIFICIAL INTELLIGENCE, BLOCKCHAIN AND QUANTUM COMPUTING 11. ARTIFICIAL INTELLIGENCE, BLOCKCHAIN AND QUANTUM COMPUTING

As the use of cryptography is so widespread and systems are interconnected, implementing such methods requires significant time and effort. For example, most websites do not meet the required standards to be quantum-secure. There is often a trade-off between security, and required computational power and transmitted data. Therefore, there is no one solution for all applications, but a balance between security, processing speed and bandwidth.
To set a standard for post-quantum cryptography, in 2015 the European Union started the project PQCRYPTO, which develops cryptographic techniques. In the same year, the US NSA announced it would explore encryption schemes that would withstand a quantum assault. In 2016, the American government founded the National Institute of Standards and Technology. It announced its intention to publish about six effective schemes by 2022 after eight years of testing.
The Open Quantum Safe, an open source project, keeps an overview of post-quantum cryptography methods. Its library also includes a test harness and benchmarking routines to compare performance of post-quantum implementations. If new cryptography methods are not tested thoroughly enough, they can cause an immediate security risk. Therefore, further efforts to test post-quantum cryptography methods are necessary.
Box 11.8. A quantum Internet can combine computational power of computers worldwide
A third strategy to building large-scale quantum computers is by connecting several smaller quantum computers in a network. Such a network is often called the “quantum Internet”. In the ideal scenario, different research institutes and companies across the world could combine their resources.
For this to work, connections between the quantum computers need to preserve the quantum mechanical properties. Hence, ordinary communication signals are not sufficient. This act of preservation can be done with light signals through an optical fibre. However, such light particles are difficult to control and errors are hard to eliminate. Various research groups in the United States, Austria, Japan, China and Switzerland have established short-distance light particles. Cambridge University, in the United Kingdom, recently reported a city-wide quantum network on existing fibres with high-bandwidth data traffic. These networks have been deployed to establish secure communication and do not allow transmission of the resources needed yet for a quantum Internet. In China, the network has already been used for communications between banks in Shanghai and Beijing.
Long-distance communication is hindered due to signal loss. To combat signal loss, many researchers are developing “quantum repeaters”. These are devices that capture and amplify the quantum signal.
An alternative to optical fibre networks is a “free space” network, which establishes the connection through a line of sight between two parties. This form of quantum communication is possible between a satellite and the ground, as demonstrated by the Chinese Academy of Sciences (Wong, 2016[71]).
305OECD DIGITAL ECONOMY OUTLOOK 2020 © OECD 2020
11. ARTIFICIAL INTELLIGENCE, BLOCKCHAIN AND QUANTUM COMPUTING 11. ARTIFICIAL INTELLIGENCE, BLOCKCHAIN AND QUANTUM COMPUTING

References
Acharya, A. and Z. Arnold (2019), “Chinese public AI R&D”, CSET Issue Brief, Center for Security and Emerging Technology, Washington, DC, https://cset.georgetown.edu/wp-content/uploads/Chinese-Public-AI-RD-Spending-Provisional-Findings-2.pdf.
[19]
Baker, P. (2020), “Blockchain now officially part of China’s technology strategy”, coindesk, 20 April, https://www.coindesk.com/blockchain-now-officially-part-of-chinas-technology-strategy.
[48]
Berryhill, J., T. Bourgery and A. Hanson (2018), “Blockchains Unchained: Blockchain Technology and its Use in the Public Sector”, OECD Working Papers on Public Governance, No. 28, OECD Publishing, Paris, https://dx.doi.org/10.1787/3c32c429-en.
[39]
Berryhill, J. et al. (2019), “Hello, World: Artificial intelligence and its use in the public sector”, OECD Working Papers on Public Governance, No. 36, OECD Publishing, Paris, https://dx.doi.org/10.1787/726fd39d-en.
[4]
Bianchini, M. and I. Kwon (2020), “Blockchain for SMEs and entrepreneurs in Israel”, OECD SME and Entrepreneurship Papers, No. 18, OECD Publishing, Paris, https://dx.doi.org/10.1787/b6d380ed-en.
[37]
BMWi and BMF (2019), Blockchain Strategy of the Federal Government: We Set out the Course for the Token Economy, Bundesministerium für Wirtschaft und Energie and Bundesministerium der Finanzen, Bonn, https://www.bmwi.de/Redaktion/EN/Publikationen/Digitale-Welt/blockchain-strategy.pdf?__blob=publicationFile&v=3.
[42]
Borak, M. (2018), “After Alibaba, Baidu leaps into quantum computing”, Technode, 8 March, https://technode.com/2018/03/08/baidu-quantum-computing/.
[72]
Brassard, G. (2005), Brief History of Quantum Cryptography: A Personal Perspective, http://dx.doi.org/10.1109/ITWTPI.2005.1543949. [55]
China (2017), “Guideline on next generation AI development plan”, webpage, http://www.gov.cn/zhengce/content/2017-07/20/content_5211996.htm (accessed on 21 October 2020).
[18]
China Daily (2019), China Biggest Global Driver of Deep Tech Investment Growth, https://www.chinadaily.com.cn/a/201910/18/WS5da91d46a310cf3e355713e0.html (accessed 22 October 2020).
[67]
Cockburn, I. (2018), “The impact of artificial intelligence on innovation”, NBER Working Paper, No. 24449, National Bureau of Economic Research, Cambridge, Massachusetts, http://dx.doi.org/10.3386/w24449.
[15]
Council of Europe (2020), Joint Statement by Alessandra Pierucci and Jean-Philippe Walter on the Right to Data Protection in the Context of the COVID-19 Pandemic, Council of Europe, Strasbourg, 30 March, https://www.coe.int/en/web/data-protection/statement-by-alessandra-pierucci-and-jean-philippe-walter.
[31]
Department of Industry, Science, Energy and Resources (2020), The National Blockchain Roadmap: Progressing towards a Blockchain-Empowered Future, Department of Industry, Science, Energy and Resources, Government of Australia, Canberra, https://www.industry.gov.au/sites/default/files/2020-02/national-blockchain-roadmap.pdf.
[41]
European Commission (2020), A European Strategy for Data, European Commission, Brussels, https://ec.europa.eu/info/sites/info/files/communication-european-strategy-data-19feb2020_en.pdf.
[20]
European Commission (2020), AI Reference Testing and Experimentation Facilities for the Manufacturing Sector in the Digital Europe Programme, European Commission, Brussels, https://ec.europa.eu/information_society/newsroom/image/document/2019-49/20200116_background_011FD2FC-0510-5F9C-29B43790C412E582_63497.pdf.
[24]
European Commission (2020), Assessment List for Trustworthy Artificial Intelligence for Self-Assessment, European Commission, Brussels, https://ec.europa.eu/digital-single-market/en/news/assessment-list-trustworthy-artificial-intelligence-altai-self-assessment.
[6]
European Commission (2020), Report on the Safety and Liability Implications of Artificial Intelligence, the Internet of Things and Robotics, COM(2020), 64, Final, European Commission, Brussels, https://ec.europa.eu/info/sites/info/files/report-safety-liability-artificial-intelligence-feb2020_en_1.pdf.
[10]
European Commission (2020), White Paper on Artificial Intelligence – A European Approach to Excellence and Trust, COM(2020), 65, Final, European Commission, Brussels, https://ec.europa.eu/info/sites/info/files/commission-white-paper-artificial-intelligence-feb2020_en.pdf.
[73]
Farhi, E., J. Goldstone and S. Gutmann (2014), “A quantum approximate optimization algorithm”, arXiv, Vol. 1411.4028, https://arxiv.org/abs/1411.4028.
[65]
FDA (2020), “Proposed regulatory framework for modifications to artificial intelligence/machine learning (AI/ML)-based software as a medical device (SaMD)”, Discussion Paper and Request for Feedback, US Food and Drug Administration, Washington, DC, https://www.regulations.gov/document?D=FDA-2019-N-1185-0001.
[8]
306 OECD DIGITAL ECONOMY OUTLOOK 2020 © OECD 2020
11. ARTIFICIAL INTELLIGENCE, BLOCKCHAIN AND QUANTUM COMPUTING 11. ARTIFICIAL INTELLIGENCE, BLOCKCHAIN AND QUANTUM COMPUTING
References and Notes
https://www.coe.int/en/web/data-protection/statement-by-alessandra-pierucci-and-jean-philippe-walter

Federal Government of Germany (2018), Artificial Intelligence Strategy, Federal Government of Germany, Bonn, https://www.bmwi.de/Redaktion/EN/Pressemitteilungen/2018/20180718-key-points-for-federal-government-strategy-on-artificial-intelligence.html (accessed on 21 October 2020).
[23]
Feld, S. (2019), “A hybrid solution method for the capacitated”, Frontiers in ICT 6, pp. 1-13. [59]
G20 (2020), Extraordinary G20 Digital Economy Ministerial Meeting: COVID-19 Response Statement, Virtual Meeting, G20 Information Centre, University of Toronto, 30 April, http://www.g20.utoronto.ca/2020/2020-g20-digital-0430.html.
[30]
G20 (2019), Overview of Saudi Arabia’s 2020 G20 Presidency, G20 Saudia Arabia 2020, Riyadh, https://g20.org/en/g20/Documents/Presidency%20Agenda.pdf.
[29]
Gambetta, J. and S. Sheldon (2019), “Cramming more power into a quantum device”, IBM Research blog, 4 March, https://www.ibm.com/blogs/research/2019/03/power-quantum-device/.
[63]
Government of Portugal (2019), “AI Portugal 2030: Portuguese national initiative on digital skills”, Coordination Office of INCoDe2030, Lisbon, https://www.incode2030.gov.pt/sites/default/files/julho_incode_brochura.pdf.
[25]
IBM Research Editorial Staff (2018), “IBM collaborating with top startups to accelerate quantum computing”, IBM Research blog, 5 April, https://www.ibm.com/blogs/research/2018/04/ibm-startups-accelerate-quantum/.
[68]
ITF (2018), “Blockchain and Beyond: Encoding 21st Century Transport”, International Transport Forum Policy Papers, No. 52, International Transport Forum, Paris, https://dx.doi.org/10.1787/bf31443f-en.
[38]
ITU (2019), World Telecommunication/ICT Indicators Database 2019, International Telecommunication Union, Geneva, http://www.itu.int/pub/D-IND-WTID.OL (accessed on 21 October 2020).
[32]
Kerenidis, I. and A. Luongo (2018), “Quantum classification of the MNIST dataset via Slow Feature Analysis”, arXiv, Vol. 1805.08837.
[57]
Kerenidis, I. and A. Prakash (2016), “Quantum recommendation systems”, arXiv, Vol. 1603.08675. [56]
Konrad, A. (2017), “JPMorgan Chase and Samsung are partnering with IBM to build business apps on quantum computers”, Forbes, 14 December, https://www.forbes.com/sites/alexkonrad/2017/12/14/why-companies-like-jpmorgan-chase-and-samsung-are-partnering-with-ibm-in-quantum-computing/#154b2f7a2c4d.
[61]
Langione, M. et al. (2019), “Where will quantum computers create value – and when?”, Boston Consulting Group, 13 May, https://www.bcg.com/publications/2019/quantum-computers-create-value-when.aspx.
[53]
Larsen, F. (2020), “Denmark: An independent council and a labelling scheme to promote the ethical use of data”, The AI Wonk, OECD.AI Policy Observatory, https://oecd.ai/wonk/an-independent-council-and-seal-of-approval-among-denmarks-measures-to-promote-the-ethical-use-of-data.
[14]
Ledger Insights (2020), “China’s central bank digital currency wallet is revealed”, webpage, https://www.ledgerinsights.com/china-digital-currency-wallet-dcep-cbdc/ (accessed on 21 October 2020).
[50]
Li, Z. et al. (2015), “Experimental realization of a quantum support vector machine”, Physical Review Letters, Vol. 114/14. [58]
Mainelli, M. and A. Milne (2016), “The impact and potential of blockchain on the securities transaction lifecycle”, Working Paper, No. 2015-007, The SWIFT Institute, London, https://swiftinstitute.org/research/the-impact-and-potential-on-the-securities-transaction-lifecycle/.
[35]
Montanaro, A. (2015), “Quantum speedup of Monte Carlo methods”, The Royal Society Publishing, Vol. 471/2181. [60]
Moylett, D., N. Linden and A. Montanaro (2017), “Quantum speedup of the traveling-salesman problem for bounded-degree graphs”, Physical Review A, Vol. 95/3.
[51]
Musharraf, M. (2020), “China launches blockchain-based service network for global commercial use”, Cointelegraph, 27 April, https://cointelegraph.com/news/china-launches-blockchain-based-service-network-for-global-commercial-use.
[49]
National Academies of Sciences, Engineering, and Medicine (2019), Quantum Computing: Progress and Prospects (2019), The National Academies Press, Washington, DC, https://doi.org/10.17226/25196.
[52]
NCO et al. (2019), Supplement to the President’s FY2020 Budget, The National Science and Technology Council, The Office of Science and Technology Policy, Subcommittee on Networking & Information Technology Research & Development, National Coordination Office, Washington, DC, https://www.whitehouse.gov/wp-content/uploads/2019/09/FY2020-NITRD-AI-RD-Budget-September-2019.pdf.
[16]
NITI Aayog, Indian Government (2020), “Blockchain: The India strategy – towards enabling ease of business, ease of living and ease of governance: Part 1”, Discussion Paper, NITI Aayog, New Delhi, https://niti.gov.in/sites/default/files/2020-01/Blockchain_The_India_Strategy_Part_I.pdf.
[45]
OeAW (2016), “First quantum satellite successfully launched”, Austrian Academy of Sciences, Vienna, https://www.oeaw.ac.at/en/oeaw/press/public-relations-and-communications/pressefotos/first-quantum-satellite-successfully-launched/.
[69]
OECD (forthcoming), Enabling SMEs to Benefit from Digitalisation, OECD Publishing, Paris. [26]
307OECD DIGITAL ECONOMY OUTLOOK 2020 © OECD 2020
11. ARTIFICIAL INTELLIGENCE, BLOCKCHAIN AND QUANTUM COMPUTING 11. ARTIFICIAL INTELLIGENCE, BLOCKCHAIN AND QUANTUM COMPUTING
References and Notes
https://swiftinstitute.org/research/the-impact-and-potential-on-the-securities-transaction-lifecycle

OECD (2020), “OECD Competition Assessment Toolkit”, webpage, https://www.oecd.org/competition/assessment-toolkit.htm (accessed on 21 October 2020).
[22]
OECD (2020), OECD Telecommunication and Internet Statistics, (database), http://dx.doi.org/10.1787/tel_int-data-en (accessed on 10 June 2020).
[28]
OECD (2020), Using Artificial Intelligence to Help Combat COVID-19, OECD Publishing, Paris, https://read.oecd-ilibrary.org/view/?ref=130_130771-3jtyra9uoh&title=Using-artificial-intelligence-to-help-combat-COVID-19.
[5]
OECD (2020), Trustworthy Artificial Intelligence in Health, OECD, Paris, www.oecd.org/health/trustworthy-artificial-intelligence-in-health.pdf.
[2]
OECD (2019), “Blockchain at the OECD”, Going Digital Policy Notes, OECD, Paris, https://www.oecd.org/going-digital/blockchain-at-the-oecd.pdf.
[34]
OECD (2019), “Blockchain technologies as a digital enabler for sustainable infrastructure”, OECD Environment Policy Papers, No. 16, OECD Publishing, Paris, https://dx.doi.org/10.1787/0ec26947-en.
[40]
OECD (2019), Going Digital: Shaping Policies, Improving Lives, OECD Publishing, Paris, https://dx.doi.org/10.1787/9789264312012-en. [36]
OECD (2019), Recommendation of the Council on Artificial Intelligence, OECD, Paris, https://legalinstruments.oecd.org/api/print?ids=648&lang=en.
[1]
OECD (2019), “Trade and Cross-Border Data Flows”, OECD Trade Policy Papers, No. 220, OECD Publishing, Paris, https://doi.org/10.1787/b2023a47-en.
[10]
OECD (2019), “Unleashing innovation”, in Going Digital: Shaping Policies, Improving Lives, OECD Publishing, Paris, https://dx.doi.org/10.1787/c285121d-en.
[11]
OECD (2017), OECD Digital Economy Outlook 2017, OECD Publishing, Paris, https://dx.doi.org/10.1787/9789264276284-en. [9]
PCPC (2020), Model AI Governance Framework, Personal Data Protection Commission, Singapore, https://www.pdpc.gov.sg/Help-and-Resources/2020/01/Model-AI-Governance-Framework.
[7]
Pednault, E. et al. (2019), “On ’quantum supremacy’”, IBM Research blog, 21 October, https://www.ibm.com/blogs/research/2019/10/on-quantum-supremacy/.
[64]
Planes-Satorra, S. and C. Paunov (2019), “The digital innovation policy landscape in 2019”, OECD Science, Technology and Industry Policy Papers, No. 71, OECD Publishing, Paris, https://dx.doi.org/10.1787/6171f649-en.
[12]
Shor, P. (1994), “Algorithms for quantum computation: Discrete logarithms and factoring”, IEEE Computer Society Press, No. 124-134, Proceedings 35th Annual Symposium on Foundations of Computer Science, http://dx.doi.org/10.1109/SFCS.1994.365700.
[54]
Statistics Canada (2020), “Percentage of workforce teleworking or working remotely, and percentage of workforce able to carry out a majority of duties during the COVID-19 pandemic, by business characteristics”, Table 33-10-0228-01, Statistics Canada, Ottawa, https://doi.org/10.25318/3310022801-eng.
[13]
Tang, E. (2014), “A quantum-inspired classical algorithm for recommendation systems”, arXiv, Vol. 1807:04271. [62]
The Economist (2017), “Here, there and everywhere: Quantum technology is beginning to come into its own”, The Economist, Technology Quarterly, 9 March, https://www.economist.com/technology-quarterly/2017/03/09/quantum-technology-is-beginning-to-come-into-its-own.
[66]
The Federal Council, Swiss Government (2019), “Federal Council wants to further improve framework conditions for DLT/blockchain”, press release, The Federal Council, Bern, 27 November, https://www.admin.ch/gov/en/start/documentation/media-releases.msg-id-77252.html.
[44]
The Federal Council, Swiss Government (2018), Legal Framework for Distributed Ledger Technology and Blockchain in Switzerland: An Overview with a Focus on the Financial Sector, The Federal Council, Bern, https://www.mme.ch/fileadmin/files/documents/Publikationen/2018/181207_Bericht_Bundesrat_Blockchain_Engl.pdf.
[43]
Thurlby, C. (2016), “China says it has stealth-defeating quantum radar”, RT, 8 September, https://on.rt.com/7oqw. [70]
Ubaldi, B. et al. (2019), “State of the art in the use of emerging technologies in the public sector”, OECD Working Papers on Public Governance, No. 31, OECD Publishing, Paris, https://dx.doi.org/10.1787/932780bc-en.
[3]
UNESCO (2020), “Towards a draft recommendation on the ethics of artificial intelligence: Working document”, presented to a virtual discussion of the Ad Hoc Expert Group (AHEG) for the preparation of a draft text of a recommendation on the ethics of artificial intelligence, 2020, 10 April, https://unesdoc.unesco.org/ark:/48223/pf0000373199.
[33]
United States (2020), American Artificial Intelligence Initiative: Year One Annual Report, https://www.whitehouse.gov/wp-content/uploads/2020/02/American-AI-Initiative-One-Year-Annual-Report.pdf (accessed on 21 October 2020).
[17]
United States (2019), Artificial Intelligence for the American People, webpage, https://www.whitehouse.gov/ai/ (accessed on 21 October 2020).
[21]
308 OECD DIGITAL ECONOMY OUTLOOK 2020 © OECD 2020
11. ARTIFICIAL INTELLIGENCE, BLOCKCHAIN AND QUANTUM COMPUTING 11. ARTIFICIAL INTELLIGENCE, BLOCKCHAIN AND QUANTUM COMPUTING
References and Notes

Vincent-Lancrin, S. and R. van der Vlies (2020), “Trustworthy artificial intelligence (AI) in education: Promises and challenges”, OECD Education Working Papers, No. 218, OECD Publishing, Paris, https://dx.doi.org/10.1787/a6c90fa9-en.
[27]
Wong, E. (2016), “China launches quantum satellite in bid to pioneer secure communications”, The New York Times, 17 August, https://www.nytimes.com/2016/08/17/world/asia/china-quantum-satellite-mozi.html.
[71]
Xinhuanet (2019), “During the 18th collective study of the Politburo, Xi Jinping emphasized on using blockchain as an important breakthrough in independent innovation of core technology to accelerate the development of blockchain technology and industrial innovation”, Xinhuanet, 25 October, http://www.xinhuanet.com/2019-10/25/c_1125153665.htm.
[47]
Zhao, R. and J. He (2020), China’s Blockchain Ecosystem: Industry Mapping Report, Innovation Centre Denmark Shanghai, Blockshine, Wanxiang Blockchain Labs, https://lnkd.in/dhNNSxE.
[46]
Notes
1. www.oecd.ai.
2. www.oecd.ai.
3. The terms “blockchain” and “DLTs”, although referring to slightly different concepts, will be used interchangeably in this publication, for the sake of simplicity.
4. For an overview of companies, see www.quantumcomputingreport.com.
309OECD DIGITAL ECONOMY OUTLOOK 2020 © OECD 2020
11. ARTIFICIAL INTELLIGENCE, BLOCKCHAIN AND QUANTUM COMPUTING 11. ARTIFICIAL INTELLIGENCE, BLOCKCHAIN AND QUANTUM COMPUTING
References and Notes


LIST OF FIGURES, TABLES AND BOXES
OECD DIGITAL ECONOMY OUTLOOK 2020 © OECD 2020 311
Chapter 1 GOING DIGITAL: AN INTEGRATED APPROACH TO POLICY MAKING IN THE DIGITAL AGE
1.1. Going Digital Integrated Policy Framework ................................................................................................ 17
Chapter 2 POLICY TRENDS2.1. High-level strategic co-ordination of national digital strategies .............................................. 372.2. Ministry-level strategic co-ordination of national digital strategies ..................................... 38
Chapter 3 ACCESS AND CONNECTIVITY3.1. Telecommunication sector revenue and investment in the OECD area,
1980-2018 ................................................................................................................................................................................ 603.2. Telecommunication sector revenue and investment as a percentage of GDP
in the OECD area, 2000-18 ......................................................................................................................................... 603.3. Trends in communications access paths in the OECD area, 1986-2018 .............................. 613.4. Bundled communication services subscriptions, 2018 ..................................................................... 623.5. Fixed broadband evolution, OECD area and world, 2009-19 ......................................................... 623.6. Fixed broadband penetration, historical leading OECD countries, 2000-19 ................... 633.7. Evolution of fixed broadband technologies, 2009-19 .......................................................................... 633.8. Fibre broadband connections, June 2019 ...................................................................................................... 643.9. Fixed broadband subscriptions per 100 inhabitants, by speed tiers, June 2019 ........... 653.10. Fixed broadband subscriptions with contracted speed faster than 25/30 Mbps
and 100 Mbps, 2018 ....................................................................................................................................................... 653.11. Average experienced download speed of fixed broadband connections,
July 2019 .................................................................................................................................................................................. 663.12. Mobile broadband evolution, OECD area and world, 2009-19 ................................................... 663.13. Mobile broadband subscriptions per 100 inhabitants, June 2019 .......................................... 673.14. Mobile data usage per mobile broadband subscription, 2018 .................................................. 673.15. Total data per mobile broadband user per month, 2018 ............................................................... 683.16. OECD trends in fixed and mobile broadband prices, 2013-19 .................................................. 693.17. M2M/embedded mobile cellular subscriptions, June 2019 .......................................................... 703.18. Households with minimum 30 Mbps of fixed broadband coverage, 2018 ...................... 713.19. Households with LTE mobile coverage, 2018 .......................................................................................... 713.20. Baskets of fixed broadband offers for 1 Gbps, 2019 .......................................................................... 733.21. Bandwidth produced at Internet exchange points, 2020 .............................................................. 78
Chapter 4 DIGITAL UPTAKE, USAGE AND SKILLS4.1. Internet users by age, 2019 ....................................................................................................................................... 954.2. Frequent Internet use by age and educational attainment, 2019 ............................................ 964.3. Average daily time spent on the Internet worldwide, 2014-19 ................................................... 974.4. Average daily time spent using Internet, mobile Internet
and social media, 2019 ................................................................................................................................................ 974.5. Weekly hours spent by students aged 15-16 on the Internet outside
of school, 2012-18 ............................................................................................................................................................. 984.6. Diffusion of selected online activities among Internet users, 2019 ....................................... 994.7. Diffusion of online purchases, 2019 .................................................................................................................. 994.8. Individuals who sold goods or services on the Internet, by income, 2019 ....................... 1004.9. Broadband connectivity by size, 2019 .............................................................................................................. 1044.10. Employed persons using computers with Internet access, by firm size,
OECD, 2009-19 ................................................................................................................................................................... 1054.11. Diffusion of selected ICT tools and activities in enterprises, 2019....................................... 1064.12. Enterprises using social media, 2019 ............................................................................................................ 1074.13. Enterprises performing big data analytics, 2017 ................................................................................. 108
List of Figures

LIST OF FIGURES, TABLES AND BOXES LIST OF FIGURES, TABLES AND BOXES
OECD DIGITAL ECONOMY OUTLOOK 2020 © OECD 2020 312
4.14. Individuals who used the Internet to interact with public authorities, by educational attainment, 2019 ...................................................................................................................... 111
4.15. Personal and corporate income tax returns filed on line, 2017 ............................................... 1124.16. Individuals who did not submit forms to public authorities on line
due to service availability, 2019 ......................................................................................................................... 1134.17. Location of the body responsible for the digital government strategy, 2019 ............... 1134.18. Governments with a user-driven approach, 2019 ............................................................................... 1144.19. Countries with a government as a platform approach, 2019 .................................................... 1154.20. Students who first accessed the Internet at age 6 or under, 2018 ........................................ 1164.21. Top performers in science, mathematics and reading, 2018 ..................................................... 1164.22. Individuals’ skill mix, 2012 or 2015 ................................................................................................................. 1174.23. Individuals who attended an online course, 2019.............................................................................. 1174.24. Individuals with diversified and complex use of the Internet, 2016 .................................. 1194.25. Skills of Internet users by profile, 2016 ....................................................................................................... 1204.26. ICT-task intensity of jobs, by gender, 2012 or 2015 ............................................................................ 1214.27. Digital skills (mis)match at work, 2018........................................................................................................ 122
Chapter 5 ENHANCING DATA ACCESS, SHARING AND RE-USE5.1. Trends in the acquisition of big-data and analytics firms,
Q1 2013-Q2 2018 ................................................................................................................................................................ 1335.2. Business use of big data by data source and industry
in the European Union, 2018 .................................................................................................................................. 1335.3. Government policy initiatives enhancing data access and sharing, 2017-18 ................. 140
Chapter 6 PRIVACY AND DATA PROTECTION6.1. Main challenges to regulatory frameworks, 2019 .................................................................................. 1596.2. Emerging technologies that pose the main challenges for privacy
and personal data protection, 2019 ................................................................................................................. 1596.3. Sample of privacy enforcement authority public surveys, 2012-18 ........................................ 1616.4. Main challenges to transborder data flows, 2019 .................................................................................. 1646.5. Countries with provisions requiring some form of data localisation
in their regulatory framework, 2019 ................................................................................................................. 1666.6. Countries with a national strategy for privacy or a whole-of-government
approach to it, 2019 ........................................................................................................................................................ 1676.7. Policy measures by governments or PEAs to further privacy
and data protection by businesses, 2019 ...................................................................................................... 1696.8. Main challenges to enforcement, 2019 ......................................................................................................... 1716.9. Main challenges to cross-border enforcement co-operation, 2019 ....................................... 172
Chapter 7 DIGITAL SECURITY7.1. Individuals who experienced phishing and pharming attacks, 2019 ................................... 1807.2. Enterprises making ICT risk assessment, by size, 2019 .................................................................... 1857.3. Risk assessment, ICT security tests and backup in small
and large firms, 2019 ..................................................................................................................................................... 1867.4. Enterprises with insurance against ICT security incidents by size, 2019 .......................... 1877.5. Enterprises making persons employed aware of their obligations
in issues related to ICT security, by size, 2019 ......................................................................................... 1877.6. Example of a fooled AI system using adversarial input ................................................................... 197
Chapter 9 DIGITAL INNOVATION9.1. ICT-related patents, trademarks and designs, 2014-17 ..................................................................... 2229.2. Business R&D expenditure, total and information industries, 2017 ...................................... 2239.3. R&D intensity of ICT and other industries, 2016 .................................................................................... 2249.4. Businesses that have either introduced an innovation or have any kind
of innovation activity, 2016 ...................................................................................................................................... 2249.5. Top 10% most-cited documents in computer science, 2018 ......................................................... 2259.6. Characteristics of innovation in the digital age ...................................................................................... 226
LIST OF FIGURES, TABLES AND BOXES
OECD DIGITAL ECONOMY OUTLOOK 2020 © OECD 2020 313
9.7. The link between innovation and the adoption of technology and business practices, Canada, 2014 ............................................................................................................ 228
9.8. Patterns of digitalisation in science across fields, 2018 ................................................................... 2299.9. Open access of scientific documents, 2017 ................................................................................................ 2309.10. Scientific production resulting in new data or code, by country
of residence, 2018 .......................................................................................................................................................... 2319.11. Scientific authors’ views on potential impacts of the digitalisation
of science, 2018 ................................................................................................................................................................ 2329.12. Scientific authors’ views on the digitalisation of science,
by country of residence, 2018 .............................................................................................................................. 2339.13. Main challenges facing DSIP initiatives, 2018 ........................................................................................ 2369.14. A stylised conceptual view of common main components
of a DSIP initiative ......................................................................................................................................................... 237
Chapter 10 EVOLVING BUSINESS MODELS10.1. Net income per employee in a selection of online platforms, 2017 .................................... 24810.2. A hybrid typology suitable for policy makers interested in jobs ............................................ 25110.3. Temporary employment in OECD countries, 2018 ............................................................................. 25510.4. Short part-time employment in OECD countries, 2018 ................................................................. 25510.5. New vacancies listed on the top five English-language online
working platforms, 2016-20 .................................................................................................................................. 25610.6. Participation in job-related training by group, OECD average, 2012 or 2015 ................. 25910.7. Teleworking before and during the COVID-19 crisis in Italy, by industry, 2020 .......... 26110.8. Business activity and teleworking, services industries
in France, April 2020 .................................................................................................................................................... 26210.9. Growth in downloads of selected video conferencing apps, 2019-20................................. 26210.10. Monthly traffic on remote working platforms during COVID-19,
October 2019-April 2020 ........................................................................................................................................ 263
Chapter 11 ARTIFICIAL INTELLIGENCE, BLOCKCHAIN AND QUANTUM COMPUTING11.1. Policy instruments used in national AI policies, 2020..................................................................... 27411.2. Examples of AI applications at different stages of the COVID-19 crisis .......................... 27611.3. AI publications by country, 1980-2020 .......................................................................................................... 27911.4. The 500 most powerful non-distributed computer systems,
by location, July 2020 ................................................................................................................................................... 28111.5. Cross-country AI skills penetration, 2015-19 .......................................................................................... 28311.6. Between-country AI skills migration, 2019............................................................................................... 28411.7. Domestic and international AI research collaboration, 1980-2020 ..................................... 285
Chapter 2 POLICY TRENDS2.1. The evolution of digital policy objectives, 2016 and 2019 ............................................................... 362.2. National digital strategy governance ............................................................................................................... 38
Chapter 3 ACCESS AND CONNECTIVITY3.1. 10 Gbps Internet cases in the OECD and Singapore ............................................................................ 743.2. Status of 5G commercial deployment in OECD countries .............................................................. 75
Chapter 4 DIGITAL UPTAKE, USAGE AND SKILLS4.1. Policy instruments to promote digital uptake by households and individuals ............ 1024.2. Policy instruments to promote digital uptake by businesses ...................................................... 110
Chapter 6 PRIVACY AND DATA PROTECTION6.1. Amendments to countries’ privacy and data protection legislation .................................... 165
List of Tables

LIST OF FIGURES, TABLES AND BOXES LIST OF FIGURES, TABLES AND BOXES
OECD DIGITAL ECONOMY OUTLOOK 2020 © OECD 2020 314
Chapter 1 GOING DIGITAL: AN INTEGRATED APPROACH TO POLICY MAKING IN THE DIGITAL AGE
1.1. Enhancing access: What matters most for policy? .............................................................................. 181.2. Increasing effective use: What matters most for policy? ................................................................ 201.3. Unleashing innovation: What matters most for policy? .................................................................. 211.4. Ensuring good jobs: What matters most for policy? ........................................................................... 231.5. Promoting an inclusive digital society: What matters most for policy? ............................. 251.6. Strengthening trust: What matters most for policy?.......................................................................... 271.7. Fostering market openness: What matters most for policy? ....................................................... 281.8. Five steps to develop a digital transformation strategy ................................................................... 29
Chapter 3 ACCESS AND CONNECTIVITY3.1. Korea’s 5G+ strategy: To realise innovative growth .............................................................................. 823.2. Expert discussion on network neutrality in Japan ............................................................................... 843.3. COVID-19: Key recommendations for policy makers, regulators
and/or network operators to meet both the surge and the changing nature of demand in network connectivity ................................................................................................................. 86
Chapter 4 DIGITAL UPTAKE, USAGE AND SKILLS4.1. The heterogeneity of digital adoption among firms ........................................................................... 1054.2. Ireland’s ICT Skills Action Plan ............................................................................................................................. 125
Chapter 5 ENHANCING DATA ACCESS, SHARING AND RE-USE5.1. Balancing the benefits with the risks: Australia’s data sharing
and release legislation ................................................................................................................................................. 141
Chapter 7 DIGITAL SECURITY7.1. Emotet, the tenacious multi-purpose malware ...................................................................................... 1847.2. Global EPIC, an international initiative to co-ordinate digital security
innovation ecosystems ............................................................................................................................................... 1917.3. The OECD Recommendation of the Council on Digital Security
of Critical Activities ............................................................................................................................................................ 195
Chapter 8 CONSUMER POLICY IN THE DIGITAL TRANSFORMATION8.1. Behavioural biases relevant to consumer policy and consumer
product safety ..................................................................................................................................................................... 2098.2. Improving terms and conditions with behavioural insights........................................................ 211
Chapter 11 ARTIFICIAL INTELLIGENCE, BLOCKCHAIN AND QUANTUM COMPUTING11.1. AI-powered responses to combat COVID-19 ........................................................................................... 27611.2. Key features of blockchain ..................................................................................................................................... 28711.3. Digital financial assets .............................................................................................................................................. 287
List of Boxes
Chapter 7 DIGITAL SECURITY7.1. Certificates for valid vs. lookalike domains for top 20 retailers
in five countries ................................................................................................................................................................ 1807.2. Cryptography exchanges affected by digital security attacks ..................................................... 183
Chapter 11 ARTIFICIAL INTELLIGENCE, BLOCKCHAIN AND QUANTUM COMPUTING11.1. Countries’ AI policies focus on a handful of sectors, selected countries ........................ 275

LIST OF FIGURES, TABLES AND BOXES
OECD DIGITAL ECONOMY OUTLOOK 2020 © OECD 2020 315
11.4. Qubits ...................................................................................................................................................................................... 29411.5. Computational power ................................................................................................................................................ 29511.6. Analogue and gate-based quantum computers .................................................................................. 29711.7. Quantum hardware ..................................................................................................................................................... 30111.8. A quantum Internet can combine computational power
of computers worldwide .......................................................................................................................................... 305

OECD Digital Economy Outlook 2020The OECD Digital Economy Outlook 2020 examines trends and analyses emerging opportunities and challenges in the digital economy. It highlights how OECD countries and partner economies are taking advantage of information and communication technologies (ICTs) and the Internet to meet their public policy objectives. Through comparative evidence, it informs policy makers of regulatory practices and policy options to help maximise the potential of the digital economy as a driver for innovation and inclusive growth.
This third edition of the OECD Digital Economy Outlook provides a holistic overview of converging trends, policy developments and data on both the supply and demand sides of the digital economy. It illustrates how the digital transformation is affecting economies and societies. Finally, it provides a special focus on how the COVID-19 pandemic is amplifying opportunities and challenges from the digital transformation.
PRINT ISBN 978-92-64-42476-0PDF ISBN 978-92-64-74044-0
This publication is a contribution to the OECD Going Digital project which aims to provide policymakers with the tools they need to help their economies and societies prosper in an increasingly digital and data-driven world.
For more information, visit www.oecd.org/going-digital
#GoingDigital
9HSTCQE*ecehga+
Making the transformation work for growth and well-being


![OECD Communications Outlook 2011 U^]X\Y:](https://static.fdokumen.com/doc/165x107/6323d24af021b67e740843c3/oecd-communications-outlook-2011-uxy.jpg)