PLASTICS INDUSTRY FEASIBILITY STUDY - RDA Tropical ...
69
rpsgroup.com PLASTICS INDUSTRY FEASIBILITY STUDY Feasibility of a Plastics Industry Hub in Far North Queensland R79945 PR147714 3.0 R3 17 December 2020
-
Upload
khangminh22 -
Category
Documents
-
view
0 -
download
0
Transcript of PLASTICS INDUSTRY FEASIBILITY STUDY - RDA Tropical ...

rpsgroup.com
PLASTICS INDUSTRY FEASIBILITY STUDY
Feasibility of a Plastics Industry Hub in Far North Queensland
R79945 PR1477143.0 R3 17 December 2020

RPS REPORT
| Plastics Industry Feasibility Study | 3.0 R3 | 17 December 2020 rpsgroup.com Page i
Document status
Version Purpose of document Authored by Reviewed by Approved by Review date
1.0 Draft preliminary report K. Kulkarni,J. Doran-Smith M. Davis M. Davis 30/09/20
2.0 Draft report K. Kulkarni, M. Davis M. Davis M. Davis 30/11/20
3.0 Final Report K. Kulkarni, M. Davis M. Davis M. Davis 9/12/20
3.0 R2 Finalisation following steering committee meeting K. Kulkarni, M. Davis M. Davis M. Davis 11/12/20
3.0 R2 Finalisation following presentation to CRC K. Kulkarni, M. Davis M. Davis M. Davis 17/12/20
Approval for issue
Megan Davis 17 December 2020
This report was prepared by RPS within the terms of RPS’ engagement with its client and in direct response to a scope of services. This report is supplied for the sole and specific purpose for use by RPS’ client. The report does not account for any changes relating the subject matter of the report, or any legislative or regulatory changes that have occurred since the report was produced and that may affect the report. RPS does not accept any responsibility or liability for loss whatsoever to any third party caused by, related to or arising out of any use or reliance on the report.
Prepared by: Prepared for:
RPS Regional Development Australia
Kapil Kulkarni Director and NSW Lead - Economics
Anne Stunzner Senior Economic Consultant
Level 13, 255 Pitt Street Sydney NSW 2000
Suite 12A, The Conservatory 12 – 14 Lake St Cairns QLD 4870
T +61 2 8099 3200 E [email protected]
T +61 7 4041 1729 E [email protected]

RPS REPORT
| Plastics Industry Feasibility Study | 3.0 R3 | 17 December 2020 rpsgroup.com Page ii
EXECUTIVE SUMMARY RPS Group was engaged by Regional Development Australia Tropical North to support their investigation into the potential development of a plastic recycling and production industry in Far North Queensland, as a pilot for future regional centres across Australia. The project incorporates the lifecycle of resource recovery from education, collection and processing, through to remanufacturing and aims to facilitate innovation in waste management and recycling, create local employment opportunities, and facilitate the development of circular economy products. Across Australia significant volumes of plastic are being produced with low volumes being recycled. Queensland state government data indicates that the following volumes of plastic were recovered in the FNQ Region during 2018-19:
• 238.8 tonnes of Polyethylene Terephthalate (PET);
• 291.1 tonnes of High-Density Polyethylene (HDPE);
• 3.4 tonnes of High-Density Polyethylene (LDPE); and
• 125 tonnes of mixed / not classified plastic.This plastic is exported to SEQ and other Australian states for recycling, whilst local producers are importing recycled plastic back into the region for reuse. The estimated plastic recovery rates of approximately 1.9 per cent is relatively low in FNQ, compared to 5.7 per cent in Queensland and 9.4 per cent in Australia. Without further investment in recovery, the recovery rates of plastic material are likely to worsen. The largest three industries in FNQ in 2018/19 were Healthcare and Social Assistance, Construction, and Agriculture, Forestry and Fishing industries. The FNQ MSW plastics stream contains large proportions of HDPE with major applications for HDPE recycling including films, pallets, wheelie bins, irrigation hose and pipes. Cairns has a disproportionately high C&I waste stream with low volumes of diversion. This stream is estimated to have significant portions of LDPE and HDPE, with major applications for LDPE recycling include film and agricultural piping. Due to the higher population density in the Cairns region, over half of all plastic produced in all of FNQ is produced in Cairns, and as a result, most recycling infrastructure and facilities are concentrated within the Cairns SA4 and surrounding region, with limited facilities available throughout the remainder of FNQ. Consequently, it is recommended that the recycling hub is centralised in Cairns with spokes in regional and remote areas to collect and distribute plastic to be recycled back to the hub. Given the existing diversion from household waste in Cairns and Port Douglas utilising the Cairns Material Recovery Facility, and the potential to increase this diversion rate through commercial and industrial sources, the investigation determined that the preferred option for a recycling hub is a plant recycling HDPE and PET sourced from commercial premises within 150km of Cairns. Longer term options are likely to include expanding the recycling plant and opportunities to source PVC feedstock for a larger (e.g. state-wide) PVC recycling plant. Waste to Energy is unlikely to be feasible unless there is sufficient scale and use for the heat. Analysis of the multi-polymer model showed that it is likely to:
• Divert approximately 5,500 tonnes of plastic per year, increasing the recycling rate to 17.1 percent in 2022, and reducing embodied GHG emissions by around 5,000 tCO2-e / year
• Deliver a net benefit to Queensland of $50.6m NPV and BCR of 3.1
• Provide economic stimulus to the region, including the creation of up to 83 FTE direct andindirect jobs during construction and up to 6 during operation
• Provide a potential return to investors of 39 per cent IRR and a payback period of 4 years.

RPS REPORT
| Plastics Industry Feasibility Study | 3.0 R3 | 17 December 2020 rpsgroup.com Page iii
Government can play an important support role in facilitating investment in the hub by providing information, tools and resources and brokering (i.e. matching supply with demand). In addition, government programs to increase market development are also recommended including implementing purchasing policies supporting purchase or recycled plastic products from the local region, and developing a regional waste strategy.

RPS REPORT
| Plastics Industry Feasibility Study | 3.0 R3 | 17 December 2020 rpsgroup.com Page iv
Contents Executive Summary .......................................................................................................................................... ii
1 INTRODUCTION ...................................................................................................................................... 1 1.1 Background .................................................................................................................................... 1
2 OBJECTIVES OF THIS PROJECT ......................................................................................................... 5 2.1 FNQ Region ................................................................................................................................... 6 2.2 Policy Context ................................................................................................................................ 6
3 METHODOLOGY ..................................................................................................................................... 9 3.1 Feasibility Assessment Steps ........................................................................................................ 9 3.2 Assessment Framework ...............................................................................................................10
4 REGION OVERVIEW .............................................................................................................................16 4.1 Economic Profile ..........................................................................................................................16 4.2 Waste and recycling infrastructure ...............................................................................................18 4.3 Plastic Waste Flows .....................................................................................................................22 4.4 Comparative SWOT .....................................................................................................................33
5 OPTIONS IDENTIFICATION .................................................................................................................35 5.1 Review of Plastic Recycling Technologies ...................................................................................35 Landfilling ...............................................................................................................................................35 Recycling ................................................................................................................................................36 5.2 Hub and spoke model ..................................................................................................................38 5.3 Potential Options for FNQ ............................................................................................................38 5.4 Potential for re-manufacturing ......................................................................................................38 5.5 Shortlist of Options Considered ...................................................................................................38
6 OPTIONS ASSESSMENT .....................................................................................................................40 6.1 Supply and demand analysis .......................................................................................................40 6.2 Multi-polymer option .....................................................................................................................41 6.3 Environmental Impacts .................................................................................................................42 6.4 Cost Benefit Analysis ...................................................................................................................42 6.5 Economic Impact Assessment .....................................................................................................44 6.6 Financial Assessment ..................................................................................................................45 6.7 Sensitivity analysis .......................................................................................................................48 6.8 Medium to longer term considerations .........................................................................................48 6.9 Legislative and Approval Considerations .....................................................................................49 6.10 Summary of Assessment .............................................................................................................49
7 CONCLUSION .......................................................................................................................................51
References ......................................................................................................................................................53
Tables Table 1 Types, Resins codes, Property and Uses of the most common Thermoplastics (6) ............................ 2 Table 2 Waste Stream Recycling Targets .......................................................................................................... 7 Table 3: Application of SWOT to determine appropriate recycling model ........................................................11 Table 4: Virgin material commodity values end-June 2020 ($AUD / tonne) ....................................................30 Table 5: Potential feasible supply of HDPE feedstock in FNQ .........................................................................41 Table 7: Environmental impact of option ..........................................................................................................42 Table 8: Economic impacts of a recycling hub in Cairns ..................................................................................45 Table 9: Option 1 - Summary of cashflows ($m nominal) ................................................................................47 Table 10: General parameters ..........................................................................................................................62 Table 11: Benefits of diversion from landfill ......................................................................................................62

RPS REPORT
| Plastics Industry Feasibility Study | 3.0 R3 | 17 December 2020 rpsgroup.com Page v
Table 12: Recovery cost assumptions ..............................................................................................................62 Table 13: Recycling costs and benefits ............................................................................................................63 Table 14: Economics assumptions for Waste to Energy ..................................................................................63
Figures Figure 1 Far North Queensland Region (RDA TN, cited 3 September 2020) .................................................... 3 Figure 2 Feasibility assessment stages .............................................................................................................. 9 Figure 3 Waste and Transport Infrastructure in FNQ .......................................................................................19 Figure 4 Levy Zone (Green) (Qld Government, Levy Zone Map, cited 20 September 2020) ..........................35
Graphs Graph 1 FNQ Value Added by Industry (source: NIEIR) ..................................................................................16 Graph 2 Employment by SA3 and Industry (source: NIEIR) ............................................................................17 Graph 3 MSW plastic waste by SA3 .................................................................................................................22 Graph 4 Composition of MSW plastics in FNQ ................................................................................................23 Graph 5 C&I plastic waste by SA3 ...................................................................................................................23 Graph 6 Composition of C&I plastics in FNQ ...................................................................................................24 Graph 7 C&D plastic waste in FNQ .................................................................................................................24 Graph 8 Composition of C&D plastics in FNQ..................................................................................................25 Graph 9 Recovery Rate by Waste Sector in FNQ ............................................................................................26 Graph 10 Composition of Plastic Recovery in FNQ .........................................................................................27 Graph 11 Destinations for Plastics Recovered from FNQ ................................................................................27 Graph 12 Polymer Profile of Packaging vs non-Packaging ..............................................................................28 Graph 13 Projected MSW plastic waste generation .........................................................................................31 Graph 14 Projected C&I plastic waste generation ............................................................................................31 Graph 15 Projected C&D plastic waste generation ..........................................................................................32 Graph 16 Projected recovery rates over time ...................................................................................................32 Graph 17 CBA results .......................................................................................................................................43
Appendices Waste Services in FNQ Stakeholders Parameters and Assumptions Used in Options Assessment

REPORT
| Plastics Industry Feasibility Study | 3.0 R3 | 17 December 2020 rpsgroup.com Page 1
1 INTRODUCTION 1.1 Background
Regional Development Australia Tropical North has engaged RPS Group to support their investigation into the potential development of a plastic recycling and production industry in Far North Queensland, as a pilot for future regional centres across Australia. The project incorporates the lifecycle of resource recovery from education, collection and processing, through to remanufacturing. The aim of the project is to facilitate innovation in waste management and recycling, create local employment opportunities, reduce unnecessary freight costs, create product for export or sale, and facilitate the development of environmentally friendly products to be sold domestically. It also aims to assist regional areas to collect and manage their plastic waste, preventing leakages into the ocean and the pollution of our coastlines and waterways.
Plastic Use and Production
Plastics have existed for just over a century and are increasingly being used across economies in sectors ranging from packaging to construction, transportation, healthcare and electronics (1). Given they are lightweight, inexpensive, and durable, they have become indispensable in everyday life with the estimated global use of plastics in 2014 at 311 million tonnes (2). The World Economic Forum predicts that this will double again in 20 years and quadruple by 2050 (3). 90 per cent of plastics produced are derived from virgin fossil feedstocks which represent approximately 6 per cent of global oil consumption (4). The Australian plastic production industry produces over 1.2 million tonne per year representing approximately 10 per cent of Australian manufacturing activity which employs 85,000 people (5). Key findings from the 2016-17 Australian Plastics Recycling Survey - National Report state that:
• A total of 3,513,100 tonnes of plastics were consumed in Australia in 2016–17
• A total of 293,900 tonnes of plastics were recycled in 2016–17, which is a fall of 10 per cent from 2015–16 recovery
• Including tyres, total plastics recovery was 415,200 tonnes
• In 2016–17 the national plastics recycling rate was 11.8 per cent
• Of the 415,200 tonnes of plastics collected for recycling, 180,100 tonnes (43.4 per cent) were reprocessed in Australia and 235,100 tonnes (56.6 per cent) were exported for reprocessing – Over the preceding year, local reprocessing remained stable, while export for reprocessing
fell by 20 per cent
• In 2016-17, Australians used 5.66 billion single-use plastic bags. Whilst there are many types of plastic, they can be categorised into two groups: thermoplastics and thermosets (6). Thermoplastics become soft when heated and malleable or moulded when put under pressure, and as they cool, they solidify and retain their shape (6). The most common thermoplastics are summarised by types, properties and uses in Table 1 below.

REPORT
| Plastics Industry Feasibility Study | 3.0 R3 | 17 December 2020 rpsgroup.com Page 2
Table 1 Types, Resins codes, Property and Uses of the most common Thermoplastics (6)
Resin Type Resin ID Code
Properties Uses
Polyethylene Terephthalate (PET)
1 Clear, tough and stiff. Resistant to chemicals and heat. Barrier for carbon dioxide and oxygen.
Soft drink bottles, fires in clothes, films, food containers.
High-Density Polyethylene (HDPE)
2 Balanced rigidity and impact strength, chemical resistance, crystalline melting point (130-135°C). Water vapour barrier.
Blow moulded products, pipes, buckets and mugs.
Polyvinyl Chloride (PVC)
3 Versatile, energy saving, adaptability to changing time and environment, durable, fire resistant.
Pumping pipes and other construction material, meat trays.
Low-Density Polyethylene (LDPE)
4 Low density, easy process ability, semi crystalline, low melting and softening point, chemical resistance, excellent dielectric properties, low moisture barrier, poor abrasion and stretch resistance.
Wrapping film, grocery bags and electrical coatings.
Polypropylene (PP) 5 Low density, excellent chemical resistance, stress resistance, high melting point, good process ability, dielectric properties, low cost, creep resistance.
Bottles such as syrup and yoghurt, straws, toys, medical containers
Polystyrene (PS) 6 Glassy surface, clear to opaque, rigid, hard, high clarity, affected by fats and solvents.
Electrical equipment such as plugs, sockets, switch plates. Wall tiles, washing baskets.
Other plastics
Polycarbonate, nylon, acrylic, acrylonitrile butadiene, styrene
7 Many types of other plastics used in engineering designs
Thermosets are initially heated and moulded into products, however, unlike thermoplastics, they cannot be remoulded simply by applying heat as they tend to break apart as a result of chemical cross-linking in the polymer during the curing process (7).

REPORT
| Plastics Industry Feasibility Study | 3.0 R3 | 17 December 2020 rpsgroup.com Page 3
Management of Plastics in FNQ
Plastic waste management practices vary across the Far North Queensland (FNQ) region (refer to Figure 1 for a map of the region), reflecting the waste management practices and infrastructure specific to each local government area (LGA). Recovered plastic waste from the more densely populated LGAs is currently sorted, bailed and then transported by road and rail to Brisbane or interstate for further processing. Recycled products are then transported back to FNQ, increasing freight costs and emissions. Queensland state government data indicates that the following volumes of plastic were recovered in the FNQ Region during 2018-19:
• 238.83 tonnes of PET (1);
• 291.1 tonnes of HDPE (2);
• 3.4 tonnes of LDPE (4); and
• 125 tonnes of mixed / not classified plastic.One plastic recycler in the FNQ region has confirmed that 15 tonnes of HDPE pellets has been imported for use over a six (6) month period with another local producer importing recycled PET from Turkey to meet demand.
Figure 1 Far North Queensland Region (RDA TN, cited 3 September 2020)
REPORT
| Plastics Industry Feasibility Study | 3.0 R3 | 17 December 2020 rpsgroup.com Page 4
Health and Environmental Impacts of Plastic Waste
Plastic waste has gained significant attention in recent decades due to the increased awareness of environmental and health impacts seen around the world. Since plastics do not readily biodegrade, mismanagement of plastics leads to an accumulation in landfills and the natural environment. Plastic waste is particularly harmful when it accumulates in aquatic environments. Plastic debris can block drains in towns and cities creating breeding grounds for harmful waterborne diseases. Aquatic wildlife can consume plastic materials, causing suffocation and particles to build up in their digestive systems, along with plastic molecules in their muscles. Once plastic enters the food chain it can create significant hazards to human and ecological health. The World Economic Forum reported that the best research currently estimates that enter over 150 million tonnes of plastic waste in the oceans today with at least 8 million tonnes of plastic leaking into the ocean annually. The Tangaroa Blue Foundation coordinates the Australian Marine Debris Initiative (AMDI). The AMDI objectives include the removal of marine debris from the environment; the collection of scientifically robust and long-term data on what is removed and from where; and tracking the debris back to the source wherever possible. Ms Heidi Taylor, Managing Director of the Tangaroa Blue Foundation, stated that to date, more than 5.4 million marine debris items have been entered into the AMDI database. This debris has been removed from 1,729 sites and the weight of the debris has been totalled at over 500 tonnes. Specific areas within the FNQ region where plastic debris has been reported at comparatively high densities include remote areas of north western Cape York and the Far North Great Barrier Reef at 400kg of debris per kilometre (7).
Economic Opportunities for FNQ
Developing recycling infrastructure in FNQ creates economic opportunities for the region and the state. Developing an integrated supply chain in FNQ would avoid the costs associated with transporting plastic material to Brisbane, or further, and back to the region after reprocessing. This would avoid both the financial and environmental impacts of transport. Regional processing could also be tailored to maximise the value of the material for regional or exports markets. Regional infrastructure also provides opportunities for employment and economic development. The 2018 National Waste policy states that for every 10,000 tonnes of waste that is recycled, 9.2 jobs are created, compared with 2.8 jobs if the same amount of waste was sent to landfill.
Alignment with Circular Economy Policies
The development of regional infrastructure also aligns with a range of policies that promote a circular economy approach to waste management. To reduce waste going to landfill and improve recycling rates in Australia, the Federal Government has proposed a Recycling and Waste Reduction Bill 2020. The proposed bill aims to phase in the end of unprocessed plastic, paper, glass and tyres that Australia ships overseas each year. Developing regional recycling infrastructure will also support the following environmental and economic goals:
• Development of the local manufacturing industry and local employment
• Protection to the health of the Great Barrier Reef
• Support a Council of Australian Government (COAG) commitment to introduce a ban on the export of waste plastic, paper, glass and tyres and ensure measures to support the waste export ban are coordinated across, and meet the collective needs of, northern Australian jurisdictions;
• Contribute to the reduction of total waste generated in Australia
• Improve the long-term sustainability of Australia’s recycling industry.

REPORT
| Plastics Industry Feasibility Study | 3.0 R3 | 17 December 2020 rpsgroup.com Page 5
2 OBJECTIVES OF THIS PROJECT This Project provides an analysis of the current plastic waste management practices across FNQ, to identify and assess the feasibility of developing a plastics recycling hub in the region. The Project is supported by a grant provided to Regional Development Australia Tropical North Incorporated (RDATN) by the Australian Department of Industry, Science, Energy and Resources (DISER), the Queensland Department of Environment and Science (DES) and Cairns Regional Council. The Project consists of the following three components:
• A Feasibility Study
• The provision of a Replicable Pilot Template
• The creation of an Education Program.
Feasibility Study
The feasibility study has included detailed analysis of the following across the FNQ region:
• Recycling and materials flows
• The source and quantity of raw materials
• Existing necessary infrastructure
• Distribution networks including local, regional and international markets (both current and future)
• Recycling opportunities for soft plastics, low value plastics and plastics from commercial and agricultural sources across the region and innovative use of recycled plastics (e.g. used irrigation systems to road base)
• The potential impact to the Great Barrier Reef, including whether it would significantly impact the volume of waste would otherwise find its way into the reef
• Relevant costs
• The benefits including real and collateral value to the regional economy
• Consideration of identified legislative compliance requirements
• Recommendations to inform government decision making regarding regional infrastructure investment.
Replicable Pilot Template
Provision of a pilot template replicable in other regions to address waste and recycling challenges across regional Australia, particularly for those regions facing similar challenges to Far North Queensland (e.g. Northern Australia).
Regional Education Program
Creation of a regional education program to reduce the use of single-use plastic in the FNQ region (e.g. reducing the use of plastics in tourism – plastic free hotels, etc.) and increase awareness of plastics recycling and remanufacturing.

REPORT
| Plastics Industry Feasibility Study | 3.0 R3 | 17 December 2020 rpsgroup.com Page 6
2.1 FNQ Region
The Far North Queensland region is a remote area situated on the northeast coast of Australia. The region comprises Statistical Area Level 3 (SA3) - Far North and Statistical Area Level 4 (SA4) – Cairns. The region encompasses twenty-one local government council areas (refer to Figure 1 in Section 1.1) with a population of 286,799 people (2016). Approximately 54 per cent of the population live in the Cairns urban area, 35 per cent in the Douglas/Cassowary Coast and Tablelands area and 11 per cent in the Gulf, Cape and Torres area. The population is expected to grow to over 467,000 by the year 2050. Cairns city is the main metropolitan centre of the area with sub-regions to the north, west and south. Cairns is situated approximately 1,700 km away from the nearest capital city, Brisbane. While Cairns is considered remote, it is identified as a regional hub for FNQ, due to its centralised locality, access to an international airport and marine port facilities, and its proximity to Queensland’s main overland link, the Captain Cook highway. It is also the closest metropolitan area to remote Cape York and the Torres Strait Islands.
2.2 Policy Context
The Project has been prepared to support the targets and objectives of existing policies related to plastic waste management in Australia. The study has identified several policies and strategies at state and federal levels that aim to support a circular economy, minimise the impacts of human activities on the environment, encourage waste prevention, and promote sustainable solid waste management. These policies and strategies provide a set of principles and targets to guide decisions and achieve positive outcomes.
Federal Policies and Strategies
The 2018 National Waste Policy provides a framework for collective actions by business, governments, communities and individuals until 2030. The policy identifies five overarching principles underpinning waste management in a circular economy. These include:
• Avoid waste
• Improve resource recovery
• Increase the use of recycled material and build demand and markets for recycled products
• Better manage material flows to benefit human health, the environment and the economy
• Improve information to support innovation, guide investment and enable informed consumer decisions.
This policy was followed by a 2019 National Waste Policy Action Plan. The Action Plan creates targets and actions to implement the 2018 National Waste Policy. These targets and actions will guide investment and national efforts to 2030 and beyond. These include:
• Ban the export of waste plastic, paper, glass and tyres, commencing in the second half of 2020
• Reduce total waste generated in Australia by 10 per cent per person by 2030
• Achieve an 80 per cent average recovery rate from all waste streams by 2030
• Significantly increase the use of recycled content by governments and industry
• Phase out problematic and unnecessary plastics by 2025
• Halve the amount of organic waste sent to landfill by 2030

REPORT
| Plastics Industry Feasibility Study | 3.0 R3 | 17 December 2020 rpsgroup.com Page 7
• Make comprehensive, economy-wide and timely data publicly available to support better consumer, investment and policy decisions.
State Policies and Strategies
In addition to the national waste management strategies, the Queensland Waste Management and Resource Recovery Strategy provides a plan to better waste management in Queensland. This strategy outlines targets for 2050 that aim to improve economic growth and jobs by recovering more materials and gaining more value from those recovered materials, which include:
• 25 per cent reduction in household waste
• 90 per cent of waste is recovered and does not go to landfill
• 75 per cent recycling rates across all waste types. The Queensland Government also implemented the Plastic Pollution Reduction Plan in 2019 which includes the following actions:
• Introduce legislation to ban the supply of specific plastics products including straws, cutlery, plates, stirrers from 1 July 2021
• Expand on the Plastic Free Places
• Focus further investment on developing plastic recovery and processing infrastructure in Queensland in 2020/21
• Exclude the use of specific single-use plastic items from Queensland Government sponsored events from 2020 onwards
• Use government purchasing power to reduce plastic use, require recycled plastic content, and transform the supply market from 2020 onwards
• Build community capacity and engagement to reduce plastic pollution in 2020/21.
Local Policies and Strategies
The FNQROC – Regional Waste Management Prioritisation & Resource Recovery Options report (Arcadis, 2016) adopted the then Queensland Waste Strategy Recycling Targets for 2024 detailed in Table 2. It is noted that both state and federal recycling targets have since been revised. Table 2 Waste Stream Recycling Targets
Waste stream Recycling Target (2024)
Municipal Solid Waste Regional areas 45%
Remote areas – improve practices
Commercial and Industrial Waste 55%
Construction and Demolition Waste 80%
The FNQROC report recommended a feasibility assessment be undertaken to establish a local plastics reprocessing facility which could address the problem waste stream of film plastic, as well as existing rigid plastics, and provide a new local industry with employment opportunities. It was recommended that the feasibility assessment would include an assessment of plastic waste

REPORT
| Plastics Industry Feasibility Study | 3.0 R3 | 17 December 2020 rpsgroup.com Page 8
generation across all sectors (domestic, commercial, and agricultural), review of technologies, options for collections, and potential products and associated markets. One of the long-term priorities (5-10 years) recommended the development of consolidating the targeted strategies and plans into a single Regional Waste Strategy which is supported and recommended to allow for implementation of the regional plastic recycling project. Cairns Regional Council have also developed a Waste Reduction and Recycling Strategy 2018 – 2027 which includes five objectives focused on addressing the current resource recovery and waste management challenges and opportunities in the Cairns region as follows:
1. Provide education and awareness: empowering the community to embrace waste avoidance, reduction and use
2. Reduce waste: where Council and community take responsibility for reduce their own waste and using resources effectively
3. Maximise resource recovery: to reduce landfill disposal through resource recovery opportunities
4. Secure our future needs: where our capacity and capability to manage future waste is secured
5. Advocacy and collaboration: to lead strategic alliances and partnerships to support best practices in waste management.

REPORT
| Plastics Industry Feasibility Study | 3.0 R3 | 17 December 2020 rpsgroup.com Page 9
3 METHODOLOGY 3.1 Feasibility Assessment Steps
The Feasibility Assessment was conducted in three main stages, which were: 1. Research and analysis 2. Options identification 3. Options assessment. Figure 2 Feasibility assessment stages summarises the key tasks completed in each stage.
Figure 2 Feasibility assessment stages
3.1.1 Research and analysis
The team conducted primary and secondary research to support the identification and assessment of options. This research included discussions with stakeholders, and obtaining and analysing:
• Background research including review of local, state and federal policy
• Socioeconomic data
• Infrastructure data
• Waste data
• Market data. The evidence obtained from these research activities provided a picture of the current state of plastic waste in FNQ, and contextual factors that helped narrow down the potential options for a feasible recycling hub in FNQ. The methodologies used to conduct each component of the research, such as the Material Flows Analysis (MFA) and assessment of comparative advantage, is detailed in Section 4.3. A summary of stakeholders consulted and the key messages obtained from stakeholder feedback is provided in Appendix 2. The team used the following main publicly available data sources:
• Australian Government of Environment and Energy, 2018, Australian Plastics Recycling Survey 2017-18

REPORT
| Plastics Industry Feasibility Study | 3.0 R3 | 17 December 2020 rpsgroup.com Page 10
• Queensland Department of Environment and Science Queensland Waste Data System (2018-19)
• Liaison with industry stakeholder to estimate volumes that are produced but not recycled The research and analysis stage concluded with a stakeholder workshop on the comparative advantage of FNQ for a plastic recycling hub. The strengths, weakness, opportunities and threats for the region (see Section 4.4 for results), informed the selection of potentially feasible options for further analysis.
3.1.2 Options identification
A workshop was held with key stakeholders to identify shortlisted options. The selection of the shortlist based on the desktop and stakeholder research, as well as a SWOT analysis and a review of barriers and drivers for plastic recycling within the region (refer to Section 4.4). The outcome of the workshop was an agreed list of:
• Short-term options to be quantitatively analysed, which present immediate opportunities for FNQ
• Long-term options that may become viable in the future depending how the markets for recycled material develop.
3.1.3 Options assessment
Once the shortlisted options were identified (refer to Section 5.5), they were assessed to understand their economic and financial feasibility. Three main analytical tools were used for this assessment, which were:
• Cost Benefit Analysis (CBA), to estimate the economic, environmental and social benefits and costs of each option from a whole of Queensland perspective
• Economic Impact Assessment, to estimate the impact of each option on regional employment, wages and economic activity
• Financial Assessment, to estimate the costs, revenues and potential funding scenarios for the recycling hub.
The methodologies for these assessments are summarised in the next subsection (Section 3.2). Appendix C provides technical details relating to the analyses, including key parameters and assumptions, and their sources.
3.2 Assessment Framework
The following subsections describe the main assessment steps, how they were conducted, and what they contributed to the overall assessment.
3.2.1 Material Flows Analysis
The Material Flow Analysis (MFA) quantifies the amount and composition of plastic waste material produced in the FNQ region over a specified time period (2020 – 2040). It sets the foundation for this Project by providing data on:
• How much and what type of plastic waste materials are being produced in different parts of the FNQ region each year

REPORT
| Plastics Industry Feasibility Study | 3.0 R3 | 17 December 2020 rpsgroup.com Page 11
• The flow of this material from the source, to the end destinations, which include landfill, local reprocessing, interstate reprocessing and export
• How this is likely to change over the specified time-period.
• The MFA modelling was based on analysing the following main datasets:
• National Waste Database (Blue Environment and REC, 2018)
• Queensland State of the Environment 2017 data
• Data from the Queensland Waste Data System (QWDS)
• Australian Packaging Consumption & Resource Recovery Data (APCO, 2019)
• 2017-18 Australian Plastics Recycling Survey (EnvisageWorks and SRU, 2019)
• Australian Bureau of Statistics (ABS) population and economic data. The above sources were used to estimate the quantities, composition, source location, destination and likely growth of plastics in FNQ over the modelled time period.
3.2.2 Assessment of Comparative Advantage
Based on assessment of the region’s waste profile, economic profile, infrastructure and outlook, the project team considered the unique barriers and opportunities for the region with respect to developing a plastic waste recycling hub. The aim of this assessment was to determine the sort of plastic recycling hub model that may prove advantageous given the region’s unique assets and features. This assessment of comparative advantage was determined by organising the waste, economic and infrastructure data into a Strengths, Weaknesses, Opportunities and Threats (SWOT) framework. Table 3 summarises some of the questions explored as part of this SWOT exercise. Table 3: Application of SWOT to determine appropriate recycling model SWOT factors Questions explored Strengths • Does the region contain sectors that provide a geographically concentrated source of plastic
material to facilitate cost effective collection and transport? • Does the region contain sectors that provide a relatively homogenous (e.g. single polymer)
stream of plastic material to facilitate cost effective recycling? • Are there locations within the region with effective access to major transport infrastructure (e.g.
port, major rail or road-route for freight etc.) to facilitate export to key material buyer markets? • Are there industries in the region that can readily use products made from recycled materials? • Is there enough volume generated to produce ROI?
Weaknesses • Are waste volumes geographically dispersed? • Are waste streams highly mixed in terms of different plastic polymers or material types? • Are remote locations inaccessible through existing transport infrastructure?
Opportunities • Does the region have any burgeoning manufacturing hubs? • Are there any major transport infrastructure projects targeted for the region? • Are existing trade destinations serviced by the region’s transport infrastructure likely to increase
their demand for plastic materials? Threats • Are volumes likely to decrease due to population or economic decline?
• Which environmental assets are particularly vulnerable to degradation from plastic pollution?

REPORT
| Plastics Industry Feasibility Study | 3.0 R3 | 17 December 2020 rpsgroup.com Page 12
3.2.3 Environmental and Economic Objectives
The options were selected and analysed based on how well that are likely to meet the following environmental and economic objectives of a recycling hub in FNQ:
• Application of the waste hierarchy
• The imperative to divert waste from landfill and from leakage into the environment, particularly the Great Barrier Reef (GBR)
• Job creation and economic development
• The drive towards a circular economy. An option that was likely to achieve more of these objectives was preferred over others. The following subsections describe the key considerations in each of these objectives.
3.2.3.1 Waste Hierarchy
The Waste and Resource Management Hierarchy is defined within Section 9 of the Queensland Waste Reduction and Recycling Act 2011 as follows:
The waste and resource management hierarchy is the following precepts, listed in the preferred order in which waste and resource management options should be considered—
a. AVOID unnecessary resource consumption;
b. REDUCE waste generation and disposal;
c. RE-USE waste resources without further manufacturing;
d. RECYCLE waste resources to make the same or different products;
e. RECOVER waste resources, including the recovery of energy;
f. TREAT waste before disposal, including reducing the hazardous nature of waste;
g. DISPOSE of waste only if there is no viable alternative.
Avoidance of plastic use has been a focus for the Queensland Government’s ban on single use plastic bags, which was introduced on 1 July 2018. The aim of the ban was to reduce the impacts of plastic pollution on our environment and particularly to marine life as it was estimated that one billion single-use plastic bags were used in Queensland annually, with around 16 million ending up in the environment (9). This ban will be extended to straws, cutlery, plates, and stirrers from 1 July 2021. A significant reduction of plastic in FNQ could be achieved by reviewing purchasing policies for all government and non-government companies across the region. In particular, the commercial and industrial sector presents opportunities to strongly contribute to these goals, as this is a large source of plastic waste. Re-use of plastic waste without further manufacturing is limited in FNQ. Recycling of plastic waste is occurring at the MRF for domestic and commercial plastics to a limited extent. Council-led education campaigns are currently being employed to divert additional recyclable plastics to the MRF. Containers for Change (refer to Section 4.2) collect both commercial and residential sourced containers, and could be expanded to collect milk bottles, and other containers that are recyclable but not eligible for the 10 cents incentive. Recovery of energy from plastic waste has been reviewed in further detail in the technology assessment (see Section 5.1).

REPORT
| Plastics Industry Feasibility Study | 3.0 R3 | 17 December 2020 rpsgroup.com Page 13
3.2.3.2 Waste Diversion
FNQ ROC has set diversion goals of 45, 55 and 80 per cent for regional areas, C&I and C&D respectively (refer to Table 2). However, state and federal governments have more ambitious targets. Specifically, the Queensland State Government has targeted a 75 per cent recycling rates across all waste types. The Great Barrier Reef Marine Park Authority states that more than 80 percent of marine debris found in the Reef is plastic which can break up into smaller pieces and travel vast distances, increasing the risk of impacts.
An increase in on-ground community clean-ups, targeted education and awareness-raising has occurred in recent years with Traditional Owner groups, Local Marine Advisory Committees, organisations such as Tangaroa Blue and Eco Barge Clean Seas Inc, and many volunteers working hard to clean up the marine environment and the information they collect is used to help identify the source of marine debris.
3.2.3.3 Job Creation and Economic Development
To inform the ranking of options, this report includes analysis of the potential economic impacts from a recycling hub. The development of a local reprocessing will support RDA’s mandate to stimulate employment and economic activity in the FNQ region. Developing a new industry can have both direct and indirect economic impacts. Direct impacts include greater employment opportunities, higher wages as a result, and the profits and taxes generated by economic activity. Indirect impacts include those that flow-on from the direct impacts. For example, a new industry will purchase supply from local businesses, increasing the economic activity, employment and wages in those supply chain businesses. Moreover, higher employment and wages encourage residents to spend more in the local economy, providing further indirect stimulus. Recycling hub options that utilise local employment and suppliers are likely to maximise these economic development benefits.
3.2.3.4 Circular Economy
Developing a recycling hub in FNQ will deliver many economic and environmental benefits. Importantly, developing local reprocessing capacity will facilitate more material to follow a circular economy pathway. Circular economy approaches aim to maximise the value of resources, while minimising environmental impacts. The benefits from circular economy pathways include:
• The retention of material value within the economy
• In some cases, increasing material value by increasing the demand for recovered material
• Stimulating the local economy through investment in processing infrastructure, which contributes to gross regional product (GRP) and employment
• Avoided externalities from landfill
• Avoided externalities from extracting virgin natural resources
• Avoided greenhouse-gas (GHG) emission from shipping the material to export markets.

REPORT
| Plastics Industry Feasibility Study | 3.0 R3 | 17 December 2020 rpsgroup.com Page 14
3.2.4 Economic and Financial Analysis
3.2.4.1 Cost Benefit Analysis
The assessment used Cost Benefit Analysis (CBA), also known as welfare economics, to estimate the economic, environmental and social benefits and costs of the shortlisted options. CBA requires:
• defining the ‘factual’ (i.e. with recycling hub scenario) and the ‘counterfactual’ (i.e. without recycling hub scenario)
• understanding the incremental difference in outcomes between the two scenarios (i.e. how much additional benefits are gained or costs incurred due to the recycling hub)
• estimating the net benefit (or cost)
• expressing the results as a Benefit Cost Ratio (BCR) and Net Present Value (NPV), which is the ratio of benefits to costs, or incremental benefits, respectively.
This approach is often used by government decision makers to evaluate policy or project decisions. The CBA is forward-looking and evaluates the impacts of a recycling hub between 2021 and 2041, with a plant assumed to be operational in calendar year 2022. However, it should be noted that planning and permitting activities are likely to require a minimum of 18 months and potentially more. The CBA used data from the literature on the market and so called ‘non-market’ value of project outcomes. Some outcomes were conducive to valuation with reference to market prices (e.g. the value of recovered plastic material). Other outcomes required non-market valuation techniques. Non-market valuation is applied by either surveying beneficiaries about how much they value certain outcomes (i.e. ‘stated preference’) or deriving an estimate for that value based on the behaviour of beneficiaries (i.e. ‘revealed preference’). This Study utilises market and non-market value data from other previous researchers’ published work, rather than undertaking original surveys or market data analysis for valuation. This method known as the ‘benefit transfer’ approach. The CBA calculates the total benefits and costs of projects over the life of the projects, using a 7 per cent discount rate to compare future year benefits and costs, to current year values in Present Value (PV) terms, as recommended by the Building Queensland (2020). Total benefits and costs are expressed as a Present Value (PV), which represents the aggregate value of all years of benefits or costs after applying the discount rate. Total net benefits are expressed as a Net Present Value (NPV), which is the difference between the PV of benefits and the PV costs. Sensitivity testing was undertaken to test the robustness of results to alternate values for key uncertain assumptions.
3.2.4.2 Economic Impact Assessment
The team estimated the impact of a recycling hub on key economic variables using Input-Output (I-O) analysis. I-O models can provide useful information and analysis on the industrial structure of an economy and, if used appropriately, to assess the impacts of policy changes (Gretton, 2013). Economic modelling estimated the impact of short-listed options on:
• industry output
• employment
• wages and salaries
• Gross State Product (GSP).

REPORT
| Plastics Industry Feasibility Study | 3.0 R3 | 17 December 2020 rpsgroup.com Page 15
The output from an industry represents the market value of goods and services produced. If an intervention is expected to change industry output (e.g. through higher demand for goods and services from an industry), I-O modelling can estimate the associated change in employment, wages and salaries, and industry value added1. The sum of industry value added across all industries in Queensland provides the Gross State Product (GSP) for Queensland. The results of the I-O modelling are presented in Section.
3.2.4.3 Financial Analysis
The Financial Analysis estimated the recycling hub’s cash inflows and outflows each year between 2021 and 2041. The cashflows were then used to estimate an Internal Rate of Return (IRR) for the project, which is an estimate of the return on capital investment. The IRR was compared against the likely Weighted Average Cost of Capital (WACC) of a private investor. The WACC represents the weighted average return expected by the financiers of a company (e.g. lenders and shareholders), and is therefore the benchmark minimum return investments should achieve. If the IRR is less than this minimum benchmark or ‘hurdle rate’, this suggests that the project has a funding gap. Moreover, private sector financial investors are likely to only provide financing, including debt and equity financing, if the funding gap is covered by the public sector or other external funding sources (e.g. through non-government organisations). Therefore, the funding gap indicates the likely level of public sector commitment to underpin the viability of the project. Section 6.5 provides the results of the financial modelling.
3.2.5 Overall Assessment
While the analyses listed above provided useful data to evaluate the feasibility of the project, the ability of the option to meet the defined environmental and economic objectives was the key assessment consideration. The analyses support the assessment by providing data on the likely performance of the options, from an economic and financial perspective, in meeting these objectives.
1 Industry value added is measured as the market value of outputs minus the inputs used in that production (i.e. capital, labour and natural resources).

REPORT
| Plastics Industry Feasibility Study | 3.0 R3 | 17 December 2020 rpsgroup.com Page 16
4 REGION OVERVIEW 4.1 Economic Profile
4.1.1 Industry structure
The FNQ industry structure is relatively diverse, with no individual sectors representing an overwhelming proportion of regional economic activity (refer to Graph 1).
Graph 1 FNQ Value Added by Industry (source: NIEIR) The above figure shows the ‘value added’ (i.e. contribution to Gross Regional Product) of each main industry in financial years 2018/19 and 2013/14. The largest three industries in FNQ in 2018/19 were Healthcare and Social Assistance, Construction, and Agriculture, Forestry and Fishing. Healthcare was the fastest growing of these industries over the period. Notably, Manufacturing in the region comprised a smaller proportion of the economy (6.3 per cent in 2018/19) compared to Manufacturing’s proportion of the Australian economy as a whole (6.6 per cent in 2018/19). The proportion of Manufacturing in FNQ is much lower than some other Australian regions where manufacturing can comprise more than 25 per cent of the economy (e.g. LGAs in Outer Melbourne). On the other hand, FNQ has a relatively large concentration of Agriculture, Forestry and Fishing, at 8.2 per cent of the economy in 2018/19, compared to 2.8 per cent for Australia. The data suggests that FNQ does not have a natural advantage with respect to established manufacturing. However, there may be some sectors producing disproportionately more waste than would be the case in other parts of Australia, such as the healthcare and agricultural sectors.
0
2,000
4,000
6,000
8,000
10,000
12,000
14,000
16,000
2018/19 2013/14
Valu
e ad
ded
by in
dust
ry ($
m p
er y
ear)
Other
Professional, Scientific and Technical Services
Retail Trade
Education and Training
Manufacturing
Transport, Postal and Warehousing
Mining
Public Administration and Safety
Agriculture, Forestry and Fishing
Construction
Health Care and Social Assistance

REPORT
| Plastics Industry Feasibility Study | 3.0 R3 | 17 December 2020 rpsgroup.com Page 17
4.1.2 Employment
Graph 2 Employment by SA3 and Industry (source: NIEIR)shows the industries of employment for the population of FNQ, by SA3 and industry.
Graph 2 Employment by SA3 and Industry (source: NIEIR) The employment data shows that:
• The Cairns – South SA3 is the largest employment centre in the region
• There is a relatively large concentration of employment in healthcare across the region
• There is a relatively large concentration of employment in the agricultural industry in the Innisfail – Cassowary Coast and Tablelands SA3s.
4.1.3 Population Growth and Socioeconomic Profile
Other relevant socioeconomic data for the region include:
• Relatively stable population growth in the region of approximately 1.2 per cent per annum (compound growth) between 2011 and 2016
• A historically high unemployment rate of around 8 per cent, which is relatively high by state and national standards, albeit falling to approximately 6 per cent by March 2020
• A relatively high level of social disadvantage as measured by the ABS’s Index of Relative Socioeconomic Disadvantage (IRSD).
These statistics show that ensuring the development of new employment centres in the region to provide opportunities for a steadily growing population will be an important economic objective. The development of a recycling hub provides an opportunity to contribute to this objective.
0
2,000
4,000
6,000
8,000
10,000
12,000
14,000
16,000
18,000
Agriculture,Forestry and
Fishing
Construction Retail Trade Accommodationand FoodServices
PublicAdministration
and Safety
Education andTraining
Health Care andSocial Assistance
Empl
oym
ent b
y in
dust
ry (p
erso
ns)
Far North
Tablelands (East) - Kuranda
Port Douglas - Daintree
Innisfail - Cassowary Coast
Cairns - South
Cairns - North

REPORT
| Plastics Industry Feasibility Study | 3.0 R3 | 17 December 2020 rpsgroup.com Page 18
4.1.4 Relevance of FNQ Economic Profile
The above economic data suggests that the recycling solutions should be tailored to the specific socioeconomic characteristics of the region. The plastic waste production in the region is likely to be unique due to the industrial profile and geographic dispersion (i.e. large proportion of healthcare and agriculture, spread across a relatively large geographical area). Due to the socioeconomic vulnerability of the region, any economic development opportunities provided by investment in the recycling sector are likely to be important in terms of stimulating employment and economic activity.
4.2 Waste and recycling infrastructure
The research conducted for this study has shown that the plastic recycling infrastructure varies and is generally limited across the region (refer to Appendix A and Figure 3). Most recycling infrastructure and facilities are concentrated within the Cairns SA4 and surrounding region, with limited facilities available throughout the remainder of FNQ. The lack of consistent waste infrastructure throughout the region suggests that there are likely to be areas that are currently underserviced, with respect to plastic recycling, presenting opportunities to improve recycling rates.
4.2.1 Landfills
Due to policy incentives discouraging landfill use, there has been a reduction in landfills in the Cairns area that accept putrescible and other wet waste. Therefore, Cairns and the surrounding LGAs are becoming increasingly reliant on the Springmount landfill, which is a privately-owned regional general waste commercial landfill, located to the west of Mareeba. The facility offers an enclosed gas flare equipment to capture and destroy methane gas and has triple lined leachate evaporation ponds for leachate management (FGF 2019). Due to the engineering design capacity of the landfill, it is the most versatile landfill for the region's general waste collection services. While there are also several smaller public and privately-owned landfills that are used for C&D and C&I wastes in the Cairns region, these are not capable of taking large volumes of general putrescible and wet waste. LGAs within the SA3 – Far North region are predominately reliant on council owned and operated landfills. This is due to the remoteness of these areas and the limited access to larger public facilities.

Legend
Far North Queensland Region
State Controlled Roads
Roads & Tracks
Railway
Ports
Transfer Station
Material Recovery Facility
Containers for Change
Cooktown
Lakeland
Mt CarbineMt Molloy
Silkwood
Atherton
Cairns
CapeFlattery
Weipa
Skardon River
QuintellBeach
Lucinda
Mourilyan
(Data sourced from DES website"Contacts for public waste andrecycling facilities in Queensland")Last updated 11 July 2018 & localCouncil websites.
Thursday Island& Horn Island
Bamaga
Mareeba
PortDouglas
Mossman
Rossville
Hope Vale
Coen
Yarraden
Archer RiverAurukun
Mapoon
Jardine River
Pormpuraaw
Kowanyama
Laura
LockhartRiver
Seisia
Shelburne
Bloomfield
Date: 24-11-2020 | Drawing: PR147714-1a
PRELIMINARY - FOR DISCUSSION PURPOSES ONLY
FNQ Regional Development Area Figure 3 Recycling Infrastructure
RPS Australia East Pty Ltd
ACN 140 292 762
135 Abbott St
PO Box 1949
CAIRNS QLD 4870
T +61 7 4031 1336
F +61 7 4031 2942
W rpsgroup.com

REPORT
| Plastics Industry Feasibility Study | 3.0 R3 | 17 December 2020 rpsgroup.com Page 20
4.2.2 Transfer Stations, MRFs and Source-Separated Recycling
There are approximately 22 registered public recycling facilities or transfer stations located throughout the entire FNQ region (refer to Appendix A). These facilities are accessible for both the public and commercial drop offs. Sorting capability at each transfer station varies throughout the region, however they are generally all able to sort green wastes, ferrous metals (i.e. car bodies, white goods and steel drums), non-ferrous metals, batteries, tyres, e-wastes, regulated materials (i.e. asbestos and tyres) and plastic drums. Besides plastic drum collection operated by the Drum Muster organisation, minimum separation of other comingled materials, including plastics occurs at these transfer stations. While transfer stations facilitate the sorting of material, plastic sorting is limited due to the difficulties associated with separating different materials. Currently, residential kerbside collection of recoverable materials only occurs in LGAs within the SA4 – Cairns area. Within this area there are approximately 83,416 kerbside collection services available only to the Cairns, Douglas shire and Tablelands councils (Appendix A). Once these materials are collected, they are redirected to the Cairns and Tablelands council’s MRFs, where recyclable contents are separated both manually and with specialised sorting equipment. The Cairns MRF services the Cairns and Douglas shire council kerbside recyclables, while the Tablelands MRF services their own residential recyclables. Outside of the Cairns, Douglas and Tablelands LGAs there are no known regular recyclable material kerbside collection services available to the residents. However, a number of regional councils including Mareeba Shire Council and Cook Shire Council offers a mobile style collection service for recyclables; whereby residents can take recyclables to a drop point that is collected weekly and taken to a transfer station for further processing. The absence of kerbside collection across the majority of FNQ is mainly due to the low population density within these areas, and the limited infrastructure to facilitate collection services and further processing. Due to the limited infrastructure and dispersed population, collection, transport and processing is costly. The Cains MRF separates kerbside collection recyclables, some transfer station recyclables and commercial drop offs from around the SA4 - Cairns area. Plastics, such as PET and HDPE are separated from other recoverable materials by mechanical and manual sorting. Each plastic type is then baled and offered to market to interested parties across Australia. Current buyers of the materials are in South East Queensland. $15 million has been invested to upgrade the Cairns MRF, which will double its processing capacity to between 25,000 to 30,000 tonnes of recycling and increase waste diversion from landfill from 40 per cent to up to 85 per cent. Tablelands Regional Council operates a Materials Recovery Facility at the Atherton Transfer Station. The MRF accepts recyclable materials that are placed in household recycle bins or large recycle skip bins at transfer stations.
4.2.3 Stewardship Programs
A number of product stewardship program collection facilities also exist across FNQ, which could be utilised to increase diversion of plastic from landfill. Three of these programs are provided below.
drumMUSTER
drumMUSTER is a stewardship program for the recycling of eligible, cleaned non-returnable chemical containers. It started as the Industry Waste Reduction Scheme (IWRS) initiative in 1998. In 2010, the National Farmers Federation, CropLife Australia, Animal Medicines Australia, Australian Local Government Association and the Veterinary Manufacturers and Distributors Association came to an agreement to create AgStewardship Australia Limited.
REPORT
| Plastics Industry Feasibility Study | 3.0 R3 | 17 December 2020 rpsgroup.com Page 21
AgStewardship is responsible for the collection and governance of the ACCC authorised levy that funds the two voluntary Stewardship programs drumMUSTER® and ChemClear®, which is delivered by Agsafe Limited. The program is voluntary for chemical manufactures who pay the levy of 6 cents per litre/kilogram of the contents of the container. These funds are used to deliver the program through Councils, Community Groups and Collection Agencies which recycle the containers across rural and regional Australia. Since inception over 35,000,000 containers have been collected and recycled throughout Australia. This equates to over 40,000 tons of material diverted from landfill, being burnt or buried. Eligible containers include steel or plastic containers between 1 litre/kg and 205 litres from participating manufacturers. Currently, there are six active councils in FNQ that deliver the drumMUSTER program and in total they have 19 active sites at their transfer stations or landfills. drumMUSTER has approved processors that collect and recycle eligible drumMUSTER containers. These approved processors will collect and bale the drumMUSTER containers from a compound and will go on farm if it has more than 700 clean and empty containers. There are currently four approved processors that service the far north Queensland area. These include three smaller operations and one larger operation that services South Australia, Victoria, New South Wales and Queensland. The three smaller operations collect and bale the drumMUSTER containers and supply the plastic to the larger operation. This larger operation predominantly recycles the plastic and produces underground polymeric cable cover and plastic bar chair (used to support the reinforcing bar and mesh in concrete structures).
Containers for Change
Containers for Change is a product stewardship arrangement for beverage containers. Drink manufacturers fund the costs of operating the scheme and recovering the containers for recycling. The intent of the scheme is to place responsibility on the producer (i.e. drink manufacturers) to reduce the environmental impacts from empty drink containers. The Queensland Government appointed the industry-based, not-for-profit group Container Exchange (CoEx) as the Product Responsibility Organisation (PRO), to develop and run the container refund scheme in Queensland. The PRO is responsible for ensuring that an effective and efficient scheme operates in Queensland, and that there is convenient and state-wide access to container refund points. Containers for Change accepts most aluminium, glass, plastic, steel and liquid paperboard beverage containers between 150ml and 3L are eligible for a 10-cent refund. Container Exchange is a not for profit organization created to establish and run the Containers for Change Scheme in Queensland.
REDcycle
REDcycle collects soft plastics at REDcycle collection bins located at participating supermarkets all around Australia. There are 16 REDcycle bins across FNQ. The collected plastic is returned to RED Group’s facility for initial processing, then delivered to Victorian manufacturer Replas. Replas uses the material as the resource to produce a range of recycled-plastic products, from fitness circuits to sturdy outdoor furniture, bollards, signage and more.

REPORT
| Plastics Industry Feasibility Study | 3.0 R3 | 17 December 2020 rpsgroup.com Page 22
4.3 Plastic Waste Flows
The MFA was developed in two stages. Firstly, the baseline (current) flows of waste were developed based on publicly available waste, population and economic data. These flows show the quantities and composition of plastic material by region, and the main destinations for that material. Secondly, population and economic forecasts were used to develop projections of material flows over the period 2021 – 2041.
4.3.1 Baseline Waste Generation and Recovery
The MFA estimates the quantities and composition of waste by each of the three waste sectors, which are municipal (MSW), commercial and industrial (C&I), and construction and demolition (C&D). Graph 3 provides the estimated volumes of MSW plastic materials between 2016 and 2021, by SA3.
Graph 3 MSW plastic waste by SA3
MSW volumes are expected to grow steadily with population growth. Graph 4 shows the estimated composition of MSW plastics in FNQ. The FNQ MSW plastics stream contains large proportions of HDPE and PP. Major applications for HDPE recycling include films, pallets, wheelie bins, irrigation hose and pipes. While major applications for PP recycling include crate boxes and plant pots.

REPORT
| Plastics Industry Feasibility Study | 3.0 R3 | 17 December 2020 rpsgroup.com Page 23
Graph 4 Composition of MSW plastics in FNQ Graph provides the estimated volumes of C&I plastic materials between 2016 and 2021, by SA3.
Graph 5 C&I plastic waste by SA3 Cairns has a disproportionately higher share of C&I waste due to its larger economy. Graph 6 shows the estimated composition of C&I plastics in FNQ.

REPORT
| Plastics Industry Feasibility Study | 3.0 R3 | 17 December 2020 rpsgroup.com Page 24
Graph 6 Composition of C&I plastics in FNQ The C&I plastics stream in FNQ is estimated to have a large proportion of LDPE and HDPE. Major applications for HDPE recycling include films, pallets, wheelie bins, irrigation hose and pipes. While major applications for LDPE recycling include film and agricultural piping. Graph 7 provides the estimated volumes of C&D plastic materials between 2016 and 2021, by SA3.
Graph 7 C&D plastic waste in FNQ

REPORT
| Plastics Industry Feasibility Study | 3.0 R3 | 17 December 2020 rpsgroup.com Page 25
These volumes are driven by both population and economic activity, as both of these factors contribute to the construction of new housing and infrastructure. It should be noted that the C&D stream is a much smaller source of plastics compared to MSW or C&I. Graph 8 shows the estimated composition of C&D plastics in FNQ.
Graph 8 Composition of C&D plastics in FNQ The C&D stream contains a large proportion of PVC. Major applications for PVC recycling include pipe and floor coverings. Graph 9 shows the estimated recovery rate by Waste Sector in FNQ. The total plastic recovery across FNQ is estimated at 658 tonnes in 2019/20.

REPORT
| Plastics Industry Feasibility Study | 3.0 R3 | 17 December 2020 rpsgroup.com Page 26
Graph 9 Recovery Rate by Waste Sector in FNQ Plastic recovery rates (of approximately 1.9 per cent) are estimated to be relatively low in FNQ, compared to:
• 5.7 per cent in Queensland
• 9.4 per cent in Australia. Graph shows the estimated composition of plastic recovery in FNQ. The main single-polymer streams recovered for recycling in FNQ are PET and HDPE. These streams are expected in even greater proportions going forward due to the deployment of container deposit infrastructure.

REPORT
| Plastics Industry Feasibility Study | 3.0 R3 | 17 December 2020 rpsgroup.com Page 27
Graph 10 Composition of Plastic Recovery in FNQ Graph 11 shows the estimated breakdown of destinations for plastics recovered in FNQ.
Graph 11 Destinations for Plastics Recovered from FNQ

REPORT
| Plastics Industry Feasibility Study | 3.0 R3 | 17 December 2020 rpsgroup.com Page 28
The majority of plastics recovered are estimated to be recycled in-state, followed by exports, recycling in NSW, and then recycling in Victoria.
4.3.2 Packaging vs Non-Packaging
Data from the Australian Packaging Consumption & Resource Recovery Data report, combined with the other material flow data sources reviewed for this Project (refer to 3.2) suggests Queensland has a higher proportion of packaging to non-packaging plastic material, relative to other states. The proportion of packaging material in Queensland waste is estimated at 30 per cent, compared to 18 per cent nationally. In the absence of information to the contrary, it is reasonable to assume that FNQ shares a similar packaging to non-packaging profile as the rest of Queensland. This proportion is informative for this Project, as packaging material contains a much higher proportion of HDPE and LDPE (refer to Graph 12).
Graph 12 Polymer Profile of Packaging vs non-Packaging In particular, the proportion of LDPE in packaging plastics is double the amount in non-packaging.
4.3.3 Potential Opportunity in the Agricultural Sector
The FNQ economy has a relatively large proportion of activity concentrated in the agricultural sector (refer to Section 4.1). The region is particularly well known for banana production. According to the Australian Banana Growers Council (ABGC), Queensland produces 94 per cent of Australia’s bananas, with almost all of that production coming from North Queensland.2 The ABGC noted during stakeholder consultation that banana operations use approximately 150 tonnes of single use plastic banana bags per 1,000 hectares. Applying that to the estimated production from the region, suggests an annual waste production of more than 1,500 tonnes of predominantly HDPE material. Recycling even half of this material would effectively double the region’s plastic material recovery rate, and therefore presents an opportunity warranting further investigation.
2 https://abgc.org.au/our-industry/key-facts/
32.9%19.3%
23.8%
11.7%
0%
10%
20%
30%
40%
50%
60%
70%
80%
90%
100%
Packaging Non-packaging
Plastic – Other plastic
Plastic – EPS (6)
Plastic – PS (6)
Plastic – PP (5)
Plastic – LDPE (4)
Plastic – PVC (3)
Plastic – HDPE (2)
Plastic – PET (1)
REPORT
| Plastics Industry Feasibility Study | 3.0 R3 | 17 December 2020 rpsgroup.com Page 29
4.3.4 Quality of material recovered for recycling
The quality of waste material recovered significantly impacts its recyclability and market value. Material that is collected in homogenous streams (e.g. plastics only, or ideally, single-polymer streams of plastic) attract a higher market value. The level of contamination also influences the value of recovered materials, with streams containing higher levels of non-recyclable material or other types of recyclable material (e.g. paper, glass etc.) carrying a lower market value. There is limited data on the homogeneity and level of contamination of material collected in FNQ. The stakeholder interviews suggested that most recycling is collected as mixed recyclables. From this, individual streams of plastics can be extracted. For example, the Cairns MRF extracts 220 tonnes of HDPE per year, attracting a market value of approximately $250 / tonne. The Recycling and Waste in Queensland 2018 report states that, based on a sample of entities surveyed, 727,000 tonnes of material sent for recycling were not able to be recovered, and were therefore disposed of to landfill as recycling residuals. The report noted that as not all recyclers were surveyed, the total amount of residual is likely to be significantly higher. This suggests that potentially much more than 6.5 per cent of the materials recovered for recycling were considered non-recyclable. This is a relatively large proportion of non-recovery by national standards. The high level of non-recovery suggests that there is likely to be significant scope to improve market values of recovered materials through improved source separation, reduced contamination and more efficient recovery. This could be achieved through education, and collection and recycling infrastructure upgrades.
4.3.5 Market for Recovered Material
The Australian Plastics Recycling Survey 2017-18 reported that there were:
• 2 reprocessors in Queensland that processed HDPE material
• 1 reprocessor that processed PVC material
• 1 reprocessor that processed PP material
• 1 reprocessor that processed EPS material. All of the surveyed reprocessors are located in South East Queensland (SEQ), and most of these are located in Brisbane. The Cairns MRF reports a market value for its HDPE of $250 / tonne. HDPE and PET have historically attracted higher material value in Australian recycling markets than other polymers, albeit there appears to be no recycling of PET in Queensland. Where recycled material is substituting for virgin material, the price of virgin material is an important consideration. Table 4 summarises a recent estimate of virgin material commodity value as at end-June 2020.

REPORT
| Plastics Industry Feasibility Study | 3.0 R3 | 17 December 2020 rpsgroup.com Page 30
Table 4: Virgin material commodity values end-June 2020 ($AUD / tonne) Material Value Comment Plastic – PET (1) virgin resin $1,350–$1,450 Plastic – HDPE (2) virgin resin $1,400–$1,500 Plastic – PVC (3) virgin resin $1,000–$1,200 Unplasticised PVC Plastic – LDPE (4) virgin resin $1,400–$1,500 Plastic – PP (5) virgin resin $1,550–$1,650 Plastic – PS (6) virgin resin $1,900–$2,000
Source: Recovered Resources Market Bulletin July 2020 (WMRR, EnvisageWorks, Sustainability Victoria, 2020)
4.3.6 Impacts of Litter
Approximately two per cent of all plastic is estimated to leak into the environment.3 Plastic materials leaking into marine environments can be particularly harmful, as already discussed. Queensland State of the Environment data show that of all area types in Queensland, beaches have the highest density (plastic items / m2) of plastic litter, with an estimated 31 items per m2. As such, the diversion of plastic to recycling is also likely to reduce the amount of plastic that is littered, and the amount of plastic leaking into marine environments, which impacts on natural assets such as the Great Barrier Reef. The options assessment (refer to 6.1) estimates the potential reduction in plastic litter through the options.
4.3.7 Projected Material Flows (2021-2041)
The generation of plastic waste is likely to continue to grow proportionally with population growth (for MSW waste), economic growth (for C&I waste) and both of these factors combined (for C&D) waste. Graph 13 summarises the projected growth in MSW plastic waste generation, based on 1.2 per cent compound population growth in FNQ, consistent with historical growth. The projections assume constant per capita waste generation.
3 https://www.barrierreefaustralia.com/info/sustainability/marine-plastic/

REPORT
| Plastics Industry Feasibility Study | 3.0 R3 | 17 December 2020 rpsgroup.com Page 31
Graph 13 Projected MSW plastic waste generation Graph 14 summarises the projected growth in C&I plastic waste generation, based on 2.0 per cent compound economic growth for FNQ, which is broadly consistent with the economic growth in the region in recent years. The projections assume constant waste generation per unit of economic activity (GSP).
Graph 14 Projected C&I plastic waste generation Graph 15 summarises the projected growth in C&D plastic waste generation, based on a compositive compound growth rate of 1.6 per cent per annum. This growth rates assumes that both population and economic growth contribute to C&D waste generation.
-
5,000
10,000
15,000
20,000
25,000
2021 2031 2041
MSW
pla
stic
was
te (t
onne
s p.
a.)
Far North
Tablelands (East) - Kuranda
Port Douglas - Daintree
Innisfail - Cassowary Coast
Cairns - South
Cairns - North
-
5,000
10,000
15,000
20,000
25,000
2021 2031 2041
C&I
pla
stic
was
te (t
onne
s p.
a.)
Tablelands (East) - Kuranda
Port Douglas - Daintree
Far North
Innisfail - Cassowary Coast
Cairns

REPORT
| Plastics Industry Feasibility Study | 3.0 R3 | 17 December 2020 rpsgroup.com Page 32
Graph 15 Projected C&D plastic waste generation Without further investment in infrastructure, the recovery rates for plastic material are likely to worsen. Although more waste will be generated due to the combined effects of population and economic growth, the capacity of the existing transfer stations, MRFs and source-separation infrastructure will eventually become constrained. This is like to result in increasingly lower proportions of the additional waste generation being recovered for recycling. That is, while the absolute amount of waste recovery is likely to increase over time (annual tonnes of plastic waste recovered), the relative amount of recovery (waste recovered as a percentage of waste generated) is likely to decrease. This would place increasing pressure on landfills, and environmental assets for plastic wastes that leak into the natural environment. Graph 16 illustrates a scenario depicting the declining recovery rate. The projections show that while recovery is increasing, plastic material being sent to landfill or leaking into the environment is increasing at a greater rate, resulting in the recovery rate declining from 1.9 per cent to 1.2 per cent between 2021 and 2041.
Graph 16 Projected recovery rates over time
-
500
1,000
1,500
2,000
2,500
3,000
3,500
2021 2031 2041
C&D
pla
stic
was
te (t
onne
s p.
a.)
FNQ
1.4%
1.5%
1.6%
1.7%
1.8%
1.9%
2.0%
-
10,000
20,000
30,000
40,000
50,000
60,000
2021 2031 2041
Fate
of p
last
ic w
aste
(ton
nes
p.a.
)
Landfill and environmental leakage Total recovery Recovery rate

REPORT
| Plastics Industry Feasibility Study | 3.0 R3 | 17 December 2020 rpsgroup.com Page 33
4.3.8 Summary of Material Flows
The MFA shows that plastics recovery rates are very low in FNQ relative to state and national benchmarks. The recovery rate of 1.9 per cent in FNQ, compares with approximately 6 and 10 per cent for Queensland and Australia respectively. Without intervention, this recovery rate is expected to worsen. Challenges and opportunities relating to plastic material flows FNQ include:
• A low base of recovery in FNQ provides opportunities for improvements
• C&I is a large source and FNQ has relatively more agriculture than other regions
• The region, like the state, appears to have a greater proportion of packaging than non-packaging plastics, suggesting a potential opportunity in HDPE recovery and recycling – An example of this would be the banana industry, which is very strongly represented in
the region by Australian standards, which may provide an opportunity for the recycling of HDPE bags used as bunch covers
• Healthcare could be another large C&I source
• Increasing the recovery of MSW would require an expansion of municipal collection infrastructure
• Currently, all recovered plastic material is sent to SEQ for recycling. These summary points have been considered, in combination with the region’s economic profile and infrastructure, to inform the identification and assessment of potential recycling hub options.
4.4 Comparative SWOT
A stakeholder workshop held on 15 October 2020, included a SWOT analysis for plastic recycling in FNQ. A summary of the findings is presented below. The workshop identified the following strengths for FNQ for the proposed plastic recycling facility:
• Existing local markets to sell into including Regen Plastics, Mungulli Milk, Babinda Springs, and Cairns Natural Springwater
• Potential customers in the state who prefer to buy local (Local Buy)
• Existing infrastructure and collection systems in place that can be utilised including the Cairns MRF, Containers for Change, Drummuster, Ecycle, Mobile Muster etc.
• Access to port, rail and road infrastructure providing access to the Southeast Asian market.
• Comparative high representation of some industries (e.g. agriculture and health services) with low diversion rates offering opportunity for improvements
• Funding opportunities at state and federal government levels.
• Legislative drivers including the ban on single use plastics and ban on the export of plastic waste are likely to increase customer demand for recycled content.
Weaknesses that were identified during the workshop included:
• Disaggregated sources across the FNQ region with large distances and low volumes
• Low manufacturing base in FNQ
• Large distance to manufacturing hubs in southern states
• Low rate of diversion at present – averaging 1.9% across the region resulting in infrastructure for diversion not being set up, particularly with C&I waste

REPORT
| Plastics Industry Feasibility Study | 3.0 R3 | 17 December 2020 rpsgroup.com Page 34
• Comparatively high cost to recycle at present in this region Opportunities identified during the workshop included:
• Potential to source homogenous streams of plastic from some sectors including agriculture and health services, which provide relatively higher market value and facilitate a circular economy approach
• Technology providers have indicated to government that they have sustainable solutions for the region’s plastic waste.
• Strengthening market for PET, with Coca Cola Amatil purchasing almost the entire supply of Recycled PET (rPET) in Australia.
Threats identified included infrastructure spending in other hubs including SEQ and Victoria.
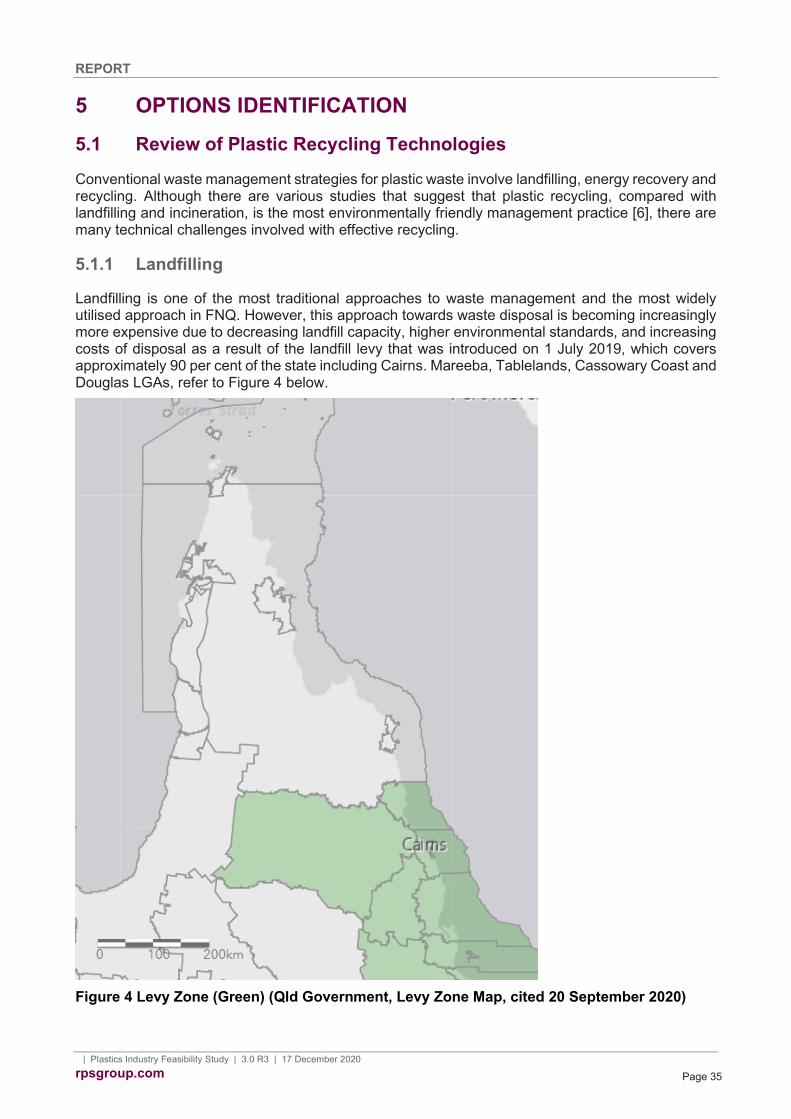
REPORT
| Plastics Industry Feasibility Study | 3.0 R3 | 17 December 2020 rpsgroup.com Page 35
5 OPTIONS IDENTIFICATION 5.1 Review of Plastic Recycling Technologies
Conventional waste management strategies for plastic waste involve landfilling, energy recovery and recycling. Although there are various studies that suggest that plastic recycling, compared with landfilling and incineration, is the most environmentally friendly management practice [6], there are many technical challenges involved with effective recycling.
5.1.1 Landfilling
Landfilling is one of the most traditional approaches to waste management and the most widely utilised approach in FNQ. However, this approach towards waste disposal is becoming increasingly more expensive due to decreasing landfill capacity, higher environmental standards, and increasing costs of disposal as a result of the landfill levy that was introduced on 1 July 2019, which covers approximately 90 per cent of the state including Cairns. Mareeba, Tablelands, Cassowary Coast and Douglas LGAs, refer to Figure 4 below.
Figure 4 Levy Zone (Green) (Qld Government, Levy Zone Map, cited 20 September 2020)
REPORT
| Plastics Industry Feasibility Study | 3.0 R3 | 17 December 2020 rpsgroup.com Page 36
Leachate from landfills is a major point source for plasticizer pollutants, of which, specifically bisphenol A, can affect reproduction, impair development and induce genetic abbreviations in multiple wildlife species [10]. In addition to the costs and environmental issues associated with landfilling, disposal of plastic waste into landfill disregards the finite resources used to create the plastic material as both the energy and the material resource used to make the plastic material are not recovered [11].
5.1.2 Recycling
Whilst avoidance is the preferred method of plastic waste management in the waste hierarchy, recycling is the preferred method to landfilling due to the lower environmental impacts and potential to conserve energy. It is noted that plastic waste materials are only able to be reclaimed when there is both available technology for treatment and a market for the product. Compared with metal recycling, the recycling of plastic polymers can be more challenging due to the relatively low density and low value of the materials and in the case of FNQ, vast distances for aggregation. In general, there are four recycling categories utilised for plastic waste management:
1) Primary (re-extrusion), 2) Secondary (mechanical), 3) Tertiary (chemical), and 4) Quaternary (energy recovery).
The advantages of each of these recycling methods depend on the specific application, available technology and location [12].
5.1.3 Primary Recycling – Re-extrusion
Primary recycling or re-extrusion involves reusing thermoplastic scrap materials or leftovers to re-extrude a new product with similar attributes as the original product. This type of recycling requires relatively clean and uncontaminated plastics to melt and remould into products with the same features, generally HDPE. This process involves heating of the specific polymer which induces deformation, allowing the polymer to be moulded into shape. These polymers are however susceptible to chemical degradation due to molecular damage. These issues are exacerbated due to mixed post-consumer products, therefore in order for re-extrusion to be successful the feed stock usually has to undergo a process to return them back to / close to their original purity [13].
5.1.4 Secondary Recycling – Mechanical Processing
Secondary recycling is the processing of mixed thermoplastic resins into new products with less demanding physical and chemical characteristics than the initial product and is one of the most common recycling technique because less separation is required to achieve a final product [14]. This secondary type of recycling produces a lower quality of product which may not be recyclable, thereby delaying the inevitable scenario of landfilling the product. Mixed post-consumer plastics can be more easily applied in secondary recycling due to the less complex processing methods and the plastics may come in various forms such as moulds or large chunks. The materials may also require cleaning, sorting, size reduction and re-pelletizing in order to produce new feed stock. Due to the wide range plastic materials, there are also additional contamination risks, including how many times the material has been reprocessed, previous thermal damage of the material, single or

REPORT
| Plastics Industry Feasibility Study | 3.0 R3 | 17 December 2020 rpsgroup.com Page 37
mixed polymer product etc. These factors all contribute to the quality of the final recycled product. Therefore, any mixed resin types and stress encountered in the original product may affect the performance of the new product. One of the most common secondary plastic products is plastic timber which can be made for park benches, decking and bulky playground equipment. The simplicity of secondary recycling means it performs well in life cycle assessments for the most environmentally beneficial means for removing mixed plastics from waste streams before incineration or landfill [15]. It is noted that due to the less stringent separating requirements, it is limited in its ability to produce high quality products like primary recycling or virgin materials [13].
5.1.5 Tertiary Recycling – Chemical Processing
Chemical or feedstock recycling involves breaking down of plastic polymers into smaller molecules (monomers) that are easily separated from impurities [13]. When converted through pyrolysis processes using thermal and chemical decomposition without oxygen, the feedstock material creates liquid fuels which can create raw material for petrochemical processes, however, these processes have restriction on the types of materials they can handle. Chemical processing cannot handle waste that has not been sorted for removal of halogens compounds, fillers and metals, and as a result, chemical recycling is more suited to polymers from condensation reactions, such as PET and nylon [13]. Research has suggested that the cost efficiency of feedstock recycling was 50% less than incineration and as a result, is a transitional solution for low-quality plastic which cannot be recycled with mechanical recycling due to technical constraints [16].
5.1.6 Quaternary Recycling – Energy Recovery Through Incineration
Incineration or energy recovery has become a widely used strategy for plastic waste management. The process of incineration reduces the need to landfill plastic material while saving considerable amount of energy [6]. Incineration of plastic waste can also reduce volumes of plastic materials by 90-99%, can significantly reduce reliance of costly landfills for waste disposal [12], and is a common occurrence in the agricultural industry in FNQ. Due to high heating value of plastics, they can be a convenient energy source which, when compared with burning of oils and fuels, the energy derived for burning of plastics is quite similar [ 2]. While there are many benefits of energy recovery from incineration, it is only considered to be justifiable when material recovery processes cannot occur due to economic constraints. This is because there are numerous environmental concerns with incineration of plastic wastes.
A life-cycle-assessment by Damgaard et. al. in 2010 [16] on air pollution controls and energy recovery in waste incineration, in Germany, found that incineration emits more crbon dioxide (CO2) than landfilling.
Pollutants including CO2, Nitrous Oxide (NOx), and Sulphur Oxide (SOx) are found to be exacerbated when burning mixed post-consumer waste materials, but can also result in a greater reduction of Nox and CO2 with improved source-sorting of plastic wastes [18].
Co-incineration
Co-incineration uses the same principle as energy recovery, however, plastic waste becomes a supplementary fuel along with coal and other primary fuels and raw materials. Co-incineration of plastic waste is used by various industries, such as cement, steel manufacturing and power stations
REPORT
| Plastics Industry Feasibility Study | 3.0 R3 | 17 December 2020 rpsgroup.com Page 38
[6]. A number of studies have assessed the resource productivity of plastic waste in co-incineration of cement which concluded that, waste as fuel can effectively decrease the amount of virgin fossil fuels and contribute to environmental protection [19].
5.2 Hub and spoke model
The success of a recycling program is dependent on efficient collection, transport and processing of recoverable materials. Hub and spoke type models can significantly reduce transportation requirements in regional areas and improve the efficiency from both a capital and operational cost perspective. In order to meet the state and federal policies of waste reduction, there needs to be increased access to recycling. This can be achieved by tying-in additional processes with already existing infrastructure. The hub and spoke model works by creating regional recycling processing centres within bigger communities which act as the “hub”. Access to these larger facilities thereby encourages smaller regional communities, or “spokes”, to deliver their recoverable materials to the hubs for further transfer and processing. Smaller communities will usually use mobile drop-off stations to transfer materials to the closest recycling hub. Consistent waste management strategies are key for effective and sustainable waste management in any organisation or community. While Cairns is identified as the main regional hub, due to its centralised locality and access to marine port facilities, there is further requirements for strategic planning in order to coordinate available services for the broader FNQ region. Strategic planning will ensure consistency of waste management processes across the region. This, however, will involve new services and infrastructure be made available to the region.
5.3 Potential for re-manufacturing
Desktop research revealed that there are several plastic fabrication companies located in the region. Moreover, data from the Australian Plastics Recycling Survey 2017-18 identify 5 plastics reprocessors located in SEQ, including 2 that process HDPE, albeit none that process PET. It should also be noted that ReGen plastics in Cairns is also a consumer of recycled resin. Overall, the research from this study suggests that there is likely to be demand for manufacturing plastic products from recycled resin in both the FNQ and SEQ regions. A plastic recycling hub in FNQ could service the demand in these regions. The potential demand for recycled resin is discussion in Section 6.1.
5.4 Shortlist of Options Considered
The agreed short-term options selected for quantitative analysis were:
• Option 1 – HDPE: Recycle HDPE material from FNQ households, businesses and existing programs (Containers for Change and drumMUSTER) at a recycling hub in Cairns
• Option 2 – PET: Recycle HDPE material from FNQ households, businesses and existing programs (Containers for Change and drumMUSTER) at a recycling hub in Cairns

REPORT
| Plastics Industry Feasibility Study | 3.0 R3 | 17 December 2020 rpsgroup.com Page 39
• Option 3 – Waste to Energy (WtE): As a complement to options 1 and 2, recover energy from the residual material that cannot be recycled and would otherwise be sent to landfill.4
Longer-term options included:
• Option 4 – PVC: Solutions for recycling PVC, as the material flows indicated this material may have proportionately higher volume in FNQ due to agricultural sources
• Option 5 – Greater recovery: Actually recycling the proportion of HPDE/PET that could not be feasibly or cost effectively recovered in the short-term, instead of WtE.
4 A stop gap solution for the material than cannot be feasibly or cost effectively recovered at present, also noting this may also be a longer-term option. The material may include, for example, the portion of HDPE bags from agricultural operations that have metal or other coating that provides Ultraviolet (UV) protection, but which makes recycling of that material unfeasible at present.

REPORT
| Plastics Industry Feasibility Study | 3.0 R3 | 17 December 2020 rpsgroup.com Page 40
6 OPTIONS ASSESSMENT 6.1 Supply and demand analysis
6.1.1 Importance of scale and understanding supply and demand volume
Recycling technologies benefit from economies of scale. Higher volumes of material make transport, aggregation and recycling more cost effective. Therefore, the potential scale of the option, in terms of amount of material recycled, is an important driver for economic and financial feasibility. The amount of material that could be feasible to recycle was investigated by considering the potential sources of that material (supply) and the potential buyers of the recycled material (demand). Both supply and demand should be considered as functions of distance and not fixed estimates. For example, a recycling plant could source a certain amount of material within a fixed distance from the plant (e.g. 50km), but could source even more material if the maximum transport distance were increased (e.g. 100-150km), with material sourced further from the plant being more costly to transport.
6.1.2 Sectoral focus
Initially, the project team investigated the feasibility of obtaining feedstock from the municipal and commercial sectors. The team conducted indicative modelling and discussed the results with a steering group, comprising local, state and federal government representatives. A key aspect of that discussion was the challenges with municipal-sourced feedstock, which included:
• That infrastructure is already in place to collect much of that material, including comingled bins, the Cairns MRF, and Containers for Change infrastructure
• There is a risk of comprising the viability of existing infrastructure if there was duplication
• Rolling out plastic-only, or single-polymer, second or third bins is unlikely to be feasible due to the high cost of collection trucks operating low-frequency routes
• Many locations do not have co-mingled yellow bins because, while they have investigated their feasibility in the past, they have proved not to be economic.
Due to these challenges, the study considered commercial sources of feedstock only.
6.1.3 Choice of hub location
The supply and demand analysis requires an assumption about where the hub would be located. The stakeholder, literature and independent desktop research confirmed that the ideal location for a recycling hub in FNQ would be Cairns. The main reasons for this choice were that:
• This is where most of FNQ’s population and economic activity is concentrated, so that Cairns is a sort of geographic ‘centroid’ from a waste production perspective
• Cairns has relatively stronger transport links
• Cairns is highly accessible by road to SEQ, which is where some of the key demand sources are likely to be located
• Cairns is likely to have the labour supply and supporting industry to service the recycling plant.

REPORT
| Plastics Industry Feasibility Study | 3.0 R3 | 17 December 2020 rpsgroup.com Page 41
6.1.4 Supply analysis
Table 5 below shows the results of the supply analysis, showing the potential amount of additional HDPE and PET that could be feasibly recovered within varying distances from Cairns. Table 5: Potential feasible supply of HDPE feedstock in FNQ Potential source1 HDPE (t.p.a) PET (t.p.a) Average distance
from Cairns (km) Estimated additional
bins required2 Lotus Glen (Prison) 45 7 77 2 Mungulli Milk 78 156 133 2 FNQ Banana farms 1,125 - 75 15 Babinda Springs 202 58 58 2 Malanda Dairy 1,116 18 75 3 Pool Shops3 2,600 - 10 15
1 Hospitals are another potential source of supply (e.g. Cairns hospital) but further investigation is required to estimate the volume of material 2 Estimated based on volume and number on discrete source locations 3 One pool shop operator that the project team engaged with (Allan’s Pool Shops) suggested that they could provide most if not all of this volume
The above supply analysis was based on directly engaging with potential waste providers and consulting them on the potential volume of HDPE and PET they could supply. The supply analysis was restricted to sources approximately 150km of transport distance or less from Cairns. Extending the distance to 300km substantially increase transport distance and therefore likely transport costs, but provides limited additional volume.
6.1.5 Demand analysis
The desktop and stakeholder research identified multiple potential demand sources for the recycled material including:
• Dairy farms, potentially providing a demand of up to 1,100 t.p.a of HDPE within 76km of Cairns
• Regen plastics located in Cairns itself
• Plastic product manufacturers in SEQ. While the potential demand for material in SEQ requires further investigation, desktop research revealed that there are several plastic fabrication companies located in the region. Future investigation should confirm the likely scale and nature of demand in that region. Notwithstanding this uncertainty, overall the research suggested that the FNQ and SEQ markets could easily absorb the demand estimated in the supply analysis above. That is, the market is more likely to be constrained by feasible and consistent supply of quality feedstock, than demand. However, an important consideration for a recycling facility is whether to produce food grade or non-food grade material. Due to the diversity of the waste feedstock sources and therefore the associated challenges likely to be faced achieving food-grade quality, this study investigated non-food grade options.
6.2 Multi-polymer option
To increase economies of scale and due to the fact that many of the feedstock sources are able to supply both HDPE and PET, the study consolidated Options 1 and 2 into a multi-polymer hub option.

REPORT
| Plastics Industry Feasibility Study | 3.0 R3 | 17 December 2020 rpsgroup.com Page 42
While the scale of PET supply indicated by the supply analysis is much lower than HDPE, PET provides an attractive market outlook due to the potential demand in the beverage industry. Once the hub is established, it would be beneficial to expand the quantity of PET processed over time to meet that growing demand. Retaining that flexibility provides important option value to enable the plant to capitalise on future market opportunities. For these reasons, the following analysis considered the option of a multi-polymer plant that initially processes 5,166 and 240 tonnes per year of HDPE and PET respectively.
6.3 Environmental Impacts
Table 7 shows the estimated environmental impacts of the options in terms of waste diversion and GHG emission reductions. Table 6: Environmental impact of option Environmental impact Business as usual Multi-polymer plant Increased recovery of plastics - 5,405 t.p.a Recovery rate (FNQ, 2022) 1.9% 17.1% Embodied emissions reduced - 5,082 tCO2-e / year
6.3.1 Potential litter reduction benefits
Litter reduction is another potential benefit following the implementation of options. However, litter reduction would only be achieved if the additional material collected for recycling is obtained from ‘away from home’ public places that are not currently serviced by recycling infrastructure or programs such as Containers for Change. Examples of such locations include parks, train stations, shopping centres and sportsgrounds. Therefore, the central estimates of environmental and economic benefits exclude litter reductions. However, the sensitivity analysis provides a scenario for such benefits if some of the incremental material collected is from away from home locations.
6.4 Cost Benefit Analysis
6.4.1 Cost benefit analysis of multi-polymer option
Graph 17 shows the estimated economic, environmental and social impacts of the multi-polymer plant, expressed in monetary terms using market and non-market valuation methods. Appendix C details the parameters and assumptions used to value the impacts.

REPORT
| Plastics Industry Feasibility Study | 3.0 R3 | 17 December 2020 rpsgroup.com Page 43
Graph 17 CBA results Using conservative assumptions, the multi-polymer plant option is expected to provide a net benefit to Queensland of $50.6m NPV and BCR of 3.1. The strongest drivers of this result are recovered product (material) value and recycling costs.
6.4.2 Material value
The market value of recovered material is a key uncertainty. Investigations conducted as part of this study suggest that if an active market for the material could be developed, the potential value of recovered HDPE and PET would be sufficient to underpin the economic feasibility of a plant. However, an active and liquid (i.e. high volume) market for the materials does not exist at present in FNQ. This suggests that government can play an important market development role to facilitate the creation of an active market in the region. Market development activities can include:
• Engaging with potential sources of demand to understand the quality, quantity and consistency of material required to purchase recycled feedstock
• Confirming the price(s) that would be acceptable to buyers. In general, the private sector needs confidence before making an investment or commercial decision (e.g. before signing an offtake agreement to buy recycled feedstock). Governments can support building confidence by providing information (e.g. guidelines on how to manage supply risks), tools and resources (e.g. sample offtake agreements) and brokering (i.e. matching supply with demand).
6.4.3 Recycling costs
The recycling costs have been estimated by analysing published data on the costs of mechanical plastic recycling in Australia and publicly quoted figures on capital investment (refer to Appendix C). The recycling process involves granulating, washing and pelletising. The costs are relatively
$0.00
$10.00
$20.00
$30.00
$40.00
$50.00
$60.00
$70.00
$80.00
Benefits Costs Net benefit
Multi-polymer plant
$m P
V (2
020
pric
es)
Material value Avoided landfill costs (including externalities)
Collection, transport and sorting Recycling (including residual disposal)
Net benefit

REPORT
| Plastics Industry Feasibility Study | 3.0 R3 | 17 December 2020 rpsgroup.com Page 44
uncertain and should be tested through further market engagement. The sensitivity analysis (refer to Section 6.6) show the impact on the NPV and BCR if recycling costs were higher or lower than estimated.
6.4.4 Cost benefit analysis of Option 3
Option 3 involves applying WtE technology to the proportion of residual material from the recycling process that has energy content but would have otherwise been sent to landfill. Using publicly available data, the net cost of WtE for a large-scale plant was estimated at approximately $100 – $120 / tonne of waste feedstock, taking into account:
• Capital costs
• Operating costs
• Revenue from electricity production. This is higher than the current operating and externality costs of landfill (excluding the landfill levy5), suggesting that WtE is unlikely to be an economic option for the residual portion unless there are other benefits (e.g. use of heat). Moreover, a small-scale WtE is likely to cost even more due to lower economies of scale. Based on this analysis, WtE is not recommended as a solution for the residual portion.
6.4.5 Conclusion from Cost Benefit Analysis
The results of the CBA suggest that plastic recycling hub in FNQ is likely to be economically feasible. That is, the estimated economic, environmental and social benefits of a hub are likely to exceed the estimated costs. The sensitivity analysis (refer to Section 6.6) tests the robustness of this conclusion to potential alternative values for key uncertain assumptions.
6.5 Economic Impact Assessment
Following convention, the CBA excludes the benefit of increased economic activity and employment in FNQ flowing from the implementation of a recycling hub. However, this is an important consideration for RDATN, which has a mandate for economic development of the region. Table 8 below shows the estimated contribution of a recycling hub to GRP and employment. It should be noted that the estimated $10.3 million capital investment is based on recycling capex data from other jurisdictions. Therefore, it does not take into account Queensland specific regulatory costs and requirements. Future studies should refine these cost estimates using a bottom-up method, and include a sufficient contingency allowance. The multi-polymer plant is expected to provide stimulus to the local economy through these impacts.
5 As per convention, CBAs should exclude taxes, subsidies and levies but include the externality cost that those items aim to internalise.

REPORT
| Plastics Industry Feasibility Study | 3.0 R3 | 17 December 2020 rpsgroup.com Page 45
Table 7: Economic impacts of a recycling hub in Cairns Economic impacts1 Multi-polymer plant Expenditure $m Capital investment 10.3 Annual operating expenditure 1.0 / yr Contribution to GRP (Year 1) $m Direct $3.2 / yr Flow-on2 $6.7 / yr Total $9.9 / yr Contribution to GRP (ongoing) $m Direct $0.3 / yr Flow-on2 $0.5 / yr Total $0.8 / yr Contribution to employment (Year 1) FTE / year Direct 30 / yr Flow-on2 53 / yr Total 83 / yr Contribution to employment (ongoing) FTE / year Direct 4 / yr Flow-on2 6 / yr Total 8 / yr
1 Estimated using the Flinders University Economic Impact Analysis Tool (EIAT), which uses Input-Output modelling, but adjusted using stakeholder data on the employment requirements for a recycling facility. The EIAT is accessible at http://eiat.aurin.org.au/#/eiat/home.
2 Flow on GRP and employment impacts refer to economic activity and employment induced through the supply chain (i.e. industries supporting the recycling hub), and the additional economic activity and employment induced through spending of wages back in the economy.
6.6 Financial Assessment
The financial assessment analyses the cashflows likely to be incurred by a plastic recycling hub. The purpose of the financial assessment is to test whether the revenues from the recycling hub are sufficient to service the costs of the hub, including capital, operating and financing costs. Key differences between the financial assessment and the CBA are that the financial assessment:
• Excludes externality costs as these are not cashflows to the hub operator
• Assumes that the recycling hub operator pays for the feedback at traded market prices for that material,6 which provides enough of an incentive for the feedstock provider to fund the collection, transport and sorting of material.
6 Estimated based on stakeholder consultation.
REPORT
| Plastics Industry Feasibility Study | 3.0 R3 | 17 December 2020 rpsgroup.com Page 46
Table 9 summarises the results of the financial assessment. The figures are presented in nominal terms, assuming an annual rate of inflation of 2.5 per cent for both revenues and costs.7 The recycling hub is estimated to provide an Internal Rate of Return (IRR) of 39 per cent and a payback period of 4 years. As long as investors have confidence in the end-markets for recycled material, the rate of return is estimated to be sufficiently healthy to attract private sector investment. The return is likely to significantly exceed the ‘hurdle rates’, which is the rates of return normally required in this context to attract capital (around 10 per cent).
7 2.5 per cent is the mid-point of the Reserve Bank of Australia’s (RBA) target band for inflation.

REPORT
| Plastics Industry Feasibility Study | 3.0 R3 | 17 December 2020 rpsgroup.com Page 47
Table 8: Option 1 - Summary of cashflows ($m nominal)
CASHFLOW ITEM 2021 2022 2023 2024 … 2039 2040 2041 Initial Investment
Capital expenditure $10.3 Revenues Material value $6.8 $7.0 $7.2 … $10.4 $10.7 $10.9 Costs Operating (inc. residual disposal) $1.0 $1.0 $1.0 … $1.5 $1.6 $1.6 Feedstock purchase $1.4 $1.4 $1.5 … $2.1 $2.2 $2.2 Net cashflow -$10.3 $4.4 $4.5 $4.6 … $6.7 $6.8 $7.0 Cumulative cashflow -$10.3 -$5.9 -$1.4 $3.2 $87.7 $94.6 $101.6

REPORT
| Plastics Industry Feasibility Study | 3.0 R3 | 17 December 2020 rpsgroup.com Page 48
6.7 Sensitivity analysis
Sensitivity analysis provides insight into how alternative values of assumptions can affect the outcome (net benefit) of a CBA. The testing focused on those assumptions that are likely to be both material and uncertain. Table 9 presents the results of the sensitivity analysis. Table 9 Sensitivity analysis
Variable Reason for test Central Value
Tested Value
Original NPV ($m)
Sensitivity NPV ($m)
Discount rate Recommended by Building Queensland 7% 4% $50.6 $64.8
Discount rate Recommended by Building Queensland 7% 10% $50.6 $40.6
Recycling capex Uncertain variable $10.3m $15.5m $50.6 $40.2
HDPE market value Volatile and uncertain $1,564 / tonne
$1,173 / tonne $50.6 $33.4
25% of material sourced from locations where litter is
an issue
Results in environmental benefits from litter reduction 0% 25% $50.6 $54.2
Minimum HDPE market value required to break-
even 1
Opportunity costs may be higher if market prices
recover
$1,564 / tonne $409 / tonne $50.6 $0 (break-
even)
Note 1: Conducted as a break-even test (i.e. estimation of threshold value)
The sensitivity analysis shows that the economic feasibility of the multi-polymer recycling plant is robust to a range values for uncertain assumptions.
6.8 Medium to longer term considerations
6.8.1 Potential options for PVC
The MFA identified PVC as a material that is likely to comprise proportionately more of the FNQ plastic stream, due to the industrial make-up of the region. The Vinyl Council of Australia (VCA) identifies the following barriers to PVC recycling8:
• “Limited availability and unreliability of supply
• Cautionary approach given possible presence of legacy additives in recyclate restricted under European legislation
8 VCA Annual Report 2019 (https://www.vinyl.org.au/images/vinyl/Publications/PDFs/Progress_Report/2019%20PSP%20FINAL%20PUBLISHED%20Annual%20Report.pdf)

REPORT
| Plastics Industry Feasibility Study | 3.0 R3 | 17 December 2020 rpsgroup.com Page 49
• Invalidates the ability to provide warranties (where source of recyclate cannot be established with certainty)
• Product specifications that 100% virgin material be used.”
Considering these barriers, FNQ in isolation is unlikely to have the necessary scale and reliability of supply to underpin feasibility. This study recommends working with other regions to establish the required supply, or waiting until the demand for the feedstock is created due to the emergence of a PVC recycling market in a nearby region (e.g. SEQ). That said, FNQ could be an important location for demand of PVC products using recycled content (e.g. irrigation pipes used in the agricultural sector). This is likely to require addressing the other barriers noted by the VCA (i.e. assurance on legacy additives, warranties and product specifications). Once there is enough scale to warrant PVC recycling in FNQ or SEQ, FNQ could support a circular economy for this material through demand for products in the agricultural and other sectors.
6.8.2 Potential to increase recycling efficiency
Research conducted as part of this study revealed that there is likely to be proportion of material that would not be feasible to recycle and therefore comprise a ‘residual’ to be disposed of at landfill. The residual would include:
• Contaminated material
• The wrong type of material (e.g. an incorrect polymer)
• Part of the item that cannot be recycled at present (e.g. HDPE bags from agricultural operations that have metal or other coating that provides UV protection, but which makes recycling of that material unfeasible at present).
The design and / or location of the recycling hub should consider the potential future recyclability of any material that would otherwise be considered residual at present. For example, the design / location of the hub could provision for future expansion to process more polymers / materials by combining the materials received by the plant with other nearby feedstock sources (e.g. a Containers for Change hub).
6.9 Legislative and Approval Considerations
Site-specific approvals are likely to be required under the relevant Planning Scheme under the Planning Act 2016 (Qld), and under the Environmental Protection Act 1994 if volumes are sufficient to trigger Environmentally Relevant Activity 12 which is defined as manufacturing, in a year, a total of 50t or more of plastic products. It is recommended that, if possible, the recycling hub is co-located with an existing waste facility. The Cairns Manufacturing Hub may be an ideal location for the proposed plastic recycling plant to be located, with the Queensland Government offering up to $4.5 million to build the advanced manufacturing capability in Cairns.
6.10 Summary of Assessment
The options assessment shows that a multi-polymer recycling hub is feasible, and also provides broader environmental and economic stimulus benefits. The sensitivity analysis verifies this finding and shows that the benefits could be larger than estimated if material values or recycling costs are more favourable, or if the options lead to a reduction in litter.
REPORT
| Plastics Industry Feasibility Study | 3.0 R3 | 17 December 2020 rpsgroup.com Page 50
Government can support private investor confidence for investment by providing information (e.g. guidelines on how to manage supply risks), tools and resources (e.g. sample offtake agreements) and brokering (i.e. matching supply with demand). In addition, government programs to increase market development are also recommended including implementing purchasing policies supporting purchase or recycled plastic products from the local region, and developing a regional waste strategy. The assessment also suggests that:
• WtE is unlikely to be economic for the residual proportion that cannot be recycled
• The design / location of the recycling hub should provision for expansion in the future
• The recycling of PVC is likely to be feasible in the future if barriers relating to supply, quality and specifications are addressed.

REPORT
| Plastics Industry Feasibility Study | 3.0 R3 | 17 December 2020 rpsgroup.com Page 51
7 CONCLUSION This study investigated the feasibility of establishing a plastics recycling hub in FNQ. The need to increase plastic recycling is underpinned by a range of local, state and federal government policy initiatives, and widespread concern about the environmental and health impacts of plastic in the environment. FNQ currently has a low rate of recovery of plastics of 1.9 per cent, which compares to:
• 5.7 per cent in Queensland
• 9.4 per cent in Australia. The rate is projected to continue to decline as population and economic growth increases waste generation, but no further investment in recycling infrastructure limits recovery. However, a key challenge for waste infrastructure investment in the region is the sparse population and dispersed volumes, which reduce economies of scale and increase transport costs. Against this backdrop, a hub and spoke recycling model could provide significant economic, environmental and social benefits to the region. The FNQ plastic waste profile is influenced by its relatively larger agriculture and health services industries, and the types of municipal waste consumed in households. This suggests potential opportunities in HDPE, LDPE, PET and PVC recycling. Following an assessment of the region’s unique strengths, weakness, opportunities and threats, the study identified the following options for further analysis:
• Option 1 – HDPE: Recycle HDPE material from FNQ households, businesses and existing programs (Containers for Change and drumMUSTER) at a recycling hub in Cairns
• Option 2 – PET: Recycle HDPE material from FNQ households, businesses and existing programs (Containers for Change and drumMUSTER) at a recycling hub in Cairns
• Option 3 – Waste to Energy (WtE): As a complement to options 1 and 2, recover energy from the residual material that cannot be recycled and would otherwise be sent to landfill9
• And in longer-term: – Option 4 – PVC: Solutions for recycling PVC, as the material flows indicated this material
may have proportionately higher volume in FNQ due to agricultural sources – Option 5 – Greater recovery: Actually recycling the proportion of HPDE/PET that could
not be feasibly or cost effectively recovered in the short-term, instead of WtE. Discussions with the project steering group suggested that a multi-polymer HDPE and PET mechanical recycling plant (hub), collecting material sourced from commercial premises (spokes) would be the most appropriate model for the region. Longer term options are likely to include expanding the recycling plant and opportunities to source PVC feedstock for a larger (e.g. state-wide) PVC recycling plant. Waste to Energy is unlikely to be feasible unless there is sufficient scale and use for the heat. Analysis of the multi-polymer model showed that it is likely to:
• Divert approximately 5,500 tonnes of plastic per year, increasing the recycling rate to 17.1 per cent in 2022, and reducing embodied GHG emissions by around 5,000 tCO2-e / year
9 A stop gap solution for the material than cannot be feasibly or cost effectively recovered at present, also noting this may also be a longer-term option. The material may include, for example, the portion of HDPE bags from agricultural operations that have metal or other coating that provides Ultraviolet (UV) protection, but which makes recycling of that material unfeasible at present.

REPORT
| Plastics Industry Feasibility Study | 3.0 R3 | 17 December 2020 rpsgroup.com Page 52
• Deliver a net benefit to Queensland of 50.6m NPV and BCR of 3.1
• Provide economic stimulus to the region, including the creation of up to 83 FTE direct and indirect jobs during construction and up to 6 during operation
• Provide a potential return to investors of 39 per cent IRR and a payback period of 4 years. Government can play an important support role in facilitating investment in the hub by providing information, tools and resources and brokering (i.e. matching supply with demand). In addition, government programs to increase market development are also recommended including implementing purchasing policies supporting purchase or recycled plastic products from the local region, and developing a regional waste strategy.

REPORT
| Plastics Industry Feasibility Study | 3.0 R3 | 17 December 2020 rpsgroup.com Page 53
REFERENCES [1] Vegter AC, Barletta M, Beck C, Borrero J, Burton H, Campbell M, Costa F, Ericksen M, Ericksson C, Estrades A, Gilardi KVK, Hardesty BD, Ivar do Sul JA, Lavers JL, Lazar B, Lebreton L, Nicols WJ, Ribic CA, Ryan PG, Schuyler QA, Smith SDA, Takada H, Townsend KA, Wabnitz CCC, Wilcox C, Young LC, Hamann M, 'Global research priorities to mitigate plastic pollution impacts on marine wildlife', Endangered Species Research, 2014, 25: 225–247, http://www.int-res.com/articles/esr_oa/n025p225.pdf. [2] World Economic Forum, The New Plastics Economy: Rethinking the future of plastics, January 2016, http://www3.weforum.org/docs/WEF_The_New_Plastics_Economy.pdf, (accessed 23 February 2016), p. 7. [3] World Economic Forum, The New Plastics Economy: Rethinking the future of plastics, January 2016, http://www3.weforum.org/docs/WEF_The_New_Plastics_Economy.pdf, (accessed 23 February 2016), p. 10. [4] World Economic Forum, The New Plastics Economy: Rethinking the future of plastics, January 2016, http://www3.weforum.org/docs/WEF_The_New_Plastics_Economy.pdf, (accessed 23 February 2016), p. 7. [5] Australian Government, Toxic Tide: the threat of marine plastic, 20 April 2016, https://www.aph.gov.au/Parliamentary_Business/Committees/Senate/Environment_and_Communications/Marine_plastics/Report cited 14 September 2020 [6] Siddiqui, J. Govind P.P, 2013. A review of Plastic Waste Management Strategies. Sematic Scholar. Corpus ID: 52060135 [7] Pickering, S.J. 2006. Recycling technologies for thermoset compositive materials – current status. Composites Part A: applied science and manufacturing, 37 (8), pp. 1206 – 1215. [8] Department of the Environment, Water, Heritage and the Arts, Background Paper for the Threat Abatement Plan for the impacts of marine debris on vertebrate marine life, May 2009, p. 2; see also Australian Institute of Marine Science, Submission 11, p. 3. [9] Queensland Government Department of Environment and Science, Plastic Bag Ban, https://www.qld.gov.au/environment/pollution/management/waste/recovery/reduction/plastic-bags/about [10] Oehlmann, J., Schulte-Oehlmann, U., Kloas, W., Jagnytsch, O., Lutz, I., Kusk, K.O., Wollenberger, L., Santos, E.M., Paull, G.C., Van Look, K.J. and Tyler, C.R., 2009. A critical analysis of the biological impacts of plasticizers on wildlife. Philosophical Transactions of the Royal Society B: Biological Sciences, 364(1526), pp.2047-2062.

REPORT
| Plastics Industry Feasibility Study | 3.0 R3 | 17 December 2020 rpsgroup.com Page 54
[11] Wu, G., Li, J. and Xu, Z., 2013. Triboelectrostatic separation for granular plastic waste recycling: A review. Waste management, 33(3), pp.585-597.
[12] Al-Salem, S.M., Lettieri, P. and Baeyens, J., 2009. Recycling and recovery routes of plastic solid waste (PSW): A review. Waste management, 29(10), pp.2625-2643.
[13] Goodship, V., 2007. Plastic Recycling, Science Progress, 90(4), pp. 245–268. doi: 10.3184/003685007X228748.
[14] Hegberg, B., 1992. Mixed plastics recycling technology. William Andrew.
[15] Shonfield, P., 2008. LCA of management options for mixed waste plastics. WRAP, UK.
[16] Wollny, V., 2001. Comparison of Plastic Packaging Waste Management Options: Feedstock Recycling versus Energy Recovery in Germany. Journal of industrial ecology (1088-1980), 5 (3), p. 49.
[17] Damgaard, A., Riber, C., Fruergaard, T., Hulgaard, T. and Christensen, T.H., 2010. Life-cycle-assessment of the historical development of air pollution control and energy recovery in waste incineration. Waste Management, 30(7), pp.1244-1250.
[18] Brattebø, H., and Reenaas, M., 2012. Comparing CO2 and NOX emissions from a district heating system with mass-burn waste incineration versus likely alternative solutions–City of Trondheim, 1986–2009. Resources, conservation and recycling, 60, pp.147-158.
[19] Strazza, C., Del Borghi, A., Gallo, M. and Del Borghi, M., 2011. Resource productivity enhancement as means for promoting cleaner production: analysis of co-incineration in cement plants through a life cycle approach. Journal of cleaner production, 19(14), pp.1615-1621.
[20] Building Queensland. 2016. Cost Benefit Analysis Guide: Supporting Business Case Development.
[21] Marsden Jacob Associates. 2013. Distributional and Cost Benefit Analysis for the Packaging Impacts Decision Regulation Impact Statement. National Environment Protection Council.
[22] BDA Group. 2009. The full cost of landfill disposal in Australia. Canberra: Department of the Environment, Water, Heritage and the Arts.

REPORT
| Plastics Industry Feasibility Study | 3.0 R3 | 17 December 2020 rpsgroup.com Page 55
[23] Marsden Jacob Associates. 2014. Estimate of the cost of hazardous waste in Australia. Available at: https://www.environment.gov.au/system/files/resources/d1889716-2b06-44e1-a62c-3e67ff3d595f/files/cost-hazardous-waste.pdf
[24] Sustainability Victoria. 2018. Resource Recovery Technology Guide. Sustainability Victoria.
[25] BITRE. 2017. Freight Rates in Australia. Department of Infrastructure and Regional Development.
[26] DOEE. 2018. National Greenhouse Accounts Factors. Australian Government.

REPORT
| Plastics Industry Feasibility Study | 3.0 R3 | 17 December 2020 rpsgroup.com Page 56
Waste Services in FNQ

REPORT
| Plastics Industry Feasibility Study | 3.0 R3 | 17 December 2020 rpsgroup.com Page 57
Local Government Area Population Number of red
bin services Number of yellow bin services
Number of public place recycling bins
Number of non-residential services
Number of green bin services
Number of tip shops
Aurukun 1,382 350 0 0 0 0 0 Cairns 165,525 72,401 63,968 55 109 0 1 Cassowary Coast 29,689 13,070 0 0 0 0 2 Cook 4,445 1266 0 10 0 0 1 Croydon 288 85 0 0 0 0 0 Douglas 12,257 7,402 7,401 23 543 0 3 Etheridge 804 137 0 0 0 0 0 Hope Vale 1,081 293 0 0 0 0 0 Mapoon 814 103 0 0 0 0 0 Mareeba 12,791 6,842 0 0 0 0 0 Napranum 1,048 300 0 11 0 0 0 Northern Peninsula Area 3,069 1,000 0 0 0 0 0 Pormpuraaw 833 225 0 1 1 0 0 Tablelands 25,541 12,500 12,500 8 393 0 0 Torres Shire 3,848 1,119 0 0 0 0 0 Torres Straight Island 4,994 1,199 0 0 0 0 0 Weipa 4,240
Wujal Wujal 306 106 0 0 0 0 0 Yarrabah 2,848 468 0 0 0 0 0 Total 275,803
Data has been sourced from the Recycling and Waste in Queensland 2019 report prepared by the Queensland Government, available online at: https://www.qld.gov.au/__data/assets/pdf_file/0033/129669/recycling-waste-report-2019.pdf

REPORT
| Plastics Industry Feasibility Study | 3.0 R3 | 17 December 2020 rpsgroup.com Page 58
Stakeholders

REPORT
| Plastics Industry Feasibility Study | 3.0 R3 | 17 December 2020 rpsgroup.com Page 59
We thank the following stakeholders for their participation and information provided Advance Cairns Allan’s Pool Shop Australian Banana Growers Council Australian Council of Recycling (ACOR) Australian Government, Environmental Protection Division, National Waste and Recycling Taskforce Australian Government Great Barrier Reef Marine Park Authority Australian Packaging Covenant Organisation Australian Road Research Board Babinda Springs Bunnings Cairns Airport Cairns Natural Spring Water Cairns Regional Council Carbon Block CEQ Community Enterprise Qld - Ibis Community Stores Cleanaway Close the Loop Container Exchange (COEX) Cook Shire Council CRC for Developing Northern Australia CSIRO DrumMUSTER Ecobiz Ecycle Enviroland Pty Ltd Everledger FNQ Food Incubator FNQ Growers (Queensland Farmers Federation) Green KPI Gunggandji-Mandingalbay Yidinji Peoples Prescribed Body Corporate Aboriginal Corporation Hilton Hotels Hon Warren Entsch MP, Federal Member for Leichhardt Industry Waste Recovery J.J. Richards LSC Recycling and Rehabilitation Local Government Association of Queensland Lotus Glen Correctional Facility Mams Group Recycling Manufacturing Hub – Cairns, State Development of Development and Manufacturing Industry Medalfield Pty Ltd Mossman Gorge Centre Mungalli Creek Natural Evolution N-Drip Northern Chemicals Norship Marine North Queensland Recycling Agents NRG Alliance Outsource Management OzPoly Innisfail North Plastic Free Cairns Plastic Recycling Australia Ports North QPLAS Queensland Government, Department of Environment and Science Queensland Government, Department of Employment, Small Business and Training

REPORT
| Plastics Industry Feasibility Study | 3.0 R3 | 17 December 2020 rpsgroup.com Page 60
Quicksilver Group RED Group, REDcycle ReGen Plastics ReGroup Ritchie Technology Sea Swift Suez Stocklick Trading Tablelands Regional Council Tangaroa Blue Terrain NRM The Reef Hotel Casino Tim North Marine Torres Shire Council Trinity Petroleum Veolia Vanden Recycling Waste Management and Resource Recovery Association of Australia Waste Recycling Industry Queensland Woolworths

REPORT
| Plastics Industry Feasibility Study | 3.0 R3 | 17 December 2020 rpsgroup.com Page 61
Parameters and Assumptions Used in Options Assessment

REPORT
| Plastics Industry Feasibility Study | 3.0 R3 | 17 December 2020 rpsgroup.com Page 62
Table 10: General parameters
Item Assumption Source / description
Time period of analysis 20 years (2022 to 2041) Costs and benefits estimated over 20 years
Social discount rate 7%
Discount rate used to calculate present values for future costs and benefits in the CBA, based on Building Queensland (2016)
Sensitivity discount rates 4% and 10% Sensitivity range based on Building Queensland (2016)
Price year for CBA figures 2020 prices All figures in the CBA are expressed in real (i.e. inflation-adjusted terms) using 2020 prices
Table 11: Benefits of diversion from landfill
Item Assumption Source / description
Marginal cost of disposal (avoided landfill capital and operating costs) $68.68 per tonne
The long-run marginal financial cost of disposing one tonne of material to landfill in Queensland, based on Marsden Jacob Associates (2013)
Landfill external costs (non GHG) $1.73 per tonne waste BDA Group (2009), average of dis-amenity, air emissions and leachate
Landfill levy (applied in the financial modelling only) $75 per tonne Current landfill levy in Queensland
Table 12: Recovery cost assumptions Item Assumption Source / description
Cost of bins at commercial premises $1,000 each for a 1,500 L bin Stakeholder discussions
Additional cost of collecting the recovered material from a recycling bin instead of a general bin
$31.60 per tonne
Assumes some new collection trucks and / or routes will be required Based on Marsden Jacob Associates (2013)
Cost to transport from spoke locations to hub $11.60 per tonne hour
Cost of a 20-tonne tripper Based on Marsden Jacob Associates (2014)
Average travel distance from spokes to hub 42 km Based on supply analysis
Average speed of trucks transporting to hub 60 km / h Based on road network speed limits
and traffic
Average transport cost to hub $16 per tonne Based on return-trip and transport assumptions outlined above

REPORT
| Plastics Industry Feasibility Study | 3.0 R3 | 17 December 2020 rpsgroup.com Page 63
Table 13: Recycling costs and benefits Item Assumption Source / description
Recycling costs for a 5,405 t.p.a. recycling plant that includes granulation, washing and pelletisation (non-food grade)
$10.3 million in capital expenditure $1.0 million per year operating expenditure $360 per tonne, including operating and amortised capital costs
Derived based on analysis of Sustainability Victoria (2018)1 and proposed Cleanaway plant2
Recycling efficiency 80% Approximate benchmark for the industry
Bulk freight costs (for pellet sales) 8 cents / net tonne kilometre BITRE (2017) Road transport distance from Cairns to SEQ 1,700 km Google maps
Cost to transport outputs to SEQ markets $136 per tonne Based on freight rate and distance
Market values $1,564 per tonne (HDPE) $1,164 per tonne (PET)
Based on stakeholder discussion and adjusted (discounted) to account for cost to transport to markets
Note 1: Sustainability Victoria (2018) estimate capital costs of $20m for a 12,500 t.p.a. plant and $6m for a 3,000 t.p.a. plant. These estimates have been used to derive a cost function that includes economies of scale effects
Note 2: https://www.cleanaway.com.au/sustainable-future/cleanaway-pact-asahi-announce-new-plant/
Table 14: Economics assumptions for Waste to Energy Item Assumption Source / description Capital costs $20 / Watt installed (large scale plant) ecogeneration1 Waste processed 12.3 tonnes per kW per year ecogeneration1 Allowance for operating costs 10% Approximation Calorific value in waste 10.5 GJ / tonne DOEE (2018) Generation efficiency 35% Assuming no heat offtake
Potential wholesale energy value $50 / MWh Approximate Queensland wholesale energy value
Net cost of WtE expressed as $ per tonne of waste processed $102.3 / tonne of waste
This excludes disposal of residual and also smaller plants are likely to be much more expensive
Note 1: https://www.ecogeneration.com.au/why-throw-it-away-waste-to-energys-role-in-our-future-energy-mix/