A COMPARISON OF GELATIN AND TRADITIONAL PLASTICS
23
A COMPARISON OF GELATIN AND TRADITIONAL PLASTICS Grant Proposal Team H: Allison Brookhart, Bao Le, Amelia Navarre, Kelly Simpson, Ame Tsamasse
-
Upload
khangminh22 -
Category
Documents
-
view
4 -
download
0
Transcript of A COMPARISON OF GELATIN AND TRADITIONAL PLASTICS
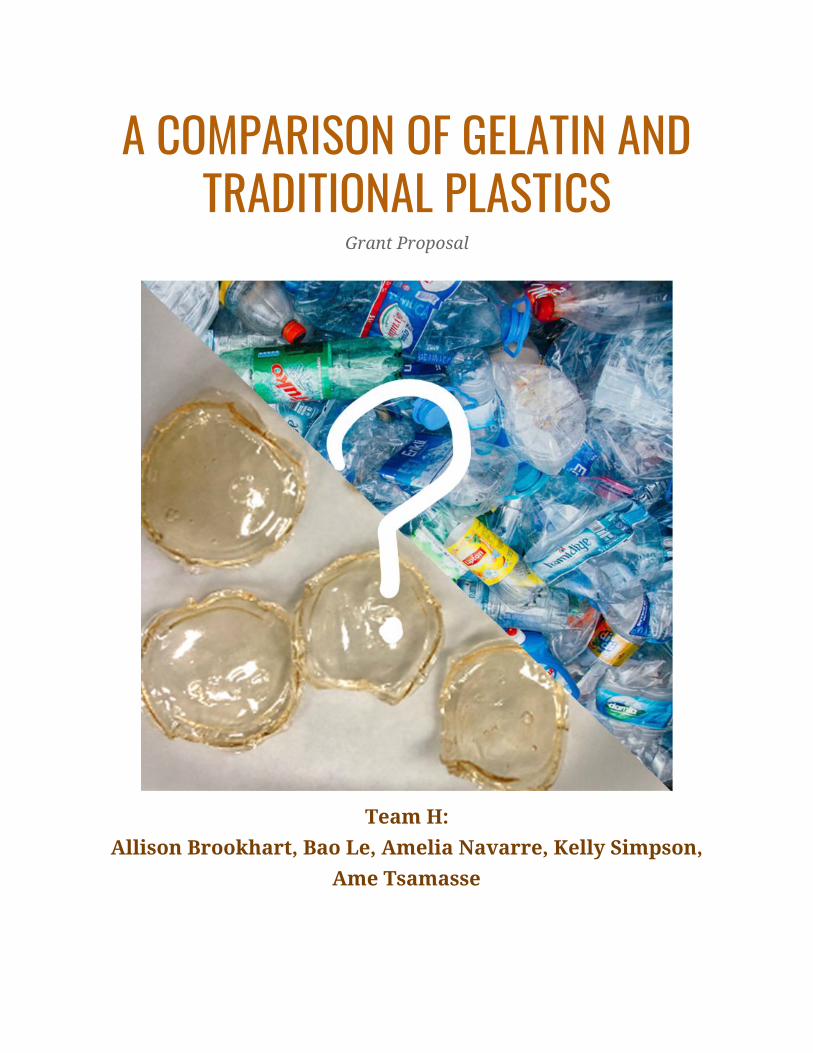
A COMPARISON OF GELATIN AND TRADITIONAL PLASTICS
Grant Proposal
Team H:
Allison Brookhart, Bao Le, Amelia Navarre, Kelly Simpson,
Ame Tsamasse
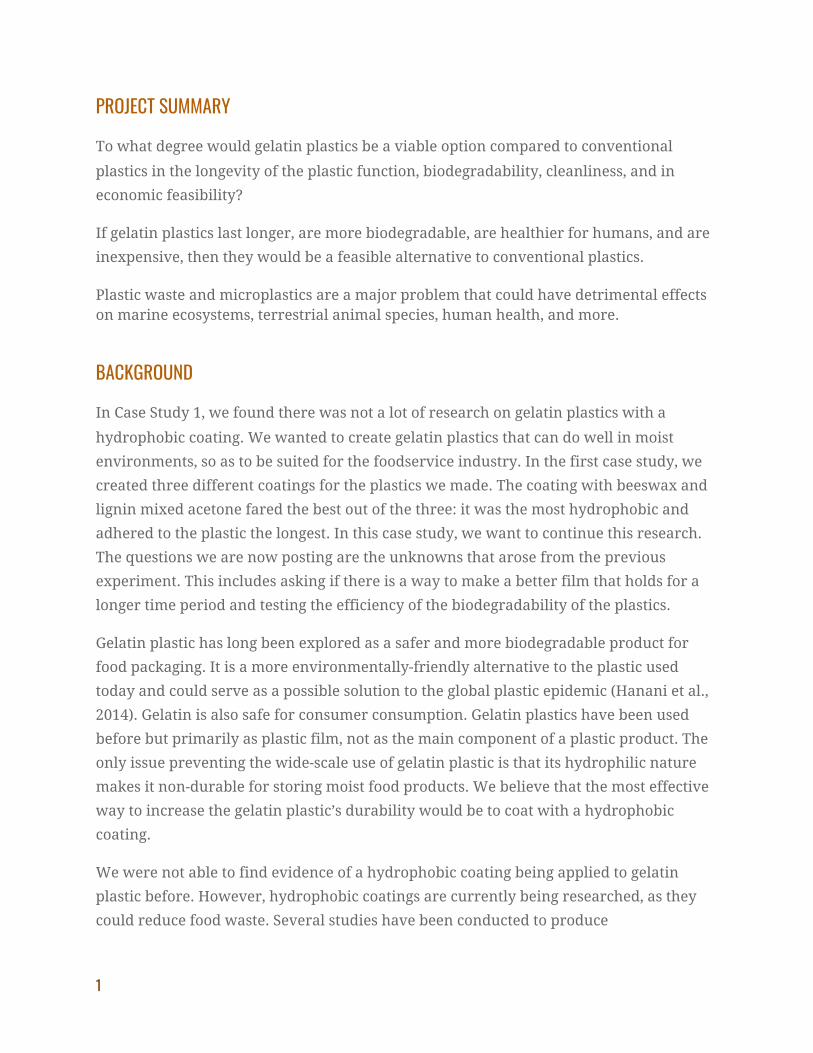
PROJECT SUMMARY
To what degree would gelatin plastics be a viable option compared to conventional
plastics in the longevity of the plastic function, biodegradability, cleanliness, and in
economic feasibility?
If gelatin plastics last longer, are more biodegradable, are healthier for humans, and are
inexpensive, then they would be a feasible alternative to conventional plastics.
Plastic waste and microplastics are a major problem that could have detrimental effects on marine ecosystems, terrestrial animal species, human health, and more.
BACKGROUND
In Case Study 1, we found there was not a lot of research on gelatin plastics with a
hydrophobic coating. We wanted to create gelatin plastics that can do well in moist
environments, so as to be suited for the foodservice industry. In the first case study, we
created three different coatings for the plastics we made. The coating with beeswax and
lignin mixed acetone fared the best out of the three: it was the most hydrophobic and
adhered to the plastic the longest. In this case study, we want to continue this research.
The questions we are now posting are the unknowns that arose from the previous
experiment. This includes asking if there is a way to make a better film that holds for a
longer time period and testing the efficiency of the biodegradability of the plastics.
Gelatin plastic has long been explored as a safer and more biodegradable product for
food packaging. It is a more environmentally-friendly alternative to the plastic used
today and could serve as a possible solution to the global plastic epidemic (Hanani et al.,
2014). Gelatin is also safe for consumer consumption. Gelatin plastics have been used
before but primarily as plastic film, not as the main component of a plastic product. The
only issue preventing the wide-scale use of gelatin plastic is that its hydrophilic nature
makes it non-durable for storing moist food products. We believe that the most effective
way to increase the gelatin plastic’s durability would be to coat with a hydrophobic
coating.
We were not able to find evidence of a hydrophobic coating being applied to gelatin
plastic before. However, hydrophobic coatings are currently being researched, as they
could reduce food waste. Several studies have been conducted to produce
1
“Superhydrophobic coatings” that are safe for consumers (Liu et al, 2019). The goal of
creating these coatings is so they can be used inside food containers to reduce food waste
(Liu et al, 2019). For example, coating a ketchup bottle in a superhydrophobic coating
would ensure that all the ketchup could easily be used, rather than some being stuck at
the bottom. Although these coatings have been researched, their potential for use on
gelatin plastics has not yet been realized.
These two studies are examples of consumer-safe superhydrophobic coatings:
“Superhydrophobic coatings with edible biowaxes for reducing or eliminating liquid
residues of foods and drinks in containers” and “Fabrication of superhydrophobic
coatings with edible materials for super-repelling non-Newtonian liquid foods”. These
studies successfully created spray-on coatings using a bio-wax and an emulsifier, such as
ethanol or acetone (Liu et al, 2019). These coatings successfully repelled liquids and
would not be harmful to the consumer (Wang et al., 2017). We believe that applying
these coatings to gelatin plastic products could make the gelatin plastics more durable
and increase their longevity.
METHODS
The Longevity of Plastic Function
a. Overview of study design
We will place the plastic in different environments that represent the foodservice
industry. We will place the plastic in a container with water, a container with soapy
water, and a container with dry rice. We will also test the plastic at different
temperatures by placing it in the fridge and microwaving it.
b. Data Collection Procedure
In order to determine the longevity of plastic function, we will expose the plastic
in various environments. There will be five different situations that the plastic will be
tested including submerging it in water, soapy water, dry rice, and exposing it to the cold
temperature of the fridge, and the microwave.
Firstly, for the submerging part, we will first have to weigh all the samples and
record their initial weights. Then, submerge three samples into each container of water,
soapy water, and dry rice, while keeping one additional sample per container as a
2
control. We will leave the samples in the containers for a week, then come back to check
for the result. We hypothesize that in the containers of water and dry rice, the plastic
will not yield any change in its composition. However, in the container of soapy water,
we hypothesize that it will erode a little bit because the nonpolar hydrocarbon tail of the
soapy water might react with the beeswax in the gelatin plastic.
In contrast, water and dry rice will not do any change to the plastic because of
their mild, low reactivity characteristics. We will monitor this process by checking on
the containers every two days. We will collect the samples at the end of the seventh day
and bring them to the lab. We will determine the change in the sample in two ways. We
will first observe the samples to look for any abrasion in the samples. To be specific, we
will use a scanning electron microscope (SEM) to characterize the morphology of the
sample surface because the equipment can provide a three-dimensional (3D) image with
high resolution (Rydz, 2019). On the other hand, we will weigh the samples to see any
addition or reduction in their weights compared to their initial weights.
Secondly, for the cold temperature part, we put three samples into the fridge and
leave one additional sample for control. We will leave the samples in the fridge for three
days, then come back every day to check on the process. Every day we will take a picture
of the samples so that we can detect any change with the plastic. In this part of the
experiment, we only focus on the outward appearance of the gelatin plastics. We
hypothesize that the samples will not shrink down because of the coldness of the fridge.
We think this is the case because the sturdy structure of the beeswax will help the plastic
to not deform in cold temperatures. At the end of the third day, the samples will be
collected.
Lastly, for the microwave part, we put one sample at a time into the microwave
and leave one additional sample for control. We will microwave the sample for 1 minute,
then will collect the sample. The procedure will be carried out three times. We
hypothesize that the sample will be deformed because the microwave might interrupt
the structure inside the gelatin plastics. After each trial, we will observe the microwaved
sample and compare it to the control. We would like to test our plastics with a
microwave since the consumer will likely microwave the container with food in it.
c. Data Analysis
3
The method of analyzing the data we collect will vary depending on the
environment of testing.
For the submerging part, we will use both observational data and weighting data.
We will weigh the samples before the experiment and weigh them again after the
experiment to detect any reduction in the weights of the samples. Then, we have to
observe the final samples using SEM to look for any abrasion on the surface of the plastic
due to the possible chemical reaction between the plastic and the solution in the
container. Our null hypothesis for the part is that the plastics in the soapy container will
reduce its weight and have some abrasions on their surfaces. Then, when we obtain all
the data, we will plot the graph of the initial vs final weights of the samples in the three
containers. The x-axis will be the names of each container with four sub-columns for
three samples and one control in each container. Underneath the x-axis, we will denote
under the sub-column about any abrasion we visually detect. The y-axis will be the
weights denoted in grams.
For the fridge part, we will take a picture of plastics for every day they stay in the
fridge to record any changes in the plastics throughout the experimental process. In the
end, we will compare the pictures we took to detect any trait of changes in the
appearance of the plastics.
For the microwaving part, we will microwave each sample at a time. The
microwaved samples will then be analyzed to see whether they shrivel up (being
deformed and not usable) during the microwaving process. We will compare the final
samples with the control to determine any changes have occurred.
Biodegradability in soil
a. Overview of Study Design
In order to measure the biodegradability of the gelatin plastic, we will be using an
altered ISO 14852 method, which measures the amount of carbon dioxide evolved, for
the determination of the degree of aerobic biodegradability of plastic materials. The
biodegradation rate is calculated by comparing the experimentally determined amount
of evolved CO2 from degraded materials with the theoretical amount of evolved CO2. We
will be comparing the gelatin plastic that we made with a store-bought plastic container.
(Guo, 2010)
4
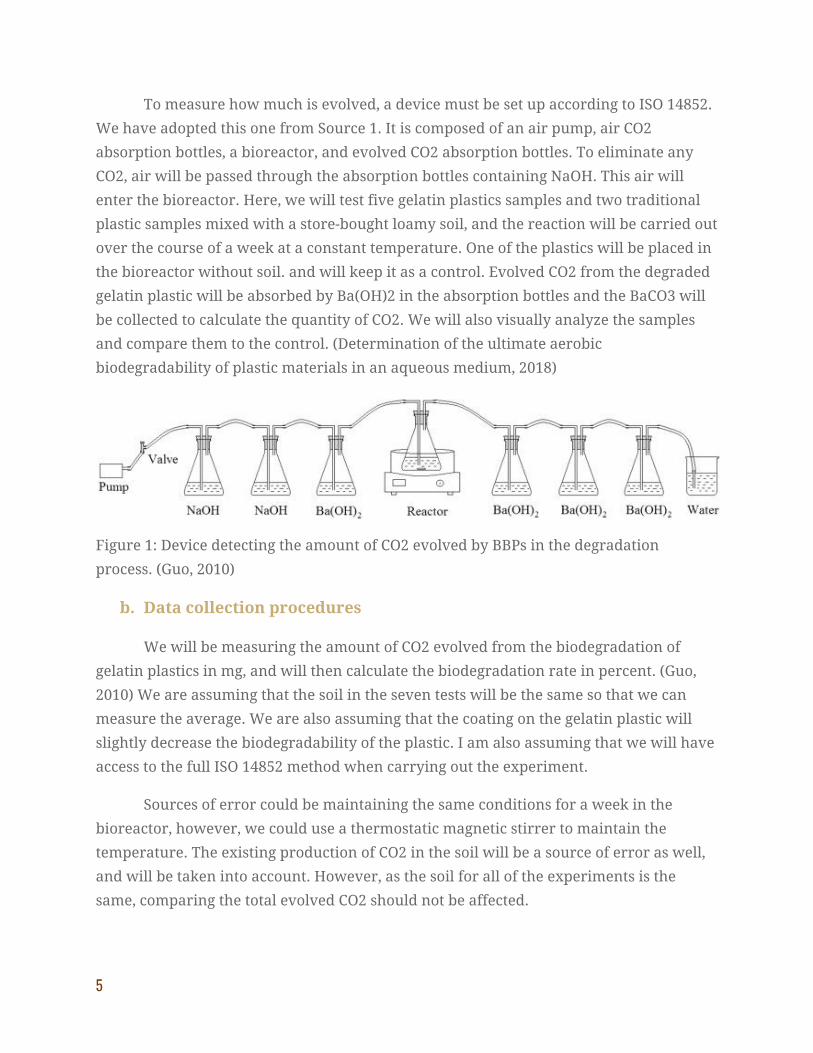
To measure how much is evolved, a device must be set up according to ISO 14852.
We have adopted this one from Source 1. It is composed of an air pump, air CO2
absorption bottles, a bioreactor, and evolved CO2 absorption bottles. To eliminate any
CO2, air will be passed through the absorption bottles containing NaOH. This air will
enter the bioreactor. Here, we will test five gelatin plastics samples and two traditional
plastic samples mixed with a store-bought loamy soil, and the reaction will be carried out
over the course of a week at a constant temperature. One of the plastics will be placed in
the bioreactor without soil. and will keep it as a control. Evolved CO2 from the degraded
gelatin plastic will be absorbed by Ba(OH)2 in the absorption bottles and the BaCO3 will
be collected to calculate the quantity of CO2. We will also visually analyze the samples
and compare them to the control. (Determination of the ultimate aerobic
biodegradability of plastic materials in an aqueous medium, 2018)
Figure 1: Device detecting the amount of CO2 evolved by BBPs in the degradation
process. (Guo, 2010)
b. Data collection procedures
We will be measuring the amount of CO2 evolved from the biodegradation of
gelatin plastics in mg, and will then calculate the biodegradation rate in percent. (Guo,
2010) We are assuming that the soil in the seven tests will be the same so that we can
measure the average. We are also assuming that the coating on the gelatin plastic will
slightly decrease the biodegradability of the plastic. I am also assuming that we will have
access to the full ISO 14852 method when carrying out the experiment.
Sources of error could be maintaining the same conditions for a week in the
bioreactor, however, we could use a thermostatic magnetic stirrer to maintain the
temperature. The existing production of CO2 in the soil will be a source of error as well,
and will be taken into account. However, as the soil for all of the experiments is the
same, comparing the total evolved CO2 should not be affected.
5
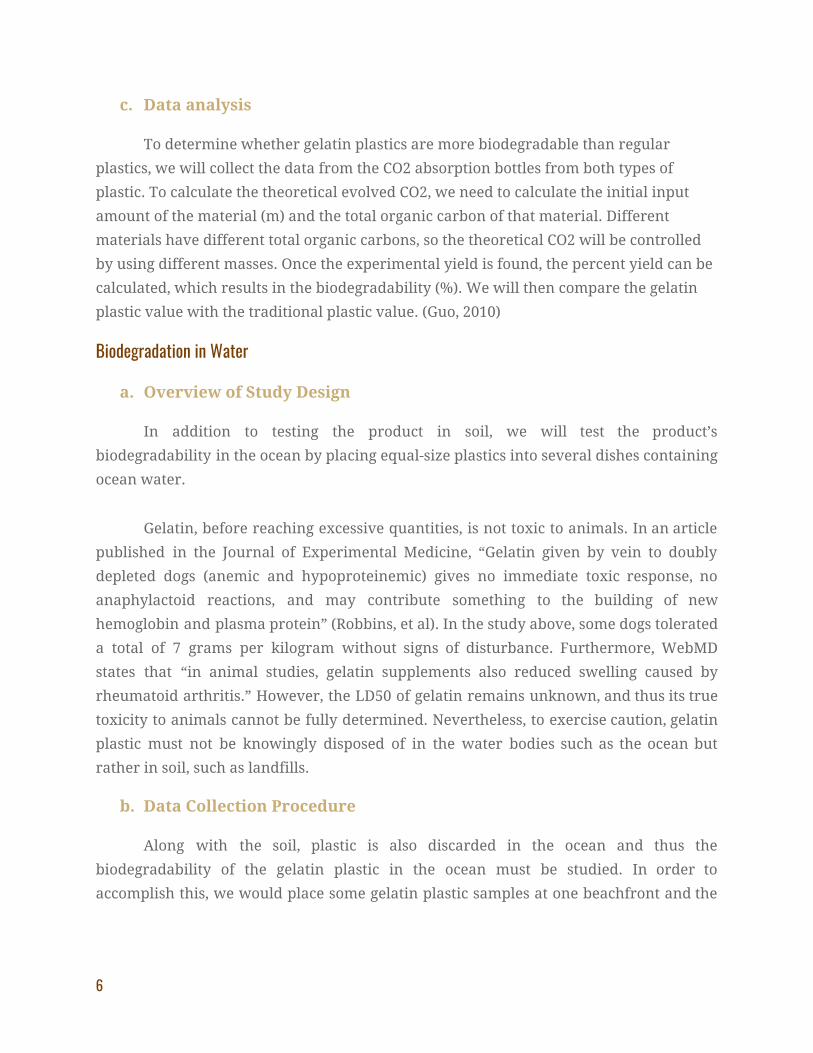
c. Data analysis
To determine whether gelatin plastics are more biodegradable than regular
plastics, we will collect the data from the CO2 absorption bottles from both types of
plastic. To calculate the theoretical evolved CO2, we need to calculate the initial input
amount of the material (m) and the total organic carbon of that material. Different
materials have different total organic carbons, so the theoretical CO2 will be controlled
by using different masses. Once the experimental yield is found, the percent yield can be
calculated, which results in the biodegradability (%). We will then compare the gelatin
plastic value with the traditional plastic value. (Guo, 2010)
Biodegradation in Water
a. Overview of Study Design
In addition to testing the product in soil, we will test the product’s
biodegradability in the ocean by placing equal-size plastics into several dishes containing
ocean water.
Gelatin, before reaching excessive quantities, is not toxic to animals. In an article
published in the Journal of Experimental Medicine, “Gelatin given by vein to doubly
depleted dogs (anemic and hypoproteinemic) gives no immediate toxic response, no
anaphylactoid reactions, and may contribute something to the building of new
hemoglobin and plasma protein” (Robbins, et al). In the study above, some dogs tolerated
a total of 7 grams per kilogram without signs of disturbance. Furthermore, WebMD
states that “in animal studies, gelatin supplements also reduced swelling caused by
rheumatoid arthritis.” However, the LD50 of gelatin remains unknown, and thus its true
toxicity to animals cannot be fully determined. Nevertheless, to exercise caution, gelatin
plastic must not be knowingly disposed of in the water bodies such as the ocean but
rather in soil, such as landfills.
b. Data Collection Procedure
Along with the soil, plastic is also discarded in the ocean and thus the
biodegradability of the gelatin plastic in the ocean must be studied. In order to
accomplish this, we would place some gelatin plastic samples at one beachfront and the
6

rest of the samples at another. This is to account for the global diversity of ocean and
seawater salinity.
After obtaining several water samples, we would engulf five of each gelatin plastic
sample in 5 different cages attached to hooks and at varying depths of the ocean, with
some closer to the surface and others a foot deep. Thereafter the samples will be left
engulfed for 2 months, all along maintaining the schedule of weighing each sample once
per week by pulling up one sample at a time and weighing it on a scale before placing it
back into the cage and returning to the same depth. We are placing the samples directly
in the ocean to account for the normal movement of ocean water.
As a control, one sample will remain dry and exposed to air on a petri dish and
will not be exposed to any water. Slight differences in the lignin beeswax coatings may
result in a minimal error. Therefore, to minimize errors in this experiment, the samples
on each beachfront must be placed around the same area so they may be exposed to the
same sunlight, humidity, and other weather conditions. Snails eating the experiment is
an uncontrolled variable.
In addition, the temperature of two of the water samples will most likely remain
between 15 to 17 degrees (59 to 63 degrees Fahrenheit) in order to reflect the global
average temperatures of ocean surfaces, whilst the other three samples will most likely
be less than 15 degrees celsius (between 10 and 12) in order to reflect the drop in
temperature as one moves further down towards the ocean floor. Thus a thermometer
will be used to check the temperatures of the water surface the samples are in every
weighing in order to make sure the temperature does not fall below or above the
determined range.
Similar to the “biodegradability in soil” test, the data will be collected on-site to
prevent any tearing that may have occurred from moving it, and thereafter it will be
analyzed in a lab.
c. Data Analysis
To measure the salinity of the different water samples, we would use a hand-held
refractometer. This tool uses the refraction of light to determine how much salt is
dissolved in the water.
7

The salinity of oceans differs, although a general average is 35ppt or 3.5%.
Measuring salinity would show us if the water surface resembles the average seawater
most plastics end up in, and the increasing salinity of the water samples would resemble
the increasing depth of the ocean.
The data collected from weighing the samples over time can be inputted into a
line graph demonstrating the exponential decay of gelatin plastic. The x-axis would be
time and it would range from 0 to 2 months, with weeks as the increments (week 1, week
2, week 3, and so on). The y-axis would be the change in weight in grams, and its
increments would be dependent upon how drastic the change in weights of the gelatin
plastics are.
Cleanliness
a. Overview of study design
We will place bacteria and fungus on the plastics. We will then test to see if the
gelatin plastics are as efficiently washed as the store-bought plastic. This will lead us to
conclude if they are a safe reusable method for food storage.
b. Data Collection Procedure
In this part of our study, we will observe how sanitary our plastics are when
cleaned. To start off we would take 10 samples of our gelatin plastics and 10 plastic
containers bought from Walmart. Two of each plastic will serve as a control where
nothing will be placed on it. We will then place a bought culture Escherichia coli on to 4
gelatin plastic and 4 plastic containers. It was decided to use E. coli because according to
PC medicine when food is left in a container for more than 3-4 days bacteria like E. coli
can accumulate. On the last 4 gelatin plastics and 4 plastic containers, we will place a
bought tempeh starter which contains the mold Rhizopus oligosporus. According to
USDA, this is one of the common foodborne molds.
After the plastics have been coated with their respective microbe two of each will
be washed. Therefore 2 gelatin E. coli, 2 plastic E. coli, 2 gelatin rhizopus, and 2 plastic
rhizopus will be washed the other 8 will not be washed. While washing the eight plastics
we will use a solution of warm water and baking soda. With about a tablespoon (15 ml)
of baking soda to a quart (1 liter) of water. This is a way to properly clean containers
8
according to GE appliances. Each plastic will have its own solution and have the same
force and time of scrubbing. They will each be scrubbed for 2 minutes.
Next cultures will be prepared for the 20 plastics. Bacteria cultures will be
prepared for the E.coli and fungal cultures for the samples exposed to the molds. The
controls will have both cultures prepared for them. The bacterial cultures will be
prepared by swabbing and the swab will be rubbed on a culture plate using
Luria-Bertani medium. The two main components of LB media are Tryptone and Yeast
Extract. Tryptone is used in a concentration of 10 gram/liter and Yeast Extract in a
concentration of 5 gram/liter (UK Research & Microbiology). The medium for the
fungus will be composed of media containing high carbohydrate sources, nitrogen
sources are required for the growth of fungi at a pH range of 5 to 6, and both incubated
at a temperature of 37˚C (Basu, 2015). The plates will be incubated for 2-3 days as the
royal society of biology recommends.
The plates will then be taken out of the incubator and observed with and without
a microscope. Quantitative and qualitative characteristics will be observed.
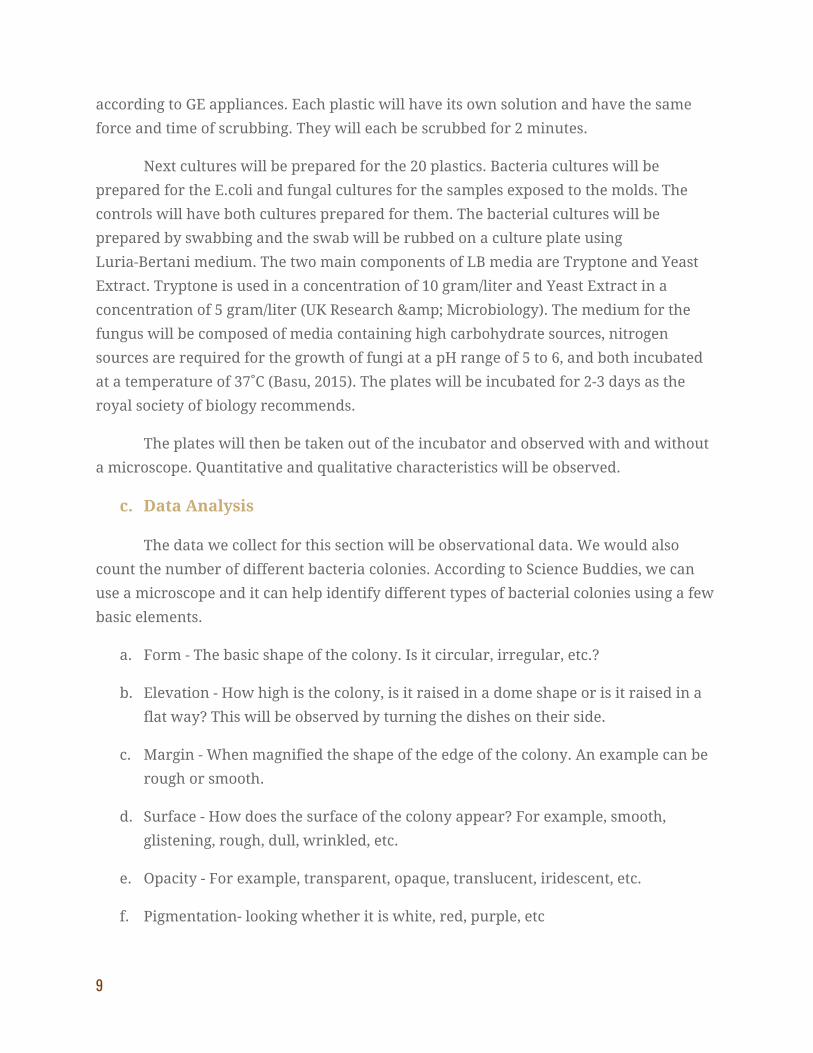
c. Data Analysis
The data we collect for this section will be observational data. We would also
count the number of different bacteria colonies. According to Science Buddies, we can
use a microscope and it can help identify different types of bacterial colonies using a few
basic elements.
a. Form - The basic shape of the colony. Is it circular, irregular, etc.?
b. Elevation - How high is the colony, is it raised in a dome shape or is it raised in a
flat way? This will be observed by turning the dishes on their side.
c. Margin - When magnified the shape of the edge of the colony. An example can be
rough or smooth.
d. Surface - How does the surface of the colony appear? For example, smooth,
glistening, rough, dull, wrinkled, etc.
e. Opacity - For example, transparent, opaque, translucent, iridescent, etc.
f. Pigmentation- looking whether it is white, red, purple, etc
9
The mold will be identified by referencing the scientific paper “A review of fungal
contamination in pharmaceutical products and phenotypic identification of
contaminants by conventional methods” this paper gives detailed descriptions and
pictures of many fungi including Rhizopus.
Once we have identified the type and number of colonies on each sample we will
be able to identify them between the plates per plastic sample. We will then run a
statistical analysis to see if there is a significance between that data set. Our null
hypothesis for this section would be that there is no statistical significance between the
number of bacterial colonies found from each plastic. Along with the statistical analysis,
we will present our data using a bar graph using error bars to differences in data sets.
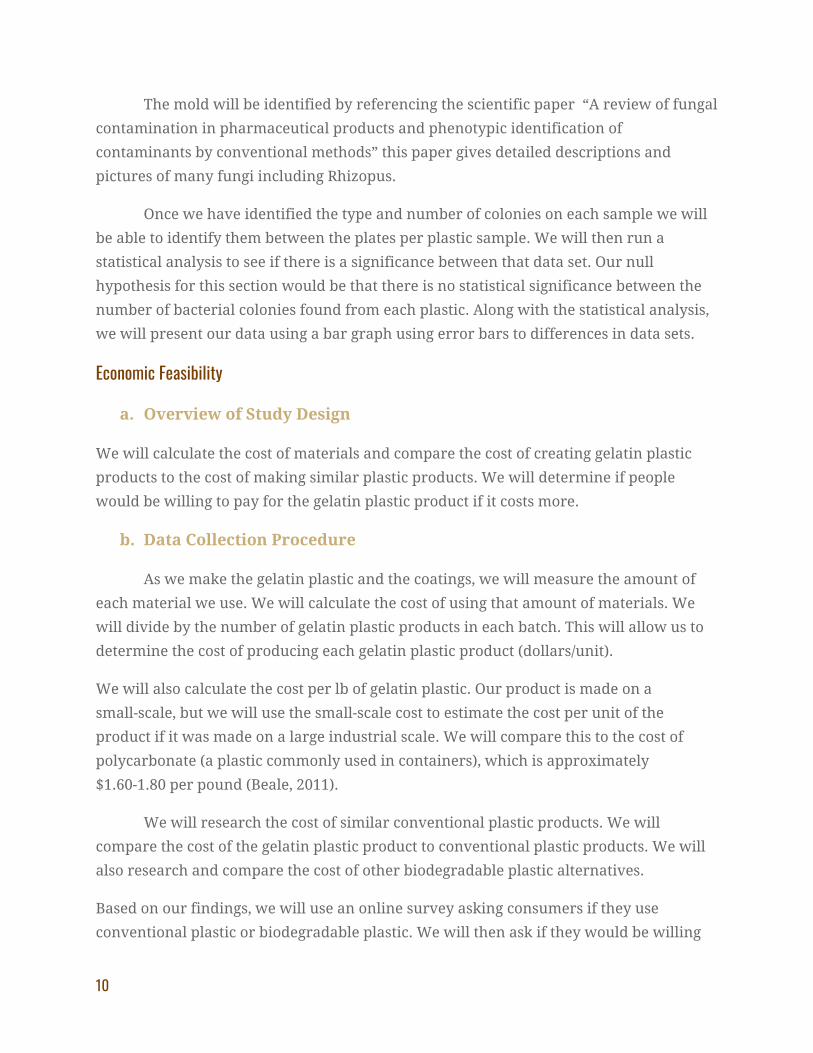
Economic Feasibility
a. Overview of Study Design
We will calculate the cost of materials and compare the cost of creating gelatin plastic
products to the cost of making similar plastic products. We will determine if people
would be willing to pay for the gelatin plastic product if it costs more.
b. Data Collection Procedure
As we make the gelatin plastic and the coatings, we will measure the amount of
each material we use. We will calculate the cost of using that amount of materials. We
will divide by the number of gelatin plastic products in each batch. This will allow us to
determine the cost of producing each gelatin plastic product (dollars/unit).
We will also calculate the cost per lb of gelatin plastic. Our product is made on a
small-scale, but we will use the small-scale cost to estimate the cost per unit of the
product if it was made on a large industrial scale. We will compare this to the cost of
polycarbonate (a plastic commonly used in containers), which is approximately
$1.60-1.80 per pound (Beale, 2011).
We will research the cost of similar conventional plastic products. We will
compare the cost of the gelatin plastic product to conventional plastic products. We will
also research and compare the cost of other biodegradable plastic alternatives.
Based on our findings, we will use an online survey asking consumers if they use
conventional plastic or biodegradable plastic. We will then ask if they would be willing
10

to pay the price we calculate for the gelatin plastic product. If they are not willing to pay
for the gelatin plastic, we will ask what price they would be willing to pay. In the survey,
we will also ask demographic information (age, gender, how much environmentally
conscious they consider themselves on a scale from 1-5, how concerned they are about
microplastics/plastic waste on a scale of 1-5, etc.). Additionally, we will ask if they have
purchased biodegradable plastic alternatives before. The survey will be sent to 100
people of various ages in the Amherst area. The survey will be conducted online.
We are calculating the cost of producing one gelatin plastic product on a small
scale (like during this study) and using that to estimate the cost of producing a gelatin
plastic product on a large scale. Of course, if we were producing the gelatin plastic
product on a large industrial scale, the cost of making each individual unit would be
reduced, but our estimate may be inaccurate. We will also need to assume that people’s
self-assessments about their level of environmental consciousness and their level of
concern about microplastics are accurate.
A potential source of error is that the cost of making a gelatin plastic unit may
vary depending on the amount of each material used, the size of the batch, the time spent
heating the gelatin, etc. We will do our best to be consistent and stick to a procedure. We
will also produce three batches, with twenty gelatin plastic products in each, to ensure
that the average cost/unit is as accurate as possible.
c. Data Analysis
We will create a histogram. On the x-axis, we will have the maximum price people
would pay for our gelatin plastic product, ranging from the cost of cheap conventional
plastic to the actual price we calculated. This will allow us to show how many people
would be willing to buy the gelatin plastic product at the current price. It will also allow
us to determine a target price (at which most people would be willing to buy the gelatin
plastic).
We will also create a bar graph showing the percentage of people in different age
groups that would be willing to pay for the gelatin plastic. We will create a similar bar
graph for gender. We will create a scatter plot comparing how much environmentally
conscious they consider themselves (scale of 1-5) and the percentage of people who
would buy the gelatin plastic. We will create a similar scatterplot with the level of
concern people have about microplastics/plastic waste (scale of 1-5).
11
We will perform a p-test to see if there is a statistically significant difference
between the percentage of people who would buy our product who have bought
biodegradable plastic alternatives before versus those who have not bought
biodegradable plastic alternatives before.
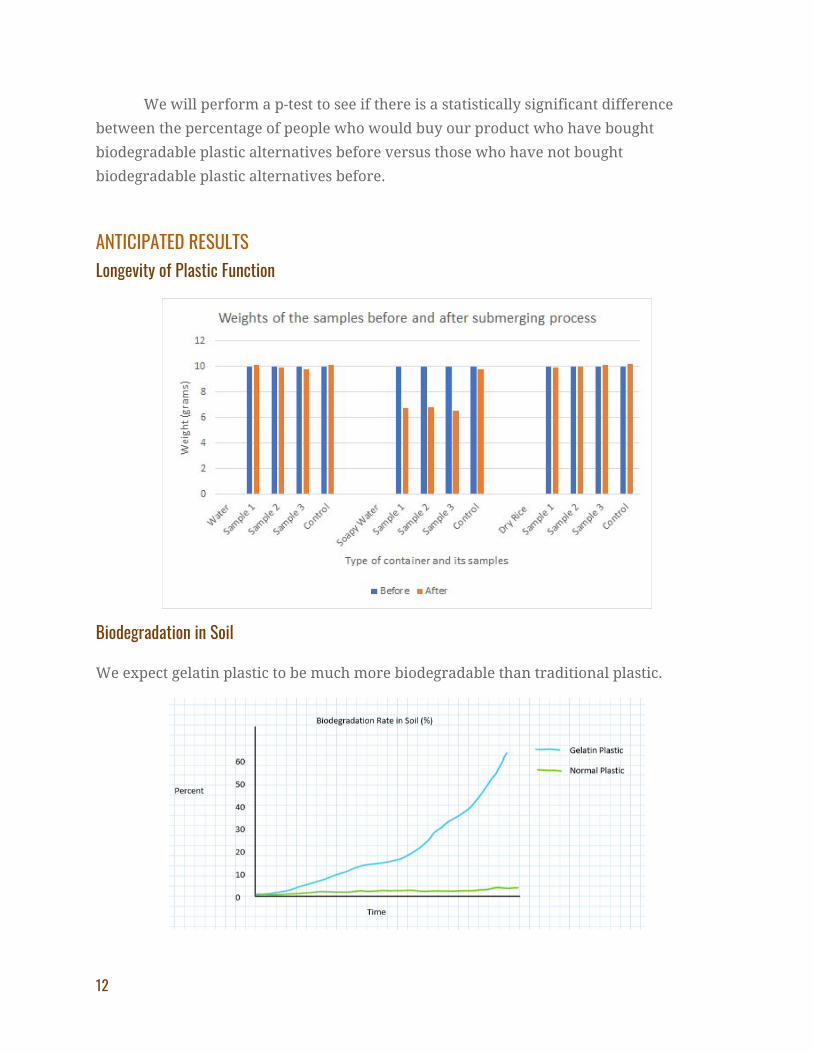
ANTICIPATED RESULTS Longevity of Plastic Function
Biodegradation in Soil
We expect gelatin plastic to be much more biodegradable than traditional plastic.
12
Biodegradation in Water
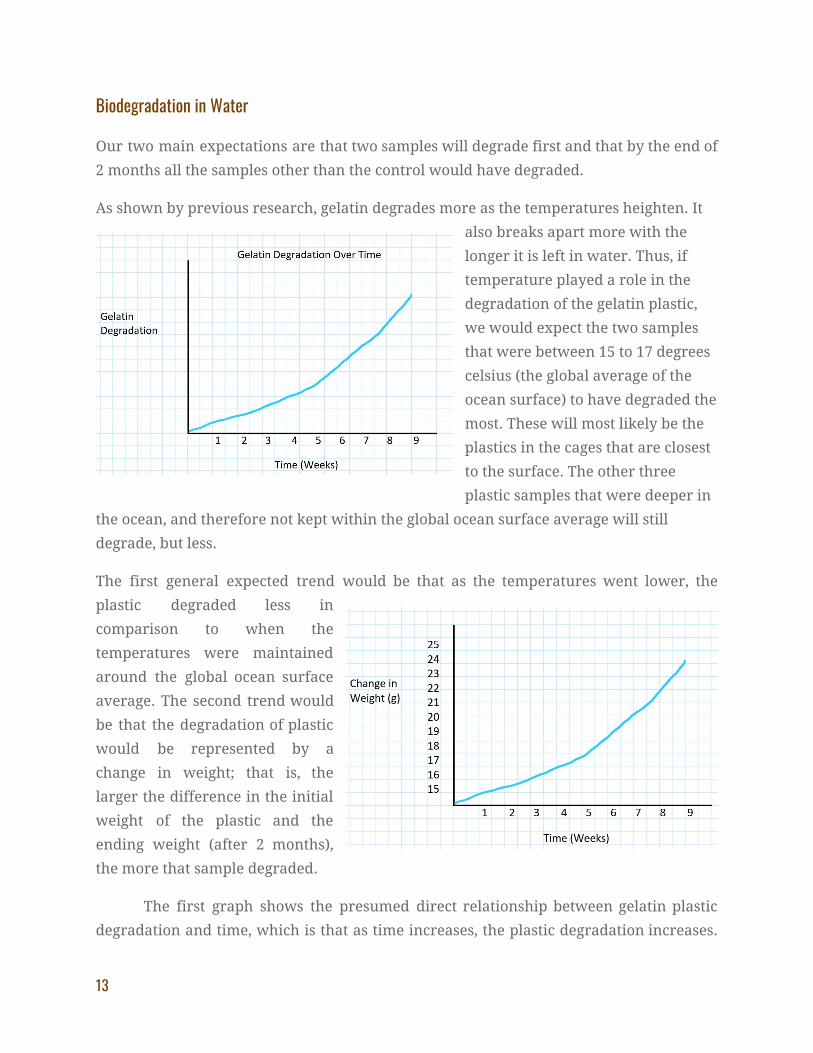
Our two main expectations are that two samples will degrade first and that by the end of
2 months all the samples other than the control would have degraded.
As shown by previous research, gelatin degrades more as the temperatures heighten. It
also breaks apart more with the
longer it is left in water. Thus, if
temperature played a role in the
degradation of the gelatin plastic,
we would expect the two samples
that were between 15 to 17 degrees
celsius (the global average of the
ocean surface) to have degraded the
most. These will most likely be the
plastics in the cages that are closest
to the surface. The other three
plastic samples that were deeper in
the ocean, and therefore not kept within the global ocean surface average will still
degrade, but less.
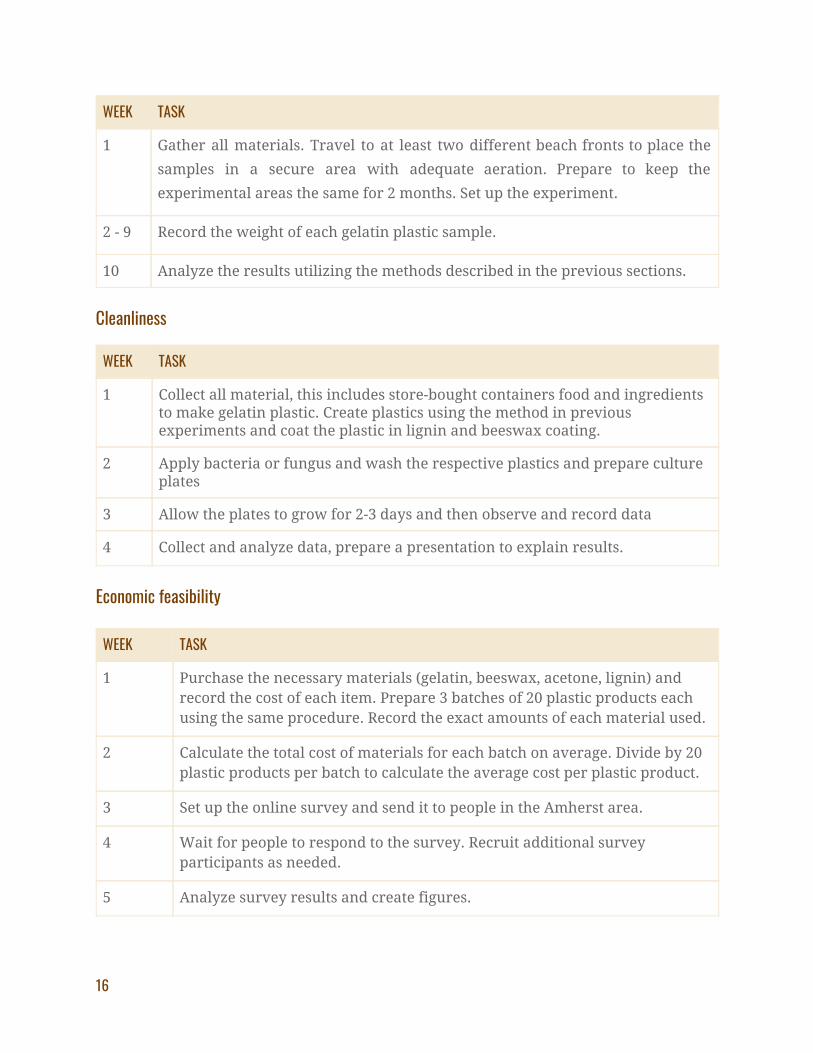
The first general expected trend would be that as the temperatures went lower, the
plastic degraded less in
comparison to when the
temperatures were maintained
around the global ocean surface
average. The second trend would
be that the degradation of plastic
would be represented by a
change in weight; that is, the
larger the difference in the initial
weight of the plastic and the
ending weight (after 2 months),
the more that sample degraded.
The first graph shows the presumed direct relationship between gelatin plastic
degradation and time, which is that as time increases, the plastic degradation increases.
13

This exponential decay is further explained by the second graph. As time goes on, we
expect the gelatin to have an increasing change in weight as time because of the
microscopic holes that will most likely develop in it. Hence why there is a sudden spike
in its degradation at some point throughout the weeks.
Cleanliness
We will chart the number of bacterial colonies on a bar graph and compare the
cleanliness of each product. We would expect that the store-bought plastic containers
would have lower amounts of bacterial and fungal colonies because they had to be
approved to be safe to be put on the market. We also suspect that because there are little
bumps and grooves in both plastics and it will allow more bacteria and fungus to reside.
However, we expect the washed for both plastics to be less in colony count.
Economic Feasibility
This graph demonstrates the maximum
price people would be willing to pay for
our product. This graph will allow us to
calculate what percentage of people would
be willing to buy our product given the
current estimated price. The more people
who would be willing to buy it, the more
economically feasible our product is. The
graph will also allow us to determine a
target price so we know how much we
want to lower the price of the product.
14

TIMELINE
Each timeline includes very different steps that occur at dissimilar times so they are displayed as different sections for each experiment. However, these experiments could all be done at the same time.
Longevity
WEEK TASK
1 Gather materials and perform experiments with water. And record all the data
2 Gather materials and perform experiments with soapy water. And record all the data
3 Gather materials and perform experiments with dry rice. Record all the data then make a graph comparing the weights.
4 Gather materials, then, take a picture of them. This week, we will test the plastics in the fridge and the microwave.
Biodegradability in soil
WEEK TASK
1 Collect all material, this includes store-bought plastic containers and ingredients to make gelatin plastic. Create plastics using the method in previous experiments and coat the plastic in lignin and beeswax coating.
2 Collect the soil and analyze its properties. Set up the bioreactor and CO2 absorption device. Measure the total organic carbon of each material to figure out the mass of each sample.
3 Place the plastics in the bioreactors with the soil. Observe every day, but take measurements every other day.
4 Measure the amount of evolved CO2 in each sample. Analyze the data and interpret the results.
Biodegradability in water
15
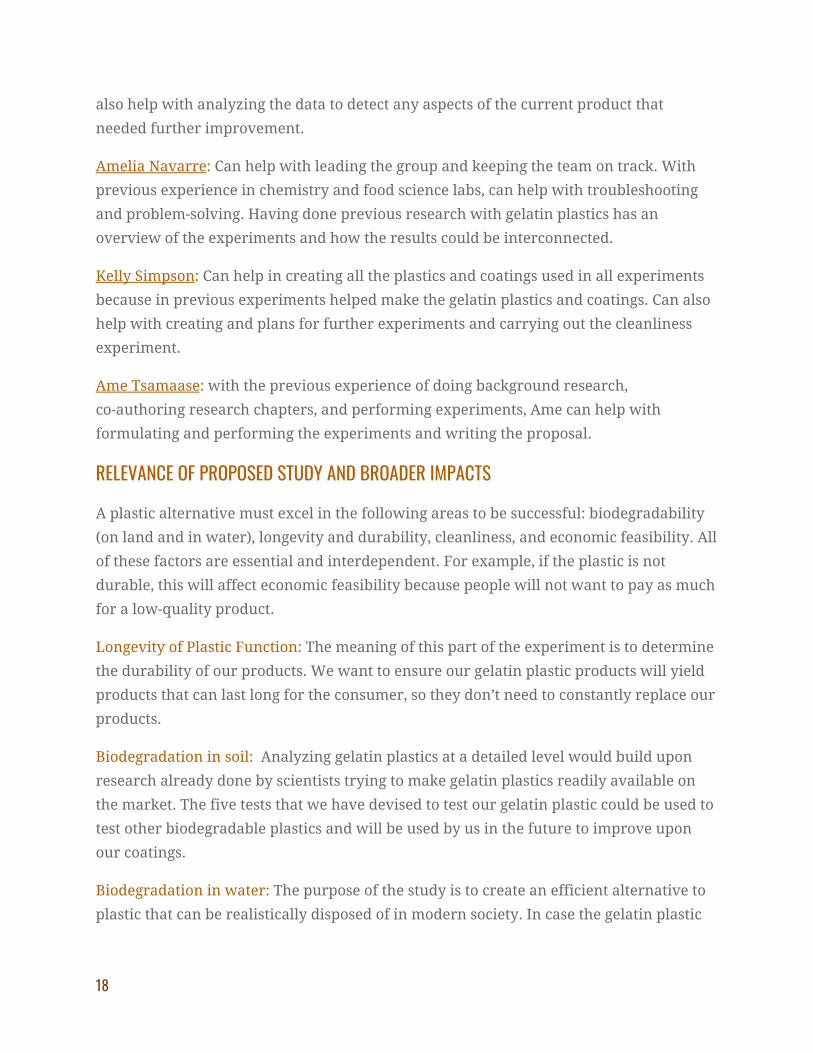
WEEK TASK
1 Gather all materials. Travel to at least two different beach fronts to place the
samples in a secure area with adequate aeration. Prepare to keep the
experimental areas the same for 2 months. Set up the experiment.
2 - 9 Record the weight of each gelatin plastic sample.
10 Analyze the results utilizing the methods described in the previous sections.
Cleanliness
WEEK TASK
1 Collect all material, this includes store-bought containers food and ingredients to make gelatin plastic. Create plastics using the method in previous experiments and coat the plastic in lignin and beeswax coating.
2 Apply bacteria or fungus and wash the respective plastics and prepare culture plates
3 Allow the plates to grow for 2-3 days and then observe and record data
4 Collect and analyze data, prepare a presentation to explain results.
Economic feasibility
WEEK TASK
1 Purchase the necessary materials (gelatin, beeswax, acetone, lignin) and record the cost of each item. Prepare 3 batches of 20 plastic products each using the same procedure. Record the exact amounts of each material used.
2 Calculate the total cost of materials for each batch on average. Divide by 20 plastic products per batch to calculate the average cost per plastic product.
3 Set up the online survey and send it to people in the Amherst area.
4 Wait for people to respond to the survey. Recruit additional survey participants as needed.
5 Analyze survey results and create figures.
16

MATERIALS AND BUDGET
ITEM COST
Plastic Containers $ 40.00
Dry Rice $ -
Soap $ -
Weight Scale $ -
SEM Microscope $ -
ISO 14852 method $ 123.00
CO2 absorption bottles $ 50.00
Gelatin $ -
Beeswax $ -
Acetone $ -
Air Pump $ -
Bioreactor $ 300.00
Sodium Hydroxide $ 20.00
Barium Hydroxide $ 50.00
Salinity refractometer $ 106.00
Tempeh Starter $ 9.00
Escherichia coli, K-12 Strain $ 12.00
Total $ 710.00
KEY PERSONNEL
Ally Brookhart: Can help with data analysis: making graphs and other figures,
performing statistical tests, etc. Is able to create the online survey, distribute it, and
analyze the results. Is knowledgeable about the chemistry and production of
hydrophobic coatings from the last case study.
Bao Le: Can help with creating future plans and modifying the chemical composition of
the gelatin plastics and coatings to lengthen the longevity of plastic function. And can
17
also help with analyzing the data to detect any aspects of the current product that
needed further improvement.
Amelia Navarre: Can help with leading the group and keeping the team on track. With
previous experience in chemistry and food science labs, can help with troubleshooting
and problem-solving. Having done previous research with gelatin plastics has an
overview of the experiments and how the results could be interconnected.
Kelly Simpson: Can help in creating all the plastics and coatings used in all experiments
because in previous experiments helped make the gelatin plastics and coatings. Can also
help with creating and plans for further experiments and carrying out the cleanliness
experiment.
Ame Tsamaase: with the previous experience of doing background research,
co-authoring research chapters, and performing experiments, Ame can help with
formulating and performing the experiments and writing the proposal.
RELEVANCE OF PROPOSED STUDY AND BROADER IMPACTS
A plastic alternative must excel in the following areas to be successful: biodegradability
(on land and in water), longevity and durability, cleanliness, and economic feasibility. All
of these factors are essential and interdependent. For example, if the plastic is not
durable, this will affect economic feasibility because people will not want to pay as much
for a low-quality product.
Longevity of Plastic Function: The meaning of this part of the experiment is to determine
the durability of our products. We want to ensure our gelatin plastic products will yield
products that can last long for the consumer, so they don’t need to constantly replace our
products.
Biodegradation in soil: Analyzing gelatin plastics at a detailed level would build upon
research already done by scientists trying to make gelatin plastics readily available on
the market. The five tests that we have devised to test our gelatin plastic could be used to
test other biodegradable plastics and will be used by us in the future to improve upon
our coatings.
Biodegradation in water: The purpose of the study is to create an efficient alternative to
plastic that can be realistically disposed of in modern society. In case the gelatin plastic
18

ends up in the ocean, it is essential in that it will not reduce ocean wildlife, hurt ocean
flora, nor make water resources undrinkable.
Cleanliness: The relevance of the expected results is to show that our gelatin plastics can
meet or surpass the cleanliness when washed standards of regular store-bought plastics.
Our goal for these plastics is that they will be used with food. These results will help
prove that these plastics are well suited for that environment and also prove that they
are just as safe to use with food items. The results will help show that they can be washed
and reused like plastic food containers.
Economic Feasibility: The objective of our study is to create a functional gelatin plastic
product. For this product to actually be bought and used by people, it must have a
reasonable price. If the gelatin plastic product is too expensive, people will not buy it and
will instead use traditional plastics, harming the environment. If this product is a
reasonable price, people will buy it, and there will be a decrease in the number of
microplastics added to the environment.
If we are able to create a gelatin plastic with these qualities, it could replace the
use of traditional plastics in many situations. Switching to a biodegradable,
environmentally friendly plastic would be extremely beneficial for the world. Less
plastic waste would accumulate in landfills or be incinerated, preventing harmful
chemical additives from entering the environment. Fewer microplastics would enter the
terrestrial and marine ecosystems. This would help organisms affected by microplastics
and save animal lives. This would also be beneficial to humans, as bioaccumulation of
microplastics in seafood could potentially be detrimental to human health.
The general public is aware of the problems plastic causes, from creating the
Great Pacific Garbage Patch to filling up landfills. Many people are seeking a solution to
this plastic issue, but given the low cost and high durability of plastics, it has been
difficult to find an alternative. Many consumers have elected to use reusable plastic bags
for grocery shopping or metal straws. However, these individual choices alone cannot fix
the problem, especially since public policy addressing this problem is limited. Our
biodegradable plastic alternative would prevent this plastic waste problem from
escalating while still having the advantages of traditional plastics, such as low cost and
durability. There are some situations in which single-use plastics are necessary. Our
19
product would allow people to use plastic water bottles, plastic drink cups, plastic straws,
plastic containers, and more, without harming the environment.
When communicating information about our product to the general public, it is
important that we emphasize how our plastic product is superior to traditional plastics
and other biodegradable plastic alternatives. For example, many “biodegradable”
plastics only break down under certain conditions, whereas our plastic would
biodegrade quickly, both on land and in the ocean. We would also want to communicate
that this product is still durable and sanitary. We believe an online campaign would be
most effective in communicating information about our product. We could use TedTalks,
informational videos, talks at conferences about plastics, posts on websites about the
environment, and more. Our goal would be to communicate this information to people
who care about climate change and the environment because they would be most likely
to use this product. We would also target companies, especially the foodservice industry.
These companies are under pressure from consumers to be more environmentally
conscious, so we believe our product would be appealing and useful to them.
20
REFERENCES Neshati, Zeinab, et al. “Evaluating the Biodegradability of Gelatin/Siloxane/
Hydroxyapatite (GS-Hyd) Complex in Vivo and Its Ability for Adhesion and
Proliferation of Rat Bone Marrow Mesenchymal Stem Cells.” Cytotechnology,
Springer Netherlands, Oct. 2012, www.ncbi.nlm.nih.gov/pmc/articles/PMC3432534
“Gelatin: Uses, Side Effects, Interactions, Dosage, and Warning.” WebMD, WebMD,
www.webmd.com/vitamins/ai/ingredientmono-1051/gelatin.
Robscheit-Robbins, F S, et al. “GELATIN-ITS USEFULNESS AND TOXICITY : BLOOD
PROTEIN PRODUCTION IMPAIRED BY CONTINUED GELATIN BY VEIN.” The
Journal of Experimental Medicine, The Rockefeller University Press, 1 Aug. 1944,
www.ncbi.nlm.nih.gov/pmc/articles/PMC2135456/.
Tosin, Maurizio, et al. “Laboratory Test Methods to Determine the Degradation of Plastics
in Marine Environmental Conditions.” Frontiers in Microbiology, Frontiers
Research Foundation, 21 June 2012,
www.ncbi.nlm.nih.gov/pmc/articles/PMC3380294/.
Basu, Srijoni, et al. “Evolution of Bacterial and Fungal Growth Media.” Bioinformation, Biomedical Informatics, 30 Apr. 2015, www.ncbi.nlm.nih.gov/pmc/articles/PMC4479053/.
“E. Coli: How Can I Tell If Food Is Contaminated.” PC Medical Info,
pcmedicalminute.com/e-coli-how-can-i-tell-if-food-is-contaminated/. Importer. “Practical Biology.” Incubating and Viewing Plates,
pbiol.rsb.org.uk/standard-techniques/incubating-and-viewing-plates. “Media for Optimal Cell Growth and Yield of Escherichia Coli Cultures Archives:
Formedium Powdered Media & Liquids: UK Research & Microbiology. www.formedium.com/product-category/formedium-media/escherichia-coli-media/media-for-optimal-cell-growth-and-yield-of-escherichia-coli-cultures/.
“Molds On Food: Are They Dangerous?” United States Department of Agriculture 2013,
www.fsis.usda.gov/wps/portal/fsis/topics/food-safety-education/get-answers/food-safety-fact-sheets/safe-food-handling/molds-on-food-are-they-dangerous_/ct_index.
21

“Refrigerator food molds.” GE Appliances products.geappliances.com/appliance/gea-support-search-content?contentId=17412.
Rajendran, Vijayakumar & Sandle, Tim. (2011). A review of fungal contamination in
pharmaceutical products and phenotypic identification of contaminants by conventional methods. European Journal of Parenteral and Pharmaceutical Sciences. 17. 4-19.
Science Buddies. “Interpreting Plates.” Science Buddies, Science Buddies, 7 Feb. 2020,
www.sciencebuddies.org/science-fair-projects/references/interpreting-agar-plates. Beale, A. (2011, April 1). Polycarbonate and ABS Engineering Resins Markets See Global
Tightening. Retrieved from https://plasticsbusinessmag.com/articles/2011/polycarbonate-and-abs-engineering-resins-markets-see-global-tightening/.
22