Autochthonous Hepatitis E Infection in a Slaughterhouse Worker
Upload
khangminh22Category
view
0download
0
energies
Article
Cultivation of Autochthonous Microalgae for BiomassFeedstock: Growth Curves and Biomass Characterization forTheir Use in Biorefinery Products
Juan Félix González 1,* , Teresa Belén Cuello 1, Antonio José Calderón 2 , Manuel Calderón 2,Jerónimo González 3 and Diego Carmona 2
�����������������
Citation: González, J.F.; Cuello, T.B.;
Calderón, A.J.; Calderón, M.;
González, J.; Carmona, D. Cultivation
of Autochthonous Microalgae for
Biomass Feedstock: Growth Curves
and Biomass Characterization for
Their Use in Biorefinery Products.
Energies 2021, 14, 4567. https://
doi.org/10.3390/en14154567
Academic Editor: Rocio Maceiras
Received: 29 June 2021
Accepted: 26 July 2021
Published: 28 July 2021
Publisher’s Note: MDPI stays neutral
with regard to jurisdictional claims in
published maps and institutional affil-
iations.
Copyright: © 2021 by the authors.
Licensee MDPI, Basel, Switzerland.
This article is an open access article
distributed under the terms and
conditions of the Creative Commons
Attribution (CC BY) license (https://
creativecommons.org/licenses/by/
4.0/).
1 Department of Applied Physics, School of Industrial Engineering, University of Extremadura,06006 Badajoz, Spain; [email protected]
2 Department of Electric, Electronic and Automatic Engineering, University of Extremadura, Avda. Elvas, s/n,06006 Badajoz, Spain; [email protected] (A.J.C.); [email protected] (M.C.); [email protected] (D.C.)
3 Extensive Crops Department, Biofuels, CICYTEX, Counseling Employment, Enterprise and Innovation,Extremadura Government, Finca La Orden, Guadajira, 06187 Badajoz, Spain; [email protected]
* Correspondence: [email protected]
Abstract: In this work, the biomass productivity for biorefinery products and growth curves ofthree autochthonous microalgae collected in different reservoirs (“Scenedesmus sp.” (SSP), mixtureof Scenedesmus sp., Chlorella minutissima, Chlorellas sp. and Nannochloropsis sp. named “La Orden”(LO) consortium and Chlorella minutissima named “Charca Brovales” (CB) consortium) were studiedin a 5.5 L column laboratory photobioreactor. Two different culture media, Arnon culture (AM)and an agriculture fertilizer-based liquid medium (FM), have been used to evaluate the growtheffect of the microalgae; it was found that the medium has a clear effect on the biomass productivityand growth rate, which ranged between 0.26–0.498 g L−1 d−1 and 0.288–0.864 d−1, respectively. Ingeneral, the elemental analysis and higher heating value of microalgae biomass for the three specieswere independent of the culture medium used for its growth, while their lipids and sugars contentdepended upon the species type and culture medium used in the cultivation. “La Orden” microalgawas selected (given its best adaption to the climatic conditions) to study the biomass productivityand growth rate in two exterior photobioreactors (100 L column and 400 L flat panel), using FM as amedium, obtaining values of 0.116–0.266 g L−1 d−1 and 0.360–0.312 d−1, respectively. An automationand control system was designed to operate the exterior photobioreactors pilot plant. The lipidcontent of this microalga in these photobioreactors was lower than in the laboratory one, with afatty acids profile with predominantly palmitic, oleic, linoleic and linolenic acids. Also, the freshbiomass collected from these photobioreactors was studied in a batch type digestion process forbiogas production, obtaining a CH4 yield of 296 ± 23 L CH4 kgVSS
−1 added with a reduction inpercentage of COD and vs. of 50 ± 1% and 50 ± 1.7%, respectively.
Keywords: autochthonous microalgae; culture medium; biorefinery; biomass production; biofuels
1. Introduction
The 2030 climate and energy framework sets targets for cutting greenhouse gas emis-sions and increasing the share of renewable energy and energy efficiency [1]. Under theenergy union, the EU is working to integrate Europe’s energy markets, ensure energysecurity, improve energy efficiency and decarbonize the economy. In this sense, in thelast years, the biorefinery concept has been implemented. According to this concept, asystem must guarantee a unified approach in the generation of valuable materials andbiofuels via the integration of biomass conversion processes [2]. A quite complete reviewhas been published describing the possible conversion technologies to transform meatprocessing waste into biochemicals and biofuels [3]. In this line, alternative renewable
Energies 2021, 14, 4567. https://doi.org/10.3390/en14154567 https://www.mdpi.com/journal/energies
Energies 2021, 14, 4567 2 of 21
processes to produce energy carriers as algae or other plants have become a hot topic forresearch [4]. Currently, the bioeconomy of the processes and products based on microalgaefaces serious restrictions [5]. In this context, Depra et al. [5] have published a recent andvery interesting review on “Microalgal Biorefineries for Bioenergy Production: Can WeMove from Concept to Industrial Reality?” establishing the advantages and benefits of theproduction of biofuels, bioenergy, biorefinery chemicals and bioproducts from microalgaeas feedstock.
Liquid biofuels are considered sustainable and carbon-neutral alternatives to petroleum-based fuels. Among all the potential feedstock for biofuels, microalgae stand out due totheir significant advantages such as high growth rate, less competition with food produc-tion and lower environmental impact when are compared with other biomass precursors.As energy feedstock, microalgae biomass can be transformed into many types of biofuels:biodiesel, biohydrogen, biogas or it may also be used for direct combustion [6–11]. Re-cently, many research studies defend that algal biofuels would be a potential alternative topetroleum-derived fuels in the transportation sector [6,8,12–14].
Microalgae have received notable attention because of their high photosynthetic rate(approximately 50 times higher than that of terrestrial plants). Recent studies have reportedphotosynthetic rates of 6.9 × 10⁴ cells mL−1 h−1, based on the Chlorella vulgaris cell numberof 5.7 × 10⁷ cells mL−1 for 34 days in control media [15].
In addition, microalgae contain high amounts of lipids, proteins and carbohydrates,which can be used for different applications [16,17]. However, a large amount of energyis needed for algae biomass collection and dewatering, which in turn generates variouspollutants/emissions [16–21].
Despite this issue, microalgae remain imperative as a future energy feedstock, as itrequires less land compared to other commercial crops such as palm or jatropha [22].
Since one major factor influencing microalgae productivity is genetics, the selectionof microalgae for cultivation is important [23]. Typical culture methods for increasing theproductivity of microalgae are: (a) two-stage culture (manipulating the culture conditionsand nutrient feed in terms of the period and concentration to increase the cell reproductionrate and lipid content of the microalgae); (b) phototropic culture (microalgal cells dependon light to reproduce) and (c) heterotrophic culture (it consumes other organisms ororganic waste containing carbons as an energy source instead of CO2 and is independentof the light source for reproduction). The most important factors influencing microalgaeproductivity are the concentration of dissolved oxygen and carbon dioxide in the medium,light conditions, nutrient supply and source, pH and climate (temperature) [23,24].
Both open or closed systems can be used for microalgae cultivation, and the choiceof the type of system will have a significant effect on the production cost of biofuel. Forinstance, cultivation in an open system (pond or tank) involves a greater degree of exposureto the environment, while a closed system has less contamination and can be more easilycontrolled. Open ponds can be classified as raceway, circular, inclined and unmixed ponds.On the other hand, different reactor configurations can be used for cultivation in a closedphotobioreactor, such as tubular, vertical, flat-plate, annular, fermented-type and internallyilluminated photobioreactors [23,24].
Estimations report that biodiesel production depends on the content of TAG (triglyc-eride), which corresponds to more than 70% of the lipid content [25], as well as the biomassproductivity. The biodiesel production depends on the TAGs concentration in the lipidcontent of an oil or fat. According to the transesterification reaction, the ratio of the feed-stock mass and biodiesel produced is 1:1, which occurs in a reactor where the blendedalcohol and catalyst react with TAGs of the oil at a temperature close to the alcohol boilingpoint [26–28]. Yun et al. [10] have published the effect of flue gas CO2 on growth, lipid pro-duction and fatty acid composition of a green microalga Acutodesmus obliquus. El-Sheekhet al. [11] have observed that the distribution of fatty acids in the oil from Chlorella vulgarisvaried under different conditions of culture stress.

Energies 2021, 14, 4567 3 of 21
The ethanol production from microalgae is primarily obtained through the fermenta-tion of the starch, sugar and cellulose contained in microalgae biomass [29]. In this way,the conversion of biomass from marine algae into ethanol could be economically feasiblesince some algae hydrolyzates can contain more total carbohydrate and hexose sugarsthan some terrestrial lignocellulosic biomass feedstock [29–31]. It has been reported thatthe carbohydrate content of a marine macroalga (Enteromorpha species) is in the range 70to 72% [32], where starch dominates the carbohydrate content and can be up to 60% (drybasis) for Chlorella vulgaris depending on the culture conditions [33]. This starch content ofmicroalgae can be improved by controlling the N or Fe during cultivation [34,35].
According to the new concept of biorefinery [2,3,5], another possibility of exploitationof microalgae biomass is biogas production from anaerobic digestion. Some works havebeen reported in the literature with excellent results [7,36], and biogas production fordifferent microalgae biomasses has been included in a recent review [8]. Literature dataindicate that conversion of the algae biomass into biogas is a highly profitable solution andthe obtained methane achieves 140–360 mL/g volatile solids (VS) depending on the algalspecies (Chlorella sp. and Micractinium sp.) [9].
This work presents a study of the microalgae growth and biomass production of threespecies: one control species which was Scenedesmus sp., and two autochthonous species,one collected from a water reservoir (named “Charca Brovales”) where the species Chlorellaminutissima is predominant, and other specie constituted by a mixture of Scenedesmussp., different Chlorella species and Nannochloropsis sp. (named “La Orden”) collected fromdifferent water reservoirs in the Extremadura region (SW of Spain). The research has beencarried out with two different culture media, Arnon medium [37] and agricultural fertilizerbased medium, in three different photobioreactors (5.5 L laboratory column, outer 100 Lcolumn and outer 400 L panel). The growth curves, kinetics and biomass production havebeen analyzed. Also in this work, according to the biorefinery of microalgae biomass,the possibilities of bioenergy and biofuels (biodiesel and bioethanol) and biogas produc-tion were analyzed and related to biomass precursors (in particular, to their lipids andsugars content).
2. Materials and Methods2.1. Species Studied and Culture Conditions
The Scenedesmus sp. control species was supplied by the research group of Prof. Acién,from Almeria University (SE of Spain).
The autochthonous species named “Charca Brovales” and “La Orden” were collectedfrom different water reservoirs located in Extremadura region (SW Spain), and are a“consortium” of different strains. The “Charca Brovales” consortium was collected from awater reservoir (named Charca Brovales, ambient temperature ranges from 3 ◦C in winterto 33 ◦C in summer, mean salinity is 4.5 ± 0.2 g/L) located near to a metallurgy industryat Brovales village (SW of Extremadura, Spain). We have chosen these reservoirs becauseof the proximity of important industries that can use them for their cooling systems andpossible discharges, such as a nuclear power plant (Arrocampo), or a steel industry (CharcaBrovales). The consortium named “La Orden” is a hybrid of Scenedesmus sp. and othermicroalgae species collected in two water reservoirs: Charca Brovales and Arrocampo (thisreservoir is near Almaraz Nuclear Plant, and its water is used for the refrigeration systemof this plant, ambient temperature ranges from 6 ◦C in winter to 29 ◦C in summer, meansalinity is 6.7 ± 0.2 g/L).
Isolation, selection, conservation and description of autochthonous microalgae wereas follows: the samples were harvested and taken to the laboratory, where they werefiltered (6 µm paper) to remove suspension partícles (such as fallen leaves, gravel, etc).Subsequently, the growth of the species was carried out with the Arnon medium [37] inglass 2 L photobioreactors, previously sterilized in an autoclave. The culture conditionswere: ambient temperature in the range 20 ± 1 ◦C, artificial light with total intensity of1600 µmol photons m−2 s−1 and photoperiod of 12 h light/12 h dark. The pH ranged
Energies 2021, 14, 4567 4 of 21
between 7.5–8 and was maintained in these values by means of the addition of pure CO2.The samples were kept in culture mode until the microalgae proliferation was observed;in those cases, in which no proliferation was observed after 15 days, the samples werediscarded.
Once the growth of the cultures was detected, these were subjected to regular injectionsof highly pure CO2 flows; it was always controlled in the range 7.5–8 as abovementioned,to guarantee higher biomass productivity.
Afterward, the more abundant microalgae in the culture were observed by lightmicroscopy, and then, they were isolated to obtain monoalgae cultures, pure strains andthus to carry out the research on the same material. Special care was taken to guaranteegood conservation of the inocula, in case it would be needed for further culture stages.The method used to carry out the isolation was the culture technique at solid medium byextension in a Petri plate [38].
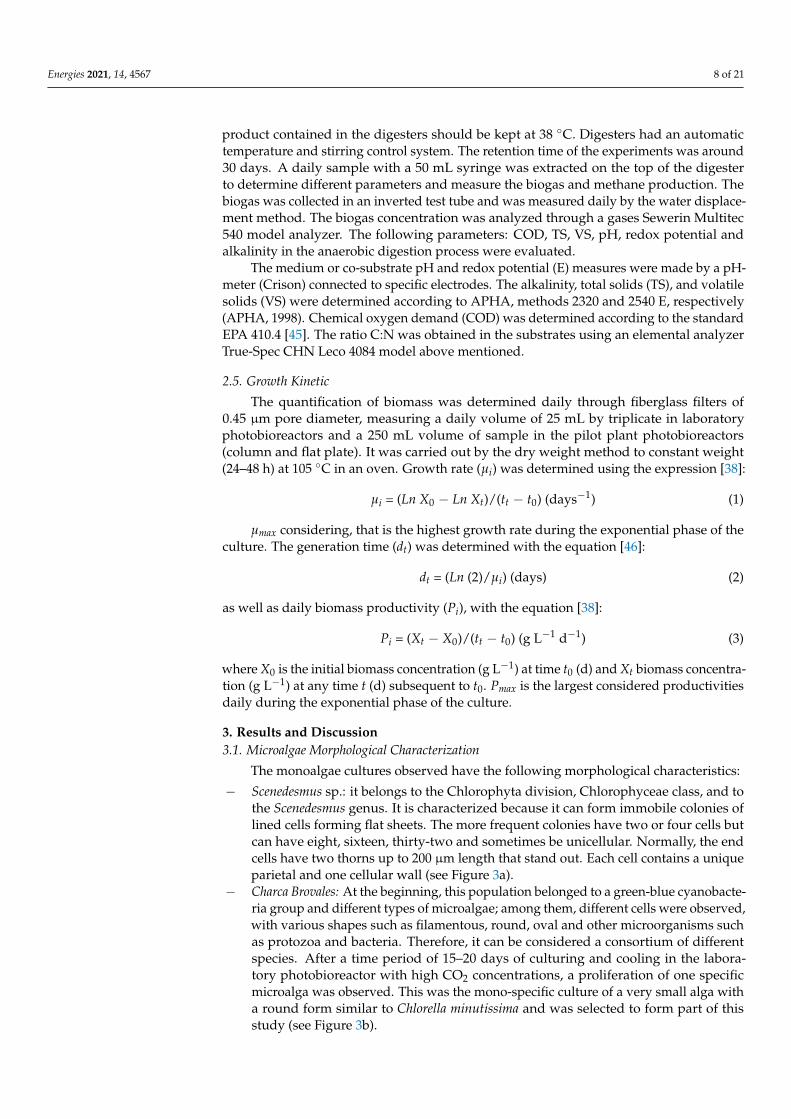
Two different culture media were studied: an Arnon medium (AM) and an agriculturalliquid fertilizer based medium (FM) made from agricultural fertilizers, with the aim ofreducing input costs. “Arnon medium” has been widely used in the cultivation of algae(mainly for freshwater species) and has shown good results in many microalgae species.Table 1 shows the composition of this medium. The most important nutrients are alwaysnitrogen and phosphorus. These can also be supplied in the form of agricultural fertilizers,which are usually available, but it also implies an additional cost [39]. Another way ofpreparing the culture media consists of adding liquid fertilizers N P K and microelementswell diluted in water that was previously autoclaved, in order to avoid contaminationby rotifers and other predators. The agricultural liquid fertilizer medium (FM) used inthis work was constituted by: 9 mM (millimolar) of nitrogen as nitrate (NO3
−), 0.5 mMof phosphorus as phosphate (HPO4
2−), 3.8 mM of potassium as (KOH) and 0.1 mM ofmicroelements (solution of B (0.05%), Fe (1.03%), Mn (0.70%), Cu (0.12%), Mo (0.01%) andZn (0.33%) in EDTA)) per liter of well water.
Table 1. Arnon medium composition.
Dissolution 1 ChemicalCompound Quantity(g L−1) (mL L−1) *
solution stock 1 Na2MoO4 2 H2O 1.26 1
solution stock D7-(Mo-V)
H3BO3 2.86
1MnCl2 4 H2O 1.81ZnSO4 7 H2O 0.222CuSO4 5 H2O 0.79CoCl2 6 H2O 0.403
solution stock 2 MgSO4 7 H2O 124 1
solution stock 3 CaCl2 2 H2O 15 1
solution stock 4 NaCl 117 1
solution stock Fe-EDTAC10H16N2O8 16 g in 186 mL water
1KOH 10.4 g in 186 mL waterFeSO47H2O 13.7 g in 384 mL water
solution stock 5 NaNO3 2M 170 10
Dissolution 2
solution stock 6 K2HPO4 1M 174 4* volume of each stock solution added to 1 L of distilled water solutions comprising 1 and one liter of solution 2.Solutions 1 and 2 were autoclaved separately and joined to form the Arnon medium.
2.2. Photobioreactors
Experiments were carried out at temperatures between 20–35 ◦C with a photoperiodday: night from 12:12 h, provided by fluorescent tubes (14 Day-light Phillips 18W/865providing a light intensity of 2000 µmol photons m−2 s −1 uniformly to the three high

Energies 2021, 14, 4567 5 of 21
performance photobioreactors). The 5.5 L methacrylate columns (diameter of 0.125 m andheight of 0.5 m) contain a front output to obtain harvested algae, a bottom outlet for thetotal emptying (which in turn serves for the introduction of air), an upper plug and pHand temperature sensors. Commercial pure CO2 was introduced on demand accordingto pH control between 7.5 and 8, the flow rate was set at 0.25 L min−1 and the air flowto bubbling at 1.5 L min−1. All batch cultures were performed in order to determine thecomplete growth curve in all its phases. This experiment was conducted in the laboratoryin different media, Arnon medium (AM) and agricultural fertilized medium (FM).
Subsequently, experimentation was extrapolated to a pilot plant, where the consortium“La Orden” was studied at FM at the concentrations described above. For this experiment,we used two photobioreactor models, which can be seen in Figure 1. One was a verticalcolumn of 100 L capacity, consisting of an acrylic cylinder of 20 cm diameter and 2 m height.In this system, the mixture was obtained by injecting air into the bottom of the column,and CO2; pH and temperature were monitored during operation by a pH meter andthermometer located at the top of the column. The other photobioreactor used in the studyconsisted of a flat structure made of a transparent plastic bag with a high surface/volumeratio, with an approximate capacity of 400 L. From the column photobioreactor it waspassed to the flat photobioreactors that constituted the pilot plant of 10 photobioreactors.The cultures agitation was made by a bubbling system, consisting of a metal tube with smallholes through which air and CO2 run longitudinally to the bag bottom. The photobioreactormay be vertical or inclined. In the latter case, the inclination can help to delay the adherenceof the microalgae cells in the upper wall of the photobioreactor, facilitating the solarradiation on the medium.
Energies 2021, 14, x FOR PEER REVIEW 5 of 22
total emptying (which in turn serves for the introduction of air), an upper plug and pH and temperature sensors. Commercial pure CO2 was introduced on demand according to pH control between 7.5 and 8, the flow rate was set at 0.25 L min−1 and the air flow to bubbling at 1.5 L min−1. All batch cultures were performed in order to determine the com-plete growth curve in all its phases. This experiment was conducted in the laboratory in different media, Arnon medium (AM) and agricultural fertilized medium (FM).
Subsequently, experimentation was extrapolated to a pilot plant, where the consortium “La Orden” was studied at FM at the concentrations described above. For this experiment, we used two photobioreactor models, which can be seen in Figure 1. One was a vertical column of 100 L capacity, consisting of an acrylic cylinder of 20 cm diameter and 2 m height. In this system, the mixture was obtained by injecting air into the bottom of the column, and CO2; pH and temperature were monitored during operation by a pH meter and ther-mometer located at the top of the column. The other photobioreactor used in the study consisted of a flat structure made of a transparent plastic bag with a high surface/volume ratio, with an approximate capacity of 400 L. From the column photobioreactor it was passed to the flat photobioreactors that constituted the pilot plant of 10 photobioreactors. The cultures agitation was made by a bubbling system, consisting of a metal tube with small holes through which air and CO2 run longitudinally to the bag bottom. The photo-bioreactor may be vertical or inclined. In the latter case, the inclination can help to delay the adherence of the microalgae cells in the upper wall of the photobioreactor, facilitating the solar radiation on the medium.
Figure 1. Vertical column and flat-panel photobioreactors.
2.3. Automation and Monitoring System of the Pilot Plant In this section, the deployment of an automation and monitoring system for control-
ling the growing process of microalgae in both types of photobioreactors (column and flat panel) is presented. The main components, hardware and sensing features are described. The most relevant contribution of the implemented system is that all the tasks in the pho-tobioreactors are performed in a fully automated way.
Among the available technology for process automation, Programmable Logic Con-trollers (PLCs) are the most suitable and versatile tools to carry out such tasks [40].
We have chosen this industrial control unit due to its features of reliability, robust-ness and stable operation, critical issues in the presented application given the severe con-ditions of the equipment to be controlled. Additional benefits are its small size and low power consumption. In addition, PLCs have digital and analog modules to connect the required sensors with proper measurement accuracy.
Figure 1. Vertical column and flat-panel photobioreactors.
2.3. Automation and Monitoring System of the Pilot Plant
In this section, the deployment of an automation and monitoring system for controllingthe growing process of microalgae in both types of photobioreactors (column and flat panel)is presented. The main components, hardware and sensing features are described. The mostrelevant contribution of the implemented system is that all the tasks in the photobioreactorsare performed in a fully automated way.
Among the available technology for process automation, Programmable Logic Con-trollers (PLCs) are the most suitable and versatile tools to carry out such tasks [40].
We have chosen this industrial control unit due to its features of reliability, robustnessand stable operation, critical issues in the presented application given the severe conditionsof the equipment to be controlled. Additional benefits are its small size and low powerconsumption. In addition, PLCs have digital and analog modules to connect the requiredsensors with proper measurement accuracy.

Energies 2021, 14, 4567 6 of 21
In the proposed approach, the controller measures and governs the different parts ofthe process by means of diverse sensors and actuators. Moreover, for monitoring purposes,a human–machine interface (HMI) is responsible for providing information to the operatorof the plant in a user-friendly way. The real-time visualization constitutes a paramountfunction to achieve an effective tracking and assessment of the process behavior. Thesecomponents are connected through a PROFINET (Process Field Net)-based network.
The automation system comprises a Siemens S7-1200 PLC equipped with analogueand digital Input/Output (I/O) modules. The models of these devices are now listed:
CPU 1214C AC/DC/RlyHMI TP600 Comfort touch panelSIMATIC ET 200S scalable system for distributed automationThis PLC controls the feeding of required CO2 and the corresponding filling and
harvesting cycles of the bioreactors. In addition, as aforementioned, this system fulfilsthe role of data acquisition. Data are displayed and stored on the KTP600 touch panel,where the SCADA (Supervisory Control and Data Acquisition) application is executed. Thetouch panel logs the variables of interest at one minute intervals from the PLC’s memoryby a permanent connection. All the variables can be plotted and displayed in real time,with the touch panel allowing remote access to the data via Internet. Since these plotsprovide real-time information about the functioning of each of the subsystems, they allowthe researcher to monitor the operation of the system under the program.
In order to obtain the measurements of the process variables, a set of sensors wereinstalled in the bioreactors of the pilot plant. The most important variable to be measuredis pH, as the CO2 injection depends on its value. This measurement was carried out by apH/EC transmitter HANNA HI 98143. As said before, temperature also has an importantrole in the growing process of microalgae, so this variable is measured by a thermoresistor,PT100. Both sensors, pHmeter and PT100, are connected to the PLC through a decentralizedperiphery station ET 200S, which is connected to the PLC using a field bus PROFINETprotocol. With this station, data from temperature and pH sensors are acquired and sent toPLC memory positions. Figure 2 shows the block diagram of the automation system.
Energies 2021, 14, x FOR PEER REVIEW 6 of 22
In the proposed approach, the controller measures and governs the different parts of the process by means of diverse sensors and actuators. Moreover, for monitoring pur-poses, a human–machine interface (HMI) is responsible for providing information to the operator of the plant in a user-friendly way. The real-time visualization constitutes a par-amount function to achieve an effective tracking and assessment of the process behavior. These components are connected through a PROFINET (Process Field Net)-based network.
The automation system comprises a Siemens S7-1200 PLC equipped with analogue and digital Input/Output (I/O) modules. The models of these devices are now listed:
CPU 1214C AC/DC/Rly HMI TP600 Comfort touch panel SIMATIC ET 200S scalable system for distributed automation This PLC controls the feeding of required CO2 and the corresponding filling and har-
vesting cycles of the bioreactors. In addition, as aforementioned, this system fulfils the role of data acquisition. Data are displayed and stored on the KTP600 touch panel, where the SCADA (Supervisory Control and Data Acquisition) application is executed. The touch panel logs the variables of interest at one minute intervals from the PLC’s memory by a permanent connection. All the variables can be plotted and displayed in real time, with the touch panel allowing remote access to the data via Internet. Since these plots provide real-time information about the functioning of each of the subsystems, they allow the researcher to monitor the operation of the system under the program.
In order to obtain the measurements of the process variables, a set of sensors were installed in the bioreactors of the pilot plant. The most important variable to be measured is pH, as the CO2 injection depends on its value. This measurement was carried out by a pH/EC transmitter HANNA HI 98143. As said before, temperature also has an important role in the growing process of microalgae, so this variable is measured by a thermoresis-tor, PT100. Both sensors, pHmeter and PT100, are connected to the PLC through a decen-tralized periphery station ET 200S, which is connected to the PLC using a field bus PROFINET protocol. With this station, data from temperature and pH sensors are ac-quired and sent to PLC memory positions. Figure 2 shows the block diagram of the auto-mation system.
Figure 2. Automation and monitoring system of the pilot plant. Figure 2. Automation and monitoring system of the pilot plant.

Energies 2021, 14, 4567 7 of 21
From the measurements obtained of sensors and signal conditioners, the controlsystem will determine the switching conditions of the valves that introduce CO2 in thebioreactors. These valves are connected through digital outputs of the decentralized pe-riphery station (ET200). On the other hand, pumps for the filling and harvesting processesare driven by means of a variable frequency drive (VFD), which is connected to the PLCusing the same fieldbus (PROFINET).
2.4. Analytical Methods
The morphology of the microalgae species in the different media was analyzed usingan optical microscope, Leica DM 500. Throughout the experimentation, at least three timesa week, a sample of each culture was observed by microscope.
At the end of the experiment, after the exponential phase and spending variousdays (2–3 days) in the stationary state, the culture contained in the photobioreactor washarvested completely for its subsequent analysis. The steady state was determined byoptical density using a colorimeter (Photometer D-100, Dinko Instruments, Baarcelona,Spain) in which a 580 nm filter was used. The optical density value for each sample wasobtained as an average of three measurements. A straight line of calibration in which“Optical density” and “Concentration (mg/L)” were confronted, where the results obtainedshowed that for values between 0 and 1.5 absorbance units, linearity was obtained with acorrelation coefficient r2 of 0.9944. To obtain the dry biomass, previously proceeded to itscentrifugation by means of laboratory centrifuge (Hettich ROTOFIX 32 A, Kirchlengern,Germany) with a velocity of 4000 rpm during 10–15 min, depending on centrifugatedmicroalga, because some microalgae, for their morphology, size and excretion of gelatinoussubstances, required some minutes more to reach a good separation without to lose biomass.The next step was drying the biomass in a laboratory stove at 60–70 ◦C, and then the samplemilling with electric mill model Super Junior “S” 180W Moulinex (908798).
Microalgae biomass characterization was performed by means of elemental analysis,calorific value, lipid and sugar contents.
The elemental analysis was carried out in an elemental analyzer (Leco CHNS TrueSpec 4084, St. Joseph, Michigan, USA) in accordance with UNE-EN 15104 standard normfor biomass C, H, N and S analysis.
The higher heating value (HHV) was determined by Parr 1351 calorimeter bomb (ISO1928).
The carbohydrate content was determined using the modified quantitative saccharifi-cation method reported by the National Renewable Energy Laboratory (NREL), followingthe Moxley and Zhang method [41]. For this determination, high performance liquidchromatography (HPLC) LC-MS/MS Varian (310_MS TQ) was utilized using a Hiplex Nacolumn 300 × 7.7 mm. This technique has been also used by Ho et al. [42], to evaluate thecarbohydrate content of Chorella vulgaris biomass.
Lipid extraction was performed by Soxhlet extraction method with an organic solvent,utilizing hexane as a liquid solvent and using a fats extractor equipment (Det. GRAS N2p 4002841, Abrera, Barcelona, Spain). The hexane solvent was evaluated as an extractionsolvent for microalgae in the Soxhlet system with interesting results [43]. This is relativelyinexpensive, easy to recover after extraction, and possesses selectivity to neutral lipids.Biomass was milled for a better homogenization and thus to favor the mechanical destruc-tion of cells with the subsequent release of lipids. The sample was dried for 24 h at 105 ◦Cin a laboratory stove. About 3 mg of sample was weighed into each cartridge, previouslydried in an oven for at least 2 h at 105 ◦C, and then proceeded to the extraction of eachsample until complete extraction. This determination was performed by triplicate to obtainthe standard deviation. “La Orden” microalgae species oil was characterized by the mea-surement of the fatty acid profile; this method was described in previous works [44]. Theanaerobic digestion of “La Orden” microalga biomass was carried out in 5 L stainless steelcylindrical reactors Batch LEHMANN Maschinenbau GMBH model built-in. Reactionswere accomplished under a mesophilic regime for microorganisms, which implies that the
Energies 2021, 14, 4567 8 of 21
product contained in the digesters should be kept at 38 ◦C. Digesters had an automatictemperature and stirring control system. The retention time of the experiments was around30 days. A daily sample with a 50 mL syringe was extracted on the top of the digesterto determine different parameters and measure the biogas and methane production. Thebiogas was collected in an inverted test tube and was measured daily by the water displace-ment method. The biogas concentration was analyzed through a gases Sewerin Multitec540 model analyzer. The following parameters: COD, TS, VS, pH, redox potential andalkalinity in the anaerobic digestion process were evaluated.
The medium or co-substrate pH and redox potential (E) measures were made by a pH-meter (Crison) connected to specific electrodes. The alkalinity, total solids (TS), and volatilesolids (VS) were determined according to APHA, methods 2320 and 2540 E, respectively(APHA, 1998). Chemical oxygen demand (COD) was determined according to the standardEPA 410.4 [45]. The ratio C:N was obtained in the substrates using an elemental analyzerTrue-Spec CHN Leco 4084 model above mentioned.
2.5. Growth Kinetic
The quantification of biomass was determined daily through fiberglass filters of0.45 µm pore diameter, measuring a daily volume of 25 mL by triplicate in laboratoryphotobioreactors and a 250 mL volume of sample in the pilot plant photobioreactors(column and flat plate). It was carried out by the dry weight method to constant weight(24–48 h) at 105 ◦C in an oven. Growth rate (µi) was determined using the expression [38]:
µi = (Ln X0 − Ln Xt)/(tt − t0) (days−1) (1)
µmax considering, that is the highest growth rate during the exponential phase of theculture. The generation time (dt) was determined with the equation [46]:
dt = (Ln (2)/µi) (days) (2)
as well as daily biomass productivity (Pi), with the equation [38]:
Pi = (Xt − X0)/(tt − t0) (g L−1 d−1) (3)
where X0 is the initial biomass concentration (g L−1) at time t0 (d) and Xt biomass concentra-tion (g L−1) at any time t (d) subsequent to t0. Pmax is the largest considered productivitiesdaily during the exponential phase of the culture.
3. Results and Discussion3.1. Microalgae Morphological Characterization
The monoalgae cultures observed have the following morphological characteristics:
− Scenedesmus sp.: it belongs to the Chlorophyta division, Chlorophyceae class, and tothe Scenedesmus genus. It is characterized because it can form immobile colonies oflined cells forming flat sheets. The more frequent colonies have two or four cells butcan have eight, sixteen, thirty-two and sometimes be unicellular. Normally, the endcells have two thorns up to 200 µm length that stand out. Each cell contains a uniqueparietal and one cellular wall (see Figure 3a).
− Charca Brovales: At the beginning, this population belonged to a green-blue cyanobacte-ria group and different types of microalgae; among them, different cells were observed,with various shapes such as filamentous, round, oval and other microorganisms suchas protozoa and bacteria. Therefore, it can be considered a consortium of differentspecies. After a time period of 15–20 days of culturing and cooling in the labora-tory photobioreactor with high CO2 concentrations, a proliferation of one specificmicroalga was observed. This was the mono-specific culture of a very small alga witha round form similar to Chlorella minutissima and was selected to form part of thisstudy (see Figure 3b).

Energies 2021, 14, 4567 9 of 21
− Arrocampo: The cells collected in this reservoir are green and round, and are verysimilar to Chlorellas sp. and Nannochloropsis sp. This microalga is unicellular and doesnot form colonies. Morphologically, it is very similar to the consortium named CharcaBrovales (Figure 3c).
Energies 2021, 14, x FOR PEER REVIEW 9 of 22
− Arrocampo: The cells collected in this reservoir are green and round, and are very similar to Chlorellas sp. and Nannochloropsis sp. This microalga is unicellular and does not form colonies. Morphologically, it is very similar to the consortium named Charca Brovales (Figure 3c).
(a) (b) (c)
Figure 3. Micrographs by optical microscopy of (a) Scenedesmus sp. to magnifications of 200 µm, (b) Charca Brovales con-sortium to magnifications of 100 µm, and (c) Arrocampo to magnifications of 100 µm.
As has been previously described, the “La Orden” consortium is a mixture of different microalgae collected at different reservoirs located in the Extremadura region (SW of Spain). The samples were collected, cooled, and cultured at a laboratory photobioreactor with high CO2 concentrations. Among others, the microorganisms detected in this me-dium were predominantly population Scenedesmus sp. living with other unicellular spe-cies of round form, Chlorella. In Figure 4 the species found from microscopic observation under different magnifications are shown.
Figure 4. Micrographs by optical microscopy of “La Orden” consortium. Species found in the culture medium to magnifications of 20 µm (above), 100 µm (left below) and 100 µm (right below).
Figure 3. Micrographs by optical microscopy of (a) Scenedesmus sp. to magnifications of 200 µm, (b) Charca Brovalesconsortium to magnifications of 100 µm, and (c) Arrocampo to magnifications of 100 µm.
As has been previously described, the “La Orden” consortium is a mixture of differentmicroalgae collected at different reservoirs located in the Extremadura region (SW of Spain).The samples were collected, cooled, and cultured at a laboratory photobioreactor with highCO2 concentrations. Among others, the microorganisms detected in this medium werepredominantly population Scenedesmus sp. living with other unicellular species of roundform, Chlorella. In Figure 4 the species found from microscopic observation under differentmagnifications are shown.
Energies 2021, 14, x FOR PEER REVIEW 9 of 22
− Arrocampo: The cells collected in this reservoir are green and round, and are very similar to Chlorellas sp. and Nannochloropsis sp. This microalga is unicellular and does not form colonies. Morphologically, it is very similar to the consortium named Charca Brovales (Figure 3c).
(a) (b) (c)
Figure 3. Micrographs by optical microscopy of (a) Scenedesmus sp. to magnifications of 200 µm, (b) Charca Brovales con-sortium to magnifications of 100 µm, and (c) Arrocampo to magnifications of 100 µm.
As has been previously described, the “La Orden” consortium is a mixture of different microalgae collected at different reservoirs located in the Extremadura region (SW of Spain). The samples were collected, cooled, and cultured at a laboratory photobioreactor with high CO2 concentrations. Among others, the microorganisms detected in this me-dium were predominantly population Scenedesmus sp. living with other unicellular spe-cies of round form, Chlorella. In Figure 4 the species found from microscopic observation under different magnifications are shown.
Figure 4. Micrographs by optical microscopy of “La Orden” consortium. Species found in the culture medium to magnifications of 20 µm (above), 100 µm (left below) and 100 µm (right below).
Figure 4. Micrographs by optical microscopy of “La Orden” consortium. Species found in the culturemedium to magnifications of 20 µm (above), 100 µm (left below) and 100 µm (right below).

Energies 2021, 14, 4567 10 of 21
3.2. Microalgae Productivity and Growth Curves3.2.1. Laboratory Photobioreactors
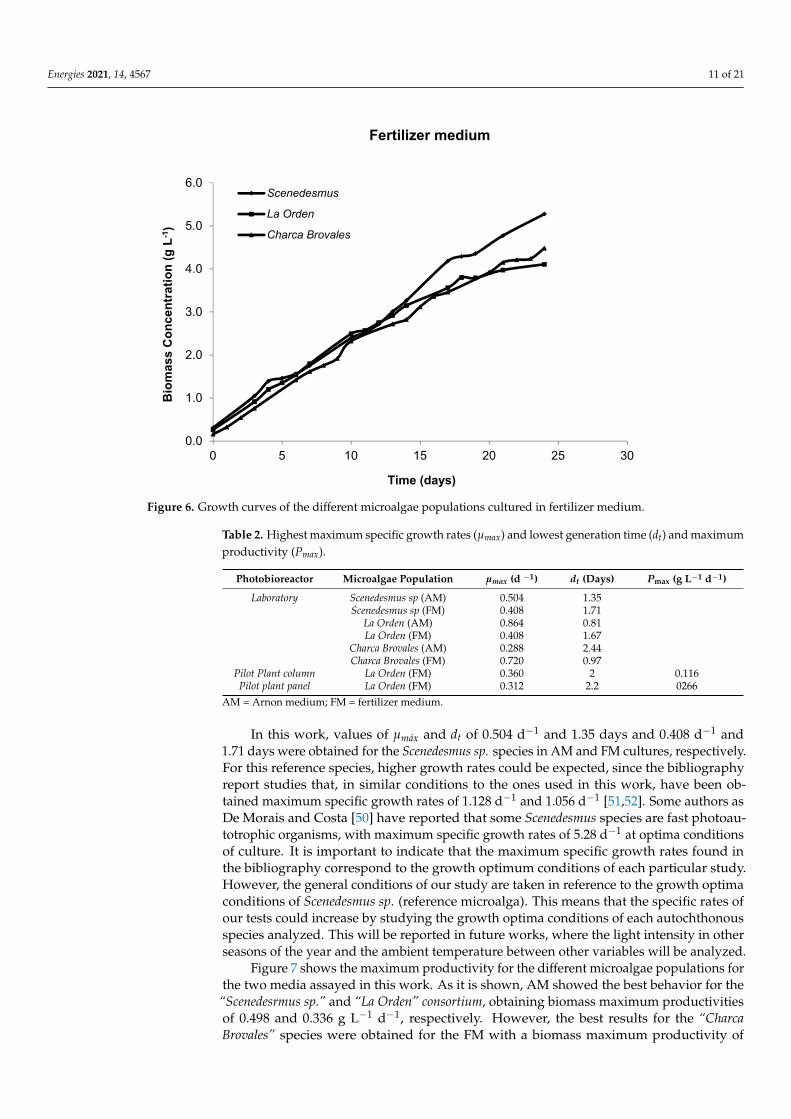
Growth curves obtained from the different microalgae populations in the differentmedia were expressed as the biomass concentration versus time, see Figures 5 and 6. In thefigures are given the mean values obtained from three samples of the biomass concentrationoscillating with a deviation less than ±0.04. An exponential growth phase can be observedin every species, which extends along the first section of the high slope. In this phase,it is possible to determine the highest growth rates (µmax), the lowest generation time(dt) and the highest productivities (Pmax). Table 2 collects the corresponding data to thetwo first parameters for this series. In Figure 5, one can see that the curve correspondingto Scenedesmus sp. is always above the “La Orden” consortium curve and this above“Charca Brovales” consortium one. However, the sequence for the µmax value is “La Orden”consortium > Scenedesmus sp. > “Charca Brovales” consortium as is shown in Table 2. Thesequence for the dt value is “La Orden” consortium < Scenedesmus sp. < “Charca Brovales”consortium. For the fertilized medium, Figure 6 shows that the Scenedesmus sp. and “LaOrden” consortium curves are practically overlapped at the beginning, indicating thatµmax and dt are similar as can be seen in Table 2. In the case of the “Charca Brovales”consortium, the values of µmax are higher and dt are lower than for the other two species.The values given in Table 2 are lower than those reported by other authors, which have beencarried out in pieces of research using autochthonous microalgae. For example, Martínez-García [47] obtained µmax of 1.75 d−1, with dt of 9.5 h for the Synechocystis sp. species.However, other authors [48] obtained values of dt near 3 days in the best conditions for theNannochloropsis occulata marine species. In addition, other published works report values ofµmax = 0.312 d−1 for Chlorellas [49], µmax = 0.336 d−1 for the Spirulina sp. species [50] andµmax = 1.09 d−1 for Acutodesmus obliquus [10].
Energies 2021, 14, x FOR PEER REVIEW 11 of 22
Figure 5. Growth curves of the different microalgae populations cultured in Arnon medium.
Figure 6. Growth curves of the different microalgae populations cultured in fertilizer medium.
In this work, values of μmáx and dt of 0.504 d−1 and 1.35 days and 0.408 d−1 and 1.71 days were obtained for the Scenedesmus sp. species in AM and FM cultures, respectively. For this reference species, higher growth rates could be expected, since the bibliography report studies that, in similar conditions to the ones used in this work, have been obtained
0.0
1.0
2.0
3.0
4.0
5.0
6.0
0 5 10 15 20 25 30
Bio
mas
s C
once
ntra
tion
(g L
-1)
Time (days)
Arnon medium
Scenedesmus
La Orden
Charca Brovales
0.0
1.0
2.0
3.0
4.0
5.0
6.0
0 5 10 15 20 25 30
Bio
mas
s C
once
ntra
tion
(g L
-1)
Time (days)
Fertilizer medium
Scenedesmus
La Orden
Charca Brovales
Figure 5. Growth curves of the different microalgae populations cultured in Arnon medium.
Energies 2021, 14, 4567 11 of 21
Energies 2021, 14, x FOR PEER REVIEW 11 of 22
Figure 5. Growth curves of the different microalgae populations cultured in Arnon medium.
Figure 6. Growth curves of the different microalgae populations cultured in fertilizer medium.
In this work, values of μmáx and dt of 0.504 d−1 and 1.35 days and 0.408 d−1 and 1.71 days were obtained for the Scenedesmus sp. species in AM and FM cultures, respectively. For this reference species, higher growth rates could be expected, since the bibliography report studies that, in similar conditions to the ones used in this work, have been obtained
0.0
1.0
2.0
3.0
4.0
5.0
6.0
0 5 10 15 20 25 30
Bio
mas
s C
once
ntra
tion
(g L
-1)
Time (days)
Arnon medium
Scenedesmus
La Orden
Charca Brovales
0.0
1.0
2.0
3.0
4.0
5.0
6.0
0 5 10 15 20 25 30
Bio
mas
s C
once
ntra
tion
(g L
-1)
Time (days)
Fertilizer medium
Scenedesmus
La Orden
Charca Brovales
Figure 6. Growth curves of the different microalgae populations cultured in fertilizer medium.
Table 2. Highest maximum specific growth rates (µmax) and lowest generation time (dt) and maximumproductivity (Pmax).
Photobioreactor Microalgae Population µmax (d −1) dt (Days) Pmax (g L−1 d−1)
Laboratory Scenedesmus sp (AM) 0.504 1.35Scenedesmus sp (FM) 0.408 1.71
La Orden (AM) 0.864 0.81La Orden (FM) 0.408 1.67
Charca Brovales (AM) 0.288 2.44Charca Brovales (FM) 0.720 0.97
Pilot Plant column La Orden (FM) 0.360 2 0.116Pilot plant panel La Orden (FM) 0.312 2.2 0266
AM = Arnon medium; FM = fertilizer medium.
In this work, values of µmáx and dt of 0.504 d−1 and 1.35 days and 0.408 d−1 and1.71 days were obtained for the Scenedesmus sp. species in AM and FM cultures, respectively.For this reference species, higher growth rates could be expected, since the bibliographyreport studies that, in similar conditions to the ones used in this work, have been ob-tained maximum specific growth rates of 1.128 d−1 and 1.056 d−1 [51,52]. Some authors asDe Morais and Costa [50] have reported that some Scenedesmus species are fast photoau-totrophic organisms, with maximum specific growth rates of 5.28 d−1 at optima conditionsof culture. It is important to indicate that the maximum specific growth rates found inthe bibliography correspond to the growth optimum conditions of each particular study.However, the general conditions of our study are taken in reference to the growth optimaconditions of Scenedesmus sp. (reference microalga). This means that the specific rates ofour tests could increase by studying the growth optima conditions of each autochthonousspecies analyzed. This will be reported in future works, where the light intensity in otherseasons of the year and the ambient temperature between other variables will be analyzed.
Figure 7 shows the maximum productivity for the different microalgae populations forthe two media assayed in this work. As it is shown, AM showed the best behavior for the
“Scenedesrmus sp.” and “La Orden” consortium, obtaining biomass maximum productivitiesof 0.498 and 0.336 g L−1 d−1, respectively. However, the best results for the “CharcaBrovales” species were obtained for the FM with a biomass maximum productivity of

Energies 2021, 14, 4567 12 of 21
0.402 g L−1 d−1. It is important to indicate that the nitrogen concentrations of both mediaare different (double in AM media compared to FM media), which can lead to differencesin biomass concentrations, affecting the behavior and growth of the different species.These results are representative if they are compared with other studies carried out withautochthon microalgae. For the reference species used in this work, however, highergrowth rates were reached, with maximum productivities of 0.87–0.95 g L−1 d−1 [53]. Inaddition, very high maximum productivity values, such as 1.437 g L−1 d−1 for Chlorellavulgaris have been published [7]. Similar values to those obtained in this work havebeen published in the bibliography, such as 0.53–0.28, 0.37, 0.36, 0.48, 0.35–0.44 g L−1
d−1 for Nannochloropsis gaditana, Tetraselmis chuii, Tetraselmis suecica and Phaeodactylumtricornutum [54], Chlorella vulgaris [55], Chlorella emersoni [15], Nannochloropsis sp. [56] andScenedesmus ob. [57], respectively. Also, the bibliography shows maximum productivityvalues lower than those obtained in this work, such as 0.15 g L−1 d−1 for Scenedesmusob. [58] and 0.199 g L−1 d−1 [35] and 0.201 g L−1 d−1 [11] for Chlorella vulgaris, this lastwork to produce high-quality biofuel under culture stress conditions. In this study, thegreatest amount of biomass accumulated during all the cultivation was obtained for theScenedesmus sp. microalgae population with 5.66 g L−1, followed by “Charca Brovales” with5.52 g L−1, both in the FM cultures. These productivities can be improved by studying theeffect of light and temperature on growth and biomass composition. It will be carried outin future studies.
Energies 2021, 14, x FOR PEER REVIEW 12 of 22
maximum specific growth rates of 1.128 d−1 and 1.056 d−1 [51,52]. Some authors as De Mo-rais and Costa [50] have reported that some Scenedesmus species are fast photoautotrophic organisms, with maximum specific growth rates of 5.28 d−1 at optima conditions of culture. It is important to indicate that the maximum specific growth rates found in the bibliog-raphy correspond to the growth optimum conditions of each particular study. However, the general conditions of our study are taken in reference to the growth optima conditions of Scenedesmus sp. (reference microalga). This means that the specific rates of our tests could increase by studying the growth optima conditions of each autochthonous species analyzed. This will be reported in future works, where the light intensity in other seasons of the year and the ambient temperature between other variables will be analyzed.
Figure 7 shows the maximum productivity for the different microalgae populations for the two media assayed in this work. As it is shown, AM showed the best behavior for the “Scenedesrmus sp.” and “La Orden” consortium, obtaining biomass maximum productivities of 0.498 and 0.336 g L−1 d−1, respectively. However, the best results for the “Charca Brovales” species were obtained for the FM with a biomass maximum productivity of 0.402 g L−1 d−1. It is important to indicate that the nitrogen concentrations of both media are different (double in AM media compared to FM media), which can lead to differences in biomass concentrations, affecting the behavior and growth of the different species. These results are representative if they are compared with other studies carried out with autochthon microalgae. For the reference species used in this work, however, higher growth rates were reached, with maximum productivities of 0.87–0.95 g L−1 d−1 [53]. In addition, very high maximum productivity values, such as 1.437 g L−1 d−1 for Chlorella vulgaris have been published [7]. Similar values to those obtained in this work have been published in the bibliography, such as 0.53–0.28, 0.37, 0.36, 0.48, 0.35–0.44 g L−1 d−1 for Nannochloropsis gaditana, Tetraselmis chuii, Tetraselmis suecica and Phaeodactylum tricornutum [54], Chlorella vulgaris [55], Chlorella emersoni [15], Nannochloropsis sp. [56] and Scenedesmus ob. [57], re-spectively. Also, the bibliography shows maximum productivity values lower than those obtained in this work, such as 0.15 g L−1 d−1 for Scenedesmus ob. [58] and 0.199 g L−1 d−1 [35] and 0.201 g L−1 d−1 [11] for Chlorella vulgaris, this last work to produce high-quality biofuel under culture stress conditions. In this study, the greatest amount of biomass accumulated during all the cultivation was obtained for the Scenedesmus sp. microalgae population with 5.66 g L−1, followed by “Charca Brovales” with 5.52 g L−1, both in the FM cultures. These productivities can be improved by studying the effect of light and temperature on growth and biomass composition. It will be carried out in future studies.
Figure 7. Maximum productivity for the different microalgae populations.
0
0.1
0.2
0.3
0.4
0.5
0.6
Max
imum
pro
duct
ivity
(g L
-1 d
-1)
Figure 7. Maximum productivity for the different microalgae populations.
3.2.2. Pilot Plant
As has been described above, the growth of the “La Orden” consortium at two photo-bioreactors (column and flat panel) was studied in this plant using the FM culture. Thisculture was elected for this study, due to its better accessibility and lower cost than AM.This species was selected for this experimentation due to its better adaptation to the clima-tologic conditions of the zone, and besides, the consortium of different strains prevailed,it was verified in an analysis performed previously to this experimentation. Probably,the distribution of the different species varied, but to know this it would be necessaryto carry out a species count. This will be performed in future studies. Figures 8 and 9show the growth curves corresponding to “La Orden” species at column and flat panelphotobioreactors, respectively, where the evolution of biomass concentration versus time isplotted. It can be observed that the increase of biomass concentration is practically linearwith time, where light is most likely the limiting factor. They show low values in terms

Energies 2021, 14, 4567 13 of 21
of accumulated biomass and it may be due to the low temperatures (4–12 ◦C) and lowbrightness of January (high cloudiness) when these experiments were carried out.
Energies 2021, 14, x FOR PEER REVIEW 13 of 22
3.2.2. Pilot Plant As has been described above, the growth of the “La Orden” consortium at two pho-
tobioreactors (column and flat panel) was studied in this plant using the FM culture. This culture was elected for this study, due to its better accessibility and lower cost than AM. This species was selected for this experimentation due to its better adaptation to the cli-matologic conditions of the zone, and besides, the consortium of different strains pre-vailed, it was verified in an analysis performed previously to this experimentation. Prob-ably, the distribution of the different species varied, but to know this it would be necessary to carry out a species count. This will be performed in future studies. Figures 8 and 9 show the growth curves corresponding to “La Orden” species at column and flat panel photobi-oreactors, respectively, where the evolution of biomass concentration versus time is plot-ted. It can be observed that the increase of biomass concentration is practically linear with time, where light is most likely the limiting factor. They show low values in terms of ac-cumulated biomass and it may be due to the low temperatures (4–12 °C) and low bright-ness of January (high cloudiness) when these experiments were carried out.
Figure 8. Growth curve of “La Orden” species with fertilizer medium in column photobioreactor of the pilot plant.
y = 0.0629x + 0.1472R² = 0.9856
0.00
0.20
0.40
0.60
0.80
1.00
1.20
1.40
0 2 4 6 8 10 12 14 16 18 20
Biom
ass c
once
ntra
tion
(g L
-1)
Time (days)
C1 Column
Figure 8. Growth curve of “La Orden” species with fertilizer medium in column photobioreactor of the pilot plant.
Energies 2021, 14, x FOR PEER REVIEW 14 of 22
Figure 9. Growth curve of “La Orden” species with fertilizer medium in panel photobioreactor of the pilot plant.
Growth rates (μmax) were also significantly lower than those expected and may be attributed to the lack of brightness and low temperatures of the period in which the study took place. This effect has been observed by other workers in this season (winter) since the availability of light is undoubtedly the main limiting factor for the photoautotrophs mi-croalgae cultures [59]. Likewise, the temperature also influences the rate coefficients in the biosynthetic pathway of microalgae growth [60]. This parameter ranged between 6–15 °C during the study month. The unfavorable weather conditions and other factors such as high cell density, cells adhesion to the photobioreactor walls prevented the penetration of light into the culture. Thus, it was appreciated a slow exponential growth phase by light limitation, this fact has been also observed by other workers [38]. The results obtained in these experiments showed that the “La Orden” algae population has a similar growth rate and dt in both systems, but the maximum productivity in the flat panel photobioreactor doubled to the obtained in the column photobioreactor (see Table 2). This effect may be attributable to the large illuminated surface of this type of photobioreactor, favoring the culture growth, as other workers have reported also [61].
3.3. Characterization of Microalgae Biomass from Laboratory Photobioreactors In Table 3, the elemental analysis and HHV of the different microalgae populations
are showed. There are no important differences in the C, H and S contents of the different species independently of the culture medium utilized, however, some differences are ob-served in the N content. While for “Scenedesmus sp.” and “La Orden” consortium species, the N content is higher for FM than AM, for the “Charca Brovales” consortium the N con-tent is higher for AM. For this parameter, it is important to remember the different content of N for both culture media.
Table 3. Elemental analysis and HHV of the microalgae populations.
y = 0.0759x + 0.1149R² = 0.9586
0.00
0.20
0.40
0.60
0.80
1.00
1.20
0 2 4 6 8 10 12 14
Biom
ass c
once
ntra
tion
(g L
-1)
Time (days)
P1 Panel
Figure 9. Growth curve of “La Orden” species with fertilizer medium in panel photobioreactor of the pilot plant.
Energies 2021, 14, 4567 14 of 21
Growth rates (µmax) were also significantly lower than those expected and may beattributed to the lack of brightness and low temperatures of the period in which the studytook place. This effect has been observed by other workers in this season (winter) since theavailability of light is undoubtedly the main limiting factor for the photoautotrophs mi-croalgae cultures [59]. Likewise, the temperature also influences the rate coefficients in thebiosynthetic pathway of microalgae growth [60]. This parameter ranged between 6–15 ◦Cduring the study month. The unfavorable weather conditions and other factors such ashigh cell density, cells adhesion to the photobioreactor walls prevented the penetration oflight into the culture. Thus, it was appreciated a slow exponential growth phase by lightlimitation, this fact has been also observed by other workers [38]. The results obtained inthese experiments showed that the “La Orden” algae population has a similar growth rateand dt in both systems, but the maximum productivity in the flat panel photobioreactordoubled to the obtained in the column photobioreactor (see Table 2). This effect may beattributable to the large illuminated surface of this type of photobioreactor, favoring theculture growth, as other workers have reported also [61].
3.3. Characterization of Microalgae Biomass from Laboratory Photobioreactors
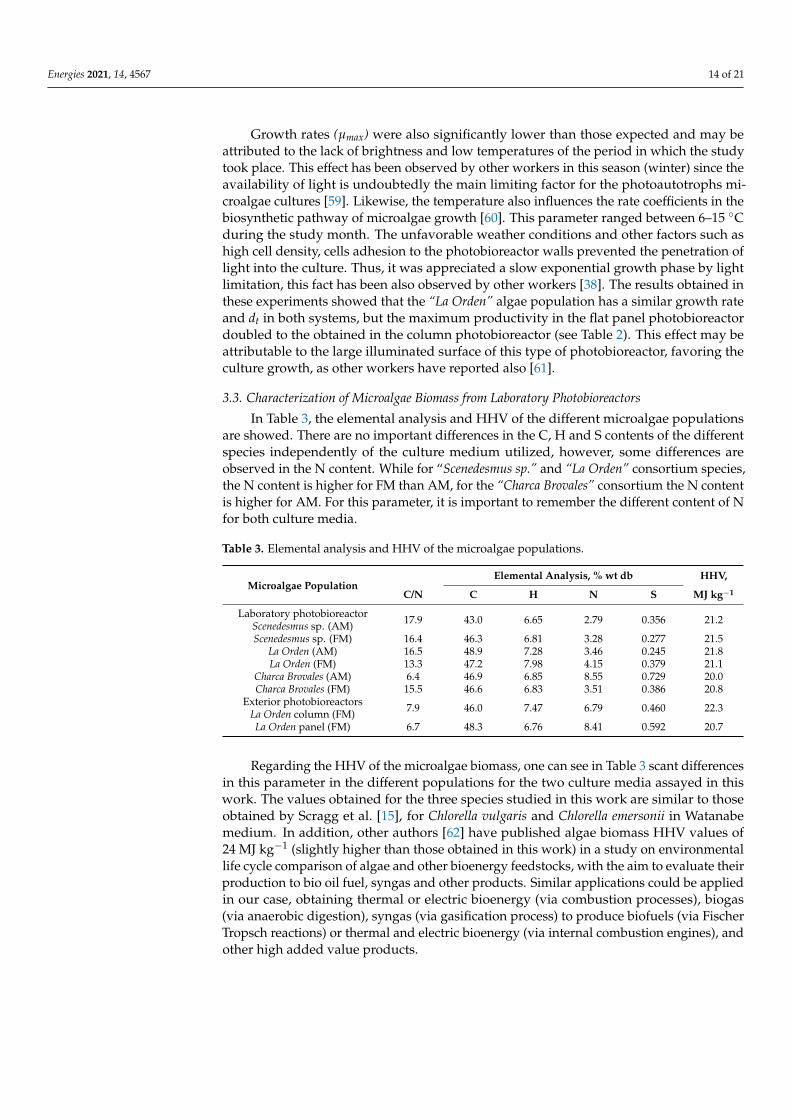
In Table 3, the elemental analysis and HHV of the different microalgae populationsare showed. There are no important differences in the C, H and S contents of the differentspecies independently of the culture medium utilized, however, some differences areobserved in the N content. While for “Scenedesmus sp.” and “La Orden” consortium species,the N content is higher for FM than AM, for the “Charca Brovales” consortium the N contentis higher for AM. For this parameter, it is important to remember the different content of Nfor both culture media.
Table 3. Elemental analysis and HHV of the microalgae populations.
Microalgae PopulationElemental Analysis, % wt db HHV,
C/N C H N S MJ kg−1
Laboratory photobioreactorScenedesmus sp. (AM) 17.9 43.0 6.65 2.79 0.356 21.2
Scenedesmus sp. (FM) 16.4 46.3 6.81 3.28 0.277 21.5La Orden (AM) 16.5 48.9 7.28 3.46 0.245 21.8La Orden (FM) 13.3 47.2 7.98 4.15 0.379 21.1
Charca Brovales (AM) 6.4 46.9 6.85 8.55 0.729 20.0Charca Brovales (FM) 15.5 46.6 6.83 3.51 0.386 20.8
Exterior photobioreactorsLa Orden column (FM) 7.9 46.0 7.47 6.79 0.460 22.3
La Orden panel (FM) 6.7 48.3 6.76 8.41 0.592 20.7
Regarding the HHV of the microalgae biomass, one can see in Table 3 scant differencesin this parameter in the different populations for the two culture media assayed in thiswork. The values obtained for the three species studied in this work are similar to thoseobtained by Scragg et al. [15], for Chlorella vulgaris and Chlorella emersonii in Watanabemedium. In addition, other authors [62] have published algae biomass HHV values of24 MJ kg−1 (slightly higher than those obtained in this work) in a study on environmentallife cycle comparison of algae and other bioenergy feedstocks, with the aim to evaluate theirproduction to bio oil fuel, syngas and other products. Similar applications could be appliedin our case, obtaining thermal or electric bioenergy (via combustion processes), biogas(via anaerobic digestion), syngas (via gasification process) to produce biofuels (via FischerTropsch reactions) or thermal and electric bioenergy (via internal combustion engines), andother high added value products.

Energies 2021, 14, 4567 15 of 21
The lipid contents extracted with hexane for the different microalgae populationsare given in Table 4. The highest values of this parameter were obtained for AM in thepopulations Scenedesmus sp and “La Orden”. For the case of the “Charca Brovales” consortium,the highest value was obtained for FM. The main components of the microalgae biomass areproteins (30–60%), carbohydrates (20–30%), lipids (10–30%) and ashes (5–10%) [59]. Someextraction studies with hexane by Soxhlet method have determined a lipids percentagein dry biomass of the Scenedesmus icrassatulus and Scenedesmus sp. species of 8.2% and7.02%, respectively [63]. The results obtained in this work are similar to those published bythese authors and even higher for the species “Scenedesmus sp.” and “La Orden” consortium,as can be observed in Table 4. Other authors have obtained lipids percentages higherthan those obtained in this work, such as 56.6, 22.4, 12.3–17.5, 15.8% on a dry basis forChlorella vulgari [34], Scenedesmus obliquus [57], Acutodesmus obliquus [10] and Chlorellavulgari [11], respectively.
Table 4. Lipids content of the microalgae populations extracted with hexane.
% wt db Lipids
Microalgae Population Hexane
Laboratory photobioreactor
Scenedesmus sp. (AM) 9.3 ± 0.3Scenedesmus sp. (FM) 8.8 ± 0.2
La Orden (AM) 12.6 ± 0.5La Orden (FM) 8.8 ± 0.3
Charca Brovales (AM) 4.5 ± 0.4Charca Brovales (FM) 7.4 ± 0.15
Exterior photobioreactors
La Orden column (FM) 6.07 ± 0.03La Orden panel (FM) 3.21 ± 0.19
Obviuosly, the production of biodiesel is considered as the most viable option to usethese lipids contents. The results obtained by Chisti [22] highlight this enormous potential,with tests in pilot plants ongoing to prove the feasibility. However, plants at an industrialscale are still at early stages. Nevertheless, some of the pilot plants show considerablehigh productivities (of more than 100 g L−1 d−1) biomass at least for a limited duration.However, the values given by Chisti [22], who found more than 100.000 L of biodiesel perha are estimates based on the highest growth rates and highest oil contents.
The sugars content in the different populations for AM in laboratory photobioreactorswas not analyzed due to the small accounts recollected of microalgae biomass in thisreactors type. In the case of FM, in Table 5 are given the fructose, glucose and sucrosecontents for the three species tested in this work. Although the values shown in Table 5 arelow according to the total values mentioned by other authors, it can be observed that thehighest value corresponds to glucose followed by fructose and sucrose for the three speciesstudied. The production of bioethanol depends directly on the carbohydrates producedby algal biomass. Most of them are part of the cell wall structure and the compositionremains variable for each microalgae species. Therefore, the conditions employed in thecarbohydrates hydrolysis previous to the ethanol production by means of fermentationmust be optimized for each microalgae. Thus, some researchers have reported values of0.24, 0.52 and 0.40 g-ethanol/g-dry biomass for Laminaria japonica [29], Chlorococcum sp. [64]and Chlorella vulgaris [65], respectively.

Energies 2021, 14, 4567 16 of 21
Table 5. Sugars and carbohydrates content of the microalgae populations in fertilizer medium.
Microalgae PopulationSugars Content % wt db
Fructose Glucose Sucrose
Laboratory photobioreactor
Scenedesmus sp 0.98 5.08 0.75La Orden 0.71 1.45 0.51
Charca Brovales 0.81 2.01 0.31
Microalgae populationCarbohydrates
(% wt db)
Exterior photobioreactors
La Orden column 6.50La Orden panel 9.22
3.4. Microalgae Biomass Characterization from Exterior Photobioreactors
In this section, the results obtained in panel and column photobioreactors are discussedwith the aim of increasing the microalgae biomass production. The culture medium usedwas FM and the cultivated species was “La Orden”. Tables 3 and 5 show, respectively,the elemental and HHV analysis and carbohydrates content, of the biomasses collectedfrom the flat panel and column photobioreactors. Small differences in the elementalanalysis and HHV of the biomass extracted from the two photobioreactors can be observed.Thus, the biomass extracted from the column has an H content and HHV higher thanthe extracted from the flat plate photobioreactor. However, the carbohydrates contentof the biomass extracted from the flat panel is higher than the extracted one from thecolumn photobioreactor. The carbohydrates content obtained in this work for “La Orden”microalga biomass is low compared to that obtained by other workers, as has been alreadycommented above. This fact may be caused by a lack of nutrients; according to differentauthors, a nitrogen deficit causes a high accumulation of carbohydrates [66]. The N contentanalyzed in the biomass extracted from the two photobioreactors is high, as can be observedin Table 3 (values of 6.79% and 8.41% in elemental analysis), therefore it could be related tothe lower content of carbohydrates.
On the other hand, the content of accumulated lipids in “La Orden” consortiumbiomass in the two exterior photobiorreactors was low, even lower than in the laboratoryphotobioreactor. However, the extracted biomass from the last one the N content obtainedin the elemental analysis was also quite lower (see Table 3). This fact may be also dueto the lack of nitrogen, in coherence with recent studies [25,66], which have shown thatmicroalgae culture in nitrogen deficient conditions leads to an increase in the lipid orcarbohydrate content, since there is a competition between the synthesis of lipids andsugars. However, the increase in lipids or carbohydrate contents under nitrogen stressconditions appears to differ depending on the strain [66]. Thus, in this work, the samereason is applied, suggesting that the cultivation of the column suffered no nutritionalstress, and in consequence, it presented a lipids content higher than the culture carriedout in the flat panel photobioreactor (see Table 4). Probably, the competition between thesynthesis of lipids and sugars gave rise to an increase in the percentage of carbohydrates,reducing thus the percentage of lipids.
Table 6 collects the fatty acids composition of microalgae and vegetable oils to establisha comparison. The “La Orden” species oil has a major fatty acid, palmitic acid, which isa saturated fatty acid that gives the oil a high saturation rank, close to the 40% that istypical of animal fats (see Table 6) [67]. On the other hand, this oil contains a high numberof not identified fatty acids that although in low concentrations, as can be observed inthe chromatogram of Figure 10, are involved in the important total content. Also, thehigh oleic and linoleic acid contents are highlighted, as is expected in typical vegetableoils (see Table 6) where their contents are higher than in animal fats [27]. Comparing

Energies 2021, 14, 4567 17 of 21
the fatty acid composition of the five microalgae species oils included in Table 6, one canobserve that “La Orden” species oil is a mix between Scenedesmus ob., Chlorella vulgaris andAcutodesmus obliquus oils, since the distribution of Parietochloris incisa oil is very differentto “La Orden”. In the case of “La Orden” species oil utilization for biodiesel production,contrary effects were observed. On the one hand, the high saturation rank of this oilconferred poor properties at low temperatures, while the polyunsaturated fatty acidspresence would improve these properties regarding the results obtained with animal fatsbiodiesel. Dissimilarly, the oxidation stability of the generated biodiesels would be favoredby the presence of saturated fatty acids, while fatty acids such as linoleic and oleic wouldbe more affected in the oxidation process [68].
Table 6. Comparison of the major fatty acid composition of microalgae with other feedstocks published by other workers([10]: Yun et al., 2016; [11]: El-Sheekh et al., 2019; [25]: Bigogno et al., 2002; [27] Martínez et al., 2014; [57]: Ho et al., 2012; [67]:Encinar et al., 2011).
Origin AnimalFats [67]
Rape Oil[27]
SoybeanOil [27]
Scenedesmusob. Oil [57]
Parietochlorisincisa
Oil [25]
ChlorellavulgarisOil [11]
AcutodesmusobliquusOil [10]
“La Orden”Oil (this
work)
Lauric acid C12:0 0.46 ± 0.05
Myristic acid C14:0 1.38 0.07 0.09 1.33 ± 0.75Palmitic acid C16:0 27.3 4.92 11.60 19.80 10.00 34.37 ± 1.56 34.0 31.50 ± 1.37
Palmitoleic acidC16:1 4.01 0.24 0.11 4.06 2.00 2.41 ± 0.09
Stearic acid C18:0 11.7 1.63 3.25 9.08 3.00 4.75 ± 1.2 3.17 ± 0.09Oleic acid C18:1 44.4 66.59 25.09 16.41 16.00 44.91 ± 2.65 13.0 19.60 ± 1.56
Linoleic acid C18:2 10.4 17.08 52.93 21.50 17.00 12.78 ± 1.87 7.8 9.32 ± 1.13Linolenic acid
C18:3 0.62 7.75 5.95 12.3 3.00 1.40 ± 0.05 36.0 6.25 ± 1.05
Nonadecanoic acidC19:0 4.71 ± 1.01
Arachidonic acidC20:4 43.00
Others 0.19 1.71 0.99 16.60 3 9.2 23.10 ± 0.93
Studies on the biogas generation by anaerobic digestion from microalgae have beenconducted since the 1950s [7]. In this work, the anaerobic digestion of “La Orden” biomassspecies collected from flat panel and column photobioreactors was made. The microalgaebiomass introduced in the digester was fresh, as it was extracted from photobioreactors.The microalgae biomass digestion process was facilitated by introducing in the digester aninoculum, the ratio microalgae/inoculum used in this test was 2:1. In Table 7 the charac-teristics of the two substrates are given. The digestion process was carried out in a batchregime. The aim was simply to know the potential of CH4 yield of the species cultured inthe higher capacity photobioreactors. The CH4 yield obtained was 296 ± 23 L CH4 kgVSS
−1
added with a reduction percentage of COD and vs. of 50 ± 1% and 50 ± 1.7%, respectively.Ras et al. [7] studied the anaerobic digestion of Chlorella vulgaris under 28 days hydraulicretention time with an organic loading rate of 1 gCOD L−1, obtaining a methane productionof 240 L kgVSS
−1, they achieved a 51% COD removal. Debowski et al. [36] have obtained351.88 L kgVSS
−1 in the anaerobic codigestion of perennial crop Sida hermaphrodita andmicroalgae biomass under semi-continuous conditions. Wang and Park [9] obtained ahigher CH4 yield on the volatile solids fed to the digester for Chlorella sp. (230 L kgVSS
−1)than Micractinium sp. (209 L kgVSS
−1).

Energies 2021, 14, 4567 18 of 21Energies 2021, 14, x FOR PEER REVIEW 18 of 22
Figure 10. Chromatogram of fatty acid profile from “La Orden” microalga oil.
Studies on the biogas generation by anaerobic digestion from microalgae have been conducted since the 1950s [7]. In this work, the anaerobic digestion of “La Orden” biomass species collected from flat panel and column photobioreactors was made. The microalgae biomass introduced in the digester was fresh, as it was extracted from photobioreactors. The microalgae biomass digestion process was facilitated by introducing in the digester an inoculum, the ratio microalgae/inoculum used in this test was 2:1. In Table 7 the char-acteristics of the two substrates are given. The digestion process was carried out in a batch regime. The aim was simply to know the potential of CH4 yield of the species cultured in the higher capacity photobioreactors. The CH4 yield obtained was 296 ± 23 L CH4 kgVSS−1 added with a reduction percentage of COD and vs. of 50 ± 1% and 50 ± 1.7%, respectively. Ras et al. [7] studied the anaerobic digestion of Chlorella vulgaris under 28 days hydraulic retention time with an organic loading rate of 1 gCOD L−1, obtaining a methane production of 240 L kgVSS−1, they achieved a 51% COD removal. Debowski et al. [36] have obtained 351.88 L kgVSS−1 in the anaerobic codigestion of perennial crop Sida hermaphrodita and mi-croalgae biomass under semi-continuous conditions. Wang and Park [9] obtained a higher CH4 yield on the volatile solids fed to the digester for Chlorella sp. (230 L kgVSS−1) than Micractinium sp. (209 L kgVSS−1).
Table 7. Initial characterization of substrates used in the anaerobic digestion process.
Parameter pH E, mV TS, % VS, % VST, % CODT, mg O2 L−1
N-ammonia, mg L−1 C:N Alkalinity, mg
CaCO3 L−1 “La Orden” con-
sortium 7.24 53 9.80 65.00 6.37 150000 196 7.55 3754
Inoculum 7.50 −414 2.86 51.29 1.47 47000 1740 9.13 8568
Figure 10. Chromatogram of fatty acid profile from “La Orden” microalga oil.
Table 7. Initial characterization of substrates used in the anaerobic digestion process.
Parameter pH E, mV TS, % VS, % VST, % CODT,mg O2 L−1
N-ammonia,mg L−1 C:N Alkalinity, mg
CaCO3 L−1
“La Orden”consortium 7.24 53 9.80 65.00 6.37 150,000 196 7.55 3754
Inoculum 7.50 −414 2.86 51.29 1.47 47,000 1740 9.13 8568
CODT: Total chemical oxygen demand, mg O2 L−1. VST: Volatile solid over total solid, %.
4. Conclusions
In this work, a study of different microalgae species for biomass production, as well asthe possibilities to obtain biorefinery products has been carried out. Growth curves of threeautochthonous microalgae in laboratory photobioreactors in AM and FM culture mediawere studied. The maximum growth rates, minimum generation times and maximumproductivities were analyzed.
The best results for both media were obtained in Scenedesmus sp. and “Charca Brovales”consortium, respectively.
The elemental analysis and HHV of biomass for all species were independent of theculture medium used.
The lipids highest values were obtained for Arnon medium in Scenedesmus sp. and “LaOrden” consortium and for agricultural liquid fertilizers medium in “Charca Brovales” con-sortium.
The sequence of sugars value was glucose > fructose > sucrose in all the species for FM.The study was also performed in pilot plant (column and flat panel) photobioreactors for
the “La Orden” consortium operated by an automation and monitoring system. The maximum

Energies 2021, 14, 4567 19 of 21
growth rates and maximum productivities were lower in these photobioreactors than in thelaboratory one. In addition, some differences were obtained for lipids and sugars contents. Thefatty acids profile was obtained for “La Orden” consortium oil and its composition is betweenanimal fat and vegetable oil one. Also, the CH4 yield in a batch type digestion process of thisspecies was evaluated, obtaining a value of 296 ± 23 L CH4 kgVSS
−1 added with a reductionpercentage of COD and vs. of 50±1% and 50 ± 1.7%, respectively.
In future research, our group will try to subject the microalgae strains to differentstress conditions in order to increase the production of carbohydrates and lipids for theirtransformation into biofuels, as well as incorporating water from reservoirs into the photo-bioreactors, and thus evaluating the effect of real conditions.
Author Contributions: Conceptualization, J.F.G., M.C. and A.J.C.; methodology, T.B.C.; software,T.B.C. and D.C.; validation, M.C., A.J.C. and J.G.; formal analysis, J.F.G.; investigation, J.F.G., T.B.C.;M.C., A.J.C., J.G. and D.C.; resources, J.F.G.; data curation, A.J.C. and D.C.; writing—original draftpreparation, J.F.G. and A.J.C.; writing—review and editing, All; visualization, All; supervision, All;project administration, J.F.G. funding acquisition, J.F.G. All authors have read and agreed to thepublished version of the manuscript.
Funding: This research was carried out as a part of the 0450_AGRI_SOS_6_E 0406 and ALTERCEXAII 4 E: Medidas de adaptación y mitigación al cambio climático a través del impulso de las energíasrenovables en Centro, Extremadura y Alentejo (Fase II). Projects of the Programme for cross-bordercooperation between Spain and Portugal 2007–2013. Also, it was financed with the Project PCJ1006(2011–2015) “Planta integrada para la fijación de CO2 en microalgas y su aprovechamiento en unproceso de co-digestión para la generación de energía térmica y eléctrica” included in the Programme“Cooperation Projects in strategic sectors between researcher groups and industries” of Junta ofExtremadura (Spain). The authors are gratefull to Junta de Extremadura and Fondo Europeo deDesarrollo Regional (Una manera de hacer Europa) by grant number GR18150.
Institutional Review Board Statement: Not applicable.
Informed Consent Statement: Not applicable.
Conflicts of Interest: The authors declare no conflict of interest.
References1. European Commission. 2030 Objectives. Available online: http://ec.europa.eu/europe2020/index_es.htm (accessed on
20 February 2021).2. Suwelack, K.; Wüst, D. An approach to unify the appraisal framework for biomass conversion systems. Biomass Bioenergy 2015,
83, 354–365. [CrossRef]3. Okoro, V.O.; Sun, Z.; Birch, J. Meat processing waste as a potential feedstock for biochemicals and biofuels- A review of possible
conversion technologies. J. Clean. Prod. 2017, 142, 1583–1608. [CrossRef]4. Dayananda, C.; Sarada, R.; Rani, M.U.; Shamala, T.R.; Ravishankar, G.A. Autotrophic cultivation of Botryococcus braunii for the
production of hydrocarbons and exopolysaccharides in various media. Biomass Bioenergy 2007, 31, 87–93. [CrossRef]5. Deprá, M.C.; Dos Santos, A.M.; Severo, I.A.; Santos, A.B.; Zepka, L.Q.; Jacob-Lopes, E. Microalgal Biorefineries for Bioenergy
Production: Can We Move from Concept to Industrial Reality? BioEnergy Res. 2018, 11, 727–747. [CrossRef]6. Pienkos, P.; Darzins, A. The promise and challenges of microalgal-derived biofuels. Biofuel Bioprod. Biorefining 2009, 3, 431–440.
[CrossRef]7. Ras, M.; Lardon, L.; Sialve, B.; Bernet, N.; Steyer, J.P. Experimental study on a coupled process of production and anaerobic
digestion of Chorella vulgaris. Bioresour. Technol. 2011, 102, 200–206. [CrossRef] [PubMed]8. Debowski, M.; Zielinski, M.; Grala, A.; Dudek, M. Algae biomass as an alternative substrate in biogas production technologies—
Review. Renew. Sustain. Energy Rev. 2013, 27, 596–604. [CrossRef]9. Wang, M.; Park, C. Investigation of anaerobic digestion of Chlorella sp. and Micractinium sp. grown in high-nitrogen wastewater
and their co-digestion with waste activated sludge. Biomass Bioenergy 2015, 80, 30–37. [CrossRef]10. Yun, H.S.; Ji, M.K.; Park, Y.T.; Salama, E.S.; Choi, J. Microalga, Acutodesmus obliquus KGE 30 as a potential candidate for CO2
mitigation and biodiesel production. Environ. Sci. Pollut. Res. 2016, 23, 17831–17839. [CrossRef]11. El-Sheekh, M.M.; Gheda, S.F.; El-Sayed, A.E.B.; Shady, A.M.A.; El-Sheikh, M.E.; Schagerl, M. Outdoor cultivation of the green
microalga Chlorella vulgaris under stress conditions as a feedstock for biofuel. Environ. Sci. Pollut. Res. 2019, 26, 18520–18532.[CrossRef]
12. Batan, L.; Quinn, J.; Willson, B.; Bradley, T. Net energy and greenhouse gas emission evaluation of biodiesel derived frommicroalgae. Environ. Sci. Technol. 2010, 44, 7975–7980. [CrossRef]

Energies 2021, 14, 4567 20 of 21
13. Liu, X.; Saydah, B.; Eranki, P.; Colosi, L.M.; Mitchell, B.G.; Rhodes, J.; Clarens, A.F. Pilot-scale data provide enhanced estimates ofthe life cycle energy and emissions profile of algae biofuels produced via hydrothermal liquefaction. Bioresour. Technol. 2013, 148,163–171. [CrossRef] [PubMed]
14. Moody, J.W.; McGinty, C.M.; Quinn, J.C. Global evaluation of biofuel potential from microalgae. Proc. Natl. Acad. Sci. USA 2014,111, 8691–8696. [CrossRef] [PubMed]
15. Scragg, A.H.; Illman, A.M.; Carden, A.; Shales, S.W. Growth of microalgae with increased calorific values in a tubular bioreactor.Biomass Bioenergy 2002, 23, 67–73. [CrossRef]
16. Wijffels, R.; Barbosa, M. An Outlook on Microalgal Biofuels. Science 2010, 329, 796–799. [CrossRef]17. Norsker, N.H.; Barbosa, M.J.; Vermue, M.H.; Wijffels, R.H. Microalgal production—A close look at the economics. Biotechnol. Adv.
2011, 29, 24–27. [CrossRef]18. Murphy, C.F.; Allen, D.T. Energy-water nexus for mass cultivation of algae. Environ. Sci. Technol. 2011, 45, 5861–5868. [CrossRef]19. Alba, L.; Torri, C.; Samorì, C.; van der Spek, J.; Fabbri, D.; Kersten, S.R.A.; Brilman, D.W.F. Hydrothermal treatment (HTT) of
microalgae: Evaluation of the process as conversion method in an algae biorefinery concept. Energy Fuels 2012, 26, 642–657.[CrossRef]
20. Mu, D.; Min, M.; Krohn, B.; Mullins, K.A.; Ruan, R.; Hill, J. Life cycle environmental impacts of wastewater-based algal biofuels.Environ. Sci. Technol. 2014, 48, 11696–11704. [CrossRef] [PubMed]
21. Mu, D.; Ruan, R.; Addy, M.; Mack, S.; Chen, P.; Zhou, Y. Life cycle assessment and nutrient analysis of various processingpathways in algal biofuel production. Bioresour. Technol. 2017, 230, 33–42. [CrossRef]
22. Chisti, Y. Biodiesel from microalgae. Biotechnol. Adv. 2007, 25, 294–306. [CrossRef] [PubMed]23. Suali, E.; Sarbatly, R. Conversion of microalgae to biofuel. Renew. Sustain. Energy Rev. 2012, 16, 4316–4342. [CrossRef]24. Kunjapur, A.M.; Bruce-Eldridge, R. Photobioreactor Design for Commercial Biofuel Production from Microalgae. Ind. Eng. Chem.
Res. 2010, 49, 3516–3526. [CrossRef]25. Bigogno, C.; Khozin-Goldberg, I.; Boussiba, S.; Vonshaka, A.; Cohen, Z. Lipid and fatty acid composition of the green oleaginous
alga Parietochloris incisa, the richest plant source of arachidonic acid. Phytochemistry 2002, 60, 497–503. [CrossRef]26. Encinar, J.M.; González, J.F.; Sabio, E.; Ramiro, M.J. Preparation and properties of biodiesel from Cynara cardúnculus L. oil. Ind.
Eng. Chem. Res. 1999, 38, 2927–2931. [CrossRef]27. Martínez, G.; Sánchez, N.; Encinar, J.M.; González, J.F. Fuel properties of biodiesel from vegetable oils and oil mixtures. Influence
of methyl esters distribution. Biomass Bioenergy 2014, 63, 22–32. [CrossRef]28. Sánchez, N.; Sánchez, R.; Encinar, J.M.; González, J.F.; Martínez, G. Complete analysis of castor oil methanolysis to obtain
biodiesel. Fuel 2015, 147, 95–99. [CrossRef]29. Kim, N.J.; Li, H.; Jung, K.; Chang, C.H.; Lee, P.C. Ethanol production from marine algal hydrolysates using Escherichia coli KO11.
Bioresour. Technol. 2011, 102, 7466–7469. [CrossRef]30. John, R.P.; Anisha, G.S.; Nampoothiri, K.M.; Pandey, A. Micro and macroalgal biomass: A renewable source for bioethanol.
Bioresour. Technol. 2011, 102, 186–193. [CrossRef] [PubMed]31. Matías, J.; Encinar, J.M.; González, J.; González, J.F. Optimisation of ethanol fermentation of Jerusalem artichoke tuber juice using
simple technology for a decentralised and sustainable ethanol production. Energy Sustain. Dev. 2015, 25, 4–39. [CrossRef]32. Nahak, S.; Nahak, G.; Pradhan, I.; Sahu, R.K. Bioethanol from Marine Algae: A Solution to Global Warming Problem. J. Appl.
Environ. Biol. Sci. 2011, 1, 74–80.33. Branyikova, I.; Marsalkova, B.; Doucha, J.; Branyik, T.; Bisova, K.; Zachleder, V. Microalgae-novel highly efficient starch producers.
Biotechnol. Bioeng. 2011, 108, 766–776. [CrossRef] [PubMed]34. Liu, Z.Y.; Wang, G.C.; Zhou, B.C. Effect of iron on growth and lipid accumulation in Chlorella vulgaris. Bioresour. Technol. 2008, 99,
4717–4722. [CrossRef] [PubMed]35. Dragone, G.; Fernandes, B.D.; Abreu, A.P.; Vicente, A.A.; Teixeira, J.A. Nutrient limitation as a strategy for increasing starch
accumulation in microalgae. Appl. Energy 2011, 88, 3331–3335. [CrossRef]36. Debowski, M.; Zielinski, M.; Kisielewska, M.; Krzemieniewski, M. Anaerobic Co-digestion of the Energy Crop Sida hermaphrodita
and Microalgae Biomass for Enhanced Biogas Production. Int. J. Environ. Res. 2017, 11, 243–250. [CrossRef]37. Arnon Daniel, I.; McSwain, B.D.; Tsujimoto, H.Y.; Wada, K. Photochimical activity and components of membrane preparations
from blue-green algae I. Coexistence of two photosystems in relation to cholorphyll and removal of phycoyanin. Biochim. Biophys.Acta 1974, 357, 231–245. [CrossRef]
38. Andersen, R.A. Algal Culturing Techniques; Elsevier Academic Press: Burlington, MA, USA, 2005.39. Chisti, Y. Production of microalgae for energy—An introduction. In Proceedings of the International Technical Conference on
“Production and Use of Microalgae for Energy Purposes”, Madrid, Spain, 11 November 2008.40. Calderón, A.J.; González, I. Some hardware and instrumentation aspects of the development of an automation system for jar tests
in drinking water treatment. Sensors 2017, 17, 2305. [CrossRef]41. Moxley, G.; Zhang, Y.H.P. More accurate determination of acid-labile carbohydrates in lignocellulose by modified quantitative
saccharification. Energy Fuels 2007, 21, 684–3688. [CrossRef]42. Ho, S.H.; Huang, S.W.; Chen, C.Y.; Hasunuma, T.; Kondo, A.; Chang, J.S. Bioethanol production using carbohydrate-rich
microalgae biomass as feedstock. Bioresour. Technol. 2013, 135, 191–198. [CrossRef]43. Anderson, J.; Sorek, B. Microalgae: The Fuel of Tomorrow; University of Pittsburg: Pittsburgh, PA, USA, 2008.

Energies 2021, 14, 4567 21 of 21
44. Encinar, J.M.; González, J.F.; Martínez, G.; Sánchez, N.; Pardal, A. Soybean oil transesterification by the use of a microwave flowsystem. Fuel 2012, 95, 386–393. [CrossRef]
45. EPA 414.4. Methods for Chemical Analysis of Water and Wastes; U.S. Environmental Protection Agency, Environmental Monitoringand Support Laboratory: Washington, DC, USA, 1993.
46. Bailey, J.E.; Ollis, D.F. Biochemical Engineering Fundamentals, 2nd ed.; McGraw-Hill: Singapore, 1986.47. Martínez-García, L. Elimination of CO2 with Native Microalgae. Ph.D. Thesis, University of León, Institute of Natural Resources,
Area of Chemical Engineering, León, Spain, 2009; p. 213.48. Persico, M.M.; Moris, M.; Tranier, E.D.; Zanazzi, A.N.; Saubidet, A.A.; Beligni, M.V. Evaluación de un sistema exterior de cultivo
masivo de la microalga marina Nannochloropsis occulata, en una zona templada oceánica de Argentina. Revista Latinoamericana deBiotecnología Ambiental y Algal 2011, 2, 30–48.
49. Chang, E.H.; Yang, S.S. Some characteristics of microalgae isolated in Taiwan for biofixation of carbon dioxide. Bot. Bull. Acad.Sin. 2003, 44, 43–52.
50. De Morais, M.G.; Costa, J.A. Biofixation of carbon dioxide by Spirulina sp. and Scenedesmus obliquus cultivated in a three-stageserial tubular photobioreactor. J. Biotechnol. 2007, 129, 439–445. [CrossRef] [PubMed]
51. Martínez, M.E.; Jiménez, J.M.; Farida, E.Y. Influence of phosphorus concentration on the growth kinetics and stoichiometry of themicroalga Scenedesmus obliquus. Process. Biochem. 1997, 32, 657–664. [CrossRef]
52. Hodaifa, G.; Martínez, M.; Sánchez, S. Use of industrial wastewater from olive-oil extraction for biomass production of Scenedesmusobliquus. Bioresour. Technol. 2008, 99, 1111–1117. [CrossRef] [PubMed]
53. Sánchez, J.F.; Fernández-Sevilla, J.M.; Acién, F.G.; Cerón, M.C.; Pérez-Parra, J.; Molina-Grima, E. Biomass and lutein productivityof Scenedesmus almeriensis: Influence of irradiance, dilution rate and temperature. Appl. Microbiol. Biotechnol. 2008, 79, 719–729.[CrossRef] [PubMed]
54. San Pedro, A.; González-López, C.V.; Acién, F.G.; Molina-Grima, E. Marine microalgae selection and culture conditions optimiza-tion for biodiesel production. Bioresour. Technol. 2013, 134, 353–361. [CrossRef]
55. Illman, A.M.; Scragg, A.H.; Shales, S.W. Increase in chlorella strains calorific values when grown in low nitrogen medium. Enzym.Microb. Technol. 2000, 27, 631–635. [CrossRef]
56. Chiu, S.Y.; Kao, C.Y.; Tsai, M.T.; Ong, S.C.; Chen, C.H.; Liu, C.S. Lipid accumulation and CO2 utilization of Nannochloropsisocculata in response to CO2 aeration. Bioresour. Technol. 2009, 100, 833–838. [CrossRef]
57. Ho, S.H.; Chen, C.Y.; Chang, J.S. Effect of light intensity and nitrogen starvation on CO2 fixation and lipid/carbohydrateproduction of an indigenous microalga Scenedesmus obliquus CNW-N. Bioresour. Technol. 2012, 113, 244–252. [CrossRef] [PubMed]
58. Mandal, S.; Mallick, N. Scenedesmus obliquus as a potential source of biodiesel production. Appl. Microbiol. Biotechnol. 2009, 84,281–291. [CrossRef] [PubMed]
59. Molina-Grima, E.; Fernández-Sevilla, J.M.; Sánchez-Pérez, J.A.; García-Camacho, F. A study on simultaneous photolimitation andphotoinhibition in dense microalgal cultures taking into account incident and averaged irradiances. J. Biotechnol. 1996, 45, 59–69.[CrossRef]
60. Richmond, A. Microalgaculture. Crit. Rev. Biotechnol. 1986, 4, 369–438. [CrossRef]61. Tredici, M.R.; Chini Zitelli, G. Efficiency of sunlight utilization: Tubular versus flat fotobioreactors. Biotechnol. Bioeng. 1998, 57,
187–197. [CrossRef]62. Clarens, A.F.; Resurreccion, E.P.; White, M.A.; Colosi, L.M. Environmental life cycle comparison of algae to other bioenergy
feedstocks. Environ. Sci. Technol. 2010, 44, 1813–1819. [CrossRef]63. Punín-Crespo, M.O.; Lage-Yusty, M.A. Determination of aliphatic hydrocarbons in the alga Himanthalia elongate. Ecotoxicol.
Environ. Saf. 2004, 57, 226–230. [CrossRef] [PubMed]64. Harun, R.; Danquah, M.K.; Forde, G.M. Microalgal biomass as a fermentation feedstock for bioethanol production. J. Chem.
Technol. Biotechnol. 2010, 85, 199–203. [CrossRef]65. Lee, S.; Oh, Y.; Kim, D.; Kwon, D.; Lee, C.; Lee, J. Converting carbohydrates extracted from marine algae into ethanol using
various ethanolic Escherichia coli strains. Appl. Microbiol. Biotechnol. 2011, 164, 878–888. [CrossRef]66. Ho, S.H.; Huang, S.W.; Chen, C.Y.; Hasunuma, T.; Kondo, A.; Chang, J.S. Characterization and optimization of carbohydrate
production from an indigenous microalgae Chorella vulgaris FSP-E. Bioresour. Technol. 2013, 135, 157–165. [CrossRef]67. Encinar, J.M.; Sánchez, N.; Martínez, G.; García, L. Study of biodiesel production from animal fats with high free fatty acid
content. Bioresour. Technol. 2011, 102, 10907–10914. [CrossRef]68. Sánchez, N. Obtención de Biodiésel Mediante Transesterificación de Aceite de Ricino y Grasas Animales. Aprovechamiento Energético
de la Glicerina Como Subproducto Del Proceso. Ph.D. Thesis, Universidad de Extremadura, Badajoz, Spain, 18 May 2015.
Copyright © 2022 FDOKUMEN