Woody Feedstock 2018 State of Technology Report
140
The INL is a U.S. Department of Energy National Laboratory operated by Battelle Energy Alliance INL/EXT-18-51655-Revision-0 Woody Feedstock 2018 State of Technology Report Damon S Hartley, David N Thompson, Hongqiang Hu, Hao Cai September 2018
-
Upload
khangminh22 -
Category
Documents
-
view
0 -
download
0
Transcript of Woody Feedstock 2018 State of Technology Report

The INL is a U.S. Department of Energy National Laboratoryoperated by Battelle Energy Alliance
INL/EXT-18-51655-Revision-0
Woody Feedstock 2018State of TechnologyReport
Damon S Hartley, David N Thompson,Hongqiang Hu, Hao Cai
September 2018

INL/EXT-18-51655-Revision-0
Woody Feedstock 2018 State of Technology Report
Damon S Hartley, David N Thompson, Hongqiang Hu, Hao Cai
September 2018
Idaho National LaboratoryIdaho Falls, Idaho 83415
http://www.inl.gov
Prepared for theU.S. Department of Energy
Office of Energy Efficiency and Renewable EnergyUnder DOE Idaho Operations Office
Contract DE-AC07-05ID14517

1
Milestone Completion ReportINL/EXT-18-51655
WOODY FEEDSTOCK 2018 STATE OF TECHNOLOGY REPORT
Damon Hartley, David N. Thompson, Hongqiang Hu, and Hao Cai
SEPTEMBER 30, 2018

2
Milestone Completion ReportINL/EXT-18-51655
BWD#: 1.1.1.2.DL.1Type: MilestoneWBS #: 1.1.1.2
Completion Date: September 30, 2018Scheduled Completion: September 30, 2018Platform Area: Feedstock Supply and Logistics
Milestone Title: Woody Feedstock 2018 State of Technology Report
Authors: Damon Hartley, David N. Thompson, Hongqiang Hu, and Hao Cai(Argonne) and Project Name: Project
Leader:Feedstock Supply Chain AnalysisDavid N. Thompson
Participating Researchers Tyler Westover, Neal Yancey, Jaya Tumuluru, Jeffrey Lacey, DavidThompson, and Vicki Thompson
Key Words: analysis, state of technology, feedstock, woody
EXECUTIVE SUMMARY
The U.S. Department of Energy promotes production of advanced liquid transportationfuels from lignocellulosic biomass by funding fundamental and applied research thatadvances the state of technology (SOT). As part of its involvement with this overall mission,Idaho National Laboratory completes annual SOT reports for biomass feedstock logistics.The purpose of the SOTs are to provide the status of feedstock supply system technologydevelopment for biomass to biofuels, based on actual data and experimental results relative totechnical targets and cost goals from specific design cases.
The 2018 Woody Feedstock SOT presents the State of Technology for feedstock supply to three individual thermochemical conversion pathways that utilize woody feedstocks: Indirect Liquefaction (IDL), Catalytic Fast Pyrolysis (CFP), and Algal-blend Hydrothermal liquefaction (AHTL). The 2018 reactor throat delivered feedstock costs were found to be $63.76/dry ton, $87.82/dry ton and $70.31/dry ton, respectively (2016$).
Additionally, 2022 projections are presented for each pathway. In 2022, the feedstock costs for IDL and AHTL are estimated to remain constant over the period, while the feedstock cost for CFP is projected to be reduced to $70.31/dry ton due to the replacement of 75% of the clean pine with less costly forest residues and the application of stepwise air classification and leaching of the lights fraction, which improves the quality of the forest residue to match or exceed the quality of clean pine.

3
Milestone Completion ReportINL/EXT-18-51655
Table of ContentsEXECUTIVE SUMMARY......................................................................................................... 2
Table of Contents........................................................................................................................3
1. BACKGROUND................................................................................................................. 7
Progression of Feedstock Supply System Designs................................................................... 7
2. DELIVERED FEEDSTOCK COST MODELS.................................................................... 9
2.1 Feedstock Supply Systems for Indirect Liquefaction (IDL).............................................. 10
2.1.1 2018 SOT for Feedstock Supply to IDL.....................................................................10
2.1.1.1 Description of Logistic System Designs.............................................................. 10
2.1.1.2 Cost Summary and Energy Usage....................................................................... 12
2.1.1.3 Sensitivity Analysis of Costs...............................................................................13
2.1.2 2022 Projection for Feedstock Supply to IDL............................................................ 15
2.1.2.1 Description of Logistic System Designs.............................................................. 15
2.1.2.2 Cost Summary and Energy Usage....................................................................... 16
2.1.2.3 Sensitivity Analysis of Costs...............................................................................18
2.2 Feedstock Supply Systems for Catalytic Fast Pyrolysis (CFP)..........................................20
2.2.1 2018 SOT for Feedstock Supply to CFP.................................................................... 20
2.2.1.1 Description of Logistic System Designs.............................................................. 20
2.2.1.2 Cost Summary and Energy Usage....................................................................... 22
2.2.1.3 Sensitivity Analysis of Costs...............................................................................23
2.2.2 2022 Projection for Feedstock Supply to CFP............................................................25
2.2.2.1 Description of Logistics System Designs.............................................................25
2.2.2.2 Cost Summary and Energy Usage....................................................................... 27
2.2.2.3 Sensitivity Analysis of Costs...............................................................................28
2.3 Feedstock Supply Systems for Algal-blend Hydrothermal Liquefaction (AHTL)............. 31
2.3.1 2018 SOT for Logging Residue Supply to AHTL...................................................... 31
2.3.1.1 Description of Logistic System Designs.............................................................. 31
2.3.1.2 Cost Summary and Energy Usage....................................................................... 33
2.3.1.3 Sensitivity Analysis of Costs...............................................................................33
2.3.2 2022 Projection for Logging Residue Supply to AHTL............................................. 36
2.3.2.1 Description of Logistic System Designs.............................................................. 36
2.3.2.2 Cost Summary and Energy Usage....................................................................... 37

4
Milestone Completion ReportINL/EXT-18-51655
2.3.2.3 Sensitivity Analysis of Costs...............................................................................39
3. INDUSTRIAL RELEVANCE OF THE FEEDSTOCKS....................................................41
4. QUALIFICATION OF THE FEEDSTOCKS FOR RENEWABLE IDENTIFICATION NUMBERS............................................................................................................................... 41
5. SUSTAINABILITY CONSIDERATIONS.........................................................................43
6. SUMMARY.......................................................................................................................44
7. REFERENCES.................................................................................................................. 45
APPENDIX A – 2018 Woody State of Technology Feedstocks Logistics Design and Assumptions for Forest Residue Supply to IDL.........................................................................53
A.1 Grower Payment...................................................................................................... 54
A.2 Harvest and Collection.............................................................................................54
A.3 Storage.................................................................................................................... 54
A.4 Landing Preprocessing.............................................................................................55
A.5 Transportation and Handling....................................................................................56
A.6 Handling, Refinery Operations.................................................................................57
APPENDIX B – 2022 Projection for Woody Feedstock Logistics Design and Assumptions for Forest Residue Supply to IDL....................................................................................................58
B.1 Grower Payment...................................................................................................... 59
B.2 Harvest and Collection.............................................................................................59
B.3 Storage.................................................................................................................... 59
B.4 Landing Preprocessing.............................................................................................60
B.5 Transportation and Handling....................................................................................61
B.6 Handling, Refinery Operations.................................................................................62
APPENDIX C – 2018 Woody State of Technology Feedstock Logistics Design and Assumptions for Clean Pine Supply to CFP....................................................................................................63
C.1 Grower Payment......................................................................................................63
C.2 Harvest and Collection............................................................................................ 63
C.3 Storage.................................................................................................................... 65
C.4 Transportation and Handling................................................................................... 66
C.5 Landing Preprocessing............................................................................................ 67
C.6 Preprocessing.......................................................................................................... 67
APPENDIX D – 2022 Projection for Woody Feedstock Logistics Design and Assumptions for Feedstock Supply to CFP.......................................................................................................... 69

5
Milestone Completion ReportINL/EXT-18-51655
D.1 Grower Payment......................................................................................................69
D.2 Harvest and Collection............................................................................................ 71
D.3 Storage.................................................................................................................... 71
D.4 Transportation and Handling................................................................................... 72
D.5 Landing Preprocessing............................................................................................ 73
D.6 Preprocessing.......................................................................................................... 74
APPENDIX E – 2018 Woody State of Technology Feedstock Logistics Design and Assumptions for Forest Residue Supply to AHTL.......................................................................................... 76
E.1 Grower Payment...................................................................................................... 77
E.2 Harvest and Collection.............................................................................................77
E.3 Storage.................................................................................................................... 77
E.4 Landing Preprocessing.............................................................................................78
E.5 Transportation and Handling....................................................................................79
E.6 Processing Operations..............................................................................................80
APPENDIX F – 2022 Projection for Woody Feedstock Logistics Design and Assumptions for Forest Residue Supply to AHTL................................................................................................ 81
F.1 Grower Payment...................................................................................................... 82
F.2 Harvest and Collection.............................................................................................82
F.3 Storage.................................................................................................................... 82
F.4 Landing Preprocessing.............................................................................................83
F.5 Transportation and Handling....................................................................................84
F.6 Handling, Refinery Operations.................................................................................85
APPENDIX G – Process Flow Diagrams and Mass Balances for Supply of Forest Residues to IDL – 2018 SOT....................................................................................................................... 86
APPENDIX H – Process Flow Diagrams and Mass Balances for Supply of Forest Residues to IDL – 2022 Projection...............................................................................................................91
APPENDIX I – Process Flow Diagrams and Mass Balances for Supply of Clean Pine to CFP – 2018 SOT..................................................................................................................................96
APPENDIX J – Process Flow Diagrams and Mass Balances for Supply of a 25% Clean Pine/75% Logging Residue Blend to CFP – 2022 Projection................................................... 107
J.1 Clean Pine Blendstock................................................................................................ 107
J.2 Forest Residue Blendstock..........................................................................................118
APPENDIX K – Process Flow Diagrams and Mass Balances for Supply of Logging Residues to AHTL – 2018 SOT..................................................................................................................125

6
Milestone Completion ReportINL/EXT-18-51655
APPENDIX L – Process Flow Diagrams and Mass Balances for Supply of Logging Residues to AHTL – 2022 Projection......................................................................................................... 131

7
Milestone Completion ReportINL/EXT-18-51655
BACKGROUND1.
The U.S. Department of Energy (DOE) promotes production of advanced liquidtransportation fuels from lignocellulosic biomass by funding fundamental and appliedresearch that advances the state of technology (SOT) to transform renewable biomass intocommercially viable biofuels. To gauge progress toward DOE objectives, the BioenergyTechnologies Office (BETO) sets cost and technology targets and an annual SOT reportprovides the status of technology relative to these goals with actual data and experimentalresults.
The BETO Feedstock Supply and Logistics Program developed performance targets thatare directed at mobilizing large amounts of biomass. One target is to validate feedstocksupply and logistics systems that can deliver feedstock at or below $85.51/dry ton (2016$),including both grower payment and logistics cost through in-feed of the conversion reactor(USDOE 2017).
Feedstocks are essential to achieving BETO goals because the cost, quality, and quantityof feedstock available and accessible at any given time limits the maximum amount ofbiofuels that can be produced. The 2016 U.S. Billion Ton report (USDOE 2016) providesseveral biomass supply scenarios that show potential biomass resources that could bedeveloped under different sets of assumptions regarding yield improvements over time. Someof these scenarios lead to a sustainable national supply of more than 1 billion tons of biomassper year by the year 2030.
In accordance with the 2017 Multi-Year Program Plan (USDOE 2017), terrestrialfeedstock supply and logistics focuses on (1) reducing the delivered cost of sustainablyproduced biomass, (2) preserving and improving the physical and chemical qualityparameters of harvested biomass to meet the individual needs of biorefineries and otherbiomass users, and (3) expanding the quantity of feedstock materials accessible to thebioenergy industry. This is done by identifying, developing, demonstrating, and verifyingefficient and economical integrated systems for harvest and collection, storage, handling,transport, and preprocessing raw biomass from a variety of crops to reliably deliver therequired supplies of high-quality, affordable feedstocks to biorefineries as the industryexpands. The elements of cost, quality, and quantity are key considerations when developingadvanced feedstock supply concepts and systems (USDOE 2015).
Progression of Feedstock Supply System Designs
Feedstock supply systems are highly complex organizations of operations required to move and transform biomass from a raw form at the point of production into a formatted, on-spec feedstock at the throat of the reactor. Feedstock logistics can be broken down into unitoperations, including harvest and collection; storage; transportation; preprocessing; and queuing and handling. Designing economic and environmentally sustainable feedstock supplysystems, while providing necessary resource quantities at the appropriate quality, is critical to growth of the bioenergy industry.

8
Milestone Completion ReportINL/EXT-18-51655
Research on feedstock supply systems aims to reduce delivered cost, improve or preservefeedstock quality, and expands access to biomass resources. Through 2012, BETO-fundedresearch on feedstock supply systems focused on improving conventional feedstock supplysystems. Conventional feedstock supply system designs rely on existing technology and systems to supply feedstock to biorefineries (Figure 1). Conventional designs tend to be vertically integrated, with a specific conversion process or biorefinery; they also place allburden of adapting to feedstock variability on the biorefinery. Within the constraints of localsupply, equipment availability, and permitting requirements, biorefineries strive to optimizeefficiencies and capacities. However, this approach makes the system vulnerable to feedstockvariability.
Figure 1. Conventional feedstock supply system designs rely on existing technologies and biomass to supply biorefineries, but they require biorefineries to adapt to the variability of feedstock.
Conventional designs are currently the backbone of the emerging biofuels industry.However, conventional feedstock supply systems have limitations that restrict widespreadimplementation on a national scale (Hess et al. 2009, Searcy and Hess 2010). The originalthought was that the conventional supply system designs could be successful in geographical areas that have a concentrated supply of easily accessible and low-costbiomass resources (such as corn stover in the Midwestern United States and pine in thesoutheastern United States). Moving outside these select regions, the feedstock supplysystem must be adapted to accommodate a changing cost, quality, and conversion facility’ssize constraints.
Conventional systems can only address feedstock quality indirectly through passivecontrols such as resource selection or best management practices. An example of this is thehigh-capacity grapple used in the DOE-funded Auburn High Tonnage Biomass LogisticsDemonstration Project (Sokhansanj et al. 2014), which prevented woody material frombeing dragged along the ground during skidding, preventing ash entrainment. Whenpositioned in a highly productive single resource area, biorefineries can be selective in contracting only those feedstocks that meet their specifications. However, biomass quality(e.g., ash and moisture content) is highly variable both spatially and temporally (Kenney etal. 2013) and, in any given year, passive controls might not provide enough quality controlfor feedstock to meet the desired in-feed characteristics. Therefore, biorefineries that relyon conventional designs are constrained to local resources and are limited in the expansionof the collection radius, which limits plant size (Graham et al. 2013).

9
Milestone Completion ReportINL/EXT-18-51655
Several analyses have shown that as the biofuels industry expands past the highlyproductive regions, conventional supply systems will fail to meet supply requirements(Argo et al. 2013, Bonner et al. 2014, Hess et al. 2009, Lamers et al. 2015, Muth et al.2014). To meet the demands of future industry, the feedstock supply system will berequired to expand beyond conventional systems in certain areas, to what has been termed“advanced” feedstock supply systems (AFSS) (Hess et al. 2009, Searcy and Hess 2010,Jacobson et al. 2014). Advanced systems incorporate innovative methods of material handling, processing and supply chain configuration.
The 2018 Woody SOT presents current supply chain designs for three conversion pathways that utilize woody biomass as a feedstock: Indirect Liquefaction (IDL), Catalytic Fast Pyrolysis (CFP) and Algal-blend High Temperature Liquefaction (AHTL). IDL is a gasification technology and has the least complicated feedstock supply system, primarily because the feedstock quality requirements for gasification technologies are less stringent than those of pyrolysis technologies, however, the conversion operations are more expensive. For gasification, the particle size can be larger and the quantity of ash can be higher, both aspects that reduce the amount of preprocessing needed. However, the higher cost of the conversion operation requires feedstocks with delivered costs approximately 25%-30% lowerthan the pyrolysis feedstock. To meet the new feedstock requirements the design was changed, reverting from an advanced system that preprocessed the biomass to a conventional system that delivered unpreprocessed chips from forest residue directly to the biorefinery. In addition, since the materials were delivered directly to the biorefinery, process heat was available to perform the drying.
CFP requires a finely-ground, low ash, high quality feedstock. The 2018 SOT utilizes “clean pine” as the model feedstock. The choice to utilize a single feedstock requires that the facility locate in an area with large inventories of available Renewable Identification Number (RIN)-qualified pine. For the “clean pine” case, the location of the biorefinery is in the Piedmont Region on the South Carolina/Georgia border. The use of a single feedstock results in increased transport distances.
AHTL uses logging residue, similar to IDL, with the differences being a much lower total quantity of material, but also that the final material must be ground to a smaller size.Additionally, the location of the resource has been specified as the Gulf coast region, to meet the requirements for algal growth.
DELIVERED FEEDSTOCK COST MODELS2.The Biomass Logistics Model (BLM) (Cafferty et al. 2013a) was used to model feedstock
supply system cost and energy consumption for the 2018 Woody SOT. The BLM incorporatesinformation from a collection of databases that provide (1) engineering performance data forhundreds of equipment systems, (2) spatially explicit labor cost datasets, and (3) local tax andregulation data. The BLM’s analytic engine is built in the systems dynamics software packagePowersim™. The BLM is designed to work with thermochemical and biochemical-based

10
Milestone Completion ReportINL/EXT-18-51655
biofuel conversion platforms and to accommodate a range of lignocellulosic biomass types(e.g., residues, short-rotation woody and herbaceous energy crops, woody residues, and algae).BLM simulates the flow of biomass through the entire supply chain, while tracking changes in feedstock characteristics (i.e., moisture content, dry matter, ash content, and dry bulk density)and calculating cost and energy consumption (Cafferty et al. 2013a). These estimates are theninput into the greenhouse gas, regulated emissions, and energy use in transportation model toperform a cursory farm gate-to-plant gate lifecycle assessment on greenhouse gas (GHG)emissions.
2.1 Feedstock Supply Systems for Indirect Liquefaction (IDL)
The 2018 and 2022 IDL conversion pathway assumes annual nth plant delivery of 725,000 dry tons of woody feedstock, with total ash ≤ 3 wt%, moisture content ≤ 10% (wet basis), and particle size of 2” chips (Table 1). The IDL conversion pathway has a delivered feedstock cost target of $63.76/dry ton (2016$) in 2022, including dockage.
Table 1. Delivered feedstock composition assumptions for indirect liquefaction.
ComponentComposition (dry wt. %)
Carbon 49.81
Hydrogen 5.91
Nitrogen 0.17
Sulfur 0.09
Oxygen 41.02
Ash 3.00
Heating Value (Btu/lb) 8,449 HHV
7,856 LHV
Moisture (Bulk Wt. %) 10.0
Particle Size (inches) 2-in. chips
2.1.1 2018 SOT for Feedstock Supply to IDL
2.1.1.1DescriptionofLogisticSystemDesigns
The 2018 SOT for feedstock supply to IDL is reported in 2016 dollars (2016$) andincludes both grower payment and logistics costs to reflect a total delivered feedstock supplycost. This report outlines the 2018 woody SOT design that was capable of achieving a modeled delivered feedstock cost of $63.76/dry ton. The cost of logging residue delivered for IDL has increased by $3.26/dry ton from the 2017 Woody SOT due to projected reductions in material availability. Logistics costs include harvest, collection, storage,

11
Milestone Completion ReportINL/EXT-18-51655
transportation, and preprocessing costs from the point of harvest to the conversion reactorthroat in-feed. Grower payment represents the stumpage payment and includes the cost ofproduction, compensation for soil nutrient removal, and grower profit. The IDL process hasless stringent quality and particle size requirements than that of pyrolysis, resulting in asimple preprocessing design along with the utilization of considerably cheaper forest residues.
The logistics system for the 2018 SOT, delivering 725,000 dry tons of forest residue, is the same as that described in the 2017 Woody SOT report (Hartley et al., 2017). The IDL system places fewer restrictions on the feedstock specifications in terms of particle size and ash content,which removed the necessity of much of the preprocessing required as compared to prior analyses (which targeted fast pyrolysis.
Grower Payment
Grower payment represents the stumpage price paid to the landowner to secure permission to harvest the material. The grower payment was calculated using the size class stumpage values reported in the 2016 Billion Ton Report (BT16; USDOE, 2016). BT16 provides values of $32.40/dry ton, $16.20/dry ton and $8.10/dry ton, for both planted and natural softwood stands, of size classes 1, 2 and 3, respectively, in the Southern Region. The calculation of forest residue grower payment utilizes the residue ratios from the USDA Forest Service Forest Inventory and Analysis Database (USDA Forest Service, 2017), to determine the proportion of the value of the whole tree stumpage that remains after the harvest as residue. Based on the assumed harvest region, the size class distribution of delivered material and residue ratio, the weighted average grower payment of Forest residue is $3.75/dry ton.
Fieldside Operations
2018 fieldside operations in this design are the same as those presented in the 2017 SOT for gasification (Hartley et al., 2017). As before, it is assumed that the forest residue is brought to the landing as part of the primary harvest operation and as such does not incur harvest or collection cost. Instead, the supply chain starts with size reduction of material that has been driedto 30% moisture content in the field. Size reduction is performed with a mobile chipper, and the operational characteristics of the equipment are based on descriptions resulting from the High Tonnage project completed by Auburn University (Sokhansanj et al., 2014). The chips are blown directly into a truck for transport, eliminating the need for additional loading equipment.
Biorefinery Operations
The forest residue chips are delivered to the refinery by truck, where they are offloaded using a truck tipper with a hopper. From the hopper the chips are conveyed to storage piles until they are dried using a rotary drier. After drying the chips to 10% moisture content, the chips are held in covered storage until feeding to the conversion process.
Processing Location Construction Cost
Construction and infrastructure costs were estimated as follows. Hu et al. (2017) utilized installation factors ranging from 1.43-1.7 to estimate the capital layout for construction and
12
Milestone Completion ReportINL/EXT-18-51655
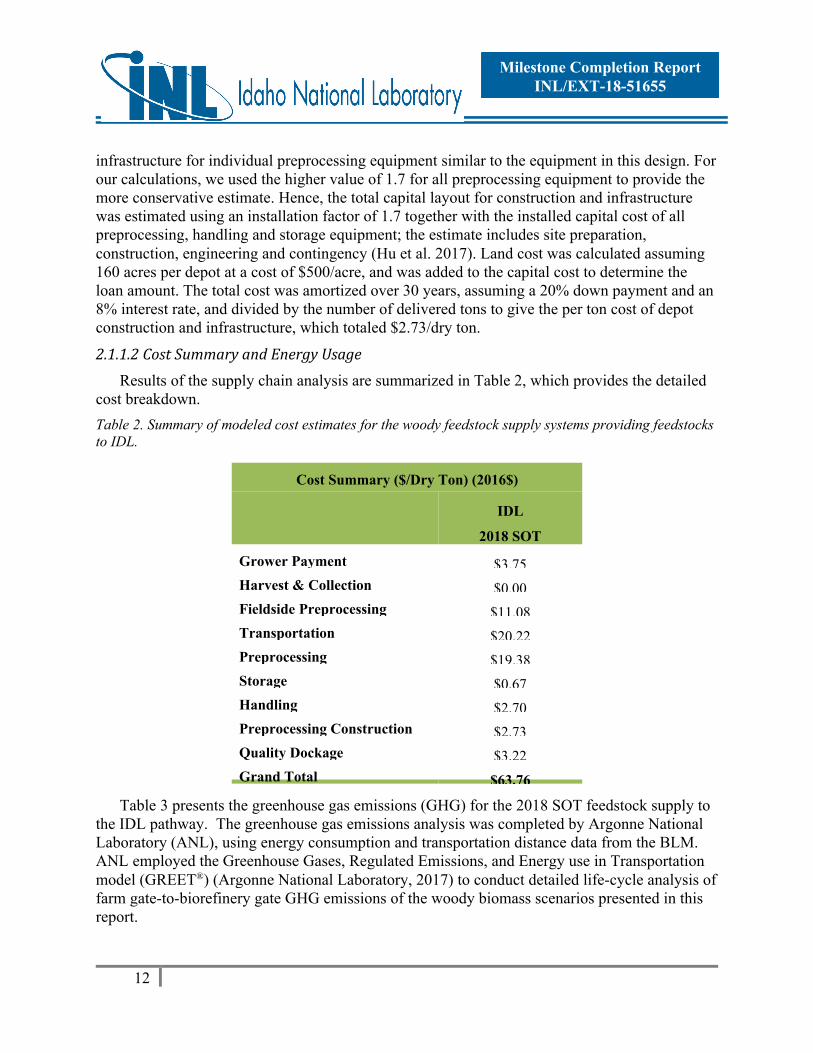
infrastructure for individual preprocessing equipment similar to the equipment in this design. For our calculations, we used the higher value of 1.7 for all preprocessing equipment to provide the more conservative estimate. Hence, the total capital layout for construction and infrastructure was estimated using an installation factor of 1.7 together with the installed capital cost of all preprocessing, handling and storage equipment; the estimate includes site preparation, construction, engineering and contingency (Hu et al. 2017). Land cost was calculated assuming 160 acres per depot at a cost of $500/acre, and was added to the capital cost to determine the loan amount. The total cost was amortized over 30 years, assuming a 20% down payment and an 8% interest rate, and divided by the number of delivered tons to give the per ton cost of depot construction and infrastructure, which totaled $2.73/dry ton.
2.1.1.2CostSummaryandEnergyUsage
Results of the supply chain analysis are summarized in Table 2, which provides the detailed cost breakdown.
Table 2. Summary of modeled cost estimates for the woody feedstock supply systems providing feedstocks to IDL.
Cost Summary ($/Dry Ton) (2016$)
IDL
2018 SOT
Grower Payment $3.75
Harvest & Collection $0.00
Fieldside Preprocessing $11.08
Transportation $20.22
Preprocessing $19.38
Storage $0.67
Handling $2.70
Preprocessing Construction $2.73
Quality Dockage $3.22
Grand Total $63.76
Table 3 presents the greenhouse gas emissions (GHG) for the 2018 SOT feedstock supply to the IDL pathway. The greenhouse gas emissions analysis was completed by Argonne National Laboratory (ANL), using energy consumption and transportation distance data from the BLM.ANL employed the Greenhouse Gases, Regulated Emissions, and Energy use in Transportation model (GREET®) (Argonne National Laboratory, 2017) to conduct detailed life-cycle analysis of farm gate-to-biorefinery gate GHG emissions of the woody biomass scenarios presented in this report.

13
Milestone Completion ReportINL/EXT-18-51655
Table 3. Summary of greenhouse gas emissions (GHG) for 2018 SOT feedstock supply to the IDL pathway.
Greenhouse Gas Emissions (kg CO2e/dry ton)
IDL
2018 SOTHarvest & Collection 0.000
Fieldside Preprocessing 24.876
Transportation from Fieldside 12.755
Preprocessing 25.920
Storage 0.858
Handling 1.969
Grand Total 66.393
2.1.1.3SensitivityAnalysisofCosts
Sensitivity analysis was performed to determine the impact that alternate values for key operational parameters would have on the delivered cost presented as the 2018 SOT Design. The feedstock utilized in the final design required only minimal processing in order to be suitable for use in conversion. This resulted in a set of relatively few model parameters that were considered to potentially have impact on the final delivered price. Model parameters were chosen that could be variable or could cause variability in the preprocessing operations and ultimately cost. The final set of sensitivity parameters consisted of the final ash content of the material, the throughput of the chipper at the roadside, the energy consumption of the chipper at the roadside, the dryer throughput at the biorefinery, and the energy consumption of the dryer at the biorefinery. Each of the equipment parameters were varied based on variation seen in the processes, based on literature, from the values that were used in the final model run (Cao et al., 2007; Spinelli et al., 2012; Thompson et al. 2013). The values used are presented in Table 4.
Table 4. Sensitivity parameters for the 2018 SOT feedstock supply to the IDL pathway.
Min Mean Max
Dryer Capacity 1.48 odt/hr 1.5 odt/hr 1.53 odt/hr
Dryer Energy 325.5 kWh/t 350 kWh/t 374.5 kWh/t
Chpper Capacity 76.37 odt/hr 79.80 odt/hr 83.00 odt/hr
Chipper Energy 13.2 kWh/t 18.5 kWh/t 26.5 kWh/t

14
Milestone Completion ReportINL/EXT-18-51655
Figure 2 presents the results of the sensitivity analysis. The delivered cost is most sensitive to chipper energy consumption, followed by the throughput of the chipper equipment. The impact of energy consumption on the chipper is because of the relative uncertainty that can be seen when processing material. The impact of throughput has to do with the distributing the cost of the piece of equipment over the amount of material that is processed. When the throughput is decreased the cost increases, while when throughput increases the cost decreases.
Figure 2. Tornado chart showing sensitivity of cost to operational parameters used to model the 2018SOT Case for IDL

15
Milestone Completion ReportINL/EXT-18-51655
2.1.2 2022 Projection for Feedstock Supply to IDL
2.1.2.1DescriptionofLogisticSystemDesigns
The logistics system for the 2022 Projection delivers only forest residue is the same that wasdescribed in the 2017 SOT report (Hartley et al. 2017) and is used in the 2018 SOT.
Grower Payment
Grower payment represents the stumpage price paid to the landowner to secure permission to harvest the material. The grower payment was calculated using the size class stumpage values reported in the 2016 Billion Ton Report (BT16; USDOE, 2016). BT16 provides values of $32.40/dry ton, $16.20/dry ton and $8.10/dry ton, for both planted and natural softwood stands, of size classes 1, 2 and 3, respectively, in the Southern Region. The calculation of forest residue grower payment utilizes the residue ratios from the USDA Forest Service Forest Inventory and Analysis Database (USDA Forest Service, 2017), to determine the proportion of the value of the whole tree stumpage that remains after the harvest as residue. Based on the assumed harvest region, the size class distribution of delivered material and residue ratio, the weighted average grower payment of Forest residue is $3.75/dry ton.
Fieldside Operations
2022 fieldside operations in this design are the same as those presented in the 2017 SOT for gasification (Hartley et al., 2017). As before, it is assumed that the forest residue is brought to the landing as part of the primary harvest operation and as such does not incur harvest or collection cost. Instead, the supply chain starts with size reduction of material that has been dried to 30% moisture content in the field. Size reduction is performed with a mobile chipper, and the operational characteristics of the equipment are based on descriptions resulting from the High Tonnage project completed by Auburn University (Sokhansanj et al. 2014). The chips are blown directly into a truck for transport, eliminating the need for additional loading equipment.
Biorefinery Operations
The forest residue chips are delivered to the refinery by truck, where they are offloaded using a truck tipper with a hopper. From the hopper the chips are conveyed to storage piles until they are dried using a rotary drier. After drying the chips to 10% moisture content, the chips are held in covered storage until feeding to the conversion process.
Processing Location Construction Cost
Construction and infrastructure costs were estimated as follows. Hu et al. (2017) utilized installation factors ranging from 1.43-1.7 to estimate the capital layout for construction and infrastructure for individual preprocessing equipment similar to the equipment in this design. For our calculations, we used the higher value of 1.7 for all preprocessing equipment to provide the more conservative estimate. Hence, the total capital layout for construction and infrastructure was estimated using an installation factor of 1.7 together with the installed capital cost of all preprocessing, handling and storage equipment; the estimate includes site preparation, construction, engineering and contingency (Hu et al. 2017). Land cost was calculated assuming

16
Milestone Completion ReportINL/EXT-18-51655
160 acres per depot at a cost of $500/acre, and was added to the capital cost to determine the loan amount. The total cost was amortized over 30 years, assuming a 20% down payment and an 8% interest rate, and divided by the number of delivered tons to give the per ton cost of depot construction and infrastructure, which totaled $2.73/dry ton.
2.1.2.2CostSummaryandEnergyUsage
Results of the analyses are summarized in Table 5, Figure 3 and Table 6 below. Table 5provides the detailed cost components for the 2017 and 2018 SOTs, as well as the projection for 2022, with a waterfall chart of the information presented in Figure 3. It can be noticed that the cost of the 2022 Projection increases over the 2017 and 2018 SOT’s. The reason for this is that the projected availability of logging residue is projected to decrease into the future. The decrease in material, necessitates a greater travel distance and a greater cost of transportation. Finally, Table 6 presents the greenhouse gas emissions (GHG) for the 2017 and 2018 SOTs and the projected 2022 case.
Table 5. Summary of modeled cost estimates for the woody feedstock supply systems providing feedstocks to IDL for the 2017 SOT, 2018 SOT and 2022 Projection.
Cost Summary ($/Dry Ton) (2016$)
IDL
2017
IDL
2018 SOT
IDL
2022 ProjectionGrower Payment $3.75 $3.75 $3.75
Harvest & Collection $0.00 $0.00 $0.00
Fieldside Preprocessing $11.08 $11.08 $11.08
Transportation $16.97 $20.22 $20.22
Preprocessing $19.38 $19.38 $19.38
Storage $0.67 $0.67 $0.67
Handling $2.70 $2.70 $2.70
Preprocessing Construction $2.73 $2.73 $2.73
Quality Dockage $3.22 $3.22 $3.22
Grand Total $60.50 $63.76 $63.76

17
Milestone Completion ReportINL/EXT-18-51655
Figure 3. Waterfall chart of delivered chipped logging residue to the IDL process in years 2017, 2018 and projected for 2022
Table 6. Summary of Greenhouse gas emissions for the woody feedstock supply systems for IDL for the 2017 SOT, 2018 SOT and 2022 Projection.
Greenhouse Gas Emissions (kg CO2e/dry ton)
IDL
2017 SOT
IDL
2018 SOT
IDL
2022 ProjectionHarvest & Collection 0.000 0.000 0.000
Fieldside Preprocessing 24.876 24.876 24.876
Transportation 12.755 12.755 15.875
Preprocessing 25.920 25.920 25.920
Storage 0.858 0.858 0.858
Handling 1.969 1.969 1.969
Grand Total 66.393 66.393 69.513

18
Milestone Completion ReportINL/EXT-18-51655
2.1.2.3SensitivityAnalysisofCosts
Sensitivity analysis was performed to determine the impact that alternate values for key operational parameters would have on the delivered cost presented as the 2022 Projection. The feedstock utilized in the final design required only minimal processing in order to be suitable for use in conversion. This resulted in a set of relatively few model parameters that were considered to potentially have impact on the final delivered price. Model parameters were chosen that could be variable or could cause variability in the preprocessing operations and ultimately cost. The final set of sensitivity parameters consisted of the final ash content of the material, the throughput of the chipper at the roadside, the energy consumption of the chipper at the roadside, the dryer throughput at the biorefinery, and the energy consumption of the dryer at the biorefinery. Each of the equipment parameters were varied based on variation seen in the processes, based on literature, from the values that were used in the final model run (Cao et al., 2007; Spinelli et al., 2012; Thompson et al. 2013). The values used are presented in Table 7.
Table 7. Sensitivity parameters for the 2022 Projection feedstock supply to the IDL pathway.
Min Mean Max
Dryer Capacity 1.48 odt/hr 1.5 odt/hr 1.53 odt/hr
Dryer Energy 325.5 kWh/t 350 kWh/t 374.5 kWh/t
Chpper Capacity 76.37 odt/hr 79.80 odt/hr 83.00 odt/hr
Chipper Energy 13.2 kWh/t 18.5 kWh/t 26.5 kWh/t
Figure 4 presents the results of the sensitivity analysis. The delivered cost is most sensitive to chipper energy consumption, followed by the throughput of the chipper equipment. The impact of energy consumption on the chipper is because of the relative uncertainty that can be seen
Figure 4. Tornado chart showing sensitivity of cost to operational parameters used to model the 2022 Projection for IDL.

19
Milestone Completion ReportINL/EXT-18-51655
when processing material. The impact of throughput has to do with the distributing the cost of the piece of equipment over the amount of material that is processed. When the throughput is decreased the cost increases, while when throughput increases the cost decreases.

20
Milestone Completion ReportINL/EXT-18-51655
2.2 Feedstock Supply Systems for Catalytic Fast Pyrolysis (CFP)
The 2018 and 2022 CFP conversion pathway assumes annual nth plant delivery of 725,000 dry tons of woody feedstock, with total ash ≤ 0.9 wt%, moisture content ≤ 10% (wet basis), and particle size of ¼“-minus (Table 8). The CFP pathway has a delivered feedstock cost target of $70.31/dry ton (2016$) in 2022, including dockage.
Table 8. Delivered feedstock composition assumptions for CFP.
Component Composition (dry wt. %)Carbon 50.94
Hydrogen 6.04
Nitrogen 0.17
Sulfur 0.03
Oxygen 41.90
Ash 0.90 to 1.0
Heating Value (Btu/lb) 8,601 HHV
7,996 LHV
Moisture (Bulk Wt. %) 10.0
Particle Size (inches) 0.08
2.2.1 2018 SOT for Feedstock Supply to CFP
2.2.1.1DescriptionofLogisticSystemDesigns
The logistics system for the 2018 SOT for feedstocks for Catalytic Fast Pyrolysis delivers 725,000 dry tons of clean pine, using similar systems as had been previously described in the SOT’s from 2013 to 2017 (Cafferty, 2013, Hartley and Cafferty, 2014, Hartley et al., 2015, Hartley et al., 2016 and Hartley et al., 2017). The system harvests plantation grown pine and forest thinning material using a mechanized harvest system. Logs are sent to the processing facility where they are size reduced and densified before feeding into the conversion process.
Grower Payment
Grower payment represents the stumpage price paid to the landowner to secure permission to harvest the material. The grower payment was calculated using the size class stumpage values reported in the 2016 Billion Ton Report (BT16; USDOE, 2016). BT16 provides values of $32/dry ton, $16/dry ton and $8/dry ton, for both planted and natural softwood stands, of size classes 1, 2 and 3, respectively in the Southern Region. Based on the assumed harvest region, the

21
Milestone Completion ReportINL/EXT-18-51655
size class distribution of delivered material was 83% from size class 3 and 17% from size class 2; the resulting weighted average grower payment for clean pine is then calculated as $9.48/dry ton.
Fieldside Operations
Fieldside operations in this design are similar to those described in the clean pine/pyrolysis section of the 2017 Woody Feedstock SOT report (Hartley et al., 2017). Felling is completed using a feller-buncher, and skidding with a grapple skidder. Operational characteristics of both pieces of equipment are based on descriptions resulting from the High Tonnage project completed by Auburn University (Sokhansanj et al., 2014). As for the Blend/Pyrolysis analysis, the primary departure from the harvest and collection system presented in the prior SOTs is that the fieldside preprocessing operations have been moved to the depots to take advantage of the high density of logs during initial transportation. In previous SOTs, clean pine comprised only a small proportion of the blend, and so in order to reduce capital cost at the single co-located depot, the logs were previously chipped at the landing and transported to the depot. This allowedcost savings by aligning with the chip format of the other blendstocks (chipped forest residues and harvested short rotation hybrid poplar). For the new 100% clean pine case, however, there is no longer a need to align with the chip format, and it becomes more efficient to process the material at the depots. Because of this change it is no longer necessary to delimb and debark at fieldside. Delimbing is accomplished just prior to stacking for storage using a lower cost delimbing gate. Debarking is accomplished using a rotary head debarker at the depot, allowing removal of the costly and energy inefficient chain flail at the fieldside landing. It is worth noting that use of the delimbing gate resulted in reduced productivity of the grapple skidder, since the stems are manually forced through a metal grid by the skidder to remove the branches.
Preprocessing Operations
The logs are unloaded from the trucks using a high-lift loader, and placed into storage piles. To initiate preprocessing, logs are delivered by loader to a rotary head debarker, and the debarked logs are conveyed to a 25 ton/hr disk chipper to produce an approximate 1-in nominal chip. The chips are conveyed to a rotary shear for the final size reduction, which provides better control of particle size distribution, and is impacted little by the moisture content of the biomass. The material exiting the rotary shear is conveyed to a surge bin, which feeds the pellet mill. The pellets are then conveyed to a cross flow grain dryer and dried to 10% moisture (wet basis). The dried pellets are stored in a covered metal bin. The pellets are conveyed to a crumbler for feeding to the conversion process.
Processing Location Construction Cost
Preprocessing construction and infrastructure costs were estimated using the same method as in the 2017 SOT (Hartley et al, 2017). Hu et al. (2017) utilized construction and installation factors ranging from 1.43-1.7 to estimate the capital layout for construction and infrastructure for individual preprocessing equipment similar to the equipment in this design. For our calculations, we used the higher value of 1.7 for all preprocessing equipment to provide the more conservative estimate. Hence, the total capital layout for construction and infrastructure was estimated using

22
Milestone Completion ReportINL/EXT-18-51655
an installation factor of 1.7 together with the installed capital cost of all preprocessing, handling and storage equipment; the estimate includes site preparation, construction, engineering and contingency (Hu et al. 2017). Land cost was calculated assuming 160 acres per depot at a cost of $500/acre, and was added to the capital cost to determine the loan amount. The total cost was amortized over 30 years, assuming a 20% down payment and an 8% interest rate, and divided by the number of delivered tons to give the per ton cost of depot construction and infrastructure, which totaled $3.43/dry ton.
2.2.1.2CostSummaryandEnergyUsage
Results of the supply chain analysis are summarized in Table 9, which provides the detailed cost components of the clean pine feedstock supply system for CFP. In our analysis, the clean pine was unable to meet the cost target of $85.51by $2.31/dry ton. While it was unable to meet the cost target in our analysis, there could be some niche locations where it would be possible to deliver clean pine material the throat of the reactor for a cost of $85.51/dry ton or less, but the number of these areas would be limited and not represent significant opportunity for industrygrowth.
Table 9. Summary of modeled cost estimates of the 2018 SOT woody feedstock supply system for clean pine supplied to CFP.
Cost Summary ($/Dry Ton) (2016$)
2018 SOTGrower Payment $9.48 Harvest & Collection $9.87 Fieldside Preprocessing $2.82 Transportation $31.56 Preprocessing $27.14 Storage $0.86 Handling $2.62 Preprocessing Construction $3.47 Quality Dockage $0.00 Grand Total $87.82
Table 10 presents the greenhouse gas emissions (GHG) for the clean pine for catalytic fastfeedstock pathway. The greenhouse gas emissions analysis was completed by ANL, using energy consumption and transportation distance data from the BLM. ANL employed the Greenhouse Gases, Regulated Emissions, and Energy use in Transportation model (GREET®) (Argonne National Laboratory, 2017) to conduct detailed life-cycle analysis of farm gate-to-biorefinery gate GHG emissions of the woody biomass scenarios presented in this report. GHG emissions remained constant from the 2017 SOT.

23
Milestone Completion ReportINL/EXT-18-51655
Table 10. Summary of Greenhouse gas emissions for the 2018 SOT CFP woody feedstock supply system.
Greenhouse Gas Emissions (kg CO2e/dry ton)
2018 SOTHarvest & Collection 13.764Fieldside Preprocessing 2.345Transportation 41.724Preprocessing 91.477Storage 0.98Handling 2.286Grand Total 152.576
2.2.1.3SensitivityAnalysisofCosts
Sensitivity analysis was performed to determine the impact that alternate values for key operational parameters would have on the delivered cost presented as the 2018 SOT for clean pine delivered in to a catalytic fast pyrolysis. Energy consumption and throughput of the key preprocessing equipment were varied to explore the impact on total delivered cost per ton. The final set of sensitivity parameters consisted of the throughput of the chipper, densifier, rotary shear and pellet drier; the energy consumption of the chipper, densifier, rotary shear and pellet drier and the dry matter loss for the chipper and rotary shear. Each of the equipment parameters were varied based on variation seen in the processes, based on literature, from the values that were used in the final model run. The values ranges used for the sensitivity analysis are presented in Table 11, and the results are shown in Figure 5.
The cost of clean pine is most sensitive to the chipper capacity with a range in cost of $1.70 from the high and low. A close second is densifier energy, which had a range of cost difference of $1.69. The chipper and densifier account for the top four sensitivity factors. The cost of clean pine is least sensitive to dryer capacity, which had the smallest range of variation.

24
Milestone Completion ReportINL/EXT-18-51655
Table 11. Sensitivity parameters for the 2018 SOT feedstock supply to the CFP pathway.
Min Mean Max
Dryer Capacity 4.74 odt/hr 4.80 odt/hr 4.89 odt/hr
Dryer Energy 46.5 kWh/t 50.0 kWh/t 53.5 kWh/t
Chipper Capacity 16.25 odt/hr 25.00 odt/hr 33.75 odt/hr
Chipper Energy 16.02 kWh/t 19.30 kWh/t 22.58 kWh/t
Chipper DML 4.5% 5.0% 4.5%
Rotary Shear Capacity 7.05 otd/hr 7.50 odt/hr 7.95 odt/hr
Rotary Shear Energy 31.85 kWh/t 33.85 kWh/t 35.97 kWh/t
Rotary Shear DML 4.5% 5.0% 5.5%
Densifier Capacity 4.5 odt/hr 5.0 odt/hr 5.5 odt/hr
Densifier Energy 92.70 kWh/t 103.0 kWh/t 113.3 kWh/t
Figure 5.Sensitivity analysis of the delivered cost of the 2018 SOT feedstock for CFP.

25
Milestone Completion ReportINL/EXT-18-51655
2.2.2 2022 Projection for Feedstock Supply to CFP
2.2.2.1DescriptionofLogisticsSystemDesigns
The logistics system for 2022 delivers 725,000 dry tons of woody material made up of a blend of 25% clean pine and 75% logging residue that has been sequentially air classified to remove soil ash and the lights fraction leached to remove alkali and alkaline earth metals. The clean pine supply system is the same as that has been presented in the 2018 SOT for feedstock supply to CFP. The system harvests the log fractions of plantation grown pine and forest thinning material using a mechanized harvest system. The logs are sent to the processing facility where they are size reduced and densified before feeding into the conversion process. The logging residue system is similar to the system that has been presented for 2018 SOT for feedstock supply to IDL, with the addition of an air-classification and leaching system, drying and grinding to the smaller particle size specification.
Grower Payment
Grower payment represents the stumpage price paid to the landowner to secure permission to harvest the material. The grower payment was calculated using the size class stumpage values reported in the 2016 Billion Ton Report (BT16; USDOE, 2016) and. BT16 provides values of $32/dry ton, $16/dry ton and $8/dry ton, for both planted and natural softwood stands, of size classes 1, 2 and 3, respectively in the Southern Region. Based on the assumed harvest region, the size class distribution of delivered material was 83% from size class 3 and 17% from size class 2; the resulting weighted average grower payment for clean pine is then calculated as $9.48/dry ton. The calculation of forest residue grower payment utilizes the residue ratios from the USDA Forest Service Forest Inventory and Analysis Database (USDA Forest Service, 2017), to determine the proportion of the value of the whole tree stumpage that remains after the harvest as residue. Based on the assumed harvest region, the size class distribution of delivered material and residue ratio, the weighted average grower payment of Forest residue is $3.70/dry ton.
Fieldside Operations
Fieldside operations in this design are similar to those described previously in the clean pine section of this document. Felling is completed using a feller-buncher, and skidding with a grapple skidder. Operational characteristics of both pieces of equipment are based on descriptions resulting from the High Tonnage project completed by Auburn University (Sokhansanj et al., 2014). Delimbing is accomplished just prior to stacking for storage using a lower cost delimbing gate. Debarking is accomplished using a rotary head debarker at the depot, allowing removal of the costly and energy inefficient chain flail at the fieldside landing. It is worth noting that use of the delimbing gate resulted in reduced productivity of the grapple skidder, since the stems are manually forced through a metal grid by the skidder to remove the branches.
The forest residue is brought to the landing as part of the primary harvest operation and as such does not incur harvest or collection cost. Instead, the supply chain starts with size reduction

26
Milestone Completion ReportINL/EXT-18-51655
of material that has been allowed to dry down to 30% moisture content in the field. Size reduction is performed with a mobile chipper, and the operational characteristics of the equipment are based on descriptions resulting from the High Tonnage project completed by Auburn University (Sokhansanj et al., 2014). The chips are blown directly into a truck for transport, eliminating the need for additional loading equipment.
Preprocessing Operations
The clean pine logs are unloaded from the trucks using a high-lift loader, and placed into storage piles. To initiate preprocessing, logs are delivered by loader to a rotary head debarker, and the debarked logs are conveyed to a 25 ton/hr disk chipper to produce an approximate 1-in nominal chip. The chips are conveyed to a rotary shear for the final size reduction, which provides better control of particle size distribution, and is impacted little by the moisture content of the biomass. The material exiting the rotary shear is conveyed to a surge bin, which feeds the pellet mill. The pellets are then conveyed to a cross flow grain dryer and dried to 10% moisture (wet basis).
The forest residue chips are delivered to the biorefinery by truck, where they are offloaded using a truck tipper with a hopper. From the hopper the chips are conveyed to storage piles. After leaving storage, the chips are passed through two stages of air classification. The first stage of air classification occurs at a fan speed of 10 Hz and is used to remove the majority of soil ash in the lights fraction and the fraction collected below the screen (i.e., sand and rocks too heavy to be fluidized in the airstream). The heavies fraction collected from the airstream is then air classified at a fan speed of 28 Hz. The lights fraction from the second stage of air classification is then sent to dilute acid fill and drain leaching at ambient temperature and pressure to remove the majority of the alkali and alkaline earth metals in that fraction (alkali and alkaline earth metals reduce the yield of pyrolysis oil and poison the downstream upgrading catalyst in pyrolysis/upgrading processes). The leached lights fraction is dried to 10% moisture content using a rotary drier. The heavy fraction from the air classifier is dried to 10% moisture content using a rotary drier, and the dried leached lights and heavies are mixed back together, ground to the particle size specification by rotary shear and held in covered storage until feeding to the conversion process.
Processing Location Construction Cost
Preprocessing construction and infrastructure costs were estimated using the same method as in the 2017 SOT (Hartley et al. 2017). Hu et al. (2017) utilized construction and installation factors ranging from 1.43-1.7 to estimate the capital layout for construction and infrastructure for individual preprocessing equipment similar to the equipment in this design. For our calculations, we used the higher value of 1.7 for all preprocessing equipment to provide the more conservative estimate. Hence, the total capital layout for construction and infrastructure was estimated using an installation factor of 1.7 together with the installed capital cost of all preprocessing, handling and storage equipment; the estimate includes site preparation, construction, engineering and contingency (Hu et al. 2017). Land cost was calculated assuming 160 acres per depot at a cost of $500/acre, and was added to the capital cost to determine the loan amount. The total cost was amortized over 30 years, assuming a 20% down payment and an 8% interest rate, and divided by

27
Milestone Completion ReportINL/EXT-18-51655
the number of delivered tons to give the per ton cost of depot construction and infrastructure, which totaled $3.43/dry ton.
2.2.2.2CostSummaryandEnergyUsage
Results of the analyses are summarized in Table 12, which provides the detailed cost components of the clean pine feedstock supply system for catalytic fast pyrolysis.
Table 12. Summary of modeled cost estimates of the woody feedstock supply system for clean pine supplied to catalytic fast pyrolysis.
Cost Summary ($/Dry Ton) (2016$)
2013 SOT 2017 SOT 2018 SOT2022
Projection
Grower Payment $26.71 $9.48 $9.48 $7.64
Harvest & Collection $23.77 $9.87 $9.87 $2.47
Fieldside Preprocessing $13.01 $2.82 $2.82 $9.81
Transportation $14.50 $31.56 $31.56 $13.32
Preprocessing $29.76 $27.14 $27.14 $31.12
Storage $0 $0.86 $0.86 $0.58
Handling $1.38 $2.62 $2.62 $2.09
Preprocessing Construction - $3.47 $3.47 $3.28
Quality Dockage - $0.00 $0.00 $0.00
Grand Total $109.13 $87.82 $87.82 $70.31
Delivered feedstock costs for the 2013 SOT, 2017 SOT, 2018 SOT and 2022 Projection for CFP are shown in Figure 6.
Table 13 presents the greenhouse gas emissions (GHG) for the clean pine for catalytic fast feedstock pathway. The greenhouse gas emissions analysis was completed by ANL, using energy consumption and transportation distance data from the BLM. ANL employed the Greenhouse Gases, Regulated Emissions, and Energy use in Transportation model (GREET®) (Argonne National Laboratory, 2017) to conduct detailed life-cycle analysis of farm gate-to-biorefinery gate GHG emissions of the woody biomass scenarios presented in this report. GHG emissions remained constant from the 2017 SOT.

28
Milestone Completion ReportINL/EXT-18-51655
Figure 6. Waterfall chart for feedstock prices for catalytic fast pyrolysis.
Table 13. Summary of Greenhouse gas emissions for the 2022 Projection for CFP woody feedstock supply.
Greenhouse Gas Emissions (kg
Clean Pine
2013 SOT
Clean Pine
2017 SOT
Clean Pine
2018 SOT
Clean Pine
2022
Harvest & Collection - 13.764 13.764 14.295
Fieldside Preprocessing - 2.345 2.345 14.001
Transportation - 41.724 41.724 9.262
Preprocessing - 91.477 91.477 227.0254
Storage - 0.98 0.98 0.951
Handling - 2.286 2.286 1.248
Grand Total - 152.576 152.576 266.791
2.2.2.3SensitivityAnalysisofCosts
Sensitivity analysis was performed to determine the impact that alternate values for key operational parameters would have on the delivered cost presented as the 2022 Projection for CFP delivered in to a catalytic fast pyrolysis. Energy consumption and throughput of the key preprocessing equipment were varied to explore the impact on total delivered cost per ton. The

29
Milestone Completion ReportINL/EXT-18-51655
final set of sensitivity parameters consisted of the throughput of the chipper, densifier, rotary shear and pellet drier; the energy consumption of the chipper, densifier, rotary shear and pellet drier and the dry matter loss for the chipper and rotary shear. Each of the equipment parameters were varied based on variation seen in the processes, based on literature, from the values that were used in the final model run. The values ranges used for the sensitivity analysis are presented in Table 14; the results are shown in Figure 7.
Table 14. Sensitivity parameters for the 2022 Projection feedstock supply to the CFP pathway.
Min Mean Max
Fieldside Chipping Capacity 76.37 odt/hr 79.80 odt/hr 83.00 odt/hr
Fieldside Chipping Energy 13.20 kWh/t 18.50 kWh/t 26.50 kWh/t
Dryer Capacity 1.48 odt/hr 1.5 odt/hr 1.53 odt/hr
Dryer Energy 325.50 kWh/t 350.00 kWh/t 374.50 kWh/t
Central Chipper Capacity 16.25 odt/hr 25.00 odt/hr 33.75 odt/hr
Central Chipper Energy 46.50 kWh/t 50.00 kWh/t 53.50 kWh/t
Central Chipper DML 4.50% 5.00% 4.50%
Rotary Shear Capacity 7.050 otd/hr 7.50 odt/hr 7.95 odt/hr
Rotary Shear Energy 31.85 kWh/t 33.85 kWh/t 35.97 kWh/t
Rotary Shear DML 4.50% 5.00% 5.50%
Air Classifier DMT 6.00 % 6.50 % 7.50 %
The cost of blended material for the 2022 Projection is most sensitive to the energy consumption of the fieldside chipper with an effect on costs ranging from a reduction of $1.16 to an increase of $0.89 per dry ton. The energy consumption has an impact of the next most impactful parameter the drier energy, which had an average impact of +/- $0.42/dry ton. Ultimately, the loss of material in the air classification and size reduction steps had relatively small impact, with rotary shear having the largest impact of -$0.17/dry ton and +$0.21/dry ton. The higher impact of the losses of the rotary shear are due to the accumulated cost that have occurred prior to arriving at the rotary shear.

30
Milestone Completion ReportINL/EXT-18-51655
Figure 7. Sensitivity analysis of the delivered cost of the 2022 Projection feedstock blend for CFP.

31
Milestone Completion ReportINL/EXT-18-51655
2.3 Feedstock Supply Systems for Algal-blend Hydrothermal Liquefaction (AHTL)
The 2018 and 2022 AHTL conversion pathway assumes 1nnual nth plant delivery of 35,752 dry tons of woody feedstock for inclusion in a 90% algae-10% woody feedstock blend, with total ash ≤ 3 wt%, moisture content ≤ 10% (wet basis), and particle size of less than ¼“-minus (Table 15). The AHTL pathway has a delivered feedstock cost target of $70.35/dry ton (2016$) in 2022, including dockage.
Table 15. Delivered feedstock composition assumptions for AHTL.
Component Composition (dry wt. %)Carbon 49.81
Hydrogen 5.91
Nitrogen 0.17
Sulfur 0.09
Oxygen 41.02
Ash 3.00
Heating Value (Btu/lb) 8,449 HHV
7,856 LHV
Moisture (Bulk Wt. %) 10.0
Particle Size (inches) > 0.08
2.3.1 2018 SOT for Logging Residue Supply to AHTL
2.3.1.1DescriptionofLogisticSystemDesigns
The 2018 woody SOT is reported in 2016 dollars (2016$) and includes both growerpayment and logistics costs to reflect a total delivered feedstock supply cost. This reportoutlines the 2018 woody SOT design that was capable of achieving a modeled delivered feedstock cost of $70.35/dry ton. Logistics costs include harvest, collection, storage, transportation, and preprocessing costs from the point of harvest to the conversion reactorthroat in-feed. Grower payment represents the stumpage payment and includes the cost ofproduction, compensation for soil nutrient removal, and grower profit. The IDL process hasless stringent quality and particle size requirements than that of pyrolysis, resulting in asimple preprocessing design along with the utilization of considerably cheaper forest residues.

32
Milestone Completion ReportINL/EXT-18-51655
The logistics system for the 2018 SOT, delivering 35,752 dry tons of forest residue, is the same that was described in the 2017 SOT report (Hartley et al., 2017). The AHTL system places fewer restrictions on the feedstock specifications, in terms of particle size and ash content; which removed the necessity of much of the preprocessing required in the previous analyses.
Grower Payment
Grower payment represents the stumpage price paid to the landowner to secure permission to harvest the material. The grower payment was calculated using the size class stumpage values reported in the 2016 Billion Ton Report (BT16; USDOE, 2016). BT16 provides values of $32.40/dry ton, $16.20/dry ton and $8.10/dry ton, for both planted and natural softwood stands, of size classes 1, 2 and 3, respectively, in the Southern Region. The calculation of forest residue grower payment utilizes the residue ratios from the USDA Forest Service Forest Inventory and Analysis Database (USDA Forest Service, 2017), to determine the proportion of the value of the whole tree stumpage that remains after the harvest as residue. Based on the assumed harvest region, the size class distribution of delivered material and residue ratio, the weighted average grower payment of Forest residue is $3.75/dry ton.
Fieldside Operations
2018 fieldside operations in this design are the same as those presented in the 2017 SOT for gasification (Hartley et al., 2017). As before, it is assumed that the forest residue is brought to the landing as part of the primary harvest operation and as such does not incur harvest or collection cost. Instead, the supply chain starts with size reduction of material that has been dried to 30% moisture content in the field. Size reduction is performed with a mobile chipper, and the operational characteristics of the equipment are based on descriptions resulting from the High Tonnage project completed by Auburn University (Sokhansanj et al., 2014). The chips are blown directly into a truck for transport, eliminating the need for additional loading equipment.
Biorefinery Operations
The forest residue chips are delivered to the refinery by truck, where they are offloaded using a truck tipper with a hopper. From the hopper the chips are conveyed to storage piles until they are dried using a rotary drier. After drying the chips to 10% moisture content, the chips are held in covered storage until feeding to the conversion process.
Processing Location Construction Cost
Construction and infrastructure costs were estimated as follows. Hu et al. (2017) utilized installation factors ranging from 1.43-1.7 to estimate the capital layout for construction and infrastructure for individual preprocessing equipment similar to the equipment in this design. For our calculations, we used the higher value of 1.7 for all preprocessing equipment to provide the more conservative estimate. Hence, the total capital layout for construction and infrastructure was estimated using an installation factor of 1.7 together with the installed capital cost of all preprocessing, handling and storage equipment; the estimate includes site preparation, construction, engineering and contingency (Hu et al. 2017). Land cost was calculated assuming 160 acres per depot at a cost of $500/acre, and was added to the capital cost to determine the loan amount. The total cost was amortized over 30 years, assuming a 20% down payment and an

33
Milestone Completion ReportINL/EXT-18-51655
8% interest rate, and divided by the number of delivered tons to give the per ton cost of depot construction and infrastructure, which totaled $2.73/dry ton.
2.3.1.2CostSummaryandEnergyUsage
Results of the supply chain analysis are summarized in Table 16, which provides the detailed cost components.
Table 16. Summary of modeled cost estimates of the 2018 SOT woody feedstock supply system for logging residues supplied to AHTL.
Cost Summary ($/Dry Ton) (2016$)
AHTL
2018 SOTGrower Payment $3.75
Harvest & Collection $0.00
Fieldside Preprocessing $11.53
Transportation $5.89
Preprocessing $39.82
Storage $0.67
Handling $3.70
Preprocessing Construction $4.95
Quality Dockage $0.00
Grand Total $70.31
Table 17 presents the greenhouse gas emissions (GHG) for each feedstock pathway. The greenhouse gas emissions analysis was completed by ANL, using energy consumption and transportation distance data from the BLM. ANL employed the Greenhouse Gases, Regulated Emissions, and Energy use in Transportation model (GREET®) (Argonne National Laboratory, 2017) to conduct detailed life-cycle analysis of farm gate-to-biorefinery gate GHG emissions of the woody biomass scenarios presented in this report.
2.3.1.3SensitivityAnalysisofCosts
Sensitivity analysis was performed to determine the impact that alternate values for key operational parameters would have on the delivered cost presented as the 2018 SOT Design for supply of logging residues to AHTL. The feedstock utilized in the final design required only minimal processing in order to be suitable for use in conversion. This resulted in a set of

34
Milestone Completion ReportINL/EXT-18-51655
Table 17. Summary of Greenhouse gas emissions for the 2018 SOT AHTL woody feedstock supply.
Greenhouse Gas Emissions (kg CO2e/dry ton)
AHTL
2018 SOTHarvest & Collection 0.000
Fieldside Preprocessing 24.876
Transportation from Fieldside 2.360
Preprocessing 53.200
Storage 0.858
Handling 1.969
Grand Total 83.263
relatively few model parameters that were considered to potentially have impact on the final delivered price. Model parameters were chosen that could be variable or could cause variability in the preprocessing operations and ultimately cost. The final set of sensitivity parametersconsisted of the final ash content of the material, the throughput of the chipper at the roadside, the energy consumption of the chipper at the roadside, the dryer throughput at the biorefinery, and the energy consumption of the dryer at the biorefinery. Each of the equipment parameters were varied based on variation seen in the processes, based on literature, from the values that were used in the final model run (Cao et al., 2007; Spinelli et al., 2012; Thompson et al. 2013). The values used are presented in Table 18.
Table 18. Sensitivity parameters for the 2018 SOT for feedstock supply to AHTL.
Min Mean Max
Dryer Capacity 1.48 odt/hr 1.5 odt/hr 1.53 odt/hr
Dryer Energy 325.5 kWh/t 350 kWh/t 374.5 kWh/t
Chpper Capacity 76.37 odt/hr 79.80 odt/hr 83.00 odt/hr
Chipper Energy 13.2 kWh/t 18.5 kWh/t 26.5 kWh/t
Figure 8 presents the results of the sensitivity analysis. The delivered cost is most sensitive to chipper energy consumption, followed by the throughput of the chipper equipment. The impact of energy consumption on the chipper is because of the relative uncertainty that can be seen when processing material. The impact of throughput has to do with the distributing the cost of the piece of equipment over the amount of material that is processed. When the throughput is decreased the cost increases, while when throughput increases the cost decreases.

35
Milestone Completion ReportINL/EXT-18-51655
Figure 8. Tornado chart showing sensitivity of cost to operational parameters used to model the 2018SOT Case for AHTL.

36
Milestone Completion ReportINL/EXT-18-51655
2.3.2 2022 Projection for Logging Residue Supply to AHTL
2.3.2.1DescriptionofLogisticSystemDesigns
The logistics system for the 2022 Projection delivers only forest residue is the same that wasdescribed in the 2017 SOT report (Hartley et al., 2017) and is used in the 2018 SOT.
Grower Payment
Grower payment represents the stumpage price paid to the landowner to secure permission to harvest the material. The grower payment was calculated using the size class stumpage values reported in the 2016 Billion Ton Report (BT16; USDOE, 2016). BT16 provides values of $32.40/dry ton, $16.20/dry ton and $8.10/dry ton, for both planted and natural softwood stands, of size classes 1, 2 and 3, respectively, in the Southern Region. The calculation of forest residue grower payment utilizes the residue ratios from the USDA Forest Service Forest Inventory and Analysis Database (USDA Forest Service, 2017), to determine the proportion of the value of the whole tree stumpage that remains after the harvest as residue. Based on the assumed harvest region, the size class distribution of delivered material and residue ratio, the weighted average grower payment of Forest residue is $3.75/dry ton.
Fieldside Operations
2022 fieldside operations in this design are the same as those presented in the 2018 SOT for AHTL. As before, it is assumed that the forest residue is brought to the landing as part of the primary harvest operation and as such does not incur harvest or collection cost. Instead, the supply chain starts with size reduction of material that has been dried to 30% moisture content in the field. Size reduction is performed with a mobile chipper, and the operational characteristics of the equipment are based on descriptions resulting from the High Tonnage project completed by Auburn University (Sokhansanj et al., 2014). The chips are blown directly into a truck for transport, eliminating the need for additional loading equipment.
Biorefinery Operations
The forest residue chips are delivered to the refinery by truck, where they are offloaded using a truck tipper with a hopper. From the hopper the chips are conveyed to storage piles until they are dried using a rotary drier. After drying the chips to 10% moisture content, the chips are held in covered storage until feeding to the conversion process.
Processing Location Construction Cost
Construction and infrastructure costs were estimated as follows. Hu et al. (2017) utilized installation factors ranging from 1.43-1.7 to estimate the capital layout for construction and infrastructure for individual preprocessing equipment similar to the equipment in this design. For our calculations, we used the higher value of 1.7 for all preprocessing equipment to provide the more conservative estimate. Hence, the total capital layout for construction and infrastructure was estimated using an installation factor of 1.7 together with the installed capital cost of all preprocessing, handling and storage equipment; the estimate includes site preparation, construction, engineering and contingency (Hu et al. 2017). Land cost was calculated assuming

37
Milestone Completion ReportINL/EXT-18-51655
160 acres per depot at a cost of $500/acre, and was added to the capital cost to determine the loan amount. The total cost was amortized over 30 years, assuming a 20% down payment and an 8% interest rate, and divided by the number of delivered tons to give the per ton cost of depot construction and infrastructure, which totaled $2.73/dry ton.
2.3.2.2CostSummaryandEnergyUsage
Results of the analyses are summarized in Table 19, Figure 9 and Table 20 below. Table 19provides the detailed cost components for the 2018 SOT and the projection for 2022, with a waterfall chart of the information presented in Figure 9. It can be noticed that the cost of the 2022 Projection increases over the 2017 and 2018 SOTs. The reason for this is that the projected availability of logging residue is projected to decrease into the future. The decrease in material, necessitates a greater travel distance and a greater cost of transportation.
Table 19. Summary of modeled cost estimates for the woody feedstock supply systems providing feedstocks to AHTL for the 2018 SOT and 2022 Projection.
Cost Summary ($/Dry Ton) (2016$)
AHTL
2018 SOT
AHTL
2022 Projection
Grower Payment $3.75 $3.75
Harvest & Collection $0.00 $0.00
Fieldside Preprocessing $11.53 $11.53
Transportation $5.89 $5.89
Preprocessing $39.82 $39.82
Storage $0.67 $0.67
Handling $3.70 $3.70
Preprocessing Construction $4.95 $4.95
Quality Dockage $0.00 $0.00
Grand Total $70.31 $70.31
Table 20 presents the greenhouse gas emissions (GHG) for the 2018 SOT and the projected 2022 case.

38
Milestone Completion ReportINL/EXT-18-51655
Figure 9. Water fall chart of delivered chipped logging residue costs to the AHTL process in 2018 and projected for 2022.
Table 20. Summary of Greenhouse gas emissions for woody feedstock supply to AHTL for the 2018 SOT and 2022 Projection.
Greenhouse Gas Emissions (kg CO2e/dry ton)
AHTL
2018 SOT
AHTL
2022 ProjectionHarvest & Collection 0.000 0.000
Fieldside Preprocessing 24.876 24.876
Transportation 12.755 15.875
Preprocessing 25.920 25.920
Storage 0.858 0.858
Handling 1.969 1.969
Grand Total 66.393 69.513

39
Milestone Completion ReportINL/EXT-18-51655
2.3.2.3SensitivityAnalysisofCosts
Sensitivity analysis was performed to determine the impact that alternate values for key operational parameters would have on the delivered cost presented as the 2022 Projection for logging residue supply to AHTL. The feedstock utilized in the final design required only minimal processing in order to be suitable for use in AHTL. This resulted in a set of relatively few model parameters that were considered to potentially have impact on the final delivered price. Model parameters were chosen that could be variable or could cause variability in the preprocessing operations and ultimately cost. The final set of sensitivity parameters consisted of the final ash content of the material, the throughput of the chipper at the roadside, the energy consumption of the chipper at the roadside, the dryer throughput at the biorefinery, and the energy consumption of the dryer at the biorefinery. Each of the equipment parameters were varied based on variation seen in the processes, based on literature, from the values that were used in the final model run (Cao et al., 2007; Spinelli et al., 2012; Thompson et al. 2013). Thevalues used are presented in Table 21.
Table 21. Sensitivity parameters for the 2022 Projection feedstock supply to the AHTL pathway.
Min Mean Max
Dryer Capacity 1.48 odt/hr 1.5 odt/hr 1.53 odt/hr
Dryer Energy 325.5 kWh/t 350 kWh/t 374.5 kWh/t
Chpper Capacity 76.37 odt/hr 79.80 odt/hr 83.00 odt/hr
Chipper Energy 13.2 kWh/t 18.5 kWh/t 26.5 kWh/t
Figure 10 presents the results of the sensitivity analysis. The delivered cost is most sensitive to chipper energy consumption, followed by the throughput of the chipper equipment. The impact of energy consumption on the chipper is because of the relative uncertainty that can be seen when processing material. The impact of throughput has to do with the distributing the cost of the piece of equipment over the amount of material that is processed. When the throughput is decreased the cost increases, while when throughput increases the cost decreases.

40
Milestone Completion ReportINL/EXT-18-51655
Figure 10. Tornado chart showing sensitivity of cost to operational parameters used to model the 2022 Projection for feedstock supply to AHTL.

41
Milestone Completion ReportINL/EXT-18-51655
INDUSTRIAL RELEVANCE OF THE FEEDSTOCKS3.Logging Residues
Currently nationwide, there are 9,414,172 dry tons of pine forest residues. The use of Forest residue is qualified by EPA to be eligible for RINs (USEPA, 2010). This scenario estimates a total of 35.9 million tons available nationwide at this cost of $59.76. If we consider only the volume that is aggregable within a 725,000 ton supply shed and ignore “stranded” resources, there are enough forest residues to supply 17 biorefineries.
Clean Pine
Currently, it is estimated that there are 21,218,792 dry tons of pine feedstocks available nationally, with 11,804,620 dry tons of planted pine and 9,414,172 dry tons of pine forest residues. Plantation grown pine is the only type of pine that is currently known to be qualified for the production of RINs. However, the amount of material that can be aggregated at a cost of approximately $87/dry ton to the reactor throat is only enough to support 8 biorefineries, given no competition for the resource.
QUALIFICATION OF THE FEEDSTOCKS FOR 4.RENEWABLE IDENTIFICATION NUMBERS
The Environmental Protection Agency revised the National Renewable Fuel Standard Program in 2010 to implement the requirements of the Energy Security and Independence Act of 2007 (EISA). The revision of the program became known as RFS2, and mandated the use of 36 billion gallons of renewable fuel by 2022. As part of the revised rules, definitions of qualified biofuel feedstocks were outlined; the revised rules stipulated that “renewable fuels” had to be made from materials that qualify as renewable biomass. To be considered renewable biomass the materials must conform to the specified types and land types from where they are harvested as directed by EISA. From the final rule published in Vol 75, No. 58 of the Federal Register on page 14681.
“The definition includes:
Planted crops and crop residue from agricultural land cleared prior to December 19, 2007 and actively managed or fallow on that date.
Planted trees and tree residue from tree plantations cleared prior to December 19, 2007 and actively managed on that date.
Animal waste material and byproducts.
Slash and pre-commercial thinnings from non-federal forestlands that are neither old-growth nor listed as critically imperiled or rare by a State Natural Heritage program.
Biomass cleared from the vicinity of buildings and other areas at risk of wildfire.

42
Milestone Completion ReportINL/EXT-18-51655
Algae.
Separated yard waste and food waste.”
Thermochemical conversion focuses primarily on woody materials. Specifically the qualification must be examined for the two potential feedstock sources that were considered: clean pine and forest residue. Clean pine, pine wood containing less than 2% bark, could potentially be sourced from both plantation and forest sources. Clean pine will generally be produced from stem sections of whole trees. The qualification of plantation material is directly addressed in Section II.B.4.a.ii on page 14694. EISA defines “…planted trees and tree residue from actively managed tree plantations on non-federal land cleared at any time prior to December 19, 2007, including land belonging to an Indian tribe or an Indian individual, that is held in trust by the United States or subject to a restriction against alienation imposed by the United States.”; as renewable biomass. While a plantation has been defined as, “a stand of no less than 1 acre composed primarily of trees established by hand- or machine-planting of seed or sapling, or by coppice growth from the stump or root of a tree that was hand- or machine-planted.” From these definitions, practically all non-federal sources of cultivated trees would qualify as a renewable biomass and thus qualify for RINS.
The ability to source clean pine material from natural forest is more limited, but still possible based on Section II.B.4.a.iii on page 14695 and Section II.B.4.iv on page 14696. These two sections describe the conditions necessary to qualify from traditional forestry operations and/or as operations that are protecting from wild fire. In order to source clean pine from natural forest, that are not under the risk of wildfire, the following conditions must be met: 1) Be the result of pre-commercial thinning or residue from a commercial harvest; 2) be, “ from non-federal forestlands, including forestlands belonging to an Indian tribe or an Indian individual, that are held in trust by the United States or subject to a restriction against alienation imposed by the United States”; 3) the material must not come, “from forests or forestlands that are ecological communities with a global or State ranking of critically imperiled, imperiled, or rare pursuant to a State Natural Heritage Program, old growth forest, or late successional forest.”. For the purposes of EISA, pre-commercial thinning is defined as, “ those trees and other vegetative material removed from a stand of trees in order to reduce stocking to concentrate growth on more desirable trees”. In order for the material to qualify as renewable biomass from “Areas at Risk From Wildfire”, the forest land would need to be designated as part of the Wildland-Urban Interface as depicted and mapped by the electronic Wildland-Urban Interface map located at http://silvis.forest.wisc.edu/Library/WUILibrary.asp.
Forest residue qualifies as a renewable material and eligible for RINS, under both Section II.B.4.ii and Section II.B.4.iii, as both sections utilize the definition of “slash” as the presented in the Dictionary of Forestry. The definition states that slash is “the residue, e.g. treetops, and branches left on the ground after logging or accumulating as a result of a storm, fire, girdling or delimbing.” For the plantation case the definition was expanded to the following for the final rule:” slash and any woody residue generated during the processing of planted trees from actively managed tree plantations for use in lumber, paper, furniture or other applications,

43
Milestone Completion ReportINL/EXT-18-51655
providing that such woody residue is not mixed with similar residue from trees that do not originate in actively managed tree plantations.”
Ultimately, the qualification of biomass as renewable is subject to verification that the feedstocks meet the requirements specified by EISA. Currently, there are three mechanisms that provide this verification. First, the individual fuel production facilities can perform their own recordkeeping and reporting. Second, renewable fuel producers can form a consortium that funds third-party audit of quality assurance, based on an EPA approved plan. The final method only is only available to producers sourcing their biomass entirely from within the United States. This method uses an aggregate compliance approach using USDA publicly available data about agricultural land to form the basis of determination on feedstock renewability. In the case of non-agricultural products, producers must obtain sufficient documentation from their suppliers to prove compliance with EISA definitions.
SUSTAINABILITY CONSIDERATIONS5.Discussion of the sustainability of woody biomass was first presented in the 2015 woody
SOT (Hartley et al. 2015). Potential risks to sustainability have not significantly changedsince that time. The attractiveness of woody biomass as an energy source is still predicatedon the material being both renewable and sustainable. Development of energy markets thatutilize woody biomass will provide an incentive for forest landowners and forest managers toremove greater proportions of material from their forest through removal of forest residuesand low value material, which generally have been left on site (Vance et al. 2014). Numerouspotential benefits are associated with removal of biomass, including but not limited toremoval of residual fuels, reducing the cost of site preparation and regeneration, andimproving overall operability in the stand (Agee and Skinner 2005, Gan and Smith 2007, USDOE 2011, Skog and Barbour 2006). However, potential concerns are associated with anincreased intensity of harvesting forest biomass, especially the impact on site productivitydue to nutrient removal (Vance et al. 2014).
The basis for concern over nutrient removal is that the majority of the material removed as part of a biomass harvest contains most of the nutrient-rich material in the tree. By removingthe tops and branches from the forest, nutrients that would have returned to the soil areremoved, potentially leading to a decline in soil and overall stand productivity. While this is areasonable train of thought, there is not a consensus among the forest science communityabout whether high-intensity harvest (i.e., removing the tops and branches) has a significantimpact on long-term soil productivity. Ponder et al. (2012) reported that during the U.S.Department of Agriculture Forest Service’s Long-Term Soil Productivity Study, which took place over 10 years at 45 sites across the United States, harvests that removed the nutrient-richmaterial had little effect on site productivity. One of the main reasons for a lack of significantand noticeable effect in soil productivity is due to operational constraints. For a typicalbiomass harvest, it is not practical to remove all available biomass due to both technologicaland economic constraints. Several studies on a variety of sites have found that operations areonly able to economically collect between 20 and 75% of biomass in a stand (Nurmi 2007,

44
Milestone Completion ReportINL/EXT-18-51655
Ralevic et al. 2010, Klockow et al. 2013). Current technology and demand for biomass make itunlikely that removal will reach levels that will cause an impact on soil productivity.However, as technology advances and higher demands increase prices, it is possible thatremovals could reach levels that have a detrimental impact on forest soils.
Aside from nutrient removal, harvesting can cause soil compaction and/or displacement.During harvest, machines traversing the site compact the soil, changing the soil’s physicalstructure by increasing soil strength and bulk density and reducing pore space (Fisher and Binkley 2000, Grigal 2000, Janowiak and Webster 2010). Soil compaction will occuranytime a machine passes over an area of ground; however, the severity may be increasedduring biomass harvest due to an increase in the machine passes required to collect theadditional material (Burger 2002). However, if biomass harvest is performed in a similarmanner to conventional timber harvest, it is unlikely that soil compaction will be significantlydifferent, because the majority of the compaction happens during the first few machine passes(Janowiak and Webster 2010, Johnson et al. 2007).
While all negative site impacts associated with removal of biomass can be seen todiminish sustainability of the practice, it is possible to prevent or mitigate negative siteimpacts through implementation of proper strategies. Vance et al. (2014) propose thatadhering to current best management practices, focusing functional values of interest, andmonitoring nutrients will limit decreases in soil productivity as a result of biomass harvest. Best management practices remain the same, independent of the intensity of the harvest ormaterial being harvested, and have been shown to be effective in protecting sustainability(Shepard 2006). Additionally, focusing functional values (such as growth rates or streamhealth) will place emphasis on the values of concern rather than a holistic ideal.
SUMMARY6.The Terrestrial Feedstock Supply and Logistics Program within BETO focuses on (1)
reducing the delivered cost of sustainably produced biomass, (2) preserving and improving the physical and chemical quality parameters of harvested biomass to meet the individual needs of biorefineries and other biomass users, and (3) expanding the quantity of feedstock materials accessible to the bioenergy industry. To support BETO and their bioenergy production goals, INL completes annual SOT reports for herbaceous and woody biomass feedstock logistics, which provides the status of technology development of feedstock logistics for biomass to biofuels given actual data and experimental results, relative to technical target and cost goals from design cases.
The 2018 Woody Feedstock SOT has been separated into three separate pathways that utilize woody feedstocks: indirect liquefaction, catalytic fast pyrolysis, and algal hydrothermal liquefaction. The 2018 delivered cost for the feedstocks were found to be $63.76/dry ton, $87.82/dry ton and $70.31/dry ton, respectively (2016$). In addition to the SOT analyses, projections for each pathway have been made for the year 2022. In 2022, the cost of feedstock for indirect liquefaction and algal hydrothermal liquefaction are estimated

45
Milestone Completion ReportINL/EXT-18-51655
to remain constant over the period, while the feedstock for catalytic fast pyrolysis are estimated to be reduced to $70.31/dry ton due to the replacement of 75% of the clean pine with less costly forest residues and the application of stepwise air classification and leaching of the lights fraction, which improves the quality of the forest residue to match or exceed the quality of clean pine.
For the IDL and AHTL pathways, the feedstock supply systems utilize what has been termed a conventional feedstock supply system. Conventional feedstock supply systems form the backbone of the emerging biofuels industry, but have limitations in their ability to adjust the quality of the material that they supply. To meet the demands of the CFP pathway, it will be required that the feedstock supply system shift from a conventional system to what has been termed “advanced” supply systems. Advanced systems incorporate innovative methods of material handling, processing and supply chain configuration. In advanced designs, variability of the feedstock can be reduce to produce feedstocks of a uniform format, moving toward biomass commoditization. The 2018 woody CFP case and the 2022 Projection both incorporate advanced concepts to increase access to biomass resources and diluting negative quality impacts.
REFERENCES7.Abt, K. L., R. C. Abt, C. S. Galik and K. E. Skog. 2014. Effect of policies on pellet production
and forests in the U.S. South: a technical document supporting the Forest Service updateof the 2010 RPA Assessment. USFS. Asheville, NC, USA, US Department of AgricultureForest Service, Southern Research Station. Gen. Tech. Rep. SRS-202: 33. Retrieved fromhttp://www.srs.fs.usda.gov/pubs/gtr/gtr_srs202.pdf, [September 2, 2015].
Ackerman, P., B. Talbot, and B. Dahlin, 2014, “Biomass Harvesting and Logistics,” In: T. Seifert(ed.), Bioenergy from Wood, Springer, Netherlands.
Agee, J. K. and C. N. Skinner, 2005, “Basic principles of forest fuel reduction treatments,”Forest Ecology and Management 211(1): 83-96.
Argo, A. M., E. C. D. Tan, D. Inman, M. H. Langholtz, L. M. Eaton, J. J. Jacobson, C. T.Wright, D. J. Muth, M. M. Wu, Y.-W. Chiu, and R. L. Graham, 2013, “Investigation ofbiochemical biorefinery sizing and environmental sustainability impacts for conventionalbale system and advanced uniform biomass logistics designs,” Biofuels Bioprod. Bior. 7:282–302
Argonne National Laboratory.2016 Summary of Expansions, Updates, and Results in GREET® 2016 Suite of Models. Technical Report, ANL/ESD-16/21, https://greet.es.anl.gov.
Bals, B., C. Wedding, V. Balan, E. Sendich, and B. Dale, 2011, “Evaluating the impact ofammonia fiber expansion (AFEX) pretreatment conditions on the cost of ethanolproduction,” Bioresource Technology 102(2): 1277-1283.

46
Milestone Completion ReportINL/EXT-18-51655
B.D. Bals, C. Gunawan, J. Moore, F. Teymouri, B.E. Dale, 2013, Enzymatic hydrolysis of pelletized AFEX™-treated corn stover at high solid loadings, Biotechnol. Bioeng111(2):264-271
Boavida, D., P. Abelha, I. Gulyurtlu, B. Valentim, and M. J. L. D. Sousa, 2012, “A study on coal blending for reducing NOx and N2O levels during fluidized bed combustion,”Clean Air 5: 175-191.
Bonner, I., D. Muth, J. Koch, and D. Karlen, 2014, “Modeled impacts of cover crops and vegetative barriers on corn stover availability and soil quality,” Bio Energy Res. 7: 576-589.
Boardman, R. et al., 2013, Logistics, Costs, and GHG Impacts of Utility-Scale Cofiringwith 20% Biomass, Technical Report INL/EXT-12-25252, PNNL-22320.
Burger, J. A., 2002, “Soil and long-term site productivity values,” In J. Richardson, R.Bjo¨rheden, P. Hakkila, A. T. Lowe, and C. T. Smith (eds.) Bioenergy from sustainableforestry: Guiding principles and practice, Klewer Academic Publishers, Dordrecht.
Cafferty, K.G., Muth, D.J., Jacobson, J.J., Bryden, K.M, 2013a, Model Based Biomass System Design of Feedstock Supply Systems for Bioenergy Production. In: ASME 2013 International Design Engineering Technical Conferences and Computers and Information in Engineering Conference, August 4–7, Portland, OR, USA. ASME. pp. V02BT02A023.
Cafferty, K, J. Jacobson, and K. Kenney, 2013b, “Woody/Pyrolysis Feedstock 2013 State ofTechnology Report,” Milestone Completion Report, Idaho National Laboratory.
Cafferty, K. G and D. S. Hartley, 2015, Woody Feedstock 2014 State of Technology Report,INL\LTD-15- 34165.
Cao, C.W. , D. Y. Yang & Q. Liu, 2007, Research on Modeling and Simulation of Mixed Flow Grain Dryer, Drying Technology, 25:4, 681-687, DOI: 10.1080/07373930701290951
Carolan, J., S. Joshi, and B. E. Dale, 2007, “Technical and Financial Feasibility Analysis ofDistributed Bioprocessing Using Regional Biomass Pre-Processing Centers,” Journal ofAgricultural & Food Industrial Organization 5(2): 1203-1230.
Coyle, D. R., Coleman, M. D., Durant, J. A. and Newman, L. A., 2006, “Survival and growthof 31 Populus clones in South Carolina,” Biomass and Bioenergy 30(8):750-758.
Dutta, A., M. Talmadge, J. Hensley, M. Worley, D. Dudgeon, D. Barton, P. Groenendijk, D.Ferrari, B. Stears, E. Searcy, C. Wright, and J. Hess, 2011, Process Design and Economics for Conversion of Lignocellulosic Biomass to Ethanol - ThermochemicalPathway by Indirect Gasification and Mixed Alcohol Synthesis, NREL/TP-5100-51400,May 2011.
EC-DG-ENV. 2015. Environmental Implications of Increased Reliance of the EU on Biomassfrom the South East US. B. Kittler, A. S. Olesen, W. Price, F. Aguilar and S. L. Bager.Brussels, Belgium, Pinchot Institute for Conservation & COWI for the European

47
Milestone Completion ReportINL/EXT-18-51655
Commission Directorate-General for Environment. ENV.B.1/ETU/2014/0043. Retrievedfrom http://www.aebiom.org/wp- content/uploads/2016/08/DG-ENVI-study-imports-from-US-Final-report-July-2016.pdf.
Emerson, R., T. Westover, D. Carpenter, B. Evans, and D. Howe, 2014, “ThermochemicalConversion Feedstock Interface, Combined Milestone Completion Report: INL, NREL and PNNL,” Idaho National Laboratory.
Erber, G., J. Routa, M. Kolstrom, C. Kanzian, L. Sikanen, and K. Stampfer, 2014,“Comparing Two Different Approaches in Modeling Small Diameter Energy Wood Drying in Logwood Piles,” Croatian Journal of Forest Engineering 35: 15-22.
FAO 2016. FAOSTAT - Forestry Production and Trade. Rome, Italy, Food and AgricultureOrganization of the United Nations. Retrieved fromhttp://faostat3.fao.org/download/F/FO/E, [February 2016].
Fisher, R. F. and D. Binkley, 2000, Ecology and management of forest soils, John Wiley and Sons, Inc., New York.
Forest2Market 2015. Wood Supply Market Trends in the US South: 1995 - 2015. Charlotte,NC, USA, Forest2Market analysis for National Alliance of Forest Owners, US Endowment for Forestry and Communities, US Industrial Pellet Association. Retrievedfrom http://www.nafoalliance.org/images/pellets/Forest2Market_USSouthWoodSupplyTrends.pdf [November 22, 2015].
FORISK, 2011, “Woody Biomass as a Forest Product - Wood Supply and MarketImplications,” B. Mendell, A. H. Lang, and T. Sydor, Forisk Consulting and NationalAlliance of Forest Owners, http://nafoalliance.org/wp-content/uploads/NAFO-US-Wood-Markets-Report-102411.pdf, accessed August 13, 2015.
Gan, J. and C. T. Smith, 2007, “Co-benefits of utilizing Forest residues for bioenergy production:The case for East Texas, USA,” Biomass and Bioenergy 31(9): 623-630.
Graham, R., M. Langholtz, L. Eaton, J. Jacobson, C. Wright, M. Muth, D. Inman, E. Tan, M.Wu, Y. W. Chiu, S. Jones, L. Snowden-Swan, and A. Argo, 2013, “Investigation ofBiochemical Biorefinery Sizing and Environmental Sustainability Impacts forConventional Bale System and Advanced Uniform Biomass Logistics Designs,” Biofuels,Bioproducts and BioPower.
Greene, W., J. Cutshall, C. Dukes, and S. Baker, 2014, “Improving Woody BiomassFeedstock Logistics by Reducing Ash and Moisture Content,” Bioenergy Res 7(3): 816-823.
Grigal, D. F., 2000, “Effects of extensive forest management on soil productivity,” For. Ecol.Manag. 138(1–3): 167–185.
Hansen, J., J. Jacobson, and M. Roni, 2015, “Quantifying Supply Risk at a CellulosicBiorefinery,” In K. Chichakly and K. Saeed (eds.), Proceedings from the 33rd International Conference of the System Dynamics Society, Albany, New York: SystemDynamics Society.

48
Milestone Completion ReportINL/EXT-18-51655
Harris, R. A. and D. R. Phillips, 1986, “Density of Selected Wood Fuels,” Georgia ForestryCommission, Georgia Forest Research Paper 61: 6.
Hartley, D., M. Roni, E. Searcy and P. Lamers. 2015. Woody/Pyrolysis Feedstock 2015 Stateof Technology Report, INL/LTD-15-36596, September 2015.
Hess, J. R., K. L. Kenney, L. P. Ovard, E. M. Searcy, and C. T. Wright, 2009, Commodity-Scale Production of an Infrastructure-Compatible Bulk Solid from HerbaceousLignocellulosic Biomass. Uniform-Format Bioenergy Feedstock Supply System Design Report Series, INL/EXT-09-17527, April 2009.
Hill, L. D., 1990, Grain grades and standards: Historical issues shaping the future, Chicago,IL, USA, University of Illinois Press.
Hodges, D. G., A. J. Hartsell, C. Brandeis, T. J. Brandeis, and J. W. Bentley, 2012,“Recession Effects on the Forests and Forest Products Industries of the South,” ForestProducts Journal 61(8): 614-624.
Howe, D, T. Westover, D. Carpenter, D. Santosa, R. Emerson, S. Deutch, A. Starace, I.Kutnyakov, and Lukins, 2015, “Field-to-Fuel Performance Testing of LignocellulosicFeedstocks: An Integrated Study of the Fast Pyrolysis-Hydrotreating Pathway,” Energy and Fuels 29(5): 3188-3197.
Humbird, D., R. Davis, L. Tao, C. Kinchin, D. Hsu, A. Aden, P. Schoen, J. Lukas, B. Olthof,M. Worley, D. Sexton, and D. Dudgeon, 2011, Process Design and Economics for the Conversion of Lignocellulosic Biomass to Ethanol: Dilute-Acid Pretreatment and Enzymatic Hydrolysis of Corn Stover, NREL/TP-5100-47764,http://www.nrel.gov/biomass/pdfs/47764.pdf, accessed June 30, 2014.
IBSS, 2014, “Wood energy: understanding the forest connection,” R. E. Bardon and D. W. Hazel, Southeastern Partnership for Integrated Biomass Supply Systems, http://www.se-ibss.org/publications-and-patents/extension-and-outreach-publications/wood-energy-understanding- the-forest-connection/at_download/file, accessed August 13, 2015.
Jacobson, J., P. Lamers, M. Roni, K. Cafferty, K. Kenney, B. Heath, J. Hansen, and J. Tumuluru,2014, Techno-economic analysis of a biomass depot, INL/EXT-14-33225, September 30,2014.
Janowiak, M. K. and C. R. Webster, 2010, “Promoting Ecological Sustainability in WoodyBiomass Harvesting,” Journal of Forestry 108(1): 16-23.
Jernigan, M. O., 2012, “High tonnage harvesting and skidding for loblolly pine energyplantations,” M.Sc. Thesis, Auburn University, Alabama
Johnson, L. R., D. Page-Dumroese, and H-S. Han, 2007, “Effects of machine traffic on thephysical properties of ash cap soils,” In D. Page-Dumroese, R. Miller, J. Mital, P.McDaniel, D. Miller (eds.) Proceedings of conference on Volcanic-ash-derived forestsoils of the Inland Northwest: properties and implications for management andrestoration, Proc. RMRS-P-44, Fort Collins, CO: U.S. Department of Agriculture, ForestService, Rocky Mountain Research Station: 69-82.

49
Milestone Completion ReportINL/EXT-18-51655
Jones, S, E. Tan, J. Jacobson, A. Meyer, A. Dutta, and L. Snowden-Swan, 2013, ProcessDesign and Economics for the Conversion of Lignocellulosic Biomass to HydrocarbonFuels: Fast Pyrolysis and Hydrotreating Bio-oil Pathway, Pacific Northwest NationalLaboratory, DRAFT Technical Report to the Bioenergy Technologies Office.
Kaczmarek, D. J., D. R. Coyle, and M. D. Coleman, 2013, “Survival and growth of a range ofPopulus clones in central South Carolina USA through age ten: Do early assessmentsreflect longer-term survival and growth trends?,” Biomass and Bioenergy 49: 260-272
Kenney, K. L., W. A. Smith, G. L. Gresham, and T. L. Westover, 2013, “Understandingbiomass feedstock variability,” Biofuels 4: 111–127.
Klockow, P. A., A. W. D’Amato, and J. B. Bradford, 2013, “Impacts of post-harvest slash andlive-tree retention on biomass and nutrient stocks in Populus tremuloides Michx.-dominated forests, northern Minnesota, USA,” Forest Ecology and Management 291:278-288.
Lacey, J. A., J. E. Aston, T. L. Westover, R. R. S. Cherry, and D. N. Thompson, 2015,“Removal of introduced inorganic content from chipped forest residues via airclassification,” Fuel 160: 265-273.
Lamers, P. and D. Hartley 2016. Domestic feedstock use patterns to identify marketlinkages. Idaho Falls, ID, USA, Idaho National Laboratory.
Lamers, P., M. S. Roni, J. S. Tumuluru, J. J. Jacobson, K. G. Cafferty, J. K. Hansen, K.Kenney, F. Teymouri, and B. Bals, 2015a, “Techno-economic analysis ofdecentralized biomass processing depots,” Bioresource Technology 194: 205-213.
Langholtz, M, 2013, ORNL personal communication, December 2013.
Langholtz, M, 2014, ORNL personal communication, December 2014.
Lanning, D. N., J. H. Dooley, and C. J. Lanning, 2012, “Shear processing of wood chips intofeedstock particles,” in 2012 ASABE Annual International Meeting, Dallas, Texas, July29-August 1, 2012, American Society of Agricultural and Biological Engineers.
Muth, D. J., M. H. Langholtz, E. C. D. Tan, J. J. Jacobson, A. Schwab, M. M. Wu, A. Argo, C. C.Brandt, K. G. Cafferty, Y. W. Chiu, A. Dutta, L. M. Eaton, and E. M. Searcy, 2014,“Investigation of thermochemical biorefinery sizing and environmental sustainability impactsfor conventional supply system and distributed pre-processing supply system designs,”Biofuels Bioprod. Bior 8: 545-567.
Nurmi, J., 2007, “Recovery of Forest residues for energy from spruce (Pices abies)dominated stands,” Biomass and Bioenergy 31(6): 375-380.
Nurmi, J., 2014, “Changes in volumetric energy densities during storage of whole-tree feedstocks from silvicultural thinnings,” Biomass and Bioenergy 61: 114-120.
Owens, V. N., D. L. Karlen, and J. A. Lacey et al. 2016. Regional FeedstockPartnership Report: Enabling the Billion-Ton Vision. U.S. Department of Energyand Idaho National Laboratory. INL/EXT-15-37477.

50
Milestone Completion ReportINL/EXT-18-51655
Pace, D. P and N. A. Yancey, 2013, Biomass Feedstock PDU Project: BiomassComminution Study, INL/EXT-14-31058.
Pearson, C.H., Halvorson, A.D., Moench, R.D. and Hammon, R.W., 2010. Production of hybrid poplar under short-term, intensive culture in Western Colorado. Industrial Crops and Products, 31(3), pp.492-498.
Ponder, F., R. L. Fleming, S. Berch, M. D. Busse, J. D. Elioff, P. W. Hazlett, and R. A.Voldseth, 2012, “Effects of organic matter removal, soil compaction and vegetationcontrol on 10th year biomass and foliar nutrition: LTSP continent-wide comparisons,”Forest Ecology and Management 278: 35-54.
Ralevic, P., M. Ryans, and D. Cormier, 2010, “Assessing forest biomass for bioenergy:operational challenges and cost considerations,” The Forestry Chronicle 86(1): 43-50.
Reddy, D. V. and N. Krishna, 2009, “Precision animal nutrition: A tool for economic and eco-friendly animal production in ruminants,” Livestock Research for RuralDevelopment 21(3).
Roise, J. P., G. Catts, D. Hazel, A. Hobbs, and C. Hopkins, 2013, Balancing biomassharvesting and drying tactics with delivered payment practice, Technical Report-not heldin TRLN member libraries, Greenville, SC: U.S. Endowment for Forestry and Community.
Sami, M., K. Annamalai, and M. Wooldridge, 2001, “Co-firing of coal and biomass fuel blends,”Progress in Energy and Combustion Science 27(2): 171-214.
Searcy, E. and J. R. Hess, 2010, Uniform-Format Feedstock Supply System: A Commodity-Scale Design to Produce an Infrastructure-Compatible Biocrude from LignocellulosicBiomass,INL/EXT-10-2037.
Searcy E. M, C. T. Wright, J. R. Hess, and T. Westover, 2012, “Logistics Costs for the 2012Conventional Woody Biomass Feedstock Supply for Thermochemical Conversion,”Idaho National Laboratory Technical Report to Office of Biomass Program, U.S.Department of Energy, January 2012.
Shepard, J. P., 2006, “Water quality protection in bioenergy production: the U.S. system offorestry Best Management Practices,” Biomass and Bioenergy 30(4): 378-384.
Shih, J.-S. and H. C. Frey, 1995, “Coal blending optimization under uncertainty,” EuropeanJournal of Operational Research 83(3): 452-465.
Skog, K. E. and R. J. Barbour, 2006, “Estimating woody biomass supply from thinningtreatments to reduce fire hazard in the U.S. West,” In P. L. Andrews and B. W. Butler(compilers), Conference proceedings RMRS-P-41––Fuels management: How tomeasure success, Ft. Collins, CO: USDA Forest Service Rocky Mountain ResearchStation: 657-672.
Sokhansanj, S., A. Turhollow, and E. Webb, 2014, Simulation of the DOE High-TonnageBiomass Logistics Demonstration Projects-Auburn University, ORNL/TM-2014/505.

51
Milestone Completion ReportINL/EXT-18-51655
Spinelli, R., Cavallo, E., Facello, A., Magagnotti, N., Nati, C. and Paletto, G., 2012. Performance and energy efficiency of alternative comminution principles: chipping versus grinding. Scandinavian Journal of Forest Research, 27(4), pp.393-400.
Stokes B., T. McDonald, and T. Kelly, 1993, Transpirational drying and costs fortransporting woody biomass a preliminary review, Auburn, AL: USDA forest service,southern forest experiment station.
Thompson, J. and W. Sprinkle, 2013, Production, cost and chip characteristics of in-woods Microchipping. Council on Forest Engineering Annual Meeting, Auburn, AL (2013)
Thompson, V., J. Aston, J. Lacey and D. Thompson, 2016, Develop feedstock blends usingcombined chemical and mechanical separations along with formulation techniques to reduce feedstock costs and risks in the supply chain, 1.2.2.1 Milestone CompletionReport.
Townsend, P. A., S. P. Kar, and R. O Miller, 2014, “Popular (Populus spp.) Trees for BiofuelProduction,” accessed 9-6-2016: http://articles.extension.org/pages/70456/poplar-populus-spp-trees- for-biofuel-production.
Tumuluru, J.S., 2016, Specific energy consumption and quality of wood pellets produced using high-moisture lodgepole pine grind in a flat die pellet mill. Chemical Engineering Research and Design. 110(2016) 82-97.
U.S. Department of Energy, 2016a, 2016 Billion Ton Report: Advancing Domestic Resourcesfor a Thriving Bioeconomy, Volume 1: Economic Availability of Feedstocks, M. H.Langholtz, B. J. Stokes, and L. M. Eaton (Leads), ORNL/TM-2016/160, Oak RidgeNational Laboratory, Oak Ridge, TN: 448.
U.S. Department of Energy, 2016b, Bioenergy Technologies Office Multi-Year Program Plan,DOE/EE-1385, March 2016,http://www.energy.gov/sites/prod/files/2016/07/f33/mypp_march2016.pdf.
U.S. Department of Energy. 2011. U.S. Billion-Ton Update: Biomass Supply for a Bioenergy and Bioproducts Industry. R.D. Perlack and B.J. Stokes (Leads), ORNL/TM-2011/224. Oak Ridge National Laboratory, Oak Ridge, TN. 227p.
U.S. Department of Energy, Bioenergy Technologies Office, 2015, “Accomplishments and Successes,” http://www.energy.gov/eere/bioenergy/accomplishments-and-successes#2014, accessed July 2015.
U.S. Energy Information Administration, 2015a, “Electric Power Monthly: Table 5.6.A Average Retail Price of Electricity to Ultimate Customers by End-Use Sector,” accessed9/1/15: http://www.eia.gov/electricity/monthly/epm_table_grapher.cfm?t=epmt_5_6_a.
U.S. Energy Information Administration, 2015b, “Gasoline and Diesel Fuel Update,”accessed 9/1/15: http://www.eia.gov/petroleum/gasdiesel/.
U.S. Energy Information Administration, 2015c, “Natural Gas: Henry Hub Natural Gas SpotPrice-Annual History,” accessed 9/1/15: http://www.eia.gov/dnav/ng/hist/rngwhhdA.htm.

52
Milestone Completion ReportINL/EXT-18-51655
U.S Energy Information Administration, 2013, Manufacturing Energy Consumption Survey(MECS). Washington DC, USA, US Energy Information Administration (EIA). Retrievedfrom https://www.eia.gov/consumption/manufacturing/, accessed February 2016.
U.S. Forest Service, 2012, Future of America’s Forest and Rangelands: Forest Service 2010 Resources Planning Act Assessment. Washington, DC, USA, United States ForestService. Retrieved from http://www.treesearch.fs.fed.us/pubs/41976/, accessed February2016.
Vakkilainen, E., K, Kuparinen and J. Heinimö, 2013, Large Indusrial Users of Energy Biomass. IEA Bioenergy, Task 40: Sustainable International Bioenergy Trade. pp 75.
Vance, E. D., W. M. Aust, B. D. Strahm, R. E. Froese, R. B. Harrison, and L. A. Morris,2014, “Biomass Harvesting and Soil Productivity: Is the Science Meeting our PolicyNeeds?,” Soil Science Society of America Journal 78(S1): S95-S104.
Wang, J., D. S. Hartley, and W. Liu, 2013, “Biomass Harvesting Systems and Analysis,” In:M. Jacobson and D. Ciolkosz (eds.), Wood Based Energy in the Northern Forests: 101-120, New York: Springer.
Webb, E., S. Sokhansanj, and A. Turhollow, 2013a, Simulation of the DOE High-TonnageBiomass Logistics Demonstration Projects-AGCO Corporation ORNL/TM-2013/323.
Webb, E., S. Sokhansanj, and A. Turhollow, 2013b, Simulation of the DOE High-TonnageBiomass Logistics Demonstration Projects-FDC Enterprises, ORNL/TM-2013/338.
Webb, E., S. Sokhansanj, and A. Turhollow, 2013c, Simulation of the DOE High-TonnageBiomass Logistics Demonstration Projects-State University of New York College of Environmental Science and Forestry ORNL/TM-2013/376.
Webb, E., S. Sokhansanj, and A. Turhollow, 2013d, Simulation of the DOE High-TonnageBiomass Logistics Demonstration Projects-TennEra LLC, ORNL/TM-2013/375.
Wright, J., 2013, “Advances in Hardwood Plantation Systems Implications for Bio-energyfeedstock,” In: 2013 SWST International Convention, Austin, TX. June 9-11, 2013.
Yancey, N. A., C.T. Wright, C.C. Connor and J.R. Hess, 2009, “Preprocessing moistlignocellulosic biomass for biorefinery feedstocks,” Proceedings of the ASABE AnnualMeeting, Reno, Nevada.

53
Milestone Completion ReportINL/EXT-18-51655
APPENDIX A – 2018 Woody State of Technology Feedstocks Logistics Design and Assumptions
for Forest Residue Supply to IDL
The 2018 woody SOT (Figure A-1) case for IDL consists of 100% forest residue, andsupplies 7500,000 dry tons of biomass annually to the throat of the conversion reactor. The forest residues are preprocessed at the roadside using a system that is based on the chip processing system that was studied by Auburn University during their High TonnageLogistics Demonstration Project. The processed forest residues are transported from theiraggregation points after preprocessing. The materials are delivered directly to the biorefinery, where they are dried using process heat before being delivered to the throat of the reactor.
Logging ResidueAsh:4%MC:30%
Chip
ChipsAsh:3.0%MC:30%PS: 2 in
Truck Transport Truck UnloadingLogging Residue
Chip Storage
Thermochemical Conversion
IDLRotary Drier
Dried Logging ResAsh:3.0%MC:10%PS: 2 in
Figure A-1. 2018 woody SOT feedstock supply system design supporting thermochemical conversion.
The model relies on assumptions about exogenous factors such as interest rates, energyprices, and land rents. The prices for electricity, natural gas, and off-road diesel were updatedto more accurately reflect market conditions. Table A-1 shows the values of the assumptions used.
Table A-1 Updated energy prices and interest rates used to model feedstock logistics costs for the 2018woody SOT.
Component 2017 Assumptions 2018 Assumptions
Interest Rate 8%a 8%a
Electricity Price $0.0672/kWhb $0.0672/kWhb
Natural Gas Price $3.36/MMBtub $3.36/MMBtub
Off-Road Diesel Price $2.01/gald $2.01/gald
aJones et al. 2013.bEIA 2017

54
Milestone Completion ReportINL/EXT-18-51655
1 Grower payment is the road-side selling price, less any preprocessing costs that are incurred.
Grower PaymentA.1
Grower payment1 represents the stumpage price paid to the landowner to secure permission to harvest the material. The grower payment was calculated using the size class stumpage values reported in the 2016 Billion Ton Report (57% Size Class 1, 43% Size Class 2; BT16; USDOE, 2016) and the residue ratios from the USDA Forest Service Forest Inventory and Analysis Database (15% for Size Class 1, 14% for size Class 2; USDA Forest Service, 2017). BT16 provides values of $32/dry ton, $16/dry ton and $8/dry ton, for both planted and natural softwood stands, of size classes 1, 2 and 3, respectively in the Southern Region. Based on the assumed harvest region, the size class distribution of delivered material and residue ratio, leadsto a weighted average grower payment of $3.70/dry ton.
Harvest and CollectionA.2
The 2018 woody SOT for IDL utilizes only forest residues. Forest residues are materials, inthe form of limbs, tops, cutoffs, and/or culled material that originate from the harvest of saw logmaterial. This material is accumulated at the landing as saw logs are processed and stored in piles. Because the material is a byproduct of saw log processing, the cost of harvest andcollection are not attributed to the material.
StorageA.3
Storage involves stockpiling material to provide an adequate lead time for downstreamprocesses and accumulating material quantities for economical transportation. Woody biomassis subject to degradation by fungi, yeast, and bacteria that alter the feedstock’s composition.Degradation is a more prevalent problem in comminuted biomass, which has a higher surfacearea exposed and accessible to the damaging agents. Conversely, if the woody biomass isstored as uncomminuted material, the material is stable and can be kept for periods greaterthan a year without experiencing a reduction in quality (Nurmi 2014, Erber et al. 2014, and Ackerman et al. 2014). The additional benefit of storage in the field is that the material driesduring that time, reducing the moisture content before transportation (Stokes et al. 1993).
Field drying during storage (first included in the 2014 woody SOT and is also a keycomponent of Auburn’s High Tonnage Logistics Demonstration Project (Cafferty and Hartley 2015, Sokhansanj et al. 2014) is included in the 2018 woody SOT for IDL. A varietyof data shows the effectiveness of field drying, which is highly variable by region, species,age, and methodology. A study conducted by North Carolina State University has showedthat by allowing logs to dry on the landing for a period of 330 to 360 days, the moisturecontent can be reduced from 50% to approximately 18%, independent of time of harvest ortree type (i.e., hardwood or softwood) (Roise et al. 2013). Because the study was completed inthe same region as the defined study area, we can assume that similar results are likely and an assumption of a moisture reduction of 20% (from 50% down to 30%) in both clean pine and forest residue is conservative. Similar studies in other areas have shown greater moisturereductions in less time (Stokes et al. 1993, Greene et al. 2014).

55
Milestone Completion ReportINL/EXT-18-51655
When the materials reach the refinery they are stored in uncovered piles to await drying. Thestorage requirements at the conversion facility are assumed to be enough material to sustain the operation for 1 week of operation. This quantity of material is assumed to be adequate to sustainoperations during periods of time when material is not supplied due to weather or otherdisruptions, while also not being so great that storage losses will be large due to degradation(Table A-2).
Table A-2. Key storage assumptions for the 2018 woody SOT for IDL.
Component Forest Res.
Fieldside
Type Uncovered pile
Ground Cover None
Material Loss (%) <1%
Biorefinery
Type Uncovered pile
Ground Cover Asphalt pad
Material Loss (%) 2%
Days of Supply 6
Landing PreprocessingA.4
The landing is the location where forest materials are initially aggregated, stored, and processed for transport and sale after harvest. Landing preprocessing is used to improve thetransportation and handling characteristics of the biomass feedstocks. Landing processing is designed to increase the bulk density and/or remove materials that will be considered wastefurther along the supply chain. Through both increasing density and removing waste materials, transportation cost for the material is reduced and subsequent processing is mademore efficient.
Landing preprocessing for the forest residues included in the 2018 woody SOT for IDLblend begins before transportation to the depot. In this design the only preprocessing at the landing is chipping. The forest residues are chipped to a 2-in. chip using a mobile diskchipper. Production and fuel consumption for the chipper were taken from the DOE High-Tonnage Biomass Logistics Demonstration Project that was carried out by AuburnUniversity. This project looked at both chipping tree length material and the effect of fielddrying on chipping operations. The chips are then loaded into the chip trailer by the loaderblowing the chips from the out feed (Table A-3).
Forest residue is processed at the landing in much the same way as clean pine by firstgoing through a flail debarker and then chipped using a disk chipper. It was assumed that thethroughput for the chipper would be the same as for clean pine operation, but the cleanupoperation would be less effective with the processed forest residue having approximately

56
Milestone Completion ReportINL/EXT-18-51655
1.25% compared to the 0.5% ash in the clean pine. Additionally, attempting to clean-up forestresidues is assumed to result in a 40% material loss. The chips are also loaded into the chiptrailers by blowing the chips from the outfeed of the chipper (Table A-3).
Table A-3. Key landing preprocessing assumptions for the 2018 woody SOT for IDL.
Component Forest Res.
Loader
Type Knuckle boom
Capacity (ton/hr) 75.6
Size Reduction
Type Chipper
Capacity (ton/hour) 79.8
Dry Matter Loss (%) 5
Particle Size 2 in.
Moisture Content 30%
Transportation and HandlingA.5
Transportation includes all processes involved in movement of material to a centralizedlocation (such as a preprocessing facility or to the biorefinery). Transportation includesprocesses such as loading, trucking, rail transport, and unloading. Beyond transportation,additional handling is required to transfer and queue biomass to the conversion facility. Surgebins, conveyors, dust collection, and miscellaneous equipment are used in handling operations.Handling operations depend on many factors, including biomass moisture content, bulkdensity, and particle size and shape distribution. Lignocellulosic feedstock inherentlypossesses characteristics that inhibit handling (e.g., high cohesivity, low density, highcompressibility, and high variability in particle size and shape uniformity) (Kenney et al.2013). For this reason, lignocellulosic feedstock handling operations are typically designed at150% of design capacity in order to accommodate variability in biomass handling properties.
The 2018 woody SOT for IDL uses truck transportation to the depot/biorefinery (Table A-4). The forest residues are blown from the chipper into possum belly open back trailers with acapacity of 4,000 ft3. The material is assumed to have a dry bulk density of 11 lb/ft3 (Harrisand Phillips 1986) and the assumed moisture content at transportation is 30% (wet basis)(Greene et al, 2014). This resulted in a calculated weight-limited payload of 17.68 dry ton/loadfor the forest residue material. The draw radius for the forest residue was 88 miles, based onmaterial availability.
Table A-4. Key transportation and handling assumptions for the 2018 woody SOT for IDL.

57
Milestone Completion ReportINL/EXT-18-51655
Component Forest Residue
Truck
Type Day Cab
Transportation Distance (mi) 88
Speed (mph) 50
Trailer
Type Open back possum belly
Volume 4,000 ft3
Dry Bulk Density 11 lb/ft3
Moisture Content 30%
Handling, Refinery OperationsA.6
The materials are offloaded at the facility using a truck tipper with a hopper, where theyare transported to storage by a conveyor. Depot operations include processing operationsrequired to create a uniform feedstock for distribution and use in the conversion process. Inaddition to processing of the feedstock, depot operations may also include necessaryauxiliary operations (such as dust collection and conveyor) to move material from one operation to the next.
The 2018 woody SOT for IDL refinery operations include only drying using process heat(Table A-5). The material is dried to 10% moisture content (wet basis) in a rotary drier using excess process heat from gasification. After drying, the forest residues are placed in queue for feeding to the reactor.
Table A-5. Assumptions of key depot operations in the 2018 woody SOT for IDL.
Component Forest Residue
Loader
Capacity 120 ton/hr
Dryer
Capacity 1.5 ton/hr
Energy Consumption 38.78 kWh/ton
Waste Heat 178.57 MMBtu/hr
Moisture Reduction 20%

58
Milestone Completion ReportINL/EXT-18-51655
APPENDIX B – 2022 Projection for Woody FeedstockLogistics Design and Assumptions for Forest
Residue Supply to IDL
The 2022 woody design case for IDL (Figure B-1) consists of 100% forest residue, and supplies 725,000 dry tons of biomass annually to the throat of the conversion reactor. The forest residues are preprocessed at the roadside using a system that is based on the chip processing system that was studied by Auburn University during their High TonnageLogistics Demonstration Project. The processed forest residues are transported from theiraggregation points after preprocessing. The materials are delivered directly to the biorefinery, where they are dried using process heat before being delivered to the throat of the reactor.
Logging ResidueAsh:4%MC:30%
Chip
ChipsAsh:3.0%MC:30%PS: 2 in
Truck Transport Truck UnloadingLogging Residue
Chip Storage
Thermochemical Conversion
IDLRotary Drier
Dried Logging ResAsh:3.0%MC:10%PS: 2 in
Figure B-1. 2022 woody feedstock supply system design supporting IDL conversion.
The model relies on assumptions about exogenous factors such as interest rates, energyprices, and land rents. The prices for electricity, natural gas, and off-road diesel were updatedto more accurately reflect market conditions. Table B-1 shows the updates of theseassumptions compared to the assumptions used in 2016.
Table B-1 Updated energy prices and interest rates used to model feedstock logistics costs for the 2022 woody design for IDL.
Component 2018 Assumptions 2022 Assumptions
Interest Rate 8%a 8%a
Electricity Price $0.0672/kWhb $0.0672/kWhb
Natural Gas Price $3.36/MMBtub $3.36/MMBtub
Off-Road Diesel Price $2.01/gald $2.01/gald
aJones et al. 2013.bEIA 2017

59
Milestone Completion ReportINL/EXT-18-51655
2 Grower payment is the road-side selling price, less any preprocessing costs that are incurred.
Grower PaymentA.7
Grower payment2 represents the stumpage price paid to the landowner to secure permission to harvest the material. The grower payment was calculated using the size class stumpage values reported in the 2016 Billion Ton Report (57% Size Class 1, 43% Size Class 2; BT16; USDOE, 2016) and the residue ratios from the USDA Forest Service Forest Inventory and Analysis Database (15% for Size Class 1, 14% for size Class 2; USDA Forest Service, 2017). BT16 provides values of $32/dry ton, $16/dry ton and $8/dry ton, for both planted and natural softwood stands, of size classes 1, 2 and 3, respectively in the Southern Region. Based on the assumed harvest region, the size class distribution of delivered material and residue ratio, leadsto a weighted average grower payment of $3.70/dry ton.
Harvest and CollectionA.8
The 2018 woody SOT for IDL utilizes only forest residues. Forest residues are materials, inthe form of limbs, tops, cutoffs, and/or culled material that originate from the harvest of saw logmaterial. This material is accumulated at the landing as saw logs are processed and stored in piles. Because the material is a byproduct of saw log processing, the cost of harvest andcollection are not attributed to the material.
StorageA.9
Storage involves stockpiling material to provide an adequate lead time for downstreamprocesses and accumulating material quantities for economical transportation. Woody biomassis subject to degradation by fungi, yeast, and bacteria that alter the feedstock’s composition.Degradation is a more prevalent problem in comminuted biomass, which has a higher surfacearea exposed and accessible to the damaging agents. Conversely, if the woody biomass isstored as uncomminuted material, the material is stable and can be kept for periods greaterthan a year without experiencing a reduction in quality (Nurmi 2014, Erber et al. 2014, and Ackerman et al. 2014). The additional benefit of storage in the field is that the material driesduring that time, reducing the moisture content before transportation (Stokes et al. 1993).
Field drying during storage (first included in the 2014 woody SOT and is also a keycomponent of Auburn’s High Tonnage Logistics Demonstration Project (Cafferty and Hartley 2015, Sokhansanj et al. 2014) is included in the 2022 woody design for IDL. Avariety of data shows the effectiveness of field drying, which is highly variable by region,species, age, and methodology. A study conducted by North Carolina State University has showed that by allowing logs to dry on the landing for a period of 330 to 360 days, the moisture content can be reduced from 50% to approximately 18%, independent of time ofharvest or tree type (i.e., hardwood or softwood) (Roise et al. 2013). Because the study wascompleted in the same region as the defined study area, we can assume that similar results arelikely and an assumption of a moisture reduction of 20% (from 50% down to 30%) in bothclean pine and forest residue is conservative. Similar studies in other areas have showngreater moisture reductions in less time (Stokes et al. 1993, Greene et al. 2014).

60
Milestone Completion ReportINL/EXT-18-51655
When the materials reach the refinery they are stored in uncovered piles to await drying.The storage requirements at the conversion facility are assumed to be enough material to sustain the operation for 1 week of operation. This quantity of material is assumed to beadequate to sustain operations during periods of time when material is not supplied due to weather or other disruptions, while also not being so great that storage losses will be largedue to degradation (Table B-2).
Table B-2 Key storage assumptions for the 2018 woody design for IDL.
Component Forest Res.
Fieldside
Type Uncovered pile
Ground Cover None
Material Loss (%) <1%
Biorefinery
Type Uncovered pile
Ground Cover Asphalt pad
Material Loss (%) 2%
Days of Supply 6
Landing PreprocessingA.10
The landing is the location where forest materials are initially aggregated, stored, and processed for transport and sale after harvest. Landing preprocessing is used to improve thetransportation and handling characteristics of the biomass feedstocks. Landing processing is designed to increase the bulk density and/or remove materials that will be considered wastefurther along the supply chain. Through both increasing density and removing waste materials, transportation cost for the material is reduced and subsequent processing is mademore efficient.
Landing preprocessing for the forest residues included in the 2022 woody design for IDLblend begins before transportation to the depot. In this design the only preprocessing at the landing is chipping. The forest residues are chipped to a 2-in. chip using a mobile diskchipper. Production and fuel consumption for the chipper were taken from the DOE High-Tonnage Biomass Logistics Demonstration Project that was carried out by Auburn University. This project looked at both chipping tree length material and the effect of field drying on chipping operations. The chips are then loaded into the chip trailer by the loaderfeeding the chipper and blowing the chips from the out feed (Table B-3).
Forest residue is processed at the landing in much the same way as clean pine by firstgoing through a flail debarker and then chipped using a disk chipper. It was assumed that thethroughput for the chipper would be the same as for clean pine operation, but the cleanupoperation would be less effective with the processed forest residue having approximately1.25% compared to the 0.5% ash in the clean pine. Additionally, attempting to clean-up forest

61
Milestone Completion ReportINL/EXT-18-51655
residues is assumed to result in a 40% material loss. The chips are also loaded into the chiptrailers by blowing the chips from the outfeed of the chipper (Table B-3).
Table B-3 Key landing preprocessing assumptions for the 2022woody design for IDL.
Component Forest Res.
Loader
Type Knuckle boom
Capacity (ton/hr) 75.6
Size Reduction
Type Chipper
Capacity (ton/hour) 79.8
Dry Matter Loss (%) 5
Particle Size 2 in.
Moisture Content 30%
Transportation and HandlingA.11
Transportation includes all processes involved in movement of material to a centralizedlocation (such as a preprocessing facility or to the biorefinery). Transportation includesprocesses such as loading, trucking, rail transport, and unloading. Beyond transportation,additional handling is required to transfer and queue biomass to the conversion facility. Surgebins, conveyors, dust collection, and miscellaneous equipment are used in handling operations.Handling operations depend on many factors, including biomass moisture content, bulkdensity, and particle size and shape distribution. Lignocellulosic feedstock inherentlypossesses characteristics that inhibit handling (e.g., high cohesivity, low density, highcompressibility, and high variability in particle size and shape uniformity) (Kenney et al.2013). For this reason, lignocellulosic feedstock handling operations are typically designed at150% of design capacity in order to accommodate variability in biomass handling properties.
The 2018 woody design for IDL uses truck transportation to the depot/biorefinery (Table B-4). The forest residues are blown from the chipper into possum belly open back trailerswith a capacity of 4,000 ft3. The material is assumed to have a dry bulk density of 11 lb/ft3
(Harris and Phillips 1986) and the assumed moisture content at transportation is 30% (wetbasis) (Greene et al, 2014). This resulted in a calculated weight-limited payload of 17.68 dryton/load for the forest residue material. The draw radius for the forest residue was 88 miles, based on material availability.

62
Milestone Completion ReportINL/EXT-18-51655
Table B-4. Key transportation and handling assumptions for the 2022 woody design for IDL.
Component Forest Residue
Truck
Type Day Cab
Transportation Distance (mi) 88
Speed (mph) 50
Trailer
Type Open back possum belly
Volume 4,000 ft3
Dry Bulk Density 11 lb/ft3
Moisture Content 30%
Handling, Refinery OperationsA.12
The materials are offloaded at the facility using a truck tipper with a hopper, where theyare transported to storage by a conveyor. Depot operations include processing operationsrequired to create a uniform feedstock for distribution and use in the conversion process. Inaddition to processing of the feedstock, depot operations may also include necessaryauxiliary operations (such as dust collection and conveyor) to move material from one operation to the next.
The 2017 woody SOT refinery operations include only drying using process heat (Table B-5). The material is dried to 10% moisture content (wet basis) in a rotary drier using excess process heat from gasification. After drying, the forest residues are placed in queue for feeding to the reactor.
Table B-5. Assumptions of key depot operations for the 2022 woody design for IDL.
Component Forest Residue
Loader
Capacity 120 ton/hr
Dryer
Capacity 1.5 ton/hr
Energy 38.78 kWh/ton
Waste Heat 178.57 MMBtu/hr

63
Milestone Completion ReportINL/EXT-18-51655
Moisture Reduction 20%

64
Milestone Completion ReportINL/EXT-18-51655
APPENDIX C – 2018 Woody State of Technology Feedstock Logistics Design and Assumptions for
Clean Pine Supply to CFPThe 2018 woody SOT for CFP (Figure C-1) consists of 100% clean pine which supplies
725,000 dry tons of biomass annually to the throat of the conversion reactor. Clean pine is harvested and preprocessed using a modified ground-based mechanized chip production system that is based on the system that was studied by Auburn University during their High Tonnage Logistics Demonstration Project. All materials are transported to a processing facility. During preprocessing, the materials are processed into pellets before being blended to create a feedstock of uniform quality for use in the biorefinery.
The model relies on assumptions about exogenous factors such as interest rates, energy prices, and land rents. The prices for electricity, natural gas, and off-road diesel were updated to more accurately reflect market conditions. Table C-1 shows the updates that were used.
Table C-1 Updated energy prices and interest rates used to model feedstock logistics costs for the 2018 woody SOT for CFP
Component 2017 Assumptions 2018 Assumptions
Interest Rate 8%a 8%a
Electricity Price $0.0672/kWhb $0.0672/kWhb
Natural Gas Price $3.36/MMBtub $3.36/MMBtub
Off-Road Diesel Price $2.01/gald $2.01/gald
aJones et al. 2013.bEIA 2017
Grower PaymentA.13
Grower payment represents the stumpage price paid to the landowner to secure permission to harvest the material. The grower payment was calculated using the size class stumpage values reported in the 2016 Billion Ton Report (BT16; USDOE, 2016) and. BT16 provides values of $32/dry ton, $16/dry ton and $8/dry ton, for both planted and natural softwood stands, of size classes 1, 2 and 3, respectively in the Southern Region. Based on the assumed harvest region, the size class distribution of delivered material was 83% from size class 3 and 17% from size class 2; the resulting weighted average grower payment for clean pine is then calculated as $9.36/dry ton.
Harvest and CollectionA.14
The harvest of clean pine for energy is similar to harvest of materials for the production of paper or lumber, using integrated activities to prepare the raw material for transport from the

65
Milestone Completion ReportINL/EXT-18-51655
Standing TreesAsh:2%
MC:50%Felling
Skidding &Delimbing
Delimbed LogsAsh:1.4%MC:50%
Stack
Pile DryDried LogsAsh:1.4%MC:30%
Debark
Chip
ChipsAsh:0.5%MC:30%PS: 2 in
Truck TransportTruck Unloading
Chip Storage
Rotary Drier
Dried PelletsAsh:0.5%MC:10%PS: Pellet
Rotary Shear
Milled Clean PineAsh:0.5%MC:12%
PS: 0.25 in
Pellet MillClean Pine Pellet
Ash:0.5%MC:9%
Covered Storage
Crumbler
Thermochemical Conversion(Pyrolysis)
Final FeedstockAsh:0.71%MC:10%
PS:<0.25 in
Preprocessing
Figure C-1. 2018 woody SOT feedstock supply system design supporting thermochemical conversion.
field to the processing facility (Wang et al. 2013). The 2018 woody SOT for CFP maintains the same type of system for clean pine harvest and collection that had been used previously and is based on the system studied in the DOE High-Tonnage Biomass Logistics Demonstration Project carried out by Auburn University. The system uses a tracked feller buncher with a high speed shear for felling the clean pine-sized material. Collection and primary transportation is completed using a grapple skidder with an oversized grapple to increase payload. Felling production using the feller buncher is 49 dry tons per hour. (Cafferty and Hartley 2015, Sokhansanj et al. 2014, Jernigan 2012). Collection of the material is completed through use of a grapple skidder with a capacity of 40 dry tons per hour (Cafferty and Hartley 2015, Sokhansanj et al. 2014, Jernigan 2012).

66
Milestone Completion ReportINL/EXT-18-51655
Table C-2. Key harvest and collection assumptions for the 2018 woody SOT for CFP.
Component Clean Pine
Harvest Machine
Type Feller-buncher
Rated Capacity (ton/hour) 75.38
Utilization (%) 65
Collection Machine
Type Grapple skidder
Rated Capacity (ton/hour) 62
Utilization (%) 65
Average Extraction Distance (feet) 1,500
Initial Moisture Content 50%
Field Dry Moisture Content 30%
Operation Hours 50 week/year, 5 day/week, 8 hour/day
StorageA.15
Storage involves stockpiling material to provide an adequate lead time for downstream processes and accumulating material quantities for economical transportation. Woody biomass is subject to degradation by fungi, yeast, and bacteria that alter the feedstock’s composition. Degradation is a more prevalent problem in comminuted biomass, which has a higher surface area exposed and accessible to the damaging agents. Conversely, if the woody biomass is stored as uncomminuted material, the material is stable and can be kept for periods greater than a year without experiencing a reduction in quality (Nurmi 2014, Erber et al. 2014, Ackerman et al. 2014). The additional benefit of storage in the field is that the material dries during that time, reducing the moisture content before transportation (Stokes et al. 1993).
Field drying during storage (first included in the 2014 woody SOT and is also a key component of Auburn’s High Tonnage Logistics Demonstration Project) is included in the 2018woody SOT for CFP. A variety of data shows the effectiveness of field drying, which is highly variable by region, species, age, and methodology. A study conducted by North Carolina State University has showed that by allowing logs to dry on the landing for a period of 330 to 360 days, the moisture content can be reduced from 50% to approximately 18%, independent of time of harvest or tree type (i.e., hardwood or softwood) (Roise et al. 2013). Because the study was completed in the same region as the defined study area, we can assume that similar results are likely and an assumption of a moisture reduction of 20% (from 50% down to 30%) in both clean pine and forest residue is conservative. Similar studies in other areas have shown greater moisture reductions in less time (Stokes et al. 1993, Greene et al. 2014).

67
Milestone Completion ReportINL/EXT-18-51655
When the materials reach the depot (in this case, it is collocated with the biorefinery), they are stored in uncovered piles to await being loaded into the blending hopper. The storage requirements at the conversion facility are assumed to be enough material to sustain the operation for 1 week of operation. This quantity of material is assumed to be adequate to sustain operations during periods of time when material is not supplied due to weather or other disruptions, while also not being so great that storage losses will be large due to degradation (Table C-3).
Table C-3. Key storage assumptions for the 2018 woody SOT for CFP.
Component Clean Pine
Field Side Storage
Type Uncovered pile
Ground Cover None
Material Loss (%) <1%
Storage at Preprocessing
Type Uncovered pile
Ground Cover Asphalt pad
Material Loss (%) 2%
Days of Supply 6
Transportation and HandlingA.16
Transportation includes all processes involved in movement of material to a centralized location (such as a preprocessing facility or to the biorefinery). Transportation includes processes such as loading, trucking, rail transport, and unloading. Beyond transportation, additional handling is required to transfer and queue biomass to the conversion facility. Surge bins, conveyors, dust collection, and miscellaneous equipment are used in handling operations. Handling operations depend on many factors, including biomass moisture content, bulk density, and particle size and shape distribution. Lignocellulosic feedstock inherently possesses characteristics that inhibit handling (e.g., high cohesivity, low density, high compressibility, and high variability in particle size and shape uniformity) (Kenney et al. 2013). For this reason, lignocellulosic feedstock handling operations are typically designed at 150% of design capacity in order to accommodate variability in biomass handling properties.
The 2018 woody SOT for CFP uses truck transportation to transport the material. The clean pine material is transported as logs on log trailers with a capacity of 4,000 ft3.

68
Milestone Completion ReportINL/EXT-18-51655
Table C-4. Key transportation and handling assumptions for the 2018 woody SOT for CFP.
Component Clean Pine
Truck
Type Day cab
Transportation Distance (mi) 219
Speed (mph) 50
Trailer
Type Log Trailers
Volume 3,600 ft3
Dry Bulk Densitya 11 lb/ft3
Moisture Content 30%
Landing PreprocessingA.1
With clean pine the only processing operation at the landing is delimbing, Delimbing is accomplished just prior to stacking for storage using a delimbing gate. It is worth noting that use of the delimbing gate resulted in reduced productivity of the grapple skidder, since the stems are manually forced through a metal grid by the skidder to remove the branches.
Table C-5. Key landing preprocessing assumptions for the 2018 woody SOT for CFP.
Component Clean Pine
Delimb
Type Delimbing Gate
Capacity (ton/hour) 50
Dry Matter Loss (%) 5
PreprocessingA.2
The materials are offloaded at the facility using a truck tipper with a hopper, where they are transported to storage by a conveyor. Depot operations include processing operations required to create a uniform feedstock for distribution and use in the conversion process. In addition to processing of the feedstock, depot operations may also include necessary auxiliary operations (such as dust collection and conveyor) to move material from one operation to the next.
The 2018 woody SOT for CFP preprocessing operations include debarking, size reduction, high moisture densification, and drying. The logs are first debarked and set to the initial size reduction. Initial size reduction is completed using a centralized chipper. The chips are further size reduced using the rotary shear. The benefit of the rotary shear over the more traditional hammer mill is that energy consumption is reduced and distribution of particle sizes is reduced. The rotary shear uniformly reduces the size of the material to a particle size of 0.25 in. or below

69
Milestone Completion ReportINL/EXT-18-51655
in preparation for pelleting. The rotary sheard material is then conveyed to densification where the pellets are produced and then dried in a cross flow drier.
Table C-6. Assumptions of key depot operations, including blending, in the 2018 woody SOT for CFP.
Component Clean Pine
Loader
Capacity 120 ton/hour
Chipper
Energy 19.3 kWh
Capacity 25 ton/hour
Debarker
Horsepower 50
Capacity 80 ton/hour
Dry Matter Loss 3%
Dryer
Capacity 4.8 ton/hour
Energy 50 kWh/ton
Waste Heat 0%
Moisture Reduction
20%
Rotary Shear
Capacity 7.5 ton/hour
Energy 33.85 kWh/ton
Screen Size 1/4-in
Operating Conditions
20% moisture
Dry Matter Loss 5%
Densifier
Capacity 5 ton/hour
Energy 103 kWh/ton

70
Milestone Completion ReportINL/EXT-18-51655
APPENDIX D – 2022 Projection for Woody Feedstock Logistics Design and Assumptions for
Feedstock Supply to CFPThe 2022 woody design for CFP (Figure D-1) consists of 25% clean pine and 75% Logging
Residue which supplies 725,000 dry tons of biomass annually to the throat of the conversion reactor. Clean pine is harvested and preprocessed using a modified ground-based mechanized chip production system that is based on the system that was studied by Auburn University during their High Tonnage Logistics Demonstration Project. All materials are transported to a processing facility. During preprocessing, the materials are processed into pellets before being blended to create a feedstock of uniform quality for use in the biorefinery.
The model relies on assumptions about exogenous factors such as interest rates, energy prices, and land rents. The prices for electricity, natural gas, and off-road diesel were updated to more accurately reflect market conditions. Table D-1 shows the updates that were used.
Table D-1 Updated energy prices and interest rates used to model feedstock logistics costs for the 2022 woody design for CFP
Component 2018 Assumptions 2022 Assumptions
Interest Rate 8%a 8%a
Electricity Price $0.0672/kWhb $0.0672/kWhb
Natural Gas Price $3.36/MMBtub $3.36/MMBtub
Off-Road Diesel Price $2.01/gald $2.01/gald
aJones et al. 2013.bEIA 2017
Grower PaymentA.3
Grower payment represents the stumpage price paid to the landowner to secure permission to harvest the material. The grower payment was calculated using the size class stumpage values reported in the 2016 Billion Ton Report (BT16; USDOE, 2016) and BT16 provides values of $32.40/dry ton, $16.20/dry ton and $8.10/dry ton, for both planted and natural softwood stands, of size classes 1, 2 and 3, respectively in the Southern Region. The calculation of forest residue grower payment utilizes the residue ratios from the USDA Forest Service Forest Inventory and Analysis Database (USDA Forest Service, 2017), to determine the proportion of the value of the whole tree stumpage that remains after the harvest as residue. Based on the assumed harvest region, the size class distribution of delivered material and residue ratio, the weighted average grower payment of Forest residue is $3.75/dry ton.

71
Milestone Completion ReportINL/EXT-18-51655
Standing TreesAsh:2%MC:50%
Felling
Skidding &Delimbing
Delimbed LogsAsh:1.4%MC:50%
Stack
Pile Dry
Dried LogsAsh:1.4%MC:30%
Debark
Chip
ChipsAsh:0.5%MC:30%PS: 2 in
Logging ResidueAsh:2%MC:30%
Chip
ChipsAsh:3%MC:30%PS: 2 in
Truck Transport Truck Transport
Truck Unloading Truck Unloading
Pulp Chip Storage
Logging Residue Chip Storage
Rotary Drier
Dried Clean PineAsh:0.5%MC:10%PS: 2 in
Rotary Shear
Milled Pine BlendAsh:0.5%MC:12%
PS: 0.25 in
Covered Storage
Thermochemical Conversion(Pyrolysis)
Final FeedstockAsh:0.5%MC:10%
PS:<0.25 in
Preprocessing
Rotary Drier
Air Class Log ResAsh:0.6%MC:10%PS: 2 in
Air Classifier
Dried Logging ResAsh:1.1%MC:10%PS: 2 in
Air Classifier
Air Classifier
Dried Clean PineAsh:0.5%MC:10%PS: 2 in
Figure D-1. 2016 woody SOT feedstock supply system design supporting thermochemical conversion.

72
Milestone Completion ReportINL/EXT-18-51655
Harvest and CollectionA.4
The harvest of clean pine for energy is similar to harvest of materials for the production of paper or lumber, using integrated activities to prepare the raw material for transport from the field to the processing facility (Wang et al. 2013). The 2022 woody design for CFP maintains the same type of system for clean pine harvest and collection that had been used previously and is based on the system studied in the DOE High-Tonnage Biomass Logistics Demonstration Project carried out by Auburn University. The system uses a tracked feller buncher with a high speed shear for felling the clean pine-sized material. Collection and primary transportation is completed using a grapple skidder with an oversized grapple to increase payload. Felling production using the feller buncher is 49 dry tons per hour. (Cafferty and Hartley 2015, Sokhansanj et al. 2014, Jernigan 2012). Collection of the material is completed through use of a grapple skidder with a capacity of 40 dry tons per hour (Cafferty and Hartley 2015, Sokhansanj et al. 2014, Jernigan 2012). Forest residues are considered a byproduct of harvest and the cost of harvesting is associated with the main products.
Table D-2. Key harvest and collection assumptions for the 2018 woody design for CFP.
Component Clean Pine
Harvest Machine
Type Feller-buncher
Rated Capacity (ton/hour) 75.38
Utilization (%) 65
Collection Machine
Type Grapple skidder
Rated Capacity (ton/hour) 62
Utilization (%) 65
Average Extraction Distance (feet) 1,500
Initial Moisture Content 50%
Field Dry Moisture Content 30%
Operation Hours 50 week/year, 5 day/week, 8 hour/day
StorageA.5
Storage involves stockpiling material to provide an adequate lead time for downstream processes and accumulating material quantities for economical transportation. Woody biomass is subject to degradation by fungi, yeast, and bacteria that alter the feedstock’s composition. Degradation is a more prevalent problem in comminuted biomass, which has a higher surface area exposed and accessible to the damaging agents. Conversely, if the woody biomass is stored as uncomminuted material, the material is stable and can be kept for periods greater than a year

73
Milestone Completion ReportINL/EXT-18-51655
without experiencing a reduction in quality (Nurmi 2014, Erber et al. 2014, Ackerman et al. 2014). The additional benefit of storage in the field is that the material dries during that time, reducing the moisture content before transportation (Stokes et al. 1993).
Field drying during storage (first included in the 2014 woody SOT and is also a key component of Auburn’s High Tonnage Logistics Demonstration Project) is included in the 2016 woody SOT (Cafferty and Hartley 2015, Sokhansanj et al. 2014). A variety of data shows the effectiveness of field drying, which is highly variable by region, species, age, and methodology. A study conducted by North Carolina State University has showed that by allowing logs to dry on the landing for a period of 330 to 360 days, the moisture content can be reduced from 50% to approximately 18%, independent of time of harvest or tree type (i.e., hardwood or softwood) (Roise et al. 2013). Because the study was completed in the same region as the defined study area, we can assume that similar results are likely and an assumption of a moisture reduction of 20% (from 50% down to 30%) in both clean pine and forest residue is conservative. Similar studies in other areas have shown greater moisture reductions in less time (Stokes et al. 1993, Greene et al. 2014).
When the materials reach the depot (in this case, it is collocated with the biorefinery), they are stored in uncovered piles to await being loaded into the blending hopper. The storage requirements at the conversion facility are assumed to be enough material to sustain the operation for 1 week of operation. This quantity of material is assumed to be adequate to sustain operations during periods of time when material is not supplied due to weather or other disruptions, while also not being so great that storage losses will be large due to degradation (Table D-3).
Table D-3. Key storage assumptions for the 2022 woody design for CFP.
Component Clean Pine Forest Residue
Field Side Storage
Type Uncovered pile Uncovered pile
Ground Cover None None
Material Loss (%) <1% <1%
Storage at Preprocessing
Type Uncovered pile Uncovered pile
Ground Cover Asphalt pad Asphalt pad
Material Loss (%) 2% 2%
Days of Supply 6 6
Transportation and HandlingA.6
Transportation includes all processes involved in movement of material to a centralized location (such as a preprocessing facility or to the biorefinery). Transportation includes processes such as loading, trucking, rail transport, and unloading. Beyond transportation, additional handling is required to transfer and queue biomass to the conversion facility. Surge

74
Milestone Completion ReportINL/EXT-18-51655
bins, conveyors, dust collection, and miscellaneous equipment are used in handling operations. Handling operations depend on many factors, including biomass moisture content, bulk density, and particle size and shape distribution. Lignocellulosic feedstock inherently possesses characteristics that inhibit handling (e.g., high cohesivity, low density, high compressibility, and high variability in particle size and shape uniformity) (Kenney et al. 2013). For this reason, lignocellulosic feedstock handling operations are typically designed at 150% of design capacity in order to accommodate variability in biomass handling properties.
The 2022 woody design for CFP uses truck transportation to transport the material. The clean pine material is transported as logs on log trailers with a capacity of 3,600 ft3, while the forest residues is transported as chips in a chip van with a capacity of 4,000 ft3.
Table D-4. Key transportation and handling assumptions for the 2022 woody design for CFP.
Component Clean Pine Forest Residue
Truck
Type Day cab Day cab
Transportation Distance (mi) 32 112
Speed (mph) 50 50
Trailer
Type Log Trailers Possum Belly
Volume 3,600 ft3 4000 ft3
Dry Bulk Densitya 20 lb/ft3 11 lb/ft3
Moisture Content 30% 30%
Landing PreprocessingA.7
With clean pine the only processing operation at the landing is delimbing, Delimbing is accomplished just prior to stacking for storage using a delimbing gate. It is worth noting that use of the delimbing gate resulted in reduced productivity of the grapple skidder, since the stems are manually forced through a metal grid by the skidder to remove the branches. For the forest residue the material is chipped at the landing and blown into the trailers for transport.
Table D-5. Key landing preprocessing assumptions for the 2022 Projection for CFP.
Component Clean Pine Forest Residue
Delimb
Type Delimbing Gate -
Capacity (ton/hour) 50 -
Dry Matter Loss (%) 5 -
Chipper
Capacity - 79.8 ton/hour
Energy Consumption - 18.5 kWh/ton

75
Milestone Completion ReportINL/EXT-18-51655
Dry Matter Loss (%) - 5
PreprocessingA.1
The materials are offloaded at the facility using a truck tipper with a hopper, where they are transported to storage by a conveyor. Depot operations include processing operations required to create a uniform feedstock for distribution and use in the conversion process. In addition to processing of the feedstock, depot operations may also include necessary auxiliary operations (such as dust collection and conveyor) to move material from one operation to the next.
The 2018 woody design for CFP preprocessing operations include debarking, size reduction, high moisture densification, and drying. The logs are first debarked and set to the initial size reduction. Initial size reduction is completed using a centralized chipper. The chips are further size reduced using the rotary shear. The benefit of the rotary shear over the more traditional hammer mill is that energy consumption is reduced and distribution of particle sizes is reduced. The rotary shear uniformly reduces the size of the material to a particle size of 0.25 in. or below.

76
Milestone Completion ReportINL/EXT-18-51655
Table D-6. Assumptions of key processing operations in the 2022 woody design for CFP.
Component Clean Pine Logging Residue
Loader
Capacity 120 ton/hour -
Chipper
Energy 19.3 kWh -
Capacity 25 ton/hour -
Debarker
Horsepower 50 -
Capacity 80 ton/hour -
Dry Matter Loss 3% -
Dryer
Capacity 1.5 ton/hour 1.5 ton/hour
Energy 350 kWh/ton 350 kWh/ton
Waste Heat 0% 0%
Moisture Reduction 20% 20%
Rotary Shear
Capacity 7.5 ton/hour 7.5 ton/hour
Energy 33.85 kWh/ton 33.85 kWh/ton
Screen Size 1/4-in 1/4-in
Operating Conditions 20% moisture 20% moisture
Dry Matter Loss 5% 5%
Air Classification and Leaching
Capacity - 8.39
Horsepower - 10
Dry Matter Loss - 6%
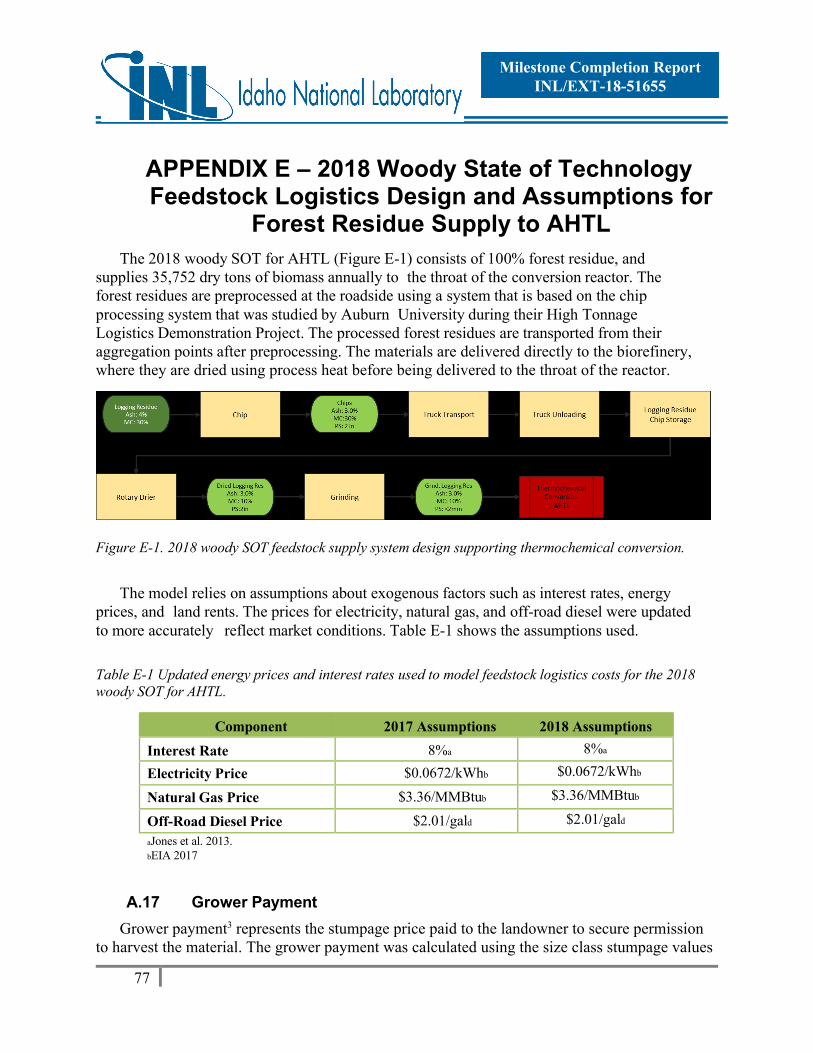
77
Milestone Completion ReportINL/EXT-18-51655
APPENDIX E – 2018 Woody State of Technology Feedstock Logistics Design and Assumptions for
Forest Residue Supply to AHTL
The 2018 woody SOT for AHTL (Figure E-1) consists of 100% forest residue, and supplies 35,752 dry tons of biomass annually to the throat of the conversion reactor. The forest residues are preprocessed at the roadside using a system that is based on the chip processing system that was studied by Auburn University during their High TonnageLogistics Demonstration Project. The processed forest residues are transported from theiraggregation points after preprocessing. The materials are delivered directly to the biorefinery, where they are dried using process heat before being delivered to the throat of the reactor.
Figure E-1. 2018 woody SOT feedstock supply system design supporting thermochemical conversion.
The model relies on assumptions about exogenous factors such as interest rates, energyprices, and land rents. The prices for electricity, natural gas, and off-road diesel were updatedto more accurately reflect market conditions. Table E-1 shows the assumptions used.
Table E-1 Updated energy prices and interest rates used to model feedstock logistics costs for the 2018woody SOT for AHTL.
Component 2017 Assumptions 2018 Assumptions
Interest Rate 8%a 8%a
Electricity Price $0.0672/kWhb $0.0672/kWhb
Natural Gas Price $3.36/MMBtub $3.36/MMBtub
Off-Road Diesel Price $2.01/gald $2.01/gald
aJones et al. 2013.bEIA 2017
Grower PaymentA.17
Grower payment3 represents the stumpage price paid to the landowner to secure permission to harvest the material. The grower payment was calculated using the size class stumpage values

78
Milestone Completion ReportINL/EXT-18-51655
3 Grower payment is the road-side selling price, less any preprocessing costs that are incurred.
reported in the 2016 Billion Ton Report (57% Size Class 1, 43% Size Class 2; BT16; USDOE, 2016) and the residue ratios from the USDA Forest Service Forest Inventory and Analysis Database (15% for Size Class 1, 14% for size Class 2; USDA Forest Service, 2017). BT16 provides values of $32/dry ton, $16/dry ton and $8/dry ton, for both planted and natural softwood stands, of size classes 1, 2 and 3, respectively in the Southern Region. Based on the assumed harvest region, the size class distribution of delivered material and residue ratio, leadsto a weighted average grower payment of $3.70/dry ton.
Harvest and CollectionA.18
The 2018 woody SOT for IDL utilizes only forest residues. Forest residues are materials, inthe form of limbs, tops, cutoffs, and/or culled material that originate from the harvest of saw logmaterial. This material is accumulated at the landing as saw logs are processed and stored in piles. Because the material is a byproduct of saw log processing, the cost of harvest andcollection are not attributed to the material.
StorageA.19
Storage involves stockpiling material to provide an adequate lead time for downstreamprocesses and accumulating material quantities for economical transportation. Woody biomassis subject to degradation by fungi, yeast, and bacteria that alter the feedstock’s composition.Degradation is a more prevalent problem in comminuted biomass, which has a higher surfacearea exposed and accessible to the damaging agents. Conversely, if the woody biomass isstored as uncomminuted material, the material is stable and can be kept for periods greaterthan a year without experiencing a reduction in quality (Nurmi 2014, Erber et al. 2014, and Ackerman et al. 2014). The additional benefit of storage in the field is that the material driesduring that time, reducing the moisture content before transportation (Stokes et al. 1993).
Field drying during storage (first included in the 2014 woody SOT and is also a keycomponent of Auburn’s High Tonnage Logistics Demonstration Project (Cafferty and Hartley 2015, Sokhansanj et al. 2014) is included in the 2018 woody SOT for IDL. A varietyof data shows the effectiveness of field drying, which is highly variable by region, species,age, and methodology. A study conducted by North Carolina State University has showedthat by allowing logs to dry on the landing for a period of 330 to 360 days, the moisturecontent can be reduced from 50% to approximately 18%, independent of time of harvest ortree type (i.e., hardwood or softwood) (Roise et al. 2013). Because the study was completed inthe same region as the defined study area, we can assume that similar results are likely and an assumption of a moisture reduction of 20% (from 50% down to 30%) in both clean pine and forest residue is conservative. Similar studies in other areas have shown greater moisturereductions in less time (Stokes et al. 1993, Greene et al. 2014).
When the materials reach the refinery they are stored in uncovered piles to await drying. Thestorage requirements at the conversion facility are assumed to be enough material to sustain the operation for 1 week of operation. This quantity of material is assumed to be adequate to sustainoperations during periods of time when material is not supplied due to weather or other

79
Milestone Completion ReportINL/EXT-18-51655
disruptions, while also not being so great that storage losses will be large due to degradation(Table E-2).
Table E-2. Key storage assumptions for the 2018 woody SOT for AHTL.
Component Forest Res.
Fieldside
Type Uncovered pile
Ground Cover None
Material Loss (%) <1%
Biorefinery
Type Uncovered pile
Ground Cover Asphalt pad
Material Loss (%) 2%
Days of Supply 6
Landing PreprocessingA.20
The landing is the location where forest materials are initially aggregated, stored, and processed for transport and sale after harvest. Landing preprocessing is used to improve thetransportation and handling characteristics of the biomass feedstocks. Landing processing is designed to increase the bulk density and/or remove materials that will be considered wastefurther along the supply chain. Through both increasing density and removing waste materials, transportation cost for the material is reduced and subsequent processing is mademore efficient.
Landing preprocessing for the forest residues included in the 2018 woody SOT for IDLblend begins before transportation to the depot. In this design the only preprocessing at the landing is chipping. The forest residues are chipped to a 2-in. chip using a mobile diskchipper. Production and fuel consumption for the chipper were taken from the DOE High-Tonnage Biomass Logistics Demonstration Project that was carried out by AuburnUniversity. This project looked at both chipping tree length material and the effect of fielddrying on chipping operations. The chips are then loaded into the chip trailer by the loaderblowing the chips from the out feed (Table E-3).
Forest residue is processed at the landing in much the same way as clean pine by firstgoing through a flail debarker and then chipped using a disk chipper. It was assumed that thethroughput for the chipper would be the same as for clean pine operation, but the cleanupoperation would be less effective with the processed forest residue having approximately1.25% compared to the 0.5% ash in the clean pine. Additionally, attempting to clean-up forestresidues is assumed to result in a 40% material loss. The chips are also loaded into the chiptrailers by blowing the chips from the outfeed of the chipper (Table E-3).

80
Milestone Completion ReportINL/EXT-18-51655
Table E-3. Key landing preprocessing assumptions for the 2018 SOT for AHTL.
Component Forest Res.
Loader
Type Knuckle boom
Capacity (ton/hr) 75.6
Size Reduction
Type Chipper
Capacity (ton/hour) 79.8
Dry Matter Loss (%) 5
Particle Size 2 in.
Moisture Content 30%
Transportation and HandlingA.21
Transportation includes all processes involved in movement of material to a centralizedlocation (such as a preprocessing facility or to the biorefinery). Transportation includesprocesses such as loading, trucking, rail transport, and unloading. Beyond transportation,additional handling is required to transfer and queue biomass to the conversion facility. Surgebins, conveyors, dust collection, and miscellaneous equipment are used in handling operations.Handling operations depend on many factors, including biomass moisture content, bulkdensity, and particle size and shape distribution. Lignocellulosic feedstock inherentlypossesses characteristics that inhibit handling (e.g., high cohesivity, low density, highcompressibility, and high variability in particle size and shape uniformity) (Kenney et al.2013). For this reason, lignocellulosic feedstock handling operations are typically designed at150% of design capacity in order to accommodate variability in biomass handling properties.
The 2018 woody SOT for AHTL uses truck transportation to the depot/biorefinery (Table E-4). The forest residues are blown from the chipper into possum belly open back trailers witha capacity of 4,000 ft3. The material is assumed to have a dry bulk density of 11 lb/ft3 (Harrisand Phillips 1986) and the assumed moisture content at transportation is 30% (wet basis) (Greene et al, 2014). This resulted in a calculated weight-limited payload of 17.68 dry ton/loadfor the forest residue material. The draw radius for the forest residue was 88 miles, based onmaterial availability.
Table E-4. Key transportation and handling assumptions for the 2018 woody SOT for AHTL.
Component Forest Residue
Truck
Type Day Cab

81
Milestone Completion ReportINL/EXT-18-51655
Transportation Distance (mi) 88
Speed (mph) 50
Trailer
Type Open back possum belly
Volume 4,000 ft3
Dry Bulk Density 11 lb/ft3
Moisture Content 30%
Processing OperationsA.22
The materials are offloaded at the facility using a truck tipper with a hopper, where theyare transported to storage by a conveyor. Depot operations include processing operationsrequired to create a uniform feedstock for distribution and use in the conversion process. Inaddition to processing of the feedstock, depot operations may also include necessaryauxiliary operations (such as dust collection and conveyor) to move material from one operation to the next.
The 2018 woody SOT for AHTL refinery operations include only drying using process heat (Table E-5). The material is dried to 10% moisture content (wet basis) in a rotary drier.After drying, the forest residues are size reduced to less than 2 mm and placed in queue for feeding to the reactor.
Table E-5. Assumptions of key preprocessing operations in the 2018 woody SOT for AHTL.
Component Forest Residue
Loader
Capacity 120 ton/hr
Dryer
Capacity 1.5 ton/hr
Energy 350 kWh/ton
Waste Heat 0%
Moisture Reduction 20%

82
Milestone Completion ReportINL/EXT-18-51655
APPENDIX F – 2022 Projection for Woody FeedstockLogistics Design and Assumptions for Forest
Residue Supply to AHTL
The 2022 woody design case for AHTL (Figure F-1) consists of 100% forest residue, and supplies 35,752dry tons of biomass annually to the throat of the conversion reactor. The forest residues are preprocessed at the roadside using a system that is based on the chip processing system that was studied by Auburn University during their High TonnageLogistics Demonstration Project. The processed forest residues are transported from theiraggregation points after preprocessing. The materials are delivered directly to the biorefinery, where they are dried using process heat before being delivered to the throat of the reactor.
Figure F-1. 2022 woody feedstock supply system design supporting AHTL conversion.
The model relies on assumptions about exogenous factors such as interest rates, energyprices, and land rents. The prices for electricity, natural gas, and off-road diesel were updatedto more accurately reflect market conditions. Table F-1 shows the values of the assumptions used.
Table F-1 Updated energy prices and interest rates used to model feedstock logistics costs for the 2022 woody design for AHTL.
Component 2018 Assumptions 2022 Assumptions
Interest Rate 8%a 8%a
Electricity Price $0.0672/kWhb $0.0672/kWhb
Natural Gas Price $3.36/MMBtub $3.36/MMBtub
Off-Road Diesel Price $2.01/gald $2.01/gald
aJones et al. 2013.bEIA 2017

83
Milestone Completion ReportINL/EXT-18-51655
4 Grower payment is the road-side selling price, less any preprocessing costs that are incurred.
Grower PaymentA.23
Grower payment4 represents the stumpage price paid to the landowner to secure permission to harvest the material. The grower payment was calculated using the size class stumpage values reported in the 2016 Billion Ton Report (57% Size Class 1, 43% Size Class 2; BT16; USDOE, 2016) and the residue ratios from the USDA Forest Service Forest Inventory and Analysis Database (15% for Size Class 1, 14% for size Class 2; USDA Forest Service, 2017). BT16 provides values of $32/dry ton, $16/dry ton and $8/dry ton, for both planted and natural softwood stands, of size classes 1, 2 and 3, respectively in the Southern Region. Based on the assumed harvest region, the size class distribution of delivered material and residue ratio, leadsto a weighted average grower payment of $3.70/dry ton.
Harvest and CollectionA.24
The 2022 woody design for AHTL utilizes only forest residues. Forest residues are materials,in the form of limbs, tops, cutoffs, and/or culled material that originate from the harvest of sawlog material. This material is accumulated at the landing as saw logs are processed and stored in piles. Because the material is a byproduct of saw log processing, the cost of harvest andcollection are not attributed to the material.
StorageA.25
Storage involves stockpiling material to provide an adequate lead time for downstreamprocesses and accumulating material quantities for economical transportation. Woody biomassis subject to degradation by fungi, yeast, and bacteria that alter the feedstock’s composition.Degradation is a more prevalent problem in comminuted biomass, which has a higher surfacearea exposed and accessible to the damaging agents. Conversely, if the woody biomass isstored as uncomminuted material, the material is stable and can be kept for periods greaterthan a year without experiencing a reduction in quality (Nurmi 2014, Erber et al. 2014, and Ackerman et al. 2014). The additional benefit of storage in the field is that the material driesduring that time, reducing the moisture content before transportation (Stokes et al. 1993).
Field drying during storage (first included in the 2014 woody SOT and is also a keycomponent of Auburn’s High Tonnage Logistics Demonstration Project is included in the2022 woody design for AHTL. A variety of data shows the effectiveness of field drying,which is highly variable by region, species, age, and methodology. A study conducted byNorth Carolina State University has showed that by allowing logs to dry on the landing for a period of 330 to 360 days, the moisture content can be reduced from 50% to approximately18%, independent of time of harvest or tree type (i.e., hardwood or softwood) (Roise et al.2013). Because the study was completed in the same region as the defined study area, we canassume that similar results are likely and an assumption of a moisture reduction of 20% (from50% down to 30%) in both clean pine and forest residue is conservative. Similar studies inother areas have shown greater moisture reductions in less time (Stokes et al. 1993, Greene etal. 2014).

84
Milestone Completion ReportINL/EXT-18-51655
When the materials reach the refinery they are stored in uncovered piles to await drying.The storage requirements at the conversion facility are assumed to be enough material to sustain the operation for 1 week of operation. This quantity of material is assumed to beadequate to sustain operations during periods of time when material is not supplied due to weather or other disruptions, while also not being so great that storage losses will be largedue to degradation (Table F-2).
Table F-2 Key storage assumptions for the 2022 Projection for AHTL.
Component Forest Res.
Fieldside
Type Uncovered pile
Ground Cover None
Material Loss (%) <1%
Biorefinery
Type Uncovered pile
Ground Cover Asphalt pad
Material Loss (%) 2%
Days of Supply 6
Landing PreprocessingA.26
The landing is the location where forest materials are initially aggregated, stored, and processed for transport and sale after harvest. Landing preprocessing is used to improve thetransportation and handling characteristics of the biomass feedstocks. Landing processing is designed to increase the bulk density and/or remove materials that will be considered wastefurther along the supply chain. Through both increasing density and removing waste materials, transportation cost for the material is reduced and subsequent processing is mademore efficient.
Landing preprocessing for the forest residues included in the 2022 woody design for AHTL blend begins before transportation to the depot. In this design the only preprocessing at the landing is chipping. The forest residues are chipped to a 2-in. chip using a mobile diskchipper. Production and fuel consumption for the chipper were taken from the DOE High-Tonnage Biomass Logistics Demonstration Project that was carried out by Auburn University. This project looked at both chipping tree length material and the effect of field drying on chipping operations. The chips are then loaded into the chip trailer by the loader feeding the chipper and blowing the chips from the out feed (Table F-3).
Forest residue is processed at the landing in much the same way as clean pine by firstgoing through a flail debarker and then chipped using a disk chipper. It was assumed that thethroughput for the chipper would be the same as for clean pine operation, but the cleanupoperation would be less effective with the processed forest residue having approximately

85
Milestone Completion ReportINL/EXT-18-51655
1.25% compared to the 0.5% ash in the clean pine. Additionally, attempting to clean-up forestresidues is assumed to result in a 40% material loss. The chips are also loaded into the chiptrailers by blowing the chips from the outfeed of the chipper (Table F-3).
Table F-3 Key landing preprocessing assumptions for the 2022 woody design for AHTL.
Component Forest Res.
Loader
Type Knuckle boom
Capacity (ton/hr) 75.6
Size Reduction
Type Chipper
Capacity (ton/hour) 79.8
Dry Matter Loss (%) 5
Particle Size 2 in.
Moisture Content 30%
Transportation and HandlingA.27
Transportation includes all processes involved in movement of material to a centralizedlocation (such as a preprocessing facility or to the biorefinery). Transportation includesprocesses such as loading, trucking, rail transport, and unloading. Beyond transportation,additional handling is required to transfer and queue biomass to the conversion facility. Surgebins, conveyors, dust collection, and miscellaneous equipment are used in handling operations.Handling operations depend on many factors, including biomass moisture content, bulkdensity, and particle size and shape distribution. Lignocellulosic feedstock inherentlypossesses characteristics that inhibit handling (e.g., high cohesivity, low density, highcompressibility, and high variability in particle size and shape uniformity) (Kenney et al.2013). For this reason, lignocellulosic feedstock handling operations are typically designed at150% of design capacity in order to accommodate variability in biomass handling properties.
The 2018 woody design for AHTL uses truck transportation to the depot/biorefinery (Table F-4). The forest residues are blown from the chipper into possum belly open backtrailers with a capacity of 4,000 ft3. The material is assumed to have a dry bulk density of 11lb/ft3 (Harris and Phillips 1986) and the assumed moisture content at transportation is 30%(wet basis) (Greene et al, 2014). This resulted in a calculated weight-limited payload of 17.68dry ton/load for the forest residue material. The draw radius for the forest residue was 88miles, based on material availability.

86
Milestone Completion ReportINL/EXT-18-51655
Table F-4. Key transportation and handling assumptions for the 2022 woody design for AHTL.
Component Forest Residue
Truck
Type Day Cab
Transportation Distance (mi) 88
Speed (mph) 50
Trailer
Type Open back possum belly
Volume 4,000 ft3
Dry Bulk Density 11 lb/ft3
Moisture Content 30%
Handling, Refinery OperationsA.28
The materials are offloaded at the facility using a truck tipper with a hopper, where theyare transported to storage by a conveyor. Depot operations include processing operationsrequired to create a uniform feedstock for distribution and use in the conversion process. Inaddition to processing of the feedstock, depot operations may also include necessaryauxiliary operations (such as dust collection and conveyor) to move material from one operation to the next.
The 2022 woody design for AHTL refinery operations include only drying using process heat (Table F-5). The material is dried to 10% moisture content (wet basis) in a rotary drier using excess process heat from gasification. After drying, the forest residues are ground to less than 2 mm and placed in queue for feeding to the reactor.
Table F-5. Assumptions of key depot operations in the 2022 woody design for AHTL.
Component Forest Residue
Loader
Capacity 120 ton/hr
Dryer
Capacity 1.5 ton/hr
Energy Consumption 350 kWh/ton
Waste Heat 0
Moisture Reduction 20%

87
Milestone Completion ReportINL/EXT-18-51655
APPENDIX G – Process Flow Diagrams and Mass Balances for Supply of Forest Residues to IDL –
2018 SOT
High-level stream table information from Aspen Plus modeling output follows, for key streams associated with each process operation area. This is followed by high-level PFDs for the associated process areas. Space for stream tables was limited; below is a key to lumped components. As the stream table information focuses primarily on the high-level overall process and does not include every individual modeled stream within each process area, mass balance closure around a given unit area may not be 100%.
Figure G-1. High-level flowsheet showing key process areas for the Indirect Liquefaction Pathway SOT.
USER2
LOADER1
USER2
CHIPPER
BIOMIN
ASH-1
BMOUT1
MC-1
DML-1ASH-2
BMOUT2
MC-2
DML-2
Figure G-2. Detailed process flow diagram for area G100 – Harvesting.

88
Milestone Completion ReportINL/EXT-18-51655
USER2
UNLOAD
USER2
STORAGE
USER2
TRANSPOT
BMOUT3
ASH-4
BMOUT4
MC-4
DML-4 ASH-5
MC-5
DML-5
BMOUT2
ASH-3
MC-3
DML-3
BMOUT5
Figure G-3. Detailed process flow diagram for area G200 – Transport & Storage.
USER2
LOADER2
USER2
CONVEYR1
USER2
DRYER
USER2
CONVEYR2
ASH-6
BMOUT6
MC-6
DML-6ASH-7
BMOUT7
MC-7
DML-7
ASH-8
BMOUT8
MC-8
DML-8
ASH-9
MC-9
DML-9
BMOUT9 BMOUT5
Figure G-4. Detailed process flow diagram for area G300 – Preprocessing.

Milestone CompletionReport INL/EXT-18-
51655
INL/
OFFICIAL USE ONLY89
Table G-1. Aspen Plus mass balances for the Indirect Liquefaction Pathway SOT.
Component Unit BIOMIN DML-1 MC-1 BMOUT1 DML-2 MC-2 BMOUT2 DML-3 MC-3 BMOUT3
Overall Flow (moisture and dry matter)
kg/hr 117,718 0 0 117,718 4,121 5,597 108,001 0 0 108,001
Moisture Flow kg/hr 35,316 0 0 35,316 0 5,597 29,719 0 0 29,719
Total Flow (dry matter) kg/hr 82,403 0 0 82,403 4,121 0 78,282 0 0 78,282
C6 kg/hr 30,513 0 0 30,513 760 0 29,753 0 0 29,753
C5 kg/hr 17,634 0 0 17,634 1,192 0 16,442 0 0 16,442
LIGNIN kg/hr 12,723 0 0 12,723 266 0 12,457 0 0 12,457
ASH kg/hr 5,768 0 0 5,768 0 0 5,768 0 0 5,768
PROTEIN kg/hr 2,497 0 0 2,497 123 0 2,373 0 0 2,373
EXTRACTIVES kg/hr 11,833 0 0 11,833 1,235 0 10,598 0 0 10,598
OTHERS kg/hr 1,434 0 0 1,434 543 0 891 0 0 891
Temperature K 298 298 298 298 298 298 298 298 298 298
Pressure atm 1 1 1 1 1 1 1 1 1 1
Vapor Frac 0 0 0 0 0 0 0 0 0 0

Milestone CompletionReport INL/EXT-18-
51655
INL/
OFFICIAL USE ONLY90
Table G-1. Continued
Component Unit DML-4 MC-4 BMOUT4DML-
5MC-
5BMOUT5
DML-6
MC-6
BMOUT6 DML-7 MC-7
Overall Flow (moisture and dry matter)
kg/hr 0 0 108,001 0 0 108,001 0 0 108,001 25 0
Moisture Flow kg/hr 0 0 29,719 0 0 29,719 0 0 29,719 25 0
Total Flow (dry matter) kg/hr 0 0 78,282 0 0 78,282 0 0 78,282 0 0
C6 kg/hr 0 0 29,753 0 0 29,753 0 0 29,753 0 0
C5 kg/hr 0 0 16,442 0 0 16,442 0 0 16,442 0 0
LIGNIN kg/hr 0 0 12,457 0 0 12,457 0 0 12,457 0 0
ASH kg/hr 0 0 5,768 0 0 5,768 0 0 5,768 0 0
PROTEIN kg/hr 0 0 2,373 0 0 2,373 0 0 2,373 0 0
EXTRACTIVES kg/hr 0 0 10,598 0 0 10,598 0 0 10,598 0 0
OTHERS kg/hr 0 0 891 0 0 891 0 0 891 0 0
Temperature K 298 298 298 298 298 298 298 298 298 298 298
Pressure atm 1 1 1 1 1 1 1 1 1 1 1
Vapor Frac 0 0 0 0 0 0 0 0 0 0 0

Milestone CompletionReport INL/EXT-18-
51655
INL/
OFFICIAL USE ONLY91
Table G-1. Continued
Component Unit BMOUT7 DML-8 MC-8 BMOUT8 DML-9 MC-9 BMOUT9
Overall Flow (moisture and dry matter)
kg/hr 107,975 0 20,988 86,987 0 0 86,987
Moisture Flow kg/hr 29,693 0 20,988 8,705 0 0 8,705
Total Flow (dry matter) kg/hr 78,282 0 0 78,282 0 0 78,282
C6 kg/hr 29,753 0 0 29,753 0 0 29,753
C5 kg/hr 16,442 0 0 16,442 0 0 16,442
LIGNIN kg/hr 12,457 0 0 12,457 0 0 12,457
ASH kg/hr 5,768 0 0 5,768 0 0 5,768
PROTEIN kg/hr 2,373 0 0 2,373 0 0 2,373
EXTRACTIVES kg/hr 10,598 0 0 10,598 0 0 10,598
OTHERS kg/hr 891 0 0 891 0 0 891
Temperature K 298 298 298 298 298 298 298
Pressure atm 1 1 1 1 1 1 1
Vapor Frac 0 0 0 0 0 0 0

92
Milestone Completion ReportINL/EXT-18-51655
APPENDIX H – Process Flow Diagrams and Mass Balances for Supply of Forest Residues to IDL –
2022 Projection
High-level stream table information from Aspen Plus modeling output follows, for key streams associated with each process operation area. This is followed by high-level PFDs for the associated process areas. Space for stream tables was limited; below is a key to lumped components. As the stream table information focuses primarily on the high-level overall process and does not include every individual modeled stream within each process area, mass balance closure around a given unit area may not be 100%.
Figure H-1. High-level flowsheet showing key process areas for the Indirect Liquefaction Pathway SOT.
USER2
LOADER1
USER2
CHIPPER
BIOMIN
ASH-1
BMOUT1
MC-1
DML-1ASH-2
BMOUT2
MC-2
DML-2
Figure H-2. Detailed process flow diagram for area H100 – Harvesting.

93
Milestone Completion ReportINL/EXT-18-51655
USER2
UNLOAD
USER2
STORAGE
USER2
TRANSPOT
BMOUT3
ASH-4
BMOUT4
MC-4
DML-4 ASH-5
MC-5
DML-5
BMOUT2
ASH-3
MC-3
DML-3
BMOUT5
Figure H-3. Detailed process flow diagram for area H200 – Transport & Storage.
USER2
LOADER2
USER2
CONVEYR1
USER2
DRYER
USER2
CONVEYR2
ASH-6
BMOUT6
MC-6
DML-6ASH-7
BMOUT7
MC-7
DML-7
ASH-8
BMOUT8
MC-8
DML-8
ASH-9
MC-9
DML-9
BMOUT9 BMOUT5
Figure H-4. Detailed process flow diagram for area H300 – Preprocessing.

Milestone CompletionReport INL/EXT-18-
51655INL/
OFFICIAL USE ONLY94
Table H-1. Aspen Plus mass balances for the Indirect Liquefaction Pathway 2022 Projection.
Component Unit BIOMIN DML-1 MC-1 BMOUT1 DML-2 MC-2 BMOUT2 DML-3 MC-3 BMOUT3
Overall Flow (moisture and dry matter)
kg/hr 117,718 0 0 117,718 4,121 5,597 108,001 0 0 108,001
Moisture Flow kg/hr 35,316 0 0 35,316 0 5,597 29,719 0 0 29,719
Total Flow (dry matter) kg/hr 82,403 0 0 82,403 4,121 0 78,282 0 0 78,282
C6 kg/hr 30,513 0 0 30,513 760 0 29,753 0 0 29,753
C5 kg/hr 17,634 0 0 17,634 1,192 0 16,442 0 0 16,442
LIGNIN kg/hr 12,723 0 0 12,723 266 0 12,457 0 0 12,457
ASH kg/hr 5,768 0 0 5,768 0 0 5,768 0 0 5,768
PROTEIN kg/hr 2,497 0 0 2,497 123 0 2,373 0 0 2,373
EXTRACTIVES kg/hr 11,833 0 0 11,833 1,235 0 10,598 0 0 10,598
OTHERS kg/hr 1,434 0 0 1,434 543 0 891 0 0 891
Temperature K 298 298 298 298 298 298 298 298 298 298
Pressure atm 1 1 1 1 1 1 1 1 1 1
Vapor Frac 0 0 0 0 0 0 0 0 0 0

Milestone CompletionReport INL/EXT-18-
51655INL/
OFFICIAL USE ONLY95
Table H-1. Continued
Component Unit DML-4 MC-4 BMOUT4DML-
5MC-
5BMOUT5
DML-6
MC-6
BMOUT6 DML-7 MC-7
Overall Flow (moisture and dry matter)
kg/hr 0 0 108,001 0 0 108,001 0 0 108,001 25 0
Moisture Flow kg/hr 0 0 29,719 0 0 29,719 0 0 29,719 25 0
Total Flow (dry matter) kg/hr 0 0 78,282 0 0 78,282 0 0 78,282 0 0
C6 kg/hr 0 0 29,753 0 0 29,753 0 0 29,753 0 0
C5 kg/hr 0 0 16,442 0 0 16,442 0 0 16,442 0 0
LIGNIN kg/hr 0 0 12,457 0 0 12,457 0 0 12,457 0 0
ASH kg/hr 0 0 5,768 0 0 5,768 0 0 5,768 0 0
PROTEIN kg/hr 0 0 2,373 0 0 2,373 0 0 2,373 0 0
EXTRACTIVES kg/hr 0 0 10,598 0 0 10,598 0 0 10,598 0 0
OTHERS kg/hr 0 0 891 0 0 891 0 0 891 0 0
Temperature K 298 298 298 298 298 298 298 298 298 298 298
Pressure atm 1 1 1 1 1 1 1 1 1 1 1
Vapor Frac 0 0 0 0 0 0 0 0 0 0 0

Milestone CompletionReport INL/EXT-18-
51655INL/
OFFICIAL USE ONLY96
Table H-1. Continued
Component Unit BMOUT7 DML-8 MC-8 BMOUT8 DML-9 MC-9 BMOUT9
Overall Flow (moisture and dry matter)
kg/hr 107,975 0 20,988 86,987 0 0 86,987
Moisture Flow kg/hr 29,693 0 20,988 8,705 0 0 8,705
Total Flow (dry matter) kg/hr 78,282 0 0 78,282 0 0 78,282
C6 kg/hr 29,753 0 0 29,753 0 0 29,753
C5 kg/hr 16,442 0 0 16,442 0 0 16,442
LIGNIN kg/hr 12,457 0 0 12,457 0 0 12,457
ASH kg/hr 5,768 0 0 5,768 0 0 5,768
PROTEIN kg/hr 2,373 0 0 2,373 0 0 2,373
EXTRACTIVES kg/hr 10,598 0 0 10,598 0 0 10,598
OTHERS kg/hr 891 0 0 891 0 0 891
Temperature K 298 298 298 298 298 298 298
Pressure atm 1 1 1 1 1 1 1
Vapor Frac 0 0 0 0 0 0 0

97
Milestone Completion ReportINL/EXT-18-51655
APPENDIX I – Process Flow Diagrams and Mass Balances for Supply of Clean Pine to CFP – 2018 SOT
High-level stream table information from Aspen Plus modeling output follows, for key streams associated with each process operation area. This is followed by high-level PFDs for the associated process areas. Space for stream tables was limited; below is a key to lumped components. As the stream table information focuses primarily on the high-level overall process and does not include every individual modeled stream within each process area, mass balance closure around a given unit area may not be 100%.
Figure I-1. High-level flowsheet showing key process areas for the Catalytic Fast Pyrolysis-Hydrotreating Pathway SOT.

98
Milestone Completion ReportINL/EXT-18-51655
USER2
FELLER
USER2
SKID DER
USER2
DELIMBER
USER2
LOADER1
USER2
LOGPILEBIOMIN
ASH-1
BMOUT1
MC -1
DML-1
MC -2
DML-2
ASH-2
BMOUT2
ASH-3
BMOUT3
MC -3
DML-3 ASH-4
BMOUT4
MC -4
DML-4
ASH-5
MC -5
DML-5
BMOUT5
Figure I-2. Detailed process flow diagram for area I100 – Harvesting.
USER2
UN LOAD
USER2
STOR AGE
USER2
TRAN SPOT
BMOUT6
ASH-7
BMOUT7
MC -7
DML-7
ASH-8
MC -8
DML-8
ASH-6
MC -6
DML-6
BMOUT5 BMOUT8
Figure I-3. Detailed process flow diagram for area I200 – Transport & Storage.

99
Milestone Completion ReportINL/EXT-18-51655
USER2
LOADER2
USER2
DEBARKER
USER2
CHIPPER
USER2
CONVEYR2
USER2
ROTSHEAR
USER2
CONVEYR3
USER2
CONVEYR4
USER2
SEPARATR
BMOUT8
ASH-9
BMOUT9
MC-9
DML-9
ASH-10
BMOUT10
MC-10
DML-10
ASH-11
BMOUT11
MC-11
DML-11ASH-12
BMOUT16
MC-12
DML-12
ASH-16
BMOUT17 MC-16
DML-16
BMOUT14
ASH-14
MC-14
DML-14
ASH-15
BMOUT15
MC-15
DML-15
BMOUT12
ASH-13
BMOUT13
MC-13
DML-13
Figure I-4. Detailed process flow diagram for area I300 – Preprocessing - Size Reduction.

100
Milestone Completion ReportINL/EXT-18-51655
USER2
CONVEYR5
USER2
PELLET
USER2
DRYER
USER2
CONVEYR6
BMOUT17ASH-18
MC-18
DML-18
BMOUT15
BMOUT18
ASH-19
BMOUT19
MC-19
DML-19
ASH-20
BMOUT20
MC-20
DML-20
ASH-21
BMOUT21
MC-21
DML-21
Figure I-5. Detailed process flow diagram for area I400 – Preprocessing - Pelleting.
USER2
METRBIN
USER2
CONVEYR7
USER2
BLENDING
USER2
CONVEYR8
USER2
CRUMBLER
BMOUT21
ASH-22
BMOUT22
MC-22
DML-22
ASH-23
BMOUT23
MC-23
DML-23
ASH-24
BMOUT24
MC-24
DML-24
ASH-25
BMOUT25
MC-25
DML-25
ASH-26
BMOUT26
MC-26
DML-26
Figure I-6. Detailed process flow diagram for area I500 – Feeding.

101
Milestone Completion ReportINL/EXT-18-51655
Table I-1. Aspen Plus mass balances for the Catalytic Fast Pyrolysis-Hydrotreating Pathway SOT.
Component unit BIOMIN DML-1 MC-1 BMOUT1 DML-2 MC-2 BMOUT2DML-
3MC-3 BMOUT3
DML-4
MC-4
Overall Flow (moisture and dry matter)
kg/hr 158,148 0 1 158,147 0 0 158,147 3,044 2,432 152,670 0 0
Moisture Flow kg/hr 71,167 0 1 71,166 0 0 71,166 0 2,432 68,734 0 0
Total Flow (dry matter)
kg/hr 86,981 0 0 86,981 0 0 86,981 3,044 0 83,936 0 0
C6 kg/hr 32,209 0 0 32,209 0 0 32,209 562 0 31,647 0 0
C5 kg/hr 18,613 0 0 18,613 0 0 18,613 881 0 17,734 0 0
LIGNIN kg/hr 13,430 0 0 13,430 0 0 13,430 197 0 13,234 0 0
ASH kg/hr 6,089 0 0 6,089 0 0 6,089 0 0 6,089 0 0
PROTEIN kg/hr 2,635 0 0 2,635 0 0 2,635 92 0 2,544 0 0
EXTRACTIVES kg/hr 12,491 0 0 12,491 0 0 12,491 913 0 11,577 0 0
OTHERS kg/hr 1,513 0 0 1,513 0 0 1,513 401 0 1,112 0 0
Temperature K 298 298 298 298 298 298 298 298 298 298 298 298
Pressure atm 1 1 1 1 1 1 1 1 1 1 1 1
Vapor Frac 0 0 0 0 0 0 0 0 0 0 0 0

102
Milestone Completion ReportINL/EXT-18-51655
Table I-1. Continued
Component unit BMOUT4 DML-5 MC-5 BMOUT5 DML-6 MC-6 BMOUT6DML-
7MC-7 BMOUT7
DML-8
Overall Flow (moisture and dry matter)
kg/hr 152,670 1,679 41,291 109,700 0 0 109,700 0 0 109,700 0
Moisture Flow kg/hr 68,734 0 41,291 27,442 0 0 27,442 0 0 27,442 0
Total Flow (dry matter)
kg/hr 83,936 1,679 0 82,258 0 0 82,258 0 0 82,258 0
C6 kg/hr 31,647 310 0 31,337 0 0 31,337 0 0 31,337 0
C5 kg/hr 17,734 486 0 17,248 0 0 17,248 0 0 17,248 0
LIGNIN kg/hr 13,234 108 0 13,125 0 0 13,125 0 0 13,125 0
ASH kg/hr 6,089 0 0 6,089 0 0 6,089 0 0 6,089 0
PROTEIN kg/hr 2,544 51 0 2,494 0 0 2,494 0 0 2,494 0
EXTRACTIVES kg/hr 11,577 504 0 11,074 0 0 11,074 0 0 11,074 0
OTHERS kg/hr 1,112 221 0 891 0 0 891 0 0 891 0
Temperature K 298 298 298 298 298 298 298 298 298 298 298
Pressure atm 1 1 1 1 1 1 1 1 1 1 1
Vapor Frac 0 0 0 0 0 0 0 0 0 0 0

103
Milestone Completion ReportINL/EXT-18-51655
Table I-1. Continued
Component unit MC-8 BMOUT8 DML-9 MC-9 BMOUT9 DML-10MC-10
BMOUT10DML-
11MC-11
BMOUT11
Overall Flow (moisture and dry matter)
kg/hr 0 109,700 0 0 109,700 1,646 0 108,054 1,620 3,959 102,475
Moisture Flow kg/hr 0 27,442 0 0 27,442 411 0 27,031 0 3,959 23,072
Total Flow (dry matter)
kg/hr 0 82,258 0 0 82,258 1,234 0 81,023 1,620 0 79,403
C6 kg/hr 0 31,337 0 0 31,337 227 0 31,110 449 0 30,660
C5 kg/hr 0 17,248 0 0 17,248 357 0 16,891 252 0 16,639
LIGNIN kg/hr 0 13,125 0 0 13,125 80 0 13,045 314 0 12,732
ASH kg/hr 0 6,089 0 0 6,089 0 0 6,089 405 0 5,683
PROTEIN kg/hr 0 2,494 0 0 2,494 37 0 2,457 0 0 2,457
EXTRACTIVES kg/hr 0 11,074 0 0 11,074 370 0 10,704 200 0 10,504
OTHERS kg/hr 0 891 0 0 891 162 0 729 0 0 729
Temperature K 298 298 298 298 298 298 298 298 298 298 298
Pressure atm 1 1 1 1 1 1 1 1 1 1 1
Vapor Frac 0 0 0 0 0 0 0 0 0 0 0

104
Milestone Completion ReportINL/EXT-18-51655
Table I-1. Continued
Component unit DML-12 MC-12 BMOUT12 DML-13 MC-13 BMOUT13 BMOUT14DML-
14MC-14 BMOUT16
DML-15
Overall Flow (moisture and dry matter)
kg/hr 0 0 102,475 0 0 15,371 87,104 0 0 87,104 0
Moisture Flow kg/hr 0 0 23,072 0 0 3,461 19,611 0 0 19,611 0
Total Flow (dry matter)
kg/hr 0 0 79,403 0 0 11,911 67,493 0 0 67,493 0
C6 kg/hr 0 0 30,660 0 0 4,599 26,061 0 0 26,061 0
C5 kg/hr 0 0 16,639 0 0 2,496 14,143 0 0 14,143 0
LIGNIN kg/hr 0 0 12,732 0 0 1,909 10,822 0 0 10,822 0
ASH kg/hr 0 0 5,683 0 0 853 4,831 0 0 4,831 0
PROTEIN kg/hr 0 0 2,457 0 0 369 2,088 0 0 2,088 0
EXTRACTIVES kg/hr 0 0 10,504 0 0 1,576 8,928 0 0 8,928 0
OTHERS kg/hr 0 0 729 0 0 110 619 0 0 619 0
Temperature K 298 298 298 298 298 298 298 298 298 298 298
Pressure atm 1 1 1 1 1 1 1 1 1 1 1
Vapor Frac 0 0 0 0 0 0 0 0 0 0 0

105
Milestone Completion ReportINL/EXT-18-51655
Table I-1. Continued
Component unit MC-15 BMOUT15 DML-16 MC-16 BMOUT17 DML-18MC-18
BMOUT18
DML-19
MC-19
BMOUT19
Overall Flow (moisture and dry matter)
kg/hr 15,371 87,104 0 0 87,104 0 0 574 14,798
675 3,412
Moisture Flow kg/hr 3,461 19,611 0 0 19,611 0 0 574 2,887 0 3,412
Total Flow (dry matter)
kg/hr 11,911 67,493 0 0 67,493 0 0 0 11,911
675 0
C6 kg/hr 4,599 26,061 0 0 26,061 0 0 0 4,599 187 0
C5 kg/hr 2,496 14,143 0 0 14,143 0 0 0 2,496 105 0
LIGNIN kg/hr 1,909 10,822 0 0 10,822 0 0 0 1,909 131 0
ASH kg/hr 853 4,831 0 0 4,831 0 0 0 853 169 0
PROTEIN kg/hr 369 2,088 0 0 2,088 0 0 0 369 0 0
EXTRACTIVES kg/hr 1,576 8,928 0 0 8,928 0 0 0 1,576 83 0
OTHERS kg/hr 110 619 0 0 619 0 0 0 110 0 0
Temperature K 298 298 298 298 298 298 298 298 298 298 298
Pressure atm 1 1 1 1 1 1 1 1 1 1 1
Vapor Frac 0 0 0 0 0 0 0 0 0 0 0

106
Milestone Completion ReportINL/EXT-18-51655
Table I-1. Continued
Component unit DML-20 MC-20 BMOUT20 DML-21 MC-21 BMOUT21DML-
22MC-22
BMOUT22DML-
23MC-23
Overall Flow (moisture and dry matter)
kg/hr 0 5,150 87,483 0 0 87,483 0 0 87,483 0 0
Moisture Flow kg/hr 0 5,150 8,755 0 0 8,755 0 0 8,755 0 0
Total Flow (dry matter)
kg/hr 0 0 78,728 0 0 78,728 0 0 78,728 0 0
C6 kg/hr 0 0 30,474 0 0 30,474 0 0 30,474 0 0
C5 kg/hr 0 0 16,534 0 0 16,534 0 0 16,534 0 0
LIGNIN kg/hr 0 0 12,601 0 0 12,601 0 0 12,601 0 0
ASH kg/hr 0 0 5,515 0 0 5,515 0 0 5,515 0 0
PROTEIN kg/hr 0 0 2,457 0 0 2,457 0 0 2,457 0 0
EXTRACTIVES kg/hr 0 0 10,421 0 0 10,421 0 0 10,421 0 0
OTHERS kg/hr 0 0 729 0 0 729 0 0 729 0 0
Temperature K 298 298 298 298 298 298 298 298 298 298 298
Pressure atm 1 1 1 1 1 1 1 1 1 1 1
Vapor Frac 0 0 0 0 0 0 0 0 0 0 0

107
Milestone Completion ReportINL/EXT-18-51655
Table I-1. Continued
Component unit BMOUT23DML-
24MC-24 BMOUT24 DML-25 MC-25 BMOUT25
DML-26
MC-26
BMOUT26
Overall Flow (moisture and dry matter)
kg/hr 87,483 0 0 87,483 0 0 87,483 0 0 87,483
Moisture Flow kg/hr 8,755 0 0 8,755 0 0 8,755 0 0 8,755
Total Flow (dry matter)
kg/hr 78,728 0 0 78,728 0 0 78,728 0 0 78,728
C6 kg/hr 30,474 0 0 30,474 0 0 30,474 0 0 30,474
C5 kg/hr 16,534 0 0 16,534 0 0 16,534 0 0 16,534
LIGNIN kg/hr 12,601 0 0 12,601 0 0 12,601 0 0 12,601
ASH kg/hr 5,515 0 0 5,515 0 0 5,515 0 0 5,515
PROTEIN kg/hr 2,457 0 0 2,457 0 0 2,457 0 0 2,457
EXTRACTIVES kg/hr 10,421 0 0 10,421 0 0 10,421 0 0 10,421
OTHERS kg/hr 729 0 0 729 0 0 729 0 0 729
Temperature K 298 298 298 298 298 298 298 298 298 298
Pressure atm 1 1 1 1 1 1 1 1 1 1
Vapor Frac 0 0 0 0 0 0 0 0 0 0

108
Milestone Completion ReportINL/EXT-18-51655
APPENDIX J – Process Flow Diagrams and Mass Balances for Supply of a 25% Clean Pine/75%
Logging Residue Blend to CFP – 2022 Projection
J.1 Clean Pine Blendstock
High-level stream table information from Aspen Plus modeling output follows, for key streams associated with each process operation area. This is followed by high-level PFDs for the associated process areas. Space for stream tables was limited; below is a key to lumped components. As the stream table information focuses primarily on the high-level overall process and does not include every individual modeled stream within each process area, mass balance closure around a given unit area may not be 100%.
Figure J-1. High-level flowsheet showing key process areas for the clean pine blendstock in the Catalytic Fast Pyrolysis-Hydrotreating Pathway 2022 Projection.

109
Milestone Completion ReportINL/EXT-18-51655
USER2
FELLER
USER2
SKID DER
USER2
DELIMBER
USER2
LOADER1
USER2
LOGPILEBIOMIN
ASH-1
BMOUT1
MC -1
DML-1
MC -2
DML-2
ASH-2
BMOUT2
ASH-3
BMOUT3
MC -3
DML-3 ASH-4
BMOUT4
MC -4
DML-4
ASH-5
MC -5
DML-5
BMOUT5
Figure J-2. Detailed process flow diagram for area J100 – Harvesting.
USER2
UN LOAD
USER2
STOR AGE
USER2
TRAN SPOT
BMOUT6
ASH-7
BMOUT7
MC -7
DML-7
ASH-8
MC -8
DML-8
ASH-6
MC -6
DML-6
BMOUT5 BMOUT8
Figure J-3. Detailed process flow diagram for area J200 – Transport & Storage.

110
Milestone Completion ReportINL/EXT-18-51655
USER2
LOADER2
USER2
DEBARKER
USER2
CHIPPER
USER2
CONVEYR2
USER2
ROTSHEAR
USER2
CONVEYR3
USER2
CONVEYR4
USER2
SEPARATR
BMOUT8
ASH-9
BMOUT9
MC-9
DML-9
ASH-10
BMOUT10
MC-10
DML-10
ASH-11
BMOUT11
MC-11
DML-11ASH-12
BMOUT16
MC-12
DML-12
ASH-16
BMOUT17 MC-16
DML-16
BMOUT14
ASH-14
MC-14
DML-14
ASH-15
BMOUT15
MC-15
DML-15
BMOUT12
ASH-13
BMOUT13
MC-13
DML-13
Figure J-4. Detailed process flow diagram for area J300 – Preprocessing - Size Reduction.

111
Milestone Completion ReportINL/EXT-18-51655
USER2
CONVEYR5
USER2
PELLET
USER2
DRYER
USER2
CONVEYR6
BMOUT17ASH-18
MC-18
DML-18
BMOUT15
BMOUT18
ASH-19
BMOUT19
MC-19
DML-19
ASH-20
BMOUT20
MC-20
DML-20
ASH-21
BMOUT21
MC-21
DML-21
Figure J-5. Detailed process flow diagram for area J400 – Preprocessing - Pelleting.
USER2
METRBIN
USER2
CONVEYR7
USER2
BLENDING
USER2
CONVEYR8
USER2
CRUMBLER
BMOUT21
ASH-22
BMOUT22
MC-22
DML-22
ASH-23
BMOUT23
MC-23
DML-23
ASH-24
BMOUT24
MC-24
DML-24
ASH-25
BMOUT25
MC-25
DML-25
ASH-26
BMOUT26
MC-26
DML-26
Figure J-6. Detailed process flow diagram for area J500 – Feeding.

112
Milestone Completion ReportINL/EXT-18-51655
Table J-1. Clean pine Aspen Plus mass balances for the Catalytic Fast Pyrolysis-Hydrotreating Pathway 2022 Projection.
Component unit BIOMIN DML-1 MC-1 BMOUT1 DML-2 MC-2 BMOUT2DML-
3MC-3 BMOUT3
DML-4
MC-4
Overall Flow (moisture and dry matter)
kg/hr 39,537 0 0 39,537 0 0 39,537 761 608 38,167 0 0
Moisture Flow kg/hr 17,792 0 0 17,792 0 0 17,792 0 608 17,183 0 0
Total Flow (dry matter)
kg/hr 21,745 0 0 21,745 0 0 21,745 761 0 20,984 0 0
C6 kg/hr 8,052 0 0 8,052 0 0 8,052 140 0 7,912 0 0
C5 kg/hr 4,653 0 0 4,653 0 0 4,653 220 0 4,433 0 0
LIGNIN kg/hr 3,357 0 0 3,357 0 0 3,357 49 0 3,308 0 0
ASH kg/hr 1,522 0 0 1,522 0 0 1,522 0 0 1,522 0 0
PROTEIN kg/hr 659 0 0 659 0 0 659 23 0 636 0 0
EXTRACTIVES kg/hr 3,123 0 0 3,123 0 0 3,123 228 0 2,894 0 0
OTHERS kg/hr 378 0 0 378 0 0 378 100 0 278 0 0
Temperature K 298 298 298 298 298 298 298 298 298 298 298 298
Pressure atm 1 1 1 1 1 1 1 1 1 1 1 1
Vapor Frac 0 0 0 0 0 0 0 0 0 0 0 0

113
Milestone Completion ReportINL/EXT-18-51655
Table J-1. Continued
Component unit BMOUT4 DML-5 MC-5 BMOUT5 DML-6 MC-6 BMOUT6DML-
7MC-7 BMOUT7
DML-8
Overall Flow (moisture and dry matter)
kg/hr 38,167 420 10,323 27,425 0 0 27,425 0 0 27,425 0
Moisture Flow kg/hr 17,183 0 10,323 6,861 0 0 6,861 0 0 6,861 0
Total Flow (dry matter)
kg/hr 20,984 420 0 20,564 0 0 20,564 0 0 20,564 0
C6 kg/hr 7,912 77 0 7,834 0 0 7,834 0 0 7,834 0
C5 kg/hr 4,433 121 0 4,312 0 0 4,312 0 0 4,312 0
LIGNIN kg/hr 3,308 27 0 3,281 0 0 3,281 0 0 3,281 0
ASH kg/hr 1,522 0 0 1,522 0 0 1,522 0 0 1,522 0
PROTEIN kg/hr 636 13 0 624 0 0 624 0 0 624 0
EXTRACTIVES kg/hr 2,894 126 0 2,769 0 0 2,769 0 0 2,769 0
OTHERS kg/hr 278 55 0 223 0 0 223 0 0 223 0
Temperature K 298 298 298 298 298 298 298 298 298 298 298
Pressure atm 1 1 1 1 1 1 1 1 1 1 1
Vapor Frac 0 0 0 0 0 0 0 0 0 0 0

114
Milestone Completion ReportINL/EXT-18-51655
Table J-1. Continued
Component unit MC-8 BMOUT8
DML-9 MC-9 BMOUT9 DML-10 MC-10 BMOUT10DML-
11MC-11
BMOUT11
Overall Flow (moisture and dry matter)
kg/hr 0 27,425 0 0 27,425 411 0 27,014 405 990 25,619
Moisture Flow kg/hr 0 6,861 0 0 6,861 103 0 6,758 0 990 5,768
Total Flow (dry matter)
kg/hr 0 20,564 0 0 20,564 309 0 20,256 405 0 19,851
C6 kg/hr 0 7,834 0 0 7,834 57 0 7,777 112 0 7,665
C5 kg/hr 0 4,312 0 0 4,312 89 0 4,223 63 0 4,160
LIGNIN kg/hr 0 3,281 0 0 3,281 20 0 3,261 79 0 3,183
ASH kg/hr 0 1,522 0 0 1,522 0 0 1,522 101 0 1,421
PROTEIN kg/hr 0 624 0 0 624 9 0 614 0 0 614
EXTRACTIVES kg/hr 0 2,769 0 0 2,769 92 0 2,676 50 0 2,626
OTHERS kg/hr 0 223 0 0 223 41 0 182 0 0 182
Temperature K 298 298 298 298 298 298 298 298 298 298 298
Pressure atm 1 1 1 1 1 1 1 1 1 1 1
Vapor Frac 0 0 0 0 0 0 0 0 0 0 0

115
Milestone Completion ReportINL/EXT-18-51655
Table J-1. Continued
Component unitDML-
12MC-12
BMOUT12
DML-13
MC-13
BMOUT13
BMOUT14
DML-14
MC-14
BMOUT16
DML-15
Overall Flow (moisture and dry matter)
kg/hr 0 0 25,619 0 0 3,843 21,776 0 0 21,776 0
Moisture Flow kg/hr 0 0 5,768 0 0 865 4,903 0 0 4,903 0
Total Flow (dry matter)
kg/hr 0 0 19,851 0 0 2,978 16,873 0 0 16,873 0
C6 kg/hr 0 0 7,665 0 0 1,150 6,515 0 0 6,515 0
C5 kg/hr 0 0 4,160 0 0 624 3,536 0 0 3,536 0
LIGNIN kg/hr 0 0 3,183 0 0 477 2,705 0 0 2,705 0
ASH kg/hr 0 0 1,421 0 0 213 1,208 0 0 1,208 0
PROTEIN kg/hr 0 0 614 0 0 92 522 0 0 522 0
EXTRACTIVES kg/hr 0 0 2,626 0 0 394 2,232 0 0 2,232 0
OTHERS kg/hr 0 0 182 0 0 27 155 0 0 155 0
Temperature K 298 298 298 298 298 298 298 298 298 298 298
Pressure atm 1 1 1 1 1 1 1 1 1 1 1
Vapor Frac 0 0 0 0 0 0 0 0 0 0 0

116
Milestone Completion ReportINL/EXT-18-51655
Table J-1. Continued
Component unit MC-15 BMOUT15 DML-16 MC-16 BMOUT17DML-
18MC-18 BMOUT18
DML-19
MC-19 BMOUT19
Overall Flow (moisture and dry matter)
kg/hr 143 3,700 169 853 20,754 0 0 24,454 0 1,295 23,158
Moisture Flow kg/hr 143 722 0 853 4,050 0 0 4,772 0 1,295 3,476
Total Flow (dry matter)
kg/hr 0 2,978 169 0 16,704 0 0 19,682 0 0 19,682
C6 kg/hr 0 1,150 47 0 6,469 0 0 7,618 0 0 7,618
C5 kg/hr 0 624 26 0 3,509 0 0 4,133 0 0 4,133
LIGNIN kg/hr 0 477 33 0 2,673 0 0 3,150 0 0 3,150
ASH kg/hr 0 213 42 0 1,166 0 0 1,379 0 0 1,379
PROTEIN kg/hr 0 92 0 0 522 0 0 614 0 0 614
EXTRACTIVES kg/hr 0 394 21 0 2,211 0 0 2,605 0 0 2,605
OTHERS kg/hr 0 27 0 0 155 0 0 182 0 0 182
Temperature K 298 298 298 298 298 298 298 298 298 298 298
Pressure atm 1 1 1 1 1 1 1 1 1 1 1
Vapor Frac 0 0 0 0 0 0 0 0 0 0 0

117
Milestone Completion ReportINL/EXT-18-51655
Table J-1. Continued
Component unit DML-20 MC-20 BMOUT20 DML-21 MC-21 BMOUT21DML-
22MC-22 BMOUT22
DML-23
MC-23
Overall Flow (moisture and dry matter)
kg/hr 0 1,288 21,871 0 0 21,871 0 0 21,871 0 0
Moisture Flow kg/hr 0 1,288 2,189 0 0 2,189 0 0 2,189 0 0
Total Flow (dry matter)
kg/hr 0 0 19,682 0 0 19,682 0 0 19,682 0 0
C6 kg/hr 0 0 7,618 0 0 7,618 0 0 7,618 0 0
C5 kg/hr 0 0 4,133 0 0 4,133 0 0 4,133 0 0
LIGNIN kg/hr 0 0 3,150 0 0 3,150 0 0 3,150 0 0
ASH kg/hr 0 0 1,379 0 0 1,379 0 0 1,379 0 0
PROTEIN kg/hr 0 0 614 0 0 614 0 0 614 0 0
EXTRACTIVES kg/hr 0 0 2,605 0 0 2,605 0 0 2,605 0 0
OTHERS kg/hr 0 0 182 0 0 182 0 0 182 0 0
Temperature K 298 298 298 298 298 298 298 298 298 298 298
Pressure atm 1 1 1 1 1 1 1 1 1 1 1
Vapor Frac 0 0 0 0 0 0 0 0 0 0 0

118
Milestone Completion ReportINL/EXT-18-51655
Table J-1. Continued
Component unit BMOUT23
DML-24 MC-24 BMOUT24DML-
25MC-25
BMOUT25DML-
26MC-26 BMOUT26
Overall Flow (moisture and dry matter)
kg/hr 21,871 0 0 21,871 0 0 21,871 0 0 21,871
Moisture Flow kg/hr 2,189 0 0 2,189 0 0 2,189 0 0 2,189
Total Flow (dry matter)
kg/hr 19,682 0 0 19,682 0 0 19,682 0 0 19,682
C6 kg/hr 7,618 0 0 7,618 0 0 7,618 0 0 7,618
C5 kg/hr 4,133 0 0 4,133 0 0 4,133 0 0 4,133
LIGNIN kg/hr 3,150 0 0 3,150 0 0 3,150 0 0 3,150
ASH kg/hr 1,379 0 0 1,379 0 0 1,379 0 0 1,379
PROTEIN kg/hr 614 0 0 614 0 0 614 0 0 614
EXTRACTIVES kg/hr 2,605 0 0 2,605 0 0 2,605 0 0 2,605
OTHERS kg/hr 182 0 0 182 0 0 182 0 0 182
Temperature K 298 298 298 298 298 298 298 298 298 298
Pressure atm 1 1 1 1 1 1 1 1 1 1
Vapor Frac 0 0 0 0 0 0 0 0 0 0

119
Milestone Completion ReportINL/EXT-18-51655
J.2 Forest Residue Blendstock
High-level stream table information from Aspen Plus modeling output follows, for key streams associated with each process operation area. This is followed by high-level PFDs for the associated process areas. Space for stream tables was limited; below is a key to lumped components. As the stream table information focuses primarily on the high-level overall process and does not include every individual modeled stream within each process area, mass balance closure around a given unit area may not be 100%.
Figure J-7. High-level flowsheet showing key process areas for the forest residue blendstock in the Catalytic Fast Pyrolysis-Hydrotreating Pathway 2022 Projection.

120
Milestone Completion ReportINL/EXT-18-51655
USER2
LOADER1
USER2
CHIPPER
BIOMIN
ASH-1
BMOUT1
MC-1
DML-1ASH-2
BMOUT2
MC-2
DML-2
Figure J-8. Detailed process flow diagram for area J100 – Harvesting.
USER2
UNLOAD
USER2
TRANSPOT
BMOUT3
ASH-4
BMOUT4
MC-4
DML-4
BMOUT2
ASH-3
MC-3
DML-3
Figure J-9. Detailed process flow diagram for area J200 – Transport.

121
Milestone Completion ReportINL/EXT-18-51655
USE R2
AIR CLAF1
USE R2
AIR CLAF2
USE R2
LEACH ING
BMO UT4
ASH- 5
MC -5
DML-5
ASH- 6
MC -6
D M L -6
ASH- 7
MC -7
DML-7
BMO UT5
BMO UT7
BMO UT6
L EACH IN
LEACH OUT
Figure J-10. Detailed process flow diagram for area J300 – Preprocessing - Air Classification & Leaching.
USE R2
DR YER
USE R2
GR IND ER
USE R2
CO N VYER2
BMO UT7
ASH- 8
BMO UT8
MC -8
DM L-8
MC -9
DML-9
BMO UT9
ASH- 10
MC -10
DML-10
BMO UT10
BMO UT6
Figure J-11. Detailed process flow diagram for area J400 – Drying & Size Reduction.

122
Milestone Completion ReportINL/EXT-18-51655
Table J-2. Forest residue Aspen Plus mass balances for the Catalytic Fast Pyrolysis-Hydrotreating Pathway 2022 Projection.
Component Unit BIOMIN DML-1 MC-1 BMOUT1 DML-2 MC-2 BMOUT2DML-
3MC-
3BMOUT3
DML-4
Overall Flow (moisture and dry matter)
kg/hr 99,260 0 0 99,260 3,474 4,719 91,067 0 0 91,067 0
Moisture Flow kg/hr 29,778 0 0 29,778 0 4,719 25,059 0 0 25,059 0
Total Flow (dry matter) kg/hr 69,482 0 0 69,482 3,474 0 66,008 0 0 66,008 0
C6 kg/hr 27,793 0 0 27,793 1,390 0 26,403 0 0 26,403 0
C5 kg/hr 18,760 0 0 18,760 938 0 17,822 0 0 17,822 0
LIGNIN kg/hr 18,760 0 0 18,760 938 0 17,822 0 0 17,822 0
ASH kg/hr 695 0 0 695 35 0 660 0 0 660 0
PROTEIN kg/hr 0 0 0 0 0 0 0 0 0 0 0
EXTRACTIVES kg/hr 3,474 0 0 3,474 174 0 3,300 0 0 3,300 0
OTHERS kg/hr 0 0 0 0 0 0 0 0 0 0 0
Temperature K 298 298 298 298 298 298 298 298 298 298 298
Pressure atm 1 1 1 1 1 1 1 1 1 1 1
Vapor Frac 0 0 0 0 0 0 0 0 0 0 0

123
Milestone Completion ReportINL/EXT-18-51655
Table J-2. Continued
Component UnitMC-
4BMOUT
4DML-5 MC-5 BMOUT5 DML-6 MC-6 BMOUT6 LEACHI
NLEACHOU
T
Overall Flow (moisture and dry matter)
kg/hr 0 91,067 4,291 1,629 85,147 8,515 0 76,633 25,545 25,545
Moisture Flow kg/hr 0 25,059 0 1,629 23,430 2,343 0 21,087 0 0
Total Flow (dry matter) kg/hr 0 66,008 4,291 0 61,717 6,172 0 55,546 0 0
C6 kg/hr 0 26,403 931 0 25,472 1,588 0 23,884 0 0
C5 kg/hr 0 17,822 1,241 0 16,581 2,118 0 14,464 0 0
LIGNIN kg/hr 0 17,822 931 0 16,891 1,588 0 15,303 0 0
ASH kg/hr 0 660 198 0 462 185 0 277 0 0
PROTEIN kg/hr 0 0 0 0 0 0 0 0 0 0
EXTRACTIVES kg/hr 0 3,300 990 0 2,310 693 0 1,617 0 0
OTHERS kg/hr 0 0 0 0 0 0 0 0 0 0
Temperature K 298 298 298 298 298 298 298 298 298 298
Pressure atm 1 1 1 1 1 1 1 1 1 1
Vapor Frac 0 0 0 0 0 0 0 0 0 0

124
Milestone Completion ReportINL/EXT-18-51655
Table J-2. Continued
Component UnitDML-
7MC-
7BMOUT7
DML-8
MC-8 BMOUT8 DML-9 MC-9 BMOUT9
Overall Flow (moisture and dry matter)
kg/hr 701 0 7,813 0 16,434 68,012 1,224 136 66,651
Moisture Flow kg/hr 189 0 2,154 0 16,434 6,806 0 136 6,670
Total Flow (dry matter) kg/hr 512 0 5,660 0 0 61,205 1,224 0 59,981
C6 kg/hr 48 0 1,636 0 0 25,521 490 0 25,031
C5 kg/hr 145 0 2,262 0 0 16,726 331 0 16,395
LIGNIN kg/hr 48 0 1,636 0 0 16,940 331 0 16,609
ASH kg/hr 129 0 55 0 0 333 12 0 320
PROTEIN kg/hr 0 0 0 0 0 0 0 0 0
EXTRACTIVES kg/hr 624 0 69 0 0 1,687 61 0 1,625
OTHERS kg/hr 0 0 0 0 0 0 0 0 0
Temperature K 298 298 298 298 298 298 298 298 298
Pressure atm 1 1 1 1 1 1 1 1 1
Vapor Frac 0 0 0 0 0 0 0 0 0

125
Milestone Completion ReportINL/EXT-18-51655
Table J-2. Continued
Component Unit DML-10 MC-10 BMOUT10
Overall Flow (moisture and dry matter)
kg/hr 0 0 66,651
Moisture Flow kg/hr 0 0 6,670
Total Flow (dry matter) kg/hr 0 0 59,981
C6 kg/hr 0 0 25,031
C5 kg/hr 0 0 16,395
LIGNIN kg/hr 0 0 16,609
ASH kg/hr 0 0 320
PROTEIN kg/hr 0 0 0
EXTRACTIVES kg/hr 0 0 1,625
OTHERS kg/hr 0 0 0
Temperature K 298 298 298
Pressure atm 1 1 1
Vapor Frac 0 0 0

126
Milestone Completion ReportINL/EXT-18-51655
APPENDIX K – Process Flow Diagrams and Mass Balances for Supply of Logging Residues to AHTL –
2018 SOTHigh-level stream table information from Aspen Plus modeling output follows, for key
streams associated with each process operation area. This is followed by high-level PFDs for the associated process areas. Space for stream tables was limited; below is a key to lumped components. As the stream table information focuses primarily on the high-level overall process and does not include every individual modeled stream within each process area, mass balance closure around a given unit area may not be 100%.
Figure K-1. High-level flowsheet showing key process areas for the forest residue blendstock in the Algae-Hydrothermal Liquefaction Pathway (AHTL) SOT.

127
Milestone Completion ReportINL/EXT-18-51655
USER2
LOADER1
USER2
CHIPPER
BIOMIN
ASH-1
BMOUT1
MC-1
DML-1ASH-2
BMOUT2
MC-2
DML-2
Figure K-2. Detailed process flow diagram for area K100 – Harvesting.
USER2
UNLOAD
USER2
TRANSPOT
BMOUT3
ASH-4
BMOUT4
MC-4
DML-4
BMOUT2
ASH-3
MC-3
DML-3
Figure K-3. Detailed process flow diagram for area K200 – Transport.

128
Milestone Completion ReportINL/EXT-18-51655
USER2
LOADER2
USER2
CONVEYR1
USER2
DRYER
USER2
GRINDER
ASH-6
BMOUT6
MC-6
DML-6ASH-7
BMOUT7
MC-7
DML-7
ASH-8
BMOUT8
MC-8
DML-8
ASH-9
MC-9
DML-9
BMOUT9
ASH-10
MC-10
DML-10
BMOUT10
USER2
CONVYER2
Figure K-4. Detailed process flow diagram for area K300 – Preprocessing – Drying & Grinding.

Milestone CompletionReport INL/EXT-18-
51655INL/
OFFICIAL USE ONLY129
Table K-1. Forest residue Aspen Plus mass balances for the Algae-Hydrothermal Liquefaction Pathway (AHTL) SOT.
Component Unit BIOMIN DML-1 MC-1 BMOUT1 DML-2 MC-2 BMOUT2DML-
3MC-
3BMOUT3
DML-4
Overall Flow (moisture and dry matter)
kg/hr 17,790 0 0 17,790 623 846 16,321 0 0 16,321 0
Moisture Flow kg/hr 5,337 0 0 5,337 0 846 4,491 0 0 4,491 0
Total Flow (dry matter) kg/hr 12,453 0 0 12,453 623 0 11,830 0 0 11,830 0
C6 kg/hr 4,981 0 0 4,981 249 0 4,732 0 0 4,732 0
C5 kg/hr 3,362 0 0 3,362 168 0 3,194 0 0 3,194 0
LIGNIN kg/hr 3,362 0 0 3,362 168 0 3,194 0 0 3,194 0
ASH kg/hr 124 0 0 124 6 0 118 0 0 118 0
PROTEIN kg/hr 0 0 0 0 0 0 0 0 0 0 0
EXTRACTIVES kg/hr 623 0 0 623 31 0 592 0 0 592 0
OTHERS kg/hr 0 0 0 0 0 0 0 0 0 0 0
Temperature K 298 298 298 298 298 298 298 298 298 298 298
Pressure atm 1 1 1 1 1 1 1 1 1 1 1
Vapor Frac 0 0 0 0 0 0 0 0 0 0 0

Milestone CompletionReport INL/EXT-18-
51655INL/
OFFICIAL USE ONLY130
Table K-1. Continued
Component Unit MC-4 BMOUT4 DML-5 MC-5 BMOUT5 DML-6 MC-6 BMOUT6 DML-7 MC-7
Overall Flow (moisture and dry matter)
kg/hr 0 16,321 0 0 16,321 0 0 16,321 0 0
Moisture Flow kg/hr 0 4,491 0 0 4,491 0 0 4,491 0 0
Total Flow (dry matter) kg/hr 0 11,830 0 0 11,830 0 0 11,830 0 0
C6 kg/hr 0 4,732 0 0 4,732 0 0 4,732 0 0
C5 kg/hr 0 3,194 0 0 3,194 0 0 3,194 0 0
LIGNIN kg/hr 0 3,194 0 0 3,194 0 0 3,194 0 0
ASH kg/hr 0 118 0 0 118 0 0 118 0 0
PROTEIN kg/hr 0 0 0 0 0 0 0 0 0 0
EXTRACTIVES kg/hr 0 592 0 0 592 0 0 592 0 0
OTHERS kg/hr 0 0 0 0 0 0 0 0 0 0
Temperature K 298 298 298 298 298 298 298 298 298 298
Pressure atm 1 1 1 1 1 1 1 1 1 1
Vapor Frac 0 0 0 0 0 0 0 0 0 0

Milestone CompletionReport INL/EXT-18-
51655INL/
OFFICIAL USE ONLY131
Table K-1. Continued
Component Unit BMOUT7DML-
8MC-8 BMOUT8 DML-9 MC-9 BMOUT9 DML-10 MC-10 BMOUT10
Overall Flow (moisture and dry matter)
kg/hr 16,321 0 3,176 13,146 237 26 12,883 0 0 12,883
Moisture Flow kg/hr 4,491 0 3,176 1,316 0 26 1,289 0 0 1,289
Total Flow (dry matter) kg/hr 11,830 0 0 11,830 237 0 11,594 0 0 11,594
C6 kg/hr 4,732 0 0 4,732 95 0 4,637 0 0 4,637
C5 kg/hr 3,194 0 0 3,194 64 0 3,130 0 0 3,130
LIGNIN kg/hr 3,194 0 0 3,194 64 0 3,130 0 0 3,130
ASH kg/hr 118 0 0 118 2 0 116 0 0 116
PROTEIN kg/hr 0 0 0 0 0 0 0 0 0 0
EXTRACTIVES kg/hr 592 0 0 592 12 0 580 0 0 580
OTHERS kg/hr 0 0 0 0 0 0 0 0 0 0
Temperature K 298 298 298 298 298 298 298 298 298 298
Pressure atm 1 1 1 1 1 1 1 1 1 1
Vapor Frac 0 0 0 0 0 0 0 0 0 0

132
Milestone Completion ReportINL/EXT-18-51655
APPENDIX L – Process Flow Diagrams and Mass Balances for Supply of Logging Residues to AHTL –
2022 ProjectionHigh-level stream table information from Aspen Plus modeling output follows, for key
streams associated with each process operation area. This is followed by high-level PFDs for the associated process areas. Space for stream tables was limited; below is a key to lumped components. As the stream table information focuses primarily on the high-level overall process and does not include every individual modeled stream within each process area, mass balance closure around a given unit area may not be 100%.
Figure L-1. High-level flowsheet showing key process areas for the forest residue blendstock in the Algae-Hydrothermal Liquefaction Pathway (AHTL) 2022 Projection.

133
Milestone Completion ReportINL/EXT-18-51655
USER2
LOADER1
USER2
CHIPPER
BIOMIN
ASH-1
BMOUT1
MC-1
DML-1ASH-2
BMOUT2
MC-2
DML-2
Figure L-2. Detailed process flow diagram for area L100 – Harvesting.
USER2
UNLOAD
USER2
TRANSPOT
BMOUT3
ASH-4
BMOUT4
MC-4
DML-4
BMOUT2
ASH-3
MC-3
DML-3
Figure L-3. Detailed process flow diagram for area L200 – Transport.

134
Milestone Completion ReportINL/EXT-18-51655
USER2
LOADER2
USER2
CONVEYR1
USER2
DRYER
USER2
GRINDER
ASH-6
BMOUT6
MC-6
DML-6ASH-7
BMOUT7
MC-7
DML-7
ASH-8
BMOUT8
MC-8
DML-8
ASH-9
MC-9
DML-9
BMOUT9
ASH-10
MC-10
DML-10
BMOUT10
USER2
CONVYER2
Figure L-4. Detailed process flow diagram for area L300 – Preprocessing – Drying & Grinding.

Milestone CompletionReport INL/EXT-18-
51655INL/
135
Table L-1. Forest residue Aspen Plus mass balances for the Algae-Hydrothermal Liquefaction Pathway (AHTL) 2022 Projection.
Component Unit BIOMIN DML-1 MC-1 BMOUT1 DML-2 MC-2 BMOUT2DML-
3MC-
3BMOUT3
DML-4
Overall Flow (moisture and dry matter)
kg/hr 17,790 0 0 17,790 623 846 16,321 0 0 16,321 0
Moisture Flow kg/hr 5,337 0 0 5,337 0 846 4,491 0 0 4,491 0
Total Flow (dry matter) kg/hr 12,453 0 0 12,453 623 0 11,830 0 0 11,830 0
C6 kg/hr 4,981 0 0 4,981 249 0 4,732 0 0 4,732 0
C5 kg/hr 3,362 0 0 3,362 168 0 3,194 0 0 3,194 0
LIGNIN kg/hr 3,362 0 0 3,362 168 0 3,194 0 0 3,194 0
ASH kg/hr 124 0 0 124 6 0 118 0 0 118 0
PROTEIN kg/hr 0 0 0 0 0 0 0 0 0 0 0
EXTRACTIVES kg/hr 623 0 0 623 31 0 592 0 0 592 0
OTHERS kg/hr 0 0 0 0 0 0 0 0 0 0 0
Temperature K 298 298 298 298 298 298 298 298 298 298 298
Pressure atm 1 1 1 1 1 1 1 1 1 1 1
Vapor Frac 0 0 0 0 0 0 0 0 0 0 0

Milestone CompletionReport INL/EXT-18-
51655INL/
136
Table L-1. Continued
Component Unit MC-4 BMOUT4 DML-5 MC-5 BMOUT5 DML-6 MC-6 BMOUT6 DML-7 MC-7
Overall Flow (moisture and dry matter)
kg/hr 0 16,321 0 0 16,321 0 0 16,321 0 0
Moisture Flow kg/hr 0 4,491 0 0 4,491 0 0 4,491 0 0
Total Flow (dry matter) kg/hr 0 11,830 0 0 11,830 0 0 11,830 0 0
C6 kg/hr 0 4,732 0 0 4,732 0 0 4,732 0 0
C5 kg/hr 0 3,194 0 0 3,194 0 0 3,194 0 0
LIGNIN kg/hr 0 3,194 0 0 3,194 0 0 3,194 0 0
ASH kg/hr 0 118 0 0 118 0 0 118 0 0
PROTEIN kg/hr 0 0 0 0 0 0 0 0 0 0
EXTRACTIVES kg/hr 0 592 0 0 592 0 0 592 0 0
OTHERS kg/hr 0 0 0 0 0 0 0 0 0 0
Temperature K 298 298 298 298 298 298 298 298 298 298
Pressure atm 1 1 1 1 1 1 1 1 1 1
Vapor Frac 0 0 0 0 0 0 0 0 0 0

Milestone CompletionReport INL/EXT-18-
51655INL/
137
Table L-1. Continued
Component Unit BMOUT7DML-
8MC-8 BMOUT8 DML-9 MC-9 BMOUT9 DML-10 MC-10 BMOUT10
Overall Flow (moisture and dry matter)
kg/hr 16,321 0 3,176 13,146 237 26 12,883 0 0 12,883
Moisture Flow kg/hr 4,491 0 3,176 1,316 0 26 1,289 0 0 1,289
Total Flow (dry matter) kg/hr 11,830 0 0 11,830 237 0 11,594 0 0 11,594
C6 kg/hr 4,732 0 0 4,732 95 0 4,637 0 0 4,637
C5 kg/hr 3,194 0 0 3,194 64 0 3,130 0 0 3,130
LIGNIN kg/hr 3,194 0 0 3,194 64 0 3,130 0 0 3,130
ASH kg/hr 118 0 0 118 2 0 116 0 0 116
PROTEIN kg/hr 0 0 0 0 0 0 0 0 0 0
EXTRACTIVES kg/hr 592 0 0 592 12 0 580 0 0 580
OTHERS kg/hr 0 0 0 0 0 0 0 0 0 0
Temperature K 298 298 298 298 298 298 298 298 298 298
Pressure atm 1 1 1 1 1 1 1 1 1 1
Vapor Frac 0 0 0 0 0 0 0 0 0 0

Milestone CompletionReport INL/EXT-18-
51655INL/
138