
Potential Indigenous Feedstock Automobile - Global Journals
97
Volume 12 | Issue 1 | Version 1.0 Online ISSN: 2249-4596 Print ISSN: 0975-5861 Potential Indigenous Feedstock Automobile: An Investigation Clean Potential Energy Two-phase Gas/Liquid-Solid
-
Upload
khangminh22 -
Category
Documents
-
view
1 -
download
0
Transcript of Potential Indigenous Feedstock Automobile - Global Journals

Volume 12 | Issue 1 | Version 1.0
Online ISSN: 2249-4596Print ISSN: 0975-5861
Potential Indigenous Feedstock
Automobile: An Investigation
Clean Potential Energy
Two-phase Gas/Liquid-Solid

Global Journal of Researches in Engineering: AMechanical and Mechanics Engineering

Open Association of Research Society
Global Journal of Researches in Engineering: AMechanical and Mechanics Engineering
Volume 12 Issue 1 (Ver. 1.0)

Global Journals Inc. (A Delaware USA Incorporation with “Good Standing”; Reg. Number: 0423089) Sponsors: Open Scientific Standards
Publisher’s Headquarters office
Global Journals Inc., Headquarters Corporate Office, Cambridge Office Center, II Canal Park, Floor No. 5th, Cambridge (Massachusetts), Pin: MA 02141 United States USA Toll Free: +001-888-839-7392 USA Toll Free Fax: +001-888-839-7392
Offset Typesetting
Packaging & Continental Dispatching Global Journals, India Find a correspondence nodal officer near you To find nodal officer of your country, please email us at [email protected]
eContacts Press Inquiries: [email protected] Investor Inquiries: [email protected] Technical Support: [email protected] Media & Releases: [email protected] Pricing (Including by Air Parcel Charges): For Authors: 22 USD (B/W) & 50 USD (Color) Yearly Subscription (Personal & Institutional): 200 USD (B/W) & 250 USD (Color)
© Global Journal of Researches in Engineering.
All rights reserved.
This is a special issue published in version 1.0 of “Global Journal of Researches in
Engineering.” By Global Journals Inc.
All articles are open access articles distributed under “Global Journal of Researches in
Engineering”
Reading License, which permits restricted use. Entire contents are copyright by of “Global
Journal of Researches in Engineering” unless otherwise noted on specific articles.
No part of this publication may be reproduced or transmitted in any form or by any means,
electronic or mechanical, including photocopy, recording, or any information
storage and retrieval system, without written permission.
The opinions and statements made in this book are those of the authors concerned. Ultraculture has not verified and neither
confirms nor denies any of the foregoing and no warranty or fitness is implied.
Engage with the contents herein at your own risk.
The use of this journal, and the terms and conditions for our providing information, is
governed by our Disclaimer, Terms and Conditions and Privacy Policy given on our
By referring / using / reading / any type of association / referencing this journal, this
signifies and you acknowledge that you have read them and that you accept and will be
bound by the terms thereof.
All information, journals, this journal, activities undertaken, materials, services and our website, terms and conditions, privacy policy, and this journal is subject to change
anytime without any prior notice.
Incorporation No.: 0423089
License No.: 42125/022010/1186
Registration No.: 430374
Import-Export Code: 1109007027
Employer Identification Number (EIN):
USA Tax ID: 98-0673427
Open Association of Research Society
Rainham, Essex, London RM13 8EUUnited Kingdom.
Open Association of Research Society, Marsh Road,
2012.
website
.
http://globaljournals.us/terms-and-condition/menu-id-1463/

Editorial Board Members (HON.)
John A. Hamilton,"Drew" Jr., Ph.D., Professor, Management Computer Science and Software Engineering Director, Information Assurance Laboratory Auburn University
Dr. Wenying FengProfessor, Department of Computing & Information Systems Department of Mathematics Trent University, Peterborough, ON Canada K9J 7B8
Dr. Henry Hexmoor IEEE senior member since 2004 Ph.D. Computer Science, University at Buffalo Department of Computer Science Southern Illinois University at Carbondale
Dr. Thomas WischgollComputer Science and Engineering, Wright State University, Dayton, Ohio B.S., M.S., Ph.D. (University of Kaiserslautern)
Dr. Osman Balci, ProfessorDepartment of Computer Science Virginia Tech, Virginia University Ph.D.and M.S.Syracuse University, Syracuse, New York M.S. and B.S. Bogazici University, Istanbul, Turkey
Dr. Abdurrahman ArslanyilmazComputer Science & Information Systems Department Youngstown State University Ph.D., Texas A&M University University of Missouri, Columbia Gazi University, Turkey
Yogita Bajpai M.Sc. (Computer Science), FICCT U.S.A.Email: [email protected]
Dr. Xiaohong He Professor of International Business University of Quinnipiac BS, Jilin Institute of Technology; MA, MS, PhD,. (University of Texas-Dallas)
Dr. T. David A. Forbes Associate Professor and Range Nutritionist Ph.D. Edinburgh University - Animal Nutrition M.S. Aberdeen University - Animal NutritionB.A. University of Dublin- Zoology
Burcin Becerik-Gerber University of Southern California Ph.D. in Civil Engineering DDes from Harvard University M.S. from University of California, Berkeley & Istanbul University

Dr. Bart Lambrecht Director of Research in Accounting and FinanceProfessor of Finance Lancaster University Management School BA (Antwerp); MPhil, MA, PhD (Cambridge)
Dr. Söhnke M. Bartram Department of Accounting and FinanceLancaster University Management SchoolPh.D. (WHU Koblenz) MBA/BBA (University of Saarbrücken)
Dr. Carlos García Pont Associate Professor of Marketing IESE Business School, University of Navarra Doctor of Philosophy (Management), Massachusetts Institute of Technology (MIT) Master in Business Administration, IESE, University of Navarra Degree in Industrial Engineering, Universitat Politècnica de Catalunya
Dr. Miguel Angel Ariño Professor of Decision Sciences IESE Business School Barcelona, Spain (Universidad de Navarra) CEIBS (China Europe International Business School). Beijing, Shanghai and Shenzhen Ph.D. in Mathematics University of Barcelona BA in Mathematics (Licenciatura) University of Barcelona
Dr. Fotini Labropulu Mathematics - Luther College University of ReginaPh.D., M.Sc. in Mathematics B.A. (Honors) in Mathematics University of Windso
Philip G. Moscoso Technology and Operations Management IESE Business School, University of Navarra Ph.D in Industrial Engineering and Management, ETH Zurich M.Sc. in Chemical Engineering, ETH Zurich
Dr. Lynn Lim Reader in Business and Marketing Roehampton University, London BCom, PGDip, MBA (Distinction), PhD, FHEA
Dr. Sanjay Dixit, M.D. Director, EP Laboratories, Philadelphia VA Medical Center Cardiovascular Medicine - Cardiac Arrhythmia Univ of Penn School of Medicine
Dr. Mihaly Mezei ASSOCIATE PROFESSOR Department of Structural and Chemical Biology, Mount Sinai School of Medical Center Ph.D., Etvs Lornd University Postdoctoral Training, New York University
Dr. Han-Xiang Deng MD., Ph.D Associate Professor and Research Department Division of Neuromuscular Medicine Davee Department of Neurology and Clinical NeuroscienceNorthwestern University Feinberg School of Medicine

Dr. Pina C. Sanelli Associate Professor of Public Health Weill Cornell Medical College Associate Attending Radiologist NewYork-Presbyterian Hospital MRI, MRA, CT, and CTA Neuroradiology and Diagnostic Radiology M.D., State University of New York at Buffalo,School of Medicine and Biomedical Sciences
Dr. Roberto Sanchez Associate Professor Department of Structural and Chemical Biology Mount Sinai School of Medicine Ph.D., The Rockefeller University Dr. Wen-Yih Sun Professor of Earth and Atmospheric SciencesPurdue University Director National Center for Typhoon and Flooding Research, Taiwan University Chair Professor Department of Atmospheric Sciences, National Central University, Chung-Li, TaiwanUniversity Chair Professor Institute of Environmental Engineering, National Chiao Tung University, Hsin-chu, Taiwan.Ph.D., MS The University of Chicago, Geophysical Sciences BS National Taiwan University, Atmospheric Sciences Associate Professor of Radiology
Dr. Michael R. Rudnick
M.D., FACP Associate Professor of Medicine Chief, Renal Electrolyte and Hypertension Division (PMC) Penn Medicine, University of Pennsylvania Presbyterian Medical Center, Philadelphia Nephrology and Internal Medicine Certified by the American Board of Internal Medicine
Dr. Bassey Benjamin Esu
B.Sc. Marketing; MBA Marketing; Ph.D Marketing Lecturer, Department of Marketing, University of Calabar Tourism Consultant, Cross River State Tourism Development Department Co-ordinator , Sustainable Tourism Initiative, Calabar, Nigeria
Dr. Aziz M. Barbar, Ph.D. IEEE Senior Member Chairperson, Department of Computer Science AUST - American University of Science & Technology Alfred Naccash Avenue – Ashrafieh

Dr. George Perry, (Neuroscientist) Dean and Professor, College of Sciences
Denham Harman Research Award (American Aging Association)
ISI Highly Cited Researcher, Iberoamerican Molecular Biology Organization
AAAS Fellow, Correspondent Member of Spanish Royal Academy of Sciences
University of Texas at San Antonio
Postdoctoral Fellow (Department of Cell Biology)
Baylor College of Medicine
Houston, Texas, United States
Dr. R.K. Dixit M.Sc., Ph.D., FICCT Chief Author, India Email: [email protected]
Vivek Dubey(HON.)
MS (Industrial Engineering),
MS (Mechanical Engineering)
University of Wisconsin, FICCT
Editor-in-Chief, USA
Er. Suyog Dixit
(M. Tech), BE (HONS. in CSE), FICCT SAP Certified Consultant CEO at IOSRD, GAOR & OSS Technical Dean, Global Journals Inc. (US) Website: www.suyogdixit.com Email:[email protected] Pritesh Rajvaidya (MS) Computer Science Department California State University BE (Computer Science), FICCT Technical Dean, USA Email: [email protected]
Sangita Dixit M.Sc., FICCT Dean & Chancellor (Asia Pacific) [email protected]
Luis Galárraga J!Research Project Leader Saarbrücken, Germany
President Editor (HON.)
Chief Author (HON.)
Dean & Editor-in-Chief (HON.)

Contents of the Volume
i. Copyright Notice
ii. Editorial Board Members
iii. Chief Author and Dean
iv. Table of Contents
v. From the Chief Editor’s Desk
vi. Research and Review Papers 1. Sclerocarya Birrea Plant Oil: A Potential Indigenous Feedstock for Biodiesel
Production in Botswana.1-6 2. Recovery of Engine Waste Heat for Reutilization in Air Conditioning System in
an Automobile: An Investigation. 7-19 3. Study of Compressed Air Storage System as Clean Potential Energy for 21st
Century. 21-33 4. Two-phase Gas/Liquid-Solid Flow Modelling in 90° Bends and Its Effect on
Erosion. 35-44 5. Experimental and Analytical Modal Analysis of Welded Structure Used For
Vibration Based Damage Identification. 45-50 6. Lean Sigma A Road to Success: A Perspective of the Indian Automobile
Industry. 51-59
vii. Auxiliary Memberships viii. Process of Submission of Research Paper ix. Preferred Author Guidelines x. Index

© 2012 Jerekias Gandure, Clever Ketlogetswe. This is a research/review paper, distributed under the terms of the Creative Commons Attribution-Noncommercial 3.0 Unported License http://creativecommons.org/licenses/by-nc/3.0/), permitting all non commercial use, distribution, and reproduction in any medium, provided the original work is properly cited.
Global Journal of researches in engineering Mechanical and mechanics engineering Volume 12 Issue 1 Version 1.0 January 2012 Type: Double Blind Peer Reviewed International Research Journal Publisher: Global Journals Inc. (USA) Online ISSN: 2249-4596 Print ISSN:0975-5861
Sclerocarya Birrea Plant Oil: A Potential Indigenous Feedstock for Biodiesel Production in Botswana
By Jerekias Gandure, Clever Ketlogetswe University of Botswana
Abstract - Exploring new feedstocks for biodiesel production is now receiving widespread attention
world-over. This paper presents experimental results on properties of celerocarya birrea plant oil. Chemical properties analysis of birrea plant oil were performed using gas chromatograph and mass spectrometer, while the engine performance tests were conducted on a variable compression ignition engine. Parameters such as fuel consumption, engine torque and engine brake power were recorded at different engine loads for pure diesel fuel and birrea plant oil. The experimental results indicate that birrea plant oil offer immense potential as both fuel and feedstock for biodiesel production. The performance characteristics of ignition compression engine using birrea plant oil indicate that the optimum compression ignition engine occurs at 60% engine load. Similarly, the results revealed that variations in specific fuel consumption recorded for diesel fuel (D100) and birrea plant oil (BPO) between 30% and
60% show no significant difference for the fuels under review.
Keywords :
Birrea plant oil, straight vegetable oil (SVO), lipid composition, properties, Botswana.
GJRE-A Classification : FOR Code: 090201
Sclerocarya Birrea Plant Oil A Potential Indigenous Feedstock for Biodiesel Production in Botswana
Strictly as per the compliance and regulations of:

Sclerocarya Birrea Plant Oil: A Potential Indigenous Feedstock for Biodiesel Production
in Botswana Jerekias Gandureα, Clever KetlogetsweΩ
Abstract - Exploring new feedstocks for biodiesel production is now receiving widespread attention world-over. This paper presents experimental results on properties of celerocarya birrea plant oil. Chemical properties analysis of birrea plant oil were performed using gas chromatograph and mass spectrometer, while the engine performance tests were conducted on a variable compression ignition engine. Parameters such as fuel consumption, engine torque and engine brake power were recorded at different engine loads for pure diesel fuel and birrea plant oil. The experimental results indicate that birrea plant oil offer immense potential as both fuel and feedstock for biodiesel production. The performance characteristics of ignition compression engine using birrea plant oil indicate that the optimum compression ignition engine occurs at 60% engine load. Similarly, the results revealed that variations in specific fuel consumption recorded for diesel fuel (D100) and birrea plant oil (BPO) between 30% and 60% show no significant difference for the fuels under review. Keywords : Birrea plant oil, straight vegetable oil (SVO), lipid composition, properties, Botswana.
I. INTRODUCTION
he quest for biofuel production in Botswana is derived from several factors including volatile oil prices, potential for job creation, fuel security and
economic diversification. The desire to establish national energy self-reliance and to develop alternatives to finite fossil fuel resources have resulted in the development of fuel technologies that are based on the use of renewable agriculture based materials as feedstocks. In the case of renewable fuels for compression ignition (diesel) engines, the majority of efforts to date have focused on biodiesel, which consists of alkyl esters of fatty acids found in agricultural acylglycerol - based fats and oils. Biodiesel can be produced from any material that contains fatty acids, whether bonded or free (Vicente et al., 2004). Consequently, different vegetable oils can be used as fuel or feedstock for biodiesel production depending on oil properties.
All vegetable oils and animal fats consist primarily of triglycerides (Srivastava and Prasad, 2000; Karmakaret al., 2010). Triglycerides have a three-
Author α Ω
: University of Botswana, Mechanical Engineering Department. Private bag 0061, Gaborone, Botswana. Tel: 00267 3554421, Fax: 00267 3952309, E-mail
backbone with a long hydrocarbon chain attached to
each of the carbons. The differences between oils from different sources relate to the length of the fatty acid chains attached to the backbone and the number of carbon–carbon double bonds on the chain. Most fatty acid chains from plant oils are 18 carbons long with between zero and three double bonds (Misra and Murthy, 2010). Fatty acid chains with no double bonds are said to be saturated
and those with double bonds
are unsaturated. The number of carbon atoms and double bonds in each of the five most common fatty acid chains found in common oils and fats are shown in Table 1.
The presence of double bonds in the fatty acid chains has a significant effect on the properties of the methyl esters (Knothe, 2005). The deformation of the molecule caused by the double bonds inhibits the growth of the crystals and this lowers the methyl ester's freezing temperature. Saturated oils and fats tend to freeze at higher temperatures. Animal fats, hydrogenated vegetable oils, and some tropical oils such as palm oil and coconut oil contain approximately 35 –
45% saturated fatty acids and may be solid at room
temperature (Misra and Murthy, 2010). Fatty acid methyl esters (FAME)
produced from such oils
may gel at
relatively high temperatures. The carbon–carbon double bonds in unsaturated oils and fats are prone to oxidation by oxygen in the air.
This effect is severe when the bonds are conjugated (two double bonds separated by two single bonds) as is the case for linoleic and linolenic acids. These fatty acids will oxidise 50–100 times faster than oleic acid with an unconjugated double bond. Saturated fatty acids are not subject to this type of oxidative attack. The choice of oil feedstock determines the resulting biodiesel's position in the trade-off between cold flow, oxidative stability, and cetane number. Fatty acid methyl esters from more saturated feedstock will have higher cetane numbers and better oxidative stability, but will have poor cold flow
properties. Fatty
acid methyl esters from oils with low levels of saturated fatty acids will have better cold flow properties, but lower cetane number and oxidative stability (Refaat, 2009).
Engine performance profile generated using a straight vegetable oil as fuel is another important property. The nature of fatty acids largely determines
T
© 2012 Global Journals Inc. (US)
Globa
l Jo
urna
l of R
esea
rche
s in E
nginee
ring
Volum
e X
II
Issu
e vvvvI V
ersion
I
1
( A)
Janu
ary
201
2
their ability to burn correctly in an engine (Aluyor et al.,

2009; Moser et al., 2009). In addition, iodine value is another important property with regards to the use of straight vegetable oil as fuel or feedstock for the production of biodiesel. The iodine value indicates the degree of unsaturation of oil (number of double and triple bonds). It corresponds to the number of grams of iodine absorbed by 100 g of oil. The more the oil is unsaturated, the higher is its iodine value. As such, low iodine value (saturated oil) is propitious to good combustion (Sidibe et al., 2010). Generally, saturated oils offer better combustion (short evaporation time, short ignition delay, fewer deposits) than unsaturated oils. Overall, quality
of combustion decreases with increase in degree of unsaturation.
Using straight vegetable oils in diesel engines is
not a new idea. Rudolf Diesel first used peanut oil as a fuel for demonstration of his newly developed compression ignition
(CI)
engine as far back as 1910 (Balat and Balat, 2008) Literature suggests that vegetable oils can substitute for mineral diesel if reduction in viscosity is achieved by blending it with diesel or by preheating. De Almeida
et al (2002) used heated palm oil as fuel in a diesel generator. The study revealed that carbon monoxide (CO)
emissions increased at higher loads. This was due to lack of oxygen at higher equivalence ratios. Palm oil nitrogen oxide (NOx)
emissions were however relatively lower than mineral diesel. Masjuki et al. (2001) used preheated palm oil to run a CI
engine. Better spray and atomization characteristics were obtained due to reduction in the viscosity of fuel due to the preheating processes. Torque, brake-power, specific fuel consumption, exhausts emissions and brake thermal efficiency were reported to be comparable to those of mineral diesel Wang et al. (2006) also performed experiment on blended vegetable oil with diesel. The authors reported higher exhaust gas temperature with very small variations in CO
emission levels and relatively low NOx
as compared to diesel.
This work evaluated chemical properties and
engine performance of birrea plant oil to assess potential for use as fuel and feedstock for biodiesel production in Botswana. Birrea tree is indigenous to most parts of Southern Africa. In Botswana, for example, it is widely distributed all over the country but concentrated in the north eastern part of the country, approximately 250 km
north east of Gaborone, Botswana’s capital city. The species then covers a huge part of the Central district and Tshapong Sub district. At maturity, the plant (tree) can grow up to approximately 10m tall with a sterm diameter of approximately 0.8 m and have several branches that bear fruits during the rainy season (October to April). However, because of limited scientific data, the age of the birrea plant (tree) from which plant oil used for this study was extracted is not covered in the present investigation.
It is the author’s view that some of these plants could be as old as 70 years and above but they still bear fruits. The tree grows
in warm and dry climatic conditions, and produce oval fruits that turn pale yellow when ready for harvesting. In Botswana the harvesting period usually starts from December to the end of March. The fruit consists of a hard woody seed covered by pulp and juice which makes the fleshy part of the fruit. The hard seed contains mostly two oil rich nuts (kernel) which can be eaten as
a snack. There is now a worldwide trend to explore wild plants for oil to augment the already existing sources of oil. The fact that the birrea tree grows in drier parts where common oil seeds cannot thrive has stirred interest in it as a valuable source of biodiesel feedstock. This has led to the evaluation of birrea nut oil as potential feedstock oil for biodiesel production. In evaluating the potential use of oil for this purpose, the fatty acid profile plays an important role.
II.
MATERIALS AND METHODS
a)
Birrea plant oil
The birrea plant oil used for the current study was purchased from Kgetsi Ya Tsie, a Community Trust located in the eastern part of the country approximately 300 km east of Gaborone City. The primary objective of the trust is to promote the
economic and social empowerment of rural women in the Tswapong Hills of Eastern part of Botswana, who extracts birrea plant oil mostly for cosmetic markets in Europe and America. Prior to the plant oil extraction processes, individuals members of the trust harvest yellow birrea fruits and manually remove the outer skin of the fruit. The hard woody seed is then dried under natural conditions for 6 to 8 weeks. The primary objective of drying the hard woody seed is to ensure that minimum force is applied on cracking the hard woody nut cover and to minimise damage of the oil rich nut. When the drying process is considered to be complete, the hard woody seeds are stored in a dry place followed by the cracking process. The cracking process is also done manually by individual members of the trust group. After cracking, the nuts are collected to a central oil pressing centre for oil extraction process.
In the present investigations birrea oil nuts from the Lerala village and communities within the out skirt of Lerala village approximately 300 km east of the Gaborone City was used to extract oil. The extracted oil was then bottled into a glass container, placed in a cooler box with ice gel and transported to the laboratory for chemical analysis as described in section
2.2.
b)
Oil characterization
The composition of birrea plant oil was analysed using the Waters GCT
premier Time of Flight (TOF)
mass spectrometer (MS)
coupled to the Agilent 6890N
gas chromatograph (GC)
system. The instrument has high sensitivity and fast acquisition rates.
In
Gl oba
l Jo
urna
l of R
esea
rche
s in E
nginee
ring
Volum
e X
II
Issu
e vvvvI V
ersion
I
2
( A)
Janu
a ry
201
2
© 2012 Global Journals Inc. (US)
Sclerocarya Birrea Plant Oil: A Potential Indigenous Feedstock for Biodiesel Production in Botswana
addition, the National Institute for Standards and Technology (NIST) developed Automated Mass Spectral Deconvolution and Identification System

(AMDIS) software package, (chemdata.nist.gov/mass-spc/amdis) was used for peak identification.
AMDIS
extracts spectra for individual components in a GC-MS
data file and identifies target compounds by matching these spectra against a reference library, in this case the NIST
library. AMDIS
also allows creation of personal libraries where routine analyses of compounds is encountered.
i.
Gas Chromatograph Conditions
1 µL
of birrea plant oil sample extract was injected into the system using an auto-injector. The injector temperature was set at 2600C
in the splitless mode. Helium was used as the carrier gas at a flow rate of 1ml/min.
Separation was achieved using a 30
meter DB5 –
MS
column. The oven temperature was kept at the initial 1000C
for 2
minutes, and then gradually increased from 1000C
to 2900C
at a rate of 100C
per minute. The total run time was approximately 35 minutes.
ii.
Mass Spectrometer Conditions
The mass spectrometer (MS)
conditions that were employed were a positive polarity of electron ionization (EI),
a source temperature of 1800C,
an emission current of 359µA.
Other MS
conditions including electron energy, resolution were set by the system auto tune function. Detection was by the micro channel plate detector (MCP)
whose voltage was set at 2700 V.
The oil composition was identified and quantified using the NIST (2005)
mass spectral library using a combination of the Masslynx acquisition /data analysis software and the AMDIS
by NIST.
c)
Engine performance analysis
The engine performance test was conducted on a TD43F
engine test rig. The test rig is water cooled, four-stroke diesel engine that is directly coupled to an electrical dynamometer. In addition to the conventional engine design, the engine incorporates variable compression design feature which allows the compression ratio to be varied from 5:1 to 18:1.
To establish that engine operating conditions were reproduced consistently as any deviation could exert an overriding influence on performance and emissions results, the reproducibility of the dynamometer speed control set points were maintained within ± 0.067 Hz
of the desired engine speed. The experimental work began with engine run on pure diesel fuel. This was done to determine the engine’s operating parameters which constitute the baseline that was compared with the subsequent case when the birrea plant oil was used as fuel. At the
point of fuel change, the fuel lines were cleaned with pure diesel fuel and engine left to operate with the fuel under test for approximately 15 minutes to stabilise at its new condition before readings were recorded.
III.
RESULTS AND DISCUSSIONS
a)
Birrea plant oil characterization
Five birrea plant oil samples were tested to establish the chemical composition present. This was done by injecting oil sample into the GC-MS system in quantities and procedure specified in Section 2.2 in a systematic study. A reference sample prepared by AccuStandards was used to calibrate the equipment. The Fatty Acids detected from the five birrea oil samples were largely similar. For simplicity, average concentration levels of fatty acids detected are presented in table 2. Table 2 also shows a number of fatty acids recorded in birrea plant oil which were not present in the reference sample.
The Fatty Acid profile of birrea plant oil indicates a range of fatty acids and esters, the majority of which were not found in the reference sample. The observation may be attributed to the uniqueness of this indigenous and unknown plant oil. Olein 2-mono and Olein 1-mono fatty acids were identified as geometrical isomers of the same compound. Oleic acid, 3-hydroxypropyl ester is very unique in that it is not found on the NIST
library and has generated a lot of interest to the authors for further research work. The fatty acid that was detected to be most abundant is Trans-Oleic acid but could not be quantified because of its absence from the
reference sample. The second highest peak detected is for Ethyl oleate (ethyl ester). Other compounds had substantial presence which could improve if concentrated through processing. The composition of birrea oil recorded in this analysis is largely consistent with results obtained by other researchers (Burger et al., 1987). As discussed in Section 1, the fatty acid parameters that have the greatest impact on fuel properties are the average chain length and the degree of unsaturation. To a large extend, fuel properties improve in quality with increase in carbon chain length and decrease as the number of double bonds increase, except cold flow properties. According to Knothe (2005), the optimal fatty acid profile that provides optimal fuel properties with relatively less adverse impact on the environmental is
a mixture consisting of methyl oleates, esters derived from palmitic, oleic, and decanoic acids. The fatty acid mixture of birrea plant oil presented in table 2 is largely composed of these desirable compounds, depicting characteristics of a good fuel. This stimulated the need to perform thermal performance of birrea plant oil as fuel on a variable compression ignition engine. The performance results are presented and discussed in Section 3.2.
b)
Engine performance analysis
Sclerocarya Birrea Plant Oil: A Potential Indigenous Feedstock for Biodiesel Production in Botswana
Globa
l Jo
urna
l of R
esea
rche
s in E
nginee
ring
Volum
e X
II
Issu
e vvvvI V
ersion
I
3
( A)
Janu
ary
201
2
© 2012 Global Journals Inc. (US)
Prior to using birrea plant oil as fuel in the compression ignition engine, the oil was neutralised using sodium hydroxide in order to minimize the possible effects of corrosion on engine parts. The oil was also filtered to eliminate possible presence of suspended matter that could form carbon deposits in

the engine during combustion. The birrea plant oil was then used to power a variable compression ignition engine to test the engine performance of the fuel. Engine performance tests were conducted for compression ratios 13:1
through 17:1.
To enable the main findings of the study to be identified clearly, only performance results for compression ratio 16:1
are presented in Section 3.2.1.
The results were compared with the results for pure diesel fuel of boiling point 422 K, vapor pressure of 53
Pa, density of 860 Kg m-3
and cetane number of 48. The comparison was done on the basis of engine torque, engine brake power, and specific fuel consumption as mentioned earlier.
The experimental data were collected as discussed in section 2.3, leading to the results presented in figure 1.
i.
Engine Performance Results
Typical results for the variation of the engine torque, brake power and specific fuel consumption for birrea plant oil and pure diesel fuel
for different engine load settings are shown in Figure 1.
There are several clear findings to be drawn from the data presented in figure 1(a)
to (c).
Firstly, the results indicate that the engine torque, brake power, and specific fuel consumption recorded
for D100
and BPO
for operation condition (compression ratio 16:1) compares favourably well. The data in figure 1(a) shows a steady increase in engine torque for both D100
and BPO
with increase in engine load between 30
and 60%. However within the same operating window, BPO
recoded relatively high engine torque compared with D100. However, it is clear from the data presented in figure 1(a) that as the engine load increase from 60% the data recorded for D100
shows a steady increase in engine torque while the
data for BPO
shows a slight decrease with increase in engine load.
The results in figures 1(b)
and (c)
also demonstrate that the data recorded for BPO
compares favourably well with that for D100. The maximum variation in brake power of 0.63W
was recorded
at 90% engine load, while the minimum variation of 0.06W
was recorded at 60%
of engine load, with D100
recording 5.06W.
The trends shown in figure 1(b) suggests that the optimum compression ignition engine performance using birrea plant oil occurs at 60%
engine load. The data shown in figure 1(c)
reinforces this observation, which shows the specific fuel consumption recorded for D100
and BPO.
One of the most discernible trends connected to figure 1(c)
is that the variations in specific fuel consumption recorded for D100 and
BPO between 30%
and 60% do not show any significant difference for the fuels under review. The minimum variation of specific fuel consumption between 30%
and 60%
engine load is 0.01g/kWh, while a maximum of 0.17g/kWh
was recorded at the engine load of 90%. Overall, the results in figure 1 indicate that birrea plant oil is a potential fuel. The relationship between fatty acid profile and engine performance analysis results of birrea plant oil indicates
potential of converting the same plant oil into quality biodiesel.
IV.
CONCLUSIONS
An experimental study to examine the profile of free fatty acids found in birrea plant oil and compared against those found in the reference sample has been described. The study also carried comparative tests using B100 and D100 to assess the engine performance. From the experimental results, it can now be concluded that.
a)
Birrea plant oil has properties that can enable it to function as a biofuel in IC
diesel engines. This implies that transesterifying birrea plant
oil under standard conditions may produce biodiesel of international biodiesel quality standards.
b)
Trans-Oleic acid is the major fatty acid in birrea pant oil and is not found in reference sample prepared by AccuStandard. This suggests that further investigations on the compositionsition of the same fatty acid need to be carried out. The second most abundant free fatty acid detected was Ethyl Oleate which is an ethyl ester. Other free fatty acids detected are Oleic acid, 3-hydroxypropyl ester, Palmitic acid
(methyl ester), Palmitic acid (ethyl ester), suggesting that the oil has strong characteristics required for biodiesel feedstock.
c)
The results prove that the performance of IC
diesel engine using birrea plant oil is close to pure diesel fuel suggesting that such oil is a potential indigenous feedstock for biodiesel production in Botswana.
ACKNOWLEDGEMENTS
We acknowledge support of the University of Botswana, and the Ministry of Wildlife, Tourism and Environment who granted a research permit for this work.
REFERENCES
REFERENCES
REFERENCIAS
1.
Aluyor, E.O., Obahiagbon, K.O., Ori-jesu, M., 2009.
Biodegradation of vegetable oils: A review.
Scientific Research and Essay. 4 (6), 543-548.
Sclerocarya Birrea Plant Oil: A Potential Indigenous Feedstock for Biodiesel Production in BotswanaGl oba
l Jo
urna
l of R
esea
rche
s in E
nginee
ring
Volum
e X
II
Issu
e vvvvI V
ersion
I
4
( A)
Janu
a ry
201
2
© 2012 Global Journals Inc. (US)
2. Balat, M., Balat, H., 2008. A critical review of biodiesel as a vehicular fuel. Energy conversion and management. 19 (10), 2727-2741.14].
3. Burger, A.E.C., de Villiers, J.B.M., du Plessis, L.M., 1987. Composition of the kernel oil and protein of the marula seed. South African Journal of Science .83, 733-735.
4. De Almeida, S.C.A., Belchior, C.R., Nascimento, M.V.G., Vieira, L.D.S.R., Fleury, G., 2002. Performance of a diesel generator fuelled with palm oil. Fuel. 81 (16), 2097–2102.

5.
Karmakar, A.,
Karmakar, S.,
Mukherjee, S., 2010.
Properties of various plants and animals feedstocks for biodiesel production.
Bioresource Technology.
101 (19), 7201-7210.
6.
Knothe, G., 2005. Dependence of biodiesel fuel properties on the structure of fatty acid alkyl esters. Fuel Process Technology. 86, 1059-1070.
7.
Masjuki, H. H., Kalam, M.A., Maleque, M.A., Kubo, A., Nonaka, T., 2001. Performance, emissions and wear characteristics of an I.D.I diesel engine using coconut blended oil. Journal of Automobile Engineering. 3,
393 -
404.
8.
Misra, R. D., Murthy, M. S., 2010. Straight vegetable oils usage in a compression ignition engine -
A review. Renewable and Sustainable Energy Reviews.14 (9), 3005-3013.
9.
Moser, B. R., Williams, A., Haas, M.J., McCormick, R. L., 2009. Exhaust emissions and fuel properties of partially hydrogenated soybean oil methyl esters blended with ultra low sulfur diesel fuel. Fuel Process Technology. 90, 1122–1128.
Sclerocarya Birrea Plant Oil: A Potential Indigenous Feedstock for Biodiesel Production in Botswana
Globa
l Jo
urna
l of R
esea
rche
s in E
nginee
ring
Volum
e X
II
Issu
e vvvvI V
ersion
I
5
( A)
Janu
ary
201
2
© 2012 Global Journals Inc. (US)
10. Refaat, A. A., 2009. Correlation between the chemical structure of biodiesel and its physical properties. Int. J. Environ. Sci. Tech. 6 (4), 677-694.
11. Sidibe, S.S., Blin, J., Vaitilingom, G., Azoumah, Y., 2010. Use of crude filtered vegetable oil as a fuel in diesel engines state of the art: Literature review. Renewable and Sustainable Energy Reviews. 14(9), 2748-2759.
12. Srivastava, A., Prasad, R., 2000. Triglycerides-based diesel fuels. Renewable and Sustainable Energy Reviews. 4, 111-133.
13. Vicente, G., Martinez, M., Aracil, J., 2004. Integrated biodiesel production: a comparison of different homogeneous catalysts systems. Bioresource Technology. 92, 297–305.
14. Wang, Y.D., Al-Shemmeri, T., Eames, P., McMullan, J., Hewitt, N., Huang, Y., et al., 2006. An experimental investigation of the performance and gaseous exhaust emissions of a diesel engine using blends of a vegetable oil. Appl. Thermal Eng. 26, 1684–1691.
Tables
Table 1 : Fatty acid composition for common oils (% by weight)
Palmitic acid Stearic acid Oleic acid Linoleic acid Linolenic acidNumber of carbons 16 18 18 18 18Number of double bonds 0 0 1 2 3Soybean 8 4 25 55 8Canola 4 2 60 22 12Olive oil 10 2 78 10 TracePalm oil 44 5 40 10 TraceRapeseed oil 3 1 13 14 10Mustard oil 4 2 24 21 10
Source: Misra, 2010.
No. Fatty acid detected Status Concentration (in standard mixture) (mg m-3)
1 Palmitic acid No -2 Palmitic acid (ethyl ester) Yes 1153 Palmitic acid (methyl ester) Yes 17.44 12-Octadecanoic acid No -5 Trans-Oleic acid No -6 Stearic acid No -7 Ethyl Oleate (Ethyl ester) Yes 223.58 Oleic acid, 3-hydroxypropyl ester No -9 Olein, 2-mono No -10 Olein, 1-mono No -
Table 2 : Birrea plant oil fatty acid profile

Sclerocarya Birrea Plant Oil: A Potential Indigenous Feedstock for Biodiesel Production in BotswanaGl oba
l Jo
urna
l of R
esea
rche
s in E
nginee
ring
Volum
e X
II
Issu
e vvvvI V
ersion
I
6
( A)
Janu
a ry
201
2
© 2012 Global Journals Inc. (US)
Figure 1 : Typical engine performance for birrea plant oil and petrodiesel fuel for different engine load settings.
Figures
(a) Engine Torque (Nm) (b) Brake power (W)
(c) Specific fuel consumption (g/kWh)
Legend: BPO = Birrea plant oil; D100 = 100% Petrodiesel
15
17
19
21
23
25
27
29
20 30 40 50 60 70 80 90 100
Eng
ine
Torq
ue (N
m)
Load (%)
BPO D100
2
3
4
5
6
7
20 30 40 50 60 70 80 90 100
Bra
ke P
ower
(W)
Load (%)
BPO D100
0.3
0.4
0.5
0.6
0.7
0.8
0.9
20 30 40 50 60 70 80 90 100
Spe
cific
Fue
l Con
sum
ptio
n (g
/kW
h)
Load (%)BPO D100

© 2012 Abhilash Pathania, Dalgobind Mahto. This is a research/review paper, distributed under the terms of the Creative Commons Attribution-Noncommercial 3.0 Unported License http://creativecommons.org/licenses/by-nc/3.0/), permitting all non commercial use, distribution, and reproduction in any medium, provided the original work is properly cited.
Recovery of Engine Waste Heat for Reutilization in Air Conditioning System in an Automobile: An Investigation
By Abhilash Pathania,
Dalgobind Mahto
Shoolini University, Solan, Himachal Pradesh, India
Abstract -
With the rapid changing environment and atmospheric effect, the air conditioning of the moving vehicle has become a necessity. In the same time consumers are incapable to bear the increasing operating cost of the vehicles due to continuous raise in fuel prices, component costs and maintenance costs associated with vehicles. More recently, several new philosophies for manufacturing improvement have been developed and implemented in various sectors, be it manufacturing, service or other. Keep in mind in this paper, an exploration has been done to research the possibility of waste heat recovery and its subsequent utilization in air conditioning system of a vehicle without increasing the component cost, weight, number of component and bring improvement in vehicle by making luxurious.
Keywords :
Waste Engine Heat, Air Conditioning System, VCRS, VARS.
GJRE-A Classification
: FOR Code: 090299, 091502
Recovery of Engine Waste Heat for Reutilization in Air Conditioning System in an Automobile An Investigation
Strictly as per the compliance and regulations of:
Global Journal of researches in engineeringMechanical and mechanics engineeringVolume 12 Issue 1 Version 1.0 January 2012Type: Double Blind Peer Reviewed International Research JournalPublisher: Global Journals Inc. (USA)Online ISSN: 2249-4596 Print ISSN:0975-5861
Recovery of Engine Waste Heat for Reutilization in Air Conditioning System in an Automobile: An
Investigation Abhilash Pathania α, Dalgobind Mahto Ω
Abstract - With the rapid changing environment and atmospheric effect, the air conditioning of the moving vehicle has become a necessity. In the same time consumers are incapable to bear the increasing operating cost of the vehicles due to continuous raise in fuel prices, component costs and maintenance costs associated with vehicles. More recently, several new philosophies for manufacturing improvement have been developed and implemented in various sectors, be it manufacturing, service or other. Keep in mind in this paper, an exploration has been done to research the possibility of waste heat recovery and its subsequent utilization in air conditioning system of a vehicle without increasing the component cost, weight, number of component and bring improvement in vehicle by making luxurious. Keywords : Waste Engine Heat, Air Conditioning System, VCRS, VARS.
I. INTRODUCTION
ndustries are vying for various tools and techniques for competitive advantage over the competitors in an ever-changing global market by combining factors
like quality, cost, flexibility, responsiveness, and innovation. In today’s global market, there is constantly increasing pressure to make products more quickly, with more variety, at the lowest possible cost. In the end, those companies that meet and exceed customers’ demands will succeed by remaining competitive. Then, the question is, how do companies become competitive and retain their competitiveness? This question may not be easy to answer because manufacturing systems are complex, and simple solutions to manufacturing problems may not exist. Therefore, companies must choose from available techniques to develop their own solutions in the existing products to attract the customers in their fold without adding extra cost.
With the rapid changing environment and atmospheric effect, the air conditioning of the moving vehicle has become a necessity. Air conditioning of a vehicle can be done by Vapour Compression Refrigeration System (hereinafter VCRS) and Vapour Absorption
Refrigeration
System (hereinafter VARS).
Author α
:
Asst. Professor, Department of Mechanical Engineering, Shoolini University, Solan, Himachal Pradesh, India.
Email :
Author Ω
: Professor, Department of Mechanical Engineering, Green Hills Engineering College, Solan, Himachal Pradesh, India.
Email :
Presently, in the vehicles VCRS is in use in most of the cases. In lieu of VCRS, if, VARS is used in vehicles the refrigeration system could be operable in a vehicle without adding running cost for air conditioning.
There is a great impact on the running cost of a vehicle due to increasing cost of fuel. The A/C system adds nearly 35 % extra cost in fuel expenses. Alternately, it is a matter of investigation that waste recovery of an engine for application in A/C can reduce the fuel economy of vehicles to what maximum extent? It has been revealed that there is great potential to reduce A/C fuel consumption because A/C systems have traditionally been designed to maximize capacity, not efficiency. From the reviews of various literatures there is an indication that reducing the A/C load decreases A/C fuel consumption. In the same line, an automobile engine utilizes only about 35% of available energy and rests are lost to cooling and exhaust system. If one is adding conventional air conditioning system to automobile, it further utilizes about 5% of the total energy. Therefore automobile becomes costlier, uneconomical and less efficient. Additional of conventional air conditioner in car also decreases the life of engine and increases the fuel consumption. For very small cars compressor needs 3 to 4 bhp, a significant ratio of the power output. Keeping these problems in mind, a car air conditioning system is proposed from recovery of engine waste heat using radiator water as source / generator for VARS.
a) Vapour Compression Refrigeration System Heat flows naturally from a hot to a colder body.
But, in refrigeration system there is opposite phenomena i.e. heat flows from a cold to a hotter body. This is achieved by using a substance called a refrigerant. The refrigerant absorbs heat and hence evaporates at a low pressure to form a gas. This gas is then compressed to a higher pressure, such that it transfers the heat it has gained to ambient air or water and turns back (condenses) into a liquid. Thus, heat is absorbed, or removed, from a low temperature source and transferred to a higher temperature source.
The refrigeration cycle can be broken down into the following stages (ref. Figure 1):
I
Globa
l Jo
urna
l of R
esea
rche
s in E
nginee
ring
Volum
e X
II
Issu
e vvvvI V
ersion
I
7
( A)
Janu
ary
201
2
© 2012 Global Journals Inc. (US)
• 1 – 2, Low pressure liquid refrigerant in the evaporator absorbs heat from its surroundings,

usually air, water or some other process liquid. During this process it changes its state from a liquid to a gas, and at the evaporator exit is slightly superheated.
•
2 –
3, The superheated vapour enters the compressor where its pressure is raised. There will also be a big increase in temperature, because a proportion of the energy input into the compression process is transferred to the refrigerant.
•
3 –
4, The high pressure superheated gas passes from the compressor into the condenser. The initial
part of the cooling process (3 -
3a) de super heats the gas before it is then turned back into liquid (3a -
3b). The cooling for this process
is usually achieved by using air or water. A further reduction in temperature happens in the pipe work and liquid receiver (3b -
4); so that the refrigerant liquid is sub-cooled as it enters the expansion device.
•
4 –
1 The high-pressure sub-cooled liquid passes through the expansion device, which both reduces its pressure and controls the flow into the evaporator.
Fig. 1
: Schematic diagram of a Basic Vapour Compression Refrigeration System
It can be observed that the condenser has to be capable of rejecting the combined heat inputs of the evaporator and the compressor; i.e. (1 –
2) + (2 –
3) has to be the same as (3 –
4). There is no
heat loss or gain through the expansion device. The existing refrigeration system in a vehicle is shown diagrammatically
in figure 2
Recovery of Engine Waste Heat for Reutilization in Air Conditioning System in an Automobile: An Investigation
Gl oba
l Jo
urna
l of R
esea
rche
s in E
nginee
ring
Volum
e X
II
Issu
e vvvvI V
ersion
I
8
( A)
Janu
a ry
201
2
© 2012 Global Journals Inc. (US)
Fig. 2 : Existing Refregiration system in automobiles

b)
Absorption Cooling Systems; a brief
Absorption is the process of attracting and holding moisture by substances called desiccants. Desiccants are sorbents, i.e., materials that have an ability to attract and hold other gases or liquids, which have a particular affinity for water. During absorption the desiccant undergoes a chemical change as it takes on moisture, as for example the table salt, which changes from a solid to a liquid as
it absorbs moisture. The characteristic of the binding of desiccants to moisture makes the desiccants very useful in chemical separation processes.
Ammonia-water combination possesses most of the desirable qualities which are listed below:
•
1m3
of water absorbs 800m3
of ammonia (NH3).
•
Latent heat of ammonia at-15ᴼC = 1314 kJ/kg.
•
Critical temperature of NH3
= 132.6ᴼC.
•
Boiling point at atmospheric pressure = -33.3ᴼC
The NH3-H2O
system requires generator temperatures in the range of 125°C to 170°C
with air-cooled absorber and condenser and 80°C
to 120°C
when water-cooling is used. These temperatures cannot be obtained with flat-plate collectors. The coefficient of performance (COP),
which is defined as the ratio of the cooling effect to the heat input, is between 0.6
to 0.7.
Ammonia is highly soluble in water and this ensures low solution circulation rates. Both constituents are obtainable at minimal cost. The choice of Ammonia-water combination is not made without considering certain disadvantages: ammonia attacks copper and its
alloys when it has been hydrated. Therefore, all components are made from mild steel or stainless steel.
c)
Engine Cooling System
The cooling system on liquid-cooled cars circulates a fluid through pipes and passageways in the engine. Temperatures in the combustion chamber of the engine can reach 4,500 F (2,500 C),
so cooling the area around the cylinders is critical. As this liquid passes through the hot engine it absorbs heat, cooling the engine. After the fluid leaves the engine, it passes through a heat exchanger, or radiator, which transfers the heat from the fluid to the air blowing through the exchanger. The engine in your car runs best at a fairly high temperature. When the engine is cold, components wear out faster, and the engine is less efficient and emits more pollution. So another important job of the cooling system is to allow the engine to heat up as quickly as possible, and then to keep the engine at a constant temperature. To handle this heat load, it may be necessary for the
cooling system in some engines to circulate 4,000
to 10,000 gallons of coolant per hour. The water passages, the size of the pump and radiator, and other details are designed as to maintain the working parts of the engine at the most efficient temperature
within the limitation imposed by the coolant. The fluid that most cars use is a mixture of water and ethylene glycol (C2H6O2), also known as antifreeze. By adding ethylene glycol to water, the boiling and freezing points are improved significantly.
The finding of the condition of coolant and temperature is shown the table 1.
Recovery of Engine Waste Heat for Reutilization in Air Conditioning System in an Automobile: An Investigation
Globa
l Jo
urna
l of R
esea
rche
s in E
nginee
ring
Volum
e X
II
Issu
e vvvvI V
ersion
I
9
( A)
Janu
ary
201
2
© 2012 Global Journals Inc. (US)
Table 1 : Condition of coolant and temperature
Condition of Coolant Pure Water 50/50, C2H6O2 / Water 70/30, C2H6O2 / Water
Freezing Point 0 C / 32 F -37 C / -35 F -55 C / -67 F
Boiling Point 100 C / 212 F 106 C / 223 F 113 C / 235 F
Normally water boils at 212°F. However, for every pound of pressure increase, the boiling point increases by 3°F. The temperature of the coolant can sometimes reach 250 to 275ᴼF (121 to 135ᴼC). Even with ethylene glycol added, these temperatures would boil the coolant, so something additional must be done to raise its boiling point. Typical radiator cap pressure is 12to 16 psi. This raises the boiling point of the engine coolant to about 250°F to 260°F. Many surfaces inside the water jackets can be above 212°F.
d) Comparison between Vapour Compression and Absorption system
A comparative study has been conducted between Vapour Compression and Absorption system. The salient findings are enumerated below in table 2

Recovery of Engine Waste Heat for Reutilization in Air Conditioning System in an Automobile: An Investigation
Gl oba
l Jo
urna
l of R
esea
rche
s in E
nginee
ring
Volum
e X
II
Issu
e vvvvI V
ersion
I
10
( A)
Janu
a ry
201
2
© 2012 Global Journals Inc. (US)
Table 2 : Comparison between Vapour Compression and Absorption system
S.No. Absorption System Compression System1 Uses low grade energy like heat. Therefore,
may be worked on exhaust systems from I.C engines, etc.
Using high-grade energy like mechanical work.
2 Moving parts are only in the pump, which is a small element of the system. Hence operation
is smooth.
Moving parts are in the compressor.Therefore, more wear, tear and noise.
3 The system can work on lower evaporator pressures also without affecting the COP.
The COP decreases considerably with decrease in evaporator pressure.
4 No effect of reducing the load on performance Performance is adversely affected at partial loads.
5 Liquid traces of refrigerant present in piping at the exit of evaporator
Liquid traces in suction line may damage the compressor
6 Automatic operation for controlling the capacity is easy.
It is difficult.
II. OBJECTIVES OF THE STUDY
The objectives of the study on the subject “Recovery of engine waste heat for reutilization in air conditioning system in an automobile: An investigation”are as follows
1. Identify the form of “muda” (waste) in traditional VCRS.
2. Compare the key characteristics of traditional VCRSand proposed VARS
3. Differentiate between existing refrigeration cost and proposed target cost
4. Identify data and tools useful for planning and assessing strategies for leadership in refrigeration quality in vehicle by use of SWOT analysis.
III. SCOPE OF THE WORK
Our scope of work is confined and limited to the study of VARS in lieu of VCRS through recovery of engine waste heat using radiator water as source / generator for VARS. The arrangement of various components of air conditioning system is also a challenge because of the fix size of cars. However, the dsigning aspects will be given due consideration after intial exeperimentation. In the proposed model condenser and evaporator will be arranged same as the conventional unit.
IV. REVIEW OF LITERATURES
There are various works available on the Adsorption cooling with exhaust gas heat of engine. But, no significant wok has been carried out by recovering and utilizing Engine heat in refrigeration system of a vehicle.
According to Palm [1], Corberan et al.[2], Domanski and Yashar,[3]) ,most HFC refrigerants have
a relatively high global warming potential (GWP) which is also being regulated by the Kyoto Protocol. They have cited that recent passage of legislation in the European Community requires the use of refrigerants with GWPs of less than 150 in all new-type vehicles starting in 2011 and in all new vehicles by 2017
Recently, Sami et al. [4] presented an improved dynamic model to study the single absorber and/or double absorber systems with heat recovery. The systems they studied employed an air cooled evaporator and an air cooled condenser. Hot oil, superheated steam or exhaust gas could be used as heating fluids for the absorbers. In these respects, they are similar to the automobile waste heat cooling system we propose. And it gave an insight into the thermodynamics for some of the system components. However, in their analysis, the cycle time was quite long and an equilibrium adsorption state was assumed.
Colbourne [5] summarized a study analyzing over 50 published technical documents comparing the performance of fluorinated refrigerants and HCs. A significantly higher number of tests showed an increase in performance when using HCs as compared to using fluorinated refrigerants (Colbourne and Suen,)[6].Similarly, Colbourne and Ritter[7] investigated the compatibility of non-metallic materials with HCrefrigerant and lubricant mixtures. They performed experiments in compliance with European standards for the testing of elastomeric materials and ASHRAEmaterial compatibility test standards.
Maclaine-Cross and Leonardi[8] compared the refrigerant performance of HCs based on refrigerant properties and concluded that the COP improvements, commonly reported in literature, were consistent with better thermodynamic properties of HCs. R600a properties and their influences on system performance were discussed. Joudi et al. [9] studied the performance

of MAC
systems with alternative refrigerants. A computer model was developed to determine the most suitable alternative refrigerant to R12. The influence of
evaporating temperature, condensing temperature and compressor speed in an ideal cycle was considered.
Ghodbane [10]
investigated the use of R152a and HCs
in MACs. Based on thermo physical data. He has proposed a quantitative analysis of MACs
with flammable refrigerants. Razmovski [11] and Rajasekariah [12] experimentally evaluated possible ignition sources in a car by connecting a welding torch to a HC
refrigerant cylinder.
The basic adsorption cycle [13-15] has a theoretical coefficient of performance of
about 0.5. Meunier [16] showed that the performance of an ideal regenerative cycle with an infinite number of cascades can be as high as 1.85, about 68% of the ideal Carnot COP.
These researches are very significant in improving the market competitiveness
of commercial adsorption cooling/heating machines.
Zhu et al. [17] measured the cooling capacity of a cooling element of a fishing boat diesel engine waste heat chiller and the temperature variation of the adsorbent bed. Their study was purely experimental and no numerical analysis was presented. Suzuki [18] theoretically studied the effects of UA
(overall heat transfer coefficient) on SCP
of a passenger car waste heat adsorption air conditioning system; however, no details were outlined with respect to the effects of other parameters which play equal important roles in adsorption refrigeration. However, in the case of automobile waste heat cooling, mechanical simplicity and high reliability will prevail on efficiency. And the waste heat recovery cannot affect the mechanical energy output from the engine. So a two-bed basic
Recovery of Engine Waste Heat for Reutilization in Air Conditioning System in an Automobile: An Investigation
zeolite-water adsorption cycle is considered in this study. The feasibility of adsorption cooling for automobile/engine waste heat recovery was studied before [17, 18]. However, information on its dynamic performance, which is necessary for the design and optimization of the system, is insufficient.
The SL refrigeration systems are frequently used in industrial refrigeration and commercial comfort cooling and are also known as ‘‘Liquid-Chilling Systems’’ (ASHRAE) [19]. As with all the reviewed refrigerants, the environmental properties are far superior to that of R134a. R600a is in the safety classification A3 by the ASHRAE Standard 34[20], meaning that it is highly flammable and has a lower flammability limit (LFL) of 1.7 vol. %, which makes it the easiest to ignite among the reviewed refrigerants. The minimum ignition energy (MIE) needed is 0.25 mJ. The acute toxicity exposure limit (ATEL), a measure of the toxicity of a refrigerant, is 25,000 ppm and therewith the lowest of the reviewed refrigerants. The acute toxicity exposure limit (ATEL) is a value used by ASHRAE
Standard 34[20] and ISO 817[21] to establish the maximum refrigerant concentration limit for a refrigerant in air.
Granryd [22] and Corberan et al. [2] summarized the environmental safety considerations and standards applied for the safe use of flammable refrigerants. Both ASHRAE Standard 34[20] and European standard prEN378 [23] classify refrigerants in three classes 1–3, where Class 1 is used for non-flammable fluids and Class 3 for highly flammable fluids. The group of Class 3 refrigerants, which includes the HCs, is limited in use for industrial applications in the USA and France. Several standards allow the use of HCs without restrictions, if the charge amount is less than 0.15 kg in hermetically sealed and safely designed systems. As a result, the use of HCs in household refrigerators, freezers and small heat pumps has increased in European countries. Furthermore, Granryd[22] compared the performance of HCs, such as R600a and R290 and their mixtures to the well Colbourne [5] summarized a study analyzing over 50 published technical documents comparing the performance of fluorinated refrigerants and HCs. A significantly higher number of tests showed an increase in performance when using HCs as compared to using fluorinated refrigerants (Colbourne and Suen)[6].
The average improvements from using HCswere 6.0% for domestic refrigeration applications, 15.0% for commercial refrigeration applications, 8.8% for air conditioning and 9.6% for heat pumping Colbourne and Ritter[7] investigated the compatibility of non-metallic materials with HC refrigerant and lubricant mixtures. Experiments were performed in compliance with European standards for the testing of elastomeric materials and ASHRAE material compatibility test standards. Test results were presented for swell rates, hardness rating, mass changes and the change of tensile strength. In a study about HC refrigerant leakages in car passenger compartments, Maclaine-Cross [8] referred to the report made by European company (Arthur D. Little Ltd), who noted that serious injury to occupants through use of flammable refrigerant would only be possible if the car crashed, due to overpressure in the compartment after a fatigue damage of the liquid line.
Ritter and Colbourne further [7] published a review on HC risk assessment from 1991 to 1998. The use of background risks as a basis for comparison of the risk of fire with HC was presented. A report from Dieckmann et al [24] for the U.S. Department of Energy was reviewed, which assessed the risk of using flammable refrigerants in MACs. Field data from car crashes and car fires was used as basis for the analysis. A similar risk assessment, performed by Elbers and Verwoerd [25], considered an R290 heat pump system used for residential heating. To provide a context for
Globa
l Jo
urna
l of R
esea
rche
s in E
nginee
ring
Volum
e X
II
Issu
e vvvvI V
ersion
I
11
( A)
Janu
ary
201
2
© 2012 Global Journals Inc. (US)

Jetter et al. [26] used a fault tree analysis to estimate the number of refrigerant exposures of automotive service technicians and vehicle occupants in the USA.
A quantitative risk assessment model was developed by Colbourne and Suen [27] to examine the influence of design, installation of equipment and external conditions on the frequency of ignition and the associated consequences for indoor refrigeration and air-conditioning units using HC
refrigerants. Safety testing of domestic refrigerators was conducted by Gigiel [28] based on the current international standard EN/ IEC 60335-2-24 (2001).
The single-phase secondary refrigerant can be divided into two categories, aqueous and non-aqueous solution (Ure, [29] Ubaldo [30]).
Melinder [31] reported the performance of aqueous secondary fluids and non-aqueous secondary fluids for indirect systems. Compared to all the water solutions, the non-aqueous fluids such as diethylbenzene mixtures, hydrocarbon mixtures, hydrofluoroether, polydimethylsiloxan require a much larger volume flow rate under the same refrigeration capacity and temperature change. Ure [29, 32] ascertained several requirements that any secondary refrigerants must satisfy:
•
low viscosity
•
high specific heat
•
good thermal conductivity
•
good chemical corrosion inhibiting
•
chemically stable, no separation or degrading
•
non-toxic
•
non-flammable
Recovery of Engine Waste Heat for Reutilization in Air Conditioning System in an Automobile: An Investigation
these safety estimates, Ritter and Colbourne [7] presented estimations of so-called background Risks
• food grade for food refrigerationNumerous authors presented experimental and
simulation results on fundamental research of ice slurries in terms of ice particle shape and growth behaviour ( Kauffeld et al., [33]; Okawa et al.,[34]; Sari et al., [35]), physical properties (Hansen et al.,[36]; Inaba, [37]; Meewisse and Ferreira,[38] and fluid dynamics (Ayel et al.,[39]; Jensen et al., [40]; Kitanovski and Poredos, [41]). Kauffeld et al. [42] published a handbook of ice slurries in 2005 as well. The main disadvantage of CO2 appeared to be the relatively low critical temperature and the availability of components (Hinde et al.)[43]. A few applications, which utilize CO2as a volatile secondary refrigerant, have been implemented in low-temperature application (Melinder, [44]; Pachai, [45]; Pearson, [46]).
Palm [1] reported that HC producers listed the compressor manufactures whose compressors are compatible for HCs. Janssen and Beks[40] evaluated hermetic compressor performances when changing from R12 to a HC mixture of R600a and R290.Corberan et al.[5] investigated the performance of a positive displacement hermetic refrigerant piston compressor
working with R290 as refrigerant. Cooling capacity of R22 compressor that was switched to R290 was lowered to an amount ranging from 13 to 19%. On the other hand, the COP of the system increased from 2 to 6%.Devotta and Sawant [47] carried out the life cycle test of the hermetic compressor with R12, R134a, R410A and various HCs. They found that the HC mixture was more compatible with the hermetic compressor materials than R12 and R134a, even under the retrofit conditions. Pellec et al. [48] tested two types of heat exchangers working with ammonia and silicone heat transfer fluid as the secondary refrigerant [49-52]. Setaro et al. [53] tested and compared the heat transfer and pressure drop through a brazed plate heat exchanger and a tube-and-fin coil for two different refrigerants, R22 and R290 in an air-to water heat pump system.
Hrnjak and Hoehne [54] reported that the air-to-R290 mini channel heat exchanger developed for a 2 kW cooling capacity refrigeration system needed less than 0.13 kg of R290 due to its smaller internal volume than that of traditional fin-and-tube heat exchanger. Hrnjak and Litch [55] also presented the experimental results of mini channel heat exchanger utilized as an air-cooled condenser in a prototype ammonia chiller.
Fernando et al. [56] studied liquid-to-refrigerant heat exchangers using flat multiport with 1.4mmhydraulic diameter tubes and showed a lower charge compared to plate heat exchangers. Fernando et al. [57-59] also carried out comprehensive tests on performance of mini channel aluminium tube heat exchangers working as evaporator and condenser.
Walker [60] shows the typical layout of the SL system in a supermarket refrigeration application. The primary loop is composed of the parallel compressors
• air-cooled condenser • expansion device • evaporator • secondary refrigerant pump• Secondary refrigerant coil.
Kruse [61] compared the energy consumption of DX system and an indirect refrigeration system with a secondary fluid loop. Kauffeld [62] reviewed the trends and perspectives in supermarket refrigeration and compared an indirect, distributed cascade and two-stage refrigeration systems theoretically.
Delventura et al. [63] took an evaluation of the SL supermarket refrigeration system and compared it with the traditional DX refrigeration system. Kazachki and Hinde [64] compared the SL system with the traditional centralized DX system for the supermarket. Evenmo [65] cited a supermarket in the United Kingdom using R407C as the primary refrigerant and a commercial fluid as the secondary fluid, since first used in February 1997.Horton et al. [66] tested a drop-in SL refrigeration system for medium temperature supermarket applications. Arias and Lundqvist [67] reported field test results of advanced systems in three
Gl oba
l Jo
urna
l of R
esea
rche
s in E
nginee
ring
Volum
e X
II
Issu
e vvvvI V
ersion
I
12
( A)
Janu
a ry
201
2
© 2012 Global Journals Inc. (US)

Faramarzi and Walker [70]
installed and tested the performance of the SL refrigeration system in U.S. supermarkets. Nyvad and Lund
[71, 72]
reported that a supermarket in Denmark replaced its existing (H) CFC-plant with a new indirect SL
system. Rolfsman [73] also reported that a supermarket in Sweden had been converted to a SL
system. NH3
was used as the primary refrigerant and CO2
was used as the secondary refrigerant for freezing. Thomas [74]
cited the supermarket in the United Kingdom that installed a SL refrigeration system. In this system, NH3
was used as the primary refrigerant and propylene glycol as the secondary refrigerant.
Rivers [75] reported for a SL
refrigeration system designed for a supermarket in Greenwich, England. The HC
was chosen as the primary refrigerant. Baxter [76]
reported a case study for a small Danish supermarket where the old refrigeration plant has been replaced with a cascade plant. Pearson [77]
submitted patents on the use of CO2
as a volatile secondary refrigerant, including a novel hot gas defrost system. Pearson [46] used CO2
as a volatile secondary refrigerant in supermarket systems for the Swedish market. Christensen [78] investigated the SL
system using CO2
as primary and secondary refrigerant in supermarket applications. Tests and measurements
Recovery of Engine Waste Heat for Reutilization in Air Conditioning System in an Automobile: An Investigation
have been carried out and compared with the original cabinet.
Pachai [45] reported a SL system installed in Helsingborg, Sweden. The primary refrigerant was HC, a mixture of R290/ R170, and the low- and intermediate-temperature side secondary refrigerants were CO2 and propylene glycol, respectively. Nilsson et al.[79] reported an ice rink refrigeration system with CO2 as the secondary fluid. Hinde et al. [43] reported that at least nine low-temperature CO2 systems were operational in the U.S. and Canada in early 2008. Kaga et al. [80] developed a compact variable capacity refrigerating system with an inverter compressor using R600a as the primary refrigerant and CO2 as the secondary refrigerant, which is circulated by ‘‘thermosiphon’’ effect.
Wang and Goldstein [81] installed the district heating and cooling system with ice slurry generation system in Osaka, Japan. The total energy consumption was reduced by 19%. Wang et al.[82] installed a SL ice slurry system using ethylene glycol/water binary solution in the Ritz Carlton Plaza in Japan. Christensen and Kauffeld [83] described the application of ice slurry as the secondary refrigerant in a SL with ice slurry accumulation tank.
Meewisse and Ferreira [38] compared two freezing point depressants, sodium chloride and ethanol. Soe et al. [84] studied two milk-cooling systems utilizing R290 as the primary refrigerant that were
installed in Demark. Ballot-Miguet et al. [85] tested and compared the energy efficiency of the R22 DX system, single-phase secondary refrigerant system, SL system using ice slurry and two-phase CO2 as the secondary refrigerant. Fukusako et al. [86] reviewed studies related to the cold thermal storage systems and components using ice slurry and recent research activities on ice slurry in Japan. Saito [87] reviewed the recent research
supermarkets (floor area ranging from 720 to 2700m2).Minea [68,69] reported a supermarket refrigeration system with SLs installed near Montreal, Canada.
on cold thermal energy storage including the SL ice slurry system.
Choi et al. [88] evaluated the performance of R22, R290, R290/600a (70/30%), and R32/152a (50/50%)used in a water-to water residential heat pump for space cooling and heating. Chang et al. [89] reported the performance and heat transfer characteristics of a heat pump system filled with HC refrigerant (R290, R600a, R1270 and binary mixture of R290/R600a and R290/R600). The secondary fluid was ethyl alcohol. Pelletier and Palm [90] tested a domestic heat pump using R290 as compared to the R22 baseline system. For R290, the heating capacity was 7–10% lower, while the heating COP was 4–5% higher than R22. Payne et al. [91] investigated and compared the performance of R22, R290 and zeotropic mixtures of R32/R290 and R32/152a. The SL fluid was 70/30% mixture of water and ethylene glycol. Stene [92] investigated the performance of a residential brine-to-water CO2 heat pump for combined low-temperature space heating and hot water heating. Yanagisawa et al. [93] investigated a SLrefrigeration system, using a vapour compression NH3cycle as the primary loop and a CO2 thermo siphon loop almost all of currently manufactured air-conditioning systems for automobile and light duty truck vehicle use R134a as the refrigerant.
Natural refrigerants, such as HCs, present a potential alternative option to R134a due to their good thermodynamic and transport properties, heat transfer characteristics, material compatibility, low cost, low toxicity and low GWP (Domanski and Yashar,[3]; Fernando et al.,[56]; Mani and Selladurai,[94];Palm, [1]). Ghodbane [10] investigated the potential of R152a and HC refrigerants as alternative refrigerants to R134a, and a comparative assessment of a SL when applied to MACs. Dentis et al. [95] compared the SL system with R152a and HC refrigerants and the R134a system in a test bench, and demonstrated that the performance of SL system was similar to, and in some cases exceeded the performance of the R134a system. Ghodbane [96] also compared the performance of SL system to conventional R134a system used in a small size passage car under the same test conditions.
According to Srikhirin et al. [97] the absorption refrigeration system went through ups and downs, being the antecessor of the vapor compression refrigeration system in the 19th century. Systems operating on lithium bromide–water were commercialized in the 1940’s and 1950’s as water chillers for large buildings air
Globa
l Jo
urna
l of R
esea
rche
s in E
nginee
ring
Volum
e X
II
Issu
e vvvvI V
ersion
I
13
( A)
Janu
ary
201
2
© 2012 Global Journals Inc. (US)

conditioning (Costa[14]; Perez-Blanco [98]). Substitution of petroleum-based combustion fuels in the 1970’s affected the application of absorption refrigeration, but, at the same time, new opportunities arose, such as usage of solar energy to operate this system (Costa [14]; Zhai et al. [99,100]). Increasing energy costs and other factors has contributed to frequent use of low temperature energy waste from chemical and commercial (supermarket) industries to operate absorption refrigeration systems (Horuz and Callander [101]; Varani [102]; Maidment et al. [103]).
Among the most applied working fluids are the pair ammonia refrigerant–
water absorbent (NH3–H2O)
and water refrigerant–lithium bromide absorbent (H2O–LiBr). A limitation of the pair water–lithium bromide is the difficulty to operate at temperatures lower than 0°C. Besides, lithium bromide crystallizes at moderate concentration, and, at high concentration, the solution is corrosive to some metals and is of high cost (Horuz [104]; Srikhirin et al. [97]). The system water–lithium bromide operates below atmospheric pressure, resulting in system air infiltration, which requires periodical purge.
On the other hand, operation
above atmospheric pressure is a considerable advantage. Though ammonia–water systems were previously applied to refrigeration and ice production, recent
Recovery of Engine Waste Heat for Reutilization in Air Conditioning System in an Automobile: An Investigation
applications are predominantly on air conditioning, for which the pair water–lithium bromide can also be employed (Chuaa et al. [105]; Costa [14]; Lazarrin et al. [106]). Wu and Schulden [107] presented a modified Carnot cycle for a heat engine using high-temperature waste heat. The authors adopted the power per heat exchanger surface unit area for performance analysis of the heat engine. The relation between the maximum obtainable specific power and the temperature range in which the high-temperature waste heat engine operates was found. Koehler et al. [108] designed, built and tested a prototype of an absorption refrigeration system for truck refrigeration using heat from the exhaust gas. The refrigeration cycle was simulated by a computer model and validated by test data.
Zhao et al. [109] studied two combined absorption/compression refrigeration cycles using ammonia and water as the working fluid. The combined cycle with one solution circuit was a conventional absorption chiller with a mechanical compressor, using both the work and heat output from an engine. The combined cycle with two solution circuits was a generalized version of the previous cycle, which condenser and evaporator were replaced by a second absorber and a second generator. The primary energy ratio, defined as the ratio of the design cooling capacity and the total energy input to the engine, increased considerably for the combined cycles compared to a conventional engine driven compression cycle working with pure ammonia. The authors concluded that the
combined cycle with two solution circuits was the best option.
Jiangzhou et al. [110] presented an adsorption air conditioning system used in internal combustion engine locomotive driver cabin. The system consists of an absorber and a cold storage evaporator driven by the engine exhaust gas waste heat, and employs zeolite–water as working pair. The mean refrigeration power obtained from the prototype system was 5 kW, and the chilled air temperature was 18°C. The authors described the system as simple in structure, reliable in operation, and convenient to control, meeting the demands for air conditioning of the locomotive driver cabin.
Qin et al. [111] developed an exhaust gas-driven automotive air conditioning working on a new hydride pair. The results showed that cooling power and system coefficient of performance increase while the minimum refrigeration temperature decreases with growth of the heat source temperature. System heat transfer properties still needed to be improved for better performance.
V. PROPOSED METHODOLOGY
The proposed model is based on three fluid vapour absorption systems. It will contain basic components needed for vapour absorption system as shown in Fig. 3.
• The three fluid used in this system will be ammonia, water and hydrogen.
o The use of water is to absorb ammonia readily.
o The use of hydrogen gas is to increase the rate of evaporation of the liquid ammonia passing through the system.
• Even though ammonia is toxic, but due to absence of moving part, there will be little chance for the leakage.
• The hot radiator water will be used to heat the ammonia solution in the generator. To remove water from ammonia vapor, a rectifier will be used before condenser. The ammonia vapor is condensed and flows under gravity to the evaporator, where, it meets the hydrogen gas.The hydrogen of gas, which is being feed to the evaporator, permits the liquid ammonia to evaporate at low pressure and temperature.
• During the process of evaporation, the ammonia will absorb the latent heat from refrigerated space and produces cooling effect. The mixture of ammonia vapor and hydrogen will be passed to the absorber where ammonia will be absorbed while hydrogen raises the top and flows back to the evaporator.
Gl oba
l Jo
urna
l of R
esea
rche
s in E
nginee
ring
Volum
e X
II
Issu
e vvvvI V
ersion
I
14
( A)
Janu
a ry
201
2
© 2012 Global Journals Inc. (US)

Recovery of Engine Waste Heat for Reutilization in Air Conditioning System in an Automobile: An Investigation
Fig.3 : Schematic of a triple fluid vapours absorption refrigeration system
a) Development of A Mathematical Model The mathematical model will be developed
considering the following elements
• Thermodynamic properties • Absorption equation• Conservation of energy• Absorption process, and• The coefficient of performance
The relation will be developed through mathematical model that what is the extent of heat generated in the engine and what quantity could be transferred for utilizing at the A/C system by recovery of waste engine heat
VI. CONCLUSION
The study of waste heat cooling system analyzed in this article will be experimentally investigated and the data will be captured for further analysis. This will be supported by a suitable mathematical model and a simulation tool. The study reveals that it comprises four heat exchanges, namely, an air finned forced convection condenser, an air finned forced convection evaporator, and a pair of shell and tube type absorbers, plus four one-way refrigerant valves, an expansion valve, and an exchange valve. For a refrigerant system the following things are needed
• Specific Cooling Power (SCP)• Coefficient of Waste Heat Recovery (CWHR)• Coefficient of Waste Heat Cooling (CWHC)
At present, for an automobile waste heat absorption cooling system, the demand for CWHC can be easily met, but for SCP, further research is needed, which will be studied in part II of this project.
REFERENCES REFERENCES REFERENCIAS
1. Palm, B., 2008. Hydrocarbons as refrigerants in small heat pump and refrigeration systems – a review. Int. J. Refrigeration 31,552–563.
2. Corberan, J.M., Segurado, J., Colbourne, D., Gonzalvez, J., 2008. Review of standards for the use of hydrocarbon refrigerants in a/c, heat pump and refrigeration equipment. Int. J.Refrigeration 31, 748–756.
3. Domanski, P.A., Yashar, D., 2006. Comparable performance evaluation of HC and HFC refrigerants in an optimized system. In: Proceedings of the Seventh IIR-Gustav Lorentzen Conference on Natural Working Fluids at Trondheim, Norway, May 29–31.
4. S.M. Sami and C Tribes, An improved model for predicting the dynamic behavior of adsorption systems, Appt. Thermal Engng 16, 149-161 (1996).
5. Colbourne, D., 2000. An overview of hydrocarbons
Globa
l Jo
urna
l of R
esea
rche
s in E
nginee
ring
Volum
e X
II
Issu
e vvvvI V
ersion
I
15
( A)
Janu
ary
201
2
© 2012 Global Journals Inc. (US)

as replacement refrigerants in commercial refrigeration and air conditioning. Refrigeration Northern Ireland Centre for Energy Research and Technology.
6.
Colbourne, D., Suen, K.O., 2000. Assessment of performance of hydrocarbon refrigerants. In: Proceedings of the Fourth IIRGustav Lorentzen
Recovery of Engine Waste Heat for Reutilization in Air Conditioning System in an Automobile: An Investigation
Conference on Natural Working Fluids, Purdue, USA.
7. Colbourne, D., Ritter, T.J., 2000. Compatibility of Non-Metallic Materials with Hydrocarbon Refrigerant and Lubricant Mixtures. IIF-IIR- Commission B1, B2, E1 and E2 – Purdue University, USA.
8. Maclaine-Cross, I.L., Leonardi, E., 1996. Comparative performance of hydrocarbon refrigerants. In: I.I.F. – I.I.R. – Commissions E2, E1, B1, B2, Melbourne, Australia.
9. Joudi, K.A., Mohammed, A.S.K., Aljanabi, M.K., 2003. Experimental and computer performance study of an automotive air conditioning system with alternative refrigerants. Energ. Convers. Manag. 44, 2959–2976.
10. Ghodbane, M., 1999. An investigation of R152a and hydrocarbon refrigerants in mobile air conditioning. In: International Congress and Exposition, SAE Paper 1999-01-0874, Warrendale, PA.
11. Razmovski, V., 1994. Safety of hydrocarbon refrigerants for car air conditioning systems. B.E. thesis, School of Mechanical and Manufacturing Engineering, UNSW, Sydney.
12. Rajasekariah, C., 1995. Safety of hydrocarbon refrigerant safety in automobiles. B.E. thesis, School of Mechanical and Manufacturing Engineering, UNSW, Sydney.
13. Cheung K, Hwang Y, Judge JF, Kolos K, Singh A, Radermacher R. Performance assessment of multistage absorption cycles. Int J Refrig 1996;19(7): 473–81.
14. Costa EC. Refrigeration. 3rd ed. São Paulo: Edgard Blücher; 1988 [in Portuguese].
15. Pereira JTV, Milanês RLP, Silvério RJR. Energy and exergy evaluation of a water– ammonia absorption refrigeration system. In: Mercofrio – I Mercosul HVAC congress, Porto Alegre, Brazil; 1998.
16. Meunier F. Adsorptive cooling: a clean technology. Clean Prod Process 2001;3:8–20.
17. R. Q. Zhu. B. Q. Han. M. Z. Lin and Y. Z. Yu, Experimental investigation on an adsorption system for producing chilled water, Int. J. Refrigeration 15, 31-34 (1992).
18. M. Suzuki, Apphcation of adsorption cooling systems to automobiles. Heat Recovery Systems & CHP 13, 335- 340 (1993).
19. ASHRAE, 2008. ASHRAE Handbook, HVAC Systems and Equipment. American Society of Heating, Refrigerating, and Air-Conditioning Engineers, Atlanta, GA.
20. ASHRAE, 2004. ANSI/ASHRAE Standard 34, Designation and Safety Classifications of Refrigerants. American Society of Heating, Refrigerating, and Air-Conditioning Engineers, Atlanta, GA.
21. ISO, 2005.ISO Standard 817: Refrigerants Designation System. International Organization for Standardization, 1, ch. de la Voie-Creuse, Case postale 56, CH-1211 Geneva 20, Switzerland.
22. Granryd, E., 2001. Hydrocarbons as refrigerants –an overview Int. J. Refrigeration 24, 15–24.
23. CEN, 2006. prEN 378-2, Refrigerating Systems and Heat Pumps –Safety and Environmental Requirements. European Committee for Standardization, Brussels.
24. Dieckmann, J.T., Bentley, J., Varone, A., 1991. Non-Inert Refrigerant Study for Automotive Applications. p. 75. DIN, 2004.
25. Elbers, S.J., Verwoerd, M., 1997. Quantitative risk assessment of a heat pump system with propane refrigerant. Final Report of TNO (for Lodam Energi A/S), Apeldoorn, Netherland.
26. Jetter, J., Reynaldo, F., Rubenstein, R., 2001. Fault tree analysis for exposure to refrigerants used for automotive air conditioning in the United States. Risk Anal. 21, 157–171.
27. Colbourne, D., Suen, K.O., 2004. Appraising the flammability hazards of hydrocarbon refrigerants using quantitative risk assessment model, part II, model evaluation and analysis. Int. J. Refrigeration 27, 784–793.
28. Gigiel, A., 2004. Safety testing of domestic refrigerators using flammable refrigerants. Int. J. Refrigeration 27, 621–628.
29. Ure, Z., 2003. Secondary refrigeration – European experiences. ASHRAE Trans. 109.
30. Ubaldo, S., 1998. Caracteristiche dei fluidi secondari per basse temperature. Zero Setto Zero Magazine October. Ure, Z., 2000. Benefits that flow from secondary systems. RAC J., 32–37. July.
31. Melinder, A., 2000. Update on secondary refrigerants for indirect systems. In: Proceedings of IEA Annex 26 Meeting, Section 2.
32. Ure, Z., 2000. Benefits that flow from secondary systems. RAC J., 32–37. July.
33. Kauffeld, M., Christensen, K.G., Lund, S., Hansen, T.M., 1999. Experience with ice slurry. In: Proceedings of the First Workshop on Ice Slurries of the International Institute of Refrigeration, Yverdon-les-Bains, Switzerland, 27–28 May, pp. 42–73.
34. Okawa, S., Saito, A., Hozumi, T., Kumano, H., 2002. Effect of ice/ water storage on the permeability of the mixtures. In: Proceedings of the International Conference on Fundamental Research on Thermal Energy Storage to Preserve Environment, pp. 49–54.
Gl oba
l Jo
urna
l of R
esea
rche
s in E
nginee
ring
Volum
e X
II
Issu
e vvvvI V
ersion
I
16
( A)
Janu
a ry
201
2
© 2012 Global Journals Inc. (US)

35.
Sari, O., Vuarnoz, D., Meili, F.,
Egolf, P.W., 2000. Visualization of ice slurries and ice slurry flows. In: Proceedings of the Second Workshop on Ice Slurries of the International Institute of Refrigeration, Paris, France, pp. 68–81.
Recovery of Engine Waste Heat for Reutilization in Air Conditioning System in an Automobile: An Investigation
36. Hansen, T.M., Kauffeld, M., Grosser, K., Zimmermann, R., 2000. Viscosity of ice slurry. In: Proceedings of the Second Workshop on Ice Slurries of the International Institute of Refrigeration, Paris, France, pp. 38–45.
37. Inaba, H., 2001. Fundamental research and development of ice slurry for its cooling system design in Japan. In: Proceedings of the Fourth Workshop on Ice Slurries of the International Institute of Refrigeration, Grand Cube Osaka, Osaka, Japan, 12–13 November, pp. 13–14.
38. Meewisse, J.W., Ferreira, C.A.I., 2000. Optimal properties of ice slurries in secondary cooling systems. In: Proceedings of the Fourth IIR-Gustav Lorentzen Conference of Natural Working Fluids, Purdue, USA, pp. 513–520.
39. Ayel, V., Lottin, O., Peerhossaini, H., 2003. Rheology, flow behaviour and heat transfer of ice slurries: a review of the state of the art. Int. J. Refrigeration 26, 95–107.
40. Janssen, M., Beks, P.., 2000. Hermetic compressor performance evaluation applying a zeotropic hydrocarbon blend instead of CFC-12. In: Proceedings of the Fourth IIR-Gustav Lorentzen Conference of Natural Working Fluids at Purdue, USA, pp. 217–224.
41. Kitanovski, A., Poredos, Al, 2002. Concentration distribution and viscosity of ice-slurry in heterogeneous flow. Int. J. Refrigeration 25, 827–835.
42. Kauffeld, M., Kawaji, M., Egolf, P.W., Melinder, A., Davies, T.W.,2005. Handbook on Ice Slurries: Fundamentals and Engineering. International Institute of Refrigeration, Paris, France.
43. Hinde, D., Zha, S., Lan, L., 2008. CO2 experiences in North American supermarkets. In: Proceedings of the Eighth IIRGustav Lorentzen Conference on Natural Working Fluids, Copenhagen, Denmark, pp. 1098–1104.
44. Melinder, A., 2004. Secondary Fluids for Low Operating Temperatures. Proceedings of the Sixth IIR-Gustav Lorentzen Conference on Natural Working Fluids, Glasgow, United Kingdom, August 29–September 1.
45. Pachai, A.C., 2004. Experience with CO2 as refrigerant in supermarkets. In: Proceedings of the Sixth IIR-Gustav Lorentzen Conference on Natural Working Fluids, Glasgow, United Kingdom, August 29–September 1.
46. Pearson, A., 2005. Carbon dioxide – new uses for an old refrigerant. Int. J. Refrigeration 28, 1140–1148.
47. Devotta, S., Sawant, N.N., 2000. Life testing of hermetic compressor with various hydrocarbon grades and other alternatives to CFC-12. In: Proceedings of the Fourth IIRGustav Lorentzen Conference of Natural Working Fluids, Purdue, USA, pp. 245–249.
48. Pellec, C.L., Marvillet, C., Clodic, D., 1996. Experimental study of flat heat exchangers in ammonia refrigeration unit. In: Proceedings of the IIR Conference on Applications for Natural Refrigerants, Aarhus, Denmark, pp. 785–794.
49. Dow. Product Information: Dowtherm G., 2009a. http://www.dow. Com / Published Literature
50. Dow. Product Information: Dowtherm J., 2009b.http://www.dow.com/Published Literature
51. Dow. Product Information: Dowtherm Mx,2009c.http://www.dow.com PublishedLiterature
52. Dow. Product Information: Dowtherm Xlt,2009e. http://www. dow.com / Published Literature
53. Setaro, T., Boccardi, G., Corberan, J.M., Urchueguia, J., Gonzalvez, J., 2000. Comparative study of evaporation and condensation of propane and R22 in a brazed plate heat exchanger and a tube and fins coil. In: Proceedings of the Fourth IIR Gustav Lorentzen Conference of Natural Working Fluids, Purdue, USA, pp. 233–238.
54. Hrnjak, P.S., Hoehne, M.R., 2004. Charge minimization in systems and components using hydrocarbons as a refrigerant. ACRC TR-224.
55. Hrnjak, P.S., Litch, A.D., 2008. Microchannel heat exchangers for charge minimization in air-cooled ammonia condensers and chillers. Int. J. Refrigeration 31, 658–668.
56. Fernando, P., Palm, B., Ameel, T., Lundqvist, P., Granryd, E., 2004. Propane heat pump with low refrigerant charge: design and laboratory tests. Int. J. Refrigeration 27, 761–773.
57 Fernando, P., Palm, B., Ameel, T., Lundqvist, P., Granryd, E., 2008a. A minichannel aluminum tube heat exchanger – part I: evaluation of single-phase heat transfer coefficients by the Wilson plot method. Int. J. Refrigeration 31, 669–680.
58 Fernando, P., Palm, B., Ameel, T., Lundqvist, P., Granryd, E., 2008b. A minichannel aluminium tube heat exchanger – part II: evaporator performance with propane. Int. J. Refrigeration 31, 681–695.
59 Fernando, P., Palm, B., Ameel, T., Lundqvist, P., Granryd, E., 2008c. A minichannel aluminum tube heat exchanger – part III: condenser performance with propane. Int. J. Refrigeration 31, 696–708.
60 Walker, D.H., 2000. Low-charge refrigeration for supermarket. IEA Heat Pump Centre Newsletter 31, 13–15.
61 Kruse, H., 2000. Refrigerant use in Europe. ASHRAE J. 42, 16–25. Likes, P., 1996. Secondary refrigerant systems for supermarket equipment. In: International Conference on Ozone Protection
Globa
l Jo
urna
l of R
esea
rche
s in E
nginee
ring
Volum
e X
II
Issu
e vvvvI V
ersion
I
17
( A)
Janu
ary
201
2
© 2012 Global Journals Inc. (US)
Technologies, October 21–23, Washington, D.C., pp. 158–164.
Recovery of Engine Waste Heat for Reutilization in Air Conditioning System in an Automobile: An Investigation
62 Kauffeld, M., 2008. Trends and perspectives in supermarket refrigeration. In: International Technical Meeting on HCFC Phase-out, 5–6 April, Montreal, Canada.
63 Delventura, R., Evans, C.L., Richter, I., 2008. Secondary loop systems for the supermarket industry. http://www. thecoldstandard.com/bohnwhitepaper/ (accessed 14.11.2008).
64 Kazachki, G., Hinde, D., 2006. Secondary coolant systems for supermarkets. ASHRAE J., 34–46. September.
65 Evenmo, K., 1998. A new secondary fluid. In: Proceedings of the IIR-Gustav Lorentzen Conference on Natural Working Fluids, Oslo, Norway, pp. 679–688.
66 Horton, W.T., Groll, E.A., Sharp, E., 1998. Testing of a drop-in secondary loop refrigeration system for medium temperature supermarket application. In: Proceedings of IIR-Gustav Lorentzen Conference on the Natural Working Fluids, Oslo, Norway, pp. 690–700.
67 Arias, J., Lundqvist, Per., 2000. Field experiences in three supermarkets in Sweden. In: Proceedings of IEA Annex 26 Workshops, IEA Heat Pump Centre, Sittard, The Netherlands.
68 Minea, V., 2007. Supermarket refrigeration system with completely secondary loops. ASHRAE J. 49, 40.
69 Minea, V., 2008. Low charge and low emission supermarket refrigeration systems. In: Proceedings of the Eighth IIR Gustav Lorentzen Conference on Natural Working Fluids, Copenhagen, Denmark, pp. 901–908.
70 Faramarzi, Ramin T., Walker, D.H., 2004. Investigation of Secondary Loop Supermarket Refrigeration Systems. Consultant Report. Foster-Miller, Inc. California Energy Commission 500-04-0132004.
71 Nyvad, J., Lund, S., 1996. Indirect cooling with ammonia in supermarkets. In: Proceedings of the IIR Conference on Applications for Natural Refrigerants, Aarhus, Denmark, pp. 207–217.
72 Nyvad, J., Lund, S., 1998. Indirect cooling with ammonia in supermarket. In: Proceedings of the IIR-Gustav Lorentzen Conference on Natural Working Fluids, 2–5 June, Oslo, Norway, pp. 725–734.
73 Rolfsman, L., 1996. CO2 and NH3 in the supermarket ica-fous. In: Proceedings of the IIR Conference on Applications for Natural Refrigerants, Aarhus, Denmark, pp. 219–225. R744.com, 2009.
74 Thomas, A.S., 1998. Retail refrigeration systems –the use of ammonia and two-level secondary refrigeration. ASHRAE Trans. 104 (1A), 440–448.
75 Rivers, N., 2000. Unconventional secondary
refrigeration in a UK supermarket. IEA Heat Pump Centre Newsletter 18, 18–19.
76 Baxter, V.D., 2006. Advances in Supermarket Refrigeration Systems. ORNL. IEA Annex 26 Summary. BSI, 2008.
77 Pearson, S.F., 1995. Cooling Method and Apparatus. British Patent Number 2258298.
78 Christensen, K.G., 1999. Use of CO2 as primary and secondary refrigerant in supermarket application. In: 20th International Congress of Refrigeration, IIR/IIF, Sydney, pp. 1936–1942.
79 Nilsson, P.O., Rogstam, J., Sawalha, S., Shahzad, K., 2006. Ice rink refrigeration system with carbon dioxide as secondary fluid in copper tubes. In: Proceedings of the Seventh IIR-Gustav Lorentzen Conference on Natural Working Fluids, Trondheim, Norway, May 29–31. NIST, 2002.
80 Kaga, S., Nomura, T., Seki, K., Hirano, A., 2008. Development of compact inverter refrigerating system using R600a/CO2 by Thermo Siphon. In: Proceedings of the Eighth IIR-Gustav Lorentzen Conference on Natural Working Fluids, Copenhagen, Denmark, pp. 1011–1018.
81 Wang, M.J., Goldstein, V., 1996. A novel ice slurry generation system and its application. In: Proceedings of the IIR Conference on Applications for Natural Refrigerants, Aarhus, Denmark, pp. 543–551.
82 Wang, M., Inoue, J.Y., Goldstein, V., 1999. Ice thermal storage in modern building. In: Proceedings of the 20th International Congress of Refrigeration, 19–24 September, Sydney, Australia.
83 Christensen, K.G., Kauffeld, M., 1998. Ice slurry accumulation. In: Proceedings of the IIR-Gustav Lorentzen Conference on Natural Working Fluids, Oslo, Norway, pp. 701–711.
84 Soe, L., Hansen, Torben M., Lundsteen, B.E., 2004. Instant milk cooling system utilizing propane and either ice slurry or traditional ice bank. In: The Proceedings of the Sixth IIR Gustav Lorentzen Conference on Natural Working Fluids, Glasgow, United Kingdom, August 29–September 1.
85 Ballot-Miguet, B., Lafargue, A., Rached, W., 2008. Ice slurry at –35 ᴼC: energy efficiency and comparison with other refrigerating systems. In: Eighth IRR-Gustav Lorentzen Conference on Natural Working Fluids, 7–10 September 2008, Copenhagen, Denmark, pp. 834–840.
86 Fukusako, S., Kozawa, Y., Yamada, M., Tanino, M., 1999. Research and development activities on ice slurries in Japan. In: First Workshop on Ice Slurries of the International Institute of Refrigeration: Proceedings of the International Meeting in Yverdon-les-Bains, Switzerland, 27–28 May, pp. 83–105.
87 Saito, A., 2002. Recent advances in research on cold thermal energy storage. Int. J. Refrigeration 25, 177–189.
Gl oba
l Jo
urna
l of R
esea
rche
s in E
nginee
ring
Volum
e X
II
Issu
e vvvvI V
ersion
I
18
( A)
Janu
a ry
201
2
© 2012 Global Journals Inc. (US)

Recovery of Engine Waste Heat for Reutilization in Air Conditioning System in an Automobile: An Investigation
88 Choi, D.K., Domanski, P.A., Didion, D.A., 1996. Evaluation of flammable refrigerants for use in a water-to-water residential heat pump. In: Proceedings of the IIR Conference on Applications for Natural Refrigerants, Aarhus, Denmark, pp 467–476.
89 Chang, Y.S.,Kim, M.S., Ro, S.T., 1996. Performance and heat transfer of hydrocarbon refrigerants and their mixtures in a heat pump system. In: Proceedings of the IIR Conference on Applications for Natural Refrigerants, Aarhus, Denmark, pp. 477–486.
90 Pelletier, O., Palm, B., 1996. Performance of plate heat exchangers and compressor in a domestic heat pump using propane. In: Proceedings of the IIR Conference on Applications for Natural Refrigerants, Aarhus, Denmark, pp. 497–506.
91 Payne, W.V., Domanski, P.A., Muller, J., 1998. A study of a water to- water heat pump using flammable refrigerants. In: Proceedings of the IIR-Gustav Lorentzen Conference on in Natural Working Fluids, 2-5 June, Oslo, Norway, pp. 658–667.
92 Stene, J., 2002. Investigation of a residential brine-water CO2 heat pump for combined low-temperature space heating and hot water preparation 2002. In: Proceedings of the Fifth IIR Gustav Lorentzen Conference on Natural Working Fluids, Guangzhou, China, pp. 268–275.
93 Yanagisawa, T., Fukuta, M., Ogura, N., Kaneo, H., 2004. Operating characteristics of natural circulating CO2 secondary loop refrigeration system working with NH3 primary loop. In: Proceedings of the Sixth IIR-Gustav Lorentzen Conference on Natural Working Fluids, Glasgow, United Kingdom, August 29– September 1.
94 Mani, K., Selladurai, V., 2008. Experimental analysis of a new refrigerant mixture as drop-in replacement for CFC12 and HFC134a. Int. J. Thermal Sciences 47, 1490–1495.
95 Dentis, L., Mannoni, A., Parrino, M., 1999. HC refrigerants: an ecological solution for automotive a/c systems. In: Vehicle Thermal Management of Systems Conference Proceedings, London, UK, pp. 133–147.
96 Ghodbane, M., 2000. On vehicle performance of a secondary loop a/c system. In: SAE 2000 World Congress, Detroit, Michigan.
97 Srikhirin P, Aphornratana S, Chungpaibulpatana S. A review of absorption refrigeration technologies. Renew Sustain Energy Rev 2001;5(4): 343–72.
98 Perez-Blanco H. Conceptual design of a high-efficiency absorption cooling cycle. Int J Refrig 1993;16(6):429–33.
99 Zhai XQ, Wang RZ, Wu JY, Dai YJ, Ma Q. Design and performance of a solar powered air-conditioning system in a green building. Appl Energy 2008; 85:297–311.
100 Zhai H, Daí YJ, Wu JY, Wang RZ. Energy and exergy analyses on a novel hybrid solar heating, cooling
101 Horuz I, Callander TMS. Experimental investigation of a vapour absorption refrigeration system. Int J Refrig 2004;27(1):10–6.
102 Varani CMR. Energy and exergy evaluation of a water–lithium bromide absorption refrigeration unit using natural gas. D.Sc. Thesis. João Pessoa, Brazil: Federal University of Paraíba; 2001.
103 Maidment GG, Zhao X, Riffat SB. Combined cooling and heating using a gas engine in a supermarket. Appl Energy 2001;68:321–35.
104 Horuz I. A comparison between ammonia–water and water–lithium bromide solutions in vapour absorption refrigeration systems. Int. Common Heat Mass Transfer 1998; 25(5):711–21.
105 Chuaa HT, Toh HK, Ngb KC. Thermodynamic modeling of an ammonia–water absorption chiller. Int J Refrig 2002;25(7):896–906.
106 Lazarrin RM, Gasparella A, Longo GA. Ammonia–water absorption machines for refrigeration: theoretical and real performances. Int J Refrig 1996;19(4):239–46.
107 Wu C, Schulden WH. Maximum obtainable specific power of high-temperature waste heat engines. Heat Recov Syst CHP 1995;15(1):13–7.
108 Koehler J, Tegethoff WJ, Westphalen D, Sonnekalb M. Absorption refrigeration system for mobile applications utilizing exhaust gases. Heat Mass Transfer 1997;32:333–40.
109 Zhao Y, Shigang Z, Haibe Z. Optimization study of combined refrigeration cycles driven by an engine. Appl Energy 2003;76:379–89.
110 Jiangzhou S, Wang RZ, Lu YZ, Xu YX, Wu JY, Li ZH. Locomotive driver cabin adsorption air-conditioner. Renew Energy 2003;28:1659–70.
111 Qin F, Chen J, Lu M, Chen Z, Zhou Y, Yang K. Development of a metal hydride refrigeration system as an exhaust gas-driven automobile air conditioner. Renewable Energy 2007;32:2034–52.
and power generation system for remote areas. Appl Energy 2009;86: 1395–404.
Globa
l Jo
urna
l of R
esea
rche
s in E
nginee
ring
Volum
e X
II
Issu
e vvvvI V
ersion
I
19
( A)
Janu
ary
201
2
© 2012 Global Journals Inc. (US)

This page is intentionally left blank
Recovery of Engine Waste Heat for Reutilization in Air Conditioning System in an Automobile: An Investigation
Gl oba
l Jo
urna
l of R
esea
rche
s in E
nginee
ring
Volum
e X
II
Issu
e vvvvI V
ersion
I
20
( A)
Janu
a ry
201
2
© 2012 Global Journals Inc. (US)

© 2012 Bharat Raj Singh, Onkar Singh. This is a research/review paper, distributed under the terms of the Creative Commons Attribution-Noncommercial 3.0 Unported License http://creativecommons.org/licenses/by-nc/3.0/), permitting all non commercial use, distribution, and reproduction in any medium, provided the original work is properly cited.
Study of Compressed Air Storage System as Clean Potential Energy for 21st Century
By Bharat Raj Singh, Onkar Singh
Abstract - Worldwide transport sector alone releases billion tonnes of excessive carbon dioxide in the atmosphere through tail pipe emissions thereby causing serious threat to global warming. It is also leading to fast depletion of hydrocarbon fuel. On account of such challenges, continued researches are being carried out to supplement the energy by renewable resources and alternate energy to sustain hydrocarbon fuel. Now a days the major thrusts are being laid upon the utilization of wind energy, hydro-power, tidal and nuclear power generation. Simultaneously efforts are also made towards storage of the energy and appropriate conversion system and its better utilization. This paper focuses on study of some energy storage and energy conversion systems. Special focus is laid on use of compressed atmospheric air as a viable alternative energy source. Such energy storage system can be used as clean energy source as zero pollution sources, and help in mitigating the global warming.
Keywords : zero pollution, compressed air, air turbine, energy conversion, energy storage, injection angle.
GJRE-A Classification : FOR Code: 091399
Study of Compressed Air Storage System as Clean Potential Energy for 21st Century
Strictly as per the compliance and regulations of:
Global Journal of researches in engineeringMechanical and mechanics engineeringVolume 12 Issue 1 Version 1.0 January 2012Type: Double Blind Peer Reviewed International Research JournalPublisher: Global Journals Inc. (USA)Online ISSN: 2249-4596 Print ISSN:0975-5861
School of Management Sciences L ucknow , U ttar Pradesh, I ndia

Study of Compressed Air Storage System as Clean Potential Energy for 21st Century
Bharat Raj Singh α, Onkar Singh Ω
Abstract - Worldwide transport sector alone releases billion tonnes of excessive carbon dioxide in the atmosphere through tail pipe emissions thereby causing serious threat to global warming. It is also leading to fast depletion of hydrocarbon fuel. On account of such challenges, continued researches are being carried out to supplement the energy by renewable resources and alternate energy to sustain hydrocarbon fuel. Now a days the major thrusts are being laid upon the utilization of wind energy, hydro-power, tidal and nuclear power generation. Simultaneously efforts are also made towards storage of the energy and appropriate conversion system and its better utilization. This paper focuses on study of some energy storage and energy conversion systems. Special focus is laid on use of compressed atmospheric air as a viable alternative energy source. Such energy storage system can be used as clean energy source as zero pollution sources, and help in mitigating the global warming.
: zero pollution, compressed air, air turbine, energy conversion, energy storage, injection angle.
GLOSSARY
CAE compressed air energy CAES compressed air energy storage DER distributed energy source EC electrochemical capacitors EDL electric double layer ESA energy storage association ISEP
iowa stored energy park
MDI
metuore development international
PCS
power conversion source
UPS
uninterrupted power supply
PNM
public service Company
of New Mexico
Author α
:
Department of Mechanical Engineering, School of Management Sciences, Technical Campus, Gosainganj, Lucknow-227125, UP, India. Telephone: +91-9415025825;
E-mail : [email protected]
Author
Ω
: Department of Mechanical Engineering, Harcourt Butler Technological Institute, Kanpur-208002, UP, India.
Telephone: +91-9415114011; E-mail : [email protected]
NOMENCLATURE
d
diameter of rotor (2r) in meter
D
diameter of outer (2R) cylinder in meter
E
stored energy
I
moment of inertia of thin rim cylinder
L
length of rotor having vanes in meter
n
no. of vanes=(360/θ)
m
rim cylinder mass
N
no. of revolution per minute
p
pressure in bar
1 1,p v
pressure and volume respectively
at which air strike the Turbine,
4 4,p v
pressure and volume respectively at which maximum expansion of air takes place,
5p
pressure at which turbine releases the air to atmosphere.
rr
radius of rim cylinder
v
volume in cu-m
vr
linear rim velocity
w
theoretical work output in Nm
wr
rotational velocity of rim cylinder(rad/sec)
W
theoretical power output (Nm/s)
1iX
variable extended lengths of vane at point1
2iX
variable extended lengths of vane at point 2
SUBSCRIPTS
1, 2...4, 5
subscripts –
indicates the positions of vanes in casing
i or imp
impingement
e
or exp
expansion
t or total total
Globa
l Jo
urna
l of R
esea
rche
s in E
nginee
ring
Volum
e X
II
Issu
e vvvvI V
ersion
I
21
( A)
Janu
ary
201
2
© 2012 Global Journals Inc. (US)
GrEEK SYMBOLS
α angle BOF - see Fig. 5
1α angle LOF(=180-φ ) - see Fig. 5
2α angle KOF(=180-θ -φ ) - see Fig. 5
β angle BAF – see Fig.5
γ 1.4 for airθ angle between 2-vanes(BOH) – see Fig. 5φ angle at which compressed air enters into rotor
through nozzle
dξ eccentricity (R-r)
Keywords
I.
INTRODUCTION
orldwide utilization of hydrocarbon fuel in transport sector, power sector and other industries
is causing
serious problem of global warming, air pollution, likely depletion of fossil fuel reserves and threat
to the survival of mankind. This fact was predicted in 1956, by US based Chief Consultant and Oil Geologist Marion King Hubert
[1] who stated that if oil is consumed with high rate, US Oil production may peak in 1970 and thereafter it will decline. It was also predicted that other countries may attain Peak Oil day within 20-30 Years and may suffer with oil crises within 40 years, when Oil wells are going to dry. The projection is illustrated with a bell shaped Hubert Curve
based on the availability and consumption of the fossil fuel.
In India, vehicular pollution was estimated to have increased eight times over the earlier two decades. This source alone was estimated to contribute about 70 per cent of total air pollution. With 243.3 million tonnes of carbon released from the consumption and combustion
of fossil fuels in 1999, India is ranked fifth in the world behind the U.S., China, Russia and Japan. India's contribution to world carbon emissions has increased many folds, due to the rapid pace of urbanization, shift from non-commercial to commercial fuels, increased vehicular usage and continued use of older and more inefficient coal-fired and fuel power-plants.
Billion tonnes of release of carbon dioxide
and other pollutants, and their implications upon the environment and ecology are compelling force to search for an environment friendly alternative to oil [2-9]. Such an alternative should ideally have a zero or near zero pollution level, low initial cost and running expenses, high degree of reliability, convenience and its versatility of utilizations. The use of compressed air for running prime mover like air turbines / engines offers a potential solution to these issues, which does not involve combustion process for producing shaft work. Thus the great advantages in terms of free of cost availability of air as a fuel and no emissions such as; carbon dioxide, carbon monoxide and nitrous oxides etc., are apparent from such air driven prime movers. Compressed air driven prime movers are also found to be cost effective compared to fossil fuel driven engines. It has perennial compressed air requirement which needs some source of energy for running compressor. The overall analysis shows that the compressed air system is quite attractive option for light vehicle applications [10] as well as wind turbine farm
for clean energy storage and it’s availability at the time of peak hour power requirement and improvement of thermal power generation efficiency by storage of compressed air energy at non-peak hour and use of such clean energy at peak hours.
The paper focuses towards the compressed air energy storage (CAES)
and its uses in the transport technology, power generation by wind turbine farm and
CAES
during non peak hours and its availability for meeting the peak hour power requirement which could not be met otherwise through the thermal power plants. The running of light vehicles / motorbikes could curb emission by 50-60% in developing countries such as India, China, Taiwan, Romania etc. It is expected that CAES
will be the major contributor of the clean energy
potential during the 21st
century.
II.
POWER
CONVERSION
/
ENERGY
STORAGE
SYSTEM
The power conversion system (PCS)
is a vital part of all energy storage systems. It interfaces the energy storage device and the load (the end-user). PCS
cost is significant and it can be greater than 25% of the overall energy storage system. PCS
cost ranges from Rs.4500/kW
for UPS markets to Rs.55000/kW
for standalone market. Some of the major PCS
markets include:
•
Motor drives
•
Power supplies
•
UPS (uninterrupted power supply)
•
Electric vehicles
•
Inverters/Converters for solar-hybrid systems, Micro-turbines, Fuel cells, Wind turbines
Power conversion system technology has been evolving slowly due to the limited distributed energy resource (DER) market. As a result, Energy Storage System
cost has been high with low profit margins and the manufacturing volume has been low impacting reliability and quality of the Power Conversion System designs. What is needed is the significant reduction in overall cost with improved reliability, and development of state-of-the-art Power Conversion System with multiple uses, which increases production volumes for DER applications, improve controls and adaptability, and improve manufacturing.
W
Study of Compressed Air Storage System as Clean Potential Energy for 21st CenturyGl oba
l Jo
urna
l of R
esea
rche
s in E
nginee
ring
Volum
e X
II
Issu
e vvvvI V
ersion
I
22
( A)
Janu
a ry
201
2
© 2012 Global Journals Inc. (US)
a) Batteries Energy Storage SystemThese storage systems operate in varying
environments and electrical conditions. In these storage systems there are many different types of battery technologies. The different storage technologies are having advantages under specific operational conditions and thus have their own capabilities and limitations. Some of these are as given ahead.
• Lead-Acid Battery- short cycle life• Li-Ion -Lithium Ion Battery-High energy and 100%
efficiency• NaS -Sodium Sulfur Battery- can run at high
temperature of 300 deg centigrade.• PSB - Polysulfide Bromide Flow Battery- 75%
efficiency• VRB -Vanadium Redox Flow Battery- 85% efficiency

b)
Super Capacitor Energy Storage
Electrochemical capacitors (EC) store electrical energy in the two series capacitors of the electric double layer
(EDL),
which is formed between each of the electrodes and the electrolyte ions. The distance over which the charge separation occurs is just a few angstroms. The capacitance and energy density of these devices is thousands of times larger than electrolytic capacitors. The electrodes are
often made with porous carbon material. The electrolyte is either aqueous or organic. The aqueous capacitors have a lower energy density due to a lower cell voltage but are less expensive and work in a wider temperature range. The asymmetrical capacitors that use metal for one of the electrodes have a significantly larger energy density than the symmetric ones and have lower leakage current.
c)
Fly Wheel Energy Storage
Most modern flywheel energy storage systems consist of a massive rotating cylinder (consisting of a rim attached to the shaft) that is substantially supported on a stator by magnetically levitated bearings that eliminate bearing wear and increase system life. To maintain efficiency, the flywheel system is operated in a low vacuum environment to reduce drag. The flywheel is connected to a motor/generator mounted onto the stator that interacts with the utility grid. Some of the key features of flywheels are little maintenance, long life (20 years or 10s of thousands of deep cycles) and environmentally inert material. Flywheels can bridge the gap between short term ride-through and long term storage with excellent cyclic and load following characteristics. The choice of using solid steel versus composite rims is based on the system cost, weight, size, and performance trades of using dense steel (200 to 375 m/s tip speed) vs. a much lighter but stronger composite that can achieve much higher rim velocities (600 to 1000 m/s tip speed). Actual delivered energy depends on the speed range of the flywheel as it cannot deliver its rated power at very low speeds. For example, over 3:1 speed range, a flywheel will deliver ~90% of its stored energy to the electric load.
While high-power flywheels are developed and deployed for aerospace and UPS
applications, there is an effort, pioneered by Beacon Power, to optimize low cost commercial flywheel designs for long duration operation (up to several hours). 2kW / 6kWh
systems are in telecom service today. Megawatts for minutes or hours can be stored using a flywheel farm approach. Forty 25kW / 25 kWh
wheels can store 1MW for 1 hour efficiently in a small footprint.
The stored energy can be approximated by:
E = (Iwr2)/2 = (mrr
2wr2)/2= (mvr
2)/2
where wr
is the rotational velocity (rad/sec), I
is the moment of inertia for the thin rim cylinder, m
is the cylinder mass, rr
is the radius of the rim cylinder and vr
is linear rim velocity.
d)
Pumped Hydro Storage
Pumped hydro storage is the most widespread energy storage technology used in the world, according to the energy storage association (ESA). There are about 90 GW of pumped storage in operation, which equals about 3 percent of worldwide generation capacity. The system works by pumping water from a lower reservoir to a higher reservoir and then allowing the water move downhill to produce electricity when needed. Traditional iterations of the technology are ideal for populations that live close to high altitude terrain, like Switzerland, where pumped hydro has been used for a century.
e)
Compressed Air Energy Storage
The Technology of air engine is not new. The Sterling air engine was developed in 1790-1810, but due to its limitation no much work was carried out. In view of fire problems in Coalmines and other volatile places, where high flammable fuel like fossil fuel vehicles are not adviseable, compressed air operated vehicles are normally being put in use.
III.
VARIOUS
OPTIONS
OF USES
OF
COMPRESSED
AIR
ENERGY
STORAGE
(CAES)
a)
Power Plant backup with CAES
Compressed air is not very old technology which takes excess energy from a power plant or renewable energy and uses it to run air compressors, which pump air into an underground cave or container where it is stored under pressure. When the air is released, it powers a turbine, creating electricity.
Study of Compressed Air Storage System as Clean Potential Energy for 21st Century
Globa
l Jo
urna
l of R
esea
rche
s in E
nginee
ring
Volum
e X
II
Issu
e vvvvI V
ersion
I
23
( A)
Janu
ary
201
2
© 2012 Global Journals Inc. (US)
The technology, which involves storing off-peak-generated energy in the form of compressed air, usually in an underground reservoir, can trace its roots to the early 1960s, when the evaluation of gas turbine technology for power production began. It gained momentum during the next decade because of its promising thermal efficiency and response capabilities for providing load-following and peaking power support.
But since the commissioning only two existing CAES plants in the world-the 290-MW Huntorf plant in north Germany in 1978 and the 110-MW Alabama Electric Corp. plant in McIntosh, Ala., in 1991 have come up. One reason for this is that setting up a CAES facility is costly and requires finding a geologic formation that can support it. For example, both the German and Alabama plants store compressed air in mined salt caverns.

Study of Compressed Air Storage System as Clean Potential Energy for 21st CenturyGl oba
l Jo
urna
l of R
esea
rche
s in E
nginee
ring
Volum
e X
II
Issu
e vvvvI V
ersion
I
24
( A)
Janu
a ry
201
2
© 2012 Global Journals Inc. (US)
Figure 1 : Underground CAES backup by non Peak Hour Compression
CAES plants work like big batteries. electric motors drive compressors that compress air (at perhaps 1,100 psi) into an underground geologic formationduring off-peak hours. When the electricity is needed most, the pre-compressed air (essentially replacing the compressor in a traditional combustion turbine) is used in modified combustion turbines to generate electricity (Figure 1). Natural gas or other fossil fuels are still required to run the turbines, but the process is more efficient-using up to 50% less natural gas than standard production, according to Sandia National Laboratories.
b) Wind Turbine Farm backup with CAESPrompted CAES is being reviewed by the
staggering growth of wind-powered capacity for its use as a load management tool as well as its capability to function as a stand-alone intermediate generation source for capturing energy arbitrage, capacity payments, and ancillary services.
As per recent announcement, Sandia was developing a stored energy park in an aquifer near Des Moines, Iowa, in collaboration with Public Service Co. of New Mexico (PNM) and more than 100 municipal utilities in Iowa, Minnesota, and the Dakotas. The Iowa Stored Energy Park (ISEP, www.isepa.com) will be a nominal 269-MW CAES plant with about 50 hours’ worth of stored energy. As per the estimates, using Iowa’s abundant wind power, it could account for 20% of the energy used annually at a typical municipal utility and save cities and their utilities as much as $5 million each year in purchased energy.
Figure 2 : Underground CAES backup by Wind Turbine Farm
ISEP Project Manager Georgianne Peek said the project, expected to be operational by 2012, was “pretty far along.” By June, ISEP developers were 95% certain that they had the right formation (based on seismic testing at the site), computer modeling, and data from a sister formation. The team is planning to conduct an analysis of the site’s rock mechanics-a study similar to the one they did in 2000 for a 2,700-MWCAES plant proposed by CAES Development Co. for construction in Norton, Ohio and the project is still under development.
c) The Submerged CAESRecently in Europe, German generation giant
E.ON gave an engineering professor at Nottingham University, Seamus Garvey, £236,000 ($333,500) to build two CAES prototypes-the first on land and then an underwater wave-powered version. Garvey, who thinks the idea makes abundant engineering sense, envisions large amounts of compressed air being stored under the sea in gigantic cone-like flexible containers, dubbed energy bags. Renewable energy primary harvesting machines would collect the energy in the form of compressed-air, then if the energy available exceeds the demand for electricity at that time, some air is inducted into storage, but the heat is extracted from that and fed into a small fraction of air that is being expanded. This presupposes that your ‘wind farm’ or ‘tidal energy farm’ or ‘wave energy farm’ or integrated mix of all of these is set up to deliver ‘base load’ most of the time, Garvey told POWER. At a depth of about 1,970 feet, he calculates that the bags could store some 6,945 MWh of energy for every cubic meter. Garvey’s prototypes are in the process of development.
f) Compressed Air Engine / TurbineNow from last two decades major thrust is
being given by the researchers for development of compressed air engine. Some technical developments, which may be considered to work on 21st Century Energy Storage system and can work on compressed
i. Reciprocating Compressed Air EngineGuy Negre, a French Scientist, in 1998
developed compressed air- 4- cylinders engine run onair and gasoline, claims zero pollution cars and got 52-patents registered since 1998 to 2004.The car was demonstrated in Oct.’2004 publically [11]. The Air Car,
air or hybrid system as an alternative to fossil fuel for running light vehicles, are listed below:-
developed by Luxembourg-based MDI Group founder

Study of Compressed Air Storage System as Clean Potential Energy for 21st Century
Globa
l Jo
urna
l of R
esea
rche
s in E
nginee
ring
Volum
e X
II
Issu
e vvvvI V
ersion
I
25
( A)
Janu
ary
201
2
© 2012 Global Journals Inc. (US)
and former Formula One engineer Guy Negre, is powered by a compressed air engine (CAE). It uses compressed air to push its pistons when running at speeds under 35 mph. At higher speeds-it can run up to 96 mph-the compressed air is heated by a secondary fuel source (biofuel, gasoline, or diesel) and expands before it enters the engine. The Air Car claims a fuel efficiency of about 100 mpg. The air is compressed using power from a regular electric outlet.
ii. Rotary Hot Air Motor (Quasi-Turbine) Saint Hilaire G., an inventor developed zero
pollution cars using Quasiturbine with a set of 14-engines parameters and disclosed on Sept’2005 using gasoline [12]. In the basic single rotor Quasiturbine engine, an oval housing surrounds a four-sided articulated rotor, which turns and moves within the housing. The sides of the rotor seal against the sides of the housing, and the corners of rotor seal against the inner periphery, dividing it into four chambers.
iii. Vaned type Air Turbine In an effort to curb pollution, a revolutionary
motorcycle engine that runs on air is under development. The prime mover is a vaned type air turbine. The prototype in question uses a compressed air tank to power a turbine and provide motive power to the motorcycle. The compressed air tanks can get recharged with pumps running off solar or other renewable energy, thus making them a cheaper, eco-friendly alternative to hybrid electric vehicles. The engine works by pushing compressed air into a small turbine. The air expands and turns the turbine, powering the motorbike. No fossil fuels are required, and the only waste product is the expended air.
The developers of the engine, states that the technology is commercially viable and could be available to consumers within a year. As of now, the only major challenge is to develop a compressed air tank that can withstand the demands of long journeys. The current technology allows for 30 minutes of running time and the researchers are now working to develop a high-pressure tank that is good enough to power the bike for six hours. Numerous studies for optimizing efficiency of these air turbines have been done [13- 17].
IV. VANED TYPE NOVEL AIR TURBINE ASPRIME-MOVER TO MOTORBIKE
In this study a vaned air turbine shown in Fig. 3, has been considered. This air turbine is tested in order to get an output of 6.50 to 7.20 HP for meeting starting torque requirements at 500–750 rpm at 4-6 bar air pressure. The average running torque is available at normal speed of 2000–2200 rpm at 2-3 bars air pressure. The air turbine with single inlet and exhaust has spring loaded vanes to maintain regular contact with the elliptical bore. The various efforts have been made to get optimum shaft output produced [18-22].
a) Mathematical ModelThe high pressure jet of air at ambient
temperature drives the rotor in novel air turbine due to both isobaric admission and adiabatic expansion. Such high pressure air when enters through the inlet passage, pushes the vane for producing rotational movement through this vane and thereafter air so collected between two consecutive vanes of the rotor is gradually expanded up to exit passage.
This isobaric admission and adiabatic expansion of high pressure air contribute in producing the shaft work from air turbine. Compressed air leaving the air turbine after expansion is sent out from the exit passage. It is assumed that the scavenging of the rotor is perfect and the work involved in recompression of the residual air is absent. Similar type of mathematical modeling is considered in earlier publications by authors and it is being reproduced here for maintaining continuity and benefits to the readers [23-36].
From Fig. 4, it is seen that work output is due to isobaric admission from E to 1, and adiabatic expansion from 1 to 4 and reference points 2, 3 in the figure shows the intermediate position of vanes. Thus, total work output due to thermodynamic process may be written as:
[Area under (E145CE)] = [Area under (E1BOE) +Area under (14AB1) – Area under (4AOD4) + Exit steady flow (45CD4)] or
Total work output = [Thermodynamic expansion work ( 1w)] + [Exit steady flow work ( 2w )]
or w = [( 1w ) + ( 2w )] (1)
Figure 3 : Air Turbine Model

Study of Compressed Air Storage System as Clean Potential Energy for 21st CenturyGl oba
l Jo
urna
l of R
esea
rche
s in E
nginee
ring
Volum
e X
II
Issu
e vvvvI V
ersion
I
26
( A)
Janu
a ry
201
2
© 2012 Global Journals Inc. (US)
Figure 4 : Thermodynamic Processes (Isobaric, adiabatic and Isochoric Expansion)
Now thermodynamic expansion work ( 1w ), can
be written as:
1 1 4 41 1 1 4 4
. .. .1
p v p vw p v p vγ
−= + − −
or
( )1 1 1 4 4. .1
w p v p vγγ
= − −
For adiabatic process, 1 1 4 4. . .p v p v p vγ γ γ= = =
constant or
1
14 1
4
.pv vp
γ =
Thus thermodynamic expansion work output would be:
1
41 1 1
1
. . . 11
pw p vp
γγγ
γ
− = − −
(2)
The process of exit flow (4-5) takes place after the expansion process (E- 4) as shown in Fig. 4 and air is released to the atmosphere. In this process; till no over expansion takes place pressure 4p can’t fall below
atmospheric pressure 5p . Thus at constant volume
when pressure 4p drops to exit pressure 5p , no
physical work is seen. Since turbine is functioning as positive displacement machine and hence under steady fluid flow at the exit of the turbine, the potential work is absorbed by the rotor and flow work (
2w ), can be written as:
5
2 4 4 54. ( )w v dp v p p= = −∫ (3)
Applying equations (2), (3) into equation (1), therefore net work output will be:
( ) ( )1
41 2 1 1 4 5 4
1
. . . 1 .1
pw w w p v p p vp
γγγ
γ
− = + = − + − −
(4)
when air turbine is having n number of vanes, then shaft output [37] can be written as:
(5)( )4
1 1 4 5 41
1
. . . 1 . .1n
pw n p v n p p vp
γγγ
γ
− = − + − −
where nw is work output (in Nm), for complete
ne cycle. From Fig. 5, shows that when two consecutive
vanes at OK and OL move to position OH and OB, the extended vane lengths varies from SK to IH and LM to BG, thus the variable length BG at variable iα is
assumed as 'var 'at iableX α can be written from the
geometry:
1,var ' ' . sin .sin ( ).cosat iable
R rBG x R cos R r rRα α α− − = = + − −
(6)
where 2R=D is diameter of casing and 2r=d is diameter of rotor, α is angle ∠ BOF, β is angle ∠BAF and θ is angle ∠HOB or∠H’OF or ∠KOL,between two consecutive vanes and φ is angle ∠KOJat which injection pressure admits to the air turbine.
Variable volume of cuboids B-G-I-H-B can be written as:
( )( )1 2 12. .sin
4i i i
cuboids
X X r Xv L θ
+ + =
(7)
where BG= 1iX and IH= 2iX variable length of
vanes when rotate into turbine as shown in Fig. 5 and i stands for min or max length.

Study of Compressed Air Storage System as Clean Potential Energy for 21st Century
Globa
l Jo
urna
l of R
esea
rche
s in E
nginee
ring
Volum
e X
II
Issu
e vvvvI V
ersion
I
27
( A)
Janu
ary
201
2
© 2012 Global Journals Inc. (US)
Figure 5 : Variable length BG and IH and injection angle
φ
Thus the volume at;
a). inlet 1v or minv will fall between angle∠ LOF=
( )1min 180α θ φ= − − and angle∠KOF=
( ) ( )2min 1min 180α α θ φ= + = − as seen in Fig. 5, when
air is admits into turbine at angle φ .
b). exit 4v or maxv will fall between angle ∠ BOF
1max 0α α= = and angle ∠HOF
( )2max 1maxα α θ θ= + =
Applying above conditions into equations (6), then LM=X1min , SK=X2min, FE=X1max=Corresponding to BG at α =0 degree and I’H’=X2max=Corresponding IHat ( )α θ+ =θ degree
Applying values of X1min and X2min to equation (7),
( )( )1min 2min 1minmin 1
2. .sin
4X X r X
v v L θ+ +
= =
(8)
Applying values of X1max and X2 max to equation (7),
( )( )1max 2max 1maxmax 4
2. .sin
4X X r X
v v L θ+ +
= =
(9)
Applying values of 1v and 4v from equations
(8) and (9) to equation (5), the total power output available totalW can be written as:
( ) ( )
( ) ( ) ( )
1min 2min 1min41
1
1max 2max 1max4 5
1. 2
.( / 60). . 1 . . .sin1 4
. 2.( / 60). . . .sin
4
total
X X r XpW n N p Lp
X X r Xn N p p L
γγγ θ
γ
θ
− + + = − − + +
+ −
(10)
V. PRESENT WORK
A novel air turbine has been conceived forbeing used as prime mover for very light vehicle applications like; motorbike engine. Based on the above mathematical model, performance of proposed air turbine is analyzed and results are obtained and plotted for different independent and dependent parameters. For optimum design values, the air turbine has been fabricated suiting to the requirements of motorbike. The novel air turbine is fabricated for optimum dimensions and run on compressed air for its performance evaluation. Experimental set up consisting of a reciprocating compressor, compressed air storage tank, air flow regulator cum filter, air turbine and dynamometer is used for validation of the performance predicted by theoretical analysis. The independent and dependent variable considered for present study are detailed below:
a) Independent Variablesi) Number of vanes (n=360 / θ) ii) Diameter of the rotor (d) in miii) Diameter of the casing (D) in miv) Length of the rotor (L) in mv) Speed of rotor (N) rpmvi) Inlet / admission pressure of air (p1 in bar)vii) Admission / injection angle (ø) in degree
b) Dependent Variables
i) Volume of two consecutive vanes (v1) in m3
ii) Volume of maximum expansion (v2) in m3
iii) Exit pressure (p4) in bariv) Torque (T) in Nmv) Total power output (Wtotal) in kWvi) Expansion power output (Wexp) in kWvii) Flow power output (Wflow) in kW
The various parametric investigations carried out in present work include optimization of vane angle ( number of vanes in rotor), air admission / injection angles, rotor and casing diameter ratio and relation between vane angle and air injection angle with respect to different injection pressure 2-7 bar ( 15- 100 psi).
VI. THEORETICAL AND EXPERIMENTALRESULTS OF NOVEL AIR TURBINE
The air engine is conceptualized as a novel vaned type air turbine is shown in Fig. 6. The air turbine

Study of Compressed Air Storage System as Clean Potential Energy for 21st CenturyGl oba
l Jo
urna
l of R
esea
rche
s in E
nginee
ring
Volum
e X
II
Issu
e vvvvI V
ersion
I
28
( A)
Janu
a ry
201
2
© 2012 Global Journals Inc. (US)
is considered to work on the reverse principle of vane type compressor. It is assumed that the total shaft work of the air turbine is cumulative effect of compressed air jet on vanes and the expansion of high pressure air. The compressed air at 20 bar is utilized for running air turbine which is stored in a storage cylinder. It is proposed to have storage capacity of 30 minutes duration. The compressed air cylinder is attached with filter, regulator and lubricator for regulating and maintaining the constant pressure during air admission so as to produce high torque at low speed of revolution. The vanes of novel air turbine are spring loaded to maintain their continuous contact with the casing wall to minimize leakage.
a) Theoretical AnalysisIn present study the thermodynamic modeling
of the air turbine has been carried out for the considered model. Theoretical analysis is carried out for varying compressed air injection pressure, number of vanes, casing diameter, rotor diameter, speed of rotation. Based on the theoretical result and analysis the final dimensions of the air turbine were fixed. A prototype of air turbine was developed and checked for its functionality. It has a casing of CI material with liner of high tensile steel. The vane rotor is also of high tensile steel and having 8 slots to accommodate 4 mm thickness vanes of self lubricating fiber material. The fiber vanes are spring loaded to maintain regular contact
Figure 7 : Experimental test setup
b) Experimental SetupThe complete schematic of test setup is shown
in Fig. 7. It consists of compressor, compressed air storage cylinder, supply of compressed air through air filter, regulator and lubricator to air turbine. The dynamometer consisting of load pulley, weight load and load dial gauge are also shown in the set up.
with casing liner.
Figure 6 : Air turbine- schematic model
The experimental setup consisting of a heavy duty two stage compressor with suitable air storage tank, air filter, regulator and lubricator, novel air turbine, rope dynamometer has been created for validation of theoretical results.
The actual setup of test rig of air engine / turbine was fabricated and air turbine was tested in the laboratory. The compressed air is produced by a heavy duty two stage compressor and stored in a suitable capacity of air tank to maintain nearly constant supply pressure of 300 psi. The compressed air is connected to air filter, regulator and lubricator to produce desired air pressure for testing. The data is recorded with various parametric conditions and performance evaluation of the prototype air turbine is carried out.
As shown in Fig. 7, it consists of a compressor and storage unit. The said unit comprises of the specifications of components used to perform the validation of Air Engine/Turbine.
i. Compressor UnitAs shown in Fig. 8, the specification of the 2-
stage compressor is as under:The air compressor is of M/s ELGI Equipment ltd., Coimbatore, India’s make. It is of two stage intercooled type and has specifications such as; TS 05 120H, Manufactured: 04/2003; 500 LPM, Maximum working pressure. 12Kgf/Cm2, Speed; 925 RPM; The compressor is connected with an electric motor. The electric motor is of 05 HP (3.7 kW) - 3 phase, speed of rotation 1420 rpm, and runs at 415V, 8.2 Amps and 50 Hz frequency.
ii. Compressed Air Storage TankCompressed air storage cylinder / receiver is
made of M/s ELGI Equipments Ltd., India’s make and connected with 6 mm heavy duty steel tube attached with compressor unit exit nozzle point. The storage container has a capacity of 250 Ltrs (8.8 cuft) at atmospheric pressure and can attain 5000 Ltrs (176 cuft) of atmospheric air, when filled up to test pressure of 20 bar= (20.4 Kg f/Cm2).
iii. Safety Valve and Air Pressure GaugeSafety valve is introduced on storage tank to
gauge the pressure and release automatically the pressure if it goes beyond the specified level of pressure 40 bar. The pressure gauge indicates the pressure attained in the storage tank for monitoring purpose.
iv. Air Release ValveIt is a unit by which compressed air is taken out.
In this set up it is a manual pressure release link / latch
•
•

Study of Compressed Air Storage System as Clean Potential Energy for 21st Century
Globa
l Jo
urna
l of R
esea
rche
s in E
nginee
ring
Volum
e X
II
Issu
e vvvvI V
ersion
I
29
( A)
Janu
ary
201
2
which is rotated to regulate the air quantity to the air filter, air regulator and lubricator unit.
v. Air Filter, Regulator and Lubricator (FRL)The filter, regulator and lubricator unit which
ensures the life of air engine by filtering, regulating the desired pressure and lubricating the air engine to prevent the Tafcon 4 mm Vanes already fitted in to the slots of rotor. The filter, regulator and lubricator unit is used of SHAVO Make OLYMPION Filter, Regulator (BL set MAJ-200-M7EC); Model SB 13; ¼” BSP, Poly Bowl, 24 Micron and 0-20 bar regulator. It suits to regulate the desired pressure needed to be given to air engine through inlet pipe.
vi. Construction of Air EngineThe inner construction of air engine has following parts:
1. Housing / Casing of Air EngineIt is made of cast iron with liner fitted inside to
receive regular contact of vanes which prevents the leakage and develops rotational load on rotor. 2. Rotor and Vanes
It is made of high tensile carbon steel of homogeneous material. Rotor length is decided depending upon the power load required and slots over the rotor periphery and to full length is cut to the depth more than the off-centre of Casing liner and Rotor diameters difference. Preferably CNC machine milling tools are to be used for very high precision and slots are made of 4+ (four plus) mm. size and accuracy is to be maintained to the order of micron. Tafcon vanes are fitted inside rotor slots and should be of exactly 4 mm. Vanes are required to slide inside the slots against centrifugal force and also loaded under spring to maintain regular contact with liner to avoid / reduce leakage between liner and vane contact once high pressure air enters to space of off centre between two consequent vanes as shown in Fig. 6.3. Shaft and Load Pulley
A pulley/sprocket is fitted with key over the extended portion of shaft. The shaft diameter is considered depending upon the load desired and for this novel engine it is of 17-18 mm (¾ “) diameter and extended about 35 mm 1 ½” approx.).
© 2012 Global Journals Inc. (US)Fig. 8 : Heavy Duty 2-Stage Compressor
The actual setup of test rig of air engine / turbine was fabricated and air turbine was tested in the laboratory as shown in Figs. 8, 9, 10 and 11. The compressed air is produced by a heavy duty two stage compressor and stored in a suitable capacity of air tank to maintain nearly constant supply pressure of 20 bar.
Fig. 9 : Air filter, regulator and lubricator
The compressed air is connected to air filter, regulator and lubricator to produce desired air pressure for running the air turbine and its testing. The data is recorded with various parametric conditions as shown in Figure 2(e) and performance evaluation of the prototype air turbine is carried out.
Fig. 10 : Actual test rig of air turbine
The most important aspects of design and analysis of the novel air engine are of optimizations of following parameters:
a) Size of air engine liner diameter (D), rotor diameter (d) and its relation (d/D).
b) Compressed air at which angle it should enters the air engine.
c) Number of vanes into the rotor depends upon angle between 2- consecutive vanes.

Study of Compressed Air Storage System as Clean Potential Energy for 21st CenturyGl oba
l Jo
urna
l of R
esea
rche
s in E
nginee
ring
Volum
e X
II
Issu
e vvvvI V
ersion
I
30
( A)
Janu
a ry
201
2
© 2012 Global Journals Inc. (US)
d) Air pressure is considered 2- 7 bar for operation.e) Exit port is considered to be placed at an angle
where re-compression should not start after expansion of air inside the air engine. The exit air is released at an angle 225o or more with reference to which casing liner and rotor gap is nearly zero.
vii. Validation of Experimental ResultsThe above experimental set up was used at
HBTI, Kanpur in the fluid mechanics lab and compressor was used after attaining its pressure 300 psi. The nylon pressure tube was connected to storage tank outlet nozzle. Other end of pipe was connected to inlet of FRL attached with air engine test setup. The release valve of storage tank was regulated and Regulator of air engine FRL unit was adjusted at air pressure of 2 bar. The load on rope pulley attachment was adjusted with spring balance after adjusting the rope tension screw.
Under this condition speed of air engine / turbine was recorded with the help of laser dynamometer. Again the pressure regulator was adjusted at 3 bar and reading of air turbine speed was recorded. Similarly regulator pressure was again adjusted for 4, 5, 6 bar air pressure under same loading conditions and speeds were recorded for all pressure conditions.
This process was continued after increasing the loading on spring balance and speed of air turbine were recorded at 2, 3, 4, 5, 6 bar pressure. The process was repeated for different set of loadings and experimental readings were then compared with theoretical values. It was observed that at low air pressure, performance of turbine was about 97 % and at high pressure and heavy loading it was to the order of 72%. Thus the innovative novel turbine was found to develop maximum performance than the any available air motors developing same power.
Fig 11 : Actual air turbine under test
(Note: All the measuring tools / instruments were validated within the specified limits of its tolerances
before the record of reading and errors were not accounted for).
c) Input ParametersFor comparison of theoretical and experimental
power output parameters are listed in Table-1.
Table-1 Input parameters for comparison of theoretical results
with experimental values
Symbols Parameters
D=2R, d=2r (100 mm,75 mm) i.e.( d/D)=0.75
1p 20 psi (=1.4 bar), 40 psi (=2.7 bar), 60 psi (=4.1 bar), 80 psi (=5.5 bar), 100 psi (=7.0 bar)
4p ( )1 4 1/ .v v pγ= >5p assuming adiabatic
expansion
5p (4 /1.2p ) >1 atm = 1.0132 bar
n Number of vanes (360 / θ)
N 500 rpm, 1000 rpm, 1500 rpm, 2500 rpm, 3000 rpm
L 45 mm length of rotor
γ 1.4 for air
θ 450 angle between 2-vanes, (i.e. rotor contains correspondingly 8 nos. of vanes)
Ø 600 angle at which compressed air through nozzle enters into rotor
VII. RESULTS AND DISCUSSION
Variation of performance efficiency = (variation in experimental and theoretical power divided by theoretical power) with respect to different injection pressure 2-7 bar is shown in Fig. 12.
Figure 12 : Performance of vane turbine with respect to experimental power

Study of Compressed Air Storage System as Clean Potential Energy for 21st Century
Globa
l Jo
urna
l of R
esea
rche
s in E
nginee
ring
Volum
e X
II
Issu
e vvvvI V
ersion
I
31
( A)
Janu
ary
201
2
© 2012 Global Journals Inc. (US)
Figure 12 depicts the variation of efficiency of air turbine for different injection pressure at different speeds of rotation. It is evident that at every injection pressure the efficiency goes down with increasing speed of rotation. This is due to the increase in friction losses on account of higher speed of rotation for a constant injection pressure. There also occur leakage losses at the mating surface of vane and casing which increase with increasing injection pressure. This higher leakage helps in overcoming the frictional resistance and reduces friction losses. On account of these factors, the efficiency of air turbine varies as shown below:
• 93% to 99% with variation of 6%, at speed of rotation 500 rpm for injection pressure 20 psi to 100 psi.
• 81.8% to 89.8% with variation of 8%, at the speed of rotation 1000 rpm for injection pressure 20 psi to 100 psi.
• 70.8% to 84.3% with variation of 13.5%, at the speed of rotation 1500 rpm for injection pressure 20 psi to 100 psi.
• 64.4% to 79.8% with variation of 15.4%, at the speed of rotation 2000 rpm for injection pressure 20 psi to 100 psi.
• 59.5% to 76.5% with variation of 17%, at the speed of rotation 2500 rpm for injection pressure 20 psi to 100 psi.
• 56.2% to 72.9% with variation of 16.7%, at the speed of rotation 3000 rpm for injection pressure 20 psi to 100 psi.
This shows that at lower speed of rotation, performance efficiency is higher and variation is small; whereas at higher speed rotation performance efficiency of turbine goes down and variation is also large. The graph at 20 psi (1.4 bar) shows the large variation in performance efficiency whereas for 40 -100 psi (2.7-7 bar), the variation in the performances are closer. This may be due to overcoming the frictional losses between vanes and casing. Thus overall performance of air turbine for working pressure ranging from 2.7-6 bar is found varying from 72%-97%.
VIII. CONCLUSIONS
On the basis of above studies, following conclusions are drawn: • Apart from all other options of storage of energy,
the compressed air energy storage (CAES) is the option to improve upon the peak hour requirement of electric power generation.
• Wind turbines farm could be used as CAES system and from CAES, electric power can be generated during peak hour requirements and it can be utilized as a source for filling the compressed air storage tank for running the air engine of light vehicles without using electricity for compressor.
• The performance efficiency of the novel compressed air engine is found varying from
72%-97% and is suitable to run motorbike’s air engine as zero pollution.
• If the compressed air technology is implemented in the light transport vehicles such as: motorbikes etc., it will practically generate zero pollution and compressed air engine technology will reduce the emission up to 50-60% as presently 80 % of pollution is generated due to the transport sector.
Thus CAES is definitely going to be the most attractive and efficient clean energy option for 21st
century.
REFERENCES REFERENCES REFERENCIAS
1. Hubbert M.K., 1956, Nuclear energy and the fossil fuels; Amer. Petrol. Inst. Drilling and Production Practice, Proc. Spring Meeting, San Antonio, Texas. 7-25.
2. Aleklett K. and Campbell C.J., 2003, The Peak and Decline of World Oil and Gas Production- Minerals and Energy, Raw Materials Report, Volume 18, Number 1, 2003, pp. 5-20.
3. Singh B.R., and Singh, Onkar, 2007, Use of Non-Conventional Energy for Sustainability to Fossil Fuel- National Conference on Recent Trend on Mechanical Engineering RAME-2007- held on 28-29th March'2007 at Baba Sahab Dr. Bhim Rao Ambedkar College of Agricultural Engg. and Technology, Etawah-Proceedings pp 130-136.
4. Singh B.R., and Singh, Onkar, 2007, Uses of Wind Power as a Non-Conventional / Renewable Energy for Sustainability - National Conference on State of Art Technology in Mechanical Engineering, STEM-2007- held on October 29-31, 2007 at College of Technology, G.B. Pant University, Pant Nagar, UP-Proceedings pp 503-515.
5. Honton E. J., 2004, Hydrogen Fuel Cell Car, presented at 15th Annual US Conference and Hydrogen Expo, April’2004, USA.
6. Rose Robert, William J. Vincent, 2004, Fuel Cell Vehicle World Survey 2003-Break through Technologies Institute, February’ 2004, Washington, D.C.
7. Singh B.R. and Singh Onkar, 2006, Necessity and Potential for Bio-Diesel Use in India, - International Conference on Bio-Fuel Vision-2015, October’13th -15th, 2006 at Bikaner, India- Proceedings pp 71-89.
9. Singh B.R., and Singh, Onkar, 2008, A Study on Sustainable Energy Sources and its Conversion Systems towards Development of an Efficient Zero Pollution Novel Turbine to be used as Prime-mover to the Light Vehicle - 2008 ASME International Mechanical Engineering Congress and Exposition -
8. Singh B.R. and Singh Onkar, 2006, Study of Compressed Air as an alternative to fossile fuel for Automobile Engines, - International Conference on Challenges and Strategies for Sustainable Energy and Environment- held on 10-11th June'2006 at UPTU, Lucknow, UP-Proceedings pp 179-191.

Study of Compressed Air Storage System as Clean Potential Energy for 21st CenturyGl oba
l Jo
urna
l of R
esea
rche
s in E
nginee
ring
Volum
e X
II
Issu
e vvvvI V
ersion
I
32
( A)
Janu
a ry
201
2
© 2012 Global Journals Inc. (US)
held on October 31-November 6, 2008 at Boston, Massachusetts, USA- Paper No. IMECE -2008 -66803, Vol.8, pp 371-378.
10. Guy and Negre Cyril, 2004, Compressed Air - The Most Sustainable Energy Carrier for Community Vehicles– Speech in front of assembly at Kultur gathered for “Fuel Cells World” Tuesday 29th June ’2004.
11. Saint Hilaire, G., Saint Hilaire, R., and Saint Hilaire, Y., 2005, Quasiturbine zero pollution car using gasoline-. Festival at Le Lundi, Montreal Gazette, 26 September 2005.
12. Knowlen C., Bruckner A. P., Mattick A.T., and Hertzberg A., 1998, High Efficiency Energy Conversion Systems for Liquid Nitrogen Automobiles- Society of Automotive Engineers, Inc., AIAA 98-1898.
13. Fuglsang P., Bak C., Gunna M., 2004, Design and verification of the Ris0-B1 Airfoil-family for Wind Turbines, ASME- Nov’2004, Vol.126 pp 1002-1008.
14. Gorla, R., and Reddy, S., 2005, Probabilistic Heat Transfer and Structural Analysis of Turbine Blade, IJTJE, Vol. 22, pp 1- 11.
15. Selig Michel S., 2004, Wind Tunnel Aerodynamics Tests of Six Airfoils for use on Small Wind Turbines, Journal of Solar Energy Engineering, Transactions of the ASME-Nov 2004, Vol.126 (4), pp. 986-1001.
16. Schreck S. and Robinson M., 2004, Tip Speed Ratio Influences on Rationally Augmented Boundary Layer Topology and Aerodynamic Force Generation, Journal of Solar Energy Engg., ASME-Nov’ 2004-Vol.126 pp 1025-1033.
17. Singh B.R., and Singh, Onkar, 2008, A concept for Development of a Vaned Type Novel Air Turbine -12 th International Symposium on TransportPhenomena and Dynamics of Rotating Machinery,held on February 17-22, 2008 at Sheraton Mohana Surfrider Hotel Honolulu, Hawaii - Paper No. ISROMAC-12-20046.
18. Singh B.R. and Singh Onkar, 2008, Development of a vaned type novel Air Turbine, International Journal of Mechanical Engineering Science (The manuscript was received on 21st Dec’ 2007 and was accepted after revision for publication on 03rd June 2008) Proc. IMechE Vol. 222 Part C, pp 1419-1426.
19. Singh B.R. and Singh Onkar, 2008, Energy Storage System to meet Challenges of 21st Century- an Overview-All India Seminar on Energy Management in Perceptive of Indian Scenario-held on October 17-19, 2008 at Institution of Engineer (India), State Centre, Engineer's Bhawan, Lucknow-Proceedings Chapter15, pp 157-167.
20. Singh B.R., and Singh, Onkar, 2008 –A Study to Optimize the Output of Vaned Type Novel Air Turbine - 4 th International Conference on Energy Research and Development - held on 17-19 November, 2008 at State of Kuwait, Kuwait- Paper No. ICERD - 4 -1353.
21. Singh B.R. and Singh Onkar, 2008, Parametric Evaluation of Vane Angle on performance of Novel Air Turbine, Journal of Science, Engineering and Management, SITM , December, 2008,Vol. 2, pp 7-18.
22. Singh B.R. and Singh O, 2009, Analytical Study on a Vaned Type Novel Air Turbine for Different Conditions of Casing and Rotor Diameters, 2009 ASME International Conference on Energy Sustainability - held on July 17-23, at San Francisco, California, USA, Paper No. ES2009 -90207, Vol. 1, 2009, pp 699-706.
23. Singh B.R. and Singh O, 2009, Applications of Compressed Air as an Alternative Energy to Meet Challenges of 21st Century- Global Warming, International Conference on Engineering Congress on Alternatives Energy Applications: Option or Necessity?, held on 3-5 November, at State of Kuwait, Kuwait- Paper No. EC2009-1082.
24. Singh B.R. and Singh O, 2009, Parametric Evaluations of Injection Angles and Vane Angles on Performance of a Vaned Type Novel Air Turbine,International Journal of Engineering and Physical Sciences, IJEPS, NZ, Vol. 3 Issue 4(38), pp 226-233.
25. Singh B.R. and Singh O, 2009, Optimization of Power Output of a Vaned Type Novel Air Turbine With Respect to Different Injection Angles-Under Ideal Adiabatic Expansion, IJME, Serials Publications, New Delhi, India, 2 (2), pp 205-211.
26. Singh B.R. and Singh O, 2010, Numerical Analysis of Pressure Admission Angle to Vane Angle Ratios on Performance of a Vaned Type Novel Air Turbine,International Journal of Engineering and Applied Sciences IJEAS, NZ, Vol.6 Issue 2(14), pp 94-101.
27. Singh B.R. and Singh O, 2010, Theoretical Investigations on Different Casing and Rotor Diameters Ratio to Optimize Shaft Output of a Vaned Type Air Turbine , International Journal of Engineering and Applied Sciences, IJEAS, NZ, Vol. 6 Issue 2(15), pp 102-109.
28. Singh B.R. and Singh O, 2010, Effect of Rotor to Casing Ratios with Different Rotor Vanes on Performance of Shaft Output of a Vane Type Novel Air Turbine , International Journal of Engineering and Applied Sciences, IJEAS, NZ, Vol. 6 Issue 4(33), pp 217-222.
29. Singh B.R. and Singh O, 2010, Effect of Different Vane Angle on Rotor - Casing Diameter Ratios to Optimize the Shaft Output of a Vaned Type Novel Air Turbine, International Journal of Engineering Science and Technology, Chennai, India, IJEST-ISSN-0975-5472,Vol. 2, Number 3 (2), pp 114-121.
30. Singh B.R. and Singh O, 2010, Study of Effect of Injection Angle to Rotor-Casing Diameter Ratios on Performance of a Vaned Type Novel Air Turbine, International Journal of Engineering Science and Technology, Chennai, India, IJEST-ISSN-0975-5472,Vol. 2, Number 4 (10), pp 409-417.

Study of Compressed Air Storage System as Clean Potential Energy for 21st Century
Globa
l Jo
urna
l of R
esea
rche
s in E
nginee
ring
Volum
e X
II
Issu
e vvvvI V
ersion
I
33
( A)
Janu
ary
201
2
31. Singh B.R. and Singh O., 2010, Critical Effect of Rotor Vanes with Different Injection Angles on Performance of a Vaned Type Novel Air Turbine,International Journal of Engineering and Technology, Chennai, India, IJET-ISSN: 0975-4024,Vol. 2 Number 2(28), 2010, pp. 118-123.
32. Singh B.R. and Singh O., 2010, Study of Influence of Vane Angle on Shaft Output of a Multi Vane Air Turbine, International Journal of Renewable and Sustainable Energy, AIP, New York, USA.ISSN:1941-7012;(The manuscript received on October 24, 2009, accepted April 09, 2010, and Published on May 6, 2010 ), Vol.2 Number 3, pp. 033101-16.
33. Singh B.R. and Singh O., 2010, Analytical Investigations on Different Air Injection Angles to Optimize Power Output of a Vaned Type Air Turbine, Internatinal Journal of Power and Energy,Westminster, London- SW1H 9JJ, UK, Proc. of IMechE, Part A: JPE-837, ISSN 0957-6509; (The manuscript was received 11th June 2009 and accepted for publication 7th October' 2009), Vol. 224, Number 3, 2010, pp. 305-312.
34. Singh B.R. and Singh O., 2010, Study of Effect of Rotor Vanes to Rotor-Casing Dimensions on Performance of a Zero Pollution Vane Type Novel Air Turbine, International Journal of the Physical Sciences, 5170-00200, Nairobi-73023 Victoria Island, Lagos, ISSN 1992-1950; (The manuscript IJPS-10-038 was received on February 01, 2010 and accepted on April 28, 2010)- Vol.5(5), 2010, pp. 547-556.
35. Singh B.R., and Singh O., 2010, Study of Influence of Different Rotor to Casing Diameter Ratios with Optimal Vane and Injection Angles on Shaft Output of a Multi-Vane Air Turbine, Inventi Rapid: Journal of Energy & Power, (2010), Vol. 1, Issue 1, 2010.
36. Singh B.R. and Singh O., 2011, Performance Investigations for Power output of a Vaned Type Novel Air Turbine, MIT International Journal of Mechanical Engineering, Moradabad, India, ISSN : 2230-7699, Vol.1(1), pp 9-16.
37. Singh Onkar, 2009, Reciprocating and Rotary Compressor, Applied Thermodynamics, New Age International (P) Ltd., Publishers, New Delhi, India, ISBN: 978-81-224-2583-3, Feb2009, pp797-798.

Study of Compressed Air Storage System as Clean Potential Energy for 21st CenturyGl oba
l Jo
urna
l of R
esea
rche
s in E
nginee
ring
Volum
e X
II
Issu
e vvvvI V
ersion
I
34
( A)
Janu
a ry
201
2
© 2012 Global Journals Inc. (US)
This page is intentionally left blank
© 2012 M. R. Ansari, S. Mohammadi, M.Khalaiji Oskouei. This is a research/review paper, distributed under the terms of the Creative Commons Attribution-Noncommercial 3.0 Unported License http://creativecommons.org/licenses/by-nc/3.0/), permitting all non commercial use, distribution, and reproduction in any medium, provided the original work is properly cited.
Two-phase Gas/Liquid-Solid Flow Modelling in 90° Bends and Its Effect on Erosion
By M. R. Ansari, S. Mohammadi, M.Khalaiji Oskouei Tarbiat Modares University
Abstract - Sand particles present in the fluid flows extracted from oil wells causes many problems for oil and gas production companies. Collision of sand particles to the wall of oil transfer pipes and process equipment reduces wall thickness which is considered as a cause of erosion. One of the consequences of this problem is frequent failures and loss of valuable production time. Bends installed in the path of oil and gas pipelines are at risk of such erosion as mentioned. This paper is a study of computational fluid dynamics to predict erosion in the bend geometry. It uses Lagrangian approximation which includes modeling of continuous flow of fluid, Lagrangian particle tracking and calculation relating to erosion. In this work, the effect of various parameters such as flow velocity, particle diameter, and bend geometry and particle-fluid density ratio on the particle motion and consequently erosion resulting from the collision of particle to bend wall is studied.
Keywords : Lagrangian approximation; Physical erosion; Erosion modeling; Particle-Fluid two-phase flow.
GJRE-A Classification : FOR Code: 030103
Two-phase GasLiquid-Solid Flow Modelling in 90Bends and Its Effect on Erosion
Strictly as per the compliance and regulations of:
Global Journal of researches in engineeringMechanical and mechanics engineeringVolume 12 Issue 1 Version 1.0 January 2012Type: Double Blind Peer Reviewed International Research JournalPublisher: Global Journals Inc. (USA)Online ISSN: 2249-4596 Print ISSN:0975-5861
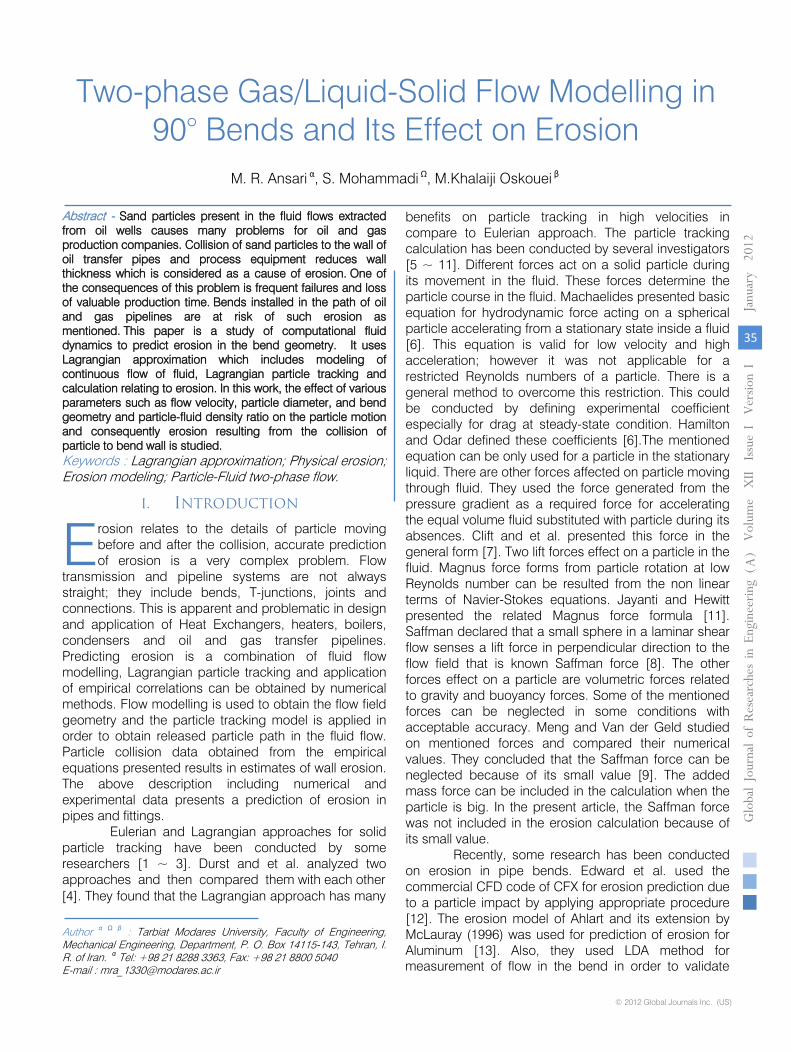
Two-phase Gas/Liquid-Solid Flow Modelling in 90° Bends and Its Effect on Erosion
M. R. Ansari α, S. Mohammadi Ω, M.Khalaiji Oskouei β
Abstract - Sand particles present in the fluid flows extracted from oil wells causes many problems for oil and gas production companies. Collision of sand particles to the wall of oil transfer pipes and process equipment reduces wall thickness which is considered as a cause of erosion. One of the consequences of this problem is frequent failures and loss of valuable production time. Bends installed in the path of oil and gas pipelines are at risk of such erosion as mentioned. This paper is a study of computational fluid dynamics to predict erosion in the bend geometry. It uses Lagrangian approximation which includes modeling of continuous flow of fluid, Lagrangian particle tracking and calculation relating to erosion. In this work, the effect of various parameters such as flow velocity, particle diameter, and bend geometry and particle-fluid density ratio on the particle motion and consequently erosion resulting from the collision of particle to bend wall is studied. Keywords : Lagrangian approximation; Physical erosion; Erosion modeling; Particle-Fluid two-phase flow.
I. INTRODUCTION
rosion relates to the details of particle moving before and after the collision, accurate prediction of erosion is a very complex problem. Flow
transmission and pipeline systems are not always straight; they include bends, T-junctions, joints and connections. This is apparent and problematic in design and application of Heat Exchangers, heaters, boilers, condensers and oil and gas transfer pipelines. Predicting erosion is a combination of fluid flow modelling, Lagrangian particle tracking and application of empirical correlations can be obtained by numerical methods. Flow modelling is used to obtain the flow field geometry and the particle tracking model is applied in order to obtain released particle path in the fluid flow. Particle collision data obtained from the empirical equations presented results in estimates of wall erosion. The above description including numerical and experimental data presents a prediction of erosion in pipes and fittings.
Eulerian and Lagrangian approaches for solid particle tracking have been conducted by some researchers [1 ~ 3]. Durst and et al. analyzed two approaches and then compared them with each other
Author α
Ω
β
: Tarbiat Modares University, Faculty of Engineering, Mechanical Engineering, Department, P. O. Box 14115-143, Tehran, I. R. of Iran. α
Tel: +98 21 8288 3363, Fax: +98 21 8800 5040
E-mail : [email protected]
[4]. They found that the Lagrangian approach has many
benefits on particle tracking in high velocities in compare to Eulerian approach. The particle tracking calculation has been conducted by several investigators [5 ~ 11]. Different forces act on a solid particle during its movement in the fluid. These forces determine the particle course in the fluid. Machaelides presented basic equation for hydrodynamic force acting on a spherical particle accelerating from a stationary state inside a fluid [6]. This equation is valid for low velocity and high acceleration; however it was not applicable for a restricted Reynolds numbers of a particle. There is
a
general method to overcome this restriction. This could be conducted by defining experimental coefficient especially for drag at steady-state condition. Hamilton and Odar defined these coefficients [6].The mentioned equation can be only used for a particle in the stationary liquid. There are other forces affected on particle moving through fluid. They used the force generated from the pressure gradient as a required force for accelerating the equal volume fluid substituted with particle during its absences. Clift and et al. presented this force in the general form [7]. Two lift forces effect on a particle in the fluid. Magnus force forms from particle rotation at low Reynolds number can be resulted from the non linear terms of Navier-Stokes equations. Jayanti and Hewitt presented the related Magnus force formula [11]. Saffman declared that a small sphere in a laminar shear flow senses a lift force in perpendicular direction to the flow field that is known Saffman force [8]. The other forces effect on a particle are volumetric forces related to gravity and buoyancy forces. Some of the mentioned forces can be neglected in some conditions with acceptable accuracy. Meng and Van der Geld studied on mentioned forces and compared their numerical values. They concluded that the Saffman force can be neglected because of its small value [9]. The added mass force can be included in the calculation when the particle is big. In the present article, the Saffman force was not included in the erosion calculation because of its small value.
Recently, some research has been conducted on erosion in pipe bends. Edward et al. used the commercial CFD code of CFX for erosion prediction due to a particle impact by applying appropriate procedure [12]. The erosion model of Ahlart and its extension by McLauray (1996) was used for prediction of erosion for Aluminum [13]. Also, they used LDA method for
E
Globa
l Jo
urna
l of R
esea
rche
s in E
nginee
ring
Volum
e X
II
Issu
e vvvvI V
ersion
I
35
( A)
Janu
ary
201
2
© 2012 Global Journals Inc. (US)
measurement of flow in the bend in order to validate

their theoretical obtained results. Comparison of the model results with experimental
results shows a reasonable agreement.
Keating and Nesic were studied a 180-degree
bend using the commercial CFD code PHOENICS with a separate code for tracking a particle by Lagrangian method in 2000 [14]. They compared their results for flow field with experimental results and showed that their results are valid. However, they used the upgraded model of Finnie, but no comparison or suggestion was given. Hansen and Petal used PHOENICS code to study erosion in bends of air lifting channels [15]. Their work is somehow different with the other recent studies. They also investigated the scratch shape by erosion. Zhong and Hengshuan worked on rectangular cross section bends, two dimensional non viscous flow with and without secondary flow in 1990 [16]. They also
used the Finnie model for erosion prediction. Wang and Shirazi studied erosion on 90° bends in 2003 [17]. They compared their numerical results with the experimental result of Eyler conducted for penetration rate in 1987. Even though their results have enough accuracy, however, they showed that their analysis differs from experimental results. They found the reason behind this, is that the particle flow rates is high in most of the experiments. They also found in long radius bends the erosion rate reduces as the main flow is gas. In the case of liquid flow, they showed that the squeeze film, secondary flow and an oscillation generated from turbulence flow has important role on the erosion rate. In
addition, the authors presented a 1st order approximate correlation based on CFD analysis for engineering calculation to estimate the bend radius effect on erosion in long-radius bends.
Fashami worked on particle motion at outside of a pipe and its effect on erosion at outer surface of the pipe [19]. The objectives of this paper is a single particle trace in a two dimensional bend, determining of velocity and impact angle with bend wall and finally prediction of erosion rate by using an erosion model. A statistical study of the most probable impact location in the bend will be presented. With respect to the fore mentioned points, the solution procedure will be as follows:
- Obtaining the flow field in the bend - Particle tracking in the flow field of the inside of
the bend obtained from the previous part - Obtaining the required information of the particle
impact on the wall and erosion probability rate calculation.
II.
THE GOVERNING EQUATIONS
a) The continues phase For modelling of incompressible steady-
state flow in the polar coordinate system in the radial and tangential directions, the mass and momentum conservation equations are as [20]:
1 ru 1 v+ =0r r r θ∂ ∂∂ ∂
(1)
2 2
2 2 2u v u v 1 P 1 ru 1 u 2 vu + - =- +ν + -r r θ r ρ r r r r r θ r θ
∂ ∂ ∂ ∂ ∂ ∂ ∂ ∂ ∂ ∂ ∂ ∂ ∂ ∂
(2)
u
and v are the velocities at radial and tangential direction, respectively.
b)
The discrete phase
The particle velocity equation at tangential direction is:
( ) fP P Pk f P θ
P P
ρdv u v=F v -v - 1- g -dt ρ r
(4)
The last term of the RHS of the above equation is the quasi coriolis force caused by the curvature effect of polar coordinate system on the particle.
The particle velocity on radial direction is:
( )2
fP Pk f P r
P P
ρdu v=F u -u - 1- g +dt ρ r
(5)
The last term of the RHS
in the above equation is the centrifugal force effecting on the
particle at the radial direction. Fk is the momentum transfer coefficient between the particle and fluid and can be obtained from:
Pk D2
P P
Re18μF = Cρ d 24
(6)
To calculate the drag coefficient, Wang and et al. declared an equation as presented by the following in 2003 [21]:
Two-phase Gas/Liquid-Solid Flow Modelling in 90° Bends and Its Effect on ErosionGl oba
l Jo
urna
l of R
esea
rche
s in E
nginee
ring
Volum
e X
II
Issu
e vvvvI V
ersion
I
36
( A)
Janu
a ry
201
2
© 2012 Global Journals Inc. (US)
( )P
P
0.687P
D PP
P
24 Re 1Re
24 1+0.15ReC = 1<Re 1000
Re0.44 Re >1000
≤ ≤
(7)
2
2 2 2v v v uv 1 P 1 rv 1 v 2 uu + + =- +ν + +r r θ r ρr θ r r r r θ r θ
∂ ∂ ∂ ∂ ∂ ∂ ∂
(3)
∂ ∂ ∂ ∂ ∂ ∂ ∂

In the above equation, the drag coefficient is a function of the particle Reynolds number and is defined as:
f P f PP
f
ρ d V -VRe =
μ
(8)
c)
Erosion model
At the present work, the model suggested by Wallace and Peters for erosion estimation is selected. They declare their equation by using the formula found experimentally by Neilson and Gilchrist in 1968 as [10]:
Two-phase Gas/Liquid-Solid Flow Modelling in 90° Bends and Its Effect on Erosion
Globa
l Jo
urna
l of R
esea
rche
s in E
nginee
ring
Volum
e X
II
Issu
e vvvvI V
ersion
I
37
( A)
Janu
ary
201
2
© 2012 Global Journals Inc. (US)
( ) ( )
( ) ( )
2 22 2P P-6 o
P
2 22 2P P-6 o
P
1 2 V cos αsin2α 1 2 V sin α1E×10 = + ; α 45N γ σ
1 2 V cos α 1 2 V sin α1E×10 = + ; α>45N γ σ
≤
(9)
In this equation, E is the erosion rate and its unit is mm3/gr. γ and σ are the cutting wear and deformation wear coefficient and are related to material properties or the body material specification. For carbon steel, their values are 33316.9 and 77419.7
III. NUMERICAL SOLUTION PROCEDURE
To solve continuous phase equations, the solution domain is divided to a large number of control volumes and then discredited equations are solved using the finite volume method. The details of the solution process have been presented by Patankar [22]. It should be noted that SIMPLE algorithm is used for decoupling of pressure and velocity. The grid size becomes finer near the bend wall as shown in Fig. 1.
To demonstrate mesh independency of the numerical results, the tangential velocity at the radial cross-section of the bend is shown in Fig. 2.
The figure shows that the developed code mostly behaviour independent of grid and mesh 40*40 is used because of formation of a complete curvature in the bend area.
Also, Fig. 2 can be applied for validation of continuum phase solution that needs to solve of Navier-Stokes PDEs. It has been observed that velocity in the centre line of channel reaches to 1.5 times of fluid average velocity (Fluid input velocity). This result has a good agreement with presented analytical solutions in the flow solution references [20]. See Fig. 3 for the bend curvature grid configuration.
For equations solution of the particle, the Range-Kutta of fourth order is applied.
IV. RESULTS AND DISCUSSION
Since Stokes number is used in the solution method, a brief definition is given as ratio of the particle response time to fluid time-scale characteristic. The Stokes number is related to three parameters as:
- Densities ratio- Second order of the particle diameter to
hydraulic diameter of channel ratio- Reynolds number of fluid flow
In modelling of the particles motion the following assumptions are used:
- Particles have spherical shape- The surface roughness is not included in the
calculationIn this paper the collision probability of particle
at different area of the bend is considered first and then obtained results are used for erosion estimation by particle. The particle track is presented for different Stokes numbers. The continuous phase is considered for two different fluids as water and air. The Reynolds numbers for the both air and water are kept same and in the laminar flow range. It should be mentioned that the density ratio is bigger than one for air and water cases. In all calculation cases the particle is started to move from the stationary condition and from the centre of distance between of the two side' walls and slightly before the bending start. See Fig. 4.
The results analysis show:By comparing the particle path for the same
Stokes numbers in air and water the results showed that the liquid cannot move (push) the particle in the flow direction and the particle changes its direction at the first half of the bend because of low flow velocity. Reynolds number is the same in both cases and assumed at laminar flow condition. It was concluded that the Stokes number is not a suitable parameter for comparison of a particle movement in two different fluids.
Comparison of particle collision location (point) in a fluid for different Stokes numbers showed that as Stokes number increases the particle impact at smaller angle of bend increases. To analyze this finding, it must be mentioned that the all three effective parameters of Stokes number have direct dependency with the particle inertia. In this paper the Reynolds number are kept constant and at the laminar flow area, thus the Stokes number change can be obtained by the change of two

Two-phase Gas/Liquid-Solid Flow Modelling in 90° Bends and Its Effect on ErosionGl oba
l Jo
urna
l of R
esea
rche
s in E
nginee
ring
Volum
e X
II
Issu
e vvvvI V
ersion
I
38
( A)
Janu
a ry
201
2
© 2012 Global Journals Inc. (US)
densities ratio were considered and presented in the following figures.
Fig. 5 shows the particle impact probability at different bend angle for different Reynolds number in the laminar flow field and density ratio of higher than one. With the mentioned conditions and knowing that the impact is in inner wall in density ratio greater than one, the most impact is happened between 0 up to 30º. The probability of not impacting in the bend wall and pass the bend is less than 10 percent.
Fig. 6 shows the particle impact probability at different location of bend for the different particle diameter from 50 to 500 microns. It shows that the particles with smaller diameter have higher probability to pass the bend without impact.
Fig. 7 shows the particle impact probability at different location of bend when the densities ratio changes from 100 to 700. The most impact probability happens at angles between 60 to 90º.
Finally, based on superposition of all probabilities and the final result for the particle impact probability at different bend location with respect to Stokes number it was concluded that the result for the all three location is almost similar. However, at 30 to 60º the impact is slightly lower than the other impact angles and the most impacts happens at the outer area of this zone, see Fig. 8. The velocity and the impact angle on the bend surface with respect to Stokes number were calculated and presented in Figs. 9 and 10 These figures show as the Stokes number which is particle inertia characteristic increases the impact velocity of the particle against the wall increases, but the impact angle (the tangent line direction at the same point on the bend wall) decreases. For the lower Stokes number (e.g. smaller diameter of a particle), the particle inertia is lower, so the particle can respond faster for velocity value changes near the wall that its result is lower impact velocity. On the other hand, the particle direction change in respect to wall will be delayed which cause the bigger impact angle.
The erosion rate by the particle impact, as mentioned before was estimated from Wallace and Peters' model declared in 2000. On this basis the volumetric erosion rate for a unit mass of eroded material (eroded carbon steel) was calculated by equation 9 and shown with respect to Stokes number in Fig. 11. The impact angle of particle at the bend was also shown on the same figure.
As it can be noticed from the figure, by increasing the Stokes number the particle inertia increases, so the particle deviate from its path at smaller angles and impacts the wall with higher inertia that means the erosion rate will increase.
V. CONCLUSION
In the present research, CFD simulation conducted on two-phase gas/liquid-solid flow in the bends by using two dimensional conservation equations at steady-state conditions. Different parameters of two-phase flow and the bend geometry and their effect on each other were considered by developing a computer code and finally the erosion rate on the wall werepredicted. The following points were concluded:
- The main parameter for the study of particle motion within the fluid, which is the Stokes number, depend on flow Reynolds number, particle to fluid density ratio and the ratio of particle diameter to channel hydraulic diameter. As a result, with increasing Stokes number the particle inertia increases.
- As the Stokes number increases, the particle inertia increase will be resulted. So, the particle deviation from the flow direction and the probability of impact with wall will be increased.
- The angle of impact depends on the particle inertia and can be between 20º to 90º.
- The Stokes number for the condition that the particle can move through the bend without impacting the wall is different for the density ratio of bigger than one and smaller than one and should not be used for comparison basis.
- The erosion rate obtained from the particle impact with wall at higher Stokes number is bigger because of higher particle inertia and this happens mostly at smaller angles of the bend.
- The erosion increases with increasing the impact velocity and decreases with increasing the approach angle.
REFERENCES REFERENCES REFERENCiaS
1. Picart, A., A. Berlemont, and G. Gouesbet, Modeling and predicting turbulence fields and the dispersion of discrete particles ransported by turbulent flows.Int J Multiphase Flow, 1986. 12(2): p. 237-261.
2. Tu, J., B. Lee, and C. Fletcher, Eulerian modeling of particle–wall collisions in confined gas-particle flows via a Lagrangian approach. ASME, Fluids Eng Div (Publication) FED, 1996. 236(1): p. 751-758.
3. Lu, Q., J. Fontane, and G. Auberitne, A Lagrangian model for solid particles in turbulent flows. Int JMultiphase Flow, 1993. 19(2): p. 347-367.
4. Durst, F., D. Milojevic, and B. Schonung, Eulerian and Lagrangian predictions of particulate two-phase flow: a numerical study. Appl Math Model, 1985. 8: p. 101-115.
The other important parameter studied in this paper is the impact probability of particle at different location of bend. For this purpose change of the main three parameters of Stokes number as Reynolds number of the fluid flow, the particle diameter and the
first parameters. So, by increasing Stokes number, the particle inertia increases and the particle have more tendencies to keep its movement direction without following the flow stream lines. This makes the collision angle reduces in the bend.

Two-phase Gas/Liquid-Solid Flow Modelling in 90° Bends and Its Effect on Erosion
Globa
l Jo
urna
l of R
esea
rche
s in E
nginee
ring
Volum
e X
II
Issu
e vvvvI V
ersion
I
39
( A)
Janu
ary
201
2
© 2012 Global Journals Inc. (US)
7. Clift, R., J. Grace, and M. Weber, Bubbles, drops and particles. 1978, New York: Academic Press.
8. Saffman, P., The lift on a small sphere in a slow shear flow. J Fluid Mech, 1965. 22(2): p. 385-400.
9. Meng, H. and V.d. Geld, Particle trajectory computations in steady non-uniform liquid flows.ASME, Fluids Eng Div (Publication) FED, 1991. 118(183-193).
10. Wallace, M., et al. CFD-based erosion modeling of multi-orifice choke valves. in Proceedings of 2000 ASME fluids engineering summer meeting. 2000. Boston, MA.
11. Jayanti, S. and G. Hewitt, Review of literature on dispersed two-phase flow with a view to CFD modeling, in Report AEA APS – 0099 from AEA Petroleum Services. 1991, AEA Technology, Harwell Laboratory: Oxon.
12. Edwards, J.K., B.S. McLaury, and S.A. Shirazi. Supplementing a CFD code with erosion prediction capabilities. in ASME Fluids Engineering Division Summer Conference. 1998: Paper FEDSM 98-5229.
13. McLaury, B., Predicting solid particle erosion resulting from turbulent fluctuations in oilfield geometries, in PhD Thesis, Department of Mechanical Engineering. 1996, University of Tulsa.
14. Keating, A. and S. Nesic. Particle tracking and
erosion prediction in three-dimensional bends. in Proceedings of FEDSM2000, ASME Fluids Engineering Summer Meeting. 2000. Boston, MA.
15. Hanson, R. and M.K. Patel. Development of a model to predict the life of pneumatic conveyor bends subject to erosive wear. in FEDSM2000-11246, Proceedings of the ASME Fluids Engineering Division Summer Meeting. 2000. Boston,MA.
16. Hengshuan, C. and X. Zhong, Numerical analysis and experimental investigation of erosion in variable rectangular-section bends by solid particles.Chinese Journal of Mechanical Engineering (English Edition), 1990. 3(1): p. 111-118.
17. Wang, J. and S.A. Shirazi, A CFD based correlation for erosion factor for long-radius elbows and bends.Transactions of the ASME, 2003. 125: p. 26-34.
18. Eyler, R.L., Design and analysis of a pneumatic flow loop, in M.S. Thesis. 1987: West Virginia.
19. Fashami, M.M., Two-phase gas-solid particle flow simulation for Eorsion phenomena at outer side of a pipe, M.Sc. thesis, Tarbiat Modares University, 2005, (in persian).
20. Fox, R.W., A.T. McDonald, and P.J. Pritchard, Introduction to Fluid Mechanics. 6 ed. 2004, New York: Wiley.
21. Wang, B., et al., Numerical study of gas-solid flow in a cyclone separator, in Third international confrence on CFD in minerals and process industries. 2003: Melbourne,Australia.
22. Patankar, S.V., Numerical heat transfer and fluid flow. 1980: Hemisphere Publishing Corporation.
5. Michaelides, E., Review – the transient equation of motion for particles, bubbles, and droplets. ASME J Fluids Eng, 1997. 119: p. 233-247.
6. Odar, F. and W. Hamilton, Forces on a sphere accelerating in a viscous fluid. J Fluid Mech, 1964. 18: p. 302-314.
Figures
Fig. 1 : Grid configuration for flow field equations solution

Two-phase Gas/Liquid-Solid Flow Modelling in 90° Bends and Its Effect on ErosionGl oba
l Jo
urna
l of R
esea
rche
s in E
nginee
ring
Volum
e X
II
Issu
e vvvvI V
ersion
I
40
( A)
Janu
a ry
201
2
© 2012 Global Journals Inc. (US)
Fig. 2 : Velocity profile for grid independency study using different meshes
Fig. 3 : The bend curvature mesh configuration

Two-phase Gas/Liquid-Solid Flow Modelling in 90° Bends and Its Effect on Erosion
Globa
l Jo
urna
l of R
esea
rche
s in E
nginee
ring
Volum
e X
II
Issu
e vvvvI V
ersion
I
41
( A)
Janu
ary
201
2
© 2012 Global Journals Inc. (US)
Fig. 4a, St=0.34Fig. 4f, St=0.34
St=0.78 Fig. 4b,Fig. 4g, St=0.78
St=1.1 Fig. 4c,St=1.1 Fig. 4h,

Two-phase Gas/Liquid-Solid Flow Modelling in 90° Bends and Its Effect on ErosionGl oba
l Jo
urna
l of R
esea
rche
s in E
nginee
ring
Volum
e X
II
Issu
e vvvvI V
ersion
I
42
( A)
Janu
a ry
201
2
© 2012 Global Journals Inc. (US)
5; a, b, c, d
St=1.27Fig : 4d,St=1.27Fig : 4i,
Fig. 5 : The particle impact probability at different area of bend wall by changing Reynolds number
St=5Fig : 4e,
Fig. 4 : Particle movement path inside the bend for different Stokes number of 0.34, 0.78, 1.1, 1.27 and and e for air and f, g, h and i for water

Two-phase Gas/Liquid-Solid Flow Modelling in 90° Bends and Its Effect on Erosion
Globa
l Jo
urna
l of R
esea
rche
s in E
nginee
ring
Volum
e X
II
Issu
e vvvvI V
ersion
I
43
( A)
Janu
ary
201
2
© 2012 Global Journals Inc. (US)
Fig. 6 : The particle impact probability at different area of bend wall by changing the particle diameter
Fig. 7 : The particle impact probability at different area of bend wall by changing the density ratios
Fig. 8 : The particle impact probability at different area of bend wall for different Stokes number
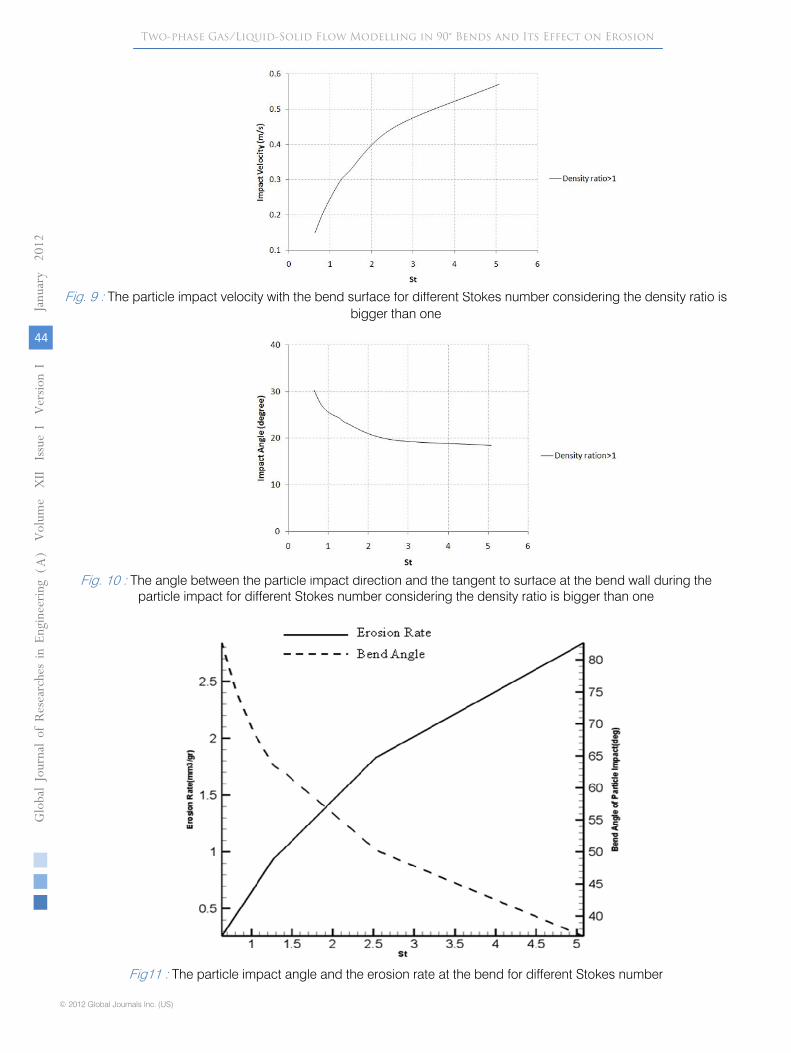
Gl oba
l Jo
urna
l of R
esea
rche
s in E
nginee
ring
Volum
e X
II
Issu
e vvvvI V
ersion
I
44
( A)
Janu
a ry
201
2
© 2012 Global Journals Inc. (US)
Fig. 9 : The particle impact velocity with the bend surface for different Stokes number considering the density ratio is bigger than one
Fig. 10 : The angle between the particle impact direction and the tangent to surface at the bend wall during the particle impact for different Stokes number considering the density ratio is bigger than one
Fig11 : The particle impact angle and the erosion rate at the bend for different Stokes number
Two-phase Gas/Liquid-Solid Flow Modelling in 90° Bends and Its Effect on Erosion
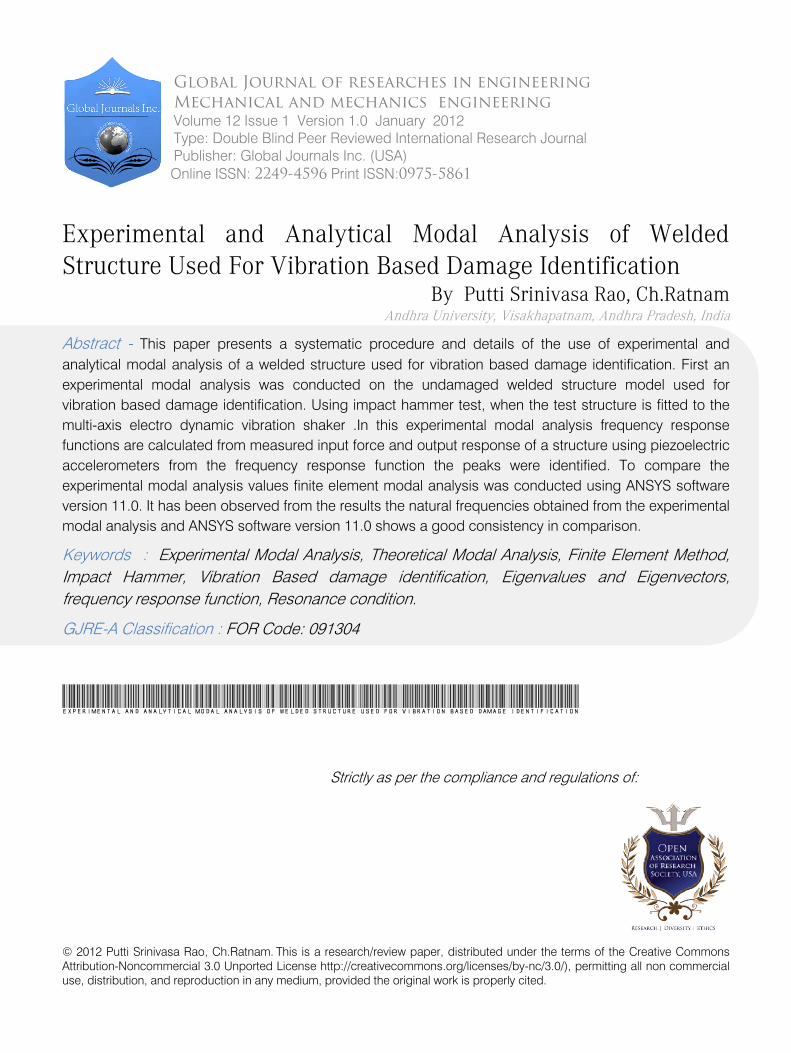
© 2012 Putti Srinivasa Rao, Ch.Ratnam. This is a research/review paper, distributed under the terms of the Creative Commons Attribution-Noncommercial 3.0 Unported License http://creativecommons.org/licenses/by-nc/3.0/), permitting all non commercial use, distribution, and reproduction in any medium, provided the original work is properly cited.
Experimental and Analytical Modal Analysis of Welded Structure Used For Vibration Based Damage Identification
By Putti Srinivasa Rao, Ch.Ratnam Andhra University, Visakhapatnam, Andhra Pradesh, India
Abstract - This paper presents a systematic procedure and details of the use of experimental and analytical modal analysis of a welded structure used for vibration based damage identification. First an experimental modal analysis was conducted on the undamaged welded structure model used for vibration based damage identification. Using impact hammer test, when the test structure is fitted to the multi-axis electro dynamic vibration shaker .In this experimental modal analysis frequency response functions are calculated from measured input force and output response of a structure using piezoelectric accelerometers from the frequency response function the peaks were identified. To compare the experimental modal analysis values finite element modal analysis was conducted using ANSYS software version 11.0. It has been observed from the results the natural frequencies obtained from the experimental modal analysis and ANSYS software version 11.0 shows a good consistency in comparison.
Keywords : Experimental Modal Analysis, Theoretical Modal Analysis, Finite Element Method, Impact Hammer, Vibration Based damage identification, Eigenvalues and Eigenvectors, frequency response function, Resonance condition.
GJRE-A Classification : FOR Code: 091304
Experimental and Analytical Modal Analysis of Welded Structure Used For Vibration Based Damage Identification
Strictly as per the compliance and regulations of:
Global Journal of researches in engineeringMechanical and mechanics engineeringVolume 12 Issue 1 Version 1.0 January 2012Type: Double Blind Peer Reviewed International Research JournalPublisher: Global Journals Inc. (USA)Online ISSN: 2249-4596 Print ISSN:0975-5861

Experimental and Analytical Modal Analysis of Welded Structure Used For Vibration Based
Damage Identification Putti Srinivasa Rao α, Ch.Ratnam Ω
Abstract - This paper presents a systematic procedure and details of the use of experimental and analytical modal analysis of a welded structure used for vibration based damage identification. First an experimental modal analysis was conducted on the undamaged welded structure model used for vibration based damage identification. Using impact hammer test, when the test structure is fitted to the multi-axis electro dynamic vibration shaker .In this experimental modal analysis frequency response functions are calculated from measured input force and output response of a structure using piezoelectric accelerometers from the frequency response function the peaks were identified. To compare the experimental modal analysis values finite element modal analysis was conducted using ANSYS software version 11.0. It has been observed from the results the natural frequencies obtained from the experimental modal analysis and ANSYS software version 11.0 shows a good consistency in comparison. Keywords : Experimental Modal Analysis, Theoretical Modal Analysis, Finite Element Method, Impact Hammer, Vibration Based damage identification, Eigenvalues and Eigenvectors, frequency response function, Resonance condition.
I. INTRODUCTION
ur dependency on mechanical, aerospace, marine and civil engineering infrastructures is increasing day by day. These structures
continue to be used, despite aging and the associated potential for damage accumulation. All these infrastructures are subjected to damage as a result of fatigue, overloading conditions, material degradation through environmental effects and unanticipated discrete events such as impacts or seismic events. Damage adversely affects the current or future performance of these infrastructures. Therefore, the interest in the ability to monitor the health of these infrastructures and damage identification at the earliest possible stage is very important to ensure performance standards, extend the operational lifespan, economical and maintain life-safety. Therefore the need for robust
Author α Ω
: Department of Mechanical Engineering, Andhra University, Visakhapatnam, Andhra Pradesh, India-530003.
E-mail : [email protected]
global damage identification methods
that can be applied to complex structures has led to the
development of methods that examine changes in the vibration parameter of the structure
[1-6].
The actual implantation of vibration based
damage identification using statistical process control for mechanical, aerospace, marine and civil engineering infrastructures starts with designing a proof of concept experiment. First, an excitation mechanism for vibration testing should be selected. The excitation methods fall into the two general categories of ambient and forced excitation methods. During ambient excitation, the input to a system is not generally measured. In contrast, excitation forces are usually applied in a controlled manner and measured when the forced excitation method is employed [7]. A resonance condition exists when the frequency of excitation due to any source coincides with a natural frequency of the structure. Therefore it is necessary to know the natural frequencies of the structure to be monitored prior to the experimentation. The modal analysis primarily concerns determination of natural frequencies and mode shapes of a dynamic structure. Once the modes are determined, they can be used in understanding the dynamic nature of the structure. Therefore Modal analysis is an important tool in vibration analysis, diagnosis, design, and control.
Vibration is a repetitive, periodic, or oscillatory
response of an engineering structure. The rate of the vibration cycles is termed “frequency”. Vibrations can naturally occur in an engineering structure and may be representative of its free and natural dynamic behavior. Vibrations may also be forced onto a structure through some form of excitation
[8]. The excitation forces may be either generated internally within the dynamic system, or transmitted to the structure through an external source. When the frequency of the forcing excitation coincides with that of the natural motion, the structure will respond more vigorously with increased amplitude. This condition is known as resonance, and the associated frequency is called the resonant frequency. Natural, free vibration is a manifestation of the oscillatory behavior in engineering structures, as a result of repetitive interchange of kinetic and potential energies among components in the structure.
O Globa
l Jo
urna
l of R
esea
rche
s in E
nginee
ring
Volum
e X
II
Issu
e vvvvI V
ersion
I
45
( A)
Janu
ary
201
2
© 2012 Global Journals Inc. (US)
Complex vibrating structures usually consist of components that possess distributed energy storage

and energy dissipative characteristics. An engineering structure, when given an initial disturbance and allowed to execute free vibrations without a subsequent forcing excitation, will tend to do so at a particular “preferred” frequency and maintaining a particular “preferred” geometric shape. This frequency is termed a “natural frequency” of the structure, and the corresponding shape (or motion ratio) of the moving parts of the structure is termed a “mode shape.” Any arbitrary motion of a vibrating structure can be represented in terms of its natural frequencies and mode shapes.
The limitations of the human mind are such that it cannot grasp the behavior of its complex structures in one operation. Thus the process of subdividing all complex structures into their individual components or “Finite elements” whose behavior is understood very easily, then rebuilding the original complex structures from the individual components or “Finite elements” to study its behavior. The term finite element was
first used by Clough in 1960
[9]
and gives the basic idea of Finite element method. The finite element method is a numerical method but is more general and powerful in its application to real world problems that involves complicated physics, geometry and/or boundary conditions. Engineering application of the Finite element method may be used in the three major categories of boundary value problems, namely 1) Equilibrium problems 2) Eigenvalue problems 3) Propagation or Transient problem
The generalized problem in free vibration is that of evaluating an Eigenvalue which is a measure of the frequency of vibration together with the corresponding eigenvector indicating the mode shapes. Actually the Eigenvalue problem may be considered as extension of the equilibrium problem in which critical values of certain parameters are determined in addition to the steady state configurations. The Eigenvalue-eigenvector calculation procedure falls into the three basic categories namely characteristic polynomial technique, vector iteration method and transformation method.
Aiming to investigate the vibration phenomena occurring in test structure first an experimental modal analysis (EMA) was conducted. The rapid development of finite-element techniques accompanied by tremendous technological progress in the field of personal computers allowed structural designers to use software packages like ANSYS for accurate simulation of structural behavior. In this work the experimental modal analysis (EMA)
values are compared with the results obtained from ANSYS software version 11.0.
The main purpose of this paper is to present our perspective concerning the evolution of modal analysis of the test structure used for vibration based damage identification, experimentally and compared the results obtained from ANSYS software package version 11.0.
II.
SPECIFICATIONS
OF
THE
TEST
STRUCTURE
The applicability of the proposed vibration based damage identification technique to structural health monitoring problems is implemented using the cantilever plate like structure. The geometry considered for this purpose is shown in Fig 1, where the two plates are welded to form a cantilever plate. The thicknesses of both the plates are 12 mm and are made up of carbon steel. The dimension of the first plate is 150 mm x 150 mm square plate and it is drilled with four 8 mm through holes at each corner of the plate. The centre of the drilled holes is at 18 mm from each corner of the plate. The dimension of the second plate is 150 mm x 100 mm and is welded to the plate one to form a cantilever plate like structure. The elastic module of the structure material (E) is 200 x 109 N/m2,
Poisson’s ratio 0.3 and the mass density is 7850 kg/m3.
The test structure is fitted to the multi axis electro dynamic vibration shaker with the help of four bolts and nuts as shown in Fig. 1
Fig.1 :
Test Structure fitted to the Multi Axis Electro Dynamic Vibration Shaker
III.
EXPERIMENTAL
MODAL
ANALYSIS(EMA)
Modal analysis is vital to understand and optimize the inherent dynamic behavior of structures, leading to lighter, stronger, and safer structures with better performance. Experimental modal analysis is based on determining the modal parameters by testing, unlike analytical modal analysis, where the modal parameters are derived from finite element models (FEMs). There are two ways of doing experimental modal analysis [10-15]. They are 1) Classical modal analysis and 2) Operational modal analysis. In classical modal analysis frequency response functions (or impulse response functions) are calculated from measured input forces and output responses of a
Experimental and Analytical Modal Analysis of Welded Structure Used For Vibration Based Damage Identification
Gl oba
l Jo
urna
l of R
esea
rche
s in E
nginee
ring
Volum
e X
II
Issu
e vvvvI V
ersion
I
46
( A)
Janu
a ry
201
2
© 2012 Global Journals Inc. (US)
structure. Most of the analysis in modal testing is performed in the frequency domain inside the analyzer.

The task of the analyzer is to convert analog time domain signal into digital frequency domain information compatible with digital computing and then to perform the required computations with these signals. Operational Modal Analysis is based on measuring only the output of a structure and using the ambient and operating forces as unmeasured input. It is used instead of classical mobility-based modal analysis for accurate modal identification under actual operating conditions, and in situations where it is difficult or impossible to control an artificial excitation of the structure. Classical modal analysis is a more mature technique in comparison to operational modal analysis, and is extremely useful in the design of engineering structures. Enhanced computing power and advances in finite element analysis (FEA) techniques have increased the fidelity of analytical model and in several cases have reduced the need for classical modal analysis, especially with legacy structures. However, classical testing will continue to be required to give engineers the confidence they need to continue to bring new product into development in today’s competitive market. Classical modal analysis relies heavily on adhering to the four primary assumptions: 1) observability, 2) linearity. 3) time invariant and 4) reciprocity.
When a modal test is performed on a test structure the objective is to measure data from which the modal parameters -
modal frequencies can be estimated. The most typical data used for parameter estimation are frequency response functions (FRFs), which use excitation input and the corresponding output of the test structure. Transient excitation is an input of short duration relative to the measured time record in contrast to random or sine inputs. The versatility of transient excitation techniques allows for several advantages over typical vibration
shaker input. Quick diagnostics of structures with short setup times are possible. The most commonly used method of transient excitation for modal testing is the impact hammer. The impact hammer used to excite the test structure during experimental modal analysis is shown in Fig. 2.
Fig. 2 : Impact Hammer
The idea of exciting a structure with an impact hammer actually involves striking the structure at a particular location and in particular direction with an impact hammer as shown in Fig. 3. Instrumented with a
force transducer located behind the tip, the impact hammer measures the force used to excite the structure.
The force input and corresponding responses are then used to compute the FRFs. The FRFs obtained from the impact hammer test is shown in Fig.4. Testing with impact hammer has some very distinct advantages. The input spectrum from the impact is flat out to the roll-off frequency with no holes in the spectrum. The technique can be very efficient and portable compared to the aligning and moving of shakers and their associated control systems.
Fig. 3 :
Experimental setup for Impact Hammer test
The natural frequencies of the test structure which were identified with the peaks in FRFs plot and the values up to five kHz are tabulated in table 1.
Table 1 : Result Obtained From Experimental Modal Analysis (Impact Hammer Test)
Mode Number
Natural Frequency in Hz
1
862.5
2
1737.5
3
2159.4
4
2631.3
5
4050.0
Experimental and Analytical Modal Analysis of Welded Structure Used For Vibration Based Damage Identification
Globa
l Jo
urna
l of R
esea
rche
s in E
nginee
ring
Volum
e X
II
Issu
e vvvvI V
ersion
I
47
( A)
Janu
ary
201
2
© 2012 Global Journals Inc. (US)
Fig.4 : Impact Hammer FRFs Measured from the Test Structure
FRF PLOT FOR THE TEST STRUCTURE IN FOUR BOLT FIXED CONDITION
0
5
10
15
20
25
30
35
40
0 500 1000 1500 2000 2500 3000 3500 4000 4500 5000
NATURAL FREQUENCY Hz
m/s^
2/N

IV.
MODAL
ANALYSIS
USING
ANSYS
In this application the plate is subjected to transverse loads and in-plane loads and at any point inside the plate experiences both in-plane and lateral displacements. The natural frequencies for the test structure are calculated using SHELL63
element in ANSYS
software version 11.0. SHELL63
has both bending and membrane capabilities. Both in-plane and normal loads are permitted for the SHELL63 element. The element has six degrees of freedom at each node i.e., translations in the nodal x, y,
and z
directions and rotations about the nodal x, y,
and z-axes.
The geometry, node locations, and the coordinate system for SHELL63
element are shown in Fig.5. The SHELL63
element is defined by four nodes, four thicknesses, elastic foundation stiffness, and the orthotropic material properties. Orthotropic material directions correspond to the element coordinate directions. In this application the thickness of the element is constant. The elastic foundation stiffness (EFS) is defined as the pressure required to produce
a unit normal deflection of the foundation. The elastic foundation capability is bypassed if EFS
is less than, or equal to, zero.
Fig.5
: SHELL63 Element Geometry
Table 2 : Results Obtained From Ansys Software Package Version 11.0
Mode Number
Natural Frequency in Hz
1
885.2
2
1731.0
3
2164.0
4
2626.0
5
4053.0
6
5454.0
7
6752.0
8
6859.0
9
6957.0
The total number of nodes generated in the meshing of the test structure is 1289, and the total number of elements is found to be 1164. The first nine
natural frequencies for the test structure are then calculated and the values are tabulated in table 2. The resultant deformation at each natural frequency and corresponding figures are given in Fig 6.
First Natural Frequency Second Natural Frequency
Third Natural frequency Fourth Natural Frequency
Experimental and Analytical Modal Analysis of Welded Structure Used For Vibration Based Damage Identification
Gl oba
l Jo
urna
l of R
esea
rche
s in E
nginee
ring
Volum
e X
II
Issu
e vvvvI V
ersion
I
48
( A)
Janu
a ry
201
2
© 2012 Global Journals Inc. (US)
Fifth Natural Frequency Sixth Natural frequency

Seventh Natural Frequency Eighth Natural Frequency
Ninth Natural frequency
Fig.6 : First Nine Natural Frequencies of the Test Structure
V.
RESULTS
AND
DISCUSSIONS
The actual implantation of vibration based damage identification using statistical process control for mechanical, aerospace, marine and civil engineering infrastructures starts with designing a proof of concept experiment. First, an
excitation mechanism for vibration testing should be selected. The excitation methods fall into the two general categories of ambient and forced excitation methods. A resonance condition exists when the frequency of excitation due to any source coincides with a natural frequency of the structure. Therefore it is necessary to know the natural frequencies of the structure to be monitored prior to the experimentation. Experimental and analytical modal analysis of a welded structure used for vibration based damage identification was conducted.
The natural frequencies obtained from the experimental modal analysis using impact hammer test and finite element modal analysis using ANSYS version 11.0 software package were compared. It has been observed that the natural frequencies obtained from the
experiment are almost coinciding with the ANSYS results. The table 3 shows the comparison of natural frequencies obtained from the experiment and ANSYS; and it shows a quite satisfactory correlation.
Table 3 : Comparisons Of Natural Frequencies
Mode Number
Natural Frequencies of the test structure in Hz
Experimentally
ANSYS
1
862.5
885.2
2
1737.5
1731.0
3
2159.4
2164.0
4
2631.3
2626.0
5
4050.0
4053.0
6
--
5454.0
7
--
6752.0
8
--
6859.0
9
--
6957.0
VI.
CONCLUSIONS
This paper presents a systematic procedure and details of the use of experimental and analytical modal analysis of a welded structure used for vibration based damage identification. It has been concluded from the results that the natural frequencies obtained
from the experimental modal analysis and ANSYS software version 11.0 shows a good consistency in comparison.
REFERENCES
REFERENCES
REFERENCIAS
1.
Putti srinivasa Rao and Ch.Ratnam “Damage Identification of Welded Structures Using Time Series Models and Exponentially Weighted Moving Average Control”
Jordan Journal of Mechanical and Industrial Engineering, Vol.4, (2010) 701-710.
Experimental and Analytical Modal Analysis of Welded Structure Used For Vibration Based Damage Identification
Globa
l Jo
urna
l of R
esea
rche
s in E
nginee
ring
Volum
e X
II
Issu
e vvvvI V
ersion
I
49
( A)
Janu
ary
201
2
2. Putti srinivasa Rao and Ch.Ratnam “Vibration Based Damage Identification Using Burg’s Algorithm and Shewhart Control Charts” Journal of ASTM International, Vol. 8, No. 4, (2011).
3. Ch.Ratnam, J.Srinivas and B.S.N Murthy, “Damage detection in mechanical system using Fourier co-efficients” Journal of sound and vibration, Vol. 303, (2007) 909-917.
4. A. Deraemaeker, E. Reynders, G. De Roeck, J. Kullaa “Vibration-based structural monitoring using output-only measurements under changing environment” Mechanical systems and signal processing,Vol.22, (2008) 34-56.
5. I. Trendafilova, “Vibration-based damage detection in structures using time series analysis” Proceedings of the Institute of Mechanical Engineering Part C- Journal of mechanical engineering science, Vol.220, no.3, (2006) 261-272.
6. J.M.Nichols, S.T.Trickey, M.Seaver, S.R.Motley and
© 2012 Global Journals Inc. (US)
7.
Hoon Sohn, Charles R. Farrar,Francois M. Hemez,Devin D. Shunk,Daniel W. Stinemates, Brett R. Nadler and Jerry J. Czarnecki “A Review of Structural Health Monitoring Literature: 1996–2001” LA-13976-MS, Los Alamos National Laboratory, USA, 2004.
8.
Clarence W. de Silva “Vibration Fundamentals and Practice” Boca Raton: CRC Press LLC, International Standard Book Number 0-8493-1808-4, Printed in the United States of America, 2000.
9.
Singiresu S.Rao “The finite Element method in Engineering” Butterworth-Heinemann Publisher, a member of Reed Elsevier group, 3rd
Edition, 2001.
10.
M.J.Carre and S.J.Haake “An examination of the clegg impact hammer test with regard to the playing performance of synthetic sports surfaces” sports engineering vol.7, 121-129 2004.
11.
Anayet U.Patwari, Waleed F.Faris, A.K.M.Nurul Amin, and S.K.Loh “Dynamic Modal Analysis of Vertical Machining Centre Components” Advances and Vibration vol.2009, Article ID 508076, 10 pages.
12.
Alvaro Cunha and Elsa Caetano” Experimental Modal Analysis of Civil Engineering Structures”.
13.
C.Delprete, A.Galeazzi and F.prengo”Experimental Modal Analysis of an Automotive Power train”, Applied Mechanics and Materials Vol.24-25, 71-76 2010.
14.
T.G.Carne and E.C.Stasiunas” Lessons Learned In Modal Testing-
Part 3: Transient Excitation For Modal Testing, More Than Just Hammer Impacts” Society for Experimental Mechanics, May/June 2006.
15.
Kenneth A.Ramsey, Structural Measurement Systems, San Jose, California” Experimental Modal Analysis, Structural Modifications and FEM Analysis on a Desktop Computer” Sound and Vibration, February
Experimental and Analytical Modal Analysis of Welded Structure Used For Vibration Based Damage Identification
Gl oba
l Jo
urna
l of R
esea
rche
s in E
nginee
ring
Volum
e X
II
Issu
e vvvvI V
ersion
I
50
( A)
Janu
a ry
201
2
© 2012 Global Journals Inc. (US)
journal of vibration and acoustics, Vol. 129, (2007) 710-717.
E.D.Eisner “using ambient vibrations to detect loosening of a composite-to-metal bolted joint in the presence of strong temperature fluctuations” ASME
1983.

© 2012 Saif Imam, Ashok Tripathi, Sudipto Sarkar. This is a research/review paper, distributed under the terms of the Creative Commons Attribution-Noncommercial 3.0 Unported License http://creativecommons.org/licenses/by-nc/3.0/), permitting all non commercial use, distribution, and reproduction in any medium, provided the original work is properly cited.
Lean Sigma A Road to Success: A Perspective of the Indian Automobile Industry
By Saif Imam, Ashok Tripathi, Sudipto Sarkar
Jazan University, Jazan, Saudi Arabia
Abstract -
The globalization of the auto industry increasingly fosters the formation of new alliances. As a resultant of this the automobile Industry in India is now working in terms of the dynamics of an open market. In order to achieve a breakthrough profit performance in a tight competitive environment and with the shadow of a never ending recession looming over, it is necessary to have a single heuristic approach to fight against the adversities of the market. In order to capitalize on the opportunities, the industry needs to develop or acquire technologies and capabilities to produce vehicles that meet future market needs. Thus, with respect to these factors this paper aims to develop lean sigma model for automobile industry and reveal the different processes involved in the manufacture of automobile. This paper also gives a brief review of the history of Indian Automobile Industry and summarizes the developments in the course.
Keywords :
Lean manufacturing, Six sigma, Value-stream mapping, SMED, DMAIC.
GJRE-A Classification
: FOR Code: 090299
Lean Sigma A Road to Success A Perspective of the Indian Automobile Industry
Strictly as per the compliance and regulations of:
Global Journal of researches in engineeringMechanical and mechanics engineeringVolume 12 Issue 1 Version 1.0 January 2012Type: Double Blind Peer Reviewed International Research JournalPublisher: Global Journals Inc. (USA)Online ISSN: 2249-4596 Print ISSN:0975-5861

Lean Sigma A Road to Success: A Perspective of the Indian Automobile Industry
Saif Imam α, Ashok Tripathi Ω, Sudipto Sarkar β
Abstract - The globalization of the auto industry increasingly fosters the formation of new alliances. As a resultant of this the automobile Industry in India is now working in terms of the dynamics of an open market. In order to achieve a breakthrough profit performance in a tight competitive environment and with the shadow of a never ending recession looming over, it is necessary to have a single heuristic approach to fight against the adversities of the market. In order to capitalize on the opportunities, the industry needs to develop or acquire technologies and capabilities to produce vehicles that meet future market needs. Thus, with respect to these factors this paper aims to develop lean sigma model for automobile industry and reveal the different processes involved in the manufacture of automobile. This paper also gives a brief review of the history of Indian Automobile Industry and summarizes the developments in the course. Keywords : Lean manufacturing, Six sigma, Value-stream mapping, SMED, DMAIC.
I. INTRODUCTION
utomotive industry is the key driver of any growing economy. It plays a pivotal role in country's rapid economic and industrial development. It caters to
the requirement of equipment for basic industries like steel, non-ferrous metals, fertilizers, refineries, petro-chemicals, shipping, textiles, plastics, glass, rubber, capital equipments, logistics, paper, cement, sugar, etc. It facilitates the improvement in various infrastructure facilities like power, rail and road transport. Due to its deep forward and backward linkages with almost every segment of the economy, the industry has a strong and positive multiplier effect and thus propels progress of a nation.
The Indian automobile industry at present is experiencing an unprecedented boom in the demand for vehicles of all types. This boom has been primarily stemmed from two major factors; firstly, because of the rise in the disposable incomes and the standard of living of the middle class Indian families and secondly due to the Indian government's liberalization measures such as
relaxation of the foreign exchange and equity regulations, reduction of tariffs on imports, and banking liberalizations. Industry watchers have predicted that the passenger vehicle sales will triple in the next five years to about one million, and as the market grows and the customer's purchasing abilities rise, there will be greater demand for high-end luxurious models also which currently constitute only a tiny fraction of the market. These trends have encouraged many giant multinational automakers to enter the Indian market. This is just one face of the coin. To get a better idea let us take a brief history of the Indian Automobile Industry.
a)
History of
the Indian Automobile Industry
For several years after India’s independence from the British in 1947, the Indian car market was dominated by two localized versions of ancient European designs --
the Morris Oxford, popularly also known as the Ambassador, and an old Fiat. This was mainly due to the Indian government's complex regulatory system that effectively banned foreign-owned operations. Within this system, any Indian firm that wanted to import either technology or products needed a license from the government. The tedious process of obtaining these licenses stifled automobile and component imports.
As a result of this, the Indian automobile industry had become a low volume and high cost car industry that was not only inefficient and unprofitable, but also technologically obsolete.
Pingle (2000) reviews the policy framework of India’s automobile industry in which he stated that the Indian Government was characterized by socialist ideology resulting in protection to the domestic auto industry and entry barriers for foreign firm between 1940's and 50's. During the next phase of rules, regulations and politics, the Indian auto industry was affected by many political developments and economic problems especially for passenger car segment. This is the period between in 1960' and 70's. In the early 1980's considering it as a third phase it was characterized by delicensing, liberalization and opening up of FDI in the auto sector. Narayanan (1998) analyses the effects of deregulation policy on technology acquisition and competitiveness in the Indian automobile industry during the 1980s and finds that competitiveness has depended on the ability to build technological advantages, even in an era of capacity-licensing. These policies resulted in the establishment of new LCV manufacturers. In the early
A
Globa
l Jo
urna
l of R
esea
rche
s in E
nginee
ring
Volum
e X
II
Issu
e vvvvI V
ersion
I
51
( A)
Janu
ary
201
2
© 2012 Global Journals Inc. (US)
Author α : Lecturer,Department of Mechanical Engineering, Faculty of Engineering, Jazan University, Jazan, Saudi Arabia.E-mail : [email protected] : Professor, Faculty of Engineering & Technology, Sam Higginbottom Institute of Agriculture, Technology & Sciences, Allahabad- Uttar Pradesh, India.E-mail : [email protected] : Associate Professor,Department of Mechanical Engineering, G.L.Bajaj Institute of Technology & Management Greater Noida- Uttar Pradesh, India. E-mail : [email protected]
Ω
β

economy porous to foreign investment and trade. In 1993, the Indian government brought a wave of FDI to India's vehicle industry. Import barriers have been progressively relaxed. Today, almost all of the major global players are present in India. The automotive industry is today a key sector of the Indian economy and a major foreign exchange earner for the country. The government further followed up its earlier liberalization measures with significant reductions in the import duty on automobile
components. As a results of these measures, the automotive industry experienced growth rates of above 25% which have been increasing since.
b)
Present Scenario and scope for future
Based on the data available at Business portal of India, India is the world's
second largest manufacturer of two wheelers, fifth largest manufacturer of commercial vehicles as well as largest manufacturer of tractors. It is the fourth largest passenger car market in Asia as well as a home to the largest motor cycle manufacturer. The installed capacity of the automobile sector has been 9,540,000 vehicles, comprising 1,590,000 four wheelers (including passenger cars) and 7,950,000 two and three wheelers. The sector has shown great advances in terms of development, spread, absorption of newer technologies and flexibility in the wake of changing business scenario. In the past two years, a number of multi-national firms have announced plans to enter the Indian market.
Besides, the announcement of 'Automotive Mission Plan' for the period of 2006-2016 is a major step taken to make India a global automotive hub. The Mission Plan aims to make India emerge as the destination of choice in the world for design and manufacture of automobiles and auto components, with output reaching a level of US$ 145 billion (accounting for more than 10% of the GDP) and providing additional employment to 25 million people by 2016. It envisages increase in production of automotive industry from the current level of Rs. 169000 crore to reach Rs. 600000 crore by 2016. McKinsey (2005) predicts the growth potential of India-based automotive component manufacturing at around 500 per cent, from 2005 to 2015.The Mission seeks to oversee the development of the automotive industry, that is, the present scenario of the sector, its broad role in the growth of national economy, its linkages with other key facets of the economy as well as its future growth prospects. This
is involved in improving the automobiles in the Indian
domestic market, providing world class facilities of automotive testing and certification as well as ensuring a healthy competition among the manufacturers at a level playing field.
The future challenges for the Indian auto industry in achieving the targets defined in the Automotive Mission Plan would primarily consist of developing a supply base in terms of technical and human capabilities, achieving economies of scale and lowering manufacturing costs, as well as overcoming infrastructural bottlenecks. While, the role of industry is primarily of designing and manufacturing products of world-class quality standards, establishing cost competitiveness, improving productivity of both labour and capital, achieving scale and R & D enhancing capabilities as well as showcasing India’s products in potential markets.
As can be inferred from the literature, the emergence of foreign companies into the Indian market will lead to a tough competition amongst the indigenous companies to remain in the market. The need of the hour in today’s highly competitive global economy requires even the most well established manufacturers to continuously improve their quality while reducing costs. This has become an essential for their survival. With the tight budget constraints and cost cuts, producing more with less has become the key to market leadership and sustainable competitive advantage. Changing production methods from mass production with high inventory to a leaner operation with low inventory has become an essential for successful manufacturers. As the concept of Lean six sigma satisfies both cost and quality constraints related to both products and services, many organizations would want to adapt the same.
II.
LITERATURE REVIEW: LEAN
SIGMA
The concept of mass production was established in the early 19th
century by Henry Ford (1913). This formed the building block for systemization of Lean production. Later in the century, at the end of the Second World War, the scarcity of resources coupled with intense domestic competition in the Japanese market for automobiles led to further innovations. Taiichi Ohno (1988) a former executive vice president of Toyota furthered the concept of Henry Ford and focused on the elimination of waste and tailored a more efficient production system according to the need of the Japanese market. Initially during the 1950’s, this work was applied basically to car engine manufacturing followed by vehicle assembly in the 1960’s and then to wider supply chain. This production philosophy was widely known as the Toyota production system in Japan. It was only in 1986 that Womack and Jones (1990) labeled it as “Lean Production and Lean thinking”. The term Lean was used by John Krafick (1988) to describe the new production techniques that were used at Toyota.
Lean Sigma A Road to Success: A Perspective of the Indian Automobile IndustryGl oba
l Jo
urna
l of R
esea
rche
s in E
nginee
ring
Volum
e X
II
Issu
e vvvvI V
ersion
I
52
( A)
Janu
a ry
201
2
© 2012 Global Journals Inc. (US)
though limited, at reforming the automotive industry and thus initiated a joint venture with Suzuki of Japan. This landmark joint-venture called Maruti Udyog Limited launched a small but fuel efficient model priced at about $5,500.This new product perfectly caught the fancy of the Indian people and became an instant rage. In 1991, the government further initiated a series of economic liberalization measures designed make the Indian
1980's, the Indian government made a few efforts, all

5. The continuous pursuit of perfection.
According to Womack and Jones (1990) Lean refers to the total enterprise, from the shop-floor to the executive suite and from the supplier to customer value chain. It optimizes the skills of the workforce by encouraging continuous improvement activities and aims at achieving perfect value by the elimination of waste. By the application of Lean processes, an organization basically
aims at being able to manufacture a large variety of products of high quality at a lower cost within a lesser time and with less investment. Between late eighties and early 90's lean concentrates on the shop floor. Later in the 1990’s, Lean had moved away
from a “shop floor focus” on waste and cost reduction to a more customer centric approach, where it tried to increase value to customers by adding product features and eliminating wasteful activities linked to customer requirement. Lean is defined by Womack and Jones (1994) as the systematic removal of waste by all members of the organization from all areas of the values stream. Kannan and Tan (2005) have referred Lean as a cost-reduction mechanism, which strives to make organizations more competitive in the market by increasing efficiency, decreasing costs incurred due to elimination of non value-adding (VA) steps and inefficiencies in the processes, at the same time simultaneously reduces cycle times and increases profit for the organization. This is achieved by identifying and removing wasteful activities with the help of the tool known as value stream mapping in lean terminology. With the help of this, analysis can also be done on the activities in the process. Value stream represents the “flow of value” to these organizations. Worley and Doolen (2006) made an analysis primarily based on identifying activities that add value to the product or activities. They classified this as muda-
the Japanese word for waste. Kannan and Tan (2005) also found that waste can be found in all activities in the value stream, especially where the product moves from one department to another. Taj and Berro (2005) claimed that many manufacturing companies waste over 70 percent of their resources. Jones et al (1997) examined that for many organizations, less than 10 percent of activities often are value adding and as much as 60 percent do not add any value at all. Similarly, Bhasin and Burcher (2006) identified that implementing Lean can reduce waste by 40 percent and recognized
seven typical forms of waste as overproduction, waiting, transportation, inappropriate processing, excess inventory, unnecessary motion, and defects. According
to Claycomb et.al. (1999) the lean system promotes conditions necessary to manufacture high quality products to meet market demand with relatively small levels of inventory. Here, holding costs can be diminished by ordering the materials whenever needed and producing the items as per the forecasted demand. As a result, “companies have substantially cut lead times, drastically reduced raw material, work-in-process and finished goods inventories, and effectively increased asset turnover”.
Brady and Allen (2006) reviewed that Six Sigma concepts were developed at Motorola through the efforts of Bill Smith, a reliability engineer, in the 1980s. This method was adopted by many US Companies, including GE and Allied Signal. It was in fact through the work of Jack Welch, the CEO of GE in 1995, that Six Sigma found its popularity amongst companies. The term “Six Sigma” refers to a statistical measure of defect rate within a system. This typically presents a structured and systematic approach to process improvement, aiming for a reduced defect rate to 3.4 defects for every million opportunities. Pande et.al. (2000) stated six sigma is a strategic, company-wide approach which helps in reducing costs of a project and increasing customer satisfaction by focusing on reducing variations. George (2002) reviewed that six sigma uses tollgate at the end of each phase. These five tollgate or phases are: define, measure, analyze, improve, and control (DMAIC). This DMAIC methodology is designed specifically for improvement of existing processes which helps in reducing costs of a project and increasing customer satisfaction by
focusing on reducing variations. Pojasek (2003) mentioned using statistical methods, organizations are able to understand fluctuations in a process, which allows them to pinpoint the cause of the problem and subsequently help in improving the process by eliminating root causes, and controlling the process to make sure that the defects do not reappear. According to Sower et.al. (1999) the root of six sigma lies in the concept of total quality management where everyone in an organization is responsible for the quality of goods and services produced by the organization. Apart from this, the other
components of Six Sigma that can be traced to Total Quality Management (TQM) include the focus on customer satisfaction when making management decisions, and a significant investment in education and training in statistics, root cause analysis, and other problem solving methodologies.
Lean Six Sigma is a widely applied program for company wide quality improvement. It is the synthesis of Six Sigma and Lean. Using one of
these tools has limitations. Since lean eliminates the use of Six Sigma’s DMAIC cycle on the other hand, Six Sigma eliminates defects but does not address how to optimize the process flow. Hence, applying both Six Sigma and Lean tools sets results in far better improvements than could be achieved with either one method alone.
Lean Sigma A Road to Success: A Perspective of the Indian Automobile Industry
Globa
l Jo
urna
l of R
esea
rche
s in E
nginee
ring
Volum
e X
II
Issu
e vvvvI V
ersion
I
53
( A)
Janu
ary
201
2
© 2012 Global Journals Inc. (US)
1. Elimination of waste (or muda in Japanese);2. The identification of the value stream;3. The achievement of flow through the process;4. Pacing by pull (or kanban, a Japanese term) signal;
The five key principles of Lean as identified of Lean Thinking given by Womack and Jones (1996) include:

authority a survey was conducted. This survey was based on the individual visits to the shop-floor in order to understand the manufacturing processes involved in each industry. Along with this a detailed subjective interview of the employees of these industries was conducted. The employees interviewed belong to different levels of the industrial hierarchy from shop floor technicians to the production managers. Further details about the operating processes was obtained from the officially available data in the form of magazines and the other brochure of the companies. From the information collected on the basis of aforesaid sources the following details were collected.
a)
Major Components of Production Division Major Components of Production Division in
the Automobile Industry are;
Press Shop and Blanking Line, Weld Shop, Paint Shop, Engine Assembly, Assembly Shop, Machine Shop Materials, Casting, Engine, Vehicle Inspection.
Press shop can be regarded as the
starting point of the car manufacturing process. The weld shop as per the requirements picks the finished body parts from the press shop. These may be sub divided as according to size of blanks. Like ‘A’ components are large outer components as for example roof, door panels etc. Press Shop produce sheet metal components for different
models.
Press shop has Press machines it can be according to the capacity of the press shop ranging from 4000 ton to 22000 ton in terms of total capacity i.e. draw, trim, pierce, bend, re-strike & 1 Tandem line.
Coil
processing lines (ROSL – Shear line & Blanking line).
Capacity can be of 55,000 strokes / day from 400
tons of steel coils. Mass production presses are continuous flow transfer presses. Set of 4 to 5 dies are mounted on single press & complete panel comes out from press after going through stamping, trimming & piercing. Steel coil which are CRS coils made up of mild steel is a raw material used to make body sheet metal parts. Its thickness ranges from 0.65 mm to 0.8 mm & weight from 1 ton to 4 tons. Steel coils are received in bulk quantities & stored at a centralized storage & supplied to blank cutting areas as per plan. Steel coils are fed to Blanking & ROSL lines by overhead EOT cranes. Sheet is first de-coiled, cleaned, oiled & fed to cutting or shearing areas of blanking or ROSL lines.
Coils are fed to blanking line & continuous supply of sheet to cutting dies result in shaping of coils to plan blanks.
Blanks are cut by stamping or shearing process
& are stacked one by one to form large mass of blanks. The stacks of blanks are further sent to press machines
for forming into shape of body panels.
Blanks are
Fig.1
:
Shows the cutout panels are stacked properly together
in a trolley in order to maintain 5-S culture.
Types of Panels
1.
External (skin) panels, such as fenders, bonnet, decklid, roof, side panels, doors, etc. Some of these are two panels in a set as left hand and right hand
2.
Internal mating panels, such as bonnet inner, decklid inner or door inner deciding subassembly quality
3.
Dimensionally critical inner panels that are complicated either
because of their complex shape or severe draw condition, such as, floor pans, dash panel, etc.
Fig.2 :
A completed
panel after press work
The body panels produced in the press shop and the other small components are joined here to give the “white body” or “shell”. In a typical car body 1400
Lean Sigma A Road to Success: A Perspective of the Indian Automobile IndustryGl oba
l Jo
urna
l of R
esea
rche
s in E
nginee
ring
Volum
e X
II
Issu
e vvvvI V
ersion
I
54
( A)
Janu
a ry
201
2
© 2012 Global Journals Inc. (US)
different components are welded together. The weld shops should have the following facilities; Welding jigs, Spot welding guns, welding robots, hemming machines, punching machines. The weld shop has different lines for different models, each of, which is further divided into three parts:
supplied to press lines for pressing. Blanks are converted to body panels by this process. Panels are stored in pallets which are supplied to Weld Shops for making White Bodies.
Based on an extensive research of the available data 5 major automobile industries in and around the Indian capital were shortlisted. After obtaining due permission from the concerned
III. METHODS AND METH
Press shop :

room panel. These underbodies are
put on the conveyor and welded together to give the underbody.
2.
Main Body: As the body moves on, the conveyor roof and side body panels (prepared on the sub lines) are welded to it to give the main body. The chassis number is punched on the cowl top and it is welded to the front engine room panel.
3.
White Body: The doors, hood and back door are attached on the main body with the help of bolts and screws to make it a “white body”. The body is checked for dent, burr and spatter and these defects are repaired. It is sent to the paint shop thereafter.
Paint Shop:
In the paint shops following processes are carried out; there are five plants/units that provide a uniform painting over the white body coming from the weld shop. In paint shop all the models are painted on the same line. Inside portion of vehicle is painted manually and outside is by Robots. After inspection and touch up the ready body is sent to the assembly shop.
The five units of the paint shop are;
1.
Pre-treatment (PT):
The body is thoroughly washed to remove the dirt and oil scales. Then the body is phosphate treated to prevent corroding of the body.
2.
ED coat:
This is done by electric deposition method, at
240V-DC supply. After applying the ED coat the body is baked in oven.
3.
Sol-sealer and under coat:
Here the holes left in the body (due to welding) are filled with sol-sealer to provide water proofing. Under coat is done on the surface above wheels to prevent damage of body in that portion.
4.
Intermediate coat:
This is done by spray-painting method using Robots. Here also inside painting is done manually. After applying the coat, the body is dried in the oven. Painting done is basically an intermediate coating to provide base for the final coat. Paint thickness is taken care, after that
vehicle is sent to IC oven. Oven temperature is 198+/-5’C.
5.
Top coat: This is done by spray-painting method using Robots. For metallic coating, double coats are applied
and aluminum flakes are provided to shine the metallic paints. Top coating is done after inspecting dry sanding. After this the vehicle will move to final inspection and will be sent to assembly shop.
Assembly Shop:
In the assembly shop the body is loaded
on an overhead conveyor. As the conveyor moves the body, fitments are made at various stations. There must be separate assembly lines for separate models. The assembly shop has a continuous production system. The assembly line can be subdivided into the followings;
1. Trim line
The vehicle proceeds through a series of Trim workstations where team members begin by installing weather stripping, moldings and pads. Then they put in wiring, vents and lights. After an instrument panel, windows, steering column and bumper supports are added, it starts to look less like a shell and more like a car.
2. Chassis Line
This is where many safety-related items are installed. Things like brake lines, torque, gas tanks and power steering are double-checked. The engine is installed, along with the starter and alternator and then comes suspension and exhaust systems. After that wheel is mounted with the help of wheel nut fastening machine.
3. Final Line
From there the vehicle enters Final 1, which covers many interior items such as the console, seats, carpet, glove box and steering wheel. This is also where bumpers, tires and the battery are added, as well as finishing touches like covers and vents. Then, Coolant, Brake oil, Power steering oil are filled and also the A/C gas are charged.
Lean Sigma A Road to Success: A Perspective of the Indian Automobile Industry
Globa
l Jo
urna
l of R
esea
rche
s in E
nginee
ring
Volum
e X
II
Issu
e vvvvI V
ersion
I
55
( A)
Janu
ary
201
2
© 2012 Global Journals Inc. (US)
Doors are taken out from the vehicle at the first station of the trim line. Doors fitted in the final line make working easier.
Machine Shop:The machine shop is the source of all major
components for the engine assembly shop. It has the following lines; Transmission case line, Cylinder head line, Cylinder block line, Crankshaft line, Camshaft line. The un-machined crankshaft and camshaft forgings, transmission case cylinder head and cylinder block castings are brought in the form of raw materials from the vendors. The cylinder heads and transmission case are aluminum castings while crankshaft and camshaft are steel forgings.
Fig.3 : Shows how steel coils are being cut before converting it into the panel
1. Under Body: Here different underbody panels are welded together. These comprise of rear underbody, central underbody and front engine
3. Separate door Assembling Line

Engine Assembly:
There can be many different types of engines which are assembled in the Engine Plant for petrol and diesel engines. FC Engine, aluminium engine, KB engines etc are the different engines.
Generalize Process Flow Chart
Fig.4
:
Indicates the generalize
process flow chart based on the survey showing the flow of material from one
process to other
The results of the survey also shows that in the press shop the main challenge of any automobile manufacturer is reducing the scrap rate of sheet metal or increasing the utilization ratio. In this shop the aim is to save the sheet metal to go into the scrap so that
money can be saved. One of the method that most of the company do not adopts is to use blank cutout of large panels as raw material for making small parts that has to be used in press machine otherwise it will go into scrap. Wastage control can also be done in the following manner:
Wastage Control
1.
Residual flat parts (scrap) utilization
2.
Die Face Modification
3.
Reducing the Blank Size by Gauge Adjustment
4.
Changing the Blank Shape
5.
Modification of the Punch Profile
6.
Modifying the Bead Design
Table 1 depicts the different tools pertaining to cost quality issues and their application areas within the automobile production and assembly lines. The survey of automobile manufacturing units in the research generalises the facts about the tools used in the manufacturing premises at different automobile industries.The different tools that are used in automobile industry is an important factor to cost and quality issues.
Based on the visits to manufacturing premises and interviewing at
different levels from the shop floor technicians to managerial representatives the common defects that come into the picture that lead to rework are shown in Table 2. In context with the processes involved in the automobile line the following defects may occur in the processes listed below;
Lean Sigma A Road to Success: A Perspective of the Indian Automobile IndustryGl oba
l Jo
urna
l of R
esea
rche
s in E
nginee
ring
Volum
e X
II
Issu
e vvvvI V
ersion
I
56
( A)
Janu
a ry
201
2
© 2012 Global Journals Inc. (US)
Table1
Tools Category/ Belongs to Application Area
5S (Sort, Set in order, Shine, Standardize, Sustain)
Lean Everywhere in the organization
Quick Change over/ SMED Lean Press ShopFishbone Analysis Lean Press , paint, weld & machine shop
Value Stream Mapping Lean All processes starting from raw material to finished product
Mistake Proofing LeanWaste identification and elimination Lean All the shops
Setup time reduction Lean Press Shop, machine shop
Inventory reduction Lean Store, in process, stock at lastYield improvement Six sigma Blanking operationWastage Control Six sigma Scrap utilization at press shop
Avoiding any type of rework Six sigma All the shops
Mistake proofing Lean/Six sigma All the shops

Table
2
Lean Sigma A Road to Success: A Perspective of the Indian Automobile Industry
Globa
l Jo
urna
l of R
esea
rche
s in E
nginee
ring
Volum
e X
II
Issu
e vvvvI V
ersion
I
57
( A)
Janu
ary
201
2
© 2012 Global Journals Inc. (US)
S.No Process Defects Precautions
1. Blanking operation
Excessive deformationSurface defects: cracks and neckingForm Defects: wrinkling and marking lines
2.
Weld shop
Spot Welding: Improper squeezing, splashing , burnt surface conditions, electrode pick up, copper deposits in the weld area and excessive electrode wear, in-sufficient energy, over energyMetal Inert Gas Welding:Porosity
Lack of penetration
Lack of fusion
3. Paint Shops
(i) Too much clearance
(i) Proper setting squeeze time, proper setting of weld time, forge time, forge force, peak force
(i) Gas flow too low or too high(ii) Blocked nozzle(iii) Leaking gas lines(iv) Nozzles distance from work is
too great(v) Wet or rusty electrode/wire(i) Current too low (ii) Worn contact tip causing
irregular arc(iii) Incorrect alignment of plates(i) Voltage too low(ii) Current too low or too high(iii) Irregular surface
(i) Follow application recomm-enddation on technical data sheets
(ii) Warm object and material up to room temperature of 20 °C/68 °F
(iii) Use correct combination of hardeners and thinners
(i) Use the intermediate and final flash off times from the technical data sheet
(ii) Choose and mix clear coat, hardener and thinner according to technical data sheet
(i) Avoid working on high film thicknesses
(ii) Ensure all products used are part of are finish system
(iii) Allow materials to flash off and dry in accordance to technical data sheets
(iv) Use recommended hardener/thinner combination
Runs:(i) Incorrect spraying viscosity,
spraying technique, flash-off times between coats, and film thicknesses
(ii) Incorrect spraying pressure(iii) Temperature of paint, substrate
or spray booth too low(iv) Incorrect choice of hardeners
and Thinners
Adhesion problems between base and clear coats:
(i) Excessive coat thickness of basecoat
(ii) Intermediate and final flash-off times of the basecoat too short
(iii) Wrong mixing ratio of clearcoat/ hardener
(iv) Incorrect hardener/thinner combination; system too fast
Lifting and Wrinkling:(i) Occurs when chemical reaction
takes place between two incompatible substrates
(ii) High film builds(iii) Overcoating an uncured
substrate(iv) Wet-on-wet system combined
with incorrect hardener/thinner

IV.
PROPOSED LEAN SIGMA MODEL: AN OUTLINE FOR LEAN SIGMA EXECUTION
An outline is proposed to implement to Lean
Sigma in the organization as shown in figure 5.The framework is developed, after a number of meetings with top and middle level management and the facilitators are carefully considered in the whole process. This helped to develop the Lean Sigma outline for implementation on the shop floor. In the proposed framework, Lean tools are used within the Six Sigma (DMAIC) problem-solving methodology to reduce the defects occurring in the ending product.
Define
Establishment of the rationale for a Lean Sigma project. Define the problem to be solved, including customer impact and potential benefits.
Measure
Identify the critical-to-quality characteristics (CTQs) of the product or service. Verify measurement capability. Baseline the current defect rate and set goals for improvement. This phase is concerned with selecting one or more product characteristics; i.e. dependent variables, mapping the respective process, making the
necessary measurements, recording the results on process “control cards,” and estimating the short- and long-term process capability
Analyze Understand root causes of why defects occur;
identify key process variables that cause defects. Benchmarking the key product performance metrics. Following this, a gap analysis is often undertaken to identify the common factors of successful performance; i.e. what factors explain best-in-class performance. Analyze the preliminary data collected in the Measure phase to document current performance (baseline process capability), and to begin identifying root causes of defects and their impact, and act accordingly.
Improve Determine how to intervene in the process to
significantly reduce the defect levels. Generating, selecting, and implementing solutions.
Implement ongoing measures and actions to
sustain improvement. Once the desired improvements have been made, put a system into place to ensure the improvements are sustained, even though significant resources may no longer be focused on the problem.
Fig.5 : Shows the proposed model for lean six sigma implementation
Lean Sigma A Road to Success: A Perspective of the Indian Automobile IndustryGl oba
l Jo
urna
l of R
esea
rche
s in E
nginee
ring
Volum
e X
II
Issu
e vvvvI V
ersion
I
58
( A)
Janu
a ry
201
2
© 2012 Global Journals Inc. (US)
c ont rol

V. CONCLUSION
After a brief review of the history and a
detailed analysis of the current state of the Indian automobile industry, it can be concluded that in order to stay ahead of competition and as well as meet the ever growing demands of the consumers, the industry needs to adapt newer measures for increasing productivity by eliminating
waste and
avoiding rework . This paper aims at doing so by introducing the concept of lean six sigma as an effective cost cutting tool. It also proposes a lean six sigma model for the effective lean sigma execution in the automobile industry. The author wishes to conclude by stating that the lean sigma model holds significance not only in the Indian context but can also be considered to be a global solution for the problems related to cost, quality, waste elimination, rework and productivity as a whole.
REFERENCES REFERENCES REFERENCIAS
Lean Sigma A Road to Success: A Perspective of the Indian Automobile Industry
Globa
l Jo
urna
l of R
esea
rche
s in E
nginee
ring
Volum
e X
II
Issu
e vvvvI V
ersion
I
59
( A)
Janu
ary
201
2
© 2012 Global Journals Inc. (US)
1. Pingle, V. (2000). Rethinking the Developmental State: India’s Industry in Comparative Perspective, Oxford University Press, Delhi, pp. 85-121.
2. Narayanan, K. (1998). Technology Acquisition, De-regulation and Competitiveness: a Study of Indian Automobile Industry, Research Policy, 27(2), pp. 215-228.
3. Business portal of India ,Business knowledge resource online 2011 Available at: <http:// business .gov.in/ Industry_services/ automobile _industry.php> [Accessed 10 October 2011].
4. McKinsey (2005). Vision 2015 for the Indian Automotive Components Industry, Automotive Component Manufacturers Association of India and McKinsey and Company.
5. Ohno, T. (1988). Toyota Production System: Beyond Large-scale Production, Productivity Press, Portland, OR
6. Womack, J., Jones, D. and Roos, D. (1990).The Machine that Changed the World, Rawson Associates, New York, NY
7. Krafcik (1988). Triumph of the Lean Production System, published in the Sloan Management Review
8. Womack, J.P. and Jones, D.T. (1996), Lean Thinking 90-8., Simon & Schuster, New York, NY, pp.
9. Womack, J.P. and D.T. Jones, (1994). From lean production to the lean enterprise. Harvard Bus. Rev., pp: 93-103.
10. Kannan, V.R., and Tan, K.C., (2005). Just-In-Time, Total Quality Management, and Supply Chain Management: Understanding Their Linkages and Impact on Business Performance, Omega, The International Journal of Management Science, 33(2005), 153-162.
11. Worley J.M., Doolen T.L., (2006). The role of communication and management support in a lean manufacturing implementation, Management Decision, 44: 228-245.
12. Taj, S. and Berro, L. (2005). Application of constrained management and lean manufacturing in developing best practices for productivity improvement in auto-assembly plant, International Journal of Productivity and Performance Management, Vol. 55 Nos 3/4, pp. 332-45.
13. Jones, P.D., T.J. Osborn, and K.R. Briffa. (1997). Estimating sampling errors in large-scale temperature averages. Journal of Climate 10:2548-2568.
14. Bhasin,S., Burcher,P., (2006). Lean viewed as a philosophy, Journal of Manufacturing Technology Management, Vol. 17 Iss: 1, pp.56 – 72
15. Claycomb, C., Germain, R. and Droge, C. (1999).Total systems JIT outcomes: inventory, organization and financial effects, International Journal of Physical Distribution & Logistics Management, Vol. 29 No. 10, p. 612.
16. Brady, J.E, and Allen, T.T. (2006). Six Sigma literatures: A review and agenda for future research .Qual. Reliab. Eng. Int.,22(3) 335-367
17. George, M, Lean Six Sigma (2002). Combining Six Sigma Quality with Lean Speed, McGraw-Hill: New York, 2002].
18. Pande, P.S., Neuman, R.P. and Cavangh, R.R.(2000). The Six Sigma Way, Mcgraw-Hill, New York,NY.
19. Pojasek, R (2003).Lean, six sigma, and the systems approach: management initiatives for process improvement, Environmental Quality Management, Vol.13 No.2, P.85.
20. Sower, V.,Savoie, M. and Renick, S. (1999), An introduction to Quality Management and Engineering, Prentice-Hall, Upper Saddle River, NJ.

Global Journals Inc. (US)
Guidelines Handbook
2012
www.GlobalJournals.org

FELLOW OF ASSOCIATION OF RESEARCH SOCIETY IN ENGINEERING (FARSE) •
'FARSE' title will be awarded to the person after approval of Editor-in-Chief and Editorial Board. The title 'FARSE" can be added to name in the following manner. eg. Dr. John E. Hall, Ph.D., FARSE or William Walldroff Ph. D., M.S., FARSE
•
Being FARSE is a respectful honor. It authenticates your research activities. After becoming FARSE, you can use 'FARSE' title as you use your degree in suffix of your name. This will
definitely will enhance and add up your name. You can use it on your Career Counseling Materials/CV/Resume/Visiting Card/Name Plate etc.
•
60% Discount will be provided to FARSE members for publishing research papers in Global Journals Inc., if our Editorial Board and Peer Reviewers accept the paper. For the life time, if you are author/co-author of any paper bill sent to you will automatically be discounted one by 60%
•
FARSE will be given a renowned, secure, free professional email address with 100 GB of space [email protected]. You will be facilitated with Webmail, Spam Assassin, Email Forwarders, Auto-Responders, Email Delivery Route tracing, etc.
•
FARSE member is eligible to become paid peer reviewer at Global Journals Inc. to earn up to 15% of realized author charges taken from author of respective paper. After reviewing 5 or more papers you can request to transfer the amount to your bank account or to your PayPal account.
•
Eg. If we had taken 420 USD from author, we can send 63 USD to your account.
•
FARSE member can apply for free approval, grading and certification of some of their Educational and Institutional Degrees from Global Journals Inc. (US) and
Open Association of Research, Society U.S.A.
•
After you are FARSE. You can send us scanned copy of all of your documents. We will verify, grade and certify them within a month. It will be based on your academic records, quality of research papers published by you, and 50 more criteria. This is beneficial for your job interviews as recruiting organization need not just rely on you for authenticity and your unknown qualities, you would have authentic ranks of
all of your documents. Our scale is unique worldwide.
•
FARSE member can proceed to get benefits of free research podcasting in Global Research Radio with their research documents, slides and online movies.
•
After your publication anywhere in the world, you can upload you research paper with your recorded voice or you can use our professional RJs to record your paper their voice. We can also stream your conference videos and display your slides online.
•
FARSE will be eligible for free application of Standardization of their Researches by Open Scientific Standards. Standardization is next step and level after publishing in a journal. A team of research and professional will work with you to take your research to its next level, which is worldwide open standardization.
Fellows
© Copyright by Global Journals Inc.(US) | Guidelines Handbook
I

•
FARSE is eligible to earn from their researches: While publishing his paper with Global Journals Inc. (US), FARSE can decide whether he/she would like to publish his/her research in closed manner. When readers will buy that individual research paper for reading, 80% of its earning by Global Journals Inc. (US) will be transferred to FARSE member's bank account after certain threshold balance. There is no time limit for collection. FARSE member can decide its price and we can help in decision.
MEMBER OF ASSOCIATION OF RESEARCH SOCIETY IN ENGINEERING (MARSE)
•
'MARSE' title will be awarded to the person after approval of Editor-in-Chief and Editorial Board. The title 'MARSE" can be added to name in the following manner. eg. Dr. John E. Hall, Ph.D.,
MARSE or William Walldroff Ph. D., M.S., MARSE
•
Being MARSE is a respectful honor. It authenticates your research activities. After becoming MARSE, you can use 'MARSE' title as you use your degree in suffix of your name. This will definitely will enhance and add up your name. You can use it on your Career Counseling Materials/CV/Resume/Visiting Card/Name Plate etc.
•
40% Discount will be provided to MARSE members for publishing research papers in Global Journals Inc., if our Editorial Board and Peer Reviewers
accept the paper. For the life time, if you are author/co-author of any paper bill sent to you will automatically be discounted one by 60%
•
MARSE will be given a renowned, secure, free professional email address with 30 GB of space [email protected]. You will be facilitated with Webmail, SpamAssassin, Email Forwarders, Auto-Responders, Email Delivery Route tracing, etc.
•
MARSE member is eligible to become paid peer reviewer at Global Journals Inc. to earn up to 10% of realized author charges taken from author of respective paper. After reviewing 5 or more papers you can request to transfer the amount to your bank account or to your PayPal account.
•
MARSE member can apply for free approval, grading and certification of some of their Educational and Institutional Degrees from Global Journals Inc. (US) and
Open Association of Research,Society U.S.A.
•
MARSE is eligible to earn from their researches: While publishing his paper with Global Journals Inc. (US), MARSE can decide whether he/she would like to publish his/her research in closed manner. When readers will buy that individual research paper for reading, 40% of its earning by Global Journals Inc. (US) will be transferred to MARSE member's bank account after certain threshold balance. There is no time limit for collection. MARSE member can decide its price and we can help in decision.
II
© Copyright by Global Journals Inc.(US)| Guidelines Handbook
II
© Copyright by Global Journals Inc.(US)| Guidelines Handbook

Auxiliary Memberships
ANNUAL MEMBER
•
Annual Member will be authorized to
receive e - Journal GJRE
for one year
(subscription for one year).
•
The member will be allotted free 1 GB Web-space
along with subDomain to
contribute and participate in our activities. •
A professional email address
will be allotted free 500 MB email space.
PAPER PUBLICATION
• The members can publish paper once. The paper will be sent to two-peer reviewer. The paper will be published after the acceptance of peer reviewers and Editorial Board.
© Copyright by Global Journals Inc.(US) | Guidelines Handbook
III
Process of submission of Research Paper
The Area or field of specialization may or may not be of any category as mentioned in ‘Scope of Journal’ menu of the GlobalJournals.org website. There are 37 Research Journal categorized with Six parental Journals GJCST, GJMR, GJRE, GJMBR, GJSFR, GJHSS. For Authors should prefer the mentioned categories. There are three widely used systems UDC, DDC and LCC. The details are available as ‘Knowledge Abstract’ at Home page. The major advantage of this coding is that, the research work will be exposed to and shared with all over the world as we are being abstracted and indexed worldwide.
The paper should be in proper format. The format can be downloaded from first page of ‘Author Guideline’ Menu. The Author is expected to follow the general rules as mentioned in this menu. The paper should be written in MS-Word Format (*.DOC,*.DOCX).
The Author can submit the paper either online or offline. The authors should prefer online submission.Online Submission: There are three ways to submit your paper:
(A) (I) First, register yourself using top right corner of Home page then Login. If you are already registered, then login using your username and password.
(II) Choose corresponding Journal.
(III) Click ‘Submit Manuscript’. Fill required information and Upload the paper.
(B) If you are using Internet Explorer, then Direct Submission through Homepage is also available.
(C) If these two are not conveninet , and then email the paper directly to [email protected].
Offline Submission: Author can send the typed form of paper by Post. However, online submission should be preferred.
IV
© Copyright by Global Journals Inc.(US)| Guidelines Handbook

Preferred Author Guidelines
MANUSCRIPT STYLE INSTRUCTION (Must be strictly followed)
Page Size: 8.27" X 11'"
• Left Margin: 0.65 • Right Margin: 0.65 • Top Margin: 0.75 • Bottom Margin: 0.75 • Font type of all text should be Swis 721 Lt BT. • Paper Title should be of Font Size 24 with one Column section. • Author Name in Font Size of 11 with one column as of Title. • Abstract Font size of 9 Bold, “Abstract” word in Italic Bold. • Main Text: Font size 10 with justified two columns section • Two Column with Equal Column with of 3.38 and Gaping of .2 • First Character must be three lines Drop capped. • Paragraph before Spacing of 1 pt and After of 0 pt. • Line Spacing of 1 pt • Large Images must be in One Column • Numbering of First Main Headings (Heading 1) must be in Roman Letters, Capital Letter, and Font Size of 10. • Numbering of Second Main Headings (Heading 2) must be in Alphabets, Italic, and Font Size of 10.
You can use your own standard format also. Author Guidelines:
1. General,
2. Ethical Guidelines,
3. Submission of Manuscripts,
4. Manuscript’s Category,
5. Structure and Format of Manuscript,
6. After Acceptance.
1. GENERAL
Before submitting your research paper, one is advised to go through the details as mentioned in following heads. It will be beneficial, while peer reviewer justify your paper for publication.
Scope
The Global Journals Inc. (US) welcome the submission of original paper, review paper, survey article relevant to the all the streams of Philosophy and knowledge. The Global Journals Inc. (US) is parental platform for Global Journal of Computer Science and Technology, Researches in Engineering, Medical Research, Science Frontier Research, Human Social Science, Management, and Business organization. The choice of specific field can be done otherwise as following in Abstracting and Indexing Page on this Website. As the all Global
© Copyright by Global Journals Inc.(US) | Guidelines Handbook
V

Journals Inc. (US) are being abstracted and indexed (in process) by most of the reputed organizations. Topics of only narrow interest will not be accepted unless they have wider potential or consequences.
2. ETHICAL GUIDELINES
Authors should follow the ethical guidelines as mentioned below for publication of research paper and research activities.
Papers are accepted on strict understanding that the material in whole or in part has not been, nor is being, considered for publication elsewhere. If the paper once accepted by Global Journals Inc. (US) and Editorial Board, will become the copyright of the Global Journals Inc. (US).
Authorship: The authors and coauthors should have active contribution to conception design, analysis and interpretation of findings. They should critically review the contents and drafting of the paper. All should approve the final version of the paper before submission
The Global Journals Inc. (US) follows the definition of authorship set up by the Global Academy of Research and Development. According to the Global Academy of R&D authorship, criteria must be based on:
1) Substantial contributions to conception and acquisition of data, analysis and interpretation of the findings.
2) Drafting the paper and revising it critically regarding important academic content.
3) Final approval of the version of the paper to be published.
All authors should have been credited according to their appropriate contribution in research activity and preparing paper. Contributors who do not match the criteria as authors may be mentioned under Acknowledgement.
Acknowledgements: Contributors to the research other than authors credited should be mentioned under acknowledgement. The specifications of the source of funding for the research if appropriate can be included. Suppliers of resources may be mentioned along with address.
Appeal of Decision: The Editorial Board’s decision on publication of the paper is final and cannot be appealed elsewhere.
Permissions: It is the author's responsibility to have prior permission if all or parts of earlier published illustrations are used in this paper.
Please mention proper reference and appropriate acknowledgements wherever expected.
If all or parts of previously published illustrations are used, permission must be taken from the copyright holder concerned. It is the author's responsibility to take these in writing.
Approval for reproduction/modification of any information (including figures and tables) published elsewhere must be obtained by the authors/copyright holders before submission of the manuscript. Contributors (Authors) are responsible for any copyright fee involved.
3. SUBMISSION OF MANUSCRIPTS
Manuscripts should be uploaded via this online submission page. The online submission is most efficient method for submission of papers, as it enables rapid distribution of manuscripts and consequently speeds up the review procedure. It also enables authors to know the status of their own manuscripts by emailing us. Complete instructions for submitting a paper is available below.
Manuscript submission is a systematic procedure and little preparation is required beyond having all parts of your manuscript in a given format and a computer with an Internet connection and a Web browser. Full help and instructions are provided on-screen. As an author, you will be prompted for login and manuscript details as Field of Paper and then to upload your manuscript file(s) according to the instructions.
VI
© Copyright by Global Journals Inc.(US)| Guidelines Handbook

To avoid postal delays, all transaction is preferred by e-mail. A finished manuscript submission is confirmed by e-mail immediately and your paper enters the editorial process with no postal delays. When a conclusion is made about the publication of your paper by our Editorial Board, revisions can be submitted online with the same procedure, with an occasion to view and respond to all comments.
Complete support for both authors and co-author is provided.
4. MANUSCRIPT’S CATEGORY
Based on potential and nature, the manuscript can be categorized under the following heads:
Original research paper: Such papers are reports of high-level significant original research work.
Review papers: These are concise, significant but helpful and decisive topics for young researchers.
Research articles: These are handled with small investigation and applications
Research letters: The letters are small and concise comments on previously published matters.
5.STRUCTURE AND FORMAT OF MANUSCRIPT
The recommended size of original research paper is less than seven thousand words, review papers fewer than seven thousands words also.Preparation of research paper or how to write research paper, are major hurdle, while writing manuscript. The research articles and research letters should be fewer than three thousand words, the structure original research paper; sometime review paper should be as follows:
Papers: These are reports of significant research (typically less than 7000 words equivalent, including tables, figures, references), and comprise:
(a)Title should be relevant and commensurate with the theme of the paper.
(b) A brief Summary, “Abstract” (less than 150 words) containing the major results and conclusions.
(c) Up to ten keywords, that precisely identifies the paper's subject, purpose, and focus.
(d) An Introduction, giving necessary background excluding subheadings; objectives must be clearly declared.
(e) Resources and techniques with sufficient complete experimental details (wherever possible by reference) to permit repetition; sources of information must be given and numerical methods must be specified by reference, unless non-standard.
(f) Results should be presented concisely, by well-designed tables and/or figures; the same data may not be used in both; suitable statistical data should be given. All data must be obtained with attention to numerical detail in the planning stage. As reproduced design has been recognized to be important to experiments for a considerable time, the Editor has decided that any paper that appears not to have adequate numerical treatments of the data will be returned un-refereed;
(g) Discussion should cover the implications and consequences, not just recapitulating the results; conclusions should be summarizing.
(h) Brief Acknowledgements.
(i) References in the proper form.
Authors should very cautiously consider the preparation of papers to ensure that they communicate efficiently. Papers are much more likely to be accepted, if they are cautiously designed and laid out, contain few or no errors, are summarizing, and be conventional to the approach and instructions. They will in addition, be published with much less delays than those that require much technical and editorial correction.
© Copyright by Global Journals Inc.(US) | Guidelines Handbook
VII

The Editorial Board reserves the right to make literary corrections and to make suggestions to improve briefness.
It is vital, that authors take care in submitting a manuscript that is written in simple language and adheres to published guidelines.
Format
Language: The language of publication is UK English. Authors, for whom English is a second language, must have their manuscript efficiently edited by an English-speaking person before submission to make sure that, the English is of high excellence. It is preferable, that manuscripts should be professionally edited.
Standard Usage, Abbreviations, and Units: Spelling and hyphenation should be conventional to The Concise Oxford English Dictionary. Statistics and measurements should at all times be given in figures, e.g. 16 min, except for when the number begins a sentence. When the number does not refer to a unit of measurement it should be spelt in full unless, it is 160 or greater.
Abbreviations supposed to be used carefully. The abbreviated name or expression is supposed to be cited in full at first usage, followed by the conventional abbreviation in parentheses.
Metric SI units are supposed to generally be used excluding where they conflict with current practice or are confusing. For illustration, 1.4 l rather than 1.4 × 10⁻³ m3, or 4 mm somewhat than 4 × 10⁻³ m. Chemical formula and solutions must identify the form used, e.g. anhydrous or hydrated, and the concentration must be in clearly defined units. Common species names should be followed by underlines at the first mention. For following use the generic name should be constricted to a single letter, if it is clear.
Structure
All manuscripts submitted to Global Journals Inc. (US), ought to include:
Title: The title page must carry an instructive title that reflects the content, a running title (less than 45 characters together with spaces), names of the authors and co-authors, and the place(s) wherever the work was carried out. The full postal address in addition with the e-mail address of related author must be given. Up to eleven keywords or very brief phrases have to be given to help data retrieval, mining and indexing.
Abstract, used in Original Papers and Reviews:
Optimizing Abstract for Search Engines
Many researchers searching for information online will use search engines such as Google, Yahoo or similar. By optimizing your paper for search engines, you will amplify the chance of someone finding it. This in turn will make it more likely to be viewed and/or cited in a further work. Global Journals Inc. (US) have compiled these guidelines to facilitate you to maximize the web-friendliness of the most public part of your paper.
Key Words
A major linchpin in research work for the writing research paper is the keyword search, which one will employ to find both library and Internet resources.
One must be persistent and creative in using keywords. An effective keyword search requires a strategy and planning a list of possible keywords and phrases to try.
Search engines for most searches, use Boolean searching, which is somewhat different from Internet searches. The Boolean search uses "operators," words (and, or, not, and near) that enable you to expand or narrow your affords. Tips for research paper while preparing research paper are very helpful guideline of research paper.
Choice of key words is first tool of tips to write research paper. Research paper writing is an art.A few tips for deciding as strategically as possible about keyword search:
VIII
© Copyright by Global Journals Inc.(US)| Guidelines Handbook

• One should start brainstorming lists of possible keywords before even begin searching. Think about the most important concepts related to research work. Ask, "What words would a source have to include to be truly valuable in research paper?" Then consider synonyms for the important words.
• It may take the discovery of only one relevant paper to let steer in the right keyword direction because in most databases, the keywords under which a research paper is abstracted are listed with the paper.
• One should avoid outdated words.
Keywords are the key that opens a door to research work sources. Keyword searching is an art in which researcher's skills are bound to improve with experience and time.
Numerical Methods: Numerical methods used should be clear and, where appropriate, supported by references.
Acknowledgements: Please make these as concise as possible.
References
References follow the Harvard scheme of referencing. References in the text should cite the authors' names followed by the time of their publication, unless there are three or more authors when simply the first author's name is quoted followed by et al. unpublished work has to only be cited where necessary, and only in the text. Copies of references in press in other journals have to be supplied with submitted typescripts. It is necessary that all citations and references be carefully checked before submission, as mistakes or omissions will cause delays.
References to information on the World Wide Web can be given, but only if the information is available without charge to readers on an official site. Wikipedia and Similar websites are not allowed where anyone can change the information. Authors will be asked to make available electronic copies of the cited information for inclusion on the Global Journals Inc. (US) homepage at the judgment of the Editorial Board.
The Editorial Board and Global Journals Inc. (US) recommend that, citation of online-published papers and other material should be done via a DOI (digital object identifier). If an author cites anything, which does not have a DOI, they run the risk of the cited material not being noticeable.
The Editorial Board and Global Journals Inc. (US) recommend the use of a tool such as Reference Manager for reference management and formatting.
Tables, Figures and Figure Legends
Tables: Tables should be few in number, cautiously designed, uncrowned, and include only essential data. Each must have an Arabic number, e.g. Table 4, a self-explanatory caption and be on a separate sheet. Vertical lines should not be used.
Figures: Figures are supposed to be submitted as separate files. Always take in a citation in the text for each figure using Arabic numbers, e.g. Fig. 4. Artwork must be submitted online in electronic form by e-mailing them.
Preparation of Electronic Figures for Publication
Even though low quality images are sufficient for review purposes, print publication requires high quality images to prevent the final product being blurred or fuzzy. Submit (or e-mail) EPS (line art) or TIFF (halftone/photographs) files only. MS PowerPoint and Word Graphics are unsuitable for printed pictures. Do not use pixel-oriented software. Scans (TIFF only) should have a resolution of at least 350 dpi (halftone) or 700 to 1100 dpi (line drawings) in relation to the imitation size. Please give the data for figures in black and white or submit a Color Work Agreement Form. EPS files must be saved with fonts embedded (and with a TIFF preview, if possible).
For scanned images, the scanning resolution (at final image size) ought to be as follows to ensure good reproduction: line art: >650 dpi; halftones (including gel photographs) : >350 dpi; figures containing both halftone and line images: >650 dpi.
© Copyright by Global Journals Inc.(US) | Guidelines Handbook
IX

Color Charges: It is the rule of the Global Journals Inc. (US) for authors to pay the full cost for the reproduction of their color artwork. Hence, please note that, if there is color artwork in your manuscript when it is accepted for publication, we would require you to complete and return a color work agreement form before your paper can be published.
Figure Legends: Self-explanatory legends of all figures should be incorporated separately under the heading 'Legends to Figures'. In the full-text online edition of the journal, figure legends may possibly be truncated in abbreviated links to the full screen version. Therefore, the first 100 characters of any legend should notify the reader, about the key aspects of the figure.
6. AFTER ACCEPTANCE
Upon approval of a paper for publication, the manuscript will be forwarded to the dean, who is responsible for the publication of the Global Journals Inc. (US).
6.1 Proof Corrections
The corresponding author will receive an e-mail alert containing a link to a website or will be attached. A working e-mail address must therefore be provided for the related author.
Acrobat Reader will be required in order to read this file. This software can be downloaded
(Free of charge) from the following website:
www.adobe.com/products/acrobat/readstep2.html. This will facilitate the file to be opened, read on screen, and printed out in order for any corrections to be added. Further instructions will be sent with the proof.
Proofs must be returned to the dean at [email protected] within three days of receipt.
As changes to proofs are costly, we inquire that you only correct typesetting errors. All illustrations are retained by the publisher. Please note that the authors are responsible for all statements made in their work, including changes made by the copy editor.
6.2 Early View of Global Journals Inc. (US) (Publication Prior to Print)
The Global Journals Inc. (US) are enclosed by our publishing's Early View service. Early View articles are complete full-text articles sent in advance of their publication. Early View articles are absolute and final. They have been completely reviewed, revised and edited for publication, and the authors' final corrections have been incorporated. Because they are in final form, no changes can be made after sending them. The nature of Early View articles means that they do not yet have volume, issue or page numbers, so Early View articles cannot be cited in the conventional way.
6.3 Author Services
Online production tracking is available for your article through Author Services. Author Services enables authors to track their article - once it has been accepted - through the production process to publication online and in print. Authors can check the status of their articles online and choose to receive automated e-mails at key stages of production. The authors will receive an e-mail with a unique link that enables them to register and have their article automatically added to the system. Please ensure that a complete e-mail address is provided when submitting the manuscript.
6.4 Author Material Archive Policy
Please note that if not specifically requested, publisher will dispose off hardcopy & electronic information submitted, after the two months of publication. If you require the return of any information submitted, please inform the Editorial Board or dean as soon as possible.
6.5 Offprint and Extra Copies
A PDF offprint of the online-published article will be provided free of charge to the related author, and may be distributed according to the Publisher's terms and conditions. Additional paper offprint may be ordered by emailing us at: [email protected] .
X
© Copyright by Global Journals Inc.(US)| Guidelines Handbook

the search? Will I be able to find all information in this field area? If the answer of these types of questions will be "Yes" then you can
choose that topic. In most of the cases, you may have to conduct the surveys and have to visit several places because this field is related
to Computer Science and Information Technology. Also, you may have to do a lot of work to find all rise and falls regarding the various
data of that subject. Sometimes, detailed information plays a vital role, instead of short information.
2. Evaluators are human: First thing to remember that evaluators are also human being. They are not only meant for rejecting a paper.
They are here to evaluate your paper. So, present your Best.
3. Think Like Evaluators: If you are in a confusion or getting demotivated that your paper will be accepted by evaluators or not, then
think and try to evaluate your paper like an Evaluator. Try to understand that what an evaluator wants in your research paper and
automatically you will have your answer.
4. Make blueprints of paper: The outline is the plan or framework that will help you to arrange your thoughts. It will make your paper
logical. But remember that all points of your outline must be related to the topic you have chosen.
5. Ask your Guides: If you are having any difficulty in your research, then do not hesitate to share your difficulty to your guide (if you
have any). They will surely help you out and resolve your doubts. If you can't clarify what exactly you require for your work then ask the
supervisor to help you with the alternative. He might also provide you the list of essential readings.
6. Use of computer is recommended: As you are doing research in the field of Computer Science, then this point is quite obvious.
7. Use right software: Always use good quality software packages. If you are not capable to judge good software then you can lose
quality of your paper unknowingly. There are various software programs available to help you, which you can get through Internet.
8. Use the Internet for help: An excellent start for your paper can be by using the Google. It is an excellent search engine, where you can
have your doubts resolved. You may also read some answers for the frequent question how to write my research paper or find model
research paper. From the internet library you can download books. If you have all required books make important reading selecting and
analyzing the specified information. Then put together research paper sketch out.
9. Use and get big pictures: Always use encyclopedias, Wikipedia to get pictures so that you can go into the depth.
10. Bookmarks are useful: When you read any book or magazine, you generally use bookmarks, right! It is a good habit, which helps to
not to lose your continuity. You should always use bookmarks while searching on Internet also, which will make your search easier.
11. Revise what you wrote: When you write anything, always read it, summarize it and then finalize it.
12. Make all efforts: Make all efforts to mention what you are going to write in your paper. That means always have a good start. Try to
mention everything in introduction, that what is the need of a particular research paper. Polish your work by good skill of writing and
always give an evaluator, what he wants.
13. Have backups: When you are going to do any important thing like making research paper, you should always have backup copies of it
either in your computer or in paper. This will help you to not to lose any of your important.
14. Produce good diagrams of your own: Always try to include good charts or diagrams in your paper to improve quality. Using several
and unnecessary diagrams will degrade the quality of your paper by creating "hotchpotch." So always, try to make and include those
diagrams, which are made by your own to improve readability and understandability of your paper.
15. Use of direct quotes: When you do research relevant to literature, history or current affairs then use of quotes become essential but
if study is relevant to science then use of quotes is not preferable.
© Copyright by Global Journals Inc.(US) | Guidelines Handbook
XI

16. Use proper verb tense: Use proper verb tenses in your paper. Use past tense, to present those events that happened. Use present
tense to indicate events that are going on. Use future tense to indicate future happening events. Use of improper and wrong tenses will
confuse the evaluator. Avoid the sentences that are incomplete.
17. Never use online paper: If you are getting any paper on Internet, then never use it as your research paper because it might be
possible that evaluator has already seen it or maybe it is outdated version.
18. Pick a good study spot: To do your research studies always try to pick a spot, which is quiet. Every spot is not for studies. Spot that
suits you choose it and proceed further.
19. Know what you know: Always try to know, what you know by making objectives. Else, you will be confused and cannot achieve your
target.
20. Use good quality grammar: Always use a good quality grammar and use words that will throw positive impact on evaluator. Use of
good quality grammar does not mean to use tough words, that for each word the evaluator has to go through dictionary. Do not start
sentence with a conjunction. Do not fragment sentences. Eliminate one-word sentences. Ignore passive voice. Do not ever use a big
word when a diminutive one would suffice. Verbs have to be in agreement with their subjects. Prepositions are not expressions to finish
sentences with. It is incorrect to ever divide an infinitive. Avoid clichés like the disease. Also, always shun irritating alliteration. Use
language that is simple and straight forward. put together a neat summary.
21. Arrangement of information: Each section of the main body should start with an opening sentence and there should be a
changeover at the end of the section. Give only valid and powerful arguments to your topic. You may also maintain your arguments with
records.
22. Never start in last minute: Always start at right time and give enough time to research work. Leaving everything to the last minute
will degrade your paper and spoil your work.
23. Multitasking in research is not good: Doing several things at the same time proves bad habit in case of research activity. Research is
an area, where everything has a particular time slot. Divide your research work in parts and do particular part in particular time slot.
24. Never copy others' work: Never copy others' work and give it your name because if evaluator has seen it anywhere you will be in
trouble.
25. Take proper rest and food: No matter how many hours you spend for your research activity, if you are not taking care of your health
then all your efforts will be in vain. For a quality research, study is must, and this can be done by taking proper rest and food.
26. Go for seminars: Attend seminars if the topic is relevant to your research area. Utilize all your resources.
27. Refresh your mind after intervals: Try to give rest to your mind by listening to soft music or by sleeping in intervals. This will also
improve your memory.
28. Make colleagues: Always try to make colleagues. No matter how sharper or intelligent you are, if you make colleagues you can have
several ideas, which will be helpful for your research.
29.
Think technically: Always think technically. If anything happens, then search its reasons, its benefits, and demerits.
30. Think and then print: When you will go to print your paper, notice that tables are not be split, headings are not detached from their
descriptions, and page sequence is maintained.
31. Adding unnecessary information: Do not add unnecessary information, like, I have used MS Excel to draw graph. Do not add
irrelevant and inappropriate material. These all will create superfluous. Foreign terminology and phrases are not apropos. One should
NEVER take a broad view. Analogy in script is like feathers on a snake. Not at all use a large word when a very small one would be
XII
© Copyright by Global Journals Inc.(US)| Guidelines Handbook

sufficient. Use words properly, regardless of how others use them. Remove quotations. Puns are for kids, not grunt readers.
Amplification is a billion times of inferior quality than sarcasm.
32. Never oversimplify everything: To add material in your research paper, never go for oversimplification. This will definitely irritate the
evaluator. Be more or less specific. Also too, by no means, ever use rhythmic redundancies. Contractions aren't essential and shouldn't
be there used. Comparisons are as terrible as clichés. Give up ampersands and abbreviations, and so on. Remove commas, that are, not
necessary. Parenthetical words however should be together with this in commas. Understatement is all the time the complete best way
to put onward earth-shaking thoughts. Give a detailed literary review.
33. Report concluded results: Use concluded results. From raw data, filter the results and then conclude your studies based on
measurements and observations taken. Significant figures and appropriate number of decimal places should be used. Parenthetical
remarks are prohibitive. Proofread carefully at final stage. In the end give outline to your arguments. Spot out perspectives of further
study of this subject. Justify your conclusion by at the bottom of them with sufficient justifications and examples.
34. After conclusion: Once you have concluded your research, the next most important step is to present your findings. Presentation is
extremely important as it is the definite medium though which your research is going to be in print to the rest of the crowd. Care should
be taken to categorize your thoughts well and present them in a logical and neat manner. A good quality research paper format is
essential because it serves to highlight your research paper and bring to light all necessary aspects in your research.
INFORMAL GUIDELINES OF RESEARCH PAPER WRITING
Key points to remember:
Submit all work in its final form.
Write your paper in the form, which is presented in the guidelines using the template.
Please note the criterion for grading the final paper by peer-reviewers.
Final Points:
A purpose of organizing a research paper is to let people to interpret your effort selectively. The journal requires the following sections,
submitted in the order listed, each section to start on a new page.
The introduction will be compiled from reference matter and will reflect the design processes or outline of basis that direct you to make
study. As you will carry out the process of study, the method and process section will be constructed as like that. The result segment will
show related statistics in nearly sequential order and will direct the reviewers next to the similar intellectual paths throughout the data
that you took to carry out your study. The discussion section will provide understanding of the data and projections as to the implication
of the results. The use of good quality references all through the paper will give the effort trustworthiness by representing an alertness
of prior workings.
Writing a research paper is not an easy job no matter how trouble-free the actual research or concept. Practice, excellent preparation,
and controlled record keeping are the only means to make straightforward the progression.
General style:
Specific editorial column necessities for compliance of a manuscript will always take over from directions in these general guidelines.
To make a paper clear
· Adhere to recommended page limits
Mistakes to evade
Insertion a title at the foot of a page with the subsequent text on the next page
© Copyright by Global Journals Inc.(US) | Guidelines Handbook
XIII

Separating a table/chart or figure - impound each figure/table to a single page
Submitting a manuscript with pages out of sequence
In every sections of your document
· Use standard writing style including articles ("a", "the," etc.)
· Keep on paying attention on the research topic of the paper
· Use paragraphs to split each significant point (excluding for the abstract)
· Align the primary line of each section
· Present your points in sound order
· Use present tense to report well accepted
· Use past tense to describe specific results
· Shun familiar wording, don't address the reviewer directly, and don't use slang, slang language, or superlatives
· Shun use of extra pictures - include only those figures essential to presenting results
Title Page:
Choose a revealing title. It should be short. It should not have non-standard acronyms or abbreviations. It should not exceed two printed
lines. It should include the name(s) and address (es) of all authors.
Abstract:
The summary should be two hundred words or less. It should briefly and clearly explain the key findings reported in the manuscript--
must have precise statistics. It should not have abnormal acronyms or abbreviations. It should be logical in itself. Shun citing references
at this point.
An abstract is a brief distinct paragraph summary of finished work or work in development. In a minute or less a reviewer can be taught
the foundation behind the study, common approach to the problem, relevant results, and significant conclusions or new questions.
Write your summary when your paper is completed because how can you write the summary of anything which is not yet written?
Wealth of terminology is very essential in abstract. Yet, use comprehensive sentences and do not let go readability for briefness. You can
maintain it succinct by phrasing sentences so that they provide more than lone rationale. The author can at this moment go straight to
XIV
© Copyright by Global Journals Inc.(US)| Guidelines Handbook
shortening the outcome. Sum up the study, with the subsequent elements in any summary. Try to maintain the initial two items to no
more than one ruling each.
Reason of the study - theory, overall issue, purpose
Fundamental goal
To the point depiction of the research
Consequences, including definite statistics - if the consequences are quantitative in nature, account quantitative data; results of any numerical analysis should be reported
Significant conclusions or questions that track from the research(es)
Approach:
Single section, and succinct
As a outline of job done, it is always written in past tense
A conceptual should situate on its own, and not submit to any other part of the paper such as a form or table
Center on shortening results - bound background information to a verdict or two, if completely necessary
What you account in an conceptual must be regular with what you reported in the manuscript
Exact spelling, clearness of sentences and phrases, and appropriate reporting of quantities (proper units, important statistics) are just as significant in an abstract as they are anywhere else
Introduction:
The Introduction should "introduce" the manuscript. The reviewer should be presented with sufficient background information to be capable to comprehend and calculate the purpose of your study without having to submit to other works. The basis for the study should be offered. Give most important references but shun difficult to make a comprehensive appraisal of the topic. In the introduction, describe the problem visibly. If the problem is not acknowledged in a logical, reasonable way, the reviewer will have no attention in your result. Speak in common terms about techniques used to explain the problem, if needed, but do not present any particulars about the protocols here. Following approach can create a valuable beginning:
Explain the value (significance) of the study
Shield the model - why did you employ this particular system or method? What is its compensation? You strength remark on its appropriateness from a abstract point of vision as well as point out sensible reasons for using it.
Present a justification. Status your particular theory (es) or aim(s), and describe the logic that led you to choose them.
Very for a short time explain the tentative propose and how it skilled the declared objectives.
Approach:
Use past tense except for when referring to recognized facts. After all, the manuscript will be submitted after the entire job is done.
Sort out your thoughts; manufacture one key point with every section. If you make the four points listed above, you will need a least of four paragraphs.
Present surroundings information only as desirable in order hold up a situation. The reviewer does not desire to read the whole thing you know about a topic.
Shape the theory/purpose specifically - do not take a broad view.
As always, give awareness to spelling, simplicity and correctness of sentences and phrases.
Procedures (Methods and Materials):
This part is supposed to be the easiest to carve if you have good skills. A sound written Procedures segment allows a capable scientist to replacement your results. Present precise information about your supplies. The suppliers and clarity of reagents can be helpful bits of information. Present methods in sequential order but linked methodologies can be grouped as a segment. Be concise when relating the protocols. Attempt for the least amount of information that would permit another capable scientist to spare your outcome but be cautious that vital information is integrated. The use of subheadings is suggested and ought to be synchronized with the results section. When a technique is used that has been well described in another object, mention the specific item describing a way but draw the basic
© Copyright by Global Journals Inc.(US) | Guidelines Handbook
XV
principle while stating the situation. The purpose is to text all particular resources and broad procedures, so that another person may use some or all of the methods in one more study or referee the scientific value of your work. It is not to be a step by step report of the whole thing you did, nor is a methods section a set of orders. Materials:
Explain materials individually only if the study is so complex that it saves liberty this way.
Embrace particular materials, and any tools or provisions that are not frequently found in laboratories.
Do not take in frequently found.
If use of a definite type of tools.
Materials may be reported in a part section or else they may be recognized along with your measures.
Methods:
Report the method (not particulars of each process that engaged the same methodology)
Describe the method entirely
To be succinct, present methods under headings dedicated to specific dealings or groups of measures
Simplify - details how procedures were completed not how they were exclusively performed on a particular day.
If well known procedures were used, account the procedure by name, possibly with reference, and that's all.
Approach:
It is embarrassed or not possible to use vigorous voice when documenting methods with no using first person, which would focus the reviewer's interest on the researcher rather than the job. As a result when script up the methods most authors use third person passive voice.
Use standard style in this and in every other part of the paper - avoid familiar lists, and use full sentences.
What to keep away from
Resources and methods are not a set of information.
Skip all descriptive information and surroundings - save it for the argument.
Leave out information that is immaterial to a third party.
Results:
The principle of a results segment is to present and demonstrate your conclusion. Create this part a entirely objective details of the outcome, and save all understanding for the discussion.
The page length of this segment is set by the sum and types of data to be reported. Carry on to be to the point, by means of statistics and tables, if suitable, to present consequences most efficiently.You must obviously differentiate material that would usually be incorporated in a study editorial from any unprocessed data or additional appendix matter that would not be available. In fact, such matter should not be submitted at all except requested by the instructor.
Content
Sum up your conclusion in text and demonstrate them, if suitable, with figures and tables.
In manuscript, explain each of your consequences, point the reader to remarks that are most appropriate.
Present a background, such as by describing the question that was addressed by creation an exacting study.
Explain results of control experiments and comprise remarks that are not accessible in a prescribed figure or table, if appropriate.
Examine your data, then prepare the analyzed (transformed) data in the form of a figure (graph), table, or in manuscript form. What to stay away from
Do not discuss or infer your outcome, report surroundings information, or try to explain anything.
Not at all, take in raw data or intermediate calculations in a research manuscript.
XVI
© Copyright by Global Journals Inc.(US)| Guidelines Handbook

Do not present the similar data more than once.
Manuscript should complement any figures or tables, not duplicate the identical information.
Never confuse figures with tables - there is a difference. Approach
As forever, use past tense when you submit to your results, and put the whole thing in a reasonable order.
Put figures and tables, appropriately numbered, in order at the end of the report
If you desire, you may place your figures and tables properly within the text of your results part. Figures and tables
If you put figures and tables at the end of the details, make certain that they are visibly distinguished from any attach appendix materials, such as raw facts
Despite of position, each figure must be numbered one after the other and complete with subtitle
In spite of position, each table must be titled, numbered one after the other and complete with heading
All figure and table must be adequately complete that it could situate on its own, divide from text Discussion:
The Discussion is expected the trickiest segment to write and describe. A lot of papers submitted for journal are discarded based onproblems with the Discussion. There is no head of state for how long a argument should be. Position your understanding of the outcomevisibly to lead the reviewer through your conclusions, and then finish the paper with a summing up of the implication of the study. Thepurpose here is to offer an understanding of your results and hold up for all of your conclusions, using facts from your research andgenerally accepted information, if suitable. The implication of result should be visibly described. Infer your data in the conversation in suitable depth. This means that when you clarify an observable fact you must explain mechanismsthat may account for the observation. If your results vary from your prospect, make clear why that may have happened. If your resultsagree, then explain the theory that the proof supported. It is never suitable to just state that the data approved with prospect, and let itdrop at that.
Make a decision if each premise is supported, discarded, or if you cannot make a conclusion with assurance. Do not just dismissa study or part of a study as "uncertain."
Research papers are not acknowledged if the work is imperfect. Draw what conclusions you can based upon the results thatyou have, and take care of the study as a finished work
You may propose future guidelines, such as how the experiment might be personalized to accomplish a new idea.
Give details all of your remarks as much as possible, focus on mechanisms.
Make a decision if the tentative design sufficiently addressed the theory, and whether or not it was correctly restricted.
Try to present substitute explanations if sensible alternatives be present.
One research will not counter an overall question, so maintain the large picture in mind, where do you go next? The beststudies unlock new avenues of study. What questions remain?
Recommendations for detailed papers will offer supplementary suggestions.Approach:
When you refer to information, differentiate data generated by your own studies from available information
Submit to work done by specific persons (including you) in past tense.
Submit to generally acknowledged facts and main beliefs in present tense.
ADMINISTRATION RULES LISTED BEFORE SUBMITTING YOUR RESEARCH PAPER TO GLOBAL JOURNALS INC. (US)
Please carefully note down following rules and regulation before submitting your Research Paper to Global Journals Inc. (US):
Segment Draft and Final Research Paper: You have to strictly follow the template of research paper. If it is not done your paper may get
rejected.
© Copyright by Global Journals Inc.(US) | Guidelines Handbook
XVII

Do not give permission to anyone else to "PROOFREAD" your manuscript.
Methods to avoid Plagiarism is applied by us on every paper, if found guilty, you will be blacklisted by all of our collaboratedresearch groups, your institution will be informed for this and strict legal actions will be taken immediately.)
To guard yourself and others from possible illegal use please do not permit anyone right to use to your paper and files.
The major constraint is that you must independently make all content, tables, graphs, and facts that are offered in the paper.You must write each part of the paper wholly on your own. The Peer-reviewers need to identify your own perceptive of theconcepts in your own terms. NEVER extract straight from any foundation, and never rephrase someone else's analysis.
XVIII
© Copyright by Global Journals Inc.(US)| Guidelines Handbook

CRITERION FOR GRADING A RESEARCH PAPER (COMPILATION)BY GLOBAL JOURNALS INC. (US)
Please note that following table is only a Grading of "Paper Compilation" and not on "Performed/Stated Research" whose grading
solely depends on Individual Assigned Peer Reviewer and Editorial Board Member. These can be available only on request and after
decision of Paper. This report will be the property of Global Journals Inc. (US).
Topics Grades
A-B C-D E-F
Abstract
Clear and concise with
appropriate content, Correct
format. 200 words or below
Unclear summary and no
specific data, Incorrect form
Above 200 words
No specific data with ambiguous
information
Above 250 words
Introduction
Containing all background
details with clear goal and
appropriate details, flow
specification, no grammar
and spelling mistake, well
organized sentence and
paragraph, reference cited
Unclear and confusing data,
appropriate format, grammar
and spelling errors with
unorganized matter
Out of place depth and content,
hazy format
Methods and
Procedures
Clear and to the point with
well arranged paragraph,
precision and accuracy of
facts and figures, well
organized subheads
Difficult to comprehend with
embarrassed text, too much
explanation but completed
Incorrect and unorganized
structure with hazy meaning
Result
Well organized, Clear and
specific, Correct units with
precision, correct data, well
structuring of paragraph, no
grammar and spelling
mistake
Complete and embarrassed
text, difficult to comprehend
Irregular format with wrong facts
and figures
Discussion
Well organized, meaningful
specification, sound
conclusion, logical and
concise explanation, highly
structured paragraph
reference cited
Wordy, unclear conclusion,
spurious
Conclusion is not cited,
unorganized, difficult to
comprehend
References
Complete and correct
format, well organized
Beside the point, Incomplete Wrong format and structuring
© Copyright by Global Journals Inc.(US) | Guidelines Handbook
XIX

A
absorber · 15, 18, 25, 26 Agricultural · 58 Automobile · 8, 11, 13, 15, 17, 19, 21, 23, 25, 27, 28, 30, 32, 34, 35, 58, 85, 87, 88, 90, 91, 93, 94, 95, 96
B
Biodiesel · 1, 3, 5, 6, 8, 10 Botswana · 1, 3, 4, 5, 6, 8, 10
C
compressed · 11, 36, 37, 38, 40, 41, 43, 50, 52, 53, 55, 57, 58 condenser · 13, 15, 17, 18, 22, 25, 26, 27, 31 crankshaft · 91 curvature · 66, 68, 71
D
Deconvolution · 4 demonstrated · 24, 41 demonstration · 3 desiccant · 15
E
eccentricity · 37 eigenvector · 78 Eigenvectors · 76 emissions · 3, 5, 8, 36, 38 Erosion · 64, 66, 68, 69, 70, 71, 72, 73, 74, 75 experimental · 1, 5, 6, 8, 19, 21, 22, 53, 56, 57, 64, 66, 70, 76, 78, 79, 80, 82 Experimental · 28, 31, 34, 50, 52, 53, 56, 76, 78, 79, 80, 81, 82, 84
F
feedstock · 1, 2, 3, 4, 6 framework · 95
H
hydroxypropyl · 5, 6, 8
L
Lagrangian · 64, 66, 69
linkages · 85, 87
linolenic · 2
lubricator · 52, 53, 54, 55
M
motorbikes · 39, 58
O
observability · 80
Orthotropic · 81
overpressure · 19
P
phenomena · 11, 70, 78
Polysulfide · 39
Potential · 1, 3, 5, 6, 8, 10, 36, 38, 40, 41, 43, 44, 50, 52, 54, 56,
58, 60, 62, 63 Preserve
· 29
R
radiator · 11, 15, 17, 26
refrigerant · 11, 13, 17, 18, 19, 21, 22, 23, 24, 25, 27, 28, 29, 30,
31, 33, 34 Refrigeration
· 11, 13, 27, 28, 29, 30, 31, 32, 33
Renewable · 8, 34, 41, 58, 62
Reutilization · 11, 13, 15, 17, 19, 21, 23, 25, 27, 28, 30, 32, 34,
35 rotational
· 37, 40, 43, 54
S
Sclerocarya · 1, 3, 5, 6, 8, 10
spectra · 5
standalone · 39
statistical · 66, 76, 82, 88
superheated · 13, 18
supermarket · 22, 23, 25, 31, 32, 33, 34
systemization · 87
Index

T
Turbine
· 37, 41, 43, 53, 58, 60, 61, 62
U
unprofitable
· 86
V
vigorously
· 77
W
Welded
· 76, 78, 80, 81, 82, 83, 84

2012 by Global Journals