Trace Element Composition of Selected Fertilizers Used in Chile: Phosphorus Fertilizers as a Source...
16
PLEASE SCROLL DOWN FOR ARTICLE This article was downloaded by: [Pontificia Universidad Católica de Chile] On: 22 June 2009 Access details: Access Details: [subscription number 906707261] Publisher Taylor & Francis Informa Ltd Registered in England and Wales Registered Number: 1072954 Registered office: Mortimer House, 37-41 Mortimer Street, London W1T 3JH, UK Soil and Sediment Contamination: An International Journal Publication details, including instructions for authors and subscription information: http://www.informaworld.com/smpp/title~content=t713401148 Trace Element Composition of Selected Fertilizers Used in Chile: Phosphorus Fertilizers as a Source of Long-Term Soil Contamination Mauricio Molina a ; Fabián Aburto b ; Raúl Calderón b ; Marcia Cazanga b ; Mauricio Escudey b a Departamento de Ciencias Vegetales, Facultad de Agronomía e Ingeniería Forestal, Pontificia Universidad Católica de Chile, Santiago, Chile b Departamento de Química de los Materiales, Facultad de Química y Biología, Universidad de Santiago de Chile, Santiago, Chile Online Publication Date: 01 July 2009 To cite this Article Molina, Mauricio, Aburto, Fabián, Calderón, Raúl, Cazanga, Marcia and Escudey, Mauricio(2009)'Trace Element Composition of Selected Fertilizers Used in Chile: Phosphorus Fertilizers as a Source of Long-Term Soil Contamination',Soil and Sediment Contamination: An International Journal,18:4,497 — 511 To link to this Article: DOI: 10.1080/15320380902962320 URL: http://dx.doi.org/10.1080/15320380902962320 Full terms and conditions of use: http://www.informaworld.com/terms-and-conditions-of-access.pdf This article may be used for research, teaching and private study purposes. Any substantial or systematic reproduction, re-distribution, re-selling, loan or sub-licensing, systematic supply or distribution in any form to anyone is expressly forbidden. The publisher does not give any warranty express or implied or make any representation that the contents will be complete or accurate or up to date. The accuracy of any instructions, formulae and drug doses should be independently verified with primary sources. The publisher shall not be liable for any loss, actions, claims, proceedings, demand or costs or damages whatsoever or howsoever caused arising directly or indirectly in connection with or arising out of the use of this material.
-
Upload
independent -
Category
Documents
-
view
0 -
download
0
Transcript of Trace Element Composition of Selected Fertilizers Used in Chile: Phosphorus Fertilizers as a Source...
PLEASE SCROLL DOWN FOR ARTICLE
This article was downloaded by: [Pontificia Universidad Católica de Chile]On: 22 June 2009Access details: Access Details: [subscription number 906707261]Publisher Taylor & FrancisInforma Ltd Registered in England and Wales Registered Number: 1072954 Registered office: Mortimer House,37-41 Mortimer Street, London W1T 3JH, UK
Soil and Sediment Contamination: An International JournalPublication details, including instructions for authors and subscription information:http://www.informaworld.com/smpp/title~content=t713401148
Trace Element Composition of Selected Fertilizers Used in Chile: PhosphorusFertilizers as a Source of Long-Term Soil ContaminationMauricio Molina a; Fabián Aburto b; Raúl Calderón b; Marcia Cazanga b; Mauricio Escudey b
a Departamento de Ciencias Vegetales, Facultad de Agronomía e Ingeniería Forestal, Pontificia UniversidadCatólica de Chile, Santiago, Chile b Departamento de Química de los Materiales, Facultad de Química yBiología, Universidad de Santiago de Chile, Santiago, Chile
Online Publication Date: 01 July 2009
To cite this Article Molina, Mauricio, Aburto, Fabián, Calderón, Raúl, Cazanga, Marcia and Escudey, Mauricio(2009)'Trace ElementComposition of Selected Fertilizers Used in Chile: Phosphorus Fertilizers as a Source of Long-Term Soil Contamination',Soil andSediment Contamination: An International Journal,18:4,497 — 511
To link to this Article: DOI: 10.1080/15320380902962320
URL: http://dx.doi.org/10.1080/15320380902962320
Full terms and conditions of use: http://www.informaworld.com/terms-and-conditions-of-access.pdf
This article may be used for research, teaching and private study purposes. Any substantial orsystematic reproduction, re-distribution, re-selling, loan or sub-licensing, systematic supply ordistribution in any form to anyone is expressly forbidden.
The publisher does not give any warranty express or implied or make any representation that the contentswill be complete or accurate or up to date. The accuracy of any instructions, formulae and drug dosesshould be independently verified with primary sources. The publisher shall not be liable for any loss,actions, claims, proceedings, demand or costs or damages whatsoever or howsoever caused arising directlyor indirectly in connection with or arising out of the use of this material.
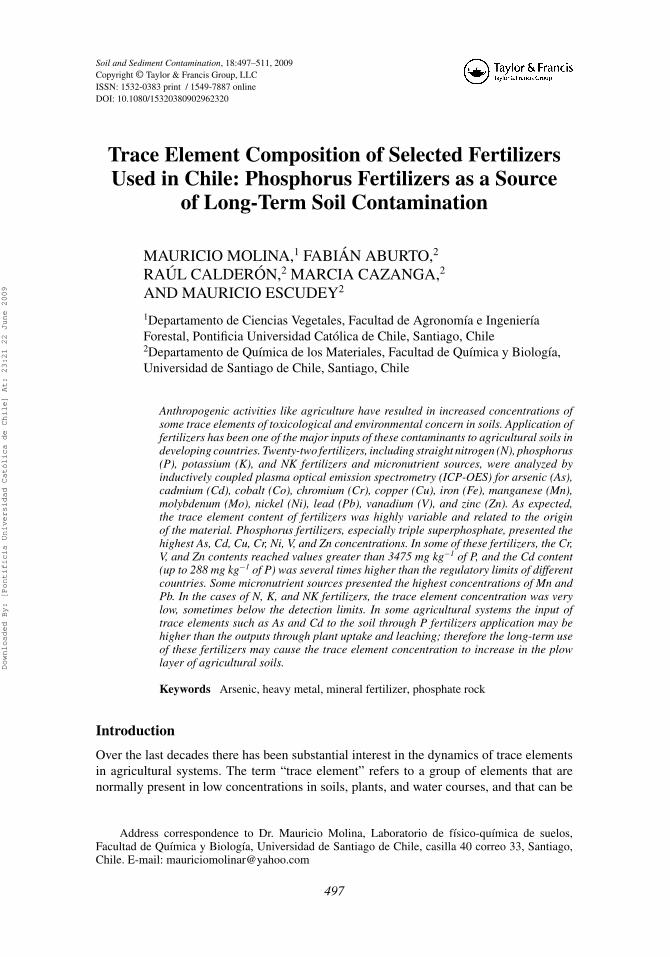
Soil and Sediment Contamination, 18:497–511, 2009Copyright © Taylor & Francis Group, LLCISSN: 1532-0383 print / 1549-7887 onlineDOI: 10.1080/15320380902962320
Trace Element Composition of Selected FertilizersUsed in Chile: Phosphorus Fertilizers as a Source
of Long-Term Soil Contamination
MAURICIO MOLINA,1 FABIAN ABURTO,2
RAUL CALDERON,2 MARCIA CAZANGA,2
AND MAURICIO ESCUDEY2
1Departamento de Ciencias Vegetales, Facultad de Agronomıa e IngenierıaForestal, Pontificia Universidad Catolica de Chile, Santiago, Chile2Departamento de Quımica de los Materiales, Facultad de Quımica y Biologıa,Universidad de Santiago de Chile, Santiago, Chile
Anthropogenic activities like agriculture have resulted in increased concentrations ofsome trace elements of toxicological and environmental concern in soils. Application offertilizers has been one of the major inputs of these contaminants to agricultural soils indeveloping countries. Twenty-two fertilizers, including straight nitrogen (N), phosphorus(P), potassium (K), and NK fertilizers and micronutrient sources, were analyzed byinductively coupled plasma optical emission spectrometry (ICP-OES) for arsenic (As),cadmium (Cd), cobalt (Co), chromium (Cr), copper (Cu), iron (Fe), manganese (Mn),molybdenum (Mo), nickel (Ni), lead (Pb), vanadium (V), and zinc (Zn). As expected,the trace element content of fertilizers was highly variable and related to the originof the material. Phosphorus fertilizers, especially triple superphosphate, presented thehighest As, Cd, Cu, Cr, Ni, V, and Zn concentrations. In some of these fertilizers, the Cr,V, and Zn contents reached values greater than 3475 mg kg−1 of P, and the Cd content(up to 288 mg kg−1 of P) was several times higher than the regulatory limits of differentcountries. Some micronutrient sources presented the highest concentrations of Mn andPb. In the cases of N, K, and NK fertilizers, the trace element concentration was verylow, sometimes below the detection limits. In some agricultural systems the input oftrace elements such as As and Cd to the soil through P fertilizers application may behigher than the outputs through plant uptake and leaching; therefore the long-term useof these fertilizers may cause the trace element concentration to increase in the plowlayer of agricultural soils.
Keywords Arsenic, heavy metal, mineral fertilizer, phosphate rock
Introduction
Over the last decades there has been substantial interest in the dynamics of trace elementsin agricultural systems. The term “trace element” refers to a group of elements that arenormally present in low concentrations in soils, plants, and water courses, and that can be
Address correspondence to Dr. Mauricio Molina, Laboratorio de fısico-quımica de suelos,Facultad de Quımica y Biologıa, Universidad de Santiago de Chile, casilla 40 correo 33, Santiago,Chile. E-mail: [email protected]
497
Downloaded By: [Pontificia Universidad Católica de Chile] At: 23:21 22 June 2009
498 M. Molina et al.
essential or not for the growth and development of plants, animals, and humans (Pierzynskiet al., 2005). This definition includes heavy metals, metalloids, micronutrients, and otherelements. The most important environmental concerns regarding these elements are relatedto human health and ecological risks, because they can harm humans, animals, plants andother organisms when they are found above a critical concentration threshold.
Trace elements are naturally found in the soil, derived from the parent material, butthey can also be introduced as a result of anthropogenic activities like agriculture. Soilcontamination by these elements can be the first step involving their entrance into the foodchain (He et al., 2005) because they are not biodegradable, their persistence in the soilis much greater than in any other medium of the biosphere, and their effect is cumula-tive. Agricultural activities, such as the application of fertilizers and sewage sludge fromwastewater treatment plants to the soil, have been mentioned as the largest sources of traceelements in cropland soils (Chang and Page, 2000; Kabata-Pendias and Pendias, 2001;Wang et al., 2001; Nicholson et al., 2003; Dach and Starmans, 2005). Some studies havepointed out that the application of fertilizers can produce an accumulation of these elementsin the soil (Taylor, 1997; Gray et al., 1999; Chang and Page, 2000; Nicholson et al., 2003).Mineral fertilizers, in contrast with other soil amendments, are the most consistent sourcesof trace elements sustained over time. This is particularly valid for developing countrieslike Chile in which there has been less pressure than that existing in developed countriesfor the disposal of sewage sludge on agricultural soils. Among mineral fertilizers, P sourcesare those that have the highest levels of contamination by environmentally important ele-ments (Charter et al., 1993; Mermut et al., 1996; McLaughlin et al., 1996; Mortvedt, 1996;Raven and Loeppert, 1997; USEPA, 1999; McBride and Spiers, 2001; Otero et al., 2005).Phosphorus fertilizers are obtained from phosphate rock (PR), a natural P-rich mineral thathas variable concentrations of trace elements depending on its origin (McLaughlin et al.,1996); usually, the average concentration of trace elements in PR is higher than that foundin the earth’s crust (McBride and Spiers, 2001). Because trace elements are undesirable inagriculture, some countries have established regulations with respect to maximum inputrates of these contaminants into agricultural soils and maximum concentration limits infertilizers (Canadian Food Inspection Agency, 1997; USEPA, 1999; California Code ofRegulations, 2001; USEPA, 2002; Van Balken, 2004; AAPFCO, 2007).
Although in Chile the area under annual and horticultural crops has remained stableat an average of about 979,000 ha between 1990 and 2004 (ODEPA, 2007), fertilizerconsumption has been increasing due to an intensification of production and the need tosustain high yields. According to data from the International Fertilizer Industry Association(IFA, 2007), nutrient consumption (N+P2O5+K2O) increased approximately 70% in thesame period, reaching 526,400 tons in 2004. This particular scenario implies a greaterincorporation either of nutrients or potential contaminants as trace elements per unit ofcultivated area. In the case of P fertilizers, practically all the local consumption is suppliedby imports, which have increased an average of 45% since 1990 (ODEPA, 2007). Thissituation is valid for several countries around the world that do not have sufficiently highP levels in their PR deposits to establish an economically sustainable exploitation and/orwhose local production is insufficient to satisfy the demand. Consequently, they have toimport P from producing countries.
In particular, in Chile there is little published information on the presence of traceelements in fertilizers. Bonomelli et al. (2002) analyzed the presence of Cd in P fertiliz-ers and in some PRs that entered Chile during the 1999–2000 season, finding a greatercontamination by Cd in triple superphosphate (TSP) and PR.
Downloaded By: [Pontificia Universidad Católica de Chile] At: 23:21 22 June 2009
Trace Element Composition of Selected Fertilizers Used in Chile 499
The objective of the present study was to analyze the content of 12 trace elements infertilizers commonly used in agriculture, and compare the existing concentrations with thestandards established or suggested by different countries in order to provide informationfor further studies on the accumulation of these contaminants in agricultural soils.
Materials and Methods
Fertilizer and Micronutrient Sources
One-kilogram samples of fertilizers were randomly collected from the warehouses ofChilean commercial suppliers and classified according to their country of origin. All sampleswere handled with plastic tools and stored in plastic containers. A total of 22 fertilizers wereanalyzed: ten P, four N, four K, and two NK fertilizers, all of them marketed during 2005, andtwo P fertilizers marketed at the beginning of 2006. These materials were selected becausethey represent the most widely used fertilizers for basal and/or topdressing applicationin cropland and horticultural soils. In addition, six micronutrient (Fe and Zn) sourcescommonly used in arid and semiarid zones of Chile (Ortega-Blu and Molina-Roco, 2007)were analyzed. Tables 1 and 2 show the macro- and micronutrient composition of fertilizersaccording to the guaranteed analyses of their labels. Before analysis, two sub-samples ofeach homogenized fertilizer were grounded in a porcelain mortar and pestle to pass a0.5-mm sieve.
Analytical Procedures
Samples were digested in duplicate in a microwave oven according to the standard EPAmethod 3052 for siliceous and organic matrices (USEPA, 1996). Briefly, one gram of samplewas digested in a 9:3:2 HNO3:HF:HCl mixture. Samples were diluted to 50 mL with double-distilled water and were stored in polyethylene containers at 5◦C until determination oftrace elements by ICP-OES (Perkin Elmer Optima 2000). The analyzed elements includedAs, Cd, Co, Cu, Cr, Fe, Mn, Mo, Ni, Pb, V, and Zn. At least 5 blanks were used tocalculate the detection limits and to minimize the background solution effect. Detectionlimits are presented in Table 3. As a quality test, a standard reference material fromthe National Institute of Standards and Technology (NIST 2709, San Joaquin soil) was
Table 1Macronutrient composition of P, N, K and NK fertilizers∗
Fertilizer N◦ samples N (%) P2O5 (%) K2O (%)
Triple superphosphate (TSP) 4 — 46–48 —Monoammonium phosphate (MAP) 4 10–12 50 —Diammonium phosphate (DAP) 4 18 46 —Urea 4 46 — —Potassium nitrate (KNO3) 2 14 — 45Potassium chloride (KCl) 3 — — 60–61Potassium sulfate (K2SO4) 1 — — 50
∗Data from fertilizer providers’ information. Percentage on a mass basis.
Downloaded By: [Pontificia Universidad Católica de Chile] At: 23:21 22 June 2009
500 M. Molina et al.
Table 2Fe and Zn composition of micronutrient (Fe and Zn) sources∗
Fertilizer N◦ samples Fe (%) Zn (%)
Iron sulfate (FeSO4) 1 6 —Iron chelate (Fe-EDDHA) 2 20 —Zinc sulfate (ZnSO4) 1 — 34Zinc chelate (Zn-EDTA) 2 — 14
∗Data from fertilizer providers’ information. Percentage on a mass basis.
digested in each set of samples following the same procedure. If during the analysisone or more elements of the reference material showed more than 10% deviation from thereference value, those elements were not considered, and a new set of samples and referencematerial was prepared and digested for analysis. In the case of Cd the tolerance was 15%because the concentration of reference material (0.38 mg kg−1) is close to the detectionlimit.
Data Analysis
Data were grouped by type of fertilizer as follow: i) P fertilizers; ii) N, K and, NKfertilizers; and iii) micronutrient sources. All samples were analyzed in duplicate, andstandard deviations for each fertilizer from different origin are represented as error bars inFigures 1 and 2. For each trace element within each group the arithmetic mean, the median,and the range of element concentration were calculated and the fertilizer with the highestelement content was identified. In the case of P fertilizers, the coefficient of variation of aspecific element was calculated for each fertilizer type.
Table 3Detection limits of trace element determination byICP-OES for the experimental conditions considered
Detection limitElement (mg kg−1)
As 1.0Cd 0.22Co 0.10Cu 0.60Cr 0.25Fe 1.4Mn 0.15Mo 0.20Ni 0.25Pb 1.1V 0.45Zn 0.45
Downloaded By: [Pontificia Universidad Católica de Chile] At: 23:21 22 June 2009
Trace Element Composition of Selected Fertilizers Used in Chile 501
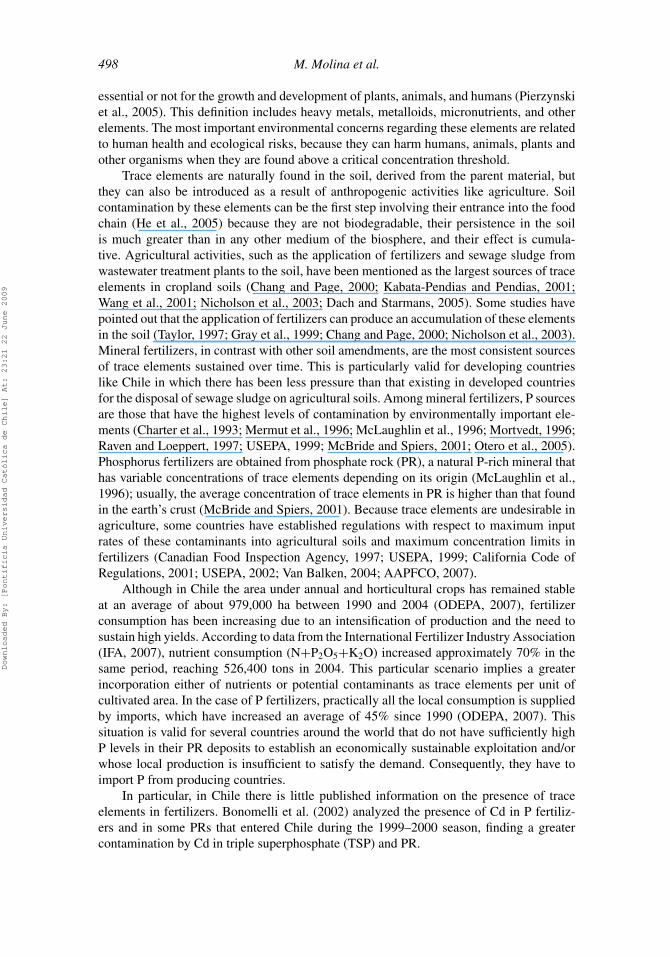
Figure 1. Trace element concentration in triple superphosphates according to their origin. Bars showstandard deviation.
Results and Discussion
Phosphorus Fertilizers
The concentration of trace elements in P fertilizers was variable, depending on the fertilizerand its origin. All the collected and analyzed P fertilizers came from Mexico or the USA,countries that have important PR deposits at the world level. The USA is the world’s mainproducer of P fertilizers and it has the largest PR deposits. Mexico, in turn, is among the16 countries with the largest deposits of these types of P sources, and it is number twoin production in Latin America after Brazil (FAO, 2004). Chile has imported from thosecountries between 70–100% of its P fertilizers over the last 15 years (ODEPA, 2007).
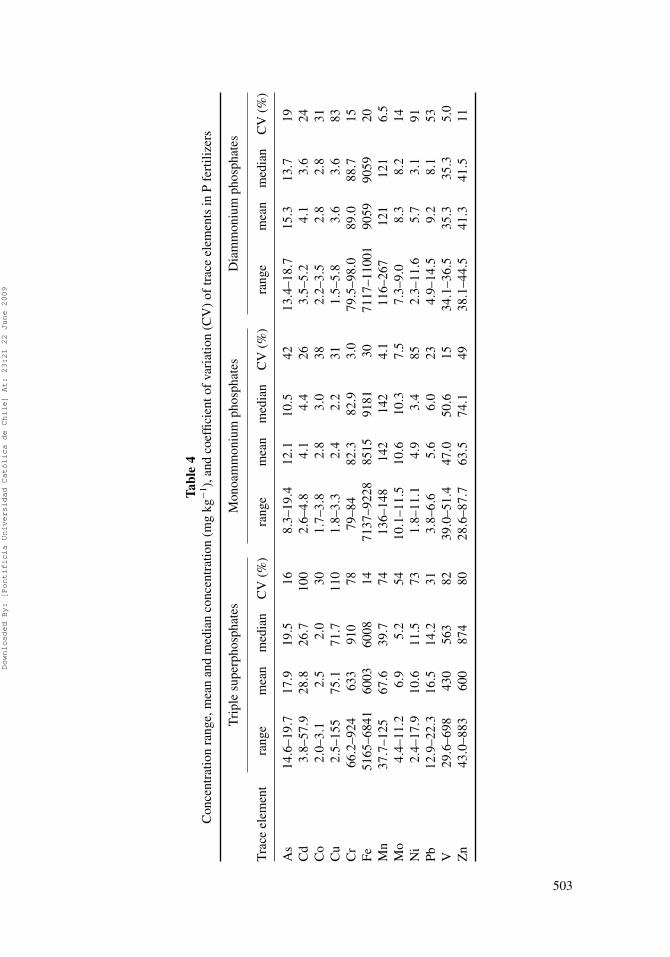
Figures 1 and 2 show the trace element concentration of the different P fertilizersanalyzed, classified according to their origin. For each type of fertilizer the elementsare presented in two groups according to their concentration range. For most elements, theaverage concentrations in TSP were higher than those in monoammonium phosphate (MAP)and diammonium phosphate (DAP) (Figures 1 and 2, Table 4). TSPs from Mexico werethe fertilizers with the highest trace element contents. For some of the elements of greaterenvironmental and health concern (Cd, Ni, Cu, Cr, V, and Zn), the average concentrationsin Mexican TSP were greater than those in TSP from the USA, and also greater than thoseof the other P fertilizers. For example, the average Cd and Cr concentrations in MexicanTSP were 13 times higher than those in the TSP from the USA; for V and Zn the differenceis more than 20 times, and for Cu more than 37 times. On the other hand, for Co, Pb, Mn,and Mo the TSP from the USA had average concentrations higher than those from Mexico.Arsenic presented similar concentration in all TSPs.
Figure 2 and Table 4 present the concentration of trace elements for DAP and MAP.These fertilizers, regardless of their origin, showed higher average concentrations of Fe andMn compared to TSP. Cobalt and Mo presented slightly higher average concentrations inDAP and MAP compared to TSP, but the values were within similar ranges (Table 4). In
Downloaded By: [Pontificia Universidad Católica de Chile] At: 23:21 22 June 2009

502 M. Molina et al.
Figure 2. Trace element concentration in monoammonium and diammonium phosphates accordingto their origin. Bars show standard deviation.
general, fertilizers derived from phosphoric acid (MAP and DAP) have lower Cd and othertrace element contents compared to TSP and PR (Alloway and Steinnes, 1999). Consideringthe origin of the material, in general it was found that the average concentration of As,Cd, Co, Ni, Cr, and V was slightly higher in the case of MAP and DAP from the USAcompared to those of Mexican origin. The concentrations of most trace elements found inthis study are within the ranges found in other countries for P fertilizers (Amaral Sobrinhoet al., 1992; Charter et al., 1993; Charter et al., 1995; Giuffre et al., 1997; CDFA, 1998;Franklin et al., 2005; Nziguheba and Smolders, 2008).
Downloaded By: [Pontificia Universidad Católica de Chile] At: 23:21 22 June 2009
Tabl
e4
Con
cent
ratio
nra
nge,
mea
nan
dm
edia
nco
ncen
trat
ion
(mg
kg−1
),an
dco
effic
ient
ofva
riat
ion
(CV
)of
trac
eel
emen
tsin
Pfe
rtili
zers
Tri
ple
supe
rpho
spha
tes
Mon
oam
mon
ium
phos
phat
esD
iam
mon
ium
phos
phat
es
Tra
ceel
emen
tra
nge
mea
nm
edia
nC
V(%
)ra
nge
mea
nm
edia
nC
V(%
)ra
nge
mea
nm
edia
nC
V(%
)
As
14.6
–19.
717
.919
.516
8.3–
19.4
12.1
10.5
4213
.4–1
8.7
15.3
13.7
19C
d3.
8–57
.928
.826
.710
02.
6–4.
84.
14.
426
3.5–
5.2
4.1
3.6
24C
o2.
0–3.
12.
52.
030
1.7–
3.8
2.8
3.0
382.
2–3.
52.
82.
831
Cu
2.5–
155
75.1
71.7
110
1.8–
3.3
2.4
2.2
311.
5–5.
83.
63.
683
Cr
66.2
–924
633
910
7879
–84
82.3
82.9
3.0
79.5
–98.
089
.088
.715
Fe51
65–6
841
6003
6008
1471
37–9
228
8515
9181
3071
17–1
1001
9059
9059
20M
n37
.7–1
2567
.639
.774
136–
148
142
142
4.1
116–
267
121
121
6.5
Mo
4.4–
11.2
6.9
5.2
5410
.1–1
1.5
10.6
10.3
7.5
7.3–
9.0
8.3
8.2
14N
i2.
4–17
.910
.611
.573
1.8–
11.1
4.9
3.4
852.
3–11
.65.
73.
191
Pb12
.9–2
2.3
16.5
14.2
313.
8–6.
65.
66.
023
4.9–
14.5
9.2
8.1
53V
29.6
–698
430
563
8239
.0–5
1.4
47.0
50.6
1534
.1–3
6.5
35.3
35.3
5.0
Zn
43.0
–883
600
874
8028
.6–8
7.7
63.5
74.1
4938
.1–4
4.5
41.3
41.5
11
503
Downloaded By: [Pontificia Universidad Católica de Chile] At: 23:21 22 June 2009
504 M. Molina et al.
All P fertilizers had a high Fe content, an element that is found in greater amounts withrespect to other heavy metals and trace elements in the earth’s crust and in PR used as rawmaterial for P fertilizer production. Iron concentration ranges were 0.51–0.68% in TSP,0.71–0.92% in MAP, and 0.71–1.1% in DAP. These concentrations are lower than thosereported by Gabe and Rodella (1999) for Brazilian TSP, DAP, and MAP (1.0–1.4%), but ingeneral higher than those reported by Raven and Loeppert (1997) for P fertilizers from theUSA (0.26–1.7%). Iron is a less important element in environmental terms, and because itis found in high concentration in soils it is considered rather as a micronutrient for plants.
Cadmium accumulation and contamination in soils has been of special interest becauseof its toxicity and mobility in the soil-plant-water system (Kabata-Pendias and Pendias,2001; Banat et al., 2007; Jalali and Khanlari, 2008). For this reason most studies of traceelement concentration in fertilizers include this element. Considering the data given in thispaper, similar (Raven and Loeppert, 1997; Bonomelli et al., 2002; Lugon-Moulin et al.,2006), lower (Charter et al., 1993; Giuffre et al., 1997; Gabe and Rodella, 1999; McBrideand Spiers, 2001; Franklin et al., 2005), and higher (CDFA, 1998) values have been reportedfor Cd content in TSP. Bonomelli et al. (2002) also found that the maximum concentrationsof Cd (up to 56 mg kg−1) were found in Mexican TSPs that entered Chile during the1999–2000 season. Concentrations higher than 130 mg kg−1 have been found in the USAin this fertilizer (CDFA, 1998). In the case of MAP and DAP, Cd concentrations were withinthe ranges reported for fertilizers of Mexican and American origin previously imported toChile (Bonomelli et al., 2002) and similar to those found by other researchers (AmaralSobrinho et al., 1992; Charter et al., 1993; Giuffre et al., 1997; Gabe and Rodella, 1999).In a recent study in which a survey of Cd concentrations in P fertilizers used in countriesbelonging to the European Union (EU) was made (Nziguheba and Smolders, 2008), anaverage Cd concentration similar to those reported for MAP and DAP in the present studywas reported. These authors did not specify the P fertilizers analyzed, but they mentionthat the concentration of Cd in the fertilizers used by the EU has decreased over time. Theuse of sewage sludge (SS) has been mentioned as an important source of trace element tocultivated soils. However, the concentration of Cd found in Mexican TSPs is 10 to 50 timeshigher than that found in Chilean SS (SAG, 2005; Escudey et al., 2007), indicating thatwith regard to this element more attention needs to be paid to the regulations and use of Pfertilizers.
Table 4 shows the coefficient of variation (CV) for the content of the elements analyzedin the P fertilizers. The Cd, Cu, Cr, Mn, Mo, V, and Zn content had the greatest variabilityin TSP. This variability is mainly due to the large difference between the concentrations ofthese elements in the fertilizers from Mexico and from the USA (Figure 1). The CV forthese elements ranged from 54% to 110% in the analyzed TSPs. For example, the averageCu content in TSP from Mexico was 146 mg kg−1, while in that from the USA it was3.9 mg kg−1. Cobalt is one of the elements found in lowest concentration in the P fertilizers,and it shows similar variations in TSP, MAP, and DAP. Nickel showed differences inconcentration, even for fertilizers from the same origin, showing a high CV in the threetypes of P fertilizers. Arsenic is found in the group of elements showing the lowest averagevariability, which is in agreement with previous reports on some P fertilizers and PRs(Charter et al., 1995; Raven and Loeppert, 1997). Molybdenum has been reported as oneof the elements with lowest concentration variation among TSP, MAP, and DAP (Charteret al., 1995). However, differences of up to twice the Mo concentration were found forthese fertilizers in the present study.
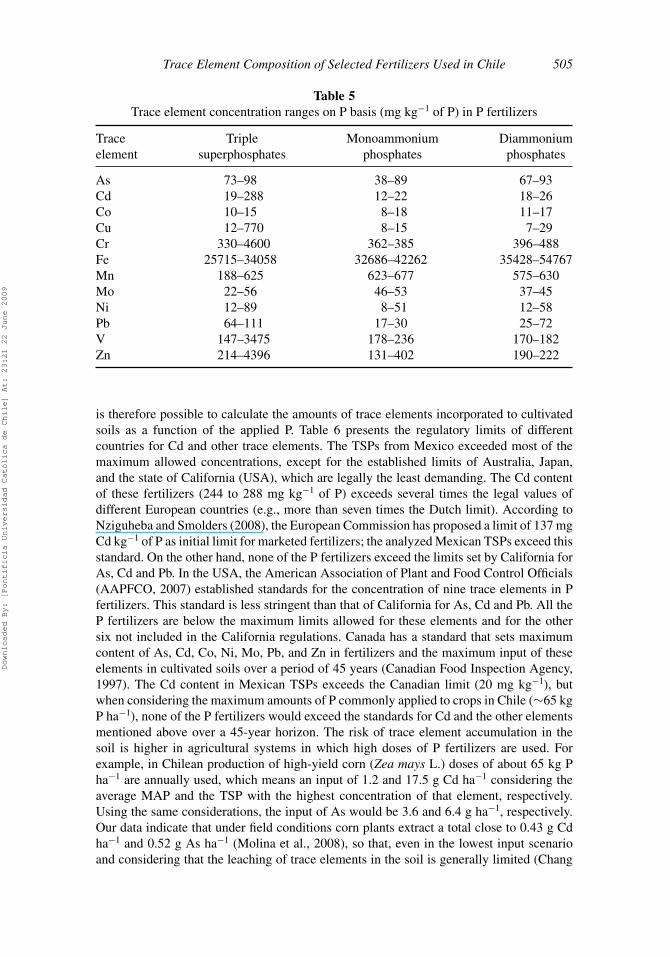
Table 5 presents the trace element content of P fertilizers based on their P content. Thisconversion is useful because fertilizer application rates depend on their P content, and it
Downloaded By: [Pontificia Universidad Católica de Chile] At: 23:21 22 June 2009
Trace Element Composition of Selected Fertilizers Used in Chile 505
Table 5Trace element concentration ranges on P basis (mg kg−1 of P) in P fertilizers
Trace Triple Monoammonium Diammoniumelement superphosphates phosphates phosphates
As 73–98 38–89 67–93Cd 19–288 12–22 18–26Co 10–15 8–18 11–17Cu 12–770 8–15 7–29Cr 330–4600 362–385 396–488Fe 25715–34058 32686–42262 35428–54767Mn 188–625 623–677 575–630Mo 22–56 46–53 37–45Ni 12–89 8–51 12–58Pb 64–111 17–30 25–72V 147–3475 178–236 170–182Zn 214–4396 131–402 190–222
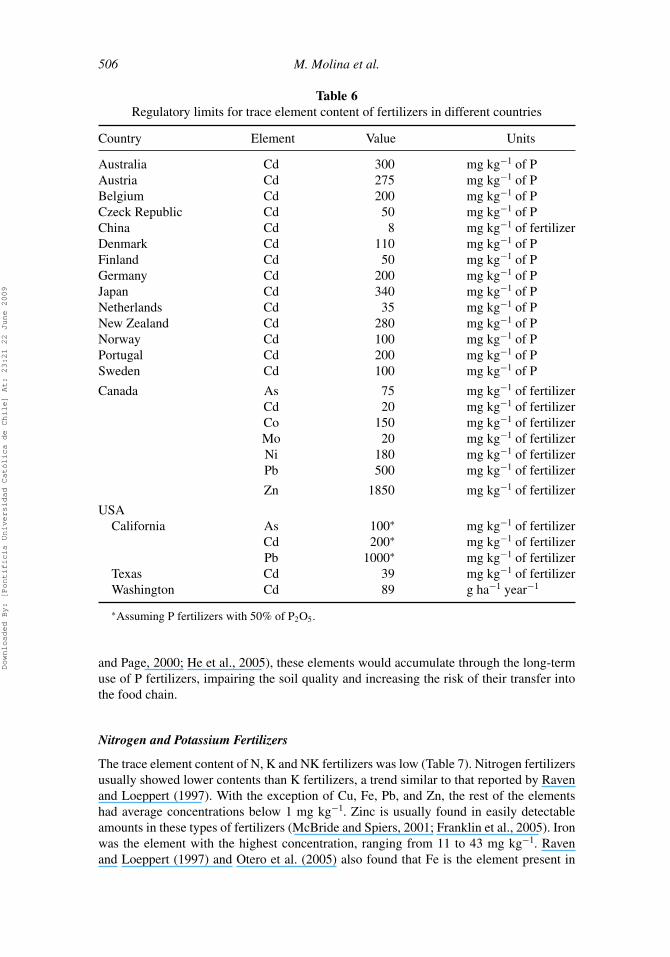
is therefore possible to calculate the amounts of trace elements incorporated to cultivatedsoils as a function of the applied P. Table 6 presents the regulatory limits of differentcountries for Cd and other trace elements. The TSPs from Mexico exceeded most of themaximum allowed concentrations, except for the established limits of Australia, Japan,and the state of California (USA), which are legally the least demanding. The Cd contentof these fertilizers (244 to 288 mg kg−1 of P) exceeds several times the legal values ofdifferent European countries (e.g., more than seven times the Dutch limit). According toNziguheba and Smolders (2008), the European Commission has proposed a limit of 137 mgCd kg−1 of P as initial limit for marketed fertilizers; the analyzed Mexican TSPs exceed thisstandard. On the other hand, none of the P fertilizers exceed the limits set by California forAs, Cd and Pb. In the USA, the American Association of Plant and Food Control Officials(AAPFCO, 2007) established standards for the concentration of nine trace elements in Pfertilizers. This standard is less stringent than that of California for As, Cd and Pb. All theP fertilizers are below the maximum limits allowed for these elements and for the othersix not included in the California regulations. Canada has a standard that sets maximumcontent of As, Cd, Co, Ni, Mo, Pb, and Zn in fertilizers and the maximum input of theseelements in cultivated soils over a period of 45 years (Canadian Food Inspection Agency,1997). The Cd content in Mexican TSPs exceeds the Canadian limit (20 mg kg−1), butwhen considering the maximum amounts of P commonly applied to crops in Chile (∼65 kgP ha−1), none of the P fertilizers would exceed the standards for Cd and the other elementsmentioned above over a 45-year horizon. The risk of trace element accumulation in thesoil is higher in agricultural systems in which high doses of P fertilizers are used. Forexample, in Chilean production of high-yield corn (Zea mays L.) doses of about 65 kg Pha−1 are annually used, which means an input of 1.2 and 17.5 g Cd ha−1 considering theaverage MAP and the TSP with the highest concentration of that element, respectively.Using the same considerations, the input of As would be 3.6 and 6.4 g ha−1, respectively.Our data indicate that under field conditions corn plants extract a total close to 0.43 g Cdha−1 and 0.52 g As ha−1 (Molina et al., 2008), so that, even in the lowest input scenarioand considering that the leaching of trace elements in the soil is generally limited (Chang
Downloaded By: [Pontificia Universidad Católica de Chile] At: 23:21 22 June 2009
506 M. Molina et al.
Table 6Regulatory limits for trace element content of fertilizers in different countries
Country Element Value Units
Australia Cd 300 mg kg−1 of PAustria Cd 275 mg kg−1 of PBelgium Cd 200 mg kg−1 of PCzeck Republic Cd 50 mg kg−1 of PChina Cd 8 mg kg−1 of fertilizerDenmark Cd 110 mg kg−1 of PFinland Cd 50 mg kg−1 of PGermany Cd 200 mg kg−1 of PJapan Cd 340 mg kg−1 of PNetherlands Cd 35 mg kg−1 of PNew Zealand Cd 280 mg kg−1 of PNorway Cd 100 mg kg−1 of PPortugal Cd 200 mg kg−1 of PSweden Cd 100 mg kg−1 of P
Canada As 75 mg kg−1 of fertilizerCd 20 mg kg−1 of fertilizerCo 150 mg kg−1 of fertilizerMo 20 mg kg−1 of fertilizerNi 180 mg kg−1 of fertilizerPb 500 mg kg−1 of fertilizer
Zn 1850 mg kg−1 of fertilizer
USACalifornia As 100∗ mg kg−1 of fertilizer
Cd 200∗ mg kg−1 of fertilizerPb 1000∗ mg kg−1 of fertilizer
Texas Cd 39 mg kg−1 of fertilizerWashington Cd 89 g ha−1 year−1
∗Assuming P fertilizers with 50% of P2O5.
and Page, 2000; He et al., 2005), these elements would accumulate through the long-termuse of P fertilizers, impairing the soil quality and increasing the risk of their transfer intothe food chain.
Nitrogen and Potassium Fertilizers
The trace element content of N, K and NK fertilizers was low (Table 7). Nitrogen fertilizersusually showed lower contents than K fertilizers, a trend similar to that reported by Ravenand Loeppert (1997). With the exception of Cu, Fe, Pb, and Zn, the rest of the elementshad average concentrations below 1 mg kg−1. Zinc is usually found in easily detectableamounts in these types of fertilizers (McBride and Spiers, 2001; Franklin et al., 2005). Ironwas the element with the highest concentration, ranging from 11 to 43 mg kg−1. Ravenand Loeppert (1997) and Otero et al. (2005) also found that Fe is the element present in
Downloaded By: [Pontificia Universidad Católica de Chile] At: 23:21 22 June 2009
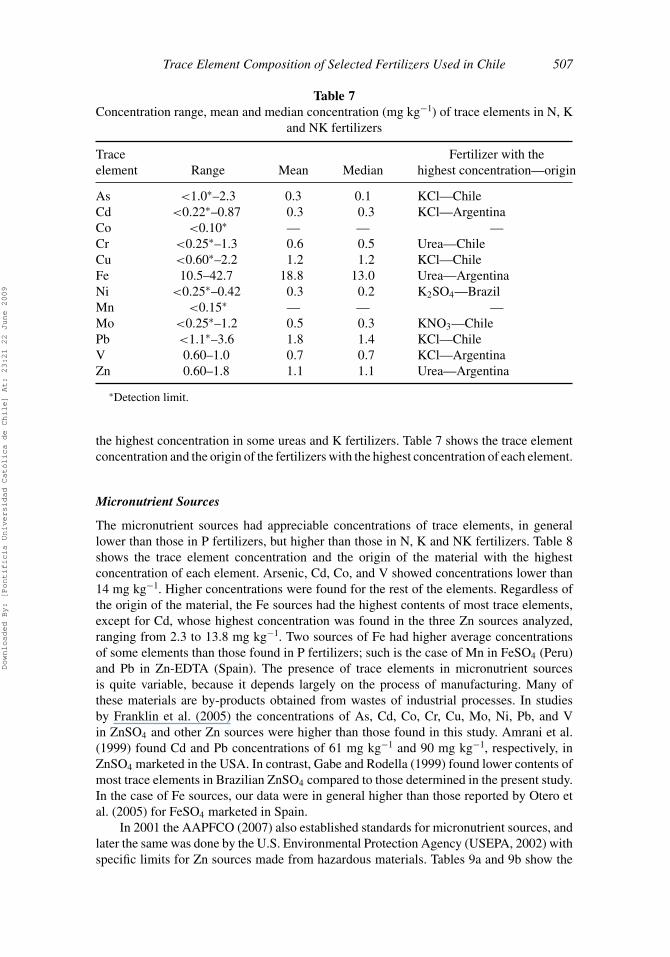
Trace Element Composition of Selected Fertilizers Used in Chile 507
Table 7Concentration range, mean and median concentration (mg kg−1) of trace elements in N, K
and NK fertilizers
Trace Fertilizer with theelement Range Mean Median highest concentration—origin
As <1.0∗–2.3 0.3 0.1 KCl—ChileCd <0.22∗–0.87 0.3 0.3 KCl—ArgentinaCo <0.10∗ — — —Cr <0.25∗–1.3 0.6 0.5 Urea—ChileCu <0.60∗–2.2 1.2 1.2 KCl—ChileFe 10.5–42.7 18.8 13.0 Urea—ArgentinaNi <0.25∗–0.42 0.3 0.2 K2SO4—BrazilMn <0.15∗ — — —Mo <0.25∗–1.2 0.5 0.3 KNO3—ChilePb <1.1∗–3.6 1.8 1.4 KCl—ChileV 0.60–1.0 0.7 0.7 KCl—ArgentinaZn 0.60–1.8 1.1 1.1 Urea—Argentina
∗Detection limit.
the highest concentration in some ureas and K fertilizers. Table 7 shows the trace elementconcentration and the origin of the fertilizers with the highest concentration of each element.
Micronutrient Sources
The micronutrient sources had appreciable concentrations of trace elements, in generallower than those in P fertilizers, but higher than those in N, K and NK fertilizers. Table 8shows the trace element concentration and the origin of the material with the highestconcentration of each element. Arsenic, Cd, Co, and V showed concentrations lower than14 mg kg−1. Higher concentrations were found for the rest of the elements. Regardless ofthe origin of the material, the Fe sources had the highest contents of most trace elements,except for Cd, whose highest concentration was found in the three Zn sources analyzed,ranging from 2.3 to 13.8 mg kg−1. Two sources of Fe had higher average concentrationsof some elements than those found in P fertilizers; such is the case of Mn in FeSO4 (Peru)and Pb in Zn-EDTA (Spain). The presence of trace elements in micronutrient sourcesis quite variable, because it depends largely on the process of manufacturing. Many ofthese materials are by-products obtained from wastes of industrial processes. In studiesby Franklin et al. (2005) the concentrations of As, Cd, Co, Cr, Cu, Mo, Ni, Pb, and Vin ZnSO4 and other Zn sources were higher than those found in this study. Amrani et al.(1999) found Cd and Pb concentrations of 61 mg kg−1 and 90 mg kg−1, respectively, inZnSO4 marketed in the USA. In contrast, Gabe and Rodella (1999) found lower contents ofmost trace elements in Brazilian ZnSO4 compared to those determined in the present study.In the case of Fe sources, our data were in general higher than those reported by Otero etal. (2005) for FeSO4 marketed in Spain.
In 2001 the AAPFCO (2007) also established standards for micronutrient sources, andlater the same was done by the U.S. Environmental Protection Agency (USEPA, 2002) withspecific limits for Zn sources made from hazardous materials. Tables 9a and 9b show the
Downloaded By: [Pontificia Universidad Católica de Chile] At: 23:21 22 June 2009
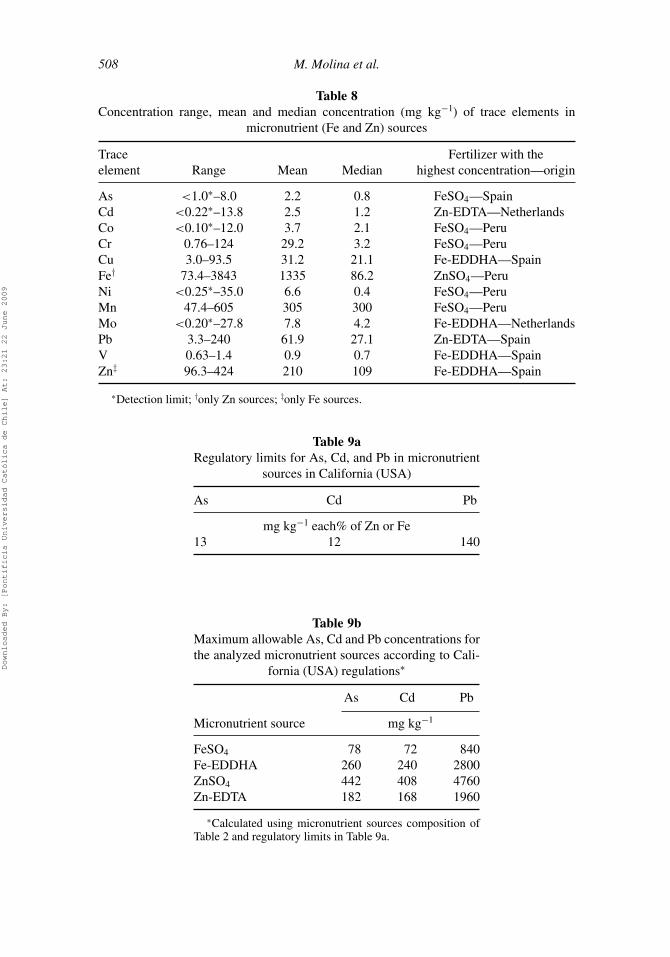
508 M. Molina et al.
Table 8Concentration range, mean and median concentration (mg kg−1) of trace elements in
micronutrient (Fe and Zn) sources
Trace Fertilizer with theelement Range Mean Median highest concentration—origin
As <1.0∗–8.0 2.2 0.8 FeSO4—SpainCd <0.22∗–13.8 2.5 1.2 Zn-EDTA—NetherlandsCo <0.10∗–12.0 3.7 2.1 FeSO4—PeruCr 0.76–124 29.2 3.2 FeSO4—PeruCu 3.0–93.5 31.2 21.1 Fe-EDDHA—SpainFe† 73.4–3843 1335 86.2 ZnSO4—PeruNi <0.25∗–35.0 6.6 0.4 FeSO4—PeruMn 47.4–605 305 300 FeSO4—PeruMo <0.20∗–27.8 7.8 4.2 Fe-EDDHA—NetherlandsPb 3.3–240 61.9 27.1 Zn-EDTA—SpainV 0.63–1.4 0.9 0.7 Fe-EDDHA—SpainZn‡ 96.3–424 210 109 Fe-EDDHA—Spain
∗Detection limit; †only Zn sources; ‡only Fe sources.
Table 9aRegulatory limits for As, Cd, and Pb in micronutrient
sources in California (USA)
As Cd Pb
mg kg−1 each% of Zn or Fe13 12 140
Table 9bMaximum allowable As, Cd and Pb concentrations forthe analyzed micronutrient sources according to Cali-
fornia (USA) regulations∗
As Cd Pb
Micronutrient source mg kg−1
FeSO4 78 72 840Fe-EDDHA 260 240 2800ZnSO4 442 408 4760Zn-EDTA 182 168 1960
∗Calculated using micronutrient sources composition ofTable 2 and regulatory limits in Table 9a.
Downloaded By: [Pontificia Universidad Católica de Chile] At: 23:21 22 June 2009
Trace Element Composition of Selected Fertilizers Used in Chile 509
accepted As, Cd, and Pb limits for micronutrient sources in California, and the acceptedconcentrations for the fertilizers evaluated in this study according to those limits. Forthese types of fertilizers the California standard is also more stringent than that proposedby the APPFCO. None of the micronutrient sources exceeded the California regulations,even in the case of the Zn-EDTA with the highest Pb concentration (240 mg kg−1). TheAPPFCO standard also sets maximum limits for Co, Mo, Ni, and Zn; however, the valuesreported in the present study were below the allowed maxima. It should be pointed outthat the application rates of micronutrient sources are several times lower than those usedfor fertilizers that supply N, P, and K; there would therefore be a lower environmental riskassociated with their use.
Conclusions
Trace element concentration in fertilizers varied widely. The concentration range dependedon the element considered, the fertilizer, and its origin. The presence of trace elements infertilizers followed the sequence: P fertilizers > micronutrient sources > K fertilizers > Nfertilizers. Among P fertilizers, TSP had the largest number of environmentally importantelements. In some of these fertilizers the Cr, V and Zn contents reached values greater than3475 mg kg−1 of P, and the Cd content (up to 288 mg kg−1 of P) was higher than thatallowed by the regulation of several countries. Except for Cd, the Fe sources showed highertrace element content compared to the Zn sources. The trace element concentration of mostanalyzed fertilizers was lower than the maximum levels set by standards proposed for Pfertilizers and micronutrient sources in different countries. However, the long-term use of Pfertilizers may increase the levels of As, Cd, and other trace elements in agricultural soils.The information obtained in this study can be used to quantify the input of trace elementsthrough P fertilization and to evaluate the long-term accumulation of these elements indifferent agro-systems in which fertilizers of similar origin are used.
Acknowledgments
This work was supported by FONDECYT (Chilean Fund for Science and Technology) underproject number 1070116 and by project DICYT-USACH 010741CS. Mauricio Molinaacknowledges PUC-MECESUP (0210) doctoral scholarship.
References
AAPFCO. 2007. Model for Fertilizers Regulation in North America. AAPFCO’s statement of uniforminterpretation and policy (SUIP#25). The heavy metal rule. Official publication N◦ 60. AmericanAssociation of Plant Food Control Officials. http://www.aapfco.org/aapfcorules.html (accessed:March 2008).
Alloway, B., and Steinnes, E. 1999. Anthropogenic additions of cadmium to soils. In: Cadmiumin Soils and Plants, pp. 97–123 (McLaughlin, M., and Singh, B., eds.). Kluwer AcademicsPublishers, Norwell, MA, USA.
Amaral Sobrinho, N., Costa, L., Oliveira, C., and Velloso, A. 1992. Metais pesados em algunsfertilizantes e correctivos (Heavy metals in some fertilizers and amendments). R. Bras. Ci. Solo16, 271–276 (in Portugese).
Amrani, M., Westfall, D., and Peterson, G. 1999. Influence of water solubility of granular zincfertilizers on plant uptake and growth. J. Plant Nutr. 22(12), 1815–1827.
Banat, K., Howari, F., and Tomah, M. 2007. Chemical fractionation and heavy metal distribution inagricultural soils, north of Jordan Valley. Soil Sed. Contam. 16(1), 89–107.
Downloaded By: [Pontificia Universidad Católica de Chile] At: 23:21 22 June 2009
510 M. Molina et al.
Bonomelli, C., Bonilla, C., Valenzuela, A., and Saavedra, N. 2002. Presencia de cadmio en fertilizantesfosforados de diferente procedencia comercializados en Chile, segunda temporada (Cadmiumoccurrence in phosphorus fertilizers from different origin marketed in Chile, second season).Simiente 72(1-2), 9–16 (in Spanish).
California Code of Regulations. 2001. Title 3: Food and agriculture, Division 4: Plant industry,Chapter 1: Chemistry, Subchapter 1: Fertilizing materials, Article 1: Standards and labeling,§2302: Non-nutritive standards. http://ccr.oal.ca.gov (accessed: November 2007).
Canadian Food Inspection Agency. 1997. Trade memorandum T-4-9, Standards for metals in fertilisersand supplements. http://www.inspection.gc.ca/english/plaveg/fereng/tmemo/t-4-0e.shtml (ac-cessed: November 2007).
CDFA. 1998. Development of Risk-based Concentrations for Arsenic, Cadmium, and Lead in In-organic Commercial Fertilizers. Report to The Heavy Metal Task Force, The Foster WheelerEnvironmental Corporation. California Department of Food and Agriculture, Sacramento, CA,USA.
Chang, A., and Page, A. 2000. Trace element slowly accumulating, depleting in soils. CaliforniaAgriculture 54, 49–55.
Charter, R., Tabatabai, M., and Schafer, J. 1993. Metal contents of fertilizers marketed in Iowa.Commun. Soil Sci. Plant Anal. 24(9–10), 961–972.
Charter, R., Tabatabai, M., and Schafer, J. 1995. Arsenic, molybdenum, selenium, and tungstencontents of fertilizers and phosphate rocks. Commun. Soil Sci. Plant Anal. 26(17-18), 3051–3062.
Dach, J., and Starmans, D. 2005. Heavy metals balance in Polish and Dutch agronomy: Actual stateand previsions for the future. Agr. Ecosyst. Environ. 107(4), 309–316.
Escudey, M., Forster, J., Becerra, J., Quinteros, M., Torres, J., Arancibia, N., Galindo, G., and Chang,A. 2007. Disposal of domestic sludge and sludge ash on volcanic soils. J. Hazard. Mat. B139(3),550–555.
FAO. 2004. Use of Phosphate Rocks for Sustainable Agriculture. (Zapata, F., and Roy, R.N., eds.)FAO Fertilizer and Plant Nutrition Bulletin n◦13. Food and Agriculture Organization of theUnited Nations, Rome, Italy.
Franklin, R., Duis, L., Brown, R., and Kemp, T. 2005. Trace element content of selected fertilizersand micronutrient source materials. Commun. Soil Sci. Plant Anal. 36(11-12), 1591–1609.
Gabe, U. and Rodella, A. 1999. Trace elements in Brazilian agricultural limenstones and mineralfertilizers. Commun. Soil Sci. Plant Anal. 30(5-6), 605–620.
Giuffre, L., Ratto de Miguez, S., and Marban, L. 1997. Heavy metals input with phosphorus fertilizersused in Argentina. Sci. Tot. Environ. 204(3), 245–250.
Gray, C., McLaren, R., Roberts, A., and Condron, L. 1999. The effect of long-term phosphaticfertilizer applications on the amounts and forms of cadmium in soils under pasture in NewZealand. Nutr. Cycl. Agroecosyst. 54(3), 267–277.
He, Z., Yang, X., and Stoffella, P. 2005. Trace elements in agroecosystems and impacts on theenvironment. J. Trace Elem. Med. Biol. 19(2–3), 125–140.
IFA. 2007. Statistics, Fertilizer Consumption Statistics. International Fertilizer Industry Associa-tion, Paris, France. http://www.fertilizers.org/ifa/statistics.asp/IFAdata/dataline.asp (accessed:November 2007).
Jalali, M., and Khanlari, Z. 2008. Cadmium availability in calcareous soils of agricultural lands ofHamadan, Western Iran. Soil Sed. Contam. 17(3), 256–268.
Kabata-Pendias, A., and Pendias, H. 2001. Trace Elements in Soils and Plants, 3rd ed. CRC Press,Boca Raton, FL, USA.
Lugon-Moulin, N., Ryan, L., Dinini, P., and Rossi, L. 2006. Cadmium content of phosphorus fertilizersused for tobacco production. Agron. Sustain. Develop. 26(3), 151–156.
McBride, M., and Spiers, G. 2001. Trace element content of selected fertilizers and dairy manures asdetermined by ICP-MS. Commun. Soil Sci. Plant Anal. 32(1-2), 139–156.
McLaughlin, M., Tiller, K., Naidu, R., and Stevens, D. 1996. Review: the behaviour and environmentalimpact of contaminants in fertilizers. Aust. J. Soil Res. 34(1), 1–54.
Downloaded By: [Pontificia Universidad Católica de Chile] At: 23:21 22 June 2009
Trace Element Composition of Selected Fertilizers Used in Chile 511
Mermut, A., Jain, J., Song, L., Kerrich, R., Kozak, L., and Jana, S. 1996. Trace element concentrationof selected soils and fertilizers in Saskatchewan, Canada. J. Environ. Qual. 25(4), 845–853.
Molina, M., Escudey, M., Chen, W., and Chang, A. 2008. Arsenic and cadmium uptake by field-growncorn (Zea maiz L.): Modeling and characterization. J. Soil Sci. Plant Nutr. (Chile) 8(3), 222–223.Poster papers presented to the 5th International Symposium of Interactions of Soil Minerals withOrganic Components and Microorganisms (ISMOM)—Soil-Root-Microbe Interactions and TheImpact on the Transformations and Fate of Nutrients and Pollutants in the Ecosystem, 24–28November, Universidad de la Frontera, Pucon, Chile.
Mortvedt, J. 1996. Heavy metals contaminants in inorganic and organic fertilizers. Fert. Res. 43(1-3),55–61.
Nicholson, F., Smith, S., Alloway, B., Carlton-Smith, C., and Chambers, B. 2003. An inventoryof heavy metals inputs to agricultural soils in England and Wales. Sci. Tot. Environ. 311(1),205–219.
Nziguheba, G., and Smolders, E. 2008. Inputs of trace elements in agricultural soils via phosphorusfertilizers in European countries. Sci. Tot. Environ. 390(1), 53–57.
ODEPA. 2007. Estadısticas y Precios, Comercio Exterior, Avance por Producto Paıs. Oficina de Es-tudios y Polıticas Agrarias, Ministerio de Agricultura, Santiago, Chile. http://www.odepa.gob.cl(accessed: December 2007).
Ortega-Blu, R., and Molina-Roco, M. 2007. Comparison between sulfates and chelated compoundsas sources of zinc and iron in calcareous soils. Agrociencia 41(5), 491–502.
Otero, N., Vitoria, L., Soler, A., and Canals, A. 2005. Fertiliser characterization: major, trace and rareearth elements. Appl. Geochem. 20(8), 1473–1488.
Pierzynski, G., Sims, J., and Vance, G. 2005. Soils and Environmental Quality, 3rd ed. CRC Press,Boca Raton, FL, USA.
Raven, K., and Loeppert, R. 1997. Trace element composition of fertilizers and soil amendments.J. Environ. Qual. 26(2), 551–557.
SAG. 2005. Informe: Criterios de Calidad de Suelo Agrıcola (Criteria for quality of agricul-tural soils). Universidad de Chile y Servicio Agrıcola y Ganadero, Ministerio de Agricultura,Santiago, Chile. http://www2.sag.gob.cl /biblioteca digital / documentos/medio ambiente/cri-terios calidad suelos aguas agricolas/ inicio.htm (accessed: July 2008).
Taylor, M. 1997. Accumulation of cadmium derived from fertilizers in New Zealand soils. Sci. Tot.Environ. 208(1-2), 123–126.
USEPA. 1996. Method 3052: Microwave Assisted Acid Digestion of Siliceous and OrganicallyBased Matrices. U.S. Environmental Protection Agency, Washington, DC, USA. http://www.epa.gov/epaoswer/hazwaste/test/3 series.htm (accessed: October 2007).
USEPA. 1999. Background Report on Fertilizer Use, Contaminants and Regulations, EPA 747-R-98-003. U.S. Environmental Protection Agency, Office of Pollution Prevention and Toxics,Washington, DC, USA.
USEPA. 2002. Zinc Fertilizers Made from Recycled Hazardous Secondary Materials, Federal Reg-ister, Vol. 57, No. 142, Final rule, 40 CFR parts 261, 266, 268, and 271. U.S. EnvironmentalProtection Agency, Washington, DC, USA.
Van Balken, J. 2004. Prospective EU Cadmium Regulation for Fertilizers. International Fertil-izer Association (IFA) Technical Conference, 20–23 April, Beijing, China. http://www.eMAP.org/Presentations/index.asp (accessed: November 2007).
Wang, Q., Dong, Y., Cui, Y., and Liu, X. 2001. Instances of soil and crop heavy metal contaminationin China. Soil Sed. Contam. 10(5), 497–510.
Downloaded By: [Pontificia Universidad Católica de Chile] At: 23:21 22 June 2009