Developments in Surface Contamination and Cleaning
259
-
Upload
khangminh22 -
Category
Documents
-
view
0 -
download
0
Transcript of Developments in Surface Contamination and Cleaning


Developments in SurfaceContamination and Cleaning

This page intentionally left blank

Developments inSurface Contamination
and CleaningVolume Three
Methods for Removal of Particle Contaminants
Edited by
Rajiv Kohli and K.L. Mittal
AMSTERDAM l BOSTON l HEIDELBERG l LONDONNEW YORK l OXFORD l PARIS l SAN DIEGO
SAN FRANCISCO l SINGAPORE l SYDNEY l TOKYO
William Andrew is an imprint of Elsevier

William Andrew is an imprint of ElsevierThe Boulevard, Langford Lane, Kidlington, Oxford OX5 1GB, UK30 Corporate Drive, Suite 400, Burlington, MA 01803, USA
First edition 2011
Copyright � 2011 Elsevier Inc. All rights reserved.
Cover image (far left): Courtesy of Tav Tech Ltd., Yehud, Israel.
No part of this publication may be reproduced, stored in a retrieval system or transmittedin any form or by any means electronic, mechanical, photocopying, recording orotherwise without the prior written permission of the publisher
Permissions may be sought directly from Elsevier’s Science & Technology RightsDepartment in Oxford, UK: phone (+44) (0) 1865 843830; fax (+44) (0) 1865 853333;email: [email protected]. Alternatively you can submit your request online byvisiting the Elsevier web site at http://elsevier.com/locate/permissions, and selectingObtaining permission to use Elsevier material
NoticeNo responsibility is assumed by the publisher for any injury and/or damage to persons orproperty as a matter of products liability, negligence or otherwise, or from any use oroperation of any methods, products, instructions or ideas contained in the materialherein. Because of rapid advances in the medical sciences, in particular, independentverification of diagnoses and drug dosages should be made
British Library Cataloguing in Publication DataA catalogue record for this book is available from the British Library
Library of Congress Cataloging-in-Publication DataA catalog record for this book is available from the Library of Congress
ISBNe13: 978-1-4377-7885-4
For information on all William Andrew publicationsvisit our web site at books.elsevier.com
Printed and bound in the UK
11 12 13 14 15 10 9 8 7 6 5 4 3 2 1

Contents
Preface viiAbout the Editors xiList of Contributors xiii
Chapter 1 Supersonic Nano-Particle Beam Technique forRemoving Nano-Sized Contaminant Particlesfrom Surfaces 1Jin W. Lee
Chapter 2 Megasonic Cleaning 31R. Nagarajan, S. Awad and K.R. Gopi
Chapter 3 Laser Cleaning for Removal of Nano/Micro-ScaleParticles and Film Contamination 63M.D. Murthy Peri, Ivin Varghese and Cetin Cetinkaya
Chapter 4 Non-Aqueous Interior Surface Cleaning UsingProjectiles 123Rajiv Kohli
Chapter 5 Electrostatic Removal of Particles and itsApplications to Self-Cleaning Solar Panelsand Solar Concentrators 149M.K. Mazumder, R. Sharma, A.S. Biris, M.N. Horenstein,
J. Zhang, H. Ishihara, J.W. Stark, S. Blumenthal
and O. Sadder
Chapter 6 Alternate Semi-Aqueous Precision CleaningTechniques: Steam Cleaning and SupersonicGas/Liquid Cleaning Systems 201Rajiv Kohli
Index 239
v

This page intentionally left blank

Preface
The purpose of this book series on Developments in Surface Contamination andCleaning is to provide a continuous state-of-the-art critical look at the currentknowledge of the behavior of both film-type and particulate surface contami-nants. The first two volumes, published in 2008 and 2010, respectively, coveredvarious topics dealing with the fundamental nature of contaminants, theirmeasurement and characterization, and different techniques for their removal.The present book is the third volume in the series.
The individual contributions in the present book provide state-of-the-artreviews by subject matter experts on removal of solid contaminants fromsurfaces.
Conventional techniques of removing contaminant particles from wafersurface are not successful in removing particles smaller than 50 nm, and newtechniques based on laser ablation or cryogenic aerosols are also limited toa similar level of cleaning. In the supersonic nano-particle beam technique,described by Jin-Won Lee in his contribution, contaminant particles areremoved by one-to-one collisions with nano-sized bullet particles, andsuccessful cleaning has been demonstrated for contaminant particle sizes downto 20 nm. Small size and high velocity of the bullet particles are two key factorscontributing to the success. Bullet particles used in this technique are smallerby a factor of 10 or more than those used in existing cryogenic aerosol cleaning,and the velocity is in the supersonic regime, 3e5 times as high as that in theexisting cryogenic aerosol technique. The supersonic beam of nano-sized bulletparticles with required size and velocity can be generated in two differentways e supersonic nozzle expansion and electrospray. Technical requirementsfor removing nano-contaminants are assessed first, and then techniques forgenerating a nano-particle beam and experimental results on cleaning perfor-mance follow sequentially. A brief introduction to the supersonic particle beamtechnique based on electrospray is included.
It is well known that micrometer- and sub-micrometer-sized particulatecontaminants cause defects in microelectronic devices, resulting in yield loss andreliability degradation, and that acoustic fields can greatly enhance removal ofsuch contaminants from product and component surfaces. The chapter byRamamurty Nagarajan, Sami Awad and K.R. Gopi focuses on megasoniccleaning. Megasonic cleaning uses higher frequencies at and above 1000 kHz; itproduces controlled cavitation. An important distinction between ultrasonic andmegasonic cleaning is that the higher megasonic frequencies do not cause theviolent cavitation effects found with ultrasonic frequencies. This significantly
vii

reduces or eliminates cavitation erosion and the likelihood of surface damage tothe product being cleaned. Parts that would be damaged by ultrasonic frequenciesor cavitation effects can often be cleaned without damage in a megasonic bathusing the same solution. With ultrasonics, cavitation occurs throughout the tank,and all sides of submerged parts are cleaned.With conventionalmegasonics, onlythe side of the part that is facing the transducer(s) is cleaned.Megasonic cleaningis widely used for removing particles fromwafer surfaces, as well as from criticalcomponent surfaces in other high-technology products. If ultrasonics is the‘workhorse’ of the parts cleaning industry, megasonics performs that role inprecision cleaning. With further study and optimization, it has the potential toextend its applicability to the nano-regime and below.
M.D. Murthy Peri, Ivin Varghese and Cetin Cetinkaya discuss lasercleaning for removal of nano/micro-scale particles and film contamination intheir contribution. They describe a laser cleaning method introduced in recentyears that utilizes shockwaves generated using the supersonic expansion ofa laser-induced plasma (LIP) core. In this cleaning technique, the directinteraction of the laser beam with the substrate is avoided. The authors providea detailed description of the technique, discuss the assumptions of the theory ofblast wave/supersonic expansion, present the results of particle removalexperiments and damage effects, characterize the LIP cleaning technique, andreport recent advancements in this technique.
Contamination of the interiors of hoses, pipes, and tubes is a criticalproblem in many industries because it often leads to corrosion and servicebreakdowns, requiring extensive repairs at substantial financial and healthcosts. Particulate and hydrocarbon contamination in lines used in high-pressureliquid and gaseous oxygen systems can also be a fire hazard. Rajiv Kohlidescribes a non-aqueous projectile cleaning method to clean the internalsurfaces of tubular components that overcomes the shortcomings of traditionaltube cleaning techniques. A pneumatic launcher shoots the projectile, sizedslightly larger than the internal diameter of the tube, into the tube. As theprojectile travels through the tube, it removes the contamination deposited onthe internal tube surface and forces it out of the tube. Cleaning can beaccomplished very effectively in seconds.
In their contribution,Malay Mazumder and his co-authors have presentedthe basic principles and operation of the electrodynamic screen for removingdust particles from solar panels. By applying a three-phase high-voltagealternating-current electric field to the electrodes, the resulting electrodynamicfield repels and removes dust particles from the screens, regardless of whetherthe dust particles are initially charged or uncharged. Self-cleaning solar panelscan be manufactured incorporating electrodynamic screens that derive theirlow-power output of approximately 10 W/m2 from the solar panels. Undernormal atmospheric conditions in desert locations, only a few minutes ofcleaning will be needed per day. More frequent cleaning of the panels will beneeded during dust storms.
viii Preface

Precision steam cleaning and supersonic gas-liquid cleaning are twoalternate semi-aqueous cleaning methods for removal of solid contaminants ina wide variety of applications. Steam cleaning employs dry superheated steamto remove surface contaminants. It is a low-cost, effective method for precisioncleaning and for decontamination of microbially contaminated surfaces.Supersonic gas-liquid cleaning is based on accelerating the cleaning liquid,suspended as droplets in a gas stream, to supersonic velocities through a con-vergingediverging nozzle. The gas-liquid mixture has the kinetic energy tovery effectively remove surface contaminants. This method can also be used forsurface cleanliness verification. Both methods use very low volumes of aqueousliquids and are viable alternatives to solvent cleaning in many applications. Inhis second chapter, Rajiv Kohli discusses the principle of each cleaningtechnique and provides an overview of available equipment and operatingconsiderations, as well as some of the applications of these cleaning methods.
The contributions in this book provide a valuable source of information onthe current status and recent developments in the respective topics on surfacecontamination and cleaning. The book will be of value to government,academic, and industry personnel involved in research and development,manufacturing, process and quality control, and procurement specifications inmicroelectronics, aerospace, optics, xerography, joining (adhesive bonding),and other industries.
We would like to express our heartfelt thanks to all the authors in this bookfor their contributions, enthusiasm, and cooperation. Our sincere appreciationgoes to Matthew Deans, our publisher, who has strongly supported publicationof this book and the future volumes in this series. The editorial staff at Elsevierhas been instrumental in seeing the book through to publication. Rajiv Kohliwould also like to thank Jody Mantell for her tireless efforts in locating obscureand difficult-to-access reference materials.
The web companion site can be found at http://www.elsevierdirect.com/companions/9781437778854.
Rajiv Kohli,Houston, Texas
Kash L. Mittal,Hopewell Junction, New York
ixPreface

This page intentionally left blank

About the Editors
Dr. Rajiv Kohli is a leading expert with The Aerospace Corporation incontaminant particle behavior, surface cleaning, and contamination control. Atthe NASA Johnson Space Center in Houston, Texas, he provides technicalsupport for contamination control related to ground-based and manned space-flight hardware for the Space Shuttle and the International Space Station, as wellas for unmanned spacecraft. Dr. Kohli was involved in developing solvent-basedcleaning applications for use in the nuclear industry and he also developed aninnovative microabrasive system for a wide variety of precision cleaning andmicro-processing applications in the commercial industry. He is the principaleditor of the new book series ‘Developments in Surface Contamination andCleaning’; the first two volumes in the series were published in 2008 and 2010,respectively, and the present book is the third volume in the series. Previously,Dr. Kohli co-authored the book Commercial Utilization of Space: An InternationalComparison of Framework Conditions, and he has published more than 200technical papers, articles, and reports on precision cleaning, advanced mate-rials, chemical thermodynamics, environmental degradation of materials, andtechnical and economic assessment of emerging technologies. Dr. Kohli wasrecently recognized for his contributions to NASA’s Space Shuttle Return toFlight effort with the Public Service Medal, one of the agency’s highest awards.
xi

Dr. Kashmiri Lal ‘Kash’ Mittal was associated with IBM from 1972 to1994. Currently, he is teaching and consulting in the areas of surfacecontamination and cleaning and in adhesion science and technology. He is theEditor-in-Chief of the Journal of Adhesion Science and Technology and is theeditor of 100 published books, many of them dealing with surface contami-nation and cleaning. Dr. Mittal was recognized for his contributions andaccomplishments by the worldwide adhesion community which organized inhis honor on his 50th birthday the 1st International Congress on AdhesionScience and Technology in Amsterdam in 1995. The Kash Mittal Award wasinaugurated in his honor for his extensive efforts and significant contributionsin the field of colloid and interface chemistry. Among his numerous awards,Dr. Mittal was awarded the title of doctor honoris causa by the Maria Curie-Sklodowska University in Lublin, Poland, in 2003. More recently, he washonored in Boston by the international adhesion community on the occasion ofpublication of his 100th edited book.
xii About the Editors

Contributors
S.B. Awad, Crest Ultrasonics Corporation, P.O. Box 7266, Trenton, NJ 08628, USA
A.S. Biris, Department of Applied Physics, University of Arkansas at Little Rock,Little Rock, AR 72204, USA
S. Blumenthal, Department of Electrical and Computer Engineering, BostonUniversity, 8 St. Mary’s Street, Boston, MA 02215, USA
C. Cetinkaya, Department of Mechanical and Aeronautical Engineering, Center forAdvanced Materials Processing, Wallace H. Coulter School of Engineering,Clarkson University, Potsdam, NY 13699-5725, USA
K.R. Gopi, Advanced Ceramic Technologies, Plot 121, Jalan Perusahaan, BukitTengah Industrial Park, 14000 Bukit Mertajam, Penang, Malaysia
M.N. Horenstein, Department of Electrical and Computer Engineering, PhotonicsBldg. Room 527, Boston University, 8 St. Mary’s Street, Boston, MA 02215, USA
H. Ishihara, Department of Applied Physics, University of Arkansas at Little Rock,Little Rock, AR 72204, USA
R. Kohli, The Aerospace Corporation, 2525 Bay Area Boulevard, Suite 600, Houston,TX 77058-1556, USA
J.W. Lee, Department of Mechanical Engineering, Pohang University of Science andTechnology (POSTECH), Hyoja 31, Pohang, Kyungbuk, 790-784, South Korea
M.K. Mazumder, Department of Electrical and Computer Engineering, PhotonicsBldg. Room 532, Boston University, 8 St. Mary’s Street, Boston, MA 02215, USA
R. Nagarajan, Department of Chemical Engineering, IIT Madras, Chennai 600036,India
M.D. Murthy Peri, Surface Conditioning Division, FSI International Inc., 3455 LymanBlvd, Chaska, MN 55318, USA
O. Sadder, Department of Electrical and Computer Engineering, Boston University, 8St. Mary’s Street, Boston, MA 02215, USA
R. Sharma, Renewable Energy Technology Program, Arkansas State University,Jonesboro, AR 72467, USA
J.W. Stark, Department of Electrical and Computer Engineering, Boston University, 8St. Mary’s Street, Boston, MA 02215, USA
I. Varghese, Eco-Snow Systems, Rave N.P., Inc., 4935A Southfront Road, Livermore,CA 94551, USA
J. Zhang, Department of Applied Physics, University of Arkansas at Little Rock, LittleRock, AR 72204, USA
xiii

This page intentionally left blank
Chapter 1
Supersonic Nano-ParticleBeam Technique for RemovingNano-Sized ContaminantParticles from Surfaces
Jin W. LeeDepartment of Mechanical Engineering, Pohang University of Science and Technology
(POSTECH), Pohang, South Korea
Chapter Outline1. Introduction 1
2. Theoretical Background 3
3. Supersonic Nozzle Beam
Technique
11
4. Electrospray Technique 24
5. Summary 27
References 28
1. INTRODUCTION
Particulate contamination seriously affects the manufacturing yield ofmicrometer- and sub-micrometer-scale devices. Semiconductor device featuresare expected to decrease continuously, reaching 25 nm by 2015 for the dynamicrandom access memory (DRAM)/flash memory devices, and as a result thecritical defect size is expected to decrease to 20 nm by 2011 and 12.5 nm by2015 [1]. Various nanotechnology-based devices with feature dimensions in thenanometer size range will also be marketed in time, which may accelerate thesize level for contamination control to decrease.
Although the theoretical adhesion force for the contaminant particles in thenanometer range is linearly proportional to the particle size, the fluid-dynamicdrag force is proportional to the second power of particle size, so the use of dragforce for cleaning becomes less efficient as the contaminant size is decreased.When it is recalled that the boundary layer thickness for typical wet processes isin the micrometer range, the removal performance of wet cleaning processes
Developments in Surface Contamination and Cleaning.
Copyright � 2011 Elsevier Inc. All rights reserved. 1

will get worse for nano-size contaminants. It is generally agreed that conven-tional techniques work poorly for sub-micrometer particles [2,3], and otherdisadvantages with wet chemistry cleaning become more apparent at smallerscales [4,5]. State-of-the-art cleaning technology based on conventional tech-niques is limited to removing particles larger than 50 nm [6e9].
One promising technique applicable in the sub-micrometer or nano-sizerange is the so-called cryogenic aerosol technique, where the contaminatedsurface is bombarded by fine particles of volatile material moving at a highvelocity. It is easily inferred that contaminant particles adhered on a surface canbe removed when the transferred energy from the bullet particles is sufficient toovercome the adhesion energy between the contaminant and the substrate. CO2
snow cleaning has long been used for cleaning large particles from opticaldevices or mechanical components [10], and was proved recently to be effec-tive for cleaning particles down to the 30 nm size range [11]. McDermott et al.[12] showed experimentally that contaminant particles of 0.1e30 mm diametercould be removed efficiently using the cryogenic argon aerosols, and a numberof studies reported the applicability of argon aerosol technique to nano-particlecleaning [11]. Argon, nitrogen and carbon dioxide are the most commoncleaning agents used, and each offers advantages and disadvantages over theothers.
Aerosol cleaning is a promising alternative to the classical cleaningmethods. This technique has matured in industry for large particles in themicrometer range, but not very well yet for nanometer particles. In this tech-nique a condensable gas or gas mixture is pre-cooled close to liquid nitrogentemperature and then expanded through a simple nozzle like a cylindrical hole.During cooling, part of the gas becomes liquid, which gets atomized into finedroplets and then solidifies while expanding through a nozzle. Typical aerosolparticle size is in the range of 0.5e50 mm and the velocity is about 100 m/s.State-of-the-art cleaning size remains around 30 nm [11], but cleaning effi-ciency drops very rapidly for contaminant particles smaller than 50 nm[13e15]. In another research study, Ar/N2 snow could remove particles down to90 nm, but efficiency dropped rapidly below 100 nm [17,18].
Up to now it has been generally accepted that the kinetic energy ormomentum of the aerosol particles is the key factor in determining the removalof contaminant particles. Yi et al. [19] showed by molecular dynamics (MD)simulation that removal efficiency for nano-sized contaminant particles wasdependent on the velocity of the bullet particles closer towV3, much more thanV2, and concluded that even for the same kinetic energy condition smalleraerosol particles moving at a higher velocity should give better removalperformance. It was also shown that if the bullet particle was too largecompared to the target contaminant by a factor of 10 or more, the fragmentedatoms/molecules of the bullet particle after collision may even surround thecontaminant particle, preventing it from leaving the surface. This implies thatthere may exist a maximum allowable size of the bullet particle for removing
2 Developments in Surface Contamination and Cleaning
contaminants in the nanometer range. When the bullet particle is excessivelylarge in size, only a negligibly small fraction of its total kinetic energy istransferred to the contaminant particle and the rest is transferred to the substrateor the patterns nearby, causing undesirable damages. The use of smaller bulletparticles moving at higher velocities is expected to have extra advantages incleaning narrow trenches and in reducing the damage potential. The ratio ofdamage on the substrate or patterns to cleaning efficiency is expected tobecome smaller if cleaning is done with smaller aerosol particles moving ata higher velocity.
Besides the unique cleaning performance for nano-contaminants which isnearly impossible with other techniques, the nano-particle beam technique hasa number of practical advantages over other techniques.
1. It is a gas phase process and is also a perfectly dry process; so fewer chem-icals are consumed and no post-processing is needed.
2. The basic mechanism is similar to that of wafer deposition or etching, so itcan be incorporated into the wafer processing process with ease.
3. The system is compatible with in situ vacuum wafer processing; thus, thereis no need to expose the wafer to the atmosphere between processing andcleaning.
4. Since it is vacuum- and fabrication-compatible, in situ monitoring ormeasurement is possible with SEM and other relevant techniques.
5. The cleaning head contains no moving parts.6. It cleans by a one-to-one collision, so cleaning is very fast.
There are shortcomings too. The biggest concern with the supersonic particlebeam technique is the potential damage to the patterns, but the use of the nano-particle beam reduces the damage potential drastically. Another disadvantageresults from the fact that it is a line-of-sight process, so shielded parts cannot becleaned at all. A multiple-path processing operation is needed.
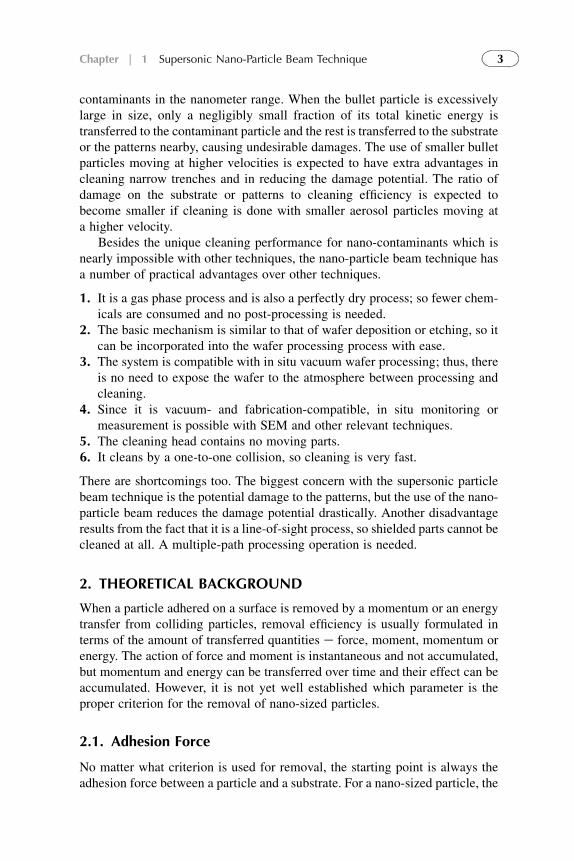
2. THEORETICAL BACKGROUND
When a particle adhered on a surface is removed by a momentum or an energytransfer from colliding particles, removal efficiency is usually formulated interms of the amount of transferred quantities e force, moment, momentum orenergy. The action of force and moment is instantaneous and not accumulated,but momentum and energy can be transferred over time and their effect can beaccumulated. However, it is not yet well established which parameter is theproper criterion for the removal of nano-sized particles.
2.1. Adhesion Force
No matter what criterion is used for removal, the starting point is always theadhesion force between a particle and a substrate. For a nano-sized particle, the
3Chapter | 1 Supersonic Nano-Particle Beam Technique

short-range van der Waals (VdW) force is the dominant one in the absence ofelectrostatic interaction or surface tension. There are three different interac-tions between molecules comprising the particle and the substrate: Keesominteraction between two permanent dipoles; Debye interaction betweena permanent and an induced dipole; and London interaction between twoinduced dipoles. All three interactions are inversely proportional to the sixthpower of the separation distance [20].
A simple formula for the VdW force for two spherical particles of diameterd1 and d2 can be written as eq. (1.1), which reduces to eq. (1.2) for a particle ofdiameter d on an infinite flat surface.
Fs ¼�
A
12z2
��d1 � d2
ðd1 þ d2Þ�
(1.1)
Fs ¼ Ad
12z2(1.2)
Here A is the Hamaker constant which is a material property proportional to theproduct of the molecular number densities of the materials involved, and z is theminimum contact distance between particle and substrate, which is usuallyassumed to be 0.4 nm.
The VdW force changes linearly with particle diameter, and for the case ofA w 8.0 eV (¼1.28 � 10e18 J) which is typical of ceramic materials, theadhesion force becomes Fs (N)w 1.6� 10e7� d (mm). This equation does notconsider the many-body force or the retarding force, so it is strictly valid forlarge separation >5 nm, but it is widely used for adhered particles as a firstapproximation.
The actual adhesion force can be very different from these simple equationsdue to asperity effects and deformation. Every surface has a surface roughness,and the contact force decreases as the number and height of asperities increase.Usually any height less than 0.5 nm is considered as molecularly smooth. Theadhesion force always generates deformation on particles and surfaces,resulting in an increased contact area and contact force. After a long residencetime the contact force can increase up to 100-fold for polymers and 20-fold formetals and oxides.
2.2. Force for Removal
The adhesion force always acts normal to the surface. If a particle is pullednormal to a surface, the force required to detach the particle from the surfaceshould be greater than the adhesion force. In most cleaning processes, however,particles are not removed by pulling against a surface, and the force on theparticle is predominantly parallel to the surface. The force required to makethe particle move, leaving the adhered spot by sliding or rolling, is much smaller,1/10e1/100, than the adhesion force due to the rolling and asperity effect.
4 Developments in Surface Contamination and Cleaning

Though there is no reliable theory for the removal force yet, a simpleexpression for it is usually written in the following way. If the interaction forcebetween the bullet particle and the target particle is constant during the inter-action period, the average removal force acting on the target particle can bewritten as the change of momentum of the bullet particle divided by theinteraction time. Deceleration of the bullet particle is then constant, and theinteraction time can be written as dtw db/v. Now the impact force generated bya collision can be written as follows.
Fb ¼ dðmbvÞdt
wmbv
2
dbwdbv
2wðdbvÞ2 (1.3)
Equation (1.3) predicts that the removal force becomes higher for the smallerparticle size if kinetic energy or momentum is the same. If particle size andvelocity are controlled independently, removal will be determined by therelative dominance between the magnitudes of Fs and Fb given in eqs. (1.2) and(1.3), respectively. If particle size and velocity are coupled, as in the electro-spray technique, another equation relating size and velocity has to be incor-porated. The above equations will hold well with reasonable accuracy for bulletand target particles of similar size. If two particles are of very different size,however, the interaction time cannot be simplified as described above, and theinteraction force will not be constant during the interaction period. In any case,there does not exist a reliable theory for the removal force, particularly fornano-particles.
2.3. Fundamental Mechanism of Nano-Particle Removal
2.3.1. MD Simulation
It is almost impossible to visualize the detailed process of nano-particleremoval by experimental means, but characteristics of particle collision andremoval in the nanometer scale can be well simulated by the MD technique. Yiet al. [19] successfully simulated the collision of a soft/volatile/fragile nano-sized particle with a rigid surface or a hard particle on a surface, elucidating theeffects of various factors on the particle removal characteristics. A standardMD algorithm was used, where the bullet particle, the contaminant particle andthe substrate were modeled by clusters of molecules interacting via pair-wisepotentials. An argon particle which is usually used as the bullet particle wassimulated with the basic Lennard-Jones (LJ) potential, and the contaminantparticle was simulated as an LJ particle with variable density (r) and bindingenergy (3).
One example result is shown in Figure 1.1 for an LJ solid particle with3 ¼ 10.0, which is slightly softer than an Al or a Cu particle, shot by an argonbullet particle at an angle of q ¼ 45�. The left figures show the states beforecollision. When Vx ¼ Vz ¼ V0 ¼ 2.0(3/m)1/2 (316 m/s) with total kinetic energy
5Chapter | 1 Supersonic Nano-Particle Beam Technique

of 1.38 � 10e19 J as in Figure 1.1a, the argon particle is partially disintegrated,but the contaminant particle just slides and rolls in the þx direction, withoutleaving the surface. When the particle velocity is increased by 50% with totalkinetic energy of 3.10 � 10e19 J as in Figure 1.1b, the argon particle iscompletely disintegrated, and the contaminant particle becomes detached fromthe surface after collision. It is clearly shown that a higher kinetic energy of thebullet particle is more effective for removal.
2.3.2. Fundamental Factor for Removal
A fundamental question from the viewpoint of the particle beam technique iswhether the determining factor for particle removal is kinetic energy,momentum or force. An MD simulation with different combinations of massand velocity at the same kinetic energy condition could answer the question[19], where the kinetic energy was twice as high as in Figure 1.1a but withdifferent mass and velocity combinations: (a) 2m and V0; (b) m and O2V0;(c) m/2 and 2V0 (Fig. 1.2). At the high-mass and low-velocity condition as inFigure 1.2a, bullet particle disintegration is not complete, and the contaminantparticle moves with sliding and rolling but stops after some distance. At theintermediate mass and velocity condition as in Figure 1.2b, bullet particledisintegration is almost complete, and the contaminant particle becomesdetached after moving some distance with sliding and rolling. Part of themolecules comprising the contaminant particle gets disintegrated from the
FIGURE 1.1 Snapshots from MD simulation of the collision between a bullet particle (dark
blob) and a contaminant particle (light blob) at three different times for two different bullet
velocities: (a) Vx ¼ Vz ¼ 2.0(3/m)1/2 (316 m/s); (b) Vx ¼ Vz ¼ 3.0(3/m)1/2 (474 m/s)
6 Developments in Surface Contamination and Cleaning

main body of the detached particle during the collision process. At the low-mass and high-velocity condition as in Figure 1.2c, bullet particle disintegra-tion is complete, and the contaminant particle gets detached from the surfacewith a high velocity soon after collision. Of the three cases of Figure 1.2, case(a) has twice as high and case (b) O2 times as high a momentum as case(c). The simulation results lead us to conclude that momentum (wmv) cannotbe an indicator for particle removal, and neither is kinetic energy (wmv2)a proper indicator. Particle removal seems to be determined by a newparameter with a much stronger dependence on velocity than mass. It alsofollows that an increased velocity is more effective for particle removal thanan increased mass.
FIGURE 1.2 Snapshots from MD simulation of the collision between a bullet particle (dark
blob) and a contaminant particle (light blob) at three different times, when the bullet kinetic energy
is twice as high as in Figure 1.1 but at three different combinations of mass and velocity: (a) 2m
and V0; (b) m and O2V0; (c) m/2 and 2V0
7Chapter | 1 Supersonic Nano-Particle Beam Technique

The behavior of the contaminant particle after collision can be classifiedinto three modes: (1) the particle just oscillates about a fixed point but does notmove at all; (2) the particle keeps moving with rolling and sliding but does notdetach from the surface; and (3) the particle gets detached. The post-collisionbehaviors observed at various velocities and shooting angles from MD simu-lation show that a higher velocity gives a better removal and shooting anglesbetween 15� and 45� give optimum performance.
2.3.3. Kinetic Energy vs. Binding Energy
Volatile bullet particles disintegrate when colliding on the substrate or with thecontaminant particle, and some extra energy can be released from the brokenbonds in addition to the center-of-mass kinetic energy. MD simulation on therelative dominance on removal performance between the kinetic energy due tocenter-of-mass velocity and the internal energy due to binding of the bulletmolecules shows that the kinetic energy is the determining factor. When thevelocity of the bullet particle is high enough, the contaminant particle can beremoved by the burst (binding energy) alone, but using the burst effect alone isnot an efficient way for particle removal [19].
Another important finding from the simulation is that the kinetic energy ofthe bullet particle causing particle removal is almost ten times as high as theadhesion energy of the target LJ particle. It has long been believed that particleremoval becomes effective once the kinetic energy of the bullet particle ishigher than the adhesion energy [12], but the MD results show that almost ten-fold higher kinetic energy is required for particle removal. This seemingdiscrepancy between the bullet particle energy and adhesion energy can beattributed to various reasons. First of all, in MD simulations removal is definedas the apparent detachment after some time, but in real situations anothermechanism, such as the thermophoresis or the carrier gas flow, can induce oraccelerate particle motion. Contaminant particles can then leave the surfaceeven when impacted by a bullet particle of much lower kinetic energy than isrequired for detachment in the absence of any other force than collision.Another factor, which seems more fundamental and critical, is that because ofbullet particle fragmentation on collision, the kinetic energy of the bulletparticle is only partially transferred to the target particle.
The effect of bullet particle fragmentation on energy transfer to the targetcontaminant could be simulated using a hard bullet particle which does notfragment on collision. Figure 1.3a shows the time variation of the kineticenergy of the bullet and target particle during a short period after collision.When the argon particle is completely fragmented after collision, energytransfer to the contaminant particle is not efficient (black solid lines). On theother hand, when the argon particle does not fragment, more of the kineticenergy is transferred to the contaminant particle (dotted lines). Figure 1.3bshows the velocity change of the contaminant particle. The x-directional
8 Developments in Surface Contamination and Cleaning

velocity abruptly increases after collision, implying that the contaminantparticle begins to move, reaches a peak velocity after about 60s, and then slowsdown. The z-directional velocity begins to change after some time lag, whichmeans that the initial motion is a sort of slip along the surface. When the bulletparticle does not fragment, the z-directional velocity of the contaminant particleis negative immediately after collision, but restores to zero with time. Thisimplies that the target particle gets compressed upon collision and recovers
FIGURE 1.3 Time variation of kinetic energy of bullet and contaminant particles (a) and the
center of mass velocity of the contaminant particle before and after collision (b); q ¼ 45�, Vx ¼ 3.0
(474 m/s) and Vz ¼ e3.0. 1s ¼ 2.15 ps. ‘CP’ refers to contaminant particle, and in (a) the solid
black line is for a fragile bullet and the dotted line is for an artificial hard bullet
9Chapter | 1 Supersonic Nano-Particle Beam Technique
later. The interaction time (acceleration of the contaminant particle anddeceleration of the bullet particle) is much longer for the fragile bullet particle,about 10 ps, and the maximum x-directional velocity of the contaminantparticle impacted by a hard bullet particle is about 25% higher than that witha fragile bullet particle.
2.3.4. Other Considerations
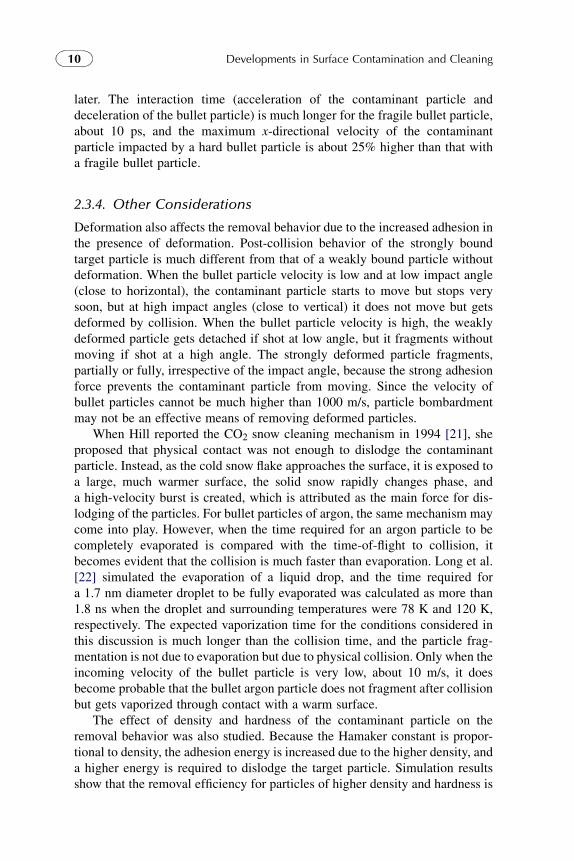
Deformation also affects the removal behavior due to the increased adhesion inthe presence of deformation. Post-collision behavior of the strongly boundtarget particle is much different from that of a weakly bound particle withoutdeformation. When the bullet particle velocity is low and at low impact angle(close to horizontal), the contaminant particle starts to move but stops verysoon, but at high impact angles (close to vertical) it does not move but getsdeformed by collision. When the bullet particle velocity is high, the weaklydeformed particle gets detached if shot at low angle, but it fragments withoutmoving if shot at a high angle. The strongly deformed particle fragments,partially or fully, irrespective of the impact angle, because the strong adhesionforce prevents the contaminant particle from moving. Since the velocity ofbullet particles cannot be much higher than 1000 m/s, particle bombardmentmay not be an effective means of removing deformed particles.
When Hill reported the CO2 snow cleaning mechanism in 1994 [21], sheproposed that physical contact was not enough to dislodge the contaminantparticle. Instead, as the cold snow flake approaches the surface, it is exposed toa large, much warmer surface, the solid snow rapidly changes phase, anda high-velocity burst is created, which is attributed as the main force for dis-lodging of the particles. For bullet particles of argon, the same mechanism maycome into play. However, when the time required for an argon particle to becompletely evaporated is compared with the time-of-flight to collision, itbecomes evident that the collision is much faster than evaporation. Long et al.[22] simulated the evaporation of a liquid drop, and the time required fora 1.7 nm diameter droplet to be fully evaporated was calculated as more than1.8 ns when the droplet and surrounding temperatures were 78 K and 120 K,respectively. The expected vaporization time for the conditions considered inthis discussion is much longer than the collision time, and the particle frag-mentation is not due to evaporation but due to physical collision. Only when theincoming velocity of the bullet particle is very low, about 10 m/s, it doesbecome probable that the bullet argon particle does not fragment after collisionbut gets vaporized through contact with a warm surface.
The effect of density and hardness of the contaminant particle on theremoval behavior was also studied. Because the Hamaker constant is propor-tional to density, the adhesion energy is increased due to the higher density, anda higher energy is required to dislodge the target particle. Simulation resultsshow that the removal efficiency for particles of higher density and hardness is
10 Developments in Surface Contamination and Cleaning

generally lower, particularly for the conditions of low velocities and smallcollision angles. At an intermediate collision angle of 45� the removalperformance stays almost the same, and at higher angles of 60� and 75� removalis even enhanced at high velocities. This removal enhancement at high collisionangles and velocities can be attributed to the elastic repercussion of the elastictarget particle against the hard substrate. And from a practical viewpoint it canbe safely assumed that the removal characteristics are dominated by the par-ticleesubstrate adhesion energy, not by the intra-particle binding energy.
2.4. Consideration of the Bullet Particle Size Effect
Though particle movement is the starting point in the whole removal process,removal is completed only when the particle acquires a sufficiently highvelocity to take off from the surface. As can be inferred from Figure 1.1,fragments of the bullet particle may pile up around the departing contaminantparticle, preventing it from gaining a high enough velocity. A smaller-sizebullet particle is advantageous in this sense. A small bullet particle ensuresa short interaction time and, thus, a high interaction force. Also, if the colliding(bullet) particle is fragile, not all the kinetic energy of the bullet particle butonly the kinetic energy of the bullet molecules close to the location of contactbetween the bullet and contaminant particle will act on the contaminantparticle, and the rest will be transferred to the fragmented and/or evaporatedbullet molecules or substrate. The larger the bullet particle the smaller thefraction of the total kinetic energy of the bullet that will be transferred to thecontaminant particle. It thus follows that small bullet particles are favored forremoval if only the total kinetic energy is high enough.
3. SUPERSONIC NOZZLE BEAM TECHNIQUE
In order to prevent the potential blocking of the moving contaminant by thefragments of bullet particles, bullet size needs to be reduced and velocityincreased instead. In the current cryogenic aerosol technique, bullet particles aregenerated by atomization, and the final size of bullet particles is in themicrometer range and the velocityw100 m/s. For a contaminant size of 10 nm,a 1 mm size bullet is too large. The bullet size needs to be reduced below 100 nm,and velocity increased to higher than 500 m/s. Atomization cannot generateparticles with these properties effectively, and new techniques have to be sought.One way of generating extremely tiny particles is the electrospray technique,where an electrostatic repulsive force is used to disintegrate a liquid intoextremely tiny droplets. This technique will be briefly introduced in the nextsection. Another process working in the opposite direction of size enlargementis the homogeneous nucleation and growth during supersonic expansion througha Laval nozzle. In this technique particle size and velocity can be controlled bythe nozzle contour, gas composition, and stagnation pressure and temperature.
11Chapter | 1 Supersonic Nano-Particle Beam Technique

3.1. Homogeneous Nucleation and Growth
One efficient way of generating a high-velocity beam of particles with sizesbelow 100 nm and high number density is homogeneous nucleation and growthduring a supersonic expansion. Particle generation by supersonic expansion hasbeen investigated experimentally and numerically for several decades, usinga pure gas or a mixture of a condensable gas and an inert carrier gas such ashelium [23e29]. In general, particles or droplets generated by homogeneousnucleation and growth are very small in size, usually less than 10 nm. Particlesize can be increased if higher pressure and lower temperature are used, butthere appears to be a practical limit due to the pressure ceiling imposed by thesaturation pressure and the temperature range required for nucleation in thesupersonic section to avoid clogging of the nozzle throat.
3.1.1. General Features of Homogeneous Nucleation and Growth
In heterogeneous condensation occurring on a foreign surface, condensationstarts and continues indefinitely so long as the vapor pressure remains higherthan or equal to the saturation pressure at the surface temperature. On theother hand, in homogeneous nucleation where condensation nuclei are formedamid a gas environment, a much higher gas/vapor pressure is required than thesaturation pressure in order to generate condensed nuclei that can remainstable in the gas environment and even grow in size. The super-saturation ratio(S), the ratio of the vapor pressure to the saturation pressure, required forstable nucleation varies depending on the cooling speed. In supersonicexpansion through a micro nozzle, the cooling rate can be as high as 106 K/sand S may reach values as high as 100 (Fig. 1.4).
When the expansion path of a gas crosses the saturated vapor line ona PeT diagram, the gas becomes supersaturated. Though various sizes of
FIGURE 1.4 Saturation curves
(lines) and nucleation onset points
(symbols) for argon (dark dots)
and nitrogen (light dots). Vertical
lines are the solidification lines,
and the curved lines are the subli-
mation and vaporization lines
12 Developments in Surface Contamination and Cleaning

nuclei are formed when S is greater than 1, only those nuclei larger than theso-called critical size (r*) can grow stably. The super-saturation ratiorequired for a sufficiently high nuclei formation rate is called the criticalsuper-saturation ratio, S*, but the criterion for S* is rather arbitrary. One wayof defining S* is to use the point of departure from the isentropic expansionpath, which results from the latent heat released by the nuclei and condensedmolecules. The turning point is usually called the nucleation onset point(Fig. 1.5a). Beyond this point, the nuclei keep growing in size along the flowpath as long as S > 1.0 (Fig. 1.5c). Particle size can be increased if higherpressure and lower temperature are used, but there still appears to bea practical limit due to the pressure ceiling of the saturation pressure and thetemperature range required for nucleation only in the supersonic section toavoid clogging of the nozzle throat. As will be shown later, the typicalparticle size that can be reached by homogeneous nucleation and growth witha nozzle of a few cm length is limited to 30 nm diameter for Ar and 50 nm forN2 at 3000 Torr and 120 K.
The simplest model for the homogeneous nucleation is that of Volmer andWeber [30], where the critical size (r*) and the nucleation rate (J) are modeledby the following equations, and J is calculated for each constituent gas speciesseparately when a gas mixture is considered. Here An is the Avogadro’s number,and DGðr�Þ the Gibbs energy change for forming a critical nucleus.
r� ¼ 2s
rl RT ln S(1.4)
DGðr�Þ ¼ 16ps3
3ðRT ln SÞ2 (1.5)
Jðr�Þclassical ¼�
P
RT
�2 1
rl
ffiffiffiffiffiffiffiffiffiffiffiffiffiffiffiffiffiffiffiffiffiffiffiffiffiffiffiffiffiffiffiffiffiffiffiffiffiffiffiffiffiffiffiffi2sA3
n
pM3wt
exp
��DGðr�ÞkT
�s(1.6)
Particles or droplets, once nucleated, continue to grow due to impingement bythe surrounding gas molecules. The growth process can be modeled in variousways, and the model of Hill [31] is one of the simplest, where the netcondensation rate is determined by a balance between collisional condensationand spontaneous evaporation due to the higher particle temperature resultingfrom the latent heat release.
dr
dt¼ x
rc
�Pffiffiffiffiffiffiffiffiffiffiffiffi2pRT
p � PDffiffiffiffiffiffiffiffiffiffiffiffiffiffiffi2pRTD
p�
(1.7)
P and T are for the impinging gas phase, PD is the saturation pressure at theequilibrium particle temperature TD, and rc is the condensate density. x iscalled the mass accommodation coefficient, introduced to correct for thediscrepancy between the model prediction and experimental results, and is very
13Chapter | 1 Supersonic Nano-Particle Beam Technique

T [K]
P[b
ar]
40 60 80 100
0
1
2
3(a)
(b)
X [cm]
Nu
cleatio
n rate [cm
-3 sec
-1]
0.2 0.4 0.6 0.8 1
0.0E+00
5.0E+18
1.0E+19
1.5E+19
2.0E+19
N2
X [cm]
Pa
rtic
le
D
ia
me
te
r [n
m]
0 0.2 0.4 0.6 0.8 1
0
20
40
60
80
100(c)
Saturation line, Solid-Liquid
Saturation line, Vapor-Solid and Vapor-Liquid
Critical onset points
Expansion path
FIGURE 1.5 Particle generation by pure nitrogen expansion starting at P0, N2 ¼ 3000 Torr and
T0 ¼ 110 K: (a) the expansion path plotted on the PeT diagram; (b) distribution of nucleation rate;
(c) the growth paths of the nuclei generated at corresponding axial locations of (b)
14 Developments in Surface Contamination and Cleaning

close to 1.0 for most cases [31]. When there is more than one condensablespecies in the gas phase, particle growth is the sum of condensational growthsby each condensable species. Microscopic details of condensational growth canbe found in Yi and Lee [32].
3.1.2. Example of Generating N2 Particles by Nucleationand Growth
When pure N2 gas is expanded through a nozzle starting from P0 ¼ 3000 Torrand T0 ¼ 110 K, the characteristics of nucleation and growth are as shown inFigure 1.5. Nucleation starts when the expansion path arrives at the onset line(Fig. 1.5a), but terminates within 4 ms of nucleation inception (Fig. 1.5b). Alsothe nucleation rate is extremely high, in the range of 1025/m3/s. Nucleigenerated at various locations along the nozzle will grow in size toward thenozzle exit (Fig. 1.5c). The growth rate is high just after nucleation or withinthe nucleating zone, but is quite low after nucleation is terminated or down-stream of the nucleating zone. The high growth rate in the nucleating zoneresults from condensation on the nuclei, whose number or surface areaincreases explosively within the nucleating zone (Fig. 1.5b). The total numberdensity of particles at the exit is about 5 � 1018/m3.
Continued condensation past the nucleation zone makes the particle sizeincrease steadily, but at a much lower rate. Particle size continues to grow aslong as supersonic expansion is maintained, but most particle growth isaccomplished within a short distance from the nucleation zone, and the meanparticle size at the exit is about 50 nm. Due to the extremely high nucleationrate and rapid growth, particle size distribution is very narrow, with a geometricstandard deviation of about 1.27. The maximum particle size obtainable byhomogeneous nucleation and growth at 3000 Torr and 120 K is 30 nm for Arand 50 nm for N2 [33].
3.2. Bullet Particle Generation
Experimental results for removing 20-nm particles with nano-particle beamgenerated with a supersonic nozzle are well summarized by Lee et al. [34,35].The cleaning facility consists of a nozzle for particle generation, an extra nozzlefor purge gas, a wafer motion stage and various monitors (Fig. 1.6). The wholesystem is contained in a vacuum chamber with an ultimate chamber pressurebelow 1 Torr.
In order to generate bullet particles a condensable gas, such as Ar, N2, CO2
or a mixture of these gases, is pre-cooled close to the triple point of thecondensable gas, and then expanded through a supersonic Laval nozzle ina vacuum environment. During supersonic expansion through the nozzle, smallcondensation nuclei are formed and grow in size, where the final size can becontrolled by the stagnation pressure and temperature, back pressure of thevacuum chamber, and the nozzle contour. Velocity of the particle beam is
15Chapter | 1 Supersonic Nano-Particle Beam Technique

controlled by the nozzle contour, gas composition and stagnation temperature.When a smaller particle size at a higher population or velocity is required,a mixture of the condensable gas and a light carrier gas such as He is used.When the partial pressure of the condensable species is higher than the satu-ration pressure, part of the condensable gas will change to liquid, and particlesare formed by atomization. On the other hand, when the condensable partialpressure is lower than the saturation pressure nuclei will be formed throughhomogeneous nucleation. When a larger particle is needed, the starting pressureis increased or a longer nozzle is used.
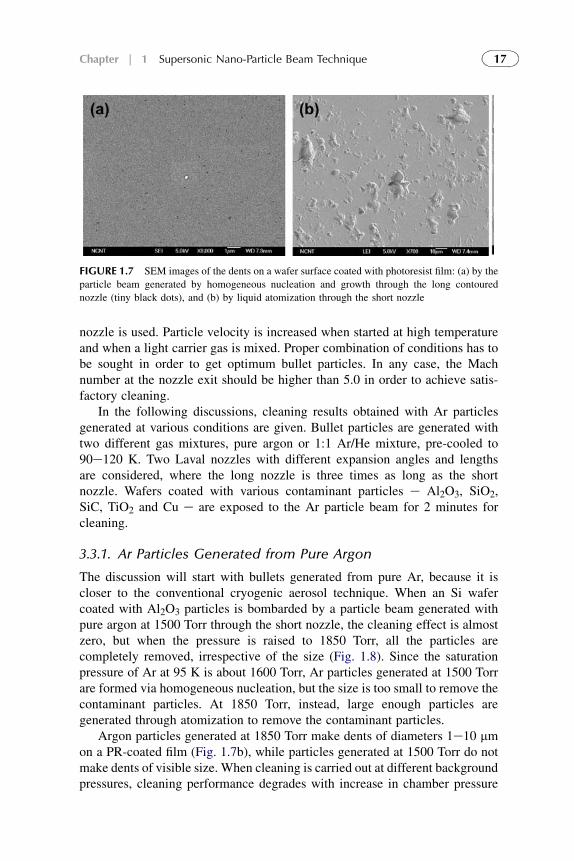
In order to estimate the size of the bullet particles, a wafer coated witha photoresist (PR) film was exposed to the particle beam for 3 seconds and thenscanning electron microscope (SEM) images were taken. When Ar particleswere generated by liquid atomization at a pressure of 4000 Torr, higher than thesaturation pressure as in the conventional cryogenic particle cleaning, dents of1e10 mm diameter were formed (Fig. 1.7b). On the other hand, when Arparticles were generated by homogeneous nucleation at a pressure of 3000 Torr,lower than the saturation pressure, dents of much smaller diameter of 50e80nm were formed (Fig. 1.7a). It is clearly shown that bullet particles generatedby gas-phase nucleation are smaller by a factor of 10e20 than those generatedby liquid breakup and the particles also have a narrower size distribution.
3.3. Cleaning 20 nm Particles with Argon Bullets
Particle size and velocity can be varied by varying the nozzle contour, gascomposition, carrier gas, and starting pressure and temperature. Particle size isincreased when started at high pressure and low temperature and when a long
FIGURE 1.6 Schematic of the setup for the supersonic nozzle for aerosol cleaning
16 Developments in Surface Contamination and Cleaning
nozzle is used. Particle velocity is increased when started at high temperatureand when a light carrier gas is mixed. Proper combination of conditions has tobe sought in order to get optimum bullet particles. In any case, the Machnumber at the nozzle exit should be higher than 5.0 in order to achieve satis-factory cleaning.
In the following discussions, cleaning results obtained with Ar particlesgenerated at various conditions are given. Bullet particles are generated withtwo different gas mixtures, pure argon or 1:1 Ar/He mixture, pre-cooled to90e120 K. Two Laval nozzles with different expansion angles and lengthsare considered, where the long nozzle is three times as long as the shortnozzle. Wafers coated with various contaminant particles e Al2O3, SiO2,SiC, TiO2 and Cu e are exposed to the Ar particle beam for 2 minutes forcleaning.
3.3.1. Ar Particles Generated from Pure Argon
The discussion will start with bullets generated from pure Ar, because it iscloser to the conventional cryogenic aerosol technique. When an Si wafercoated with Al2O3 particles is bombarded by a particle beam generated withpure argon at 1500 Torr through the short nozzle, the cleaning effect is almostzero, but when the pressure is raised to 1850 Torr, all the particles arecompletely removed, irrespective of the size (Fig. 1.8). Since the saturationpressure of Ar at 95 K is about 1600 Torr, Ar particles generated at 1500 Torrare formed via homogeneous nucleation, but the size is too small to remove thecontaminant particles. At 1850 Torr, instead, large enough particles aregenerated through atomization to remove the contaminant particles.
Argon particles generated at 1850 Torr make dents of diameters 1e10 mmon a PR-coated film (Fig. 1.7b), while particles generated at 1500 Torr do notmake dents of visible size. When cleaning is carried out at different backgroundpressures, cleaning performance degrades with increase in chamber pressure
FIGURE 1.7 SEM images of the dents on a wafer surface coated with photoresist film: (a) by the
particle beam generated by homogeneous nucleation and growth through the long contoured
nozzle (tiny black dots), and (b) by liquid atomization through the short nozzle
17Chapter | 1 Supersonic Nano-Particle Beam Technique

(Fig. 1.9). From this observation, it can be concluded that the much improvedremoval performance of the Ar particles formed by atomization in a Lavalnozzle can be attributed to the effect of increased supersonic velocity incontrast to subsonic velocity in conventional aerosol techniques. Insufficientexpansion or acceleration at high chamber pressure conditions lowers thevelocity of the generated particles.
Cleaning characteristics for other ceramic particles such as SiO2, TiO2
(Fig. 1.10) and SiC are almost the same as for Al2O3. Particles deposited ina trench with 1 mm width and 1 mm depth are seen to be completely removedexcept in the shadow area (Fig. 1.11). Particles left in the shadow area can beremoved easily by a second cleaning by injecting the beam in the oppositedirection.
3.3.2. Argon Particles Generated from Ar/He Mixture
The increase in flow velocity by use of a light carrier gas should result inimproved removal, but at the same time results in reduced time for particlegrowth, which is the flow time through the nozzle. Thus, the advantage ofusing a carrier gas can be assured only when the reduced growth time can becompensated for by using a longer nozzle. Argon particles are generated with1:1 Ar/He mixture through two different nozzles e the short nozzle and thelong nozzle e starting from the same conditions of 3000 Torr and 95 K, andshot at a flat Si wafer coated with 20 nm Al2O3 particles. When the short
FIGURE 1.8 SEM images before (left) and after (right) cleaning. Al2O3 particles on Si surface
and argon stagnation pressure of 1500 Torr (top) and 1850 Torr (bottom)
18 Developments in Surface Contamination and Cleaning

nozzle is used, contaminant particles are not removed at all (Fig. 1.12), butwhen the long nozzle is used, the surface is perfectly cleaned, irrespective ofthe size of the contaminants (Fig. 1.13). Since the saturation pressure ofargon at 95 K is about 1600 Torr, the pressure cannot be increased anyfurther in order to generate bullet particles by means of homogeneousnucleation. It is certain that bullet particles are formed through gas-phasenucleation and growth, and the velocity of the particle beam is higher than300 m/s if the chamber pressure is controlled low enough to ensure a truesupersonic expansion inside and downstream of the nozzle to the wafersurface.
It is successfully demonstrated in Figure 1.13 that argon bullet particlesgenerated by homogeneous nucleation through a Laval nozzle can removecontaminants on a flat Si surface down to 20 nm. The only difference betweenFigures 1.12 and 1.13 lies in a different nozzle length or expansion angle.Roughly speaking, the size of the bullet particles from the long nozzle is threetimes as large as those from the short nozzle, because the rate of growth inparticle diameter is almost linearly proportional to growth time or residencetime, and absolute flow speed does not change sensitively to Mach number at
FIGURE 1.9 Cleaning of TiO2 particles on Si surface with argon particles generated at 1850 Torr
and 95 K at four different chamber pressures: (a) 150 Torr, (b) 100 Torr, (c) 50 Torr, and
(d) 10 Torr. Image before cleaning is similar to the left figure of Figure 1.10
19Chapter | 1 Supersonic Nano-Particle Beam Technique

FIGURE 1.10 SEM images for TiO2 particles on Si surface before cleaning (left) and after cleaning with argon particles generated at 1500 Torr (middle) and
1850 Torr (right)
20
Develo
pmen
tsin
Surface
Contam
inatio
nan
dClean
ing

FIGURE 1.11 SEM images before (left) and after (right) cleaning of Al2O3 particles in a 1� 1 mm
trench using argon particles generated at 1850 Torr
FIGURE 1.12 SEM image (a) before and (b) after cleaning with the short nozzle. Al2O3 particles
on Si surface and 1:1 Ar/He mixture at 3000 Torr and 95 K
FIGURE 1.13 SEM image (a) before and (b) after cleaning with the long nozzle. Al2O3 particles
on Si surface and 1:1 Ar/He mixture at 3000 Torr and 95 K
21Chapter | 1 Supersonic Nano-Particle Beam Technique
high Mach number conditions [31]. Since a factor of 3 in diameter is equivalentto a factor of 27 in mass, the insufficient cleaning with the short nozzle can beattributed to insufficient kinetic energy of the bullet particles generated with theshort nozzle.
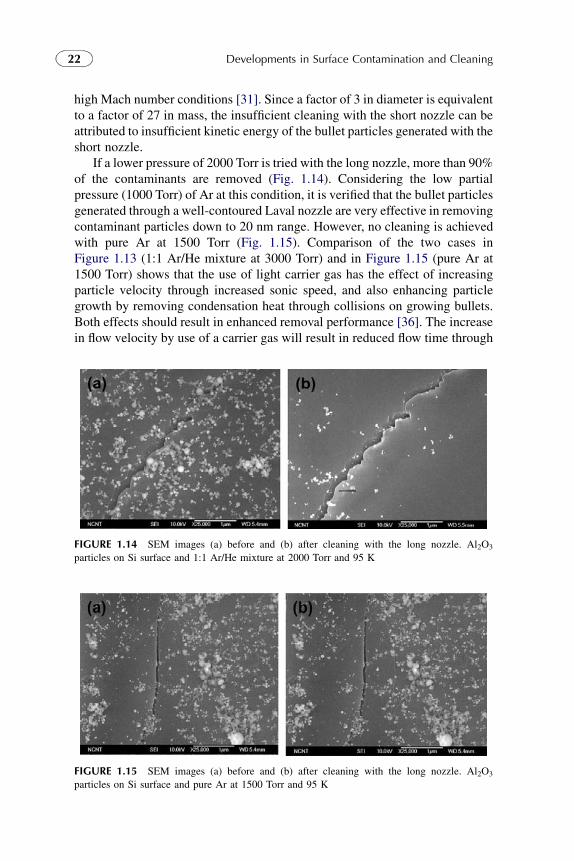
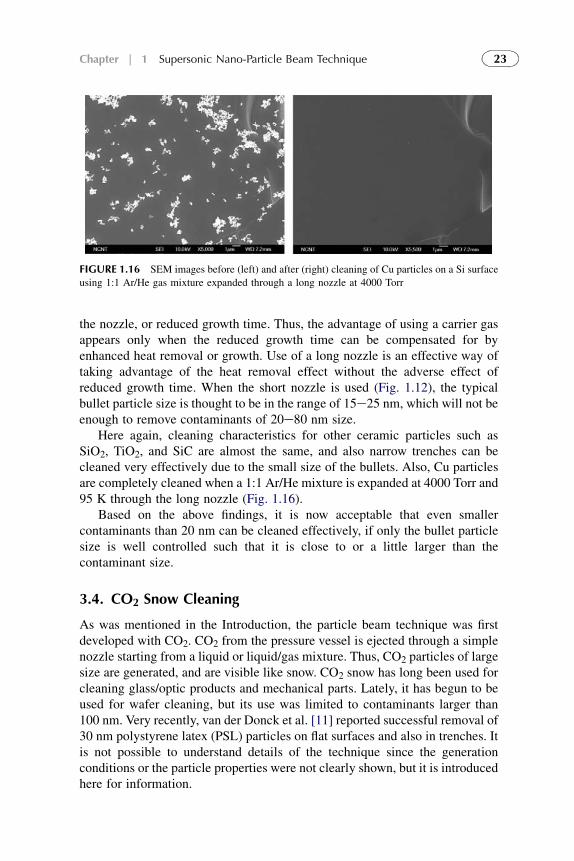
If a lower pressure of 2000 Torr is tried with the long nozzle, more than 90%of the contaminants are removed (Fig. 1.14). Considering the low partialpressure (1000 Torr) of Ar at this condition, it is verified that the bullet particlesgenerated through a well-contoured Laval nozzle are very effective in removingcontaminant particles down to 20 nm range. However, no cleaning is achievedwith pure Ar at 1500 Torr (Fig. 1.15). Comparison of the two cases inFigure 1.13 (1:1 Ar/He mixture at 3000 Torr) and in Figure 1.15 (pure Ar at1500 Torr) shows that the use of light carrier gas has the effect of increasingparticle velocity through increased sonic speed, and also enhancing particlegrowth by removing condensation heat through collisions on growing bullets.Both effects should result in enhanced removal performance [36]. The increasein flow velocity by use of a carrier gas will result in reduced flow time through
FIGURE 1.14 SEM images (a) before and (b) after cleaning with the long nozzle. Al2O3
particles on Si surface and 1:1 Ar/He mixture at 2000 Torr and 95 K
FIGURE 1.15 SEM images (a) before and (b) after cleaning with the long nozzle. Al2O3
particles on Si surface and pure Ar at 1500 Torr and 95 K
22 Developments in Surface Contamination and Cleaning
the nozzle, or reduced growth time. Thus, the advantage of using a carrier gasappears only when the reduced growth time can be compensated for byenhanced heat removal or growth. Use of a long nozzle is an effective way oftaking advantage of the heat removal effect without the adverse effect ofreduced growth time. When the short nozzle is used (Fig. 1.12), the typicalbullet particle size is thought to be in the range of 15e25 nm, which will not beenough to remove contaminants of 20e80 nm size.
Here again, cleaning characteristics for other ceramic particles such asSiO2, TiO2, and SiC are almost the same, and also narrow trenches can becleaned very effectively due to the small size of the bullets. Also, Cu particlesare completely cleaned when a 1:1 Ar/He mixture is expanded at 4000 Torr and95 K through the long nozzle (Fig. 1.16).
Based on the above findings, it is now acceptable that even smallercontaminants than 20 nm can be cleaned effectively, if only the bullet particlesize is well controlled such that it is close to or a little larger than thecontaminant size.
3.4. CO2 Snow Cleaning
As was mentioned in the Introduction, the particle beam technique was firstdeveloped with CO2. CO2 from the pressure vessel is ejected through a simplenozzle starting from a liquid or liquid/gas mixture. Thus, CO2 particles of largesize are generated, and are visible like snow. CO2 snow has long been used forcleaning glass/optic products and mechanical parts. Lately, it has begun to beused for wafer cleaning, but its use was limited to contaminants larger than100 nm. Very recently, van der Donck et al. [11] reported successful removal of30 nm polystyrene latex (PSL) particles on flat surfaces and also in trenches. Itis not possible to understand details of the technique since the generationconditions or the particle properties were not clearly shown, but it is introducedhere for information.
FIGURE 1.16 SEM images before (left) and after (right) cleaning of Cu particles on a Si surface
using 1:1 Ar/He gas mixture expanded through a long nozzle at 4000 Torr
23Chapter | 1 Supersonic Nano-Particle Beam Technique

CO2 snow was generated by expanding CO2 gas or liquid through a vari-able orifice unit with a ball valve (Model K5-10s, Applied Surface Technol-ogies, New Providence, NJ, USA). The pressure conditions or nozzleparameters were not specified. Two different contaminants, PSL and silica,were tested on, or in, three different substrates e flat, trench, and gap betweensharp lines. The width and depth/height of the line or trench were 100/150/200/250/300 nm, and 100/250 nm, respectively. Trench/line patterns were e-beamwritten on an Si wafer in a 10 � 10 array, and etched on Si or CVD depositedon Al. PSL particles of 30 and 50 nm were spin-coated, and 30e100 nm silicaparticles were deposited by a low-pressure impactor. The nozzleesubstratedistance and the angle were varied over 20/30/40 mm and 30/60/90 degrees,respectively, and cleaning speed was 4 cm2/s with liquid CO2 and 1 cm
2/s withgas CO2.
Silica particles were almost perfectly cleaned even in a trench, and evenwhen cleaned 7 months after deposition. For cleaning 50 nm PSL particles ina trench or on a line with liquid CO2, the cleaning efficiency was 60% fora trench (250 nm depth) and 70e80% between lines (100 nm height). The anglewas very important, with the efficiency at 60� angle (vertical) being just one-third of that at a 30� angle (75%). For PSL particles on a flat surface, removalefficiency varied a lot depending on the distance and whether the startingmedium was liquid or gas. With liquid, 100% removal of 30 nm PSL wasobserved at the smallest distance (20 mm), but the best performance with gaswas 96% for 30 nm PSL at 30 mm distance. It was not explained why thesmaller distance of 20 mm was not tried.
Damage to the patterns is a serious concern with the particle beam tech-nique. When gas was used, there was no damage at all. When liquid was used,thin lines were damaged, but the trenches were not damaged. Damage wassevere when cleaning was done sideways.
4. ELECTROSPRAY TECHNIQUE
Another method of generating tiny particles moving at a high speed is theelectrospray technique. The electrospray technique has long been developed forapplications in the field of space propulsion, coating, and particle formation.Mahoney and his colleagues have applied this technique to nano-particleremoval for over 20 years, and called it the Micro Cluster Beam Technique.Only a brief introduction is given here, and details of the technique can befound in their publications [4,37,38].
4.1. Electrospray
When a conducting liquid is fed into a metal capillary tube and positivevoltage is applied to the tube, positive ions migrate toward the open surfaceand negative ions are attracted to the tube wall. If the electrostatic stress on the
24 Developments in Surface Contamination and Cleaning

interface/surface is higher than the surface tension, the liquid meniscusformed at an opening is disrupted and tiny droplets are ejected. The elec-trostatic stress or the electric field near the nozzle tip is increased whena small-diameter nozzle and/or a high voltage are used [39,40]. Particlesgenerated in this technique are charged liquid droplets, not neutral solidparticles. Usually an electric voltage is maintained between the nozzle and thesurrounding emitter electrode, and another electric voltage is applied betweenthe emitter electrode and the wafer surface for particle acceleration. Thevelocity or kinetic energy at collision is controlled by the acceleratingvoltage.
There appear several different modes of spraying depending on the electricvoltage and liquid flow rate. At low-voltage conditions, the liquid meniscus isshaped like a single sharp tip, and spraying occurs at the tip in a single array,which is called the cone jet mode. If the voltage is increased over a certainthreshold value, spraying occurs at multiple spots along the rim of the nozzleexit, which is called the crown or rim jet mode. When a high generation rate isneeded as in particle removal, the rim jet mode is usually used. In the rim jetmode, the size of the generated droplets is non-uniform, but the mean sizeincreases with flow rate at a given electric field strength (E) and decreases withE at a given flow rate.
Electrospraying is possible in both vacuum and atmospheric conditions, buta higher maximum voltage before breakdown is needed in vacuum. Since thegenerated droplets are charged, fast removal of the charges accumulating onthe substrate is an important practical problem. Beam half angle is a function ofthe acceleration voltage, increasing with decreased voltage, and typical valuesare a few degrees at 10e20 kV. Droplets are usually much smaller than 1 mm,and the energy per cluster is O (1 MeV), which corresponds to w1 eV permolecule of the cluster. Particles are accelerated to supersonic velocity in orderto clean surface films and particles.
4.2. Particle Removal
Though this technique uses different means of generating and acceleratingbullet particles, it is similar to the supersonic nozzle technique in the removalmechanism. Removal is based on the one-to-one collision between bullet andcontaminant, so the kinetic energy of the droplets is the source of particleremoval, and size matching is important. Films are removed by a micro-shockinduced by a collision of the bullets on a substrate. Removal performance isdetermined by the kinetic energy of the colliding droplets, which is againdetermined by the accelerating voltage.
The formula for the removal force was derived by combining theoreticaland experimental equations. When the Rayleigh criterion, eq. (1.8), of themaximum charge sustainable by a liquid sphere of surface tension g anddiameter d [41] is incorporated into an experimental relationship between the
25Chapter | 1 Supersonic Nano-Particle Beam Technique

electric voltage Va and current I, eq. (1.9), formulas for the charge per particlemass (q/m), particle diameter (d), and velocity (v) can be obtained as eqs.(1.10)e(1.12). The final result for the impact force, eq. (1.13), shows that theremoval force is proportional to d1/2, varying much more slowly with particlesize than for the supersonic nozzle technique.
qwg1=2 � d3=2 (1.8)
IwV2a (1.9)
q
mwg1=2 � d�3=2 (1.10)
dwg1=3 ��Q
I
�2=3
wg1=3
V4=3a
wV�4=3a (1.11)
v ¼h2
�q
m
�Va
i1=2wV3=2
a (1.12)
Fb ¼ dðmvÞdt
wmv2
dwg1=2d1=2VawV1=3
a (1.13)
For a glycerol solution with surface tension g ¼ 0.005 N/m, these equationspredict particle size, velocity and generation rate as 40e135 nm, 0.63e2.73km/s and 0.1e3.7 � 1010/s for voltage variations in the range 5e15 kV. Highvoltage gives small size, high velocity and large number of particles. Theimpact force is estimated as 1.5e2.5 (10e5 N/particle). In case the cluster andthe contaminant are of the same size, the removal force calculated by eq.(1.13) is 1e2 orders of magnitude larger than the adhesion force forcontaminant sizes of 10 nme1.0 mm, with the relative factor larger for thesmaller contaminant sizes.
4.3. Typical System Configuration and Performance
In order to control conductivity of the liquid solution, ammonium acetatewas added to the following solutions to 1.0 M concentration: 50/50 H2O/N-methyl-2-pyrrolidone (NMP), conductive glycerol solution, pure gly-cerol, H2O/methanol and H2O/isopropyl alcohol. Typical system configu-ration and operating conditions used by Mahoney et al. [4,37,38] were asfollows.
l Chamber pressure: 10e3e10e5 Torrl Fused silica glass capillary: inner diameter (ID) 50 mm, outer diameter (OD)
375 mml Liquid flow rate: 0.5e2 mL/minl Emitteretarget distance: 125 mml Voltage and current: 15 kV, 0.5 mAl Cleaning time: 5 minutes.
26 Developments in Surface Contamination and Cleaning

The cleaning performance obtained with the above-mentioned conditions was(1) particles in the size range of 50 nme5 mm were completely removed, butparticles larger than 5 mm remained on the surface and could not be removed[38]; (2) 1 mm PSL particles were removed even in a crevice; and (3) oneemitter can clean 20 cm2 in 2 minutes.
This technique has several advantages for removing nano-contaminants.
l Easy and gentle velocity controll Extremely low liquid consumption rate, on the order of wmL/waferl Wide area coverage using a linear array of nozzles and scanningl Reduced impact damagel Low power consumptionl No consumption of expensive or hazardous liquids.
Potential cleaning application areas are wide ranging, such as wafer backsidecleaning, flat panel displays, photo lithography masks, post chemicalmechanical planarization (CMP) cleaning, disk drives, microelectromechanicalsystems (MEMS) devices, optical gyroscopes, and space optics.
5. SUMMARY
The new aerosol cleaning technique based on nano-sized particles/droplets,instead of micrometer-sized particles/droplets used in the conventional aerosolcleaning techniques, can overcome the 50 nm particle size barrier and removecontaminant particles of ceramics, polymers, and metallic copper down to20 nm with nearly 100% efficiency. Key to the successful cleaning of nano-sized contaminant particles is the combination of smaller bullet size anda higher velocity. Bullet particles satisfying these requirements can be gener-ated in two different ways e supersonic expansion and electrospray. In thesupersonic expansion technique, solid bullet particles are generated byhomogeneous nucleation and growth, where particle size and velocity arecontrolled by the gas composition, nozzle contour, and stagnation conditions epressure and temperature. In the electrospray technique, liquid droplets aregenerated by electrostatic atomization, where droplet size and velocity arecontrolled by the solution composition and the accelerating voltage. Bothtechniques have advantages and disadvantages relative to each other, but nano-sized bullets impacting at supersonic speed common to both techniques.Smaller size and higher velocity of the bullet particles than in the conventionalaerosol techniques reduces the damage potential, in addition to achievingimproved cleaning performance.
ACKNOWLEDGMENT
This work was supported by the Korea Science and Engineering Foundation (KOSEF) grants
funded by the Korea government (MOST) (No. ROA-2008-000-20045-0).
27Chapter | 1 Supersonic Nano-Particle Beam Technique

REFERENCES
[1] SEMATECH, International Technology Roadmap for Semiconductors (2007).
[2] D.S. Rimai, D.J. Quesnel, Fundamentals of Particle Adhesion, Global Press, Srbija. Presently
available through The Adhesion Society, Blacksburg, VA, USA, 2001.
[3] W. Zapka, W. Ziemlich, A.C. Tam, Efficient Pulsed Laser Removal of 0.2 mm Sized Particles
from a Solid Surface, Appl. Phys. Lett. 58 (1991) 2217.
[4] J.F. Mahoney, P. Julius, S. Carl, J.C. Andersen, Removal of Particulate and Film
Contaminants by Impacting Surfaces with Microcluster Beams, in: K.L. Mittal (Ed.),
Particles on Surfaces 5&6: Detection, Adhesion and Removal, VSP, Utrecht, The
Netherlands, 1999, pp. 311e325.
[5] Y. Momonoi, K. Yokogawa, M. Izawa, Dry Cleaning Technique for Particle Removal
Based on Gas-Flow and Down-Flow Plasma, J. Vacuum Sci. Technol. B 22 (2004) 268.
[6] K. Bakhtari, R.O. Guldiken, P. Makaram, A.A. Busnaina, J.G. Park, Experimental and
Numerical Investigation of Nanoparticle Removal Using Acoustic Streaming and the Effect
of Time, J. Electrochem. Soc. 153, G846 (2006).
[7] S.I. Kudryashov, S.D. Allen, S.D. Shukla, Experimental and Theoretical Studies of Laser
Cleaning Mechanisms for Submicrometer Particulates on Si Surfaces, Particulate Sci.
Technol. 24 (2006) 281.
[8] H.K. Lim, D.D. Jang, D.S. Kim, J.W. Lee, Correlation between Particle Removal and
Shock-wave Dynamics in the Laser Shock Cleaning Process, J. Appl. Phys. 97 (2005)
054903e1.
[9] R. Vanderwood, C. Cetinkaya, Nanoparticle Removal from Trenches and Pinholes with
Pulsed-Laser Induced Plasma and Shock Waves, J. Adhesion Sci. Technol. 17 (2003)
129.
[10] R. Sherman, Carbon Dioxide Snow Cleaning, in: K.L. Mittal (Ed.), Particles on
Surfaces 5&6: Detection, Adhesion and Removal, VSP, Utrecht, The Netherlands, 1999,
pp. 221e237.
[11] J.C.J. van der Donck, R. Schmits, R.E. van Vliet, A.G.T.M. Bastein, Removal of Sub-100-nm
Particles from Structured Substrates with CO2 Snow, in: K.L. Mittal (Ed.), Particles on
Surfaces 9: Detection, Adhesion and Removal, VSP/Brill, Leiden, The Netherlands, 2006,
pp. 291e302.
[12] W.T. McDermott, R.C. Ockovic, J.J. Wu, R.J. Miller, Removing Submicron Surface
Particles Using a Cryogenic Argon-Aerosol Technique, Microcontamination (October 1991)
33e36.
[13] J.M. Lauerhaas, J.F. Weygand, G.P. Thomes, Advanced Cryogenic Aerosol Cleaning:
Application to Damage-Free Cleaning of Sensitive Structured Wafers, Proc. IEEE/SEMI
Advanced Semiconductor Manufacturing Conference (2005) 11e16.
[14] H. Lin, K. Chioujones, J. Lauerhaas, T. Freebern, C. Yu, Damage-free Cryogenic Aerosol
Clean Processes, IEEE Trans. Semiconductor Manufacturing 20 (2007) 101.
[15] T.J. Wagener, K. Kawaguchi, Improved Yields for the Nano-Technology Era Using Cryo-
genic Aerosols, Proc. IEEE/SEMI Advanced Semiconductor Manufacturing Conference
(2004) 467e471.
[16] N. Narayanswami, J.F. Weygand, P. Reuther, K.K. Christenson, J.W. Butterbaugh, S.H. Yoo,
et al., Evaluation of Particle Removal Efficiency in Wafer Cleaning Processes, Semi-
conductor Intl (June 2000).
[17] M. Okada, S. Kwada, Y. Sonoda, Stencil Reticle Cleaning Using an Ar Aerosol Cleaning
Technique, J. Vac. Sci. Technol. B 20 (2002) 71.
28 Developments in Surface Contamination and Cleaning

[18] P.G. Clark, J.W. Butterbaugh, G.P. Thomes, J.F. Weygand, T.J. Wagner, D.S. Becker,
Compatibility of a Cryogenic Aerosol Process on SiLK@ and Porous MSQ, Proc. IEEE Intl.
Symp. on Semiconductor Manufacturing (2003) 479e482.
[19] M.Y. Yi, D.S. Kim, J.W. Lee, J. Koplik, Molecular Dynamics (MD) Simulation on the
Collision of a Nano-Sized Particle onto Another Nano-Sized Particle Adhered on a Flat
Substrate, J. Aerosol Sci. 36 (2005) 1427.
[20] H. Krupp, Particle Adhesion: Theory and Experiment, Adv. Colloid Interf. Sci. 1 (1967) 111.
[21] E.A. Hill, Carbon Dioxide Snow Examination and Experimentation, Precision Cleaning 36
(February 1994).
[22] L.N. Long, M.M. Micci, B.C. Wong, Molecular Dynamics Simulations of Droplet Evapo-
ration, Comput. Phys. Comm. 96 (1996) 167.
[23] M.R. Hoare, P. Pal, P.P. Wegener, Argon Clusters and Homogeneous Nucleation: Comparison
of Experiment and Theory, J. Colloid Interf. Sci. 75 (1980) 126.
[24] N.G. Garcia, J.M.S. Torroja, Monte Carlo Calculation of Argon Clusters in Homogeneous
Nucleation, Phys. Rev. Lett. 47 (1981) 186.
[25] G. Koppenwallner, C. Dankert, Homogeneous Condensation in Nitrogen, Argon, and Water
Vapor Free Jets, J. Phys. Chem. 91 (1987) 2482.
[26] Y. Okada, K. Sunouchi, H. Ryu, A. Patra, K. Ashimine, K. Takeuchi, Measurement of
Condensation Onset in Steady Supersonic Laval Nozzle Flow for the Molecular Laser Isotope
Separation Process, J. Nucl. Sci. Technol. 35 (1998) 158.
[27] D.W. Oxtoby, Homogeneous Nucleation: Theory and Experiment, J. Phys. Cond. Matter
4 (1992) 7627.
[28] P.P. Wegener, Nucleation of Nitrogen: Experiment and Theory, J. Phys. Chem. 91 (1987)
2479.
[29] B.J.C. Wu, P.P. Wegener, G.D. Stein, Homogeneous Nucleation of Argon Carried in Helium
in Supersonic Nozzle Flow, J. Chem. Phys. 69 (1978) 776.
[30] M. Volmer, A. Weber, Nuclei Formation in Supersaturated States, Z. Phys. Chem. 119 (1926)
277.
[31] P.G. Hill, Condensation of Water Vapor During Supersonic Expansion in Nozzles, J. Fluid
Mech. 25 (1966) 593.
[32] M.Y. Yi, J.W. Lee, Condensation and Evaporation of a Nano-sized Particle Moving in a Fluid
Environment, J. Aerosol Sci. 38 (2007) 764.
[33] H. Bae, I. Kim, E. Kim, J.W. Lee, Generation of Nano-Sized Ar-N2 Compound Particles by
Homogeneous Nucleation and Heterogeneous Growth in a Supersonic Expansion, J. Aerosol
Sci. 41 (2010) 243.
[34] J.W. Lee, K.S. Kang, K.H. Lee, M.Y. Yi, M.J. Lee, Removing 20 nm Particles Using
a Supersonic Argon Particle Beam Generated with a Contoured Laval Nozzle, J. Adhesion
Sci. Technol. 23 (2009) 769.
[35] K.S. Hwang, M.J. Lee, M.Y. Yi, J.W. Lee, Removing 20 nm Ceramic Particles Using
a Supersonic Particle Beam from a Contoured Laval Nozzle, Thin Solid Films 517 (2009) 3866.
[36] D. Kane, S.P. Fisenko, M. Rusyniak, M.S. El-Shall, The Effect of Carrier Gas Pressure on
Vapor Phase Nucleation Experiments Using a Thermal Diffusion Cloud Chamber, J. Chem.
Phys. 111 (1999) 8496.
[37] J.F. Mahoney, Microcluster-Surface Interactions: A New Method for Surface Cleaning, Int. J.
Mass Spectrom. Ion Proc. 174 (1998) 253.
[38] J. Perel, J. Mahoney, P. Kopalidis, R. Becker, Particle Removal by Collisions with Energetic
Clusters, in: K.L. Mittal (Ed.), Particles on Surfaces 8: Detection, Adhesion and Removal,
VSP, Utrecht, The Netherlands, 2003, pp. 345e352.
29Chapter | 1 Supersonic Nano-Particle Beam Technique

[39] A.T. Blades, M.G. Ikonomou, P. Kebarle, Mechanism of Electrospray Mass Spectrometry.
Electrospray as an Electrolysis Cell, Anal. Chem. 63 (1991) 2109.
[40] G.J. Van Berkel, F. Zhou, Characterization of an Electrospray Ion Source as a Controlled-
Current Electrolytic Cell, Anal. Chem. 67 (1995) 2916.
[41] Lord Rayleigh, On the Equilibrium of Liquid Conducting Masses Charged with Electricity,
Phil. Mag. 14 (1882) 184.
30 Developments in Surface Contamination and Cleaning

Chapter 2
Megasonic Cleaning
R. Nagarajan,1 S. Awad2 and K.R. Gopi31Department of Chemical Engineering, IIT Madras, Chennai, India, 2Crest Ultrasonics
Corporation, Trenton, NJ, USA, 3Advanced Ceramic Technologies, Penang, Malaysia
Chapter Outline1. Introduction 31
2. Cleaning Mechanism 34
3. Theory of Megasonic
Cleaning
41
4. Surface Cleanliness
Measurement
45
5. Megasonic System Evaluation
in the Laboratory and in
Industry
48
6. Industry Case Studies 58
7. Concluding Remarks 59
References 60
1. INTRODUCTION
Wikipedia, the online encyclopedia, defines megasonic cleaning as ‘a type ofacoustic cleaning, related to ultrasonic cleaning’. It is a gentler cleaningmechanism, less likely to cause damage, and is currently used extensively inwafer cleaning in semiconductor manufacturing. It is well known thatmicrometer and sub-mm-sized particulate contaminants cause defects inmicroelectronic devices, resulting in yield loss and reliability degradation[1e11], and that acoustic fields can greatly enhance removal of suchcontaminants from product and component surfaces. Similar to ultrasoniccleaning, megasonics utilizes a transducer, usually composed of piezoelectriccrystals to create megasonic energy (Fig. 2.1) [12]. Megasonic energy is ofa higher frequency (800e2000 kHz) than typical ultrasonic cleaners (<100kHz). As a result, the cavitation that occurs is gentler and on a much smallerscale [13].
The difference between ultrasonic cleaning [14] and megasonic cleaninglies in the frequency that is used to generate the acoustic waves. Ultrasoniccleaning uses lower frequencies; it produces random cavitation. Megasoniccleaning uses higher frequencies at and above 1000 kHz; it produces controlledcavitation. An important distinction between the two methods is that the higher
Developments in Surface Contamination and Cleaning.
Copyright � 2011 Elsevier Inc. All rights reserved. 31

megasonic frequencies do not cause the violent cavitation effects found withultrasonic frequencies. This significantly reduces or eliminates cavitationerosion and the likelihood of surface damage to the product being cleaned.Parts that would be damaged by ultrasonic frequencies or cavitation effects canoften be cleaned without damage in a megasonic bath using the same solution.With ultrasonics, cavitation occurs throughout the tank, and all sides of thesubmerged parts are cleaned. With conventional megasonics, only the side ofthe part that is facing the transducer(s) is cleaned (Fig. 2.2) [15].
Megasonic cleaning is widely used for removing particles from wafersurfaces, as well as from critical component surfaces in other high-technologyproducts, but its underlying mechanism is not clearly understood even by manyof the practitioners. Lester [16] indicates that, in general, there are two prin-cipal classes of mechanisms through which megasonic cleaners couldaccomplish cleaning: through direct action of the sound field with the particle;and through indirect action, via acoustic cavitation.
A single-wafer megasonic cleaner has been described by Wu et al. [17]where control of sound distribution is achieved by varying the operatingconditions of the transducer assembly. This cleaner is designed for integrationwith process tools in both front-end and back-end applications. Kim et al. [18]
FIGURE 2.1 Finite element simulation of propagation of megasonic waves in a tank [12]
32 Developments in Surface Contamination and Cleaning

present a comparison between the design and operation of typical ultrasonicand megasonic cleaners, sketched in Figure 2.3.
They have theoretically analyzed and experimentally characterized bothtypes of cleaners. The transmission of the ultrasonic wave is shown to beaffected not only by the geometric and material parameters of the plate, but alsoby the mass density and wave speed in the adjacent liquid of the incident waveregion and the transmitted wave region. The mass density and wave speed in theliquid are found to be dependent on the temperature and the chemicalcomposition of the solution. For megasonic cleaners, it has been shown that thetransmission of the sound power through the bottom plate of the inner containeris affected by the plate thickness and inclination as well as by the liquidtemperature, and the optimal condition for the maximum cleaning performancehas been found in terms of several relevant parameters.
Berg et al. [19] have demonstrated a ‘reciprocity principle’ in megasoniccleaning, i.e. decreasing exposure time to a megasonic field while increasingfield intensity by the same ratio results in equivalent cleaning performance.Thus, cleaning performance depends only on the ‘acoustic exposure’ (average
FIGURE 2.2 Micro-streaming in a megasonic field [15]
33Chapter | 2 Megasonic Cleaning

power times exposure time), rather than on time or power separately. Thisimplies that megasonic cleaning equipment can best be improved by providinghigher average power transducers.
2. CLEANING MECHANISM
Sonic cleaners work by two principal mechanisms:
l Cavitationl Acoustic streaming.
Cavitation is a process where the constructive interference of sonic energycauses the formation of rarified bubbles in the cleaning fluid. When thesemicroscopic bubbles implode (due to the passage of the rarefaction energy, themoving sound wave), they produce microscopic jets of liquid that can impingeon the surface of parts to be cleaned. These high-velocity jets remove particles
FIGURE 2.3 Cross-sectional diagrams of (a) ultrasonic and (b) megasonic cleaners [18]
34 Developments in Surface Contamination and Cleaning

from surfaces and convey cleaning chemicals to organic and inorganic chem-ical contamination on the surface. This mechanism has been described in detailby Awad and Nagarajan [20].
When acoustic waves constructively combine, the resulting decrease inpressure creates a localized bubble. In properly degassed solutions, this bubbleconsists almost entirely of solvent vapors. When the ultrasonic pressure wavegoes through a compression cycle, the localized pressure drops and the bubblecollapses. When this occurs, a microscopic jet of liquid is formed, jetting fromthe bubble wall into the volume of the bubble. This high-velocity jet scours thesurface of parts it comes in contact with, knocking loose material from thesurface (Figs 2.4 and 2.5).
Cavitations are generated on the order of microseconds. At the 20 kHzfrequency, it is estimated that the pressure is about 35e70 kPa and the transientlocalized temperatures are about 5273 K, with the velocity of microstreamingaround 400 km/h.
In acoustic streaming, bulk movement of fluid occurs. Contaminants that getremoved from the surface are carried away by acoustic streaming, and hence, are
FIGURE 2.4 Ultrasonic cavitations and cleaning
FIGURE 2.5 Growth and
collapse (implosion) of a cavi-
tation bubble
35Chapter | 2 Megasonic Cleaning

prevented from re-attaching to the surface. Acoustic streaming can penetratethrough the boundary layer of motionless fluid that surrounds all of the surfacesin the ultrasonic tank. Particles dislodged from the surface by cavitation actionare not swept away from the surface and may get re-attached. At highfrequencies (>200 kHz) the acoustic streaming is highly directional, and so theorientation of the part to be cleaned becomes critical. At low ultrasonicfrequencies, the acoustic streaming is randomized and not highly directional.Gouk et al. [21] have obtained sound pressure fields in cleaning tanks using a ‘rayacoustic’ model that vectorially adds rays of acoustic energy emitted isotropi-cally from a transducer, including various interference and barrier effects.Microstreaming near a wafer surface is simulated and particle removal forces areestimated, with the results being compared against laboratory measurements.
Cavitation and acoustic streaming work together in all forms of ultrasoniccleaning, but the relative contribution of each is a function of frequency. At lowultrasonic frequencies, cavitation is very strong and dominates the cleaningprocess. At high ultrasonic frequencies, characteristic of megasonic cleaning,cavitation bubbles are very small, but acoustic streaming velocities can be veryhigh. Thus at high frequencies, acoustic streaming dominates the cleaningprocess and less of the cleaning occurs due to cavitation. Figure 2.6 showsa plot of cavitation strength versus frequency. We note that the cavitationstrength decreases rapidly with increasing frequency. Also, cavitation abun-dance (bubble density) with frequency is pictured in Figure 2.7. (Note thedecrease in bubble size with increase in bubble density.)
High-intensity ultrasonic waves create fine bubbles in the liquid medium,which grow to maximum sizes proportional to the applied ultrasonic frequency
FIGURE 2.6 Cavitation strength as a function of frequency
36 Developments in Surface Contamination and Cleaning

and then implode, releasing their energies. The higher the frequency, thesmaller is the cavitation bubble size. Thus, in the megasonic regime, cavitationintensity is relatively weak, but the number density of bubbles is large, and thebubble size is very small.
Minsier and Proost [22] point out that cavitation effects can still besignificant in the megasonic range. Their calculations for different gas equa-tions of state inside the bubble show that the van der Waals law predictsa slightly higher liquid velocity at the shock-front than when consideringa perfect gas law. Also, decreasing the value of the interfacial tension at thebubbleeliquid interface results in an increase in the liquid velocity at the shockfront. Their calculations indicate that the strength of the shock waves emittedupon spherical bubble collapse can cause delamination of typical devicestructures used in microelectronics.
The boundary layer effect is very significant in case of surface cleaning.During this process, the cleaning solution rushes past the substrate beingcleaned, forcing chemicals onto contaminant particles, removing them from thesurface, and carrying them away. On a microscopic scale, the fluid friction atthe surface causes a very thin layer of solution to move more slowly than thebulk solution. This layer of slow-moving fluid at the substrate surface is calledthe boundary layer (Fig. 2.8). The boundary layer effectively shields thesubstrate surface from fresh chemistry and shields contaminants from theremoval forces of the bulk fluid. As frequency increases, the momentum-transfer boundary layer thickness decreases as square of the frequency. Hence,in the megasonic regime, even sub-mm particles are exposed to the cleaningfluid and chemistry.
FIGURE 2.7 Cavitation abundance varies with frequency
37Chapter | 2 Megasonic Cleaning

The thickness of the boundary layer surrounding the parts is a function ofthe ultrasonic frequency in the tank. The higher the ultrasonic frequency, thethinner is the boundary layer. This is illustrated in Figure 2.9, where theboundary layer thickness is plotted as a function of frequency.
The boundary layer, next to the substrate surface where the sound does notpenetrate, is essentially motionless. At 40 kHz, it is fairly thick at 2.8 mmwheresmaller particles can be trapped. As frequency increases, the boundary layer isreduced, permitting the fluid to get closer to the surface and, therefore, thecontaminants. For example, at 400 kHz, the boundary layer is reduced to0.98 mm. In the >1 MHz range, the boundary layer is thin enough to expose
FIGURE 2.8 Change in boundary layer thickness (relative to contaminant size) from ultrasonic
to megasonic regime
FIGURE 2.9 The relationship between frequency and boundary layer thickness for room
temperature water (theoretical simulation)
38 Developments in Surface Contamination and Cleaning

even nanometer-sized particles to shear forces. Bakhtari et al. [23] have pre-sented the effect of acoustic frequency and amplitude (represented as intensity)on streaming velocity in Figure 2.10.
They have also developed a model for particle removal based on ratio ofremoval moment to adhesion-resisting moment (MR) (Fig. 2.11), and com-pared their theoretical prediction with experimental data (Fig. 2.12).
FIGURE 2.10 Effect of acoustic field parameters on streaming velocity [23]
FIGURE 2.11 Moment ratio model for particle removal from a surface. MR is the removal
moment; MA is the adhesion resisting moment; Fdrag is the drag force; FAdhesion is the adhesion
force; Felec double layer is the electric double layer force; R is the particle radius; a is the contact
radius between the deformed particle and the surface [23]
39Chapter | 2 Megasonic Cleaning

At very high frequencies approaching 1 MHz, cavitation becomes asecondary phenomenon compared to ‘acoustic streaming’, which is the time-independent fluid motion generated by a sound field [24]. The associatedstreamlines are shown in Figure 2.13.
Principally, this flow is categorized into two main types [24e28]: (1)streaming caused due to spatial attenuation of the wave in free space; and (2)
FIGURE 2.12 Experimental and theoretical particle removal efficiencies. Si-cap refers to a 4 nm
silicon capping layer on the wafer [23]
FIGURE 2.13 Fluid motion generated by a sound field [24]
40 Developments in Surface Contamination and Cleaning

streaming caused by friction between the vibrating medium and the solid wall.The second mechanism is further classified as inner streaming that is inducedwithin the acoustic boundary layer, and outer streamingwhich is the steady vortexflow developed outside the acoustic boundary layer. In particle removal,streaming activity close to a surface plays the key role. The so-called Schlichtingstreaming occurs in a viscous boundary layer in a sound field [29]. This streamingproduces vortices of a scale much smaller than the acoustic wave length. Velocitygradients are large, and transport is enhanced due to this streaming.
3. THEORY OF MEGASONIC CLEANING
Deymier et al. [30] have characterized the forces of adhesion and removal asa function of size for spherical particles on a silicon wafer surface (Fig. 2.14).The adhesion forces represented as dotted lines in the figure are for threedifferent separation distances between the particle and the silicon surface,namely 5, 7, and 10 A. The dashed-dotted line stands for the removal force inthe case of the silicon/water system for an excited Rayleigh wave. The dashedline refers to the water/silicon/water system and excitation of a bulk wave. Theyfound that the component of the streaming force parallel to the solidefluidinterface can lead to particle removal by a rolling and tugging mechanism.They have shown that subjecting a silicon wafer to a grazing incident acousticwave, as is traditionally done in megasonic cleaning tanks, may not lead to anoptimum cleaning efficiency. Normal and parallel components of the streaming
FIGURE 2.14 Removal and adhesion forces on a spherical particle [25]
41Chapter | 2 Megasonic Cleaning

force are strongly dependent on the incidence angle of the incoming wave.Their results suggest that cleaning efficiency may be improved by subjectinga wafer to incident acoustic waves sampling a wide range of incidence angles,between e45� and 45�.
Kim et al. [31] have proposed that particles near radially oscillating bubblescan be detached from a solid surface by two mechanisms. The liquidegasinterface is passed through by a particle located within the oscillation rangeduring the bubble’s radial motion. Then the torque due to Laplace pressure isexerted on the particle. On the other hand, particles located outside the rangeswept by the meniscus are affected by the short-range dynamic pressure gradient.In summary, the movies obtained through their work reveal that megasoniccleaning is achieved by local fluid motion induced by oscillating bubbles close toresonant size. The estimation of the exerted torque by the two proposed mech-anisms provides a possible explanation. Globally generated acoustic pressuregradient and acoustic streaming have only minor direct effects on particleremoval. However, they may play secondary roles in cleaning. For the cleaning ofan entirewafer, multiple bubbles shouldmove around so that their paths can coverthe entire surface. This bubble movement is primarily caused by the Bjerknesforce [32], which is the result of the acoustic pressure gradient. Furthermore, theparticles lifted off the solid surface must be driven away to prevent reattachment,which could be made possible by acoustic streaming. They also note that themechanism of megasonic cleaning is different from that of surface cleaning bymillimeter-sized bubbles which can be generated by laser irradiation, and whichcollapse to generate a high-speed liquid jet onto a solid surface.
The general theory of ultrasonic cleaning has been presented in detail byAwad and Nagarajan [20]. It may be reasonably inferred that bubble collapsepressure, PC, directly affects the extent of surface impact by cavitation forces,and thereby influences any induced erosive effects. The instantaneous clusterwall velocity at the time of cluster collapse, SC (m/s), is calculated by Kanthaleet al. [33] as:
SC ¼ ½PC=ðrbð1� bÞÞ�1=2 (2.1)
where r is the density of the medium, and b is the void fraction in the cluster. Astated limitation of this model is that ‘acoustic streaming’ e i.e. mediumstreaming induced by pressure gradient along the ultrasonic beam e has beenneglected (in order to simplify the model by neglecting frictional forcesbetween the liquid and cavity cluster). This aspect needs to be dealt with ingeneralizing the model for megasonic cleaning.
3.1. Contribution of Acoustic Streaming to ParticleRemoval from Immersed Surfaces
Acoustic waves that propagate in liquids observe the general laws of hydro-dynamics. Nyborg [24] solved the Navier-Stokes equation for a Newtonian
42 Developments in Surface Contamination and Cleaning

liquid using second-order approximations. Markham [25] showed thatstreaming was due to sound absorption and relaxation processes. In principle,constant streaming occurs in all acoustic radiation fields, and increases until theintensity is reduced by beam divergence and/or attenuation in the medium [28].Tjotta [26] introduced a simple formula in which the streaming velocity, SAc,was proportional to the absorption coefficient a, the beam width 2a, and theacoustic intensity I, and was inversely proportional to the viscosity of themedium h, and the sound velocity in the medium c:
SAc ¼ 8aIa2=ðhcÞ (2.2)
The absorption coefficient, a, varies as the square of the frequency, f,according to the following expression:
a¼ 2hf 2=ð3rc3Þ (2.3)
Combining eqs (2.2) and (2.3) eliminates the dependence of acousticstreaming velocity on fluid viscosity:
SAc ¼ 16Ia2f 2=ð3rc4Þ (2.4)
This acoustic streaming velocity is a significant contributor to the shearingforce that acts to dislodge particles from exposed surfaces; the total shearingvelocity that the particle experiences may be written as the sum of thecontributions to particle shear from cavitational cluster collapse and acousticstreaming [34]:
S ¼ SC þ SAc (2.5)
The corresponding total acoustically induced tangential particle removalshear, stan, may then also be written as a sum of the contributions due to clustercollapse, stan,C, and due to acoustic streaming, stan,Ac:
stan ¼ ðh=x0Þ : ðSÞ (2.6)
where x0 is the thickness of the boundary layer.It is important to note that, unlike the shearing stress due to a collapsing
cavity cluster, the shear imparted by acoustic streaming is non-erosive, andonly serves to enhance particle depletion from surfaces. Therefore, the optimalcleaning stress is now augmented by the contribution of streaming shear, pereq. (2.5).
Acoustic streaming, which gains in importance as cavitation intensity isreduced, has few detrimental effects on the immersed surface. Thus, itsincorporation in the surface cleaning/erosion model does not alter the setting ofoptimum cavitation pressure, but does enhance the particle removal velocity atthe surface. Since the streaming velocity depends on the square of thefrequency, it is particularly significant in high-frequency ultrasonic fields
43Chapter | 2 Megasonic Cleaning

(�170 kHz), and even more so in the megasonic range (�1 MHz). However, itshould be borne in mind that in the case of particles that are strongly adhered tosurfaces, acoustic streaming alone cannot be relied upon to dislodge andremove the particles. Typically, a staged cleaning system e with lower-frequency ultrasonics at the front end to loosen the particles, followed byhigher-frequency ultrasonics and megasonics to flush the loosened particlesaway from the surface e would be required in order to optimize surfacecleaning.
Experimental acoustic streaming velocities of 4 m/s have been reported inwater at a frequency of 850 kHz. At such high frequencies, it can be assumedthat all the ultrasonic power is used up in generating streaming motion, i.e.absorbed by the liquid medium. Cavitation phenomena can be mostlyneglected. Assuming the power level remains constant, the streaming velocitycan be obtained at other frequencies by using the square law dependence ofstreaming velocity on frequency. The graph in Figure 2.15 illustrates thecalculated variation of streaming velocity with frequency.
During the streaming process, a linear momentum, whose magnitude ischaracterized by the frequency of sound applied, is imparted to the fluidmedium, and is the source of the shear force that dislodges particles fromimmersed surfaces. The streaming velocity at 470 kHz is calculated to beapproximately 1.22 m/s and, from bubble-collapse velocity calculations, theassociated cavitational velocity is found to be of the order of 10e4 m/s (which isrelatively very small).
Kuehn et al. [35,36] have studied particle removal from semiconductorwafers by megasonic cleaning from a fundamental perspective. They havemodeled the sound pressure field and acoustic velocity field in the tank, andcompared them to measured data, using a hydrophone and optical flow
FIGURE 2.15 Variation of streaming velocity with frequency
44 Developments in Surface Contamination and Cleaning
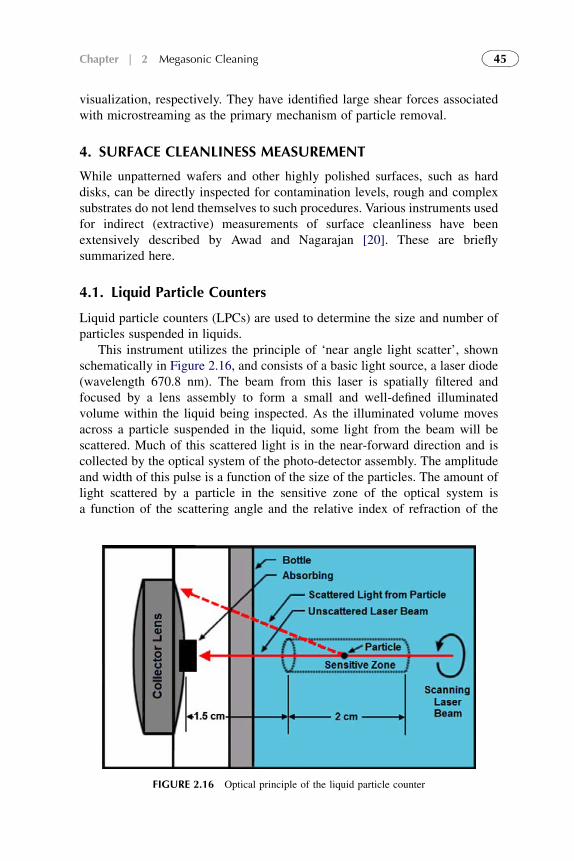
visualization, respectively. They have identified large shear forces associatedwith microstreaming as the primary mechanism of particle removal.
4. SURFACE CLEANLINESS MEASUREMENT
While unpatterned wafers and other highly polished surfaces, such as harddisks, can be directly inspected for contamination levels, rough and complexsubstrates do not lend themselves to such procedures. Various instruments usedfor indirect (extractive) measurements of surface cleanliness have beenextensively described by Awad and Nagarajan [20]. These are brieflysummarized here.
4.1. Liquid Particle Counters
Liquid particle counters (LPCs) are used to determine the size and number ofparticles suspended in liquids.
This instrument utilizes the principle of ‘near angle light scatter’, shownschematically in Figure 2.16, and consists of a basic light source, a laser diode(wavelength 670.8 nm). The beam from this laser is spatially filtered andfocused by a lens assembly to form a small and well-defined illuminatedvolume within the liquid being inspected. As the illuminated volume movesacross a particle suspended in the liquid, some light from the beam will bescattered. Much of this scattered light is in the near-forward direction and iscollected by the optical system of the photo-detector assembly. The amplitudeand width of this pulse is a function of the size of the particles. The amount oflight scattered by a particle in the sensitive zone of the optical system isa function of the scattering angle and the relative index of refraction of the
FIGURE 2.16 Optical principle of the liquid particle counter
45Chapter | 2 Megasonic Cleaning

particle. This instrument collects and averages light that has been scattered ina near-forward direction over a solid angle ranging from 4o to 19o. Variation ofcollected light is of the order of�15% in a single reading of one particle count.This instrument typically detects particles from 0.5 to 100 mm.
When particles are extracted ultrasonically from immersed componentsurfaces into a liquid medium, the LPC can be used to indirectly quantifysurface contamination levels by counting and sizing the extracted particlessuspended in the liquid. In the case of complex substrates, such as hard diskdrive components, this may be the only practical option to measure surfacecleanliness.
4.2. Precision Turbidity Meter
The American Public Health Association (APHA) defines turbidity as an‘expression of the optical property that causes light to be scattered and absorbedrather than transmitted in straight lines through the sample’. Turbidity can beinterpreted as a measure of the relative clarity of water. Turbidity is not a directmeasure of suspended particles in water; instead, it is a measure of the scat-tering effect such particles have on light. The optical property expressed asturbidity is the interaction between light and suspended particles in water. Adirected beam of light remains relatively undisturbed when transmitted throughabsolutely pure water, but even the molecules in a pure fluid will scatter light toa certain degree. Therefore, no solution will have zero turbidity.
While most earlier turbidimetric methods measured the transmitted light,turbidity measurement standards changed in the 1970s, when the nephelometricturbidimeter was developed, which determines turbidity by the light scatteredat an angle of 90� from the incident beam (Fig. 2.17). A 90� detection angle isconsidered to be the least sensitive to variations in particle size. Nephelometryis a preferred means for measuring turbidity because of the method’s
FIGURE 2.17 Schematic diagram of a nephelometer
46 Developments in Surface Contamination and Cleaning

sensitivity, precision, and applicability over a wide range of particle sizes andconcentrations. The preferred expression of turbidity is nephelometric turbidityunits (NTU). As in the case of surface cleanliness measurement using extrac-tion followed by LPC, here, too, extraction followed by turbidimetry canprovide quantification of surface particulate levels.
4.3. Microbalance
A microbalance may be used to quantify mass loss from a coupon by surfacecleaning, or by cavitation erosion. The Cahn C-34/C-35� is one such sensitiveweight and force measurement instrument. It is designed for weights and forcesup to 3.5 grams and is sensitive to changes as small as 0.1 microgram. Thebalance may be described as a force-to-current converter. The current necessaryto produce the required torque motor force is a direct measure of the force onthe beam. The process of calibration allows this current to be measured in unitsof weight (grams).
In order to measure mass loss due to ultrasonic cleaning, the materialcoupon is first cleaned with pure water and dried in the oven so that it loses allits moisture and is weighed using the Cahn Microbalance before immersing itin the beaker full of water. This beaker is then suspended at the center of thetank using a fixture to hold it. The ultrasonic generator is switched on and thepower level is adjusted. Experiments may be done to simulate even mildcavitation conditions (i.e. megasonic) and low power inputs. After a certaintime (say, 2 minutes), the generator is turned off. The specimen is then takenout and dried in the oven. When the specimen is dry, it is taken out and re-weighed using the microbalance. This step is repeated in a multiple-extractionmode.
4.4. Cavitation Meter
The ultrasonic cavitation meter (ppb-500�) is an instrument used to measurethe energy density (in watts per unit area) of cavitation in liquids (Fig. 2.18). Itis not a sound meter or hydrophone. The main difference is that it measurescavitation or the collapse of water bubbles as they implode on a surface, insteadof sound waves produced by a pressure transducer.
The ultrasonic cavitation meter is simple and easy to use, yet it containssophisticated electronics and options for data storage, retrieval, and analysis.The meter measures the instantaneous energy in a given direction. The probe isa 50-cm (20-inch) long stainless steel tube with an ethylene propylene dienemonomer (EPDM) half-sphere at one end and a cable at the other end. Theblack half-sphere is made of elastic material to isolate the filter lens mounted onit from the holding rod. The lens is a thick quartz crystal.
Cavitation generated by the sound pressure waves is produced in the form ofbubbles that grow and implode with micro-streaming water jets hitting the filter
47Chapter | 2 Megasonic Cleaning

surface. The sensor mounted behind the lens detects these impacts and thesignal is sent via cable to the electronic case.
5. MEGASONIC SYSTEM EVALUATION IN THELABORATORY AND IN INDUSTRY
Cavitation intensity as a function of acoustic field frequency and position in thetank has been studied extensively at ACT Laboratories in Penang, Malaysia.The measured data at 27 locations (nine at each level e top, bottom, andmiddle) are shown in Figure 2.19.
Figure 2.20 presents a comparison of mean cavitation intensity forfrequencies extending down to 192 kHz. It is evident that there is a significantreduction in cavitation intensity as frequency increases, and that there is verylittle variability with respect to position in tank.
Vereecke et al. [37] have used a particle measurement method known as‘haze mapping’ to study the influence of process parameters on megasonicparticle removal efficiency (PRE). In particular, the effects of dissolved gas and
FIGURE 2.18 Cavitation meter
48 Developments in Surface Contamination and Cleaning

solution chemistry are shown in Figures 2.21 and 2.22. In contrast to ultrasoniccleaning, degassing actually reduces megasonic PRE.
Particle removal efficiency was studied by Busnaina et al. [29] atfrequencies of 40, 65, 80, and 850 kHz. The 850 kHz experiments were per-formed using a commercially available megasonic cleaning system (nominalfrequency 862 kHz and maximum power input 150 W), while commercialultrasonic tanks and generators (40, 65, 80, and 100 kHz) were used in theremaining experiments. Silicon wafers used were 125 mm p-type (100). Thewafers were cleaned prior to deposition of the particles using an RCA Standard
FIGURE 2.19 Cavitation intensity as a function of frequency and position within the cleaning tank
FIGURE 2.20 Mean cavitation intensity as a function of frequency (192e960 kHz)
49Chapter | 2 Megasonic Cleaning

Clean (SC1) (1 NH4OH: 1 H2O2: 5 H2O) solution and scanned by a lasersurface scanner (with 0.1 mm resolution) to establish a background particlecount. The background count of particles of unknown origin was subtractedfrom the total number of particles on the wafer before and after sonic cleaning.
Particles used were polystyrene latex (PSL) spheres, SiO2 (silica) spheres,and non-spherical Si3N4 (silicon nitride). Mean particle diameters of 0.3, 0.4,0.5, 0.6, 0.7, and 1.0 mm were employed. These particles, originally ina concentrated high-purity aqueous solution, were mixed with isopropanol to
FIGURE 2.21 Influence of dissolved oxygen on the particle removal efficiency (PRE) of 34-nm
SiO2 particles [30]
FIGURE 2.22 Particle removal efficiency for 78- and 34-nm SiO2 particles in aerated deionized
(DI) water and ammonia/peroxide mixture (APM) solutions (a) with megasonic agitation and (b)
without megasonic agitation [37]
50 Developments in Surface Contamination and Cleaning

form a dilute solution, eliminating the problem of particle agglomeration. Theresulting suspension was atomized using a nebulizer with 0.1 mm filtered air,and deposited onto the wafers. Approximately 150e300 particles weredeposited on each wafer, resulting in relatively low pre-cleaning particle counts(1.1e2.4 particles/cm2). Wafers were then loaded into a 25-wafer per-fluoroalkoxy (PFA) Teflon cassette, which was inserted vertically into the tank.After the required immersion time in deionized (DI) water, the cassette wasremoved from the tank. Wafers were rinsed in DI water, dried, and re-scannedto obtain the post-cleaning particle count.
Removal efficiency l was computed as follows:
lð%Þ ¼ f½Nbefore � Nafter�=Nbeforeg � 100 (2.7)
where Nbefore is the number of particles deposited on the water surface prior tosonic cleaning, and Nafter is the number of particles remaining on the surfaceafter cleaning. For any particular operating condition, ten experiments wererun, ten removal efficiency values were measured, and their average wascalculated.
Table 2.1 shows removal efficiencies for various PSL sphere sizes in DIwater at each frequency tested [29]. Efficiency was expected to increase withfrequency, as indeed it did with the exception of 80 and 100 kHz.
In all cases, removal was observed to increase with time until a maximumefficiency was reached, after which there was either no improvement or evena slight degradation in cleaning. Removal efficiency was also observed todecrease with decreasing particle size, consistent with the fact that the ratio ofparticle adhesion force to removal force scales approximately as particle size.
A megasonic cleaner operates more effectively at high electrical power. Yet,there are times when the system is not cleaning effectively and power isincreased beyond the saturation level, which continues to reduce cleaningeffectiveness. Results from experiments demonstrate that, in fact, higher power(in excess of 300 W) does not deliver effective cleaning [16]. The researchersfound that this reduced effectiveness at high power is not caused by limitations
TABLE 2.1 Particle Removal Efficiency (%) at Various Frequencies [29]
Particle Diameter, mm 40 kHz 65 kHz 80 kHz 100 kHz 862 kHz
1.0 88 95 83 87 95
0.7 84 87 75 75 90
0.5 75 84 70 70 85
0.3 70 72 65 57 N/A
Note: Each number represents an average of three data points. Immersion time was 20 minutes.
51Chapter | 2 Megasonic Cleaning

in the electrical or transduction systems, but is a cavitating fluid effect.Specifically, if there is too much cavitation, the increased volume fraction ofgas in the liquid prevents the acoustic field from propagating.
Another experiment [16] examined the sonoluminescence flux within thecleaner e pre-existing gas-filled nuclei necessary for cavitation inception.When the liquid remained undisturbed for 10 minutes, and then engaged, thelevel of cavitation activity was quite low after an initial spike, and slowlyshowed decreasing activity over a 2-minute period. If nucleation sites werecontinually supplied by bubbling air through the liquid both before and duringcleaner operation, similar behavior was observed; however, the level of cavi-tation activity was more than three times higher.
In the last experiment [16], the system remained undisturbed for severalminutes, and then both the cleaner and the bubbler were engaged. Resultsshowed that the level of cavitation activity gradually increased from the lowervalue, observed without the bubbler, to the higher value observed when thebubbler was activee indicating that it would be better to bubble gas through themegasonic cleaner while it is in a cleaning mode.
Finally, it is believed that in sequential operation, there is no need to movethe silicon wafers in the tank because cavitation activity is homogeneouslydistributed over the entire cleaning region. Again, results indicate a differentscenario [16]. When the cleaning region was examined during sequentialoperation, the transducers generated a band of cavitation activity, with regionsbetween the transducers generating very little cavitation. This explains theexistence of uncleaned bands on wafers.
Megasonic cleaning, although in widespread use in the semiconductorindustry [38], continues to be viewed warily because of damage [39] from theinconsistent surging or fountain effect of traditional megasonic systems(Fig. 2.23). This phenomenon is experienced when one of a group of megasoniclead zirconate titanate (PZT) transducers is set at the resonant frequency of thegenerator, or almost on the resonant point. It is not uncommon for the liquid torise 5 centimeters above the liquid level in this surge zone. This surge in poweris predictable because the frequency of the generator is set at the average of thefrequencies of the PZT array. If the power is reduced to eliminate the surge, theother PZTs underperform. Lack of uniformity and/or damage from the surgeminimizes the use of megasonics in silicon wafer cleaning and processes.‘Megasonic sweeping’ e a novel technology introduced by MegasonicSweeping Inc. (Trenton, New Jersey, USA) e eliminates traditional powersurges and establishes uniform activity in a megasonic cleaning vessel(Figs 2.24 and 2.25). Uniform cleaning and rinsing without damage is possibleby sweeping the array of megasonic PZT transducers. This process allocatesexactly the same amount of time to each PZT, and each PZT operates at itsoptimum resonant frequency.
The cleanability and erodibility of an acoustic field may be evaluated via themultiple-extraction procedure outlined previously [20]. Alternatively, cleaning
52 Developments in Surface Contamination and Cleaning

FIGURE 2.23 Traditional non-sweeping megasonic power distribution in a cleaning vessel
FIGURE 2.24 Sweep megasonic power distribution in a cleaning vessel
53Chapter | 2 Megasonic Cleaning

efficiency may be evaluated by quantifying the number of particles on a surfaceprior to and after a cleaning step.
For this study [40], two trans-sonic systems (i.e. operating at frequenciesbelow 1 MHz, but exhibiting all mechanistic characteristics of megasonicfields) were used, one operating at 470 kHz and the other at 430 kHz. The 470kHz system, supplied by Megasonic Sweeping Inc., incorporates sweeping,whereas the 430 kHz system does not. The difference in energy uniformitybetween the two is obvious as soon as they are switched on. The 430 kHzsystem only shows activity along the normal direction from the centrally placedtransducers, whereas the 470 kHz system shows a very uniform level ofagitation over the entire tank. Both units operate with an input power of 600 W.
This qualitative comparison was later quantitatively substantiated bymeasuring the prevalent cavitation intensity using a ppb� Cavitation Meter inthe two systems. The data are shown in Figure 2.26. At the center, both systemsshow robust intensity levels, although the 470 kHz system has energy levelsnearly double those of the 430 kHz. But the contrast is vivid at the sides and
FIGURE 2.25 470 kHz tank with sweeping (courtesy of Crest Ultrasonics Corporation, USA)
54 Developments in Surface Contamination and Cleaning

corners. The 430 kHz system has negligible activity at these off-center loca-tions, whereas the 470 kHz system, with sweep megasonics, continues to showsignificant energy levels.
This is clearly indicative of the fact that power is distributed uniformlyto the entire tank when sweep is applied, in stark contrast to conventionalmegasonic systems. There is less peaking of power at the center. Clean-ability and erodibility studies were performed with uncontaminated siliconand glass coupons, as well as coupons intentionally contaminated with PSLparticles of sizes ranging from 0.3 mm to 5 mm. Extraction was performedin purified, filtered water at room temperature. At the center, the 430 kHzsystem shows a ‘fountain’ effect, where the normal energy transmission isso concentrated that it causes a plume of water to shoot up. As expected,this results in 1.5e2� higher surface erodibility at the center of the430 kHz tank for a clean (uncontaminated) substrate (Fig. 2.27). It is to be
FIGURE 2.26 Cavitation intensities in center and corners of sweeping megasonics (470 kHz
from MSI, Inc., USA) and traditional megasonics (430 kHz)
FIGURE 2.27 Erodibility comparison at center of tank (based on turbidity measurement on
extract solution)
55Chapter | 2 Megasonic Cleaning

noted that every data point in this and the subsequent figures is a mean of atleast three replicate runs, and the standard deviation in every case was lessthan 10e15% of the mean.
Cleanability was compared at the corners using PSL-contaminated glassdisks. The 470 kHz system produces a multiple-extraction curve with a sig-nificantly steeper (by about 50%) initial slope, indicating superior cleaningefficiency (Fig. 2.28). The higher asymptote in this case is indicative of higheracoustic power at the corners of the 470 kHz tank compared to the 430 kHztank.
Also of interest is the mean size of residual particles after various cleaningcycles. This parameter is compared for the two systems in Figure 2.29. It isclear that the 470 kHz system is able to remove finer particles from thesurface compared to the 430 kHz system. After five extraction stages, the meansurface-residual particle size in the 470 kHz system is three times smaller than
FIGURE 2.28 Cleanability comparison at the center of the tank based on turbidity measurement
of the extract solution
FIGURE 2.29 Mean size of surface residual particles after multiple cleaning stages
56 Developments in Surface Contamination and Cleaning

the 430 kHz system. This could have important ramifications in precisioncleaning of microelectronic components.
Another comparison of the surface cleaning effectiveness of the 430 and470 kHz systems was performed using a Surface Particle Detector QIIIþ�
(supplied by Pentagon Technologies Inc., USA). This instrument uses airblowing and vacuum suction to entrain particles from the surface into an airstream which is then sampled using a laser particle counter. Residual particlelevels on a glass disk after cleaning with the two systems are compared inFigure 2.30. It is evident that the disks cleaned by the 470 kHz sweep mega-sonics have fewer residual particles (by 2e3�) for sizes ranging from 0.3 mm to1 mm [40].
The presence of ‘sweep’ renders another dimension to megasonic cleaning.The most prominent limitation of megasonics, namely its non-uniformity, hasbeen overcome, to a large extent, by the sweep feature. Instead of the acousticpower being confined to the center of the tank, it is now widely and uniformlydistributed to every location in the tank, including the edges and corners. Theacoustic intensity, cleanability and erodibility data reported here confirm that470 kHz ‘swept megasonics’ is superior to conventional 430 kHz cleaning inevery aspect. This is a very positive development in the context of semi-conductor wafer cleaning, as it will lead to a reduction in contamination-relateddefects. The resultant yield improvement is projected to be quite significant.
FIGURE 2.30 Comparison of cleaning efficiency of swept (470 kHz) and traditional (430 kHz)
megasonic cleaning
57Chapter | 2 Megasonic Cleaning

6. INDUSTRY CASE STUDIES
Chang et al. [41] have discussed the use of 0.8e1 MHz frequency acousticwaves to enhance cleaning efficiency for post-etch polymer removal in theCu-low-k dual damascene process. They demonstrated effective usage ofmegasonic cleaning without structural damage (though the average Cu rootmean square (RMS) roughness, measured by an atomic force microscope(AFM), did increase from 8.5 nm to 9.5 nm at maximum input power), andyields >90%. Processing time was greatly reduced with the megasonicenhancement.
Keswani et al. [42] have investigated the feasibility of removal of particlesfrom silicon wafers in electrolyte solutions of different ionic strengths irradi-ated with megasonic waves, using KCl as model electrolyte and silica as modelparticles. They have measured the effect of ionic strength on acoustic pressurein solutions using a hydrophone, and found that sound wave pressure amplitudecan be increased in electrolyte solutions of ionic strength greater than 0.01 M.The key result from this work was that the removal of particles can be achievedat lower acoustic power densities through the use of simple electrolytesolutions.
Kim et al. [43] have developed a megasonic system for nano-patterncleaning that does not cause damage. An L-type (named for the shape)waveguide made from quartz was found to give best cleaning results. Themaximum values and standard deviations of acoustic pressure were decreasedby 17% and 14%, respectively. They conclude, therefore, that the L-type wouldhave higher particle removal efficiency and would be less likely to causepattern damage.
FIGURE 2.31 Defect number after various cleaning processes [36]
58 Developments in Surface Contamination and Cleaning

Huang et al. [44] have compared various cleaning processes used to removepost-CMP (chemical mechanical polishing) residue in hard disk substratemanufacturing. The results are summarized in Figure 2.31. Megasonic cleaningis clearly superior to ultrasonics and scrubbing in defect reduction. This isreinforced for various particle types in Figure 2.32. The authors conclude thatbrush scrubbing can remove 99% of the contamination, but megasonics isneeded to remove sub-mm particles.
7. CONCLUDING REMARKS
The theory, experimentation and practice of megasonic cleaning lead to theconclusion that it has inherent advantages vis-a-vis ultrasonic cleaning inminimization of surface damage and ability to remove fine particles. However,the technique does have its limitations, which must be clearly understood by thepractitioner. In particular, the uni-directionality of megasonic fields is a majorconcern. This has now been addressed effectively by sweep-megasonics.Another issue with megasonic cleaning is its inability to dislodge stronglyadhered particles from surfaces. While this is yet to be fully resolved, pre-cleaning of substrates at a lower trans-sonic frequency of 400e600 kHz may bea good strategy to leverage megasonics primarily as a rinsing mechanism forloosened particles on the surface.
Unlike ultrasonics which can function very effectively as a ‘physical’cleaner, with water and surfactant only, a megasonic cleaner typically reliesupon strong chemistry to optimize cleaning. From an environmental point ofview, this is not entirely desirable, but it must be borne in mind that deployingmegasonics very likely results in a reduction in chemical usage and in pro-cessing time, both highly desirable outcomes.
If ultrasonics is the ‘workhorse’ of the parts cleaning industry, megasonicsperforms that role in precision cleaning. With further study and optimization, ithas the potential to extend its applicability to the nano-regime and below.
FIGURE 2.32 Particle residue by type after various cleaning processes [36]
59Chapter | 2 Megasonic Cleaning

REFERENCES
[1] D.W. Cooper, Particulate Contamination and Microelectronics Manufacturing: An Intro-
duction, Aerosol Sci. Technol. 5 (1986) 287.
[2] V.B. Menon, Particle Adhesion to Surfaces: Theory of Cleaning, in: R.P. Donovan (Ed.),
Particle Control for Semiconductor Manufacturing, Marcel Dekker, New York, NY, 1990,
pp. 359e382.
[3] M.A. Mendicino, P.K. Vasudev, P. Maillot, C. Hoener, J. Baylis, J. Bennett, et al., Silicon-on-
Insulator Material Qualification for Low-Power Complementary Metal-Oxide Semiconductor
Application, Thin Solid Films 270 (1995) 578.
[4] R. Nagarajan, Survey of Cleaning and Cleanliness Measurement in Disk Drive Manufacture,
Precision Cleaning Magazine, pp. 13e22 (February 1997).
[5] L. Nebenzahl, R. Nagarajan, L. Volpe, J.S. Wong, O. Melroy, Chemical Integration and
Contamination Control in Hard Disk Drive Manufacturing, J. Inst. Environ. Sci. Technol. 41
(1998) 31.
[6] G.S. Selwyn, C.A. Weiss, F. Sequeda, C. Huang, In-Situ Analysis of Particle Contamination
in Magnetron Sputtering Processes, Thin Solid Films 317 (1998) 85.
[7] W.G. Fisher, Particle Interaction with Integrated Circuits, in: R.P. Donovan (Ed.),
Particle Control for Semiconductor Manufacturing, Marcel Dekker, New York, NY, 2000,
pp. 1e8.
[8] S. Huth, O. Breitenstein, A. Huber, D. Dantz, U. Lambert, Localization and Detailed
Investigation of Gate Oxide Integrity Defects in Silicon MOS Structures, Microelectronic
Eng. 59 (2001) 109.
[9] E.-S. Yoon, B. Bhushan, Effect of Particulate Concentration, Materials and Size on the
Friction and Wear of a Negative-Pressure Picoslider Flying on a Laser-Textured Disk, Wear
247 (2001) 180.
[10] W. Kern (Ed.), Handbook of Semiconductor Wafer Cleaning Technology: Science, Tech-
nology, and Applications, Noyes Publications, Park Ridge, NJ, 1993.
[11] K.A. Reinhardt, W. Kern (Eds.), Handbook of Semiconductor Wafer Cleaning Tech-
nology: Science, Technology, and Applications, second ed., William Andrew, Norwich,
NY, 2008.
[12] Techsonic Website, http://www.techsonic.fr/megatheory.htm (2010).
[13] S.B. Awad, Particle Removal with Ultrasonics and Megasonics, in: K.L. Mittal (Ed.),
Particles on Surfaces 7: Detection, Adhesion and Removal, VSP, Utrecht, The Netherlands,
2002, pp. 341e354.
[14] I.I. Kashkoush, A.A. Busnaina, F.W. Kern, R.F. Kunesh, Ultrasonic Cleaning of Surfaces: An
Overview, in: K.L. Mittal (Ed.), Particles on Surfaces 3: Detection, Adhesion and Removal,
Plenum Press, New York, NY, 1991, pp. 217e237.
[15] D. Swanson, High Power Megasonic Cleaning in the CMP Application, CMPUG_04_2002,
American Vacuum Society CMP User Group (April 2002).
[16] M.A. Lester, A Glimpse into Megasonic Cleaning, Semiconductor International 26 (2003)
38.
[17] Y. Wu, C. Franklin, M. Bran, B. Fraser, Acoustic property characterization of a single wafer
megasonic cleaner, in: R.E. Novak, J. Ruzyllo, T. Hattori (Eds.), Cleaning Technology in
Semiconductor Device Manufacturing VI, The Electrochemical Society, Pennington, NJ,
2000, pp. 360e367.
[18] J.O. Kim, S. Choi, J.H. Kim, Vibroacoustic Characteristics of Ultrasonic Cleaners, Appl.
Acoustics 58 (1999) 211.
60 Developments in Surface Contamination and Cleaning

[19] D.M. Berg, T. Grimsley, P. Hammond, C.T. Sorensen, New Sonic Cleaning Technology for
Particle Removal from Semiconductor Surfaces, in: K.L. Mittal (Ed.), Particles on Surfaces
2: Detection, Adhesion and Removal, 1989, pp. 307e317.
[20] S. Awad, R. Nagarajan, Ultrasonic Cleaning, in: R. Kohli, K.L. Mittal (Eds.), Developments
in Surface Contamination and Cleaning, Vol. 2, Elsevier, Oxford, UK, 2010, pp. 226e278.
[21] R. Gouk, D.B. Kittelson, T.H. Kuehn, Y. Wul, Measurement and Modelling of Megasonic
Cleaning Processes, in: K.L. Mittal (Ed.), Particles on Surfaces 5&6: Detection, Adhesion
and Removal, VSP, Utrecht, The Netherlands, 1999, pp. 191e201.
[22] V. Minsier, J. Proost, Shockwave upon Spherical Bubble Collapse during Cavitation-Induced
Megasonic Surface Cleaning, Ultrasonics Sonochem. 15 (2008) 598.
[23] K. Bakhtari, R.O. Guldiken, P. Makaram, A.A. Busnaina, J.-G. Park, Experimental and
Numerical Investigation of Nano-Particle Removal Using Acoustic Streaming and the Effect
of Time, J. Electrochem. Soc. 153, G846 (2006).
[24] W.L. Nyborg, Acoustic Streaming, in: W.P. Mason (Ed.), Physical Acoustics II, Academic
Press, New York, NY, 1965, pp. 265e331.
[25] J.J. Markham, Second Order Acoustic Field: Streaming and Viscosity and Relaxation, Phys.
Rev. 86 (1952) 497.
[26] S. Tjotta, On Some Non-Linear Effects in Sound Fields, with Special Emphasis on the
Generation of Vorticity and the Formation of Streaming Patterns, Arch. Math. Naturvidensk
55 (1959) 1.
[27] C.E. Brennen, Cavitation, Bubble Dynamics, Chapter 4, Oxford University Press, Oxford,
UK, 1995.
[28] A. Nowicki, W. Secomski, J. Wojcik, Acoustic Streaming: Comparison of Low-Amplitude
Linear Model with Streaming Velocities Measured by 32-MHz Doppler, Ultrasound in
Med. & Biol. 23 (1997) 783.
[29] A.A. Busnaina, G.W. Gale, I.I. Kashkoush, Ultrasonic and Megasonic Theory and Experi-
mentation, Parts Cleaning, pp. 13e19 (April 1994).
[30] P.A. Deymier, J.O. Vasseur, A. Khelif, B. Djafari-Rouhani, L. Dobrzynski, S. Raghavan,
Streaming and Removal Forces due to Second-Order Sound Field During Megasonic
Cleaning of Silicon Wafers, J. Appl. Phys. 88 (2000) 6821.
[31] W. Kim, T.-H. Kim, J. Choi, H.Y. Kim, Mechanism of Particle Removal by Megasonic
Waves, Appl. Phys. Lett. 94 (081908) (2009).
[32] I. Akhatov, R. Mettin, C.D. Ohl, U. Parlitz, W. Lauterborn, Bjerknes Force Threshold for
Stable Single Bubble Sonoluminescence, Phys. Rev. E 55 (1997) 3747.
[33] P.M. Kanthale, P.R. Gogate, A.B. Pandit, A.M. Wilhelm, Cavity Cluster Approach for
Quantification of Cavitational Intensity in Sonochemical Reactors, Ultrasonics Sonochem. 10
(2003) 181.
[34] R. Nagarajan, Use of Ultrasonic Cavitation in Surface Cleaning: A Mathematical Model
to Relate Cleaning Efficiency and Surface Erosion Rate, J. Inst. Environ. Sci. Technol. 49
(2006) 40.
[35] T.H. Kuehn, D.B. Kittelson, Y. Wu, R. Gouk, Particle Removal from Semiconductor Surfaces
by Megasonic Cleaning, J. Aerosol Sci. 27, S427 (1996).
[36] T.H. Kuehn, C.H. Yang, D.B. Kittelson, Influence of Temperature and Dissolved Air on
Megasonic Particle Removal, in: K.L. Mittal (Ed.), Particles on Surfaces 7: Detection,
Adhesion and Removal, VSP, Utrecht, The Netherlands, 2002, pp. 355e376.
[37] G. Vereecke, E. Parton, F. Holsteyns, K. Xu, R. Vos, P.W. Mertens, M.O. Schmidt, T. Bauer,
Investigating the Role of Gas Cavitation in Megasonic Nanoparticle Removal, Micro-
contamination 22 (2004) 57.
61Chapter | 2 Megasonic Cleaning

[38] S.L. Wicks, M.S. Lucey, J.J. Rosato, Effects of Megasonics Coupled with SC-1 Process
Parameters on Particle Removal on 300-mm Silicon Wafers, in: K.L. Mittal (Ed.), Particles
on Surfaces 8: Detection, Adhesion and Removal, VSP, Utrecht, The Netherlands, 2003,
pp. 315e322.
[39] R. Nagarajan, Cavitation Erosion of Substrates in Disk Drive Component Cleaning: An
Exploratory Study, Wear 152 (1992) 75.
[40] M. Goodson, R. Nagarajan, Megasonic Sweeping and Silicon Wafer Cleaning, Solid State
Phenomena 145e146 (2009) 27.
[41] C.K. Chang, T.H. Foo, M. Mukherjee-Roy, V.N. Bliznetov, H.Y. Li, Enhancing the Efficiency
of Post-Etch Polymer Removal Using Megasonic Wet Clean for 0.13-mm Damascene
Interconnect Process, Thin Solid Films 462e463 (2004) 292.
[42] M. Keswani, S. Raghavan, P. Deymier, S. Verhaverbeke, Megasonic Cleaning of Wafers in
Electrolyte Solutions: Possible Role of Electro-Acoustic and Cavitation Effects, Micro-
electronic Eng. 86 (2009) 132.
[43] H. Kim, Y. Lee, E. Lim, Design and Fabrication of an L-Type Waveguide Megasonic System
for Cleaning of Nano-Scale Patterns, Current Appl. Phys. 9, e189 (2009).
[44] Y. Huang, X. Lu, G. Pan, B. Lee, J. Luo, Particles Detection and Analysis of Hard Disk
Substrate after Cleaning of Post Chemical Mechanical Polishing, Appl. Surf. Sci. 255 (2009)
9100.
62 Developments in Surface Contamination and Cleaning

Chapter 3
Laser Cleaning for Removal ofNano/Micro-Scale Particles andFilm Contamination
M.D. Murthy Peri,1 Ivin Varghese2 and Cetin Cetinkaya31Surface Conditioning Division, FSI International Inc., 3455 Lyman Blvd, Chaska, MN 55318,
USA, 2Eco-Snow Systems, Rave N.P., Inc., 4935A Southfront Road, Livermore, CA 94551, USA,3Department of Mechanical and Aeronautical Engineering, Center for Advanced Materials
Processing, Wallace H. Coulter School of Engineering, Clarkson University, Potsdam, NY
13699-5725, USA
Chapter Outline1. Introduction 63
2. Dry Particle Removal
Technique Requirements
65
3. Laser Cleaning Techniques 67
4. Future Directions in Laser
Particle Removal Research
113
5. Conclusions and Remarks 114
References 117
1. INTRODUCTION
A technique for generation of extremely monochromatic radiation in theinfra-red optical region of the spectrum using potassium vapor as the activemedium was proposed by Schawlow and Townes [1]. Javan [2] and Sanders [3]discussed proposals involving electron-excited gaseous systems. Finally in1960, Theodore Maiman successfully applied an optical pumping techniqueto a fluorescent solid resulting in the attainment of negative temperatures andstimulated optical emission at a wavelength of 6943 A utilizing ruby as theactive material, thus demonstrating the first working laser [4,5]. Since thenlasers have been applied to several key technological applications, such asmicromachining, materials processing, welding, non-destructive testing,cutting, precision metrology, and medical treatments [6]. Due to somecritical limitations of conventional cleaning techniques, especially in
Developments in Surface Contamination and Cleaning.
Copyright � 2011 Elsevier Inc. All rights reserved. 63
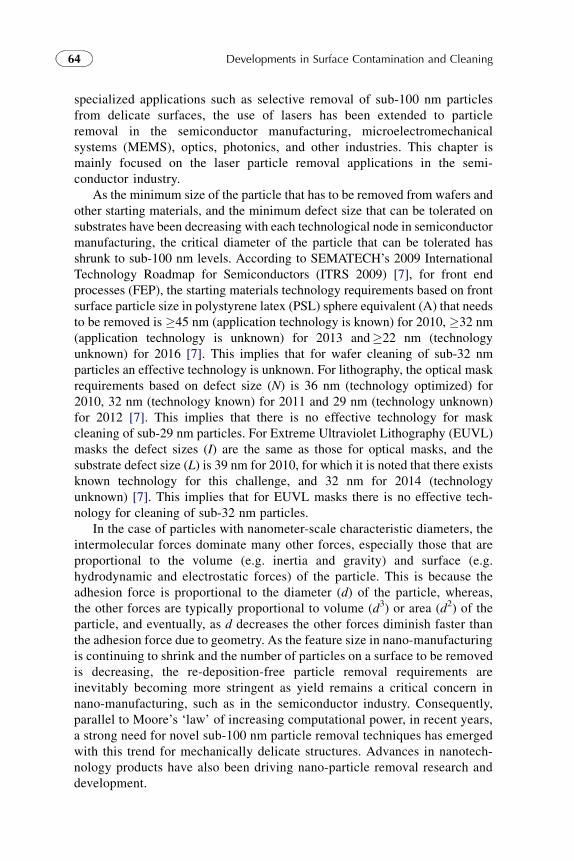
specialized applications such as selective removal of sub-100 nm particlesfrom delicate surfaces, the use of lasers has been extended to particleremoval in the semiconductor manufacturing, microelectromechanicalsystems (MEMS), optics, photonics, and other industries. This chapter ismainly focused on the laser particle removal applications in the semi-conductor industry.
As the minimum size of the particle that has to be removed from wafers andother starting materials, and the minimum defect size that can be tolerated onsubstrates have been decreasing with each technological node in semiconductormanufacturing, the critical diameter of the particle that can be tolerated hasshrunk to sub-100 nm levels. According to SEMATECH’s 2009 InternationalTechnology Roadmap for Semiconductors (ITRS 2009) [7], for front endprocesses (FEP), the starting materials technology requirements based on frontsurface particle size in polystyrene latex (PSL) sphere equivalent (A) that needsto be removed is �45 nm (application technology is known) for 2010, �32 nm(application technology is unknown) for 2013 and�22 nm (technologyunknown) for 2016 [7]. This implies that for wafer cleaning of sub-32 nmparticles an effective technology is unknown. For lithography, the optical maskrequirements based on defect size (N) is 36 nm (technology optimized) for2010, 32 nm (technology known) for 2011 and 29 nm (technology unknown)for 2012 [7]. This implies that there is no effective technology for maskcleaning of sub-29 nm particles. For Extreme Ultraviolet Lithography (EUVL)masks the defect sizes (I) are the same as those for optical masks, and thesubstrate defect size (L) is 39 nm for 2010, for which it is noted that there existsknown technology for this challenge, and 32 nm for 2014 (technologyunknown) [7]. This implies that for EUVL masks there is no effective tech-nology for cleaning of sub-32 nm particles.
In the case of particles with nanometer-scale characteristic diameters, theintermolecular forces dominate many other forces, especially those that areproportional to the volume (e.g. inertia and gravity) and surface (e.g.hydrodynamic and electrostatic forces) of the particle. This is because theadhesion force is proportional to the diameter (d) of the particle, whereas,the other forces are typically proportional to volume (d3) or area (d2) of theparticle, and eventually, as d decreases the other forces diminish faster thanthe adhesion force due to geometry. As the feature size in nano-manufacturingis continuing to shrink and the number of particles on a surface to be removedis decreasing, the re-deposition-free particle removal requirements areinevitably becoming more stringent as yield remains a critical concern innano-manufacturing, such as in the semiconductor industry. Consequently,parallel to Moore’s ‘law’ of increasing computational power, in recent years,a strong need for novel sub-100 nm particle removal techniques has emergedwith this trend for mechanically delicate structures. Advances in nanotech-nology products have also been driving nano-particle removal research anddevelopment.
64 Developments in Surface Contamination and Cleaning

2. DRY PARTICLE REMOVAL TECHNIQUE REQUIREMENTS
The most common cleaning techniques [8,9] employed in various high-technology industries include brush scrubbing [10e12], ultrasonic and mega-sonic cleaning [13e15], centrifugal spray cleaning, vapor phase cleaning [16],fluid jet cleaning, and cryogenic cleaning [17e20]. These techniques are ofteneffectively employed for removal of large numbers of micro/nano-scale parti-cles when particle re-deposition is not an issue. The efficiency of the brushscrubbing process is dependent on the mechanical contact of the particle andthe brush whiskers, thus generally making it unviable for nanoparticle removal[21,22]. In wet cleaning techniques, the fluid used should overcome the viscouseffects and capillary force to generate enough local flow rates to remove thenanoparticles, and ultrasonic excitation of the fluid to increase the efficiency ofthe process might lead to cavitation and subsequent damage [23]. The wetcleaning techniques have to be followed by a heating process to dry the surface,which is known to result in damage and stains of undesired chemicals on thesurfaces [21,24]. In sub-100 nm range, the force required to remove nano-particles with the conventional techniques could pose a realistic risk of substratedamage for films and multilayers as required removal forces per unit area havebecome high compared to yield strength of materials and features involved. Overthe past two decades or so, several laser-based dry non-contact techniques havebeen introduced for cleaning contaminants from substrates. A summary of thecurrent techniques used in the industry is detailed in Table 3.1 and the effects ofinteraction forces are summarized in Table 3.2.
The major concerns of the current wet cleaning techniques with respect tosemiconductor substrates are three-fold: (i) material loss; (ii) contaminationissues due to chemical residues (e.g. haze defects); and (iii) possibility ofdamage to features present elsewhere from the particle defects on the substrate,since conventional cleaning processes target the entire substrate; in otherwords, precision cleaning is not possible. More specifically, for example, thewet cleaning techniques cannot be used in some of the BEOL (Back End of theLine) processes as the metal surface exposed to the wet chemicals could causeundesired corrosion, resulting in change of electrical properties of materialsand devices. Consequently, dry, chemical-free cleaning techniques such as lasercleaning and cryogenic cleaning would have an edge over conventional wetcleaning techniques in many aspects when: (i) material loss is a concern andhigh particle removal efficiency is desired; (ii) local/precision cleaning ofmicrometer/sub-micrometer and sub-100 nm particles (classified as surface andsmall particles respectively), in crucial processes is desired; (iii) applicationsinvolve chemically sensitive features; and (iv) cleaning of optical and photonicsubstrates (e.g. photomasks) is desired since the chemical residue/haze couldchange the optical properties of the substrate. Additionally, in the near term theindustry projects the utilization of the EUVL technology for the feature sizes22 nm and below. At this length scale, any contaminant particles adhered to the
65Chapter | 3 Laser Cleaning for Removal of Nano/Micro-Scale Particles

TABLE 3.1 A Summary of Leading Industrial Cleaning Techniques and Comparison of their Main Characteristics, Advantages and
Disadvantages
Cleaning Method Advantages Disadvantages and Limitations
Wet-chemical etchingl Centrifugal Spray Cleaningl Ultrasonic (18 to 250 kHz)
(cavitation-based)l Megasonic (0.8 to 4.0 MHz)
l Particle size range for removal: 10 to 0.3 mmin diameter
l High removal efficiencyl Mature technology
l Difficulties in integration into the process line(cluster tools)
l Blocking the high aspect ratio surface featuresl Particle control and prevention of re-attachmentl High cost of chemicals usedl Expensive chemicals disposall Environmental pollution
Vapor-phase cleaning l More effective than wet chemical etching foradvanced devices
l Dryl Ongoing developments
l Low cleaning efficiencyl Complicated processl Waste disposall High cost of high-purity gasl Safety issues
Mechanical cleaningl Brush scrubbingl Fluid jet (rinsing, spinning)l Cryogenic cleaning
l Very effective for particles up to 1 mm indiameter
l Mature technology
l High maintenance requirements for brushesl High potential damage to surfacesl Dislodging and dispersing particles due to bubble
formationl Lower efficiency for sub-mm particles
Laser cleaningl Steam laserl Dry laser
l Sub-mm particle removal (up to 0.1 mm)l Dry processl Rapid processl Noncontactl Easy to integrate in process line (cluster tools)l No chemicals requiredl Environmental benefits: water conservation
and less chemical pollutant generation
l Expensivel High initial costl Surface damage possiblel Still under development, not optimized
66
Develo
pmen
tsin
Surface
Contam
inatio
nan
dClean
ing

photomask during exposure would result in defects in the masks and, subse-quently, on chips on the wafer. As a result, there has been an increasingnecessity for using a cleaning technique that is ‘in-tool’ during, or immediatelybefore, the start of the exposure of the next-generation lithography photomasks.Conventional cleaning techniques are often unsuitable for the ‘in-tool’ appli-cations. In this respect, the laser-based technique is considered as a potential‘in-tool’ cleaning technique [13].
3. LASER CLEANING TECHNIQUES
In this class of particle removal techniques, a pulsed laser source is used togenerate the particle removal force. Depending on their removal mechanisms,the most common laser-based cleaning techniques are (i) dry laser cleaning(DLC), (ii) wet/steam laser cleaning (WLC), (iii) laser induced plasma (LIP)cleaning, and (iv) advanced laser cleaning (ALC).
The effectiveness of these laser-based techniques for removal of sub-100nm particles has been reported in the literature. For example, the removal of 60nm PSL particles from silicon (Si) wafers in a damage-free manner using theLaser Induced Plasma is reported in [25]. Some breakthroughs in 40e50 nmparticle removal were listed in the literature review in chapter 3 in [26]. TheWLC technique was utilized for removal of 51 nm PSL particles from Si waferssubmerged in a liquid medium consisting of a mixture of water and ethanol nearthe meniscus creating a ‘mini-tsunami’ effect [27,28]. The two uncommonlaser-based cleaning techniques that are a subset of the DLC technique areMatrix Laser Cleaning and Plasmon Resonance Technique. Matrix Laser
TABLE 3.2 A General Grouping of Adhesion Forces for Their Interaction
Ranges and Effects
Group I Group II Group III
Range Long-rangeinteractions
Short-rangeinteractions
Very-short-rangeinteractions
Interaction Solidesolid Solidesolid,solideliquid
Solidesolid,solideliquid
Effects l Electrostaticforces
l Magneticforces
l van der Waals forcesl Sintering effects
(diffusion andcondensation)
l Diffusive mixingl Mutual dissolution
and alloyingl Capillary forces
l Chemical bondsl Intermediate bonds
67Chapter | 3 Laser Cleaning for Removal of Nano/Micro-Scale Particles

Cleaning reported in [29] was successful in removing PSL particles down to 50nm from Si wafers in a damage-free manner, by using an additional layer ofsolid CO2 (quench condensed CO2) deposited on the Si surface prior to the laserpulse [26]. Plasmon Resonance Technique [30] was successful in removing 40nm gold particles from Si wafers by localized excitation of the surface plasmonby incident radiation with a wavelength of 532 nm. The most recent break-through for removal of 10e40 nm PSL particles from Si wafers was reported in[31]. The main particle detachment modes are rolling, sliding, and lifting, ora combination of these modes [32].
3.1. Dry Laser Cleaning Method
The DLC approach was the first method employed to remove particles fromsubstrates using lasers. Various academic and industrial research groups havereported the experimental, characterization and computational results of thiscleaning method in the past [33e46]. In the dry laser method of cleaning,a short-pulsed laser beam is directed on the substrate that has to be cleaned.This laser pulse excitation on the substrate results in rapid thermal expansionand thermomechanical wave propagation and out-of-plane acceleration,thereby exciting the substrate and/or the particles that have to be removed. Thishigh-frequency (nanosecond) acceleration and wave propagation phenomenongenerates an inertial force that can shake off the particle adhered to thesubstrate, provided the generated inertial force exceeds the total adhesion forceconsisting of several individual forces, such as van der Waals, electrostatic, andcapillary forces. The main principle of this mode of sub-micrometer particleremoval is the substrate acceleration induced by the thermoelastic fieldgenerated by the irradiation of the short-pulsed laser. The substrate attains itsmaximum acceleration value due to the substrate thermal expansion during theirradiation of the short-pulsed laser in the out-of-plane direction until the peakfluence of the beam is reached. The resulting positive acceleration presses theparticle down and increases the contact diameter and the strain energy stored inthe deformed particle. Removal can occur only after the surface begins todecelerate. The magnitude of surface acceleration is proportional to the level offluence due to linearity assumption of thermoelastic effects and is inverselyproportional to the duration of the laser pulse squared. However, abovea certain level of laser fluence, thermal and/or mechanical damage on thesurface could occur [46]. It is also noteworthy that during this process thesurface is subjected to high levels of electromagnetic radiation as well.
In the dry laser cleaning technique, to understand the modes of substratedamage, both thermal and mechanical (stress) damage thresholds must be wellunderstood and accurately modeled. A key complication in such analysis is thatthe material properties vary substantially with strain rates and temperaturechanges, and it is often not well understood how certain materials yield underhigh thermoelastic strain rate excitations. These thresholds could then be used to
68 Developments in Surface Contamination and Cleaning

avoid excessive heat deposition and/or stress levels. The complexity of thethermoelastic process requires that a detailed analysis be carried out for thedetermination of optimal removal efficiencies. The onset of the material damagedue to thermal and mechanical fields in this technique was modeled for the firsttime in [46], for silicon particles on copper and silicon substrates. It was reportedthat for the DLC method the required laser fluence for removing a particular sizeparticle depends on the coefficient of reflectivity of the substrate and the particle.Based on the computational model, the critical limit of DLC was determined, interms of the minimum diameter of the silicon particles that could be removedfrom silicon and copper substrates without any damage. Our research group atthe Photo-Acoustics Research Laboratory at Clarkson University has reportedthat the type of damage initiation (thermal or mechanical fracture) depends onthe particle size that has to be removed and particle-substrate system materialproperties, and the damage risk for sub-100 nm particle removal with DLC isfound to be very high [46]. The thermal damage threshold is the meltingtemperature, and mechanical damage occurs above the yield stress of thesubstrate material. Thus, the thermo-elastic simulations from [46] indicate thatwhen silicon particles smaller than 600 nm are removed from a silicon substrate,and when silicon particles smaller than 630 nm are removed from coppersubstrate using DLC, it would result in thermal and mechanical damage,respectively. It should be noted that the only effects considered in the reportedstudy were linear thermal and mechanical fields, and no other types of damagesuch as optical and electromagnetic damage mechanisms were considered.Delicate structures on substrates and processing techniques used to machinethem sometimes substantially lower the local material yield properties, and suchstructures can amplify the laser beam on the textured surface due to diffraction,thus their cleaning requires substantially greater care than flat substrates.
3.2. Liquid-Based Laser Cleaning
In the liquid-based laser cleaning technique and its several variants, a liquidmedium is used to enhance forces applied to the particle and thus improve lasercleaning efficiency. Key effects of this technique include, but are not limited to,the high-speed ablation of the liquid film, explosive boiling of the liquid film,and utilization of the higher density of the liquid film (e.g. the density of wateris three orders of magnitude higher than that of air). Laser irradiation of a thinliquid film present on the substrate surface, resulting in explosive vaporizationof the liquid layer that provides the momentum transfer for particle removal, isthe principle behind steam laser cleaning (SLC) [25,27,35,47e54]. Forexample, as reported in [35], particle removal was achieved by the explosivevaporization of water (transparent liquid required) with a 248 nm pulsed laserradiation. Gold particles as small as 200 nm were effectively removed, bydepositing a liquid film of thickness on the order of a micrometer on thesurface, and irradiating the surface with a pulsed laser at a wavelength that is
69Chapter | 3 Laser Cleaning for Removal of Nano/Micro-Scale Particles

strongly absorbed by the surface and short pulse duration to avoid substratedamage [33]. It was also reported that alumina particles of 100 nm diameterwere efficiently removed from a silicon surface with KrF excimer laser radi-ation of 16 ns pulse length and 120 mJ/cm2 energy density [49]. The methodutilizes the process of bubble nucleation in the liquid, and can remove at least100-nm-sized particles from a solid surface [30,35,50,54]. By depositinga small deionized (DI) water droplet (approximately 100 mm diameter) on theSi wafer sample, 404 nm PSL particles were removed by using laser-inducedplasma (LIP) generated 1.4 mm above the substrate surface [55]. This liquid-based laser cleaning technique is different from SLC and WLC because in thistechnique the plasma is not created in the liquid film, thus, in principle, nocavitation bubble formation or ablation is observed.
3.3. Laser-Induced Plasma Cleaning
A laser cleaning method introduced in recent years utilizes shockwavesgenerated using the supersonic expansion of an LIP core [13,25,31,55e73].Unlike the DLC technique, in the LIP cleaning technique the direct interactionof the laser beam with the substrate is avoided. Here we provide a detaileddescription of the technique, blast wave/supersonic expansion theoryassumptions, particle removal experiments, damage effects, characterization ofthe LIP cleaning technique, and the recent advancements in this technique.
In the LIP particle cleaning approach, a short pulse (typically in the range ofonly a few nanoseconds) high-energy infrared laser beam (e.g. at 1064 nm) isfocused to a spot in air using a convex lens as depicted in Figure 3.1. LIP isformed above a silicon wafer surface, as shown in Figure 3.1c. This focusingresults in the initiation of dielectric breakdown of air at the focal point due tothe steep elevation in electromagnetic energy density and, consequently, thelocal temperature. The breakdown of air leads to formation of a rapidlyexpanding plasma core. The size of the plasma core expands initially to certainextent and then tends to saturate. As the supersonic plasma expansion saturates,the compressed air surrounding the plasma core emerges as a strong shockwavefront. The growth and decay of plasma and the shockwave are illustrated inFigure 3.2 by the shadowgraphs acquired using high-speed photography byVillagran-Muniz et al. [74]. In the LIP cleaning technique, the propagatingshockwave front is directed onto the substrate to exert a transient pressure fieldand if this exerted force is greater than the critical adhesion force between theparticle and the substrate, the particle will be moved and/or detached. Fordamage-free removal, the interaction of the plasma core with the substrate isavoided, or at least minimized.
3.3.1. Propagation of LIP Blast Wave
Laser-induced breakdown in air, first discovered in 1963 [75], is realized in foursuccessive stages [76]: (i) multi-photon collision with the gas molecules
70 Developments in Surface Contamination and Cleaning

FIGURE 3.1 Laser-induced plasma (LIP) nanoparticle removal technique: (a) schematic (not to
scale); (b) photograph of the experimental set-up showing the LIP being measured by a pressure
transducer (inset); (c) LIP formed above a silicon wafer
71Chapter | 3 Laser Cleaning for Removal of Nano/Micro-Scale Particles

FIGURE 3.2 A sequence of shadowgrams for the evolution of laser-generated plasma, shock
wavefront and hot air core. The original height and width of each frame are 27 mm. The shock
wavefronts are labeled as SW. Courtesy of M. Villagran-Muniz et al. [74]
72 Developments in Surface Contamination and Cleaning

resulting in the initial release of electrons; (ii) the cascade release of electronsinitiates ionization of the gases in the focal region and plasma formation; (iii)absorption of laser energy by the opaque plasma leading to formation of theblast wave; and (iv) blast wave propagation into the surrounding gas. Taylor[77] and von Neumann [78] proposed similarity laws to accurately describethe initial motion and pressure of the blast wave during its propagation when itremains strong. Taylor’s similarity laws were independently derived by Sedov[79].
The key assumptions of the blast wave theory are the following.
1. The explosion results in sudden release of a certain amount of energy (E)concentrated at a point.
2. The pressures and velocities produced in the resultant flow fully dominatethe initial pressure and sound speed of the ambient air with density r0.
The energy E from the explosion and the density r0 of the ambient air are thedimensional parameters that will be utilized to derive the blast wave theoryrelations [77,79].
3.3.2. Blast Wave Theory Relations
Modeled as waves generated by a point explosion, the LIP shockwave isexpected to follow the blast wave theory (BWT). The LIP shockwave radius,velocity, and pressure can be approximated by utilizing the BWT relations.Similarity solutions describe the propagation of blast waves. The change ofshockwave front radius R (see Fig. 3.3) over time is given by eq. (3.1) [77,79]:
RðtÞ ¼ k
�E
r0
�15
t25 (3.1)
Assuming the pressure and thermal field are uniformly distributed withinthe LIP plume, the time-dependent pressure (P) and velocity (u) fields behindthe shock are given by eqs (3.2) and (3.3) [80]:
PðtÞ ¼ 8
25
k2r0gþ 1
�E
r0
�25
t�65 (3.2)
uðtÞ ¼ 4
5
k
gþ 1
�E
r0
�15
t�35 (3.3)
Here R is the shockwave radius, t is the shockwave propagation time, E isthe net released energy, r0 is the density of the ambient air, k is a calibrationconstant, and g is the adiabatic index of air. An experimental comparison ofshockwave propagation (radius of the shockwave as a function of time) wasreported in [81], as depicted in Figure 3.4. The radius of the shockwave wasextracted from the shadowgraphs of the LIP obtained by Villagran-Muniz
73Chapter | 3 Laser Cleaning for Removal of Nano/Micro-Scale Particles

et al. [74], Dors and Parigger [81], and Jiang et al. [82], and was comparedwith the BWT [77]. Further, the arrival time data from experimental LIPtransient pressure measurements at different firing distances was utilized toextract the shockwave propagation [72] for comparison in Figure 3.4. It isevident from Figure 3.4 that the curve obtained in [72] deviates from theBWT approximately after the first 10 microseconds and tends to follow theshadowgraphs in [82]. The shockwave generated typically has a velocity ofapproximately 1000 m/s during the first few microseconds and decays nearlyto 700 m/s at 10 microseconds. Thus, the shockwave generated has a highmomentum which could be used to break the adhesion bond between theparticle and the substrate. Particle removal also depends on the distancebetween the plasma core and the substrate which governs the distance theshockwave front has to propagate (as the shockwave front momentum reduceswith time as it propagates) and the location of the particle from the point ofimpact of the shockwave on the substrate. To minimize the risk of radiationdamage, it is also necessary to avoid direct interaction of the plasma core withthe substrate.
The LIP removal technique is mainly employed to selectively removeparticles that are in the sub-100 nm range since the LIP core can be generated atan arbitrary point above the substrate surface with the help of an optical beamsteering system. The curvature of the shockwave front is at the millimeter scalewhile the particles to be removed are in sub-micrometer to nanometer size
FIGURE 3.3 The incident spherical shockwave of radius R (t) originated and reflected from the
substrate (not to scale). P, T and r are the pressure, temperature and the density, while the indices
1, 2, and 5 correspond to properties of the ambient air, behind the incident shockwave and behind
the reflected shockwave, respectively
74 Developments in Surface Contamination and Cleaning

range. Considering at least three orders of magnitude difference in the size,the effects of curvature of the shockwave can be neglected when the shockwavefront interacts with particles. Thus, it is appropriate to neglect the curvatureeffects of the shockwave and consider the shockwaveeparticle interactiondue to a plane wave impingement. Based on this assumption, the LIP shock-wave loading can be modeled using the one-dimensional relations for normalincident shocks (eqs 3.4 and 3.5). The temperature behind the shock (T2), basedon gas dynamics pressureetemperature relationships [83] of eq. (3.4),
T2T1
¼�gþ1g�1
�þ P2
P1�gþ1g�1
�þ P1
P2
(3.4)
is determined by utilizing the ambient conditions 101.3 kPa for pressure P1 and298 K for temperature T1, and the pressure behind the shock (P2) based on theBWT is calculated from eq. (3.2).
The pressure behind the reflected shockwave (P5) based on normal shockassumption, as shown in Figure 3.3, can thus be described by eq. (3.5):
P5 � P1
P2 � P1¼ 1þ
2gg�1
1þh�
gþ1g�1
��P1
P2
�i!
(3.5)
FIGURE 3.4 Comparison of experimental shock data reported in the literature with the Blast
Wave Theory (BWT). The curve representing LIP experiment represents the arrival time data
extracted from the pressure measurements carried out in the present study. The plot depicts the
expansion of the shockwave radius (r) as a function of a time (t)
75Chapter | 3 Laser Cleaning for Removal of Nano/Micro-Scale Particles

The corresponding temperature behind the reflected shockwave (T5) isobtained from gas dynamic pressureetemperature relationships [80] and isgiven as:
T5T2
¼�gþ1g�1
�þ P5
P2�gþ1g�1
�þ P2
P5
(3.6)
3.3.3. Nanoparticle Detachment with LIP Shockwave
A schematic of the experimental set-up for LIP particle removal is depicted inFigure 3.1a. The shock propagation in air and the reflection of the shock front atthe substrate surface are shown in Figure 3.1b. A proper understanding of theaction of the shock field on a nanoparticle is essential to efficiently utilize theLIP-induced force for effective removal of particles. The particle detachmentand removal can be explained by the following considerations: (i) momentbalance criterion, and (ii) rocking motion of the particle when subjected toa dynamic pressure/force field.
3.3.3.1. Moment Balance Criterion
The detachment force of adhesion (FA) between a spherical particle anda substrate is defined by the Johnson-Kendall-Roberts (JKR) model as:
FA ¼ 3
4pWAD (3.7)
HereWA is the work of adhesion between a spherical particle with diameterDand the substrate [84], assuming that the particle is relatively soft and the force ofadhesion between the particle and substrate is predominantly of van der Waalstype at static equilibrium. The work of adhesion between a PSL particle andsilicon substrate is given asWA ¼ 23:5 mJ=m2. When a pressure field (P) (dueto the shockwave) acting on a nanoparticle is known, the forces exerted on theparticle can be determined (Fig. 3.5) [68]. The shockwave front could initiaterolling and/or sliding of particles if the associated critical pressure magnitudesdue to the shockwave exceed the force of adhesion due to the substrate. As theforce required to roll a particle is less than for sliding and for lifting, assumingthat the particle removal takes place due to rolling mode, simple moment balanceat the point O (Fig. 3.6) provides an approximate relation for critical pressure Pc
required for detachment of a particle in rolling mode:
Pc ¼ 2aðFA þ mgÞAsðDjcos qj � 2a sin qÞ (3.8)
Here As is the effective area normal to the applied LIP pressure, m is themass of the particle, g is the acceleration due to gravity (mg is negligible in sub-micrometer length-scale), and q is the angle between the applied force and the
76 Developments in Surface Contamination and Cleaning

plane parallel to the substrate surface. The contact radius (a) between thespherical particle and the substrate surface is determined by considering elas-ticity as:
a ¼�3pWAD
2
8K
�1=3
(3.9)
where K ¼ 43½ð1�y21ÞE1
þ ð1�y22ÞE2
��1and n1, E1, n2 and E2 are the Poisson’s ratiosand the Young’s moduli of the particle and substrate materials, respectively.
FIGURE 3.5 Elementary particle removal mechanism based on moment balance criterion. a0 in
the figure denotes the contact depth, and r, q and z represent the cylindrical coordinate axes
FIGURE 3.6 Schematic of nanoparticle detachment mechanism based on rocking motion
criterion
77Chapter | 3 Laser Cleaning for Removal of Nano/Micro-Scale Particles

The critical pressure for a 60 nm PSL particle on a silicon substrate is calcu-lated to be approximately 45.35 kPa when q approaches 0 or p.
3.3.3.2. Rocking Motion of Particle Subjected to a Transient Force Field
An alternative approach for determining this critical pressure level for removalunder transient loading conditions is to take rolling resistance and vibrationalmotion of the particle into consideration. According to the rolling resistancemoment theory, due to bond stiffness, rocking motion of the particle could beexcited by a transient pressure field and, consequently, is a potential mechanismfor nanoparticle detachment. When no external moment is exerted on a spher-ical particle, the pressure distribution for a spherical particle on a flat substrate(according to the JKR adhesion model) has to be cylindrically symmetric andhence the moment of resistance in case of symmetric pressure distribution isgiven by:
My ¼ZZ
xpðx; yÞdxdy ¼ 0 (3.10)
Here p(x, y) is the pressure distribution in the contact area [85].Based on the formulation reported in [85], the rolling resistance moment for
a particle with radius r on a flat substrate in static equilibrium as a function ofthe rolling angle x is approximated by:
Myz6pWArx (3.11)
Assuming that the pull-off force for a spherical particle in contact with a flatsurface is given by eq. (3.7) and using the equation of motion of a sphericalparticle in free-rotational oscillation on a flat surface Iq
::þ 6pWAxr ¼ 0;where
xzrq is the shift in contact area due to the asymmetric pressure, the resonancefrequency un of the rocking motion is determined by eq. (3.12) [86]:
un ¼ 1
r3=2
ffiffiffiffiffiffiffiffiffiffiffiffiffi45
4
WA
r
s(3.12)
Here r is the mass density of the particle material.The experimental evidence for the existence of the rolling resistance moment
and rocking motion has been demonstrated and reported in [86e88]. Theschematic of nanoparticle removal mechanism based on rocking motion criterionis depicted in Figure 3.6. From eq. (3.12), it is evidently difficult to remove smallparticles, while the larger particles can be removed relatively easily with smallercritical angles (qcrit). For instance, assuming qcrit ¼ (1 e 5)� 10e9/r, the rollingresistance moment required for a 100 nm PSL particle on a silicon substrate(assumed to be a cylinder with the length equal to its diameter) is given byMcrit¼ 22.1e 110.7 nN-nm forWA¼ 23.5 mJ/m2. The resonance frequencies ofa 100 nm PSL particle on a silicon substrate for axial and rocking motions are
78 Developments in Surface Contamination and Cleaning

determined to be 960 MHz and 227 MHz, respectively [72]. Note that therocking resonance frequency is much lower than the axial frequency.
The pressure field exerted due to the shockwave on a particle is a statisticaldistribution of the gas moleculeeparticle interaction according to the kineticgas theory. For a particle located away from the critical distance, if the fluc-tuations due to the gas moleculeeparticle interactions approach the resonancefrequency of rocking motion of the adhesion bond given by eq. (3.12), theamplitude of rocking motion increases until the magnitude of q reaches qcrit andthe particle detaches.
3.3.4. Gas MoleculeeNanoparticle Interactions
To understand the particle removal mechanism in the LIP technique, a detailedinvestigation of shockwaveenanoparticle interaction is necessary. Due to thecharacteristic length-scale of interactions, such an investigation requiresmolecular level simulation rather than continuum models such as the Navier-Stokes equations. The transition between the molecular and continuum modelsfor the flow is governed by the Knudsen number defined as:
Kn ¼ l=L (3.13)
Here l is the mean free path and L is a characteristic length of the system.A Knudsen number of 0.1 is generally considered the upper limit for thecontinuum approach. The Knudsen number for a 100 nm particle under shockconditions in air is estimated as Kn ¼ 0.323 and the mean free path is l ¼32 nm. The gas moleculeeparticle interaction was simulated using the DirectSimulation Monte Carlo (DSMC) method according to the kinetic theory ofgases, as it is more appropriate in the nanoscale than the Navier-Stokesequations [89]. A computational study using the DSMC has been reported byour group in [70e72]. It was observed in these simulations that whena shockwave front arrives at the particle, the moment exerted on the particleincreases rapidly until it reaches a critical maximum and then it reduces bya fraction of maximum moment, termed as mean-moment. The mean-momentexerted on the particle will be constant, until the entire shockwave passes theparticle. For instance, Figure 3.7a shows the moment exerted on the particle dueto a planar shockwave front obtained from the DS2V software simulations(two-dimensional DSMC) [70]. The maximum and the mean momentsobtained from 2D simulations (i) for a 100 nm particle wereMmax¼ 500 nN-nmandMmean ¼ 393 nN-nm, [72] and (ii) for a 60 nm particle asMmax ¼ 60.5 nN-nm andMmean¼ 41.7 nN-nm [71]. Note that the moment exerted on the particlein 2D simulations is approximately equal to the moment exerted on a cylin-drical particle with a length equal to the diameter of the particle in 3D simu-lations, rather than the regular sphere itself. The critical moments calculated forPSL particles with diameters of 100 nm and 60 nm on a silicon substrate usingthe rolling resistance moment theory are Mcrit ¼ 22.1e110.7 nN-nm and
79Chapter | 3 Laser Cleaning for Removal of Nano/Micro-Scale Particles

FIGURE 3.7 Transient moment exerted on a 100 nm particle due to gas moleculeseparticle
surface interactions excited by the shockwave (a), and close-up of the frequency spectrum (b)
shown in (a). The dot-dash line represents the predicted rocking resonance frequency of 100 nm
PSL particle on a silicon substrate
80 Developments in Surface Contamination and Cleaning

Mcrit ¼ 13.3e66.4 nN-nm. This implies that the 100 nm PSL particles and sub-100 nm particles (60 nm PSL particles) can be more easily removed from thesubstrates by rolling mode of detachment than other methods of detachment.Furthermore, the transient/jitter part (due to the gas molecules in the shockwavefront of the transient moment plot (after 2.5 ns time in Figure 3.7b) for a 100 nmparticle) is extracted and the frequency spectrum of the moment plot isanalyzed for the rocking frequency. From the frequency spectra it has beendeduced that the gas moleculeeparticle interactions would excite theparticleesubstrate bond in the rocking motion mode, indicating that this effectis a possible sub-100 nm particle removal mechanism. At low Kn, according tothis removal mechanism, the gas molecules oscillating in the shockwave frontwould bombard the nanoparticle with a range of frequencies and, if thisfrequency range covers the natural (resonance) rocking frequency of theadhesion bond between the nanoparticle and the substrate, the particle wouldrock until it reaches critical amplitude breaking the adhesion bond dependingupon the thickness of the shockwave. The expected rocking resonancefrequencies for a 100 nm PSL and a 60 nm PSL particle on a silicon substratewere approximated as 227 MHz [72] and 488 MHz [71], respectively. Theexpected rocking frequency for 100 nm PSL particle is represented inFigure 3.7b as a dot-dash line. Thus, from the rolling mode and the rockingmotion of particle, a zone for particle removal limits can be determined fora given firing distance d, i.e. the distance from the center of the plasma core tothe substrate surface. A summary of the values of the particle rolling momentand the particle removal zone based on the location of the particle from thearrival of the shockwave front is reported in [70]. Thus, the critical rollingmoment and the rocking frequency due to the transient pressure field wereidentified as the two possible mechanisms responsible for particle removal inthe LIP technique.
3.3.5. LIP Nanoparticle Removal Experiments
Several experiments have been performed to investigate the damage-free particleremoval capability of the LIP technique [25,31,69]. The laser typically employedin these experiments was an Nd:YAG pulsed laser with fundamental wavelengthof 1064nm, repetition rate of 10Hz, pulsewidth of 5 ns, a beamdiameter of 5mm,and a pulse energy of 370 mJ. Commercially available lasers have variable pulseenergies and pulse widths and the selection of the laser depends on the type ofapplication, particles, and the substrate that has to be cleaned. A convex lens of100 mm focal length with an antireflective coating was used to converge the laserbeam and this could be varied from smaller to larger focal lengths, up to a lengthbeyond which optical aberrations might play a role in convergence of the beam toform plasma. The substrates used for the experiments were bare 125 mm, n-typedoped [111] silicon wafers with approximately 1 mm thick thermal oxide layersand a bare quartz photomask substrate. Figure 3.8 shows the pre- and the post-scanimages acquired using a surface analysis system (SAS) on a 152 mmwafer when
81Chapter | 3 Laser Cleaning for Removal of Nano/Micro-Scale Particles

the center of thewafer was cleaned. In Figure 3.8b the cleaned area is indicated bya square. The silicon substrates (Figs 3.9e3.14) were cut into small samples ofapproximately 1.5 cm� 1.5 cm area due to scanning electron microscopy (SEM)constraints. The samplewafer was washed with DI water andmethanol to removethe initial contamination. In order to locate the test site on the sample during SEM
FIGURE 3.8 Surface analyzer system (SAS) analysis of the silicon substrate. (a) Before LIP
exposure with the 8 � 8 mm cleaning grid in the inset and (b) after LIP exposure. The white square
in (b) indicates the cleaning area grid
82 Developments in Surface Contamination and Cleaning

FIGURE 3.9 SEM images of ceria CMP slurry particles deposited on a silicon wafer. (a), (b) at
6000�, (c), (d), (e) and (f) at 3000� and (g), (h), (i) and (j) at 1000� magnification are pairs of
images before and after LIP exposure. Approximate size of some of the individual particles is
identified on all the before images. The dash-dot lines indicate the boundaries of the markers and
the cleaning area
83Chapter | 3 Laser Cleaning for Removal of Nano/Micro-Scale Particles

FIGURE 3.9 (continued)
84 Developments in Surface Contamination and Cleaning

FIGURE 3.9 (continued)
85Chapter | 3 Laser Cleaning for Removal of Nano/Micro-Scale Particles

imaging, a diamond-shaped reference mark with an approximate area of 2 mm2
was engraved on the sample. To remove the residual particles from the sample dueto thismarking, the samplewas subjected to the LIP particle removal technique byfiring five shots at a firing distance of d ¼ 1.4 mm. The firing distance is the gapbetween the center of the plasma and the substrate.
The particles in the experiments were ceria CMP slurry particles witha size range of 30e400 nm (Fig. 3.9), 60 nm PSL particles (Figs 3.10 and3.11), 10e40 nm PSL particles (Figs 3.12 and 3.13), and 60 nm goldparticles (Fig. 3.14). The particles on the photomask were unknown(Fig. 3.15). The ceria and PSL particle suspensions were diluted in methanolin order to acquire good distribution of the particles in the resultantsuspension, and then the resultant suspension was excited to preventagglomeration of the particles. The drop-agitation technique was employedto deposit the particle suspension on the sample. This process ensureduniform distribution of the particles, avoiding agglomeration. The goldparticles were deposited on the silicon sample by adding 1 wt% HF and KAu(CN)2. After the silicon native oxide dissolves in HF, galvanic deposition ofAu occurs with simultaneous Au(CN)2e reduction and silicon oxidation anddissolution, forming SiF6
2e. The surface of the wafer sample was analyzed ina JEOL scanning electron microscope (SEM) and before LIP images of themarked area were acquired. The sample was then mounted on a micrometer-controlled x�y�z stage. The firing distance was controlled by the z-axis.This firing distance was set to d ¼1.4 mm to achieve good particle removalwithout substrate damage. The sample was adjusted in the x�y directionssuch that the plasma was formed directly above the marked area and theadjustment was made with the aid of a diode laser. The pulsed laser wastriggered for LIP removal and ten shots were fired. The sample was againanalyzed using SEM to obtain after LIP images. The before and after imageswere compared to determine the particle removal efficiency (Figs 3.9e3.15).
FIGURE 3.9 (continued)
86 Developments in Surface Contamination and Cleaning

FIGURE 3.10 Before LIP exposure (a) and after LIP exposure (b) SEM images at 5000�magnification. PSL particles with 60 nm diameter are identified in the before and after images. The
dashed lines indicate the boundaries between the cleaning zones and location markings
87Chapter | 3 Laser Cleaning for Removal of Nano/Micro-Scale Particles

FIGURE 3.11 SEM images at 5000� magnification before LIP cleaning (a, c) and after LIP
cleaning (b, d) of 60 nm PSL particles at another location. The dashed lines indicate the boundaries
between the cleaning zones and location markings. Removal of large agglomerates is illustrated
88 Developments in Surface Contamination and Cleaning

FIGURE 3.11 (continued)
89Chapter | 3 Laser Cleaning for Removal of Nano/Micro-Scale Particles

It was observed that if the firing distance was too small, the plasma corewould interact directly with the substrate surface and damage the substrate.This damage could be attributed to the thermal field generated in the plasmarather than the mechanical field generated by the shockwave. It should benoted that the photomask sample was a 152 � 152 mm square sample andthe scan of the mask was obtained before and after application of LIP ata firing distance of 2 mm.
FIGURE 3.12 SEM images of the test area pre-LIP (a) and post-LIP (b) cleaning at the marked
location (dotted line) at 30 000� magnification.
90 Developments in Surface Contamination and Cleaning

The SEM images of the substrate before and after application of LIP atdifferent locations with 30e400 nm (at 6000� magnification) ceria particles,60 nm PSL particles (at 5000� magnification), 10e40 nm PSL particles (at30 000� magnification), 60 nm gold particles (at 10 000� magnification) and
FIGURE 3.13 SEM images of the test area pre-LIP (a) and post-LIP (b) cleaning PSL particles
with 10e40 nm diameter at the marked location (dotted line) at 30 000� magnification. (c) and (d)
are the higher-magnification images of the test area shown in images (a) and (b), respectively
91Chapter | 3 Laser Cleaning for Removal of Nano/Micro-Scale Particles

FIGURE 3.13 (continued)
92 Developments in Surface Contamination and Cleaning

FIGURE 3.15 Pre-LIP (a) and post-LIP (b) cleaning images of a bare photomask substrate. The
line in (b) indicates an added surface particle after the pre-scan
FIGURE 3.14 SEM images of pre-LIP (a) and post-LIP (b) exposure of the test area with gold
particles of 60 nm diameter at the marked location (dashed line) at 10 000� magnification
93Chapter | 3 Laser Cleaning for Removal of Nano/Micro-Scale Particles

unknown particles on the photomasks are shown in Figures 3.9 (Ceria onSilicon), 3.10, 3.11, 3.12 and 3.13 (PSL on Silicon), 3.14 (Au particles onSilicon) and 3.15 (unknown particles on photomask), respectively. These SEMimages clearly indicate that the majority of the particles in the pre-scan imageshave been removed in the after LIP images. The particle removal results aresummarized in Table 3.3.
3.3.6. Optimization of LIP Process Parameters
The LIP technique has potential for damage-free nanoparticle removal fromsemiconductor substrates as demonstrated from the references cited above. Aspredicted in the DSMC simulations [71,72], the moment exerted on a 60 nmparticle is lower by approximately a factor of 8.2 when compared to that ofa 100nmparticle. This reduction is due to the fact that the available surface area ofthe particle is substantially less. Thus, for removal of particles smaller than 60 nm,the LIP technique has to be optimized for maximizing the transient pressure, thedistance which the shockwave has to travel after it is detached from the plasmaand before it interacts with the substrate has to be decreased, and the pulse energyof the laser has to be reduced to avoid larger plasma cores yet obtain the sameshock pressure. The main factors that influence the damage threshold of thesubstrate are yield strength of the material, reflectivity of the material for broadwavelength of irradiation exhibited by the plasma core (especially for photo-mask), and the thickness of the nanofilm for each layer (for anEUVLmask) on thesubstrate since mismatch of thermal coefficients would result in thermo-mechanical damage. Thus, the three parameters to be optimized in theLIPprocessare: (i) the firing distance; (ii) the pulse energy; and (iii) the number of laser shotsto be triggered based on the substrate fromwhich the particles have to be removed.
3.3.6.1. Transient Pressure Measurements
In order to determine the transient pressure available for particle removal due tothe interaction of the shockwave at different firing distances, accurate transient
TABLE 3.3 Summary of LIP Particle Removal Experiments
Substrate Particle Size Range
Firing
Distance
Number
of Pulses
Figure
Numbers
Silicon Ceria Slurry 30e400 nm 1.4 10 3.9
Silicon PSL Spheres 60 nm 1.4 10 3.10, 3.11
Silicon PSL Spheres 10e40 nm 1.4 12 3.12, 3.13
Silicon Gold 60 nm 1.4 10 3.14
Quartz Unknown 50e150 nm 2 10 3.15
94 Developments in Surface Contamination and Cleaning
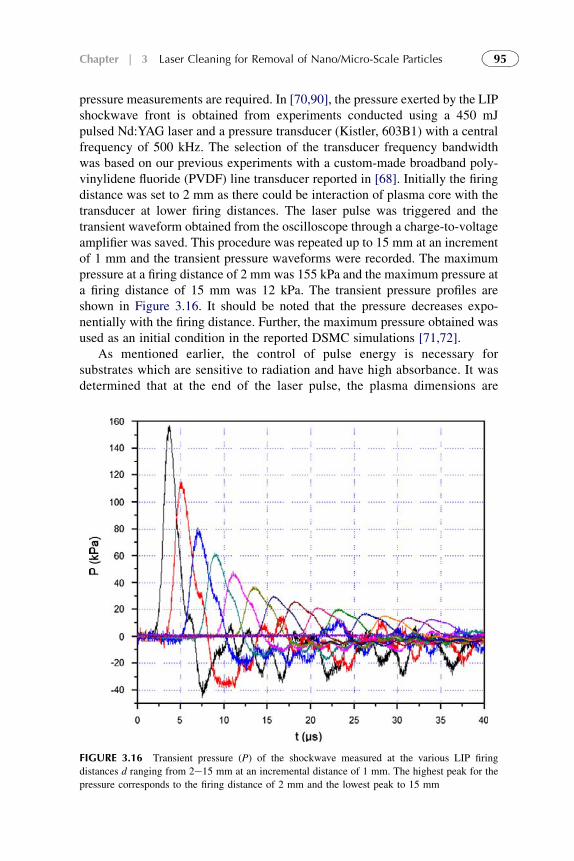
pressure measurements are required. In [70,90], the pressure exerted by the LIPshockwave front is obtained from experiments conducted using a 450 mJpulsed Nd:YAG laser and a pressure transducer (Kistler, 603B1) with a centralfrequency of 500 kHz. The selection of the transducer frequency bandwidthwas based on our previous experiments with a custom-made broadband poly-vinylidene fluoride (PVDF) line transducer reported in [68]. Initially the firingdistance was set to 2 mm as there could be interaction of plasma core with thetransducer at lower firing distances. The laser pulse was triggered and thetransient waveform obtained from the oscilloscope through a charge-to-voltageamplifier was saved. This procedure was repeated up to 15 mm at an incrementof 1 mm and the transient pressure waveforms were recorded. The maximumpressure at a firing distance of 2 mm was 155 kPa and the maximum pressure ata firing distance of 15 mm was 12 kPa. The transient pressure profiles areshown in Figure 3.16. It should be noted that the pressure decreases expo-nentially with the firing distance. Further, the maximum pressure obtained wasused as an initial condition in the reported DSMC simulations [71,72].
As mentioned earlier, the control of pulse energy is necessary forsubstrates which are sensitive to radiation and have high absorbance. It wasdetermined that at the end of the laser pulse, the plasma dimensions are
FIGURE 3.16 Transient pressure (P) of the shockwave measured at the various LIP firing
distances d ranging from 2e15 mm at an incremental distance of 1 mm. The highest peak for the
pressure corresponds to the firing distance of 2 mm and the lowest peak to 15 mm
95Chapter | 3 Laser Cleaning for Removal of Nano/Micro-Scale Particles

proportional to the fifth root of the deposited energy [73]. Laser energy canbe attenuated either by electrical power supplied to the laser unit or by anoptical method. The attenuator used in the reported experiments wasa commercially available high-energy optical attenuator. The experimentalset-up for LIP attenuation is shown in the Figure 3.17. The attenuator can beset at various dial values which results in certain level of energy attenuation,and hence can be calibrated to get specific laser energies. A medium-powervolume absorber power/energy meter (used in [91]) was utilized formeasuring the single shot laser pulse energy during the experiments. Themedium power meter has a spectral bandwidth that ranges from 190 nm to3 mm except in the range 625e900 nm. An attenuator setting of zero impliesthat there is no attenuation and the laser energy recorded on the display unitof the power meter was 315 mJ (specification on the laser was 370 mJ), assome energy was lost in the spectral hole of the power meter (625e900 nm).Measurements at various attenuator settings were recorded and are reported inTable 3.4 and in Figure 3.18. The percent reduction in laser pulse energy isalso plotted in Figure 3.19 and reported in Table 3.5. Based on these atten-uator experiments, the required energy levels can be obtained. For example, ifthere is some damage caused by LIP application at a specific firing distance(d), then the attenuator can be utilized to reduce the laser pulse energy withoutchanging d. Thus, the laser pulse energy could be reduced by attenuation andcould be optimized for the substrate that is to be cleaned.
FIGURE 3.17 Photograph (top) and instrumentation diagram (bottom) of the experimental set-
up for the laser attenuation experiments
96 Developments in Surface Contamination and Cleaning

TABLE 3.4 Maximum and Average Single-Shot Laser Pulse Energies at
Certain Attenuations
Attenuator Dial Value
Single-Shot Laser Energy (mJ)
Average Maximum
12.00 296 301
12.25 296 299
12.50 286 290
12.75 281 283
13.00 269 272
13.25 255 267
13.50 232 234
13.75 205 212
14.00 178 182
14.25 140 143
14.50 101 107
14.75 60 63
250
300 Average Maximum
150
200
100Sing
le S
hot E
nerg
y (m
J)
12.0 12.5 13.0 13.5 14.0 14.5 15.0
50
Attenuator Dial Value
FIGURE 3.18 Maximum and average single shot laser pulse energies at certain attenuations
97Chapter | 3 Laser Cleaning for Removal of Nano/Micro-Scale Particles

80
70
90
50
60
20
30
40
% R
educ
tion
in E
nerg
y
0
10
Attenuator Dial Value12.0 12.5 13.0 13.5 14.0 14.5 15.0
FIGURE 3.19 Percent reduction in maximum laser pulse energies obtained for different atten-
uator settings
TABLE 3.5 Maximum Single-Shot Laser Pulse Energies and Corresponding
Percent Reduction in Pulse Energies as Obtained for Different Attenuator
Settings
Attenuator
Dial Value
Single-Shot Laser
Energy Maximum (mJ)
Percent
Reduction
in Energy
0.00 315 0.0
12.00 301 4.4
12.50 290 7.9
13.00 272 13.6
13.50 234 25.7
14.00 182 42.2
14.25 143 54.6
14.50 107 66.0
14.75 63 80.0
98 Developments in Surface Contamination and Cleaning

3.3.7. Thermomechanical Analysis of LIP
For any cleaning application, the highest achievable particle removal efficiencyis required while assuring no damage to the sample being cleaned. Sampleswith different material compositions would have varied damage thresholds,thereby requiring different process conditions. The possible damage effectwhich LIP application could inflict has been systematically studied for Cr filmson quartz substrates by experiments and computationally on (i) a photomask e100 nm Cr film on a low CTE (coefficient of thermal expansion) quartzsubstrate; (ii) an EUVL mask e 2.5 nm Ru film on 105 nm Mo/Si multi-layers(MLs) (modeled as a substrate with average material properties of Mo and Si);and (iii) an EUVL mask e 2.5 nm Ru film on 280 nm Mo/Si MLs (modeled asa substrate with average material properties of Mo and Si) [90]. In the LIPapplication, it has been identified that the two key interdependent and criticalprocess parameters include the firing distance (d) and the laser pulse energy (E)available for nanoparticle removal. These two parameters govern the initiationand form of damage on a substrate. If d and/or E are above their criticalthresholds, substrate damage could occur. Yet the optimum values for d and Ewould still vary, depending on the damage threshold of the sample beingsubjected to LIP. Provided there is no direct contact of the LIP core with thesample surface (nanofilms/substrate surface in the case of lithography masks)the two possible sources of damage are the thermomechanical loading from theLIP shockwaves due to gas convection heating, and the thermoelastic radiationintensity heating from the plasma core. The timescale for radiation heating is innanoseconds, while that for LIP shockwaves is in microseconds, resulting inlaser radiation heating effects appearing earlier than those due to the LIPshockwaves on the sample surface [90e93].
The removal of smaller particles would require higher pressure levelsattainable either at a lower d for constant E, or with higher E. It is desirable toincrease the available pressure without damage risk and determine thethresholds for LIP particle removal. The pressure (P) and temperature (T) fieldsgenerated on the substrate [90e93], obtained from LIP at low firing distances d,are to be mitigated to ensure damage-free particle removal in the sub-100 nmrange. An estimation of the transient temperature [91] experienced by thelithography masks due to LIP is thus needed to predict damage risk.
For practical implementation of the LIP technique, a design space (a set ofvalues for the optimized parameters) for damage-free nanoparticle removalneeds to be determined. Transient LIP shockwave pressure measurements wereconducted utilizing a piezoelectric transducer (Fig. 3.1b) to characterize thetransient pressure field of an LIP shockwave front as reported in [94]. Opti-mized parameters for 60 nm PSL particle removal on silicon wafers weredetermined to be the firing distance of d ¼ 1.4 mm and ten laser pulses for theNd:YAG pulsed-laser with the pulse energy of 370 mJ at the wavelength of1064 nm [25]. Silicon wafer is a bulk material and crystalline in nature and is
99Chapter | 3 Laser Cleaning for Removal of Nano/Micro-Scale Particles

mechanically stronger than the delicate nanofilms like Cr and Ru deposited onEUVL masks and photomasks. These nanofilms are generally weakly bondedto the substrates and have much larger surface area to volume ratio. Siliconwafers should, therefore, be expected to be less susceptible to material alter-ation and/or damage due to thermomechanical loading compared to lithographymasks for given process conditions [93].
3.3.7.1. LIP Shockwave Loading of Prototype Lithography Masks
In [90e93] a set of transient waveforms was acquired to characterize theshockwave front for its pressure, while its temperature was approximatedutilizing gas dynamics relations. Detailed computational investigations[90e93] have been conducted to determine the dynamic responses experiencedby different prototypes due to LIP shockwave thermomechanical loading: (i)a photomask e 100 nm Cr film on a low CTE quartz substrate; (ii) an EUVLmask e 2.5 nm Ru film on 105 nm Mo/Si MLs (modeled as a substrate withaverage material properties of Mo and Si); and (iii) an EUVL mask e 2.5 nmRu film on 280 nm Mo/Si MLs (modeled as a substrate with average materialproperties of Mo and Si). The effects of the shockwave pressure alone(mechanical loading) and shockwave temperature alone (thermal loading) wereobtained. It was observed that the radial, circumferential, and shear stresses arelargely due to thermal expansion (shockwave temperature) of the film, whileaxial stresses were generated by the mechanical loading (shockwave pressure)for all the three cases considered.
The radial stress (srr), axial stress (szz), and shear stress (srz) componentsinduced by the application of only the LIP shockwave thermomechanical loadingwere determined for each case: (i) for the prototype photomaske649 MPa,195 kPa, and 172 kPa, respectively; (ii) for the prototype EUVL mask (105 nmMo/Si) e 2.25 GPa, 305 kPa, and 20 MPa; respectively; and (iii) for theprototype EUVL mask (280 nmMo/Si) e 595.7 MPa, 1.08 MPa, and 5.13 MPa,respectively [90,94]. The chief observation from the reported studies was that thetemperature rise on the film was of no damage concern due to melting, yet theradial stress field induced in the film by this thermal field is apparently highenough to be considered as a potential source of damage. Further, it was observedthat the radial and circumferential transient stress amplitudes were significantlyhigher than the (static) yield strengths of the film materials in each case.
For a static loading case, the obtained stress levels would easily result indamage; however, the dynamic strength of materials is known to be strain rate-dependent and thereby a great deal higher than their static counterparts, eventhough such relations are currently not readily available even for many practicalmaterials. The dynamic yield strength for LIP application on chromium is,however, estimated to be higher than the static yield strength at least by a factorof 2 [94]. The shear stresses calculated at the interface were not of concern formaterial alteration for the photomask, i.e. no delamination due to interfacialshear was predicted, and the axial stress at the interface was low (comparable to
100 Developments in Surface Contamination and Cleaning

shockwave-front pressure) for the structure/model under consideration. For theEUVL mask, on the other hand, the radial and shear stress components weremuch higher, implying increased damage risk. Gas heating and pressureloading of the substrate due to LIP shockwaves, generated utilizing this pulsedlaser, on a photomask or an EUVL mask, at a firing distance of d ¼ 2 mm fora high strain rate gain factor ofw4 is not expected to be of concern for damageto the substrate [90].
3.3.7.2. LIP Radiation Intensity Loading of Prototype Lithography Masks
Radiation energy (Erad) measurements are required. Such data help approximatethe magnitude of the radiation intensity required as load for conductingcomputational studies to determine transient thermoelastic responses ofsubstrates. The thermoelastic responses for prototype lithography masksubstrates were reported in [91e93]. It was found that for damage concerns, theradial stress component srr was the most critical stress component on the filmsurface for both the thermomechanical LIP shockwave excitation as well as theLIP radiation exposure. The damage threshold for LIP application on theprototype lithography mask (a 100 nm Cr film on a quartz substrate) wasassumed to be at the firing distance of d ¼ 2.5 mm (as slight damage wasdetected at d ¼ 2 mm, but not at dcr ¼ 2.5 mm) based on experimental obser-vations. It was observed that the Cr film surface responses (i.e. temperature riseand stress levels) due to laser radiation intensity level heating dominated thethermomechanical load due to the LIP shockwaves. Therefore, the correspond-ing radial stress component srr of the Cr film at very short firing distances(d< dcr) is critical for damage concern. For the Cr film, the actual dynamic yieldstress is approximated to be at least four times the material yield stress sy forbulk Cr (362 MPa) due to the high strain rate experienced in the LIP radiationexcitation. If the radial stress component srr exceeds the actual dynamic yieldstress of Cr film and/or the surface temperature rise leads to melting, thenmaterial alteration/damage of the Cr film would occur. For 0% and 20%reflectivity of the Cr film, the dynamic yield stresses were required to be at least5.32 sy and 4.25 sy, respectively, to prevent inception of material alteration/damage. At the experimental damage threshold firing distance of dcr ¼ 2.5 mm,the damage limit for maximum radial stress component amplitude is srr,max ¼1.93 GPa for no reflectivity of the Cr film, whereas it is 1.54 GPa for the case of20% reflectivity. A safe firing distance of d ¼ 3.6 mm (as slight damage wasdetected at d ¼ 3.55 mm, but none at dcr ¼ 3.6 mm) was obtained, based onexperimental observations for LIP application on an EUVL mask with a 2.5 nmRu film on 105 nm Mo/Si MLs on a quartz substrate. Radial stress (srr) and thesurface temperature rise (DT) of the Ru film due to laser radiation intensity(wnine times the intensity due to LIP shockwave thermomechanical load) atvery small firing distances (d < dcr) are sources of LIP damage concern.Therefore, if the surface temperature rise leads to melting and/or the radial stress(srr) exceeds the actual yield stress (dynamic) of Ru film material alteration/
101Chapter | 3 Laser Cleaning for Removal of Nano/Micro-Scale Particles

damage of the Ru film would occur. The damage limit for radial stress amplitude(srr) is 21 GPa for no reflectivity case of the Ru film at the critical firing distanceof 3.6 mm (dcr). Thermal loading leading to material mechanical failure isdetermined to be of damage concern for nanofilms. Reflectivity would decreasethe film surface responses of the film. The temperature profiles obtained due toboth LIP shockwave and radiation heating are lower than the melting points of Cr(photomask) and Ru (EUVL mask) nanofilms, and hence melting is nota potential damage mode in this particular case. It is concluded that the level ofradial stress alone is of damage concern. As a potential solution for minimizingdamage risk on these nanofilms on lithography masks, introducing residual radialtension in the film is suggested as a means to extend the damage threshold of theCr and Ru films on photomasks and EUVL masks, respectively. Sincecompressive stresses are applied due to LIP excitation, this radial stress wouldlower the resultant stresses that will be experienced on the nanofilms, as a result,increasing the damage-free process window [90,93].
3.3.8. Onset of Material Alterations on Lithography Masks DuringLIP Exposure
For any cleaning application, the ideal requirement is complete particle removal,with no new adders and no damage to the sample. Depending on the industrialapplication, different samples would have varied structures and features (e.g.trenches) that are very delicate, thus having diverse damage thresholds. It isnoteworthy that, as with many semiconductor manufacturing applications, fordamage-free lithography mask cleaning, the determination of the onset ofmaterial alterations and/or damage of the nanofilms deposited on lithographymasks is critical, rather than the extent of damage. In [90e93], experiments wereconducted to investigate the onset of material alterations in nanofilms onlithography masks (EUVL masks and photomasks) due to LIP exposure. Ther-momechanical loading from LIP shockwaves, i.e. the combination of the thermal(shockwave temperature) and the mechanical (shockwave pressure) effects, aswell as the thermal loading due to the laser radiation intensity (I0) heating fromthe LIP core, were considered for material alteration studies on the nanofilms andare described in Section 3.3.7, and reported in [90e93]. The critical firingdistance dcr, i.e. the minimum safe LIP firing distance beyond which there will beno material alterations, needs to be identified for a given laser pulse energy. Thiscritical firing distance would be different depending on the damage thresholds ofvarious samples. Damage and/or material alterations would occur if the nano-films are not able to sustain the induced film surface stresses and temperature risedue to the combination of radiation heating and LIP shockwave loading duringLIP application on the samples. If the firing distance d < dcr for the specificsample, then the load experienced by the nanofilm on the EUVL masks and/orphotomasks would result in either film surface temperature higher than themelting point or induced stresses larger than the yield and/or rupture stress,
102 Developments in Surface Contamination and Cleaning

resulting in material alterations such as melting, cracking, channeling, peeling,film stripping, and discoloration [90e93]. Investigation of the onset of materialalterations on EUVL masks and photomasks due to LIP exposure, and deter-mining experimental damage thresholds for estimating safe firing distances fordamage-free nanoparticle removal were reported previously [90e93]. Possiblematerial alterations that occur due to LIP application on these masks weredetermined in order to prevent onset of the least of these material alterations, andthus ensure damage-free removal. LIP was demonstrated as a damage-free sub-100 nm particle removal technique for EUVL masks and photomasks. Thedamage threshold for LIP application on a photomask with a 100 nm Cr film ona quartz substrate was assumed to be at the firing distance of d ¼ 2.5 mm basedon experimental observations. Extreme cases of intentional material alterations,such as surface cracks, channeling, peeling, film stripping, melting and discol-oration, are observed in the optical microscope (Fig. 3.20) and scanning electronmicroscope (SEM) images (Figs 3.21aed) on the photomask when deliberatelysubjected to 2 minutes of continuous LIP exposure (~1200 shots) at a firingdistance of d ~ 0 mm (plasma hitting the film surface) [74]. Surface cracks andchanneling are the first experimentally observed material alteration modes on theCr nanofilm (when d< dcr) at a firing distance of d¼ 2 mm, as seen in the opticalmicroscope images in Figure 3.22. The minimum size of PSL particle (softparticle) that can be removed from the Cr film, utilizing LIP at the safe firingdistance of d ¼ 2.5 mm with the 138 kPa available shockwave pressure, ispredicted as 46 nm, based on the JKR model for rolling detachment of sphericalparticles from a flat substrate [92]. The safe firing distance of d¼ 3.6 mm, basedon experimental observations for LIP application on EUVLmask with 2.5 nmRufilm on 105 nm ofMo/Si MLs on a quartz substrate, was obtained as described inSection 3.3.7. The PSL particle size of 59 nm is the smallest particle that can beremoved with LIP at the safe firing distance of d¼ 3.6 mm from the Ru film withthe 93.46 kPa available shockwave pressure (based on the JKR model for rollingdetachment of spherical particles from a flat substrate). The predicted order(increasing d or decreasing level of excitation) of material alterations in EUVLmasks due to LIP exposure was found to be material melting, film/MLs stripping,cracks, peeling and discoloration (smallest material alteration). The level ofcracking in photomasks is observed to be substantially higher than in EUVLmasks [90].
As reported in [90], EUVL masks are determined to be weaker (larger dcr ¼3.6 mm) compared to the photomasks (dcr ¼ 2.5 mm) for onset of materialalterations due to LIP exposure, therefore greater caution is required for LIPapplication on EUVL masks during nanoparticle removal.
3.4. Advanced LIP Cleaning Technique
In [90] it has been identified that there is a threshold for the smallest-sizedparticle that can be removed in a damage-free manner utilizing the LIP
103Chapter | 3 Laser Cleaning for Removal of Nano/Micro-Scale Particles

technique in air from lithography masks. If particles smaller than this limitneed to be removed, some LIP pressure amplification technique is required,since more pressure needs to be applied to break the adhesion bond forsmaller-sized particles. If LIP is utilized in air at a firing distance d < dcr,material alteration/damage would occur due to radiation heating and LIPshockwaves, resulting in either surface temperatures greater than the meltingpoint and/or induced stresses exceeding the dynamic yield stress ofthe material under consideration. The removal of 60 nm [31] as well as10e40 nm [25] PSL particles from silicon substrates has been successfullydemonstrated utilizing the LIP removal technique in air. The instrumentation
FIGURE 3.20 Optical microscope images at 100� magnification depicting extreme cases of
material alterations (surface cracks, channeling, discoloration, peeling, film stripping) of 100 nm
Cr film on a quartz substrate intentionally created at LIP firing distance of d w 0 mm (plasma in
contact with nanofilm surface) [92]
104 Developments in Surface Contamination and Cleaning

diagram for the pressure measurement set-up for LIP in air is depicted inFigure 3.23a. The maximum pressure obtained from LIP in air for a 370 mJ,1064 nm Q-switched Nd:YAG pulsed laser was 156 kPa at a firing distanced¼ 2 mm. Damage was reported to occur on 100 nm Cr film on a quartzsubstrate at a firing distance d¼ 2 mm [92]. From the analyses of theradiation heating and LIP thermomechanical shockwave loading (Section3.3.7), it is found that the induced film surface radial stress and temperaturerise are critical for damage concerns. Radiation heating from the plasma coreis determined to be the more serious LIP damage source as the film surfaceresponses dominate those due to LIP shockwave loading. As reported in[90], various pressure amplification techniques, such as LIP in a pressurizedchamber, shock tubes in air, wet-LIP, and submerged shock tubes, have beeninvestigated. Pressure calibration of LIP at a firing distance of d abovea pressure transducer on a prototype lithography mask is shown inFigure 3.23b.
FIGURE 3.21 Scanning electron microscope (SEM) images at (a) 500� (b) 1000�, (c) and (d)
5000� magnifications depicting extreme cases of intentional LIP generated material alterations
(surface cracks, peeling, film stripping, melting and channeling) of 100 nm Cr film on a quartz
substrate at firing distance of d w 0 mm (plasma in contact with nanofilm surface) [92]
105Chapter | 3 Laser Cleaning for Removal of Nano/Micro-Scale Particles

3.4.1. LIP in Pressurized Chambers
As demonstrated and analyzed in [90], the shockwave pressure can be increasedby increasing the chamber pressure. LIP was created in a pressurized chamber atvarious ambient static pressure levels to determine its effect on the LIP pressureobtained because pressure amplification was predicted. The experimental set-upfor LIP pressure measurements used in [90] is shown in Figure 3.24. Thecomponents of the experimental set-up include a pressure chamber built ofPlexiglas (inner diameter of 25.4 mm, outer diameter of 37.9 mm, and chamberlength of 63.5 mm), a 25.4 mm diameter and 50 mm focal length plano-convexlens, high-energy laser wedgedwindows specific to the 1064 nmpulsed laser withdiameter of 25.4 mm and thickness of 6.1 mm, a tank that can sustain up to 0.56MPa pressure (along with a pressure gauge), a regulator to keep constant pressureinside the chamber (also with a pressure gauge), a Kistler transient pressuretransducer, a charge amplifier, and a digitizing oscilloscope. The LIP peak pres-sures obtained utilizing the pressure transducer for various levels of additionalchamber pressures (dP¼ 0e0.4MPa) are depicted in Figure 3.25 and reported inTable 3.6 [90]. The LIP transient pressure waveforms recorded by the pressuretransducer are shown in Figure 3.26, for the different pressure levels that wereadded to the pressurized chamber. The inset in Figure 3.26 shows the zoomed-inimages of the peaks of the different waveforms. It is observed from Table 3.6 as
FIGURE 3.22 Optical microscope image at 50� magnification depicting slight material alter-
ations (surface cracks and channeling) of 100 nm Cr film on a quartz substrate at LIP firing
distance of d ¼ 2 mm for a single laser shot [92]
106 Developments in Surface Contamination and Cleaning

well as Figures 3.25 and 3.26 that the LIP pressure increases with increase inpressure supplied in the chamber. The LIP pressure obtained almost doubled onadding the initial 0.56 MPa pressure, but further increase in pressure resulted inonly small increases in LIP pressure, which can be attributed to the cracking of thelaser window due to laser exposure during the experiments. Thus, LIP pressure isobserved to increase with added pressure in the chamber, with peak pressure of217 kPa, and could be used for nanoparticle removal.
3.4.2. In-Air Shock Tubes
Another method for amplifying shockwave pressure is to use confining cavitystructures, called shock tubes [95e97], to limit the propagation directions of
FIGURE 3.23 (a) Instrumentation diagram for LIP measurement in air, and (b) transient pressure
calibration recorded by an embedded pressure transducer on a prototype lithography mask by
forming LIP at a firing distance d. SMIF is the acronym for standard mechanical interface
107Chapter | 3 Laser Cleaning for Removal of Nano/Micro-Scale Particles

pressure waves, and hence increase dynamic pressure in the direction ofpropagation. It was observed that LIP resulted in a peak pressure of 156 kPa inair, and by adding 0.4 MPa of air pressure, while utilizing a pressure chamber,up to 217 kPa was obtained [90]. For obtaining even higher pressures someother pressure amplification technique is required. Further, it will be an addedadvantage if higher pressures can be achieved at larger firing distances in orderto prevent the thermal effects due to radiation heating from the plasma core,determined as a crucial LIP damage source (Section 3.3.7), that could result inmaterial alterations while removing still smaller particles. Therefore, a novelmethod for the amplification of the pressure (P) obtained from the shockwavesat farther distance from the LIP was introduced in [95]. This amplification canbe achieved by constraining the volume and direction available for theexpansion of the LIP by focusing the laser beam inside a cylindrical shock tube[95]. Shock tubes can also be utilized to reduce the laser pulse energy (E) whileobtaining the same pressure levels, thereby resulting in reduced temperatures
FIGURE 3.24 Experimental set-up for LIP creation in a pressure chamber. The photograph
above shows the experimental set-up and the schematic shows the pressure chamber arrangement
108 Developments in Surface Contamination and Cleaning

(T) on the surface and less damage concern. The instrumentation diagram forshock tubes in air is depicted in Figure 3.27a. The objective is to experimentallyoptimize a shock tube for its two-fold potential to either amplify the pressurefield (for better particle removal) or mitigate the temperature (T) experiencedon the surface (to reduce material alteration/damage concern). As the distancefrom the LIP core to the substrate (firing distance d) decreases, the thermalloading on the substrate increases. A pressure decrease of an order of magni-tude per 5 mm is observed for LIP shockwaves in air. Higher pressures atdistances significantly farther from the core of LIP are obtained with the shocktube technique. Shock tube effectiveness is quantified by its pressure
FIGURE 3.25 Peak LIP pressures in the pressure chamber for different added pressure levels
TABLE 3.6 LIP Pressures in Pressure Chamber for Added Pressures in
Chamber
Added Pressures in Chamber (kPa) LIP Pressure from Transducer (kPa)
0 91
101.33 168
202.65 187
303.98 193
405.30 217
109Chapter | 3 Laser Cleaning for Removal of Nano/Micro-Scale Particles

amplification factor. A pressure amplification factor of 11 was obtained at thefiring distance d¼ 10 mm since the shock tube generated a transient pressure of523 kPa, while in air the LIP transient pressure was 47.5 kPa [95].
3.4.3. Wet-LIP Cleaning
The generation and utilization of LIP in liquids (i.e. wet-LIP cleaning) [96] isanother pressure amplification technique, in which LIP is created inside a liquidmedium (e.g. water) in an immersion tank, resulting in higher pressure levelsfrom the shockwaves compared to pressure levels obtained in air, due mainly tothe higher density of water (a factor of ~775 [96]). Another advantage in wet-LIP is that the thermal effects of the LIP become mitigated to an extent becauseof heat loss to water. Furthermore, LIP is formed as a long streak (compared tothe elliptical plume in air) in water medium, thus the applied thermal load at thetarget is restricted, and only the mechanical effect of the shockwave is utilized.The threshold irradiance for laser-induced breakdown for 1064 nm laser in purewater for a 5 ns pulse is approximately 70 GW/cm2 [98]. The instrumentationdiagram for wet-LIP is shown in Figure 3.27b. A pressure amplification factorof 5 was observed, from 110 kPa to 550 kPa, when the LIP was created in wateras opposed to air, at the same firing distance d¼ 4 mm. A peak pressure of 1030kPa was obtained by wet-LIP at a firing distance d ¼ 0.5 mm. As reported in[96], wet-LIP is a potential pressure amplification technique and gives higherpressures (1030 kPa) than shock tubes in air (523 kPa).
FIGURE 3.26 LIP transient pressures obtained in the pressure chamber for different added
pressure levels
110 Developments in Surface Contamination and Cleaning

FIGURE 3.27 Instrumentation diagrams for (a) LIP utilizing a shock tube in air; (b) wet-LIP;
and (c) submerged shock tube (in water)
111Chapter | 3 Laser Cleaning for Removal of Nano/Micro-Scale Particles

3.4.4. Submerged Shock Tubes
Underwater LIP transient pressure amplification utilizing shock tubes(submerged shock tubes) to assist non-contact particle removal was investi-gated in [96,97]. This amplification approach could also reduce radiationexposure of the substrate, which was identified as the leading cause of LIPdamage during nanoparticle removal (Section 3.3.7). The instrumentationdiagram used in [90] for submerged shock tubes (in water) is shown inFigure 3.27c. With the aid of a submerged shock tube the maximum pressureamplitude of 6.48 MPa is observed, demonstrating significant LIP shockwavefront pressure amplification and, as a result, particles with smaller sizes and/orstronger adhesion bonds can be removed. It is predicted that with wet-LIP onecould remove particles down to 10 nm size, while with submerged shock tubes,removal of PSL particles much smaller than 10 nm from a silicon substrate istheoretically possible. Thus, these LIP pressure amplification techniques havethe potential to be utilized for damage-free particle removal from substratessuch as patterned silicon wafers, EUVL masks, and photomasks [95]. Theexperimental LIP pressures obtained at various firing distances (d) utilizing LIPin air, shock tubes in air, wet-LIP, and submerged shock tubes in water areshown in Figure 3.28. It is observed that maximum LIP pressure amplificationis obtained with submerged shock tubes, the best being submerged shock tube 3with transient pressure of 6.48 MPa.
FIGURE 3.27 (continued)
112 Developments in Surface Contamination and Cleaning

4. FUTURE DIRECTIONS IN LASER PARTICLEREMOVAL RESEARCH
The utility and capability of the laser-based LIP technique have been studiedand demonstrated by removing various sub-100 nm particles from siliconsubstrates [25,31,69]. Selective removal of nanoparticles is a key attribute ofthis laser technique. Due to the potential portability, it is also being consideredfor developing as an ‘in-tool’ technique for EUVL tools. As discussed in thischapter, it is a fast, dry and non-contact technique in which damage risk can bereduced. This technique has critical advantages when (i) material loss isa concern and high particle removal efficiency is desired; (ii) local and preci-sion cleaning of small and surface particles in crucial processes is desired; (iii)applications involve chemically sensitive features; (iv) photomask cleaning isdesired as the chemical residue/haze would change the optical properties of thesubstrate; and (v) hydrophobic substrates are used. The typical applications inthe industry include, but are not limited to, post-copper CMP cleaning, post-deposition cleaning, and cleaning steps that include exposed metal and that aresusceptible to chemical attack.
The capability of this technique for removing nanoparticles from patternedstructures is yet to be investigated and demonstrated. The potential complica-tions in the application of LIP to surfaces with delicate features stem from twosources: (i) in general, the mechanical strength of features on a substrate isweaker than that of the substrate materials, and (ii) features can amplify theoptical, thermal, and mechanical effects on the substrate, thus leading toincreased substrate damage risk. For example, it is known that the thermo-mechanical damage could result in damage of high-aspect ratio structures in
FIGURE 3.28 LIP pressures available at various firing distances d in air, for shock tubes in air,
wet-LIP in water, and for submerged shock tubes in water
113Chapter | 3 Laser Cleaning for Removal of Nano/Micro-Scale Particles

which heat transfer is enhanced due to increased surface area. However, theadvanced LIP techniques could be used to mitigate the damage concerns bycareful selection of the method and tuning the process based on the sensitivityof the structure. This design space needs to be further explored for specificnanoparticle removal applications.
Combination of techniques to improve particle removal efficiency, whilebeing able to minimize damage concern, is one of the logical next steps in thisarea of research. For example, irradiation with an ultraviolet (UV) laser prior tolaser (Nd:YAG) shockwave cleaning was observed to increase the particleremoval efficiency over 95%, while it was 50% with UV laser alone and lessthan 25% with laser shockwave cleaning alone, when attempted on organicPSL particles on Si capping layer of an EUVL mask [62]. In [99], an integratedlaser-based wet cleaning tool, which utilizes the physical forces from lasershockwave cleaning to enhance the cleaning chemistries, has been utilized toshow effective particle removal down to 30 nm from EUVL blanks.
It is also possible to combine localized cleaning by the LIP method with fullsubstrate cleaning using another technique, such as cryogenic cleaning. Sucha combined approach would still offer a completely dry cleaning technique andhence could be utilized in applications where conventional wet cleaningmethods cannot be used.
It is evident that further research in the field is required to fully utilize lasercleaning techniques for future technology challenges in several fields. Certainaspects of LIP are still not well understood, especially at the nano-second timescale. Further research is needed in radiation heating, pressure waves,nanoparticleegas molecule interactions at the nano-scale, laser stability, andthe control of LIP cores to better define the design space of the LIP method foradvanced special cleaning applications. Additional research is also needed inthe areas of the plasma coreesubstrate interactions and the effects of near-fieldradiation for optimizing the advanced LIP techniques for sub-100 nm particleremoval. As the feature sizes in semiconductor manufacturing decrease further,it is reasonable to predict that the needs for such applications will also becomemore apparent.
5. CONCLUSIONS AND REMARKS
In selective nanoparticle removal, dry, chemical-free cleaning techniques havean edge over conventional wet cleaning techniques in many aspects: (i) whenmaterial loss is a concern and high particle removal efficiency is desired; (ii)local and precision cleaning of surface and small (sub-micrometer and nano)particles in crucial processes is desired; (iii) applications involve chemicallysensitive features; and (iv) photomask cleaning because the chemical residue/haze would alter the optical properties of the substrate.
This chapter has presented a comprehensive summary of recent progress inlaser-based cleaning techniques. In the laser techniques, a laser beam with short
114 Developments in Surface Contamination and Cleaning

pulse duration is used as a source of energy for nanoparticle detachment. InDLC the pulsed laser beam is directed on the substrate. The irradiation resultsin acceleration of the substrate due to the thermomechanical expansion andwave propagation. The main reported shortcoming of the DLC technique is theprobability of substrate damage for nanoparticle removal. The computationalwork in the literature indicates that when silicon particles smaller than 600 nmare removed from a silicon substrate, and when silicon particles smaller than630 nm are removed from a copper substrate using DLC, it would result inthermal and mechanical damages. Liquid-based laser cleaning techniques havealso been developed in order to enhance the laser cleaning efficiency and toreduce the substrate damage risk for nanoparticles. Some of the effects includethe ablation of the liquid film, explosive boiling of the liquid film and utilizationof the higher density of the liquid film (e.g. density of water is three orders ofmagnitude higher than that of air). In addition, an extensive summary of the LIPtechnique is provided. One of the key improvements in the LIP technique overDLC is that direct contact of the laser beam or plasma core with the substratedirectly is avoided. The propagation and decay of the shockwave pressure andthermal fields and the plasma core are illustrated with the aid of shadowgraphsfrom the literature. The expansion/propagation of the shockwave after itdetaches from plasma core is described based on the blast wave theory (BWT).It is also shown from the transient pressure experiments that the shockwavepropagation in the LIP technique deviates from the BWT after the first 10microseconds of the process.
The particle removal mechanisms developed, namely, critical moment androcking motion of particle based on simple moment balance and a two-dimensional adhesion theory (the stresses in both x and y direction areconsidered in obtaining this formulation), were also described [100]. Further,the use of molecular dynamics simulations based on DSMCwere discussed andsome key results are presented to shed light on the shockwaveenanoparticleinteractions. The necessity for molecular level simulations based on kinetictheory of gases rather than simulations based on continuum equations formodeling shockwaveenanoparticle interaction is explained based ona Knudsen number argument. If the moment exerted on the nanoparticle isgreater than the rolling resistance moment, it would result in straining ofthe adhesion bond and, consequently, removal of the particle. The removalof the nanoparticles which did not attain the critical moment due to the locationof the particle away from the impact of the shockwave on the substrate, butstill would be removed as a result of the gas moleculeenanoparticle interac-tions, was explained based on the rocking frequency criterion. According to thiscriterion, it is possible that the individual gas molecules would oscillate andbombard the nanoparticle with a certain frequency band and, if this frequencycovers the rocking resonance frequency of the adhesion bond of the parti-cleesubstrate system, the particle would rock and result in removal after theadhesion bond is ruptured. The capability of the LIP technique has been
115Chapter | 3 Laser Cleaning for Removal of Nano/Micro-Scale Particles

demonstrated by the particle removal experiments from substrates. Removal of30e400 nm ceria CMP slurry particles, 10e60 nm PSL particles, and 60 nmgold particles from silicon substrates is demonstrated. The removal of unknownparticles from blank photomask is also reported. One of the key advantages ofthe LIP technique is the selective removal of nanoparticles from substrate ratherthan targeting the surface of the entire substrate. The SEM images published inthe literature clearly indicate that 10e60 nm PSL particles can be removedeffectively with this non-contact, dry and fast technique without any substratedamage. Thus, the potential of an efficient sub-100 nm particle removal tech-nique, which is essential in the semiconductor industry and for nanotechnologyapplications, is demonstrated with LIP.
Optimization of the main LIP process parameters, laser energy and firingdistance, is also discussed in the literature. To assess damage risk, thermal-mechanical analyses have been conducted for LIP shockwave loading and forLIP radiation intensity loading. It was concluded that gas heating and pressureloading of the substrate due to LIP shockwaves, on a photomask and an EUVLmask, generated utilizing the pulsed laser at a firing distance of d ¼ 2 mm fora high strain rate gain factor ofw4, may not be of concern for surface damage.The damage threshold for LIP application on the prototype lithography mask,a 100 nm Cr film on a quartz substrate, was assumed to be at the firing distanceof d ¼ 2.5 mm (as slight damage was detected at d ¼ 2 mm, but not atdcr ¼ 2.5 mm) based on experimental observations. The timescale for radiationheating is in nanoseconds while it is in microseconds for LIP shockwaves,resulting in laser radiation heating effects showing up earlier than those due tothe LIP shockwaves on the sample surface. It was observed that the nanofilmsurface responses (temperature rise and stresses) due to laser radiation intensitylevel heating dominated the thermomechanical load due to the LIP shockwaves.For a photomask with 100 nm Cr film on quartz, at the experimental damagethreshold firing distance of dcr ¼ 2.5 mm, the damage limit for maximum radialstress component amplitude is srr,max ¼ 1.93 GPa for no reflectivity ofthe nanofilm, whereas it is 1.54 GPa for 20% reflectivity. A safe firing distanceof d ¼ 3.6 mm (slight damage was detected at d ¼ 3.55 mm, but not atdcr ¼ 3.6 mm), based on experimental observations for LIP application on anEUVL mask with a 2.5 nm Ru film on 105 nmMo/Si MLs on a quartz substrate,was obtained. Radial stress (srr) and the surface temperature rise (DT) of the Rufilm due to laser radiation intensity (w9 times that due to LIP shockwavethermomechanical load) at very small firing distances (d < dcr) are sources forLIP damage concern. If the surface temperature rise leads to melting and/or theradial stress (srr) exceeds the actual yield stress (dynamic) of Ru film material,alteration/damage of the Ru film would occur.
It is reported that determination of the onset of material alterations and/ordamage of the nanofilms deposited on lithography masks, rather than the extentof damage, is critical to ensure damage-free lithography mask cleaning.Surface cracks and channeling are the first experimentally observed material
116 Developments in Surface Contamination and Cleaning

alteration modes on the Cr nanofilm at a firing distance of d ¼ 2 mm. Thepredicted order (increasing d or decreasing level of excitation) of materialalterations in EUVL masks due to LIP exposure is melting, film/MLs stripping,cracks, peeling and discoloration (smallest material alteration). The level ofcracking in photomasks is observed to be much higher than that for EUVLmasks. In summary, EUVL masks are determined to be weaker (largerdcr ¼ 3.6 mm) compared to the photomasks (dcr ¼ 2.5 mm) for onset ofmaterial alterations due to LIP exposure, therefore more caution is required forLIP application on EUVL masks during nanoparticle removal.
A set of advanced LIP techniques, namely shock tubes in air, wet-LIP andsubmerged shock tubes, are discussed for removal of sub-100 nm particleswithout damage concern. Some future research directions for laser-basednanoparticle cleaning are also identified and discussed.
ACKNOWLEDGMENTS
Funds from the National Science Foundation, Intel, International SEMATECH, Praxair
Electronics, NYSERDA, NYSTAR, CAMP, and Clarkson University are acknowledged. The
authors would also like to thank our previous colleagues from the Photo-Acoustic Research
Laboratory, L. Chen, R. Vanderwood, T. Hooper, J. Wu, J. Lin, V.K. Devarapalli, T. Dunbar,
D. Zhou, A.J. Kadaksham, B. Maynard and D.A. Thomas, for their valuable contributions in
better understanding and maturing the LIP technology.
REFERENCES
[1] A.L. Schawlow, C.H. Townes, Infrared and Optical Masers, Phys. Rev. 112 (1940)
(1958).
[2] A. Javan, Possibility of Production of Negative Temperature in Gas Discharges, Phys. Rev.
Lett. 3 (1959) 87.
[3] J.H. Sanders, Optical Maser Design, Phys. Rev. Lett. 3 (86) (1959).
[4] T.H. Maiman, Optical and Microwave-Optical Experiments in Ruby, Phys. Rev. Lett. 4
(564) (1960).
[5] T.H. Maiman, Stimulated Optical Radiation in Ruby, Nature 187 (493) (1960).
[6] H. Kogelnik, T. Li, Laser Beams and Resonators, Appl. Opt. 5 (1550) (1966).
[7] The International Technology Roadmap for Semiconductors (ITRS) 2009 Edition,
SEMATECH International, San Jose, CA (2009).
[8] K.L. Mittal (Ed.), Particles on Surfaces: Detection, Adhesion and Removal, Vol. 8, VSP,
Utrecht, The Netherlands, 2003.
[9] K.L. Mittal (Ed.), Particles on Surfaces: Detection, Adhesion and Removal, Vol. 9, VSP,
Brill, Leiden, The Netherlands, 2006.
[10] A.A. Busnaina, H. Lin, N. Moumen, J.W. Feng, J. Taylor, Particle Adhesion and Removal
Mechanisms in Post-CMP Cleaning Processes, IEEE Trans. Semicond. Manuf. 15 (374)
(2002).
[11] K. Xu, R. Vos, G. Vereecke, G. Doumen, W. Fyen, P.W. Mertens, et al., Fundamental
Study of the Removal Mechanisms of Nano-Sized Particles Using Brush Scrubber Cleaning,
J. Vac. Sci. Technol. B 23 (2160) (2005).
117Chapter | 3 Laser Cleaning for Removal of Nano/Micro-Scale Particles

[12] K. Xu, R. Vos, G. Vereecke, G. Doumen, W. Fyen, P.W. Mertens, et al., Particle Adhesion
and Removal Mechanisms During Brush Scrubber Cleaning, J. Vac. Sci. Technol. B 22
(2844) (2004).
[13] N.A. Lammers, A. Bleeker, Laser Shockwave Cleaning of EUV Reticles, Proc. SPIE
Volume 6730 (67304P) (2007).
[14] M. Olim, A Theoretical Evaluation of Megasonic Cleaning for Submicron Particles,
J. Electrochem. Soc. 144 (3657) (1997).
[15] G. Vereecke, F. Holsteyns, S. Arnauts, S. Beckx, P. Jaenen, K. Kenis, et al., Evaluation of
Megasonic Cleaning for Sub-90nm Technologies, Solid State Phenomena 103e104 (141)
(2005).
[16] W. Kern, Overview and Evolution of Silicon Wafer Cleaning Technology, in:
K.A. Reinhardt, W. Kern (Eds.), Handbook of Silicon Wafer Cleaning Technology,
second ed., William Andrew Publishing, Norwich, NY, 2007. Ch. 1.
[17] C. Bowers, I. Varghese, M. Balooch, J. Rodriguez, Advances in CO2 Cryogenic Aerosol
Technology for Photomask Post AFM Repair, in: Proc. SPIE, Volume 7488 (74881R) (2009).
[18] C. Bowers, I. Varghese, M. Balooch, W. Brandt, Advances in Post AFM Repair Cleaning of
Photomask with CO2 Cryogenic Aerosol Technology, Proc. SPIE Volume 7379 (73791I)
(2009).
[19] C. Toscano, G. Ahmadi, Particle Removal Mechanisms in Cryogenic Surface Cleaning,
J. Adhesion 79 (175) (2003).
[20] J.M. Lauerhaas, C. Morote, J. Ple, Cryogenic Aerosol for Zero-Damage Cleaning, Semi-
cond. Intl. 28 (36) (2005).
[21] S. Wolf, R.N. Tauber, Silicon Processing for the VLSI Era. Volume 1: Process Technology,
second ed., Lattice Press, Sunset Beach, California, USA, 1999.
[22] J.W. Butterbaugh, C.K. Gould, Wafer Cleaning Techniques for Meeting the Challenges of
Advanced Semiconductor Manufacturing, Semiconductor Manuf. 7 (33) (2006).
[23] P.W. Mertens, E. Parton, Sub-100 nm Technologies Drive Single-Wafer Wet Cleaning, Solid
State Technol. 45 (51) (2002).
[24] H. Aoki, S. Yamasaki, N. Aoto, Cleaning for Deep-Submicron Structures, Electrochem.
Soc. Proc. 99 (102) (1999).
[25] I. Varghese, C. Cetinkaya, Non-contact Removal of 60-nm Latex Particles from Silicon
Wafers with Laser-Induced Plasma, J. Adhesion Sci. Technol. 18 (795) (2004).
[26] B.S. Luk’yanchuk, W.D. Song, Z.B. Wang, M.H. Hong, T.C. Chong, J. Graf, et al., New
Methods for Laser Cleaning of Nanoparticles, in: C.R. Phipps (Ed.), Laser Ablation and its
Applications, Springer, New York, NY, 2007. Ch. 3.
[27] W.D. Song, M.H. Hong, B.S. Luk’yanchuk, T.C. Chong, Laser-Induced Cavitation Bubbles
for Cleaning of Solid Surfaces, J. Appl. Phys. 95 (2952) (2004).
[28] W.D. Song, M.H. Hong, B.S. Luk’yanchuk, A Method and Apparatus for Cleaning Surfaces,
U.S. Patent 6,777,642 B2 (2004).
[29] J. Graf, B.S. Luk’yanchuk, M. Mosbacher, M.H. Hong, T.C. Chong, P. Leiderer, Optimi-
zation of the Energy Transfer Medium in Laser Cleaning: A New Strategy, Abstracts of 4th
International Workshop on Laser Cleaning, Sydney, Australia, 2004.
[30] B.S. Luk’yanchuk, Z.B.Wang, Y. Zhou,M.H. Hong,W.D. Song, T.C. Chong, Particle on Surface:
AboutPossibleAcoustic andPlasmonicsEffects inDryLaserCleaning, in:D.M.Kane (Ed.),Laser
Cleaning II, World Scientific, Singapore, 2006, pp. 81e117.
[31] M.D. Murthy Peri, V.K. Devarapalli, C. Cetinkaya, Selective Removal of 10-40-nm Particles
from Silicon Wafers Using Laser-Induced Plasma Shockwaves, J. Adhesion Sci. Technol. 21
(331) (2007).
118 Developments in Surface Contamination and Cleaning

[32] M. Soltani, G. Ahmadi, Particle Removal Mechanisms under Substrate Acceleration,
J. Adhesion 44 (161) (1994).
[33] W. Zapka, W. Ziemlich, A.C. Tam, Efficient Pulsed Laser Removal of 0.2 mm Sized
Particles from a Solid Surface, Appl. Phys. Lett. 58 (2217) (1991).
[34] K. Imen, J. Lee, S.D. Allen, Laser-Assisted Micron Scale Particle Removal, Appl. Phys.
Lett. 58 (203) (1991).
[35] A.C. Tam, W.P. Leung, W. Zapka, W. Ziemlich, Laser-Cleaning Techniques for Removal of
Surface Particles, J. Appl. Phys. 71 (3515) (1992).
[36] X. Wu, Excimer Laser-Induced Removal of Particles from Silicon Surfaces, Ph.D. Disser-
tation, University of Montreal, Montreal, Canada, 1999.
[37] D.R. Halfpenny, D.M. Kane, A Quantitative Analysis of Single Pulse Ultraviolet Dry Laser
Cleaning, J. Appl. Phys. 86 (6641) (1999).
[38] C. Cetinkaya, J. Lin, R. Vanderwood, C. Li, Nanoparticle Removal with a Pulsed Laser:
Thermoelastic Transient Surface Acceleration Simulations for Analyzing Edge Effects,
J. Adhesion Sci. Technol. 16 (1979) (2002).
[39] D. Grojo, M. Boyomo-Onana, A. Cros, Ph. Delaporte, Influence of Laser Pulse Shape on
Dry Laser Cleaning, Appl. Surf. Sci. 252 (4786) (2006).
[40] G. Vereecke, E. Rohr, M.M. Heyns, Laser-Assisted Removal of Particles on Silicon Wafers,
J. Appl. Phys. 85 (3837) (1999).
[41] P. Leiderer, J. Boneberg, V. Dobler, M. Mosbacher, H.-J. Munzer, N. Chaoui, et al., Laser-
Induced Particle Removal from Silicon Wafers, Proc. SPIE Volume 4065 (249) (2000).
[42] G. Schrems, M. Delamare, N. Arnold, P. Leiderer, D. Bauerle, Influence of Storage Time on
Laser Cleaning of SiO2 on Si, Appl. Phys. A 76 (847) (2003).
[43] Y.W. Zheng, B.S. Luk’yanchuk, Y.F. Lu, W.D. Song, Z.H. Mai, Dry Laser Cleaning of
Particles from Solid Substrates: Experiments and Theory, J. Appl. Phys. 90 (2135)
(2001).
[44] D.J. Hwang, N. Misra, C.P. Grigoropoulos, A.M. Minor, S.S. Mao, Situ Monitoring of Laser
Cleaning by Coupling a Pulsed Laser Beam with a Scanning Electron Microscope, Appl.
Phys. A 91 (219) (2008).
[45] C. Cetinkaya, C. Wu, C. Li, Laser-Based Transient Surface Acceleration of Thermoelastic
Layers, J. Sound Vib 231 (195) (2000).
[46] J. Lin, C. Cetinkaya, Potential Thermo-Mechanical Substrate Damage in Nanoparticle
Removal with Pulsed Lasers, J. Adhesion Sci. Technol. 17 (91) (2003).
[47] E.Y. Assendel’ft, V.I. Beklemyshev, I.I. Makhonin, Yu. N. Petrov, A.M. Prokhorov,
V.I. Pustovoy, Optoacoustic Effect on the Desorption of Microscopic Particles from a Solid
Surface into a Liquid, Sov. Tech. Phys. Lett. 14 (444) (1988).
[48] Yu. N. Petrov, Laser Cleaning of Semiconductor Surface, Proc. SPIE Volume 1352 (266)
(1990).
[49] W. Zapka, A.C. Tam, G. Ayers, W. Ziemlich, Liquid Film Enhanced Laser Cleaning,
Microelectron. Eng. 17 (473) (1992).
[50] M. Mosbacher, V. Dobler, J. Boneberg, P. Leiderer, Optical Field Enhancement Effects in
Laser-Assisted Particle Removal, Appl. Phys. A 72 (41) (2001).
[51] P. Leiderer, M. Mosbacher, V. Dobler, A. Schilling, O. Yavas, B.S. Luk’yanchuk, et al.,
Steam Laser Cleaning of Silicon Surfaces: Laser-Induced Gas Bubble Nucleation and
Efficiency Measurements, in: B.S. Luk’yanchuk (Ed.), Laser Cleaning, World Scientific,
Singapore, 2002, pp. 255e310. Ch. 6.
[52] W. Zapka, The Road to Steam Laser Cleaning, in: B.S. Luk’yanchuk (Ed.), Laser Cleaning,
World Scientific, Singapore, 2002, pp. 23e48. Ch. 1.
119Chapter | 3 Laser Cleaning for Removal of Nano/Micro-Scale Particles

[53] F. Lang, S. Georgiou, P. Leiderer, Phase Transition Dynamics Measurements in Superheated
Liquids by Monitoring the Ejection of Nanometer-Thick Films, Appl. Phys. Lett. 85 (2759)
(2004).
[54] F. Lang, M. Mosbacher, P. Leiderer, Near Field Induced Defects and Influence of the Liquid
Layer Thickness in Steam Laser Cleaning of Silicon Wafers, Appl. Phys. A 77 (117) (2003).
[55] V.K. Devarapalli, M.D. Murthy Peri, C. Cetinkaya, Particle Removal with Liquid-Film-
Enhanced Laser-Induced Plasma, J. Adhesion Sci. Technol. 20 (233) (2006).
[56] J.M. Lee, K.G. Watkins, W.M. Steen, Angular Laser Cleaning for Effective Removal of
Particles from a Solid Surface, Appl. Phys. A 71 (671) (2000).
[57] J.M. Lee, C. Curran, K.G. Watkins, Laser Removal of Copper Particles from Silicon Wafers
Using UV, Visible and IR Radiation, Appl. Phys. A 73 (219) (2001).
[58] J.M. Lee, K.G. Watkins, Removal of Small Particles on Silicon Wafer by Laser-Induced
Airborne Plasma Shock Waves, J. Appl. Phys. 89 (6496) (2001).
[59] J.M. Lee, K.G. Watkins, W.M. Steen, Surface Cleaning of Silicon Wafer by Laser Sparking,
J. Laser Applic. 13 (154) (2001).
[60] S.H. Lee, J.G. Park, J.M. Lee, S.H. Cho, H.K. Cho, Si Wafer Surface Cleaning Using Laser-
Induced Shock Wave: A New Dry Cleaning Methodology, Surf. Coat. Technol. 169e170
(178) (2003).
[61] H. Lim, D. Kim, Optical Diagnostics for Particle-Cleaning Process Utilizing Laser-Induced
Shockwave, Appl. Phys. A 79 (965) (2004).
[62] S. Lee, Y. Kang, J. Park, A.A. Busnaina, J. Lee, T. Kim, et al., Laser Shock Removal of
Nanoparticles from Si Capping Layer of Extreme Ultraviolet Lithography Masks, Jpn.
J. Appl. Phys. 44 (5560) (2005).
[63] B. Oh, J.W. Lee, J.M. Lee, D. Kim, Numerical Simulation of Laser Shock Cleaning Process
for Micro-Scale Particle Removal, J. Adhesion Sci. Technol. 22 (635) (2008).
[64] D. Jang, J. Lee, J.M. Lee, D. Kim, Visualization of Particle Trajectories in the Laser Shock
Cleaning Process, J. Appl. Phys. 93 (147) (2008).
[65] P. Zhang, B. Bian, Z. Li, Particle Saltation Removal in Laser-Induced Plasma Shockwave
Cleaning, Appl. Surf. Sci. 254 (1444) (2007).
[66] I. Varghese, M.D. Murthy Peri, T.J. Dunbar, B. Maynard, D.A. Thomas, C. Cetinkaya,
Removal of Nanoparticles with Laser Induced Plasma, J. Adhesion Sci. Technol. 22 (651)
(2008).
[67] C. Cetinkaya, T.R. Hooper, Efficiency Studies of Particle Removal with Pulsed-Laser
Induced Plasma, J. Adhesion Sci. Technol. 17 (751) (2003).
[68] C. Cetinkaya, M.D. Murthy Peri, Non-Contact Nanoparticle Removal with Laser Induced
Plasma Pulses, Nanotechnology 15 (435) (2004).
[69] V.K. Devarapalli, Y. Li, C. Cetinkaya, Post-Chemical Mechanical Polishing Cleaning of
Silicon Wafers with Laser-Induced Plasma, J. Adhesion Sci. Technol. 18 (779) (2004).
[70] D. Zhou, A.T.J. Kadaksham, M.D. Murthy Peri, I. Varghese, C. Cetinkaya, Nanoparticle
Detachment Using Shockwaves, Proc. Inst. Mech. Engr., Part N: J. Nanoeng. Nanosystems
219 (91) (2005).
[71] D. Zhou, C. Cetinkaya, Molecular-Level Mechanisms of Nanoparticle Detachment in Laser-
Induced Plasma Shockwaves, Appl. Phys. Lett. 88 (173109) (2006).
[72] M.D. Murthy Peri, I. Varghese, D. Zhou, A. John, C. Li, C. Cetinkaya, Nanoparticle Removal
Using Laser-Induced Plasma Shockwaves, Particulate Sci. Technol. 25 (91) (2007).
[73] F. Ferioli, Experimental Characterization of Laser-Induced Plasmas and Application to Gas
Composition Measurements, Ph.D. Dissertation, University of Maryland, College Park, MD,
2005.
120 Developments in Surface Contamination and Cleaning

[74] M. Villagran-Muniz, H. Sobral, E. Camps, Shadowgraphy and Interferometry Using a CW
Laser and a CCD of a Laser-Induced Plasma in Atmospheric Air, IEEE Trans. Plasma Sci.
29 (613) (2001).
[75] P.D. Maker, R.W. Terhune, C.M. Savage, Optical Third Harmonic Generation, in: P. Grivet,
N. Bloembergen (Eds.), Proc. 3rd Intl. Conf. Quantum Electronics, Columbia University
Press, New York, NY, 1964, p. 1559.
[76] H. Yan, R. Adelgren, M. Boguzko, G. Elliots, D. Knight, Laser Energy Deposition in
Quiescent Air, AIAA J 41 (1988) (2003).
[77] G.I. Taylor, The Formation of a Blast Wave by a Very Intense Explosion: I. Theoretical
Discussion, Proc. Royal Soc. London A 201 (159) (1950).
[78] J. von Neumann, Collected Works of J. von Neumann. Volume VI, Pergamon Press, New
York, NY, 1963.
[79] L.I. Sedov, Similarity and Dimensional Methods in Mechanics, Academic Press, New York,
NY, 1959.
[80] G.B. Whitham, Linear and Nonlinear Waves, John Wiley and Sons, New York, NY, 1974.
[81] I.G. Dors, C.G. Parigger, Computational Fluid-Dynamic Model of Laser-Induced Break-
down in Air, Appl. Opt. 42 (5978) (2003).
[82] Z. Jiang, K. Takayama, K.P.B. Moosad, O. Onodera, M. Sun, Numerical and Experimental
Study of a Micro-Blast Wave Generated by Pulsed-Laser Beam Focusing, Shock Waves 8
(337) (1998).
[83] J.D. Anderson, Modern Compressible Flow with Historical Perspective, second ed.,
McGraw-Hill, New York, NY, 1990.
[84] K.L. Johnson, K. Kendall, A.D. Roberts, Surface Energy and the Contact of Elastic Solids,
Proc. Royal Soc. London 324 (301) (1971).
[85] C. Dominik, A.G.G.M. Tielens, Resistance to Rolling in the Adhesive Contact of Two
Elastic Spheres, Phil. Mag. A. 72 (783) (1995).
[86] M.D. Murthy Peri, C. Cetinkaya, Rolling Resistance Moment of Microspheres on Surfaces,
Phil. Mag. 85 (1347) (2005).
[87] W. Ding, A.J. Howard, M.D. Murthy Peri, C. Cetinkaya, Rolling Resistance Moment of
Microspheres on Surfaces: Contact Measurements, Phil. Mag. 87 (5685) (2007).
[88] W. Ding, H. Zhang, C. Cetinkaya, Rolling Resistance Moment-Based Adhesion Charac-
terization of Microspheres, J. Adhesion 84 (996) (2008).
[89] G.A. Bird, Molecular Gas Dynamics and the Direct Simulation of Gas Flows, Oxford
University Press, Oxford, U.K., 1994.
[90] I. Varghese, Onset of Material Alterations and Damage-free Nanoparticle Removal Utilizing
Laser Induced Plasma for Nanofilms on Lithography Photomasks, Ph.D. Dissertation,
Clarkson University, Potsdam, NY, 2008.
[91] M.D. Murthy Peri, D. Zhou, I. Varghese, C. Cetinkaya, Transient Thermoelastic Response
of Nanofilms Under Radiation Heating From Pulsed Laser-Induced Plasma, IEEE Trans.
Semicond. Manuf. 21 (116) (2008).
[92] I. Varghese, D. Zhou, M.D. Murthy Peri, C. Cetinkaya, Onset of Material Alterations Due to
Laser-Induced Plasma Exposure in Nanofilms Deposited on Photomasks, IEEE Trans.
Semicond. Manuf. 22 (579) (2009).
[93] I. Varghese, C. Cetinkaya, Laser Induced Plasma Exposure on Extreme Ultra-Violet
Lithography Masks, to be published in IEEE Trans. Semicond, Manuf (2010).
[94] I. Varghese, D. Zhou, M.D. Murthy Peri, C. Cetinkaya, Thermal Loading of Laser Induced
Plasma Shockwaves on Thin Films in Nanoparticle Removal, J. Appl. Phys. 101 (113106)
(2007).
121Chapter | 3 Laser Cleaning for Removal of Nano/Micro-Scale Particles

[95] T.J. Dunbar, B. Maynard, D.A. Thomas, M.D. Murthy Peri, I. Varghese, C. Cetinkaya,
Pressure Amplification of Laser Induced Plasma Shockwaves with Shock Tubes for
Nanoparticle Removal, J. Adhesion Sci. Technol. 21 (67) (2007).
[96] T.J. Dunbar, M.D. Murthy Peri, I. Varghese, C. Cetinkaya, Submerged Laser-Induced
Plasma Amplification of Shockwaves Using Shock Tubes for Nanoparticle Removal,
J. Adhesion Sci. Technol. 21 (1425) (2007).
[97] T.J. Dunbar, C. Cetinkaya, Underwater Pressure Amplification of Laser-Induced Plasma
Shock Waves for Particle Removal Applications, Appl. Phys. Lett. 91 (051912) (2007).
[98] J. Noack, A. Vogel, Laser-Induced Plasma Formation in Water at Nanosecond to Femto-
second Time Scales: Calculation of Thresholds, Absorption Coefficients, and Energy
Density, IEEE J. of Quantum Electronics 35 (1156) (1999).
[99] A. Johnkadaksham, A. Rastegar, Nanoparticle Removal from EUV Mask Blanks Using Wet
and Dry Laser Shock Cleaning, Proc. SPIE Photomask Technology 7122 (2008)
7122e7181.
[100] M.D. Murthy Peri, Nanoparticle Removal Using Laser Induced Plasma (LIP) Technique and
Study of Detachment Modes Based on Molecular Dynamics Simulations, Ph.D. Disserta-
tion, Clarkson University, Potsdam, New York, 2008.
122 Developments in Surface Contamination and Cleaning

Chapter 4
Non-Aqueous Interior SurfaceCleaning Using Projectiles
Rajiv Kohli,The Aerospace Corporation, NASA Johnson Space Center, 2525 Bay Area Blvd, Suite 600,
Houston, TX 77058, USA
Chapter Outline1. Introduction 123
2. Types of Contamination 124
3. Effects of Contamination 125
4. Fluid Cleanliness Levels 126
5. Tube Cleaning Methods 132
6. Non-Aqueous Projectile
Cleaning Method
134
7. Summary 143
Disclaimer 143
References 144
1. INTRODUCTION
Contamination of the interior of hoses, pipes, and tubes is a critical problem inmany industries because it often leads to corrosion and service breakdowns,requiring extensive repairs at substantial financial and health costs [1].Particulate and hydrocarbon contamination in lines used in high-pressureliquid and gaseous oxygen systems can also be a fire hazard. Fires haveoccurred in space, such as on the Mir Space Station, and in aircraft life support,medical applications, aerospace applications, construction materials, andoxygen production [2e5]. And if the contamination is hazardous in nature, anybreakdown in the system can lead to major environmental problems. Fluid linesmust meet minimum cleanliness levels to prevent the lines from becomingcontaminated, thereby reducing the availability and life of the deliverysystems.
At the other extreme, contamination of carbon nanotubes degrades theirproperties and presents a different set of challenges for cleaning. Recently,several methods have been developed and successfully applied to clean carbonnanotubes using wet chemical techniques, laser cleaning, plasma, oxygenradicals, or a chemical sleeve [6e14]. Plasma cleaning and steam cleaning have
Developments in Surface Contamination and Cleaning.
Copyright � 2011 Elsevier Inc. All rights reserved. 123

been shown to be very effective in cleaning fine-bore surgical instruments[15,16]. Palladium alloy membranes are used in hydrogen purification tubes[17,18].
This chapter describes a non-aqueous cleaning technique for removing solidcontaminants from the interior of large-bore tubular components.
2. TYPES OF CONTAMINATION
In industrial fluid systems contamination is generally present in the form ofsolid particles, hydrocarbon films, microbiological materials, or dissolved ionsin solution. These contaminants lead to progressive fouling of the interiorsurfaces, thereby reducing the efficiency of the delivery system. The principalmodes and types of fouling are described below [1,19e22].
l Biological fouling. Micro-organisms (such as bacteria) present in naturalwaters form an organic film on the tube surface, which tend to grow dueto the growth of micro-organism populations. In addition, the micro-organisms are a source of nutrients for macro-organisms (such as algae,mussels, seaweed, and other organic fibrous organisms) which can attachto the surface. Growth of the macro-organism films can exacerbate fouling.Sulfate-reducing bacteria are known to produce corrosive by-products,while iron-oxidizing bacteria may actually consume base metal resultingin, for example, manganese pitting of stainless steel. Also, the filteringeffect of the porous biofilms tends to entrap fine particulates, further exac-erbating fouling problems.
l Corrosion fouling. Corrosion layers can build up on the surface if the basic,very thin, non-porous protective oxide film is disrupted due to changes inoperating conditions and the water chemistry. If a porous oxide is formed,it can also accelerate pitting and corrosion.
l Deposition or particulate fouling. Suspended fine-particulate debris such asclay, silt, and biogrowth, or precipitated crystalline solids, deposit on tubesurfaces in any orientation. Larger particles can settle on horizontal surfacesdue to gravitational setting under low-flow conditions. Deposition canpromote other fouling mechanisms such as microbial corrosion due tomicrobes present in the deposit.
l Scaling or crystallization fouling. Scale occurs when dissolved saltsprecipitate and deposit on the surface. This can occur due to evaporationof the solvent, or when the solubility limit of the salt is exceeded due toheating (inverse solubility of salts such as CaCO3, Ca3(PO4)2, MgSiO3
and Li2CO3) or cooling (normal solubility). Other causes are pH variationsand mixing of fluid streams of different compositions. Non-crystallinesolid fouling can also occur if the fluid stream is cooled below the solid-ification temperature of a component in the stream, for example, wax incrude oil.
124 Developments in Surface Contamination and Cleaning

l Chemical reaction fouling. Chemical reactions that produce a solid phaseat or near the surface can cause fouling. The surface itself does not parti-cipate, but it can cause thermal degradation of one of the components ofthe fluid stream, or it may lead to polymerization with the formation ofa plastic or rubber-like surface deposit.
Most commonly, several fouling processes occur simultaneously. For example,fine particle deposit increases as such particles are trapped in biofilms formedon the surface. It is critical to fluid delivery system performance that suchtubular components are thoroughly cleaned and maintained clean.
3. EFFECTS OF CONTAMINATION
Research worldwide has found at least 75% of all hydraulic and pneumaticsystems degrade and fail due to fluid contamination [1,23e34]. Contaminationcauses degradation of the fluids and the performance of the hydraulic system,and, ultimately, its failure due to material degradation (e.g. corrosion, fatigue,wear), increased internal leakage, jamming from accumulated sludge or silt, orexcessive heat generated due to loss of control of flow and pressure. Even whencare is taken during production and assembly of fluid systems and the system isthoroughly flushed with a cleaning fluid, some hydraulic hoses, tubes, and pipeshave been found to contain contaminant particles as large as 800e1200 mm.Smaller contaminant particles, which can be observed with the unaided eye(>40 mm), are also invariably present together with the larger particles. Fora fluid system installation which could contain 100e200 meters of hose andtube combinations, this would be approximately 6e10 grams of contaminationproduced during assembly of the system. Examples of contaminants present inhydraulic systems include core sand, weld spatter, machine swarf (debris orwaste resulting from metalworking operations), pipe scale and rust, fibrousmaterial, packaging residue, paint flakes, rubber particles from the hoses andseals, and oil oxidation products.
Most hydraulic system contamination failures are caused by solid particlesthat chemically react with the fluid, or by fouling the system through accumula-tion. Particle size range ofmost concern is 5e20mm,but even 0.5mmparticles canbe harmful to most systems due to their increased propensity for silting. With theincreased demand for higher system pressures and faster cycle times, manufac-turers have been imposing tighter tolerances and clearances between movingsurfaces,which, in turn, demands cleanerfluids. For example, a tolerance of 2e5mmgives a dynamic clearance of 1e2.5 mm between two mating surfaces.
The damaging effects of solid particle contamination are influenced by thecomposition, size, shape, and abrasiveness of the particles. Metal particles tendto catalyze oil oxidation and contribute to corrosion. High concentrations ofsmall hard metal or metal oxide particles (�10 mm), which are smaller than theclearance between the two mating surfaces, form silt which erodes the interior
125Chapter | 4 Non-Aqueous Interior Surface Cleaning Using Projectiles

mating surfaces of valves, causing loss of control characteristics and efficiencyof the component. Jamming of the moving parts can also occur, leading tocomponent malfunction and erratic machine operation.
Contaminating particles larger than the clearance gap block ports andorifices, and can cause erosion and leakage of a valve if trapped in the workingclearance between the poppet and its seat. The larger particles, in turn, canbreak into smaller particles. High flow velocities or operating pressures canexacerbate the problem.
Contaminating solid particles that are about the same size as the clearancebetween two moving surfaces can cause both jamming and rapid wear of themating surfaces. The abrasive action of the original particles due to metal-to-metal contact produces new particles and a chain reaction of abrasion andcontamination is initiated. Increased dynamic clearance between the matingsurfaces causes increased system leakage, loss of system efficiency and control,and localized heat (and increased maintenance costs). The other wear mecha-nisms that result in self-generating contaminants include: adhesive, abrasive,erosion, fatigue, delamination, corrosive, electro-corrosive, fretting corrosion,cavitation, electrical discharge, and polishing wear. Each of these types of wearcategories has its own mechanism and symptoms; however, in practice theymay occur individually, combined, or in sequence.
Contaminants, such as water and air or other gases in oil, can degrade theperformance of hydraulic systems and component failure. Free water, whichforms when the saturation point of the oil is exceeded, can adversely impact thefluid chemistry by reacting with oxidation products and purposely addedchemicals (additives) to form organic acid compounds and sludge. Free watercan also be present as emulsified droplets suspended throughout the fluid. Otherdetrimental effects of free water include accelerated corrosion and abrasivewear, metal fatigue, reduced bearing life, jamming due to ice crystals formed atlow temperatures, loss of dielectric strength, and bacterial problems. Air andother gases in oils may cause foaming, slow system response, higher temper-atures, pump cavitation, lack of system pressure, and accelerated oil oxidation.
Contamination presents the potential for critical failure of manned andunmanned space missions which could result in loss of mission or loss of crewor both. For example, particle contamination in a flow control valve can causeblockage of fuel delivery to the main engine of a manned vehicle or to thepropulsion system of a satellite, causing the system to malfunction or failentirely; or, worse, it can ignite the fuel with disastrous consequences.
Clean fluid is the only way to achieve optimum performance froma hydraulic or pneumatic system.
4. FLUID CLEANLINESS LEVELS
Particle contamination can reduce the service life of fluid delivery systems.A correctly maintained fluid can eliminate 75e85% of the hydraulic machine’s
126 Developments in Surface Contamination and Cleaning

future failures and increase the life expectancy of its components. Some level ofparticle contamination is always present in the fluid streams, even in a newfluid. New hydraulic fluids can contain 500 000 particles larger than 5 mm per100 mL [23,27,29,33], which exceeds the level recommended for hydraulicsystem normal operation. Operations of processing equipment used forsynthesis are sources of particle contamination. Transfer of hydraulic fluidsfrom delivery tanks to storage containers at point of use can make themsusceptible to ten times the amount of contamination than if the fluid wereretrieved directly from the manufacturer. The level of acceptable cleanlinessdepends on the type of fluid delivery system [24,25,34].
4.1. Hydraulic Fluids
The contamination level in hydraulic and lubricating oils is characterized by anoil cleanliness code. Due to their shape, size tolerance, contamination sensi-tivity, function, and operating method different components tolerate differentcontamination levels of operating fluids. These contamination levels of oper-ating liquids are defined by oil cleanliness codes according to variousstandards.
4.1.1. ISO Standard
The most frequently used classification for oil cleanliness codes in fluid powersystems is defined by the international standard ISO 4406 (Table 4.1) [35].
The cleanliness level may be measured either by automatic or microscopicparticle counting. The classification of the cleanliness level of a hydraulic oil isidentified by a three-number code for particles >4 mm, >6 mm, and >14 mmin a 100 mL sample when measured with an automatic particle counter[36e39]. For example, an oil sample from a hydraulic system gave thefollowing results of particle counts measured with an automatic particlecounter.
According to Table 4.1, this hydraulic oil has an oil cleanliness of ISO17/14/11.
If an optical microscope is used to count the particles [37,40], only a two-digit code is used to designate the cleanliness of the sample. In this case, onlyparticle sizes larger than 5 mm and 15 mm are considered. As an example, an oilsample with the following particle count distribution measured with an opticalmicroscope would be assigned an oil cleanliness of ISO 17/15.
Particle Size Number of Particles ISO Code
>4 mm 85 376 17>6 mm 15 516 14>14 mm 1301 11
127Chapter | 4 Non-Aqueous Interior Surface Cleaning Using Projectiles
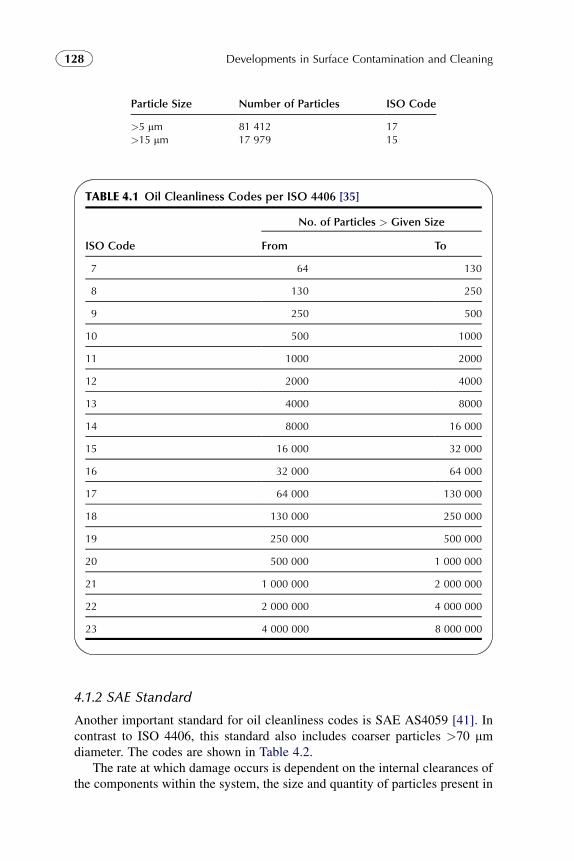
4.1.2 SAE Standard
Another important standard for oil cleanliness codes is SAE AS4059 [41]. Incontrast to ISO 4406, this standard also includes coarser particles >70 mmdiameter. The codes are shown in Table 4.2.
The rate at which damage occurs is dependent on the internal clearances ofthe components within the system, the size and quantity of particles present in
TABLE 4.1 Oil Cleanliness Codes per ISO 4406 [35]
ISO Code
No. of Particles > Given Size
From To
7 64 130
8 130 250
9 250 500
10 500 1000
11 1000 2000
12 2000 4000
13 4000 8000
14 8000 16 000
15 16 000 32 000
16 32 000 64 000
17 64 000 130 000
18 130 000 250 000
19 250 000 500 000
20 500 000 1 000 000
21 1 000 000 2 000 000
22 2 000 000 4 000 000
23 4 000 000 8 000 000
Particle Size Number of Particles ISO Code
>5 mm 81 412 17>15 mm 17 979 15
128 Developments in Surface Contamination and Cleaning

the fluid, and the system pressure. Typical internal clearances of hydrauliccomponents are shown in Table 4.3 [24,42].
The minimum recommended fluid cleanliness levels for different types ofhydraulic systems, defined according to ISO and SAE standards, are shown inTable 4.4.
Table 4.5 [43,44] recommends conservative target ISO cleanliness codesbased on several component manufacturers’ guidelines and extensive fieldstudies for standard industrial operating conditions in systems using petroleum-based fluids.
4.1.3. Military Standard
The United States Department of Defense (DoD) has issued a standard MIL-H-5606G for cleanliness of hydraulic fluids [45]. The number of solidparticles in each 100 mL sample of hydraulic fluid cannot exceed the valuesshown in Table 4.6.
TABLE 4.2 Oil Cleanliness Codes per SAE AS4059 [41]
Optical Counting
Maximum Number of Particles for Given Particle Size
>1 mm >5 mm >15 mm >25 mm >50 mm >100 mm
Automatic Counting >4 mm >6 mm >14 mm >21 mm >38 mm >70 mm
Size Code Class A B C D E F
Code 000 195 76 14 3 1 0
Code 00 390 152 27 5 1 0
Code 0 780 304 54 10 2 0
Code 1 1560 609 109 20 4 1
Code 2 3120 1220 217 39 7 1
Code 3 6520 2430 432 76 13 2
Code 4 12 500 4860 864 152 26 4
Code 5 25 000 9730 1730 306 53 8
Code 6 50 000 19 500 3460 612 106 16
Code 7 100 000 38 900 6920 1220 212 32
Code 8 200 000 77 900 13 900 2450 424 64
Code 9 400 000 156 000 27 700 4900 848 128
Code 10 800 000 311 000 55 400 9800 1700 256
129Chapter | 4 Non-Aqueous Interior Surface Cleaning Using Projectiles

4.2. Non-Hydraulic Fluids
For aerospace applications, strict cleanliness requirements have been derivedfrom liquid oxygen (LOX) system compatibility, since contaminants such asparticles and hydrocarbon greases and oils can easily ignite in the presenceof LOX. These cleanliness requirements are specified for all gaseous and
TABLE 4.3 Typical Internal Clearances of Hydraulic Components [24,42]
Component Type Typical Internal Clearance, mm
Gear pump 0.5e5
Vane pump 0.5e13
Piston pump 0.5e40
Proportional valve 2.5e40
Servo valve 1.0e63
Control valve 0.5e40
Pressure valve 13e40
Linear actuator 50e250
Bearings 0.5e100
TABLE 4.4 Minimum Fluid Cleanliness Levels for Different Types of
Hydraulic Systems [24,43]
Type of Hydraulic System
Minimum Recommended
Cleanliness Level
ISO 4406 SAE 4059
Silt sensitive 15/13/10 1
Servo 16/14/11 2
High pressure (25e40 MPa) 17/15/12 3
Normal pressure (15e25 MPa) 18/16/13 4
Medium pressure (5e15 MPa) 20/18/15 6
Low pressure (< 5 MPa) 20/18/15 e
Large clearance 21/19/16 e
130 Developments in Surface Contamination and Cleaning

TABLE 4.5 Recommended Target ISO Cleanliness Codes for Systems Using
Petroleum-Based Fluids per ISO 4406 for Particle Sizes 4 mm/6 mm/14 mm
[43,44]
Hydraulic System
Operating Pressure, MPa
<14 21.2 >21.2
PumpsFixed gear 20/18/15 19/17/15 e
Fixed piston 19/17/14 18/16/13 17/15/12
Fixed vane 20/18/15 19/17/14 18/16/13
Variable piston 18/16/13 17/15/13 16/14/12
Variable vane 18/16/13 17/15/12 e
ValvesCartridge 18/16/13 17/15/12 17/15/12
Check valve 20/18/15 20/18/15 19/17/14
Directional (solenoid) 20/18/15 19/17/14 18/16/13
Flow control 19/17/14 18/16/13 18/16/13
Pressure control (modulating) 19/17/14 18/16/13 17/15/12
Proportional cartridge valve 17/15/12 17/15/12 16/14/11
Proportional directional 17/15/12 17/15/12 16/14/11
Proportional flow control 17/15/12 17/15/12 16/14/11
Proportional pressure control 17/15/12 17/15/12 16/14/11
Servo valve 16/14/11 16/14/11 15/13/10
BearingsBall bearing 15/13/10 e e
Gearbox (industrial) 17/16/13 e e
Journal bearing (high speed) 17/15/12 e e
Journal bearing (low speed) 17/15/12 e e
Roller bearing 16/14/11 e e
ActuatorsCylinders 17/15/12 16/14/11 15/13/10
Vane motors 20/18/15 19/17/14 18/16/13
(Continued)
131Chapter | 4 Non-Aqueous Interior Surface Cleaning Using Projectiles

non-gaseous fluids used in high-pressure oxygen systems. The cleanliness limits(chemical and particle contaminants) for fluids used in the Space Shuttle systemsare specified in [46]. Precision cleanliness levels are specified for applicationswhere contamination control limits are necessary to ensure reliability andperformance of fluids and parts and components exposed to the fluids [38].
5. TUBE CLEANING METHODS
Several different cleaning methods have been developed and havebeen successfully employed for in-line and off-line cleaning of tubes[1,20,22,47e68].
TABLE 4.6 Maximum Number of Solid Particles Allowed According to
MIL-H-5606G [45]
Particle Size Range
(Largest Dimension), mm
Maximum Number of Particles Allowed
(Automatic Particle Counting)
5e15 10 000
16e25 1000
26e50 150
51e100 20
>100 5
TABLE 4.5 Recommended Target ISO Cleanliness Codes for Systems Using
Petroleum-Based Fluids per ISO 4406 for Particle Sizes 4 mm/6 mm/14 mm
[43,44]econt’d
Hydraulic System
Operating Pressure, MPa
<14 21.2 >21.2
Axial piston motors 19/17/14 18/16/13 17/15/12
Gear motors 20/18/14 19/17/13 18/16/13
Radial piston motors 20/18/15 19/17/14 18/16/13
Test standsTest stands 15/13/10 15/13/10 15/13/10
Hydrostatic transmissions 17/15/13 16/14/11 16/14/11
132 Developments in Surface Contamination and Cleaning

1. Steam cleaning2. Air blowing3. High pressure water jet cleaning4. Mechanical cleaning5. Projectile cleaning6. Chemical cleaning (alkali or acid solutions, solvents).
Steam cleaning is best suited for the removal of oil and grease. Chemicals suchas Na3PO4 may be added to steam to increase its cleaning effectiveness. Debrissuch as dirt and rust will also be removed if the velocity of the steam is adequateto blow loose debris out of the tube, or if the pressure is sufficient to break upadherent debris. This is usually not the case with field application of typicalsteam cleaners. The method is also time consuming.
The same velocity problems and limitations of steam cleaning also apply toair blowing.
High-pressure water jet cleaning employs water at high pressures to 415MPa to clean the tube. A mechanical pig may also be forced into the tube toenhance cleaning effectiveness. This method will remove dirt and even scale.Large volumes of water are used and the waste water must be disposed of athigh cost. Although the use of high-pressure water can be effective with certaindeposits, the jet nozzle must be moved along the tube slowly, and the timerequired to clean a heat exchanger can be excessive.
Mechanical cleaning involves the use of air-driven high-speed rotating toolssuch as brushes, buffing tools, hones, scrapers, or cutters that clean by abrasiveaction. One disadvantage of high-speed rotation is the inability to control dwelltime on the surface. Low-speed rotary cleaning systems have been developed toovercome this disadvantage. Depending on the type of contamination, the toolscan be made from soft or hard plastics, metals, or hard ceramics. Brushes areavailable with bristle sizes as small as 3 mm for medical applications such ascleaning catheters or endoscopes [67,68]. Often, the cleaners have portsthrough which water or other liquids can be injected to clean and flush ina single operation. The cleaning method is fast, economical, and safe forstraight tubes, and it can clean almost all types of deposits including hard scale.With properly designed and manufactured scrapers, there is minimal loss ofbase metal of the tube. According to one investigation, it would require nearly1000 years of annual CuNi condenser tube cleaning to result in a criticalreduction (~30 to 50%) in tube wall thickness loss [61]. Brushes have also beeneffective in cleaning tubes with enhanced internal surfaces (spirally indented,grooved, or finned), or tubes with thin metal inserts or epoxy type coatings.However, the presence of sharp bends in small-diameter tubing makes thiscleaning method often inapplicable.
Projectile cleaning has traditionally employed compressed air and water orhigh-pressure water alone to propel a cleaning projectile through the tubes toremove deposits. Projectiles can range from rubber bullets to brushes to hard
133Chapter | 4 Non-Aqueous Interior Surface Cleaning Using Projectiles

plastic or various metal or non-metallic abrasive (carbide) scrapers. Mostprojectiles are only suitable for light deposits such as mud and algae, althoughcarbide scrapers have been used to successfully remove hard calcium carbonatedeposits from condenser tubes. One advantage in using water is that thewastewater containing the deposit can be collected for laboratory analysis.
Chemical cleaning with alkaline or acid solutions is very effective inremoving scale or hard oxide films, as well as other hydrocarbon contaminantsand debris. Other liquids, such as solvents and even hydraulic oil, have alsobeen used, but they are less effective in removing strongly adhering deposits.However, the use of hazardous chemicals increases the risks, requires enhancedpersonnel safety and expertise, and adds significant waste disposal costs to thecleaning operation. The cleaning process is also time consuming. Its use hasbeen declining in recent years.
6. NON-AQUEOUS PROJECTILE CLEANING METHOD
Many of the cleaning methods mentioned in Section 5 are only partiallyeffective, are often time consuming and expensive, use hazardous chemicalsand solvents, or they use large volumes of water which must also be disposed athigh costs. To overcome these shortcomings, a non-aqueous method has beendeveloped that uses projectiles to clean the internal surfaces of tubularcomponents [49e53,55e58]. A pneumatic launcher propels the projectile,sized slightly larger than the internal diameter of the tube, into the tube. As theprojectile travels through the tube, it removes the contamination deposited onthe internal tube surface and forces it out of the tube. Cleaning can beaccomplished very effectively in seconds.
6.1. Principle of the Cleaning Method
The principle of the projectile cleaning method is illustrated in Figure 4.1. Apneumatic launcher with an acetal compression nozzle is used to propela compressible polyurethane projectile pneumatically through the tube to becleaned. The projectile is 20e30% larger in external diameter than theinternal diameter of the tube. Once compressed through the nozzle, theprojectile expands against the internal surface and achieves and maintains full360� contact with the internal surface of the tube. The elasticity of theprojectile material and the friction on the surface, combined with the pro-pulsion force from the compressed gas, allow the projectile to remove thecontamination on the surface as it travels through the system and ejectthe removed contamination from the open end of the tube, hose, or pipe. Theprojectiles travel at approximately 15 m/s, so cleaning can be accomplishedvery quickly, even with bends, curves, or elbow joints in the tube. The onlyrequirement is a source of compressed gas and an entrance and exit in the tubeto be cleaned.
134 Developments in Surface Contamination and Cleaning
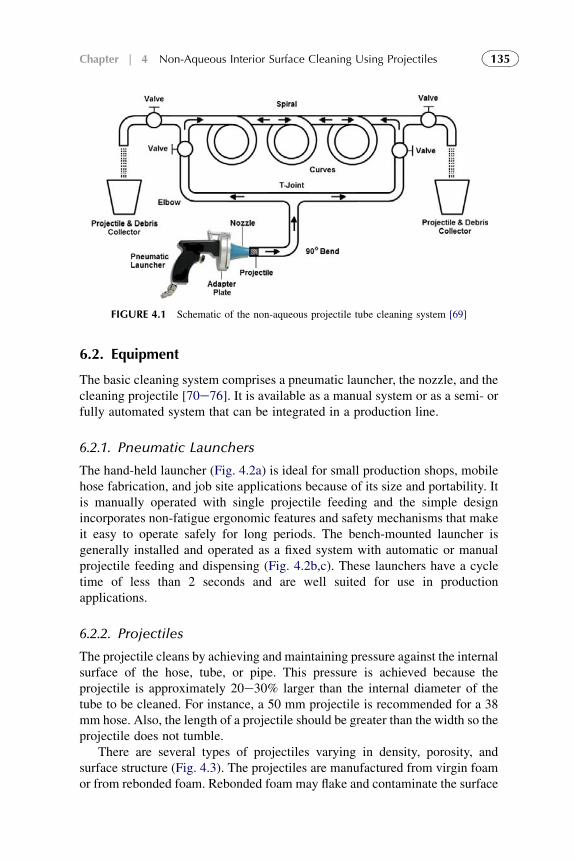
6.2. Equipment
The basic cleaning system comprises a pneumatic launcher, the nozzle, and thecleaning projectile [70e76]. It is available as a manual system or as a semi- orfully automated system that can be integrated in a production line.
6.2.1. Pneumatic Launchers
The hand-held launcher (Fig. 4.2a) is ideal for small production shops, mobilehose fabrication, and job site applications because of its size and portability. Itis manually operated with single projectile feeding and the simple designincorporates non-fatigue ergonomic features and safety mechanisms that makeit easy to operate safely for long periods. The bench-mounted launcher isgenerally installed and operated as a fixed system with automatic or manualprojectile feeding and dispensing (Fig. 4.2b,c). These launchers have a cycletime of less than 2 seconds and are well suited for use in productionapplications.
6.2.2. Projectiles
The projectile cleans by achieving and maintaining pressure against the internalsurface of the hose, tube, or pipe. This pressure is achieved because theprojectile is approximately 20e30% larger than the internal diameter of thetube to be cleaned. For instance, a 50 mm projectile is recommended for a 38mm hose. Also, the length of a projectile should be greater than the width so theprojectile does not tumble.
There are several types of projectiles varying in density, porosity, andsurface structure (Fig. 4.3). The projectiles are manufactured from virgin foamor from rebonded foam. Rebonded foam may flake and contaminate the surface
FIGURE 4.1 Schematic of the non-aqueous projectile tube cleaning system [69]
135Chapter | 4 Non-Aqueous Interior Surface Cleaning Using Projectiles

FIGURE 4.3 Available projectiles used for cleaning. (a) Standard projectile. (b) Coupling
projectile. (c) Product recovery projectile. (d) Abrasive projectile. (e) Grinding projectile [74,75].
Courtesy of Tube Clean GmbH, Hinwil, Switzerland and Ultra Clean Technologies, Bridgeton, NJ
FIGURE 4.2 Projectile launchers. (a) Hand-held unit. (b) Bench mount unit with projectile
dispenser. (c) Bench mount system with nozzles. Courtesy of Tube Clean GmbH, Hinwil, Swit-
zerland and Ultra Clean Technologies, Bridgeton, NJ
136 Developments in Surface Contamination and Cleaning

as it travels through the tube. The density should be sufficiently high to preventthe compressed gas from passing through the projectile, but not too high toprevent the projectile from being compressed and to prevent it from negotiatingcurves, bends, and other constrictions. The typical density of the foam is in therange 80e200 kg/m3.
A. Standard projectile. This ultraclean projectile removes fine particles ofloose contamination and can also be used for product purging. It is usedin tube-cleaning applications to remove mandrel lubricants, grease, andoil after the bending process.
B. Coupling projectiles. These ultraclean projectiles can be used in non-straight-line tubes and pipes. The structure and mechanical properties ofthe coupling projectile provide sufficient flexibility for the projectile tocompress through joints, couplings, bends, kinks, and other reductions inthe system.
C. Product recovery projectiles. The product recovery projectiles aredesigned to travel through a system without the need for disassembly.The projectiles have a closed cell structure and mechanical properties toachieve compactability up to 60%. This ensures maximum expansionand contact within the tube, allowing for efficient product recovery. Theseprojectiles are used to recover residual product after processing in the foodand beverage industry.
D. Abrasive projectile. Abrasive projectiles are manufactured with abrasivegauze fitted at the front of the projectile. The gauze acts as an effectivescrubber to remove surface rust or scale from straight tubes or tube assem-blies. An ultraclean standard or coupling projectile should always be usedafter an abrasive projectile to insure removal of abrasive gauze debris fromthe tube.
E. Grinding projectile. Grinding projectiles are coated with abrasive mediumsuch as alumina and are used to remove heavy contamination and corrosionlayers (scale or rust) in straight lengths of tube or pipe. For a 6 mm diametertube, a 4e6 mm grinding projectile is recommended. For larger-diametertubes, the projectile should be the same diameter as the tube. The grindingprojectile must be followed by an ultraclean standard projectile to ensureremoval of any grinding debris from the tube.
6.2.3. Ultraclean Nozzles
Nozzles are available in different sizes and configurations (Fig. 4.4). Thenozzles have smooth aerodynamic internal surfaces to easily propel theprojectiles.
A. Hose nozzle. The nozzle is inserted into the hose (Fig. 4.4a), so theexternal diameter of the nozzle must be less than the internal diameterof the hose.
137Chapter | 4 Non-Aqueous Interior Surface Cleaning Using Projectiles

B. JIC (Joint Industry Conference) nozzle. The JIC nozzle has a male flare atthe top that will mate against the female JIC coupling on hose and tubeassemblies. The male flared fitting of the JIC nozzle butts against thefemale JIC coupling. The use of a JIC nozzle may be required to matecorrectly with a flared end of the tubing.
C. BSP (British Standard Pipe) coupling fitting. The female flared fitting ofthe BSP nozzle butts against the male BSP coupling.
D. Tube nozzle. The nozzle is inserted over the tube (Fig. 4.4c), therefore, theexternal diameter of the tube must be less than the internal diameter of thenozzle. There is a stop on the inside of the nozzle that forms an airtight sealwhen the tube is fully inserted into the nozzle.
6.2.4. Automated Cleaning Systems
Automated systems for high-volume, high-rate cleaning in production lines areavailable [72,75]. These systems are supplied with manual or automaticprojectile feeding and dispensing and can be operated as mobile or stationaryunits (Fig. 4.5). The systems can be integrated into automatic processing linesand can clean pipes, hoses, and tubes with inside diameters of 2e60 mm at ratesas high as 3000 articles per hour.
6.3. Operating Considerations
The launchers have interchangeable nozzles and projectiles available ina variety of diameters, so all tube sizes from 2 mm to 110 mm can be cleaned toachieve ISO 4406 15/13/10 cleanliness level. The projectiles will travel througha tube that has been kinked or flattened by about 40e60% along the length ofthe tube, but the constriction cannot occur at the beginning of the tube wherethe projectile is entering. The smaller the tube, the less tolerance there willbe for constrictions. Similar considerations apply to other constricting
FIGURE 4.4 Examples of nozzles and configurations for cleaning. (a) Hose nozzle. (b) JIC
nozzle and coupling. (c) Tube nozzle [75]. The top row shows the actual nozzles, while the
schematics in the bottom row show the nozzle configuration during cleaning. Courtesy of Tube
Clean GmbH, Hinwil, Switzerland
138 Developments in Surface Contamination and Cleaning

configurations such as knots, coils, or clamped joints. The projectile will gothrough 90, 180, or 360 degree bends. The standard, coupling and abrasiveprojectiles will negotiate sweeping bends and the standard ultraclean projec-tiles will handle tight bends. Branching tube geometries and tees can be cleanedprovided one branch is sealed and the projectile enters the tube at the correctentry location. The projectile will go through coupling and ball valves andsimilar designs, but not through a non-return valve or butterfly valve or one ofsimilar design. As long as there is sufficient volume of gas behind theprojectile, it will keep traveling through the tube. Thus, long sections of tubeshundreds of meters in length can be cleaned.
The normal operating pressure is 0.59e0.97 MPa. Operating the launcher atthe high end of the recommended pressure range can enhance contaminationremoval. If gas pressure is too low, the correct-sized projectile could possiblybecome lodged in the tube. The use of a smaller projectile will increase thenumber of projectiles required and the time for cleaning and reduce the overalleffectiveness of the system. If the gas pressure is too high, the valve and trigger inthe launchermay not operate properly. The gas source should always be regulatedto the correct pressure and filtered to insure contaminant-free dry gas. The bench-mounted and automated systems incorporate a suitable filter in the gas line.
The standard ultraclean or product recovery projectiles will remove silt andsoil, slurry and moisture from the line. Hardened deposits usually require anabrasive or grinding projectile for removal. This is always followed by a stan-dard ultraclean projectile to remove any residual contamination from theabrasive cleaning step. The standard and abrasive projectiles will not damagethe surface; however, grinding projectiles may cause some scratching. For
FIGURE 4.5 Automated production level cleaning systems offered by Tube Clean GmbH. (a)
Full automated system. (b) Mobile semi-automated system. Courtesy of Tube Clean GmbH,
Hinwil, Switzerland
139Chapter | 4 Non-Aqueous Interior Surface Cleaning Using Projectiles

certain applications, the projectiles can also be soaked in rust-inhibitingchemicals that will be applied to the entire inner surface as it travels through thetube, accomplishing cleaning and rust prevention in a single step. In othercases, such as paint lines, the projectile may need to be soaked in paint thinnersto assist in removing the paint. To maintain the cleanliness of the component orthe hardware after cleaning, ultraclean tape is often applied over the open ends.The tape can be easily removed before final assembly of the component orinstallation of the hardware.
Selection of the correct projectile size is important to the cleaning opera-tion. If the projectile is too large it will not leave the nozzle and if it is too smallit will not clean effectively. The ejected projectile is often an indicator of thecondition of the tube. Damage of the internal tube wall or the presence ofa sharp surface protrusion, such as a burr, weld spatter, or a broken wire, canshred the projectile. A projectile collector is frequently used to collect theprojectiles to assess the internal condition of the tube and to determine whetheradditional cleaning is required, as well as to collect the removed contaminantsfor identification and laboratory analysis.
Depending on the cleanliness of the application, the projectiles could becleaned and reused. Reusing the projectiles in the medical, food and beverage,or hydraulic applications is generally not recommended, but other applicationswith less stringent cleanliness requirements may benefit from reduced costs bycleaning and reusing the projectiles. The additional resources and costs ofcleaning the projectiles may offset the cost advantages of reuse.
A projectile control and verification system is often used in high-volume,high-rate cleaning applications to ensure that a projectile is never left insidea hose or tube being cleaned.
6.4. Advantages and Disadvantages
6.4.1. Advantages
l The cleaning system is simple, safe, and easy to operate.l High cleanliness levels can be achieved, which can also reduce warranty
claims.l Hardware can be cleaned very rapidly, saving costs and reducing downtime.l Assembled systems do not have to be disassembled for cleaning. The
projectile negotiates tee joints, elbows, and 90� bends. If a tube componentfails, it can simply be disconnected from the assembly for cleaning.
l The system can be used as an indicator of the internal condition of thecomponent or assembled hardware.
l Long lengths are not an obstacle to cleaning.l The use of hazardous cleaning chemicals and solvents is reduced or elimi-
nated, thereby saving high disposal costs. Personnel risks from inhalation,contact, and disposal are reduced.
140 Developments in Surface Contamination and Cleaning

l It is environmentally friendly. The projectiles are inexpensive and can bereadily disposed.
l Operator morale is improved by the use of an efficient and effective clean-ing system.
6.4.2. Disadvantages
As with any projectile cleaning method, this method has some disadvantages.
l Hard deposits, such as rust and scale, will require multiple cleaning cycleswith abrasive and grinding projectiles, followed by a standard projectile.This will increase the operating costs for maintenance of such systems.Also, grinding projectiles do not effectively negotiate bends, so onlystraight sections with hardened deposits can be cleaned.
l Both ends of the tube, hose, or pipe must be open for cleaning and recoveryof projectiles, residual product, or removed contaminants. Removal of theend caps increases labor requirements.
l There is a safety risk of the projectile being launched back at the operatorwhen the launcher is removed from a plugged tube that becomes pressurizedwith the gas. Most systems include a safety feature to prevent this fromoccurring.
l The method is not very effective on enhanced surfaces (convoluted, finned,or ridged tube configurations). The tube must have a consistent internaldiameter throughout its length.
l The system will not clean if there are significant reductions and expansionsin the tube. It must be disassembled into sections to clean.
6.5. Applications
The projectile cleaning system is used in a wide range of commercial andindustrial applications that transmit power through fluid transfer as listed inTable 4.7 [74e76]. For example, a steam generator with a thermal output of1100 MW may have nearly 70 km of tubes flowing water at high temperaturesand pressures. These tubes are cleaned regularly as part of a preventivemaintenance program.
Srimongkolkul [77] evaluated the cleanliness of a spiral hydraulic hose(25.4 mm internal diameter, 610 mm long). The hose had been cut with anabrasive wheel or a mechanical saw and cleaned using standard projectiles.Particle counts were measured after flushing the hose with clean filteredhydraulic oil (ISO 4406 15/13/10) before and after cleaning. The resultsshowed the hose could be cleaned to ISO 4406 15/13/10 cleanliness level.
A hygiene and microbiological assessment [78] was recently performed onthe cleaning system offered by Tube Clean GmbH. The intent of the assessmentwas to determine the suitability of the system for cleaning, disinfection, and
141Chapter | 4 Non-Aqueous Interior Surface Cleaning Using Projectiles

TABLE 4.7 Applications of the Projectile Cleaning System [74e76]
Application Use
Hydraulic and pneumatic lines Eliminates rubber contamination, metal particles, contaminated oil, moisture contamination introducedthrough the manufacture and cutting that reduce operating efficiency and cause breakdown and componentfailure
Steam boilers Removes most scaling in steam pipes for servicing during regular maintenance
Heat exchangers and condensertubes
Eliminates contamination that reduces heat transfer resulting in low-level performance
Air conditioning and refrigeration Eliminates minute particles in copper tubes, coolant lines that affect system performance
Oxygen and gas lines Eliminates oil, grease, and other contaminants from copper or stainless steel tubing
Oil, gas, and chemical processing Efficient cleaning and purging of product pipes as part of service maintenance
Earthmoving and miningequipment maintenance
Removal of contaminants in hydraulic assemblies, new equipment, and for repairs to used or failed equipment,thus reducing downtime. Allows transmission of fluid energy efficiently to the working elements on heavyequipment. Reduces flushing time and filter usage
Rubber and plastics Removal of latex from conveyor pipes. Removal of by-products, plastic fibers, and other deposits from injectionmolding lines
Automotive servicing Cleaning of fuel lines, brake lines, air conditioning, and power steering lines prior to assembly and servicing ofcomponents
Wave guide Cleaning of microwave signal transfer lines
Food and beverage productrecovery and contaminationremoval
Retrieval of product (e.g. chocolate, ice cream, syrups, other liquids) from lines during product changeover andgeneral cleaning of the lines, thereby reducing or eliminating solvents or detergents. Eliminates contamination(bacteria, yeast buildup, and other microbiological contaminants) by effectively cleaning the internal surface ofTemprite� (Temprite, Chicago, IL) coils, superchiller coils, beer, juice, and other carbonated beverage lines
Gun barrels Removes rust, scale, or powder residue from gun barrels much faster than brushing or swabbing
142
Develo
pmen
tsin
Surface
Contam
inatio
nan
dClean
ing

drying of drinking water hoses (designated ‘S’) for short-term application.A hose with high biofilm and inorganic contamination loading (designated ‘U’)was used for comparison. Drinking water was circulated through the hoses for 8weeks at ambient temperature. The hoses were then cleaned with standard orproduct recovery projectiles. The ‘S’ hose required only two projectile shots toclean and dry the hose; the second shot projectile appeared to be clean and dry.By comparison, even the fourth shot projectile from the ‘U’ hose was coveredin a slimy fluid together with a large amount of debris, indicating considerableresidual contamination in the hose. The bacterial count in the collectedwastewater and ejected projectiles gave 60 CFU/mL for the ‘S’ hose comparedwith >150 CFU/mL for the ‘U’ hose. Finally, tests were performed to disinfecta bacterially contaminated ‘S’ hose by shooting multiple projectiles soaked ina suitable disinfectant through the hose. No evidence of bacterial contaminationwas found on the projectile or on the inner surface of the hose after the secondprojectile shot, indicating complete and effective disinfection of the hose.
Several manufacturers of hydraulic hose and hydraulic components andother user organizations in different industrial sectors worldwide havesuccessfully employed the projectile cleaning system to achieve cost-effectiveand efficient high-rate cleaning of hoses, tubes, and pipes.
7. SUMMARY
Internal contamination of tubes, hoses, and pipes reduces the operating effi-ciency of industrial systems that transmit fluids. Traditional cleaning methods,such as water jetting, solvent and chemical cleaning, and mechanical cleaningwith liquid flushing, are often time consuming and expensive, use hazardouschemicals or solvents, or they use large volumes of water. The pneumaticprojectile cleaning method overcomes these disadvantages. A pneumaticlauncher propels the projectile, sized slightly larger than the internal diameterof the tube, into the tube. As the projectile travels through the tube, it removesthe contamination deposited on the internal tube surface and forces it out of thetube. Tubes with internal diameters from 2 mm to 60 mm can be cleaned to ISO4406 15/13/10 cleanliness levels. Cleaning can be accomplished very effec-tively in seconds. Automated systems can achieve cleaning rates as high as3000 articles per hour. The method is applicable in a wide variety of industries.
ACKNOWLEDGMENT
The author would like to thank Jody Mantell for help with the references.
DISCLAIMER
Mention of commercial products in this chapter is for information only anddoes not imply recommendation or endorsement by The Aerospace
143Chapter | 4 Non-Aqueous Interior Surface Cleaning Using Projectiles

Corporation. All trademarks, service marks, and trade names are the property oftheir respective owners.
REFERENCES
[1] H. Muller-Steinhagen (Ed.), Handbook of Heat Exchanger Fouling. Mitigation and Cleaning
Technologies, Publico Publications, Essen, Germany, 2000.
[2] NFPA 53, Recommended Practice on Materials, Equipment, and Systems Used in Oxygen-
Enriched Atmospheres, National Fire Protection Association, Quincy, MA, 2004.
[3] AIGA 005/04, Fire Hazards of Oxygen and Oxygen Enriched Atmospheres, Asia Industrial
Gases Association, Singapore, 2004.
[4] H.D. Beeson, S.R. Smith, W.F. Stewart (Eds.), Safe Use of Oxygen and Oxygen Systems:
Handbook for Design, Operation, and Maintenance, ASTM Manual 36, second ed., ASTM
International, West Conshohocken, PA, 2007.
[5] J.M. Stolzfuss, Oxygen Systems, NASA White Sands Test Facility, Las Cruces, NM, 2010.
http://www.nasa.gov/centers/wstf/laboratories/oxygen/index.html.
[6] I.W. Chiang, B.E. Brinson, R.E. Smalley, J.L. Margrave, R.H. Hauge, Purification and Char-
acterization of Single-Wall Carbon Nanotubes, J. Phys. Chem. B 105 (2001) 1157.
[7] J.S. Kim, K.S. Ahn, C.O. Kim, J.P. Honga, Ultraviolet Laser Treatment of Multiwall Carbon
Nanotubes Grown at Low Temperature, Appl. Phys. Lett. 82 (2003) 1607.
[8] M.T. Martınez, M.A. Callejas, A.M. Benito, M. Cochet, T. Seeger, A. Anson, et al.,
Modifications of Single-Wall Carbon Nanotubes upon Oxidative Purification Treatments,
Nanotechnology 14 (2003) 691.
[9] B. Bundjemil, E. Borowiak-Palen, A. Graff, T. Pichler, M. Guerioune, J. Fink, et al.,
Elimination of Metal Catalyst and Carbon-Like Impurities from Single-Wall Carbon Nano-
tube Raw Material, Appl. Phys. A 78 (2004) 311.
[10] M.P. Petkov, Non-Destructive Cleaning of Carbon Nanotube Surfaces: Removal of Organic
Contaminants and Chemical Residue with Oxygen Radicals, Microsc. Microanal. 11 (Suppl
2) (2005) 1928.
[11] N. Grobert, Carbon Nanotubes e Becoming Clean, Mater. Today 10 (2007) 28.
[12] K.E. Hurst, A.C. Dillon, D.A. Keenan, J.H. Lehman, Cleaning of Carbon Nanotubes near the
p-Plasmon Resonance, Chem. Phys. Lett. 433 (2007) 301.
[13] A. Capobianchi, S. Foglia, P. Imperatori, A. Notargiacomo, M. Giammatteo, T. Del Buono,
et al., Controlled Filling and External Cleaning of Multi-Wall Carbon Nanotubes Using
a Wet Chemical Method, Carbon 45 (2007) 2205.
[14] S.Y. Ju, W.P. Kopcha, F. Papadimitrakopoulos, Brightly Fluorescent Single-Walled Carbon
Nanotubes via an Oxygen-Excluding Surfactant Organization, Science 323 (2009) 1319.
[15] J. Pollak, M. Moisan, D. Keroack, J. Seguin, J. Barbeau, Plasma Sterilisation within Long
and Narrow Bore Dielectric Tubes Contaminated with Stacked Bacterial Spores, Plasma
Proc. Polym. 5 (2008) 14.
[16] R. Kohli, Alternate Semi-Aqueous Precision Cleaning Techniques: Steam Cleaning and
Supersonic Gas/Liquid Cleaning Systems, in: R. Kohli, K.L. Mittal (Eds.), Developments in
Surface Contamination and Cleaning. Removal of Particulate Contaminants Volume 3,
Elsevier, Oxford, U.K., 2011, p. 201.
[17] Palladium Membrane Hydrogen Purifiers, Outside-In or Inside-Out Flow e Which Design is
Best for Compound Semiconductors? Technical Bulletin 0303, Johnson Matthey Gas Puri-
fication Technology, West Chester, PA, 2010. http://pureguard.net/cm/Library/Technical_
Bulletins.html.
144 Developments in Surface Contamination and Cleaning
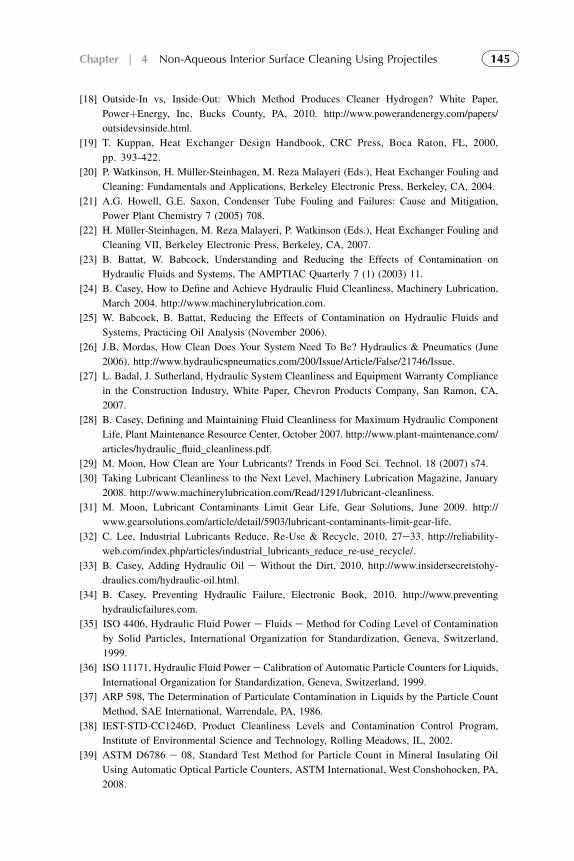
[18] Outside-In vs, Inside-Out: Which Method Produces Cleaner Hydrogen? White Paper,
PowerþEnergy, Inc, Bucks County, PA, 2010. http://www.powerandenergy.com/papers/
outsidevsinside.html.
[19] T. Kuppan, Heat Exchanger Design Handbook, CRC Press, Boca Raton, FL, 2000,
pp. 393-422.
[20] P. Watkinson, H. Muller-Steinhagen, M. Reza Malayeri (Eds.), Heat Exchanger Fouling and
Cleaning: Fundamentals and Applications, Berkeley Electronic Press, Berkeley, CA, 2004.
[21] A.G. Howell, G.E. Saxon, Condenser Tube Fouling and Failures: Cause and Mitigation,
Power Plant Chemistry 7 (2005) 708.
[22] H. Muller-Steinhagen, M. Reza Malayeri, P. Watkinson (Eds.), Heat Exchanger Fouling and
Cleaning VII, Berkeley Electronic Press, Berkeley, CA, 2007.
[23] B. Battat, W. Babcock, Understanding and Reducing the Effects of Contamination on
Hydraulic Fluids and Systems, The AMPTIAC Quarterly 7 (1) (2003) 11.
[24] B. Casey, How to Define and Achieve Hydraulic Fluid Cleanliness, Machinery Lubrication,
March 2004. http://www.machinerylubrication.com.
[25] W. Babcock, B. Battat, Reducing the Effects of Contamination on Hydraulic Fluids and
Systems, Practicing Oil Analysis (November 2006).
[26] J.B. Mordas, How Clean Does Your System Need To Be? Hydraulics & Pneumatics (June
2006). http://www.hydraulicspneumatics.com/200/Issue/Article/False/21746/Issue.
[27] L. Badal, J. Sutherland, Hydraulic System Cleanliness and Equipment Warranty Compliance
in the Construction Industry, White Paper, Chevron Products Company, San Ramon, CA,
2007.
[28] B. Casey, Defining and Maintaining Fluid Cleanliness for Maximum Hydraulic Component
Life, Plant Maintenance Resource Center, October 2007. http://www.plant-maintenance.com/
articles/hydraulic_fluid_cleanliness.pdf.
[29] M. Moon, How Clean are Your Lubricants? Trends in Food Sci. Technol. 18 (2007) s74.
[30] Taking Lubricant Cleanliness to the Next Level, Machinery Lubrication Magazine, January
2008. http://www.machinerylubrication.com/Read/1291/lubricant-cleanliness.
[31] M. Moon, Lubricant Contaminants Limit Gear Life, Gear Solutions, June 2009. http://
www.gearsolutions.com/article/detail/5903/lubricant-contaminants-limit-gear-life.
[32] C. Lee, Industrial Lubricants Reduce, Re-Use & Recycle, 2010, 27e33. http://reliability-
web.com/index.php/articles/industrial_lubricants_reduce_re-use_recycle/.
[33] B. Casey, Adding Hydraulic Oil e Without the Dirt, 2010. http://www.insidersecretstohy-
draulics.com/hydraulic-oil.html.
[34] B. Casey, Preventing Hydraulic Failure, Electronic Book, 2010. http://www.preventing
hydraulicfailures.com.
[35] ISO 4406, Hydraulic Fluid Power e Fluids e Method for Coding Level of Contamination
by Solid Particles, International Organization for Standardization, Geneva, Switzerland,
1999.
[36] ISO 11171, Hydraulic Fluid Power e Calibration of Automatic Particle Counters for Liquids,
International Organization for Standardization, Geneva, Switzerland, 1999.
[37] ARP 598, The Determination of Particulate Contamination in Liquids by the Particle Count
Method, SAE International, Warrendale, PA, 1986.
[38] IEST-STD-CC1246D, Product Cleanliness Levels and Contamination Control Program,
Institute of Environmental Science and Technology, Rolling Meadows, IL, 2002.
[39] ASTM D6786 e 08, Standard Test Method for Particle Count in Mineral Insulating Oil
Using Automatic Optical Particle Counters, ASTM International, West Conshohocken, PA,
2008.
145Chapter | 4 Non-Aqueous Interior Surface Cleaning Using Projectiles
[40] ASTM F312 e 08, Standard Test Methods for Microscopical Sizing and Counting Particles
from Aerospace Fluids on Membrane Filters, ASTM International, West Conshohocken, PA,
2008.
[41] SAE AS4059, Aerospace Fluid Power e Cleanliness Classification for Hydraulic Fluids,
SAE International, Warrendale, PA, 2001.
[42] Recommended Oil Cleanliness Codes for Components, Bosch Rexroth Filtration Systems
GmbH, Lohr, Germany, 2010. www.boschrexroth.nl.
[43] Oil Cleanliness Codes, Bosch Rexroth Filtration Systems GmbH, Lohr, Germany, 2010.
www.boschrexroth.nl.
[44] Selecting Target ISO Cleanliness Codes, Precision Filtration Products, Pennsburg, PA, 2010.
www.precisionfiltration.com.
[45] MIL-H-5606G, Hydraulic Fluid Petroleum Base: Aircraft, Missile, and Ordnance, U.S.
Department of Defense, Wright-Patterson Air Force Base, Dayton, OH, 1994.
[46] SE-S-0073, Space Shuttle Fluid Procurement and Use Control, Specification, National
Aeronautics and Space Administration, Johnson Space Center, Houston, TX, 1995.
[47] S.Ya. Kunin, Machine for Cleaning Pipes, Metallurgia 6 (1970) 395.
[48] B.H. Herre, Investigation of Chemical Cleaning Procedures for Replacement Boiler Tubes,
Report PPE-222-R, Pennsylvania Power and Light Company, Allentown, PA, September
1986.
[49] D.W. Casella, Pneumatic Gun, U.S. Patent 4,974,277 (1990).
[50] J.B. Fowler, Pneumatic Gun and Projectiles Therefor, U.S. Patent 5,329,660 (1994).
[51] J.B. Fowler, Pneumatic Gun and Projectiles Therefor, U.S. Patent 5,555,585 (1996).
[52] E. Schef, A Method and an Apparatus for Internal Cleaning of Pipes or Tubes, International
Patent WO/1999/043450 (1999).
[53] E. Schef, Method and Apparatus for Internal Cleaning of Pipes or Tubes, U.S. Patent
6,082,378 (2000).
[54] P. Courville, M.L. Connell, J.C. Tucker, A.L. Branch, R.S. Tyre, The Development of
a Coiled-Tubing Deployed Slow-Rotating Jet Cleaning Tool that Enhances Cleaning and
Allows Jet Cutting of Tubulars, Paper 62741-MS, IADC/SPE Asia Pacific Drilling Tech-
nology Conference, International Association of Drilling Contractors (IADC), Houston, TX,
2000.
[55] D. Menzie, Automatic Pneumatic Projectile Dispensing System, International Patent WO/
2002/081109 (2002).
[56] J.B. Unternaehrer, Automatic Pneumatic Projectile Launching System, International Patent
WO/2003/086672 (2003).
[57] B. Riley, System for Cleaning Gun Barrels, U.S. Patent 6,668,480 (2003).
[58] J. Svenson and R. Axelsson, Applicator for Inside Cleaning of Pipe and Hose, U.S. Patent
6,578,226 (2003).
[59] S. Spielmann, An Overview: Chiller Tube Cleaning, 2003.www.contractingbusiness.com.
[60] D.J. Smith, Condenser Cleaning Saving $1 Million Annually, Power Engineering, May
2004.
[61] G. Saxon, A. Howell, The Practical Application and Innovation of Cleaning Technology for
Condensers, Energy-Tech.com, ASME Power Division Special Section, (August 2005)
pp. 19e26.
[62] A. Pivovarov, Cleaning of Submerged Surfaces by Discharge of Pressurized Cavitating
Fluids, U.S. Patent Application 2006/0151634 (2006).
[63] J. Laughlin, T. Hansen, Nuclear Plant Efficiently Removes Calcium Carbonate from
Condenser Tubes, Power Engineering, July 2007.
146 Developments in Surface Contamination and Cleaning

[64] L.A. Martini, Slow Rotating Fluid Jetting Tool for Cleaning a Well Bore, U.S. Patent
7,314,083 (2008).
[65] Y. Tabani, M.E. Labib, Method for Cleaning Hollow Tubing and Fibers, U.S. Patent
7,367,346 (2008).
[66] D. Feng, C. Huang, K. Zhou, P. Wang, J. Liu, S. Li, Crucial Technology Research on Pipeline
Jet Cleaning, in: C. Hong, H. Liu, Y. Huang, Y. Xiong (Eds.), Intelligent Robotics and
Applications, Springer Verlag, Berlin and Heidelberg, Germany, 2008, pp. 1137e1144.
[67] Disposable Endoscopic Cleaning Brushes, Clinical Choice, Greensboro, NC, 2010.
www.clinicalchoice.com.
[68] Tube Brushes, Schaefer Brush, Waukesha, WI, 2010. www.schaeferbrush.com.
[69] Alka Technical Solutions, Bergamo, Italy, 2010. http://www.alka-srl.com/Home.html.
[70] B. Riley, Product Review of the Contamination Eliminator System, in Proc. 24th Mr. Clean
Conference, Princeton, NJ, J. Dennis (Ed.) 1998, pp. 300e305.
[71] H. Landolt, COMPRI Tube Clean System. The Economical Way to Clean Heat Exchangers,
in: H. Muller-Steinhagen (Ed.), Handbook of Heat Exchanger Fouling. Mitigation and
Cleaning Technologies, Publico Publications, Essen, Germany, 2000, pp. 70e74.
[72] JetCleaner Cleaning System for Hose and Tube, Eurocomp AB, Avesta, Sweden, 2009. http://
www.eurocomp.se.
[73] Hose, Tube & Pipe Cleaning Technology, COMPRI Tube Clean SA, Woodside, South
Australia, 2010. http://www.tubecleansa.com.au/ and http://www.compri.com.au/.
[74] Hose and Tube Cleaning, Ultraclean Technologies Corporation, Bridgeton, NJ, 2010. http://
www.ultracleantech.com/.
[75] Tube Clean GmbH, Hinwil, Switzerland, 2010. http://www.compritubeclean.com/de/
produkte.html.
[76] MegaClean� Hose and Tube Cleaning System, Gates Corporation, Denver, CO, 2010.
[77] V. Srimongkolkul, Hose Cleanliness Evaluation Report, Oil Pure Technologies, Kansas City,
MO, 2001. http://www.ultracleantech.com/.
[78] G.-J. Tuschewitzki, C. Schell, Hygienisch-mikrobiologische Bewertung des Rohr- und
Schlauchreinigungssystems COMPRI Tube Clean System, Report W-187408-10-SI,
Hygiene-Institut des Ruhrgebiets, Gelsenkirchen, Germany, 2010.
147Chapter | 4 Non-Aqueous Interior Surface Cleaning Using Projectiles

This page intentionally left blank

Chapter 5
Electrostatic Removal ofParticles and its Applicationsto Self-Cleaning Solar Panelsand Solar Concentrators
M.K. Mazumder,1 R. Sharma,2 A.S. Biris,3 M.N. Horenstein,1 J. Zhang,3
H. Ishihara,3 J.W. Stark,1 S. Blumenthal1 and O. Sadder11Department of Electrical and Computer Engineering, Boston University, Boston, MA 02215,
USA, 2Renewable Energy Technology Program, Arkansas State University, Jonesboro, AR 72467,
USA, 3Department of Applied Physics, University of Arkansas at Little Rock, Little Rock, AR
72204, USA
Chapter Outline1. Introduction 150
2. Solar Power Potential
and the Global Energy
Needs
151
3. Atmospheric Dust and
Its Deposition on Solar
Panel
154
4. Loss of PV Output Power
Caused by Dust
Deposition
155
5. Electrostatic Charging of
Dust Particles
157
6. Dust Deposition Process:
Effects of Size and Charge
Distributions
158
7. Transmission Loss Due to
Atmospheric Dust
160
8. Experimental Studies on
Solar Panel Obscuration by
Dust Deposition
162
9. Effect of Microstructural
Deposition Pattern: Particle
Size, Shape, and Electrostatic
Charge Distributions
163
10. Removal of Dust From
Solar Panels Using
Low-Power Electrodynamic
Screens
165
11. Trajectories of Charged
Particles on the
Electrodynamic Screen
170
12. Dielectrophoretic Force 175
13. Tribocharging of Particles 177
14. Removal of Uncharged
Conducting Particles
178
15. High-Voltage Three-Phase
Power Supply for the
Electrodynamic Screen
179
16. Testing of the
Electrodynamic Screen
184
Developments in Surface Contamination and Cleaning.
Copyright � 2011 Elsevier Inc. All rights reserved. 149

17. Measurement of
Maximum Power Point
Operation of the PV
System With EDS
190
18. Testing the Solar Panels
Integrated With EDS for
Maximum Power Point
Operation
191
19. Results 193
20. Summary and Conclusions 196
References 197
1. INTRODUCTION
By the mid-twenty-first century, it is anticipated that photovoltaic (PV) plantinstallations will be widely used providing electrical power up to 25% of thetotal global energy needs. These installations will likely be located more in thedesert and semi-arid regions not useful for farming or other commercialapplications. Nearly one-third of the land areas of the world belong to theseregions. It has been estimated that if only 4% of the total usable desert areas areutilized for PV power plants to harvest solar radiation, the current total globalenergy needs can be completely met with negligibly small CO2 emissioncompared to the current global warming threat imposed by greenhouse gasemissions [1].
While inexhaustible for the foreseeable future, solar energy is a low powerdensity (z1.0 kilowatt (kW) per square meter) source. Installations of mega-watt (MW)-scale solar power plants require large areas of land, in locationswhere solar irradiance is high throughout the year. For example, a 125 MWsolar PV installation will require 2.6 km2 area of land. Desert regions are idealfor large-scale photovoltaic and photothermal (PT) installations whereconventional power plants are not built because of the lack of water supplyneeded for plant operation. PV systems are scalable; their power-generatingcapacity can range from milliwatt (mW) level (used for hand-held calculators)to MW to gigawatt (GW) levels for industrial grid connected power generation.This is possible since all PV systems are modular in construction. Currently,single crystalline silicon (c-Si) and multi-crystalline silicon (mc-Si) solarpanels comprise more than 80% of all solar PV installations [2]. Each solarmodule consists of approximately 36 c-Si solar cells, each cell providing onlyabout 1.5 W. Each solar panel consists of one or more modules and the numberof panels used in a solar PVarray depends upon the total power output capacity.The solar arrays can operate independently or they can be banked together togenerate power at kW to GW scales. For instance, a 1.0 GW PV system willrequire approximately 6 million modules mounted on solar panels and framedon the PV arrays; the land area requirement for such an installation isapproximately 23 km2.
150 Developments in Surface Contamination and Cleaning
One of the problems of desert operation of large-scale solar PV systems isthe airborne dust that often deposits on the panels. Efficient operation of solar-PV installations requires clean panels for collecting solar radiation with a highefficiency [3]. Dust deposition on solar panels obscures solar flux, significantlyreducing the efficiency of the systems. An integrated electrodynamic screen(EDS) on each solar panel can provide automatic and continuous removal ofdust from solar panels without requiring water or any moving parts. The EDStechnology was developed under a National Aeronautics and Space Adminis-tration (NASA) project for protecting solar panels on the Moon and Mars [4].Reported experimental studies show that 95% of dust deposited on the panelscan be removed by EDS in less than two minutes, drawing less than 2% of thepanel power output during the cleaning period. The dust particles are removedby electrostatic and dielectrophoretic forces. The self-cleaning solar panelswith EDS are effective for both charged and uncharged dust particles.
We present here a brief review of the need for dust mitigation in terrestrialand space applications of solar panels, basic principles of the electrodynamicdust removal process, electrical power supply needed for the EDS operation,test procedures used for evaluation of the solar panels, and a brief outline of theongoing research for increasing the energy yield of solar panels. Potentialapplications of self-cleaning solar panels in PV systems, particularly in arid andsemi-arid regions, are included, and the economic advantage in payback for theadded cost is examined.
2. SOLAR POWER POTENTIAL AND THEGLOBAL ENERGY NEEDS
The average total irradiance from the sun received outside the Earth’s atmo-sphere is approximately 1366 W/m2 (solar constant). Attenuation by theatmosphere is measured by air mass (AM) [2,5]. For example, AM 0 representssolar irradiance received outside the Earth’s atmosphere and AM 1.0 representsthe atmospheric attenuation of solar irradiance when solar radiation is incidentvertically in a clear sky (at an angle 90� with respect to the horizon). Theaverage solar radiation incident on a horizontal plane on the ground dependsupon the angle at which the rays strike and on the latitude of the location. Thesolar energy received at any location varies throughout the day. The standardterrestrial solar radiation spectrum used for averaging is at AM 1.5 (corre-sponding to the sun being at an angle 42o). The atmospheric transmission loss atthis angle reduces irradiance to about 900 W/m2; however, for convenience theaccepted standard terrestrial irradiance is considered as 1000 W/m2 [5,6]. Allsolar panels are tested at this level of irradiance striking the cells at normalincidence at a temperature 298 K.
The average insolation (incident solar radiation) data in different parts ofthe world are available from satellite measurements such as Landsat. Theaveraging process takes into account that direct solar radiation is received only
151Chapter | 5 Electrostatic Removal of Particles and its Applications

during the day. At any given moment half the planet does not receive any solarradiation; the average extraterrestrial flux incident on a unit surface area is one-fourth the solar constant, which is approximately 342 W/m2. Average globalirradiance received on the surface of the Earth varies from less than 100 W/m2
at high latitudes to more than 300 W/m2 at the sunniest places.The annual insolation on a horizontal plane is maximum in the continental
desert areas between latitude 25oN and 25oS of the equator [7], and it falls offtoward both the equator and towards the poles. In the equatorial regions, cloudcover contributes considerably to the variation of insolation, whereas seasonalvariations cause major fluctuations of irradiance in the northern climates.Considering these variations, the mean annual horizontal global irradiation datain energy units of kWh (1 kWh ¼ 3.6 � 106 J) are available; for example, it ishighest in the Sahara Desert at 2685 kWh/m2/year, followed by the Great SandyDesert at 2343 kWh/m2/year, the Thar Desert at 2179 kWh/m2/year, and theGobi Desert at 1701 kWh/m2/year.
Globally, harvesting solar radiation using PV and PT systems is thefastest-growing industry in the energy sector; the annual average growth is inexcess of 35% beginning in the year 2000, and most of the growth is takingplace in Europe, Japan, China, the US, and India. Energy consumptioncorrelates roughly with the gross national product and the climate. Per capitausage of energy in Japan and in Europe is 6 kW; in the US it is 11.4 kW, inChina 1.6 kW, and in India 0.7 kW.
The available solar power is approximately 120 000 TW (1 terawatt (TW)¼1012 W). The average global power consumption recorded in 2008 wasapproximately 15 TW and the corresponding energy consumption was 474exajoules (474 � 1018 J); about 90% of the energy is currently derived fromfossil fuels. Considering a future world population of 10 billion with an averagepower need per person of 10 kW, the total power need will be 1011 kW or 100TW. Ideally, solar power can clearly meet this future global power need. Tomeet this need in its entirety, PV installations, using solar panels with 14%efficiency, will require approximately 3.5 � 105 km2 of land area located inregions of high insolation. If one-fifth of all seven desert regions of the worldare used for PV installations, the total available area will be in excess of 2� 106
km2. Thus, only a fraction of the arid and semi-arid areas is needed to meet theforeseeable global power needs.
Vast areas of barren deserts remain unused where vegetation cannot growand solar irradiation level is high throughout the year. Approximately 20e50%of the desert areas are suitable for PV installations not considering the hillyterrains and sand dunes. Most large-scale PV installations are located on hardground covered with gravel and sand. The ground is least disturbed by theinstallations except for the mounting supports used for the large number ofarrays. The arrays are tilted (often at the latitude angle) with respect to thehorizontal plane and are spaced apart from each other to avoid shading. Thespace factor, as it is called, is usually 50%. Thus, the land area needed is
152 Developments in Surface Contamination and Cleaning

slightly more than twice the area of the PV panels. PV systems are robust, havelow operating and maintenance costs, and the solar panels usually last morethan 25 years.
One of the advantages of the PV system is that it can support irrigation;solar panels are now extensively used for this purpose in India, and in manyparts of the world where grid-connected electric power lines are not available.Stand-alone PV systems can also be used for desalination in coastal areas whereclean water is scarce. Availability of clean water is considered to be a majorhealth threat in many parts of the world. PV systems in remote semi-aridregions can provide electricity for water irrigation and desalination of sea waterby the reverse osmosis process [1].
In the US, the total electrical power production in 2008 was close to1.0 TW and the total energy consumption in that year was about 4100 TWh.According to the US Department of Energy (DOE) estimate (2010), the totalUS solar PV potential is 206 TW. For comparison, power production capac-ities of other renewable sources are: wind 10 TW (on shore and off shore),geothermal 0.04 TW, hydropower 0.014 TW, and biomass 0.08 TW. Theinstalled capacity (in watts) of a PV system is the product of local solaraverage irradiance (W/m2), total area of the PV panels (m2), PV conversionefficiency (varies from 6% for amorphous Si (a-Si) to 14% for c-Si solarpanels), and the plant performance ratio (typically 70%).
The Mojave Desert, with an area of approximately 75 000 km2 and lessthan 25 cm annual rainfall, has a huge potential for solar power plants.Currently, the combined solar-energy-generating systems at Mojave havea capacity of 354 MW. One of these PV systems is the Nellis PV power plantwith 14 MW capacity producing energy of 30 � 106 kWh/year. By 2011,another PV power plant (Mojave Solar Park) with a capacity of 553 MW willbecome operational. This new plant will be installed over an area of 24 km2.The next large-scale PV system (AV Solar Ranch One), to be commissioned in2013, will add 230 MW to the solar power plant capacity with an estimatedenergy delivery of 600 million kWh/year. Once operational, the plant willsupply electrical energy to 70 000 homes. The estimated generation cost ofelectricity of the AV Solar Ranch One is not expected to exceed $0.13 perkWh. Currently, the national average of electricity cost to the customer isapproximately $0.10 per kWh. In some States like Massachusetts, the electricutility cost is about $0.19 per kWh.
If 25% of the total electric power in the US is to be produced from solar PVsystems, and one-half of all US solar power is to come from the Mojave Desert,it will require approximately 6250 km2 for the PV plants with a total generatingcapacity of 125 GW. The c-Si solar modules are the most efficient, but also themost expensive, at just under $4.00/Wp (peak watt); mc-Si solar modulesare slightly less efficient, but are also less expensive, about $2.50/Wp.Currently, the thin-film PV panels are the least expensive, close to $1.00/Wp.Since both the lifetime and the efficiency vary depending upon the type of
153Chapter | 5 Electrostatic Removal of Particles and its Applications

module used, the area needed for the PV installation, and the cost of the PVsolar system, depend upon the selected module. The module price generallyrepresents 50% of the total installation cost.
With c-Si modules, the total installation cost for PV plants producing125 GW (12.5% of the total electric power in the US) will be approximately$500 billion. This is about ten times the cost of the Gulf of Mexico oil leakdisaster of 2010. The major goal of the PV manufacturers is to reduce the costof the solar panel to $1.00/Wp, with high efficiency and longevity. When thisgoal is achieved, the solar PV system will be highly competitive withconventional fuels, even without considering the environmental benefits ofrenewable energy systems. Very large-scale PV systems will be sustainable ifeach installation generates enough revenue to provide resources for installingtwo plants of the same size during the life span of the first plant.
Like all conventional power plants, one of the most important economicfactors is the cost per kWh in PV installations. Most PV systems are designedbased on the type of solar cells to be used (c-Si, mc-Si, thin film CdTe/CdS, orcopper indium selenide (CIS/CdS)), their performance specified under standardtesting conditions (STC: irradiance 1000 W/m2, AM 1.5, temperature 298 K),their cost, and their anticipated life time. However, the actual energy yield ina PV plant depends upon (1) the average annual illumination intensity incidenton the solar modules in the area where the system will be actually installed, and(2) the operating temperature of the modules. The output power is not linearlyproportional to the incident solar irradiation since the photo-conversion effi-ciency of the cells depends upon the intensity of incident light and the ambientconditions.
When there is a loss of illumination intensity caused by obscuration of lightby dust layer on the panels, there are three adverse effects: (1) the power outputis reduced; (2) there is a decrease in conversion efficiency; and (3) formation ofhot spots and dead cells if the modules are partially blocked by dust layerdeposits. When some of the cells are covered by dust, the shaded cells do notgenerate power to match the other cells; rather, they act as a dead load on theworking cells. As a result, the temperature of the shaded cells increases,forming hot spots. Unless efficient protection devices are used to preventthe formation of hot spots, the modules can get permanently damaged. In thefollowing sections, we describe the loss of transmittance of the incident solarradiation to solar modules and methods for protecting them.
3. ATMOSPHERIC DUST AND ITS DEPOSITIONON SOLAR PANEL
About 30e50% of the extraterrestrial irradiance is lost by scattering andabsorption by the atmosphere before reaching the surface of the Earth. Themean annual energy available on a horizontal plane in different parts of theworld has been measured by using satellites and the measured data are
154 Developments in Surface Contamination and Cleaning

published by the International Energy Agency (IEA). Solar energy has regulardaily and annual cycles due to the Earth’s rotation and inclination of its axiswith the ecliptic plane as the Earth moves around the sun [7].
Deposition of dust on the panels, particularly when these are installed industy areas, deserts, or along highways, could severely minimize solar-to-power output efficiency. In desert regions, where solar radiation is intense andavailable almost throughout the year, obscuration of solar radiation, caused bydust and by the shadowing effect due to passing clouds, is a significant problem.
Solar panel obscuration by dust is caused by: (1) suspended dust in theatmosphere (aerosol) that is directly in the optical path of incoming radiation tothe solar panels, causing extinction of light even when the cells are relativelyclean, and (2) extinction of light due to dust deposited on the panel surface.Both conditions occur during high dust concentration in the atmosphere. Duststorms can completely obscure solar radiation; for example, a dust storm inSydney, Australia, darkened the sky for several days with red dust in 2009. Ouranalysis and experimental studies reported here are limited to the obscurationby dust deposition on the panel and removal of the deposited dust by electro-dynamic screens.
Experimental data on the concentration of suspended atmospheric partic-ulate matter (PM) with particle size smaller that 10 mm in diameter (referred toas PM10) in different regions of the world are available from remotemeasurements made by the US National Oceanic and Atmospheric Adminis-tration (NOAA) and by US Environmental Protection Agency (EPA) [8,9].Airborne particles in this range (PM10) at high concentration are of majorconcern because of health risks and visibility degradation. Maximum lightattenuation comes from the particles in the range 0.3e0.6 mm in diameter sincetheir dimension is comparable to the wavelength of light in the visible region.
The dust deposition rates in different regions of the world have beenmeasured under normal atmospheric conditions. The rate of dust deposition onsolar panels, particularly in the PM10 range, is useful to predict possibleobscuration of light. For example, some of the deserts in regions of the MiddleEast have an average dust deposition rate of approximately 0.36 g/m2/day;the Negev Desert has an average dust deposition of 0.5 g/m2/day; and theMojave Desert has a relatively low dust deposition rate of 0.17 g/m2/day. Thedust deposition rate varies over a wide range [8,9].
Figure 5.1 shows a dust devil forming in the dry lake area of the MojaveDesert. Such dust devils can obscure sunlight completely and can deposit duston the panels with high mass concentration.
4. LOSS OF PV OUTPUT POWER CAUSED BYDUST DEPOSITION
Atmospheric aerosol particles include mineral dust stirred up from the ground,salt particles from sea spray as the droplets evaporate, anthropogenic particles
155Chapter | 5 Electrostatic Removal of Particles and its Applications

such as particulate pollutants discharged from the power plants, biologicalparticles, photochemically produced particles of sulfates and nitrates,soot particles from fires and vehicle exhaust, and road dust. As most of theseparticles are produced at or near ground level, their concentration decreasesalmost exponentially as a function of height, and most of the particles arewithin a height of about 1.5 km above ground level. In the arid and semi-aridareas, airborne particles are mostly metal oxides (SiO2, Al2O3, and otheroxides) and are likely to be of high electrical resistivity.
Both concentration and the size distribution of the atmospheric particlesvary widely with respect to the geographical location and time. Particle sizedistribution varies from nanometers to several micrometers. In the arid andsemi-arid areas, there are often dust storms which arise due to wind erosion
FIGURE 5.1 Dust devil formation on the dry lake area of the Mojave Desert. Photo courtesy of
Creative Commons Corporation, San Francisco, CA. http://www.animalu.com/pics/photos.htm Jeff
T. Alu
156 Developments in Surface Contamination and Cleaning

from a dry surface. Wind gusts pick up dust from dry surfaces of the desertby saltation and transport the dust, often as a thick cloud, from one place toanother [10]. Like deserts, multi-year droughts in many parts of the worldare the primary sources of dust cloud transport over a large distance. Often,the concentration of these dust clouds can be dense enough to darken thesky over a large area and blanket everything on land with a thick layerof dust.
Major dust storm occurrences in many parts of the world since the 1930shave been documented by meteorologists [10,11]. Several places includingNorth America, East Asia, Australia, Hong Kong, Taiwan, Japan, and SouthKorea were affected. For example, dust storms in 1971, 2004, and 2007 coveredseveral cities of the US. Australian dust storms covered many cities witha blanket of reddish orange dust in 1983, and again in 2009. A large part ofPakistan was severely affected by a dust cyclone and caused many deaths in2007. Similarly, sand storms were recorded in many parts of the Middle East.Volcanic eruptions, such as the one that occurred in Iceland in 2010, causeddeposition of ash in many parts of Europe.
Large-scale PV installations can be severely affected by such dust deposi-tion on solar panels. Dust storms in desert areas are frequently followed by lightrains which cause a thin layer of mud to cover the exposed panel surface. Rapidcleaning of the dust layer, either during or immediately after the storm, canminimize the cleaning problem. Many PV panels installed in arid and semi-aridareas are cleaned with water; the process is labor intensive and costly, partic-ularly where clean water is scarce and expensive. Most PV panels are con-structed with tempered borosilicate glass as the front surface which makes thepanels easy to clean with water. However, there is a recent trend to have thefront surface of the glass textured to minimize reflection losses and to trap light.Deposition of microscopic dust particles on the textured surface may defeatthese advances.
5. ELECTROSTATIC CHARGING OF DUST PARTICLES
Wind erosion of dust from a surface under dry conditions is likely to causetriboelectric charging of the particles during the lift-off from the surface.The wind speed in desert areas can reach up to 18 m/s. As the dust particlesbecome airborne from the surface, the inter-particle separation processcontributes to bipolar charging of the dust. Windblown dust, in the sizerange from sub-mm to 50 mm in diameter, rising from desert surfaces,continues to add to the atmospheric dust load. Sedimentation is the primarymechanism of dust deposition on the solar panels. The daily buildup of dustlayers on the panels depends on (1) the atmospheric dust concentration,(2) the settling velocity of dust particles, (3) the adhesion of the dust layeron the surface, (4) aggregation properties of dust deposits, and (5) dustremoval by wind.
157Chapter | 5 Electrostatic Removal of Particles and its Applications

The adverse effects of dust on the solar panel performance depend upon: (1)density of the suspended dust cloud (mg/m3) in the atmosphere; (2) size andshape distribution of the particles; (3) optical properties (scattering andabsorption) of dust; (4) electrostatic charge; (5) adsorbed moisture on thesurface of the particles; and (6) surface mass density (kg/m2) of the dust layerdeposited on the solar panel surface.
Wind and rain can clean the surface and may provide sufficient cleaningwhere rainfall is frequent throughout the year. In many parts of the worldrainfall is seasonal, such as the monsoon season of India, where atmosphericdust concentration is high during the other seasons of the year.
The presence of cloud cover and suspended dust in the atmosphere causesignificant obscuration of sunlight even when the glass-covered solar panels areclean. Similarly, a significant transmission loss occurs from the dust layerdeposited on the front glass surface of the solar panel even when the sky isclear. In general, both phenomena contribute to the attenuation of incidentradiation.
6. DUST DEPOSITION PROCESS: EFFECTS OF SIZE ANDCHARGE DISTRIBUTIONS
The atmospheric particles vary in size from 0.001 to 100 mm in diameter. Thenumber concentration of the particles decreases rapidly as the diameterincreases. Particles smaller than 1.0 mm in aerodynamic diameter remain sus-pended in the atmosphere much longer compared to the coarser particles, sincethe settling velocity of the particles varies as the square of the particle diameter.Particle deposition on the solar panel surface is caused by four depositionmechanisms: (1) gravitational settling; (2) deposition by diffusion; (3) elec-trostatic deposition; and (4) inertial and diffusive deposition from turbulentflow. Of these, gravitational settling plays the primary role. The gravitationalsettling velocity VTS can be written as [12]:
VTS ¼ rpðdpÞ2gCc=18h (5.1)
where rp is the particle bulk density, h is the viscosity of the gaseous medium,Cc is the Cunningham slip correction factor, and g is the acceleration due togravity. The correction factor Cc can be taken as 1.0 for particles larger than 1.0mm. Particle deposition by diffusion is significant for particles smaller than 1.0mm. The deposition rate J due to particle diffusion per unit area of surface fora time period t can be expressed as:
J ¼ N0ðD=ptÞ1=2 (5.2)
The diffusion coefficient D is given by:
D ¼ kTCc=3phd (5.3)
158 Developments in Surface Contamination and Cleaning

with k being the Boltzmann constant and T is the absolute temperature. Thediffusion coefficient D is independent of the density of the particles. While themass fraction of the fine particles that deposit on solar panels is small comparedto that of the coarse particles, the extinction coefficient Qext and the specificsurface area are higher for small particles. The deposition rate due to settlingincreases as d2, while the rate of deposition due to diffusion increases inverselywith particle diameter d.
When the dust is being carried by high winds or dust storms, diffusion andinertial deposition from turbulent flow can occur on the panels. For particleslarger than 1 mm in diameter, their impaction on the panel surface could beone of the dominant mechanisms of deposition. However, the wind shear forceis also one of most effective removal processes in a turbulent flow. Bothdeposition and removal occur during a dust storm. The removal efficiencydepends upon the relative strength of the force of adhesion between theparticles and the panel surface, and the shear force at the boundary layer. Theshear force is proportional to d2, whereas the adhesion force is directlyproportional to d. Therefore, as the particle size decreases, particularly forsub-mm particles, the force of adhesion becomes much stronger than the lift-off force of the wind.
Electrostatic forces also play an important role in the deposition process forsmall particles carrying a high charge-to-mass ratio. When a charged particlecomes close to a grounded metal or to an insulating surface supported ona grounded conducting substrate, it experiences electrostatic attraction to thesurface due to the image force. If the surface has an electrostatic charge, therewill be Coulomb forces of attraction or repulsion. These forces vary inverselyas the square of the distance between the particle and the surface. Therefore,electrostatic forces are effective only when the distance is small, typicallywhen a charged particle is within a few millimeters from the surface. TheCoulomb force arises when the panel surface is electrostatically charged, oftencaused by the previously deposited charged particles. The electrostatic forcebecomes dominant when the charged particle reaches the vicinity of the surfacedriven by other forces, such as gravity, diffusion, and turbulent transport. Oncethe charged particle is close to the surface, the electrostatic force of attractionor repulsion depends upon the polarity of the charge of the particleapproaching the panel and the charge distribution of the deposited dust layer onthe panel.
The charge distribution of the particles can change the microstructuraldeposition pattern, and hence the opacity, of the surface dust layer. Thecharge distribution provides the details of both the polarity and the magnitudeof charge of individual particles. For particles with unipolar charge distri-bution, the electrostatic deposition forces are likely to make the dust layermore uniform on the panel with strong adhesion to the panel surface. As eachparticle comes close to the surface, it experiences electrostatic attraction tothe panel caused by the image force and repulsion by the neighboring
159Chapter | 5 Electrostatic Removal of Particles and its Applications

particles deposited with charge of the same polarity. This process makes theparticle land on the surface where the repulsion force is weak because of theleast number of deposited particles with the same polarity. The localizeddistribution of the electrostatic field causes the dust layer to be relativelyuniform resulting in a high packing density of dust on the surface. Even a thinlayer of densely packed dust can cause a high obscuration of incidentradiation.
If the particles are bipolarly charged, the particles aggregate readily on thesurface because of the inter-particle attraction. The aggregates are often in theform of dendrites, microscopic tree-like structures, of particles loosely boundto the panel surface. Such a structure often allows a major component of theforward scattered light to enter the solar panel, and, as a result, the trans-mission loss is reduced. The loosely bound particles can become re-suspendedin air and be removed by wind. Thus, the particle size distribution and thepacking density of dust layer on the panel have a strong influence on theoptical transmission loss.
7. TRANSMISSION LOSS DUE TO ATMOSPHERIC DUST
A parallel beam of sunlight passing through an atmosphere containing sus-pended particles is assumed to be normally incident on a solar panel. If weassume the particles are monodispersed with respect to size, spherical inshape with diameter d, Ap is the projected area of each particle towards theincident beam, Qext is the extinction coefficient (efficiency) of individualparticles and L is the atmospheric path length of the incident beam, the ratio ofthe intensity of the transmitted beam (I) to that of the incident beam (I0) can bewritten as [12]:
ðI=I0Þ ¼ expð�N0ApQextLÞ (5.4)
where N0 is the number of dust particles per unit volume in the optical path ofthe incident solar radiation.
The extinction efficiency Qext of a particle is the sum of its scatteringefficiency Qs and the absorption efficiency Qa. The extinction efficiency variesfrom 0 to 5, depending on the particle size parameter a (a¼ pd/l), the particleshape, and the complex reflective index m (m ¼ m0 e m0ai) with m0 beingthe real component of the index of refraction, m0a being the imaginary part, andi ¼ (e1)1/2. Based on the diameter d of the particles, and the refractive index mfor a given wavelength l, we can calculate the size parameter a, and determinethe value of Qs, Qa, and Qext from the Mie scattering theory [13].
Since the particle cloud density N0 is likely to be a function of height Lvertically above ground, we can consider a similar concentration of suspendedparticles as a function of length perpendicular to the surface of the solar paneltilted at an angle. We can express the ratio (I/I0) with respect to the totalnumber of particles suspended in a dust column (in the path of the incoming
160 Developments in Surface Contamination and Cleaning

light over a unit area (1 m2) of the solar panel). Writing N ¼ N0L, eq. (5.4)can be rewritten as:
ðI=I0Þ ¼ expð�NApQextÞ (5.5)
where N is the number of particles suspended per unit area (1 m2) normal to thepanel in the direction of the incident beam. Since the product NApQext isdimensionless, it is often termed as an ‘optical depth’ (s) and is given by:
s ¼ �NApQext (5.6)
The ‘optical depth’ represents the loss of light intensity during its transmissionthrough the optical path due to scattering and absorption in the atmosphere.Experimental data on the optical depth, with respect to the vertical path in theatmosphere above ground, are available for many sites. Since the solar panelsare usually tilted (southward in the northern hemisphere) with respect to thevertical plane, and are often fixed in that position, the optical depth for a path ofradiation, incident at angle q with respect to the normal direction, can beexpressed as s0 ¼ (AM)s, where AM is the air mass, defined as AM ¼ 1/cosq,where q is the zenith angle. Thus, the ratio (I/I0) becomes:
ðI=I0Þ ¼ e�s1 (5.7)
The optical path s (for q¼ 90o), under normal atmospheric conditions, has beenmeasured in many areas. In a relatively clear sky with the particle mass mediandiameter in the range of 1.0 to 2.0 mm, the obscuration by the suspendedparticles in the atmosphere is very low.
However, in desert areas settling of particles on the panel surface is mostlikely to be a significant factor in the transmission loss for the coarse dust withparticle diameter larger than 1.0 mm. If we assume that the average particlediameter is 1.0 mm and if we consider the peak of the solar radiation spectrumis at a wavelength l ¼ 0.52 mm, then a ¼ pd/l ¼ 6.8. For absorbing particleswith a equal to or larger than 5.0, Qext approaches its limiting value of 2. Forparticle diameters in the range 0.2 to 1.0 mm, Qext oscillates around 2.0 withthe maximum value approaching 5.0. The extinction coefficient for non-absorbing spheres with refractive index between 1.33 and 1.5 oscillatesaround the value of 2.5 as a(m e 1) increases until it reaches its limiting valueof 2.5.
For irregular particles in the size range between 1 and 4 mm in equivalentdiameter, both maximum and minimum values for Qext are close to 2.0. Fora given particulate mass concentration in the atmosphere, maximum lightextinction occurs for particles with diameters in the range between 0.3 and0.8 mm, where Qext reaches its maximum value around 5.0. Scattering of lightreaches a maximum level when the diameter of the particles is comparable tothe wavelength of the radiation. In this size range of mineral dust, the trans-mission loss is due primarily to the scattering effect. True absorption occurs
161Chapter | 5 Electrostatic Removal of Particles and its Applications

when the complex refractive index m of the particles, such as soot, hasa significant imaginary component m0a where the absorption effect predomi-nates scattering.
For a monolayer of dust particles of diameter d deposited on the surface ofa solar panel, the extinction of light can be calculated using eq. (5.5), where N isthe number of deposited particles per unit area. For polydispersed particles, theproduct of NAp Qext can be written as:
s ¼ �NApQext ¼Xi
pðN0Þiðdi=2Þ2ðQextÞi (5.8)
where (N0)i is the particle number concentration with diameter di havingextinction efficiency (Qext)i. For particles larger than 1.0 mm in diameter, wecan assume Qext is close to 2.0. When multiple layers of particles deposit onthe panel surface, estimation of transmission loss is difficult since both sizedistribution and orientation of the particles are not known. One approach forestimating the transmission loss in such a case is to treat the loss of individuallayers and multiply the fractional losses for each layer. For a high numberdensity of particles, multiple scattering effects will have to be taken intoaccount and polydispersed particles with a high packing density maycompletely obscure the incoming light.
8. EXPERIMENTAL STUDIES ON SOLAR PANEL OBSCURATIONBY DUST DEPOSITION
In order to make quantitative measurements on the obscuration of a solar paneldue to the deposition of dust layers, experimental studies were performed usingvolcanic dust samples, containing primarily of SiO2, Al2O3, TiO2, and othermineral oxides. The test dust sample was classified by using a sieve to removeparticles larger than 40 mm in diameter. A pneumatic dust dispersion devicewas constructed and used to disperse the test dust fairly uniformly overa glass cover. The particle size analysis of the test dust was carried out usinga particle size analyzer and the measured size distribution is shown inFigure 5.2. The d10, d50, d90 values were found to be 1.22 mm, 9.06 mm, and38.45 mm, respectively.
A test chamber was used for studying obscuration by dust deposition [14]. Asingle crystal Si solar cell was used with a glass plate that covered the solar cell.Before each test, the dust sample was dried in an oven at a temperature of 373 Kfor at least 24 hours. For each experimental run, a small amount of dust wasdispersed using the dust dispersion device to form a dust cloud within the testchamber. The dust particles were then allowed to settle on the glass plate. Axenon lamp was used to illuminate the solar cell through the glass cover. Thespectral radiation of the solar lamp approximately simulated solar radiation forthe test purpose. The output power of the solar cell was measured with andwithout the deposited dust layer. The mass concentration in mg/cm2 deposited
162 Developments in Surface Contamination and Cleaning

on the glass cover was measured with a microbalance. The uniformity of thedust layer was examined by using an optical microscope. The power output wasplotted as a function of the mass concentration of the dust layer deposited onthe glass cover.
The normalized power output of the solar cell, plotted as a function ofthe surface mass density of dust deposited on the front glass plate placed overthe solar cell (Fig. 5.3) shows an exponential decay of power output as surfacedust loading increased. The decay curve agrees with the theoretical predictionof eq. (5.5). When the surface mass density of the dust deposit increased to1.5 mg/cm2, the output power decreased by more than 90%.
9. EFFECT OF MICROSTRUCTURAL DEPOSITION PATTERN:PARTICLE SIZE, SHAPE, AND ELECTROSTATIC CHARGEDISTRIBUTIONS
The microstructural characteristics of the deposited dust on the glass surfacewere examined using an optical microscope. It was found that the dustparticles on the surface formed dendrites (tree-like structures of agglom-erates). This deposition pattern can be explained based on the bipolarelectrostatic charge distributions of the particles of dust samples. Theparticles became bipolarly charged during the dispersion process used inthe experiments. A similar charging process is expected when dust particlesbecomes airborne from a dry surface by wind shear forces. A dendrite
FIGURE 5.2 Particle size distribution (shown in dark solid steps) of the test dust as measured by
using a Microtrac� particle size analyzer. The line connecting the dots shows the cumulative size
distribution plotted as a function of particle diameter in mm
163Chapter | 5 Electrostatic Removal of Particles and its Applications

deposition pattern has the advantage of forming a low packing density ofthe deposited dust on the surface of the solar panels, leaving some clearsurface that reduces obscuration.
Particles of the same size deposited as a monolayer, where the outersurface of each particle is in contact with the surface of the neighboringparticles, will result in a maximum surface density of dust on the glass plate.The maximum surface area coverage of the plate will not, however, exceed66%, regardless of the diameter of the monodispersed spherical particles.Considering geometrical optics, at least 34% of the light should still betransmitted through the dust layer of single spherical particles. The surfacemass density can be calculated for such an ideal case for each layer ofparticles. However, if the particles are of different diameters, the interstitialspaces can get filled by small particles resulting in higher packing density ofdust particles. The obscuration of light increases as the particle size distri-bution becomes wider. Polydispersed particles of irregular shapes havingunipolar charge distribution will deposit on the surface with a high packingdensity, and can cause maximum obscuration of light for a given surface massdensity of dust measured as mg/cm2. Soot mixed with dust will have increasedextinction of light.
Thus, the actual obscuration of light depends upon several factors: (1) thesize, shape, and the charge distributions of particles; (2) the packing density orthe microstructural deposition pattern of the particles (which depends upon theparticle size, shape, and the electrostatic charge distributions); and (3) surfacemass density of the deposited dust layer.
In summary, both theoretical analysis and experimental studies show thatdust deposition on the solar panels can cause a significant loss of PV outputpower.
FIGURE 5.3 Normalized output power of a single crystal solar cell as a function of mass
concentration dust (mg/cm2) deposited on the front cover glass. A xenon lamp was used to illu-
minate the solar cell. The mass median diameter of the dust sample was approximately 9 mm
164 Developments in Surface Contamination and Cleaning

10. REMOVAL OF DUST FROM SOLAR PANELS USINGLOW-POWER ELECTRODYNAMIC SCREENS
Early work on electrodynamic traveling-wave systems and their applications indifferent fields were reported by several authors [15e19]. Figure 5.4 illustratesthe basic principles of an EDS [20]. In this figure a free screen is shown withoutany encapsulation by a dielectric film. The electrodes can be energized eitherby using a single-phase or by a three-phase alternating current (AC) drivesignal. The single-phase excitation (Fig. 5.4a) produces a standing wavebetween the electrodes and a polyphase drive (Fig. 5.4b) produces a travelingwave. The latter is preferable since the traveling wave has a strong translationalcomponent that rapidly moves the dust particles from one end of the screen tothe other [17].
The standing wave produced by single-phase excitation also works forremoving the particles from the screen. A standing wave can be considered asthe superposition of two traveling waves moving in opposite directions. Thus,any instability in the AC electric field, the presence of harmonics in the appliedfield, or any air currents on the top surface of the panel, produce a drift velocityto transport the dust particles levitated by the electrodyamic forces from thesurface to move away from the screen.
Figure 5.4 shows a set of parallel electrodes, insulated from each other andconnected to an AC voltage source. In Figure 5.4a, the electric field linesbetween two adjacent electrodes are shown. The electric field is non-uniformwith respect to the spatial coordinates and it varies with time. Charged particleswithin this electric field experience an oscillatory motion; a particle witha chargeþq is shown in Figure 5.4a at an instant of time when it is close to oneof the positive electrodes. As the particle moves along the curved field lines, itexperiences a centrifugal force. In addition, a dielectric particle in a non-uniform electric field experiences a dielectrophoretic force [21,22]. This forceis experienced by dielectric particles, uncharged or charged, in a divergentelectric field AC or direct current (DC).
FIGURE 5.4 Schematic of (a) single-phase EDS and (b) three-phase EDS
165Chapter | 5 Electrostatic Removal of Particles and its Applications

In modeling the performance of an EDS, it is necessary to calculate therepulsive forces that are applied to the particles and the transport velocity whena multiphase drive is applied as shown in Figure 5.4b. A general equation ofmotion of charged particles repelled and being transported can be representedby [22]:
mpdVp
dtþ 6phrVpðr; tÞ ¼ qE0ðrÞcosut þ Fext; (5.9)
where mp is the particle mass, Vpðr; tÞis the particle velocity, h is the viscosityof the gas surrounding the screen, r is the particle radius, q is the electrostaticcharge on the particle, and EoðrÞcosut is the applied electric field of angularfrequency u, and Fext represents external forces, such as gravity. In the aboveequation r represents coordinates (x,y,z), whereas r is used to denote particleradius.
The electric field E(x,y,z,t) and the motion of the charged particle Vp(x,y,z,t)are related in a complex manner making it difficult to solve the Laplaceequations involving the particle motion as a function of mp and q. Masuda, whofirst introduced the concept of an electric curtain [16], solved the equationnumerically with appropriate approximations. His simulation agreed well withhis experimental data. Referring to the particle of charge þq shown inFigure 5.4a, it is possible to examine the instantaneous electrostatic forceexperienced by the particle in the field E(t). The Coulomb force of repulsionwill be:
Fe ¼ qE (5.10)
where q ¼ ss4pr2C, and ss in the surface charge density. If we assume that
particles are tribocharged to their saturation level, then:
qs ¼ 4pr2 � 2:64� 10�5C (5.11)
where the factor 2.64 � 10e5 C/m2 is taken as the maximum surface chargedensity [22] of a spherical particle with diameter r > 1.0 mm at the atmospherepressure of Earth (z0.1 MPa). The charge density limit is set by the onset ofcorona discharge initiated by the field created by the charged particle (self-field) when the maximum surface charge density is exceeded. Then themaximum repulsive force experienced by a particle with surface charge densityss is:
FeðmaxÞ ¼ qmaxEmax ¼ Kmaxr2; (5.12)
where qmax is proportional to r2, Emax is taken as 5� 105 V/m for safe operation
of the electrodes below the breakdown electric field of air at atmosphericpressure, and Kmax is a constant at a given ambient condition. At atmosphericpressure, Kmax¼ 112.9r2. When a small particle with a saturation chargeþ qmax
166 Developments in Surface Contamination and Cleaning

approaches the screen and is close to the electrode where the field is Emax, thevelocity acquired by the particle can be estimated if we assume that the particlemotion obeys Stokes law (eq. (5.9)). The maximum velocity of the particle atsteady state will occur when the drag resistance equals the electrostatic drivingforce:
6phrVpðmaxÞ ¼ 2:64� 10�5 � 4pr2 � 5� 105 (5.13)
We assume the particle is in air under atmospheric conditions, h is 1.8 � 10e5
N s/m2, and Emax is 5 � 105 V/m. Under these conditions, the maximumvelocity Vp(max) is proportional to the radius of the particle:
VpðmaxÞ ¼ 4:88� 105 � r m=s (5.14)
For example, when r ¼ 1 mm, Vmaxz 500 cm/s and when r ¼ 100 mm,Vmaxz 50 m/s. These estimated values of maximum velocity for highlycharged particles exemplify their vigorous motion on an EDS.
Charged particles will acquire their steady state velocity within a time periodof approximately 3sp, where sp is the aerodynamic relaxation time of the particle[12]. At atmospheric pressure, sp ¼ 13 ms for r ¼ 1 mm, and sp ¼ 30 ms forr¼ 50 mm. For a 50-mm aerodynamic diameter particle the value of 3sp is 90 ms.The time period T, or the frequency of the electric field of excitation of the EDSelectrodes, is determined from the range of values of 3sp for the range ofparticles to be removed. EDS is operated generally at a frequency range of4e20 Hz.
Figure 5.5 shows an arrangement of a single-phase electrodynamic screenembedded within a dielectric film. The dielectric film protects the electrodesfrom environmental degradation and provides a dielectric surface for tri-bocharging the dust particles. A phased voltage is applied to the screen elec-trodes to lift the particles and move them away from the screen by electrostaticforces. A flexible electrodynamic screen made of transparent conductingelectrodes embedded in a transparent dielectric film can be used to remove dustfrom the surface of the solar panels [20]. Typically electrodes are made ofindium tin oxide (ITO) 50 mm in diameter with inter-electrode separation
Solar Cell
Dust Particle Migration
EDS Phased Electrodes
FIGURE 5.5 A cross-sectional view of transparent parallel electrodes embedded in a transparent
film or glass panel. The electrodes are energized by phased pulsed voltage for lifting and removing
deposited dust particles from the solar panels or mirrors
167Chapter | 5 Electrostatic Removal of Particles and its Applications

distance of 500 mm. The electrodes are encapsulated in polyurethane (PU) of200 mm thickness.
In eq. (5.9), we have assumed an initial electrostatic charge þq on theparticle. However, if a particle with no initial charge (q ¼ 0) deposits onthe surface of the screen, it will acquire a charge by triboelectrification as theparticle moves on the film surface by dielectrophoretic force (discussed inSection 12). In most cases, particles approaching the surface of the EDS willhave a significant electrostatic charge, since dust particles become tribo-electrically charged during their lift-off from the ground, as discussed earlier.
Figure 5.6 shows arrangements for single- and three-phase electrodeconfigurations of EDS.
An arrangement for placing the EDS over the solar panel is shown inFigure 5.7. Here the screen is composed of parallel transparent conductingelectrodes embedded in the top surface of a transparent dielectric film that isplaced over the solar panels for dust cleaning. The screen can be placed directlyover the solar panel or at a short distance over the surface covering the panel. Ifthe electrodes are embedded within a thin dielectric film, the film serves (1) asa physical protection against mechanical impaction and abrasion by the dustparticles, particularly during a dust storm, and (2) as an electrodynamic dustshield for minimizing obscuration of incident optical radiation. The dielectricfilm also serves as a means to charge the uncharged particles, thus making thescreen effective against both charged and uncharged dust.
FIGURE 5.6 A schematic layout of (a) single-phase (left diagram) and (b) three-phase EDS
(right diagram) electrodes
168 Developments in Surface Contamination and Cleaning

The power requirement for operating the EDS is approximately 10 W/m2 ofthe solar panels, and the EDS is designed to operate by drawing the requiredpower from the solar panels. The EDS is energized only when cleaning isneeded. When the EDS is energized it takes less than two minutes to clean thepanels. Under normal atmospheric conditions, dust cleaning may not berequired for more than a few minutes per day, while the average powerproduced per square meter of the solar panels during the peak hours isapproximately 100 watts. Experiments were conducted with high dust loadingconditions exceeding 10 mg/cm2 when the obscuration reached nearly 100%.When the EDS was energized, more than 90% of the dust was removed.Figure 5.8 shows a three-phase power supply developed for the operation of theEDS. The power supply was designed and constructed to have low weight,small size, and low-power requirements for its operation.
SiO2 substrate
SnO2, ITO or ZnO front electrode
a-Si:H p-layer, i-layer and n-layer
ZnO reflection enhancement
Aluminum back
PU film
Screen
Solarcell
ITO electrodes
FIGURE 5.7 Transparent EDS embedded in a transparent polyurethane (PU) film is placed
over a solar panel. The ITO electrodes are of triangular cross-section which provides a more
uniform distribution of the electric field compared with the field distribution produced by
electrodes of rectangular cross-section. The figure shows an a-Si solar cell integrated with
an EDS
FIGURE 5.8 A three-phase power supply on a circuit board is shown connected to a three-phase
EDS screen. The electrodes are embedded in a dielectric film
169Chapter | 5 Electrostatic Removal of Particles and its Applications

11. TRAJECTORIES OF CHARGED PARTICLES ON THEELECTRODYNAMIC SCREEN
A simplified model of the positions and trajectories of drift-dominated chargedparticles driven by traveling or standing wave voltages over the EDS is presentedhere [23]. The analysis assumes that the self-field from the particles is muchsmaller than the imposed field from the traveling or standing wave voltages (Figs5.4 and 5.7). The traveling wave is generated by applying a three-phase electrodesystem (Fig. 5.8) embedded in the screen, whereas a standing wave is formedwhen a single-phase electrode system (Fig. 5.5) is used. Figure 5.6 shows theelectrode layout for single- and three-phase voltage drives.
Figure 5.9 shows the two-dimensional geometry of a traveling wavepotential at x ¼ �d:
vðx ¼ �d; z; tÞ ¼ V0 cosðut � kzÞ (5.15)
where V0 is the amplitude of particle motion on the surface of the screen that iscovered by a dielectric layer of thickness d, permittivity 3, and conductivity s.The dielectric film is considered to have some leakage due to its finiteconductivity (s s 0). The region for x > 0 is taken to be free space withpermittivity 30. The system is assumed to extend infinitely in the y directionwith no field dependence on the y coordinate.
In the absence of significant volume charge in the two regions � d < x < 0and x > 0, the governing equation is Laplace’s equation in both regions. Thenecessary boundary conditions are:
Fðx ¼ �d; z; tÞ ¼ vðx ¼ �d; z; tÞ ¼ V0 cosðut � kzÞFðx ¼ 0þ; z; tÞ ¼ F ðx ¼ 0�; z; tÞ
30vExðx ¼ 0þ; z; tÞ
vt¼ 3
vExðx ¼ 0�; z; tÞvt
þ sExðx ¼ 0�; z; tÞ (5.16)
FIGURE 5.9 A travel-
ing wave of potential is
applied at x ¼ �d. A
lossy dielectric layer of
thickness d, permittivity
3, and conductivity s
prevents charged dust
from penetrating into the
region x < 0. The x ¼0 surface has reduced
potential magnitude (V1
< V0) and a lagging
phase b to the driving
x ¼ �d potential
170 Developments in Surface Contamination and Cleaning

It is convenient to introduce complex amplitude notation so that the scalarelectric potential can be written as:
Fðx; z; tÞ ¼ Re½bFðxÞejðut�kzÞ� (5.17)
where Re signifies the real part. Then the solution is:
bFðxÞ ¼(�V0 sinh kx
sinh kdþ
bV 1 sinh kðxþ dÞsinh kd
�d � x � 0
bV 1e�kx x � 0
(5.18)
where bV 1 is the complex amplitude potential at x ¼ 0 and is given by:
bV 1 ¼ ðsþ ju3ÞV0
sinh kd½ ju30 þ ð ju3þ sÞcoth kd� (5.19)
The magnitude and phase of bV 1 ¼ V1e�jb are:
V1 ¼ V0
"2ð32u2þs2Þ
ð32�320Þu2þs2þðð32þ320Þu2þs2Þcosh 2kdþ2330u2 sinh 2kd
#1=2
(5.20)
b ¼ tan�1
�u30ssinh kd
ðu232 þ s2Þcosh kd þ 330u2 sinh kd
�(5.21)
Note that if s ¼ 0,
V1 ¼ 3V0
½3 cosh kd þ 30 sinh kd�; b ¼ 0
The complex amplitude electric field in each region can then be written as:
bEx ¼ �d bFdx
¼(
k½V0 cosh kx�bV 1 cosh kðxþdÞ�sinh kd �d � x � 0
k bV 1e�kx x � 0
(5.22)
bEz ¼ jk bFThus, the electric field for x > 0 is:
E ¼ Re½ð bExix þ bEzizÞejðut�kzÞ�¼ kV1½cosðut � kz� bÞix � sinðut � kz� bÞiz�e�kx
11.1. Charged Particle Trajectories for x > 0
We now assume that charged particles, each with total charge q and radius r, areinitially uniformly distributed for x > 0 and that their self-field is very small
171Chapter | 5 Electrostatic Removal of Particles and its Applications

compared to the applied field. We also assume that the Coulomb force on theparticles gives them a drift velocity opposed by Stokes’ viscous drag where themedium for x > 0 has viscosity h:
6phrv ¼ qE
The particle mobility m is written as:
m ¼ v=E ¼ q=6phr (5.23)
Neglecting particle inertia gives the x and z components of particlemotion as:
vx ¼ dx
dt¼ mEx ¼ mkV1 cosðut � kz� bÞe�kx (5.24)
vz ¼ dx
dt¼ mEz ¼ �mkV1 sinðut � kz� bÞe�kx (5.25)
We now replace the traveling wave voltage at x ¼ 0 in Figure 5.9 by a standingwave:
vðx ¼ �d; z; tÞ ¼ V0 cos ut cos kz (5.26)
Then, the solution for the scalar electric potential is of the form:
Fðx; z; tÞ ¼ Re½bFðxÞcos kz ejut� (5.27)
where bFðxÞ is of the same form as eq. (5.18). The boundary conditions are stillgiven by eq. (5.16) with the traveling wave potential at x ¼ �d replaced byeq. (5.27). Then, the solutions of eqs (5.19)e(5.22) are valid here and theelectric field for x > 0 is given by:
E ¼ kV1 cosðut � bÞ½cos kz ix þ sin kz iz�e�kx (5.28)
The analogous charge transport equations to eqs. (5.27) and (5.28) are:
vx ¼ dx
dt¼ mEx ¼ mkV1 cosðut � bÞcos kz e�kx (5.29)
vz ¼ dz
dt¼ mEz ¼ mkV1 cosðut � bÞsin kz e�kx (5.30)
11.2. Removal of Charged Particles
A particle with diameter 1.0 mm, with a charge þq, and subjected to anexcitation voltage waveform, V0 sin ut (or the electric field E0 cos(ut)), willmove with a velocity Vp(t) ¼ Vpo cos(ut � f), as shown in Figure 5.10. Theparticle with charge þq undergoes a hopping motion along the curved linesof force between the adjacent electrodes. The figure shows a positively
172 Developments in Surface Contamination and Cleaning
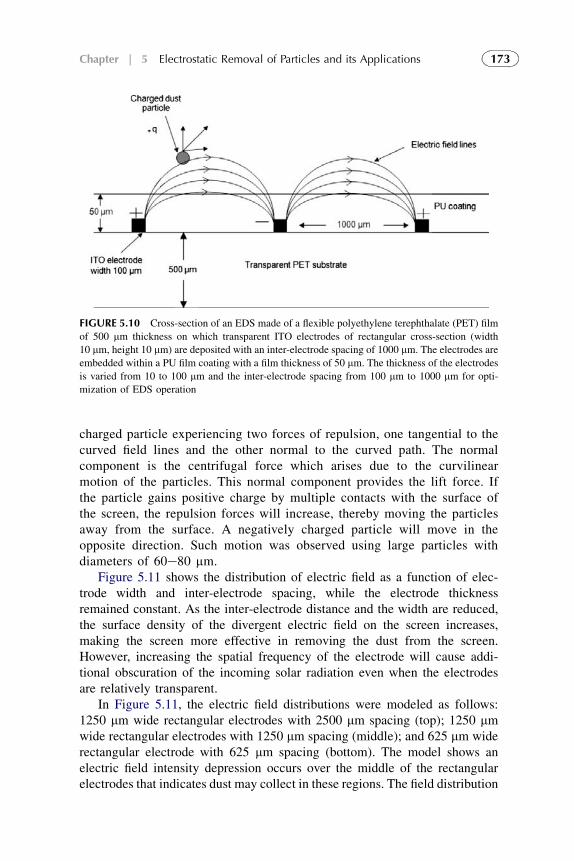
charged particle experiencing two forces of repulsion, one tangential to thecurved field lines and the other normal to the curved path. The normalcomponent is the centrifugal force which arises due to the curvilinearmotion of the particles. This normal component provides the lift force. Ifthe particle gains positive charge by multiple contacts with the surface ofthe screen, the repulsion forces will increase, thereby moving the particlesaway from the surface. A negatively charged particle will move in theopposite direction. Such motion was observed using large particles withdiameters of 60e80 mm.
Figure 5.11 shows the distribution of electric field as a function of elec-trode width and inter-electrode spacing, while the electrode thicknessremained constant. As the inter-electrode distance and the width are reduced,the surface density of the divergent electric field on the screen increases,making the screen more effective in removing the dust from the screen.However, increasing the spatial frequency of the electrode will cause addi-tional obscuration of the incoming solar radiation even when the electrodesare relatively transparent.
In Figure 5.11, the electric field distributions were modeled as follows:1250 mm wide rectangular electrodes with 2500 mm spacing (top); 1250 mmwide rectangular electrodes with 1250 mm spacing (middle); and 625 mm widerectangular electrode with 625 mm spacing (bottom). The model shows anelectric field intensity depression occurs over the middle of the rectangularelectrodes that indicates dust may collect in these regions. The field distribution
FIGURE 5.10 Cross-section of an EDS made of a flexible polyethylene terephthalate (PET) film
of 500 mm thickness on which transparent ITO electrodes of rectangular cross-section (width
10 mm, height 10 mm) are deposited with an inter-electrode spacing of 1000 mm. The electrodes are
embedded within a PU film coating with a film thickness of 50 mm. The thickness of the electrodes
is varied from 10 to 100 mm and the inter-electrode spacing from 100 mm to 1000 mm for opti-
mization of EDS operation
173Chapter | 5 Electrostatic Removal of Particles and its Applications

analysis shows that triangular-shaped electrodes as shown in Figure 5.7 wouldbe most preferred.
11.3. Removal of Charged and Uncharged Particles
When the electrodes are embedded within a dielectric film, and are excited withsine waves as shown in Figures 5.4, 5.5, 5.7, 5.10, and 5.12, both initiallycharged and uncharged particles with different electrical resistivities are effi-ciently removed from the EDS. The removal process for an initially charged (q)particle is due primarily to the Coulomb force, and for uncharged dielectricparticles the removal process is caused by dielectrophoretic force, as explainedbelow and illustrated in Figures 5.13 and 5.14. Figure 5.14 shows the inter-action of the uncharged conducting particle in the electrodynamic field, wherethe primary charging mechanisms are induction and tribocharging. In summary,the electrodynamic mechanisms involved in the dust removal process are:(1) Coulomb force; (2) dielectrophoretic force; (3) triboelectric charging;(4) induction charging; (5) non-uniform electric field distribution on the screensurface; and (6) temporal variation of the phased voltage waveform over thesurface of the screen.
FIGURE 5.11 The electric field has been modeled for three electrode configurations. The top
section shows electrodes with relatively large dimensions and large inter-electrode spacing. The
spatial distribution of the divergent electric field intensity is non-uniform. As the electrode
dimensions and the inter-electrode spacing are reduced, more uniform field intensity distributions
are achieved (middle and bottom sections)
174 Developments in Surface Contamination and Cleaning

12. DIELECTROPHORETIC FORCE
An electric field E produces some displacements of the electrons and ionswithin a dielectric particle. This process is similar to the polarization of anyatom when an external electric field distorts the electron cloud with respect tothe nucleus of the atom. In a microscopic particle, when two charges þqand �q are separated by a distance d, a dipole of moment qd is formed. Thecombined effect of each of these elementary dipoles within a microscopic
FIGURE 5.12 A charged (þq) particle of diameter 2 mm, located at A, is subjected to an AC
electrical field E0sin(ut) applied between the adjacent electrodes as shown. The frequency of the
electric field is 4 Hz
175Chapter | 5 Electrostatic Removal of Particles and its Applications

particle can be considered as a single polarization vector P as shown inFigure 5.13. By virtue of the dipole moment induced on the particle placed ina non-uniform electric field, the particle experiences dielectrophoretic force[21,22], expressed in eq. (5.31), in the field gradient produced by the appliedvoltage across the electrodes embedded in the screen.
Fd ¼ ðPVÞE (5.31)
where P is the polarization vector (field-induced dipole moment) and is equal tonp, where p ¼ qd, the dipole moment for each individual dipole within a singleparticle, and n is the number of dipoles. The translational dielectrophoreticforce Fd is proportional to the product P and grad E. A spherical particle ofradius r having a dielectric constant 32, resting on a medium of dielectricconstant 31, and experiencing an electric field gradient, will experience a forceFd which can be expressed as [21,22]:
Fd ¼ 2pr33132 � 3132 þ 31
VjEj2 (5.32)
Vo sin(ωt)PU film
Dielectric surface
Dipole moment on an
initially uncharged particle
Electrodes
FIGURE 5.13 An uncharged dielectric particle, deposited on the surface of a dielectric film, is
experiencing a dielectrophoretic force because of the induced dipole moment on the particle by the
applied non-uniform electric field
FIGURE 5.14 Induction charging of conducting and semi-conducting particles deposited on
a dielectric screen with embedded electrodes. 31 and 32 are the relative dielectric constants of the
screen and the particle, respectively
176 Developments in Surface Contamination and Cleaning

The direction of the force Fd (the upper bar is used for vector notation)depends upon the sign of the term (32 e 31). In a non-uniform electric field,the polarization force can induce vigorous motion of a neutral particlesuspended in a fluid medium (eq. (5.12)). If the permittivity of the particle ishigher than that of the medium, the dielectrophoretic force pulls the particletowards the region of higher field intensity. In an alternating field, anuncharged dielectric particle approaching the EDS will oscillate and rollback and forth. As the particle makes contact with the surface of the screen,the movement of the initially neutral particle will cause electrostaticcharging by triboelectrification. The acquired electrostatic charge, positiveor negative, will add Coulomb force of repulsion, lifting the particle off thesurface.
13. TRIBOCHARGING OF PARTICLES
When an uncharged dielectric particle is resting on the surface of the dielectricfilm (Fig. 5.13) and the electric field is then applied to the electrode system, itwill experience the translational dielectrophoretic force causing particlemotion over the polymer film. Since the force is proportional to the square ofthe field gradient and the field is oscillating, the fluctuations of the dielec-trophoretic force of attraction on the particle makes it roll or move along thefield gradient lines on the dielectric film surface. These particle motions on thedielectric surface of the screen cause the particle to become triboelectrified toa significantly high charge level. Thus, the initially uncharged particles restingon the screen are tribocharged, resulting in a net charge gain on the particlewhich causes the particles to jump off the screen by the Coulomb force ofrepulsion.
When the particles, charged or uncharged, in contact with a dielectricfilm oscillate or roll even with a small amplitude of motion due to Coulombor dielectrophoretic force, the associated friction against the surface of thescreen causes the particles to acquire triboelectric charges. The polarity andmagnitude of the charge depends upon the work function difference betweenthe two contacting surfaces. The added charge on the particle increases theamplitude of particle motion until the charge level is high enough for itsremoval from the surface. In the tribocharging process, there is a chargeexchange between the particle and the screen surface. Beside the workfunction difference, the charge level acquired by the particle will alsodepend upon the force of adhesion between the particle and the screensurface and environmental factors such as relative humidity. As the chargedparticles are lifted off, the screen surface remains charged with the samemagnitude but of opposite polarity, and thus it is necessary to drain thecharges from the film surface for its continued charge exchange operation fordust removal. It is, therefore, necessary to use an optimum level ofconductance in the dielectric film.
177Chapter | 5 Electrostatic Removal of Particles and its Applications
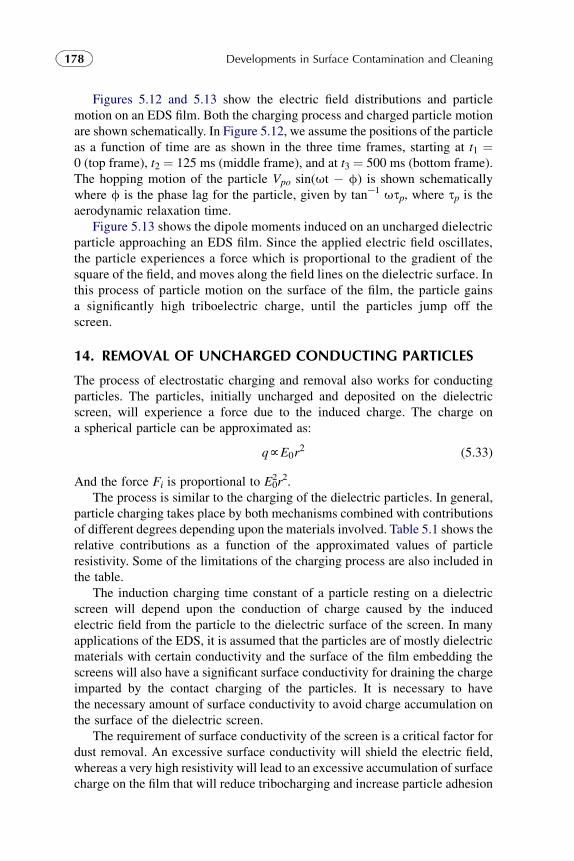
Figures 5.12 and 5.13 show the electric field distributions and particlemotion on an EDS film. Both the charging process and charged particle motionare shown schematically. In Figure 5.12, we assume the positions of the particleas a function of time are as shown in the three time frames, starting at t1 ¼0 (top frame), t2 ¼ 125 ms (middle frame), and at t3 ¼ 500 ms (bottom frame).The hopping motion of the particle Vpo sin(ut � f) is shown schematicallywhere f is the phase lag for the particle, given by tane1 usp, where sp is theaerodynamic relaxation time.
Figure 5.13 shows the dipole moments induced on an uncharged dielectricparticle approaching an EDS film. Since the applied electric field oscillates,the particle experiences a force which is proportional to the gradient of thesquare of the field, and moves along the field lines on the dielectric surface. Inthis process of particle motion on the surface of the film, the particle gainsa significantly high triboelectric charge, until the particles jump off thescreen.
14. REMOVAL OF UNCHARGED CONDUCTING PARTICLES
The process of electrostatic charging and removal also works for conductingparticles. The particles, initially uncharged and deposited on the dielectricscreen, will experience a force due to the induced charge. The charge ona spherical particle can be approximated as:
qfE0r2 (5.33)
And the force Fi is proportional to E02r2.
The process is similar to the charging of the dielectric particles. In general,particle charging takes place by both mechanisms combined with contributionsof different degrees depending upon the materials involved. Table 5.1 shows therelative contributions as a function of the approximated values of particleresistivity. Some of the limitations of the charging process are also included inthe table.
The induction charging time constant of a particle resting on a dielectricscreen will depend upon the conduction of charge caused by the inducedelectric field from the particle to the dielectric surface of the screen. In manyapplications of the EDS, it is assumed that the particles are of mostly dielectricmaterials with certain conductivity and the surface of the film embedding thescreens will also have a significant surface conductivity for draining the chargeimparted by the contact charging of the particles. It is necessary to havethe necessary amount of surface conductivity to avoid charge accumulation onthe surface of the dielectric screen.
The requirement of surface conductivity of the screen is a critical factor fordust removal. An excessive surface conductivity will shield the electric field,whereas a very high resistivity will lead to an excessive accumulation of surfacecharge on the film that will reduce tribocharging and increase particle adhesion
178 Developments in Surface Contamination and Cleaning

to the surface. The time constant for induction charging of the particle willdepend upon the product of the particle’s effective surface resistivity rp andthe dielectric constant 32 of the particle. If rp is the effective resistivity of theparticle on the screen surface, then the charging time constant sc can beapproximated as:
sc ¼ 3230rp (5.34)
where 30 is the permittivity of free space and is given by30 ¼ 8:854� 10�12F=m:
Induction charging takes place for all materials but becomes effective whensc << T ; where T is the time period of the applied electric field E0 sinðutÞ: Forexample, if rp ¼ 108 Um, and 32 ¼ 2.0, the charging time constant will beapproximately 2 ms, which is much shorter than 250 ms time period T if thefrequency of the applied AC field is 4 Hz. Figure 5.12 shows an example ofa 2.0 mm diameter particle trajectory if we consider that the particle hasacquired a positive charge q during the half cycle before t ¼ 0þ. For particleswith higher resistivity, the charging is due primarily to the combination ofdielectrophoresis, induction, and triboelectrification.
15. HIGH-VOLTAGE THREE-PHASE POWER SUPPLY FOR THEELECTRODYNAMIC SCREEN
15.1. Design Requirements
An EDS requires a high-voltage AC power supply to build an electrostatictraveling wave. The power supply design is mainly to meet the requirements for
TABLE 5.1 Electrostatic Charging Processes for Initially Uncharged Particles
Deposited on an Electrodynamic Screen Embedded in an Insulative
Polymer Film.
Particle Resistivity Charging Processes Limitations
r < 108 Um Induction chargingTriboelectrification
Film surface resistivity too highHigh humidity, r< 0.5 mm, lowelectric field
108 Um < r < 1011
UmInduction chargingDielectrophoretic motionTriboelectrification
Same as above
r > 1011 Um Dielectrophoretic motionTriboelectrification
Same as above, low workfunction difference betweenthe contacting surfaces
179Chapter | 5 Electrostatic Removal of Particles and its Applications

energizing the EDS electrodes, providing three-phase voltages with the featuresof variable frequency, variable amplitude, and experimental convenience. In thefollowing sections we discuss some fundamentals of EDS power supply andgive descriptions of two practical designs. We will also discuss the futuredesign of industry-standard EDS power supply.
An EDS power supply provides three-phase voltages with 120� phase shift.For various laboratory tests the required voltage amplitude may change fromseveral hundred volts to several kV. Operating frequency is adjustable fromseveral Hz to several hundred Hz. The power requirement is quite low for anexperimental EDS. For example, the required power for a 60-cm2 EDS is about10 mW which includes the power needed to operate the power supply. Muchsimpler design is also available for specific applications.
In most applications [23e25], the three-phase voltages are assumed to besinusoidal waveforms as shown in Figure 5.15a. However, in practice, thesquare-waveform voltages as shown in Figure 5.15b can also be applied to EDSoperation for dust removal. The main differences are the power consumption ofthe power supply, current waveforms, and system costs.
An EDS can be assumed as a capacitive load. When three-phase voltagesare sinusoidal, the three-phase currents are also sinusoidal and lead the voltagesby 90�. In the case of square-waveform of three-phase voltages, the three-phasecurrents have very large current harmonic contents and high peak values.
FIGURE 5.15 Three-phase voltages (a) in sinusoidal waveforms and (b) in square waveforms
180 Developments in Surface Contamination and Cleaning

However, a square-waveform Power supply has advantages of simple circuitdesign, low power losses, and low manufacturing costs.
As shown in Figure 5.16, an EDS power supply consists of: (1) a DC/DCconverter to generate a DC high voltage up to several kV; (2) an inverter toconvert DC high voltage to three-phase AC voltage outputs with 120� phaseshifts; and (3) control and protection units. The inverter control and circuitprotection against over-voltage and over-current faults are essential for EDSoperation.
15.2. MOSFET-Based EDS Power Supply
The EDS power supply works at high voltage and extremely low current. Ahigh-voltage metal oxide semiconductor field-effect transistor (MOSFET) issuitable. Linear MOSFETs can run up to 1.5 kV, while switching MOSFETscan operate up to 4 kV. Linear MOSFETs have an extended forward-bias safeoperating area and can be used to develop sinusoidal EDS power supply.Switching MOSFETs are mainly used for switching operations and can be usedfor square-waveform EDS power supply. For higher-voltage operation, seriesconnection of MOSFETs is possible.
FIGURE 5.15 (continued) Three phase square wave forms
181Chapter | 5 Electrostatic Removal of Particles and its Applications

An experimental design of a square-waveform EDS power supply is shown inFigure 5.17. By setting the input voltage from 0 to 12 V, we can control the DC/DC converter EMCO-F10 (EMCO High Voltage Corporation, Sutter Creek, CA)to generate a DC voltage from 0 to 1 kV. Two photographs of the EDS powersupply are shown in Figures 5.18a and 5.18b.
The inverter consists of three legs, each consisting of two MOSFETs(1.2 kV/4.5 U). Each leg provides a phase voltage output. By switching on andoff two MOSFETs in one leg sequentially, one square-waveform voltage isgenerated as shown in Figure 5.15b. The digital signal processing (DSP)controller is used to control MOSFETs of three legs to generate three-phaseoutput voltages in square waveforms. The frequency can be set from 0 to 1 kHz.The DSP controller also detects the DC-link voltage and current for measure-ment and system protection against over-voltage and over-current faults.
FIGURE 5.16 Block diagram of an EDS power supply
FIGURE 5.17 Schematic diagram of an experimental EDS power supply based on 1.2-kV
MOSFETs
182 Developments in Surface Contamination and Cleaning

The power circuit can be modified for higher voltage up to 3 kV bychanging the DC/DC converter and power MOSFETs. The highest voltagerating of single power MOSFETs available is 4 kV. For a voltage higher than3 kV, the circuit must be changed, for example, to connect several powerMOSFETs in series for higher voltage operation. The DC/DC converter of thesame series can reach up to 14 kV.
FIGURE 5.18 MOSFET-based EDS power supply (a) in a housing and (b) circuits in a PCB
183Chapter | 5 Electrostatic Removal of Particles and its Applications
15.3. High-Voltage Linear Amplifier-Based SinusoidalPower Supply
A simple solution to realize an EDS power supply in sinusoidal waveforms is touse high-voltage linear amplifiers. A high-voltage linear amplifier is able togenerate high-voltage output following the input waveform. The gain of theamplifier can be up to 50 dB. A high-voltage linear amplifier can actuallygenerate an arbitrary waveform depending only on the input signal.
An experimental EDS sinusoidal power supply is shown in Figure 5.19. Thehigh-voltage linear amplifier is AS3B1 (Matsusada Precision Inc., Shiga,Japan). A Labview workstation (not shown in Figure 5.19a) is applied togenerate control signals for three-phase voltages and data acquisition for EDSexperiments. The block diagram is shown in Figure 5.19b. The power supplycan generate three-phase voltages with the peak values frome3 kV to 3 kV, andfrequencies from 0 to 1.5 kHz. The power rating is 3 W.
Electrical design of high-voltage power supply is a mature technology inpower electronics. Single-phase high-voltage power supplies are commerciallyavailable. Such a commercial product is generally designed for special appli-cations and is expensive. For EDS operations, three-phase or other multi-phasehigh-voltage power supplies are required. The costs and physical sizes areimportant for the wide applications of EDS technology in the future. Hence, itis necessary to find the optimal design of EDS power supplies.
For the industry-standard design of EDS power supplies, there are still manyquestions to be answered by EDS investigations, such as how to select anoptimal operating frequency and voltage magnitude. It is expected that bothfrequency and voltage magnitude are strongly related to EDS applications: (1)the locations of the EDS application (for instance, on Earth or on Mars); (2) thecharacteristics of dust particles; and (3) the EDS size and power requirements.
The average power required for operating a three-phase screen constructedon a printed circuit board (PCB) with square wave excitation is shown inFigure 5.20. The power drawn by the electrodes (with 1 mm spacing) is shownfor three operating frequencies 4, 10 and 15 Hz. Similar power vs. appliedvoltage relationship for a transparent screen made of a polyethylene tere-phthalate (PET) screen with ITO electrodes (spacing 1 mm) is shown inFigure 5.21.
16. TESTING OF THE ELECTRODYNAMIC SCREEN
16.1. Experimental Setup
Transparent electrodynamic screens were originally developed for theirpossible applications to NASA’s Mars mission [23e25]. Experiments on testingthe screens for their dust removal efficiency (DRE) were carried out with Marsdust simulant. The dust samples were obtained from Johnson Space Center(JSC), Houston, TX, and from Jet Propulsion Laboratory, Pasadena, CA. The
184 Developments in Surface Contamination and Cleaning

FIGURE 5.19 Linear-amplifier-based EDS power supply (a) in a system test setup and (b) block
diagram
185Chapter | 5 Electrostatic Removal of Particles and its Applications

FIGURE 5.20 Power vs. voltage curves for a three-phase PCB EDS with 1-mm electrode
spacing
FIGURE 5.21 Power curves for a three-phase ITO electrode-EDS with 1-mm electrode spacing
186 Developments in Surface Contamination and Cleaning

dust was prepared from Hawaii volcanic dust with appropriate size classifica-tion and mineral oxide additives to simulate the predicted dust composition ofMars. The primary constituent of the dust is SiO2. The dust samples weresieved so that the upper size limit was approximately 40 mm in diameter.
Before each test, the dust sample was dried in an oven at a temperature of373 K for at least 24 hours. For each experimental run, a small amount of dustwas dispersed using a powder pump (a Venturi suction device) for aerodynamicdispersion of the dust inside a test chamber. The dispersion process forms anaerosol containing dust inside the test chamber as the particles were allowed tosettle on the screen. Alternatively, a sieve with 40 mm openings was used fordispersing the sample dust.
16.2. Size Classification
Test aerosols containing dust particles were classified by using a cycloneclassifier that removed the coarse particles with diameters larger than 10 mm.The fine fraction of aerosol was used for the tests. The Count MedianDiameter (CMD) of the fine dust ranged from 2 to 5 mm, and the Volume (orMass) Median diameter (MMD) ranged from 8 to 15 mm. This size rangeagrees with the anticipated Martian dust cloud, as well as with the sizedistribution of desert dust.
16.3. Charge Conditioning of Dust Cloud
The dust removal efficiency of the EDS was tested against both charged andneutral dust samples. For charging the particles of the test aerosol, coronachargers were used for unipolar charging, either with positive or negativepolarity. In most cases, however, the dust particles were tribocharged bytumbling against stainless steel or Teflon� beads in a stainless steel orTeflon�-lined container [26]. The dust dispersion process creates a cloud-charged particle with both negative and positive polarities. For neutralizingthe dust particles, a charge neutralizer was used. The charge neutralizationprocess consists of introducing bipolarly charged ions inside the test chamber.As the dust particles deposit inside the chamber in an atmosphere containingboth positive and negative ions, the charge-to-mass ratio decreases asa function of time. Charge neutralization was necessary for testing the screenperformance against uncharged particles [27e29].
16.4. Test Procedure
A dust cloud chamber with an appropriate air filtration system was used fortesting the EDS devices operating with either single- or three-phase AC drive.The test EDS was placed near the bottom of the chamber while the test aerosolwas introduced at the top. The size and charge distributions of particles were
187Chapter | 5 Electrostatic Removal of Particles and its Applications
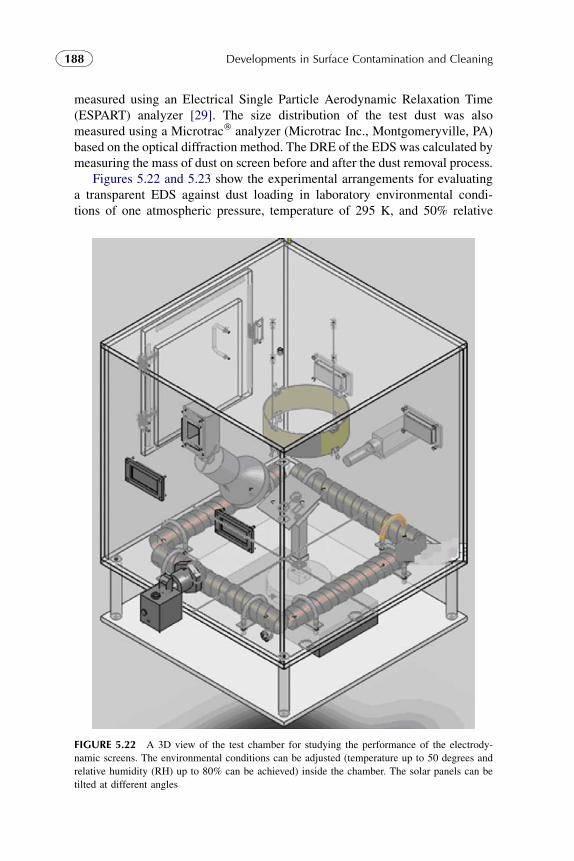
measured using an Electrical Single Particle Aerodynamic Relaxation Time(ESPART) analyzer [29]. The size distribution of the test dust was alsomeasured using a Microtrac� analyzer (Microtrac Inc., Montgomeryville, PA)based on the optical diffraction method. The DRE of the EDS was calculated bymeasuring the mass of dust on screen before and after the dust removal process.
Figures 5.22 and 5.23 show the experimental arrangements for evaluatinga transparent EDS against dust loading in laboratory environmental condi-tions of one atmospheric pressure, temperature of 295 K, and 50% relative
FIGURE 5.22 A 3D view of the test chamber for studying the performance of the electrody-
namic screens. The environmental conditions can be adjusted (temperature up to 50 degrees and
relative humidity (RH) up to 80% can be achieved) inside the chamber. The solar panels can be
tilted at different angles
188 Developments in Surface Contamination and Cleaning

humidity (RH). Mars simulant dust (JSC-1) was used for testing the panels.The dust simulant was first size classified after grinding the dust witha laboratory milling machine and using a cyclone size classifier to classifythe dust to obtain particles with CMD smaller than 10.0 mm. A vibratory dustfeeder and a powder pump were used to disperse the dust sample inside thechamber. The dust particles were allowed to settle for about 10 minutesbefore testing the DRE. The structure and uniformity of the dust layer wereexamined with a microscope.
Measurement of DRE was performed: (1) for positively and negativelycharged dust (with corona charging), dust particles that were charged withbipolar charge distribution (tribocharging), and with neutral particles (dustparticles with a very low charge); (2) with different dust loadings on the screen(measured in mg/cm2); and (3) continuous and intermittent operation of theEDS. The dust loading on the EDS was measured gravimetrically. The size andcharge distributions of the test dust were measured by sampling the particlesfrom the dust cloud inside the chamber.
Figure 5.24 shows an experimental arrangement for testing EDS under lowatmospheric pressure. In this case, the screen was placed inside a vacuumchamber. The chamber was evacuated to a low pressure of 0.5 kPa and refilledwith CO2. The process was repeated several times to reduce the concentration ofoxygen and experiments were conducted at 1 kPa pressure in a CO2 environmentwhich approximately simulates the Martian atmosphere.
φ1 φ2 φ3Electrodynamic screen
(flexible)
Glass support
Solar panel
Vibrator
Mars dust simulant
Brush
Solar lamp/UVradiation
Bipolar iongeneration
Screen
3-Phase high voltage (0-2000 V) AC drive (low current)
Output
AC high voltage
Fan
FIGURE 5.23 An experimental setup for testing transparent electrodynamic screens against
mass loading of test dust under normal atmospheric conditions
189Chapter | 5 Electrostatic Removal of Particles and its Applications

17. MEASUREMENT OF MAXIMUM POWER POINTOPERATION OF THE PV SYSTEM WITH EDS
The PV systems require external power conditioning electronic circuitry tooperate solar cells for delivering maximum power to the load connected to thePV system. Without this control system, the efficiency of the solar panel will becompromised by not operating at the maximum power point (MPP) of thesystem for which it is designed. Power conditioning and control circuitry isalmost always used to measure the current and voltage output of the solarpanels, and to adjust the voltage to allow the modules to operate at their MPP. Itis therefore necessary to test the solar panel output at its MPP operation. Asdust builds up on the panel surface and occludes the light from illuminatingthe solar cells, the performance of the PV system degrades. To determine if thechange in PVoutput power is caused by a decrease in the insolation due to theapparent motion of the sun or by a cloud cover, or by dust deposition, anexternal panel surface monitor will have to be used for detecting dust depo-sition and energizing the EDS system. This monitor detects the surface densityof deposited dust on the panel and provides a signal to the power control deviceto energize the EDS, which will remove dust from the panels as needed andmaintain the operation at its maximum efficiency.
FIGURE 5.24 Experimental arrangement for testing the EDS under Martian atmospheric
conditions (0.5 to 1.0 kPa pressure, CO2 atmosphere) to determine the dust removal efficiency as
a function of dust loading. For each experiment, the total power requirements for removal of the
dust layer were measured as functions of applied voltage pulses and the frequency of operation
190 Developments in Surface Contamination and Cleaning

18. TESTING THE SOLAR PANELS INTEGRATED WITH EDS FORMAXIMUM POWER POINT OPERATION
To test an EDS-integrated solar panel’s performance with external MPP controlcircuitry, a test chamber was designed for depositing dust on the panel surfaceunder different ambient conditions. Figure 5.23 shows a schematic view of thesolar panel test chamber, constructed to control the intensity of light incident onthe solar panel, the tilt angle of the panel, relative humidity inside the chamber,and the surface mass concentration of dust dispersed onto the solar panel. Thetest panels can be evaluated under different conditions while tracking andmeasuring the maximum power of the solar panel. The light sources used areeither a solar simulator (xenon lamp), or a pulse width modulation (PWM)-controlled light-emitting diode (LED) light source for lower intensity (10W/m2)applications. Both light sources can be tested to have precise irradiance forexperiments. Dust can be deposited by using a vibrating sieve or a powderpump to control the amount of dust occluding the panel, and a microbalance isused to measure the change in weight of the panel before and after testing.
Before dust is deposited on the solar panel, measurements can be taken todetermine the maximum power of the clean solar panel. Because the current ofthe solar panel will be determined by the amount of light on the panel, thepower output may not be maximized even under the clean condition. As shownin Figure 5.25, the output voltage can be adjusted to obtain the MPP operationof the solar panel.
To adjust the voltage output of the PV modules to be applied to the load forits operation at the MPP, a DCeDC converter is used. In its simplest form, thiscan be realized by a resistive load that can be varied to change the voltage dropgoing to the load, or by using a commercial voltage regulator integrated circuitthat can have a variable voltage output, such as the LM317 (National Semi-conductor, Santa Clara, CA) shown in Figure 5.26.
FIGURE 5.25 Maximum power point operation of a solar panel
191Chapter | 5 Electrostatic Removal of Particles and its Applications

The method most often used for adjusting the voltage is a boost/buckvoltage converter, which incorporates an inductive circuit and a MOSFETswitch to control the load voltage from the solar panel output. The MOSFETswitch can be controlled by a PWM signal, which varies the amount of timethe switch is in the open or closed state. This will, in turn, increase or decreasethe voltage, which can be used to obtain the MPP. The circuit shown inFigure 5.27 is often used as a converter.
With an efficient method of voltage control in place, the circuitry canmonitor the input voltage and change the output voltage levels to find the MPPoperation. This function is known as maximum power point tracking (MPPT).A microcontroller with an appropriate analog-to-digital converter is used toperiodically measure current and voltage from the panel, and an algorithm isimplemented to change the PWM signal to switch the MOSFET to keep itoperating at the MPP. Commercial electronics are readily available thatperform MPPT functions for solar panel arrays.
FIGURE 5.26 Application of an integrated circuit (IC) to control the output voltage for MPP
operation
FIGURE 5.27 Voltage converter for MPP operation
192 Developments in Surface Contamination and Cleaning

Once the MPPT functions have been realized, the maximum power of theclean panel can be measured. After this, the test dust can be deposited onto thepanel, and the decreased power output from the solar panel can be measured atits current maximum power output under dust loading. The EDS panel can thenbe activated to clean the solar panel, and the maximum power is measured onceagain. To implement a smart EDS system for automatic operation, photo-detectors or small cameras can be used to observe the dust layer on the solarpanels, and a threshold level can be set to activate the EDS cleaning systemusing power from the solar panel.
At each step in the measurement process, the cleaning efficiency can bemonitored by the weight measurements taken before dust deposition, after dustdeposition, and once again after EDS cleaning. By integrating weight, irradi-ance measurements, power measurements, and other environmental measure-ments into a localized microcontroller, data can be gathered on all aspects ofthe operation. This can be used to determine the dust concentration per unitarea, power output as a function of dust loading, and cleaning efficiency indifferent environmental conditions.
19. RESULTS
The particle size analysis of JSC Mars-1 simulant dust measured using theMicrotrac� analyzer is shown inFigure 5.28.Thed10,d50,d90 valueswere found tobe 1.22 mm, 9.06 mm, and 38.45 mm, respectively. The CMD of simulant dustusing an ESPARTanalyzer was 3.66 mm (standard deviation 0.19, n ¼ 15). The
FIGURE 5.28 Size distribution of Mars dust simulant measured by an ESPART analyzer
193Chapter | 5 Electrostatic Removal of Particles and its Applications

charge distribution measurements were also performed using an ESPARTanalyzer and are shown in Figure 5.29.
The net charge-to-mass ratio (Q/M) of simulant dust measured with anESPART analyzer was 2.7 mC/g, as shown in Figure 5.30. This charge distri-bution was the result of (1) inter-particle charging; (2) tribocharging duringgrinding; and (3) handling processes.
In the dispersion process the dust particles became charged. Some of theexperiments were performed by deliberately charging the particles either witha net positive charge or with a net negative charge. When the dust was tribo-charged against a Teflon� surface, the particles were mostly charged positivelyand were negatively charged against a stainless steel surface. When the parti-cles were neutralized, most of the particles showed charge close to zero. Theperformance of the screen was analyzed for dust with a net positive charge anda net negative charge, and for mostly neutral particles (Fig. 5.31). It was foundthat the efficiency of the screen did not deteriorate for neutral particles[27e29].
A DRE of 85% was obtained for charged Mars dust simulant whenexcited by single-phase AC. The effect of particle size on DRE was alsostudied for a three-phase EDS system. A DRE of over 90% was achievedfor an EDS with 1.27 mm electrode spacing (Fig. 5.31). Figure 5.32 showsthe DRE with and without neutralization of the Mars dust simulant. TheEDS system was found to be equally effective for charged and neutralparticles.
FIGURE 5.29 Charge distribution of Mars dust simulant as measured by an ESPART analyzer.
The particles were bipolarly charged as shown in the figure
194 Developments in Surface Contamination and Cleaning

FIGURE 5.30 The net charge-to-mass ratio in mC/g of Mars dust simulant particles measured
using an ESPART analyzer varied depending on the process conditions. The particles became
charged primarily during the dispersion process
FIGURE 5.31 Dust removal efficiency of a three-phase EDS operating at 750, 1000, and
1250 volts (electrode spacing ¼ 1.27 mm, electrode width ¼ 0.127 mm, f ¼ 4 Hz, cleaning
operation time ¼ 60 s)
195Chapter | 5 Electrostatic Removal of Particles and its Applications

20. SUMMARY AND CONCLUSIONS
We have presented here the basic principles of EDS operation for removingdust particles from solar panels. In most of our tests three-phase operationproduced better dust removal efficiency compared to the single-phase opera-tion. It appears that the traveling wave plays an important role in dust removal.
The mathematical analysis provides an outline for the operation of the EDSfor charged and uncharged particles driven by traveling or standing wavevoltages. The analysis presented here has made simplifying assumptions thatenvironmental conditions are ideal for the EDS operation and that the self-fieldfrom the charged particles, including image forces, are negligible compared tothe imposed fields from the traveling and standing wave voltages.
The test results show that EDS operation remains efficient for all of thethree charging conditions: (1) positively charged particles; (2) negativelycharged particles; and (3) neutral particles with a net charge close to zero. Thedesign for constructing the EDS has also been empirically optimized. However,most of the tests performed to date have been conducted at atmosphericpressure and at low pressure close to 1 kPa (for Mars applications).
A major problem in operating the EDS will be to avoid Paschen breakdownof the electrodynamic field applied across the electrodes. The breakdownvoltage, or the sparking potential, according to Paschen’s law is a function ofthe product pds, where p is the ambient pressure and ds is the distance betweenthe electrodes. The breakdown field is not a linear function of pds; it dependsupon the actual value of ds and the number of collisions made by the electron incrossing the gap dswhich depends upon the density of the surrounding medium.
The electrodynamic screens are made of transparent plastics, such as PETfor its ultraviolet (UV) radiation resistance, and a set of parallel conducting
FIGURE 5.32 Dust removal efficiency of a three-phase EDS with and without charge neutralizer
(electrode spacing ¼ 1.27 mm, electrode width ¼ 0.127 mm, peak-to-peak voltage ¼ 1250 V,
f ¼ 4 Hz, run time ¼ 60 s, count median (aerodynamic) diameter of the dust particles ¼ 3.66 mm,
d10 ¼ 1.22 mm, d50 ¼ 9.06 mm, d90 ¼ 38.45 mm)
196 Developments in Surface Contamination and Cleaning

electrodes, made of transparent ITO or a conducting polymer, embedded undera thin transparent film on the surface. The transparent plastic film EDS can beefficiently used for protecting solar panels from dust deposition and obscura-tion of solar radiation. However, for actual terrestrial application, the EDSsystem needs to be integrated with the solar panel during the manufacturingprocess.
By applying a three-phase high-voltage AC electric field to the electrodes,the resulting electrodynamic field repels and removes dust particles from thescreens, regardless of whether the dust particles are initially charged oruncharged. Test results show that self-cleaning solar panels may be manufac-tured by incorporating electrodynamic screens that derive their power outputfrom the solar panels. For the power output requirements with a three-phasepulsed high-voltage power supply, it is estimated that approximately 10 W maybe needed from the solar panel per square meter of the solar panel, a smallfraction of power only when cleaning is needed. Under normal atmosphericconditions in desert locations, only a few minutes of cleaning will be neededper day. More frequent cleaning will be needed during dust storms.
ACKNOWLEDGMENTS
Both the theoretical and experimental studies were pursued jointly at the Department of
Applied Science, University of Arkansas at Little Rock (UALR), Laboratory for Electro-
magnetic and Electronic Systems, Massachusetts Institute of Technology (MIT), Electro-
statics and Surface Physics Laboratory, NASA Kennedy Space Center (KSC), NASA Jet
Propulsion Laboratory, and Appalachian State University. The research was supported by
a NASAGrant NRA 02-0SS-01 (ROSS-2002), JPL Contract No. 1263202. We are thankful to
Rao Surampudi and Chester Chu of JPL for their continued support for EDS development. We
are thankful to Sid Clements of ASU, Jim Mantovani of NASA KSC, Praveen Srirama, David
Clark and Chris Wyatt of UALR, and Mark Zahn of MIT for their contributions to this study.
REFERENCES
[1] K. Kurokawa, K. Komoto, P. van der Vleuten, D. Faiman (Eds.), Energy from the Desert.
Practical Proposals for Very Large Scale Photovoltaic Systems, Earthscan, London, UK,
2006.
[2] T. Markvart (Ed.), Solar Electricity, second ed., John Wiley & Sons, West Sussex, UK, 2000.
[3] M.S. El-Shobokshy, F.M. Hussein, Degradation of Photovoltaic Cell Performance due to Dust
Deposition on to Its Surface, Renewable Energy 3 (1993) 585.
[4] M.K. Mazumder, A.S. Biris, C.U. Yurteri, R.A. Sims, R. Sharma, C.E. Johnson, et al., Solar
Panel Obscuration by Dust in the Martian Atmosphere, in: K.L. Mittal (Ed.), Particles
on Surfaces 9: Detection, Adhesion and Removal, VSP, Utrecht, The Netherlands, 2006,
pp. 167e195.
[5] M.A. Green, Solar Cells: Operating Principles, Technology, and System Applications,
Prentice-Hall, Englewood Cliffs, NJ, 1980.
[6] G. Landis, Mars Dust Removal Technology, J. Propulsion and Power 14 (1998) 126.
197Chapter | 5 Electrostatic Removal of Particles and its Applications

[7] D.Y. Goswami, F. Kreith, J.F. Kreider (Eds.), Principles of Solar Engineering, second ed.,
Taylor and Francis, Philadelphia, PA, 2000.
[8] E. Aguado, Effect of Advected Pollutants on Solar Radiation Attenuation: Mojave Desert,
California, Atmospheric Env. Part B. Urban Atmosphere 24 (1990) 153.
[9] http://interestingenergyfacts.blogspot.com/2008/04/us-solar-energy-map.html
[10] D. Mei, L. Xiushan, S. Lin, W. Ping, A Dust Storm Process Dynamic Monitoring with Multi-
Temporal Modis Data, in Proc. ISPRS Congress Beijing, The International Archives of the
Photogrammetry, Remote Sensing and Spatial Information Sciences, vol. 37 (2008)
965e970. Part B7.
[11] H. Chanson, Dust Storm over Brisbane on 23 September 2009 e During and After, Working
paper, School of Civil Engineering, University of Queensland, Brisbane, Australia, 2009. See
also: A. Ramachandran, Sydney Turns Red: Dust Storm Blankets City, The Sydney Morning
Herald, September 23, 2009. http://www.smh.com.au/environment/weather/sydney-turns-
red-dust-storm-blankets-city-20090923-g0so.html.
[12] W.C. Hinds, Aerosol Technology. Properties, Behavior, and Measurement of Airborne
Particles, second ed., John Wiley & Sons, New York, NY, 1999.
[13] C.F. Bohren, D.R. Huffman, Absorption and Scattering of Light by Small Particles, Wiley
Science Paperback Series, Chichester, UK, 1998.
[14] J.R. Robison, C. Wyatt, J. Diaz, J. Zhang, R. Sharma, M.K. Mazumder, Development and
Testing of Large Area Electrodynamic Screens for Deployment on Mars Missions, Proc.
Electrostatic Society of America Annual Meeting, 2007 pp. 227e233.
[15] J.R. Melcher, Traveling-Wave Induced Electroconvection, Phys. Fluids 9 (1966) 1548.
[16] S. Masuda, Electric Curtain for Confinement and Transport of Charged Aerosol Particles,
Proc. Conference on Electrostatics, June 8e11, Albany, NY, 1971.
[17] S. Masuda, K. Fujibayashi, K. Ishida, H. Inaba, Confinement and Transportation of Charged
Aerosol Clouds by Electric Curtain, Electronic Eng. Japan 92 (1972) 9.
[18] F.M. Moesner, T. Higuchi, Traveling Electric Field Conveyor for Contactless Manipulation of
Microparts, Proc. IEEE Indus. Applics. Soc. Mtg 3 (1997) 2004.
[19] P. Atten, H.L. Pang, J.L. Reboud, Study of Dust removal by Standing-Wave Electric
Curtain for Application to Solar Cells on Mars, IEEE Trans. Industry Applics 45
(2009) 75.
[20] M.K. Mazumder, R.A. Sims, J.D. Wilson, Transparent Self-Cleaning Dust Shield, U.S. Patent
6,911,593 (2006).
[21] H.A. Pohl, Dielectrophoresis, Cambridge University Press, Cambridge, UK, 1978.
[22] J.A. Cross, Electrostatic Principles, Problems and Applications, Taylor and Francis, Adam
Hilger Imprint, Bristol, UK, 1987.
[23] M.K. Mazumder, R. Sharma, A.S. Biris, J. Zhang, C.I. Calle, M. Zahn, Self-Cleaning
Transparent Dust Shields for Protecting Solar Panels and Other Devices, Particulate Sci.
Technol. 25 (2007) 5.
[24] C.I. Calle, C.R. Buhler, J.G. Mantovani, J.S. Clements, A. Chen, M.K. Mazumder, et al.,
Electrodynamic Shield to Remove Dust from Solar Panels on Mars, Proc. 41st Space
Congress, April 27e30, Cape Canaveral, FL, 2004.
[25] A.S. Biris, D. Saini, P.K. Srirama, M.K. Mazumder, R.A. Sims, C.I. Calle, et al., Electro-
dynamic Removal of Contaminant Particles and its Applications, in Conf. Record 39th IEEE
IAS Annual Mtg., Seattle, WA, vol. 2, 2004 pp. 1283e1286.
[26] S. Trigwell, Correlation between Surface Structure and Tribocharging of Powders, Ph.D.
Dissertation, University of Arkansas at Little Rock, Little Rock, AR, 2003.
198 Developments in Surface Contamination and Cleaning

[27] C.E. Johnson, P.K. Srirama, R. Sharma, K. Pruessner, J. Zhang, M.K. Mazumder, Effect of
Particle Size Distribution on the Performance of Electrodynamic Screening Systems, in Conf.
Record 40th IEEE IAS Annual Mtg., Hong Kong, vol. 1, 2005, pp. 341e345.
[28] C.I. Calle, M.K. Mazumder, C.D. Immer, C.R. Buhler, J.S. Clements, P. Lundeen, et al.,
Controlled Particle Removal from Surfaces by Electrodynamic Methods for Terrestrial,
Lunar, and Martian Environmental Conditions, Electrostatics 2007, J. Physics: Conference
Series 142 (2008) 012073.
[29] R. Sharma, C.A. Wyatt, J. Zhang, C.I. Calle, N. Mardesich, M.K. Mazumder, Experimental
Evaluation and Analysis of Electrodynamic Screen as Dust Mitigation Technology for Future
Mars Missions, IEEE Trans. Industry Applics. 45 (2009) 591.
199Chapter | 5 Electrostatic Removal of Particles and its Applications

This page intentionally left blank

Chapter 6
Alternate Semi-AqueousPrecision Cleaning Techniques:Steam Cleaning and SupersonicGas/Liquid Cleaning Systems
Rajiv Kohli,The Aerospace Corporation, NASA Johnson Space Center, 2525 Bay Area Blvd, Suite 600,
Houston, TX 77058, USA
Chapter Outline1. Introduction 201
2. Precision Steam Cleaning 202
3. Supersonic Gas-Liquid
Cleaning
212
4. Summary 231
Disclaimer 231
References 231
1. INTRODUCTION
For many decades precision cleaning in industrial applications has involved theuse of a variety of solvents, many of which are deemed detrimental to theenvironment [1,2]. In the late 1990s, many new concerns were raised forenvironmental protection. Concerns about ozone depletion, global warming,and air pollution led to new regulations and mandates for the reduction ofchlorinated solvents, hydrochlorofluorocarbons (HCFCs), trichloroethane, andother ozone-depleting solvents. The search for alternate cleaning methods toreplace these solvents has led to the consideration of various alternate cleaningsystems [3e5 and references therein]. This chapter describes two alternatesemi-aqueous cleaning methods, precision steam cleaning and supersonic gas-liquid cleaning.
Developments in Surface Contamination and Cleaning.
Copyright � 2011 Elsevier Inc. All rights reserved. 201

2. PRECISION STEAM CLEANING
2.1. Background
Steam can be a practical and environmentally friendly method to clean withoutthe use of solvents. Vapor steam cleaning has been used in a variety of appli-cations from household to industrial to military to medical. Steam can begenerated by simply boiling water; however, it is the combination of temper-ature and pressure that makes steam cleaning effective. A steam cleaner isa highly beneficial piece of equipment for all home, commercial, and industrialapplications requiring sanitizing, disinfecting, and cleaning capabilities ina single machine. Most people are familiar with the corner car wash enginesteam cleaners that remove oil, grease, and grime from the engine witha pressurized steam spray. Other types of steam systems are used in carpetcleaning and other household applications [6,7], although in many cases, thesecleaning systems employ hot water rather than steam for cleaning. The realsteam cleaning systems are growing in popularity because of the ability ofsteam vapor to kill germs and microbes and, in some cases, disinfect withoutthe use of chemical disinfectants [8]. Steam vapor has also been shown to beeffective in killing dust mites in carpet, bedding, and upholstery [7,9]. Tele-vision infomercials tout the ability of small steam generators to clean house-hold dirt, grime, dust, and germs among other contaminants [10]. Thesehousehold systems generally operate at low pressure (0.3e0.6 MPa). Largecommercial steam systems operating at higher pressure (up to 2 MPa) areutilized in industrial applications (often utilizing boilers and pressure vessels)as degreasers and for cleaning tools and large surfaces [10,11]. One novelapplication is weed control with steam which has an interesting fringe benefitof sterilizing the soil [10].
Medical applications call for sterilization and disinfection of surfaces suchas tools, hospital rooms, and restrooms with steam [8]. In 2005, the Universityof Washington tested a steam vapor system in restrooms and reported laborsavings and hygienic improvements compared with traditional cleaningmethods such as mechanical scrubbing with detergent solutions [13]. A recentinnovation involves the addition of low zeta potential mineral crystals to thesource water to produce an enhanced type of steam vapor that has been shownto kill a broad range of microorganisms after 3e5 seconds’ exposure to steam[14]. Kunze-Concewitz [15] had proposed a method using both water and steamfor removing particle residue from chemical mechanical planarization ofsemiconductor wafers and other applications that require super-clean surfaces,such as manufacture of liquid crystal display products and magnetic disks forhard drives.
Steam can also be used for precision cleaning applications where contam-ination must be removed at a microscopic level. Due to its fluid properties asa vapor (low viscosity), steam has the ability to penetrate inaccessible areas
202 Developments in Surface Contamination and Cleaning
where other fluid cleaning methods may be unsuccessful. This is especiallyimportant when cleaning printed circuit boards to penetrate blind vias and holesand to penetrate contacts and terminations to remove residual flux that maycause increased electrical resistance and corrosion. Precision steam cleaning isused to remove adhesive, flux, oil, grease, fingerprints, and other contaminantsfrom optics and electronic components, automotive components, variouscomponents in the defense industry, jewelry and gems, medical instruments,and dental implants [16e25].
2.2. Principle of Steam Cleaning
Plain water is not an effective medium for dissolving hydrocarbons such assoils and greases, but it has the capability to dissolve many inorganiccompounds. By using the principle that chemical reaction rates increase withtemperature, water heated to create superheated steam becomes a very effectivecleaning agent for hydrocarbon compounds. The combination of moisture,heat, and pressure of superheated steam provides the means for immediateremoval of contaminants from a surface. The hydrocarbon compounds becomeless viscous at higher temperatures (some of these compounds may even melt),making it easier to remove them from the surface. For solid contaminants,cleaning is primarily breaking the bond between the contaminant and thesurface and the high-pressure steam spray becomes an effective removal agentfor solid contaminants. Furthermore, steam also exhibits the fluid properties ofa gas which makes it very effective in penetrating the surface boundary layerand accessing tight spaces. The viscosity of steam at 573 K is in the range20.279 to 20.076 mPa.s for pressures from 0.2 to 2 MPa as compared with theviscosity of liquid water at 373 K in the range 281.74 to 282.22 mPa.s forpressures from 0.2 to 2 MPa [26].
2.3. Description of Steam Cleaning System andEquipment [16e25]
A suitable water source is used to pump a metered amount of deionized orotherwise filtered or purified water into the steam generator. A dispersingnozzle or atomizer may be incorporated in the steam generator which enhancessteam generation because it disperses the incoming water into small waterdroplets and directs them onto the heated inner surfaces of the steam generationpot. The water droplets convert instantly to high-pressure superheated steam.
The steam which is generated leaves the steam generator by means ofa conduit located in the upper half of the generator. The superheated steam iscarried to a suitable external nozzle or wand assembly and can be directed asa jet spray onto the part to be cleaned. An operator-activated switch cyclicallydraws water into the pump to initiate the steam generation process. For smaller
203Chapter | 6 Alternate Semi-Aqueous Precision Cleaning Techniques

single tank models, a short recovery time is required for steam to be generatedfor each cycle.
Moisture content of the steam can range from 5% (dry steam) to 99% (wetsteam, a combination of steam and hot water). Dry steam systems use very littlewater because the vapor is created at a high temperature with very low moisturecontent between 5 and 6% water. These systems use high pressures but lesswater for precision and delicate cleaning tasks. A quarter cup of water producesabout 1135 liters of steam. Average water use rates range from 3.78 to 19 litersper 8-hour work shift.
The steam pressure needed for the systems to obtain the heat for cleaning isproduced by a boiler made primarily from stainless steel. Stainless steel offershigher safety margins and is more resistant to scaling, pitting, and corrosionwhich can contaminate the substrate being cleaned.
The part surfaces are often warmed enough during cleaning to dry quickly.However, a drying stage may be needed to prevent oxidation or corrosion ofsensitive parts. Flash rusting may be a problem for some materials andpreventive measures, such as the use of a rust inhibitor, may be required forsuch parts.
Two types of cleaning units are available. Single tank units have a boilerthat is filled directly with water. When the machine runs empty of water, it willneed to be cooled before opening the safety pressure cap and refilling withwater. The bigger the boiler capacity the longer is the operating time. Modernunits also offer a continuous-fill system which consists of a separate non-pressurized, non-heated water tank and the boiler. This allows the machine tobe refilled at any time without waiting to cool down the machine. The level ofthe water in the boiler is constantly detected by a special sensor. This means nodowntime because there is always a constant amount of water in the boiler. Theflash-heat design typically requires 6e8 minutes’ start-up time, although onemodel has a start-up time of 1 minute [18].
Sloan and Bellegarde [27] developed a new heating system that has beenincorporated into the micro precision steam cleaners offered by VaTranSystems [19]. This new heating system in the boiler cavity employs a smoothheating surface made from material with interconnecting pores that veryeffectively overcomes the Leidenfrost effect [28]. The Leidenfrost effect isa phenomenon in which a liquid drop impinging on a surface significantlyhotter than the boiling point of the liquid immediately forms an insulatingvapor layer (approximately 0.06 mm thickness at 433 K [29,30]) whichdecreases the heat transfer from surface to the liquid and keeps the liquid fromboiling rapidly. The pores in the heating surface act as escape passages for theinsulating vapor layer, which reduces the thickness of the layer and increasesthe contact of the droplets with the heated surface. This significantly enhancesthe conversion of impinging water droplets into steam compared to othersystems [31e35].
204 Developments in Surface Contamination and Cleaning

The steam cleaners for precision cleaning applications can be provided withcontinuous steam spray capabilities without the use of boilers and pressurevessels. This is an important safety consideration since pressurized steamstorage requires the use of pressure vessels that must meet strict safetyrequirements. Most models superheat steam for on-demand use of up to 20minutes, which is long enough for most cleaning applications. Various modelsare equipped with other safety features such as an audible or visual water-levelindicator, automatic check valve to prevent pressure build-up, and automaticshut-off feature.
Most models come with a trigger wand assembly and interchangeablenozzles, including single jet for a straight stream; fan jet for a flat spray to cleanlarger areas; and peripheral nozzles for hole and tube cleaning. The steamdelivery system could be hand-held (pistol grip) which affords the operatordirect steam control. It allows the user freedom of movement when working onsmall parts. By contrast, the stationary delivery systems have built-in steamnozzles which allow the operator to grasp the part with two hands for greatercontrol. Precision steam cleaners are lightweight (6e25 kg) and are easilytransportable wherever cleaning is required.
The waste management system usually includes a cabinet, exhaust fans,spotlights, and cart. Clear vinyl curtains enable the operator to see productsbeing cleaned and avoid splashing. The waste management system hasa removable drip pan to capture any contaminant residue. Steam cleaners usevery little water to do a large amount of cleaning, which means less waste fordisposal.
The typical range of specifications of commercial precision cleaning units isgiven below.
Steam cycle time range 1e20 minutesVoltage 100e240 VACFrequency 50e60 HzPower requirement 1700e3000 WSteam pressure 0.2e2 MPaSteam temperature 373e573 KNozzle Fixed single jet or multiple jets; customizable for
given applicationTank capacity 3e5 litersExternal dimensions 21e38 cm � 33e44 cm x 20e33 cmWeight 8e25 kgInternal materials ofconstruction
Stainless steel, brass, Teflon� hose. Wetted brasssurfaces are suitable for non-contamination-sensitiveapplications such as jewelry cleaning
System operation Single tank for intermittent operation; twin tanks forcontinuous operation; foot- or hand-operated pedal;pistol-grip or straight nozzle
Start-up time 1e30 minutes
205Chapter | 6 Alternate Semi-Aqueous Precision Cleaning Techniques

Examples of different precision steam cleaners are shown in Figure 6.1.For medical instrument cleaning applications, the instruments frequently
need a manual pre-cleaning step to remove contaminants built up in difficult-to-access locations, primarily due to the design, shape, and construction of theinstruments. Often, these contaminants are not removed when the instrumentsare cleaned in automatic washers before reuse. Recent surveys in severalhospitals in Germany indicated that between 5 and 15% of the surgicalinstruments required a pre-cleaning step to effectively remove all residualcontaminants after cleaning/disinfection for reuse of the instruments [36].
FIGURE 6.1 Examples of commercial precision steam cleaners. (a) VaTran micro precision
steam cleaner. (b) Elmasteam high-performance steam jet cleaners. (c) Steamshine Lotus model
steam cleaners. (d) Reliable Model i700A. (e) Mini-Max cleaner [19e23]. Courtesy of VaTran
Systems, Chula Vista, CA; Elma GmbH, Singen, Germany; C.D. Nelson Consulting, Lakemoor,
IL; Reliable Corporation, Toronto, Canada; and PDQ Precision, San Diego, CA
206 Developments in Surface Contamination and Cleaning

A variety of attachments and adapters (Fig. 6.2) are available for precisionsteam cleaning of difficult-to-clean medical instruments such as endoscopes,catheters, and orthopedic and dental handpieces [36,37]. A Luer-Lockconnector [38,39] allows instruments with the respective coupling device to beconnected directly to the handpiece, so that the steam spray can be guided intothe rinsing channel of the instrument to clean precisely where it is requiredwithout any pressure loss (Fig. 6.3).
2.4. Operating Considerations
The first consideration when utilizing vapor steam in precision cleaningapplications is the quality of the water used. Tap water contains manycontaminants including minerals, silicates, and organic matter, so it is unsuit-able for precision cleaning applications. Use of high-purity filtered, deionized,or distilled water is absolutely essential for such applications.
Another consideration should be whether the parts being cleaned canwithstand the temperature and pressure of the steam spray. Precision steamcleaners can be provided with a variety of outlet pressures and temperatures.Steam saturation quality, supply of wetter or dryer steam, and steam pressurecan be adjusted for specific applications for contaminant removal. Cleaningunits have steam pressures ranging from 0.14 MPa to over 2 MPa, whiletemperatures can range from 373 K to 573 K. The temperature decreases veryrapidly in the steam vapor plume. Heat generated is minimal for electronic
FIGURE 6.2 Adapters and attachments for precision steam cleaning surgical instruments. (a)
Long and short hollow needles with steam vents along the side. (b) Hollow straight needle
attachment with steam vent at the tip. (c) Hollow curved needle attachment with steam outlet at the
tip. (d) Luer-Lock adapter. (e) Catheter attachments. (f) Hose connection. (g) Mounting pliers. (h)
Rack [36]. Courtesy of Elma GmbH, Singen, Germany
207Chapter | 6 Alternate Semi-Aqueous Precision Cleaning Techniques

components such as circuit boards. By controlling the distance from the steamoutlet nozzle, temperature-sensitive parts can be cleaned without exposure tounnecessarily high temperatures. Recent testing on aluminum alloy 7075 strips(0.5 mm thick � 24.5 cm wide � 48.3 mm long) has shown the temperature ofthe surface was between 311 K and 318 K 10 seconds after removal of steamfrom the surface [40]. The maximum temperature of the surface was 253 K at25 mm steam exit distance from the surface to as high as 372 K at 0.64 mmfrom the surface [40].
Condensed water can penetrate and/or damage joints, seals, and bondedareas, and limits the usefulness of steam vapor cleaning. Preventive measures,such as air blowers, may be required to remove residual moisture. Steam vaporcleaning is optimal when individual components are removed or disassembledfrom the hardware as part of the normal task. However, disassembly can betime- and labor-intensive.
Additives such as detergents, alcohol, or saponifiers are generally not addedto the water since most additives will break down at the high temperaturesneeded to make steam. Often these additives are sprayed on the parts prior tosteam cleaning.
Caution should be used in operating steam cleaners since hot surfaces,nozzles, and substrates can result from cleaning. Steam pressure is also a safety
FIGURE 6.3 Steam cleaning of medical instruments with different adapters. (a) Straight bore
needle. (b) Hollow curved bore needle. (c) Direct connection with the Luer-Lock interface [36].
Courtesy of Elma GmbH, Singen, Germany
208 Developments in Surface Contamination and Cleaning

consideration. Personal protective equipment (safety glasses, gloves, appro-priate work clothing) should be employed. Operators must be trained properlyto use the steam cleaning equipment efficiently and safely. Often, the equip-ment is employed in an enclosed cabinet to capture the contaminants and tominimize worker exposure to debris from the part being cleaned.
2.5. Advantages and Disadvantages of Precision Steam Cleaning
2.5.1. Advantages
l Eliminates the use of solventsl Reduces the amount of hazardous waste and hazardous air emissions gener-
ated compared to solvent degreasingl Wastewater stream is generally compatible with conventional industrial
wastewater plantsl Low implementation cost utilizing simple equipmentl Provides solvent cost savingsl Ideal for removing grease, oil, flux, adhesive, fingerprints, and other
contaminantsl Low water usagel Safe, clean design generates superheated steam on demandl No high-pressure steam storagel Lightweight, portable design for point-of-use applicationsl Auto shut-off feature safeguards heaterl Steam can reach otherwise inaccessible areas and spacesl Elimination and control of the biofilms that resist typical disinfectantsl Effective technique as a manual pre-cleaning step for medical devicesl Steam can be used very selectively and preciselyl Steam cleaning is very handy and fast.
2.5.2. Disadvantages
l Not recommended for temperature- or moisture-sensitive parts. Rusting orsurface oxidation may occur
l Risk of electrostatic discharge (ESD) when cleaning electronic componentsl Damage to joints, seals, and bonds from residual moisture.
2.6. Applications
Steam for precision cleaning can be used for a variety of applications.
l Removing water-based (no-clean) flux from circuit boards and othersoldering applications
l Cleaning fiber optics and other optical components
209Chapter | 6 Alternate Semi-Aqueous Precision Cleaning Techniques

l Cleaning hybrid circuits prior to wire bondingl Cleaning medical devices and instrumentsl Cleaning dental implantsl Cleaning and degreasing aerospace tools and partsl Cleaning military hardware such as weapons, automotive parts, electronics,
ground support equipment, and other gearl Cleaning automotive components to remove grease and grimel Cleaning jewelry and gems.
Sloan [41] demonstrated the effectiveness of micro precision steam cleaning on304 stainless steel substrates. Ten 0.1 m2 plates were pre-cleaned and indi-vidually contaminated with approximately 8e16 mg/m2 of dust and drillinglubricant as determined by weighing. The samples were dry steam cleaned forapproximately 2e3 minutes and re-weighed. The remaining contaminationranged from 1 to 2 mg/m2; the cleaning efficiencies were between 75 and 93%,with an average cleaning efficiency of 86%. Visual inspection of the cleanedsurface showed uniform removal with no evidence of visible contamination onthe surface.
The prevailing method of cleaning aircraft ejection seats in the US Navyemploys an organic solvent such as isopropyl alcohol. This method of cleaningthe ejection seat and/or ejection seat components is extremely labor-intensiveand generates significant quantities of hazardous waste for disposal. Kwan et al.[42] performed an evaluation of an alternate cleaning method using a wet steamcleaning system. The steam vapor cleaning process is found to be optimal whenindividual components of the ejection seats were removed or disassembled forcleaning as part of the normal task. This ensured that water was not trapped.But disassembly was time- and labor-intensive. Concern about the deteriorationor damage to the O-ring seals was not realized; however, the steam cleaningprocess did remove the lubricants on the seals and had to be replaced.
Panzner et al. [43] investigated cleaning of three gilded objects: fire-gildedcopper pipe; a leaf-gilded spire; and a festive bonnet made of fibers wrapped bychemically gilded silver wire. Micro precision steam cleaning was successful inremoving surface contamination, although some surface damage was observed.This is not unexpected if the surface coating layer is very thin, as in the case ofthe gildings which were only 10 mm thick.
The effectiveness of precision steam cleaning to decontaminate microbiallycontaminated surfaces was investigated recently [8]. Dried films of 11 differentmicroorganisms (E. coli, Shigella flexneri, Enterococcus faecalis, Salmonellaenterica, Staphylococcus aureus, Pseudomonas aeruginosa, S. aureus,Candida albicans, Asperigillus niger, Bacteriophage MS2, and Clostridiumdifficile) were deposited on porous clay tiles that are more representative ofsurfaces found in the health care and food service industries. The initialconcentrations of the microorganisms ranged from 1.08 � 104 to 4.83 � 106
CFU per test surface (colony-forming unit (CFU) is a unit of measurement for
210 Developments in Surface Contamination and Cleaning

viable bacteria numbers). The test surfaces were disinfected with a portablesteam cleaner for 0.5, 1.0, 2.0, or 5 seconds. Individual colonies were countedand the results recorded as CFU per test surface. The results showed the highconcentration of the diverse array of microorganisms tested was completelydestroyed very rapidly. For example, the initial concentration of Salmonellaand E. coli of 9.75 � 104 and 1.14 � 106 CFU, respectively, was reduced to3.16 and 5.98 � 103 CFU after 2 seconds’ exposure and to 0 CFU after5 seconds’ exposure to steam.
Similar studies in Italy showed the efficacy of precision steam cleaning indestroying six bacteria strains (E. coli, Staphylococcus aureus, Streptococcusfaecalis, Bacillus cereus, Saccaromyces cerevisiae, and Pseudomonas aerugi-nosa) deposited on porcelain tiles, Teflon�, and stainless steel substrates after 5seconds’ exposure to steam [44,45].
Industrial and government organizations worldwide involved in precisioncleaning are increasingly adopting precision steam cleaning for their pre-cleaning and/or their final cleaning operations for many different applications.The US Department of Defense (DoD) has recommended the adoption of steamcleaning in all service branches as a viable alternative to solvent cleaning ofcomponents and parts such as electronics, weapons, printed circuit boards, andother items. Significant cost savings have been realized at different DoDinstallations by employing precision steam cleaning [16,17]. Steam cleaning ofsurgical instruments and medical devices has also found increasing acceptancein hospitals worldwide, primarily due to the ability to reach inaccessiblelocations and the effectiveness of steam cleaning in destroying microorganisms[8,36,44,45].
Recently, ITT designed and built a new facility equipped with modernprecision cleaning equipment, including micro precision steam cleaners [46].The company has incorporated micro precision steam cleaning in the newfacility for cleaning mechanical parts and assemblies. ITT cleans parts that canrange in size from a single threaded fastener to large composite structures.Materials that are processed include optical glass, ceramics, composites,metals, and various high-performance coatings. First-pass yield of 98% hasbeen achieved in the new facility with annual savings of $1 million, part ofwhich is attributable to the use of micro precision steam cleaning.
Duffy et al. [47] have recently developed a novel four-stage automatedprocess to efficiently clean and dry fiber optic endfaces in high-density multi-ferrule connectors. The system incorporates a micro precision steam cleaningas the first process step, followed by CO2 snow cleaning for final precisioncleaning. The parts are dried in flowing heated ionized air. All process steps arecarried out with a single multistage programmable cleaning system. It has beenused to successfully demonstrate the removal of various contaminants,including fibers, dust, oils, and other residues with better than 90% efficiency.
Other examples of applications and case studies of steam cleaning are givenby the various commercial vendors of cleaning systems [19e24,48].
211Chapter | 6 Alternate Semi-Aqueous Precision Cleaning Techniques

2.7. Cost Benefits
Significant cost savings can be achieved by steam cleaning compared to solventcleaning. For example, the total annual operational costs to clean 120 guns perday were estimated to be approximately $217 000 using a portable steamcleaner compared with approximately $660 000 for solvent cleaning forestimated savings of $443 000 [16,17]. Similar savings of ~$308 000 wereachieved by steam cleaning of aircraft ejection seat frames and componentscompared with solvent cleaning [42].
3. SUPERSONIC GAS-LIQUID CLEANING
3.1. Background
Commercial spray cleaning systems are well established for cleaning varioustypes of parts and surfaces. These systems employ high pressures for cleaning,use large quantities of fluids, and are unsuitable for precision cleaning. Ifsolvents are also used for cleaning, they pose a significant waste disposalproblem, even if the solvents are not regulated and are approved for use. As anexample, the Kennedy Space Center (KSC) of the National Aeronautics andSpace Administration (NASA) was processing approximately 250 000 smalland large components (such as valves, pipes, regulators, flexible hose lines,and compressed gas cylinders) through the cleaning facility each year,consuming as much as 27 000 kg of solvent (CFC 113) for cleaning andverification purposes [49,50]. Historically, at KSC precision cleaning toremove surface contamination (particulate and non-volatile residue) was toflow large quantities of water with detergents at high temperature or to flowlarge volumes of CFC solvents over the components, which tended to bea significant enviornmental problem. The strict cleanliness requirements werederived from liquid oxygen (LOX) system compatibility, since particles andhydrocarbon greases and oils can easily ignite in the presence of LOX.Subsequently, the level of cleanliness was verified according to NASA speci-fication [51] that requires quantitative measurements of particle contamination(number of particles per unit area) and non-volatile residue (NVR as mass perunit area) for space components designed for LOX service and for other fluidsystems where high levels of cleanliness are required. This was performed byflushing the defined surface area (0.1 m2) with a CFC solvent. For particlecontamination, the sovent was poured through a filter and the particles werecounted using an optical microscope. The NVR analysis was performedgravimetrically by evaporating the collected solvent and weighing theremaining solid residue.
An effective method was needed at KSC to replace this system ofcleaning and verification employing such large volumes of solvents. Othercleaning methods like high-pressure water jets, ultrasonic cleaning, andflushing with approved solvents had several disadvantages. Although
212 Developments in Surface Contamination and Cleaning
ultrasonic cleaning is very effective in removing contaminants, the compo-nent must be immersed in the cleaning fluid. The size of most componentscleaned at KSC made this impractical. Water jet cleaning disadvantagesincluded high volumes of water consumption and the relatively high pressuresrequired for effective contaminant removal. In spite of their excellentsolvency potential, cleaning and flushing with even approved solvents doesnot solve the issue of consumption of large volumes of used solvent whichhave to be processed, and the tendency for solvent flushing to leave behindinsoluble contaminants.
To overcome these disadvantages, the supersonic gas-liquid cleaning (SS-GLC) concept was developed of accelerating liquid droplets to supersonicvelocities (>Mach 3) by using a converging/diverging nozzle and mediumpressure (~2 MPa) compressed inert gas or air [52e55]. SS-GLC providedadvantages over alternate cleaning methods. Benefits over water jet cleaningincluded lower operating pressures, less water consumption, and greatersurface impingement capability. Benefits over solvent flushing included theelimination of solvent consumption and the removal of insoluble particles byimpingement. Using a spraying nozzle meant that large surfaces that could notbe immersed in an ultrasonic bath could be cleaned. SS-GLC also providedseveral advantages over other pressurized cleaning methods. The system didnot abrade the surface of the parts being cleaned, and it required much lowerlevels of pressure while using very little water. These features enabled thesystem to clean a wide variety of items [56].
In medical applications, removal of solid contaminants from and cleansingof exposed in vivo tissue is necessary during surgical procedures [56]. Inaddition, such cleansing is necessary in preparation for treatment for dentalconditions such as gingivitis, caused by the long-term effects of plaquedeposits. Organic matter tends to bond to tissue much more strongly than non-organic matter, and is generally more difficult to remove than non-organicmatter such as fibers, dust, and sand particles. Cleaning with a liquid such aswater is often ineffective in removing the particles that are smaller than thethickness of the stagnant laminar boundary layer (flow velocity is zero at thesurface) which is formed on the tissue surface [57]. The particles located in theboundary layer have a sufficiently high drag force that cannot be overcome bya liquid stream even with a very high overall velocity.
Several cleansing devices have been developed to improve cleaning ofa variety of surfaces and systems using one or more of these devices and areavailable commercially [58e79]. These systems provide a liquid stream witha reduced boundary layer thickness employing liquid and gas nozzleassemblies; a high velocity aerosol of at least partially frozen particles; andpulsed jets of liquid sprayed on to a metal surface to remove small particles.Many of the dermal abrasion and cleansing systems use relatively high liquidflow rates which reduce the cleansing and scouring effect due to the virtuallystagnant boundary layer that develops over the surface to be cleaned. High
213Chapter | 6 Alternate Semi-Aqueous Precision Cleaning Techniques

velocity can also cause damage to the surface. Other devices have low flowrate, low-pressure nozzles for mixing fluids, but they employ Venturi tubeinjection to atomize the liquid, which cannot achieve supersonic velocity inthe mixture. In general, these devices provide only a small improvement overnon-pulsed spray cleaning systems.
The principles of SS-GLC have been applied to develop devices formultiple tissue cleansing and dermal abrasion applications [80e82] thatovercome the limitations of other methods. The SS-GLC devices use very smallamounts of the cleansing liquid to form a mist of droplets suspended in a high-velocity gas. The small amount of liquid suspended as a mist prevents theformation of a liquid boundary layer which could trap small particles. The gas-liquid mixture is accelerated to supersonic velocity and is delivered to the tissuesurface, mass, or cavity to be abraded, thereby very effectively scouring andcleansing the surface.
3.2. Principle of Supersonic Gas-Liquid Cleaning
SS-GLC is effective in removing particle and non-particle (hydrocarbonfilm) contaminants. The system mixes gas and liquid from separate pres-surized sources; the liquid is suspended as fine droplets in the gas stream.The nozzle has a convergingediverging geometry. Assuming homogeneousand adiabatic uniform velocity with thermal equilibriun (rapid heat transfer)between the gas and the liquid, the compressibility of the gas can acceleratethe atomized liquid particles to supersonic velocities [53,54]. Recent workhas shown that the assumption of rapid heat transfer between the gas andliquid phases is incorrect; rather, the assumption of no heat transfer betweenthe phases may be more appropriate in describing nozzle flow since liquiddroplets have been observed in the jet exiting the nozzle [83]. At the sametime, a stagnant liquid boundary layer cannot form on the surface because ofthe small quantity of liquid used for cleaning. The gas-liquid mixture isejected at supersonic speeds from one or more nozzles at the end of a hand-held wand assembly. At these speeds, the liquid droplets suspended in thegas have the kinetic energy to forcibly dislodge the solid contaminants fromthe surface, dispersing them into a minimal waste stream. Even smallparticles that, due to their size may be trapped in a liquid boundary layer,can be removed.
The dominant mechanism for hydrocarbon residue removal is due toemulsification upon liquid droplet impact with the target surface [53,84]. Thesupersonic nozzle tends to emulsify hydrocarbon contaminants, so that theconcentration exceeds the contaminant solubility limit in the liquid. Theemulsification process is dependent on the size and concentration of the liquiddroplets present in the mixture, as well as nozzle design and injectionarrangement [84e87].
214 Developments in Surface Contamination and Cleaning

3.3. Description of the Method and Equipment
3.3.1. Precision Cleaning Applications
For precision cleaning applications, SS-GLC operates by flowing high-pressureair or nitrogen through a throttling valve to the nozzle. Water is injected into thegas flow stream through an inlet orifice upstream of the converging/divergingsection of the nozzle. The nozzle design is based on an area ratio (ratio of exitarea to the throat area) of 5.44 which gives a Mach number of 3.14 corre-sponding to a velocity of approximately 1067 m/s (Fig. 6.4) [53]. At this pointthe rate of change in Mach number with area ratio begins to decrease signifi-cantly. More recent work has shown that the measured velocity, 630 m/s, andthe computed velocity, 670 m/s, of the gas-liquid mixture are in good agree-ment, but approximately two-thirds of the expected velocity based on theoriginal design calculations [84]. Two different nozzle designs have beendeveloped and are commonly employed in cleaning applications. In theconventional convergingediverging nozzle, the two-phase jet discharging fromthe conventional nozzle diverges, thus creating a wider jet with smaller
FIGURE 6.4 Mach number vs. area ratio for the KSC SS-GLC convergingediverging
nozzle [53]
215Chapter | 6 Alternate Semi-Aqueous Precision Cleaning Techniques

concentration of liquid droplets at the cleaning surface. By contrast, the jet inthe annular nozzle converges at the exit and reaches its greatest concentrationa short distance downstream of the nozzle outlet (Fig. 6.5) [86e88]. The jetdiameter and intensity are narrower and the concentration of droplets at thetarget surface is higher than the conventional nozzle at the same pressure andflow rate. The conventional nozzle can cover a larger surface area than theannular nozzle. Supersonic exit velocities can be achieved without an inordi-nately large exit cone in the nozzle.
The mixed gas-liquid flow then enters the converging/diverging nozzlewhere it is accelerated to supersonic speeds. The supersonic gas-liquid streamis directed onto the surface of the components that require cleaning or clean-liness verification (Fig. 6.6).
The velocity imparted to the water by the gas flow gives it sufficientmomentum at impact to remove contaminants on the surface of the compo-nent being cleaned or verified while simultaneously dissolving the contami-nant into the water, which can be captured for cleanliness verification. Theflow parameters for the gas-liquid nozzle can be set so virtually any gas andliquid can be used for a desired flow and mixing ratio. In addition, the size andnumber of nozzles are adjustable. This adjustability makes it possible tocreate sizes ranging from small hand-held cleaning nozzles to very largemultiple-nozzle configurations. For cleanliness verification the cleaning fluidis replaced with water which can be collected for analysis after spraying thesurface of the cleaned part (Fig. 6.7). The small volume of cleaning fluidresults in reduced solvent usage and the resultant cost of hazardous wastedisposal.
A commercial SS-GLC system based on this design is shown in Figure 6.8[89]. The system accommodates the use of distilled or deionized water and theuse of compressed breathing air or nitrogen. All wetted parts are fabricatedfrom stainless steel or Teflon�. Cleaning and drying functions are controlled
FIGURE 6.5 Convergingediverging nozzle with flow-directing annular insert [86e88]
216 Developments in Surface Contamination and Cleaning

from a single trigger. Since the environmentally friendly system requires lessthan 100 mL of water per minute, there is very little liquid left after cleaningthat must be handled as contaminated waste.
The system is non-abrasive due to the low mass energy of the atomizedwater, approximately 0.13� 10e6 kg-m/s per 1 mm size water particle, ascompared with other spray cleaning methods (see Table 6.1).
With a nozzle that can be oriented in any direction, the system is adjustableto allow all sides of a part to be cleaned without reorientation. Designed foroperator safety and comfort, the system requires minimal training for operation
FIGURE 6.6 Schematic of the basic supersonic gas-liquid cleaning system for precision cleaning
applications [53,54]
FIGURE 6.7 Supersonic gas-liquid cleaning system arranged for precision cleaning and clean-
liness verification [54]
217Chapter | 6 Alternate Semi-Aqueous Precision Cleaning Techniques

and is easily moved on built-in casters, despite its weight (~200 kg). Whenoperating the SS-GLC adequate hearing protection is required during operationdue to the supersonic velocities. Maintenance is minimal with only a fewmoving parts.
3.3.2. Medical Applications
The SS-GLC system developed for medical applications employs a con-vergingediverging gas nozzle and a liquid discharge nozzle arrangedconcentrically within the gas discharge nozzle. The gas nozzle configurationis operated such that the inlet gas pressure is at least twice the outlet gaspressure. This pressure drop causes a shockwave in the gas and, depending onthe gas pressure, accelerates it to velocities ranging from subsonic to super-sonic. At the same time, the liquid flow downstream of the gas dischargenozzle is atomized and forms a mist of liquid droplets (5e100 mm) suspendedin the flow of discharged high-velocity gas (Fig. 6.9) [80e82]. Gas (air,oxygen, carbon dioxide, and nitrogen) is supplied from the pressurized gassource at a pressure of 0.28e1 MPa and liquid is supplied from the pressur-ized liquid source at a pressure in the range 0 to 0.034 MPa. The mist jet
FIGURE 6.8 Commercial SS-GLC system for precision cleaning applications. Courtesy of
VaTran Systems, Chula, Vista, CA
218 Developments in Surface Contamination and Cleaning

delivery nozzle arrangement includes at least two gas discharge nozzles orat least two liquid discharge nozzles. A suction conduit is included in the mistjet delivery nozzle arrangement which provides for removal of waste liquidand abraded tissue particles. The device is designed to be used while beingheld in one hand.
A system based on this technology is commercially available fordifferent applications. The JetOx� system (Fig. 6.10) is used for woundcleansing and debridement (debridement is the surgical excision of dead,devitalized, or contaminated tissue and removal of foreign matter froma wound [91]) [92e98]. For this application, the system employs medical-grade oxygen and a sterile cleaning liquid. Saline solution (0.9% sodiumchloride) is most commonly employed, although other solutions have beenused successfully [99e103]. The spray is precisely calibrated to treat onlythe affected areas. A unique shield is attached to the delivery nozzle toprevent contamination.
The JetPeel� system (Fig. 6.11) is employed for dermal applications[104,105]. It contains a control unit and a unique disposable handpiece that
TABLE 6.1 Typical parameters of different particle removal techniques [90]
Cleaning
method
Impacting
particle
size, mm
Impacting
particle
density,
kg/m3
Impacting
particle
mass, kg
Impacting
particle
velocity,
m/s
Momentum
transferred
per impacting
particle,
kg-m/s (10e6)
Dry icepelletblasting
3.18 dia �6.35 long
1562 7.84 � 10e5 ~335 27 652
CO2
particles< 1 1562 8.16 � 10e7 46 37.33
0.5 1562 8.16 � 10e7 305 248.87
CO2 snow 1.48 780 1.31 � 10e6 ~0.3 0.41
Water ice(smallparticles)
70 � 10e3 930 1.32 � 10e9 335 0.45
Water ice(largeparticles)
1.02 dia �6.35 long
930 1.9 � 10e5 162 3071
SS-GLC 1 � 10e3 1000 1.18 � 10e10 1067 0.13
8 � 10e3 1000 6.01 � 10e8 1067 64.84
219Chapter | 6 Alternate Semi-Aqueous Precision Cleaning Techniques

includes the delivery nozzles. The fine, single-nozzle handpiece (Fig. 6.12a) issuitable for non-invasive mesotherapy, wrinkle and acne treatments, while thetriple nozzle handpiece (Fig. 6.12b) is used for most other skin treatments.The system is lightweight and ergonomic and requires only minimal dexterityfrom the operator. The skin peeling depth can be precisely controlled bycontrolling the gas pressure and the number of passes, making it possible toindividually treat different areas of skin simultaneously without collateraldamage. JetPeel� is capable of removing the epidermis layer of the skin,thereby increasing tissue oxygenation which contributes to accelerated woundhealing [106].
FIGURE 6.10 The JetOx� wound cleansing and debridement system [92,93]. Courtesy of
TavTech Ltd., Yehud, Israel
FIGURE 6.9 Schematic of the cleaning system for medical applications [80e82]
220 Developments in Surface Contamination and Cleaning

FIGURE 6.11 JetPeel� system for dermal applications [104]. Courtesy of TavTech Ltd., Yehud,
Israel
221Chapter | 6 Alternate Semi-Aqueous Precision Cleaning Techniques

3.4. Advantages and Disadvantages of Supersonic Gas-LiquidCleaning
3.4.1. Precision Cleaning
3.4.1.1. Advantages
l Uses very little cleaning liquid (<100 mL/min)l Reduced hazardous waste volume disposal and associated disposal costsl Can be used for cleaning and for cleanliness verificationl Does not abrade the surfacel Adaptable design for cleaning large surfaces and parts with complex
geometriesl Portablel Few moving partsl Operator-friendly systeml Minimal training required for operation.
3.4.1.2. Disadvantage
l Requires tailoring as cleanliness verification tool for specific contaminantsand applications.
3.4.2. Medical Applications
3.4.2.1. Advantages
l Uses very little cleaning liquid (<2 mL/min)l Versatile system that can use many different cleaning liquidsl Effective in removing very small solid contaminants that could be trapped in
a surface boundary layerl Enables non-invasive trans-dermal delivery of liquids (nutrient supple-
ments, vitamins, and anti-aging solutions)
(a) (b)
FIGURE 6.12 Handpieces for aesthetic application used with the JetPeel� system. (a) Single-
nozzle handpiece. (b) Triple-nozzle handpiece [104]. Courtesy of TavTech Ltd., Yehud, Israel
222 Developments in Surface Contamination and Cleaning

l Generates minimal waste with reduced associated disposal costsl Simple rapid setup for usel Operator-friendly, single-handed, safe operationl Short learning curvel Minimal training required for operationl Precision application to desired areas for cleansing with minimal collateral
damagel Minimal pain and rapid post-treatment healing.
3.4.2.2. Disadvantage
l More time-consuming than traditional debridement and dermal abrasiontreatments.
3.5. Applications
3.5.1. Precision Cleaning
Validation testing of the cleaning performance of the system developed at KSCwas performed by Caimi and Thaxton [53], which required a correlationbetween the NVR remaining on the surface after cleaning and the total organiccarbon (TOC) reading of the water sample collected after cleaning. Stainlesssteel witness plates with an area of ~0.09 m2 were contaminated with a knownquantity (11.1 to 111mg/m2) of fluorinated greases (such as Krytox�eDuPont,or Tribolube� e Aerospace Lubricants Inc.) and other common lubricantsused at KSC, and then impinged between 2 and 8 minutes each. The TOCmeasurements were found to be linearly correlated with the known initialcontaminant level (Fig. 6.13) and with the remaining NVR after cleaning(Fig. 6.14). The results also indicated that the nozzle emulsifies the hydro-carbon contaminants well enough not to require another cleaning step. Similarlinear correlations were observed in extensive testing with other contami-nants and mixtures of contaminants deposited on valve bodies and witnessplates from 0.05 to 0.75 m2 [49,50,52,107,108]. SS-GLC was shown to bea consistent technique for cleanliness verification of spaceflight hardware atKSC. The data collected also suggested that the system cleans the compo-nents more completely than the previous method using solvent (CFC-113).
A similar investigation was carried out to test the effectiveness of the KSCSS-GLC system for cleaning surfaces [89]. The samples consisted of ~0.1 m2
304 stainless steel plates contaminated with a known quantity (7e18 mg) ofdust and drilling lubricant, oils, and hydrocarbon and fluorinated greases. Thecontaminated area on each plate was cleaned by impinging for 2 minutes withthe SS-GLC system. SS-GLC tends to emulsify hydrocarbon contamination, sothat it exceeded the contaminant solubility limit in water and flows off thesurface. The cleanliness verification method measured the TOC in watersamples collected from cleaning. Eleven of 20 plates were completely cleaned
223Chapter | 6 Alternate Semi-Aqueous Precision Cleaning Techniques

with no residue measured in the TOC samples. The TOC samples from theother nine plates measured residue of 0.1 mg or less. The results indicate thatthe contaminants could be removed with greater than 96% efficiency with theSS-GLC system.
Parametric studies have been conducted with a 1.25 cm long con-vergingediverging nozzle in the SS-GLC system [83]. The pressure upstreamof the nozzle was either 2.2 MPa or 2.89 MPa with water flow rates of 0.052liters/min and 0.056 liters/min, respectively. The mean velocity remains nearly
FIGURE 6.13 TOC vs. the initial contaminant level of the stainless steel plates [53]
FIGURE 6.14 Linear correlation between TOC and NVR remaining after cleaning [53]
224 Developments in Surface Contamination and Cleaning

constant up to an axial distance of 50 mm. Increasing the air tank pressureincreases the mean velocity of the flow at the exit of the nozzle from ~620 m/sto 630 m/s. The optimum tank pressure was around 2 MPa. The best workingdistance was found to be between 30 and 80 millimeters.
The SS-GLC technology has been adapted for cleaning and verifying thecleanliness of the interior surfaces of hollow items, such as small compressedgas cylinders (K-bottles), tanks, and long pipes and tubes (over 15 cm long)[109]. For K-bottle cleaning, the system employs a rotating spray head withthree nozzles with only a diverging section for supplying a gas-liquid cleaningmixture to the surface of the parts at supersonic velocity. The diverging nozzleis much smaller than a full convergingediverging nozzle and can fit through thenarrow opening (~1.8 cm) of the bottle, although there is a 20% loss in fluidmomentum compared with the convergingediverging nozzle. One nozzle isaimed straight down the bottle, while the other nozzles are oriented at 30 and210 degrees from the bottle axis. The orientation of the three nozzles covers allsurfaces of the bottle. The spray head is both rotatable and translatable along itslongitudinal axis. No moving parts are exposed to the interior surfaces of theitems to be cleaned, thereby reducing the risk of contamination. The system canalso be employed for cleanliness verification by simply replacing the cleaningliquid with plain water, and collecting and analyzing the waste water after it hasbeen sprayed onto the item. For large pipes the full convergingedivergingnozzle can be employed, so cleaning is more efficient. In this case, a pipecrawler is used to transport the rotating nozzle head through the pipe whilepulling a gas-liquid supply hose.
Klausner et al. [86,87] investigated the performance of the SS-GLCimpingement system developed at KSC as characterized by the rate ofcontaminant removal. Polished stainless steel substrates were contaminatedwith grease (8e11.5 mg/m2) and cleaned using both the conventional con-vergingediverging nozzle and the annular nozzle. The rate of contaminantremoval is inversely proportional to the interfacial tension, which, in turn, isinversely proportional to temperature. Thus, the rate of contaminant removalby emulsification should be enhanced by increasing temperature, as wasobserved. A 15� jet approach angle gave the highest rate of residue removal,consistent with the theoretical consideration that the shearing force is mosteffective in breaking the cohesive bonds between adjacent contaminantmolecules. The contaminant removal rate declined sharply with increasingdistance from the cleaning surface due to reduction in droplet concentrationand increased viscous drag. As expected, the cleaning performance of theannular nozzle was significantly better than that of the conventional con-vergingediverging nozzle under the same operating conditions. For theconventional convergingediverging nozzle, the highest removal rate wasachieved at a distance of 5 cm from the surface, suggesting that the supersonicjet flow may converge at that distance. Based on these results, optimumperformance of the system can be realized by using the annular nozzle with an
225Chapter | 6 Alternate Semi-Aqueous Precision Cleaning Techniques

approach angle of 15 degrees to the cleaning surface at a distance of 2 cm fromthe surface with as high a mixture temperature as possible without evaporatingthe water. The cleaning effectiveness of the system could also be increasedby the addition of detergents with the lowest dynamic surface tension to thewater. Such detergents have been shown to enhance the effectiveness of spraycleaning for soil removal [110].
Kanno et al. [111] have developed a system for cleaning wafers usinga novel two-fluid jet nozzle which is capable of removing sub-mm particles.The novel convergingediverging nozzle is capable of accelerating the liquiddroplets to high velocity by a gas at relatively low supply pressure.Figure 6.15 shows the liquid droplets accelerated by the two-fluid nozzlereaches sonic velocity at a gas supply pressure of about 3 kgf/cm2 (line A),whereas a conventional low-pressure nozzle requires the gas supply pressureto be 10 kgf/cm2 or above to accelerate the liquid droplets to sonic velocity(line B).
In semiconductor manufacturing, the maximum gas pressure used is about7 kgf/cm2, which is sufficient to achieve supersonic velocity of the jet exitingthe two-fluid nozzle. With a conventional nozzle, the jet reaches only subsonicexit velocity. The effectiveness of this new nozzle design in cleaning wafers,represented by the contaminant removal ratio, is compared with conventionallow-pressure and high-pressure jetting nozzles for similar operating conditions(Fig. 6.16). The contaminant removal ratio is defined as the ratio of the numberof particles removed to the number of particles remaining on the surface.Clearly, cleaning with the new jet nozzle can remove particles smaller than 0.1mm (curve A) as compared with the other nozzles. Although the low-pressure
FIGURE 6.15 Graph showing the relation between the velocity of the liquid drops and the
supply pressure of the gas for different jet nozzles. (a) Two-fluid nozzle. (b) Conventional low-
pressure nozzle [111]
226 Developments in Surface Contamination and Cleaning
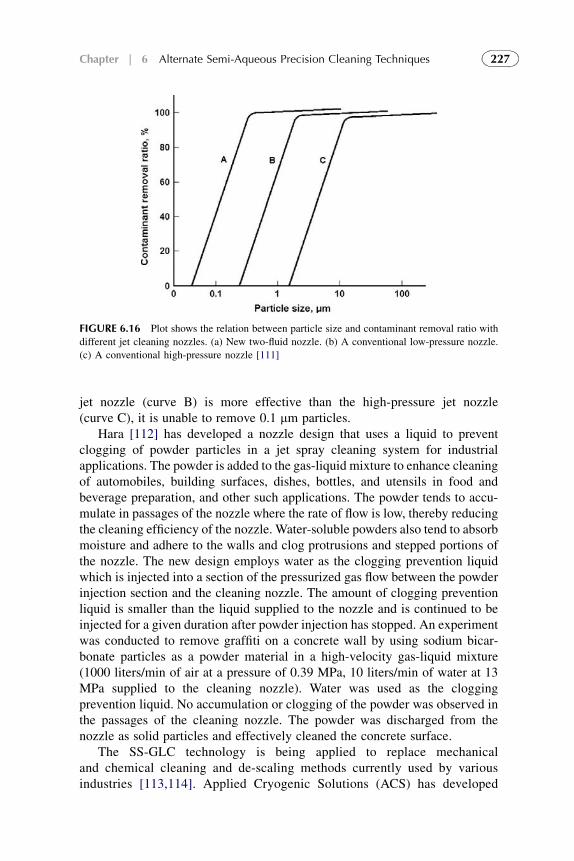
jet nozzle (curve B) is more effective than the high-pressure jet nozzle(curve C), it is unable to remove 0.1 mm particles.
Hara [112] has developed a nozzle design that uses a liquid to preventclogging of powder particles in a jet spray cleaning system for industrialapplications. The powder is added to the gas-liquid mixture to enhance cleaningof automobiles, building surfaces, dishes, bottles, and utensils in food andbeverage preparation, and other such applications. The powder tends to accu-mulate in passages of the nozzle where the rate of flow is low, thereby reducingthe cleaning efficiency of the nozzle. Water-soluble powders also tend to absorbmoisture and adhere to the walls and clog protrusions and stepped portions ofthe nozzle. The new design employs water as the clogging prevention liquidwhich is injected into a section of the pressurized gas flow between the powderinjection section and the cleaning nozzle. The amount of clogging preventionliquid is smaller than the liquid supplied to the nozzle and is continued to beinjected for a given duration after powder injection has stopped. An experimentwas conducted to remove graffiti on a concrete wall by using sodium bicar-bonate particles as a powder material in a high-velocity gas-liquid mixture(1000 liters/min of air at a pressure of 0.39 MPa, 10 liters/min of water at 13MPa supplied to the cleaning nozzle). Water was used as the cloggingprevention liquid. No accumulation or clogging of the powder was observed inthe passages of the cleaning nozzle. The powder was discharged from thenozzle as solid particles and effectively cleaned the concrete surface.
The SS-GLC technology is being applied to replace mechanicaland chemical cleaning and de-scaling methods currently used by variousindustries [113,114]. Applied Cryogenic Solutions (ACS) has developed
FIGURE 6.16 Plot shows the relation between particle size and contaminant removal ratio with
different jet cleaning nozzles. (a) New two-fluid nozzle. (b) A conventional low-pressure nozzle.
(c) A conventional high-pressure nozzle [111]
227Chapter | 6 Alternate Semi-Aqueous Precision Cleaning Techniques

a cleaning system that consists of a spray head containing supersonic con-vergingediverging nozzles using a source of liquid gas, together with a novel,proprietary pumping system that permits pumping liquid nitrogen, liquid air,or supercritical carbon dioxide to pressures in the range of 138e417 MPa. Thesize and number of nozzles can be varied so the system can be built inconfigurations ranging from small hand-held spray heads to large multinozzlecleaners (Fig. 6.17). The system also can be used to verify if a part has beenadequately cleaned. Pilot trials on heat exchanger tubing components haveshown several benefits:
l Superior cleaning in a much shorter period of timel Lower energy and labor requirements for cleaning and de-scaling
operationsl Significant reductions in waste volumes by not using water, acidic or basic
solutions, organic solvents, or non-volatile solid abrasives as components inthe cleaning process
l Improved energy efficiency in post-cleaning heat exchanger operations.
The ACS system has the flexibility and adaptability for use in existing plantsusing heat exchangers of various designs and operational configurations. Inaddition to heat exchanger applications, ACS is adapting the system for other
FIGURE 6.17 A multiple nozzle SS-GLC system being used for cleaning heat exchanger
parts [114]
228 Developments in Surface Contamination and Cleaning

applications including: cleaning of coated or contaminated surfaces; air and seainfrastructure applications; mining, natural gas and oil exploration; and otherpotential uses.
3.5.1.1. Other Applications
SS-GLC system can be applied for precision cleaning in the aerospace,automotive, circuit boards, electronics, machinery, metals, plastics, andoptics industries. Additional applications include contamination removal inthe nuclear, agriculture, food, pharmaceutical, and chemical industries.Commercial applications range from flux removal from printed circuitboards to scouring building exteriors; removal of algae and other organicmatter from boat hulls; cleaning dead-ended components; mildew and stainremoval; paint removal; removal of salt contamination and surface prepa-ration prior to painting; removal of oil stains and grease spots; and spotcooling [115].
3.5.2. Medical Applications
Golan and Hai [116] treated 50 adult volunteers suffering from sun-damagedskin, facial rhytids, skin pigmentation, and post-acne facial scarring with theJetPeel� system. The overall duration of the treatment ranged from 5 to 70minutes. The results were judged to be aesthetically good to excellent by thepatients and the medical staff, with a high degree of patient satisfaction. Thetechnology was found to be particularly efficient in treating perioral regionsdue to its ability to achieve different depths of penetration of the skin. Theapplication is more time-consuming than dermal abrasion or chemical peeling,but the post-treatment healing was found to be smother and quicker whichcould be attributed to tissue oxygenation with the JetPeel� system. Oneprecaution recommended was to avoid the eyelids.
In another study, Onesti et al. [117] treated a group of 54 patients with theJetPeel� method for skin rejuvenation from scar treatment (surgical, post-traumatic injury, acne), as well as damage from pigmentation and stretchmarks. Six treatments of 5e15 minutes were performed. The depth of skinabrasion was a function of time of exposure and the distance of the nozzle fromthe surface. The results were very satisfactory and the rapid healing led to highpatient acceptance of the procedure. Increased absorption and efficiency maybe achieved by adding other treatment substances, such as vitamins andhomeopathic drugs, to the saline jet stream.
Ishikawa [118] employed the JetOx-ND� system to effectively treatwounds from infected abrasions, incised or crushed wounds before suturing,and wounds at graft donor sites. Cleaning and debridement was performed witha saline solution and oxygen. No local anesthesia was used. The small volumeof cleaning solution (100 mL) required was sufficient for treating a wound 5 cmwide and 1 cm deep and the drainage and foreign matter could be collected
229Chapter | 6 Alternate Semi-Aqueous Precision Cleaning Techniques

easily with gauze and swab. The shield prevented splashing of the cleaningsolution. The author reported that the pain caused by the treatment was toler-able without local anesthesia. No cases of post-suturing infection were found.The system was considered to be effective in improving wound care in surgeryand emergency situations for cleaning and debridement of wide and deepwounds.
Olivares et al. [119] successfully used the JetOx� system for cleansingand debridement as part of negative-pressure wound therapy for adult patientsover a period of 3 years with injuries of different etiology and evolutionresulting in acute, chronic, and complex wounds. The deep chronic woundsrepresent a very high cost for health systems. Faster healing resulted inenhanced comfort and cost reduction for the patient during the healingprocess.
Mechanical debridement of chronic wounds may be complicated andvery painful despite the use of suitable analgesics. Mutumbo et al. [120]conducted a study to evaluate the efficacy and safety after a 1-year expe-rience with the JetOx-HDC� system promoting removal of fibrin, withoutdamaging granulation tissues. Ten patients with chronic leg ulcers weresubjected to an average of three sessions with the JetOx-HDC� systemfollowed by local application of an EMLA (Eutectic Mixture of LocalAnesthetics). The results showed a remarkable improvement of woundstatus. The treatment was found to be less painful and the patients did notneed local or general anesthetic. The JetOx-HDC� system is considered partof a global therapeutic strategy.
As noted earlier, the JetOx-ND� system can be used with other non-salinesolutions. Brizzio et al. [121] have employed Ringer’s lactate solution(a solution containing sodium chloride, potassium chloride, calcium chloride,and sodium lactate in distilled water [90]) to successfully clean and debridevenous leg ulcers (3e50 cm2) in a group of 55 adult patients. Other solutionsthat have been developed and used successfully for cleansing and debridementinclude super-oxidized water solutions (oxidized water (99.98%) with reactivespecies of chlorine and oxygen) and an antimicrobial solution containingdichlorine monoxide (Cl2O) [99e103].
Uribe and Sanchez [101,102] conducted a pilot study to evaluate theepithelialization rates of chronic, uninfected diabetic foot ulcers in 40 adultpatients treated topically with a neutral pH super-oxidized water solution.Treatment was conducted with 25 mL of the super-oxidized solution usingthe JetOx� system (O2 pressure 1e1.3 kPa at 1.5 mL/min). The resultsshowed remarkable rates of epithelialization of 0.5e0.7 mm per day withtotal wound closure observed between 27 and 43 days. In a control grouptreated with saline solution, wound closure required between 45 and75 days.
Altamirano [122] treated 64 children with various partial- and full-thicknessburn injuries. Debridement with the JetOx� system was conducted under
230 Developments in Surface Contamination and Cleaning

general anesthesia at entry followed by moistening of the wound with a super-oxidized water solution. In general, the patients tolerated the daily cleansingand debridement without much pain. The length of hospital stay was shorter,resulting in significant cost savings.
4. SUMMARY
Two alternate semi-aqueous cleaning techniques have been developed forvarious precision cleaning applications. Vapor steam cleaning employs drysuperheated steam to remove surface contaminants. It is a low-cost, effectivemethod for precision cleaning and for decontamination of microbially contam-inated surfaces. Supersonic gas-liquid cleaning is based on accelerating thecleaning liquid, suspended as droplets in a gas stream, to supersonic velocitiesthrough a convergingediverging nozzle. The gas-liquid mixture has the kineticenergy to very effectively remove surface contaminants. This method can also beused for cleanliness verification. Both methods use very low volumes of aqueousliquids and are viable alternatives to solvent cleaning in many applications.
ACKNOWLEDGMENTS
The author would like to thank Jim and Jeff Sloan for useful discussions. He is very grateful to
Jody Mantell for help with locating obscure reference articles.
DISCLAIMER
Mention of commercial products in this chapter is for information only anddoes not imply recommendation or endorsement by The Aerospace Corpora-tion. All trademarks, service marks, and trade names are the property of theirrespective owners.
REFERENCES
[1] The U.S. Solvent Cleaning Industry and the Transition to Non Ozone Depleting Substances,
EPA Report, U.S. Environmental Protection Agency, Washington, DC, 2004. www.epa.gov/
ozone/snap/solvents/EPASolventMarketReport.pdf.
[2] J.B. Durkee, Cleaning with Solvents, in: R. Kohli, K.L. Mittal (Eds.), Developments in
Surface Contamination and Cleaning, William Andrew Publishing, Norwich, NY, 2008,
pp. 759e871. Ch. 15.
[3] R. Kohli, Adhesion of Small Particles and Innovative Methods for Their Removal,
in: K.L. Mittal (Ed.), Particles on Surfaces 7: Detection, Adhesion and Removal, VSP,
Utrecht, The Netherlands, 2002, pp. 113e149.
[4] DoD Joint Service Pollution Prevention Opportunity Handbook, Section 8, Department of
Defense, Naval Facilities Engineering Service Center (NFESC), Port Hueneme, CA, 2010.
[5] R. Kohli, K.L. Mittal (Eds.), Developments in Surface Contamination and Cleaning,
William Andrew Publishing, Norwich, NY, 2008.
231Chapter | 6 Alternate Semi-Aqueous Precision Cleaning Techniques

[6] The Ultimate Technology for Clean Room Cleaning e Steam Vapor Cleaning, 2010.
www.todayshealthyhome.com/steamvapor/cleaning_uses.html.
[7] Steam Vapor the Clear Winner in Fighting Mold in Carpet, International Facility
Management Association, Houston, TX, April 2007. www.ifma.org/daily_articles/2007/apr/
04_09.cfm.
[8] B.J. Tanner, Reduction in Infection Risk through Treatment of Microbially Contaminated
Surfaces with a Novel, Portable, Saturated Steam Vapor Disinfection System, Am. J.
Infection Control 37 (2009) 20.
[9] J.C. May, Use ‘Dry’ Steam Vapor Treatment for Healthier Carpet, Upholstery. www.house
keepingchannel.com/a 565 (December 2009).
[10] Steam Bullet: The Ultimate Cleaning Machine, 2010. www.asseenontv.com/prod-pages/
steam-bullet.html.
[11] M. Dietrich, Don’t Run Out of Steam. Parts 3 and 4, Sanitation Canada (Septembere
October 2009) 45e47.
[12] M.J. Weitz, Method and Apparatus for Steam Cleaning Anilox Inking Rolls, U.S. Patent
Application 2003/0167948 (2003).
[13] R. Hoverson, Steaming Clean, American School & University Magazine, October 2006.
http://asumag.com/Maintenance/university_steaming_clean/.
[14] W.J. Bauer, Systems and Methods for Disinfecting and Sterilizing by Applying Steam Vapor
Containing Low Zeta Potential Mineral Crystals, U.S. Patent 7,547,413 (2009).
[15] H. Kunze-Concewitz, Method of Cleaning Surfaces with Water and Steam, U.S. Patent
5,964,952 (1999).
[16] W. Koehler, H. Padilla, Steam Cleaning as a Solvent Alternative, DoD Joint Service
Pollution Prevention Opportunity Handbook, Section 8-1-6, Naval Facilities Engineering
Service Center (NFESC), Port Hueneme, CA, 2000.
[17] R. Vozilla, C. Tittle, Portable Steam Cleaning System (Mini-Max), DoD Joint Service
Pollution Prevention Opportunity Handbook, Section 8-1-11, Naval Facilities Engineering
Service Center (NFESC), Port Hueneme, CA, 2003.
[18] Synopsis of Steam Cleaners, Report Project 06e02, US Air Force Dental Evaluation and
Consultation Service, Great Lakes Naval Training Center, Great Lakes, IL 2006. http://
airforcemedicine.afms.mil/idc/groups/public/documents/afms/ctb_109150.pdf.
[19] The Micro Precision Steam Cleaner Solves Tough Cleaning Challenges, VaTran Systems,
Chula Vista, CA, 2010. www.vatran.com.
[20] High Performance Steam Jet Cleaning, Elma GmbH & Co KG, Singen, Germany, 2010.
www.elma-ultrasonic.com.
[21] Dental and Jewelry Steam Cleaners, Reliable Corporation, Toronto, Ontario, Canada, 2010.
www.reliablecorporation.com.
[22] Steamshine Steam Cleaning Systems, C.D. Nelson Consulting, Lakemoor, IL, 2010.
www.steamshine.com.
[23] The Mini-Max Cleaner, PDQ Precision Inc, San Diego, CA, 2010. www.pdqprecision.com.
[24] Steam Cleaning, 2010. www.imexserve.it/guide-steam-cleaning.html.
[25] W. Swichtenberg, Vapor Steam Cleaning, 2010. http://articles.directorym.com/Vapor_
Steam_Cleaning-a940806.html.
[26] E.W. Lemmon, M.O. McLinden, D.G. Friend, Thermophysical Properties of Fluid Systems,
in: P.J. Linstrom, W.G. Mallard (Eds.), NIST Chemistry WebBook, NIST Standard Refer-
ence Database Number 69, National Institute of Standards and Technology, Gaithersburg,
MD, 2010. http://webbook.nist.gov.
[27] J.E. Sloan, E.L. Bellegarde, Steam Cleaning System, U.S. Patent 6,299,076 (2001).
232 Developments in Surface Contamination and Cleaning

[28] J.G. Leidenfrost, De Aquae Communis Nonnullis Qualitatibus Tractatus, University of
Duisburg, Germany (1756). English Translation of Chapter 15: On the Fixation of Water in
Diverse Fire, Intl. J. Heat Mass Transfer 9 (1966) 1153.
[29] C. Gianino, Leidenfrost Point and Estimate of the Vapour Layer Thickness, Phys. Educ. 43
(2008) 627.
[30] A.K. Mozumder, M.R. Ullah, A. Hossain, M.A. Islam, Sessile Drop Evaporation and Lei-
denfrost Phenomenon, Am. J. Appl. Sci. 7 (2010) 846.
[31] M. Friedheim, Steam Jet Cleaning and Sterilizing System, U.S. Patent 4,414,037 (1983).
[32] C.D. Nelson, Method and Apparatus for Generating Pressurized Fluid, U.S. Patent
4,878,458 (1989).
[33] M. Friedheim, Superheated Vapor Generator and Control System and Method, U.S. Patent
5,471,556 (1995).
[34] M. Friedheim, Superheated Vapor Generator System, U.S. Patent 6,006,009 (1999).
[35] M. Friedheim, Superheated Vapor Generator and Method of Fabrication Thereof, U.S.
Patent 6,181,873 (2001).
[36] Elmasteam Steam Cleaning for Medical Engineering, Elma GmbH & Co KG, Singen,
Germany, 2010. www.elma-ultrasonic.com.
[37] Cleaning Surgical Instruments, SPS Medical, Rush, NY, 2001. www.spsmedical.com/
education/educationarticles.html.
[38] J. Weber, B. Beck, Luer-Lock Connector for Medical Devices, U.S. Patent 7,472,932
(2009).
[39] G. Guala, Male Luer Lock Connector for Medical Fluid Lines, U.S. Patent 6,893,056 (2005).
[40] J. Ham, Steam Exposure Temperature Measurement, GTI Industries, San Diego, CA,
September 2002, Test Report 02-339-A, www.pdqprecision.com.
[41] Personal communication with Jeff Sloan, VaTran Systems (2009).
[42] R.M. Kwan, A.J. Yost, J.V. Santiago, A.C. Herring, M.M. Conlin, Steam Vapor Cleaning
Ejection Seat Frames and Components Technical Evaluation, Technical Report NAWCAD-
PAX/TR-2002/244, Naval Air Warfare Center Aircraft Division, Patuxent River, MD, 2003.
[43] M. Panzner, G. Weidemann, M. Meier, W. Conrad, A. Kempe, T. Hutsch, Laser Cleaning of
Gildings, in: J. Nimmrichter, W. Kautek, M. Schreiner (Eds.), Lasers in the Conservation of
Artworks LACONAVI Proceedings, Springer Verlag, Berlin, Germany, 2007, pp. 21e28.
[44] Microbiological Tests with Capitani Steam Cleaning Systems, Gialloblu Studio e Controllo
Prodotti e Produzioni, Milan, Italy, 2006. www.capitani.it/test_eng.shtml.
[45] Anti Bacterial Effect Case Study, Adriatic Union Laboratories, Vicenza, Italy, 2010.
www.imexserve.it/guide-case-study.html.
[46] S.E. Mackler, Case by Case: Upgrading the Precision Cleaning Process, Process Cleaning
Magazine, September/October 2009.
[47] J.W. Duffy, D. Hashimoto, J.E. Sloan, E.L. Bellegarde, Development of an Automated
Cleaning System for Multi-Ferrule Fiber-Optic Connectors, in: Optical Fiber Communi-
cation Conference and Exposition and The National Fiber Optic Engineers Conference,
OSA Technical Digest (CD), Paper JThA109, Optical Society of America, 2008.
www.opticsinfobase.org/abstract.cfm?URI¼OFC-2008-JThA109.
[48] M. Friedheim, Super-Heated, High-Pressure Steam Vapor Cleaning, in: B. Kanegsberg,
E. Kanegsberg (Eds.), Handbook for Critical Cleaning, CRC Press, Boca Raton, FL, 2001,
pp. 343e348.
[49] R.E.B. Caimi, M.D. Littlefield, G.S. Melton, E.A. Thaxton, Cleaning Verification by Air/
Water Impingement, in: Proc. Precision Cleaning ’94 Conference. Witter Publishing,
Flemington, NJ, 1994, pp. 31e41.
233Chapter | 6 Alternate Semi-Aqueous Precision Cleaning Techniques

[50] L.L. Jones, M.D. Littlefield, G.S. Melton, R.E.B. Caimi, E.A. Thaxton, Cleaning Verifi-
cation by Air/Water Impingement, NASA Technical Memorandum NASA-TM-111898,
NASA Kennedy Space Center, FL, 1994.
[51] Contamination Control Requirements Manual, NASA Document JPR 5322.1, NASA
Johnson Space Center, Houston, TX, 2009.
[52] W.L. Dearing, L.D. Bales, C.W. Basset, R.E.B. Caimi, G.M. Lafferty, G.S. Melton, et al.,
Methods for Using Water Impingement in Lieu of Chlorofluorocarbon 113 for Determining
the Non-Volatile Residue Level on Precision Cleaned Hardware, in: C.J. Bryan, K. Gebert-
Thompson (Eds.), Alternatives to Chlorofluorocarbon Fluids in the Cleaning of Oxygen and
Aerospace Systems and Components, ASTM STP-1181. ASTM International, West
Conshohocken, PA, 1993, pp. 66e77.
[53] R.E.B. Caimi, E.A. Thaxton, Supersonic Gas-Liquid Cleaning System, in: Proc 4th National
Technol Transfer Conf, NASA Conference Publication CP-3249 Volume 1 (1993) 232e240.
[54] R.E.B. Caimi, F.N. Lin, E.A. Thaxton, Gas-Liquid Supersonic Cleaning and Cleaning
Verification Spray System, U.S. Patent 5,730,806 (1998).
[55] Super Clean, Super Safe, NASA Spinoff, p. 98 (2002).
[56] M.S. Granick, R.L. Gamelli (Eds.), Surgical Wound Healing and Management, Informa
Healthcare, New York, NY, 2007.
[57] H. Schlichting, K. Gersten, Boundary Layer Theory, eighth ed., Springer Verlag, Heidelberg
and Berlin, Germany, 2000.
[58] D.R. Spotz, Water Jet Cleaning Appliance, U.S. Patent 3,982,965 (1976).
[59] R.A. Hudson, Pulsating Spray Nozzle, U.S. Patent 4,350,158 (1982).
[60] D.H. Klosterman, S.M. Laskowski, S.V. Knee, S.-K. Shi, Low Flow Rate-Low Pressure
Atomizer Device, U.S. Patent 4,787,404 (1988).
[61] C.R. Sperry, A.M. Raff, Method for the Cleansing of Wounds Using an Aerosol Container
Having Liquid Wound Cleansing Solution, U.S. Patent 5,059,187 (1991).
[62] V.E. Johnson Jr., Enhancing Liquid Jet Erosion, U.S. Patent 4,681,264 (1987).
[63] R.C. Lewis Jr., Ultrasonic Wound Cleaning Method and Apparatus, U.S. Patent 4,982,730
(1991).
[64] L. Molinari, Adjustable Apparatus for Removing Surface Portions of Human Tissue, U.S.
Patent 5,037,432 (1991).
[65] D.H. Grulke, D.L. Tyler Sr., W.M. Booth III, Compact Pulsing Pump for Irrigation Hand-
piece, U.S. Patent 5,046,486 (1991).
[66] D.C. Bailey, Method and Apparatus for Cleaning with High Pressure Liquid at Low Flow
Rates, U.S. Patent 5,551,909 (1996).
[67] S. Palffy, Method and Device for Producing Periodical Impulse Changes in a Fluid Flow,
U.S. Patent 5,819,801 (1998).
[68] S. Gold, J.V. Mizzi, Liquid Spray Dispenser and Method, U.S. Patent 6,125,843 (2000).
[69] P.H. Rose, P. Sferlazzo, R.G. van der Heide, Aerosol Surface Processing, U.S. Patent
6,203,406 (2001).
[70] M.E. Labib, C.-Y. Lai, P.A. Materna, G.L. Mahon, Method of Cleaning Passageways Using
a Mixed Phase Flow of Gas and a Liquid, U.S. Patent 6,454,871 (2002).
[71] D.E. Holt, C.E. Lundberg, D. Austin, M. Foster, Fluid and Air Nozzle and Method for
Cleaning Vehicle Lenses, U.S. Patent 6,554,210 (2003).
[72] C. Litherland, K. Behzadian, Devices and Methods for Nebulizing Fluids Using Flow
Directors, U.S. Patent 6,550,472 (2003).
[73] P.J. Weber, L.B. da Silva, A.M. Rubenchik, Tissue Resurfacing Using Biocompatible
Materials, U.S. Patent 6,726,693 (2004).
234 Developments in Surface Contamination and Cleaning

[74] G. Andersson, Surface Treatment Nozzle, U.S. Patent 6,824,453 (2004).
[75] M.A. Hashish, S.J. Craigen, F.M. Sciulli, Y. Baba, Apparatus for Fluid Jet Formation, U.S.
Patent 6,945,859 (2005).
[76] D.P. Jackson, Carbon Dioxide Snow Apparatus, U.S. Patent 7,293,570 (2007).
[77] Y. Tabani, M.E. Labib, Method for Cleaning Hollow Tubing and Fibers, U.S. Patent
7367346 (2008).
[78] W.T. McDermott, J.W. Butterbaugh, Cleaning using Argon/Nitrogen Cryogenic Aerosols,
in: R. Kohli, K.L. Mittal (Eds.), Developments in Surface Contamination and Cleaning,
William Andrew Publishing, Norwich, NY, 2008, pp. 951e986. Ch. 19.
[79] R. Sherman, Carbon Dioxide Snow Cleaning, in: R. Kohli, K.L. Mittal (Eds.), Develop-
ments in Surface Contamination and Cleaning, William Andrew Publishing, Norwich, NY,
2008, pp. 987e1012. Ch. 20.
[80] M. Tavger, Apparatus and Method for Tissue Cleansing, U.S. Patent 6,283,936 (2001).
[81] M. Tavger, Dermal Abrasion, U.S. Patent 6,673,081 (2004).
[82] M. Tavger, A High Velocity Liquid-Gas Mist Tissue Abrasion Device, Int. Patent WO/2005/
065032 (2005).
[83] F. Kinney, Supersonic Gas-Liquid Cleaning System, NASA Contractor Report CR-97-
206196 (1996).
[84] S.A. Sherif, W.E. Lear, N.S. Winowich, Effect of Slip Velocity and Heat Transfer on the
Condensed Phase Momentum Flux of Supersonic Nozzle Flows, Trans. ASME J. Fluids
Eng. 122 (2000) 14.
[85] W.E. Lear, S.A. Sherif, Aerothermal Considerations for the Design of Two-Phase High
Speed Impact Cleansers, Trans. ASME J. Fluids Eng. 122 (2000) 20.
[86] J.F. Klausner, R. Mei, S. Near, R. Stith, Performance Enhancement of a High Speed Jet
Impingement System for Nonvolatile Residue Removal, NASA Contractor Report CR-97-
205941, 1997.
[87] J.F. Klausner, R. Mei, S. Near, R. Stith, Two-Phase Jet Impingement for Non-
Volatile Residue Removal, Proc. Inst. Mech. Engrs. Part E: J. Process Mech. Eng. 212
(1998) 271.
[88] Flow-Concentrating Supersonic Gas/Liquid Nozzles, Technical Support Package KSC-
11883, NASA Tech Briefs, 2001.
[89] Personal communication with Jim Sloan, VaTran Systems, Chula Vista, CA, 2010.
[90] J.E. Sloan, Low Mass Flow, Momentum Cleaning Methods, in: Proc. Precision Cleaning ’97
Conference, pp. 182e185, Witter Publishing, Flemington, NJ, 1997.
[91] American Heritage Medical Dictionary, Houghton Mifflin Company, New York, NY, 2007.
[92] Jetox� - ND and Jetox� - HDC Wound Cleansing and Debridement Systems, TavTech Ltd.,
Yehud, Israel, 2010. www.tav-tech.com.
[93] Jetox� - ND Jet Lavage Wound Cleansing and Debridement System, DeRoyal, Powell, TN,
2009. www.deroyal.com.
[94] B. Noel, Prise en Charge de L’Ulcere de Jambe D’Origine Veineuse, Revue Medicale
Suisse, Review No. 16 (April 2005).
[95] S. Meaume, L. Teot, Step by Step Wound Healing, Jaypee Brothers Medical Publishers,
New Delhi, India, 2005. Ch. 2.
[96] C. Sussman, B. Bates-Jensen, Wound Care: A Collaborative Practice Manual for Health
Professionals, third ed., Lippincott Williams & Wilkins, Philadelphia, PA, 2006.
[97] H. Jenzer, Okonomie der Wundheilung, in: T. Wild, J. Aubock (Eds.), Manual der Wund-
heilung. Chirurgisch-dermatologischer Leitfaden der modernen Wundbehandlung, Springer
Verlag, Vienna, Austria, 2007, pp. 297e305.
235Chapter | 6 Alternate Semi-Aqueous Precision Cleaning Techniques

[98] L. Teot, Surgical Debridement, in: M.S. Granick, R.L. Gamelli (Eds.), Surgical Wound
Healing and Management, Informa Healthcare, New York, NY, 2007, pp. 91e101. Ch. 10.
[99] H. Alimi, A. Guiterrez, Method of Treating Skin Ulcers Using Oxidative Reductive
Potential Water Solution, U.S. Patent Application 2006/0235350 (2006).
[100] T.A. Wolvos, Advanced Wound Care with Stable, Super-Oxidized Water, Wounds (January
2006 Supplement), pp. 11e13.
[101] F.F. Uribe, F.S. Sanchez, Comparative Study of the Use of Jetox and Chloride of Sodium
0.9% versus Jetox and Solutions Superoxidants Electrolyzed, in: Proc. 19th Symp.
Advanced Wound Care and Wound Healing Society, San Antonio, Texas, 2006. www.
oculusis.com/us/technology/published.php.
[102] F.F. Uribe, Effect of a Neutral pH Super-Oxidized Solution in the Healing of Diabetic Foot
Ulcers, Poster PW 102 at 2008 WUWHS Congress, World Union of Wound Healing
Societies, 2008. www.wuwhs.com/congress2008.
[103] R. Northey, Antimicrobial Solutions Containing Dichlorine Monoxide and Methods of
Making and Using the Same, U.S. Patent Application 2010/0112092 (2008).
[104] JetPeel 3 Multifunction Skin Rejuvenation System, TavTech Ltd, Yehud, Israel, 2010.
www.tav-tech.com.
[105] R. Kronmeyer, JetPeel Vies to Replace Microdermabrasion, Aesthetic Buyers Guide
(September/October 2006) 218e219.
[106] E.S. Lindenbaum, M. Tavger, JetPeel e New Aspect for Skin Rejuvenation, unpublished
report, 2005. www.tav-tech.com.
[107] R.G. Barile, C. Fogarty, C. Cantreil, G.S. Melton, Precision Cleaning Verification of Fluid
Components by Air/Water Impingement and Total Carbon Analysis, NASA Technical
Memorandum NASA-TM-II742, NASA Kennedy Space Center, FL, 1994.
[108] G.S. Melton, R.E.B. Caimi, E.A. Thaxton, Determination of Non-Volatile Residue on
Precision Cleaned Oxygen and Aerospace Systems and Components by Means of Water and
Total Organic Analysis, in: Proc. 1993 Intl. CFC and Halon Alternatives Conf., 1993,
pp. 642e650.
[109] R.E.B. Caimi, E.A. Thaxton, Balanced Rotating Spray Tank and Pipe Cleaning and
Cleanliness Verification System, U.S. Patent 5.706,842 (1998).
[110] N.E. Prieto, W. Lilienthal, P.L. Tortorici, Correlation Between Spray Cleaning
Detergency and Dynamic Surface Tension of Nonionic Surfactants, J. Am. Oil Chemists
Soc. 73 (1996) 9.
[111] I. Kanno, M. Tada, M. Ogawa, Two-Fluid Cleaning Jet Nozzle and Cleaning Apparatus, and
Method Utilizing the Same, U.S. Patent 5,918,817 (1999).
[112] S. Hara, Cleaning Nozzle and Cleaning Apparatus, U.S. Patent 6,935,576 (2005).
[113] Gas-Liquid Supersonic Cleaning Spray System Technology, NASA Innovative Partnership
Program, Kennedy Space Center, FL, 2010.
[114] Personal Communication with Ken Smith, Applied Cryogenic Solutions, Galveston, TX,
2010.
[115] J.B. Gayle, T.S. Jerowski, Developing NASA’s Supersonic Gas-Liquid Cleaning System.
Boon to Critical Cleaning, Precision Cleaning Magazine (May 1996) pp. 52e55.
[116] J. Golan, N. Hai, JetPeel: A New Technology for Facial Rejuvenation, Annals of Plastic
Surgery 54 (2005) 369.
[117] M.G. Onesti, G. Curinga, M. Toscani, N. Scuderi, Jet-Peel: New Technique for the Treat-
ment of Skin Imperfections, Dermatologia Clinica 26 (2006) 19.
[118] H. Ishikawa, Clinical Use of a New Wound Cleansing and Debridement System, in: Proc.
67th Ann. Mtg. Japan Surgical Association, Tokyo, Japan, 2005, pp. 315-317.
236 Developments in Surface Contamination and Cleaning

[119] E.R. Olivares, A.V. Martınez, C.C. Smith, M.A.Z. Aguirre, Terapia de Presion Negativa en
el Manejo de Heridas, Cirugia Plastica 18 (2008) 56.
[120] M. Mutombo, M. Poiteau, T. Morel, K. Benabdallah, P. Guillain, JETOX� System in
Management of Leg Ulcer: A Review of One Year’s Experience, Journal des Plaies et
Cicatrisations 63 (2008) 25.
[121] E. Brizzio, F. Amsler, B. Lun, W. Blattler, Comparison of Low-Strength Compression
Stockings with Bandages for the Treatment of Recalcitrant Venous Ulcers, J. Vascular
Surgery 51 (2010) 410.
[122] A.M. Altamirano, Reducing Bacterial Infectious Complications from Burn Wounds,
Wounds (January 2006 Supplement) 17e19.
237Chapter | 6 Alternate Semi-Aqueous Precision Cleaning Techniques

This page intentionally left blank

Index
Acoustic streaming cleaning, 35e6, 42e5
particle removal benefits, 43e5Adhesion forces, general grouping, 67
Aerosol cleaning, and particulate
contamination, 2
Argon bullets, for 20 nm particles, 16e23
from AR/He mixture, 18e23
Laval nozzle, 19
long and short nozzles, 18e19, 23
SEM images, 19e22
from pure argon, 17e18
Biological fouling, 124
Bjerknes force, 42
Blast wave theory (BWT) for LIP, 73e6
Boundary layers, with sonic cleaners,
37e9Bullet particles:
fragmentation, 8e10generation, 15e16
size estimation, 16
Cahn microbalance, 47
Cavitation with megasonic cleaning, 31e2
cavitation meters, 47e8
cleaning process, 34e5Chemical reaction fouling, 125
Cleaning techniques, advantages/
disadvantages:
laser cleaning, 65e6mechanical cleaning, 65e6
vapour-phase cleaning, 65e6
wet-chemical etching, 65e6Cleanliness measurement see Surface
cleanliness measurement
CO2 snow cleaning, 23e4
damage issues, 24
efficiency, 24
and particulate contamination, 2Contamination see Fluid cleanliness levels;
Interior surfaces, contamination;
Particulate contamination
Corrosion fouling, 124
Cryogenic aerosol cleaning technique, 2
Crystallization/scaling fouling, 124
Debye interaction, 4
Deposition/particulate fouling, 124
Detachment force of adhesion, JKR model,
76e8
Deymier et al characterization of adhesion/
removal forces, 41e2Dielectrophoretic force, 175e7
Direct Simulation Monte Carlo (DSMC)
method, 79
DRAM/flash memory devices, and
particulate contamination, 1
Drinking water hose cleaning see Projectiles,
cleaning with
Dry laser cleaning (DLC), 68e9
damage issues, 68e9main principle, 68
Dry particle removal, 65e7Dust removal from solar panels see
Electrodynamic screens (EDS);
Solar panels, dust removal from
Electrodynamic screens (EDS), 165e9
basic principles, 165
dielectrophoretic force, 175e7
high-voltage linear sinusoidal power
supply, 184, 185, 186
high-voltage three-phase power supply,
179e84
design requirements, 179e81
MOSFET-based power supply,
181e3
performance modeling, 166e7
power requirements, 169
single-phase EDS arrangement, 167e8three-phase EDS arrangement, 168
trajectories of charged particles, 170e5
electric field, 170e1
removal of charged particles, 172e6removal of uncharged particles,
174e6
trajectories, 170e1tribocharging of particles, 177e8
uncharged conducting particles removal,
178e9
see also Solar panels, dust removal from
239

Electrodynamic screens (EDS), dust removal
efficiency (DRE) testing, 184e90
charge conditioning of dust cloud, 187
dust removal efficiency, 184e9experimental setup, 184, 187e8
low pressure testing, 189e90
maximum power point (MPP) for panels,
190e3adjusting voltage output, 191e2
cleaning efficiency measurement, 193
maximum power point tracking
(MMPT), 192e3
test chamber, 189, 191
size classification, 187
test procedure, 187e90
test results, 193e6
net charge-to-mass ratio (Q/M), 194Electrospray technique, 24e7
about electrospray, 24e5advantages, 27
basis of particle removal, 25e6
performance, 27
removal force formula, 25e6typical system, 26e7
Electrostatic charging of particles, 157e8, 159
Fluid cleanliness levels, 126e32
about particulate contamination, 126e7
hydraulic fluids, 127e30
ISO standard, 127e8, 130, 131, 132
military standard, 129e30, 132
SAE standard, 128e9, 130
typical internal clearances, 130
non-hydraulic fluids, 130e2see also Tube cleaning methods
Fouling see Interior surfaces, contamination
Gas molecule-nanoparticle interactions with
LIP, 79e81
critical rolling moment, 81
Direct Simulation Monte Carlo (DSMC)
method, 79
Knudsen number, 79
rocking resonance frequencies, 81
Hamaker constant, 4
Haze mapping, 48e9
High-pressure jet cleaning, 133
Homogeneous nucleation and growth, 12e15
about the nucleation and growth, 12
critical super-saturation ratio, 13
general features, 12e15
generation by pure nitrogen expansion
example, 14e15
nucleation onset point, 13, 14
Volmer and Weber model, 13e15Hose cleaning see Projectiles, cleaning with
Hydraulic fluids see Fluid cleanliness levels
Interior surfaces, contamination:
contamination types:
biological fouling, 124
chemical reaction fouling, 125
corrosion fouling, 124
deposition or particulate fouling, 124
scaling or crystallization fouling, 124
effects, 125e6hydraulic/pneumatic systems failure,
125e6
oil degradation with water/gases, 126
in space missions, 126
see also Fluid cleanliness levels;
Projectiles, cleaning with; Tube
cleaning methods
Keesom interaction, 4
Kennedy Space Centre (KSC), and SS-GLC
cleaning, 212e13
Knudsen number, 79
Laser cleaning, 63e117
about laser cleaning, 63e4, 67e8, 114e17advantages/disadvantages summary, 66
dry laser cleaning (DLC), 68e9
future research direction, 113e14
liquid-based laser cleaning, 69e70see also Laser-induced plasma (LIP)
cleaningLaser-induced plasma (LIP) cleaning, 70e103
basic principles, 70e2
blast wave propagation, 70, 73
blast wave theory (BWT), 73e6
shockwave propagation, 73e4temperature behind shockwave, 76
lithography mask damage and/or
alterations issues, 102e6
nanoparticle displacement, 76e9detachment force of adhesion, JKR
model, 76e9
gas molecule-nanoparticle interactions,
79e81
moment balance criterion, 76e8
rocking motion from transient force
field, 78e9
240 Index

nanoparticle removal experiments, 81e94
results summary, 94
scanning electron microscopy (SEM)
images, 83e6, 87e93surface analysis system (SAS) images,
81e2
process parameters optimization, 94e8
about optimization, 94
attenuator use and setting, 95e8
pulse energy control, 95e6
transient pressure measurement, 94e8
thermomechanical analysis, 99e102
damage issues, 99
radiation intensity loading of masks,
101e2shockwave loading of masks, 100e1
small particles problems, 99Laser-induced plasma (LIP) cleaning,
advanced techniques, 103e13
about removing smaller particles, 103e5
damage problems with normal techniques,
105
LIP with in-air shock tubes, 107e10basic principles, 107e8
instrumentation diagram, 111e12
LIP in pressurized chambers, 106e7
experimental set-up, 108
LIP with submerged shock tubes, 112e13
wet-LIP cleaning, 110e11Laval nozzle, 19
Liquid particle counters (LPCs), 45e6
near angle light scatter, 45e6Liquid-based laser cleaning, 69e70
steam laser cleaning (SLC), 69e70London interaction, 4
Mechanical cleaning:
advantages/disadvantages, 65e6
tubes, 133Megasonic cleaning, 31e59
about ultrasonic and megasonic cleaning,
31e4, 59
applications, 32
case studies:
Cu-low-k dual damascene process, 58
irradiating wafers in electronic
solutions, 58
L-type waveguides, 58
removal of post-CMP residues, 59
cavitation control benefit, 31e2
contribution of acoustic streaming, 42e5
microbalances, 47
reciprocity principle, 33e4
theory, 41e5
Bjerknes force, 42
Deymier et al characterization of
adhesion/removal forces, 41e2
Kim et al. on detachment of bubbles, 42
Wu et al. single-wafer cleaner, 32e3
see also Sonic cleaners; Surface cleanliness
measurementMegasonic system evaluation, 48e57
damage issues, 52
electrical power value issues, 51e3
examination of sonoluminescence flux, 52
haze mapping, 48e9
mean cavitation intensity with frequency,
48e9
particle removal efficiency (PRE), 48e51
sweep, usage of, 55e7Microbalances, 47
Mie scattering theory, 160
Molecular dynamics (MD) simulation, 2e3,
5e8
Moment ratio (MR) models, sonic cleaners,
39e40
Nano-particle removal:
about the removal, 3
adhesion force, 3e4
bullet particle fragmentation, 8e10
bullet particle size effects, 11
deformation/adhesion issues, 10
force for removal, 4e5
impact force of collision, 5
Hamaker constant, 4
kinetic energy, momentum or force?, 6e8
kinetic energy vs. binding energy, 8e10
Molecular dynamics (MD) simulation, 5e8particle density/hardness issues, 10e11
particle/substrate interactions:
Debye interaction, 4
Keesom interaction, 4
London interaction, 4
van der Waals (VdW) force, 4Near angle light scatter, 45e6
Nephelometry turbidity units (NTUs), 46e7
Nozzle beam technique see Supersonic
nozzle beam technique
Particle removal efficiency (PRE), 48e51
Particulate contamination:
and aerosol cleaning, 2
and the cryogenic aerosol process, 2
241Index
Particulate contamination (Continued )
and DRAM/flash memory devices, 1
and the fluid-dynamic drag force, 1
and wet cleaning processes, 1e2see also Interior surfaces, contamination
Photovoltaic (PV) and photothermal (PT)
installations, 149e97.
see also Electrodynamic screens (EDS);
Solar panels, dust removal from;
Solar power potential
Pipe cleaning see Projectiles, cleaning with
Precision steam cleaning, 202e12
about steam cleaning, 202e3
basic principles, 203
commercial examples, 206
cost benefits, 212
delivery systems, 205
equipment, 203e7
medical applications, 206e7, 208moisture content, 204
spray capabilities, 205
steam sources:
continuous fill systems, 204
Leidenfrost effect, 204
single tank units, 204
VaTran Systems, 204
surface drying, 204
typical specification, 205
waste management, 205Precision steam cleaning, applications,
209e11
aircraft ejection seats, 210
fibre optic endfaces, 211
gilded objects, 210
microbially contaminated surfaces, 210e11
stainless steel substrates, 210
typical examples, 209e10US Department of Defense (DoD), 211
Precision steam cleaning, operation issues,
207e9
additive use, 208
advantages, 209
disadvantages, 209
safety of operators, 208e9
suitability of objects, 207e8water quality, 207
Precision turbidity meter, 46e7
Projectiles, cleaning with, 134e43
about cleaning with projectiles, 123e4, 143
advantages/disadvantages, 140e1
applications, 141e3
automated systems, 138e40
basic principle, 134
operating issues, 138e40
operating pressures, 139
path constraints, 138e9for silt, soil, slurry and moisture,
139e40
size considerations, 140
pneumatic launchers, 135
projectiles, 135e7
abrasive projectiles, 136e7
coupling projectiles, 136e7grinding projectiles, 136e7
product recovery projectiles, 136e7
standard projectiles, 136e7
ultraclean nozzles, 137e8British Standard Pipe (BSP) nozzles,
138
hose nozzles, 137
Joint Industry Conference (JIC)
nozzles, 138
tube nozzles, 138
see also Fluid cleanliness levels; Interior
surfaces, contamination; Tube
cleaning methods
Reciprocity principle, with megasonic
cleaning, 33e4
Scaling or crystallization fouling, 124
Schlichting streaming, 41
Solar panels, dust removal from:
about the installations, 150e1, 196e7
charge distribution effects, 163e4
deposition rates, 155
power loss, 156e7
problem summary, 151
electrostatic charging of particles,
157e8
charge distributions, size/effect,
158e60
desert areas, 161
optical depth, 161
optical path, 161
microstructural deposition effects, 163e4
size/shape effects, 163e4suspended dust, 151
test chamber studies, 162e3
transmission loss, 160e2
extinction efficiency, 160e2
Mie scattering theory, 160
see also Electrodynamic screens (EDS);
Solar power potential
242 Index

Solar power potential, 151e4
available solar power, 151e2
cost/economic issues, 154
dust, adverse effects, 154
global power need, 152e3
PV system benefits, 153
US PV usage and potential, 153e4
see also Photovoltaic (PV) and
photothermal (PT) installationsSonic cleaners, 34e41
acoustic streaming process, 35e6boundary layer effects, 37e9
cavitation with acoustic streaming, 36,
40e1
cavitation process, 34e5frequency effects, 36e8
moment ratio (MR) models, 39e40
Schlichting streaming, 41
see also Megasonic cleaningSonoluminescence flux examination, 52
Steam cleaning, pipes, 133.
see also Precision steam cleaning
Steam laser cleaning (SLC), 69e70
Steam pipe cleaning see Projectiles, cleaning
with
Supersonic gas-liquid cleaning (SS-GLC),
212e31
about SS-GLC cleaning, 212e14
Kennedy Space Centre (KSC) special
needs, 212e13advantages, 222
basic principles, 214
disadvantages, 222
parameters for different techniques,
219
precision cleaning, 215e18, 223e9
Applied Cryonic Solutions (ACS)
systems, 227e8
commercial system example,
216e18
de-scaling, 227e8gas/water velocity, 216
heat exchanger tubing, 228
hollow items, 225
KSC validation testing, 223
nozzle design, 215e16
parametric studies, 224e5
rate of contamination removal tests,
225e6
semiconductor manufacture, 226e7
wafer cleaning, 226
water-soluble powders, 227
Supersonic gas-liquid cleaning (SS-GLC),
medical applications, 218e22,
229e31
advantages, 222e3burn injuries, 230e1
disadvantages, 223
foot ulcers, 230
gas nozzle configurations, 218e20infected wounds, 229e30
JetOxTM system, 219e20, 229e30
JetPeelTM system, 219e21, 229skin damage, 229
Supersonic nano-particle beam technique,
1e27
about the technique, 1e3, 27advantages, 3
disadvantages, 3
electrospray technique, 24e7
see also Particulate contaminationSupersonic nozzle beam technique, 11e24
argon bullets, for cleaning of 20 nm
particles, 16e23
bullet particle generation, 15e16CO2 snow cleaning, 23e4
homogeneous nucleation and growth, 12e15Surface cleanliness measurement, 45e8
liquid particle counters (LPCs), 45e6
microbalances, 47
nephelometric turbidity units (NTUs), 47
precision turbidity meter, 46e7ultrasonic cavitation meters, 47e8
Tribocharging of particles, 177e8
Tube cleaning methods, 132e4
chemical cleaning, 134
high-pressure jet cleaning, 133
mechanical cleaning, 133
steam cleaning, 133
see also Fluid cleanliness levels; Interior
surfaces, contamination;
Projectiles, cleaning with
Ultrasonic cavitation meters, 47e8
van der Waals (VdW) force, 4
Vapour-phase cleaning, advantages/
disadvantages summary, 66
Wet cleaning processes:
advantages disadvantages summary, 65e6
and particulate contamination, 1e2
wet/steam laser cleaning (WLC), 67
243Index

This page intentionally left blank