manual - The Cleaning System
244
The Cleaning System MANUAL
-
Upload
khangminh22 -
Category
Documents
-
view
2 -
download
0
Transcript of manual - The Cleaning System

The Cleaning System
MANUAL

2
Publisher:
Sales Support Team bvba
pa Jan Van Heelulaan 22, 2020 Antwerpen
Author:
Jan Van Aken
Manual version 150512
This manual is the exclusive property of Sales Support Team bvba and Aps Data-know-how. No part of this publication may be reproduced or made public in any form or by any means without the written permission of Sales Support Team bvba in Antwerp and Aps Data-know-how.
The manual is exclusive to the supply of the software licenses of The Cleaning System.
This manual is based on The Cleaning System version Pro 4.2 of December 2014, and is intended for users of the English version of The Cleaning System.

i
Content
Introduction 1
1. Glossary 1
A. Hierarchical relationship of the terms 1
B. Explanation of the words 2
2. Presentation of The Cleaning System 4
3. Structure and operation 5
4. Area type sets 7
5. Key figures 11
Installation 15
1. Software installation 15
Installation of the software 15
Subfolders of Aps Data-know-how\DKH4 16
Data back-up 17
2. Technical information – network environment 18
3. Databases 19
4. Installation for multiple simultaneous users 20
Main screen 23
1. Elements of the main screen 23
A. Main menu 24
B. Main data in the tree structure 24
C. Application work screen 27
2. Main screen functions 29
A. Creating a new customer 29
B. Creating a new building or floor 31
C. Creating an area 32
D. Building, floor or area tabs 34
Primary information tab 34
Secondary information tab 38
Floor and methods tab 41
Service profile tab 42
Dep. (Department connection) tab 42
Comment – Addresses – Contact tab 42
Details tab 43
3. Symbols in the Main data sidebar 44

ii
File 45
1. Choice of customer database 45
2. Data and software location management 46
3. Import and export data 46
4. Report generator 50
5. Choice of database 50
6. Exiting the software 50
7. Back-up of database(s) 51
8. Launching another database 51
A. Launching another user database 51
B. Launching another customer database 52
Edit 53
Image 54
1. Toolbar settings function 54
2. Zooming function 55
3. Visible layers function 55
4. View grid and guidelines function 55
5. View DXF function 56
6. Adjusting time format function 56
7. Time/cost as … function 56
8. Icons function 57
Data 59
1. Area libraries 60
Connection task sets with area library 60
2. Task sets 61
Tasks 63
Method 64
Method for drafting task sets 67
Frequency profiles 72
Frequency tables 72
Combination work code and frequency profile 75
Working times 76
3. Area types menu 78
4. Recalculate area types menu 83
5. Service profiles menu 83
6. Quality profile connection menu 85
7. Area groups menu 87

iii
8. Additional requirements tab 88
9. Calendar definition 92
10. Period definition 93
11. Work code definition 94
12. Work instructions 95
Customer 97
1. Introduction 97
2. Recalculating 98
3. End calculation 101
4. Other 104
5. Tasks 106
6. Show related images 106
7. Active plan type 106
8. Departments 108
9. Planning - implementation 111
A. Work plans 111
B. Personnel 114
C. Allocation – definition of zone 115
D. Weekly schedule 119
10. Maintenance settings runtime 120
11. Switch on/off level 120
12. Work state 121
13. Customer options 122
A. General options 123
B. Connections 125
Choice of area library 125
Choice of calendar 125
Choice of periods 127
Overview of the results of the institutions 127
C. Default adjustment key figures 128
D. Adjustment key figures periodical work 128
E. Add.shift (Trim) 129
F. Add.shift visualization in the building plans 130
G. Denomination other implementation plans 131
H. Making frequency texts and codes 131
I. Determine the contact titles of the customer files 132
J. Setting description ISO-codes 133
K. Setting CAD default patterns 133
L. Setting header texts 135

iv
Drawing 139
1. Drawing 139
2. Functions in the Drawing module 141
3. Measuring areas 144
4. Drawing the areas 146
A. Importing a DXF-file 155
B. Measuring the DXF building plan 157
C. Default settings building plans 158
D. Area information 161
5. Data management via shading 163
A. Use of shading 163
B. Selection of patterns – shading and colour 166
6. Visualizing information with symbols 167
7. Creating print sections 169
8. Visualization of information 173
Quality control 177
1. Introduction 177
2. Functions in the Quality control module 181
3. Setting quality controls 182
4. Exporting data 188
5. Wi-Fi communication settings 189
System 193
1. Introduction 193
2. Users and access rights management 194
A. New users 195
B. Removing a user 195
C. Changing password 196
D. Access levels 196
E. Denomination access level 197
F. Search open sessions 198
3. System management options 199
A. System settings management 199
B. Digitizer setting 200
C. Other – Calendar settings 200
D. Denomination of contact types 200
E. Denomination of symbol layers in the drawing sheet 201
F. Denomination ISO-codes 202
G. Denomination furnishing level 202
H. Runtime settings 203

v
4. Management of user settings 203
A. Text and sorting 204
B. Timer behaviour 205
C. Automation 206
D. Warnings 207
E. Customer and building subdivisions 207
F. Time formats 209
G. CAD – cursor settings 209
H. Settings in CAD – axes, grid, and support lines 210
I. Frequency symbols 211
J. Work code symbols 212
K. Planning symbols 213
L. Resetting user settings to default settings 214
M. Hints settings 214
N. Log notes settings 214
5. Management of customer file settings 215
A. General settings 215
B. Connections 216
C. Adjustments and pers. supplements 217
D. Calculation – return 217
E. Calculation – other 219
F. Post clean-up(s) 219
G. Add.shift – CAD graphics 220
H. Plan types 220
I. Frequency texts 221
J. Contact types 222
K. ISO-codes 222
L. CAD – grid 223
M. CAD – gridtype headers 223
6. Management of default settings 224
7. Download 224
8. Administration 224
9. Language choice 225
10. System information 226


vii
Illustration content
Introduction 1
Presentation of terms and their relationship 1
Installation 15
System ad 19
Login and password 20
Main screen 23
Main screen 23
Main screen The Cleaning System 25
Examples Work screen 27
Examples Work screen 28
New customer 29
New customer file 30
Screen customer options - Connections 31
Automatic generation of door and room numbers 33
Area screen 34
List area types as drop-down 34
List floor types 35
Setting furnishing level in floor sets 36
Task sheet 38
Secondary information 39
Examples parameters in Secondary info file 39
Parameters for area components on client level. 40
Work code fill out completely 42
Visualization of icons in the Main data sidebar 44
File 45
Illustrations import data 47
Export Excel, choice of fields and order 49
Available reports 50
Illustration opening another user database 51
Illustration opening another customer database 52

viii
Edit 53
Image 54
Data 59
Connection task sets with area library 61
Choice of task lists 62
Menu File of task sets 62
Screen Exporting task sets 62
Area components and tabs 63
Task screen 64
Method screen 64
New method file 65
Screen task-method file 65
Screen furnishing level parameter 66
New task set for e.g. floor 67
New inventory task 68
Screens tasks, ceiling, glass, wall, window, outdoor tasks. 69
Tasks linked to methods 70
Connection method and tasks 70
Detail connection task with method – return and work type 71
Frequency profiles in the respective tables 72
Menu choice of symbols 73
Frequency symbols 73
Designation of frequency profiles 74
Filling out frequency profiles in the frequency table 75
Impact work time of work codes with different frequency profiles 76
Alternative input working time in the time sheet 76
Working times for outdoor tasks 77
New area type 79
Additional calculation methods in the default area sheet 80
Work program tab 81
Window cleaning data 82
Detail service profile 84
Quality profile with tolerance values 85
Overview number of areas per quality profile 87
Detail area group and adjustment gains 88
ATP-measurement sheet 89
Own assessment limits 90
Reversed assessment limits 90

ix
Settings of the ATP-limit values 90
Assessment values with check marks 91
Assessment values with selection buttons 91
Period definition(s) 93
Work code (P1 to 3: Xxx) 94
Work instructions 95
Area main screen 96
Connection instructions 96
Customer 97
Log screen 100
The final recalculation notification 100
End calculation screen 101
Calculation results for the work types. 102
Factor field 102
Menu Options Other 104
Iso-codes with automatic increasing sequence number 105
Detail Instructions 105
List instructions 106
Active plan type 107
Tab departments 108
Department structure – Departments – Sections 108
Department sheet - Parameters 109
Overview of work times and costs per department 109
Setting detail overview per department 110
Illustration menu planning - implementation 111
Overview of the work plans. 111
New work plan 112
Norm time (available work time) 113
Completed available work time 113
Tab pages work plan 113
Optional designation of work type 113
Personnel allocation work plan. 114
Personnel details 115
Allocation work screen 116
Drop-down list of available work plans 116
Part screen selection of areas 117
Selection totals 117
‘Transfer‘-button 117

x
‘Remove-button from the work plan’ 118
Automatic selection until available work time 118
Automatic selection areas 118
Selection setting ‘Selection buttons‘ 118
Close button 118
Work screen weekly schedule 119
Menu weekly schedule 119
Image of the drop-down 120
Runtime settings 120
Default settings work state 121
Area with a work state number 121
Screen customer options 122
Name and status of the customer file 123
Alternative customer name 123
Options area texst descriptions 124
Show weekly schedule with icon 124
Show weekly schedule with text 124
Connections 125
Calendar – Selection button 125
Calendar settings 126
Period settings 127
Return calculation – work types 128
Adjustment periodical work 129
Division common spaces 129
Shift Rounds or extra cleanings button 129
Setting denomination shift rounds 130
Add.shift – Cad graphics 130
Setup of Plan types 131
Frequency codes and descriptions 132
Titles contacts with example 132
Iso-codes 133
Cad default patterns 134
Setting own titles 135
Drawing 139
Automatic numbering areas and doors 145
Worksheet drawn mode 146
Settings axes, grids and gridlines 147
Drawing pointer 147

xi
Support menu while drawing 148
Menu indicating areas in drawing sheet 148
Imported graphic images 149
Illustration combination of settings 150
Imported image 151
Active image 152
Measured floor 152
‘Rescaling to known length‘ 153
Calculation distortion scale 153
Dragging image to the correct scale setting 154
Scale setting below the worksheet 154
Scale adjustment 155
Import screen DXF-files 156
Measurement units of the DXF-building plan 156
Importing multiple DXF-files 156
Definition position with X – Y coordinates 157
Building plan in DXF with ‘snap points‘ and support lines 158
Drawing settings 159
Shading settings 159
Elements text layout 160
Section layouts 160
Legend layout in sections 161
Area information 161
Weekly schedule 162
Bar menu 163
Patterns 164
Pattern selection list 164
Illustration available codes 165
Brush for coding 165
Pattern settings 166
Denomination of the symbol layers 167
Fixed location for a symbol 168
Illustration layer choice 168
List print sections - sections 170
Window new print section 171
Colour setting print section 171
Active angular points 172

xii
Quality control 177
Main screen quality control 178
Setting of a control schedule 179
Statistics 180
Setting the inspection days 180
Control theme with inspection rounds 183
Control theme calendar 183
Detail sheet of an inspection round 184
Control type setting 185
Customizing entry field manually 185
Screen manually set control form 185
Input control Insta800 186
Input hygiene control 186
Input additional reuirements data 187
Input ATP-control 187
Result control 188
FTP synchronization 189
System 193
System main menu 193
Screen users 194
Screen new user 195
Screen changing password 196
Screen access levels 196
Screen settings access levels 197
Screen setting level names 198
Example of setting access levels 198
Searching and closing connected and non-active users 199
System options 199
Screen digitizer settings 200
Screen denomination contact types 201
Screen denomination symbol layers 201
Screen denomination ISO-codes 202
Denomination furnishing level 203
Screen user options 204
Set display of data in Main data 204
Screen timer(s) settings 205
Automation screen 206
Warnings 207

xiii
Customer and building divisions 208
Division with building group and without building group 208
Customizing time display 209
Cursor settings 209
Settings axes, grid, and support lines 210
Frequency symbols 211
Work code symbols 212
Work code symbols 213
Resetting to default settings 214
Hints 214
Screen customer options – general settings 215
Adjustment of returns in relation to work type 217
Frequency texts customer file 221
Contact types customer file 222
ISO-codes customer file 222
Screen settings grid per customer file 223
Repair database 224
Repair process 225
End of repair message 225
Screen system information 226


The Cleaning System
Introduction


Introduction
1
Introduction
1. Glossary
The Cleaning System uses a vocabulary that describes the cleaning organization on the basis of a fixed terminology. The words have in addition to their own specific meaning also a hierarchical relationship that helps organizing the cleaning structure.
Understanding the terminology and its hierarchical relationship will make the operation of this software clear.
As to get a quick understanding of how The Cleaning System works, you will find an overview of the words and their hierarchical relation in several parts of this manual.
A. Hierarchical relationship of the terms
Presentation of terms and their relationship

Introduction
2
B. Explanation of the words
Area library: the ‘library ‘of areas or also called the default set. It includes all the default areas with associated tasks used in The Cleaning System. It is used to calculate the number of working times and forms the basis for the default tasks to be carried out in any area.
Area group: each area belongs to a particular group or type of spaces which are similar in use and have the same functional or hygiene level. There may be differences among area groups. Each building consists of multiple area groups or area types.
The known area groups are: administrative, (para)medical, educational, traffic, kitchen, storage, residence, sleeping, meeting, sanitary, technical and external areas. The Cleaning System use can create other or more groups.
Area type: the standardized areas in the library are areas that get their function by the activities which take place in it. Once an area is used for a different activity or function, it does not change the area but the area type. An office can for instance transform into a meeting room, and therefore the cleaning tasks change. An office for one employee does not change when two or more employees move in. Only the inventory, the furniture and the accessories will change.
Area: when a building is measured and the cleaning organization is worked out, The Cleaning System designates a certain area type for each room in the building. Both the properties of the area and adjustments in the task list can be included. As soon as the used area type applies, the term ‘area‘ is used for that specific space.
Area component: each area is characterized by the activities taking place in it. Therefore, each area type can always be described on the basis of a number of fixed components. These fixed components are the basis of the description and are the starting point for quality control. The data of area components are laid down in the area type and saved as such in the library.
The components are always:
the type of floor in the area,
the inventory (furniture, accessories and their number of pieces),
the walls including doors, door list, switches etc.,
the ceiling including any equipment that belongs to the inventory,
interior glass, such as glass walls, inside windows and window sills.
Beside these five default components, The Cleaning System software allows to manage two more elements in the area components, which are:
other tasks linked to the area, such as clearing the meeting table, making coffee, filling vending machines, etc.,
outdoor tasks: if the area was described as an exterior area, e.g. the entrance, this also includes an inventory as sign posts, ashtrays, floor mats, etc. for which the work can be defined as a task.
Inventory: the inventory of the area type determines the tasks to be carried out. The Cleaning System allows those to be added as a ‘parameter‘, because their number influences the total working time. As such, one can use a parameter to set the number of work areas in an open office and manage the working time.
Frequency: every cleaning task has a fixed frequency, with which the task is carried out. The Cleaning System allows for each task to establish a certain rhythm to plan the task. These frequencies are mostly: daily, weekly, monthly, each 14
th day of the month, every two days, every two weeks, etc.
Frequency profile: The Cleaning System provides significant flexibility in organizing tasks according to different alternative frequencies. Each frequency can have an alternative for different reasons. To manage the frequency alternatives, the user establishes several frequency profiles. A group of frequencies is referred to as frequency profiles.

Introduction
3
Period: The Cleaning System allows the user to divide the seven days of the week over maximum three periods. For instance period 1 for weekdays, period 2 for Saturday, and period 3 for Sundays and holidays. Each period can be linked to a different work planning or it can be indicated that there is other work or no work.
Work code: The Cleaning System follows a uniform code to display the work organization in an area. The work code uses three figures (e.g. 511, 321, 111, ...) to indicate the frequency with which an area is cleaned during a certain period (e.g. weekdays). The second figure indicates how often the floor is cleaned thoroughly, and the third figure indicates the thorough cleaning of the inventory.
Service profile: The concept of a service profile summarizes the cleaning method for one or more areas. The service profile links frequency profiles to area components to carry out cleaning. Cleaning the area components is carried out according to a specific frequency profile in the service profile, possibly in accordance to hygiene requirements. Service and quality profile here are logically connected.
Quality profile: a quality profile sets out the tolerance values of the number of errors per area component within the selected AQL value. These tolerance values are indicated per component for attached (grp 1) and not attached dirt (grp 2). The Cleaning System provides default AQL values of 2.5%; 4%; 6.5% and 10% and the samples are integrated in the ‘quality control’ module. The user decides the tolerance values per quality profile. The sampling method for the AQL values is default according to the ISO2859 in this software.
Task: description of a cleaning task per object.
Method: is the way a task is being carried out and that is characterized by another operating efficiency or key figure (number of m² per hour of time per piece). A floor can for instance be cleaned manually or mechanically. The efficiency return between both methods is managed in ‘Method’ and then linked to the area component as to be carried out following a certain frequency.
The method is mainly linked to floor maintenance tasks. For components such as inventory and walls, the task is usually laid down without different methods.
Work type: tasks belong to a specific group or work type, because they differ from each other due to their nature. The main work types in The Cleaning System are: cleaning, technical work, mechanical cleaning, and ‘other work ‘.

Introduction
4
2. Presentation of The Cleaning System
The Cleaning System is the ultimate software solution for complete management of the cleaning of large buildings such as schools, health care facilities, office complexes, shopping centres, etc. The software provides a solution for recording, measuring, calculating, and planning of all cleaning and maintenance activities. Besides, it allows to easily carry out a correct cost calculation and quality check.
The Cleaning System offers unique opportunities to carry out very detailed and orderly calculations of tasks, to make work organization transparent, and to do a permanent quality control on the basis of the results. The quality control is based on the European quality standards, as defined in the INSTA800 standards (part of the ISO EN 13549 standard) to follow hygiene in detail.
The transparency of the calculation results and the clarity of the tasks according to the area types allow to respond quickly to changing circumstances. Along with a number of other advanced features, including a built-in report generator, the system offers unlimited possibilities for planning cleaning and service tasks.
The Cleaning System is available in two versions for a single user:
• The ‘Light’ version is aimed at smaller environments, such as schools, small health care facilities, start-up cleaning companies;
• The ‘Standard’ version is intended for an unlimited number of spaces, suitable for a single user;
• And in a version for multiple users simultaneously:
• The ‘Professional’ version with database setting for multiple users simultaneously can be used to manage an unlimited number of buildings.
The quality control module is based on the common Scandinavian standard for quality control, INSTA 800, which is part of the European standard.
With more than 15 years of experience and thanks to the feedback from more than 1,000 organizations in 7 countries, The Cleaning System has become the primary tool for modern maintenance planners in both private and public cleansing management. The Cleaning System is used in all Scandinavian countries, the United States, Great Britain, Brazil and Belgium, by cities and municipalities, health care facilities, office administrators and cleaning companies.

Introduction
5
3. Structure and operation
The Cleaning System Version 4 is a PC-based (Windows) system for the calculation, registration, measurement, distribution, and control of service or work, such as cleaning, window cleaning, maintenance of the outdoor space and extra services regarding to cleaning services.
The software system uses a basic set of objects, working methods, specific key figures and frequencies. These sets are divided into uniform sets for floor cleaning, area inventory cleaning, and cleaning of walls and ceilings, all with freely adjustable service tasks. Users can create their own task list per area and include it in the division of tasks.
The basic sets can be adjusted according to the building requirements, so that specific cleaning demands in terms of methods and frequencies are integrated. The Cleaning System offers a solution for various cleaning needs in e.g. buildings of health care facilities for long or short stay, administrative buildings or schools, etc. Tailor-made task packages allow the implementation of different kind of working methods and take into account the importance of hygiene within the buildings.
The task sets are put together in default sets, supplemented by tasks for floors, inventory, walls, ceilings, window cleaning and outdoor tasks. The default set is assigned to a particular building or a specific customer, so that the same tasks and key figures are used within each client file. The user copies the desired default sets at the beginning of a building survey.
Standard sets are usually based on a list of ‘area’ types to which tasks and operations for area components (floors, inventory, walls, ceiling, glass, outdoor-tasks) are connected. This allows to make an area type set of all relevant area types and associated tasks for cleaning an hospital. Other task packages can be made for other building types with other area types. Another area type set contains relevant models for administrative buildings and a third set can contain the models (and objects) for cleaning of schools and institutions.
For any kind of building or every sort of client, a specific default set can be developed, including the methods and elements for a full and correct solution of their cleaning needs.
The Cleaning System always uses ‘client level’ as the highest level in managing its client files. Customers can be grouped in customer groups and folders that may contain multiple buildings. The user has the flexibility to make his own transparent tree with customers, folders, buildings, floors, and spaces. This tree structure can contain up to 15 levels, which are:
• Country
• Region
• Subdivision
• Customer groups
• Customer
• Customer – subdivision
• Building group
• Building
• Building part
• Floor group
• Floor
• Floor-part
• Area group
• Area
• Area parts

Introduction
6
The user of The Cleaning System choose the levels. He can directly while entering the areas of a building add the floors and tasks by skipping the levels ‘customer group’ or ‘building group’. (See illustration).
At every registration, e.g. an area measurement, the area identification (area number) is indicated. In addition, the appropriate area type for the area is taken from the ‘area type set’. (See illustration). Depending on the area type set settings, the relevant key figures (for all area components) are used for the calculation of the working times to clean the area. Extra parameters may affect the calculation of the working time.
These parameters are e.g.
• Service profile
• Program code
• Frequency profile
• Quality profile
• Degree of pollution
• Furnishing level
• Number of jobs, beds, tables etc.
• Extra inventory elements or tasks

Introduction
7
4. Area type sets
The Cleaning System allows to set a list of area types. Area types can be ‘default‘ areas or be set by the user according to calculations and the work organization.
These area types are linked to task sets, in which tasks and operations are defined. The tasks and operations of the task sets (area components) are defined by the user and can set far-reaching details for cleaning tasks.
The Cleaning System works with seven different task sets:
Floor types,
Inventory elements,
Walls and wall elements,
Ceilings and ceiling elements,
Window cleaning,
Additional services,
Outdoor elements
Each task set contains following files:
Tasks or elements,
Methods,
Frequency profiles,
Frequency tables,
Working times.
Tasks or elements form the description, the types (e.g. floors, walls, ceilings), the inventory elements, or certain service commands (e.g. distribution of food, taking photocopies, duration, etc.) that are essential for the task content and therefore the time calculation;
For each of these elements a standard working time is specified to carry out the described task. The tasks are integrated in the work packages and the calculation.

Introduction
8
Work type: every task can be grouped into one work type. Work types are later used to draw up a work plan, so that the tasks can be grouped at the time of implementation.
Illustration: choice of work type for tasks and choice of work type for developing work plans.

Introduction
9
Methods describes the working methods applied within a set to the corresponding element. In some cases there are no multiple methods per element, while in other cases there are multiple methods with which the task is carried out. For each combination, another working time is fixed.
Some tasks can be performed with other methods and ‘alternative‘ methods are also included in this list.
It is also possible to create an operation list directly in the list of the elements if there are no multiple methods to clean the object,, e.g. inventory elements that are cleaned, replaced or supplemented in a single manner.
Multiple methods are linked to the tasks, but the user can also choose to just describe the task one single time without linking it to a method, e.g. emptying rubbish bins and replacing rubbish bags.
Frequency profiles are used to show tasks in a separate implementation profile. So different frequency profiles can be set; each one refers to another cleaning level. The frequencies allow to make different combinations of the desired tasks for the elements in the area.
Frequency profile 1 can be set as a ‘Light’ program in which the elements are cleaned at a low frequency;
Frequency profile 2 can be set as a ‘default’ program in which certain elements are cleaned daily;
Frequency profile 3 can be set as a ‘thorough’ program in which all elements are cleaned daily, etc.
All frequency profiles can be created in accordance with individual requirements and allow to respond to the wishes and requirements of the organization.
Frequencies indicate how often a task is being carried out.

Introduction
10
Frequencies are defined by a number of times per year (e.g. 52) or as a symbol that reflects how often a task is carried out (e.g., d = daily, w = weekly, m = monthly, etc.). Moreover, it is possible to set combinations that show whether the task is part of the light or the thorough work program (g = thoroughly and l = light). These codes are part of the work assignment.
The cleaning frequencies can be bundled in frequency profiles that can be different in different periods (the user can create three different periods).
For each frequency, operations can also be set as extra-service; if an operation is to be carried out several times per day, e.g. cleaning sanitary facilities or the entrance hall.
How these frequencies, frequency profiles and periods are defined is explained in the respective chapter.
Working times show how long it takes to carry out tasks. These times form the key figures of the efficiency of each task or the efficiency of the performance of an assignment. The Cleaning System allows to measure each operation in terms of a key figure expressed in centiminutes (1 minute = 100 parts), seconds, minutes or m²/hour.
The cleaner performs the operation or assignment within a working time that depends on the surface or the number of elements. The length of time is directly proportional to the surface or the number of pieces. If there are different methods to perform the task, an alternative time can be set by combining ‘element’ and ‘method’. In that way, one can compare the length of operations or one can use other efficiency values if another method is chosen. E.g. scrubber drier versus manual scrubbing and mopping.
The user can create up to five different times per set. in The Cleaning System. Performing a task normally happens only once according to one chosen method.

Introduction
11
5. Key figures
Key figures are the ratios that show the working time of the method or of the execution of a specific task. Each task set contains for all tasks and/or cleaning methods key figures, which form the basis of the cleaning calculation. The Cleaning System does not impose any key figures, but allows the user to use own key figures for all the sets.
All the necessary information for the maintenance of buildings is bundled in seven task sets. The task sets are grouped under a ‘default area type set’ and The Cleaning System allows, if desired, to put together multiple default area type sets.
The default area type set contains all typical areas the user manages and to which the task sets are connected. These sets form the template on which the further cleaning organization is set up: inventory of the building, drafting of measuring conditions; areas and their surfaces, establishing tasks for the area components (floor, inventory, wall, ceiling, glass, specific tasks and outdoor tasks). Each task can be linked to labour efficiency, indicated by a key figure.


13
The Cleaning System
Installation


15
Installation
1. Software installation
The Cleaning System can be installed on all PC’s with following minimum requirements:
Microsoft Windows XP, Windows 7 with at least a 1,5 GHZ processor;
200 Mb available disk space, a serial port (if a Digitizer is used) and
Wi-Fi connection for sending and receiving quality control forms that are processed with an Android device.
Users of the ‘Professional version’ must connect the PC’s to the internal network, whereby the database(s) are put onto the server to give others users access to the database(s).
The Cleaning System uses the ‘single user’ version of Paradox on the PC or the ‘multi-user’ version of Paradox for the software’s ‘multi-user’ version. The management of the user accounts is done by the administrator (main user) of The Cleaning System.
The Cleaning System is delivered digitally over the Internet.
Installation of the software
While installing The Cleaning System software, folders and programs are stored onto two different places on your computer. The first series of programs and folders comes under program Files (x 86), the second comes under Users\PublicDKH DBs.
First: The main software is installed on your computer’s C:-drive under the folder:
C: program Files (x86) \ Aps Data-know-how \ DKH4.
A folder DKH4 is installed in program Files (x86) with as default four subfolders, the main programs (an .exe) of The Cleaning System and the necessary .dll application extensions. The main programs of The Cleaning System that are placed in the folder DKH4 are:
DKH: work program of The Cleaning System
RsDBRepair: support program for repair and re-indexation of the two databases that are used by The Cleaning System.
RSPolicyEditor: support software which sets the location of the customer database and the system settings.

Introduction
16
Important
The files in this folder are not to be removed, as this may cause errors in running the software.
The user preferably places a shortcut on the desktop of the DKH and RsDBRepair software.
Subfolders of Aps Data-know-how\DKH4
The subfolder DKH4 contains following subfolders:
User Templates: a language file is installed for all available or planned languages. This contains a number of .csi files (cleaning system import) destined for the import functions of The Cleaning System. These files contain the default settings for fonts, colour codes, area text layout and section layout.
Symbols: icons and symbols used in The Cleaning System;
Docs: pdf-files with available manuals. This folder also contains the .pdf with the Dutch software manual.
Secondly: the second part of the software occurs on your computer’s C:-drive under the folder:
C: Users\Public\DKH DBs
The folder DKH DBs is installed in Users\Public that contains by default two subfolders. These two folders are on the C:-drive at a stand-alone (single user) installation and must be replaced to the same location on a network drive for multi-user installation.
[System Settings]: contains files with access rights of the user in a stand-alone version or of multiple users who can use the database simultaneously in a multi-user installation. The files in this folder may not be overwritten by users.
Demo-DB xx: contains demo files supplied with the software.
17
Installation of databases
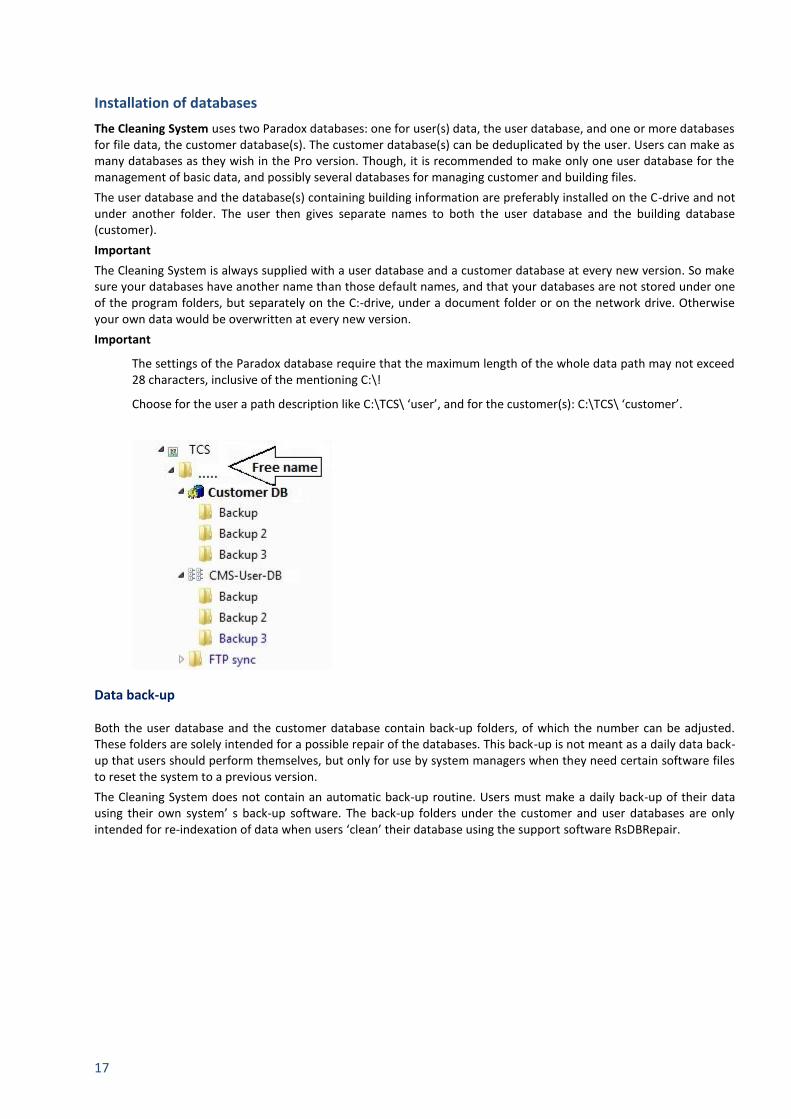
The Cleaning System uses two Paradox databases: one for user(s) data, the user database, and one or more databases for file data, the customer database(s). The customer database(s) can be deduplicated by the user. Users can make as many databases as they wish in the Pro version. Though, it is recommended to make only one user database for the management of basic data, and possibly several databases for managing customer and building files.
The user database and the database(s) containing building information are preferably installed on the C-drive and not under another folder. The user then gives separate names to both the user database and the building database (customer).
Important
The Cleaning System is always supplied with a user database and a customer database at every new version. So make sure your databases have another name than those default names, and that your databases are not stored under one of the program folders, but separately on the C:-drive, under a document folder or on the network drive. Otherwise your own data would be overwritten at every new version.
Important
The settings of the Paradox database require that the maximum length of the whole data path may not exceed 28 characters, inclusive of the mentioning C:\!
Choose for the user a path description like C:\TCS\ ‘user’, and for the customer(s): C:\TCS\ ‘customer’.
Data back-up
Both the user database and the customer database contain back-up folders, of which the number can be adjusted. These folders are solely intended for a possible repair of the databases. This back-up is not meant as a daily data back-up that users should perform themselves, but only for use by system managers when they need certain software files to reset the system to a previous version.
The Cleaning System does not contain an automatic back-up routine. Users must make a daily back-up of their data using their own system’ s back-up software. The back-up folders under the customer and user databases are only intended for re-indexation of data when users ‘clean’ their database using the support software RsDBRepair.

Introduction
18
2. Technical information – network environment
If a workstation is connected to a network, a network card of at least 100 Mbit is to be used and sufficient bandwidth must be available to make the 30 to 40 items per area from the various tables quickly available.
Once all the data of building and areas are read, only the adjustments are sent over the network and the load will be low.
Waiting time can also occur when launching the software if the bandwidth is insufficient or overloaded. Other network loads can occur while transferring or copying a file to a new building, when creating customers who are not yet in the program memory or when recalculating customer files and generating reports.
The software can be installed on any workstation in the network (one user license per installation) or on every assigned network drive.
When installing the program, the software’s version is also stored in the workstation registry:
HKEY_LOCAL_MACHINE\SOFTWARE\Aps Data know-how.
To run the software installation on the logged-on workstation, you must have administrator rights. All other software information is stored in the registry:
HKEY_CURRENT_USER\Software\Aps Data-know-how
(Does not require administrator rights)
Along with the software comes the installation of the Borland Database Engine, which provides the connections of the program with the accompanying Paradox database in one or more user version(s). The Borland Database Engine settings are managed in the BDE Administrator, which is placed under the folder program Files \ Common files \ Borland Share \ BDE.
It is possible to change certain network settings in the program via the menu ‘System’ and the menu-elements ‘System information’ under the tab ‘BDE info’.
The Cleaning System uses two Paradox databases: one for software data and one for file data.
The network installation of The Cleaning System requires that BDE is installed on all workstations that need access to the common databases. The network folder (net Dir) must refer to the same network path or the same drive.
For example \ \ SERVER \ USER FILES \ PARADOX-NETDIR or F: \. PARADOX-NETDIR)
The network folder can be changed by the program submenu-item System, System Information, BDE Info or via BDE Administrator under Configuration drivers, Native, PARADOX.
For optimal network speed following values can be entered in the BDE:
Local share True MAXFILEHANDLES 100
MAXBUFSIZE 16384 MINBUFSIZE 128
These settings can be changed via the BDE Administrator (Configuration, System, INIT) as mentioned earlier.

19
3. Databases
After installation, The Cleaning System has two Paradox databases. One user database and one customer database. In the software’s multi-user version, multiple databases can be made and up to five users can be connected simultaneously.
In the illustration, the database is located directly under the root and the description was kept as short as possible.
After the installation, administrators of The Cleaning System can manage both the system path and the reference to the location of the databases as they please.
System ad
Illustration of the RSPolicyEditor screen

Introduction
20
4. Installation for multiple simultaneous users
If you have the ‘Professional version’ license of The Cleaning System, the software can process data information with multiple users simultaneously. The multi-user system allows for more users at multiple work stations to work simultaneously at the same data over your internal network. The ‘user database’ manages the users and the ‘customer database’ manages the files. An unlimited number of files or customer databases can be made.
The ‘user database’ manages users in such a way that within a network environment a user can work on any workstation (on which the program was installed) with The Cleaning System. The license key is managed within the user database.
Therefore it is necessary to put the folder containing the database(s) on a network server. Transfer of the database(s) is done via Explorer, but requires that all connected users have read and write rights for the relevant network server-drive.
Before entering the password, each user must also specify the correct location of the database(s) in the login screen.
Login and password
The choice of the location of the file is specified under Administration.
This function opens the regular Explorer and allows to specify the correct location of the user database.
After specifying the correct user database, the password is entered and the user must then indicate the correct location of the desired customer database. Both databases can be placed at the same or at different locations, depending on your network administrator‘s wish.
The location of the customer database is entered as follows.
Go to the main menu File – Other/New customer database or type Ctrl + O
If the user choose another customer database than the current one, The Cleaning System will restart immediately and ask to enter the password again as to check user’s rights.

21
The Cleaning System
Main screen


Main screen
23
Main screen
1. Elements of the main screen
The Cleaning System is made up of several modules, each containing its own menu functions. The main menu gives the user access to the general functions of the software, as well as to certain features of the corresponding modules. Additional features are available and explained within the modules themselves. It is not possible to integrate all the modules‘ features into the menu, because it would make things confusing. Besides, some features are integrated in multiple parts of the main menu, for instance when they determine how the building plan is displayed or when they contain calculation parameters.
All functions are described in the relevant chapter. The chapters of the supplementary modules explain how the modules work.
The main screen of The Cleaning System has the following structure.
Main screen

Introduction
24
The screen of The Cleaning System contains the following components:
A. Main menu
Under the main menu is the ‘toolbar’.
The toolbar can optionally be switched on/off with or without text at the icons. Therefore, a ‘View’ function is available with the following menu.
Under the main menu, the work screen is divided into three main parts.
B. Main data in the tree structure
The left part contains the tree structure of all files, or customers with their respective buildings, floors, and areas.
If a building, a floor or an area is selected in this screen, the Main data toolbar indicates how many elements were selected.
Double-clicking the blue title bar will make it bigger or smaller, so the user does not need to drag the field wider to see all the titles and descriptions. This is particularly useful in the building plan module, where all the main data and the tree structure are visible at a glance. The wider sidebar with the main content shows the designated areas, and at the bottom all details of the area itself. The building plan with the chosen area is shown adjacently. (See illustration).

Main screen
25
Main screen The Cleaning System
By clicking on an area, either within the building plan or in the area list of the tree structure, the user can make all data visible on the area. These data can be modified at any time. Clicking on several areas will mark them collectively on the building plan. The number of areas that has been selected is shown next to the title of the ‘Main data’ sidebar. (See example above.)
In the tree structure, all areas are listed under a floor, the floors under the building, and the buildings under the customer. (See illustration tree structure).
In the customer file, an area can be identified via the set of codes of a building, of the floor and of the area itself (e.g. the door number).
All customer files with associated buildings, floors and areas are summarized in a table on the tree structure on the left toolbar of the program screen. This tree structure can be opened and closed per individual customer by double

Introduction
26
clicking on their name, or by clicking on the small squares with a plus (+) and a minus (-). In this way, users can navigate through their area registry (also called tree structure).
The user can open the tree by double-clicking the name of the customer, or by clicking the little icon with the ‘+ ‘to the left of the name of the customer.
The user can close the tree by double-clicking the name of the customer, or by clicking the little icon with the ‘- ‘to the left of the name of the customer.
The user can open multiple files or all customers at the same time. It is, however, more convenient to open just a few files, or only one floor at a time.
The data which are visible in the tree structure, can be set via the function ‘User options ‘. Go to ‘System’ - ‘User options ‘to open the setup screen.
Every time you click a customer name, a building, a floor or an area, the recorded data of the selection will be shown in the worksheet ‘Properties’. This screen contains all information on the chosen area, the building, the floor etc.

Main screen
27
C. Application work screen
The middle of the main screen contains the application work screen and all modules. This worksheet changes depending on the selected module. Above this worksheet are several tabs with the main functions of the relevant modules with, if necessary, tabs of the functions per module. The illustration shows different possibilities of this work screen.
Examples Work screen
A vertical menu bar of the work screen
The right part of the screen shows a toolbar with menu elements that relate to the specific functions of the module in which the user is working at that moment.

Introduction
28
For the ‘Work planning- Week planning ‘function and the ‘Quality control’ module, a separate screen will open that can be used as work screen. This second screen is complementary to the first work screen, but is only available for the functions of those particular modules. (See the relevant chapters).
Examples Work screen

Main screen
29
2. Main screen functions
The most important function in the main screen is creating a new customer with the associated building structure.
A. Creating a new customer
A customer is added to the customer database at the top of the Main data sidebar. To create a new customer click with the right mouse button on ‘Customer database’ and the following menu appears.
Illustration menu creating a new customer
Click on the _ (New) Plus_ customer and a screen will open up under the tab ‘Properties’. The customer main data are to be entered in this screen.
Click OK to confirm the new customer. When a new customer is created, The Cleaning System asks to connect the new customer to the desired area type set for areas and area components..
The user gets the following message on the screen:
Users can turn off this automatic notification by clicking the relevant blank choice box.
The user confirms the question to ‘Connect to the area type set by clicking Yes, after which the screen ‘Connections’ will open. (See below in New customer connection area type set).
The user can also postpone the connection by clicking No. In that case, a mark that the connection was not yet made will remain before the customer’s name.
The Cleaning System will then place a red exclamation mark before the name of the new customer in the Main data bar. (See image).
New customer
To complete customer data, the user clicks the tab ‘Properties’, whereby a number of underlying tabs appear. The most important customer data are set under the tab ‘Primary info’. The basic data are entered in this customer file.
Important: use a uniform numbering of customers and buildings. The customer index (ID/number) determines the sequence of a file within the tree structure, and will be used when data is entered through Excel.

Introduction
30
New customer file
Relating data can be placed in the five remaining tabs. Such as three different addresses and five contacts. When these data are filled out, the icon for the customer name or building designation will change. (See more on this in the icon list).
New customer connection basic sets
The customer can also later be linked to the desired ‘set’. This can be done in the menu function ‘Default’ (of the) customer. To activate, go to __System – Settings, Default – Default customer and choose the option Connections.

Main screen
31
The connection with the set of your choice is done in the ‘Connections’ screen. In this screen is indicated which area library is chosen, which calendar is used, how many work days and weekends influence the calculation how periods are laid down. The settings of the ‘Connections’ screen apply to this customer and allow to manage multiple parameters. More about this later.
Screen customer options - Connections
This screen contains the basic settings that later will be essential for all aspects of this customer’s cleaning management. The settings are: area library, calendar and designation of the three periods.
After the connection is set up, the user confirms by clicking OK. The further registration of customer data can be done in the other tabs. The customer entry is now finished and buildings, floors, and areas can be created.
B. Creating a new building or floor
Choose in the ‘Main data’ bar the relevant customer and click in the worksheet on the (new) ‘Plus building’ key, or in the building on (New) ‘Plus Floor’. Within the primary field opens a blank sheet, which can be filled out in the same way as creating a new customer.
The data of the new building are completed in the corresponding tabs.
The same method is used to create new floors and areas. If a building plan is being measured in the ‘Building plan’ module, it is better to create the correct number of areas at that time, without entering any area details. This will facilitate the operation during the survey of the building plan, because this module passes automatically on to the next area during the measurement. The area properties can be completed afterwards in the measurement sheet,

Introduction
32
under the ‘List’ tab, instead of entering them while measuring the areas or entering them separately at each time. (See attached example).
C. Creating an area
A new area is created by either clicking the right (New) ‘Plus area’ button or by clicking the right mouse button and then clicking the relevant feature on the menu. See illustrations
Button menu
Right mouse button functions
The sequence number that identifies the areas in the list can be assigned automatically. The ‘increase‘ with which a new area is identified in the number sequence can be set in the function System, User options, Automation. (See the related illustration).

Main screen
33
Automatic generation of door and room numbers

Introduction
34
D. Building, floor or area tabs
Primary information tab
When a new area is being created, the next window with corresponding features will open. This screen is under the ‘Primary information’ tab.
Area screen
ID: Use the ‘ID ‘-field as sequential number in the list of areas under the relevant floor.
Number: use the ‘Number’ -field as door number or area reference on the floor.
Area type: the field ‘ Area type’ gives a choice from the list of default area types, included in the standard set. Within the library, a default surface, inventory list with variable parameters, and a default work program were linked to these default area types. When performing a survey of a building, these default data will be overwritten for the file. The area library only contains default information.
Choose the appropriate area type from the drop-down list. This list follows the code numbers of the area types.
List area types as drop-down
The field ’Short name‘ offers the possibility to use a different name, which does not impact the work program connected to the area: e.g. the default area ’Office‘ can be designated as desk, workroom, office, …

Main screen
35
Next to the drop-down of area types is a button that gives access to the full list of data from all available area types.
List area types – full list
Floor type
The’Floor type’ field offers a selection of the default floor type list in the task sets. Each area type can have a default floor type which is adapted on inventorization. This also applies to the default service profile and the work program of the floors.
List floor types

Introduction
36
Furnishing level of the floor
F.L. or Furnishing level: in addition to the description of the floor type and the underlying cleaning method(s), the user can give a subjective value of furnishing level to the floor in the area. This function allows to adjust the furnishing level to a higher (above 5) or lower (under 5) rating. The calculation takes this adjustment into account according to the set values.
The default description for the furnishing level is set in the function:
System, System options, furnishing levels. The adjustment of the key figure for a specific area itself is part of the settings in the floor sets. (See illustration).
Setting furnishing level in floor sets
Surface (m²)
Next to the title Surface (m²) are different elements.
Net: displays the net cleaning surface;
Total: total surface of the area;
Work avg.: the average working time for this area;
Perimeter: show the outline of the area (results from the measurement of the area)
Height: when the user clicks the title ‘Perimeter ‘, this field changes into a field in which the height of the area can be entered.

Main screen
37
Service profile
Each area type is also linked to a standard hygiene level and a service profile. This service profile determines the default work program and the working frequency for this area. The work program can be adjusted in the ‘Service profile‘ tab. This drop-down is linked to the work programs.
Above the field ‘Service profile‘ is a selection button. This button gives the user direct access to the default work program for this area type. This work program can be adjusted directly.
Please note! When a work program is entered that does not meet the hygiene or service level of this area type, The Cleaning System will give a warning in the ‘Service profile‘ tab. Please then adjust the work program or service profile accordingly.
At the bottom of the primary information sheet, there are three zones with several additional information fields. By clicking the relevant titles or small buttons, another field will be displayed. E.g. by clicking on the field ‘Height‘, the field ‘Outline‘ will pop up; by clicking on ‘Working‘, the average working times will be shown;
The costing field allows to display costs and working times according to different methods of calculation. (See illustration).

Introduction
38
The primary information screen allows to directly enter additional task adjustments for this area. To do this, click the following function button at the right top of the screen:
This feature provides direct access to the tasks for a specific area. The task screen allows to adjust or complete tasks per area component.
Task sheet
Directly below this button is a brief overview that indicates how the calculation of working time occurs. The used methodology is marked in light blue.
‘Calculation‘: the calculation is based on the surface, the tasks and the different elements (filled out as parameters) for this area. Below is a link to the task screen.
‘Area based‘: the calculation is only based on the surface, the area type, and the key figure for this area. With below the procedure with key figure, or with available time entered per area. (The latter method is not recommended as a standard calculation method).
Secondary information tab
The first part of the calculation of cleaning hours is done by measuring the surface of the area, and then assigning the area to an area type to which default return data from the library is allocated. The working time is divided into three periods that were selected or created previously at the time of the period definition. Adding a number of pieces to the parameters list (9 free choices for inventory elements) allows to create variations in the standard area using variable objects that characterize this area. These elements have a direct impact on the calculation, because the elements are connected to specific tasks of which the working time is multiplied by the number of pieces of this inventory. If these are not present, no time can be calculated.

Main screen
39
Secondary information
Fine-tuning the inventory is done in the ‘Secondary information’ tab. This tab also allows adjustments to the calculation factors of the default area components: floor, inventory, wall, ceiling, window, other tasks, and outdoor tasks. This percentage (default 100%) can be manipulated on client level to the type of work and on separate area level per area component.
These parameters are also linked to the parameters of the furnishing level, service level and of the upper hygiene level for the relevant area type.
Parameters for area components on area level.
The ‘Secondary information’ tab allows to adjust the default inventory elements for this area type (from the list of area types). The inventory elements are set as parameters in the default area types, so they can be used as default by all similar area types. Within the task sheet, additional tasks are connected to these elements, where working time is affected by the quantities. In the secondary information sheet, only the number of inventory elements is adjusted. The inventory elements themselves are specified in the default file in the default list of area types.
Examples parameters in Secondary info file

Introduction
40
Possible deviations in task return can be entered by adjusting a parameter, expressed in percentages. Affecting the whole cleaning time by adjusting the return with specific percentages, can be done on client level. To do this, go to the menu System – Settings – Default, Default customer... and select the option Work speeds and Pers. % supp..
Parameters for area components on client level.

Main screen
41
Floor and methods tab
The ‘Floor and methods‘ tab can be used to adjust, if required, the floor type, but is mainly used to set working methods for ‘Default’, ‘Thorough’, ‘Extra service‘, ‘Periodical and annual‘ work.
The choice of method is done in the default list of the task set ’Floor’. The selected method is entered in this screen for all days of the week (weekdays, Saturdays and Sundays). Each method can also have an alternative.
Floors default method
Floors thorough method
The impact on the work calculation is again displayed directly at the bottom part of the screen. (Similar to the screens of the primary and secondary information).

Introduction
42
Service profile tab
Under this tab, the area’s service profile is displayed, as well as associated data, such as program code, quality profile, and frequency profiles. All these features are set individually. The objective and operation of service profiles is explained in the ‘Data’ chapter in service profiles.
The fields ‘Service profile‘, ‘Quality profile‘, and ‘Hygiene‘ offer drop-down lists, in which the software follows the used logic. The work codes indicate which work programs are followed during weekdays and on Saturdays and Sundays. These work codes are also linked to the chosen service profile for the relevant area.
After having selected the service and quality profile, the frequency profile for the area components inventory, wall, and ceiling are filled out automatically. As the floor frequency and the other components always result from the task sheet, there is no automatic filling here.
The field ‘Hygiene‘ results from the area type setting and uses the descriptions of INSTA800.
Please note! Make sure that when no work code is entered on the relevant days, the boxes always contain a ‘–‘and are not blank. The Cleaning System requires for the calculation a value within this field, and does recognize any blank field.
Work code fill out completely
Dep. (Department connection) tab
Each area can be part of one or more departments. An area can, for example, belong to an area group for quality control, but also to an administrative department and be under the control of another responsible. The user can link the area to 10 different departments. The (drop-down) list is set up in the area type set.
Comment – Addresses – Contact tab
The tabs ‘Comment‘, ‘Addresses‘ and ‘Contacts‘ are intended for entering additional relevant information to this area.
If a comment is made for a specific area, a symbol will appear before the area in the main bar, indicating that there is
a comment on this area in the comment tab. A red square = no comments , a note =comment.

Main screen
43
Details tab
The ‘Details‘ tab provides a detailed insight into all aspects of the survey, calculation data, working times and costing for this area. These data result from the previous steps and cannot be altered in this field.

Introduction
44
3. Symbols in the Main data sidebar
The left bar ’Main data’ contains a tree structure with customer groups, customers, buildings, floors, and areas. Each element of this tree structure has a symbol as to give the user a clear overview of the underlying data. These symbols are:.
Description of icons Description of icons
Customer database
Customer Building
Customer with multiple buildings Floor
Customer with DXF or JPG or symbols Floor contains a building plan in DXF or JPG format.
Recalculate the file Floor contains a building plan in DXF or
JPG format
The area’ s file contains comments.
Floor contains a building plan in DXF or JPG and the area contains symbols.
Customer data completed
Customer and contact data completed Area
Customer with calculation on which end calculation factors were applied
Area with building plan in DXF or JPG.
Customer and contact data completed and end calculation factors applied.
Area with building plan in DXF or JPG and the plan contains symbols.
The symbols can occur in multiple combinations, such as of
Icons in the sidebar can optionally be switched on or off by clicking on the relevant visualization in the menu ‘View‘. This setting is shown in the following illustration.
Visualization of icons in the Main data sidebar

File
45
File
The functions of the main menu depend on the installed modules. These functions are briefly explained in this chapter of the manual.
File menu
1. Choice of customer database
Other / New customer database: allows the user to create multiple customer databases as to spread files with relevant buildings over several databases. This is done at own discretion and allows to shield specific files from users. By clicking this function, a regular Explorer window will open, in which the administrator can indicate the desired database or create a new one.

File
46
2. Data and software location management
Explorer: The user manages here the locations of the program, the customers and the user databases. The procedure for installing The Cleaning System for multiple users is described in the chapter above ‘Software installation‘.
3. Import and export data
Importing and exporting default database files
Users of The Cleaning System can exchange data with other companies and convert information from other systems. The import function allows to import data and merge with existing data. Import start from this screen. The import is mainly based on importing files from other devices, files that were previously exported from The Cleaning System, or on importing data in a fixed format that were prepared in an Excel file.
To export data from a customer database, the user follows the next steps.
A. Specify the customer from where the export occurs;
The export feature for databases only works on ‘Client‘-level in the tree structure, and not in ‘Customer group’ or ‘Building’. The work screen must be on active in the ‘Settings‘.
The export feature with Excel works from multiple locations within the system. Every time the feature lights up, export is available.
B. Click on ‘Export‘… and the following screen will open:

File
47
C. Select the data you wish to export.
D. The file can be stored on a place of choice, and can only be imported by another user with the same version of The Cleaning System.
Following export data choices are available in this window:
Customer data
Customers, buildings, floors, areas with optional building plans
Data of departments, work plans, assigned personnel
End calculation data;
Inspection and cost related data;
Pattern: colour- and shading patterns the user has set (See Building Plan chapter)
Default data as: libraries, calendar and period profiles, work code definitions and instructions
E. The export is done in ‘.IMP‘-format. This file in a secure format is intended for the direct import to the database and cannot be altered by the user.
F. When these files have been exported, they can be imported to a specific customer file using the import function.
G. Always import to a customer file. To secure an existing file, the user can also create a temporary client file (see functions in main screen: create a new customer) and afterwards copy the area data between the files.
Illustrations import data
Step 1: Specify the customer file and go to the import Step 2: Click on the import function…

File
48
function in the menu <File>.
Step 3: Click the selection button at the right to select the desired file.
Step 4: Click the active button <Start>
When the import has been completed, the log file will show the amount of data imported and possible errors found. These errors are shown per line of import file (e.g. Excel, .csv file) to allow the user to make corrections.
Remark:
The export and import features do not perform any synchronization.
The menus sometimes refer to ‘.XCS‘ files. This format is not used in the current version 4, but allows users of previous versions to convert their files to the new version.
Synchronization [Yes/No] field: The import screen contains a feature ‘Synchronizing‘ available.
When using a multi-user version of The Cleaning System, users who work on the same customer database continuously have the same updated information available. When an important import is being carried out at one of the work stations, it is recommended to stop synchronization temporarily, because intensive calculation will increase import times significantly. Switch off this feature (default setting) during import and switch back on after the import is completed.
Status and log
This process line shows the import process and indicates any errors during import. (Important for imports from Excel files, then the error line will be indicated).
The import program also indicates whether certain data already exist and asks whether existing data may be overwritten or if a new identification must be created.
If the user overrides a basic set, all data will be replaced. Methods, costing, working times, frequency profiles, ... will then be replaced by the imported data. So consider very well if you want to replace existing or create new data. Doubles can always be removed.
Example: what if a customer already exists and the system asks to overwrite data?
It is preferred to add this data to a new customer number instead of overwriting the existing customer data. Then compare the two customers, and decide which one you want to keep. If you think that different underlying data (e.g. buildings or floors) can be useful, it is possible to transfer data from one customer to another via the usual copy/paste function.
Export to Excel …
The function ‘Export to Excel‘ opens in the next window a list of all the possible information fields that are available in The Cleaning System. By selecting the desired fields, fixing the field order in the export template using the two arrows,

File
49
and then saving the export template, the user can regularly carry out an export to an Excel sheet of his choice. This choice is done by the six numbers under the arrows, which allow the user to determine the field order.
On top of the window with all available information are following optional choices:
Line number: indicates the line number of each file.
Auto insert unique indexes: inserts automatically a unique index, as to keep the connection between buildings and areas.
Column header: places the column headers on the first line of the export file. In this way, the field has a name and the export order is determined.
Export Inactive Levels: determines whether inactive levels (buildings, floors, areas) also will be exported. When switched off, these levels will not be exported.
Export Excel, choice of fields and order
Fields: almost all fields of the customer database can be exported to Excel.

File
50
4. Report generator
The function ‘Report generator‘ opens this separate module. The Cleaning System provides several reports that can be adjusted within the report generator. An experienced computer scientist is quickly familiar with this report generator where direct access is provided to all data fields of The Cleaning System. It is also possible to draft separate reports to your own liking via SQL statements. The manual of the report generator is available over the Internet. (see also Delphi: ReportBuilder Developer ‘s Guide).
Available reports
5. Choice of database
This screen shows the user the last used databases, and allows to open directly other databases. This is useful if a design with multiple customer databases is chosen.
6. Exiting the software
The ‘Exit‘ (shutting down) function saves the modified data in the database(s), checks the calculations and rounding and makes sure (through a multi-user system) that the user is no longer logged on in the database. The Cleaning

File
51
System should therefore always be closed with this feature and not by shutting down the PC, because then the user will remain open – active in the database.
To log off a ‘logged on‘ user who is not active, The Cleaning System performs an automatic work procedure, ‘Remove Lazy Users‘, but this step can best be avoided by executing the normal shutdown procedure.
7. Back-up of database(s)
The Cleaning System always uses at least one user database and at least one customer database. The customer database contains all building and project data. Depending on which version is being used, the user disposes of one or more databases.
Both types of database can easily get backed up.
Step 1: Close the application completely;
Step 2: Find the two databases in Windows Explorer (UserDB and CustomerDB);
Step 3: Indicate the respective database, click with right mouse and make a copy;
Step 4: Go to the folder in Windows Explorer, where you want to place a backup;
Step 5: Paste the database in this folder, BUT never overwrite the older backup!
Step 6: enter a suitable name (e.g. database name_BUdate in format YYMMDD
Repeat these steps for the second database.
If you wish to put this backup back later, repeat steps 1 to 6.
8. Launching another database
A. Launching another user database
To open another user database, specify this user database BEFORE you enter the password.
Illustration opening another user database
Select the desired user database in Windows Explorer.

File
52
B. Launching another customer database
To open another customer database, select Other/New customer database in the main menu File.
Illustration opening another customer database
Select the desired customer database in Windows Explorer.
Other customer databases that are already opened will also be available under the menu File. See example.

Edit
53
Edit
Edit menu
The Edit menu only offers features related to the layout or adjustment of fields, such as adding floors and areas; cutting, copying, pasting, and removing fields; making or reversing selections or retrieving certain information in a column.
The function ‘List settings‘ refers to how the layout of building information is displayed in ‘List’ tab. Most of these functions are also available in the worksheet of the relevant module of in the software’s functions.

Image
54
Image
Image menu
The Image menu contains features, allowing the user to switch on and off general visual information. It contains format and time unit settings. There are also a number of functions that can be used to draw up part of the building plan, zooming in and zooming out features, support for lines and rulers. Drawing or building plan features are of course only available if the building plan module is activated.
1. Toolbar settings function
The first part of the menu contains the settings of the toolbar. It can be switched on or off, with or without text indications and from the status bar at the bottom of the screen.
The Digitizer‘s menu element can be used for the settings of a Digitizer tablet. It allows for building plans to be drawn or measured manually. This is important when building plans on paper are to be measured or copied in detail. The Digitizer communication settings are also integrated in the ‘System’ menu, where more standard types of Digitizers are available.

Image
55
2. Zooming function
When the user is working in the building plan module, this feature allows to zoom in on or zoom out off the drawing(s) and measurement(s). The scroll on the mouse works similarly for zooming. See for other similar features in the building plan menu.
3. Visible layers function
The visible layers feature allows the user to determine whether the file for the customer, the whole building, or only the floor or area is visualized on the building plan worksheet.
4. View grid and guidelines function
These two functions for the building plan module allow to switch on or off the worksheet‘s two types of guidelines.
The grid helps with the placement of the building plan in the general overview of the worksheet. This position is important for the work planning when the user should overlook multiple floors.
The guidelines help the user during the survey of the areas. The building scheme module places both horizontal and vertical drop lines at each measuring point and provides in this way a visual clear result of the survey. (See illustration). This support is also available in the menu of the building plan module.

Image
56
5. View DXF function
The Cleaning System works with AutoCAD-files in DXF-format and with images (JPG). The building plans in DXF work closely with features in the building plan module and can be switched on or off via this feature. See below in the Building plan chapter.
6. Adjusting time format function
The Cleaning System uses different time format models. Users can set here the time unit they usually work with, either CMin. (especially for users who used to do their calculations in Excel), hours, minutes, and seconds, with minutes or directly in FTEs. The user can visualize the selected format at various locations in The Cleaning System by clicking on the button ‘Time format‘ that is in most screens with time data next to the title.
Cmin. : Centiminutes – a minute is expressed in hundredths, e.g. 250 CMin equals 2.5 minutes. This is the smallest calculation unit. The result of 21,000 Cmin equals 3.5 hours or 03: 30:00 (h:m:s).
7. Time/cost as … function
The Cleaning System calculates the working time of areas, customers, etc. on the basis of a common denominator, namely the daily average.
In this way, it is possible to summarize a different number of cleaning days. The used frequency of the cleaning program calculates the average daily working time on the basis of the length of the period and the number of cleaning days.
Example: if the period length is 5 days and the area work program ‘511‘, meaning 5 working days, then the working time (the average daily time) is calculated on this period. This means the time available for the cleaning work according to the task list. But when for this area a work program of ‘211‘was chosen over the same time period of 5 days, the working time will be adjusted to the lower frequency over the same duration. The working time is divided over the 5 day-period and is displayed as follows.

Image
57
The calculation starts with the daily working time, multiplies it with the days in the period (5 days) and divides the total time (the period of 5 days) by the two cleaning days of the program ‘211‘.
This calculation allows to calculate both costing and the working times based on the set period, per week, per 2 weeks, etc. up to one year.
The user has access to this data in all screens that display the calculated working time and costs. This menu indicates which time/cost calculation is first shown by default. In these windows, the user can directly switch to another f calculation method, but the set method will always be the ‘default’ value.
8. Icons function
To visualize the work schedule, The Cleaning System offers an extensive library of symbols and icons that are placed in the drawing. The user can choose to switch them on or off, but also place them on a separate layer of the drawing.
More about symbols and icons in the ‘Building plan’ chapter.


Data
59
Data
Data menu
The Data menu contains all elements, features and models to perform the calculation method and the work schedule. The menu gives access to these functions to manage all details of areas, tasks, frequencies and modalities for the implementation of the cleaning.
The main functions are focused on creating the area libraries, task lists and the area types. The functions directly related to the area types (default areas) are the quality and service profiles. The other menu options give direct access to functions of The Cleaning System, which are also accessible through tabs in other places. The menu functions on this site provide direct access.
The options are explained in detail below.

Data
60
1. Area libraries
The Cleaning System allows settings for several area libraries and separate work programs for floor, inventory, wall, ceiling, window cleaning, other tasks and outdoor tasks. The user chooses here which area library to use in the (customer) file.
This window has following menu elements available.
Create a new basic set by clicking on this element or by clicking (New) Plus in the ‘File‘ menu.
Creating an area library allows to make settings for private standards, building types and work schedules that apply to certain customer files. This contains the full properties of a file.
Customize the title of the current basic set by clicking on this element or by clicking Edit in the ‘Function‘ menu.
By clicking on Edit in the menu, the user can copy, paste or remove the selected basic set. When copying or pasting, the system will ask to enter a separate ID or code for the new set. Choose a distinct code with a clear description.
Clicking this element will (definitely) remove the selected basic set.
Connection task sets with area library
To make a connection between the area library and the corresponding tasks/methods for area components, the user clicks the menu function ‘Area libraries‘. A window with available area libraries will open.
By double-clicking the desired library, a screen will open in which the basic objects for the area components can be set. This choice can be different for each customer file.
The same screen allows to choose the desired calendar with corresponding settings for periods. Calendars are created under the menu function ‘Calendar definition‘.

Data
61
Connection task sets with area library
Remark: It is possible to use one task set and to link it to several area libraries, making The Cleaning System very flexible and easy to maintain. The user does not have to keep separate task sets. Conversely, a basic set can be derived from another, be adjusted in the area components or just form an alternative calculation method: instead of taking into account all the components, one can make a calculation based on the area’s floor surface. This simple method, though, interferes with a proper work planning.
2. Task sets
The menu function ‘Task sets ‘gives access to an overview screen with the area components floor, inventory, walls, ceilings, other tasks, glass and outdoor tasks. The various task lists laid out by the user can be linked to these area components. When a task set is selected, it will be connected with the relevant components.

Data
62
Choice of task lists
In this screen the user can link the task sets for the various area components. Several task sets can be available over the different files, and they are linked to the relevant file via this screen.
The user can also export a task set as to import it afterwards in another file. This feature is under the ‘File ‘menu.
Menu File of task sets
Click on the ‘Export ‘function and the export screen opens up. This export occurs in database format and is immediately ready to be imported in another file. In the export screen is chosen whether tasks, and/or methods and/or frequency profiles are exported.
Screen Exporting task sets
Importing these sets (and other) does not take place via this menu, but under the main menu of File _ Import.

Data
63
Menu tasks, methods, frequency profiles, …
The buttons in this menu take the user directly to the screen of tasks, methods, frequency profiles, ... for the different area components. This menu function is an alternative for clicking in the steps.. Data.. – ..Area types.. – ..Task sets tab..
Area components and tabs
Tasks
The user makes a task set for the area components: floor, inventory, walls, ceilings, glass, other tasks and outdoor tasks. This task set contains a list of elements, such as used floor types, the usual inventory, etc.
Alternative working methods, e.g. for cleaning floors: sweeping or mechanic scrubbing, are (optionally) listed under the ‘Methods‘ tab. Each method can have its own key figures and in the frequency tables they can be linked to different frequencies.
Next, the chosen working method is linked under the ‘Tasks‘ tab. This screen consists of two parts, the upper part contains the tasks, the lower part allows to assign one or more methods per element.

Data
64
Task screen
Method
Methods that are available for a specific area component are stored under the ‘Method’ tab. After having created the tasks, the user can set the methods with which the tasks will be carried out. Each method describes a different method with which the selected object can be cleaned.
For example: a floor object can be cleaned using different methods: sweeping or mechanic scrub-cleaning. An inventory object can be cleaned by sweeping or dusting. By clicking one of the methods, details will be saved and the method can be linked to the object. Certain tasks can only be performed in one way and have no different methods, such as replacing a garbage bag or filling a vending machine.
A list of possible methods is created under the ‘Method’ tab. When a method is linked to a task, the return and relevant data regarding the impact of a method to a certain task are filled out. The relation task-method contains the calculation data.
Each method has an ID and a name. Methods can be adjusted by clicking on ‘Edit‘, or double-clicking the method. New methods are added via (New) _Plus_.
Method screen

Data
65
New method file
A new method for cleaning an area component always contains the following information:
ID: this identification code is used on all task screens and should be unique but also distinct. Once this code has been created, it cannot be changed.
Name: is the description of the method
Note: is a free text field to e.g. specify the machine type.
After the various methods are linked to the floor types, the user can set default methods to clean the floor per period. Double-click on the floor. The floor type screen pops up and when completing the fields for Normal, Thorough, Extra service, Periodical and Spring-cleaning, The Cleaning System will propose these methods as default. These methods can always be adapted to the specific requirements of one method. This feature is explained later.
Relation task-method
Screen task-method file
When a method is linked to a task, the method screen always consists of following elements:
Task: this is the task description for the area component;
Method: indicates the connection to the relevant method;
Default indication: this shows whether this is the default method for the relevant area component.
Time 1 – 5: the working times (in five different possibilities) to carry out the working method for this task. When the cursor is in the working time box, the ‘furnishing level’ button will light up and a variant of the time can be entered, as to respond to the furnishing level in the area. Then click on ‘Furnishing level’.

Data
66
Screen furnishing level parameter
If the floor is less furnished, cleaning can be carried out faster. If the area is more furnished, working time will increase. In the furnishing level table, the user can enter which degree of increase and/or reduction applies. The user can choose his own settings as to the impact of furnishing level on the calculation. The description of the different steps in the furnishing level is entered in the menu System _ System options _ Settings – Furnishing level.

Data
67
Method for drafting task sets
To create an element in the task set, the user first clicks on (New) _Plus_. Then the next sheet will open.
New task set for e.g. floor
This screen is the same for all elements. It contains the following information fields:
ID: all ID codes in The Cleaning System are always unique codes for their domain and cannot be changed after entering. Try always to use short codes within their domain of application.
Name: the description of the task set is done with the name and can always be modified. The name should clearly describe what the task set is used for, and what makes it different from other task sets for the relevant area component.
Unit type – text description: The unit indicates the method of calculation. This can be per m², running meter, and piece.
Working times 1 – 5: optional indication of separate working times
Furnishing level (for floors): same as mentioned above;
Cost: the normal calculated cost of the implementation.
Work type: to which group of tasks this specific task belongs: these are ‘Cleaning‘, ‘Machine‘ and ‘Technical‘. This can be taken into account in the work assignment.
Methods: The working methods for the area component Floor are entered (the drop-down of methods) for three different types of work: firstly, the default method and its alternative, secondly the work method of the thorough procedure with its alternative, and thirdly the method.
For the three different intensities of work method, there are always two possible methods:
For two periodical works, two possible methods:
For the annual cleaning (spring cleaning), two working methods:
Note: note field for explanations and/or comments.
The task screen for the new inventory task has following default fields available: ID, Name, Unit Type, Working time (1 to 5), Fixed costs, Work type and Note field available.

Data
68
Type: the Type field with selection button allows to set a standard task, containing a number of other tasks, which are connected and have various numbers. This feature allows specific tasks, such as e.g. disinfection of a room, to contain a series of existing tasks and allows ‘task grouping‘ to schedule a separate implementation for this work.
‘Physical characteristics‘: this indicates whether the task should be connected to the area surface and whether working times for the floor decreases. This function is for instance used to deduct shelf space, refrigerators, etc. in a supermarket from the floor cleaning surface.
New inventory task
The screens for new tasks for ceiling and glass components, and for additional or outdoor tasks, do not contain specific fields. Grouping is also available for this kind of tasks via the Type option.

Data
69
Screens tasks, ceiling, glass, wall, window, outdoor tasks.

Data
70
Tasks linked to methods
The link between task and method is done in the Task screen. Click on a specific job, and it will light up (in blue). (See illustration).
Connection method and tasks
The Method screen possibly already contains a list of set methods. Then click ‘(New) Plus‘ and the following screen opens up in which the possible method and corresponding working time can be entered.

Data
71
Detail connection task with method – return and work type
When a task is linked to the method, the user can also specify whether the chosen method is the default method for the corresponding task, e.g. floor; then the identification color for the method will change from blue to green (See illustration). The completed work time is specified in centiminutes, seconds, minutes, or hours.
Only a task or method associated with a floor component can be entered in m² per hour. The software always calculates the conversion between these different parameters into centiminutes.
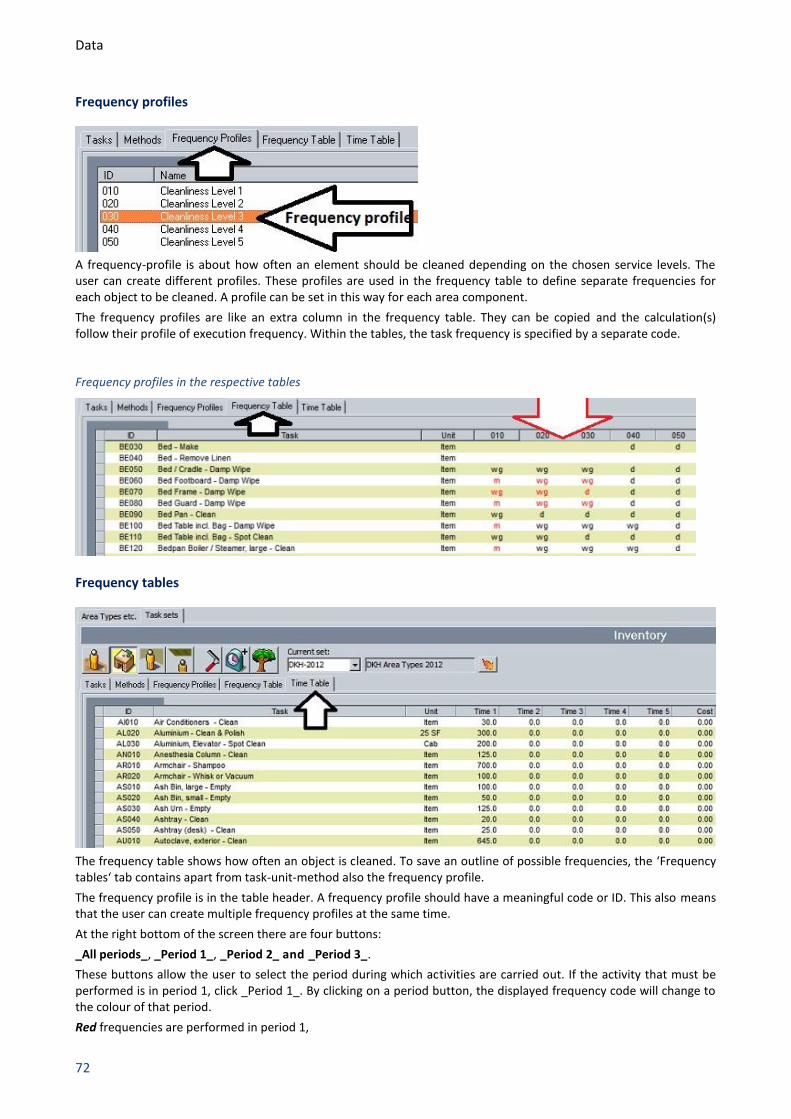
Data
72
Frequency profiles
A frequency-profile is about how often an element should be cleaned depending on the chosen service levels. The user can create different profiles. These profiles are used in the frequency table to define separate frequencies for each object to be cleaned. A profile can be set in this way for each area component.
The frequency profiles are like an extra column in the frequency table. They can be copied and the calculation(s) follow their profile of execution frequency. Within the tables, the task frequency is specified by a separate code.
Frequency profiles in the respective tables
Frequency tables
The frequency table shows how often an object is cleaned. To save an outline of possible frequencies, the ‘Frequency tables‘ tab contains apart from task-unit-method also the frequency profile.
The frequency profile is in the table header. A frequency profile should have a meaningful code or ID. This also means that the user can create multiple frequency profiles at the same time.
At the right bottom of the screen there are four buttons:
_All periods_, _Period 1_, _Period 2_ and _Period 3_.
These buttons allow the user to select the period during which activities are carried out. If the activity that must be performed is in period 1, click _Period 1_. By clicking on a period button, the displayed frequency code will change to the colour of that period.
Red frequencies are performed in period 1,

Data
73
Green in period 2 and
Blue in period 3
The meaning of a period (1, 2 and 3) is entered in the System menu. In this example, period 1 are weekdays, period 2 Saturdays, and period 3 Sundays and public holidays. The setting of the period is done under the menu Period definition(s).
The user can change an existing execution frequency by double-clicking on the line of the corresponding task in the field of the implementing frequency. The codes of the execution frequencies were entered in the menu: _System_, _User options F9_, Frequency Symbols_
Menu choice of symbols
Frequency symbols for the execution of tasks
This menu contains the different codes the user can create to set the execution codes.
See following screen illustration for the code definition.
Frequency symbols
Frequency codes have been entered as an example. The execution frequencies are divided into three main domains for which a code is set. The main domains can be described as:
Execution codes: this specifies the frequency with which work is planned, such as regular, daily, weekly, monthly and annual work.
Codes combined with the first code to indicate whether the work will be specified as light, thorough or extra service in the frequency table.
Codes for specific low-frequent jobs. The user can assign here tasks to periodical (two groups) or trim work (spring-cleaning).

Data
74
Following codes were entered as an example:
Frequency type work division
Code Frequency type work division Code Frequency supplement Code
Periodical p Periodical cleaning (1) a Thorough cleaning g
Daily d Periodical cleaning (2) b Light cleaning l
Weekly w Spring Cleaning s Extra service (2nd
time) x
Each 14th day f
Monthly m
Annually j
The figure before the execution frequencies increases the execution frequency; a figure behind the code of the execution frequency lowers this execution. The figure can indicate how many times the work is carried out with this code during the same working day or with different interval.
Example:
2d means that an activity is carried out twice a day.
d2 indicates that the activity is performed every other day.
The frequencies can also be combined. The combination of the frequency indications d and x, for example, specifies that the execution occurs daily and is complemented by a, ‘extra-service‘.
To schedule the execution of tasks several times a day (up to 8 performances per day), the user can use the function ‘Trim‘ to set frequencies. This option is available in the system menu under Customer options – Settings. This extra services can get a separate description, like e.g. at 8 am, at 10 am, at noon, etc.
Frequency profiles
The frequencies are used to specify in the software how often actions or tasks should be carried out. Along with the time of the execution, this allows to calculate the cleaning time (calculation).
The frequency table shows how often an object is cleaned according to the assigned profile (frequency profile). The overview of these frequency profiles is under the tab frequency profiles. Their ID in the column header makes the scheme clear and comparable.
The user can change these frequency tables for all area components: floor, inventory, wall, ceiling, glass, other tasks and outdoor tasks.
Designation of frequency profiles

Data
75
Filling out frequency profiles in the frequency table
When the user fills out a column, the other columns can be copied from the completed column to the other columns. By a right mouse click, the user then gets the following features available:
Illustration right mouse click from a frequency profile
By entering each work code (p, d, w, f, m, j or with its combination g, x, l, like wl, wg, d2), the frequency profile can be completed to the user’ s liking. The frequency codes are linked to a period code with corresponding colour, so that the work codes are entered in the work preparation.
Combination work code and frequency profile
The work code indicates how many times a week an area is cleaned. It specifies how frequent the cleaning of the floor and the inventory is done thoroughly. Other times, the floor and inventory are cleaned according to the light program. This combination is organized in the period tables of the frequency profiles. The impact on cleaning working times is important to assign the available working time to the executors and to align availability. The combination of work codes and frequencies is combined in Service profiles.
This is illustrated in the next table:

Data
76
Impact work time of work codes with different frequency profiles
Work code 311 511 521 552
Frequency profile 30 40 Time 30 40 30 40 30 40 30 40
Floor
Light: dusting wl wl 1 2w 104 2w 104 4w 208 4w 208 3w 156 3w 156 n/a n/a
Thorough: wet-scrub wg wg 2 w 52 W 52 w 52 w 52 2w 108 2w 108 d 260 d 260
Time floor: 0.80 0.80 1.20 1.20 1.43 1.43 2.00 2.00
Inventory
Office wg d 1 w 52 3w 156 w 52 d 260 w 52 d 260 2w 104 d 260
Telephone w wg 1 w 52 3w 156 w 52 w 52 w 52 w 52 w 52 2w 104
Paper basket d d 1 3w 156 3w 156 d 260 d 260 d 260 d 260 d 260 d 260
Lighting m w 1 m 52 W 52 m 12 w 52 m 12 w 52 m 12 w 52
Chair m w 1 m 52 W 52 m 12 w 52 m 12 w 52 m 12 w 52
Shelves 4j m 1 4j 4 M 12 4j 4 m 12 4j 4 m 12 4j 4 m 12
Door – finger prints wg wg 1 w 52 W 52 w 52 w 52 w 52 w 52 2w 108 2w 108
Door frame m 2m 1 m 12 2w 24 m 12 2m 24 m 12 2m 24 m 12 2m 24
Time inventory: 1.35 2.54 1.75 2.94 1.75 2.94 2.17 3.35
Work code 311 511 521 552
Frequency profile 30 40 30 40 30 40 30 40
Total time 1.35 2.54 1.75 2.94 1.75 2.94 2.17 3.35
Working times
Working times to clean a specific object are entered in the working time tables. The tasks are listed with their respective method. The calculation factor of square meters, unit (piece) or activity can be entered here. This working time can also be entered in the corresponding task sheet. The working time is displayed in centiminutes.
Header working time table
Alternative input working time in the time sheet

Data
77
Each working time can be displayed with four alternative additional working times. This is mainly used by engineering offices that use The Cleaning System to advise their customers.
The user can choose between several locations in The Cleaning System to enter working times for separate task/methods. Usually this is done per task/method or per floor method, but this screen gives an overview and provides to make adjustments for each object.
The user can draw up working time tables for all area components: floor, inventory, wall, ceiling, glass, other commands and outdoor tasks.
Working times for outdoor tasks

Data
78
3. Area types menu
Area types menu
The menu function Area types opens the main screen with the chosen list of the area library. This list gives a clear overview of the default areas with corresponding parameters and values. This screen has two tabs at the top of the screen: area types and task lists.
The list of types in the area library is only visible when a selection is available in the drop-down field of ‘Current basic model‘. The user makes this choice by:
indicating a specific library from the drop-down,
connecting the customer file to a particular library, then the set library will open up automatically,
clicking the button next to the description field. This button also gives access to the list of available area libraries.
Once the list of area types is open, the other tabs of the area library will be active. The other tabs contain data from::
Service profiles,
Quality Profiles,
List of area groups
Additional terms, e.g. used for quality controls.
Overview area types screen
The area types screen contains an overview of the default areas from the library. This listing contains following information::
ID: the unique code of this area type. All ID-codes in The Cleaning System are always unique to their domain and cannot be changed after entering. Try always using short codes within their domain application.
For area types, the code should only refer to a default area and not contain any data as floor covering, department or to which area group the area belongs. Such properties are entered in the area sheet itself.
Name: the description the user wishes to give to the area.
Area in m²: any default area can have a standard surface and perimeter. These data are only indicative and are not used in the calculations of the files. For a uniform overview in the list, however, they prove to be useful.
Work code: each area has a default working profile, based on the service and quality level of the relevant area. This screen visualizes the work codes of maximum three periods.
Service profile: specifies to which service profile group this default area belongs.
Quality profile: specifies to which quality profile group this default area belongs.
Hygiene area type: specifies to which hygiene profile group (INSTA800 standards) this default area belongs.
Working times: the default surface, the floor program and the task list of this default area give a calculation of the cleaning times required for this default area. These working times are only indicative.

Data
79
New area types screen
There are two methods to create new area types. In the first way, the user follows these steps.
Click (New) _Plus_. Then the following blank sheet will open.
New area type
The default area sheet consists of two parts. The upper part contains the identification and the lower part the data that manage the work organization.

Data
80
Area type sheet: identification data
The default area sheet contains all possible information of a default area. Beside the identification and description, all links of floor type, working methods, quality and hygiene requirements, the work packages and possible costing overviews are combined within this sheet.
ID: the unique code of this area type.
Name: the default description of the area.
Short name: the description a user wishes to give to the area or the abbreviated designation.
Level: indicates whether this is an area, but this element can also belong to another division such as a floor, an entire building or be used for a single customer.
Area group: to which area group this area belongs. This list is drawn up under the separate tab.
Hygiene type: an area can belong to a hygiene group; the default list is available in the drop-down menu.
Surface: the user can assign a default surface to the area.
Circumference: the user can give a default surface to the area.
Height: the user can give a default height to the area.
Working times and costing for three periods: The Cleaning System calculates on the basis of the above default data and the set tasks also following information: the average working time per day for each period; the actual total time and cost per period, per week, per 2 weeks, etc. These options are available as a separate menu in the title bar.
Additional calculation methods in the default area sheet
Floor type: the default floor type for this default area.
F.L..: the furnishing level used by default for this default area.

Data
81
Area type sheet: connection with methods and requirements
Extra tabs in the default area sheet
The second part of the default area sheet consists of separate tabs with following elements:
Work program tab
The tab ‘Work program‘ is used to enter all data for the preparation of the calculation and work organization. Data that determine the default area’s quality and service profile are entered.
Work program tab
The data in this part of the data sheet connect all the elements established by the calculation and the work design for the default area. This information is entered not by filling in values, but by clicking a value in the drop-down menus. The Cleaning System will check in this way if the chosen values correspond with each other.
Service profile: unless an area is subject to a hygiene level, the user can enter a value. If the area is subject to periodical hygiene control, the value of the service profile must correspond to that of the hygiene level.
Hygiene type and quality profile
Corresponding service profile
Corresponding frequency profile
5 5 50
4 4 40 of 50
3 3 of 4 30 of 40
2 2 of 3 of 4 20, 30 of 40
1 1 of 2 of 3 10, 20 of 30
When entering the service profile and the corresponding quality profile, The Cleaning System checks whether consistency of these data is correct.
The designation _ (!)_ for the service profile and frequency profiles indicates that the connection is not correct, usually a level of service set too low. By double-clicking this warning, the software will assign a proper profile.
The working codes for the three periods result automatically from the combination of service and quality profile. The user can enter an alternative work code by clicking on the double arrow, after which the field work code switches to alt. work code. Then choose the desired working code from the list. This list is preferably drawn up with the function Work code definition.

Data
82
Floor method tab
The Floor method tab contains the set floor methods. When choosing a floor type, these fields are filled out automatically, but they can be overwritten or altered at any time when another working method better fits the selected default area.
Parameters tab
Within the default area the user can enter nine elements, whose number may vary for this type of area and which have a significant impact on calculation. These (mostly) inventory elements are then included in the parameters drop-down lists for each type of default areas, so the syntax remains the same and the user retains a simple overview of the words used.
These parameters are available in the task screen to be able to calculate the working time for these tasks on the basis of the quantity that was entered in the inventory: e.g. the number of beds, desks or chairs in a particular area type.
Parameters
Windows tab
To calculate window cleaning, the number of windows, their surface, and up to five parameters can be used to make a standardized calculation of the window cleaning. This can be interior glass, such as separation walls at a railing, dividing walls, or outdoor glass..
Window cleaning data
Quick calculation tab
The quick calculation tab is rarely used. It offers a simple solution to enter a cost or amount of working time that will be used. It is particularly suitable for smaller projects or for the start-up of a project in which previous calculation data is entered to use a simple overview.

Data
83
Details tab
The Details tab gives the user a quick insight into the results of both the different calculations of working times and the cost. The buttons at the top of the titles allow an overview of the different methods. The buttons at the bottom of the screen give an insight into the used standard data per work type: cleaning, engineering, service, window cleaning, machines, inspection, etc. The results are thus illustrative and only calculated on the basis of the default data of the default area.
Note tab
Each default area has a note field to keep specific data, such as technical information. These notes can be consulted by all users or are available for the reports of this part of The Cleaning System.
4. Recalculate area types menu
The Recalculate area types function is available in the Data main menu. After the user entered the default area information or changed data in the course of different projects, it is recommended to recalculate the default data of each area sheet. This will reset all settings and internal calculations of the area library. Use this feature especially if tasks and methods were adjusted.
5. Service profiles menu
The Service profiles menu in the Data main menu gives direct access to the Service profile tab of the area library. There, the user can create or modify the desired service profiles. The tab contains the available service profiles.
List of service profiles
This tab contains the following information:
ID: the unique code of this service profile.
Name: the default description.

Data
84
Qual.: the service profile is connected with a specific quality profile.
Work code 1 to 3: each service profile is characterized by a standard work code. The working codes for the periods 1 to 3 are displayed here.
Owner c P1 up to P3: the user can create own work codes and connect them to a service profile.
Click _ (New) _Plus or _Edit_ to create or modify a profile. In this screen, the set data of the desired service profile are entered.
Detail service profile
The used fields of the service profile sheet are:
ID: contains the unique code of this profile.
Name: the default description.
Work code: a working code for each period is entered; by clicking the double arrow, the user can enter an alternative period.
Quality profile: in the drop-down menu of quality profile is a list of available quality profiles. The service profile must be linked to quality profile.
Frequency model connection: all area components can be linked to an appropriate frequency profile.
Note: a note field allows to enter remarks and descriptions.

Data
85
6. Quality profile connection menu
The function Quality profiles in the Data main menu gives direct access to the Quality profiles tab of the area library. The user can create or modify the desired quality profiles under this tab. These profiles are also linked to an AQL. The tab displays the available quality profiles with an overview of following data.
List of quality profiles and AQL ‘s
ID: the unique code of this quality profile.
Name: the default description.
AQL: the set AQL-value for the control of this quality profile
Inv. 1 & inv. 2: the specified tolerance values for this component for group 1 and group 2
Wall 1 & wall 2: the specified tolerance values for this component for group 1 and group 2
Floor 1 & floor 2: the specified tolerance values for this component for group 1 and group 2
Ceiling 1 & ceiling 2: the specified tolerance values for this component for group 1 and group 2
Click _ (New) _Plus or _Edit_ to create or modify a profile. In this screen, the fixed data of the desired quality profile are entered.
Quality profile with tolerance values

Data
86
The Cleaning System offers the possibility to carry out thorough quality and hygiene checks in several ways. All statistical calculations to carry out standardized quality controls are incorporated into the software.
The Cleaning System contains for instance the necessary settings for the ISO EN 13549 control with variable AQL and tolerance limits. In addition, the INSTA800 control method for inspection of hygiene bound areas is integrated. Thirdly, The Cleaning System also offers a solution for the recording of the ATP check measuring results, linked to the standard quality control.
Hygiene control based on ATP (adenosine triphosphate) is a simple method that can be used to check how effectively someone cleans his hands.
The user only needs to make the desired settings for management of buildings in the ‘customer’ database. The Cleaning System provides a choice of AQL-settings 2.5%, 4%, 6.5% and 10%. See the drop-down menu on the screen (AQL). In view of quality and hygiene controls, the user can set tolerance limits for light (Group 1) and attached or high pollution (Group 2). For the ATP measurement results, only the tolerance values need be entered, and during the checks the values established by the measurement device.
The quality profile data sheet now also provides space in the quality control to set additional tolerance values for certain elements included in the control. The control can thus contain more elements than specified in the default controls. These elements can be defined by the users with three parameters, in their corresponding tolerance values (accepted deviations).
When users, however, do not perform a formal check, the area quality control can be based on an own standard with values between 1 and 9 or A and I. The user then determines which meaning is given to these values.
To perform free controls (own values between 1 and 9 or A and I) or to include ATP control results, software settings can be found under the tab ‘Additional requirements‘ at the right of the Area groups tab.

Data
87
7. Area groups menu
The function Area groups in the Data main menu gives direct access to the Area groups tab of the area library. The user can create or modify the desired area groups under this tab. The tab contains the available area groups with an overview of the respective surfaces listed in the customer file.
Overview number of areas per quality profile
ID: the unique code of the area group.
Name: the default description.
Areas: the number of areas that belong to this group in the ‘Customer’ database.
Surface: the total surface in m² of the number of areas that belong to this group in the ‘Customer’ database.
Click on _(New)_Plus or _Edit_ to create or modify an area group. A next window will open in which set data are entered.

Data
88
Detail area group and adjustment gains
The area group sheet contains two elements that have an impact in different fields. The first element consists of a percentage which is added as a supplement or deducted from all areas that belong to this group: Cleaning Technical Supplementary percentage. This percentage can be used on all area components.
The second element consists of three parameters (elements that users choose themselves) that can be used with their corresponding tolerance values to add additional elements to the quality control or take them into account.
8. Additional requirements tab
The additional requirements tab allows users to set a series of control criteria according to their requirements or likings.
The user can set additional requirements as he sees fit, to be used in the quality control during the inspections. To set a requirement or group of requirements, click on _ (New)_Plus or _Edit_ to change an existing one. A requirement will open the next sheet.

Data
89
ATP-measurement sheet
ID: the unique code of the Additional requirements set.
Name: the default description.
Input type: the user chooses which kind of additional requirement(s) to enter and which parameters to use

Data
90
Selection button A …X/1…3: this allows the user to enter the value range in which (an) area(s) are approved or rejected. The meaning of the evaluation values 1 to 9 or A to I are chosen by the user himself. The evaluation leads to the approval or rejection of the area, depending on the used assessment limits.
Own assessment limits
If the user wishes the opposite, namely that an evaluation between two set values reject this area, then click in the checkbox to turn the values.
Reversed assessment limits
The field under the checkbox (checkmark) always shows the acceptation limits.
Select button 9.99: the quality control allows the user (on the Android screen) to enter the ATP-control measurement results for an area or an area component
Hygiene control based on ATP (adenosine tri-phosphate) is used to check how effectively someone cleans his hands, by measuring a (bacteriological) sample on the touch points using a specialized device. The measurement result of this device can be entered in the quality control screen. The Cleaning System will indicate with limit values whether the area is accepted or rejected.
The limit values of the ATP-measurements are saved by the user in the corresponding screen.
Settings of the ATP-limit values
The two following selection buttons are used to add own control points for each quality control. The user has the possibility to add own assessment points to the measurement. This is done as follows.

Data
91
Selection button Checkmark(s): the assessment points are indicated with a checkmark. The evaluation criteria get a number or letter value, e.g. 5 up to 1 and only with values from 3 up to 5, the area will be accepted.
Assessment values with check marks
The user sets a (limited) number of assessment values. Next is decided for which values the area is accepted. The values 2 and 1 in the example lead to rejection of this area. But via the drop-down menu the software allows to take other actions. These are: ‘No action‘; ‘Reject room‘ and ‘Warning‘.
Selection button Selection: the second possibility for the user to add own assessment values to the quality control is via selection buttons. At the input is then decided whether the impact of the selection follows on a higher or lower assessment value than the selection.
Assessment values with selection buttons

Data
92
9. Calendar definition
The Calendar function in the Data main menu gives direct access to a separate window in which the user can choose preset calendars. The Cleaning System contains calendars up to 2021. The user can create or modify the desired calendars in this window. The adjustment applies for instance to the number of working days, public holidays or extra closing days that apply to the whole organization.
These calendars are also available via the menu _System_Default settings_ Default customer under the function _ Connections_. Selection button next to the calendar.
The calendar screen gives an overview of the calendar days and how they are spread over the year, the number of public holidays and possible closing days.
Illustration Calendar information tab

Data
93
10. Period definition
The function Period(s) definition in the Data main menu gives direct access to a separate window in which the user can set the settings of Period, 1, 2, and 3. A calendar can also work with only one or two periods, with for instance the weekends as second period. The description of the periods is used in the same way through the entire system and the description is also visible in all reports.
These calendars are also available via the menu System_Default settings_ Default customer under the function below the function _Connections_. Selection button next to the period._Connections_ _System_Default_Settings _Default Customer. Selection button next to the period.
New periods can be set or existing periods can be modified by clicking the buttons _ (New)_Plus or _Edit_.
Period definition(s)

Data
94
11. Work code definition
The function Work code in the Data main menu gives direct access to a window in which the user can set his own separate work codes for the period 1, 2, and 3. These work codes are then available in the selection field of the work period of all area types.
To set a new work code, the user first decides to which period the new code applies. Then click on the desired work code (P1 to 3: xxx), and the next sheet will be displayed.
Work code (P1 to 3: Xxx)
ID: the unique code of the extra work code.
Name: the default description.
Code: the work code itself. The work codes can contain MMM values or consist of a number combination from 100 up to 777.
Note: Additional notes can be linked to each work code in the note field.

Data
95
12. Work instructions
The function Work instructions in the Data main menu gives direct access to a sheet in which the user can draw up a detailed work instruction for all kinds of tasks for the area components.
Work instructions
ID: the unique code of the work instruction.
Name: the default description.
Note: notes can be saved in the note field.
Work instructions, e.g. ‘preparing coffee pot, cups, water and glasses‘ are placed in the default report EX121 work plan for the executors. The connection of work instructions for a particular area is done in the main screen of that specific area.
The steps to perform a link are as follows:
A. Go to an area on a floor to perform an instruction link;
B. Next to the area screen, click on the selection button _Other_.
C. The menu shows the options: Tasks (task package of the area); ISO-codes (if ISO-codes apply), area instructions and work design.
D. Choose the option _Area instructions_.
E. A blank screen with possible instructions will open;
F. Click _(New) Plus_ and a detailed data sheet opens up (see illustration).

Data
96
Area main screen
Connection instructions
The screen contains the following information.
Code: this is the list of set instructions with a link;
Work type: allows the user to connect instructions with one or more work types for the work design;
Period type: allows the user to have the instruction carried out during a specific period (period 1 to 3).
The instruction(s) is/are now included in the work design and will be placed in the report of the area work planning (see work design) for the set period(s).
Instructions are no substitute for tasks/methods linked to the area components, as they do not contain standard times and are not included in the calculation of working times. It are solely instructions that are part of an area, or they can be used as a reminder to perform tasks.

Customer
97
Customer
1. Introduction
The Customer main menu contains all features that allow to manage or calculate individual customer or organization information. The functions allow to set customer-related data such as departments, work plans and client-related selection possibilities.
The Cleaning System makes all calculations at the lowest level, namely local or area level. The calculations include working time(s) and costing of all period types, all types of work and for all types of buildings. The calculations happen at customer level and are not continued onto customer groups, regions, etc.
The Cleaning System works maximally at customer level, where is set how periods are divided and which type of calendar is used. The calculation of the average daily time is thus set on customer level. The calculation of working time(s) cannot be combined with other customers, because they might have a different work organization, another task packages or a different calendar. The Customer file menu is as follows.
Customer menu

Customer
98
2. Recalculating
The user uses The Cleaning System to record buildings, floors and areas. The buildings always contain floors and areas that are registered under a customer. When entering a new building floor, all customer data will be saved automatically with this calculation from the moment the area is saved. But there are also situations in which the adjustment of time and cost calculation does not happen automatically or continuously.
E.g. when a furniture object (see the nine parameters in the area sheet) was set up differently previously or when the basic model was first used, The Cleaning System will have to carry out a recalculation of all areas to this customized model after the changes. The same applies e.g. for a change in the technical percent surcharge of the key figure for cleaning in an area group. This can in turn be linked to multiple master models.
The function ‘Recalculate‘ allows the user to recalculate the working time(s) and costs of one or more customers at the same time. Usually, this is done on the active work plan, but the function can also be performed across multiple types of work plans. (See below more about work plans.)
The recalculation function includes the following options:

Customer
99
Plan types
The Cleaning System allows to manage up to five different plan types.
This screen displays the plan types that are available for the selected customers. The current plan type is marked in bold.
If an end calculation was already carried out for one of the plan types, The Cleaning System will show a symbol with green/red marking. If an end calculation with adjusted factors was carried out, these factors will also impact the recalculation. These factors are preferably turned off until every calculation factor is switched off. Only then the recalculation is initiated. It is less cumbersome to perform a recalculation on one customer or one floor instead of several.
The Cleaning System warns the user with the following notification that active factors are switched on for the selected customer(s). (See illustration.)
The active plan types are displayed in this Recalculation sheet. In this example, they are Day shift; Evening shift and Night shift. Plan type ’0‘ is by default the active plan type, but the user can change this under the function Customer, Active plan type.
This menu item shows which plan types are recalculated for the recalculation function.
Select
The recalculation firstly allows whether or not to include active and non-active areas in the recalculation.
Secondly, the user can ask The Cleaning System to assign the correct work codes automatically according to the preset area profiles.
Progress bar
Shows the recalculation progress. After the recalculation, the progress bar displays for how many areas a recalculation was carried out. If the recalculation was finished correctly, The Cleaning System will place an indication next to the selection.
Shows that the recalculation proceeded without errors.
Attention, the selected recalculation contains errors or a mix-up of files.
In case of recalculation errors, The Cleaning System will give a warning and show the errors in the log screen.

Customer
100
Log
The log part of the recalculation sheet gives information on the recalculation procedure and whether any errors occurred. The log screen also contains information about which customers were recalculated and which not. (See illustration.)
Log screen
The recalculation starts by clicking the ‘Start‘ button. The user can follow the progress on the screen. For each customer, the following occurs:
Times in relation to work plans, sections, areas, floors, buildings etc. are reset for the selected plan types.
Areas, floors, and buildings are individually reassessed and get key figures. This occurs simultaneously for all selected plan types.
The summary also takes place simultaneously for the work plans and sections.
The working time and costs are calculated for the work schedules and assigned tasks, such as extra hours for special or additional tasks.
At the end of the recalculation is shown at the bottom which customer and which plan types have been calculated. (See illustration.)
The final recalculation notification

Customer
101
3. End calculation
End calculation screen
The end calculation function allows to manipulate in three ways the calculation of the cleaning times with all customer data, including the work plan, the three periods, the periodical work (period 1 and 2) and the ‘spring cleaning‘. The recalculation function is focused on the recalculation after changes were made on several locations in the measurement or the tasks that might impact all areas and the customer’s file.
The end calculation function is focused on the manipulation, impact of the final results of the calculation by the user himself. The user can affect the calculation using three factors. See as an example the illustration of the impact through the Factor field.
The manipulation of the calculation can only happen after all the elements of the calculation are finally set. Then the user can use the fields Factor: time (available working time), production (return m²/hour) or a factor chosen by himself (in the example 1.2) to manipulate the calculation of the total working time to a number of working times decided on by the organization.
To perform this manipulation, the user enters a rating in one of the Factor fields as he sees fit, and then clicks on the _Start_button. The end result can be reset at any time via the _Reset_ button.

Customer
102
The overview of the calculation results shows all working times according to periods, area components and work types.
Calculation results for the work types.
Under this review is a toolbar with the total work time, the average return expressed in m² per hour, and an input field in which the impact factor of the results can be entered.
Factor field
The end calculation allows to influence or make a simulation of the end calculation via three different factors. Simulation can be done through:
A. Time: If a specific amount of work time is available, it can be checked how this time is spread over the relevant tasks and area components, but also which general return this available time can offer.
B. Production: entering the gain yourself (m² per hour will result in other working times for the tasks.
C. Factor: entering a figure, higher or lower than one (1) will influence the results of the calculation as a percentage change.
Enter here the desired impact factor. To see the result of this factor, click on one of the two buttons next to the screen: with or without factor.
By clicking these buttons, the user can immediately see the impact of the factor. See illustration.
The function of the end calculation gives in addition to the calculation of all periods, also an overview of the calculation of all work types for all area components.

Customer
103
The other function buttons on this end calculation screen are:
_Period 1_: (Weekdays) If this button is activated, time calculation and adjustments are done for all work types for period 1, which in this example are weekdays. If the period is not used (no day is entered in the corresponding period definition), then this period button is not available.
_Period 2_: (Saturday) If this button is activated, time calculation and adjustments are done for all work types for period 2, which in this example are Saturdays. If the period is not used (no day is entered in the corresponding period definition), then this period button is not available.
_Period 3_ in your experience: (Sunday) If this button is activated, time calculation and adjustments are done for all work types for period 3, which in this example are Sundays. If the period is not used (no day is entered in the corresponding period definition), then this period button is not available.
_Periodical 1_ : Behind this button, you will find all data of Periodical work 1.
_Periodical 2_ : Behind this button, you will find all data of Periodical work 2.
_Spring Cleaning_ : Behind this button, you will find all data of ‘Spring Cleaning‘.
If those periods are not entered, the buttons will not be available.
The buttons at the left side of the time schedule are:
_Without factor_ : Shows the detailed time calculation without any post-calculation factor.
_With factor_ : When this button is pushed, all detailed time calculations are done with the required post-calculation factors.
The buttons at the right side of the time schedule are:
_Start_ : Starts end calculation of the customer.
_Stop_ : Stops the end calculation. As some Areas were possible recalculated, this should only be run when the user wants to change factors or carry out a simulation.
_Closing_ : Closes the screen for the local instructions and returns to the main screen.
_Reset_ : Resets the end calculation for the period and for all types of work. This resets all periods to factor 1.0.
_Current factor_ : Resets possibly the other factors of the calculation. This applies to all period types.
_50/0:30_ : Switches between the four default time displays of The Cleaning System.
Cmin : Centiminutes.
h:m:s : hour : minutes : seconds.
Hour: The time format is displayed according to the number of decimal places specified by the user.
Minutes: Time display in minutes and number of decimal places.
The end calculation function also allows for the used work codes to be validated and possibly corrected. To do this, click the drop-down field. When done, it is not possible to undo correction(s)!
Progress: Shows the process of the end calculation.
Log: the log window gradually displays the result of the end calculation and provides the user with an overview of the system process. (% of the calculation, time and duration)
Remark: After the end calculation, a comment about the calculation and its results will be displayed, just as in the 'Recalculation' function.

Customer
104
4. Other
Under the menu item ‘Other’, specific settings are saved for the management of ISO-codes, as to give specific instructions in certain areas, to give own codes to work designs and to give renewed direct access to the task screen. This last function is not further explained here.
This menu function is identical to the _Other_-button in the right part of the screen when the building measurement data is opened.
Menu Options Other
ISO-codes
If a company or organization works according to ISO standards, this feature allows to show the status of documents with different number formats.
Optionally, the user can give the ISO-fields a customized description. The user can define ISO-codes used by the customer with these fields. These descriptions will then appear in the file for the ISO-code to the next level. The description(s) for these ISO codes can be found in the system settings under the menu System, System selection, 'ISO-codes'.
The ISO-codes can follow a sequence, by which the user clicks on the '+'-button next to the relevant ISO-code field. This allows numbering. There are six ISO-code fields available.
ISO codes are only active from the level 'Building' in the client files.

Customer
105
Iso-codes with automatic increasing sequence number
Area instructions
It can be very useful to provide certain areas with specific instructions for the various types of tasks. These instructions are then linked to the area tasks on the relevant cleaning files.
To create these instructions, you will find the function ‘Area instructions’ under the menu item ‘Other'.
The user can give specific instructions to a space by clicking in the menu 'Other', ‘Area instructions’. (See illustration).
Detail Instructions
An instruction is given to a specific work type: cleaning, technical, service, window cleaning, outdoor work, machine, inspection, quality control or other work type 1 to 3. The instruction also applies to one or more period, according to the settings.
The instruction’s code and description follows from a default list created by the user. Area instructions can be created by clicking on 'Instructions'. The list opens up and new instructions, tailored to the user, can be made by clicking on (New) 'Plus'. (See illustration).

Customer
106
List instructions
5. Tasks
The function 'Tasks' is one of several options to instantly access the task sheet for the area. This task sheet is the same as when the user clicks the other function buttons for the task sheet in The Cleaning System.
6. Show related images
The menu function ‘Show related images’ is not available and will be removed in subsequent versions of The Cleaning System.
7. Active plan type
The system menu ‘Customer options’ allows the user to create up to five plan types for the organization of cleaning tasks. To do this, click the button ‘Customer options’ in the menu bar, go under settings to Plan types and the active planning screen will open up.
To use the desired plan type, the user clicks in the main menu on the function ‘Active plan types’. The activated plan types will be available in the menu. The active plan set by the user is shown on top of the screen.

Customer
107
Active plan type

Customer
108
8. Departments
A customer or organization can be divided into departments, each with its own budget. Each department can be divided into sections. This function allows the user to assign the costs and work time for each area to the department and the sections. The division in department and sections is made under the Departments tab, after which the areas are assigned in the area sheet. (See illustration)
Tab departments
The Cleaning System offers the possibility to set up the whole organization matrix under ten default departments. Departments are divided into sections and within a department the user can set area groups, individual persons, as well as sections. The user is free to set up an organizational structure under these ten tabs in the way he or she wishes.
For a health care facility, for example, it might be interesting to assign areas both to an administrative section as to specific work areas. That allows the user to get an idea of the work programs in these departments and sections, and when necessary make adjustments of the cleaning programs etc. Beside the division into departments, also a division over the different disciplines is possible. Possibilities are almost unlimited, as multiple departments and sections can be linked to each area.
In addition to calculating various ratios, it will also be possible to use distribution key to print outline drawings, shaded by department, to get a visual overview of maps.
The screen for the departments is structured as follows:
The whole left side of the screen gives an overview of all departments and for each department the department structure with branches and ramifications.
At the right of the screen you will find buttons for the structure format
Department structure – Departments – Sections
The keys at the right side of the screen are the following:
_(New) Plus_ : Using this key allows to make a new section under one of the 10 departments.
_(New) Add sub_ : Using this key allows to create a section or subsection for the selected department and the relevant section.
_Edit_ : This key allows you to edit a created section. (See also illustration Department sheet).
_Remove_ : Use this key to remove a selected section from the overview list. If a user removes a section, the underlying section(s) will also be removed.

Customer
109
The section of subsection contains is a sheet containing the following data over two tab pages.
Department sheet - Parameters
The department sheet contains the following two elements in the description of the department or sub (section).
ID : Identification code of the department or section.
Name : Name or description of the department or section.
Under the identification elements of the sheet, you will find seven parameter fields that allow the user to enter a specific return for the work types to be carried out in this particular department. This return adjustment is done with a plus or minus percentage for the specific work types. The work types are floor, inventory, wall, ceiling, other tasks, window cleaning, and outdoor tasks.
Overview of work times and costs per department

Customer
110
Important:
Note that if the user sets a percentage for multiple types of tasks, these adjustments have a global effect on the calculations and the calculation of the average daily time for the area. The setting of different adjustments should be carefully considered.
In the department detail view, the user can switch between the different default methods used by The Cleaning System. To do this, click the button with the two arrows to switch between the different views of calculation methods.
The Cleaning System allows to set up five plan types for the areas, under which dozens of work plans can be entered. The overview in the detail view of the department gives an insight into results per department for each plan type. To do this, click the number of the appropriate plan type to obtain the overviews.
In The Cleaning System tasks belong to a work type. For each work type, it is possible to get an overview of time and costs. This overview per work type for the relevant department is available under the drop-down menu. (See illustration drop-down menu of work type).
Illustration drop-down menu of work type
Select in the bottom part of the department sheet the desired setting of the detail view per department. (See illustration)
Setting detail overview per department

Customer
111
9. Planning - implementation
After registration of the building and the areas, tasks and working programs are assigned. From this registration of the cleaning work follows the calculation of the amount of working time per area and all the other tasks. The end calculation shows the end results of work times and costs as to organize the execution of the work. The function ‘Planning – implementation’ under the menu 'Customer', allows to set up the day-to-day organization. This menu item contains the following main functions:
Illustration menu planning - implementation
A. Work plans
The feature work plans is used to draw up work plans. A work plan includes a zone of areas that are merged on the basis of the calculation results of each area. In this work zone, the work is carried out according to a part of the day. Separate work plans can be set for the different work types. E.g. cleaning of patient rooms in a corridor that needs four working hours, cleaning of corridors with a machine, and so on. The work plans can be linked to an executor (see Personnel sheet), but are usually made in general, so no new work plans must be created in case of replacement or absence of personnel. The work plans can be set separately per work type.
That is why the tasks are linked to a work type.
The work plan is mainly thus a zone of areas, assigned to an executor. The zone is created to spread the work over the desired time period, the available time of a executor, or on the basis of the priority of a zone, e.g. cleaning all meeting rooms. The work plan itself is always based on the available working time of a executor (in general). The Cleaning System offers the option to plan 'automatically' (see below).
Create especially work plans based on a part of the day, according to a specific zone and particularly according to the kind of work: the work type.
The user can set an unlimited number of work plans. Each work plan belongs to one of the five available plan types, which allows the user to set the cleaning organization. The calculation plan type shows the main organization of the work, such as e.g. (0) daily work, (1) evening work, (3) reduced availability of personnel, etc.
This work plans group this work in a zone, so that it can be assigned to a performer.
Overview of the work plans.

Customer
112
The overview of the work plans contains the following information:
ID: identification code of the work plan
Name: description of the plan
PT – plan type: to which of the five available plan types the work plan belongs
Norm: or number of working hours available for this plan
Total: the allocated work time in the work plan
Remain.: the rest of the available work time in the work plan
Active m²: number of m² in the work plan
Total m²: total surface of the zone
First create several work plans according to the available work time of the executors.
A new work plan can be created by clicking _(New) Plus_. The following window will open up:
New work plan
The sheet of a work plan contains the following data:
ID: Identification code of the work plan.
Period type: select here the period for to which the work plan applies. You can choose from three possible periods. The choice determines which fields are active in the field of the available work time (Norm time) under identification fields.
PT – Plan type: to which of the five available plan types the work plan belongs
The available and activated plan types are available in this drop-down list as to be allocated to the relevant work plan.
Name: description of the plan
Norm: or number of working hours available for this plan
Total: the allocated work time in the work plan

Customer
113
Remain: the rest of the available work time in the work
Active m²: number of m² in the work plan
Total m²: total surface of the zone
Available work time: the available work time of an executor (in general) is available in the following selection bar. By choosing a period, weekdays in the example, five fields become available to be filled out.
Norm time (available work time)
Enter either the first field with 'Avg. – average' and this time will be distributed across the available fields, or fill in the available work time day by day. The time is entered in minutes. In the overview of the work plans, the time is displayed in hours:minutes. See example.
Completed available work time
Tab pages extra information work plan: the work plan tab pages allow optionally to enter additional information. The main tab pages are:
Tab pages work plan
Work types: work plans may include the normal cleaning tasks on the tasks for the relevant zone. Apart from the usual cleaning, specific tasks can focus on individual assignments or specific work. As to distinguish this, the user enters in this field to which work type these tasks belong and that they form a separate part of the week plans. See below in Weekly schedule and assignments
Optional designation of work type
Personnel: For the cleaning service, The Cleaning System is based on the notion of general staff, zones usually are not assigned to one particular person. But the option to assign personnel remains available. This also allows to assign certain work plans, e.g. zone operation room, machine work in the corridors, to one single person. Also the Inspector can be specified. See illustration. The list of available staff follows from the list under the tab page Planning personnel.

Customer
114
Personnel allocation work plan.
Frequency profiles: the frequency profiles of the regular work are linked to areas, but separate tasks can have a separate frequency profile in the work plan.
Parameters: within the inventory of the areas, parameters are used for additional calculations for regular cleaning. The same frequency profiles can be chosen for the specific tasks.
Other parameters: this tab page contains the summary of the active surface, total surface, and outline of areas in the selected zone. It has no adjustable data.
Comments: extra directives and comments can be entered here.
Task work plan
The work plan can be drawn up to plan separate work orders for a specific zone. Behind this button, you will find the task sheet which is built with the same data from the tasks and methods of all area components.
ISO – codes
Optionally, a work plan can be followed using ISO-codes.
Pay scales
This function is connected to the costs module of The Cleaning System, but has not been implemented yet. .
B. Personnel
Next to the Work plan tab is the Personnel tab. The user can optionally list all staff with contact details. This list is available in the work plan structure. The user indicates in the staff sheet if someone works for a particular customer or possibly for more. (Field: client-related).

Customer
115
Personnel details
C. Allocation – definition of zone
The function button ‘Allocation' starts the function with which areas are grouped into a zone and are ready to be allocated to the function Weekly schedule. To organize the cleaning, a zone must first be allocated to a work plan. In the next step, the user will organize and plan this work zone in the weekly schedule.
The work screen of the allocation is structured as follows.

Customer
116
Allocation work screen
The work screen consists of three parts:
The choice of work plan with option for additional clean-ups (trim);
Identification of the zone of the work plan.
Selection of areas for the zone with their respective surface(s) and working time(s).
Allocation of a zone to a work plan
Work plan: When identifying a zone, the user first makes a choice of the work plan (number or reference) that will be assigned to the zone. This choice follows from the list of the drafted work plans. This selection list is available in a drop-down menu next to 'Work plan'.
Drop-down list of available work plans
Work plan info: next to the selection button of the work plan is the field with information that is important for his work plan. This information is:
Name: the description of the work plan;
Surface: the surface of the selected areas (in part three) of this work plan;
Default: the default time of the work plan, expressed in work hours. The work plan contains the number of minutes per day available for the plan. In this field, the working time is displayed in number of working hours.
Own time: time that was added additionally to the calculation.

Customer
117
Allocated time: the sum of the work time from the calculation, used in this work plan.
Free: work time that is still available (+) or that was allocated too much to this work plan (-).
This will give the user an overview of the real amount of work time allocated to the group of areas that has to be entered in the weekly schedule.
Selection of areas for the zone
The second part of the work screen contains the selection of areas from the inventory list (tree structure) to assign them to the zone of the work plan. See illustration screen.
Part screen selection of areas
The selection screen consists of two parts: part 2 and part 3 of the overview. Left is the part with the areas from the inventory list and right is the screen part with the selected areas that are assigned to the work plan. Below the screen a bar shows the surface and calculated cleaning time of the selected area(s). When areas are selected, the bar above the measurement data also shows the number of selected areas.
Selection totals
A button between the two screens allows the user to transfer the selected areas to the work plan. By using the _Ctrl_-key, more areas can be selected and transferred.
‘Transfer‘-button

Customer
118
To remove areas from the list of selected areas in the work plan, click the button 'Remove from selection' by going with the cursor into the field on the right, so in the list of selected areas, and then click the Remove button. If the user wishes to remove multiple areas, choose any area while holding the _Ctrl_ -key.
‘Remove-button from the work plan’
The Cleaning System also offers two function buttons to facilitate the selection of areas. With the two function buttons below the Remove button, The Cleaning System can select itself several areas according to the available work time in the work plan.
The first function button automatically selects the available areas and selects a certain number of areas until the available work time of the current work plan is completed. Selected areas are marked and the user can then assign them using the 'Transfer' button. The areas are then placed in the third part of the screen and are ready for the organization in the weekly schedule.
The first function button only selects areas that have a calculated working time, in contrast to the second function button below, which also selects areas without a calculated work time.
Automatic selection until available work time
Automatic selection areas
With these two selection buttons, the user can also make an additional choice in the drop-down menu which is displayed by the button itself. These choices are:
From the top of the list
From the current area in the list
Starting from the next area in the list
Both function buttons contain those selection options.
Selection setting ‘Selection buttons‘
Remark:
When areas are selected for allocation, the area is still visible in the selection list, but the amount of work time is transferred to the selected areas. When the user removes the area from the selection, this area will be effectively removed from the selection list and the work time will be transferred back to the area in the selection list.
After a user has built up the selection list of the work plan according to his or her own view, the selection is assigned to the corresponding work plan by clicking the 'Close' button. This will bring the user back to the main screen of Plans – work plans and a new selection can be done.
Close button

Customer
119
D. Weekly schedule
When the work plans are prepared with the available work time and possible additional conditions, the areas are allocated as zones to these work plans. As to implement the work plans during the following months, a weekly schedule is drawn up for the usual cleaning, the monthly work and possibly specific assignments. The ‘Weekly schedule’ function offers the solution to organize this implementation schedule in a realistic way over the following weeks.
To start the weekly schedule feature, the user clicks the function 'Weekly schedule' in the screen of the work plans.
Work screen weekly schedule
The menu of the separate weekly schedule window consists of the following functions:
Files: selection of the work plan
Rotation (automatic planning): function to support the automatic planning of parts
Planning (automatic planning): function to support the automatic planning
Image: time settings
Data: free set-up to spread the frequencies as default over the weekdays.
Menu weekly schedule

Customer
120
Selection of work plan or files
Image of the drop-down
10. Maintenance settings runtime
Runtime settings
The meaning of ‘Runtime‘ refers to how to software performs changes when users perofrms changes of certain properties.
11. Switch on/off level

Customer
121
The features to switch on/off the level and fixed/free level are used to remove areas and floors temporarily out of the cleaning organization, because these areas are, for instance, being renovated. The function can also be used to remove certain areas and floors temporarily out of the work planning.
12. Work state
The function Work state only serves as a support for the user. The work state feature allows to give each area, floor or building a code that has a meaning for the user. E.g. the data of this space are complete, incomplete, incorrect, I have yet to enter task sheets, internal consultation is required, etc.
When you click the function Work state, the following menu list pops up.
Default settings work state
The available functions are:
Clear work state: select the relevant area, floor or building, and the number that was set for this area according to ‘User defined 1 to 9‘ will be removed. See illustration.
Area with a work state number
Clear work state (incl. sublevels) : select the floor or building and the number that was set for this floor or building according to the ‘User defined 1 to 9‘-code will be removed together with the work state number of underlying floor(s) and areas.
Clear work state (customer and all sublevels): select the relevant customer and all codes will be removed.
Reviewed: apart from the nine codes, an area, floor or building can also get the separate Reviewed work state code, as to inform the user that those areas were reviewed and a new work plan is required.
The work state function can get a number (1 to 9) that can be chosen freely, as well as the Reviewed symbol. When the measuring state receives an update from quality control, e.g. to complete area information, the area also gets a work state status to inform the user that this area contains new data.

Customer
122
Description of the icons
Free choice of code for work state
Icon of data import and modification for this area
Reviewed
In the quality module is explained how a form can be forwarded to a mobile phone or tablet (Android and iOS) to allow the user(s) to complete area data in the measuring state.
13. Customer options
The function Options in the customer menu gives access to a general menu in which the various settings of The Cleaning System for the customer file can be set and adjusted. Click the menu function or on the button to open the following screen.
Screen customer options
This screen contains in the right part the various elements where settings can be adjusted according to each customer. This setting list consists of:
General options: general settings of the customer file, alternative name, default settings for additional file and image folders, and how data is displayed on the drawing.
Connections: setting of the file’s default sets, calendar, and name of periods.
Return and % supplements: the different work types can contain an extra calculation parameter as to increase or decrease the rate of return in certain work types.
Calculation – return:
Calculation – other:
Trim: designation of the eight extra clean-ups that can be set.
Trim – CAD graphics: enter here a code with colour setting to display the trim and post-cleaning separately at the icon of the weekly schedule. This allows the user to see that a trim or post-cleaning is scheduled for the area.

Customer
123
Plan types: The Cleaning System can organize work for five different kinds of plans.
Frequency texts: allows to modify the codes for the various frequencies.
Contact types: allows to modify the description of the default contact persons in the customer file.
ISO-codes: allows to modify the description of the used ISO-codes in the customer file.
CAD – grid: allows to modify the shading and the colour codes used for visualization of the building plan for all selections in the customer file.
CAD – grid type headers: allows to modify headers according to the user’s wishes.
A. General options
The screen with general options consists of four parts. The first part information allows to enter the name of a consultant or a person responsible for the file. Names that are put here will appear in the drop-down menu. Also the field of the customer’s current status can be completed by the user; this free text is also listed in the drop-down menu.
Name and status of the customer file
This information contains the two folders that pop up in all area fields in the top left-hand corner. These two icons of a folder allow to save text files and photos of areas. The user can enter in these two information fields the path in which all customer-related files and images are stored.
Folder ref.: click here to get access to the default path to save all file documents of the customer file.
Image folder link: click her to get access to the default path to save all images and illustrations of the customer file.
The second part of this screen allows to give an alternative name to the customer file and to use this alternative name as default in all documents and reports. You will find this option under the title of level names.
Alternative customer name
The third part of the general Options screen allows to enter settings for the description of the areas in the measured building plans. This description of each area can also be set in the building plan, but default values are set with this choice. The identification with door number can be set here as a primary identification.

Customer
124
Options area texst descriptions
The fourth part of this screen allows the user to determine the default setting of the weekly schedule display. This setting has two basic differences:
1. The weekly schedule is displayed with icons or symbols: no separate headers can be chosen then. These headers are set under the option CAD – grid type headers. This option, however, does allow the user to choose the period for which the icons are displayed.
2. The weekly schedule is displayed with text to show the working method.
Show weekly schedule with icon
Show weekly schedule with text

Customer
125
B. Connections
The Connections screen shows which library, calendar, and period descriptions are used in the customer file.
Connections
The screen consists of the following parts:
Choice of area library
In the Data menu _ area library, area libraries with corresponding task packages (datasets) are set. These different libraries are available in the drop-down menu, and in this way the connection between customer file and selected library is set.
Choice of calendar
The work planning and allocation of the work is done in a calendar for one year. Depending on the country or the customer’s organization, this calendar may have other weekdays, compensation days, and so on. To be able to work with these differences between the customer files, The Cleaning System disposes of the calendar option.
To choose a calendar and determine the working days, the user clicks on the grey button next to the information field.
Calendar – Selection button

Customer
126
Calendar settings
The Cleaning System contains calendars up to 2021. These calendars contain all days of the week and the holidays. The second part of the screen shows the weekdays and holidays and allows the user to customize existing calendars or create separate ones. Possible closing days of the customer can be included in the calendar.
To modify the working days of the calendar year, the user clicks on the field next to the weekday and adjusts the number of regular days, holidays or closing days. The screen can also be 'reset’ to the original setting. Modifications are saved on closing.
The _Edit_ button allows to change the description of the calendar.

Customer
127
Choice of periods
To determine the periods with which The Cleaning System will work in the customer file, the user clicks on the grey button next to the description of the period: period definition.
Period settings – selection button
Period settings
This window allows the user to set the description of period 1, 2 and 3 and mark in the breakdown which days of the seven weekdays belong to which period.
Also the setting of the length of all periods can be entered. To do this, the user can choose from a period of one, two, three or four weeks.
The _Edit_ button allows to modify the description of this profile.
The adjustments are stored when clicking the _Close_ button.
Overview of the results of the institutions
In the part of the calculation data screen, the user gets an overview of the calendar settings and the periods in number of weeks per year, number of months per year, number of working days for period 1, 2 and 3, and the period description in the blue bar above the number of days.

Customer
128
C. Default adjustment key figures
A customer file can be changed in the returns of all work types, without having to change individual tasks. This adjustment is done in this screen. It allows the user to enter for all work types an upgrade or devaluation in general or related to performer(s).
After this adjustment, the user must perform a recalculation for the customer file.
Return and % supplements
D. Adjustment key figures periodical work
The Cleaning System offers the possibility to adjust used returns in the customer file with multiple additional parameters that are not based on tasks or separate areas. This calculation computes a total work time over the total areas by adding up the various work types.
This method is rarely used and will be removed in the future.
Return calculation – work types
Calculation adjustment – execution periodical works

Customer
129
Periodical work and spring cleaning are shown in the allocation and the weekly schedule as to be planned together with the other periodical work, such as monthly and quarterly work. The Cleaning System can also schedule the time interval between the periodical work and the spring cleaning. Both the number of clean-ups per year and the time interval between the following assignments are set in this screen.
The first part of the screen asks the user how many clean-ups (number of rounds) are planned per year. The second part of the screen allows to set the time interval.
Adjustment periodical work
The screen still gives the option that the calculation of the common building parts can be divided on level of customer, building or floor. This setting is intended primarily for cleaners who perform tasks where the building is divided between several different customers.
Division common spaces
E. Add.shift (Trim)
The Cleaning System allows to schedule a post-cleaning by adding an x to the daily work in the frequency profile: dx.
If the user finds one post-cleaning insufficient, there is a possibility to plan and organize up to eight separate post-cleanings. These post-cleanings are marked with their numbers in the sidebar of the area list below the title Shift Rounds. In the customer options menu, these extra cleaning sessions can get a separate designation that can also be added to the building plans.
Shift Rounds or extra cleanings button

Customer
130
Setting denomination shift rounds
The screen allows the user to describe the extra cleanings and to indicate how many can be scheduled. The top button on the screen allows the user to turn scheduled extra cleanings on or off in the customer file. The three tabs for the three periods allow to set a different setup of extra cleanings in these three periods.
By clicking on the number of the extra cleaning, it becomes active (green) or inactive (grey). In addition to the extra cleaning, a text field will pop up in which a free text description can be entered. It can contain a different description for each cleaning in each period.
The denomination of the fields is explained in the menu ‘System’.
F. Add.shift visualization in the building plans
The extra maintenance cleanings that are scheduled via the function Add.shift can be visualized separately on the building plans (see also Chapter Building plans). This graphic presentation is to be set with the function Add.shift – CAD graphics.
Add.shift – Cad graphics

Customer
131
For every basis round and for the extra cleanings, the user can add a letter to the symbol of the extra cleaning, e.g. the letter B, and change colours of the text field and text. This setting can be done via the selection button. All colours of the default Windows settings are available.
G. Denomination other implementation plans
Setup of Plan types
The Cleaning System allows to set up to five different implementation plans for the cleaning organization. Each plan type can have its own description and the plan types are available in both the calculation and the implementation plans.
To set the desired number of plan types, the user first clicks on the button for the desired number. The desired number of fields then becomes active allowing the user to give each plan type a description.
H. Making frequency texts and codes
Frequency codes are used within the task sheets and frequency tables to show with which interval and frequency tasks are being carried out. In addition to labour efficiency, implementation frequency has a significant impact on the calculation of the work time. The second part of the frequency code consists of a code that indicates whether the task belongs to the daily, light, thorough work or if it is a trim/extra-cleaning.
The codes and their combinations were explained above. This table allows the user to enter codes as he sees fit.

Customer
132
Frequency codes and descriptions
I. Determine the contact titles of the customer files
Each customer file has five standard sheets available where contact details of the file can be entered. The user can set the titles of the five contact sheets to keep the information uniform.
Fill in a title at the desired description; it will be used as header of the contact sheets at Customer file _ Properties _ Contacts.
Titles contacts with example

Customer
133
J. Setting description ISO-codes
Users that make use of ISO-codes in the files can use this option to set a description for the codes’ titles.
Iso-codes
K. Setting CAD default patterns
The main information elements in the building plan can be displayed graphically. This gives during and after the measurements a clear overview of the information on the building plan. The presentation of the information elements is done by shading and colour codes according to the Windows settings.
Click on the function CAD – grid and the screen for the CAD standard patterns will open up. This screen allows to set the desired default patterns, a colour-shade combination, for the whole customer file.

Customer
134
Cad default patterns
Remark:
The patterns option is also available in the building plan module and works in this module with codes that are used or available on the relevant building plan. It is easier to set colour-shading codes here, but they are not standardized and must be set again afterwards for a new customer.

Customer
135
L. Setting header texts
Pattern titles in the building plan can be displayed with titles-headers set by the customer. This setting and the option whether or not to use it, is done in the window of CAD – grid type headers.
This setting of separate titles is also available for the denomination of the ten departments.
Setting own titles

137
The Cleaning System
Building plan


Building plan
139
Drawing
1. Drawing
The main menu ‘Drawing’ contains all functions to measure the areas of a digital building plan (DXF of JPG-format) and to link the information to the measurement data of the building. The drawing module also allows to measure a building plan using a digitizer. The measured building plan forms the ‘measuring data’ of a building and is the basis for the cleaning calculation and organization. The defaults, set out in the area library, are linked to the measuring data, because every area has been denominated from the default areas (area library). The building plan allows the user to set the work structure and organization visually.
In the module 'Quality and hygiene control', the building plan supports the user while touring the building with an Android device.
The Cleaning System performs calculations based on data from the area library and the task packages on these measurement data. Users who are familiar with drawing software like AutoCAD, will quickly feel familiar with the ‘Building plan module'.
The main functions of the ‘Measurement module' are accessible from the main menu or from the toolbar above the worksheet via separate icons. The menu of the ‘Drawing module' looks as follows.
Drawing menu

Building plan
140
Main bar of the drawing screen
The main screen of the ‘Drawing’ module consists of three parts:
Main data: the list of areas under the tree structure of main data, optionally with detailed information of the area. Just like the drawing, this sheet is context sensitive, i.e. when an area is marked in the drawing, the detail sheet will be displayed. When multiple areas are selected in the tree structure, all these areas will also be marked in the drawing and vice versa.
Building drawing: the drawing area with the building plan and possibly the visualization of the selected elements.
Extra menu, floating function bar, for settings of shading, colour codes, symbols and icons. These additional elements are placed on separate drawing layers.
Full main screen: detail sheet and grid
To show the detail sheet of an area under ‘Main data’, the user double clicks on the blue bar of main data. An area which is selected in the main bar will be marked in the drawing and vice versa.

Building plan
141
2. Functions in the Drawing module
The ‘Drawing’ module contains both in the menu and in the toolbar above the drawing sheet the module’s functions. For ease of use, these functions are available in several places. The worksheets in The Cleaning System also contain context-sensitive menus: functions from the menu and the headers can be found according to the context in a menu below the right mouse button.
All functions of the ‘Drawing’ module' are briefly described below and further explained in the chapters on the working of the program.
The features in both the main menu when in the main bar above the drawing sheet are the following.
Main menu functions
Select mode: neutralizes the other functions and allows to designate an object.
Drawing mode: activates the drawing sheet and opens the drawing functions.
Manual moving or panning: moves the drawing on the screen.
Zoom mode: allows to zoom in or out on the drawing sheet
Drawing menu: gives direct access to a drawing function in the submenu of drawing instruments.
Snap to Guidelines: when measuring areas, gridlines can be set to get more correct measurements. Each angular point in the building plan gets a horizontal and vertical gridline.
Define print selection: opens the function to set print forms.
Determine patterns: opens the menu in the drawing sheet to set patterns and shading.
Reference point: allows to enter the reference points of a building plan on paper using a digitizer.
calibration: allows to calibrate the slope of the measurement result when measuring with a digitizer.
Maintenance
Scale marked drawing part: allows to adjust the scale on the x - and y - axis of an area.
Update Marked Area and Circumference Fields: when adjusting the building plan, the modified values of surface and outline are taken over.
Update Marked Area Fields: when adjusting the building plan, the modifications are taken over.
Update Marked Circumference Field: when adjusting the building plan, the modified values of the outline are taken over.
Select the period: lets the building drawing show the settings of the chosen period.
Area information: shows a limited overview of the area information.
Text layout: allows to choose which area text information is displayed.
Remove text from selected area: removes the text from the selected area(s).
Reset text anchor: allows to move the anchor of the text position on the area drawing.
Remove all drawing data: removes the measurement data of an area.
DXF Building plan: opens the import and management window to import DXF-files. (Only on building or floor)
JPG Building plan: opens the import and management window to import JPG-files.
Settings, user: opens user settings.
Settings, drawing: opens the settings for text display of the building plan.

Building plan
142
Drawing mode functions
This menu can be moved in the bar.
Drawing walls: starts the measurement or drawing of an area.
Drawing reduction zone: draw a zone that will be deducted from the area surface.
Drawing loose straight lines, e.g. the lengths of windows.
Add a new area to the measurement data, following on the previous area
Remove area
Copy areas from one floor to another on the same place in the new
Calculate the number of m² at the time of measurement or switch off the calculation
Snap the measurement to the gridlines: at visualization setting above 30%
Go after the measurement of an area immediately to the following area in the measurement data.
Zoom mode functions
Switch on zoom function
Zoom in
Zoom out
Zoom directly to the indicated area
Zoom out to show the whole floor
The zoom feature in the drawing sheet can also be carried out with the mouse wheel. This zoom focuses to the place where the cursor is in the screen. The zoom function also allows to go to the desired point when adjusting a drawing or measurement.
The ‘Building plan’ toolbar shows next to the zoom buttons also the size in which the drawing is displayed. The zoom changes with plus or minus 10% below the 100% and with steps of plus or
minus 25% above 100%. The scaling menu allows the user to visualize the building plan to the appropriate zoom to get full view, according to the height or width of the entire plan.
Scaling display

Building plan
143
Building display
The user can set the display of a building on the drawing sheet to his or her own liking. The drawing sheet is just like in a drawing software, e.g. AutoCAD, not limited in size. The digital building plan is imported on a 1:1 scale and zooming to areas at the time of measurement does not affect the scale of measurement.
The user can place multiple building plans of a building next to and above each other when importing the graphic or DXF drawings. In the chapter on importing DXF building plans is explained how different building plans be linked together.
Overview choice
Choice of period
The building plan visualizes measurements, work codes, etc. for the three periods the user has set plus the periodical and annual cleaning. Choose with this menu the period view.
Digitizer toolbar
The ‘Building plan’ module can receive measurement data from a digitizer. A digitizer was used to measure building plans on paper (format A3 to A0) or to draw building plans by hand on a tablet. Those devices are rarely used as digital versions of building plans (DWG and DXF-formats) have become common. The functions to work with a digitizer and the connection remain available in The Cleaning System.
The settings for the link are available in the system menu under 'Digitizer settings’. The manual does not address the operation and connection of these measuring devices.
Digitizer toolbar

Building plan
144
3. Measuring areas
Creating areas
The user first creates a list of areas under the main data of the building or floor. If the building already exists in the customer database, we recommend to create a 'test floor' with a number of areas. This list can be imported via an MS Excel file or by creating it manually. This last method is simple and gives more flexibility to adjust the ID and door numbers afterwards.
Import new areas via Excel
Contact the distributor to create new areas via an imported Excel file. The software distributor has the default import file and will help you with the import-structure of this file.
Create new areas manually
The user takes the following steps to create a series of new areas.
A. First create a new area. (See illustration)
B. Give as ID-number e.g. ‘010’ and leave all other fields blank. (See illustration.)

Building plan
145
C. Click ‘OK’ and the first area is created under the tree structure. (See illustration.)
When the first new area has been created, the software will immediately create a new one. The ID number is increased by a set increase factor, e.g. 10, whereby the second space gets the ID-number 020. The new door number of this area can follow the same numbering as the ID. The door number can also be increased automatically with a value that is different from the ID-number. These two automatic increasing factors can be set separately in the menu ‘User options_General options_Automation’. (See illustration.)
Automatic numbering areas and doors
D. Click as many times ‘OK’ as new areas are required. (See illustration.)
E. When the desired number of areas is reached, click on ‘Cancel’ to stop the creation of new areas. The Cleaning System asks after the creation the new area list to recalculate the customer file. Such recalculation is optional. After the measurement of the areas, recalculation is required.

Building plan
146
4. Drawing the areas
The Cleaning System offers various methods to measure the outline and surface of areas. It always involves drawing, but the method can differ according to the available building plans.
Draw the areas in the drawing mode without underlying sketch: free hand of the user.
Draw the areas in the drawing mode with a digitizer that measures a paper plan: connection with a digitizer is still possible, but because these devices are becoming obsolete, this method is no longer explained in the manual.
Draw the areas with a JPG-drawing as underlying sketch: draw ‘on top’ of the lines of an imported image, e.g. a pdf-document imported in JPG-format. Only images can be imported.
Draw the areas with a DXF-building plan as underlying sketch, with support of gridlines and snap points from the original AutoCAD drawing.
The last method is the quickest, most efficient and most reliable method for getting a correct drawing, and it does not require calculation of rescaling X- and Y axes of the underlying image.
Drawing mode
Open the ‘Building plan’ module in drawing mode and make e.g. the underlying grid visible: click on . The drawing sheet window is displayed as a checquered worksheet. This drawing sheet contains at the bottom left the axis crossing to position the drawing. At the bottom of the screen you will find the coordinates of positioning, length, width, and surface of the drawn object.
Worksheet drawn mode
The colour of the X and Y axes can be set in the menu 'Building plan_User settings_Drawing settings’. The setting allows to customize the colour of axes and grid. Also the colour and relative distance between the checks can be entered here. Take for example a value of 50 to 100 cm. Also the line style can be adjusted according to the preset number. Next, the support lines are set: colour and number. When working with an AutoCAD, the user can set here whether the drawn area ‘snaps’ towards the snap points. This depends on personal preference.

Building plan
147
Settings axes, grids and gridlines
Click on an area in the list under the tree structure to draw this and following area(s).
Click in the drawing menu on the function drawings of walls. The drawing sheet gets a blue border to remind users in which mode they are working. The cursor changes from an arrow into a cross and the intersection of two support lines. The cursor type can also be set. See System.
Drawing pointer
Click at each vertex on the left mouse button and continue until the area is drawn.
To draw a rectangular area, it is sufficient to indicate the first corner and next the diagonally opposite corner. Double click in the second corner to close the area. The next area can be drawn now, because The Cleaning System brings you directly to the next area.
To disable this support, click on
While drawing the areas, a menu is available through the right mouse button. This menu allows you to cancel the last measuring point, close the drawn object, customize area information with text size and change directly the settings of the drawing program.

Building plan
148
Support menu while drawing
To close the function of drawing areas, the user clicks either on the menu 'Close' or on the Esc key on the keyboard.
The menu below the right mouse button is context sensitive: for drawings, this becomes a specific menu. When an existing area is selected in the drawing, it becomes a customized menu. (See illustration.)
Menu indicating areas in drawing sheet

Building plan
149
Importing a JPG-file
If the user has building plans that were not digitally signed or not digitally available, e.g. a .pdf document, they must first be converted into image format. Images of building plans can be imported in the following formats: gif, jpg, jpeg, gif, bmp, ico, emf and wmf.
To import images of a building plan, first click
The following import window will open up: (See illustration)
Import window images
To choose the images, click on the function ‘Open folder' and the following screen will open. At the left you will find the available files, on the right a small icon that shows the selected image.
If the user first wishes to see the full picture, click on and a separate screen will show the full image. After having imported the desired images for the floor, the imported images will be displayed on the screen.
Imported graphic images
The screen with imported graphic images contains a set of features that manage order, blocking, turning on and off, and refreshing.

Building plan
150
Function at importing images
Open explorer
Remove image
Place image behind the measurement (once)
Place image before the measurement (once)
Move up in order (once)
Move down in order (once)
Lock image
Refresh import or removal
Set image as active or inactive
In the imported image folder, it is possible to manage the visualization of these images in the drawing screen. The user can specify whether an image’s status is active or inactive. A non-active image is not yet included in the drawing sheet. An active image is included in the drawing sheet by pressing the refresh button.
The indication 'in front' or 'behind drawing' indicates whether the image in the drawing sheet overlaps the drawing or is placed in the background.
Illustration combination of settings
When the graphic image in the imported image folder is set on active, click on to add the image to the drawing screen. (Refresh)
The imported image (or images) is placed on the drawing sheet, centered in the axes crossing. (See illustration.)

Building plan
151
Imported image
The image can be moved manually to another location on the drawing sheet.
To do this, activate the drawing mode by clicking
Select the image and its angular points will be marked with a black square. (See illustration.) Then, the user can move the image manually over the drawing sheet.

Building plan
152
Active image
Start measurements of the areas as explained in the paragraph ‘Drawing’.
After measuring all areas, the graphic file can be removed.
Measured floor
To remove the image, open the import folder again: click on
In the folder with open files, unmark the relevant image and refresh: click on and change to .
To remove the image from the drawing sheet, click once again on . The, the image is removed from the drawing sheet, but also from the customer database. The image then cannot be replaced automatically at the same location again.
Scale settings at different X and Y axes
An imported image in JPG format includes a building plan of which the X and Y axes are not in the correct scale or do not use the same scale on the X and Y axes. To check the image and to correct the measurement to the appropriate scale, the user has two functions.
The first function is the 'Scale by Ruler': this method compares the drawn length with a known length of one area to allow the user to change after measuring this length in the drawing into the known. (See illustration.)

Building plan
153
‘Rescaling to known length‘
The second method is the 'Measure length’ (Ruler): the user will perform the rescaling of all areas of the drawing by dragging the graphic representation. This measuring function allows to measure the whole image on the X and Y axes.
In the menu below the right mouse button, you will fund the function 'Measure length (Ruler)'. The user measures the longest known horizontal length, e.g. the length of a corridor or the full length of the building.
Click on the function . The drawing sheet colour changes into light green with a blue border around the screen, which indicates the user is in drawing mode. Click on the first measuring point and scroll horizontally to the end point of the known length. The distance value is displayed in a yellow speech bubble under the drawing sheet.
Make a note of this value and do not start immediately the second measuring, but restart the function! Perform the same handling for the vertical distance and also make a note of that value.
Check on the basis of those two values whether the drawing scale corresponds to the measurements of The Cleaning System.
If the measurement values do not correspond to the mentioned scale, if there is an important deviation, it is useful to adjust the scale settings of the drawing for all measured areas. The calculation of the distortion is done manually with a simple formula:
Calculation distortion scale
A. If the drawing has a different scale on the X and Y axes, e.g. 1:375 on the X-axis and 1:300 on the Y-axis, then perform one of following calculations:
a. If X is higher than Y: ((X-axis / Y-axis) – 1) * 100%
Example: the X- axis = 1:350 and the Y-axis = 1:300
Calculation: ((375 / 300) – 1) * 100% = 25,0 %
b. If X is lower than Y: -(1- (X-axis / Y-axis)) * 100%
Example: the X- axis = 1:300 and the Y-axis = 1:450
Calculation: - (1- (300 / 450))*100% = -33,33 %
B. Zoom out over the whole drawing
C. Outline all areas with the mouse. Start for example at the top left corner of the drawing, hold the mouse button until all areas in this group are covered.
D. Activate the drawing mode and click on an area, so that the marking of the encircled areas is black on the four corners. (=active)

Building plan
154
E. Click on the top right marking and hold the left mouse button. Drag this marking into the desired direction until the scale indication at the bottom of the screen shows the desired setting. (See illustration.)
Dragging image to the correct scale setting
Scale setting below the worksheet
F. Leave the left mouse button and wait until the software has carried out recalculations.
Scale setting at incorrect scale
A drawing made in an equal X- and Y-axis, but of which the measurement data are not correct, must be rescaled. To carry out this equal X- and Y-axis correction for all areas, a separate correction function is available. The scare correction for all areas happens as follows.
A. Zoom out over the whole drawing
B. Outline all areas with the mouse. Start for example at the top left corner of the drawing, hold the mouse button until all areas in this group are covered.
C. Select in the ‘Building plan’ menu the option ‘Maintenance’ and click on the function ‘Scale Marked Drawing
Parts‘ or on .
D. The following screen will open up and allows to enter the surfaces or to perform the adjustment over the whole drawing with a percentage. The software then recalculates the surfaces and outlines of all areas.

Building plan
155
Scale adjustment
E. Select here the adjustments or corrections that need to be carried out, and click then on ‘OK’.
A. Importing a DXF-file
If DXF-files of the building are available, it is recommended to use these drawings, because the method is the quickest to measure areas. DXF-files are based on original building plans in DWG-format by saving them as DXF. This format contains all building information and allows to merge building plans as a whole. When for instance a floor consists of several building plans, they can be combined flawlessly. That is not possible with building plans that are imported as image files. The software has no functions to change the drawing, only to measure all aspects of the drawing. E.g. to display the exact location of hydrants using a separate symbol on a separate drawing layer. More about this in the symbols chapter.
A building plan in DXF-format is always treated as a drawing on 1:1 scale, and the software uses this scale automatically while drawing and measuring.
Importing a DXF-file happens as follows:
A. Create a new floor in the building under ‘Main data’, and then create a number of areas as described above.
B. Indicate in ‘Main data’ the floor in which the building plan must be imported.
C. Select the DXF drawing button: click , the import window will open up.

Building plan
156
Import screen DXF-files
D. To choose the DXF-files, click on the function ‘Open folder‘ and select via Explorer the searched file. Multiple files can be opened per floor. (See example.)
E. Select at import the measurement unit with which the files will be read. These measurements units are both metric (from millimeter to kilometer) and empirical (from micro inch to mile).
Measurement units of the DXF-building plan
Importing multiple DXF-files
After import, the selected DXF-files will appear in the window (see illustration).

Building plan
157
For each building plan, also the building layers in the DXF-files are displayed. These layers can be switched on or off by marking or unmarking the building layer. The colour code of each building layer can be set by the user. These building layers give the user additional information, but are not always clearly described by the architectural draftsman. Check yourself which layers are relevant.
A DXF-file is imported as building plan into the software by clicking
Each time a building layer is switched on or off, the image in the drawing sheet should be ‘refreshed’ by clicking the ‘refresh’ arrow.
A DXF-file is not imported to the axis crossing in the drawing sheet, but to the position determined by the X-Y coordinates. These coordinates provide a very accurate positioning on the drawing sheet. Seek yourself the desired position on the building plan. The coordinates are entered either manually or by using the up and down arrows: Building plans can form together a floor; when a user wants a complete overview of the entire building (see drop-down menu) this placement next to or on top of each other is important. The intersection of the axes crossing is always the X = 0 and Y = 0 value on the drawing sheet and plans can be placed below, above, left or right of this intersection. There are no restrictions on the surface of this screen.
Definition position with X – Y coordinates
F. When the import, the choice of building layers and the correct positioning of the building plans are set, the user can start measuring the areas.
B. Measuring the DXF building plan
Areas with a DXF building plan in the background are drawn in the same ways as in previous methods. The DXF-file can support the measurement if the ‘snap points' of the file are active and because the software takes over the scale of the DXF file. Corrections of the scale are rare.

Building plan
158
Building plan in DXF with ‘snap points‘ and support lines
Upon measuring, the function ‘Drawing walls’ will recognize these snap points and the user can draw an area correctly faster using the support lines (in green on the example). If the original AutoCAD DWG drawing with closed polylines was converted to the DXF-file, they also will be recognized, which supports the drawing or the areas.
To draw areas with the DXF-file in the background, the user can also support the visualization with the shading or colouring. (See next point.)
Follow these steps to start measuring.
A. Make a series of areas under the ‘Main data’ bar.
B. Click on an area in the list under the tree structure to draw this and following area(s).
C. Click in the drawing menu on the function ‘Drawing walls’ and the full menu of the drawing mode will open up in the menu bar above the drawing screen.
D. The drawing sheet gets a blue border to remind users in which mode they are working. The cursor changes from an arrow into a cross and the intersection of two support lines
E. When drawing, the object within the drawn lines or marked points becomes green. To close an area, the user double clicks on the last measuring point and the area changes to the setting as set in the shading.
F. To improve a measurement, click on the desired location of a line of the measurement and move the measuring point to the desired location. All lines can also be ‘snapped’ to draw an extra corner for instance.
G. Always close the measurement by double clicking or pressing the Esc key.
C. Default settings building plans
Via 'Drawing settings’, the user can determine the default settings and text display in the building plan. This includes font, size, colour and background colour.
Click on this icon to activate the function.
The choice of font settings is the same as in all Windows applications, the field ‘Preview’ shows the result of the setting.

Building plan
159
Drawing settings
The choice element 'Grids' allows the user to set shading for all available information elements in The Cleaning System. This can also be done with the function 'Grids' in the drawing sheet. The settings made in the drawing sheet are also displayed.
Shading settings
The different default texts in the selection field ‘Text layout’ can be changed or customized here. The information elements themselves are not editable.

Building plan
160
Elements text layout
The user can determine several text layouts which contain other data on areas. Contact the distributor for further clarification about the structure and composition of the texts.
The various options to add a frame to print forms, can be set by the user via the 'Section layouts'. This frame of the standard report can have a meaning for a user, for instance correspond to the area colour of the building, a specific colour for certain hygiene sensitive zones, etc.
The colour setting and text descriptions are editable according to the user needs, just as the way in which the legend is being structured and displayed.
Section layouts

Building plan
161
Legend layout in sections
D. Area information
The user can have a quick overview of area and work planning via the function ‘Area information’ .
This screen gives an overview of the information on the area and the weekly schedule, whenever the user moves the cursor over the areas of the building plan. The content in this screen is not customizable and only gives a quick overview.
Area information

Building plan
162
Weekly schedule

Building plan
163
5. Data management via shading
The function 'Shading' is the easiest way to visualize area information in The Cleaning System. This feature allows to display information such as floor, area type, area group, department, service profile, hygiene type, work code executor, inspector, etc. The shading function also allows to link the correct data to the areas by colouring the area in the building plan with the colour code of the desired data.
As such, The Cleaning System allows to complete in an efficient and clear way the measuring data with other essential information by marking the desired colour code in the area using a brush. This section shows how this information can be applied quickly.
A. Use of shading
You can find the ‘Shading' function in the menu 'Building plan_Create patterns_’ or by clicking on .
On the left or the right side of the drawing sheet, a separate bar with three tabs opens up: Grid (patterns), Sections (Print Forms) and Symbols (icons and symbols). This bar can be dragged freely to any position on the screen.
The bar can be moved via a separate menu. Click with the right mouse button on the bar. The menu pops up and the user can beside the default menu functions enter where the bar is 'docked'. (See illustration.)
Bar menu
The pattern bar can be fold up temporarily or switched off by clicking one of the symbols on top of the pattern bar:
click the left button to hide, the right button to switch off.

Building plan
164
Patterns
Place the pattern bar at a desired position.
The user first chooses which information patterns are to be displayed. Click on the drop-down with the header ‘Grid Type’. (See illustration.)
Pattern selection list
For a number of grid types a subdivision, such as Work codes, is available. (See illustration).

Building plan
165
The third selection field allows to allocate a separate selection to the own work codes.
When selecting a grid type, the software directly creates a list with the used or available codes. The available codes are elements which were set in The Cleaning System, but not (yet) used in the in this building plan.
Activate this option by clicking on the button
Next to each available code, you will see the number of areas for which this code applies. Their number is indicated between brackets. (See illustration.)
Illustration available codes
Each available code can have its own colour setting and shading. It is therefore useful to keep those colour settings and the different possible shadings in a separate overview.
To add a colour or shading code to an area, click on the desired setting of the available codes.
Click on the brush icon and the cursor changes into a brush. (See illustration).
Brush for coding
By marking areas with the brush, the relevant code is added to the area in the drawing sheet. At the time of marking, data in the customer database will be completed.
The list of allocated codes to areas is only refreshed when the user clicks .
Codes can be removed from the area. Mark an area, click on to remove the selected code. Then click on the refresh button to refresh the list and the image.

Building plan
166
B. Selection of patterns – shading and colour
Select the desired element in the list of available codes, click on the element’s field and the setting menu will open up. (See illustration).
Pattern settings
The user chooses a colour according to the default Windows palette, either the full color or the shade. The button next to the shading colours allows to switch them from front to back.
The code may also be linked to a bitmap.
The result of the settings is displayed in the preview screen.
The user can choose whether the colour setting applies to the whole system or just to the customer.
Because so many colour combinations are possible, increased by the number of shadings, it is important to save these settings separately as to keep a high degree of consistency in the colour settings. E.g. colour settings for areas with a high level of hygiene should match the colour codes of corresponding work codes and service profiles.
Save colour settings (RGB numbers) and shading (serial number) in an overview. (See example.)
Elements R G B Shading R G B Example
Element 1 255 255 255 R11 120 120 60
Element 2 160 160 255 R18 255 255 255
Remark: the shading numbering in the example is the sequence number of the pattern in the menu.

Building plan
167
6. Visualizing information with symbols
The building plans in The Cleaning System can be supplemented with symbols. These symbols are available in the pattern bar under the Symbols tab. The default symbol library can be supplemented by the customer by adding own icons in the system folder.
The survey of the building on this drawing and the visualization of the elements always occurs on the drawing layer of the building itself. The symbols can be placed on separate drawing layers as to be easily turned on or off. The Cleaning System features nine separate drawing layers, specifically for the symbols.
Denomination of a symbol layer
The denomination of layers takes place in the menu ‘System_System options‘. Click in this menu on the option ‘Settings_Symbol layers’ and a window with denomination of the nine layers will open. These layers are not connected with the customer database, but apply to all files in The Cleaning System.
Denomination of the symbol layers
Description of a drawing layer
The information of symbols in The Cleaning System can be divided logically and each symbol applies to a specific work situation. To display this information, the drawing is built up in several levels. These levels are called ‘layers’. They can best be compared with a number of transparent foils which are place on top of each other over the drawing. When placing symbols, the user will take into account the type of information and when the symbols are visualized, for instance fire plan, use of machinery, time at which an area is not accessible.
The menu for placing symbols can be opened directly via the button .
Symbols menu
Open Explorer
Remove this symbol from the areas, only in drawing mode
Brush the symbol on the indicated place in the drawing
Determine the place where the symbol will be placed as default in the area

Building plan
168
Determine the size of the symbol
Choice of layer with description of the layer
The way in which symbols are displayed in their list
Show the list with layers and their denomination, switch layers on and off.
Placing the symbols is done in the same way as colouring other information in the areas. Click on a symbol from the library with available symbols, click on the brush and place the symbol on the desired location or the relevant areas. If
a symbol should always have the same location, the user can fix that location in the area via the menu under . This menu allows to set a fixed location for a symbol.
Fixed location for a symbol
The size of the symbol is set via the function . This is done in the same way as selecting font sizes in all other software.
The choice of layer where to place a symbol is done via the function . This menu allows to select the right layer.
Illustration layer choice
The list of drawing layers on which are placed the symbols, can be visualized with the button. This will activate the window with drawing layers that the user switches on or off.
Illustration visualization of drawing layers

Building plan
169
7. Creating print sections
The building plans in The Cleaning System can be printed with default reports. A default report can be copied and modified in the report generator. The adjustments are stored in the 'User-defined reports'. The default reports of The Cleaning System can print the building plans through the reference to the 'Print Sections’ set by the user himself. In that way, the reports contain all required information. Via the functions in 'Print Sections’, the user determines in which way and of which building part plans are to be printed with a default user report.
Illustration relation default report and print form
The print sections are set by the user in accordance to the building plans, their place in the drawing sheet and the parameters that are important to the user. The setting of the print section(s) is done in following steps.
A. Activate the bar for setting the ‘Shading‘, ‘Symbols‘ and ‘Print sections‘, click on
B. Print sections can also be started directly with the button.
C. Select the part ‘Print sections‘ with following options. (See illustration.)

Building plan
170
List print sections - sections
The ‘Print sections’ toolbar consists of three parts:
The ‘Sections‘ menu
The overview with preset print sections
The legend settings in the print section: place, number, and columns.
Sections menu – print forms
Create a new print section
Edit: edit an existing print section
Remove an existing print section
Print an existing print section with the building plan in PDF
Print an existing print section with the building plan
Print-preview: show the print section with the building plan
Create a new print section, click on and the window will open.

Building plan
171
Window new print section
Name: give the print section a distinct name;
Colour: to be recognizable, the print section has a coloured frame. This colour is not used in the report. To set a colour, click on the ‘Change’ button next to the colour field.
Colour setting print section

Building plan
172
Scale factor: the user can set a scale for the drawing himself, or leave this to the software when the printing command is done. The scale is displayed both in the print section (see illustration) and the report.
Illustration scale print section
Report: choose from the list the default report for the print section
Illustration choice of report
Section information: via this setting, the default report gets a coloured background. The colour setting can be relevant for the user depending on the content of the report. (See drop-down list in the illustration.)
Illustration setting report frame
Revision date and ID: both on the print form and the report (print preview), a date and additional remark can be added to the report.
Note: a free text field
Position: this fields determines the place of the building plan legend
Columns: when a legend contains a lot of elements, this information can be spread over several columns. You can set the number of columns here.
A. Click on ‘OK’ after the information window of the new print section is completed.
B. A transparent frame opens up in the drawing screen containing the colour settings of the new print section.
C. Place this frame on the desired location in the drawing sheet. By clicking active angular points with the mouse button, those can be dragged to enhance or reduce the size of the print form. The scale of the print section is automatically adjusted.
Active angular points
D. Via the edit function, the print section can be customized, for instance to move the legend to another location. This function is also available in print preview.

Building plan
173
8. Visualization of information
On the drawing sheet of the ‘Building plan’ module, various information elements can be displayed. The separate menu to switch on or off these elements is a floating menu that can be moved.
Menu visualization
Switch on or off gridlines, chequered page.
Switch on or off support lines for digital measuring.
Show texts in the measurement, switch on or off.
Show work programs in the measurement, switch on or off.
Show free texts in the measurement, switch on or off.
Show symbols in the measurement, switch on or off.
Show the DXF-drawing in the background of the measurement, switch on or off.
Show image in the background of the measurement, switch on or off.
This function turns on or off the original image (jpg) in the background. By turning off the original image, only the inventoried areas with their icons remain visible.
Make a drawing transparent, choose transparent or not transparent.
When a drawing is set as transparent, it will turn yellow. This function sets the measured areas as transparent or not transparent. When transparent, it is easy to have an overview of the measurements of the original plan. This function is linked to the previous function (switching on or off the original image in the background) to give the user a clear overview of the measurements and the building plan when measuring the building.
This function is mainly destined to show process of the measuring when no shadings were set.
Blocks an area, so it will not be added to a selection of more areas, switch on or off.
Remarks
The visualization of texts, work programs and free texts depends on the area text layout. The text layout is done via the menu ‘Text layout’ in the drawing.
The visualization of symbols is linked to the open or closed layers of the symbols, as preset in the menu ‘Visible layers’.


175
The Cleaning System
Quality control


Quality control
177
Quality control
1. Introduction
The quality control module organizes the quality control of cleaning, hygiene control of the areas and the extra (quality) controls set by the user. These additional controls consist of personal forms, such as inventory data of the area. The measurement results of an ATP-control in areas can be added as additional criteria of a control. The control reports can be entered both manually and with an Android device (a tablet or smartphone). Connection to the Android devices is done via Wi-Fi connection. The use of an Android device and the synchronization avoids double entries of data.
The manual explains the software and not the principles of quality and hygiene controls (INSTA800 rules). Contact the distributor for further explanations on regulation of these normalized control methodologies.
All settings of the quality and hygiene controls follow from the settings of the quality levels or the hygiene category to which an area belongs. No settings are done in the quality module. The module sets the implementation of controls on a form, which can be edited manually or via an Android device.
The main menu 'Quality control' contains two main functions: the setup screen of the controls and the function 'Quality profiles' that is also part of the definition of the default set: area types and their default tasks. The quality profiles were extensively explained in the chapter 'Data'.
Main menu quality control
Click on the function ‘Quality control’ in the main menu and a new window will open. All aspects of quality and hygiene control are managed via this window.

System
178
Main screen quality control
The main screen of the function 'Quality control' consists of two parts. The first part gives an overview of current and past controls with their status and to whom they were sent. The second part of the screen shows the control settings. For this screen there are three tabs.
Main file: the control is only based on the active customer file.
Calendar: an overview when the planned controls are to be carried out.
Planning mode: active for a group of controls, this tab gives the status of each control separately: date, time, control type, whether the control was accepted or refused, and the result of the control.
Default reports are available for all elements. Contact the software distributor to customize default reports.
The screen elements of the control schedule are the only settings with which a control or a series of controls must be set. Those settings are uniform and will be explained in detail below.

Quality control
179
Setting of a control schedule
The window with the control schedule settings consists of following parts.
ID: The Cleaning System creates a sequence number for each control. This sequence number always consists of the exact time on which the control schedule was created. The user can convert this ID himself to a personal code.
Name: the control schedule gets a default denomination (‘Sampling Scheme‘ date in JJ-MM-DD format); this description can be changed as well.
Inspection type: the user can define three types of control, one of which must be marked. Those three types are:
A. INSTA/800 maintenance control
B. DSF 2451 (hygiene) – Infection control in health care
C. Additional requirements, personal controls and input of ATP-data.
Inspection type
If the user also marks the third control, this should be built up. This can be done via the ‘Edit’ button, which allows the user to compose the form for the Android sheet/screen. This screen can have several tabs in which the separate entry boxes are placed. (See more below.)
Area properties: behind this field, additional control requirements can be defined, such as area type information, floor, frequency corrections, etc.
Statistics: these are the selection parameters and the description of the working of the inspection round.

System
180
Statistics
The selection fields for the statistics and inspection rounds consist of the following possibilities.
A. The choice of the control method. INSTA800 of ISO 2859-1
B. Sample type: single, double, and full control.
Single control: in this case, the inspector receives a list that is fully checked. The number of areas in the inspection round is based on the AQL-statistics.
Double control: the inspector receives a shorter list then normally required by the AQL-statistics. If the control for this (abrigded) list is accepted, the control is completed. If areas from the abridged list are rejected, the list will be extended with more areas to be inspected.
Total control: the inspector receives the list of all areas in the building or the floor for which a control or completion of data (additional requirements) is required.
Switching rules: Only valid for INSTA 800 revisions before 2011 and “pure” ISO 2859-1.
Population: is the way in which the control is composed. The user can choose between two working methods to populate the inspection round(s).
Grouping: controls can be grouped, e.g. according to hygiene category, area group, department or work code.
Stratification: controls can be stratified, e.g. per building, floor, etc. .
Android device settings: these extra settings are destined for the control to work on the Android device.
Show result: whether or not the inspector can see the control results on the device.
Exceeding rejection count: when the acceptation of areas during a control is exceeded, the control can be stopped automatically.
Enable the use of photo: in a following version, pictures can be taken and synchronized to document the final report.
Result influences: the calculation of the acceptance or rejection of the control can be influenced by additional parameters if the users wishes so. These additional elements are the INSTA800 results, hygiene results or the personal parameters, selected from the list of ‘Additional requirements’.
Period: the user enters the data and the number of wished controls in the entry fields of periods and start- and end date. The user can enter on which weekdays the inspection rounds can be carried out or not, e.g. not on Tuesday, Thursday, and Saturday. This will be taken into account when managing the inspection rounds.
Setting the inspection days

Quality control
181
2. Functions in the Quality control module
The ‘Quality control’ module contains both in the menu and in the toolbars above the screen all functions of this module. These functions are available at several locations as to give the user full comfort. The worksheets and functions also contain context sensitive menus: functions from the menu and headers are placed according to context in a menu below the right mouse button.
All functions of the ‘Quality control’ module are explained below and in the chapters on the working of the software.
Print the control report directly
Show the control report on the screen (before printing)
Create a new control (or series of controls)
Cancel and remove control
Remove control from a list
Unfold or close navigation bar (show all controls under this point)
Switch off filter(s) in the displayed list
Switch on filter(s) in the displayed list
Create a calendar selection
Show controls according to their status
Show controls sent to (type of device)
Show controls sent to (inspector)
Filter settings that always apply
Add areas or criteria to control
Generate control
Generate control with same date/dates (on/off button)
Generate control with random date/dates (on/off button)
Send control(s) to device(s)
Create control manually (paper control)
Stop started inspection
Complete manual control (entry field is started)
Synchronize controls with synchronization folder
Send building data to user (after the control was sent to user)
Import changes, customer data (entry forms)
Synchronize the control images, pictures (new functions in preparation)

System
182
3. Setting quality controls
The user sets the quality and hygiene controls as a set of controls according to a specific theme. This theme is determined via the screen settings (Sampling Scheme Data). The result of these settings is a number of controls that are placed under the theme in the overview. When these inspection rounds are ready to be carried out, the user decides how to send the control rounds to the inspectors. The inspectors can carry out their inspection rounds with control forms or with an Android device, phone or tablet. If they use an Android-tablet, the administrator must also send the building plans of the inspection rounds, so the inspector can see the areas to be inspected on a building plan.
The results of the inspection rounds are either entered manually or returned from the Android device via Wi-Fi. After synchronization, the reports are available to the administrator(s).
Method to compose a control theme
A. The control theme is created by clicking on
B. The new window of Sampling Scheme Data is activated and the software itself gives an ID and name, which the user should change.
C. Then enter the data of the inspection type, the statistics type, the sampling plan.
D. Indicate which population must be used or whether stratification is used. If the user suggests grouping, the software will generate a separate inspection round for each element from the group. E.g. at quality level, a series of controls is proposed for each quality level separately. If the administrator chooses a ‘Joined (All-in one inspection)‘, an inspection round per date will be proposed.
E. Indicate the settings that apply to the Android device and how results may be influenced by INSTA800, DSF2451 and/or additional elements.
F. When these data are entered or marked, the user indicates the period when the controls and how many controls may be carried. The user can optionally enter on which days of the week no controls should be performed.
When the data of a control subject are set, the user – control administrator, can generate the control rounds. To carry out control rounds within a control theme, the user first decides whether the controls should take place on the same date (e.g. limited period and low number of different stratified controls) or that they may take place on randomly chosen dates.
This choice is made by clicking one of following two buttons .
A. The user generates first the control rounds by clicking the button ‘Generate controls’‘:
B. If a user is not satisfied with the settings or wishes to change the controls, he can remove the rounds and repeat the previous steps.

Quality control
183
Control theme with inspection rounds
The inspection rounds under one theme are also clearly displayed in a calendar.
Control theme calendar
The software indicates for each inspection round how many areas are part of the total population and how many areas must be checked. The software also shows in the control screen which is the acceptance level of the next round, and which AQL is followed.

System
184
Detail sheet of an inspection round
Meaning of the abbreviations:
AC/RC: acceptation lower and upper limit
AQL: choice of AQL for the sample
LQ: AQL limit value. This value is always three times the AQL value.
PR: Producers risk: the risk for a producer that an accepted area was approved erroneously.
CR: Customer risk: the risk for a customer that an accepted area was approved erroneously. If this value is not acceptable for the customer, the sample size must be increased.
After the inspection rounds are scheduled, a sheet ‘Plan mode’ is available for the control theme indicating how many rounds were performed for this theme and what the results are.
Control plan, control process
Method to prepare a control theme with building information
To follow local quality criteria, a quality control administrator can develop his own control method, separate from INSTA800. (See additional requirements in chapter 1 Data).
When creating the control theme, the user clicks only on ‘Additional requirements’. (See illustration.)
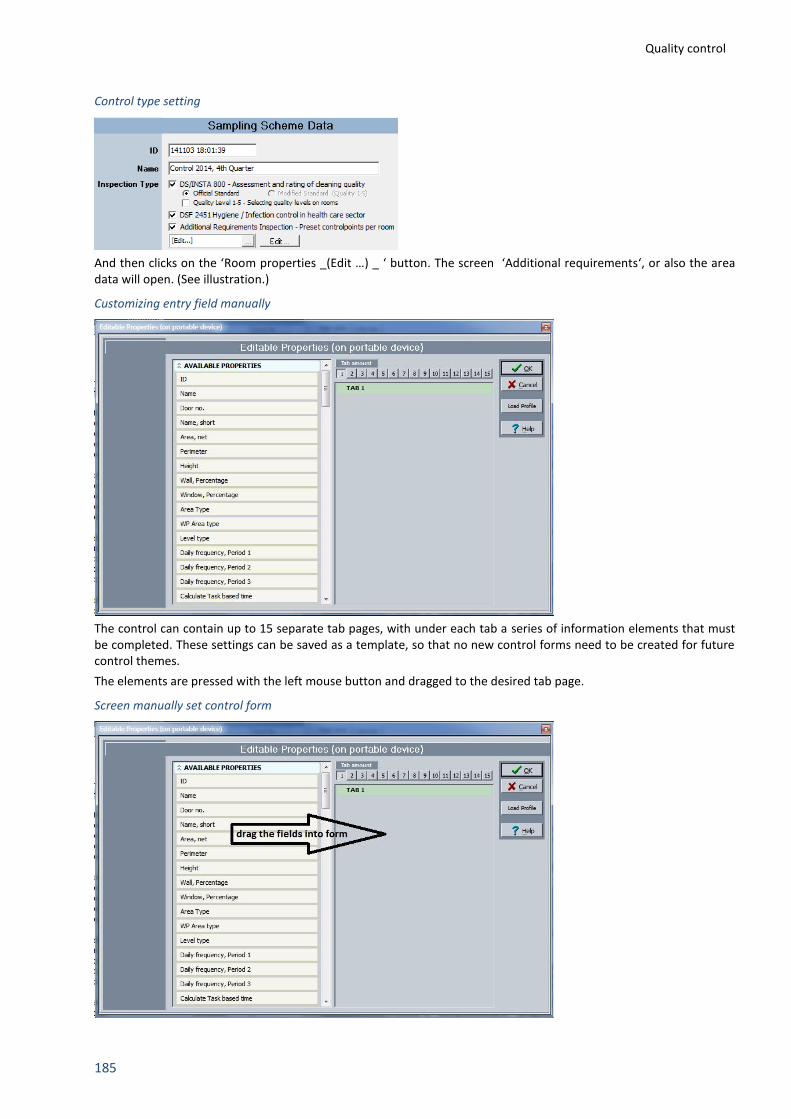
Quality control
185
Control type setting
And then clicks on the ‘Room properties _(Edit …) _ ‘ button. The screen ‘Additional requirements‘, or also the area data will open. (See illustration.)
Customizing entry field manually
The control can contain up to 15 separate tab pages, with under each tab a series of information elements that must be completed. These settings can be saved as a template, so that no new control forms need to be created for future control themes.
The elements are pressed with the left mouse button and dragged to the desired tab page.
Screen manually set control form

System
186
When the desired control is set, the user enters further settings for the control theme as described above. For instance for a control during which the measuring data must be completed, the ‘Sampling Plan’ with the setting ‘Total Sampling Plan’ and without quality control is the best method.
Method for the input of manual inspection rounds
To enter data of a manual inspection round, click
The screen with the entry field opens up and the user completes all elements. This screen is structured in the same way as the control form.
After input of all data, the software calculates the acceptation or rejection of the area(s) and the final report is available.
Input control Insta800
Input hygiene control

Quality control
187
Input additional reuirements data
This control can contain a random – sample number that was entered manually or is generated automatically by the software.
Input ATP-control
This control can contain a random – sample number that was entered manually or is generated automatically by the software.

System
188
Result control
4. Exporting data
Both the inspection rounds as the results can be exported to an Excel document. This function is available in the menu ‘File’ of the quality module.

Quality control
189
5. Wi-Fi communication settings
Contact the software distributor to arrange the Wi-Fi settings. These settings require both a password and a separate year subscription on this FTP-service. The administrator function for synchronization with Android devices is accessible in the menu ‘Functions_Managing Syncfolders_’.
FTP synchronization


191
The Cleaning System
System management


System
193
System
1. Introduction
The System menu functions allow to set the working of The Cleaning System and the settings of the different modules for the user. The functions that determine the user settings of the System menu can also be accessed directly via the user options in the respective modules. All these settings and the The Cleaning System options can be found under the System menu and can be divided in following parts.
Users and access rights management;
System, user, and default settings management.
License and database(s) management;
User’s language choice.
System main menu

System
194
2. Users and access rights management
The Cleaning System allows up to five simultaneous users to work together on one single shared customer database. The Cleaning System’s installation and working environment allows to have 40 or 80 users to be connected to the software, but only five users can access the database(s) simultaneously. If The Cleaning System is set as a multi-user system, these users must be known by the software administrator. Setting up users and give them certain access rights is done with the functions: user administration and access levels.
Users of an Android device for the input of quality and hygiene control are not entered in user management, because The Cleaning System is not restricted to a limited number of ‘inspectors’. The settings for the WI-FI synchronization with an Android device can only be done in the quality module.
The function _Useradministration_ opens the screen that contains all users of The Cleaning System: their ID, initials, to which department they belong, their user level, and when they last worked with the software.
Screen users

System
195
A. New users
To set a new user of the software, click on the button _(New) Plus_ or to modify an existing user on the button _Edit_. The screen for a new user will pop up.
It is easier to set first the correct user levels before creating users. If these levels are not set yet, skip the new user step and enter user levels first.
Screen new user
The screen to enter a new user contains the following elements:
User ID: enter here the user’s personnel number; this number is also used when logging in the user at software start-up;
Access level: each user must belong to a certain level in which available modules, rights, and possibilities are managed. These levels are available in the drop-down menu.
Identification the user: user data is set in the fields Name, initials, department, phone, and E-mail.
Access info: the access levels determine per function type which functions are available (modify, read, not accessible) in the software. The administrator can additionally specify these access levels for a user if they differ from the default access level settings.
Save these data when all fields are completed by clicking _OK_ or _Save_.
B. Removing a user
The administrator can remove a user from the software by marking this user in the overview and clicking on the _Remove_ button. This user, however, must be marked as non active..

System
196
C. Changing password
A user password can be changed. First click on the _Password_ button. In the first screen, you will see the current password and in the second a new password is entered and repeated. Then the user has a new password.
Screen changing password
D. Access levels
The functions to manage access levels are accessible via the following screen.
Screen access levels
The Cleaning System allows to set nine user profiles. The administrator is the ninth profile and has as default the highest access levels. The eight other profiles (level 1 to 8) can be completed with up to three ‘guest profiles’ for occasional users.
The level profile of each user is set by three settings per group of functions in the software. These three settings are: full access, limited access – readable, and no access. See illustration settings.
The other restraint indicates whether the user can install new versions of the software online.

System
197
The access rights per function group (arrow 1 in the illustration) in the overview is done by sliding the desired colour code in the bar with three colour codes, so the colour changes (see arrow 2 and 3 in the illustration). The administrator sets the bar vertically up or down by clicking the mouse on the black line below ‘higher colour code’ and to drag this to the relevant profile level to get the desired settings. At each level per software feature, the colour code changes in the full square box.
See illustration procedure.
Screen settings access levels
The settings of ‘guest users’ can only be done by clicking on the field of each guest until the desired colour is set.
E. Denomination access level
Each access level can have an own denomination as to give an administrator a clear overview of the users. These denominations are free to choose by the administrator and can have up to 15 characters.
To enter level names, click on _Level names_ in the access level screen. A window will open in which a name can be entered for each of the twelve levels.

System
198
Screen setting level names
Example of setting access levels
F. Search open sessions
If a user does not exit the software correctly, this user remains connected to the databases of The Cleaning System. When the user restarts the software, it will show a message saying that the user is still connected. The software then says that the ‘lazy user' must be closed and whether other open sessions of the database must be searched. By confirming, the software itself will close all open connections, initiate the right actions in the database, and then give the user access again. This happens automatically when a user logs on with the same password. However, the administrator can initiate this action himself, e.g. at the end of the day. To do this, click on the button _Search open sessions_ in the User management screen. The Cleaning System will ask the administrator if it should search for open sessions and whether these may be closed.

System
199
Searching and closing connected and non-active users
3. System management options
A. System settings management
The system management of The Cleaning System contains a number of functions that apply to all users. Click on the menu function ‘System options’ to open this window.
System options
Updates software: these settings allow the system administrator to determine whether the software connects automatically with the website of Data-Know-How for a new version, and with which frequency. This automatic control can be switched off when for instance the installation is restraint from internet access or when the customer wishes to have the new versions managed by its own services.
Printer settings: indicates whether the printer is controlled by WMF or EMF.
Measurement unit: The Cleaning System can be used in Europe and Anglo-Saxon countries. The settings to have the software work with one of both systems at this site: choice between metric or imperial system.
FTE: set here the number of (work) hours per week the software may follow for the conversion of the number of working hours into the number of fulltime equivalents (FTE).

System
200
B. Digitizer setting
When measuring the building plans, The Cleaning System can also be connected to digitizer. In the menu function Digitizer Settings, the user can arrange the connection and adjustment of a digitizer. To connect a digitizer, the user must enter the active range of the device in mm, allocate the computer’s correct COM port and enter the settings for ‘databits’, baud rate, parity, and recognition of the Stop bit via the manufacturer’s manual. These values completely depend on the device and the manufacturer manual. Each device will also follow a different ‘Protocol and Flow Control’, which can also be entered in The Cleaning System.
Screen digitizer settings
C. Other – Calendar settings
Under the header Other, you will find the calendar settings for all countries where The Cleaning System is available. The calendar settings contain the number of weekdays and official public holidays per calendar year until 2021. The calendar setting is language-sensitive. If the user changes the language selection, it is recommended to check this setting.
D. Denomination of contact types
The default data from the customer database can include five contacts. If desired, the Administrator can enter the function titles of these contacts, so that all the users always link the right contact to the right function. Use this screen to set the desired function titles.

System
201
Screen denomination contact types
E. Denomination of symbol layers in the drawing sheet
Illustrating the building plan using symbols in the areas can be done on specific layers above the drawing, which can be switched on and off whenever required. To keep drawings and internal working consistent, it is useful to give these layers a proper name. In this screen, the user can enter appropriate names for the nine available layers. See illustration.
Screen denomination symbol layers

System
202
F. Denomination ISO-codes
Users who wish to manage input, documents, and process follow-up in The Cleaning System via ISO-codes, can enter in this screen the default codes they esteem necessary.
Screen denomination ISO-codes
G. Denomination furnishing level
When calculation the work time, The Cleaning System takes into account the furnishing level that the user enters for each area. Within the cleaning organization, opinions may differ on the notions 'much' and 'less' furnishing in a space. This screen allows to use consistent terms that are associated with a percentage increase or decrease of furniture in an area, and thus have an impact on the work time. The internal terms can be entered into this screen.

System
203
Denomination furnishing level
H. Runtime settings
The Cleaning System allows to copy a part of or the entire customer file to another file. The user can decide whether the copied file settings are retrieved in the other file, and if values may or may not be overwritten. Never perform this function without prior backup, because The Cleaning System can overwrite the entire target file by copying.
4. Management of user settings
Settings for the functioning of the user database can be done by the users for themselves or they can be set for all users of The Cleaning System. The General settings are set in the menu system _ Default settings_ Default user.
The settings for a specific user are set via the menu function 'User options'. You will find this function under the System main menu, but also separately in the menu bar as not all users have access to the system settings, although they want to manage their own user settings.
The User Options menu function (one user) allows to set a series of settings in The Cleaning System, which are important to the user. These settings apply only to the user and can only be transferred to other users when the function _Make default_ is marked.
Click on this function or button in the menu bar and the (individual) options screen will open up.

System
204
Screen user options
The settings screen does not open with the home screen, but always with the last used screen. The screen always consists of two parts, at the left the settings and at the right the detail elements of these settings.
In the general settings screen, only the colour of e.g. error messages can be set.
A. Text and sorting
The function Text and sorting allows to set the display of building, floor, and area information in the Main data sidebar.
Set display of data in Main data

System
205
By clicking the desired display and way of sorting, the order and/or information in the sidebar will be displayed differently.
B. Timer behaviour
The feature Timer Behaviour allows to determine visualization of the cursor and the help text. This is done by two settings:
Hide time: notifies how long it takes before the cursor and help text appear.
Visibility time: notifies how long the help text of the cursor remains visible.
Test area: in this field, the user can see the result of the settings.
Hints: switch hints in the work screen on or off.
Database Refresh interval: allows the user to set the interval of database synchronization at regular times (0 to 120 sec.). This function must be switched off when the user performs important changes to the database, e.g. drawing work or importing files from Excel.
Screen timer(s) settings

System
206
C. Automation
The ‘Automation, other’ screen allows to arrange different aspects of day-to-day work.
Automation screen
The following elements can be set in this screen:
Creation mode: when the user is working in the building plan, it can be preset whether the drawing mode stops after each drawing or the user keeps on drawing until clicking the ESC key to exit the drawing mode.
Delete elements: sets whether the software immediately accepts the removal of an element, area, and so on, or should ask for confirmation. The latter is certainly recommended when the software is fully set for daily use.
Automatic ID – Automatic door number: when the user creates new areas in the tree structure, the software can create the ID and door number automatically according to a series set by the user. See also the building plan module.
Drag and drop activities: when the user wants to drag areas to another floor, the software can accept this directly or ask for confirmation.
Object method assignment: when a new object (e.g. area) is created, the software can assign or not assign the default methods. This connection is set or rejected here (in that case manual work is required for each new object).

System
207
D. Warnings
The Cleaning System can warn the user in different ways about an error or handling for which confirmation is advisable. These warnings can be set here.
Warnings
E. Customer and building subdivisions
Customer files can be displayed in different ways in the tree structure of the Main data toolbar. The divisions are based on the following optional subdivisions:
Regional subdivision: country, region, and branch;
Customer organization: customer group, customer, and part of customer (e.g. administrative headquarters and regional branches with subdivision in warehouses, technical areas, and shops);
Building organization: building group, the building, and part of a building;
Floor: floor group, floor or part of a floor;
Areas: area group, area or part of an area.
Remark:
Quality and hygiene controls only work on level of customer, building, floor, and areas. These controls do not take into account the organizational structure of other subdivisions.

System
208
Customer and building divisions
To give a customer file another division, e.g. separation between branches and regional administrative headquarters, the user can set an extra level by marking the checkbox next to this level. This extra level is automatically set in the main menu when a new division or extra area is required. See examples in the illustration.
Division with building group and without building group

System
209
F. Time formats
The Cleaning System works throughout the entire software with working hours that are presented in different ways. The main note of time is the unit of centiminutes: one minute is divided into 100 centiminutes. A centiminute is the smallest unit of account. In this screen, the user can set up the display of time in software.
The decimals can be set for: centiminutes, minutes, hours, FTE's (full-time equivalents). It can be preset to always display the number of hours, zero if necessary, and seconds.
Customizing time display
G. CAD – cursor settings
User settings in the drawing module allow to resize the cursor to his or her own preference. When the drawing of an area is finished (closed outline), the user has the option whether or not to draw another element in this area or to directly close the object.
When areas are selected in the tree structure, they can be marked with a dark shade in the plan. Normally, a selected area is only indicated with a dark blue outline.
Cursor settings

System
210
Cursor formats in CAD
Arrow Square Sight Cross
H. Settings in CAD – axes, grid, and support lines
In the drawing sheet of the building plan module, the user has the option to work with the grid (chequered page) and support lines. These settings allow to choose the colour and line type for the options.
Settings axes, grid, and support lines

System
211
I. Frequency symbols
The user can set the frequency symbols independently. The default settings set these symbols for all users. Users themselves choose which abbreviations are used and how symbols are displayed in the documents, abbreviated or full.
Frequency symbols

System
212
J. Work code symbols
The user can set the work code symbols independently. The default settings set these symbols for all users. Users themselves choose which abbreviations are used and how symbols are displayed in the documents.
Work code symbols

System
213
K. Planning symbols
The user can set the planning symbols independently. The default settings set these symbols and colour codes for all users. Users themselves choose which abbreviations are used and how symbols are displayed in the documents. The colour code setting of the work code icons can be set by the user here.
Work code symbols
Planning colour settings
To set a colour code, the user clicks on the colour button at the left of the display and chooses a colour. These colour codes can also be set as default for all users in the menu function Default settings_Default user.

System
214
L. Resetting user settings to default settings
User settings of The Cleaning System can be set individually or as default for all users under Default user. If a user wishes to overwrite his own settings with user default settings, these two function buttons manage the overwriting of own settings. The action is irrevocable.
Resetting to default settings
M. Hints settings
The Cleaning System asks the user to make the connection with the default set each time a new customer is created, and to recalculate the customer file when changes were made to the basic data. The user can preset whether the software gives this warning. To switch hints on or off, the user clicks the boxes next to the setting points.
Hints
N. Log notes settings
The Cleaning System contains a log which is used for reparation of the database and recalculation of the customer file. The way in which this log displays time can be set in this screen.
In the white bar, the user can set the headers for date, time, and name of the user. The codes for this are also mentioned in the description work field and are:
#1: date; #2: time and #3: name of the user.

System
215
5. Management of customer file settings
Settings for the management of the customer database can be entered by the user for one specific customer or they can be defined for all customer files in The Cleaning System. The general settings are set in the menu system _ Default settings_ Default customer.
The settings for a specific customer take place via the menu button 'Customer options'. This function is not under the System main menu, but is kept separately in the menu bar because not all users have access to the system settings of all customer files, but they do want to manage their own customer file.
The menu function Customer options (one customer) allows to set a series of settings of The Cleaning System, which are important to the user.
Click on the button in the menu bar and the screen for (individual) options will open up. This setting only applies to this customer file and can only be transferred to other files when the function button _Make Default_ is marked.
A. General settings
The settings screen does not open with the home screen, but always with the last used screen.
The screen always consists of two parts, at the left the settings and at the right the detail elements of these settings.
Screen customer options – general settings
In the general settings window, some important parameters are set.
Consultant: in the information field, the name of an internal collaborator responsible for the customer file can be entered.

System
216
Current status: the status field allows to allocate an internal status to the customer file.
Folder link: connection with the folder in Windows Explorer, where the files, documents for this customer are managed.
Image folder link: connection with the folder in Windows Explorer, where the images of the customer file are stored. This connection is also displayed at the top left of the work screen of floors and areas.
Alternative level names: a customer file can get another or alternative name or the mentioning that a customer is part of a larger customer file. By checking the control box, these names are used by all documents as alternative for the name in the tree structure of Main data.
Area texts: the drop-down list gives a list of descriptions that can be displayed on the areas of the building plan. The user can also choose the setting to use the door number as primary identification.
Weekly schedule display mode: the work code is visually converted into a weekly schedule and will be displayed in each area if the ‘Default room texts‘ makes mention of this. The display method can be text or icon, and for the active or for all periods. (See illustration.)
Example of settings weekly schedule display mode
Display weekly schedule with icons: active or all periods.
or
Display weekly schedule as work code: active periods.
Example of areas with door number and ID for an active period
B. Connections
In the Connections screen, the customer file is connected to the desired default set and the calendar, and the three periods are set. The software indicates in this screen the number of weeks and months of the year, together with the number of days per period. The allocation of periods is mentioned in the title field with the number of days below.

System
217
C. Adjustments and pers. supplements
In the default set, the user has linked the task sets to the respective tasks and returns. These returns can be adjusted for the customer file per work type and per group of executors appointed to those work types. This adjustment of the return still takes into account return adjustments per area and area group that were entered before.
Adjustment of returns in relation to work type
D. Calculation – return
To calculate the return of all works in a customer file, the user can set an own formula that takes into account all work types for the customer file, and gives the average return for the client. To set this calculation, the user clicks the relevant work types, and enters an extra parameter for the work type as he sees fit.

System
218

System
219
E. Calculation – other
The screen in which the number of periodical works and the interval is set, has become obsolete because of changes in the weekly schedule and the allocation of work. We advise against using this screen.
F. Post clean-up(s)
The Cleaning System allows to set one post clean-up for each task in the normal planning (dx or 2d code in the frequency table). If the user wishes to organize more post clean-ups (e.g. cleaning toilets every two hours), up to eight post clean-ups can be set per period (also called Trim). Those eight post clean-ups get their own description and work code can be set with separate colours at the visualization of the work plans.
The steps to set the post clean-ups are:
Click in the period with the mouse button on the figure before the text line. The number of the active post clean-up turns green
Enter a denomination for the post clean-up
Repeat those steps for each period

System
220
The post clean-ups can be marked in the tab ‘Other’ of the areas.
G. Add.shift – CAD graphics
The settings for text and background colour of the add.shifts are set in this screen. At the basic round and the post clean-ups, the text code of the post clean-up can be preceded by or end with text, brackets, numbers or letters. The background colour of the post clean-up code makes it more visible in the building plan.
H. Plan types
The Cleaning System can be preset with several plan types for different kinds of calculations or for the division of tasks into separate implementation plans. A work organization can be set for a separate morning shift and a separate day shift. While for the different work types, the tasks are organized separately. This higher lever of work structure is included in separate plan types. The denomination is done in this screen.
Indicate how many plan types are required and
give each plan type a distinct name.

System
221
I. Frequency texts
If the user wishes to use a separate code and name for the customer, they can be entered in this screen. These separate frequency texts then apply to the customer file and are limited to the basic frequencies. The extended settings are done in the user settings. See frequency symbols.
Frequency texts customer file

System
222
J. Contact types
If the customer file contains separate contact types, they can be entered in this screen. According to the customer file, these contact types can differ from the default contact types used in the user settings.
Contact types customer file
K. ISO-codes
If a customer file requires separate ISO-codes, they can be entered in this screen. These ISO-codes can differ from the default ISO-codes which are used in the user settings.
ISO-codes customer file

System
223
L. CAD – grid
In the building plan module, a shading function is available to clearly visualize the different information elements. The user can do this setting via this screen, as to set the same values, colours, and shading for all future building plans. These default settings are automatically available in the grid options with a separate indication: a box with colour
code and a light grey sidebar: see example
Screen settings grid per customer file
To create a new grid setting, click on _Plus_. A new ID-box becomes active. Enter the code, set the colour and shading as explained in the building plan module.
M. CAD – gridtype headers
The description text of the different headers that are visible in the GRID menu list can be set separately in this screen (and the following tabs) for the documents of The Cleaning System. The transfer of own settings in the drop-down menus is not implemented yet.

System
224
6. Management of default settings
The system menu contains a separate function for the default settings of the default user and default customer. This refers to 'default settings ' for the user database and the customer database. These settings are the same functions as in the 'User Settings' and the 'Customer settings’, but the 'Default settings' are defined by the system administrator for all users and all customer files.
7. Download
The System menu includes a function for the 'download' of new software versions. This function can be activated by Data-Know-How if the customer of the software wants to install the new versions automatically. Alternatively, a new version is sent via email to the system administrator, who performs the update of the new version.
8. Administration
The System menu contains the function Administration that is linked to the management of the software versions. The subfunction Update System report places after the installation of the new version the new reports in the language folders of the reports of the Report generator. Data-Know-How and its distributors always strive to make new reports maximally available. These reports are not customizable in the language system folder, because they are secured by the software in the language folder.
Contact the distributor for more information about the personal or customized reports.
The subfunction Remote support automatically opens the support page of Data-Know-How for the installation of TeamViewer. Contact your system administrator to see whether your organization's internal network allows this access via the Internet.
The subfunction Repair database initiates the optimization or re-indexation of your system’s user and customer database. Use this function regularly, especially when new items were added or when task sheets were changed.
When starting the Repair function, The Cleaning System will first be closed for all users. After the repair has been completed, the software can be restarted.
Repair database

System
225
First select the desired user database via Windows Explorer using the first button on top of the screen.
Repair process
When the Repair function is completed, The Cleaning System possibly shows a log with the changes. If no changes were made and only a re-indexation took place, The Cleaning System will tell that the Repair is function completed.
End of repair message
9. Language choice
The Cleaning System comes standard with all available languages. To change the language, click the desired language. The Cleaning System will instantly restart and reboot with the chosen language. The available languages are: Danish, Norwegian, Swedish, English, German, Portuguese and Dutch. The Spanish translation of the software is currently being worked on.

System
226
10. System information
The System information function shows which user rights were allocated to the software license, which modules of The Cleaning System were activated for the user, and which are the settings for use of the software.
No functions can be activated in this screen, it is merely informative.
Screen system information