FOREST PRODUCT MARKET DEVELOPMENTS
141
Working Paper: FAO/FPIRS/02 prepared for the World Bank Forest Policy Implementation Review and Strategy FOREST PRODUCT MARKET DEVELOPMENTS THE OUTLOOK FOR FOREST PRODUCT MARKETS TO 2010 AND THE IMPLICATIONS FOR IMPROVING MANAGEMENT OF THE GLOBAL FOREST ESTATE
-
Upload
khangminh22 -
Category
Documents
-
view
1 -
download
0
Transcript of FOREST PRODUCT MARKET DEVELOPMENTS

Working Paper: FAO/FPIRS/02prepared for the World Bank
Forest Policy ImplementationReview and Strategy
FOREST PRODUCT MARKET DEVELOPMENTSTHE OUTLOOK FOR FOREST PRODUCT MARKETS TO 2010 AND THE IMPLICATIONS
FOR IMPROVING MANAGEMENT OF THE GLOBAL FOREST ESTATE


FOREST PRODUCT MARKET DEVELOPMENTS:THE OUTLOOK FOR FOREST PRODUCT MARKETSTO 2010 AND THE IMPLICATIONS FOR IMPROVINGMANAGEMENT OF THE GLOBAL FOREST ESTATE
Adrian WhitemanForestry Officer (Sector Studies)
Christopher BrownFAO Consultant
and
Gary BullFAO Consultant
Forestry Policy and Planning Division, Rome
July 1999

© FAO 1999
The designations employed and the presentation of material in this publication do not implythe expression of any opinion whatsoever on the part of the Food and AgricultureOrganization of the United Nations concerning the legal status of any country, territory, cityor area or of its authorities, or concerning the delimitation of its frontiers or boundaries.
All rights reserved. No part of this publication may be reproduced, stored in a retrieval system, ortransmitted in any form or by any means, electronic, mechanical, photocopying or otherwise,without the prior permission of the copyright owner. Applications for such permission, with astatement of the purpose and extent of the reproduction, should be addressed to the Director,Information Division, Food and Agriculture Organization of the United Nations, Viale delleTerme di Caracalla, 00100 Rome, Italy.
This document has been commissioned as part of the Forest Policy Implementation Reviewand Strategy Development process and is being circulated to encourage thought anddiscussion within the framework of the ongoing Forest Policy Implementation Review andStrategy. It is not a publication of the World Bank Group and the views expressed are thoseof the authors and should not be attributed to the World Bank Group.


FAO Paper for the World Bank Forest Policy Implementation Review and Strategy
_________________________________________________________________________________________Forest product market developments
iii
FOREWORD
There is a considerable amount of knowledge available about the techniques to achievevarious dimensions of sustainable forest management. Thus, although there is someuncertainty about the precise effects of forest management over the long-term, it is generallybelieved that enough is known to manage forests on a more sustainable basis. However, it isalso estimated that a significant proportion of the world's forests is not managed in a way thatcould be described as sustainable. The questions facing forestry policymakers around theworld therefore, are: why is this the case and what actions would encourage the widerimplementation of sustainable forest management practices?
It is against this background, that this working paper has been prepared as part of an FAOinput to the World Bank Forest Policy Implementation Review and Strategy. The paperdiscusses the future market conditions that may have an impact on the development ofsustainable forest management and describes the implications of these for future action bygovernments, FAO, the World Bank and other international agencies to support itsimplementation.
The first part of the report describes broad global trends in supply and demand and then theanalysis focuses on the likely future developments in markets by region and forest product.Part two of the report describes some of the implications of these trends for the managementof forest resources then examines important issues in forest product processing, marketingand trade.
Some specific topics covered in the report include: the future availability of forest resources;future land-use changes (in terms of both expansion of agricultural land and reservation ofnatural forest areas); the development of forest plantations and other non-forest resourcessuch as trees outside of forests; trends in technology; the impact of globalisation on forestproducts markets and forest management; the importance of issues such as forestcertification; and the impact of sustainable forest management prescriptions on futurepotential wood and fibre supply.
A number of background papers have been prepared on some of the specific topics covered inthis report. Papers on technological developments were produced by experts from the USForest Service Forest Products Laboratory in Madison, Wisconsin, the Forest ResearchInstitute of Malaysia in Kuala Lumpur and FAO's Wood and Non-wood Products UtilizationBranch. A separate forest plantations study has been produced by one of this reports authorsand a study of future wood fuel supply and demand is currently being produced. These reportswill be issued separately as part of the FAO Global Forest Products Outlook Study workingpaper series.
The main forest products supply and demand projections used in this report were produced bythe University of Wisconsin at Madison and future fibre availability was assessed usingFAO's Global Fibre Supply Model. Draft versions of this report have also been reviewed by anumber of external experts in this field, including: J Ball; A Baudin; J Bourke; D Boulter;D Brooks; and A Contreras.
FAO would like to express its gratitude to all the contributors to this paper and to thankeveryone that has provided comments on earlier drafts of this work. FAO will continue to

A Whiteman, C Brown and G Bull
_________________________________________________________________________________________Forest product market developments
iv
explore, with member countries, the ways in which sustainable forest management can beimplemented with greater success and to assist with implementation through its technical andnormative work programmes. In this respect, we would welcome comments on all aspects ofthis study from readers.
Lennart LjungmanDirector
Forestry Policy and Planning Division

FAO Paper for the World Bank Forest Policy Implementation Review and Strategy
_________________________________________________________________________________________Forest product market developments
v
TABLE OF CONTENTS
FOREWORD...................................................................................................................................................... III
LIST OF ACRONYMS AND ABBREVIATIONS.......................................................................................... IX
USED IN THE REPORT................................................................................................................................... IX
EXECUTIVE SUMMARY................................................................................................................................ XI
1. INTRODUCTION .......................................................................................................................................1
Part 1: the future global supply and demandfor wood and wood products
2. FACTORS INFLUENCING THE SUPPLY AND DEMANDFOR WOOD AND WOOD PRODUCTS..........................................................................................5
2.1 Factors driving the demand for wood and wood products ........................................................................52.1.1 Population growth...........................................................................................................................52.1.2 Income growth.................................................................................................................................62.1.3 Other impacts of population and income growth............................................................................7
2.2 Factors likely to affect the supply of wood and other fibre.......................................................................72.2.1 Changes to natural forest management regimes .............................................................................82.2.2 Forest loss .......................................................................................................................................82.2.3 Forest change..................................................................................................................................82.2.4 Afforestation rate and development gains in industrial forest plantations .....................................92.2.5 Development of non-wood and recovered fibre supplies ..............................................................10
2.3 Synthesis: major issues surrounding future supply and demand drivers .................................................12
3. GLOBAL SUPPLY AND DEMAND ANALYSIS ..................................................................................13
3.1 Global supply and demand at a glance....................................................................................................133.2 Supply and demand for industrial wood and wood products by region ..................................................14
3.2.1 Current supply and demand by geographical region....................................................................153.2.2 Growth in supply and demand by region ......................................................................................163.2.3 The distribution of wood processing by region .............................................................................17
3.3 Supply and demand for industrial forest products by product category..................................................183.4 Trade in industrial forest products ..........................................................................................................193.5 The supply and demand for wood fuel....................................................................................................21
3.5.1 Projections of wood fuel demand ..................................................................................................223.5.2 Sources of wood fuel supply..........................................................................................................22
3.6 Comparison of roundwood supply with supply potential........................................................................233.7 Overall synthesis of the baseline projections ..........................................................................................28
4. MAIN GLOBAL MARKET POTENTIALS...........................................................................................29
4.1 Industrial roundwood production and consumption................................................................................294.2 Sawnwood production and consumption ................................................................................................324.3 Wood-based panel production and consumption ....................................................................................334.4 Pulp production and consumption...........................................................................................................364.5 Paper production and consumption.........................................................................................................374.6 Major bilateral trade flows......................................................................................................................39
4.6.1 Current trade flows by product and region...................................................................................404.6.1 Possible future trade flows in 2010...............................................................................................41
4.7 Overall synthesis of the main global market potentials...........................................................................43

A Whiteman, C Brown and G Bull
_________________________________________________________________________________________Forest product market developments
vi
Part 2: implications of thesupply and demand projections
5. MAJOR DRIVING FORCES AND CHALLENGES FOR THE FUTURE.........................................47
5.1 Main market developments.....................................................................................................................475.2 Main challenges for the future ................................................................................................................48
6. THE FUTURE AVAILABILITY AND MANAGEMENT OF FOREST RESOURCES FORWOOD PRODUCTION ....................................................................................................................51
6.1 Deforestation and competing demands for forest land............................................................................516.1.1 Deforestation: a brief overview.....................................................................................................516.1.2 The demand for conversion of forests to agricultural land...........................................................526.1.3 The placement of forest into legally protected areas ....................................................................54
6.2 The development of forest plantation resources .....................................................................................566.2.1 Estimated current wood supply from forest plantations................................................................576.2.2 Factors affecting the future supply of wood from forest plantations ............................................586.2.3 Future likely rates of plantation establishment .............................................................................59
6.3 The potential for increasing future wood supplies from trees outside of forests.....................................606.3.1 What are trees outside of forests? .................................................................................................616.3.2 What is the extent of the resource? ...............................................................................................616.3.3 The potential to increase wood supplies from trees outside of forests ..........................................63
6.4 The impact of Sustainable Forest Management on future wood supply..................................................646.4.1 A brief explanation of Sustainable Forest Management ...............................................................646.4.2 The implications of Sustainable Forest Management for future wood supply ..............................65
6.5 Synthesis: implications of future changes in forest resource availability and management for futurewood production.............................................................................................................................67
6.5.1 The effect of forest land-use changes on future potential supply ..................................................676.5.2 Future supply from plantations and trees outside of forests .........................................................696.5.3 Changes in wood supply with the implementation of SFM ...........................................................72
7. THE FUTURE FOR FOREST PRODUCT PROCESSING, MARKETING AND TRADE .............75
7.1 The impact of technology changes on the derived demand for wood and fibre ......................................757.1.1 Technology changes in paper and paperboard production ..........................................................767.1.2 Solid wood product production in developed countries................................................................797.1.3 Solid wood product production in developing countries...............................................................83
7.2 The impact of globalisation on future supply and demand .....................................................................847.2.1 Trade liberalisation.......................................................................................................................847.2.2 Foreign investment in the forestry sector......................................................................................867.2.3 Globalisation of environmental advocacy and concern................................................................87
7.3 The outlook for forest certification .........................................................................................................887.3.1 The growth of certification............................................................................................................897.3.2 The costs and benefits of certification...........................................................................................927.3.3 Future challenges for forest certification......................................................................................93
7.4 Synthesis: the impact of future technology changes, globalisation and certification on the markets forforest products ................................................................................................................................94
7.4.1 The effect of technology changes on future supply and demand...................................................957.4.2 The effect of globalisation and certification on future forest products markets............................96

FAO Paper for the World Bank Forest Policy Implementation Review and Strategy
_________________________________________________________________________________________Forest product market developments
vii
8. CONCLUSIONS........................................................................................................................................97
8.1 Poverty alleviation ..................................................................................................................................978.2 Sustainable development ......................................................................................................................1008.3 Private-sector development...................................................................................................................1028.4 Common themes ...................................................................................................................................103
8.4.1 Information..................................................................................................................................1038.4.2 Pricing.........................................................................................................................................1048.4.3 Human resource development.....................................................................................................1048.4.4 Industrial restructuring ...............................................................................................................1058.4.5 Institutional development ............................................................................................................105
REFERENCES..................................................................................................................................................107
ANNEX 1: PROJECTIONS OF WOOD FUEL CONSUMPTION ..........................................................111
ANNEX 2: SUPPLY AND DEMAND PROJECTIONS BY WORLD BANK OPERATIONALREGIONS....................................................................................................................................113
LIST OF TABLES
Table 1: World population in 1995 and projection for 2010 (medium fertility variant) ...................................6Table 2: World GDP in 1995 and projection for 2010......................................................................................7Table 3: Estimated annual rate of afforestation in selected countries ..............................................................9Table 4: Global non-wood fibre papermaking capacity.................................................................................10Table 5: Global wastepaper recovery in 1995 ................................................................................................11
Table 6: Expected growth in production and consumption over the period 1995 to 2010..............................16Table 7: Industrial roundwood and forest product production by region in 1996 and 2010..........................17Table 8: Production and consumption by product category in 1995 and 2010 ..............................................18Table 9: Forest products trade as a proportion of production in 1995...........................................................19Table 10: Direction of global trade in forest products in 1995 (value in US$ billions)....................................20
Table 11: Forecast production of wood and fibre from forests, recovered and non-wood fibre sourcescompared with estimated potential production in 2010 ....................................................................27
Table 12: Current and projected industrial roundwood production and consumption by region and country 31Table 13: Current and projected sawnwood production and consumption by region and country ..................33Table 14: Current and projected wood-based panel production and consumption by region and country ......35Table 15: Current and projected pulp production and consumption by region and country ............................37
Table 16: Current and projected paper production and consumption by region and country..........................39Table 17: Annual change in forest area by region estimated in 1995 ...............................................................51Table 18: Global area of forest and forest in protected area estimated in 1996...............................................55Table 19: Forest area in protected areas in 1997 and amount required to meet a 10% target ........................56Table 20: The estimated global distribution of forest plantation resources in 1995 .........................................56
Table 21: Industrial forest plantation areas in 2050 under three new planting scenarios ...............................60Table 21: Forest, other wooded land and agricultural tree crop area..............................................................62Table 22: Area of forest and trees from homesteads contributing to wood supply in Bangladesh ...................62Table 23: The effect on potential future wood supply of achieving a minimum of 10% forest in
protected areas by the year 2010 ......................................................................................................68Table 25: Current and projected wood production from homesteads and other non-forest tree
resources in Sri Lanka (in thousand m3) ...........................................................................................71

A Whiteman, C Brown and G Bull
_________________________________________________________________________________________Forest product market developments
viii
Table 26: Current and projected wood production from trees outside of forests inthe Asia-Pacific region (in million m3)..............................................................................................71
Table 27: Summary of the findings of recent studies into the production cost and volumeimplications of implementing SFM around the world .......................................................................72
Table 28: Timber buyers groups operating in 1998 ..........................................................................................92Table 29: Countries where forest products exports had a share of total merchandise exports
greater than 10% in 1995 .................................................................................................................98Table 30: Current probable levels of wood and fibre production from various sources
and the potential for alleviating poverty by increasing supply from these sources ..........................99
Table 31: Estimated wood fuel consumption in 1996 and projections for 2010,by World Bank operational region ..................................................................................................111
Table 32: Industrial roundwood - current and projected supply and demandby World Bank operational region ..................................................................................................113
Table 33: Sawnwood - current and projected supply and demand by World Bank operational region..........114Table 34: Wood based panel - current and projected supply and demand
by World Bank operational region ..................................................................................................115Table 35: Pulp - current and projected supply and demand by World Bank operational region ...................116
Table 36: Paper and paperboard - current and projected supply and demandby World Bank operational region ..................................................................................................117
LIST OF BOXES
Box 1: Factors most likely to affect future wood and other fibre supplies .....................................................8Box 2: The impact of the recent economic downturn in Asia on
the supply and demand projections to 2010 ......................................................................................20Box 3: A brief description of the supply and demand models used by FAO in recent outlook studies..........24Box 4: The range of potential wood and fibre supplies in the Asia-Pacific region ......................................26Box 5: Typical contrasts between Sustainable Forest Management and sustained yield .............................65
Box 6: The difference between different types of forest certification scheme ...............................................89Box 7: Seven nails in the coffin of certification?..........................................................................................91
LIST OF FIGURES
Figure 1: Trend in the utilisation of pulp in the manufacture of paper ............................................................11Figure 2: Industrial roundwood supply and forest product demand - 1996 and 2010 .....................................13Figure 3: Global industrial roundwood production and forest product consumption in 1996
and the forecast for 2010 ..................................................................................................................14Figure 4: Wood fuel consumption in 1996 and projection for 2010 .................................................................21Figure 5: Growth in the global area of legally protected areas 1900 - 1994 ...................................................54
Figure 6: Estimated production of wood from forest plantations as a percentage of total woodproduction in 1995 ............................................................................................................................58
Figure 7: Three forecasts of future potential industrial roundwood production from forest plantations .........70Figure 8: Production of coniferous and non-coniferous pulpwood 1961 - 1997..............................................78Figure 9: New product developments in the markets for solidwood products in
the United States of America since 1950 ...........................................................................................80Figure 10: Projected and actual product recovery in sawmills and plywood mills in
the Western United States of America 1968 - 1992...........................................................................82
Figure 11: Area of forest certified by FSC-accredited certification bodies ........................................................90

FAO Paper for the World Bank Forest Policy Implementation Review and Strategy
_________________________________________________________________________________________Forest product market developments
ix
LIST OF ACRONYMS AND ABBREVIATIONSUSED IN THE REPORT
AAC Annual allowable cut - the amount of timber which may be cut in agiven period, usually determined by considerations of standing volumeof growing stock, rate of growth and forest condition.
APEC Asia-Pacific Economic Co-operation forumASEAN Association of Southeast Asian NationsAPFSOS Asia-Pacific Forestry Sector Outlook Study (FAO, 1998)
CARICOM Caribbean CommunityCIFOR Center for International Forestry Research
ETTS V The Fifth European Timber Trends Study (UN, 1996a)EQ (m3 EQ) Cubic metres of roundwood equivalent - i.e. the volume of roundwood
required to produce a specific volume or weight of forest productsEU European UnionExp Exports
FAO Food and Agriculture Organisation of the United NationsFRA (FRA 90) Forest Resource Assessment (the 1990 Forest Resource Assessment) - a
periodic assessment of the area and condition of the world's forestscarried-out by FAO (see, for example: FAO, 1995).
FSC Forest Stewardship Council
GDP Gross Domestic ProductGFPM Global Forest Products Model (see: Tomberlin et al, 1999)GFPOS Global Forest Products Outlook Study (see: Whiteman, in prep)GFSM Global Fibre Supply Model (see: FAO, 1999a)
HRD Human resources development
IRR Internal rate of return - the percentage rate of return given by aninvestment during its life
IRW Industrial roundwood (roundwood used for purposes other than as asource of energy)
MERCOSUR Mercado Comun del Sur or "Common Market of the South"mt or MT Metric tonnes
NAFTA North American Free Trade AgreementNATTS North American Timber Trends Study (UN, 1996b)NGOs Non-governmental organisations
OECD Organisation of Economic Co-operation and DevelopmentOSB Oriented strandboard

A Whiteman, C Brown and G Bull
_________________________________________________________________________________________Forest product market developments
x
LIST OF ACRONYMS AND ABBREVIATIONSUSED IN THE REPORT (CONTINUED)
Prod Production
SFM Sustainable forest managementSME Small and medium-sized enterprises
UN United NationsUNECE United Nations Economic Commission for Europe
WCMC World Conservation Monitoring CentreWTO World Trade OrganisationWTP Willingness to payWWF World Wildlife Fund

FAO Paper for the World Bank Forest Policy Implementation Review and Strategy
_________________________________________________________________________________________Forest product market developments
xi
FUTURE DEVELOPMENTS IN FOREST PRODUCTS MARKETS
EXECUTIVE SUMMARY
This paper has been prepared by staff from the Forestry Department of the Food andAgriculture Organisation of the United Nations, for the World Bank Forest PolicyImplementation Review and Strategy. The paper is in two parts. The first part presentsprojections of wood and wood product supply and demand to the year 2010. The second partof the paper discusses emerging developments in the availability and management of forestresources and in forest products processing and trade, which have the potential to affect forestproducts markets in the future. The paper concludes by discussing areas where the WorldBank could justify involvement in the forestry sector on the basis of the sector's linkages to itskey policy objectives of poverty alleviation, environmentally sustainable development andprivate sector development.
Global supply and demand for industrial roundwood and wood products
The first point worth noting about global supply and demand is the dominance of developedcountries in world timber markets, both in terms of production and consumption. Total globalproduction of industrial roundwood is currently around 1.5 billion m3/year. Around 62% ofthis industrial roundwood is produced in developed countries1 which, incidentally, containless than 20% of the world's forest resources. In terms of consumption, developed countriesaccount for an even greater share of world markets, accounting for over 65% of industrialroundwood consumption and between 70% and 75% of wood product consumption.
The difference between industrial roundwood production and wood product consumption isbalanced by a net trade flow of industrial roundwood and wood products from developing todeveloped countries. This flow is equal to about 70 million m3/year of roundwood. Generally,most international trade takes the form of trade in wood products, but 70% of the net tradefrom developing to developed countries (or 50 million m3/year) is in the form of industrialroundwood.
By 2010, total global production and consumption of industrial roundwood is expected toreach around 1.9 billion m3 or roughly 25% higher than in 1996. The dominance of developedcountries in global forest products markets is not expected to change by very much. However,the developed country share of industrial roundwood production is expected to fall slightly to58%. The total share of global consumption held by developed countries is also expected tofall to 62% of industrial roundwood and 65% to 75% of wood products markets. The onlywood product market where the developed country share of total consumption is not expectedto fall significantly is the market for paper and paperboard. The net trade flow fromdeveloping to developed countries is expected to increase slightly to about100 million m3/year.
1 For the purpose of this analysis, "developed countries" has been defined as countries which are
members of the OECD. This includes all the countries of Western Europe and North America, plus:Japan; Australia; New Zealand; Mexico; Republic of Korea; Poland; and Czech Republic.

A Whiteman, C Brown and G Bull
_________________________________________________________________________________________Forest product market developments
xii
In terms of individual product markets, the highest rate of growth over the period to 2010 isexpected to occur in the market for paper and paperboard, which is projected to increase byjust under 40%. Consumption of wood-based panels will be the next fastest growing sector,with a total expected increase in consumption of 20% by 2010. In contrast, globalconsumption of sawnwood and pulp is expected to increase by only 17% and 16%respectively.
The difference between the high rate of growth in paper consumption and relatively low rateof growth in pulp consumption will be filled by the increased use of recycled paper in thetotal fibre furnish in the future. From 1970 to 1995, the share of the total fibre furnishaccounted for by pulp declined from over 80% to around 65%. A large part of this decline canbe attributed to the increased use of recycled paper. By 2010, it is expected that pulp willaccount for just under 50% of the total fibre furnish.
The outlook for future roundwood requirements and availability
In order to meet future demands for wood products, it is expected that total industrialroundwood production will have to increase by around 25%. This is slightly higher than theaverage expected increase in product demand and reflects the fact that developing countriesare expected to gain a greater share of forest product production in the future and theirindustries generally use wood less efficiently (i.e. they require more wood input per unit ofwood product output than in developed countries).
The supply and demand analysis has shown that this increase in global wood production canbe achieved without significant upward pressure on prices. In other words, it is believed thatglobal industrial roundwood and fibre supplies will expand to meet the increased demandwithout too much difficulty. However, there will be some changes in the relative abundanceof all the different types of wood and fibre available in the future. It is anticipated that sometypes of wood, for example large high quality logs from the natural forest, will become morescarce, while other material such as recycled fibre and smaller pieces of roundwood from fast-growing plantations will become more abundant. It is also anticipated that, although at theglobal level supplies will be adequate, scarcity may become a problem in some regions.
Statistics about wood fuel use are currently highly unreliable and many are best estimatesmade by organisations such as FAO, based on what little data is available in individualcountries. However, it is believed that the use of wood for fuel is currently the largest use ofroundwood around the world and that global consumption might be in the order of around1.8 billion m3/year (or roughly 20% higher than industrial roundwood use). Wood fuelconsumption is projected to increase by 25% over the period to 2010 to about2.2 billion m3/year. Most of this increase in demand is expected to occur in developingcountries. In contrast, developed country consumption of wood fuel is expected to declineover the period.
The supply and demand analysis has also made a preliminary attempt to try to examinewhether the future world's wood requirements will be broadly within the biological capacityof the world's forest resources to supply them. This analysis has indicated that futureindustrial roundwood needs are probably within the biological production potential of theworld's forests under expected future changes in the areas which will be available for wood

FAO Paper for the World Bank Forest Policy Implementation Review and Strategy
_________________________________________________________________________________________Forest product market developments
xiii
supply. It must be stressed however, that these calculations are subject to a great deal ofuncertainty and that there are regions, such as Africa and Asia, where future demands maycome close to or even exceed the sustainable level of production potential. In terms of woodfuel production, an important point to note is that a vast proportion of the world's wood fuelneeds are believed to be met from non-forest sources (e.g. trees outside of forests), deadwoodand branches. In as much as this harvesting does not have a significant negative impact onforest resources, it is believed that wood fuel collection is not a major cause of deforestationexcept in some localised areas.
The regional supply and demand picture
Given the dominance of developed countries in global forest products markets, another aim ofthis study has been to highlight the main implications of the future for forest productsmarkets, for developing countries. Four developing country regions have been used in thisstudy: non-OECD countries in Europe (including the Russian Federation); Africa; non-OECDcountries in South and Central America; and non-OECD countries in Asia and Oceania. Thesize of forest product markets and future expected market developments in each of theseregions are briefly summarised below.
At the global scale, forest products markets in developing countries account for around 40%of the total global market for wood and wood products. The largest developing region is Asiaand Oceania, which has a forest products market just slightly smaller than Western Europe's(around 15% to 20% for most products). By 2010, production and consumption in this regionare expected to grow by around 50% and 35% respectively, making this market slightlybigger than that of Western Europe.
Non-OECD countries in South and Central America are the next largest developing regionmarket, accounting for about 7% to 10% of the global market for industrial roundwood andsawnwood. A slightly smaller share of the global market for these products is held by non-OECD countries in Europe. The shares of the global market for these products held by thesetwo regions is expected to increase very slightly by 2010. The non-OECD countries in Europeregion is also expected to grow to a slightly larger size than the non-OECD countries in Southand Central America region. Both of these regions hold very small shares of the globalmarkets for pulp and paper production and consumption and this situation is not expected tochange by very much.
Africa is the least significant producer of wood and wood products, accounting for only 4% to5% of global industrial roundwood production and consumption and 1% to 3% of productionand consumption of wood products. Furthermore, within Africa, by far the greatest share ofthe continent's wood and wood product production and consumption is held by South Africa.However, the forestry sector makes important contributions to gross domestic product andexports in many African countries. For example, exports of forest products account for morethan 10% of merchandise exports in nine African countries and account for a much greatershare of trade in several of these. If the importance on non-wood forest products is taken intoaccount, then the importance of the forestry sector in Africa is even greater.

A Whiteman, C Brown and G Bull
_________________________________________________________________________________________Forest product market developments
xiv
Trade and the developing regions
Three of the developing regions are net exporters of forest products. Net exports account forabout one-third of production in non-OECD Europe and non-OECD South and CentralAmerica. Developing countries in Asia and Oceania are small net exporters on balance. Thisregion has some large exporters of forest products (e.g. Indonesia and Malaysia) but also hassome very large importers of forest products (e.g. China and Thailand). Africa is a majorexporter of industrial roundwood, but is a net importing region overall, when its imports ofwood products are taken into account.
Wood products exported from the developing regions tend to be relatively low-value productssuch as industrial roundwood, sawnwood and, to a lesser extent, wood-based panels(e.g. plywood from Indonesia). Exports of pulp and paper are also significant in a fewcountries in South America.
Production and consumption in all four developing regions are expected to grow faster than inthe developed regions. Production is expected to grow fastest in non-OECD Europe, followedby non-OECD Asia and Oceania, Africa and non-OECD South and Central America.Consumption is expected to grow at similar rates to production in all of these regions exceptAfrica, where very little consumption growth is foreseen. The net effect of this will be thattwo of the three net exporting developing regions, Europe and South and Central America,will continue to export roughly the same amounts in 2010 as they do today. Non-OECD Asiaand Oceania will become a small net importer and Africa will remain a small net importer.
The three biggest inter-regional trade flows of forest products are as follows: North Americato Europe; North America to Asia and Oceania; and Europe to Asia and Oceania. Developedcountries within these regions account for most of these trade flows. However, in Asia andOceania, a large proportion of the imports into the region are accounted for by imports intoboth China and Japan. In terms of the developing country exporters, South American andSoutheast Asian countries are major exporters to Japan. South American countries also exportsome products to North America. The volume of exports of forest products from Africancountries is tiny in comparison to this trade (although, as noted above this trade is veryimportant to some of these countries).
Changes in the future availability of forest resources for wood production
Three broad changes in the availability of forest resources affect future wood supplies. Firstly,there are changes in the overall area of the world's forests due to deforestation and theestablishment of forest plantations. Secondly, as forest harvesting proceeds, new areas ofpreviously undisturbed natural forest are opened-up for future harvesting and existingundisturbed areas are harvested. The latter generally results in a reduction in the standingstock of commercial timber species and a reduction in the long-run potential supply fromsuch areas in the future. The third change which takes place is that some areas of forest aretaken out of production for environmental reasons either through logging bans or theplacement of forest into legally protected areas such as national parks.
The projections of supply and demand summarised earlier have already taken most of thesefactors into account. For example, the industrial roundwood supply projections were made

FAO Paper for the World Bank Forest Policy Implementation Review and Strategy
_________________________________________________________________________________________Forest product market developments
xv
assuming that deforestation will continue in the future at much the same rate as it has in thepast. It has also been assumed that the expansion of forest harvesting into new areas of forestwill continue to follow past trends and that new plantation establishment will continue atcurrent rates. However, three of the most important components of this changing pattern offorest land-use have been examined in greater detail in this analysis: the future demand foragricultural land; the future placement of forests into legally protected areas; and the potentialfuture supply of wood from plantations and trees outside of forests.
Current estimates of the future demand for agricultural land suggest that about 90 million haof land might be required for conversion to agriculture by the year 2010. The 1990 ForestResource Assessment suggests that around 65 million ha of this might come from forests overthe period 1995 - 2010, if past forest land-use changes are repeated in the future. This is lessthan one-half of the deforestation estimate already built into the forecasts of future woodsupply presented earlier. Therefore, unless the future demand for conversion of forest land toagriculture is significantly higher than expected, this should have already been taken intoaccount in these projections.
The baseline projections of future wood supply presented earlier have assumed that the areaof forest in legally protected areas will not change over the forecast period. Undoubtedly therewill be more areas of forest put into legally protected areas so, as a sensitivity analysis, thisanalysis has examined what would be the impact of increasing the global area of forests inprotected areas to 10% of the total forest area. The results of this analysis depend on the typesof forest that are put into legally protected areas. If areas that are currently unavailable forwood supply (for technical or economic reasons) are put into legally protected areas, thiswould have almost no effect on the future supply projection (i.e. there is a sufficient areaalready excluded from production in the model in most regions, to meet the 10% target).However, if some areas currently used for wood supply were also to be put into legallyprotected areas, this would reduce the global potential wood supply by around 6%. Potentialwood supply would still be sufficient to meet future demand needs at a global level, but sucha move would put increasing pressure on future wood supplies in Asia, Africa and SouthAmerica.
As noted above, the baseline supply forecast has already taken into account the expectedpotential increase in production from forest plantations in the future. It has not however,taken any account of the potential contribution of trees outside of forests to future woodsupplies. Forest plantations currently account for about 13% of global wood supplies (26% ofindustrial roundwood production and 4% of wood fuel production). In some regions,plantations are a particularly important source of supply. For example, up to 80% of woodsupplies in Oceania may come from forest plantations. By 2010, the potential supply of woodfrom plantations is expected to increase by almost 60% to 630 million m3/year. Globally, thiscould account for about 27% of future industrial roundwood and fibre requirements.
Trees outside of forests are a resource about which very little is known. However, they arebelieved to have tremendous potential for future wood supply. They are already veryimportant sources of wood supply in South Asian countries, which have relatively smallforest resources. For example, India is the world's third largest producer of roundwood, muchof which is believed to come from trees outside of forests. Trees outside of forests are alsobelieved to supply about 60% of Bangladesh's wood needs. The baseline projections of supplyand demand have not included any specific forecasts for future supplies from trees outside of

A Whiteman, C Brown and G Bull
_________________________________________________________________________________________Forest product market developments
xvi
forests, but it is believed that this resource will play a greater role in future wood supplies asmore restrictions are placed on harvesting in the natural forest.
The impact of sustainable forest management on future wood supply
Of all the possible changes in the way forest resources are managed in the future, changes inforest harvesting practices as a result of the implementation of sustainable forest management(SFM) have the greatest potential to diminish future wood supplies. A literature review ofseveral case studies from around the world suggest that harvesting volumes might be reducedby up to 20% to 60% in tropical regions (generally less in temperate and boreal regions) withthe introduction of more sustainable harvesting practices. The same studies also indicate thatproduction costs could rise by 5% to 25%.
It is not known however, whether the results of these studies are generally applicable to thewide range of different types of forest present in the world. Certainly, if they are, they wouldsuggest that there could be scarcity in future wood supply in many regions in the future.Perhaps the most significant implication of these figures is that they cast doubt on whetherSFM will be widely implemented in the long-run. Given the potential impacts on costs andharvesting volumes described above, the implementation of SFM will present a significantchallenge to many forest policymakers in both developing and developed countries.
Future technological change
One way in which future demand for wood can be more easily reconciled with supply isthrough greater efficiency in the use of wood. Historically, the wood processing industry indeveloped countries has continually improved product recovery rates through improvementsin processing technology and the development of products which can use residues, recycledmaterials and non-wood fibres. New processes have also been developed to utilise formerlynon-commercial species and take advantage of new sources of supply such as fast-growingplantation species.
Technology has generally advanced by less in most developing countries, where it has beentraditionally cheaper to extend harvesting into new areas of natural forest rather than useexisting resources more efficiently. The one exception to this is the development of therubberwood processing sector in Southeast Asia which has developed to take advantage of theabundance of this resource.
The baseline projections of supply and demand presented in this analysis have not assumedany changes in technology in the future except for an increasing use of recycled fibre in thetotal fibre furnish for papermaking. However, a sensitivity analysis of future potential gainsfrom technological improvements has suggested that maybe up to 70% of future demandgrowth in the solidwood products sector in developed countries could be met byimprovements in processing efficiency. The potential for improvements in developingcountries is currently unknown but is believed to be even greater than this.

FAO Paper for the World Bank Forest Policy Implementation Review and Strategy
_________________________________________________________________________________________Forest product market developments
xvii
Globalisation and forest certification
Two final aspects of the future outlook for forest products markets, which have beenexamined in greater detail in this analysis, are: the potential impacts of greater globalisationon forest products markets; and the potential for forest certification to affect future markets.
Three aspects of globalisation are believed to have the most potential to affect future forestproducts markets. Firstly, it is believed that trade liberalisation will continue to stimulateforest products trade to the benefit of all countries. Trade liberalisation will help all countriesto continue their drive to export higher value-added wood products and may be particularlybeneficial to developing countries in this respect. It may also however, reduce some of theprotection given to domestic industries in some developing countries, causing them todownsize or increase the efficiency of their industries in some other way.
The second impact of globalisation will be that it should support the continued developmentof forest management and processing facilities in developing countries through increasedforeign investment and transfer of skills and technology. Foreign direct investment has playedan important role in the development of the forestry sector in many developing countries, butthe benefits of such development have not always been distributed very fairly. There willcontinue to be a strong demand for foreign investment in the forestry sector in manydeveloping countries and forestry policymakers in these countries should consider how theycan achieve an appropriate transfer of skills and technology to help them with their long-termdevelopment plans.
The third expected trend in globalisation is the continued globalisation of environmentaladvocacy and concern. International non-governmental organisations (NGOs) have increasedtheir interest in forestry issues over the last decade and are now a major force in internationalforestry policy discussions. Their most recent significant contribution to this debate has beenthe development and promotion of forest certification in the markets for forest products indeveloped countries. It can be expected that they will continue to attempt to influence forestrypolicymaking through moves such as this.
However, the outlook for forest certification is currently uncertain. As noted above, theimplementation of SFM may prove to be rather expensive and what little evidence isavailable to date suggests that consumers are not currently willing to pay significantly morefor certified forest products. It seems likely therefore, that the market for certified forestproducts is only ever going to account for a relatively small share of the total wood market.
Implications for future action
The final part of this analysis has examined the implications of the future supply and demandoutlook for future involvement in the forestry sector by the World Bank and others. It hasconcluded that there are five main areas where involvement may be justified on the groundsof the forestry sector's linkages to the World Bank's key objectives of poverty alleviation,sustainable development and private-sector development. These are briefly outlined below.
Information. The supply and demand analysis has shown that there is a continuing need forbetter information about the forestry sector in many developing countries. Given the desire to

A Whiteman, C Brown and G Bull
_________________________________________________________________________________________Forest product market developments
xviii
implement SFM in many countries, this information need is even greater. The World Bankand others should consider what role they should play in supporting this process as part oftheir strategies to support sustainable development more generally.
Pricing. Many of the desirable changes discussed in this report, such as the implementationof SFM and greater efficiency in wood use, require that the correct price signals are given toforestry concessionaires and industrial wood users. However, there are many examples ofcountries where the stumpage price of roundwood has been set artificially low in order tostimulate the development of domestic processing industries. The World Bank and othersshould continue to encourage countries to improve their forest revenue collection systems onthe grounds of greater economic efficiency and in order to improve the sustainability of theirforest industry developments. To some extent, countries could also be encouraged to usesome of this money to improve the effectiveness of their forestry administrations to monitorand control forest operations.
Human resource development. Many of the issues discussed in this report have tremendousimplications for human resource development (HRD). Policies to implement SFM and thegeneral level of industry restructuring towards more technologically complex productionprocesses expected in the future, will all have to be supported by a significant and prolongedprogramme of HRD in many developing countries. The upgrading of human resources in theforestry sector in many countries will require a substantial amount of funding and technicalassistance. The World Bank and others should consider the best way in which theseinvestment needs can be met on a sustainable basis in the long-run.
Industrial restructuring. The supply and demand outlook has suggested that there will be asignificant need for industrial restructuring. At a policy level, the World Bank, FAO andothers should consider how they can best help countries to re-align their industrial policies totake into account the expected future changes in wood availability and forest productsmarkets. Such changes will have cross-sectoral implications, so the World Bank can also playa useful role by trying to influence the relevant parts of government administrations outside ofthe forestry sector (e.g. industry, energy and planning ministries) where appropriate.
Institutional development. Many forestry administrations in developing countries haveevolved to fulfil fairly limited roles. Mostly they have largely taken on the tasks of planning,encouraging or developing, then monitoring, roundwood production from the natural forest.The changing pattern of future wood supply and developments such as SFM and greaterneeds for HRD, research and better management of protected areas, will all require forestryadministrations to broaden their activities. The World Bank and others should support this atthe policy level in their regular dialogues with countries and consider how technicalassistance can best be provided to facilitate this process.

FAO Paper for the World Bank Forest Policy Implementation Review and Strategy
_________________________________________________________________________________________Forest product market developments
1
1. INTRODUCTION
Several studies of global wood and wood products supply and demand have recently beenproduced2. These have all contained projections of product supply and demand of roughly thesame order of magnitude. In contrast, however, many of the studies have arrived at differentconclusions about the adequacy of forest resources to meet the wood raw materialrequirements underlying their forest product supply projections. Most of the studies broadlyagree that, at the global level, raw material supplies will expand to meet productionrequirements. However, few of the studies foresee plentiful wood supplies and several havesuggested that it may be difficult to meet future requirements in some regions or for sometypes of wood.
FAO has recently completed two major global studies relevant to this subject: the GlobalForest Products Outlook Study (GFPOS), which presents forecasts of forest product supplyand demand to 2010; and the Global Fibre Supply Model (GFSM), which examines potentialfuture fibre supplies based on likely future developments in forest resources and alternativesources of fibre supply. This paper, drawing from these two studies, has been prepared bystaff of the FAO Forestry Department as a background paper to the World Bank Forest PolicyImplementation Review and Strategy.
The paper is in two main parts. The first part presents FAO's projections of wood and woodproduct supply and demand to 2010 and discusses the potential of the global forest resourceand alternative supply sources to fulfil the wood and fibre raw material requirementsunderlying these projections. This sets the scene for a discussion of market developments inpart two of the paper. In this section, emerging developments in the forest sector that have thepotential to affect forest products markets are discussed. In particular, the second part of thepaper examines factors that might reduce or extend the availability of wood raw materialsupplies and policy developments that may affect future trade in forest products.
The paper attempts to give some insight into the broad supply and demand developments thatare driving the sector and will shape the future of the sector over the next decade or so. It alsodiscusses areas where the World Bank could justify involvement in forestry on the basis ofthe sector’s linkages to its key objectives of poverty alleviation, environmentally sustainabledevelopment and private sector development. The analysis places a greater emphasis on thesupply side discussion since generally, issues of supply fall within the purview of forestpolicymakers while demand issues are more heavily influenced by national economicpolicies.
2 See, for example: Margules, Groome and Pöyry (1996); Sedjo and Lyon (1990); Apsey and Reed
(1995); Nilsson (1996); FAO (1997a); and Solberg et al (1996).

A Whiteman, C Brown and G Bull
_________________________________________________________________________________________Forest product market developments
2

FAO Paper for the World Bank Forest Policy Implementation Review and Strategy
_________________________________________________________________________________________Forest product market developments
3
Part 1: the future global supply anddemand for wood and wood products

A Whiteman, C Brown and G Bull
_________________________________________________________________________________________Forest product market developments
4

FAO Paper for the World Bank Forest Policy Implementation Review and Strategy
_________________________________________________________________________________________Forest product market developments
5
2. FACTORS INFLUENCING THE SUPPLY AND DEMAND FOR WOOD AND WOOD PRODUCTS
2.1 Factors driving the demand for wood and wood products
A range of factors affect the demand for wood and wood products, including: the price of theproducts themselves; the price of substitute products; population and income levels; andtrends in consumer preferences. In addition to these factors, most forest products areintermediate goods. They are used in other industrial processes or commercial activities(e.g. construction), such that technological changes in these processing or end-use sectors canhave a major impact on the demand for forest products through the efficiency with which theyare transformed into other products.
The use of wood products in the future will continue be challenged by substitute productsfrom the metals, plastics, agricultural, cement, and chemical industries. A correlation betweenincreasing incomes and preferences for environmentally friendly products and outcomessuggests a future of increasingly complex interplay in the demands placed on forests and therelative acceptability to consumers of forest products and competing non-forest substitutes.Several of these factors will be examined later in this paper. This first section concentrates onthe two main forces that tend to drive the demand for forest products over time: populationand income growth.
2.1.1 Population growth
Population growth broadly acts to increase the demand for forest products by increasing thenumber of forest product consumers.3 World population has roughly doubled in the last fourdecades, and growth in the consumption of roundwood (including wood fuel) has increased atonly a marginally lower rate. Rates of population growth in most developed countries havedeclined (and are indeed now negative in many developed countries) and it is expected that achanging distribution of global population, from developed towards less developed countries,will have a moderate impact on future forest product demand patterns.
The distribution of world population and expected population growth is shown in Table 1.This shows that developed countries currently account for just under one-fifth of worldpopulation. The latest population projections from the UN Population Division, indicate thatworld population will probably increase by just under 20% over the next 15 years. It isexpected that most growth will occur in less developed countries, led by African countrieswhere population is expected to grow by over 40% or over twice the world average. Incontrast, population in developed countries is expected to grow by only 6% and the share ofworld population in developed countries is expected to decline to 17%. Asia is and willremain the world's most populous region with over half of the world's population.
3 Other more complex demographic factors may also affect demand in more subtle ways. For example,
the age structure of a country's population will affect household formation and, consequently, demandfor construction materials such as sawnwood.

A Whiteman, C Brown and G Bull
_________________________________________________________________________________________Forest product market developments
6
Table 1: World population in 1995 and projection for 2010 (medium fertility variant)
Region 1995 2010 Growth 1995 - 2010(millions) (%) (millions) (%) (annual) (total)
Countries within OECDEurope 432 8% 431 6% +0.0% -0.3%Asia and Oceania 252 4% 270 4% +0.5% +7.0%The Americas 388 7% 440 7% +0.8% +13.4%Subtotal 1,072 19% 1,141 17% +0.4% +6.4%Non-OECD countriesEurope 295 5% 282 4% -0.3% -4.6%Asia and Oceania 3,214 57% 3,819 57% +1.2% +18.8%The Americas 386 7% 465 7% +1.3% +20.7%Africa 719 13% 1,028 15% +2.4% +42.8%Subtotal 4,614 81% 5,593 83% +1.3% +21.2%World total 5,687 6,734 +1.1% +18.4%
Source: UN (1998)
2.1.2 Income growth
The second principal factor influencing the demand for forest products is wealth or income.Leaving aside the issue of income distribution, demand for most forest products generallyincreases as countries become richer and can afford to buy more of all goods and services. Inthe context of markets for wood products, the only major exception to this is wood fuel. Percapita consumption of wood fuel tends to decline as incomes increase, because people switchtowards using more convenient types of energy4.
Current and projected gross domestic product (GDP) for all the main regions of the world isshown in Table 2. GDP is currently very unevenly distributed. For example, 80% of worldGDP is accounted for by the 29 OECD countries, in stark contrast to their 20% share of worldpopulation. Asian developing countries account for 13% of world GDP and 7% of worldGDP is produced in other less developed countries.
It is expected, however, that GDP will grow at the highest future growth rates in lessdeveloped countries. Many less developed countries are expected to sustain GDP growth atover 3% per annum (and some much faster than this) compared with growth of only 2% to3% in most developed countries5. Thus, by 2010, the share of world GDP produced in lessdeveloped countries is expected to increase from 20% to around 35%. Also, compared withthe size of their economies in 1995, less developed countries are expected to double in size by2010, whereas developed countries are expected to increase by only around 50%. Thesedevelopments may have a profound effect on the demand for forest products.
4 Total consumption of wood fuel may still increase however, if population increases faster than per
capita consumption declines.
5 The current economic turmoil in Asia has the potential to alter some of the projections used in thisanalysis and the eventual long-run outcome of recent events is currently unpredictable. However, it isbelieved that the effects of recent events will not significantly alter the main conclusions of thisanalysis, but are more likely to merely delay some of the expected outcomes by a few years.

FAO Paper for the World Bank Forest Policy Implementation Review and Strategy
_________________________________________________________________________________________Forest product market developments
7
Table 2: World GDP in 1995 and projection for 2010
Region 1995 2010 Growth 1995 - 2010(billions) (%) (billions) (%) (annual) (total)
Countries within OECDEurope 5,997 30% 8,797 27% 2.6% 46.7%Asia and Oceania 3,664 18% 6,049 18% 3.4% 65.1%The Americas 6,147 31% 8,941 27% 2.5% 45.5%Subtotal 15,807 79% 23,786 72% 2.8% 50.5%Non-OECD countriesEurope 523 3% 958 3% 4.1% 83.2%Asia and Oceania 2,369 12% 5,864 18% 6.2% 147.5%The Americas 785 4% 1,411 4% 4.0% 79.7%Africa 476 2% 860 3% 4.0% 80.6%Subtotal 4,153 21% 9,092 28% 5.4% 118.9%World total 19,961 32,879 3.4% 64.7%
Source: FAO (1997b) GDP figures have been converted to US$ at 1987 prices and exchange rates
2.1.3 Other impacts of population and income growth
Population and income growth may not only affect the demand for forest products, but alsoaffect the supply of wood raw materials. For example, increasing population density increasesthe pressure to convert forestland into other uses and higher incomes tend to result in higherdemands for environmental services from forests (Solberg et al 1996). Thus, the changesoutlined above are likely to put pressure on forest resources both in terms of the wood andfibre products that will be desired from them and the other non wood goods and services thatthey will be expected to produce (which may consequently reduce their availability for timbersupply).
2.2 Factors likely to affect the supply of wood and other fibre
A large number of economic, technical and biological factors are likely to influence the futuresupply of wood and other fibre. Box 1 lists some of the factors most likely to have asignificant impact on supply.
The factors listed in Box 1 have been identified and considered as part of this analysis. Thelist is not an exhaustive collection, but rather a subset of a larger set of variables that havebeen identified as affecting wood supplies in various studies within the last decade (seefootnote on page 1). These variables have been chosen because of their suspected importanceand the availability of information about their presence and likely impacts on forests aroundthe world.

A Whiteman, C Brown and G Bull
_________________________________________________________________________________________Forest product market developments
8
Box 1: Factors most likely to affect future wood and other fibre supplies
2.2.1 Changes to natural forest management regimes
The implications of Sustainable Forest Management (SFM) for wood and other fibre supplyare frequently mentioned in forest policy discussion. The concept of SFM has been broadenedin recent years and, as a result, the objectives of natural forest management in many countriesare gradually shifting emphasis away from predominantly management for timber productiontowards management that balances timber production with ecological and socialsustainability. These changes could have significant impacts on the amount of timber whichcan be harvested from the world's natural forests in the future.
2.2.2 Forest loss
Deforestation remains a serious forestry policy issue for most regions. The main direct impactof deforestation on future wood availability is that it reduces the area of forest available forwood supply. A more subtle impact it has, is that it increases the pressure on forestrypolicymakers to place forest areas in legally protected areas (see below) or prevent harvestingin some other way (e.g. logging bans), thus further reducing the amount of wood that can beharvested from the remaining forest areas.
2.2.3 Forest change
A more subtle change that has occurred within many of the world’s forests in recent years isthe process of gradual forest degradation. Forest degradation can manifest itself in many waysincluding: loss of site fertility; soil erosion; reduction in biological diversity; andfragmentation of forest areas, but probably the single most important indicator of degradation(and one of the most important in terms of future timber supply) is the gradual loss ofstanding biomass.
Wood supply from the natural forest:
Management regime (as expressed by cutting cycle and intensity);Forest loss - e.g. Unplanned and planned deforestation; andForest change - e.g. forest degradation, conversion to legally protected areas or expansion of the exploitation frontier.
Wood supply from industrial forest plantations:
Afforestation rate; andDevelopment gains in rates of growth and fibre yields.
Non-wood fibre supply:
Capacity to collect and process non-wood fibre sources.
Recovered fibres:
Capacity to collect and process recovered paper.

FAO Paper for the World Bank Forest Policy Implementation Review and Strategy
_________________________________________________________________________________________Forest product market developments
9
Forest degradation will affect timber supplies by reducing the amount of standing commercialtimber available for harvest in the future. Thus, for example, as countries move fromharvesting old-growth or primary forest stands into second growth forest, it can be expectedthat harvesting volumes per unit of area will decline. Such shifts are likely to take place overseveral decades in countries where virgin forest still accounts for a major share of currentwood production (e.g. many tropical countries) and they have been taken into account in thisanalysis.
Partly in response to the problems of deforestation and forest degradation, countries are alsoplacing more natural forest into legally protected areas. As areas of forest are placed intoprotected areas, they are taken out of production and this reduces the long-run sustainablesupply of timber that can be harvested from the natural forest. This is another aspect of forestchange that has been examined in the analysis.
2.2.4 Afforestation rate and development gains in industrial forest plantations
Increasing the forest area by establishing forest plantations is one way in which future supplyof wood from forests can be increased. Table 3 shows the current estimated rates ofafforestation in some of the main countries actively pursuing vigorous plantationestablishment policies. Because tree growth in plantations is generally much higher than innatural forests, policy developments that promote the establishment and use of plantationscan have a significant impact on future wood supplies.
There is frequently a significant difference between planned and actual afforestation rates,due to poor establishment practices. But, for the purposes of this study, the planned rates wereused as a starting point for the analysis. A more detailed examination of the outlook forplantations is given in Part 2 of this report.
Table 3: Estimated annual rate of afforestation in selected countries
Africa South America Asia-PacificCountry Area
1,000 haCountry Area
1,000 haCountry Area
1,000 haSouth Africa 24 Argentina 25 Australia 20Zimbabwe 5 Brazil 200 Bangladesh 50
Chile 120 China 500Uruguay 20 India 500
Indonesia 250Malaysia 50New Zealand 50Pakistan 50Philippines 44Sri Lanka 10
Source: FAO (1999a)
Development gains, particularly in industrial forest plantations, are another key factor thatwill affect future potential wood supply. Such gains will include both silvicultural and geneticgains. Vichnevetskaia (1997) provides a partial survey of studies published on factorsaffecting productivity in tropical forest plantations. Such gains are a further potential source

A Whiteman, C Brown and G Bull
_________________________________________________________________________________________Forest product market developments
10
of increased wood supply, although they have not been included in the analysis presentedlater.
2.2.5 Development of non-wood and recovered fibre supplies
Currently, wood is the major raw material input to the global pulp and paper industry.Significant levels of non-wood fibres are currently used in a handful of countries, mostnotably in: China; India; and a few other Asian countries. However, there are also currentlyindications of increasing interest in non-wood fibres, particularly in North America.
At present, the most common non-wood fibre used to make pulp and paper is straw (seeTable 4), which accounts for 46 % of total non-wood fibre consumption (Atchison, 1995).This is followed by bagasse (14 %) and bamboo (6 %). Other non-wood fibres, such ascotton, hemp, sisal, and kenaf, are gradually becoming more important in the manufacture ofpulp and paper.
Table 4: Global non-wood fibre papermaking capacity
Material Capacity (thousand metric tons)1985 1988 1990 1993
Straw 6,166 5,260 7,623 9,566Bagasse 2,339 2,267 2,646 2,984Bamboo 1,545 1,674 1,468 1,316Miscellaneous 3,302 6,366 6,870 6,870Total non-wood fibre papermaking capacity 13,352 15,567 18,607 20,736Total paper and paperboard production 178,558 225,887 238,939 250,359Estimated production from non-wood fibres 7.4% 6.9% 7.8% 8.3%
Source: Mabee and Pande (1997)
In total, it is estimated that non-wood fibres currently account for around 8% of global pulpand paper production. Given the world's area of agricultural crops, their potential contributionto meet future demands for fibre is vast, but much will depend on the economic,environmental and technical feasibility of collection and processing the resource. Forexample, pollution from non-wood fibre pulp mills is becoming an increasing environmentalconcern in China.
More important to the future wood product supply and demand balance is the outlook forwastepaper recovery and utilisation. Figure 1 shows how the utilisation of wood and non-wood fibre pulp in the manufacture of paper has declined over the last 25 years, largely due tothe increased use of recovered paper in the total fibre furnish.

FAO Paper for the World Bank Forest Policy Implementation Review and Strategy
_________________________________________________________________________________________Forest product market developments
11
Figure 1: Trend in the utilisation of pulp in the manufacture of paper
0%
10%
20%
30%
40%
50%
60%
70%
80%
90%
100%
1970 1975 1980 1985 1990 1995
Year
Source: FAO (1999b)
Table 5 shows that currently, most regions of the world are recovering around 40% of thepaper they consume.6 The exceptions to this are Africa and the countries of the former USSR.Poor infrastructure may be the cause of low recovery rates in Africa and the abundance offorest resources is almost certainly the cause of the very low recovery rate in the countries ofthe former USSR. Because of the size of its domestic market for paper products, NorthAmerica is by far the largest producer of recovered paper in the world.
Table 5: Global wastepaper recovery in 1995
Region Wastepaperrecovery
Recovery as aproportion of paper
consumption
Wastepaperconsumption
Consumption as aproportion of paper
production1,000 MT % 1,000 MT %
Europe 31,923 45 32,297 46Asia-Pacific 35,603 40 40,946 40North America 41,999 40 34,427 45Latin America 4,354 42 5,853 31Africa 901 26 924 23Former USSR 40 1 629 2World 115,820 41 116,076 41
Source: Mabee and Pande (1997)
6 The technical limit to wastepaper recovery will depend upon a number of factors and can not currently
be determined. Some countries already recover much higher proportions of their paper consumptionthan are shown here (Japan, for example, which recovered over 50% of consumption in 1995). Anotherfactor that will confound any analysis of future recovered paper supply is the trend in some countries touse this resource for the production of energy. However, the projections for the recovery of wastepaperpresented later on are believed to be feasible, given current policies governing the collection and use ofthis resource.

A Whiteman, C Brown and G Bull
_________________________________________________________________________________________Forest product market developments
12
In terms of wastepaper utilisation, the table shows that North America and Europe lead theworld in terms of the share of paper produced from recycled fibre, while the Asia-Pacificregion is the largest consumer of recovered paper overall. However, even though NorthAmerica has the highest rate of utilisation, the region has consistently recovered morewastepaper than it uses (due to domestic recycling and waste management policies) and hasbecome the world's dominant exporter of recovered paper. Much of this material is sold to theAsia-Pacific region.
Europe, Africa, Latin America and the Former USSR each have a lower levels of imports anddemand that could easily be met by increases in national recovery levels in these regions.
2.3 Synthesis: major issues surrounding future supply and demand drivers
The above analysis has described the main factors that are likely to affect forest productssupply and demand patterns in the future.
On the demand side, consumption patterns are expected to switch somewhat towards lessdeveloped countries. Also, as incomes rise, other forest functions are likely to becomeincreasingly important and this will have an impact on future wood supplies.
On the supply side, the description given above has shown that there is a wide range offactors which might affect future supplies. The challenge for policymakers, will be toinfluence these factors to satisfy market needs while, at the same time, pursuing widerforestry policy objectives such as SFM.
Following-on from these general themes, several particularly important topics have beenchosen for more detailed examination in this analysis. These include:
1. the effect on wood supplies of competing demands for forest-land;
2. the potential for plantations and non-forest supply sources to meet future wood andfibre demands;
3. the potential for technological change to help balance future wood and wood product
supply and demand; and
4. the impact of trends such as globalisation and forest certification on forest productsmarkets
These themes are covered in Part 2 of the report.

FAO Paper for the World Bank Forest Policy Implementation Review and Strategy
_________________________________________________________________________________________Forest product market developments
13
3. GLOBAL SUPPLY AND DEMAND ANALYSIS
This section of the report presents a brief description of the main global supply and demanddevelopments which are expected to occur over the period to 2010.7 The first four subsectionsdiscuss the outlook for industrial wood products and the fifth discusses the wood fueloutlook. Expected wood production and biological productivity are then compared in part sixof this section, which is followed by a final synopsis of the main expected marketdevelopments.
3.1 Global supply and demand at a glance
The current and future expected level of global supply and demand for wood and woodproducts is shown in Figure 2. Developed countries8 currently account for about 1 bn m3 EQ9
of annual wood and wood product consumption or two-thirds of the global total of1.5 bn m3 EQ/year. Their share of global industrial roundwood production is slightly lower,such that about 6% (or around 0.07 billion m3 EQ/year) of their wood and wood productrequirements have to be imported from less developed countries each year. About half of thisnet trade from developing to developed countries is in the form of wood products and theremainder is accounted for by trade in industrial roundwood.
Figure 2: Industrial roundwood supply and forest product demand - 1996 and 2010
Developing country total consumption:
0.5 billion m3
Developed country total consumption:
1.0 billion m3
Developing country total consumption:
0.7 billion m3 Developed
country total consumption:
1.2 billion m3
7 A brief description of the supply and demand models used to make all the projections presented here is
given in Box 3 later on.
8 Defined, for the purposes of this analysis, as members of the OECD.
9 Wood raw material equivalent or m3 EQ is calculated as the amount of industrial roundwood requiredto produce a given quantity of final forest products (i.e. sawnwood, panels and paper). This conversionis used to make countries forest product consumption projections comparable with their industrialroundwood production projections.
Total global production andconsumption in 1996: 1.5 bn m3 EQ
Total expected global production andconsumption in 2010: 1.9 bn m3 EQ

A Whiteman, C Brown and G Bull
_________________________________________________________________________________________Forest product market developments
14
Global demand for industrial wood and wood products is expected to increase by 25% to1.9 bn m3 EQ/year by 2010. By far the greatest increase in demand is expected to occur in lessdeveloped countries, where demand is expected to rise by about 40% to 0.7 bn m3 EQ. Incontrast, demand in developed countries is expected to increase by only about 20%. This willincrease the developing countries share of global industrial wood and wood productconsumption from about one-third to just under 40%.
Net trade from developing to developed countries is expected to increase very slightly toaround 0.1 bn m3 EQ. However, with greater market opportunities at home, some developingcountries with currently high exports may reduce their levels of exports in the future.
3.2 Supply and demand for industrial wood and wood products by region
Greater regional detail about wood production and wood products consumption in 1996 and aforecast for 2010 are shown in Figure 3. Reflecting their shares of world GDP, consumptionof wood products is dominated by OECD countries. Non-OECD countries in Asia andOceania also account for a major share of world production and consumption. In contrast,Africa and Non-OECD countries in Europe and South and Central America together accountfor less than 10% of global wood product consumption.10
Figure 3: Global industrial roundwood production and forest product consumption in1996 and the forecast for 2010
10 To avoid the complexities of including the use of recovered paper in these calculations, wherever wood
product production and consumption is compared with industrial roundwood production andconsumption, wood products has been defined as including only: sawnwood; wood based panels andwood pulp. This is, of course, slightly misleading in situations where recovered paper and non-woodfibres are an important component of the total fibre supply used to make paper.
�����������������������������������
���������������������
���������������������������������������������������������������������������������������������������������������������������������������
����������������������������
���������������������������������������������������������������
����������������������������
���������������������������
���������������������������������������������������������������
������������������������������������
�����������������������������������������������������������������������������������������������������������������������
���������������������������������������������
����������������������������������������������������������������������
���������������������������������������������
���������������������
0
100
200
300
400
500
600
700
Europe Asia andOceania
The Americas Europe Asia andOceania
The Americas Africa
������������ Production in 1996 Consumption in 1996
��������������Production in 2010 Consumption in 2010
OECD member countries non-OECD countries

FAO Paper for the World Bank Forest Policy Implementation Review and Strategy
_________________________________________________________________________________________Forest product market developments
15
Notwithstanding the present economic difficulties in Asia, continued increases in wealth inthis most populous region are expected to result in the Asia and Oceania region (includingdeveloped and developing countries) maintaining its position as the region with the greatestshare of global consumption and future demand growth.
3.2.1 Current supply and demand by geographical region
North America and Asia each account for about one-third of current global forest productsconsumption. The two OECD members in Asia (Japan and Republic of Korea) account forone-third of Asia's share of consumption, China accounts for just under one-third and theother non-OECD countries in the region account for the remainder
Europe follows closely, accounting for about one-quarter of global consumption. Of this,three-quarters is consumed in European OECD countries. South America, Africa and Oceaniaare currently relatively insignificant consumer regions, although South America doesconsume slightly more wood products than non-OECD countries in Europe.
In terms of industrial roundwood production in each of the regions, the pattern is slightlydifferent. North America supplies about 40% of the global market and Europe again accountsfor about 25%. Asia provides about half of the remaining production, or about 18% of theglobal total and the other regions account for the remainder.
In terms of net trade, the picture is more complicated. At the regional level, the developedcountries of Europe and the Asia region consume more than they produce. However, the twodeveloped economies in Oceania (Australia and New Zealand) are both large net exporters.North America is also a large net exporter of wood and wood products. Of the developingregions, Asia is the only region which consumes more than it produces. Africa anddeveloping countries in Oceania export more than half of their production (as both processedproducts and roundwood) and around one-third of production in non-OECD European andSouth and Central American countries is currently exported.
Given that the net imports into European OECD countries is almost exactly balanced by netexports from the non-OECD countries in Europe, Asia is the only region which is a major netimporter of wood and wood products. The countries of Asia consume a volume of productsequal to about 100 million m3 of industrial roundwood more than they produce each year (orthey import roughly 20% of their wood and wood product requirements). Asia imports a widerange of forest products each year, from raw logs and pulp through to sawnwood, panels andpaper. To a large extent Japan is the major driving force behind this phenomenon, but otherlarge economies in the region (such as China, Republic of Korea and Thailand) are alsobecoming significant net importers.

A Whiteman, C Brown and G Bull
_________________________________________________________________________________________Forest product market developments
16
3.2.2 Growth in supply and demand by region
During the period 1996 to 2010, annual global industrial forest product production andconsumption is projected to increase at a rate of about 1.7% per year, giving a total increaseof 26% over the whole period. However, the expected level of consumption in 2010(1.9 billion m3 EQ/year) will only be about 10% higher than the peak in consumption (of1.7 billion m3 EQ/year) experienced around 1990.11
The low overall rate of growth in production and consumption expected in OECD countries islargely due to expected low growth in North America (see Table 6). Growth in EuropeanOECD countries is expected to match the global rate of growth and growth in the OECD Asiaand Oceania region is expected to exceed it.
The highest rates of growth in production and consumption in non-OECD countries isexpected in Europe, followed by Asia and Oceania. Growth in production and consumption inAfrica will be slightly less than the global average, and growth in South and Central Americawill be lowest of all.
Table 6: Expected growth in production and consumption over the period 1995 to 2010
Region Expected total growth inproduction 1995 - 2010
Expected total growth inconsumption 1995 - 2010
Countries within OECDEurope 27% 23%Asia and Oceania 34% 22%The Americas 10% 8%Subtotal 17% 15%Non-OECD countriesEurope 55% 100%Asia and Oceania 52% 57%The Americas 17% 9%Africa 23% 18%Subtotal 41% 47%World total 26% 26%
The relative shares of global consumption and production held by each of the world regions isnot expected to change much by 2010. The only slight change is that Asia and Europe areexpected to increase their shares of global consumption and production by 2-3%, largely atthe expense of North America. Asia is projected to have the highest rate of growth ofindustrial roundwood production at 3.0% per annum. Consumption in Asia is projected togrow at only 2.1%, but the region overall is expected to remain the world’s main netimporting region, and will still have to import a volume of forest products equal to roughly20% of its consumption requirements each year by 2010.
11 The global decline in production and consumption since 1990 is largely attributable to falls in
production and consumption in the countries of the former USSR. This may be, in part, a statisticalanomaly.

FAO Paper for the World Bank Forest Policy Implementation Review and Strategy
_________________________________________________________________________________________Forest product market developments
17
3.2.3 The distribution of wood processing by region
From the point of view of examining forest resources as a base for industrial development, itis also useful to compare the production of industrial roundwood with the production ofprocessed products and this is shown in Table 7. This table compares industrial roundwoodand processed forest product production12 between the various developed and developingregions in 1996 and the projection for 2010.
Table 7: Industrial roundwood and forest product production by region in 1996 and 2010
Region Industrial roundwood and productproduction in 1996 (million m3 EQ)
Industrial roundwood and productproduction in 2010 (million m3 EQ)
IRW Products Export/importlevel
IRW Products Export/importlevel
Countries within OECDEurope 256 276 -7% 327 361 -9%Asia and Oceania 72 116 -38% 97 156 -38%The Americas 596 580 +3% 653 634 +3%Subtotal 924 972 -5% 1,077 1,151 -6%Non-OECD countriesEurope 113 91 +24% 175 148 +18%Asia and Oceania 249 241 +3% 378 362 +4%The Americas 135 124 +9% 157 136 +15%Africa 68 61 +11% 84 74 +14%Subtotal 565 517 +9% 795 721 +10%World total 1,490 1,490 1,872 1,872
Notes: For the purposes of this comparison, product production has been defined as the production of sawnwood, wood-based panels and wood pulp. Negative percentages indicate the proportion of wood products manufactured from importedindustrial roundwood and positive percentages indicate the proportion of industrial roundwood production which isexported.
The table shows that wood product production is currently higher than industrial roundwoodproduction in all of the OECD countries together (i.e. the OECD countries are net importersof industrial roundwood). Within the three OECD regions, the exception is the NorthAmerica region which is a net exporter of industrial roundwood (Australia and New Zealandare also major net exporters). In contrast, all of the non-OECD regions are net exporters ofindustrial roundwood. For example, non-OECD Europe exports one-quarter of its industrialroundwood production in the form of unprocessed wood.
The discrepancy between industrial roundwood and processed product production is currentlyhighest in Asia and Oceania (developed and developing countries), where 321 million m3 ofindustrial roundwood is currently produced, but the region produces processed products equalto a volume of about 357 million m3. Thus, through industrial roundwood trade (net importsof 36 million m3 per year), Asia produces a proportionately greater share of its processedforest product consumption requirements than the industrial roundwood production figuresgiven above would suggest. If processing of imported pulp and wastepaper were taken intoaccount, Asia and Oceania would be shown to have an even greater share of global processingcapacity. Asia and Oceania is the world's major net industrial roundwood importing regionand this situation (net industrial roundwood imports into Asia and Oceania supporting the
12 For the purposes of this comparison, processed product production has been defined as the production
of sawnwood, wood-based panels and wood pulp.

A Whiteman, C Brown and G Bull
_________________________________________________________________________________________Forest product market developments
18
wood processing sector there) is also expected to continue in the future at roughly the samelevel.
With the exception of OECD countries in Europe, the other regions all produce moreindustrial roundwood than processed products and, hence, supply Asia and Oceania with itsindustrial roundwood imports. The only main change expected in the future is that the sourcesof industrial roundwood imports for Asia and Oceania may diversify away from NorthAmerica to include greater shares from other countries (e.g. the Russian Federation andcountries in South America).
3.3 Supply and demand for industrial forest products by product category
Current and projected estimates of global forest product production and consumption byproduct category are shown in Table 8. As in the past, consumption of paper and paperboardis expected to have the most rapid growth of all the product sectors, at an annual rate of 2.4%.In contrast, consumption of pulp for paper is projected to grow by only 1.1% per year,reflecting the increased use of recovered paper in the total fibre furnish which, it is expected,will take place in the future.
Moderate growth in solid wood product consumption is expected, at rates of 1.1% per annumin the case of sawnwood and 1.3% per annum in the case of wood-based panels. Most growthin wood-based panels production and consumption is expected in the reconstituted woodpanels sector rather than the plywood sector.
Table 8: Production and consumption by product category in 1995 and 2010
Product category Production/consumption Total growth Annual growthin 1996 in 2010 1996 - 2010 1996 - 2010
Industrial roundwood 1,490 1,872 26% 1.7%Sawnwood 430 501 17% 1.1%Wood-based panels 149 180 20% 1.3%Pulp 179 208 16% 1.1%Paper and paperboard 284 394 39% 2.4%
Note: all volume figures for roundwood, sawnwood and wood-based panels are in million m3, figures for pulp and paperare in million MT.
A major significance of the difference in growth rates between the different productcategories shown above is that these changes in consumption patterns will affect the types ofraw material inputs which can be processed in the future. The highest rates of growth will befor products which can be produced from smaller sizes of wood and alternative fibre sources(i.e. paper and reconstituted panels). In contrast, consumption of products which require largelogs as raw material inputs (i.e. sawnwood and plywood) will grow only slowly. Thus,changing future demand patterns will increase the scope for input substitution away fromlarge logs, which have traditionally come from the natural forest or long rotation plantations,to other fibre inputs, which can come from a wide variety of sources. This is a majorstructural change which is expected to continue to take place in the future and, as will beshown later, could have profound implications for the relative importance of different sourcesof wood and fibre supply in the future.

FAO Paper for the World Bank Forest Policy Implementation Review and Strategy
_________________________________________________________________________________________Forest product market developments
19
3.4 Trade in industrial forest products
Given that the geographical distribution of industrial roundwood production and processingcapacity is quite different to the distribution of forest product demand, international tradeaccounts for a relatively large share of forest product production. Table 9 shows the share offorest product production that was internationally traded in 1995 by region and productcategory.
In line with most countries desires to add-value to domestic resources, the proportion ofindustrial roundwood and pulp production that is traded is generally lower than the proportionof the other forest products that are traded.13 However, this is less so in Africa, Asia andSouth America. Thus, for example, pulp exports account for a major share of pulp productionin Africa and Latin America & the Caribbean and industrial roundwood exports are relativelyimportant in Africa and Asia. In contrast, North America exports a major share of itssawnwood production and Europe is a major trader of all products.
Table 9: Forest products trade as a proportion of production in 1995
Region Industrialroundwood
sawnwood wood-basedpanels
pulp paper
million m3 % million m3 % million m3 % million mt % million mt %Prod Exp Prod Exp Prod Exp Prod Exp Prod Exp
Africa 67 7 10 9 1 15 2 0 21 2 1 27 3 1 20Asia and Oceania 309 34 11 103 8 8 46 16 35 44 1 3 81 7 8Latin America &the Caribbean
141 13 9 33 4 12 7 2 33 10 4 38 12 2 14
North America 592 24 4 166 55 33 47 9 19 85 17 20 104 22 21Europe 401 55 14 116 42 36 45 15 33 42 9 21 82 44 53World 1,510 131 9 427 111 26 146 42 29 183 32 17 282 75 27
Source: FAO (1999b)
Earlier sections have already alluded to the major wood product trade flow into Asia from theother world regions. A fuller picture of global forest products trade flows is given in Table10. As the table shows, Europe accounts for nearly one-half of total world forest productstrade (by value). North America accounts for about one-third of world exports and Asiaaccounts for about one-third of world imports.
However, much of the trade in forest products at this scale is within regions. For example,80% of Europe's trade is between European countries, 85% of exports from countries in Asiaare to countries in the same region and 80% of North American imports come from within theregion. The only major (over US$ 5 billion) inter-regional trade flows are from NorthAmerica to Europe and from North America and Europe to Asia and Oceania.
13 There are also certain production economies from using pulp in integrated mills (i.e. mills that produce
pulp and then use it straight away to produce paper and paperboard).

A Whiteman, C Brown and G Bull
_________________________________________________________________________________________Forest product market developments
20
Table 10: Direction of global trade in forest products in 1995 (value in US$ billions)
FromTo Africa Asia and
OceaniaLatin America& Caribbean
NorthAmerica
Europe World total
Africa 0.3 0.2 0.1 0.5 2.0 3.1 2%Asia and Oceania 1.2 17.9 1.7 15.3 6.4 42.6 30%Latin America &the Caribbean
0.1 0.0 1.2 4.1 0.7 6.1 4%
North America 0.1 1.0 1.7 20.4 1.6 24.9 18%Europe 2.1 1.4 2.3 8.5 49.4 63.8 45%World total 3.9 20.7 6.9 48.8 62.1 142.4
3% 16% 5% 34% 43%Source: estimated from UN COMTRADE database by FAO
Since the 1950's, trade in forest products has steadily increased as a proportion of totalproduction. In the future however, growth in trade in forest products may lag behind growthin production and consumption. This may occur for two reasons. Firstly, because countrieswill continue to develop value-added industries in their own countries (e.g. to process ratherthan export roundwood and pulp), which will reduce exports of semi-processed products.14
Secondly, because it is expected that several currently large exporters in less developedcountries, particularly in Asia, will develop significant domestic markets of their own due tostrong economic growth export (see Box 2 for a slightly different view of the future in Asia).
Box 2: The impact of the recent economic downturn in Asia on the supply and demandprojections to 2010
The model used to produce the supply and demand forecasts contained here was also used to estimate thepotential impact of the recent economic downturn in Asia on global markets. It was not the purpose of thisexercise to estimate the immediate effects of the crisis, but the long-term impact on the outlook to 2010. Basedon projections of reduced economic growth in Asia available in April 1998, the results of this analysis are brieflysummarised below.
With significantly reduced economic growth in: Republic of Korea; Indonesia; Thailand and Malaysia, plusknock-on effects in some other countries in the region, overall consumption of wood products is expected tofollow a slower growth trajectory. This will result in estimates of consumption which are roughly 4-5% lowerthan the baseline projection for the year 2010 across all wood product categories. Because of the effects ofcompetitive devaluation and the fact that the region is such a large importer, it is projected that most of thisreduction in consumption growth will be reflected in lower imports to the region. However, some countries inthe region that have been less badly affected by the crisis (e.g. Australia and Japan) may increase forest productimports if prices in the region generally fall. Production in major exporter countries is expected to remain on asimilar trajectory to the baseline projection due to the effect of these devaluations.
In summary therefore, the impact of the crisis is likely to result in only slightly less consumption in the long-term. The crisis is not projected to have a major impact on suppliers in the region, but is expected to result inlower imports to the region from countries outside.Source: FAO (1998)
If the above developments do occur, they will put pressure on importing countries,particularly those (predominantly in Asia), which have built large forest product processingindustries that rely on imports of raw materials (i.e. industrial roundwood) and partly
14 Countries may also, in the future, export more wood products as finished products such as furniture,
doors and window frames, which will not show-up in forest product statistics.

FAO Paper for the World Bank Forest Policy Implementation Review and Strategy
_________________________________________________________________________________________Forest product market developments
21
processed forest products (such as pulp and rough sawn timber). This will have implicationsfor the future location of processing facilities in these countries and may require that theyrestructure some of their domestic processing industries.
3.5 The supply and demand for wood fuel
Projecting wood fuel supply and demand is a difficult task because statistics about this forestproduct are currently only partial and quite unreliable. However, as part of this study, FAOhas conducted a literature search to collect and enhance its existing databases on wood fueluse. This has included collecting new information about wood fuel consumption and revisingFAO's models of wood fuel demand.15 More importantly however, it has also involvedcollecting better information about the utilisation of various sources of supply.
Figure 4: Wood fuel consumption in 1996 and projection for 2010
0 500 1,000 1,500 2,000 2,500
2010
1996
Fuelwood consumption (in million m3)
Africa N and S America Asia-Pacific Europe
15 The projections given here are based on FAO’s WAICENT statistics. Revised projections will be
produced later as part of the FAO's Global Forest Products Outlook Study working paper series.

A Whiteman, C Brown and G Bull
_________________________________________________________________________________________Forest product market developments
22
3.5.1 Projections of wood fuel demand
Current and projected wood fuel consumption is shown in Figure 4. World wood fuelconsumption currently stands at around 1.8 billion m3, or roughly 20% higher than industrialroundwood consumption. This is projected to increase by 1.5% per annum (or just under 25%in total) over the period to 2010, at which point consumption will amount to around 2.2billion m3. (More detailed projections are given in Annex 1).
In line with the size of its population, Asia accounts for around half of world wood fuelconsumption and consumption in Asia is projected to increase by over 2% per annum (or overone third in total) over the period. In contrast, consumption in Europe is expected to almosthalve over the same period. The differences between the projections of consumption growthin Asia and Europe show how sensitive consumption growth is to income. As countries inAsia become richer, they may, at first, be expected to consume more fuel generally, asincomes rise. As part of this, wood fuel consumption would be expected to increase and thesupply of wood fuel may also become more formalised (i.e. from collection for own usetowards commercial collection for resale) as consumers can afford to buy wood fuel ratherthan have to collect it themselves. However, as income continue to rise, consumers will tendto switch to other types of fuel (usually charcoal first, then kerosene, followed by LPG andelectricity), which are cleaner, easier to use and quicker to heat or cook.
A range of other supply-side factors will also affect fuel-switching (from wood to other typesof fuel) and it is uncertain at what level of income fuel-switching will start to occur. Thus, forexample, increased incomes in Asia, combined with future investment in rural energy supplyinfrastructure may result in less consumption growth than is shown here.
3.5.2 Sources of wood fuel supply
A key question which is often asked is: what sources of wood are used for wood fuel supplyand what role does wood fuel collection play in deforestation? Research by FAO indicatesthat a wide range of forest and other land types are used for wood fuel supply. It also showsthat deforestation due to wood fuel collection is often very localised and generally only occursin areas that are already under stress due to other ecological factors such as drought..
Extensive research in Asia (FAO, 1998), suggests that only about one-third of wood fuelcomes from forest land. The majority of wood fuel is collected from individual trees andshrubs, or from shelterbelts and woodlots on agricultural land. The same research indicatedthat wood fuel collected for own-use is rarely transported more than 20 km, but may betransported for up to 100 km if it is being collected for resale. Further research has alsoshown that charcoal may be transported for even greater distances due to its higher value.Thus, as people move up the "fuel-ladder" from wood fuel to charcoal, wood fuel collection(and on-site conversion into charcoal) may move into forest areas that were previouslyeconomically inaccessible.
Another point to note is that the collection of wood fuel often does not compete withproduction of industrial roundwood and may not greatly harm standing trees. For a start, allover the world, research indicates that deadwood is preferred to greenwood as a wood fuelsource because it is lighter, does not require drying and burns more easily. Furthermore, if

FAO Paper for the World Bank Forest Policy Implementation Review and Strategy
_________________________________________________________________________________________Forest product market developments
23
deadwood is not available, branches are often preferred to whole trees because they are easierto cut and require less cutting to the sizes suitable for stoves and domestic fireplaces. Again,however, in commercial wood fuel collection operations it may be more efficient to utilisewhole trees.
In conclusion, wood fuel supply comes from a variety of sources and utilises a range of typesof wood apart from whole trees. There are examples of local wood fuel scarcity anddeforestation due to wood fuel collection around some of the world's largest and pooresttowns and cities. However, it is likely that the increased demand for wood fuel projectedearlier will not, on its own, lead to greater deforestation except in a few localised areas. Amore important mechanism by which wood fuel demand may lead to greater deforestation isthe likely commercialisation of wood fuel collection and greater conversion of wood fuel intocharcoal, as wood fuel consumers incomes rise.
The challenge for policymakers will be to plan for the increased energy needs expected indeveloping countries and respond with appropriate strategies to supply these needs in themost efficient way and with minimal disturbance to the most highly valued forest areas. Thisis likely to require increased capacity of government institutions to identify and analyse theseneeds and develop an appropriate framework whereby wood fuel markets can developalongside the maintenance of natural forest areas.
3.6 Comparison of roundwood supply with supply potential
In order to assess current and future potential fibre supply, it is necessary to examine trends inforest area, forest volume and forest removals and consider other developments such as theexpansion of forest plantations and the development of new potential fibre sources. Tocompound the challenges in assessment, it is also necessary to consider the impacts ofconstantly shifting market forces and forest policies on these factors and the way they interactwith one another.
Based on the information collected as part of the GFSM, APFSOS, and GFPM modellingexercises, FAO has started to examine these issue in more detail. (A brief description of thesupply models used in these models is given in Box 3). A comparison of roundwoodproduction with production potential in the Asia-Pacific region is given in Box 4 and a moregeneral comparison of industrial roundwood production and fibre supply potential for thewhole of the world is given in Table 11.

A Whiteman, C Brown and G Bull
_________________________________________________________________________________________Forest product market developments
24
Box 3: A brief description of the supply and demand models used by FAO in recentoutlook studies
FAO have two main forecasting models which can be used to produce wood supply and demand projections: theGlobal Fibre Supply Model (GFSM) and the Global Forest Products Model (GFPM). As will be shown later, theGFSM only examines supply, but forms is an important input to the GFPM, which forecasts both supply anddemand. An extension to the GFSM was also constructed for the APFSOS and this is explained below.
The Global Fibre Supply Model (GFSM)
The GFSM is a model of future potential wood and fibre supply, based on detailed information about the areaand characteristics of forests, harvesting regimes (i.e. the amount of wood which is harvested per hectare in eachcutting) and growth rates, harvesting efficiency, recovery of wastepaper and non-wood fibre pulping capacity.The model contains information about these variables, which can be used to project future supply, for nearlyevery country of the world.
In terms of forest characteristics, the model mostly contains information which is important for the calculation offuture supply including: forest area by type and stocking; area logged and unlogged; and information about theareas which are potentially available for wood supply or unavailable due to legal, economic, or biological factorsor reasons of accessibility. For forest plantations the model includes: area and species and potential growth rates.
The model projects future supply as a function of area multiplied by harvesting intensity or yield, depending onthe type of forest, for each of the forest types available for wood supply in each country. In the absence ofdetailed age-structure data, the model also applies various yield reduction factors to the potential yields fromforest plantations to take into account the immaturity of some plantation areas. The yield forecasts from all typesof forest are also reduced to take into account harvesting efficiencies or the proportion of utilisable yield which isusually taken from the forest. (To a certain extent, the weakest component of this projection framework is thelack of reliable yield estimates from around the world). In addition to these forest-based supply components areadded estimates of future potential wastepaper recovery and non-wood fibre utilisation.
The model can be used to project potential supply under a range of alternative assumptions about rates ofdeforestation, rates of harvesting in the unlogged forest and the expansion of the harvesting frontier intopreviously inaccessible forest. Changes in future plantation establishment, wastepaper recovery and non-woodpulping capacity are also important variables which affect future potential supply and future scenarios for thesevariables can be examined in the model. The scenario used in the baseline analysis presented here is one ofcontinuation of past trends in these variables.
The Global Forest Products Model (GFPM)
The GFPM is a market simulation model of future wood and wood product production, consumption and tradefor every country of the world. The model takes supply and demand curves for each country, fixes these such thatthe model roughly replicates global production, consumption and trade in the last year for which actual data isavailable and then shifts these curves out for every country and each year of the forecast. As part of this processthe model identifies the trade flows and price changes necessary to clear all markets within each year of theforecast, using a linear programming algorithm. In contrast to the GFSM, the GFPM produces projections ofactual wood production rather than potential production.
The demand curves used in the GFPM were estimated from an econometric analysis of past consumption usingdata taken from the Forest Products Yearbook (FPY). The analysis gave estimates of price and income elasticityfor countries and projections of future income growth were used to shift the demand curves for each year of theforecast. On the supply side, estimates of the price elasticity of industrial roundwood supply were taken from theforest economics research literature. The supply curves for each country were then shifted in each year of theforecast on the basis of the projected changes in future potential supply given by the GFSM.

FAO Paper for the World Bank Forest Policy Implementation Review and Strategy
_________________________________________________________________________________________Forest product market developments
25
Box 3 (continued): A brief description of the supply and demand models used by FAO inrecent outlook studies
Source: FAO (1998 and 1999a) and Tomberlin et al (1999)
Wood product production and the links between future product demand and roundwood and product supply inthe model are specified in the model as functions of a series of technical coefficients such as roundwood toproduct conversion factors, capacity utilisation and wastepaper recovery rates. The baseline analysis presentedhere assumes no change in future technology, but does assume that the recovery and utilisation of wastepaperwill increase in the future at the same rate as it has in the past.
Supply and demand model used in the Asia-Pacific Forestry Sector Outlook Study (APFSOS)
A considerable amount of in-depth information about wood supply and demand and timber markets generallywas collected as part of the APFSOS. Given this wealth of data and the amount of time available, it was possibleto examine future supply and demand in this region in greater detail than was possible in the broader globalstudies. In particular, the study gave a greater insight into future wood supply and supply potential, by examiningin greater detail factors such as plantation developments, technology and supply from trees outside of forests.Some of these insights are presented in the following box and the main differences between the APFSOS andGFSM supply analysis are briefly described below.
In terms of forest products markets, the supply and demand projections presented in the APFSOS wereconstructed in roughly the same way as above. The GFSM was used to project changes in potential industrialroundwood supply and the GFPM was used to translate these into projections of future actual supply anddemand. However, in the APFSOS, the industrial roundwood supply projections were also adjusted somewhat toreflect policy statements about future supply and demand from various forestry administrations in the region.These modifications have been included in the analysis presented here for the Asia and Oceania region, but notfor any of the other regions.
On the supply side, further modifications were made to the GFSM projections in the APFSOS to reflect thegreater amount of data available about the region. The basic area statistics and projections contained in theGFSM were used in the APFSOS, but the potential supply projections were modified somewhat to take intoaccount information available about the age structure of plantations and concessions in some countries in theregion. Additional potential sources of supply were also considered in the analysis including: harvesting residues;wood processing residues; and trees outside of forests (including agricultural tree crops, for which there wasconsiderable data).
The concluding section of the analysis examined how different sources of wood supply and improvements inharvesting and processing technology could be used to meet future wood demands at the same time as meetingother forestry policy objectives. It also identified the policy changes and investments which might be needed tofollow different courses of action. This is the approach which will be attempted on a wider scale in part two ofthis report.

A Whiteman, C Brown and G Bull
_________________________________________________________________________________________Forest product market developments
26
Box 4: The range of potential wood and fibre supplies in the Asia-Pacific region
Source: FAO (1998)
An analysis of the supply outlook for all potential sources of wood and fibre supply was carried-out as part of theAsia-Pacific Forestry Sector Outlook Study (FAO, 1998). This analysis incorporated data from the GFSM(plantations, natural forest, recycled and non-wood fibre), an earlier study by Blanchez (1997) which includedinformation about supply potential from trees outside the forest and a separate analysis of the potential volume ofharvesting and wood processing residues produced each year. The main findings of the analysis are shown in thegraph below.
0
100
200
300
400
500
600
700
800
900
1,000
1,100
1,200
1,300
NF PL OWL TOF HRE RNW WPR
Source of supply
Sawlogs Other fibre
Pulpwood
Sawlogs
Fuelwood
RNW fibre
The bars in the graph show the potential production of sawlogs and other fibre (small roundwood, residues,recovered paper and non-wood fibre) in 2010. Each pair of bars represents one of the following sources: naturalforest (NF); plantations (PL); other wooded land (OWL); trees outside forests (TOF); harvesting residues (HRE);recovered and non-wood fibre (RNW); and wood processing residues (WPR). The forecasts were made on thebasis of existing technology (except for a trend towards more recovery of wastepaper in the future) and policies(e.g. with respect to the area of forest in legally protected areas). However, historical trends in forest conversionto other land-uses were also incorporated in the forecast. The horizontal lines also show projected production ofrecycled and non-wood fibre, pulpwood, sawlogs and wood fuel in the region in 2010 from GFPOS 98.
As the graph shows, the region has a large potential to produce sawlogs and other fibre from outside the areasthat would be typically considered in forestry supply and demand analysis (i.e. natural forest and plantations). Interms of other fibre production potential, non-forest sources far exceed the potential of the forest to meetproduction needs. For example trees outside the forest have twice the potential to produce small roundwood asforest plantations, due to the large area of agricultural land (particularly agricultural tree crops) in the area.(However, few reliable statistics on trees outside forests are available, so the exact magnitude of this resource issomewhat uncertain). Recovered paper and wood processing residues could also meet the regions entire needsfor pulpwood. In terms of sawlog production, the forest industry typically has to look to forests to get therequired high quality of logs. About half of the potential sawlog production in the region is from the naturalforest and a further quarter from forest plantations. However, even in this category, trees outside forests accountfor the remaining one-quarter of production potential and could go a long way towards meeting sawlogproduction requirements.
Several countries with limited forest resources (e.g. many countries in South Asia) already use a wide variety ofsources for sawlog and fibre supply. Countries that currently rely on natural forests to supply much of their needsalso generally have the option to do this should they wish to.

FAO Paper for the World Bank Forest Policy Implementation Review and Strategy
_________________________________________________________________________________________Forest product market developments
27
Box 4 shows that, comparing the forecast roundwood production levels estimated for 2010 forthe Asia-Pacific region with production (or estimated biological) potential, future woodproduction requirements can be easily met within the region. However, a more detailedexamination of the results also showed that, in certain countries and for certain types of wood,particularly sawlogs, supplies are going to become increasingly scarce in the future.
FAO does not yet have sufficient data to make an accurate assessment of the total wood andfibre production potential for the whole world. The GFSM, for example, covers a large part ofthe world, but excludes some regions and the important contribution of trees outside offorests. Another major weakness of the GFSM is the reliability and availability of yieldestimates for forests from around the world. However, the GFSM and other official supplyprojections such as Fifth European Timber Trends Study or ETTS V (UN, 1996a) and NorthAmerican Timber Trends Study or NATTS (UN, 1996b) can be used to make some sort ofcomparison between projected levels of actual production with projected future supplypotential from the forest and recovered and non-wood fibre sources across some regions.Such a comparison is shown in Table 11.
Table 11: Forecast production of wood and fibre from forests, recovered and non-woodfibre sources compared with estimated potential production in 2010
Region Forecast of actual production in 2010 Forecast of roundwoodindustrial
roundwoodrecovered andnon-wood fibre
total and other fibre productionpotential in 2010
Africa 84 2 86 81Asia 421 222 643 729Oceania 54 0 54 80Europe 502 133 632 893North and Central America 658 147 805 835South America 153 2 155 225World total 1,872 506 2,375 2,843
Note all volume figures are in million m3 EQ (i.e. the figures for recovered and non-wood fibres have been converted totheir industrial roundwood equivalents). The figures for potential production in Europe in this table are from ETTS V andinclude industrial roundwood, residue and recycled paper production, except for Russian Federation, where the officialAAC for 2010 has been used. The potential production figures for North America are official estimates of future industrialroundwood production only and exclude the potential contribution of recovered fibre supplies. Consequently, totalproduction potential in North America is far greater than shown here.
As Table 11 shows, forecast production levels appear to be well within the forecast limit offorest, recovered paper and non-wood fibre production potential in all regions except Africa.However, three points are worth noting:
1. It must be stressed that the projections of future supply potential from the GFSM areincomplete, are not strictly comparable with the results from other studies such asETTS V and NATTS and are based on what little data is currently available (which mightbe quite unreliable in many cases).
2. The projections from the GFSM in the above table present results which should probablybe considered as an absolute maximum amount of potential supply. The cost of accessingincreasingly marginal areas, which are included in the GFSM analysis, may prevent thetotal potential supply presented above from being utilised in the near future.

A Whiteman, C Brown and G Bull
_________________________________________________________________________________________Forest product market developments
28
3. It should be remembered that, while supplies at a broad regional or country level may beplentiful, there may continue to be local scarcity which puts forestry policymakers underpressure to release areas of natural forest for timber harvesting in some areas.
In regions such as Africa and Asia, where supplies (particularly supplies of large logs) fromforests are coming under pressure, consumers of wood and fibre may increasingly have tolook to other sources of supply to meet demands (as they already are in some parts of Asia).This is particularly likely if increased scarcity is combined with more effective monitoringand control (i.e. to stop overharvesting). Alternatively, a perhaps more likely future, is thatmarkets for forest products will continue to move in the direction of substitution ofsawnwood and plywood by other wood-based panels and engineered wood products, whichcan be manufactured from small sized wood or non-wood substitutes.
3.7 Overall synthesis of the baseline projections
The above analysis suggests that supplies of wood and other types of fibre required to meetdemand for the foreseeable future will be broadly within the productive capacity of theworld’s forests and other fibre sources. However, the situation will vary between countriesand regions. For example, South Asia will continue to have to use a wide range of non-forestsupply sources to meet their needs. Sawlog production will also approach the capacity offorests and plantations to provide the required higher qualities of logs in some regions, suchas: Africa; Southeast Asia; and the Pacific Islands.
Given the above, it is also expected that product prices will not generally rise significantlyover the projection period. Upward pressure on the prices of certain types of wood (typicallythe higher grades) may arise, but the price and availability of cheaper wood and non-woodsubstitutes will limit the potential for price increases. Such conditions will also encourageshifts in processing towards reconstituted panels at the expense of sawnwood and plywood.
Trading patterns are not expected to change significantly, except that the trend towards morein-country processing of wood raw materials is expected to continue in the future. This maylead to slower growth in trade in semi-processed and commodity grade wood products in thefuture compared with trade in higher value products.

FAO Paper for the World Bank Forest Policy Implementation Review and Strategy
_________________________________________________________________________________________Forest product market developments
29
4. MAIN GLOBAL MARKET POTENTIALS
The previous section of this analysis provided a broad indication of the potential markets andsources of supply for the main categories of forest product. This section increases the level ofdisaggregation to sharpen the focus of the analysis on the countries that account for most ofthe world's wood supply and demand and the most important countries in each of the maindeveloping regions of the world.
The top ten consumer and producer countries across all forest product categories are mostlythe same: the G5 countries, Sweden, Finland, Russian Federation, China and Indonesia. TheUnited States of America is the largest producer and consumer of wood products across allproduct categories. Given the World Bank's focus on less developed countries therefore, thissection has grouped OECD member countries together and included the most importantproducer and consumer countries in the developing regions in the analysis.
However, even outside the OECD country group, the same countries tend to appear as largeproducers or consumers across all product categories. Of the less developed countries, China,Russian Federation, Brazil and Indonesia are within the top six producers and consumersacross all product categories. India, Malaysia and Chile are also important in many of theproduct categories. Countries which are not so important at a global scale but are importantwithin their respective regions include: Thailand; Turkey; Nigeria; South Africa; andArgentina.
The analysis presented below has used the country groupings described earlier (i.e. threeOECD regions and four non-OECD regions). Statistics for an alternative country grouping -World Bank client and non-client countries in each of their operational regions - is given inAnnex 2.
4.1 Industrial roundwood production and consumption
Current and projected industrial roundwood production and consumption is shown in Table12. In terms of production, OECD countries, led by the United States of America and Canada,currently produce 62% of the world's industrial roundwood. Other large OECD producersinclude: Sweden, Finland and Germany.
Of the non-OECD regions, Asia and Oceania has the greatest share of world industrialroundwood production (17%) and four producers of global significance (China, Indonesia,Malaysia and India). The only other globally significant producers in the non-OECD regionsare Russian Federation, Brazil; Chile and South Africa.
Industrial roundwood production in non-OECD Europe is dominated by the RussianFederation (production in other countries in Eastern Europe is very small at the global scale).However, Russian production continues to be significantly lower than experienced inprevious decades due to the economic circumstances facing the country. It is likely that, of allthe non-OECD countries, the Russian Federation has the greatest potential to increaseindustrial roundwood production substantially.

A Whiteman, C Brown and G Bull
_________________________________________________________________________________________Forest product market developments
30
The non-OECD South and Central America and Asia and Oceania regions both contain anumber of large industrial roundwood producers. Production in these regions comes from amixture of tropical natural forests, tropical plantations and temperate plantations. Theplantations in these regions have tremendous potential to increase wood supplies in the future.However, there are uncertainties about the yields which might be achieved in some of theseplantations. The other major supply uncertainty in these regions concerns the amounts andmanner of harvesting which will be allowed in the regions' natural forests in the future.
Africa is a minor industrial roundwood producing region, despite containing most of themajor remaining countries which will export tropical logs. One third of industrial roundwoodproduction in Africa comes from South Africa (mostly from temperate plantations). However,industrial roundwood production in this country is small at the global scale.
In terms of current industrial roundwood consumption, the picture is only slightly different.OECD countries account for 65% of world industrial roundwood consumption, again led bythe United States of America and Canada. Japan is the next major consumer and, as a resultof relatively low domestic production, is a major importer (Japan accounts for a substantialshare - about 40% - of the world's industrial roundwood imports). Other major consumers are:Sweden; Finland; and France.
Of the non-OECD countries, the same six countries (Russian Federation, China, Indonesia,Malaysia, India and Brazil) are the top industrial roundwood consumers and account for 24%of world consumption. All the other non-OECD countries added together only account for11% of global industrial roundwood consumption. Non-OECD countries in Asia have thegreatest share of consumption of the non-OECD regions (19%) and this region is a netimporter of industrial roundwood.
By 2010, it is expected that non-OECD countries will have increased their share of globalindustrial roundwood production and consumption to 42% and 38% respectively. The UnitedStates of America and Canada will remain the world's largest industrial roundwood producersand consumers, but with a smaller share of the global market. Most other OECD countries areexpected to increase production and consumption in line with the global trend. Japan willremain a significant log buyer, but will find it increasingly difficult to source logs from itstraditional supplier countries. It is likely to look to the southern countries, particularly inOceania and South America, for new sources of supply.

FAO Paper for the World Bank Forest Policy Implementation Review and Strategy
_________________________________________________________________________________________Forest product market developments
31
Table 12: Current and projected industrial roundwood production and consumption byregion and country
Region 1996 2010 (projection)Production Consumption Production Consumption
(1,000 m3) % (1,000 m3) % (1,000 m3) % (1,000 m3) %OECD - Europe 256,327 17% 277,108 19% 326,616 17% 362,780 19%OECD - Asia and Oceania 72,448 5% 115,960 8% 97,024 5% 156,812 8%OECD - Americas 595,622 40% 581,326 39% 653,304 35% 637,086 34%OECD total 924,397 62% 974,394 65% 1,076,943 58% 1,156,678 62%Russian Federation 67,000 4% 51,652 3% 94,523 5% 83,542 4%Romania 9,441 1% 9,516 1% 9,028 <1% 9,008 <1%Belarus 9,206 1% 8,690 1% 14,221 1% 13,278 1%Latvia 5,690 <1% 3,387 <1% 6,920 <1% 1,660 <1%Slovakia 4,887 <1% 4,343 <1% 4,549 <1% 3,515 <1%Others 17,091 1% 13,564 1% 46,201 2% 37,682 2%Non-OECD Europe total 113,315 8% 91,153 6% 175,442 9% 148,685 8%China 108,718 7% 112,407 8% 151,582 8% 154,770 8%Indonesia 47,245 3% 46,739 3% 57,256 3% 56,960 3%Malaysia 35,771 2% 28,843 2% 37,910 2% 24,883 1%India1 24,989 2% 25,302 2% 46,936 3% 49,955 3%Turkey 10,745 1% 11,501 1% 13,789 1% 13,806 1%Others 21,698 1% 16,701 1% 70,707 4% 63,474 3%Non-OECD Asia & Oceania total 249,165 17% 241,493 16% 378,180 20% 363,849 19%Brazil 84,711 6% 82,504 6% 97,405 5% 88,114 5%Chile 21,387 1% 14,938 1% 28,933 2% 21,971 1%Argentina 6,220 <1% 5,258 <1% 10,752 1% 7,756 <1%Ecuador 5,514 <1% 5,495 <1% 1,558 <1% 1,519 <1%Paraguay 3,877 <1% 3,882 <1% 2,107 <1% 2,094 <1%Others 13,007 1% 12,644 1% 16,725 1% 15,390 1%Non-OECD Americas 134,716 9% 124,721 8% 157,480 8% 136,844 7%South Africa 18,176 1% 15,780 1% 21,677 1% 18,214 1%Nigeria 8,479 1% 8,470 1% 9,698 1% 9,796 1%Congo, Democratic Republic of 3,433 <1% 3,255 <1% 4,694 <1% 4,580 <1%Cameroon 3,364 <1% 2,057 <1% 3,455 <1% 1,806 <1%Côte d'Ivoire 3,008 <1% 2,676 <1% 2,989 <1% 2,929 <1%Others 31,471 2% 28,930 2% 41,016 2% 37,358 2%Africa total 67,931 5% 61,168 4% 83,529 4% 74,682 4%Non-OECD total 565,127 38% 518,535 35% 794,631 42% 724,060 38%World total 1,489,524 1,492,929 1,871,574 1,880,738Note: 1. Based on production of wood products, it is suspected that current industrial roundwood production in India
is substantially under-reported. A figure of closer to 40 million m3 is probably the current level of industrialroundwood production and growth from 1996 to 2010 will, consequently, really be lower than appears here.
Of the non-OECD countries, industrial roundwood production is expected to increase in allthe major producer countries. However, there are uncertainties about supply in some of thelarger producers. China has announced a policy to restrict harvesting from the natural forestas has Malaysia. Several smaller countries (e.g. Sri Lanka; Thailand and the Philippines)already have production bans in the natural forest and others are examining this policy option(e.g. Vietnam).
Most industrial roundwood production growth in non-OECD countries is expected to comefrom the maturation of plantations in large producer countries such as: China; Brazil; andIndonesia. Other slightly smaller producer countries are also expected to increase their share

A Whiteman, C Brown and G Bull
_________________________________________________________________________________________Forest product market developments
32
of world industrial roundwood production due to the maturation of their plantation resources(e.g. Chile and Argentina).
4.2 Sawnwood production and consumption
Current and projected sawnwood production and consumption is shown in Table 13. OECDcountries currently have a 68% share of world production and a 69% share of worldconsumption. The United States of America and Canada again lead the sawnwood productiontable, although this time they are followed by: Japan; Sweden; Germany; and France. In termsof sawnwood consumption, major consumers in this group are: United States of America;Japan; Germany; Canada; France and Italy.
Canada is by far the largest sawnwood exporter in the world. Major sawnwood importers arethe United States of America, Japan, the United Kingdom, Germany and Italy.
Of the non-OECD countries, the top four sawnwood producers (Russian Federation, China,India and Brazil) account for 19% of global production and consumption. The remainingdeveloping countries added together account for about 13% of sawnwood production and14% of sawnwood consumption.
Non-OECD Asia and Oceania again has the largest share of non-OECD sawnwoodproduction (15%) and consumption (16%). In this region, Malaysia, Indonesia and Turkey aresignificant sawnwood producers and consumers at the regional level. Other countries ofregional significance include: Chile in South America; and Nigeria and South Africa inAfrica.
Out of all the non-OECD countries, only the Russian Federation and Malaysia are globallysignificant sawnwood exporters and China is the only major sawnwood importer. Brazil is ofminor significance as a world exporter of sawnwood.
By 2010, the OECD share of world sawnwood production is expected to decline only slightly,but its share of global sawnwood consumption is expected to fall to 65%. This is due to slowgrowth in sawnwood consumption expected in the United States of America and Canada.Growth in the other OECD countries is expected match the global trend. Overall, the marketfor sawnwood in OECD countries is expected to grow by only 0.6% per annum or 9% in totalover the period.
In contrast, relatively high rates of growth in consumption of sawnwood are expected in non-OECD countries, particularly in Asia and Eastern Europe, as their economies expand.Average annual growth of 2.2% or total growth of 35% over the period is expected in thenon-OECD countries; this figure is roughly twice the rate of growth in OECD countries.
An important projection for non-OECD Asia and Oceania is that sawnwood consumptiongrowth is expected to exceed production growth over the period to 2010. Most exporters inthe region are expected to consume more of their domestic production and have lesssawnwood left over for export and sawnwood imports are projected to increase in severalcountries. As a result, the region is projected to change from net exporter of sawnwood to netimporter of sawnwood.

FAO Paper for the World Bank Forest Policy Implementation Review and Strategy
_________________________________________________________________________________________Forest product market developments
33
Table 13: Current and projected sawnwood production and consumption by region andcountry
Region 1996 2010 (projection)Production Consumption Production Consumption
(1,000 m3) % (1,000 m3) % (1,000 m3) % (1,000 m3) %OECD - Europe 79,763 19% 80,006 19% 90,515 18% 94,540 19%OECD - Asia and Oceania 38,663 9% 51,206 12% 50,121 10% 60,325 12%OECD - Americas1 175,026 41% 163,222 38% 193,442 39% 165,269 33%OECD total 293,452 68% 294,433 69% 334,077 67% 320,133 64%Russian Federation 21,600 5% 16,927 4% 30,586 6% 26,457 5%Romania 1,693 <1% 808 <1% 1,527 <1% 1,217 <1%Belarus 1,545 <1% 1,397 <1% 1,961 <1% 1,652 <1%Latvia2 1,300 <1% .. .. 476 <1% 223 <1%Lithuania 1,250 <1% 204 <1% 623 <1% 621 <1%Others 3,134 1% 2,435 1% 9,485 2% 9,575 2%Non-OECD Europe total 30,522 7% 21,771 5% 44,658 9% 39,746 8%China 26,969 6% 28,901 7% 29,920 6% 37,202 7%India 17,460 4% 17,450 4% 22,208 4% 22,207 4%Malaysia 8,382 2% 4,985 1% 6,243 1% 5,948 1%Indonesia 7,338 2% 6,941 2% 11,381 2% 10,553 2%Turkey 4,331 1% 4,455 1% 4,848 1% 4,884 1%Others 1,788 <1% 7,144 2% 9,980 2% 15,555 3%Non-OECD Asia & Oceania total 66,267 15% 69,875 16% 84,580 17% 96,349 19%Brazil 19,091 4% 17,563 4% 20,067 4% 20,453 4%Chile 3,802 1% 2,739 1% 3,182 1% 3,155 1%Ecuador 1,886 <1% 1,803 <1% 270 <1% 269 <1%Argentina 1,000 <1% 1,121 <1% 1,356 <1% 1,296 <1%Costa Rica 780 <1% 779 <1% 842 <1% 927 <1%Others 3,699 1% 3,800 1% 3,617 1% 5,189 1%Non-OECD Americas 30,258 7% 27,805 7% 29,334 6% 31,289 6%Nigeria 2,723 1% 2,698 1% 3,135 1% 3,132 1%South Africa 1,574 <1% 1,948 <1% 1,852 <1% 1,812 <1%Cameroon 1,400 <1% 1,084 <1% 259 <1% 224 <1%Côte d'Ivoire 706 <1% 206 <1% 730 <1% 110 <1%Ghana 604 <1% 364 <1% 494 <1% 463 <1%Others 2,140 <1% 6,111 1% 2,134 <1% 5,028 1%Africa total 9,147 2% 12,411 3% 8,604 2% 10,770 2%Non-OECD total 136,193 32% 131,862 31% 167,177 33% 178,154 36%World total 429,645 426,295 501,254 498,288Notes: 1. It is not really possible to compare actual consumption in 1996 with the projection for 2010, because the
projection is a projection of the trend and consumption in 1996 was significantly above this trend.Consequently, the growth trend in consumption is higher than the appearance given here.
2. Net exports of sawnwood from Latvia were greater than officially recorded production in 1996, soconsumption can not be accurately estimated.
4.3 Wood-based panel production and consumption
Current and projected wood-based panel production and consumption is shown in Table 14.OECD countries have a 67% share of world wood-based panel production and 73% share ofwood-based panel consumption. Again, the United States of America is the worlds largestproducer and consumer. Germany, Canada, Japan, Italy and France are the next largestproducers and the order of the next largest consumer countries is: Japan; Germany; the UnitedKingdom; Italy; Canada and France.

A Whiteman, C Brown and G Bull
_________________________________________________________________________________________Forest product market developments
34
Canada is the largest OECD exporter of wood-based panels. However, in contrast to themarket for sawnwood, it is not the world's largest exporter (Indonesia is). The high level ofwood-based panels production in Japan is partly dependent on the import of industrialroundwood (the same is true of Japan's sawnwood production).
An interesting feature to note, is that European production of wood-based panels is globallymuch more significant compared with Europe's position in the global markets for industrialroundwood and sawnwood. Europe is particularly strong in markets for reconstituted panels,which form a much greater share of the market for solid wood products (sawnwood andwood-based panels) in Europe than elsewhere. For example, reconstituted panels account forabout 30% of solid wood product consumption in Europe, compared with 15% in NorthAmerica and just over 10% in Asia.
Non-OECD countries have a one-third share of world wood-based panel production and aslightly lower share of world consumption. The top three wood-based panel producers(China, Indonesia and Malaysia) have a 22% share of world production and Brazil andRussian Federation are the only other globally significant developing country producers witha 2% share of world production each.
Asia and Oceania is by far the largest non-OECD producer region and wood-based panelproduction in many Asian countries is currently concentrated in the plywood sector. Much ofthis current strength in plywood production is based on the natural advantage of a relativelyabundant availability of large logs from the natural forest. The same is also true of Brazil tosome extent.
Several of the non-OECD countries shown in Table 14 are also globally significant wood-based panel exporters. For example, Indonesia is the world's largest exporter of wood-basedpanels, Malaysia is the world's third largest exporter and Brazil is the world's eighth largestexporter. Most of these exports are of commodity-grade plywood to markets in East Asia,including: China; Japan; and Republic of Korea.
The shares of wood-based panel production and consumption held by OECD countries andnon-OECD countries is not expected to change by very much by 2010. The only majorexpected change is that, as with sawnwood, production growth in non-OECD countries is notexpected to keep-up with consumption growth. Thus, net exports from non-OECD countriesto OECD countries are expected to fall significantly as these countries consume more of theirproduction in their domestic markets.

FAO Paper for the World Bank Forest Policy Implementation Review and Strategy
_________________________________________________________________________________________Forest product market developments
35
Table 14: Current and projected wood-based panel production and consumption by regionand country
Region 1996 2010 (projection)Production Consumption Production Consumption
(1,000 m3) % (1,000 m3) % (1,000 m3) % (1,000 m3) %OECD - Europe 37,942 25% 38,808 26% 52,415 29% 49,514 28%OECD - Asia and Oceania 12,389 8% 20,238 14% 17,370 10% 24,935 14%OECD - Americas 49,605 33% 49,002 33% 53,394 30% 53,150 30%OECD total 99,936 67% 108,049 73% 123,180 69% 127,599 71%Russian Federation 3,036 2% 2,126 1% 6,305 4% 5,628 3%Hungary 459 <1% 337 <1% 477 <1% 517 <1%Romania 433 <1% 435 <1% 508 <1% 556 <1%Belarus 374 <1% 348 <1% 570 <1% 485 <1%Slovenia 361 <1% 303 <1% 168 <1% 499 <1%Others 1,562 1% 1,305 1% 3,782 2% 3,966 2%Non-OECD Europe total 6,225 4% 4,853 3% 11,809 7% 11,651 7%China1 15,349 10% 19,479 13% 13,912 8% 16,014 9%Indonesia 10,128 7% 1,873 1% 11,978 7% 3,376 2%Malaysia 6,770 5% 1,760 1% 4,141 2% 2,183 1%Turkey 1,078 1% 1,316 1% 835 <1% 1,126 1%Philippines 596 <1% 833 1% 496 <1% 499 <1%Others 1,140 1% 3,393 2% 3,953 2% 8,368 5%Non-OECD Asia & Oceania total 35,061 23% 28,653 19% 35,315 20% 31,567 18%Brazil 3,558 2% 2,617 2% 3,320 2% 1,849 1%Chile 844 1% 446 <1% 782 <1% 786 <1%Argentina 590 <1% 448 <1% 1,274 1% 1,208 1%Ecuador 380 <1% 296 <1% 336 <1% 335 <1%Venezuela 194 <1% 212 <1% 351 <1% 392 <1%Others 776 1% 847 1% 1,081 1% 1,298 1%Non-OECD Americas 6,342 4% 4,866 3% 7,143 4% 5,867 3%South Africa 653 <1% 741 <1% 492 <1% 456 <1%Côte d'Ivoire 272 <1% 199 <1% 72 <1% 56 <1%Nigeria 115 <1% 135 <1% 113 <1% 153 <1%Ghana 105 <1% 33 <1% 90 <1% 88 <1%Tunisia 104 <1% 136 <1% 214 <1% 258 <1%Others 573 <1% 774 1% 1,081 1% 1,347 1%Africa total 1,822 1% 2,019 1% 2,062 1% 2,357 1%Non-OECD total 49,450 33% 40,391 27% 56,328 31% 51,441 29%World total 149,385 148,440 179,508 179,040Note: 1. The trend in wood-based panel production and consumption in China is broadly upwards over the projection
period.. Sudden very high levels of production and consumption were reported for China in 1995 and 1996and it is believed that these figures may be a statistical anomaly.
Given that such a large share of wood-based panel production in non-OECD countries in Asiais plywood production and, consequently, dependent on the supply of large logs from thenatural forest, the uncertainties about this source of industrial roundwood supply raised earliermust also apply to the outlook for wood-based panel production. Much of the recent increasein plantation area in Asia is accounted for by short-rotation pulpwood species which will notsupply the sorts of logs required to make plywood. Furthermore, the areas which have beenplanted with suitable species will require some considerable time to mature and are unlikelyto make much of a difference within the timescale of this analysis. Therefore, the projectedincreases in wood-based panel production shown here may be difficult to achieve withoutcontinued harvesting in the natural forest (at possibly even greater levels) or somerestructuring of the industry into reconstituted panel production.

A Whiteman, C Brown and G Bull
_________________________________________________________________________________________Forest product market developments
36
Another alternative solution might be to source such logs from other countries and there arealready signs that some producers are looking to countries in other developing regions inorder to obtain large logs from natural forests and keep this industry going. It is questionablehowever, whether such moves can be sustained in the long-run.
4.4 Pulp production and consumption
Current and projected pulp production and consumption is shown in Table 15. OECDcountries currently have a three-quarters share of world pulp consumption and production andare again dominated by United States of America and Canada. Non-OECD Asia and Oceaniacurrently has a 17% share of global pulp production and a 19% share of global pulpconsumption. The non-OECD regions are relatively insignificant. Broadly speaking, the non-OECD region as a whole is a very small net exporter to OECD countries.
Of the non-OECD countries, China is the only globally significant pulp producer andconsumer. The Russian Federation, Brazil and South Africa are significant within theirregions, but fairly small producers at a global scale. It should also be noted that non-woodfibre pulp accounts for a major share of the Chinese market (as it does in India).
Very little growth in production and consumption is expected over the period to 2010. Mostgrowth is likely to occur in non-OECD countries, particularly Asia and Oceania but also, tosome extent, South and Central America. Thus, the OECD share of future world productionand consumption is expected to fall slightly to 70% and 72% respectively.
The forecast for pulp production and consumption growth is relatively low considering that,of all the product categories, paper consumption is expected to grow the fastest in the future.This is because the GFPM analysis presented here has assumed that the use of recovered fibrewill increase in the total fibre furnish in line with historical trends.
The collection and utilisation of recovered fibre is largely policy driven, so the extent towhich this material is used in the future is largely in the hands of government policymakers(not necessarily forestry policymakers, though). At the rates of recovery assumed in thisanalysis, there is still scope to increase recovery further, but much will depend upon the costsof collecting more material and the incentives or regulations requiring producers andconsumers to do so.

FAO Paper for the World Bank Forest Policy Implementation Review and Strategy
_________________________________________________________________________________________Forest product market developments
37
Table 15: Current and projected pulp production and consumption by region and country
Region 1996 2010 (projection)Production Consumption Production Consumption
(1,000 MT) % (1,000 MT) % (1,000 MT) % (1,000 MT) %OECD - Europe 33,958 19% 39,859 22% 43,425 21% 44,035 21%OECD - Asia and Oceania 14,367 8% 19,604 11% 17,714 9% 22,601 11%OECD - Americas1 83,386 47% 73,577 41% 82,098 39% 80,049 39%OECD total 131,711 74% 133,039 75% 143,236 69% 146,686 71%Russian Federation 3,725 2% 2,758 2% 2,936 1% 2,734 1%Romania 247 <1% 258 <1% 273 <1% 267 <1%Slovakia 235 <1% 203 <1% 166 <1% 168 <1%Bulgaria 107 <1% 77 <1% 157 <1% 91 <1%Slovenia 101 <1% 192 <1% 95 <1% 202 <1%Others 214 <1% 217 <1% 1,001 <1% 923 <1%Non-OECD Europe total 4,629 3% 3,703 2% 4,628 2% 4,385 2%China 24,751 14% 26,809 15% 35,330 17% 36,467 18%Indonesia 2,635 1% 2,143 1% 2,753 1% 2,810 1%India 1,870 1% 2,132 1% 2,375 1% 2,392 1%Thailand 503 <1% 718 <1% 436 <1% 1,007 <1%Turkey 354 <1% 500 <1% 203 <1% 621 <1%Others 719 <1% 1,196 1% 3,327 2% 3,853 2%Non-OECD Asia & Oceania total 30,832 17% 33,498 19% 44,424 21% 47,150 23%Brazil 6,225 3% 4,258 2% 7,144 3% 4,363 2%Chile 2,123 1% 479 <1% 4,056 2% 514 <1%Argentina 822 <1% 768 <1% 1,005 <1% 535 <1%Colombia 307 <1% 380 <1% 476 <1% 642 <1%Venezuela 165 <1% 358 <1% 124 <1% 195 <1%Others 139 <1% 227 <1% 498 <1% 718 <1%Non-OECD Americas 9,781 5% 6,470 4% 13,303 6% 6,966 3%South Africa 1,547 1% 1,177 1% 1,888 1% 1,693 1%Swaziland2 200 <1% .. .. 99 <1% .. ..Morocco 104 <1% 60 <1% 9 <1% 68 <1%Kenya 66 <1% 71 <1% 143 <1% 143 <1%Egypt 60 <1% 124 <1% 77 <1% 105 <1%Others 154 <1% 276 <1% 204 <1% 344 <1%Africa total 2,131 1% 1,708 1% 2,419 1% 2,353 1%Non-OECD total 47,373 26% 45,379 25% 64,774 31% 60,854 29%World total 179,083 178,418 208,009 207,540Notes: 1. It is not really possible to compare actual consumption and production in 1996 with the projection for 2010,
because the projection is a projection of the trend and consumption and production in 1996 was significantlyabove this trend. Consequently, the growth trend in consumption and production is higher than theappearance given here.
2. Net exports of sawnwood from Swaziland were greater than officially recorded production in 1996, soconsumption can not be accurately estimated..
4.5 Paper production and consumption
Current and projected paper and paperboard production and consumption is shown in Table16. As with the market for pulp, OECD countries have a dominant share of the global marketfor paper, accounting for nearly 80% of global production and 75% of global consumption.However, OECD countries as a whole are net exporters to non-OECD countries.

A Whiteman, C Brown and G Bull
_________________________________________________________________________________________Forest product market developments
38
Again, China is the only non-OECD country with a significant paper market and non-OECDAsia and Oceania holds the largest global share of paper production (15%) and consumption(18%) of all the non-OECD regions.
As with other product categories, the share of the global market held by OECD countries isexpected to decline by 2010. Production share will fall back 3% to 76% as less developedcountries expand their production capacity more rapidly than OECD countries. Consumptionshare will fall back only slightly, by 1% to 74%.
Paper consumption growth in most non-OECD countries is expected to exceed growth in theOECD countries by a wide margin. However, due to the currently extremely low levels ofconsumption in many of these countries, this is not expected to change the picture of globalsupply and demand by very much in the near future.
In terms of future paper (and pulp) production, the main uncertainty about the forecastpresented here concerns the large area of pulpwood plantations which have been establishedin many tropical countries over the last decade or so. The potential volume of fibre which canbe produced from these plantations is huge and this is shown in the projections of the GFSM.However, although these potential supply increases are incorporated in the GFPM, the latteris somewhat constrained to follow trends starting from existing patterns of productioncapacity. If large volumes of cheap available fibre in Asia and South America were tosuddenly emerge over the next 10 years or so, this could change production costs and result ina shift in manufacturing capacity into these regions.
The extent to which this might occur will depend on several factors including: the ease withwhich the complex processing technology required for pulp and paper manufacturing can beintroduced into many of these countries; the comparative cost of other factors of production;and the competition for this resource from the reconstituted panels sector (see above). Ifconditions are favourable, production could shift on a scale which is noticeable at the globallevel. If not, some of these countries could be left with a large resource without a market.

FAO Paper for the World Bank Forest Policy Implementation Review and Strategy
_________________________________________________________________________________________Forest product market developments
39
Table 16: Current and projected paper production and consumption by region andcountry
Region 1996 2010 (projection)Production Consumption Production Consumption
(1,000 MT) % (1,000 MT) % (1,000 MT) % (1,000 MT) %OECD - Europe 75,544 27% 68,652 25% 103,608 26% 95,186 24%OECD - Asia and Oceania 41,581 15% 42,645 15% 61,676 16% 61,876 16%OECD - Americas 106,634 37% 97,911 35% 133,247 34% 130,881 33%OECD total 223,759 79% 209,208 75% 298,531 76% 287,943 74%Russian Federation 3,212 1% 1,788 1% 4,252 1% 3,563 1%Slovenia 460 <1% 368 <1% 1,013 <1% 910 <1%Hungary 363 <1% 522 <1% 457 <1% 753 <1%Romania 332 <1% 320 <1% 433 <1% 402 <1%Slovakia 327 <1% 190 <1% 321 <1% 377 <1%Others 698 <1% 1,049 <1% 1,788 <1% 2,031 1%Non-OECD Europe total 5,392 2% 4,238 2% 8,263 2% 8,036 2%China 30,253 11% 32,917 12% 50,980 13% 48,098 12%Indonesia 4,386 2% 3,372 1% 5,014 1% 4,278 1%India 3,025 1% 3,369 1% 4,338 1% 4,340 1%Thailand 2,241 1% 2,506 1% 1,863 <1% 3,081 1%Turkey 1,235 <1% 1,772 1% 1,128 <1% 1,366 <1%Others 1,856 1% 6,414 2% 6,403 2% 14,610 4%Non-OECD Asia & Oceania total 42,996 15% 50,350 18% 69,728 18% 75,772 19%Brazil 5,885 2% 5,574 2% 7,714 2% 6,376 2%Argentina 1,108 <1% 1,630 1% 947 <1% 2,006 1%Venezuela 735 <1% 799 <1% 1,047 <1% 801 <1%Colombia 676 <1% 961 <1% 1,194 <1% 1,236 <1%Chile 597 <1% 606 <1% 910 <1% 873 <1%Others 540 <1% 1,968 1% 2,005 1% 2,690 1%Non-OECD Americas 9,541 3% 11,538 4% 13,817 4% 13,982 4%South Africa 1,871 1% 1,708 1% 2,439 1% 2,616 1%Egypt 221 <1% 483 <1% 232 <1% 824 <1%Kenya 129 <1% 149 <1% 268 <1% 276 <1%Morocco 106 <1% 239 <1% 189 <1% 356 <1%Tunisia 90 <1% 154 <1% 66 <1% 219 <1%Others 278 <1% 671 <1% 420 <1% 926 <1%Africa total 2,695 1% 3,405 1% 3,614 1% 5,217 1%Non-OECD total 60,624 21% 69,531 25% 95,421 24% 103,007 26%World total 284,383 278,740 393,952 390,950
4.6 Major bilateral trade flows
The last section of this report showed the broad inter-regional trade flows of wood and woodproducts and previous parts of this section have noted some of the world's major wood andwood product importers and exporters. Before concluding, this section will present a littlemore detail about some of the main trade flows of wood and wood products currently takingplace.
Unfortunately, the GFPM in its current formulation, does not produce projections for country-to-country or region-to-region trade flows, but only produces projections for exports andimports (to the rest of the world) for each country. The model is also based on economicrationality and fails to capture some of the significant impacts of trading policies on trade

A Whiteman, C Brown and G Bull
_________________________________________________________________________________________Forest product market developments
40
flows. However, an attempt will be made to describe some of the changes in trade flowswhich may occur over the period to 2010, based on a careful interpretation of the model'sresults and a general appraisal of current trends in wood and wood products trade.
4.6.1 Current trade flows by product and region
In terms of international wood and wood products trade, a handful of major exporting andimporting countries appear at the top of the trade tables for nearly all products. To a largeextent, major producers are also major exporters and major consumers are also majorimporters. The only exceptions to this rule are United States of America, Japan and Chinawhich are both major producers and importers of some wood products.
Of the OECD countries, major exporter countries include: United States of America(industrial roundwood and all products); Canada, Finland and Sweden (most products); andAustralia and New Zealand (industrial roundwood). Of the non-OECD countries, majorexporters are: Russian Federation; Chile and Malaysia (industrial roundwood and someproducts); Indonesia and Brazil (some products).
Major importers in the OECD include: Canada and Finland (industrial roundwood); Japanand Republic of Korea (industrial roundwood and most products); and United States ofAmerica, United Kingdom, Germany, Italy and France (some products). The only major non-OECD importer is China. The main trade flows by product are set-out below.
Industrial roundwood. The largest trade flow of industrial roundwood occurs betweencountries on the Pacific Rim. Six countries (United States of America, Russian Federation,Chile, Australia, Malaysia and New Zealand) export industrial roundwood to Japan, Chinaand Republic of Korea. Together, these activities accounted for around 50 million m3 ofindustrial roundwood trade in 1995 or 43% of the global total of 113 million m3. The onlyother major industrial roundwood trade flow is from United States of America to Canada(4.5 million m3).
Industrial roundwood (tropical). Despite the attention given to tropical roundwood trade,trade flows of tropical logs are actually very small (14% of total industrial roundwood trade).The only major exporter is Malaysia which, joined by Papua New Guinea and Solomon Isles,exports to Japan, Republic of Korea and China. African exports are also fairly low. The twolargest exporters (Gabon and Cameroon) export to a range of European and Asian Countries.
Sawnwood. Total trade in sawnwood in 1995 was 107 million m3. Exports from Canada toUnited States of America accounted for 40 million m3 of this. Exports from Canada andUnited States of America to Japan and from Sweden and Finland to the rest of Europeaccounted for much of the rest of world trade. The Russian Federation and Malaysia are theonly significant non-OECD sawnwood exporters and exported to a broad range of countries.
Wood-based panels. Total trade in wood-based panels amounted to 41 million m3 in 1995.Two trade flows are significant: Malaysia and Indonesia to China, Japan and Republic ofKorea (8.7 million m3 , mostly plywood); and Canada to United States of America (4.6million m3, mostly particleboard).

FAO Paper for the World Bank Forest Policy Implementation Review and Strategy
_________________________________________________________________________________________Forest product market developments
41
Pulp. Pulp trade is, perhaps, the most interesting of all because major countries involved inthe total trade of 33 million MT in 1995 can be found on four continents. The trading patternsare also quite complex. The largest individual trade flow is from Canada to United States ofAmerica (4.5 million MT). Significant trade flows also occur between these two countriesand Europe and Sweden and Finland and the rest of Europe. Canada and United States ofAmerica are joined by Brazil and Chile as major exporters to Japan, China and Republic ofKorea. However, Brazil and Chile are also significant exporters to United States of America.Outside Asia, this is the only major trade flow from non-OECD countries to an OECDcountry.
Paper. The main trade flows in paper products are similar to the trade flows in sawnwood.Canada exported 11 million MT to United States of America in 1995 (out of total global tradeof 69 million MT). The other main trade flows were from Canada, United States of America,Finland and Sweden to the rest of Europe. Interestingly, Asia is not a major trader in paperproducts. Only China is an importer of minor significance. Japan chooses to manufacturemost of its own needs from recycled fibre and imports of industrial roundwood (much ofwhich is imported in the form of chips).
4.6.1 Possible future trade flows in 2010.
As noted above, any forecast of trade flows in 2010 is likely to be highly speculative.However, the changes in supply and demand expected in the future might lead to the changesin trading patterns outlined below.
Industrial roundwood. Global industrial roundwood trade in the future will continue to beconcentrated around the Pacific Rim. Japan, China and Republic of Korea will continue tohave significant levels of demand for imported industrial roundwood, unless their tradingpolicies change or current exporters can provide them with finished products at verycompetitive prices. However, the extent to which they manage to continue to import asignificant proportion of their wood needs in the form of industrial roundwood, rather thanproducts, will largely depend upon export policies and industrial developments in thecountries currently supplying them.
There will be a significant increase in the availability of plantation-grown wood in some oftheir supplier countries. However, it seems likely that some of their current suppliers willdevelop significant wood processing industries of their own and may prefer to exportproducts in the future. The most likely to do this are the developed supplier countries, such asAustralia and New Zealand and, maybe, Malaysia. Consequently log export flows may shiftsomewhat towards countries which are some way behind these with the development of theirdomestic processing industries (e.g. in developing South America and Oceania).
A further potentially vast source of future supply in this area is Eastern Siberia. Expansion ofharvesting into this area will depend upon the economics of production and, to some extent,diplomatic relations in the region. It is anticipated, however, that production from this regionwill expand to fill-in an expected reduction in temperate industrial roundwood exports fromthe United States of America.

A Whiteman, C Brown and G Bull
_________________________________________________________________________________________Forest product market developments
42
In summary, the main centres of import demand are expected to remain the same, but theweight of the various exporting countries is expected to shift from United States of Americato Russian Federation in the northern hemisphere and from Southeast Asia and developedOceania to less developed Oceania and South America in the Southern Hemisphere.
Sawnwood. No major changes in the trade flows of sawnwood are expected in the future. Asalready noted, most international trade in sawnwood takes place between developed countriesand this is expected to continue in the future. China will become a larger importer ofsawnwood and is likely to have to rely on a wider range of countries to meet its import needs.A greater share of exports to China are also likely to come from outside Asia. Sawnwoodexports from the few significant developing country exporters (Malaysia, Russian Federationand Brazil) are also likely to decline as their domestic demand growth exceeds productiongrowth. Indeed, Russian Federation may remain the only large developing country exporter ofsawnwood by the year 2010.
Wood-based panels. Trading patterns in wood-based panels are also expected to remainmore or less the same in 2010. Of the three significant developing country exporters, exportsfrom Brazil and Indonesia are expected to remain roughly the same as production growthkeeps up with domestic consumption growth. In Malaysia, domestic consumption growth isexpected to exceed production growth, leading to a decline in exports. China, Japan andRepublic of Korea will therefore, have to look elsewhere for some of their future wood-basedpanel imports.
As already noted, the majority of wood-based panel exports from developing countries are inthe plywood sector. Production in Malaysia is expected to decline somewhat over the periodto 2010 due to increasing log scarcity. To the extent that this affects Brazil and Indonesia,these countries may also see a decline in exports in the future rather than the constant level ofexports projected here. If this leads to upward price pressure in plywood markets, othercountries with substantial remaining natural forest resources (e.g. Papua New Guinea,Suriname and Guyana) or more mature plantations (e.g. Chile and Argentina) may choose todevelop greater export plywood markets. They would be unlikely however, to reach a globallysignificant scale within the time period of this analysis.
An alternative for many plywood exporting countries facing potential log shortages, would beto move into production of other types of wood-based panel. It is likely that this willeventually occur across the whole of Southeast Asia and some restructuring may take placeduring the period of this forecast. Again, it is unlikely however, that they would be able toreach a globally significant scale within the time period of this analysis.
Pulp and paper. The most interesting potential development in pulp and paper trade which isquite likely to occur over the period to 2010, is the continued increase in pulp exports fromSouth America (Chile, Argentina and Brazil) to Asia and, possibly, United States of America.This region has already developed the nucleus of a globally significant centre of pulpproduction and exports and it should be relatively simple to build on this base and expandproduction and exports further. (In the case of Brazil, these comments apply equally to thepaper industry). There will, however, be continued pressure (in terms of both productioneconomies and government policies) to integrate pulp production with paper production, thustending to limit expansion in the trade of pulp.

FAO Paper for the World Bank Forest Policy Implementation Review and Strategy
_________________________________________________________________________________________Forest product market developments
43
In contrast, two of the three largest Asian pulp and producers (China and India) producemostly non-wood fibre pulp and the only other significant producer (Indonesia) is stillrelatively inexperienced in this area. The rate at which pulping and papermaking capacity isinstalled and effectively managed in these and other countries, will have a profound impacton whether Asia's vast pulpwood plantation resource is left in the ground, produced andexported as chips or roundwood, or produced and exported as pulp and paper.
4.7 Overall synthesis of the main global market potentials
The preceding discussion has shown in greater detail, the countries or groups of countrieswhich are most significant at the global scale in terms of wood and wood product production,consumption and trade. The most important point this discussion has highlighted is that, ingeneral, production, consumption and trade of all wood and wood products isoverwhelmingly dominated by a small number of developed countries and that this situationis not likely to change by very much over the period to 2010.
Developing countries have a roughly 20% to 30% share of global production andconsumption of all wood and wood product categories and their shares of the differentproduct category markets are generally expected to increase marginally by 2010. Of the fourdeveloping regions identified in this analysis, Asia and Oceania is has by far the largestmarket for wood and wood products.
Developing countries which have been highlighted as globally significant in production,consumption and trade include: Russian Federation, China and Brazil (industrial roundwoodand all products); and Indonesia and Malaysia (as producers and consumers of industrialroundwood and most products and exporters of some products). Of the above countries, allare major exporters with the exception of China. India is also a major producer and consumerbut does not register as a major trading nation in wood and wood products markets.
Other developing countries of minor global significance or regional significance include:Chile and Argentina in South America; Turkey in Asia; and South Africa in Africa. It isinteresting to note that none of the developing European countries, with the exception ofRussian Federation, are of even minor significance in any of the wood and wood productcategories. This is probably due to their small size. However, it must also be noted that theyhave tremendous marketing opportunities by being located so close to Western Europe. Justas Japan has acted as a catalyst for forest product market development in Asia, countries suchas Germany, Finland, Sweden and Austria could (and indeed already are to some extent) dothe same in Eastern Europe.
In terms of individual countrys' forest products markets, it would appear that the mostinteresting developments over the next decade or so are going to arise in the Pacific-Rimcountries. This region is and will continue to be a major centre of production, consumptionand trade, including a considerable amount of trade between developing and developedcountries. Major developing country producers in the region face uncertainties regarding theirfuture supply from the natural forest and the large area of plantations that they havedeveloped. In turn, this will cause many of them to consider carefully the forest processingindustry developments they will wish to pursue over the next few decades. Given the

A Whiteman, C Brown and G Bull
_________________________________________________________________________________________Forest product market developments
44
timescale over which some of these changes might take place, they will have to examine suchchanges fairly soon.

FAO Paper for the World Bank Forest Policy Implementation Review and Strategy
_________________________________________________________________________________________Forest product market developments
45
Part 2: implications of thesupply and demand projections

A Whiteman, C Brown and G Bull
_________________________________________________________________________________________Forest product market developments
46

FAO Paper for the World Bank Forest Policy Implementation Review and Strategy
_________________________________________________________________________________________Forest product market developments
47
5. MAJOR DRIVING FORCES AND CHALLENGES FOR THEFUTURE
The first part of this report identified the main trends in wood and wood products marketswhich are likely to develop over the next decade or so. These trends are summarised belowalong with the major challenges facing the markets in the future.
5.1 Main market developments
Patterns of regional demand will not change by very much. The analysis has shown thatdeveloped countries currently account for 60-80% of forest product demand depending on thetype of forest product. This situation is not likely to change very much over the next decade.Rapid economic growth in Asia will increase the importance of this region as a consumer, butmuch of the demand and demand growth in Asia will continue to be dominated by Japan.Despite relatively slower projected consumption growth in North America and WesternEurope, the sheer size of these economies is likely to mean that they will also continue toconsume a substantial share of the worlds forest product output.
Growth in consumption will continue to shift towards consumption of paper andreconstituted panels. For several decades now, growth in consumption of paper andreconstituted panels has consistently been 1-2 percentage points above growth inconsumption of sawnwood and plywood in most countries and this trend is likely to continue.The only major exception to this is parts of Asia where demand for plywood is currently stillvery strong.
Importance of a few forest product suppliers at the global level. Despite the fact thatforest resources are generally distributed more evenly than income across the world, moreintensive use of forests and higher productivity rates in developed countries means that forestproduct supply is also quite concentrated in the hands of a few developed countries. Most ofthe world's wood production comes from temperate and boreal forests, which currentlyaccount for 80% of global supplies. Of the temperate and boreal countries, USA, Canada,Sweden and Finland account for 45% of global wood supplies. China and the RussianFederation are the next largest producers, with 7% and 4% shares of world productionrespectively. Of the tropical countries, Brazil is the largest producer with a 6% share of worldoutput. Indonesia, India and Malaysia are the only other significant producers with shares of2-3% each. This global dominance of a handful of countries is expected to continue in thefuture although, at the regional level, a few smaller producers may gain prominence (e.g.countries with large plantation resources such as South Africa, Chile and New Zealand).
Adequacy of wood supplies at the global level. The results of this analysis confirm theconsensus among recent studies, that wood supplies at a global level will be adequate to meetdemands for both industrial wood and wood fuel in the immediate future. However, the typesof wood which will be available in the future will be very different from what has beenproduced in the past. The natural forest will generally produce less wood in smaller log sizesthan previously except in the few countries where virgin natural forest will remain availablefor wood supply. Most growth in wood supply in the future is expected to come from forest

A Whiteman, C Brown and G Bull
_________________________________________________________________________________________Forest product market developments
48
plantations and trees outside forests, which have the potential to play a much greater role insupply than they have in the past.
Forest products trade. A general trend towards trade in higher value-added products hasbeen experienced in the past and is expected to continue in the future. This trend will besupported by the general thrust toward more liberal trade policies, through the World TradeOrganisation (WTO) and regional associations such as the Asia-Pacific Economic Co-operation forum (APEC) and Association of Southeast Asian Nations (ASEAN). Severalcountries already have trade restrictions on unprocessed forest products such as logs andrough sawnwood and these policies are expected to continue in the future.
5.2 Main challenges for the future
In terms of the future markets for wood and wood products, the main challenges facing theforestry sector will be to secure adequate wood supplies while meeting the social andenvironmental demands increasingly being placed on forests. There are undoubtedly enoughforest resources to meet future demand needs, but the crucial question which will be faced inthe future will be: from what mixture of natural forest, plantation and non-forest resourceshould future demands be met? Given that supply sources are likely to diversify, another issuewill be: how will the processing sector develop to accommodate these changes and what rolewill trade policies play in this transition? The main likely future challenges in each of theseareas are summarised below.
Pressure on supplies from the natural forest. It is expected that moves to take greater areasof natural forest out of wood production and declining harvesting volumes in the remainingareas, will put some pressure on wood supplies from natural forests. At a global scale, suchmoves may not have a major impact, but they may have more of an impact at the regionallevel. For example, greater scarcity of large logs in Asia will put pressure on plywoodproduction and encourage substitution by other types of panels in markets currentlydominated by plywood.
An increased role for forest plantations and trees outside of forests. It is anticipated thatforest plantations and trees outside of forests will play an increasing role in wood supplies inthe future. These resources will produce smaller log sizes and, more generally, a verydifferent type of wood than has been produced in the past. The main uncertainties withrespect to these supply sources will be the growth rates which will be achieved (particularly inforest plantations) and the extent to which these supply sources will substitute for productscoming from the natural forest. To a large extent, the degree of substitution achieved willdepend upon the pricing policies (for industrial roundwood from the natural forest) whichcountries pursue.
Changes in the structure of industrial processing capacity. The changes noted above willbe reinforced by the expected changes in forest product demand. The strongest levels ofdemand growth are anticipated in the reconstituted panels and pulp and paper sectors. Incomparison, only relatively slow growth in the demand for sawnwood and plywood isexpected in the future. This shift is important because the former can be produced from arange of fibre sources and do not require high quality, large logs for their production. Thechallenge facing the sector, will be to restructure the forest processing industry towards the

FAO Paper for the World Bank Forest Policy Implementation Review and Strategy
_________________________________________________________________________________________Forest product market developments
49
larger, more technologically complex processing plants required to produce these woodproducts. This challenge will be particularly acute in those developing countries which havedeveloped large sawmilling and plymilling sectors (e.g. several countries in Southeast Asia).
The potential role for technology improvements. Another way in which the forest sectormay choose to respond to the increasing wood product demand and changes in supply sourcescould be to strive for greater wood processing efficiency. Indeed, for the sawmilling andplymilling sectors, this may become of paramount importance. There is, as will be shownbelow, still tremendous scope to increase the efficiency of processing plants around the worldand such moves could go a large way towards accommodating the expected changes in woodsupply outlined above. As with the development of new sources of supply however, muchwill depend on pricing policies.
Globalisation and trading policies. The forestry sector will continue to rely on internationaltrade for a major share of revenues and, given the desire to trade in higher value-addedproducts, exporter countries will continue to seek access to high value markets in Europe andNorth America. Foreign investment will also continue to be important for the development ofthe sector in developing countries. Against this background, concerns about environmentalissues are likely to continue to play a role in forest products trade and investment andmeasures such as certification may become more important in the future for some exportercountries.
The remainder of this part of the report discusses in more detail some of these challenges,then attempts to draw-out the main conclusions of this analysis and implications for WorldBank involvement in the forestry sector.

A Whiteman, C Brown and G Bull
_________________________________________________________________________________________Forest product market developments
50

FAO Paper for the World Bank Forest Policy Implementation Review and Strategy
_________________________________________________________________________________________Forest product market developments
51
6. THE FUTURE AVAILABILITY AND MANAGEMENT OFFOREST RESOURCES FOR WOOD PRODUCTION
This section of the report discusses some of the changes which might be expected in thefuture in the availability of forest resources and the way in which they are managed. Itdiscusses the future potential availability for wood production of natural forest, plantationsand trees outside of forests. It then discusses the likely impact of SFM on future woodsupplies. It finishes by synthesising the main implications of these changes on forest productsmarkets.
6.1 Deforestation and competing demands for forest land
Deforestation is a major force affecting the future availability of forest resources for woodsupply both directly, through the total amount of forest in existence, and through the pressureit puts on forestry policy makers to take greater areas of forest out of wood production. Afterdiscussing deforestation in general terms, two specific demands on forest-land are discussedbelow: the conversion of forest land to agricultural uses and the placement of forests intolegally protected areas.
6.1.1 Deforestation: a brief overview
Table 17 summarises the regional changes in forest cover estimated by FAO in 1995 on thebasis of the 1990 Forest Resource Assessment. There is considerable variation betweenregions: South America has the highest level of deforestation in terms of area loss, whileAfrica has the greatest annual percentage loss of forest. In contrast, forest cover is actuallyincreasing in Europe and the countries of the former USSR. Given that the forest area changeis negative in all of the regions except one, deforestation can be expected to remain aprominent issue in the public policy debate over forests.
Table 17: Annual change in forest area by region estimated in 1995
Region Forest area Annual change (1990-95)1,000 ha 1,000 ha %
Africa 520,237 -3,748 -0.7Asia 503,001 -2,901 -0.6Oceania 90,695 -91 -0.1Europe 933,326 +519 +0.0North and Central America 536,529 -274 -0.1South America 870,594 -4,774 -0.5World 3,454,382 -11,269 -0.3
Source: FAO (1999c)
There is evidence that the rate of deforestation might be declining in some areas. Forexample, forest plantation programmes in a few countries (e.g. India and China) are slowingthe overall rates of deforestation in some regions. Recent research by the Center forInternational Forestry Research (CIFOR) in Latin America has also suggested that theconversion of forest to agricultural land there may be declining as small-scale farmers switch

A Whiteman, C Brown and G Bull
_________________________________________________________________________________________Forest product market developments
52
their attentions to secondary forest (or other wooded land) for the expansion of theiragricultural holdings.
The complexity of land-use changes which are currently taking place around the world washighlighted in the recent APFSOS, where it was shown that a range of land-use changes havebeen taking place in the Asia-Pacific region over the last few decades. Overall, deforestationin the region appears to have been slowing somewhat due to afforestation programmes insome of the largest countries in the region (e.g. China, India and Indonesia). Furthermore,other more complex patters of change were found to be at work within the region. Forexample, Australia and New Zealand are expanding forest area at the expense of agriculturalland, while China is expanding both agricultural land and forest area by cultivating previouslyunused land. Only some of the countries of Southeast Asia were found to be following thetypically expected model of conversion of forest land to agriculture.
Perhaps the most revealing insight of the analysis was the finding that the process of gradualforest degradation is making it increasingly difficult to talk simply about deforestation. Forexample, in terms of natural forest, deforestation in Asia is still very high. However, withhigh rates of plantation establishment, total forest loss each year is much less. Furthermore, ifforest is broadened to include other wooded land, the annual loss of forest and other woodedland each year is only about 20% of the figure for forest alone. This is because much of theforest lost each year still contains some trees and therefore, enters the other wooded landcategory.
Due to the complexity of the mechanisms encouraging deforestation and afforestation and thecurrent uncertainty about the way in which they operate, it would probably be premature tosuggest that, at the global scale, the rate of deforestation is increasing or declining. Therefore,the supply and demand projections presented earlier were made on the basis of an assumptionthat deforestation would continue in the future at roughly the same rates as in the past.
6.1.2 The demand for conversion of forests to agricultural land
Deforestation is driven by a range of factors including: deliberate conversion to other landuses; overgrazing; overharvesting of wood or non-timber forest products; wood fuelcollection; fire; and outbreaks of pests and diseases. Most of the deliberate conversion offorest areas to other land uses is probably accounted for by the conversion of forest land toagricultural uses. This is sometimes planned by the government (e.g. as in some cases inIndonesia) but is more often the result of shifting agriculture or overgrazing. Conversion toother uses such as opencast mining and reservoirs is also important in a few locations(e.g. Malaysia; Papua New Guinea; Nauru and New Caledonia).
There is no clear consensus about the extent to which deforestation is caused, directly orindirectly, by forest harvesting. Certainly, the forestry literature cites many examples of poorharvesting and over harvesting leading to negative environmental impacts around the world.Also, in a number of countries, industrial harvesting is generally recognised as a major causeof forest degradation, but rarely does harvesting alone lead to total loss of tree cover.Probably more important in facilitating permanent deforestation is the provision ofinfrastructure (roads, supply lines and communication facilities) associated with forest

FAO Paper for the World Bank Forest Policy Implementation Review and Strategy
_________________________________________________________________________________________Forest product market developments
53
harvesting operations, which assists with the process of settling previously undisturbed forestareas and expanding the agricultural frontier.
Given that conversion of forest-land to agricultural uses is probably still the largestdeterminant of forest loss in tropical regions, it is useful to examine the likely pressures thatdemands for agricultural land will place on the world's forest resources in the future.
The last global appraisal of the future demand for agricultural land was completed by FAO in1995 (Alexandratos, 1995). This showed that, in developing countries, future needs (to 2010)for greater agricultural production would be satisfied by two changes:
! increased cropping of existing agricultural areas, partly through an expansion ofirrigation, which would bring into production an additional 120 million ha of land whichis currently left fallow each year; and
! conversion of other types of land into agricultural land (about 90 million ha).
It was also predicted that the main areas of agricultural land expansion would be in Sub-Saharan Africa, Latin America and the Caribbean, with maybe a little expansion in East Asia.
Analysis of past land-use changes from the 1990 Tropical Forest Resource Assessment(FRA 90) suggested that about 85 million ha of forest in tropical countries might beconverted to agriculture over the 20 years 1990 to 2010. This would suggest that conversionof forest land to agriculture might account for about 64 million ha over the period 1995 to2010 or 70% of the requirement indicated by Alexandratos. However, it is also worth notingthat this figure implies that the conversion of forest to agricultural land accounts fordeforestation of about 4.3 million ha, or roughly 0.12%, per annum. This is only aboutone-third of the estimated total rate of global deforestation of 11 million ha/year, or0.3% per annum.
Based on these observations, it could be assumed that the conversion of forest land to formalagriculture may account for about one third of future forest area losses in developingcountries, much the same as in the past. However, conversion or degradation due to informalagriculture (i.e. shifting cultivation) may exert a greater pressure on forest resources than isimplied here.
It should be noted that the above projections only apply to developing countries. Forest areasin North America and Japan have not changed by very much in recent years and have beenincreasing in many European countries, Australia and New Zealand. Increased agriculturalproductivity and measures to enhance the environment are likely to continue to encourage theafforestation of agricultural and other types of land in many of these countries.
It should also be noted that conversion of forest to agriculture may not necessarily lead togreat reductions in potential wood supply. In places where large areas of forest have beenconverted to agriculture, the reduced supply of timber for local needs often results in theplanting of trees outside of forests in hedgerows, shelterbelts and small farm wood lots. Thiscan increase potential wood supplies from these types of resource dramatically, particularlywhere population is high. These sorts of changes, plus the trend towards afforestation of

A Whiteman, C Brown and G Bull
_________________________________________________________________________________________Forest product market developments
54
agricultural land in developed countries, could have the impact of increasing potential futurewood supplies, although probably not for several decades.
6.1.3 The placement of forest into legally protected areas
Increased interest in environmental issues in the 1980's and 1990's is a global phenomenonwhich has affected nearly all countries in the world. Greater concern for the environment hasaffected the way in which forests are managed in many countries and has started to affect themarkets for forest products as well. One of the ways in which it has started to affect theavailability of forest resources for wood supply is by placing greater pressure on policymakersto take natural forest areas out of production.
Figure 5: Growth in the global area of legally protected areas 1900 - 1994
0
2,000
4,000
6,000
8,000
10,000
12,000
14,000
1900/04 1910/14 1920/24 1930/34 1940/44 1950/54 1960/64 1970/74 1980/84 1990/94
Five year period
Num
ber
of s
ites
0
2,000
4,000
6,000
8,000
10,000
12,000
14,000
Are
a (i
n th
ousa
nd s
quar
e ki
lom
eter
s)
Total area designated as protected area
Number of protected areas sites
Source: WCMC
Figure 5 shows the growth in the number and total area of legally protected areas between1900 and 1994.16 Historically, the number and area of protected areas has increased by around8% each year. This has slowed down somewhat in recent years and annual growth in the areaof legally protected areas is currently a little over 4% while growth in their number is about3%. This amounts to an increase in the global area of legally protected areas of around150 million ha to 200 million ha every year.
The area of forest within legally protected areas has recently been estimated by the WorldConservation Monitoring Centre (WCMC) and CIFOR and is shown in Table 18. By
16 Legally protected areas for the purpose of this analysis have been defined as areas within national
protected designations corresponding to IUCN Categories I-VI.

FAO Paper for the World Bank Forest Policy Implementation Review and Strategy
_________________________________________________________________________________________Forest product market developments
55
comparing Figure 5 and Table 18, it can be seen that about one-quarter of the world's legallyprotected areas are forest areas. Furthermore, the total area of forest in legally protected areasis currently estimated to be just over 300 million ha or around 8% of the total forest area.
Table 18: Global area of forest17 and forest in protected area estimated in 1996
Region Forest area Forest in protected area1,000 ha 1,000 ha % of total
Africa 568,313 49,693 8.7Continental South and Southeast Asia 170,768 19,246 11.3Insular Southeast Asia 146,836 24,750 16.9Far East 145,603 7,740 5.3Middle East 16,766 639 3.8Australasia 149,323 12,582 8.4Europe 181,400 14,483 8.0Russian Federation 825,716 15,064 1.8North America 845,399 69,996 8.3Central America 90,198 8,810 9.8Caribbean 5,385 790 14.7South America 842,946 87,492 10.4World 3,988,792 311,284 7.8
Source: WCMC/CIFOR (1998)
In addition to forests in formally protected area systems, many countries have also restrictedor prohibited harvesting across parts or all of their forest estates (i.e. logging bans). Countrieswith complete bans on harvesting in their natural forests include: Thailand; Sri Lanka;Bangladesh; South Africa; El Salvador; and Uruguay; and China and Vietnam are believed tobe considering implementing such a move.
The projections of supply and demand presented earlier were based on an assumption that thearea of forest in legally protected areas or subject to other restrictions on harvesting would notchange in the future. Clearly, this is almost certainly unlikely to be the case. However, inorder to determine the effect that the future placement of forests into protected areas will haveon the future availability of wood supplies, it is necessary to make an assumption about howmuch forest will be placed in legally protected areas in the future.
Past trends would suggest that maybe around 30 million ha to 50 million ha of forest might beput into protected areas globally every year, but this figure seems rather high (for example, by2010, this would result in 20% of the world's forest area being placed in protected areas).Therefore, for the purpose of this analysis, it was assumed that an amount of forest would beput into protected areas such that 10% of forest area in every country would be in protectedareas by the year 2010. This figure (10%), is a target which has been recommended by severalenvironmental organisations working in this field.
The amount of forest which would have to be placed into protected areas to meet a 10% targetis shown in Table 19. Globally, just under 110 million ha would have to be placed intoprotected areas to meet such a target. According to FAO statistics, the regions where mostforest would have to be placed into protected areas to meet such a target would be: South
17 Due to differences in definitions, the area figures presented here differ slightly from those presented
from FAO sources.

A Whiteman, C Brown and G Bull
_________________________________________________________________________________________Forest product market developments
56
America; North and Central America; and Africa. A considerable area of forest in Europewould also have to be put into protected areas, mostly in the Russian Federation.
Table 19: Forest area in protected areas in 1997 and amount required to meet a 10% target
Region Forest area (1,000 ha) Area in protected areas (1,000 ha)Available forwood supply
Unavailable forwood supply
Current Required to meeta 10% target
Africa 166,461 233,157 34,058 18,486Asia 223,207 175,077 75,659 4,682Oceania 26,274 61,593 13,850 2,271Europe 645,651 187,503 78,806 8,853North and Central America 332,168 288,700 33,637 31,629South America 155,492 707,062 51,200 42,042World 1,549,253 1,653,092 287,210 107,962
Source: FAO (1999a)
6.2 The development of forest plantation resources
Forest plantations18 presently constitute only a very small proportion of the world's totalforest area. The global area of forest plantations is currently estimated to be just over120 million ha, or approximately 3.5% of total forest area (see Table 20). Forest plantationsrepresent, however, an extreme of management intensity, usually focussing on wood-fibreproduction. Consequently, the importance of forest plantations in terms of both their actualand their potential contribution to meeting global demands for wood fibre is far greater thantheir share of total forest area would imply.
Table 20: The estimated global distribution of forest plantation resources in 1995
Country or region Industrialforest plantation area
(million ha)
Non-industrialforest plantation area
(million ha)
Total forestplantation area
(million ha)Africa 3.6 2.2 5.7Asia 41.8 15.1 56.9 China 17.5 3.9 21.4 India 4.1 8.3 12.4 Japan 10.7 0 10.7Oceania 2.7 <0.1 2.7 Europe 8.7 0 8.7 Former-USSR 22.2 0 22.2 Russian Federation 17.1 0 17.1North and Central America 18.9 0.3 19.2 United States 18.4 0 18.4South America 5.4 2.8 8.2World 103.3 20.4 123.7
Sources: FAO, UNECE, Pandey (1997).
18 The UN-ECE/FAO Temperate and Boreal Forest Resources Assessment 2000 defines plantation(s) as:
"Forest stands established by planting or/and seeding in the process of afforestation or reforestation.They are either: forests of introduced species (all planted stands), or intensively managed stands ofindigenous species which meet all the following criteria: one or two species at plantation; even ageclass; and regular spacing". This is the definition that has been used for this analysis.

FAO Paper for the World Bank Forest Policy Implementation Review and Strategy
_________________________________________________________________________________________Forest product market developments
57
There is considerable variation in the global distribution of forest plantations. The largestproportion of the world’s forest plantations can be found in Asia (just under 50%). However,as Table 20 shows, the five countries with the largest plantation areas collectively account fortwo-thirds of the global plantation resource.
Many countries around the world support forest plantation establishment in one way oranother and the level of incentives available to establish forest plantations partly accounts forwhy some countries have much greater forest plantation resources than others. Other factorsthat can partly explain differences between countries include: agricultural subsidy regimesand the availability and price of land; expected growth rates; and local market conditions forroundwood (see Brown (1999) for a further discussion of some of these issues).
6.2.1 Estimated current wood supply from forest plantations
Information about the source of roundwood production is not currently collected at the globallevel. Therefore, it has been necessary to estimate the level and proportion of currentproduction which might come from forest plantations, based on the area and age-structure ofexisting plantation resources, potential yields and harvesting losses and the availability ofother sources of supply in individual countries. The utilisation of plantation-grown wood hasalso been split according to the type of plantation, with an assumption that industrial forestplantations are used for industrial roundwood supply, while non-industrial forest plantationsare primarily used for wood fuel supply19.
Based on this information, the forest plantation supply model suggests that industrial forestplantations account for a relatively high proportion of industrial roundwood production(around 331 million m3 per year, which is equal to about 22% of global industrial roundwoodproduction), but only a modest share of wood fuel production (around 86 million m3 per yearor about 4% of global production). This is not surprising, given that trees outside of forests,such as woodlots and individual trees on agricultural land are often more convenient sourcesof wood fuel (see Section: 3.5.2 Sources of wood fuel supply for further information).The "bottom-line" is that current forest plantation production could be supplying around 12%of the world's total roundwood harvest.
It should also be noted that this varies considerably between geographical regions. Figure 6,for example, shows the estimated current industrial and non-industrial forest plantationharvests as a percentage of the total harvest of natural forest and plantation-grown industrialroundwood, wood fuel and total roundwood, in different regions. Plantation production forindustrial roundwood is particularly important in the Oceania region, where 80 percent ofindustrial roundwood is plantation-grown. Africa (35 percent), South America (27 percent)and Asia (23 percent) also have above average proportions of industrial roundwoodproduction in plantations. Production from plantations in a handful of countries in each ofthese regions – Australia, New Zealand, Chile, China, Japan and South Africa – is sufficientlylarge to put these regions ahead of the global average.
19 Plantations for wood fuel production are a major component of the non-industrial forest plantation area.

A Whiteman, C Brown and G Bull
_________________________________________________________________________________________Forest product market developments
58
Figure 6: Estimated production of wood from forest plantations as a percentage of totalwood production in 1995
Source: Brown (1999)
6.2.2 Factors affecting the future supply of wood from forest plantations
The extent to which wood from forest plantations is accepted in the market is determined byboth quantitative and qualitative dimensions. At a very broad level it is feasible to estimateapproximate aggregate yields from a given plantation resource base and thus, develop simplewood production forecasts (as was done above and is done regularly in the UK and NewZealand, for example). An equally important but far more difficult proposition however, is todetermine the degree to which future plantation production will be substituted for wood fromother sources. This is particularly important in countries that have large areas of naturalforest, but can also be important in countries where plantations are the major domestic forestresource. For example, Japan has a large domestic plantation resource but still chooses toimport a large proportion of its domestic industrial roundwood requirements each year asnaturally-grown industrial roundwood from other countries.
This point is exemplified by noting that a predominant strategy in evaluating plantationestablishment uses financial criteria as the key decision variable. Under current log pricestructures, plantation investment models based on internal rate of return (IRR) analysis, haveencouraged a weighting in establishment towards short rotation lengths and high-yield, fast-growing, industrial-grade species. For example, around 50% of identified tropical plantationsare either eucalyptus or fast-growing pine species. The likely trend, therefore, is thatplantation-grown wood will increasingly substitute for small-sized naturally grown wood, inthe markets for wood pulp and for the production of composite wood panels. The productsleast likely to be supplied to great extent by plantations in the future are consequently likely
����������������������������
���������������������������������������������������������������������������������������������������������������������������������������������������������������������������
�����������������������������������
��������������������������������������������������������
������������������������������������
������������������������������������������������������������������������
����������������������������������������
������������������������������������������������������� ��������
��������������������
���������������� ����������
��������������������
0%
10%
20%
30%
40%
50%
60%
70%
80%
90%
Europe Oceania North and CentralAmerica
South America Asia Africa Former_USSR World
Region
������Industrial Roundwood
���Fuelwood
Total Roundwood

FAO Paper for the World Bank Forest Policy Implementation Review and Strategy
_________________________________________________________________________________________Forest product market developments
59
to be slow-growing, high-value "luxury" timbers and large peeler logs used in producingveneer and plywood.
Another issue affecting the role plantations might play in future wood supply concerns theiracceptability from an environmental viewpoint. Despite the apparently key role plantationsmay play in meeting future wood demands, plantation programmes have been increasinglysurrounded by controversy. A number of criticisms have been levelled at plantations, theprominently that they: promote the loss of biodiversity; degrade soils and reduce soil fertility;deplete groundwater reserves; are susceptible to catastrophic loss through pests or disease;and destabilise the often fragile social fabric of rural communities, by reducing the amount ofland available to the poorest sections of society.
Examples can be found of all these faults. Equally, in almost every instance the majordifficulties can be overcome or countered through careful planning. Biodiversity (if it is lost)can be promoted through mixed species planting and silviculture that promotes thedevelopment of understorey species; soil degradation can be avoided by better landpreparation techniques; pest risks can be reduced by targeted research and development;social problems can be ameliorated by careful consideration of community-based issues inproject planning. The key to ensuring the future acceptability of forest plantationestablishment, is to ensure that they are established within the broad context of sustainability.
6.2.3 Future likely rates of plantation establishment
The future potential supply of industrial roundwood from forest plantations will depend upona number of factors. The most crucial factor will be the rate at which new planting issustained, although improvements in fields such as plant breeding, silvicultural techniques,plant survival and harvesting techniques, are all likely to contribute to greater productivity.This analysis has assumed that the latter variables will all remain unchanged and hasconcentrated on producing three future scenarios for new planting, in order to forecastpotential industrial roundwood supply from forest plantations through to the year 2050.
Scenario 1 provides a baseline forecast, by assuming that forest plantations are not expandedbeyond their current area and that all areas are replanted after harvesting.
Scenario 2 assumes that new planting will increase the forest plantation area at a constantrate of 1.2 million ha per annum in total (equal to 1% of the current area of forestplantations).
Scenario 3 assumes that the annual rate of new planting estimated in 1995 (4.71 million ha intotal) is maintained until the year 2010, after which it is reduced by 940,000 ha at the start ofeach of the following decades (i.e. until it declines to zero in 2050).
All three of these scenarios assume that the geographical distribution of the global forestplantation estate will not change (in other words, that any new planting will take place inproportion to the current share of forest plantations located in each country). However, theage-class structure (and hence the annual volume harvested) in each country will change overtime, in response to harvesting, replanting and new planting. The implications of these

A Whiteman, C Brown and G Bull
_________________________________________________________________________________________Forest product market developments
60
scenarios, in terms of plantation establishment by region and for the countries with mostforest plantations, are shown in Table 21.
Table 21: Industrial forest plantation areas in 2050 under three new planting scenarios
Country or region Scenario 1(million ha)
Scenario 2(million ha)
Scenario 3(million ha)
Africa 3.6 5.6 8.9Asia 41.8 64.8 119.5 China 17.5 27.1 68.3 India 4.1 6.4 11.7 Japan 10.7 16.6 12.4Oceania 2.7 4.2 5.7 Europe 8.7 13.5 15.3 Former-USSR 22.2 34.4 28.0 Russian Federation 17.1 26.5 21.1North and Central America 18.9 29.3 43.2 United States 18.4 28.5 41.2South America 5.4 8.4 13.6World 103.3 160.2 234.2
Source: Brown (1999).
Scenario 2 is notable for requiring only relatively modest, and seemingly plausible, increasesin plantation areas (+55%). For example, the 27.1 million ha proposed for China in 2050under Scenario 2 is markedly less than the 40.4 million ha currently planned in China to2050. Plantation development is, however, unlikely to be uniform across countries. Countriessuch as Chile and New Zealand have, for example, achieved isolated increases in plantationareas of 5% to 10% in a single year. Other countries have gone for extended periods withlittle or no plantation establishment. South Africa, for example, is not encouraging furtherafforestation because of water scarcity. Conversely, Australia has targeted the development ofa 3 million-hectare plantation estate (a trebling of the current estate) by 2020.
The areas implicit in Scenario 3 also seem to be generally achievable in physical terms.Institutional and policy constraints may, however, play a highly significant role in limitingplanting below the indicated levels. Two notable cases are China and the United States, bothof which would be required to maintain rates of plantation establishment higher (or forlonger) than seems likely at present. Some of this “excess” planting could, however, bespread across other countries without markedly affecting the results of Scenario 3. It isbelieved that these three scenarios cover the most pessimistic and optimistic likely futures forglobal rates of forest plantation establishment and their impacts on future potential woodsupply from plantations will be discussed at the end of this section.
6.3 The potential for increasing future wood supplies from trees outside of forests
Increases in the demand for wood products are often simplistically portrayed as leadingdirectly to increases in forest harvesting. While this may be true in a number of countries, itoverlooks the wide mixture of land-based and non-land-based resources which are currentlyused to meet wood and fibre demands. One such non-forest resource is trees outside offorests. As more information is collected about this resource, the important role that treesoutside of forests play in current wood supply and the potential they have for increasingsupplies in the future is gaining increasing recognition.

FAO Paper for the World Bank Forest Policy Implementation Review and Strategy
_________________________________________________________________________________________Forest product market developments
61
Trees outside of forests play important economic, social and environmental roles andnowhere are these roles more critical than in developing countries. They act as the primarysource of industrial roundwood, wood fuel and non-wood forest products in many countries,they often perform vital environmental function such as soil and water conservation and theycan provide multiple social benefits to both rural and urban populations.
This section describes what the resource encompasses, presents information about the extentof the resource in some countries and discusses some of the key issues related to the potentialwood supply from the resource.
6.3.1 What are trees outside of forests?
By definition, trees outside of forests include all areas of trees and woody crops not identifiedas forests. However, although there is a commonly accepted international definition offorests, there is not yet a definition of what should be counted as trees outside of forests.Therefore, definitions vary widely between countries, which makes it difficult to estimate andanalyse the extent of this resource at the global scale20.
Trees outside of forests undoubtedly encompasses a wide variety of situations, fromindividual trees to areas of woodland considered too small to count as forest under the agreedinternational definition. This analysis has not attempted to clarify exactly what trees outsideof forests should include. Rather, the analysis has accepted that definitions vary and hasincluded the wide range of resource types identified as trees outside of forests in variouscountries, including: agricultural tree crops; agro-forestry plantations; individual trees onagricultural and other land trees; home gardens; roadside trees; wood-lots; and other woodedland.
6.3.2 What is the extent of the resource?
Information about the area of trees outside of forests is not collected globally, so it is difficultto get an idea of the total global extent of the resource. Furthermore, because of the diversityof the resource, any statistics which are available are only likely to be partial. However, thereare some statistics on certain types of trees outside forests and a few countries (particularlywhere the resource is significant) have detailed statistics which give an idea of the diversityand importance of the resource in particular circumstances.
20 The exception to this is "other wooded land", for which there is an internationally agreed definition.
Other wooded land is not included as forest in international forestry statistics and is, thus, a componentof trees outside of forests.

A Whiteman, C Brown and G Bull
_________________________________________________________________________________________Forest product market developments
62
Table 22: Forest, other wooded land and agricultural tree crop area
Region Forest area(1,000 ha)
Other wooded land(1,000 ha)
Area of agriculturaltree crops harvested
in 1998 (1,000 ha)Africa 545,085 591,591 5,150Asia 497,359 162,911 19,813Oceania 71,467 106,336 616Europe 904,253 212,220 0North America 456,737 292,552 0Latin America & Caribbean 967,469 292,249 1,282World 3,443,370 1,658,859 26,861
Note: Agricultural tree crops defined as including: oil palm; rubber; and coconuts. Other significant agricultural tree cropsinclude fruit and nut trees, but these are not included here.
Two components of the trees outside of forests resource about which global statistics areavailable are other wooded land and agricultural tree crops. Table 22 summarises the areas ofthese two resources. As the table indicates, the area of these two resources is, in some cases,significant. For example, Africa has a greater area of other wooded land than it does of forest.Overall, the global area of other wooded land is about half the area of forest.
The area of agricultural tree crops shown in the table is less significant. In total, the area ofagricultural tree crops is only equal to about 1% of the area of forests, but in some regionsthey are relatively more important (e.g. Asia, where the area equals roughly 4% of the area offorests in the region). However, it should be noted that the area of agricultural tree cropsshown in the table does not include the area of fruit trees in each region. These are known tototal several million hectares in Asia and may equal several hundred thousand hectares ineach of the other regions. Furthermore, the table shows the area harvested and does notinclude the area of immature crops not yet ready for harvesting in each region. Recent work inthe APFSOS showed that if fruit trees and immature crops were also to be counted, the areaof agricultural tree crops in Asia could equal the area of forest plantations.
Table 23: Area of forest and trees from homesteads contributing to wood supply inBangladesh
Year Forestarea
(1,000 ha)
Area of trees outside offorests from homesteads
(1,000 ha)
Total area used forwood supply
(1,000 ha)
Share of productivearea from homesteads
(%)1966 719 360 1,079 331970 532 360 892 401975 214 400 614 651976 217 360 577 621977 290 360 650 55Since 1980 60
Sources: FAO (1981)
Most of the countries where statistics about trees outside of forests are readily available are inSouth Asia, where the resource contributes significantly to wood supply. For example, Table23 shows the contribution of homesteads (i.e. small farm woodlots) to wood supply inBangladesh. With the gradual loss of forest cover experienced in Bangladesh since the 1960's,homesteads have increased in prominence in the country's wood supply and now provideapproximately 60% of the total wood supply. Other examples of the contribution of thisresource to wood supplies are given at the end of this section.

FAO Paper for the World Bank Forest Policy Implementation Review and Strategy
_________________________________________________________________________________________Forest product market developments
63
6.3.3 The potential to increase wood supplies from trees outside of forests
In order to estimate the potential for wood supplies from trees outside of forests, it isnecessary to have information about both the area of the resource and the level of stocking orgrowth of utilisable wood. As noted above, only partial information is available about areaand, unfortunately, even less is known about stocking and the growth potential of treesoutside of forests. Furthermore, as with forest plantations, the social and economic conditionswhich lead owners of the resource to turn potential yields into actual timber supply have to bebetter understood before forecasts can be made. However, from experiences gained in theAPFSOS, it is possible to make some general statements about the nature of wood suppliesfrom the resource and these are summarised below.
Ownership. In contrast to much of the worlds forest resources, trees outside forests arelargely in the hands of private owners and, to some extent, outside the control and regulationof forestry authorities. Therefore, the supply of wood from trees outside of forests is likely tobe more strongly influenced by social and economic factors and less influenced by forestrypolicy decisions than is, say, supply from natural forests and plantations.
Motivation to use for commercial wood supply. Following on from the above, experiencesuggests that in many countries at the moment, trees outside of forests are seen by largecommercial wood producers as a resource to be used as a last resort, when forests have beendepleted or placed under harvesting restrictions. This is largely as a result of pricing policies,where it is often cheaper to access forest resources (particularly if they are controlled by thegovernment) rather than purchase wood from smallholders, farmers and others, at somethingcloser to a competitive market price.
Motivation to plant. Similarly to the point raised above, trees outside of forests are ofteninitially planted by individuals to provide a wide range of goods and services, when naturalforests have been depleted in the areas in which they live. However, systems of land tenurecan complicate the picture (for example, in some countries, areas of natural forest are clearedand planted with crops and trees to establish a right to use the area). There are also now someschemes (e.g. outgrower schemes in India) whereby commercial forestry interests are payingfarmers and other landowners to plant trees to secure future wood supplies. Planting formulti-purpose benefits is a prominent feature of trees outside of forests in both developed anddeveloping countries.
Potential yields. Although areas containing trees outside of forests often have low stocking(a few trees per hectare), the lack of competition and the fact that these areas of land are oftenmore fertile (and may be improved with additional nutrient inputs) can lead to very highyields. Thus, for example, one hectare of agricultural land containing 5% tree cover growingat 20 m3/ha/year, can sustainably supply the same amount of wood as a natural forest with100% stocking but only growing at 1 m3/ha/year. High yields are often also common because,due to the fact that much of the resource is privately owned, the resource is often wellmanaged and maintained.
Management for multiple-use benefits. Given that trees outside of forests are oftenmanaged as part of an agricultural enterprise and for a range of expected benefits, decisions to

A Whiteman, C Brown and G Bull
_________________________________________________________________________________________Forest product market developments
64
cut them for timber supply can be influenced by a range of factors other than wood prices.For example, in many developed and developing countries around the world, farm woodlotsare managed as a store of value and are only cut to cover large irregular expenses. Woodlotowners in Asia appear to have started to take greater interest in the commercial timber valueof their timber resources and manage them for timber production. However, it may be moredifficult to persuade such owners to supply timber in Africa, where the non-timber benefits oftrees (e.g. food security) generally vastly outweigh their potential commercial value.
Many of the points raised above have interesting implications both for the future for woodsupplies and the achievement of other policy objectives, such as the development of small andmedium-sized enterprises, alleviation of rural poverty and sustainable development. Thesewill be discussed in the concluding chapter of this report.
6.4 The impact of Sustainable Forest Management on future wood supply
The concept of Sustainable Forest Management (SFM) has increased in prominence in thepublic policy debate about forest management over the last decade. Policymakers are slowlyreaching a consensus as to what the concept means exactly and how it can be implementedand the implementation of SFM could have a significant impact on future wood supplies.
6.4.1 A brief explanation of Sustainable Forest Management
SFM is primarily a systematic approach to sustaining each component of the forest ecosystemand sustaining interactions between the components. In natural forests, this usually meanscombining wood production with other management objectives and, above all, maintainingecological capacity through the conservation of plant and animal biological diversity and soiland water conservation.
Similar intentions are not specified as clearly in the classic management concept of sustainedyield. It is now, however, generally agreed that forest management must systematicallyaddress a fuller range of environmental, social and economic issues. Box 5 presents asummary of major differences in management approaches between the two concepts of SFMand traditional sustained yield forestry.
Measures to encourage the implementation of SFM have started to be introduced at theinternational and national level. At the international level, several groupings of countries areworking on mechanisms to measure and report criteria and indicators for SFM. At thenational level, countries are revising legislation and introducing policies such as new codes offorest practice to incorporate wider objectives, such as those outlined in Box 5, into forestmanagement. The extent to which SFM is implemented will primarily depend upon the costof such measures and the extent to which forestry administrations monitor and enforcecompliance with the policies to encourage SFM they are currently introducing.

FAO Paper for the World Bank Forest Policy Implementation Review and Strategy
_________________________________________________________________________________________Forest product market developments
65
Box 5: Typical contrasts between Sustainable Forest Management and sustained yield
Sustainable Forest Management Sustained yield forestry
Maintain the productivity of the forest, by avoidingerosion, soil degradation, and impoverishment of thesoil ecosystem.
Emphasises productivity but tends to use intensivetechniques to replant or to use the least costregeneration technique.
Use practices that mimic natural disturbances to theextent that is feasible.
No emphasis on the mimicking of naturaldisturbances. Aesthetic impacts are considered, aswell as the silvicultural characteristics of species andeconomic considerations. Where feasible, stands oflow value species tend to be converted to high valuedspecies.
Seek harvesting methods that reduce the level ofdisturbance in the forest. This has primarily meantthat the size of clear-cut areas is being reduced andpartial harvesting systems are being used morewidely.
Increasing utilisation and reducing costs are theprimary motivations to change harvesting practices.Such motivations often have to be constrained byregulation (e.g. on clear-cut size).
Maintain wildlife populations and maintain species. Maintaining wildlife and non-timber species wasgenerally considered outside the purview of forestmanagers and applied biologists were primarilyconcerned about maintaining populations of gamespecies.
Maintain structural and biological diversity inmanaged forests.
The agro-industrial ideal was to have uniform rows ofsame sized, single species trees. Aestheticconsiderations and economic costs were primaryconstraints.
Source: Bull, Williams, and Duinker (1996)
6.4.2 The implications of Sustainable Forest Management for future wood supply
Two components of SFM which have the potential to affect future wood supplies are theincreased placement of forest areas into legally protected areas and changes in the way inwhich harvesting is carried-out in remaining forest areas. The former has already beendiscussed above, so the latter will be discussed here.
The largest potential impact of SFM on future wood supply will probably be through changesin harvesting regulations that are likely to be introduced. Most countries around the worldhave regulations the amount of wood which can be harvested from public (and sometimesalso private) forest lands and many also lay down rules about how, when and when the woodmay be cut. The achievement of SFM will, in many cases, require a revision of these rules(and, of course, stricter implementation of these rules - in many cases, implementation iscurrently very weak).
There is currently considerable debate and disagreement about exactly what measures wouldbe required so that a forest manager could then say that they are managing their forestssustainably. However, most current interpretations of SFM have resulted in a general trend

A Whiteman, C Brown and G Bull
_________________________________________________________________________________________Forest product market developments
66
towards a reduction in the amount of timber that can be harvested each year from areas ofnatural forest and plantations.
Measures that might be introduced in forest plantations include:
1. requirements to plant more native species and a greater diversity of species;
2. requirements to leave greater areas of open space around watercourses andother sensitive sites; and
3. measures to reduce the amount of artificial inputs (i.e. fertilisers andpesticides) added to forest crops.
Such measures will all generally tend to reduce the growth potential of plantations (althoughbetter silvicultural practices, the selection of faster growing trees and other technologydevelopments may offset this effect to some extent).
In terms of harvesting, in plantations and areas of natural forest where clear-cuttingharvesting systems are the norm, measures which might be introduced include:
1. alteration of rotation ages away from economically optimum rotation agestowards ages which are more aesthetically pleasing and better for theenvironment (generally longer rotation ages);
2. changes in the size of areas which may be clear-cut as one contiguous area,probably reducing the average clear-cut area (and, consequently increasingoperating costs) in most cases; and
3. retention of areas of forest to grow to biological rotation age in order toprovide seed, maintain wildlife habitats and reduce soil erosion (e.g. thevariable retention silvicultural system recently accepted for adoption by onemajor forestry company in British Columbia).
In plantations and natural forest where selection felling is more commonly applied, SFM mayinvolve increasing the minimum size of trees which may be felled, reducing the number ortype of species which may be felled in a given area (to conserve biodiversity) and extendingthe cutting cycle.21
All of these possible changes to harvesting regulations are likely to have the effect ofreducing the volume of timber which can be taken from a forest area in any one year. Theywill therefore, tend to reduce potential harvesting volumes in the short-run. However, in thelong-run, they may support a sustainable level of production that will exceed what would bepossible in later years if current harvesting systems were to be continued. It should also benoted that they will also generally tend to increase roundwood production costs (see below).
21 Similar to the rotation age in a plantation, the cutting cycle is the period of time which must elapse
before a forest manager is permitted back into an area which has been selectively logged in order totake a subsequent volume of timber.

FAO Paper for the World Bank Forest Policy Implementation Review and Strategy
_________________________________________________________________________________________Forest product market developments
67
6.5 Synthesis: implications of future changes in forest resource availability andmanagement for future wood production
The above sections described the main ways in which changes in future forest resourceavailability and management might affect potential wood supplies. This final section tries tosummarise and quantify these changes.
6.5.1 The effect of forest land-use changes on future potential supply
Two possible land-use changes were examined above as probably having the greatestpotential effect on future wood supplies: changes in the demand for agricultural land andchanges in the area of forest in protected areas or subject to other forms of harvestingrestrictions.
As has already been noted, the expected future demand for agricultural land is only about onethird of the expected future rate of deforestation, which has been built into the calculation ofthe baseline supply projections presented earlier. If a greater share of the world's future foodproduction requirements were to be satisfied by a higher rate of conversion of forest land toagricultural uses, there is a considerable additional area of forest conversion to other land usesalready built into the estimates of future deforestation to believe that such an increase couldbe accommodated without significantly increasing the deforestation estimates used here.Thus, it is believed that any such changes are unlikely to have a significant impact on futurepotential wood supplies. This view is reinforced by the fact that, as will be shown below,agricultural land can also be a significant source of future wood supply from trees outside offorests.
The amount of forest which would have to be placed into protected areas to meet a globaltarget of 10% was shown in Table 19. If such a target were to be achieved, the impact onfuture supply potential would depend upon the type of forest areas taken out of production.
As Table 19 showed, the amount of forest which would have to be removed from productionto meet such a target is far less than the amount of forest already assumed in the GFSM, to beunavailable for future wood supply at the broad regional level. Even at the individual countrylevel, there are only a handful of very small countries which are already harvesting in or haveaccess to such a large extent of their forest estate that such a move would necessarily reducethe area available for wood supply.
Therefore, given that currently inaccessible areas are more likely to be chosen for placing intoprotected areas (because they have been less disturbed) than areas currently available forwood supply, it seems likely that the achievement of a 10% forest protected area target couldbe achieved with minimal impact on future timber markets. However, to test a range of futurepossibilities, three scenarios for the future placement of forest areas into legally protectedareas have been constructed for this analysis and are shown in Table 24.

A Whiteman, C Brown and G Bull
_________________________________________________________________________________________Forest product market developments
68
Table 24: The effect on potential future wood supply of achieving a minimum of 10%forest in protected areas by the year 2010
Region Area removed from areaavailable for wood supply to
meet the target (1,000 ha)
Potential future wood andfibre supply in 2010 with
areas removed (million m3)
GFPMprojectionfor 2010
Low Medium High Low Medium High (million m3)Africa 0 7,700 18,486 81 77 72 86Asia 32 2,628 4,682 729 720 714 643Oceania 0 679 2,271 80 78 73 54Europe 14 6,864 8,853 893 884 881 632North and Central America 0 16,922 31,629 835 792 755 805South America 0 7,579 42,042 225 214 164 155World 47 52,231 107,962 2,843 2,766 2,659 2,375
Note: The potential future production estimate for North and Central America is a vast underestimate because potentialfuture recovery of recycled fibre has not been included in the official estimate for North America.
The low impact scenario assumes that all forest required to be taken out of production to meeta 10% protected area target (at the individual country level) has to come first from forestcurrently unavailable for wood supply. The high impact scenario assumes the opposite andthat forest available for wood supply will be placed into protected areas first. The centralscenario assumes that forest areas placed into legally protected areas will come from each ofthe two types of forest in proportion to their present relative sizes.
The areas remaining in production in each scenario are then simply multiplied in the table, bythe baseline estimate of future potential supply originally shown in Table 11 to give therevised estimates of future production potential shown in the right-hand half of Table 24. (Forease of reference, the baseline forecasts of total actual production from the GFPM are alsoshown on the far right-hand side of the table).
This simplistic calculation of the effect on potential supply of moving areas of forest intoprotected areas probably overestimates the impact of such moves. For example, the originalestimates of supply potential for all regions except North America, included supply fromrecycled and non-wood fibre which will not be affected by such changes. However, the resultsshown in Table 19 illustrate the generally minor impact such moves would have on futuresupply potential, in most regions and under most future scenarios.
Under the low impact scenario, only a tiny amount of forest available for wood supply wouldhave to be moved into protected areas, so the 10% target could be achieved with practicallyno impact on future wood supplies. Under the medium impact scenario, potential productionwould fall in each of the regions by between 1% in Asia and 5% in South America and wouldalso be likely to have little impact. Under the high impact scenario, production would fall ineach of the regions by between 2% in Asia and 27% in South America. This might start tohave an impact on future wood supplies in some regions.
Africa is the only region where transferring forest areas into protected areas might causereductions in production potential to lead to cuts in actual production. The figures for Northand Central America in Table 24 also show production potential dropping below the actualproduction forecast for 2010 under the high and medium impact scenario. However, it mustbe remembered that the enormous potential production of recycled fibre is not included in thefigures presented for this region.

FAO Paper for the World Bank Forest Policy Implementation Review and Strategy
_________________________________________________________________________________________Forest product market developments
69
Production potential in all of the other regions should be likely to remain high enough tocover industrial roundwood needs under almost all circumstances and even in Africa, theabundance of trees outside of forests may make it possible to achieve the 10% forest inprotected area target with minimal impact on timber markets.
6.5.2 Future supply from plantations and trees outside of forests
Based on the three scenarios of future industrial forest plantation establishment rates givenin Section 6.2.3 Future likely rates of plantation establishment, the forecasts of futurepotential industrial roundwood production from forest plantations shown in Figure 7 wereconstructed. These scenarios illustrate several features relating to potential future industrialroundwood production from forest plantations:
1. they show that the recent historically high rates of plantation establishmentwill ensure that potential wood production from forest plantations willsignificantly increase over the period to 2010 (to around 600 million m3/year);
2. they show that the current rate of forest plantation establishment will havelittle effect on potential production within the period to 2010; but
3. they also show that the current rate of forest plantation establishment will havea major impact on potential wood production over the longer term (adifference of about 700 million m3/year between the high and low forecasts bythe year 2020).
The forecast of total industrial roundwood supply and demand can not be reliably extended to2050, so it is difficult to assess the likely importance of forest plantations for future industrialroundwood supply in the very long-term. However, it is possible to make some tentativestatements based on a continuation of current trends in supply and demand. For example,scenario 1 (no new planting) is likely to be insufficient to keep pace with growth in industrialroundwood consumption in the long-term and additional new sources of wood or fibre (ornew technologies) would probably have to be found to satisfy future demands. Somethingclose to scenario 2 would probably roughly keep pace with increasing demand for industrialroundwood in the long-term and would result in current levels of harvesting in natural forestsand the use of non-forest fibre sources being maintained (unless other new fibre sources arefound or new technologies are introduced). Only under scenario 3, with its relatively largeimplications for land-use change, would forest plantations be likely to substitute for industrialroundwood production from natural forests. Scenario 3 suggests an expansion in forestplantation production to 1.5 billion m3/year (a level that is approximately equal to currentlevels of global industrial roundwood consumption).
As this analysis shows, the long-term production forecast from forest plantations is verysensitive to the assumptions made about future forest plantation establishment rates.Consequently, much is likely to be determined by the future availability of land for newplanting.

A Whiteman, C Brown and G Bull
_________________________________________________________________________________________Forest product market developments
70
Figure 7: Three forecasts of future potential industrial roundwood production fromforest plantations
Source: Brown (1999)
In the case of potential future wood supply from trees outside of forests, it was already notedabove that a current lack of data makes it extremely difficult to make any projections at aglobal scale. However, at a regional and country scale and for certain components of the treesoutside of forests resource, it is possible to make some rough estimates. This is particularlythe case for countries and regions where such resources might be most important. So, forexample, the Government of Sri Lanka has collected information about current sources ofsupply and some projections of potential wood production from trees outside of forests, asillustrated in Table 25.
0
200
400
600
800
1000
1200
1400
1600
1995 2000 2005 2010 2015 2020 2025 2030 2035 2040 2045 2050
Scenario 1
Scenario 2
Scenario 3
Potential supply from forest plantations (in million cubic metres)
Year

FAO Paper for the World Bank Forest Policy Implementation Review and Strategy
_________________________________________________________________________________________Forest product market developments
71
Table 25: Current and projected wood production from homesteads and other non-foresttree resources in Sri Lanka (in thousand m3)
Product and source Year1995 2000 2010 2020
Rubberwood peeler logs 7.8 7.9 8.4 8.2Sawlogs Home gardens 551.3 570.0 641.8 702.4 Rubber plantations 253.1 256.3 270.0 265.8 Coconut and Palmyra 168.0 202.4 210.9 154.3 Trees on tea land 75.9 75.9 75.9 75.9 Other perennials 65.6 68.6 74.9 81.9 Roadsides and settlements 4.7 4.8 5.1 5.2Poles Home gardens 786.6 813.2 822.6 831.7 Other perennials 45.6 47.7 52.1 57.0Total 1,958.6 2,046.8 2,161.7 2,182.4
Source: Government of Sri Lanka (1995)
As the above table shows, homesteads and non-forest trees generally are expected to supplymore sawlogs and more poles for local consumption over the next 20 years. Becauseharvesting is currently not allowed in forest areas and Sri Lanka is not a wealthy country, thissupply is vital to meet future domestic wood demands.
Table 26: Current and projected wood production from trees outside of forests in theAsia-Pacific region (in million m3)
Region SourceOther Agricultural land Other Total
woodedland
Agriculturaltree crops
Other cropsand pasture
land
1995Advanced Industrial Economies 6.4 2.0 16.5 1.6 26.5Newly Industrialising Economies 0.1 1.7 0.5 0.1 2.4North Asia 19.2 60.4 317.9 44.7 442.2Southeast Asia 17.2 115.6 60.4 8.7 201.9South Asia 9.7 44.6 133.3 12.4 200.0Pacific Islands 0.5 0.3 0.9 0.5 2.2Asia-Pacific 53.1 224.6 529.5 68 875.22010Advanced Industrial Economies 6.4 1.8 16.3 1.6 26.1Newly Industrialising Economies 0.1 1.6 0.5 0.1 2.3North Asia 19.0 143.1 308.9 43.3 514.3Southeast Asia 15.6 146.2 81.2 9.7 252.7South Asia 7.3 48.7 134.7 11.8 202.5Pacific Islands 0.4 0.4 1.7 0.5 3.0Asia-Pacific 48.8 341.8 543.3 67 1000.9
Source: FAO (1998)
The only region where detailed research into the future potential supply from trees outside offorests has been conducted is the Asia-Pacific region (FAO, 1998; Blanchez, 1998). Asummary of the current and future projected potential wood supply from trees outside offorests presented in the APFSOS is shown in Table 26. It should be pointed-out that some ofthese estimates are based on sparse data and that there is much uncertainty attached to theseforecasts. However, they can serve as a rough guide to the importance of this resource within

A Whiteman, C Brown and G Bull
_________________________________________________________________________________________Forest product market developments
72
the region. For example, they show that the recent and future projected increase in theestablishment of agricultural tree crops in the region (fruit orchards and plantations of oilpalm, coconuts and rubber) could have a significant impact on future wood supplies,particularly in North and Southeast Asia. Already some countries in the region (e.g. Thailandand Malaysia) are developing industries to take advantage of this resource.
It seems likely that Asia and Africa are the two developing regions where there is most scopefor increasing wood supply from trees outside of forests.
6.5.3 Changes in wood supply with the implementation of SFM
The main ways in which implementation of SFM may lead to a reduction in future harvestingvolumes were described above. Some quantitative estimates of future volume reductions andproduction cost changes are shown in Table 27. This table was constructed from a review ofthe forestry literature carried-out as part of the GFSM analysis. In many cases, the impactsshown in the table are based on a single study of a small area. Therefore, the results of thesestudies must be interpreted cautiously and not be seen as representative of whole countries,regions or the world.
Table 27: Summary of the findings of recent studies into the production cost and volumeimplications of implementing SFM around the world
Region Country Case study Short-termvolume reductions
Costimplications
North America Canada Clayoquot Sound 30-40% 8-25% costincrease
North America Canada White River 10-25% IncreaseNorth America Canada Seine River 24% n.a.Europe Sweden A Barklund 6-8% n.a.Asia Malaysia Sarawak 50% IncreaseAsia Malaysia Innoprise Corp. 6-8% 5% cost increaseAsia Malaysia Dermakot up to 100% n.a.Asia Indonesia Indonesian Plan 18.4% n.a.Asia Indonesia STREK Project 9 - 15% IncreaseLatin America Bolivia Chimanes 24 - 57% 35-67% loss in
profits to loggingcontractors
Latin America Brazil Paragominas up to 100% $ 72/ha increaseLatin America Brazil Precious Woods 24-57% 0% cost increase
but assumes moretrees ascommercialspecies
Latin America Suriname CELOS 9% 10-20% costsavings
Latin America Costa Rica n.a. IncreaseSource: FAO (1999a)
Most of the studies reviewed here suggest that the implementation of SFM is likely to resultin reductions in future harvesting volumes (per unit area), particularly in the short-term. In thetropical regions, they suggest reductions may be between 20% and 60%, but sometimes ashigh as 100%, depending upon circumstances. In the few studies of temperate and boreal

FAO Paper for the World Bank Forest Policy Implementation Review and Strategy
_________________________________________________________________________________________Forest product market developments
73
forests, they suggest generally lower volume impacts of between 10% and 40%. In the longer-term however, the literature also suggests that SFM will result in higher production than acontinuation of current harvesting practices through the maintenance of site productivity andthe retention and prevention of damage to immature trees (in selectively logged areas).
Less information is available about the impact of SFM on production costs, but whatinformation is available suggests that costs may rise by up to 25% in temperate and borealcountries. In tropical countries, the cost impact of implementing SFM could be much lower,say up to 5%. This is partly because current poor harvesting practices in many tropicalcountries are not only bad for the environment, but are also not very cost-effective. Therefore,the improved practices required to implement SFM may actually result in cost savings insome cases22.
Losses of harvesting volumes such as those suggested above would have profoundimplications for future wood and wood product supply and demand. The regions most likelyto be affected would be Africa and Asia, although some major temperate and borealproducers would also face significant challenges. Such losses could be replaced by suppliesfrom plantations and trees outside of forests, but again, this would require a significantrestructuring of the wood processing industry. However, the greatest uncertainty about thefuture impact of the implementation of SFM on harvesting volumes is likely to concern thetotal area where radical changes in current forest practices will be required. The above tablehas shown the possible impacts of changes in a few specific examples from around the world.It seems likely that there are large areas of forest where the impacts of the implementation ofSFM would be less than suggested above.
22 For example, there is a wealth of studies in the forestry literature to show how the implementation of
SFM techniques such as proper planning, road and skid-trail layout and reduced impact felling havelittle impact on costs and can actually reduce costs or increase the value of output in some cases.

A Whiteman, C Brown and G Bull
_________________________________________________________________________________________Forest product market developments
74

FAO Paper for the World Bank Forest Policy Implementation Review and Strategy
_________________________________________________________________________________________Forest product market developments
75
7. THE FUTURE FOR FOREST PRODUCT PROCESSING, MARKETING AND TRADE
The previous section of this report examined, in greater detail, the supply-side of the baselinewood and wood product supply and demand forecasts presented earlier. In particular, itexamined possible future changes in forest resources and the effect they might have on theavailability of future wood supplies. This section of the report discusses possible futurechanges which might take place on the other side of timber markets; in other words, changesin the demand for wood products and, through technology changes, the derived demand forindustrial roundwood.
With the exception of wood fuel and a few minor uses for round poles, all roundwood isprocessed to some extent before it reaches the final consumer. Sometimes this processing isfairly simple, such as sawing the wood; other processes such as pulping and the manufactureof reconstituted panels are considerably more complex. There have been considerablechanges in the efficiency of all of these processes in the past and it is expected that there willcontinue to be changes in technology in the future.
On top of technology changes, there are also changes in consumer preferences for finalproducts (e.g. sawnwood and paper) which can have an impact on the derived demand forwood and wood products. In particular, recent debate has focused on environmental concernsabout the production of wood and wood products. This has led to a number of initiativeswhich may affect the marketing of and demand for wood and wood products.
One final issue which will also be examined here is the impact which the increasingglobalisation of the world economy might have on the production and trade in wood andwood products. To a certain extent, the forest industry has always been a global industry. Alarge proportion of wood and wood product production is traded in international markets andforeign capital, skills and technology support production in many of the largest producingcountries in developing regions. However, both the potential changes in technology andchanges in consumer preferences referred to above are largely driven by developed countries,so increased globalisation may have an influence on how they affect developing countryproducers.
This section of the report is organised as follows: first, it describes current trends under eachof the above topics and the impact they might have on future wood and wood product supplyand demand. It then finishes by roughly quantifying the possible impact some of thesechanges might have on the markets for wood and wood products.
7.1 The impact of technology changes on the derived demand for wood and fibre
As in any other industry, the forest processing industry is constantly improving technology inresponse to changes in resource availability and in the pursuit of new markets and higherprofitability. There are three main ways in which technology changes affect the industry and,consequently, the balance of forest products supply and demand:

A Whiteman, C Brown and G Bull
_________________________________________________________________________________________Forest product market developments
76
1. in terms of raw material availability, new processes increase the types and quality ofwood and fibre which can be processed into useful products and increase the volumeand variety raw material resources which can be considered as available for futurewood supply;
2. in terms of end-uses, technological changes alter the patterns of demand for wood
products, many of which have very different wood raw material requirements; and 3. in terms of the production process, new processes and improvements to existing
processes can increase the amount of product which can be manufactured from a givenamount of wood and fibre input, effectively utilising another source of supply - forestprocessing residues.
There are many examples of how such changes have affected wood and wood product supplyand demand in the past. The development of a wide variety of different types of reconstitutedpanels have allowed the forest industry to manufacture products out of wood from vast areasof forest which were previously identified as containing mostly non-commercial species.Examples include the aspen forests of North America and birch woodlands across much ofNorthern Europe. In Southeast Asia, research into processing and effective marketing havesupported the development of a significant rubberwood processing industry.
The development of the reconstituted panel industry has also started to change patterns ofsolid wood consumption in end-uses such as furniture manufacturing and construction. Notonly do reconstituted panels tend to have higher product recovery rates than the sawnwoodthat they have started to replace in some markets, but they have also increased the recovery ofutilisable product from sawmilling itself by increasing the market for sawmilling residues.
The analysis presented below has investigated the likely future developments in each of theseareas for three main sectors: the paper and paperboard manufacturing sector; solid woodproduct production in developed countries and solid wood product production in developingcountries23.
7.1.1 Technology changes in paper and paperboard production
In terms of fibre supply and demand, the most noticeable changes in pulp and papermakingtechnology which have occurred in recent years have been changes in the acceptability of newfibre sources and in the end-uses of different types of paper. In contrast, fibre recovery in theactual pulp and paper production process has not changed by very much. For example, manyof the recent advances in waste recovery, such as better screening and recovery of effluents,have had beneficial environmental impacts, but have probably not increased fibre recoverydramatically for any particular pulping process.
The greatest technological change in the sector over the last three decades has been the movetowards the increasing use of recycled paper in the fibre furnish for papermaking. This has
23 The latter two parts of this investigation were carried-out with the assistance of the US Forest Service
Forest Products Laboratory in Madison, Wisconsin and Forest Research Institute of Malaysia.

FAO Paper for the World Bank Forest Policy Implementation Review and Strategy
_________________________________________________________________________________________Forest product market developments
77
been encouraged by the increasing costs of disposing of such waste material andenvironmental legislation.
Statistics showing historical trends in the use of recovered fibre in the overall fibre furnishhave been collected by FAO. Therefore, it has been possible to analyse these trends andincorporate an expected change in the future use of recycled fibre into the supply and demandprojections presented earlier. Currently, wastepaper recovery rates (the proportion of paperconsumption which is collected each year for recycling) vary from 10-15% in countries withabundant forest resources and low population densities to 65-70% in countries with highpopulation densities and limited forest resources. The baseline projections presented earlierhave assumed that the proportion of paper consumption collected and turned into recycledpaper will increase in line with historical trends, subject to an overall limit that the proportionof recovered fibre used in papermaking will not exceed 70%.
The historical trend in the use of recovered paper in the total fibre furnish can be inferredfrom Figure 1, which shows the proportion of pulp used in paper manufacturing falling from80% in 1970 to around 60% in 1996. Recovered paper and a small amount of fillers (e.g.china clay and bonding agents) account for the remaining volume of raw materials used inpaper production. It is expected that the trend shown in Figure 1 will continue and that, by2010, pulp will only account for about 50% of the inputs required to make paper. This trendis incorporated into the baseline projections presented earlier.
Even greater growth in the future use of recovered paper is technically feasible, but woulddepend upon two major factors: the economics of collection and recovery (i.e. the costs ofcollection and the value of recovered paper) and policy measures requiring or encouragingpapermakers to use such material.
Relatively high recovery rates are currently achieved in some developing countries wherepopulation is high and labour is inexpensive (e.g. India and China). However, the value ofrecovered paper is often low in developing countries where there is an abundance of cheappulpwood. Thus, in countries such as Russia and Indonesia recovery rates are somewhatlower than could be achieved given their relatively low labour costs and high levels ofurbanisation. However, it is unlikely that, without specific government intervention toencourage greater recycling (e.g. recycling laws or changes in pulpwood pricing policies),developing countries will increase their use of recovered paper beyond the levels incorporatedinto the forecasts presented earlier.
OECD countries (particularly those in Western Europe) have passed most of the majorchanges in legislation to encourage paper recovery. For example, the European Parliamentpassed a directive in 1994 requiring that member states must recover a minimum of 50% ofall packaging materials within five years of the implementation of the directive into nationallaws24. Some member states have individual initiatives which go beyond this (e.g. Germany).In the United States of America, the American Forest and Paper Association has established avoluntary target of 50% wastepaper recovery by the year 2000. Other highly urbanisedcountries such as Australia and Japan are also already major wastepaper recyclers, without theneed for much government intervention. Again, these developments have already been
24 EC Directive 94/62 on Packaging and Packaging Waste (EC, 1996).

A Whiteman, C Brown and G Bull
_________________________________________________________________________________________Forest product market developments
78
incorporated into the forecasts presented earlier and it is doubtful whether the use ofrecovered paper could be increased beyond these levels within the timescale of this analysis.
The other major raw material change which has occurred in the last few decades is thegrowing acceptability of hardwood species for pulp production. Traditionally, softwoodspecies have always been preferred for pulp production due to their long fibre length andstrength. However, improvements in the pulping process have enabled hardwoods to take agreater share of this market in recent years. For example, Figure 8 shows that the proportionof non-coniferous pulpwood production in total pulpwood production has increased from lessthan 20% in 1961 to 40% in 1997.
Figure 8: Production of coniferous and non-coniferous pulpwood 1961 - 1997
0
50
100
150
200
250
300
350
400
450
500
1961 1971 1981 1991
Year
Coniferous species Non-coniferous species
Source: FAO (1999b)
This development has encouraged the establishment of fast-growing plantations of hardwoodspecies across the world. For example, in the Southern United States of America, large fast-growing poplar plantations have been established for the production of pulpwood and a largeproportion of the vast areas of plantations in tropical countries have been planted witheucalypti and acacia for pulp production.
The move towards greater acceptability of hardwoods for pulping has, in part, also beenencouraged by changing end-use demands in the paper sector. The fastest growing sector ofthe paper market is the market for printing and writing paper. Such papers require highdensity, opacity and porosity. These are characteristics in which hardwood pulps excelcompared with their softwood alternatives. The trend towards demand for these types of paperwill also reduce fibre requirements because such paper has a higher content of non-fibre rawmaterials (e.g. bonding agents and fillers such as kaolin).

FAO Paper for the World Bank Forest Policy Implementation Review and Strategy
_________________________________________________________________________________________Forest product market developments
79
The above changes have already been built-in to the forecasts presented earlier in that thedifferent product recovery rates (for each of the paper products) have been incorporated intothe projections for derived pulpwood demand.
The only other major technological shift which may improve recovery in the near future is ifthe mixture of mechanical and chemical pulp in the overall fibre furnish changes. Due to thedifferences in the pulping process, it generally takes less raw fibre (roughly one cubic metre)to produce one metric tonne of mechanical pulp than it does to produce one tonne of chemicalpulp. However, chemical pulping is often a cheaper process due to lower energy costs and isthe preferred process for species with short fibre lengths such as hardwoods. Therefore,chemical pulp currently accounts for the vast majority of pulp consumption in most countriesof the world.
As mechanical pulping processes improve, it is expected that pulp consumption will shiftmore towards mechanical pulp. The model currently assumes that a gradual shift towardsgreater use of mechanical pulp will occur on the grounds of increased cost-effectiveness.Thus, for example, the proportion of total wood pulp consumption held by mechanical pulpincreases from 22% in 1996 to 27% in 2010 in the baseline projections presented earlier. Iftechnology allows mechanical pulp to substitute for chemical pulp even faster than iscurrently projected, this would have the impact of reducing future wood and fibrerequirements for pulping even further.
7.1.2 Solid wood product production in developed countries
Technological innovation has brought several new solid wood products to the market inrecent decades. Each time this has happened, these products have tended to help to extend theuse of forest resources. Particleboard (chipboard) production started on a commercial scale inthe 1950's, followed by oriented strand board production in the late 1970's and mediumdensity fibreboard production in the early 1980's. New products currently beginning to enterthe market in a major way include laminated veneer lumber, I-joists and strand lumber.
Figure 9 shows the increasing role that engineered wood products have played in the marketsfor solid wood products in the United States from 1950 to 1997. As the figure shows, aconsiderable amount of the growth in production of solid wood products over the last fourdecades has been met by development of these new products. In contrast, sawnwoodproduction has remained relatively static and plywood production, while growing at first, hasdeclined in recent years.

A Whiteman, C Brown and G Bull
_________________________________________________________________________________________Forest product market developments
80
Figure 9: New product developments in the markets for solidwood products in the UnitedStates of America since 1950
Source: Ince et al (1997)
This situation has been mirrored in most developed European economies except that, in manycases, the market share taken by reconstituted wood products25 has been even greater than inthe United States of America and Canada. Only in Japan has the market for solid woodproducts not experienced these sorts of changes to a significant extent.
The technology to produce such products and utilise them in situations where previouslysawnwood and plywood would have been used, has had a profound impact on the extent andtype of forest resources which can now be used for solid wood processing. The mostimportant impact has been that such products have enabled smaller sized trees and residuesfrom sawmilling and plywood manufacturing to be used to manufacture these products. Thishas greatly increased the supply of wood and fibre from sources that would have previouslybeen considered as non-commercial.
A similar impact has been that such changes have greatly increased the number of specieswhich can be used to manufacture solid wood products. Wood, because it is a natural product,can be very variable in terms of its strength, durability and workability. Consequently, allover the world, a few species have become the preferred species for manufacturing sawnwoodand plywood, because their properties have been researched, are generally predictable and arewell documented and well known.
25 Reconstituted or engineered wood products are solidwood products or panels other than sawnwood and
plywood. They include products such as: chipboard; hardboard; insulating board; oriented strandboard;glue laminated lumber; and medium density fibreboard.
1950 1990 1997
Year
0
20
40
60
80
100Million cubic meters
Softwoodlumber
Softwoodplywood
Particleboard
Hardboard
Medium densityfibreboard
Oriented strandboard
Laminated veneerlumber

FAO Paper for the World Bank Forest Policy Implementation Review and Strategy
_________________________________________________________________________________________Forest product market developments
81
Trying to introduce a new, less well known species to manufacturers of sawnwood andplywood is a slow and difficult task. However, with engineered wood products, it has beenpossible to take a wide variety of species and, through the manufacturing process, turn theminto an acceptable and predictable product. Thus, for example, species such as birch inEurope and Alder in North America were once regarded as non-commercial because theywere generally too small to peel or saw and didn't have many of the other properties desiredfor sawnwood or plywood. Now they can be chipped and turned into reconstituted panelswhich can be used in a variety of end-uses and are generally cheaper to produce than thesawnwood and plywood they have replaced.
The third impact on raw material demands has been that reconstituted panels generallyrequire less wood input per cubic metre of output. Thus, for example, sawnwood andplywood typically require 1.75 to 2.0 cubic metres of input to produce one cubic metre ofoutput in developed countries (and even more in developing countries because technologylevels tend to be lower). However, conversion rates for reconstituted products are generallylower than this and may be in the range of 1.2 to 1.6 cubic metres of input to one cubic metreof output.
In part these technological changes have been driven by increased scarcity of large logs intemperate and boreal forests as harvesting has moved from old-growth to secondary-growthnatural forests. Another major factor has been the availability of cheap wood residues, whichwere previously either used for pulp production or simply discarded if no local pulpwoodmarket existed. It is not uncommon now to find sawmills in Europe and North America withnear-100% product recovery rates when the residues from sawmilling are chipped and used inthe manufacture of pulp and reconstituted panels.
In terms of end-uses, technological improvements have also reduced the volume of productrequired to meet end-use needs or demands. Thus, for example, I-joists and laminated veneerlumber can be substituted for sawnwood in many end-uses such as roofing joists and beams.These products require a lower volume of wood than an equivalent piece of sawnwood tomeet a certain structural requirement. They can also be produced in longer lengths whichreduces the need for overlaps at seams, which further reduces wood requirements.
In contrast to paper and paperboard production, processing technology in the sawmilling andwood-based panels manufacturing industries has also improved dramatically over the last fewdecades. Spelter (1999), lists a whole range of ways in which sawmills in North America areincreasing the amount of product they can recover from each cubic metre of log input,including: better operator training; optimised sawing; curve sawing; and varying feed ratesinto the sawblade.
These improvements have helped to push product recovery rates (i.e. the volume ofsawnwood produced from a given volume of roundwood) up in the North Americansawmilling industry over the last 30 years. For example, Figure 10 shows that productrecovery rates in the Western United States of America increased from 42% in 1968 to 47%in 1992. This was slightly below projections made in 1973 (H C Mason and Associates,1973), but these improvements have been made against a background of slowly deterioratinglog size and quality in the region. However, it does mean that, for each cubic metre of woodinput, mills in this region managed to produce 0.5% more sawnwood output on average eachyear over this period. This rate of growth in recovery (0.5% per annum) may not seem like

A Whiteman, C Brown and G Bull
_________________________________________________________________________________________Forest product market developments
82
much, but it must be remembered that the projected growth to 2010 of sawnwood productionin North America shown earlier is also only a small figure (0.7% per annum).
Figure 10: Projected and actual product recovery in sawmills and plywood mills in theWestern United States of America 1968 - 1992
40%
45%
50%
55%
1967 1972 1977 1982 1987 1992
Year
Sawnwood H C Mason projection Plywood
Source: Spelter (1999)
The wood-based panel industry in North America has similarly developed someimprovements in processing technology which have increased recovery rates. Plywood millsnow use scanners to reduce waste at the start of peeling and improve clipping. Modernpeeling machinery can also peel down to a smaller core with retractable or telescopicspindles. This has pushed plywood recovery rates up from 45% to 55% over the last 30 yearsin some regions (see Figure 10 above).
In the manufacture of reconstituted wood panels, a range of technological improvements haveincreased product recovery. Larger logs can now be fed into the chippers or flakers andmodern machinery can make larger panels. Both of these improvements reduce trimminglosses. Heat conditioning the logs before they enter the process also reduces the production offines (small particles - e.g. sawdust - which can not be used in the final product) and bettergluing technology has reduced the amount of wood needed to make a board of a givenstrength. Reconstituted panels already have the best recovery rates of all solidwood products(up to 60% in the most technologically advanced mills), but many mills are somewhat behindin their adoption of new technology. There is therefore, still some scope for improvement inproduct recovery rates across the industry overall.

FAO Paper for the World Bank Forest Policy Implementation Review and Strategy
_________________________________________________________________________________________Forest product market developments
83
7.1.3 Solid wood product production in developing countries
Very little information is available about product recovery in developing countries. However,it is generally believed that many developing countries, particularly those with large forestresources, have much lower rates of product recovery than are typically found in developedcountries. It is also believed that there have not been any significant trends towards greaterefficiency in forest products processing in developing countries over the last 30 years.
To a large extent though, many of the opportunities for technological improvement outlinedabove are, if anything, even greater in developing countries than they are in developedcountries. There are two reasons for this. Firstly, at least in the case of tropical countries, theaverage size and quality of industrial roundwood harvested from the forest is generally higherthan would be found in most developed countries. Secondly, the required quality of productsin developing countrys' domestic markets are generally lower than would be found indeveloped country markets. Therefore, many of the conversion losses associated withproducing a high-quality finished product might not apply to many developing countrieswhere a slightly lower quality of product is generally acceptable.
There are however, a few examples where new products have been developed in response tochanges in resource availability. One of the most notable developments over the last fewyears has been the increased use of agricultural tree crops in Southeast Asia. Rubberwoodutilisation has been pioneered by Malaysia in response to diminishing industrial roundwoodsupply in Peninsular Malaysia and the large area of rubber plantations present in the country.A similar development has also occurred in Thailand, where there is now a complete ban onlogging in the natural forest and both countries have developed significant rubberwoodprocessing industries.
Rubberwood sawnwood is unlikely to substitute for other types of sawnwood in manyapplications, but it has been found to work well in applications such as furniture making.There are also now several medium-density fibreboard plants either operating or planned inSoutheast Asia which will use rubberwood as their main raw material source. The next likelydevelopment will be the use of oil palm husks and trees for the manufacturing of medium-density fibreboard. One such plant was proposed in Malaysia last year, although it is unclearwhether, given current financial circumstances, this plant will still be built in the near future.
In terms of end-uses, one of the most notable aspects of forest products markets in developingcountries is the size of the share of solidwood products markets in these countries held bysawnwood and, to a lesser extent, plywood. Only a tiny proportion of the world'sreconstituted panel production takes place in developing countries and, similarly, suchproducts have only a negligible share of their domestic markets. As noted above,reconstituted panel production offers tremendous opportunities for utilising new sources offibre from forest industry residues to less-well known forest species and non-forest trees. It islikely that a significant proportion of the high growth in demand for forest product expectedin developing countries over the next decade, could be met without significantly greater forestharvesting if reconstituted panel products were to be more frequently utilised.

A Whiteman, C Brown and G Bull
_________________________________________________________________________________________Forest product market developments
84
7.2 The impact of globalisation on future supply and demand
The trend toward increased globalisation has accelerated during the past decade. Mostcountries have adopted trade, investment, and even environmental policies, which havereduced national insularity and promoted a greater level of standardisation in market prices,production processes, product quality, and regulatory environments. As noted above, theforestry sector has always, to a certain extent, been a global industry and it has not, therefore,been immune to these developments.
It is likely that three aspects of globalisation have the most potential to significantly affect thefuture development of forestry and forest products markets. These are:
1. trade liberalisation in forest products markets;
2. the increasing role foreign investment and multinational corporationsoperating in the forestry sector; and
3. the globalisation of environmental advocacy and concern.
The possible future developments in each of these areas and the potential impacts they mighthave on markets for wood and wood products are briefly described below.
7.2.1 Trade liberalisation
In 1994 the Uruguay Round of negotiations over trade, tariffs and non-tariff barriers to tradeconcluded with a series of commitments to lower tariff and non-tariff barriers and overhaulthe world's trade policy and dispute negotiation mechanisms. The commitments made duringthe Uruguay Round provided both promises of tangible reductions in global trade restrictionsand a new impetus to trade liberalisation efforts.
In addition to the major negotiations such as the Uruguay Round, which have been takingplace over the last 50 years, more recent history has also seen an expansion in the number andscope of regional trade agreements and trading blocs. Associations which have developed orexpanded over the last 30 years include: the North-American Free Trade Agreement(NAFTA); the European Union (EU); APEC; ASEAN; the Mercado Comun del Sur(MERCOSUR); and the Caribbean Community (CARICOM). These have offered furtherpotential for reducing trade restrictions at the regional level.
However, trade policies in the forestry sector are already currently relatively liberal incomparison to say, for example, agriculture. The highest rates of import tariffs on woodproducts in developed countries are for wood-based panels (especially plywood) andfurniture, at around 15% (see: Bourke and Leitch, 1998). Tariffs on most other wood productsare in the 5-10% range and many wood products have no import tariff at all. Import tariffs onall wood products in developing countries are generally higher than in developed countriesand are mostly in the region of 20-40%, with tariffs as high as 50-80% on some finishedwood products.

FAO Paper for the World Bank Forest Policy Implementation Review and Strategy
_________________________________________________________________________________________Forest product market developments
85
Probably the most significant trade measures that have had an impact on markets for woodproducts in the past are non-tariff barriers. Non-tariff barriers include a wide range ofmeasures such as: export or import quotas; licensing requirements; phytosanitary, technicaland environmental requirements or standards; and overcomplicated import or exportprocedures. Of these, export restrictions (usually put in place to develop domestic industries)have probably had more of a detrimental effect on forests than import restrictions (usuallyimplemented to protect markets).
An example of a non-tariff barrier commonly encountered in the forestry sector is restrictionsplaced on the export of unprocessed wood products. A large number of countries haveimplemented such measures, both as a means of reducing demands on limited forest resourcesand as a means of promoting domestic processing industries. Some have restricted only logexports while others have gone further and have also placed restrictions on exports of woodchips or sawnwood. This is one of the few areas where the forestry sector has been tending togo in the opposite way to the global trend towards more liberal trade.
As with most trade restrictions, the net effect of export restrictions on global efficiency islikely to be negative. Such measures will encourage the development of a local industry, butthey won't necessarily encourage the development of an efficient and internationallycompetitive industry. For example, export restrictions reduce domestic raw material prices(i.e. industrial roundwood prices), which then tends to reduce the incentive to use suchmaterials efficiently. Also, as a significant industry develops, which is dependent upon thesupply of cheap raw materials, it becomes increasingly difficult to remove the traderestriction. In other ways, export restrictions may be detrimental to forest resources since theytend to lower the revenues available to forest owners and hence reduce the incentive to investin better forest management.26
A concise review of the outlook for future trade measures is given in Bourke and Leitch(1998), which presents a synopsis of the major commitments made during the Uruguay roundto reduce import tariffs and non-tariff barriers to trade over the next 10 to 15 years. Generally,import tariffs in developed countries will fall by 43% for solidwood products and 99% forpulp and paper products. In many cases, import tariffs on pulp and paper products will fall tozero and import tariffs on furniture will also fall to zero in some countries. The only sectorwhere import tariffs are expected to remain high is wood-based panels, especially plywood.Developing countries have also agreed to cut import tariffs to a certain extent, but importtariffs in developing countries will remain somewhat higher than those in developedcountries. The impact of these tariff reductions on future supply and demand will be to furtherreinforce the expected trend towards greater trade in higher value-added products expected inthe future.
26 The statements presented here are based on the overall results of a number of studies into the impacts of
export restrictions in the forestry sector. It must be borne in mind however, that such studies often haveto make a number of assumptions and use estimates that are very approximate and that many studieshave only analysed part of the situation. Export restrictions are sometimes ineffective, they can lead toother positive benefits that are difficult to measure and analyse and it is often difficult to assess whatwould have happened in the absence of such restrictions. Therefore, although the weight of theory andevidence suggests that they are certainly not a first-best solution, it is still debatable whether a moreeffective way could be found to achieve the goals of most export restrictions.

A Whiteman, C Brown and G Bull
_________________________________________________________________________________________Forest product market developments
86
It is not possible to project what might happen to non-tariff barriers to trade and other tradeimpediments. Some agreements were reached on phytosanitary measures and technicalbarriers to trade in the Uruguay Round, but the impacts of such measures (and, consequently,reductions in them) are difficult to quantify. Furthermore, discussions tended to focus mainlyon barriers to imports rather than export trade barriers (such as log export bans). It wouldseem therefore, likely that bans or high tariffs on exports of unprocessed wood products arelikely to be a feature of the future, unless countries can be persuaded to remove them. Thecontinuance of export restrictions for certain types of wood product and in certain countrieswas built into the baseline projections presented earlier and there are no grounds to suggestthat these measures will change significantly in the future.
However, one new feature of trade which has become more prominent in recent years and hasthe potential to grow significantly in importance in the future, is the number of informalbarriers or impediments to trade which have arisen in developed countries. Informal barriersto trade include: the formation of buyers groups; local and national government policies toonly purchase certain types of products or products from certain countries; and voluntary bansand boycotts promoted by environmental non-governmental organisations (NGOs). In part,these impediments are intimately associated with moves to create green labels and certifyforests. To the extent that these measures can be pushed forwards outside the mechanisms forcontrol and negotiation of the World Trade Organisation, they have the potential to have asignificant impact on exporters of wood and wood products in the future and their impact onfuture supply and demand patterns will be discussed in a separate section on certificationbelow.
7.2.2 Foreign investment in the forestry sector
Recent strong moves toward the development of a Multilateral Agreement on Investment(MAI) are similarly indicative of the move towards globalisation in the investment and capitalmarkets. Within the forestry sector there is significant and often longstanding foreign directinvestment in forest and forest processing operations and some of the world's largest forestrycompanies have operations in many countries. Cross-border investments in the forestry sectorhave been controversial in some cases, particularly in the harvesting sector, but there are fewsigns that such investments are likely to decline in the long-term future.
Historically, there has been significant resistance to foreign ownership of forests in a numberof countries. Forests have often been regarded as strategic national assets and foreignownership has been regulated against in some countries and popularly opposed in mostothers. Nonetheless, there is evidence of a trend towards a more liberal future, with severalcountries advancing significantly down the path of forest privatisation, including sellingforests to overseas interests.
Foreign ownership of processing facilities is much more common than foreign ownership offorests and tends to be less controversial. Such investments are often seen as a means ofdeveloping national economies through the generation of income and employment, provisionof training and transfers of technology, marketing and management skills. To the extent thatsuch investments do supply such benefits to host countries, they are a desirable component ofnational development which should be encouraged.

FAO Paper for the World Bank Forest Policy Implementation Review and Strategy
_________________________________________________________________________________________Forest product market developments
87
The main problems which have arisen with foreign investment in the past have been in caseswhere such investments have not supplied many of the above benefits. Perhaps the bestexamples of this have been where multinational companies have obtained licences to harvestoutside their home countries, particularly (but not exclusively), in tropical forests. Forexample, several Asian companies have recently obtained harvesting licences in Africa andSouth America. In cases where they have imported capital and labour to manage these areas,they have provided few benefits to the countries where they are working. These arrangementshave provoked some controversy in the companies home countries, the countries they areworking with and within the international community.
In terms of the outlook for globalisation and forestry investment and the impact such movesmight have on future timber markets, the future is uncertain and difficult to quantify.However, a few points are probably worth noting.
Firstly, the privatisation of forest resources is likely to continue, although probably at aslower rate and more so in developed countries than developing countries. A possibleexception to this may be Eastern Europe, where efforts to return formerly centrally-controlledforest assets into private-hands can be seen as a form of privatisation. This continuing trend inprivatisation will offer more scope for cross-border investment in forest management andharvesting in the future.
Secondly, in terms of processing facilities, most developing countries will continue to needstrong inflows of foreign capital and expertise if they are to fully develop the economicpotential of their forest resource base. However, from the point of view of nationaldevelopment, it will be important to ensure that such inflows involve more than just capital,but also involve flows of technological, marketing and management expertise.
The last point to note is that these developments, if carefully planned and monitored, are notto be feared. Many of the controversies surrounding forest harvesting by multinationals arenot the fault of the multinationals themselves, but rather due to the weakness of forestryinstitutions in some countries. Often, the multinationals are merely following the same lowstandards set for domestic forest operators in host countries but, due to the sheer size of theiroperations, are having a much more noticeable impact. On the positive side, foreigninvestment in the forestry sector in developing countries, has the potential to bring inimproved technology and management practices. This, in turn, could help to balance futuresupply and demand without requiring more harvesting in new areas of forest, in the same wayas was suggested above under efficiency gains. The key to achieving this will be to ensurethat there is the right policy and institutional framework in place in countries to encouragesuch moves.
7.2.3 Globalisation of environmental advocacy and concern
The 1990 Rio Summit highlighted awareness of the need for a global approach toenvironmental issues including forestry. The development of the new vision for forestry -"Sustainable Forest Management" - has effectively paralleled a broader drive toward globalsustainable development, which has gathered momentum throughout the 1990s. To a largeextent this has been a result of heightened awareness that environmental issues, such as thosefacing the forestry sector, will generally have cross-border implications. Evidence of such

A Whiteman, C Brown and G Bull
_________________________________________________________________________________________Forest product market developments
88
awareness is provided by recent international initiatives such as: the development of criteriaand indicators for sustainable forest management; moves towards forest certification;agreements on carbon emissions (including sinks such as forests); and agreements to jointlymonitor and manage international watersheds.
This heightened international awareness of forests and the environment is, perhaps, the lastmajor example of where increased globalisation has had an impact on forestry. Whereformerly, powerful commercial forestry interests could manipulate developing countrygovernments and poorly educated landholders, far greater balance has been achieved throughthe interventions of environmental NGOs, development agencies and the development ofmore stringent environmental regulations within developing countries themselves.
The trend toward increased globalisation in environmental advocacy and concern has alsoresulted in a recognition that, in the future, national forest policies are likely to receive greaterinternational scrutiny and that forestry development and the ability to produce and trade inforest products may be contingent on meeting specific international standards. For example,market opportunities or access to foreign capital may be denied to companies that cannotprove that they have a good environmental record or provide a credible promise that they willdo so in the future.
The outlook for this aspect of globalisation is that, with continually increased access to newcommunication media, the trend towards the internationalisation of environmental concernwill continue. Furthermore, there is evidence to suggest that this globalisation will also resultin stronger grass-roots NGO capacity in developing countries. The impact of this on futuretimber markets is most likely to be in the areas of trade and investment already discussedabove.
7.3 The outlook for forest certification
One market development that has increased in importance since the early 1990's has been theissue of forest certification or ecolabelling. In many respects, forest certification represents aserious attempt by consumer countries to try to influence forest management throughdemand-side responses to environmental concerns as opposed to the more traditional route ofpressure to change supply-side practices through international agreements, political pressureand lobbying and more gentle persuasion through the development assistance programmes ofdeveloped countries.
It is still uncertain as to what impact forest certification will have in the long-run and whetherthe interest in certification (both political and in terms of market preferences) will besustained. However, this section will attempt to describe some of the basic issues that havedeveloped to date and present some views on the future.

FAO Paper for the World Bank Forest Policy Implementation Review and Strategy
_________________________________________________________________________________________Forest product market developments
89
7.3.1 The growth of certification
A range of forest certification schemes have been developed or are currently being developedaround the world at the moment. Certification schemes can be divided into two basic types:systems-based schemes and performance-based schemes, which can be implemented by oneof three different types of agents: first; second; and third-party certifiers (see Box 6 for adescription of the different types of certification scheme).
Box 6: The difference between different types of forest certification scheme
Source: Adapted from Hansen (1998)
A range of national and international certification schemes have developed over the lastdecade in response to varying market and forest conditions around the world. Probably thetwo largest national certification schemes at the moment are: the American Forest and PaperAssociation's Sustainable Forestry Initiative (which is a second-party, performance basedscheme); and the Canadian Standards Association's Sustainable Forest Management SystemStandards (a third-party, system based scheme). Some other countries are also developingnational certification schemes. Those countries which are furthest down the route ofdeveloping their own schemes include: Finland; Sweden; Norway; Indonesia and the UnitedKingdom.
Two major international certification schemes have been developed. The first is theInternational Organisation for Standardisation's ISO Standards 14001 and 14061. Thesestandards are both systems-based certification schemes, with optional third-party auditing.The second major international certification scheme is the set of standards developed under
Distinctions between different arrangements for certifying forests are usually made in two areas. Firstly, variousschemes are differentiated according to who is doing the certification and secondly, there is a difference betweenschemes which actually measure performance as opposed to those which report on systems for identifying andmeasuring environmental performance. These differences are explained below.
First, second and third party assessment
The difference between first, second and third party assessment is the independence of the organisation carrying-out the assessment for the purpose of certifying the forest or forest product. A first-party assessment occurswhen a company assesses, measures and reports its own performance against a set of environmental standards.Second-party assessment occurs where this is done by a slightly more independent body such as a customer or atrade association. Third-party assessment involves an assessment by a neutral third-party, based on a standardisedand commonly accepted set of standards applying across the whole of the sector.
Performance and systems-based certification schemes
To pass a systems-based certification scheme, a company must demonstrate that it has a management system inplace to identify, measure and monitor the company's impact on the environment and encourage improvedenvironmental performance. It does not, however, have to pass any particular standard in any of the areas inwhich it is monitoring performance. Rather, the collection of the monitoring information itself is seen as adesirable first-step to improving performance.
A performance-based scheme goes a stage further than a systems-based scheme and requires that the companymust meet certain standards or at least report achievement in a quantitative way in each of the environmentalareas which it is monitoring. Typically, this information is then passed on to the consumer in the form of a "greenlabel" or "ecolabel" on the final product.

A Whiteman, C Brown and G Bull
_________________________________________________________________________________________Forest product market developments
90
the auspices of the Forest Stewardship Council (FSC). The FSC certification scheme is athird-party performance-based scheme, monitored by independent certifiers accredited by theFSC. The standards which have to be met to obtain an FSC certificate vary in accordancewith the local conditions facing the forestry sector in each country, but this is only reasonableconsidering the wide range of forest types which the FSC have attempted to cover in theircertification scheme.
Figure 11: Area of forest certified by FSC-accredited certification bodies
0
2
4
6
8
10
12
14
1992 1993 1994 1995 1996 1997 1998 1999 (to date)
Year
Source: Forest Stewardship Council (1999)
Of all the forest certification schemes, the FSC certification scheme is probably the mostwell-known. The area now (January 1999) certified by the six independent companiesworking to FSC guidelines has just reached 13 million ha (see Figure 11). This is still,however, only a tiny fraction of the total area of forest used globally for wood productioneach year (several hundreds of millions of hectares). The World Wildlife Fund (WWF) andWorld Bank have, as part of their strategic alliance announced in 1998, agreed to pursue agoal that 200 million ha of forest will be certified by the year 2005. This will present a majorchallenge, particularly if they want to include a significant proportion of certified tropicalforests in this total (see, for example, Box 7, which presents a much less optimistic view ofthe future for certification).
In parallel (and often in association) with the development of certification schemes, has beenthe development of demand for such products. The organisations promoting certification havetended to stimulate demand for certified products in two ways. Firstly, they have lobbied localauthorities (and sometimes parts of national government) to use only certain types of timber.Secondly, they have encouraged local retailers (sometimes with the threat of environmentalprotest) to stock certified products. They have had some success in both of these sectors, butit should be remembered that the vast majority of wood products are used in industrialapplications, where forest certification has yet to make any significant impact.

FAO Paper for the World Bank Forest Policy Implementation Review and Strategy
_________________________________________________________________________________________Forest product market developments
91
Box 7: Seven nails in the coffin of certification?
Forest certification represents a serious attempt by environmental NGOs to try to influence forestry policy andmanagement by altering market signals. In as much as market signals have a powerful effect on the way thatcompanies and individuals act, this is to be commended. However, there remain a number of questions about theviability of forest certification in the long-run and, perhaps more importantly, whether it is likely to have any realimpact on the forests that are most under threat from unsustainable practices.
! Forest certification will be most attractive (i.e. present the least additional costs) to forest owners andmangers that already manage their forests reasonably well either due to strong national regulatoryframeworks or because the owners already place high importance on environmental or multi-purposemanagement objectives. This is partly reflected by the fact that most of the area that has currently beencertified by the FSC is in the western developed countries.
! By concentrating on how forests are managed for the production of marketed forest products, forestcertification will do little to stop deforestation and have little impact on forests that are unsustainablymanaged to meet local needs.
! Increasing globalisation in forest products markets means that end products often mix wood and fibre inputsfrom a number of sources that are increasingly difficult to verify. Wood is also only a small part of the endproduct in some of its most important applications (e.g. in construction and furniture manufacturing) and thedistance between the forest and end-user is becoming increasingly long.
! The benefits from purchasing certified wood to the end-user are mostly non-use benefits as opposed to usebenefits (in comparison to some other environmentally friendly products such as energy efficient appliancesand organic food).
! The benefits are poorly understood and difficult to market (in comparison to, say, dolphin friendly tuna).
! Studies have shown that the markets for certified forest products in developed countries are relativelylimited and the prospects for price premia are poor.
! The majority (80 percent) of marketed wood and wood products produced in developing countries is alsoconsumed in developing countries, where willingness to pay for environmentally friendly forest productswill be constrained by ability to pay.
Taking these points into consideration, it is difficult to assess exactly how useful forest certification will be in thelong-run as a measure to promote and encourage sustainable forest management. It is also very unclear as towhether it represents a cost-effective policy tool. The major benefit of forest certification may be that it hasraised awareness of some important forestry issues amongst both consumers and producers and may lead togreater support for more effective policy changes in the future.
Actions by local authorities (and parts of national government) to ban the use of certain typesof timber in their offices and public projects have been especially prevalent to date inGermany, Netherlands, United Kingdom and United States of America. These actions havemostly tried to ban the use of timber from sources which do not meet some definition ofsustainability (which has often been defined as having an FSC-backed certificate). However,they have also either implicitly or explicitly tended to focus on banning the use of tropicaltimber. It is generally accepted that such bans are of limited value or, at worst,counterproductive (Bourke and Leitch, 1998) and some authorities are starting to back-downfrom such actions. It is also questionable whether such actions would stand-up to scrutinyunder international trade law if tropical countries were to push for their removal in bodiessuch as the WTO.

A Whiteman, C Brown and G Bull
_________________________________________________________________________________________Forest product market developments
92
Moves to encourage local retailers to take certified products (or even better still, to only takecertified products), started in 1991 with the foundation of the 1995 Group of timber retailersin the UK. This line of action has been pushed forward in particular by the WWF and buyersgroups (groups of retailers committed to only selling certified products in the future) can nowbe found in eight countries (see Table 28).
Table 28: Timber buyers groups operating in 1998
Country Group name Founded Number ofmembers
Total annual sales(US$ millions)
United Kingdom 1995+ Group 1991 87 69,000Netherlands Hart Voor Hout 1995 11 n.a.Netherlands Organisations committed to FSC 1992 473 n.a.Belgium Club 1997 1994 79 270Austria Gruppe 1998 1996 26 960Germany Gruppe 1998 1997 31 12,000Switzerland WWF Wood Group 1997 10 170USA and Canada Certified Forest Products Council 1997 640 n.a.Source: Hansen (1998). Note: total annual sales is much greater than total annual sales of wood products formost of these companies. Taking this into account, these companies represent only a small share of forestproducts markets.
The establishment of buyers groups is a crucial component to the success of the forestcertification movement in that they strengthen the demand for certified products withoutrequiring a prolonged, widespread and, consequently, expensive promotional campaign,which environmental non-governmental organisations (NGOs) would be hard-pressed tokeep-up. However, it is also worth noting that, as with the total area of forests certified todate, the actual market share held by companies which are members of buyers groups (and,therefore, committed to certification) is tiny compared with the total size of the market forforest products. Only in Belgium, does the buyers group supporting forest certification holdanything near to a significant proportion of the timber market (around 50% of the timber trade- Source: Rametsteiner et al, 1998).
7.3.2 The costs and benefits of certification
As with the costs of implementing Sustainable Forest Management (discussed inSection 6.5.3 Changes in wood supply with the implementation of SFM), the cost of meetingFSC certification standards is currently unknown and uncertain. Therefore, all figurespresented here should be considered as highly speculative.
Table 27 showed that the cost of implementing SFM could increase roundwood productioncosts by up to 25% in temperate and boreal countries and 5% in tropical countries.27 Many ofthe management interventions which would be desirable from the SFM point of view are alsolikely to be required to meet most certification standards, so it is anticipated that the cost ofcertification should be roughly the same as the cost of implementing SFM, plus a smallallowance for the cost of auditing or monitoring to check that a forest meets the standardsrequired to be certified.
27 Other organisations, for example industry associations and the ITTO, have suggested much higher
figures.

FAO Paper for the World Bank Forest Policy Implementation Review and Strategy
_________________________________________________________________________________________Forest product market developments
93
However, there is considerable evidence to suggest that forest owners and consumers of forestproducts, between them, will not be prepared to pay very much for certified products. Forexample, in a survey of willingness-to-pay (WTP) by Rametsteiner et al (1998), forest ownersin United Kingdom and Finland were mostly only prepared to pay up to 2% of their timberincome to obtain certification and almost none were prepared to pay over 5%. Furthermore,consumers in these countries were at most only prepared to pay an additional 5% for certifiedwood products and only then for certain types of wood product. Similar market researchstudies in the Netherlands (Stolp, 1997) have shown that consumers there are not prepared topay any additional price premiums at all for certified products (and the Netherlands is acountry where environmental issues tend to be considered as fairly important compared withmost other West European countries!).
Clearly, if the average cost of meeting the higher management standards required to obtain anFSC certificate is considerably higher than producers and consumers are willing to pay, thenthis suggests that certified forest products will never account for more than a small share ofthe timber market and that the only forests which will become certified will be those wherethe costs of certification are very low (i.e. those which are already well-managed from anenvironmental viewpoint). This, to a certain extent, will reduce the impact of forestcertification on the average forest management standards achieved in any particular country.
As the above discussion has shown, it is generally accepted that certified products areunlikely to attract price premiums in any but the most limited and specialised markets. Thiswill severely limit the extent to which producers can pass on the costs of certification tocustomers and it looks increasingly likely that these costs will have to be borne mostly by theproducers. The question then for the future of certification is: are there any other benefits toproducers of certified wood products which can justify the additional cost of producing them?
At the moment, the answer to the above question seems to be yes and the main reason putforward by most companies which have shown an interest in producing or selling certifiedproducts seems to be a perception that certified products give the companies a marketing edgeover their rivals. There is little hard evidence to suggest that certified products have allowedcompanies to increase their market shares, but this is a perception which is strongly felt bymany companies selling certified products and has been reported in several studies (e.g.Hansen, 1998; Rametsteiner et al, 1998). How long this can last is unknown, but there willcome a time when this perception of "marketing edge" will diminish and this may not be veryfar away unless NGOs can continue to keep publicising the availability and desirability ofcertified forest products.
7.3.3 Future challenges for forest certification
From the experiences with forest certification and the marketing of certified forest products todate, some major challenges for certification appear to be taking shape for the future. Theseare as follows:
Limited market demand. As noted above, several studies have shown that the demand forcertified products currently appears to be quite limited. Some very large consumer countries(e.g. China and Japan) appear to have practically no interest in certified products at all. Even

A Whiteman, C Brown and G Bull
_________________________________________________________________________________________Forest product market developments
94
in countries where certified products have been marketed more strongly (e.g. UnitedKingdom and Netherlands) there still appears to be only a small amount of demand for suchproducts and next to no inclination to pay any more for them.
Lack of supply. Ironically, there have also been several instances recently of companieswanting to sell certified forest products, but being unable to obtain sufficient supplies ofcertified products. This has occurred in some of the large consumer markets where supply hasbeen unable to keep-up with demand (e.g. the recent experience of Homebase in the UnitedStates of America) and in smaller markets where retailers have made strong commitments tosell certified products (e.g. the United Kingdom).
Fragmentation. There are now two separate international forest product certificationschemes and a range of national schemes are also being developed. These schemes are allcompeting with each other for greater recognition and the amount of fragmentation amongstthe various schemes is causing some concern and confusion within the industry. The amountof international trade in wood products also confuses the issue further (e.g. if a plywoodproducer in Canada intends to export a lot of plywood to the United Kingdom, should theproducer apply for a certificate based on a national standard drawn-up in Canada or one forthe United Kingdom?). Larger suppliers and retailers are overcoming some of this confusionby applying for certification under several different certification schemes. However, many cannot afford this option and are choosing not to enter the market for certified products untilthings have become clearer.
Credibility. The last major challenge which has become more important in recent years is thecredibility of some of the agencies offering certification. There have been several well-publicised controversies over forests which have been certified recently and this has donelittle to help the cause of certification. Rametsteiner et al (1998) shows that both producersand consumers in Europe believe that a government or scientific agency would best fulfil therole of certifying forests in their own countries. This study also showed quite clearly thatNGOs and private independent companies are placed low on the list of organisations mostpeople would like to have certifying their forests. The question of what role independentbodies such as the FSC should play in the long-term future therefore, remains unanswered,but it seems as though the role of such organisations might have to change in the future.
Until these challenges are effectively addressed, it seems likely that certification of forestproducts will continue to attract a lot of attention in forestry policy discussion but, in reality,have very little impact on forest products markets.
7.4 Synthesis: the impact of future technology changes, globalisation andcertification on the markets for forest products
Out of all the topics discussed in this section, it seems likely that technology changes arelikely to have the most impact and have the potential to have the most impact on forestproducts markets in the future. In contrast, globalisation and certification are expected to haveonly minor impacts on the future markets for forest products.

FAO Paper for the World Bank Forest Policy Implementation Review and Strategy
_________________________________________________________________________________________Forest product market developments
95
7.4.1 The effect of technology changes on future supply and demand
The baseline projections of supply and demand presented earlier were made with only oneassumption about future technological change: that the proportion of recycled fibre in thetotal fibre furnish would increase in the future in line with past trends. The future roundwoodsupply projections assumed that supply would change in line with changes in the currentcommercially viable forest area and biological growth, but did not consider the possibility ofgreater areas of forest becoming commercially viable as production processes adapt to utilisenew species. The projection model also used the same conversion factors to estimate derivedroundwood demand from product demand for every year of the forecasts (with the exceptionof the greater use of recycled fibre noted above). Consequently, possible improvements inproduct recovery rates have not been built into the projection forecasts.
With respect to the first point, it is very difficult to project or forecast in any way, the area offorest resources which has been currently excluded from the model of timber supply, butmight become viable as a source of supply in the future. For example, the development ofwhole industries based on the processing of aspen, birch and rubberwood, could not havebeen predicted 20 years ago. All that can be said is that the development of newer and betterprocessing technologies will reinforce the trend towards the utilisation of smaller sized piecesof roundwood from a greater diversity of areas including agricultural tree crops, other treesoutside of forests, harvesting and mill residues and wood from fast-growing pulpwoodplantations. In this way, technological change is expected to support the changes in futuresupply already discussed in the last section of this report.
In terms of processing efficiency however, some quantitative information is available aboutthe potential impact future improvements in technology might have on the supply anddemand balance. Spelter (1999) for example, notes that there is a technical limit to thesawnwood recovery rate which can be achieved in the future, due simply to the geometricalproblem of cutting square shaped objects from round shaped ones. His paper suggests thatthis might be in the range of 45% to 55% depending on log size (larger logs should havebetter recovery rates). He also suggests that recovery in reconstituted panel mills such asoriented strandboard (OSB) mills might level-off at around 60%.
Given that most sawmills and reconstituted panel mills in developed countries are currentlyachieving recovery rates somewhat below these figures, this would suggest that theimprovements in efficiency experienced in the past could continue into the future for the nextdecade or so. If past efficiency trends continued, the figures quoted by Spelter would suggestthat maybe 70% of future sawnwood production growth could be achieved by sawmillprocessing efficiency gains, leaving only 30% requiring gains in other areas or additionalsources of industrial roundwood. A similar proportion of future expected growth in theproduction of reconstituted panels could be satisfied by increased efficiency in reconstitutedpanel mills.
In developing countries, the potential for efficiency gains is even greater. The current level ofproduct recovery in many developing countries is unknown, but believed to be so low that itwould not be unreasonable to state that all production growth expected over the next decadeor so could be met by improvements in processing efficiency, without any need to increasethe harvesting of industrial roundwood.

A Whiteman, C Brown and G Bull
_________________________________________________________________________________________Forest product market developments
96
The extent to which new technologies are introduced to make more efficient use of woodresources, will depend upon the pricing of industrial roundwood and whether it becomesexpensive enough to encourage such changes. In part, the currently low levels of technologyin many developing countries can be explained by low roundwood prices set by governmentsfor harvesting roundwood from the natural forest. As long as industrial roundwood continuesto be made available at low prices, there will be little incentive to invest in capital whichutilises the resource more efficiently. Therefore, the extent to which future technologicalchanges help to balance future supply and demand essentially comes down to a question ofroundwood pricing.
7.4.2 The effect of globalisation and certification on future forest products markets
As the world economy continues to become increasingly global, consumers will continue tolook for low-cost suppliers and producers will continue to establish and transfer operations tolow-cost locations. If forest products markets are further liberalised, this should reduce theartificial advantages enjoyed by producers in some markets, where either bans on the exportof unprocessed forest products or high tariffs on the import of finished products support thedomestic production of wood products. In as much as some protected industries may have toreduce output or increase competitiveness, this should stimulate greater efficiency andsupport some of the expected trends in increased efficiency already referred to above.
With respect to certification, there are two key questions for the future:
! what proportion of the world's timber trade is likely to be affected by the demand forcertified products; and
! will certification actually lead to significantly improved forest management.
As noted above, less than 0.3% of the world's forest area has been certified to date and theproportion of the world's wood and wood products markets held by certified products isunknown, but may be at a similarly low level. Even if the WWF/World Bank target of 200million ha of certified forest by 2005 were to be achieved, this would still only account for6% of the world's forest area (but possibly a greater share of the area used for woodproduction).
The only anecdotal evidence on the future market penetration of certified products is given inStolp (1997). This report indicates that some organisations supporting certification in theNetherlands believe that, as an absolute maximum, certified products might at some time inthe future account for 25% of the timber market. However, in the light of the WTP surveyresults reported above, even this figure seems very optimistic. It seems likely therefore, that asomewhat lower figure than this might be achieved over the next decade or so.
Ten percent market penetration would seem like the most that could be expected by the year2010 and only then in countries, such as those in Western Europe and North America, wherecertification has been actively supported by some forest product suppliers and retailers. Giventhat the most interest in forest certification, amongst both producers and consumers, has beenshown in developed countries, the prospect of forest certification leading to significantlybetter forest management in developing countries seems most unlikely.

FAO Paper for the World Bank Forest Policy Implementation Review and Strategy
_________________________________________________________________________________________Forest product market developments
97
8. CONCLUSIONS
The supply and demand analysis presented in this report has suggested that, broadly speaking,global forest resources will produce sufficient supplies of roundwood to meet future demandsfor forest products, without significant upward pressure on prices. This is not to say however,that there will not be scarcity in some regions or for some types of wood in the future. Forexample the analysis has shown that the trend towards increasing scarcity of high-qualitylarge logs (typically taken from the natural forest) is likely to continue in the future. Rather,the analysis has shown that the mixture of resources that will have to be used for wood supplywill change somewhat in the future.
The changing pattern of resource availability expected in the future will have profoundimplications for the forest processing industry and for forestry administrations in manycountries. A major concern for the industry will be the changes in technology, processingcapacity and location, which will be required to accommodate the expected changes inresource availability. Forestry administrations will also have to take note of these expectedchanges in supply and demand patterns as they continue to support the development of thesector while, at the same time, attempt to encourage a change in emphasis in forestmanagement towards SFM.
The important question for the future therefore, will not be: is there enough wood? But rather:where should it come from and who will produce it? Whatever course is chosen will havesocial, economic and environmental implications and forestry policymakers have, to someextent, the power to influence these outcomes. This concluding section of the supply anddemand analysis will examine the implications of the outlook for the World Bank's threepriority areas of: poverty alleviation; sustainable development and private-sectordevelopment.
8.1 Poverty alleviation
The production of wood and wood products makes a significant contribution to GDP andexport earnings in some of the world's poorest countries. For example, Table 29 shows thatforest products exports accounted for more than 10% of total merchandise exports in 19developing countries in 1995 (and in a further four developed countries as well).
What is particularly noticeable in this table is how important forest products exports are tomany African countries. This is in stark contrast to the fact that Africa is an insignificantproducer of wood and wood products on a global scale, accounting for generally less than 5%of total world output in all forest product categories. Therefore, although Africa is not asignificant region in terms of world forest products markets, the reverse is not true and worldforest products markets can be said to have a significant effect on many African economies.
In addition to the production of industrial roundwood, forests are often also important sourcesof food, forage, fuel, medicines and building materials for rural communities. The value ofthese outputs are often not captured in national accounts statistics, but may be as great, if notgreater, than the value of industrial forest product outputs in many poor countries.

A Whiteman, C Brown and G Bull
_________________________________________________________________________________________Forest product market developments
98
Table 29: Countries where forest products exports had a share of total merchandiseexports greater than 10% in 1995
Country Total value ofmerchandise exports
(US$ million)
Total value of forestproducts exports
(US$ million)
Forest products exportsas a percentage of total
merchandise exports (%)OECD countriesCanada 192,607 27,787 14.4New Zealand 13,769 1,634 11.9Finland 40,489 11,968 29.6Sweden 79,878 10,850 13.4Non-OECD countriesCameroon 1,654 329 19.9Central African Republic 193 29 15.2Congo, Rep of 1,136 127 11.2Congo, Democratic Republic of 461 55 11.9Equatorial Guinea 84 36 42.9Gabon 2,650 388 14.6Ghana 1,431 276 19.3Guinea Bissau 31 4 12.9Liberia 300 68 22.7Chile 16,447 2,060 12.5Paraguay 819 98 12.0Cambodia 342 171 50.0Indonesia 45,418 4,728 10.4Laos 348 70 20.2Myanmar 846 307 36.3Papua New Guinea 2,681 536 20.0Solomon Islands 182 115 63.2Estonia 1,838 192 10.4Latvia 1,306 277 21.2Source: FAO (1997c)
From the point of view of poverty alleviation, the most important aspect of the future supplyand demand projections presented earlier is that different sources of wood and fibre supplyhave different potentials to generate local income and employment and, hence, help toalleviate poverty. For example, harvesting natural forests generally does less to reducepoverty (and may actually increase it by encroaching on forest areas already used forsubsistence purposes) than would say, obtaining future wood supplies from trees outside offorests. In as much as future supply patterns in most developing countries are expected todiversify away from exploitation of the natural forest towards supply from a broad range ofsources, this could have a beneficial effect on some of the poorest citizens in developingcountries.
A very rough appraisal of the potential ability of different sources of supply to alleviatepoverty is given in Table 30. Harvesting of the natural forest is believed to provide generallylittle benefit in terms of poverty alleviation because of the high capital intensities and lowlevel of labour inputs generally used in such operations. Plantations are a little better becausethey tend to employ more people during harvesting and replanting. However, plantations willnot help alleviate poverty if they use land which local people were already using forsomething else. Greater use of harvesting and mill residues could have significantenvironmental benefits but would generally do little to improve poverty. Indeed, the use ofbetter technology in forest harvesting and processing often means substituting capital for

FAO Paper for the World Bank Forest Policy Implementation Review and Strategy
_________________________________________________________________________________________Forest product market developments
99
labour, which might increase unemployment and, consequently, have a negative effect onpoverty.
The potential sources of future wood and fibre supply which are believed to have the greatestpotential benefits in terms of reducing poverty are trees outside forests and recycling and non-wood fibre supplies. The utilisation of such supplies generally involves the generation of aconsiderable amount of employment and can benefit both rural areas (trees outside forests andnon-wood fibres) and urban areas (recovered paper).
Table 30: Current probable levels of wood and fibre production from various sources andthe potential for alleviating poverty by increasing supply from these sources
Variable/region Wood and fibre supply sourceNaturalforests
Plantations Trees outsideof forests
Harvesting andmill residues
Recycled andnon-wood fibre
Potential of each source to helpalleviate poverty
low moderate high low high
Current estimated level ofproduction from each of thesesources (non-OECD countries) Europe moderate moderate low moderate moderate Asia and Oceania high moderate moderate low moderate Americas high moderate low low low Africa high low moderate low lowPotential to use each of the sourcesto alleviate poverty by includingthem in the future supply mix Europe low moderate low low high Asia and Oceania low moderate high low high Americas low moderate moderate low moderate Africa low moderate high low low
The middle section of Table 30 shows an estimate of the current level of importance of eachof these supply sources for each of the four non-OECD regions identified earlier. Currentsupply in non-OECD Europe is believed to come from a fairly even mixture of natural forest,plantations, residues and recycled materials. Supply in the three other developing regions isbelieved to be currently much more heavily weighted towards production from natural forests.
The bottom section of Table 30 shows the potential for supply from each source in eachregion to be increased and help to alleviate poverty. This section is, in a way, a function of thetwo sections above it. It shows that, from the point of view of alleviating poverty, it might bemost effective to encourage greater use of trees outside of forests in Africa; trees outside offorests and recycled and non-wood fibre supplies in Asia and Oceania; and recycled and non-wood fibre supplies in Europe.
Another way in which forest resources can be used to alleviate poverty is more generallythrough the development of domestic processing industries. Several developed countries haveused their abundant endowments of forest resources as an engine of economic growthincluding: Canada; Finland and Sweden. Some developing countries have also builtsubstantial forest processing industries on the strength of their forest resources, including:Malaysia; Indonesia; Brazil; and Chile.

A Whiteman, C Brown and G Bull
_________________________________________________________________________________________Forest product market developments
100
The success of development strategies which have used forest resources to developsubstantial processing industries has been mixed. All the countries that have pursued suchstrategies have managed to create large industries generating a significant amount of incomeand employment for their local economies. However, their successes have not been withoutproblems. For example, a common way in which domestic processing has been encouraged inthe past is through a combination of trade restrictions (e.g. log export bans or very high tariffson unprocessed forest products) and government policies for pricing roundwood from thenatural forest, which allow processors access to very cheap sources of wood raw materials.This has led to distortions in investment and overuse of forest resources and an eventual lossof confidence in some of these countries (e.g. as in Malaysia and Indonesia at the moment).
Perhaps the key to the success of such strategies in the future lies in ensuring that theprocessing industries are not encouraged to develop beyond the capacity of the forestresources to support them in the long-run. This requires information about long-run supplypotential which is generally better than is available in most developing countries today.
The countries which have the greatest potential to follow this model of economicdevelopment are perhaps those which currently have large log production and export sectors(e.g. many West African countries and the larger producers in the Asia-Pacific region such as:Cambodia; Papua New Guinea; and Solomon Islands). Others with significant plantationresources (e.g. China; India; and South Africa) could be expected to follow this model ofdevelopment also, although, at least in the case of the latter two countries, they havesignificant domestic markets which can absorb a large amount of forest product production.
A more general observation from the supply and demand analysis is that all countries areexpected to continue to their attempts to move into higher value-added products such asfurniture, doors, windows and joinery products. The production of such higher value-addedproducts can substantially increase income and employment but, as noted above, the policiesintroduced to stimulate such activities have to be designed with care. However increasing theproduction of higher value-added wood products is very challenging for many developingcountries because of the higher levels of technology that are required. Such moves alsorequire improvements in skills, both technical skills and management skills, in order tocompete effectively in the increasingly global and highly competitive international forestproducts marketplace.
8.2 Sustainable development
The main component of sustainable development in the forestry context is the concept ofSustainable Forest Management (SFM). Political discussion and pressure to implement SFMhas grown over the last decade and will continue to do so in the future. To a limited extent,this pressure will be supported by increasing globalisation in the forestry sector and greaterdemands for the certification of forest products and both of these moves will furtherencourage countries to implement policies in support of SFM.
However, it also seems likely that the implementation of SFM will develop at a much fasterpace in developed countries than in developing countries. Institutional weaknesses in manydeveloping countries makes it difficult for them to implement SFM and, at least in the case of

FAO Paper for the World Bank Forest Policy Implementation Review and Strategy
_________________________________________________________________________________________Forest product market developments
101
the countries that still have vast forest areas, unsustainable options appear to be moreprofitable in the short-run (these issues are discussed further in Contreras, 1999).
Implementation of SFM will involve a range of measures which will alter the way forests aremanaged in the future and, consequently, affect future wood supply. The two majorcomponents of SFM are likely to be
1. moves to increase the area of forest within legally protected areas; and
2. moves to alter the way in which forest harvesting and management are carried-out in the future, in order to increase the social and environmentalacceptability of production forestry.
As the supply and demand analysis has shown, increasing the area of forest in legallyprotected areas should be feasible without too much impact on future wood supplies. A moreimportant aspect of any policy moves in this direction will be to ensure that there is adequatefunding to properly manage and protect such areas. For example, there are already vastexpanses of legally protected areas in many developing countries, but many of these countriesspend very little on the protection of these areas (see, for example, Paine (1997) for adiscussion of protected area funding in the Asia-Pacific region).
Altering the way in which wood is harvested in the production forest is likely to have a muchgreater impact on future wood supplies. The supply and demand analysis has shown thatpotential wood supply could be reduced quite significantly, but should still generally besufficient to cover future needs in most areas. Regions and product sectors where there mightbe problems are those which have already been identified as facing potential scarcity in thefuture, e.g. Southeast Asia and parts of Africa and the plywood production sector.
What is potentially more important to the success of any policies to encourage theimplementation of SFM, will be the increased cost of SFM practices. Historically, woodproduct prices have generally remained constant or fallen in real terms in the past. It isunlikely therefore, that any increased production costs (as a result of following SFMpractices) can be passed on to consumers. Nor is there yet any strong evidence to suggest thatconsumers will pay more for products from sustainably managed forests (i.e. certifiedproducts).
A major future challenge therefore, will be to identify how SFM can be financed given theselimits. Not only will SFM cost forest managers more (in terms of increased expenditures andpossibly lower timber incomes), but the higher standards of monitoring and control, whichSFM is likely to entail, will also cost forestry administrations more. Certification, whileappearing attractive on the surface, is unlikely to solve this problem and is only likely to be anattractive option for forest managers that are already managing their forests well and will,consequently, have lower compliance costs. In other words, in terms of cost-effectiveness,there may be a substantial amount of "deadweight" associated with this process.
It is possible that there is already considerable scope to pay for SFM out of the slack in manycountries forest revenue collection systems. However, if countries are not currently very goodat increasing their own government revenues from higher forest levies, it is questionable

A Whiteman, C Brown and G Bull
_________________________________________________________________________________________Forest product market developments
102
whether they would be any better at persuading forest concessionaires to spend their excessprofits on SFM.
One solution to this problem, which countries might take however, is to take part or all oftheir natural forests out of production completely. This model has been pursued to someextent in New Zealand, Chile and South Africa and several tropical countries in Asia, whichhave mostly replaced production from their natural forests with production from forestplantations. China, which is a huge consumer of wood and wood products, is also currentlytemporarily phasing-out production from some of its natural forests, in response to concernsabout flooding. Even in the United States of America, the perennial battles over productionfrom the National Forest can be interpreted as a struggle to take all of this area out ofcommercial wood production.
If more countries were to decide that SFM is just too expensive and that it would be easierjust to simply take some or all areas of natural forest out of wood production, then this wouldhave a severe and profound impact on future wood supplies. This is, of course, unlikely tohappen on a dramatic scale in the countries that have little alternative but to harvest thenatural forest (e.g. some of the Pacific Islands). It is also likely to occur very gradually and,thus, have little impact within the period of this analysis. However, moves in this directionare gradually gaining ground and this situation should be carefully monitored and appraised.
Another aspect of the supply and demand outlook which is of relevance to sustainabledevelopment, is the potential for better technology to enable residues, recycled material andless well known species to be used in the wood raw material supply mix. Past trends inefficiency gains and the greater use of residues and recycled materials are expected tocontinue in the future. In as much as these trends will reduce forest processing waste, theywill have environmental benefits and can be considered as another contribution towardssustainable development. However, the extent to which these trends continue will dependupon the measures introduced to support such moves by forestry policymakers andenvironmental agencies.
There is still scope to improve efficiency across the whole forestry sector in developedcountries and the scope for improvement in developing countries is tremendous. In as muchpolicies and programmes to encourage such developments are often easier to plan andimplement, they may present an opportunity to improve the sustainability of the forestrysector that is as great, if not greater, than the traditional approach of devising rules andregulations about what can and can't be done in the forest.
8.3 Private-sector development
On the roundwood supply side, the outlook for private-sector development in the forestrysector is positive. Changes in the relative strength of different sources of potential woodavailability and in forest products markets should encourage the development of futuresupplies from plantations, trees outside of forests and recovered paper. These sources ofsupply all tend to be mostly in private ownership, therefore the expected changes in supplysources will offer tremendous scope for private-sector development.

FAO Paper for the World Bank Forest Policy Implementation Review and Strategy
_________________________________________________________________________________________Forest product market developments
103
Forestry policymakers can encourage supply from these sources by incentives (e.g. forplantations) or technical assistance (e.g. research and development and extension activities).However, an even stronger mechanism to encourage supply from these sources may be toadjust policies for wood supply from the natural forest (in countries where natural forests areimportant). Examples of policies which might be re-examined include stumpage pricing andforest land-use planning policies.
In the past, decisions to restrict supply from the natural forest have tended to be taken inresponse to serious concerns about environmental degradation (e.g. the bans on harvesting inthe natural forest introduced in the Philippines and Thailand in response to concerns aboutdeforestation in these countries). However, some countries, such as China, are now starting toconsider such changes in their land-use policies before the condition of their natural forestareas has deteriorated significantly. A careful balance between restricting supply from thenatural forest and developing alternative sources of wood supply is likely to be the bestapproach to implementing such changes. Forestry policy in Malaysia is a good example ofwhere such an approach has been pursued, where gradual reductions in the availability ofwood from the natural forest have been introduced and compensated for by extensive researchinto the utilisation of lesser-known forest species and agricultural tree crops such asrubberwood and oil palm husks.
In terms of forest product processing, the outlook for private-sector development is equallybright, but less so for the development of small and medium-sized enterprises (SME). Theexpected move towards greater production of reconstituted panels and pulp and paper inmany developing countries will require large infusions of capital which only the private-sector will generally be able to afford. These developments should also involve the transfer oftechnology and skills to many developing countries.
These investments will tend to be large-scale and will generally strengthen the concentrationof forest industries in many countries into a small handful of large corporations. However, ona positive note, the general increase the production of high value-added products such asfurniture expected in the future, should offer some scope for SME development.
8.4 Common themes
Five common themes for potential World Bank support and encouragement emerge from theabove analysis. These can be broadly described under each of the following headings:information; pricing; human resource development; industrial restructuring; and institutionaldevelopment.
8.4.1 Information
The preceding analysis has shown that there is a continuing need for better information aboutthe forestry sector in many developing countries. As a first step, better information aboutforest areas and potential yields are required to enable countries to more effectively plan andmonitor the development of their forest industries. For example, few developing countriesproduce supply forecasts or reliable estimates of annual allowable cut and many don't evenknow with any great degree of accuracy what current production really is.

A Whiteman, C Brown and G Bull
_________________________________________________________________________________________Forest product market developments
104
If serious attempts are really going to be made to introduce SFM in many developingcountries, this is going to require a significant upgrading of their capacities to collect andinterpret information about forest resources and production. The World Bank and othersshould consider what role they should play in supporting this process as part of theirstrategies to support sustainable development more generally.
8.4.2 Pricing
With increased demand for other forest services from natural forests and the introduction ofpolicies to support SFM, it is believed that the pattern of wood supply in the future will haveto move away from its current heavy dependence on the natural forest towards a broaderrange of supply sources. However, the extent to which future supply is taken fromplantations, trees outside of forests and recycled fibre sources will be strongly influenced bypricing policies in the natural forest.
There is a wealth of literature to suggest that many countries are setting stumpage rates atlevels well below forest concessionaires ability to pay (see, for example, Repetto and Gillis(1988) for an early review of some of these issues). Not only does this discourage the use ofother supply sources, but it also tends to distort investment decisions, discourage investmentin more efficient production processes and encourage unsustainable forest practices.
The World Bank and others should continue to encourage countries to improve their forestrevenue collection systems on the grounds of greater economic efficiency and in order toimprove the sustainability of their forest industry developments. To some extent, countriescould also be encouraged to use some of this money to improve the effectiveness of theirforestry administrations to monitor and control forest operations.
8.4.3 Human resource development
A third and often neglected implication of the outlook for future forest product supply anddemand is that many of the issues discussed in this report have tremendous implications forhuman resource development (HRD). Policies to implement SFM and develop SMEs (say,by encouraging greater supply from trees outside forests); and the general level of industryrestructuring towards more technologically complex production processes expected in thefuture, will all have to be supported by a significant and prolonged programme of HRD inmany developing countries.
Some countries have already begun to upgrade the skills of their forestry staff. For example,India has a superb forest surveying section and a considerable number of well trained forestryextension workers. Similarly, Malaysia has a well developed forest research and developmentcommunity. However, many countries have nowhere near the number of skilled staffnecessary to make SFM a viable proposition in the near future. This is particularly the case atthe lowest levels of forest operations, where forest workers often receive little training inanything but the most basic forestry skills.

FAO Paper for the World Bank Forest Policy Implementation Review and Strategy
_________________________________________________________________________________________Forest product market developments
105
The upgrading of human resources in the forestry sector in many countries will require asubstantial amount of funding and technical assistance. The World Bank and others shouldconsider the best way in which these investment needs can be met on a sustainable basis inthe long-run.
8.4.4 Industrial restructuring
The supply and demand outlook has suggested that there will be a significant need forindustrial restructuring. At a policy level, the World Bank, FAO and others should considerhow they can best help countries to re-align their industrial policies to take into account theexpected future changes in wood availability and forest products markets. This is particularlythe case in countries where past industrial policy has been designed to support industrieswhich may start to come under pressure (e.g. those relying on increasingly scarce large logs,such as the sawmilling and plywood industries). At a project level, there will also be someneed for sector reviews to help countries anticipate and adjust to the changes noted above.
Some of the future challenges in terms of required industrial restructuring will have cross-sectoral implications and touch on other government policies outside the forestry sector. TheWorld Bank can also play a useful role therefore, by trying to influence the relevant parts ofgovernment administrations outside of the forestry sector (e.g. industry, energy and planningministries) where appropriate.
8.4.5 Institutional development
Many forestry administrations in developing countries have evolved to fulfil fairly limitedroles. Mostly they have largely taken on the tasks of planning, encouraging or developing,then monitoring, roundwood production from the natural forest. The changing pattern offuture wood supply and developments such as SFM and greater needs for HRD, research andbetter management of protected areas, will all require forestry administrations to broadentheir activities.
As noted above, some have already started to do this (e.g. India and Malaysia), others willneed encouragement and technical assistance with the restructuring of their institutionalcapacities. The World Bank and others should support this at the policy level in their regulardialogues with countries and consider how technical assistance can best be provided tofacilitate this process.

A Whiteman, C Brown and G Bull
_________________________________________________________________________________________Forest product market developments
106

FAO Paper for the World Bank Forest Policy Implementation Review and Strategy
_________________________________________________________________________________________Forest product market developments
107
REFERENCES
Alexandratos, N (editor), World agriculture: towards 2010, an FAO study, JohnWiley, Chichester (UK).
Apsey and Reed, 1995, World timber resources outlook: current perceptions - adiscussion paper, Council of Forest Industries, Vancouver.
Atchison, J E, 1995, Twenty five years of global progress in non-wood plant fibrepulping - historical highlights, present status and future prospects, in: Proceedings,Tappi pulping conference (Book 1), pp 91-101, Tappi Press, Atlanta.
Blanchez, J, 1998, Forest resources and roundwood supply in the Asia-Pacificcountries: situation and outlook to the year 2010, Asia-Pacific Forestry SectorOutlook Study Working Paper APFSOS/WP/17, FAO, Rome.
Bourke, I J, and Leitch, J, 1998, Trade restrictions and their impact on internationaltrade in forest products, FAO, Rome.
Brown, C, 1999, The outlook for future wood supply from forest plantations, GlobalForest Products Outlook Study Working Paper GFPOS/WP/03, FAO, Rome.
Bull, G, Williams, J, and Duinker, P, 1997, Northern temperate and boreal forests,Towards a sustainable paper cycle: sub-study series no 3, International Institute forEnvironment and Development, London.
Contreras-Hermosilla, A, 1999, Towards sustainable forest management: anexamination of the technical, economic and institutional feasibility of improvingmanagement of the global forest estate, Background paper prepared for the WorldBank Forest Policy Implementation Review and Strategy, FAO/FPIRS/01, FAO,Rome.
EC, 1996, European Parliament and Council Directive 94/62/EC of 20th December1994 on packaging and packaging waste, available at the following website:http://www.micro.co.uk/dir11.html.
FAO, 1981, Tropical forest resources assessment project (in the framework of theGlobal Environment Monitoring System - GEMS): Forest resources of tropicalAsia, Technical report 3, FAO, Rome.
FAO, 1995, Forest resources assessment 1990: global synthesis; FAO Forestry Paper124, FAO, Rome.
FAO, 1997a, FAO provisional outlook for global forest products consumption,production and trade to 2010, FAO, Rome.

A Whiteman, C Brown and G Bull
_________________________________________________________________________________________Forest product market developments
108
FAO, 1997b, Compendium of demographic and Macro-economic assumptions:population, total gross domestic product and per caput gross domestic producttrends and projections 1970 - 2005, FAO Working Paper ESC/M/97/5, FAO,Rome.
FAO, 1997c, FAO yearbook: forest products 1991-1995, FAO Forestry Series no 30,FAO Statistics Series no 137, FAO, Rome.
FAO, 1998, Asia-Pacific forestry towards 2010: report of the Asia-Pacific forestrysector outlook study, FAO, Rome.
FAO, 1999a, The global fibre supply study, FAO, Rome.
FAO, 1999b, Forest products statistics, available from the World AgriculturalInformation Centre (WAICENT) at the FAO website: http://www.fao.org.
FAO, 1999c, State of the World's Forests 1999, FAO, Rome.
Forest Stewardship Council, 1999, List of certified forests at FSC-UK website:http://www.fsc-uk.demon.co.uk/index.html.
Government of Sri Lanka, 1995, Masterplan for Forestry, Government of Sri Lanka,Colombo.
Hansen, E, 1998, Certified forest products marketplace, in: Forest products annualmarket review 1997-1998, Timber Bulletin Volume LI (1998), No 3(ECE/TIM/BULL/51/3), UN, Geneva.
H C Mason and Associates, 1973, Study of softwood sawlog lumber conversionefficiency and the timber supply problem, H C Mason and Associates, GladstoneOR (USA).
Ince, P, Howard, J, Nicholson, G, and Darr, D, 1997, Production, imports, exports andconsumption of timber products in the United States: roundwood equivalents 1900to 1995, Presentation to the 1996 Forest Product Society Convention, Minneapolis.
Mabee, W E, and Pande, H, 1997, Recovered and non-wood fibre: effects ofalternative fibres on global fibre supply, Global Fibre Supply Study Working PaperGFSS/WP/04, FAO, Rome.
Margules, Groome and Pöyry, 1996, World wood - supply, demand and value andmarket-oriented reforms in the forestry sector, Presentation to project advisorycommittee meeting, Kunming, Yunnan Province, China, 29-30 April 1996.
Nilsson, S, 1996, Do we have enough forests?, IUFRO Occasional Paper No 5,International Institute for Applied Systems Analysis, Laxembourg.

FAO Paper for the World Bank Forest Policy Implementation Review and Strategy
_________________________________________________________________________________________Forest product market developments
109
Paine, J, 1997, Status, trends and future scenarios for forest conservation includingprotected areas in the Asia-Pacific region, Asia-Pacific Forestry Sector OutlookStudy Working Paper APFSOS/WP/04, FAO, Rome.
Pandey, D, 1997, Hardwood plantations in the tropics and subtropics: tropical forestplantation areas in 1995, Report for FAO Project: GCP/INT/628/UK, FAO, Rome.
Rametsteiner, E, Schwarzbauer, P, Justin, H, Kärnä, J, Cooper, R, Samuel, J, Becker,M, and Kühn, T, 1998, Potential markets for certified forest products in Europe,European Forest Institute Discussion Paper 2, European Forest Institute, Joensuu.
Repetto, R, and Gillis, M, 1988, Public policies and the misuse of forest resources,Cambridge University Press, Cambridge (UK).
Sedjo, R A, and Lyon, K S, 1990, The long-term adequacy of world timber supply,Resources for the Future, Washington.
Solberg, B, Brooks, D, Pajuoja, H, Peck, T J, Wardle, P A, 1996, Long-term trendsand prospects in world supply and demand for wood and implications forsustainable forest management: a synthesis, European Forest Institute ResearchReport 6, European Forest Institute, Joensuu.
Spelter, H, 1999, Technological changes in solid wood products manufacturing inNorth America and their impact on wood recovery, in: The impact of technologicalchange on the supply and demand for industrial roundwood, Global Forest ProductsOutlook Study Working Paper GFPOS/WP/04, FAO, Rome.
Stolp, J A N, 1997, The Netherlands national market report 1997, paper presented tothe 55th Session of the ECE Timber Committee, 6-9th October 1997, Geneva.
Tomberlin, D, Zhu, S, and Buongiorno, J, 1999, The global forest products model(GFPM): users manual and guide to installation, Global Forest Products OutlookStudy Working Paper GFPOS/WP/02, FAO, Rome.
UN, 1996a, European timber trends and prospects: into the 21st Century, GenevaTimber and Forest Study Papers ECE/TIM/SP/11, UN, Geneva.
UN, 1996b, North American timber trends study, Geneva Timber and Forest StudyPapers ECE/TIM/SP/9, UN, Geneva.
UN, 1998, World population projections to 2150, Population Division, Department ofEconomic and Social Affairs, UN, New York.
Vichnevetskaia, K, 1997, Factors affecting productivity of tropical forest plantations:acacia, eucalypt, teak, pine, Global Fibre Supply Study Working PaperGFSS/WP/02, FAO, Rome.

A Whiteman, C Brown and G Bull
_________________________________________________________________________________________Forest product market developments
110
WCMC/CIFOR, 1998, A global overview of forest conservation: including GISdigital files of forests and protected areas: version 2, available from the followingwebsite: http://www.wcmc.org.uk/forest/data/cd2flier.htm.
Whiteman, A, in prep, The outlook for global forest products markets to the year2010: report of the global forest products outlook study, FAO, Rome.
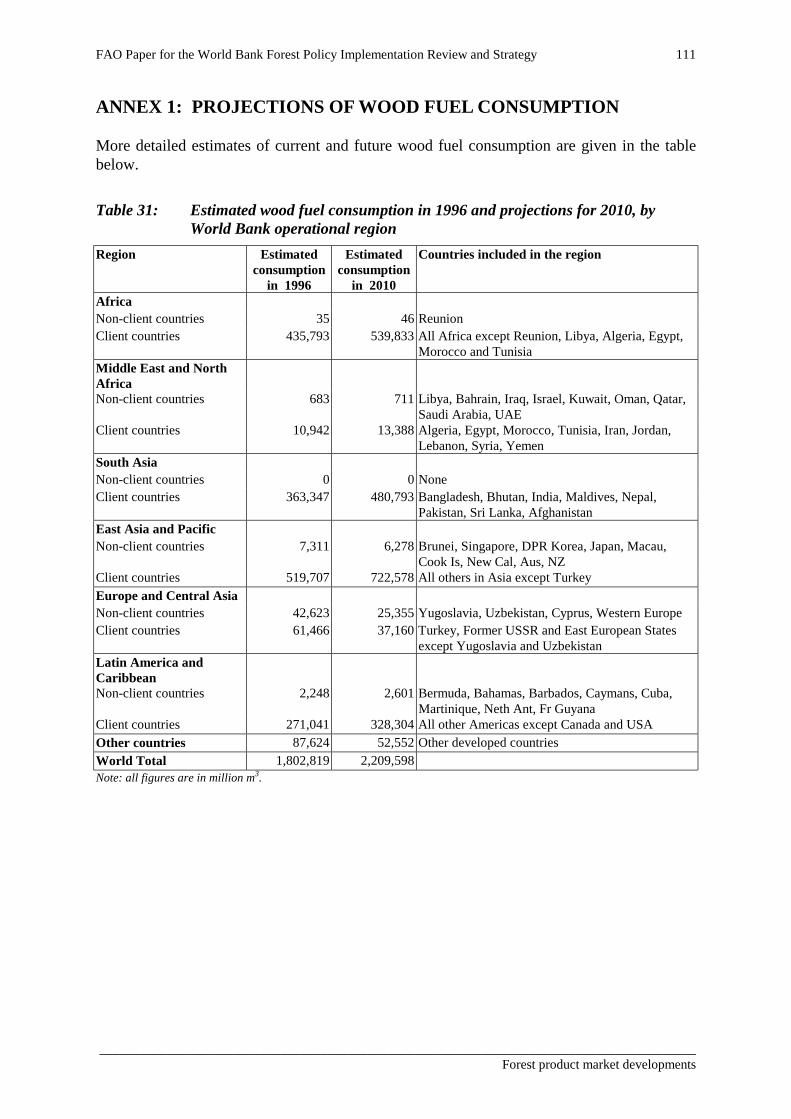
FAO Paper for the World Bank Forest Policy Implementation Review and Strategy
_________________________________________________________________________________________Forest product market developments
111
ANNEX 1: PROJECTIONS OF WOOD FUEL CONSUMPTION
More detailed estimates of current and future wood fuel consumption are given in the tablebelow.
Table 31: Estimated wood fuel consumption in 1996 and projections for 2010, byWorld Bank operational region
Region Estimatedconsumption
in 1996
Estimatedconsumption
in 2010
Countries included in the region
AfricaNon-client countries 35 46 ReunionClient countries 435,793 539,833 All Africa except Reunion, Libya, Algeria, Egypt,
Morocco and TunisiaMiddle East and NorthAfricaNon-client countries 683 711 Libya, Bahrain, Iraq, Israel, Kuwait, Oman, Qatar,
Saudi Arabia, UAEClient countries 10,942 13,388 Algeria, Egypt, Morocco, Tunisia, Iran, Jordan,
Lebanon, Syria, YemenSouth AsiaNon-client countries 0 0 NoneClient countries 363,347 480,793 Bangladesh, Bhutan, India, Maldives, Nepal,
Pakistan, Sri Lanka, AfghanistanEast Asia and PacificNon-client countries 7,311 6,278 Brunei, Singapore, DPR Korea, Japan, Macau,
Cook Is, New Cal, Aus, NZClient countries 519,707 722,578 All others in Asia except TurkeyEurope and Central AsiaNon-client countries 42,623 25,355 Yugoslavia, Uzbekistan, Cyprus, Western EuropeClient countries 61,466 37,160 Turkey, Former USSR and East European States
except Yugoslavia and UzbekistanLatin America andCaribbeanNon-client countries 2,248 2,601 Bermuda, Bahamas, Barbados, Caymans, Cuba,
Martinique, Neth Ant, Fr GuyanaClient countries 271,041 328,304 All other Americas except Canada and USAOther countries 87,624 52,552 Other developed countriesWorld Total 1,802,819 2,209,598Note: all figures are in million m3.

A Whiteman, C Brown and G Bull
_________________________________________________________________________________________Forest product market developments
112

FAO Paper for the World Bank Forest Policy Implementation Review and Strategy
_________________________________________________________________________________________Forest product market developments
113
ANNEX 2: SUPPLY AND DEMAND PROJECTIONS BY WORLD BANKOPERATIONAL REGIONS
Table 32: Industrial roundwood - current and projected supply and demand by WorldBank operational region
Industrial roundwood
(1,000 m3) % (1,000 m3) % (1,000 m3) % (1,000 m3) %
Africa (non-client countries) 122 0.0% 126 0.0% 119 0.0% 116 0.0%
South Africa 18,176 1.2% 15,780 1.1% 21,677 1.2% 18,214 1.0%
Nigeria 8,479 0.6% 8,470 0.6% 9,698 0.5% 9,796 0.5%
Congo, Democratic Republic of 3,433 0.2% 3,255 0.2% 4,694 0.3% 4,580 0.2%
Cameroon 3,364 0.2% 2,057 0.1% 3,455 0.2% 1,806 0.1%
Côte d'Ivoire 3,008 0.2% 2,676 0.2% 2,989 0.2% 2,929 0.2%
Others 29,675 2.0% 26,598 1.8% 38,637 2.1% 34,430 1.8%
Africa (client countries) 66,135 4.4% 58,835 3.9% 81,150 4.3% 71,755 3.8%
Africa (total) 66,257 4.4% 58,962 3.9% 81,269 4.3% 71,870 3.8%
E Asia and Pacific (non-client countries) 60,535 4.1% 93,908 6.3% 82,436 4.4% 130,297 6.9%
China 108,718 7.3% 112,407 7.5% 151,582 8.1% 154,770 8.2%
Indonesia 47,245 3.2% 46,739 3.1% 57,256 3.1% 56,960 3.0%
Malaysia 35,771 2.4% 28,843 1.9% 37,910 2.0% 24,883 1.3%
Viet Nam 4,487 0.3% 4,139 0.3% 6,106 0.3% 6,096 0.3%
Philippines 3,394 0.2% 4,017 0.3% 6,064 0.3% 6,072 0.3%
Others 43,844 2.9% 48,852 3.3% 79,448 4.2% 87,164 4.6%
E Asia and Pacific (client countries) 243,459 16.3% 244,996 16.4% 338,366 18.1% 335,945 17.9%
E Asia and Pacific (total) 303,994 20.4% 338,904 22.7% 420,803 22.5% 466,242 24.8%
Europe and C Asia (non-client countries) 227,541 15.3% 251,493 16.8% 306,913 16.4% 343,992 18.3%
Russian Federation 67,000 4.5% 51,652 3.5% 94,523 5.1% 83,542 4.4%
Poland 17,783 1.2% 17,785 1.2% 17,854 1.0% 17,539 0.9%
Turkey 10,745 0.7% 11,501 0.8% 13,789 0.7% 13,806 0.7%
Romania 9,441 0.6% 9,516 0.6% 9,028 0.5% 9,008 0.5%
Belarus 9,206 0.6% 8,690 0.6% 14,221 0.8% 13,278 0.7%
Others 38,715 2.6% 29,184 2.0% 90,389 4.8% 74,975 4.0%
Europe and C Asia (client countries) 152,890 10.3% 128,328 8.6% 239,803 12.8% 212,148 11.3%
Europe and C Asia (total) 380,431 25.5% 379,821 25.4% 546,716 29.2% 556,140 29.6%
L A and Caribbean (non-client countries) 795 0.1% 827 0.1% 1,084 0.1% 1,043 0.1%
Brazil 84,711 5.7% 82,504 5.5% 97,405 5.2% 88,114 4.7%
Chile 21,387 1.4% 14,938 1.0% 28,933 1.5% 21,971 1.2%
Argentina 6,220 0.4% 5,258 0.4% 10,752 0.6% 7,756 0.4%
Mexico 5,914 0.4% 5,914 0.4% 6,222 0.3% 5,677 0.3%
Ecuador 5,514 0.4% 5,495 0.4% 1,558 0.1% 1,519 0.1%
Others 16,089 1.1% 15,698 1.1% 17,748 0.9% 16,441 0.9%
L A and Caribbean (client countries) 139,834 9.4% 129,806 8.7% 162,617 8.7% 141,479 7.5%
L A and Caribbean (total) 140,630 9.4% 130,633 8.8% 163,701 8.7% 142,522 7.6%
Mid East and N Africa (non-client countries) 267 0.0% 401 0.0% 571 0.0% 569 0.0%
Iran (Islamic Republic of) 4,902 0.3% 4,894 0.3% 6,676 0.4% 6,676 0.4%
Morocco 941 0.1% 1,275 0.1% 1,184 0.1% 1,283 0.1%
Algeria 395 0.0% 442 0.0% 454 0.0% 507 0.0%
Tunisia 210 0.0% 248 0.0% 432 0.0% 554 0.0%
Egypt 128 0.0% 241 0.0% 191 0.0% 467 0.0%
Others 46 0.0% 97 0.0% 645 0.0% 647 0.0%
Mid East and N Africa (client countries) 6,621 0.4% 7,197 0.5% 9,581 0.5% 10,134 0.5%
Mid East and N Africa (total) 6,888 0.5% 7,597 0.5% 10,152 0.5% 10,704 0.6%
South Asia (non-client countries) 0 0.0% 0 0.0% 0 0.0% 0 0.0%
India 24,989 1.7% 25,302 1.7% 46,936 2.5% 49,955 2.7%
Pakistan 2,062 0.1% 2,192 0.1% 3,462 0.2% 3,463 0.2%
Afghanistan 1,742 0.1% 1,740 0.1% 1,877 0.1% 1,877 0.1%
Sri Lanka 710 0.0% 710 0.0% 1,014 0.1% 1,014 0.1%
Nepal 620 0.0% 620 0.0% 1,264 0.1% 1,266 0.1%
Others 657 0.0% 666 0.0% 1,194 0.1% 1,196 0.1%
South Asia (client countries) 30,780 2.1% 31,230 2.1% 55,746 3.0% 58,771 3.1%
South Asia (total) 30,780 2.1% 31,230 2.1% 55,746 3.0% 58,771 3.1%
Other countries 560,544 37.6% 545,781 36.6% 593,188 31.7% 574,490 30.5%
World total 1,489,524 100.0% 1,492,929 100.0% 1,871,574 100.0% 1,880,738 100.0%
1996
Production Consumption
2010
Production Consumption

A Whiteman, C Brown and G Bull
_________________________________________________________________________________________Forest product market developments
114
Table 33: Sawnwood - current and projected supply and demand by World Bankoperational region
Sawnwood
(1,000 m3) % (1,000 m3) % (1,000 m3) % (1,000 m3) %
Africa (non-client countries) 33 0.0% 301 0.1% 10 0.0% 155 0.0%
South Africa 1,574 0.4% 1,948 0.5% 1,852 0.4% 1,812 0.4%
Nigeria 2,723 0.6% 2,698 0.6% 3,135 0.6% 3,132 0.6%
Congo, Democratic Republic of 100 0.0% 56 0.0% 88 0.0% 85 0.0%
Cameroon 1,400 0.3% 1,084 0.3% 259 0.1% 224 0.0%
Côte d'Ivoire 706 0.2% 206 0.0% 730 0.1% 110 0.0%
Others 2,495 0.6% 2,261 0.5% 2,394 0.5% 2,444 0.5%
Africa (client countries) 8,998 2.1% 8,252 1.9% 8,458 1.7% 7,807 1.6%
Africa (total) 9,031 2.1% 8,554 2.0% 8,468 1.7% 7,962 1.6%
E Asia and Pacific (non-client countries) 31,290 7.3% 43,114 10.1% 42,024 8.4% 50,530 10.1%
China 26,969 6.3% 28,901 6.8% 29,920 6.0% 37,202 7.5%
Indonesia 7,338 1.7% 6,941 1.6% 11,381 2.3% 10,553 2.1%
Malaysia 8,382 2.0% 4,985 1.2% 6,243 1.2% 5,948 1.2%
Viet Nam 721 0.2% 698 0.2% 873 0.2% 873 0.2%
Philippines 313 0.1% 735 0.2% 347 0.1% 859 0.2%
Others 24,986 5.8% 28,043 6.6% 31,995 6.4% 36,354 7.3%
E Asia and Pacific (client countries) 68,708 16.0% 70,303 16.5% 80,759 16.1% 91,789 18.4%
E Asia and Pacific (total) 99,998 23.3% 113,417 26.6% 122,783 24.5% 142,319 28.6%
Europe and C Asia (non-client countries) 71,639 16.7% 74,191 17.4% 83,585 16.7% 91,268 18.3%
Russian Federation 21,600 5.0% 16,927 4.0% 30,586 6.1% 26,457 5.3%
Poland 5,060 1.2% 4,190 1.0% 4,576 0.9% 4,290 0.9%
Turkey 4,331 1.0% 4,455 1.0% 4,848 1.0% 4,884 1.0%
Romania 1,693 0.4% 808 0.2% 1,527 0.3% 1,217 0.2%
Belarus 1,545 0.4% 1,397 0.3% 1,961 0.4% 1,652 0.3%
Others 8,764 2.0% 4,432 1.0% 19,202 3.8% 15,927 3.2%
Europe and C Asia (client countries) 42,993 10.0% 32,209 7.6% 62,700 12.5% 54,428 10.9%
Europe and C Asia (total) 114,631 26.7% 106,400 25.0% 146,285 29.2% 145,696 29.2%
L A and Caribbean (non-client countries) 149 0.0% 426 0.1% 104 0.0% 449 0.1%
Brazil 19,091 4.4% 17,563 4.1% 20,067 4.0% 20,453 4.1%
Chile 3,802 0.9% 2,739 0.6% 3,182 0.6% 3,155 0.6%
Argentina 1,000 0.2% 1,121 0.3% 1,356 0.3% 1,296 0.3%
Mexico 2,543 0.6% 2,816 0.7% 1,228 0.2% 3,711 0.7%
Ecuador 1,886 0.4% 1,803 0.4% 270 0.1% 269 0.1%
Others 4,330 1.0% 4,144 1.0% 4,356 0.9% 5,667 1.1%
L A and Caribbean (client countries) 32,652 7.6% 30,186 7.1% 30,458 6.1% 34,551 6.9%
L A and Caribbean (total) 32,801 7.6% 30,612 7.2% 30,562 6.1% 35,000 7.0%
Mid East and N Africa (non-client countries) 39 0.0% 2,091 0.5% 25 0.0% 1,912 0.4%
Iran (Islamic Republic of) 159 0.0% 160 0.0% 203 0.0% 203 0.0%
Morocco 83 0.0% 622 0.1% 136 0.0% 794 0.2%
Algeria 13 0.0% 384 0.1% 0 0.0% 324 0.1%
Tunisia 20 0.0% 319 0.1% 0 0.0% 500 0.1%
Egypt 0 0.0% 2,532 0.6% 0 0.0% 1,190 0.2%
Others 18 0.0% 565 0.1% 101 0.0% 422 0.1%
Mid East and N Africa (client countries) 293 0.1% 4,582 1.1% 440 0.1% 3,433 0.7%
Mid East and N Africa (total) 332 0.1% 6,673 1.6% 465 0.1% 5,345 1.1%
South Asia (non-client countries) 0 0.0% 0 0.0% 0 0.0% 0 0.0%
India 17,460 4.1% 17,450 4.1% 22,208 4.4% 22,207 4.5%
Pakistan 1,280 0.3% 1,342 0.3% 1,421 0.3% 1,421 0.3%
Afghanistan 400 0.1% 400 0.1% 443 0.1% 443 0.1%
Sri Lanka 5 0.0% 20 0.0% 0 0.0% 29 0.0%
Nepal 620 0.1% 620 0.1% 772 0.2% 772 0.2%
Others 88 0.0% 88 0.0% 124 0.0% 124 0.0%
South Asia (client countries) 19,853 4.6% 19,921 4.7% 24,968 5.0% 24,996 5.0%
South Asia (total) 19,853 4.6% 19,921 4.7% 24,968 5.0% 24,996 5.0%
Other countries 152,999 35.6% 140,719 33.0% 167,723 33.5% 136,970 27.5%
World total 429,645 100.0% 426,295 100.0% 501,254 100.0% 498,288 100.0%
1996 2010
Production Consumption Production Consumption

FAO Paper for the World Bank Forest Policy Implementation Review and Strategy
_________________________________________________________________________________________Forest product market developments
115
Table 34: Wood based panel - current and projected supply and demand by WorldBank operational region
Wood based panels
(1,000 m3) % (1,000 m3) % (1,000 m3) % (1,000 m3) %
Africa (non-client countries) 0 0.0% 54 0.0% 0 0.0% 47 0.0%
South Africa 653 0.4% 741 0.5% 492 0.3% 456 0.3%
Nigeria 115 0.1% 135 0.1% 113 0.1% 153 0.1%
Congo, Democratic Republic of 21 0.0% 16 0.0% 24 0.0% 24 0.0%
Cameroon 74 0.0% 36 0.0% 75 0.0% 68 0.0%
Côte d'Ivoire 272 0.2% 199 0.1% 72 0.0% 56 0.0%
Others 418 0.3% 326 0.2% 710 0.4% 715 0.4%
Africa (client countries) 1,552 1.0% 1,453 1.0% 1,485 0.8% 1,472 0.8%
Africa (total) 1,552 1.0% 1,507 1.0% 1,485 0.8% 1,519 0.8%
E Asia and Pacific (non-client countries) 9,530 6.4% 16,024 10.8% 13,973 7.8% 19,320 10.8%
China 15,349 10.3% 19,479 13.1% 13,912 7.8% 16,014 8.9%
Indonesia 10,128 6.8% 1,873 1.3% 11,978 6.7% 3,376 1.9%
Malaysia 6,770 4.5% 1,760 1.2% 4,141 2.3% 2,183 1.2%
Viet Nam 39 0.0% 58 0.0% 50 0.0% 51 0.0%
Philippines 596 0.4% 833 0.6% 496 0.3% 499 0.3%
Others 3,292 2.2% 5,322 3.6% 4,525 2.5% 9,541 5.3%
E Asia and Pacific (client countries) 36,174 24.2% 29,323 19.8% 35,102 19.6% 31,666 17.7%
E Asia and Pacific (total) 45,704 30.6% 45,348 30.5% 49,075 27.3% 50,986 28.5%
Europe and C Asia (non-client countries) 34,710 23.2% 36,147 24.4% 49,630 27.6% 46,922 26.2%
Russian Federation 3,036 2.0% 2,126 1.4% 6,305 3.5% 5,628 3.1%
Poland 2,410 1.6% 2,248 1.5% 2,809 1.6% 3,121 1.7%
Turkey 1,078 0.7% 1,316 0.9% 835 0.5% 1,126 0.6%
Romania 433 0.3% 435 0.3% 508 0.3% 556 0.3%
Belarus 374 0.3% 348 0.2% 570 0.3% 485 0.3%
Others 3,235 2.2% 2,480 1.7% 6,670 3.7% 6,901 3.9%
Europe and C Asia (client countries) 10,566 7.1% 8,952 6.0% 17,695 9.9% 17,817 10.0%
Europe and C Asia (total) 45,276 30.3% 45,099 30.4% 67,325 37.5% 64,739 36.2%
L A and Caribbean (non-client countries) 149 0.1% 226 0.2% 201 0.1% 267 0.1%
Brazil 3,558 2.4% 2,617 1.8% 3,320 1.8% 1,849 1.0%
Chile 844 0.6% 446 0.3% 782 0.4% 786 0.4%
Argentina 590 0.4% 448 0.3% 1,274 0.7% 1,208 0.7%
Mexico 606 0.4% 764 0.5% 1,272 0.7% 1,285 0.7%
Ecuador 380 0.3% 296 0.2% 336 0.2% 335 0.2%
Others 821 0.5% 827 0.6% 1,231 0.7% 1,423 0.8%
L A and Caribbean (client countries) 6,799 4.6% 5,398 3.6% 8,214 4.6% 6,884 3.8%
L A and Caribbean (total) 6,948 4.7% 5,625 3.8% 8,415 4.7% 7,151 4.0%
Mid East and N Africa (non-client countries) 180 0.1% 1,430 1.0% 149 0.1% 1,266 0.7%
Iran (Islamic Republic of) 383 0.3% 384 0.3% 331 0.2% 331 0.2%
Morocco 35 0.0% 67 0.0% 111 0.1% 88 0.0%
Algeria 50 0.0% 107 0.1% 88 0.0% 147 0.1%
Tunisia 104 0.1% 136 0.1% 214 0.1% 258 0.1%
Egypt 81 0.1% 202 0.1% 164 0.1% 346 0.2%
Others 73 0.0% 319 0.2% 28 0.0% 401 0.2%
Mid East and N Africa (client countries) 725 0.5% 1,214 0.8% 936 0.5% 1,570 0.9%
Mid East and N Africa (total) 905 0.6% 2,644 1.8% 1,085 0.6% 2,837 1.6%
South Asia (non-client countries) 0 0.0% 0 0.0% 0 0.0% 0 0.0%
India 348 0.2% 348 0.2% 631 0.4% 624 0.3%
Pakistan 110 0.1% 127 0.1% 149 0.1% 149 0.1%
Afghanistan 1 0.0% 2 0.0% 1 0.0% 2 0.0%
Sri Lanka 15 0.0% 26 0.0% 42 0.0% 71 0.0%
Nepal 0 0.0% 0 0.0% 0 0.0% 0 0.0%
Others 22 0.0% 27 0.0% 31 0.0% 31 0.0%
South Asia (client countries) 496 0.3% 530 0.4% 854 0.5% 877 0.5%
South Asia (total) 496 0.3% 530 0.4% 854 0.5% 877 0.5%
Other countries 48,505 32.5% 47,688 32.1% 51,269 28.6% 50,932 28.4%
World total 149,385 100.0% 148,440 100.0% 179,508 100.0% 179,040 100.0%
1996 2010
Production Consumption Production Consumption

A Whiteman, C Brown and G Bull
_________________________________________________________________________________________Forest product market developments
116
Table 35: Pulp - current and projected supply and demand by World Bank operationalregion
Pulp
(1,000 MT) % (1,000 MT) % (1,000 MT) % (1,000 MT) %
Africa (non-client countries) 0 0.0% 2 0.0% 11 0.0% 11 0.0%
South Africa 1,547 0.9% 1,177 0.7% 1,888 0.9% 1,693 0.8%
Nigeria 7 0.0% 14 0.0% 6 0.0% 8 0.0%
Congo, Democratic Republic of 0 0.0% 0 0.0% 4 0.0% 4 0.0%
Cameroon 0 0.0% 0 0.0% 0 0.0% 0 0.0%
Côte d'Ivoire 0 0.0% 0 0.0% 0 0.0% 0 0.0%
Others 380 0.2% 194 0.1% 365 0.2% 267 0.1%
Africa (client countries) 1,934 1.1% 1,385 0.8% 2,262 1.1% 1,972 1.0%
Africa (total) 1,934 1.1% 1,387 0.8% 2,273 1.1% 1,982 1.0%
E Asia and Pacific (non-client countries) 13,501 7.5% 16,389 9.2% 15,617 7.5% 17,153 8.3%
China 24,751 13.8% 26,809 15.0% 35,330 17.0% 36,467 17.6%
Indonesia 2,635 1.5% 2,143 1.2% 2,753 1.3% 2,810 1.4%
Malaysia 103 0.1% 167 0.1% 997 0.5% 998 0.5%
Viet Nam 133 0.1% 167 0.1% 94 0.0% 137 0.1%
Philippines 149 0.1% 201 0.1% 152 0.1% 243 0.1%
Others 3,312 1.8% 6,132 3.4% 5,144 2.5% 9,111 4.4%
E Asia and Pacific (client countries) 31,082 17.4% 35,619 20.0% 44,469 21.4% 49,766 24.0%
E Asia and Pacific (total) 44,583 24.9% 52,009 29.1% 60,086 28.9% 66,919 32.2%
Europe and C Asia (non-client countries) 32,620 18.2% 38,530 21.6% 41,910 20.1% 42,311 20.4%
Russian Federation 3,725 2.1% 2,758 1.5% 2,936 1.4% 2,734 1.3%
Poland 848 0.5% 969 0.5% 935 0.4% 1,316 0.6%
Turkey 354 0.2% 500 0.3% 203 0.1% 621 0.3%
Romania 247 0.1% 258 0.1% 273 0.1% 267 0.1%
Belarus 31 0.0% 36 0.0% 217 0.1% 217 0.1%
Others 1,116 0.6% 1,016 0.6% 3,304 1.6% 3,097 1.5%
Europe and C Asia (client countries) 6,321 3.5% 5,536 3.1% 7,868 3.8% 8,252 4.0%
Europe and C Asia (total) 38,941 21.7% 44,066 24.7% 49,778 23.9% 50,564 24.4%
L A and Caribbean (non-client countries) 52 0.0% 56 0.0% 21 0.0% 21 0.0%
Brazil 6,225 3.5% 4,258 2.4% 7,144 3.4% 4,363 2.1%
Chile 2,123 1.2% 479 0.3% 4,056 1.9% 514 0.2%
Argentina 822 0.5% 768 0.4% 1,005 0.5% 535 0.3%
Mexico 511 0.3% 887 0.5% 661 0.3% 860 0.4%
Ecuador 0 0.0% 5 0.0% 11 0.0% 111 0.1%
Others 559 0.3% 903 0.5% 1,067 0.5% 1,423 0.7%
L A and Caribbean (client countries) 10,240 5.7% 7,301 4.1% 13,943 6.7% 7,805 3.8%
L A and Caribbean (total) 10,292 5.7% 7,357 4.1% 13,964 6.7% 7,826 3.8%
Mid East and N Africa (non-client countries) 9 0.0% 242 0.1% 38 0.0% 276 0.1%
Iran (Islamic Republic of) 245 0.1% 269 0.2% 195 0.1% 279 0.1%
Morocco 104 0.1% 60 0.0% 9 0.0% 68 0.0%
Algeria 21 0.0% 84 0.0% 50 0.0% 151 0.1%
Tunisia 12 0.0% 52 0.0% 11 0.0% 47 0.0%
Egypt 60 0.0% 124 0.1% 77 0.0% 105 0.1%
Others 8 0.0% 79 0.0% 105 0.1% 145 0.1%
Mid East and N Africa (client countries) 450 0.3% 669 0.4% 446 0.2% 794 0.4%
Mid East and N Africa (total) 459 0.3% 912 0.5% 484 0.2% 1,070 0.5%
South Asia (non-client countries) 0 0.0% 0 0.0% 0 0.0% 0 0.0%
India 1,870 1.0% 2,132 1.2% 2,375 1.1% 2,392 1.2%
Pakistan 165 0.1% 243 0.1% 128 0.1% 346 0.2%
Afghanistan 0 0.0% 0 0.0% 0 0.0% 0 0.0%
Sri Lanka 10 0.0% 21 0.0% 4 0.0% 52 0.0%
Nepal 15 0.0% 15 0.0% 9 0.0% 9 0.0%
Others 122 0.1% 129 0.1% 152 0.1% 195 0.1%
South Asia (client countries) 2,182 1.2% 2,540 1.4% 2,669 1.3% 2,995 1.4%
South Asia (total) 2,182 1.2% 2,540 1.4% 2,669 1.3% 2,995 1.4%
Other countries 80,694 45.1% 70,148 39.3% 78,757 37.9% 76,184 36.7%
World total 179,083 100.0% 178,418 100.0% 208,009 100.0% 207,540 100.0%
1996 2010
Production Consumption Production Consumption

FAO Paper for the World Bank Forest Policy Implementation Review and Strategy
_________________________________________________________________________________________Forest product market developments
117
Table 36: Paper and paperboard - current and projected supply and demand by WorldBank operational region
Paper
(1,000 MT) % (1,000 MT) % (1,000 MT) % (1,000 MT) %
Africa (non-client countries) 6 0.0% 30 0.0% 12 0.0% 45 0.0%
South Africa 1,871 0.7% 1,708 0.6% 2,439 0.6% 2,616 0.7%
Nigeria 57 0.0% 111 0.0% 27 0.0% 209 0.1%
Congo, Democratic Republic of 3 0.0% 5 0.0% 4 0.0% 19 0.0%
Cameroon 5 0.0% 36 0.0% 0 0.0% 40 0.0%
Côte d'Ivoire 0 0.0% 52 0.0% 0 0.0% 13 0.0%
Others 258 0.1% 388 0.1% 453 0.1% 637 0.2%
Africa (client countries) 2,194 0.8% 2,299 0.8% 2,922 0.7% 3,533 0.9%
Africa (total) 2,200 0.8% 2,330 0.8% 2,934 0.7% 3,578 0.9%
E Asia and Pacific (non-client countries) 32,832 11.5% 34,760 12.5% 51,163 13.0% 50,273 12.9%
China 30,253 10.6% 32,917 11.8% 50,980 12.9% 48,098 12.3%
Indonesia 4,386 1.5% 3,372 1.2% 5,014 1.3% 4,278 1.1%
Malaysia 674 0.2% 1,442 0.5% 1,817 0.5% 2,333 0.6%
Viet Nam 125 0.0% 194 0.1% 245 0.1% 260 0.1%
Philippines 613 0.2% 948 0.3% 438 0.1% 1,304 0.3%
Others 13,887 4.9% 15,551 5.6% 17,167 4.4% 24,436 6.3%
E Asia and Pacific (client countries) 49,938 17.6% 54,424 19.5% 75,662 19.2% 80,708 20.6%
E Asia and Pacific (total) 82,770 29.1% 89,184 32.0% 126,825 32.2% 130,980 33.5%
Europe and C Asia (non-client countries) 73,403 25.8% 66,488 23.9% 100,810 25.6% 92,260 23.6%
Russian Federation 3,212 1.1% 1,788 0.6% 4,252 1.1% 3,563 0.9%
Poland 1,525 0.5% 1,689 0.6% 2,515 0.6% 2,388 0.6%
Turkey 1,235 0.4% 1,772 0.6% 1,128 0.3% 1,366 0.3%
Romania 332 0.1% 320 0.1% 433 0.1% 402 0.1%
Belarus 131 0.0% 133 0.0% 239 0.1% 239 0.1%
Others 2,333 0.8% 2,553 0.9% 5,825 1.5% 6,730 1.7%
Europe and C Asia (client countries) 8,768 3.1% 8,256 3.0% 14,391 3.7% 14,687 3.8%
Europe and C Asia (total) 82,171 28.9% 74,744 26.8% 115,201 29.2% 106,947 27.4%
L A and Caribbean (non-client countries) 57 0.0% 94 0.0% 59 0.0% 95 0.0%
Brazil 5,885 2.1% 5,574 2.0% 7,714 2.0% 6,376 1.6%
Chile 597 0.2% 606 0.2% 910 0.2% 873 0.2%
Argentina 1,108 0.4% 1,630 0.6% 947 0.2% 2,006 0.5%
Mexico 3,047 1.1% 3,494 1.3% 5,094 1.3% 4,703 1.2%
Ecuador 86 0.0% 399 0.1% 460 0.1% 532 0.1%
Others 1,808 0.6% 3,234 1.2% 3,727 0.9% 4,100 1.0%
L A and Caribbean (client countries) 12,531 4.4% 14,938 5.4% 18,852 4.8% 18,590 4.8%
L A and Caribbean (total) 12,588 4.4% 15,032 5.4% 18,911 4.8% 18,685 4.8%
Mid East and N Africa (non-client countries) 299 0.1% 1,113 0.4% 483 0.1% 2,000 0.5%
Iran (Islamic Republic of) 205 0.1% 567 0.2% 502 0.1% 540 0.1%
Morocco 106 0.0% 239 0.1% 189 0.0% 356 0.1%
Algeria 78 0.0% 199 0.1% 193 0.0% 240 0.1%
Tunisia 90 0.0% 154 0.1% 66 0.0% 219 0.1%
Egypt 221 0.1% 483 0.2% 232 0.1% 824 0.2%
Others 74 0.0% 309 0.1% 276 0.1% 469 0.1%
Mid East and N Africa (client countries) 774 0.3% 1,952 0.7% 1,458 0.4% 2,647 0.7%
Mid East and N Africa (total) 1,073 0.4% 3,065 1.1% 1,940 0.5% 4,647 1.2%
South Asia (non-client countries) 0 0.0% 0 0.0% 0 0.0% 0 0.0%
India 3,025 1.1% 3,369 1.2% 4,338 1.1% 4,340 1.1%
Pakistan 447 0.2% 661 0.2% 640 0.2% 840 0.2%
Afghanistan 0 0.0% 1 0.0% 0 0.0% 1 0.0%
Sri Lanka 25 0.0% 103 0.0% 89 0.0% 230 0.1%
Nepal 13 0.0% 13 0.0% 17 0.0% 17 0.0%
Others 160 0.1% 264 0.1% 314 0.1% 349 0.1%
South Asia (client countries) 3,670 1.3% 4,412 1.6% 5,398 1.4% 5,777 1.5%
South Asia (total) 3,670 1.3% 4,412 1.6% 5,398 1.4% 5,777 1.5%
Other countries 99,912 35.1% 89,974 32.3% 122,744 31.2% 120,335 30.8%
World total 284,383 100.0% 278,740 100.0% 393,952 100.0% 390,950 100.0%
1996 2010
Production Consumption Production Consumption

A Whiteman, C Brown and G Bull
_________________________________________________________________________________________Forest product market developments
118

FAO Paper for the World Bank Forest Policy Implementation Review and Strategy
_________________________________________________________________________________________Forest product market developments
119
PAPERS PRODUCED BY FAO FOR THE WORLD BANK FORESTPOLICY IMPLEMENTATION REVIEW AND STRATEGY
Contreras-Hermosilla, A, 1999, Towards sustainable forest management: an examination ofthe technical, economic and institutional feasibility of improving management of theglobal forest estate, FAO/FPIRS/01.
Whiteman, A, Brown, C, and Bull, G, 1999, Forest product market developments: the outlookfor forest product markets to 2010 and the implications for improving management ofthe global forest estate, FAO/FPIRS/02.
Hagner, S, 1999, Forest management in temperate and boreal forests: current practices andthe scope for implementing sustainable forest management, FAO/FPIRS/03.
Dupuy, B, Maître, H -F, and Amsallem, I, 1999, Tropical forest management techniques: areview of the sustainability of forest management practices in tropical countries,FAO/FPIRS/04.
Dupuy, B, Maître, H -F, and Amsallem, I, 1999, Techniques de gestion des écosystèmesforestiers tropicaux: etat de l'art, FAO/FPIRS/05.

A Whiteman, C Brown and G Bull
_________________________________________________________________________________________Forest product market developments
120