The dynamics of financial globalization: Technology, market structure, and policy response
Upload
khangminh22Category
view
1download
0
The global financial crisis and subsequent global recession led to only a modest deceleration of credit in emerging market and developing economies (EMDEs), partly reflecting a general reliance of EMDE banks on local funding bases, limited exposure to sophisticated derivative financial products that suffered stress, strengthened macroeconomic policy frameworks, and improved supervision and regulation. A number of EMDEs, however, experienced credit crunches amid a loss of access to external funding—especially in Europe and Central Asia, as foreign banks that operated local subsidiaries and branches deleveraged. Following the global recession, many EMDEs have experienced a rapid buildup of debt and a shift toward lightly regulated nonbank financial intermediaries, which have heightened their vulnerability to financial disruption. These trends underscore the importance of an effective system of regulation and supervision, including appropriate macroprudential tools, to help contain systemic financial stability risks. The increasing regional role of EMDE banks also calls for close cooperation between home and host country regulators.
Introduction
Across emerging market and developing economies (EMDEs), robust economic growth before the 2009 global recession was accompanied by increasing financial deepening. The ratio of domestic banks’ assets to gross domestic product (GDP) in the median EMDE increased from 26 percent at end-2002 to 31 percent at end-2007.1 By the onset of the global recession, EMDE banks were the main source of domestic private sector credit and were mostly funded by local deposits, which limited funding risks for banks and nonfinancial corporations.
This funding pattern—as well as minimal exposure to financial derivatives, especially those related to the housing sector in the United States—limited the spillovers from the global financial crisis to EMDEs. The resilience of EMDE financial systems was also buttressed by earlier efforts to strengthen macroeconomic policy and financial oversight frameworks, and by the financial buffers that were built in response to previous financial crises.2
Note: This chapter was prepared by Carlos Arteta and Sergiy Kasyanenko. 1 A large and growing literature addresses the trade-off between financial development and financial stability.
Substantial heterogeneity in this trade-off has been found, depending on the level of financial development, country attributes, and characteristics of financial systems (Loayza, Ouazad, and Ranciere 2017). Nonetheless, a broad consensus has emerged that a rapid acceleration of financial deepening may elevate crisis risks. For a detailed discussion of the role financial systems play in development, see World Bank (2012).
2 For example, in the median EMDE, the ratio of foreign exchange reserves to GDP increased by 6 percentage points from about 10 percent during the Asian financial crisis, reflecting a broad-based buildup of reserves across all EMDE regions, but especially in Asia. Policy reforms that boosted the role of the private sector and gradually liberalized financial markets, interest rates, and exchange rates may also have helped EMDEs to absorb external shocks, with fewer disruptions compared to previous crises (Wise, Armijo, and Katada 2015).
CHAPTER 4 Financial Market Developments

166 CHAPTE R 4 A DECAD E AFT ER THE GLOB A L RECES S ION
As a result, EMDE financial systems were less affected by the global shocks of 2008-09 than in previous episodes of financial distress. Following a brief period of slowing financial system growth, several EMDEs went through credit booms after the global recession, spurred by supportive macroeconomic policies, large capital inflows, and accommodative global financial conditions.
Unfortunately, credit booms in recent years have left a legacy of elevated debt among many EMDEs, which may have raised their risk of financial instability. Private sector credit in percent of GDP more than doubled in one-tenth of EMDEs in the decade to end-2018, whereas in over a quarter it increased by more than half. In the past, such private credit booms were often associated with costly macroeconomic and financial adjustments (Ohnsorge and Yu 2016). Meanwhile, a buildup of government debt—in nearly 30 percent of EMDEs, government debt in percent of GDP doubled over the past decade—makes some EMDEs more vulnerable to sovereign debt crises. Elevated levels of government debt may also constrain the scope and effectiveness of countercyclical fiscal policies (World Bank 2019a). As a result of rising debt burdens, EMDE financial systems look more fragile than at the onset of the global recession, and this fragility may amplify an economic downturn.
Systemic risks among EMDEs are also exacerbated by their increased inter-connectedness. These economies have increased their reliance on capital inflows, including from other EMDEs, and in many cases foreign portfolio investors play a much larger role in domestic bond markets. As a result, these EMDEs are now more susceptible to shocks to international capital markets, shifts in global investor sentiment, or contagion from other EMDEs.
Against this backdrop, this chapter considers the following questions:
How were EMDE financial markets affected by the global recession?
How have financial markets in EMDEs evolved since the global recession?
What implications do these changes have for financial stability and policies in EMDEs?
Contributions. The chapter expands the existing literature on the topic in several directions. In particular, it documents the extent to which the global financial crisis and subsequent global recession affected financial systems in EMDEs across a much larger sample of economies and broader dimensions compared to what has been done in similar exercises. Previous studies have focused on financial systems in advanced economies and associated global financial regulation, or have focused on developments in EMDE banking systems, with limited integration of the discussion into the broader context of changes in international capital markets after the global recession. For example, World Bank (2016, 2019a) show how private credit booms and increasing government debt can amplify financial stability risks. World Bank (2018a) argues that international banking may lead to increased exposure to volatile capital inflows and sudden stops in cross-border lending as well as facilitate the propagation of shock within regions. IMF (2019a) and FSB (2018a) point to increasing complexity of EMDE financial systems and new shock amplification mechanisms and propagation channels

CHAPTE R 4 167 A DECAD E AFT ER THE GLOB A L RECES S ION
that this complexity may create. Other research on these topics typically focuses on a narrow set of questions, such as the impact of financial integration on spillovers from global financial shocks (Bräuning and Ivashina 2019), and usually covers small samples of EMDEs. This study brings these different strands together into an overall assessment of EMDE financial systems over the past decade.
Main findings and lessons. This chapter documents the following findings. First, during the global recession, private sector deleveraging in EMDEs was milder than in previous episodes of financial distress. In 2009-10, nonfinancial private sector debt in EMDEs was little changed as a percent of GDP, compared to large decreases after past crises. The most severe credit crunches occurred in economies where precrisis credit booms were funded by large capital flows and where banks had a narrow deposit base, such as some economies in Europe and Central Asia (ECA) region (Feyen et al. 2014).
Second, credit growth and capital flows resumed in many EMDEs following a brief pause after the global recession, as benign international financial conditions encouraged EMDE corporate sector and governments to access international capital markets (Feyen et al. 2015). Many EMDEs witnessed credit booms during 2011-16. Although these booms have largely subsided, they have left a legacy of high private sector debt that makes corporations more vulnerable to financing shocks (World Bank 2019b). Over the decade to end-2018, private sector debt nearly doubled, reaching 118 percent of GDP on average, which contributed to total debt in EMDEs surging to 169 percent of GDP on average from 98 percent of GDP at end-2007.
In several EMDEs, greater borrowing in international capital markets has also increased debt denominated in foreign currency. On average, foreign currency-denominated corporate debt rose from 21 percent of GDP in 2007 to 28 percent of GDP in 2018, increasing the risk that the EMDE corporate sector and banks will be unable to meet these obligations in the event of large currency depreciation. The risks associated with elevated debt, and especially foreign currency-denominated debt, have been apparent in several large EMDEs.
Third, tighter regulations and a retrenchment by crisis-hit global banks have significantly curtailed foreign bank credit in several EMDE regions—most notably ECA and, to a lesser degree, Latin America and the Caribbean (LAC) and Sub-Saharan Africa (SSA)—where lending by international banks was an important source of finance for the government and the private sector (IMF 2016, 2017; World Bank 2018b). The retrenchment of global banks has opened space for the rapid expansion of EMDE-headquartered banks in some regions, such as SSA.3
3 More than 80 percent of high-income countries have already adopted Basel III regulations (World Bank 2019c). Stricter regulatory frameworks, introduced through the Basel III, have generally strengthened the global banking system (Adrian, Kiff, and Shin 2018). These postcrisis reforms of bank regulation and supervision may have also contributed to the decline in riskier cross-border activities of international banks, which may have a lasting negative impact on cross-border lending to EMDEs (CGD 2019). Spillovers from these regulatory reforms in advanced economies have yet to be felt across EMDEs but can be mitigated if new rules are consistently applied across jurisdictions and countries cooperate better when they design and implement financial system regulations (Briault et al. 2018).

168 CHAPTE R 4 A DECAD E AFT ER THE GLOB A L RECES S ION
Finally, financial intermediation in EMDEs with systemically important financial sectors is now larger and more complex, opaque, and interconnected than at the onset of the crisis, which raises new regulatory challenges.4 For example, in several large economies, especially China, the nonbank financial sector—which is often less regulated than banks—is playing an increasing role in supplying credit to corporate borrowers (Ehlers, Kong, and Zhu 2018). A postcrisis buildup of liquidity and maturity mismatches in nonbank financial institutions, and their strong links to banks, may substantially magnify the impact of financial shocks on credit intermediation in EMDEs (IMF 2019a).
The rest of this chapter proceeds as follows. The next two sections briefly discuss developments of EMDE financial systems and the growth of private credit before and during the 2009 global recession. A surge in capital inflows to EMDEs after the global recession and its contribution to credit booms and growing indebtedness are covered in the subsequent section. The chapter then highlights several new features of the financial systems in EMDEs, including diminishing role of international banks, growing EMDE-to-EMDE cross-border lending, and increasing reliance of EMDE borrowers on international capital markets. The last section presents concluding remarks and policy implications.
Before the global recession: Expansion and strengthening
Expansion of EMDE financial systems. EMDE financial systems expanded rapidly during 2002-07 in response to strong economic growth and a trend toward financial deepening. In particular, the ratio of banks’ assets to GDP in the median EMDE increased from 26 percent at end-2002 to 31 percent of GDP at end-2007 (figure 4.1). Despite this increase, banks maintained healthy balance sheets, partly as a result of improvements in financial regulation. At the onset of the global recession, the ratio of Tier 1 capital to risk-weighted assets stood at about 14 percent in the median EMDE, and residential housing loans represented only a 10th of all bank lending.
The rapid expansion of bank balance sheets was primarily financed with local deposits—in all EMDE regions except ECA, bank credit continued to be predominantly deposit-financed. The average EMDE loan-to-deposit ratio was 80 percent at end-2007 despite an uptick before the global recession (figure 4.1), reflecting little exposure of EMDE banks to less stable wholesale funding.
In many large EMDEs, the growing role of nonbank financial institutions such as pension funds and insurance companies also helped to broaden the domestic base for financial intermediation. Total assets of financial institutions (other than central banks) in large EMDEs, excluding China, rose by almost 10 percentage points of GDP, to 62.5 percent of GDP at end-2007 (figure 4.1). The role of financial institutions other than
4 The International Monetary Fund designates Brazil, China, India, Mexico, the Russian Federation, and Turkey as EMDEs having systemically important financial sectors (IMF 2018a).

CHAPTE R 4 169 A DECAD E AFT ER THE GLOB A L RECES S ION
FIGURE 4.1 EMDE financial markets before the global recession
EMDE banks expanded rapidly during 2002-07, primarily relying on local deposits. This expansion was also accompanied by strengthening prudential regulations and oversight, and by increasing competition.
B. Loan-to-deposit ratios A. Banks’ assets
D. Macroprudential supervision: 2002 vs. 2007 C. Financial system assets
Sources: Bank for International Settlements; Cerutti, Claessens, and Laeven (2017); Čihák et al. (2012); Haver Analytics; International Monetary Fund; World Bank. Note: Offshore financial centers are excluded. EAP = East Asia and Pacific; ECA = Europe and Central Asia; EMDEs = emerging market and developing economies; LAC = Latin America and the Caribbean; MNA = Middle East and North Africa; SAR = South Asia; SSA = Sub-Saharan Africa. A.B.E. Data are from the Financial Structure Dataset (Čihák et al. 2012). A. Median. Based on data for 141 EMDEs in 2002 and 144 in 2007. B. Banks’ loans to the private sector as a ratio of the sum of their demand, time, and savings deposits. C. Excluding assets of central banks; based on data for 10 EMDEs—Argentina, Brazil, Chile, China, India, Indonesia, Mexico, the Russian Federation, South Africa, and Turkey—which jointly account for about 71 percent of total EMDE output in 2018. Ratios shown are total financial assets across the 10 EMDEs divided by their total GDP. D. Sample comprises 123 EMDEs; each bar shows unweighted averages of the Macroprudential Policy Index of Cerutti, Claessens, and Laeven (2017). E. Assets of three largest commercial banks as a share of total commercial banking assets. Data are available for 8 economies in EAP, 20 in ECA, 25 in LAC, 14 in MNA, 5 in SAR, and 28 in SSA. F. Sample comprises 140 EMDEs, ratios shown are the total stock of cross-border bank claims on the region divided by regional GDP aggregates.
F. Cross-border bank lending to EMDEs E. Concentration in banking sectors
0
20
40
60
80
100
120
EM
DE
s
EA
P
EC
A
LAC
MN
A
SA
R
SS
A
2007 2002Percent of GDP
0
20
40
60
80
100
120
140
EMDEs EMDEs ex. China
2002 2007Percent of GDP
0
1
2
3E
MD
Es
EA
P
EC
A
LAC
MN
A
SA
R
SS
A
2007 2002Percent of GDP
40
50
60
70
80
90
EM
DE
s
EA
P
EC
A
LAC
MN
A
SA
R
SS
A
2007 2002Percent of GDP
0
6
12
18
24
EM
DE
s
EA
P
EC
A
LAC
MN
A
SA
R
SS
A2007 2002
Percent of GDP
0
20
40
60
EM
DE
s
EA
P
EC
A
LAC
MN
A
SA
R
SS
A
2007 2002Percent of GDP

170 CHAPTE R 4 A DECAD E AFT ER THE GLOB A L RECES S ION
banks, pension funds, and insurance companies—for example, money market funds, investment funds, hedge funds, structured finance vehicles, and trust companies—remained relatively small (only 17 percent of GDP at end-2007 in the median EMDE, roughly half the ratio in advanced economies).5 The more limited exposure of EMDEs to these relatively lightly regulated entities also insulated them from financial stress ahead of the crisis (FSB 2017a).
Strengthening frameworks. The expansion of EMDE financial systems before the global recession was also accompanied by strengthening prudential regulations and oversight, especially in ECA and LAC (figure 4.1; Cerutti, Claessens, and Laeven 2017), and by increasing competition (for example, in ECA and SSA). Banking systems became more diversified, with a smaller market share of the largest banks in over 60 percent of EMDEs (figure 4.1), partly due to increased competition after the entry of foreign banks in many EMDEs (Claessens and van Horen 2015).6
In general, financial systems in EMDEs had limited exposure to sophisticated derivative financial products linked to housing markets in advanced economies. As a result, those systems were largely spared a severe disruption to credit intermediation during the global financial crisis. More fundamentally, the resilience of EMDE financial systems can be attributed to well-capitalized banks, mostly funded with local deposits, and primarily focused on supplying credit to their domestic corporate sectors.
During the global recession: General resilience, with exceptions
Resilience of private credit. The global financial crisis, which triggered severe economic downturns and private sector deleveraging in advanced economies, had only a modest and brief impact on EMDE financial systems. Limited exposure to financial products and markets where the crisis originated, the general reliance of EMDE banks on domestic funding, and, in some regions, moderate levels of overall integration with global financial markets protected most EMDEs from the financial shocks emanating from advanced economies. This resilience contrasts sharply with previous episodes of global financial distress (such as the 1998 Asian financial crisis) when reversals of private capital flows caused sizable disruptions to credit intermediation across several large EMDEs.
The generally solid balance sheets of EMDE banks—and, in some EMDEs, macroeconomic policy stimulus—supported private sector credit during the 2009 global
5 These nonbank financial institutions are often referred to as the “shadow banking system” and are often used by regulated financial institutions to engage in unregulated activities. Among advanced economies, these institutions were found to have taken on excessive leverage, as well as maturity and liquidity mismatches.
6 The degree of competition in the banking sector is just one of the attributes of the financial architecture that may influence financial stability and development (see World Bank 2012 for a detailed discussion). Cross-country studies show that more competitive banking systems have a lower incidence of systemic banking crises (Beck, Demirgüç-Kunt, and Levine 2006) because banks tend to have higher capital ratios in more competitive markets (Schaeck and Čihák 2012).

CHAPTE R 4 171 A DECAD E AFT ER THE GLOB A L RECES S ION
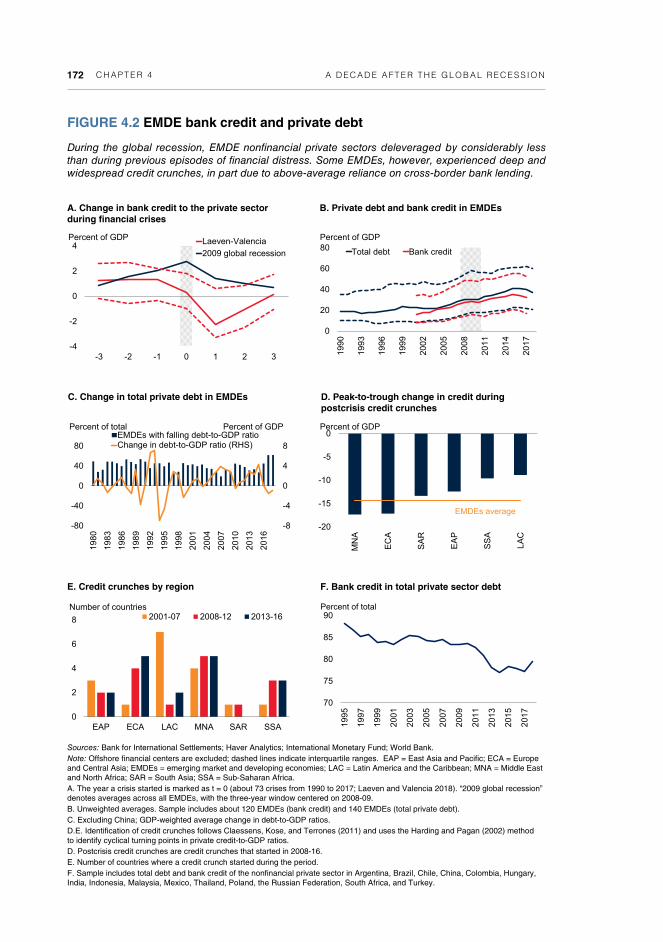
recession.7 Average EMDE private credit growth as percent of GDP declined only moderately, and it was considerably more stable than in EMDEs that experienced episodes of financial distress in the past (figure 4.2). In the three-year window centered around the 2009 global recession, average private credit to GDP in EMDEs (excluding China) declined by only about 0.7 percentage point.8 This moderate drop contrasts markedly with other episodes of financial crises over the past three decades, when the average decline from the year before these events and the year after was 3.5 percentage points. Consistent with the mild decline in private sector credit to GDP, EMDE nonfinancial private sectors deleveraged by considerably less than during previous episodes of financial crises.
Overall, average EMDE nonfinancial private sector debt as percent of GDP was little changed in 2009-10 after having risen by 1.3 percent of GDP per year, on average, during 2002-07 (figure 4.2). This constancy contrasts with previous financial crises in EMDEs. For example, the deleveraging across EMDEs during the global recession was less severe than during the Asian financial crisis, when average EMDE private debt con-tracted by over 2 percentage points of GDP the year after the crisis started (figure 4.2).
Credit crunches in some EMDEs during and after the global recession. Despite the general resilience of private sector credit, the global financial crisis and subsequent euro area crisis of 2010-12 did trigger credit crunches in over one-fifth of EMDEs, especially those with fragile financial systems and heavy reliance before the crisis on cross-border lending that financed earlier credit booms.9 These EMDEs faced a decline in external funding, experienced a sharp increase in nonperforming loans amid currency depre-ciations and slower economic growth, and were forced to deleverage, markedly curtailing credit supply. On average during these credit crunches, private sector credit declined by about 13 percentage points of GDP (peak to trough; figure 4.2).
Credit crunches were most pronounced in ECA and, to a lesser extent, the Middle East and North Africa (MNA)—regions that, to varying degrees, relied on cross-border lending, had a relatively narrow domestic deposit base, or had weak and highly leveraged banking systems (figure 4.2).10 Credit crunches were particularly severe and widespread across countries in ECA, as stressed euro area banks curtailed their cross-border lending. In MNA, the 2008-09 oil price collapse led to a sharp drop in asset prices and tighter external funding conditions for the corporate sector in several economies, putting an end
7 Direct interventions in individual institutions (for example, through capital injections or nationalization of banks), were much less common in EMDEs than in advanced economies (Igan et al. 2019).
8 These financial crisis episodes include currency crises, systemic banking crises, and sovereign debt crises and restructuring, as identified by Laeven and Valencia (2018).
9 A credit crunch is defined as a peak-to-trough phase of a credit cycle that lasts at least five years, featuring a decline in the credit-to-GDP ratio of at least 7 percentage points of GDP (the median decline in the credit-to-GDP ratio in the full sample of EMDEs). The peak of the credit cycle is defined as the year immediately before the private sector credit-to-GDP ratio begins to decline. The trough is defined as the year before this ratio begins to rise. During 1990-2018, 82 credit crunches were identified in 60 EMDEs (where population exceeds 2.5 million) with 24 credit crunches still ongoing. Thirty-three of these credit crunches started in 2008-16.
10 Feyen et al. (2014) show that high loan-to-deposit ratios and a strong reliance on foreign funding make bank credit growth to the private sector in EMDEs particularly sensitive to shocks in cross-border lending.
172 CHAPTE R 4 A DECAD E AFT ER THE GLOB A L RECES S ION
FIGURE 4.2 EMDE bank credit and private debt
During the global recession, EMDE nonfinancial private sectors deleveraged by considerably less than during previous episodes of financial distress. Some EMDEs, however, experienced deep and widespread credit crunches, in part due to above-average reliance on cross-border bank lending.
B. Private debt and bank credit in EMDEs A. Change in bank credit to the private sector during financial crises
D. Peak-to-trough change in credit during postcrisis credit crunches
C. Change in total private debt in EMDEs
Sources: Bank for International Settlements; Haver Analytics; International Monetary Fund; World Bank. Note: Offshore financial centers are excluded; dashed lines indicate interquartile ranges. EAP = East Asia and Pacific; ECA = Europe and Central Asia; EMDEs = emerging market and developing economies; LAC = Latin America and the Caribbean; MNA = Middle East and North Africa; SAR = South Asia; SSA = Sub-Saharan Africa. A. The year a crisis started is marked as t = 0 (about 73 crises from 1990 to 2017; Laeven and Valencia 2018). “2009 global recession” denotes averages across all EMDEs, with the three-year window centered on 2008-09. B. Unweighted averages. Sample includes about 120 EMDEs (bank credit) and 140 EMDEs (total private debt). C. Excluding China; GDP-weighted average change in debt-to-GDP ratios. D.E. Identification of credit crunches follows Claessens, Kose, and Terrones (2011) and uses the Harding and Pagan (2002) method to identify cyclical turning points in private credit-to-GDP ratios. D. Postcrisis credit crunches are credit crunches that started in 2008-16. E. Number of countries where a credit crunch started during the period. F. Sample includes total debt and bank credit of the nonfinancial private sector in Argentina, Brazil, Chile, China, Colombia, Hungary, India, Indonesia, Malaysia, Mexico, Thailand, Poland, the Russian Federation, South Africa, and Turkey.
F. Bank credit in total private sector debt E. Credit crunches by region
0
20
40
60
80
1990
1993
1996
1999
2002
2005
2008
2011
2014
2017
Total debt Bank credit
Percent of GDP
-8
-4
0
4
8
-80
-40
0
40
80
1980
1983
1986
1989
1992
1995
1998
2001
2004
2007
2010
2013
2016
EMDEs with falling debt-to-GDP ratioChange in debt-to-GDP ratio (RHS)
Percent of total Percent of GDP
-20
-15
-10
-5
0
MN
A
EC
A
SA
R
EA
P
SS
A
LAC
Percent of GDP
EMDEs average
0
2
4
6
8
EAP ECA LAC MNA SAR SSA
2001-07 2008-12 2013-16Number of countries
70
75
80
85
90
1995
1997
1999
2001
2003
2005
2007
2009
2011
2013
2015
2017
Percent of total
-4
-2
0
2
4
-3 -2 -1 0 1 2 3
Laeven-Valencia
2009 global recession
Percent of GDP
CHAPTE R 4 173 A DECAD E AFT ER THE GLOB A L RECES S ION
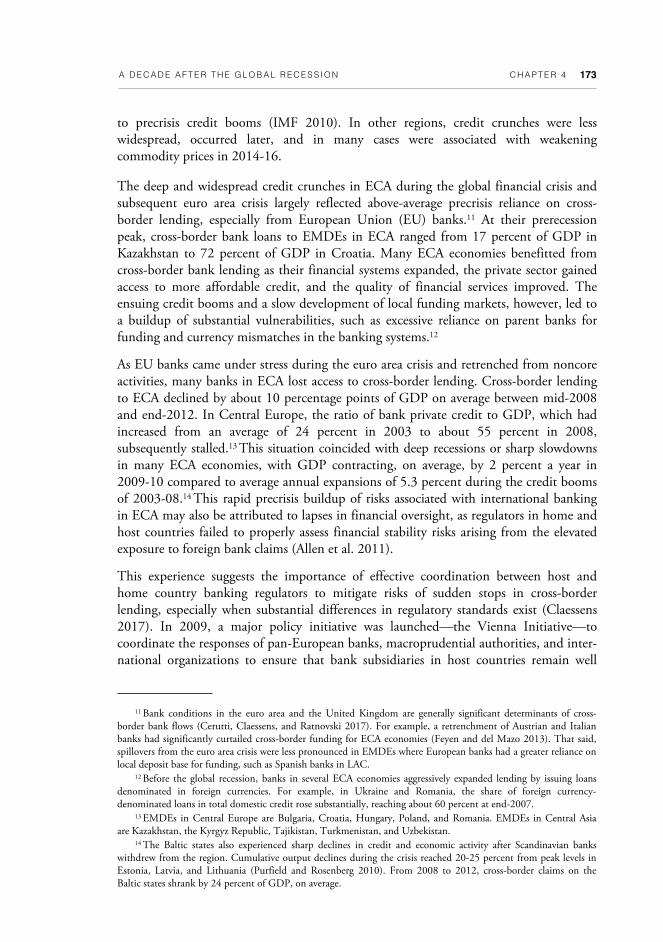
to precrisis credit booms (IMF 2010). In other regions, credit crunches were less widespread, occurred later, and in many cases were associated with weakening commodity prices in 2014-16.
The deep and widespread credit crunches in ECA during the global financial crisis and subsequent euro area crisis largely reflected above-average precrisis reliance on cross-border lending, especially from European Union (EU) banks.11 At their prerecession peak, cross-border bank loans to EMDEs in ECA ranged from 17 percent of GDP in Kazakhstan to 72 percent of GDP in Croatia. Many ECA economies benefitted from cross-border bank lending as their financial systems expanded, the private sector gained access to more affordable credit, and the quality of financial services improved. The ensuing credit booms and a slow development of local funding markets, however, led to a buildup of substantial vulnerabilities, such as excessive reliance on parent banks for funding and currency mismatches in the banking systems.12
As EU banks came under stress during the euro area crisis and retrenched from noncore activities, many banks in ECA lost access to cross-border lending. Cross-border lending to ECA declined by about 10 percentage points of GDP on average between mid-2008 and end-2012. In Central Europe, the ratio of bank private credit to GDP, which had increased from an average of 24 percent in 2003 to about 55 percent in 2008, subsequently stalled.13 This situation coincided with deep recessions or sharp slowdowns in many ECA economies, with GDP contracting, on average, by 2 percent a year in 2009-10 compared to average annual expansions of 5.3 percent during the credit booms of 2003-08.14 This rapid precrisis buildup of risks associated with international banking in ECA may also be attributed to lapses in financial oversight, as regulators in home and host countries failed to properly assess financial stability risks arising from the elevated exposure to foreign bank claims (Allen et al. 2011).
This experience suggests the importance of effective coordination between host and home country banking regulators to mitigate risks of sudden stops in cross-border lending, especially when substantial differences in regulatory standards exist (Claessens 2017). In 2009, a major policy initiative was launched—the Vienna Initiative—to coordinate the responses of pan-European banks, macroprudential authorities, and inter-national organizations to ensure that bank subsidiaries in host countries remain well
11 Bank conditions in the euro area and the United Kingdom are generally significant determinants of cross-border bank flows (Cerutti, Claessens, and Ratnovski 2017). For example, a retrenchment of Austrian and Italian banks had significantly curtailed cross-border funding for ECA economies (Feyen and del Mazo 2013). That said, spillovers from the euro area crisis were less pronounced in EMDEs where European banks had a greater reliance on local deposit base for funding, such as Spanish banks in LAC.
12 Before the global recession, banks in several ECA economies aggressively expanded lending by issuing loans denominated in foreign currencies. For example, in Ukraine and Romania, the share of foreign currency-denominated loans in total domestic credit rose substantially, reaching about 60 percent at end-2007.
13 EMDEs in Central Europe are Bulgaria, Croatia, Hungary, Poland, and Romania. EMDEs in Central Asia are Kazakhstan, the Kyrgyz Republic, Tajikistan, Turkmenistan, and Uzbekistan.
14 The Baltic states also experienced sharp declines in credit and economic activity after Scandinavian banks withdrew from the region. Cumulative output declines during the crisis reached 20-25 percent from peak levels in Estonia, Latvia, and Lithuania (Purfield and Rosenberg 2010). From 2008 to 2012, cross-border claims on the Baltic states shrank by 24 percent of GDP, on average.
174 CHAPTE R 4 A DECAD E AFT ER THE GLOB A L RECES S ION
capitalized and cross-border exposures are maintained in five ECA economies (Bosnia and Herzegovina, Hungary, Latvia, Romania, Serbia). Multinational banks that participated in this initiative were more stable lenders in the aftermath of the global recession than domestic and foreign banks that did not sign country-specific commit-ments to maintain exposures to their subsidiaries in the ECA region (de Haas et al. 2012).
Limited impact on low-income countries (LICs). Compared to the financial systems in other EMDEs, those in many LICs were more bank dominated, less complex, and less integrated into global financial markets at the onset of the global recession. Also, LIC banking systems were smaller: at end-2007, bank credit to the private sector stood at only about 12 percent of GDP in a median LIC compared to about a third of GDP in a median non-LIC EMDE. As a result, domestic financial systems in many LICs were not strongly affected by the global financial crisis (IMF 2009). In commodity-producing LICs, however, credit growth slowed as investments in mining and commodity-related infrastructure were postponed in response to falling commodity prices (for example, Chad, Guinea, Liberia, Sierra Leone, Uganda). Of note, in many LICs, banks shifted from making riskier loans to nonfinancial corporations to holding government securities, which increased sovereign-bank linkages and, therefore, the exposure of LIC banks to domestic fiscal policy shocks (IMF 2019c; see also chapter 6).
Notwithstanding the resilience of domestic financial systems in many LICs, financial stress in global credit markets did reduce LICs’ access to global capital markets. Several LICs with solid macroeconomic fundamentals, which had gained access to international debt markets prior to the crisis, had to postpone or cancel the issuance of new bonds (Tanzania, Uganda). LICs with a substantial presence of foreign lenders (Mozambique, Togo) experienced a withdrawal of cross-border lending owing to the retrenchment of international commercial banks.
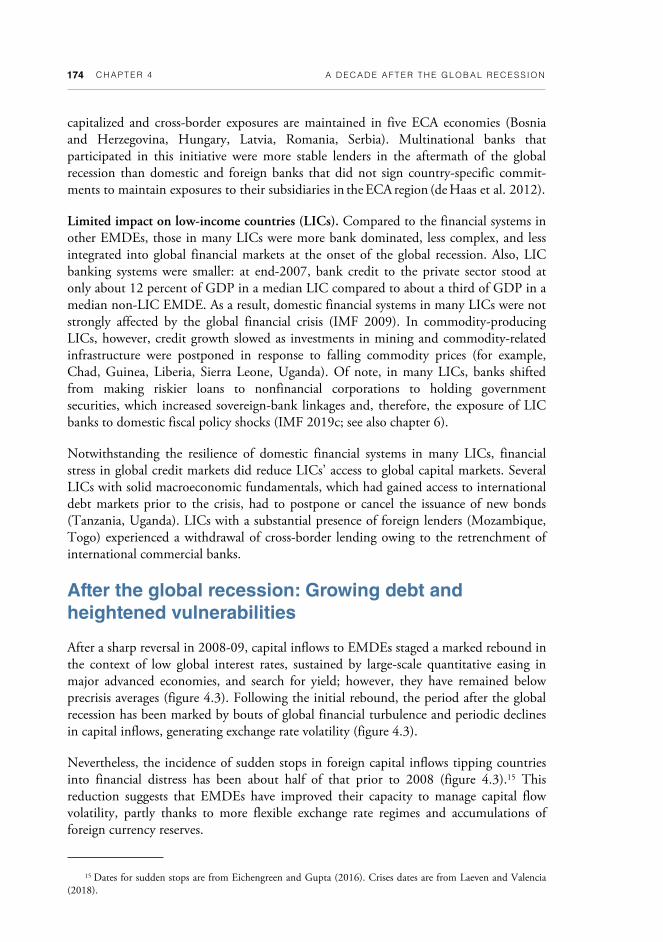
After the global recession: Growing debt and heightened vulnerabilities
After a sharp reversal in 2008-09, capital inflows to EMDEs staged a marked rebound in the context of low global interest rates, sustained by large-scale quantitative easing in major advanced economies, and search for yield; however, they have remained below precrisis averages (figure 4.3). Following the initial rebound, the period after the global recession has been marked by bouts of global financial turbulence and periodic declines in capital inflows, generating exchange rate volatility (figure 4.3).
Nevertheless, the incidence of sudden stops in foreign capital inflows tipping countries into financial distress has been about half of that prior to 2008 (figure 4.3).15 This reduction suggests that EMDEs have improved their capacity to manage capital flow volatility, partly thanks to more flexible exchange rate regimes and accumulations of foreign currency reserves.
15 Dates for sudden stops are from Eichengreen and Gupta (2016). Crises dates are from Laeven and Valencia (2018).

CHAPTE R 4 175 A DECAD E AFT ER THE GLOB A L RECES S ION
FIGURE 4.3 Capital inflows to EMDEs after the global recession
Spurred by accommodative monetary policy and a search for yield, capital flows to EMDEs rebounded after the global recession but remained below precrisis averages. Meanwhile, a sharp drop in cross-border bank lending during and following the global recession has been accompanied by growth in portfolio flows.
B. Gross portfolio inflows and exchange rate volatility
A. Gross capital inflows
D. Composition of gross capital inflows C. Share of EMDEs in a financial crisis following a sudden stop in capital flows
Sources: Bank for International Settlements; Bloomberg; International Monetary Fund; World Bank. Note: EAP = East Asia and Pacific; ECA = Europe and Central Asia; EMDEs = emerging market and developing economies; FDI = foreign direct investment; FX = foreign exchange; LAC = Latin America and the Caribbean; MNA = Middle East and North Africa; SAR = South Asia; SSA = Sub-Saharan Africa. A. Total gross inflows of foreign direct investments, portfolio investments, and other investments for about 120 EMDEs. B. Based on data for about 90 EMDEs. FX volatility is the J.P. Morgan VXY Global index for 23 U.S. dollar currency pairs. C. Share of economies in a financial crisis within two years of a sudden stop. Dates for sudden stops are from Eichengreen and Gupta (2016); dates for financial crises are from Laeven and Valencia (2018). D. Aggregate flows; based on a balanced panel for 76 EMDEs. E. Unweighted averages; end-of-period stocks of external liabilities for EMDEs with data available in 2008. F. t = 0 indicates the year when a crisis started. Global recession years are 1982 and 1991. “Financial crises” denotes averages for EMDEs that went through a systemic banking crisis before the 2009 global recession (99 crises from 1980 to 2003). “After global recession” denotes averages for EMDEs that went through a systemic banking crisis after the global financial crisis (seven crises in 2008-14).
F. Change in cross-border bank lending to EMDEs during episodes of financial distress
E. Share of portfolio liabilities in total external liabilities
0
6
12
18
24
30
-0.5
0.5
1.5
2.5
2000
2001
2002
2003
2004
2005
2006
2007
2008
2009
2010
2011
2012
2013
2014
2015
2016
2017
2018
Equity Debt FX volatility (RHS)
Percent of GDP Percentage points
0
20
40
60
Before global recession After global recession
Percent
-200
20406080
100
02-0
7
10-1
7
02-0
7
10-1
7
02-0
7
10-1
7
02-0
7
10-1
7
02-0
7
10-1
7
02-0
7
10-1
7
02-0
7
10-1
7
EMDEs EAP ECA LAC MNA SAR SSA
Portfolio FDI OtherPercent of total
0
10
20
30
EM
DE
s
EA
P
EC
A
LAC
MN
A
SA
R
SS
A
2017 2008Percent of total
-4
-2
0
2
-3 -2 -1 0 1 2 3
Financial crises
Global recessions
After global recession
Percent of GDP
012345678
2008
2009
2010
2011
2012
2013
2014
2015
2016
2017
2018
Percent of GDP
2002-07 average

176 CHAPTE R 4 A DECAD E AFT ER THE GLOB A L RECES S ION
Changing composition of capital flows. A rebound of capital flows after the global recession was accompanied by a shift in their composition. A sharp drop in cross-border lending during and following the global recession has been followed by growth in portfolio flows (figure 4.3). During 2010-17, cumulative portfolio flows accounted for over 24 percent of all capital flows to EMDEs, up from 17 percent in 2002-07 on average. As a result, at end-2017, portfolio liabilities accounted for over 13 percent of EMDE external liabilities, on average, compared to 8 percent at end-2008 (figure 4.3). The share of portfolio liabilities in external liabilities increased in all EMDE regions except East Asia and Pacific (EAP).16 In contrast, the share of other liabilities, which include direct cross-border lending, declined in all regions, with the biggest decreases in LAC, MNA, and SSA; however, it remained generally stable in South Asia (SAR).
The inclusion of some EMDEs in major benchmark bond indexes has contributed to increasing portfolio inflows, particularly to smaller markets for which membership in an index may have attracted foreign investors. By linking economies with different fundamentals into the same portfolio, this inclusion may have also heightened the exposure of EMDEs in benchmark indexes to shocks and fluctuations in international capital markets (Arslanalp and Tsuda 2015; IMF 2019a; Miyajima and Shim 2014).17
Volatility of capital inflows back at its precrisis level. The volatility of capital inflows to EMDEs spiked in 2009-10. After the global recession, it returned to its 2002-07 level, with bouts of volatility flaring up during periods of heightened risk aversion such as the 2013 taper tantrum (figure 4.4). This variation reflects the impact of global financial shocks such as a tightening of international liquidity, which are often accompanied by increases in capital inflow volatility (Pagliari and Hannan 2017).
Country-specific factors, including the level of foreign reserves and domestic financial sector development, may reduce the volatility of certain capital inflows (Aghion, Bacchetta, and Banerjee 2004; Broto, Díaz-Cassou, and Erce 2011). After the global recession, however, the sensitivity of capital inflows—in particular, portfolio inflows—to global shocks has increased (Ahmed and Zlate 2014; Fratzscher 2012; IMF 2019b). This increased sensitivity suggests that, if global risk sentiment were to suddenly deteriorate, some EMDEs may encounter increased swings in inflows.
Trends in the volatility of aggregate capital inflows to EMDEs mask cross-country heterogeneity. In about a third of EMDEs, the average volatility of inflows that were not foreign direct investment (FDI) during 2011-18 was at least 10 percent higher than the average volatility in 2002-07.18 Cross-country differences in capital inflow volatility have largely reflected the different roles of push and pull factors and their interaction, as well
16 Foreign direct investment continues to be the principal source of external funding for EAP economies, representing over 55 percent of all external liabilities in that region.
17 For example, Cerutti, Claessens, and Puy (2019) show that a higher reliance on global mutual funds increases the exposure of EMDEs to shifts in global financing conditions transmitted through capital flows.
18 Capital inflows volatility refers to country-by-country GARCH (generalized autoregressive conditional heteroskedasticity) estimates of the conditional variance of gross non-FDI inflows adjusted by the level of GDP. Non-FDI inflows are portfolio inflows and other investments. Other investments include cross-border bank lending.

CHAPTE R 4 177 A DECAD E AFT ER THE GLOB A L RECES S ION
FIGURE 4.4 EMDE capital inflow volatility after the global recession
The volatility of aggregate EMDE capital inflows has returned to its precrisis level, notwithstanding some risk-off episodes. Relative to FDI, portfolio inflows continue to exhibit greater swings, as do other inflows such as cross-border bank lending.
B. Average volatility of capital inflows A. Volatility of non-FDI capital inflows
Sources: Bloomberg; International Monetary Fund; World Bank. Note: Capital flows volatility refers to GARCH (generalized autoregressive conditional heteroskedasticity) estimates of the conditional variance of non-FDI inflows adjusted by the level of GDP. Estimates are based on aggregate inflows to 29 EMDEs with quarterly data from 1996Q1 to 2018Q4; China is not included. Non-FDI inflows are portfolio inflows and other investments; other investments include cross-border bank lending. EMDEs = emerging market and developing economies; FDI = foreign direct investment; VIX = Volatility Index. A. Non-FDI inflows include portfolio inflows and other investments. Global risk aversion refers to the volatility measured by the VIX implied volatility index of option prices on the U.S. S&P 500.
0
0.1
0.2
0.3
0.4
Portfolio FDI Other Portfolio FDI Other
Gross Net
2002-07 2008-10 2011-18Percent of GDP
5
20
35
50
65
0
1
2
1996 1999 2002 2005 2008 2011 2014 2017
Volatility of gross inflowsGlobal risk aversion (RHS)
Percent of GDP VIX index
as country-specific composition of inflows and the types of borrowers and lenders (Avdjiev et al. 2017; Cerutti, Claessens, and Puy 2019; Hannan 2018; Koepke 2019). Furthermore, in several EMDEs, vulnerability to the volatility of capital inflows grew after the global recession because of higher reliance on market-based finance and increased issuance of foreign currency-denominated bonds.
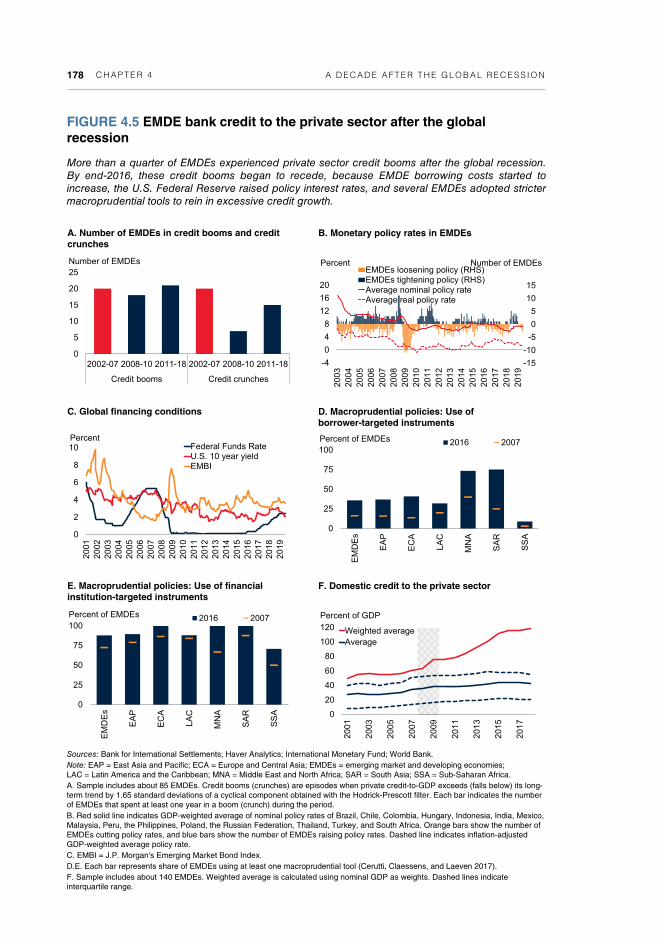
Reemergence of credit booms in EMDEs. More than one-quarter of EMDEs experienced private sector credit booms in at least one year during 2011-18 (figure 4.5).19 Unlike previous episodes of rapid credit growth in EMDEs, however, many of these credit booms were not accompanied by investment surges, because they primarily boosted consumption (box 4.1). The credit booms were fueled by large capital flows to EMDEs amid historically unprecedented monetary policy accommodation in major advanced economies, including negative interest rate policies (box 4.2), and monetary policy loosening in EMDEs (Arteta et al. 2015, Arteta et al. 2018).
As in advanced economies, many EMDE central banks reduced, and then maintained, their monetary policy rates at historic lows. During 2009-16, most EMDEs (with the exception of Brazil) maintained real policy rates below the 2002-07 average of about 4 percent (figure 4.5). A growth rebound in EMDEs supported investor confidence and increased credit demand from nonfinancial corporations (Ohnsorge and Yu 2016;
19 About half of all credit booms are followed by at least a mild deleveraging within three years (Ohnsorge and Shu 2016).
178 CHAPTE R 4 A DECAD E AFT ER THE GLOB A L RECES S ION
FIGURE 4.5 EMDE bank credit to the private sector after the global recession
More than a quarter of EMDEs experienced private sector credit booms after the global recession. By end-2016, these credit booms began to recede, because EMDE borrowing costs started to increase, the U.S. Federal Reserve raised policy interest rates, and several EMDEs adopted stricter macroprudential tools to rein in excessive credit growth.
B. Monetary policy rates in EMDEs A. Number of EMDEs in credit booms and credit crunches
Sources: Bank for International Settlements; Haver Analytics; International Monetary Fund; World Bank. Note: EAP = East Asia and Pacific; ECA = Europe and Central Asia; EMDEs = emerging market and developing economies; LAC = Latin America and the Caribbean; MNA = Middle East and North Africa; SAR = South Asia; SSA = Sub-Saharan Africa. A. Sample includes about 85 EMDEs. Credit booms (crunches) are episodes when private credit-to-GDP exceeds (falls below) its long-term trend by 1.65 standard deviations of a cyclical component obtained with the Hodrick-Prescott filter. Each bar indicates the number of EMDEs that spent at least one year in a boom (crunch) during the period. B. Red solid line indicates GDP-weighted average of nominal policy rates of Brazil, Chile, Colombia, Hungary, Indonesia, India, Mexico, Malaysia, Peru, the Philippines, Poland, the Russian Federation, Thailand, Turkey, and South Africa. Orange bars show the number of EMDEs cutting policy rates, and blue bars show the number of EMDEs raising policy rates. Dashed line indicates inflation-adjusted GDP-weighted average policy rate. C. EMBI = J.P. Morgan's Emerging Market Bond Index. D.E. Each bar represents share of EMDEs using at least one macroprudential tool (Cerutti, Claessens, and Laeven 2017). F. Sample includes about 140 EMDEs. Weighted average is calculated using nominal GDP as weights. Dashed lines indicate interquartile range.
D. Macroprudential policies: Use of borrower-targeted instruments
C. Global financing conditions
0
5
10
15
20
25
2002-07 2008-10 2011-18 2002-07 2008-10 2011-18
Credit booms Credit crunches
Number of EMDEs
-4
0
4
8
12
16
20
2003
2004
2005
2006
2007
2008
2009
2010
2011
2012
2013
2014
2015
2016
2017
2018
2019
EMDEs loosening policy (RHS)EMDEs tightening policy (RHS)Average nominal policy rateAverage real policy rate
Percent Number of EMDEs
0
2
4
6
8
10
2001
2002
2003
2004
2005
2006
2007
2008
2009
2010
2011
2012
2013
2014
2015
2016
2017
2018
2019
Federal Funds RateU.S. 10 year yieldEMBI
Percent
0
25
50
75
100
EM
DE
s
EA
P
EC
A
LAC
MN
A
SA
R
SS
A
2016 2007Percent of EMDEs
F. Domestic credit to the private sector E. Macroprudential policies: Use of financial institution-targeted instruments
0
25
50
75
100
EM
DE
s
EA
P
EC
A
LA
C
MN
A
SA
R
SS
A
2016 2007Percent of EMDEs
0
20
40
60
80
100
120
2001
2003
2005
2007
2009
2011
2013
2015
2017
Weighted averageAverage
Percent of GDP

CHAPTE R 4 179 A DECAD E AFT ER THE GLOB A L RECES S ION
World Bank 2016). In addition, weak commodity prices during 2011-16 increased corporate borrowing needs in commodity-exporting EMDEs.
The rapid credit growth after the global recession was accompanied by some deterioration in asset quality and an increased reliance on short-term wholesale funding. Nonperforming loan ratios and loan-to-deposit ratios edged up (especially in SSA and SAR), although the latter still remained well below 100 percent, on average.
Toward the end of 2016, however, these credit booms began to recede. EMDE borrowing costs started to increase at the same time that the U.S. Federal Reserve raised policy interest rates in late 2015 (figure 4.5). These increases coincided with the adoption by more EMDEs of stricter macroprudential tools to cool credit booms, EMDE monetary policy tightening and a sharp slowdown of output growth in commodity exporters during 2014-16 (figure 4.5; chapter 5 explores financial sector regulatory reforms in EMDEs after the global recession).
Expectations of additional policy easing by major central banks have accompanied an easing of global financing conditions in 2019, as manifested by a significant decline in global bond yields and growing share of negative-yielding debt. These developments have not, however, resulted in a sustained, broad-based recovery in capital flows to EMDEs, amid heightened risk aversion and flight to safety, in the context of a deteriorated global growth outlook and heightened trade policy uncertainty. In contrast to the broad-based rebound in the aftermath of the global recession, fewer EMDEs have been experiencing increased capital inflows, primarily in the form of portfolio debt inflows (IIF 2019a).
Rising levels of private sector debt in EMDEs. Credit booms have contributed to a rapid buildup of private sector debt in EMDEs, increasingly owed to nonresident creditors and in the form of local currency-denominated debt securities (figure 4.6; Agur et al. 2018). Despite the deceleration in credit growth since 2016, at end-2017 bank credit to households and nonfinancial corporations in the average EMDE amounted to 39 percent of GDP, 9 percentage points higher than at end-2007.
In China alone, credit to nonfinancial corporations and households, as percent of GDP, nearly doubled in the decade to end-2018, to 204 percent. Most of this increased credit was to corporations, rather than households (Bruno and Shin 2014; IMF 2015a; World Bank 2018c). More generally, in the 15 largest EMDEs for which Bank for International Settlements data on credit to nonfinancial corporations and households are available, average bank credit to nonfinancial corporations rose to about 55 percent of GDP by end-2018, nearly 12 percentage points higher than at end-2007. Again, this increase was especially pronounced in China, where corporate debt constituted almost 152 percent of GDP in 2018, 54 percentage points higher than in 2007. Excluding China, from end-2007 to end-2018, credit to nonfinancial corporations in EMDEs rose by about 10 percentage points of GDP, on average, to just under 50 percent of GDP (figure 4.6).
There is, however, substantial variation across countries. Nonfinancial corporations deleveraged in Argentina and Hungary—credit declined by 1.4 percent of GDP and 11

180 CHAPTE R 4 A DECAD E AFT ER THE GLOB A L RECES S ION
FIGURE 4.6 EMDEs: Financing of debt after the global recession
Credit booms have contributed to a rapid buildup of private sector debt, especially in the nonfinancial corporate sector. Issuance of debt denominated in local currency has grown, partly because of the increasing role of nonresident creditors in local bond markets.
B. Total credit to nonfinancial corporations A. Foreign ownership of government debt
D. Claims on private nonfinancial sector C. Local currency debt
Sources: Bank for International Settlements; Institute of International Finance; International Monetary Fund; World Bank. Note: Unweighted averages. Dashed line indicates interquartile range. EMDEs = emerging market and developing economies. A.F. Medians for 21 EMDEs: Argentina, Brazil, Bulgaria, Chile, Colombia, the Arab Republic of Egypt, Hungary, India, Indonesia, Malaysia, Mexico, Peru, the Philippines, Poland, Romania, the Russian Federation, South Africa, Thailand, Turkey, Ukraine, and Uruguay. B. The sample includes Argentina, Brazil, Chile, China, Colombia, Hungary, Indonesia, India, Mexico, Malaysia, Poland, Russia, Thailand, Turkey, and South Africa. C. Local currency-denominated debt as share of total debt of the general government and nongovernment sectors. Nongovernment sector debt includes debt of financial corporations (including banks) and nonfinancial corporations. D.E. Sample includes Argentina, Brazil, Chile, Colombia, Hungary, India, Indonesia, Mexico, Malaysia, Poland, Russia, Thailand, Turkey, and South Africa. Claims by foreign banks (on an ultimate risk basis) are a sum of cross-border lending and credit extended by local subsidiaries of foreign banks. E. Average foreign bank reliance (FBR) measure across the sample of 15 EMDEs with Bank for International Settlements data on total credit; sample excludes Saudi Arabia. Sector-specific FBR measure is calculated as a ratio of cross-border lending and local claims by subsidiaries of foreign banks divided by total credit to the sector (see BIS 2019a for details).
F. Government bonds owned by domestic banks E. Reliance on foreign banks by sector
30
40
50
60
200
6
200
7
200
8
200
9
201
0
201
1
201
2
201
3
201
4
201
5
201
6
201
7
201
8
EMDEs EMDEs ex. ChinaPercent of GDP
82
84
86
88
90
30
40
50
60
70
20
10
20
11
20
12
20
13
20
14
20
15
20
16
20
17
Percent of GDP Percent of total (RHS)Percent of GDP Percent of total
0
10
20
30
40
50
60
70
2005 2010 2018
Nonbank creditBank credit
Percent of GDP
10
15
20
25
30
20
07
20
08
20
09
20
10
20
11
20
12
20
13
20
14
20
15
20
16
20
17
20
18
NonbanksNonbank privateOfficial
Percent of total credit to the sector
5
15
25
35
20
04
20
05
20
06
20
07
20
08
20
09
20
10
20
11
20
12
20
13
20
14
20
15
20
16
20
17
20
18
Percent of total
0
10
20
30
40
20
04
20
05
20
06
20
07
20
08
20
09
20
10
20
11
20
12
20
13
20
14
20
15
20
16
20
17
20
18
Local currency Total
Percent of total

CHAPTE R 4 181 A DECAD E AFT ER THE GLOB A L RECES S ION
BOX 4.1 Credit booms without investment booms
Following the 2009 global recession, private credit rose sharply in several emerging market and developing economies (EMDEs). Unlike in previous such episodes, these credit booms have not, in most cases, been accompanied by investment booms. The absence of investment booms during postcrisis credit booms is associated with lower economic growth once the credit boom unwinds.
Introduction
During the recent wave of credit booms in EMDEs, investment growth in many slowed despite rapidly rising credit to the nonfinancial private sector. By contrast, in episodes before the 2009 global recession, credit booms often financed rapid investment growth, with investment subsequently stalling. Against this background, this box addresses the following questions:
How has investment evolved during credit booms and deleveraging episodes?
How often have credit booms been accompanied by investment booms?
How has output growth evolved during credit booms and deleveraging episodes?
The results indicate that, whereas investment often grew rapidly during previous credit booms, this has not been the case since 2010. In the recent wave of credit surges in EMDEs, growing credit mainly financed a rise in consumption. This is of concern because, as highlighted by recent studies, when credit booms unwind, economic growth tends to contract more if the credit boom was not accompanied by an investment surge.
Data and methodology
Credit to the nonfinancial private sector consists of claims—including loans and debt securities—on households and nonfinancial corporations by the domestic financial system and external creditors (Ohnsorge and Yu 2016). A credit boom is defined as an episode during which the ratio of private sector credit to gross domestic product (GDP) is more than 1.65 standard deviations above its Hodrick-Prescott filtered trend in at least one year (Ohnsorge and Yu 2016; World Bank 2016). The start of such a boom is defined as when the credit-to-GDP ratio rises above its trend by one standard deviation and the end as when the ratio begins to fall. Conversely, a deleveraging episode is defined as a period during which the private sector credit-to-GDP ratio is more than 1.65 standard deviations below trend in at least one year. The deleveraging episode starts when the ratio falls more than one standard deviation below trend and ends when the credit-to-GDP ratio begins to climb.
Note: This box was prepared by Shu Yu.
182 CHAPTE R 4 A DECAD E AFT ER THE GLOB A L RECES S ION
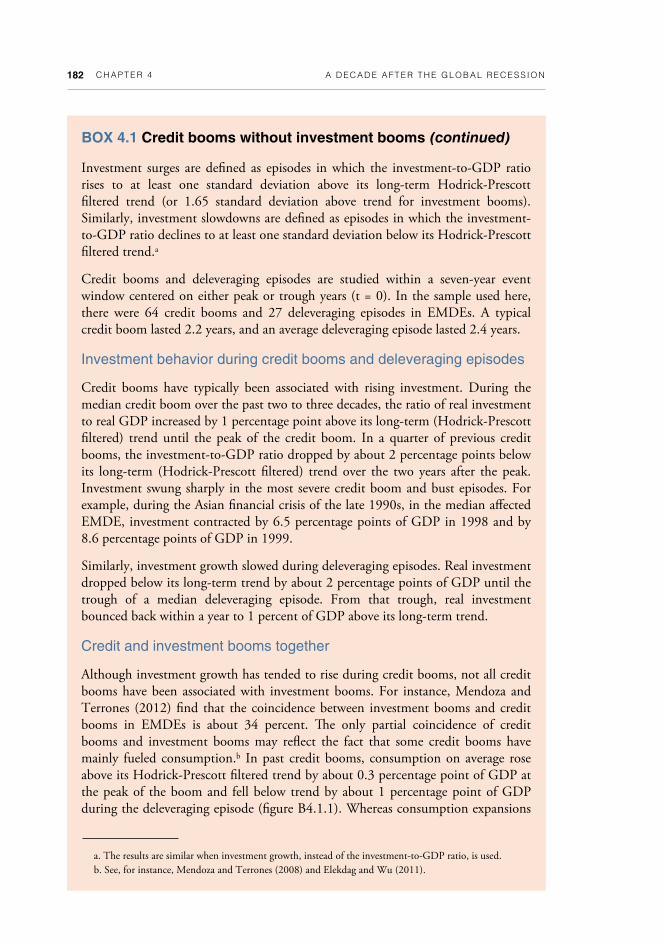
Investment surges are defined as episodes in which the investment-to-GDP ratio rises to at least one standard deviation above its long-term Hodrick-Prescott filtered trend (or 1.65 standard deviation above trend for investment booms). Similarly, investment slowdowns are defined as episodes in which the investment-to-GDP ratio declines to at least one standard deviation below its Hodrick-Prescott filtered trend.a
Credit booms and deleveraging episodes are studied within a seven-year event window centered on either peak or trough years (t = 0). In the sample used here, there were 64 credit booms and 27 deleveraging episodes in EMDEs. A typical credit boom lasted 2.2 years, and an average deleveraging episode lasted 2.4 years.
Investment behavior during credit booms and deleveraging episodes
Credit booms have typically been associated with rising investment. During the median credit boom over the past two to three decades, the ratio of real investment to real GDP increased by 1 percentage point above its long-term (Hodrick-Prescott filtered) trend until the peak of the credit boom. In a quarter of previous credit booms, the investment-to-GDP ratio dropped by about 2 percentage points below its long-term (Hodrick-Prescott filtered) trend over the two years after the peak. Investment swung sharply in the most severe credit boom and bust episodes. For example, during the Asian financial crisis of the late 1990s, in the median affected EMDE, investment contracted by 6.5 percentage points of GDP in 1998 and by 8.6 percentage points of GDP in 1999.
Similarly, investment growth slowed during deleveraging episodes. Real investment dropped below its long-term trend by about 2 percentage points of GDP until the trough of a median deleveraging episode. From that trough, real investment bounced back within a year to 1 percent of GDP above its long-term trend.
Credit and investment booms together
Although investment growth has tended to rise during credit booms, not all credit booms have been associated with investment booms. For instance, Mendoza and Terrones (2012) find that the coincidence between investment booms and credit booms in EMDEs is about 34 percent. The only partial coincidence of credit booms and investment booms may reflect the fact that some credit booms have mainly fueled consumption.b In past credit booms, consumption on average rose above its Hodrick-Prescott filtered trend by about 0.3 percentage point of GDP at the peak of the boom and fell below trend by about 1 percentage point of GDP during the deleveraging episode (figure B4.1.1). Whereas consumption expansions
BOX 4.1 Credit booms without investment booms (continued)
a. The results are similar when investment growth, instead of the investment-to-GDP ratio, is used. b. See, for instance, Mendoza and Terrones (2008) and Elekdag and Wu (2011).

CHAPTE R 4 183 A DECAD E AFT ER THE GLOB A L RECES S ION
BOX 4.1 Credit booms without investment booms (continued)
FIGURE B4.1.1 Investment and consumption during credit booms and deleveraging episodes
In the median EMDE credit boom, investment rose by about 1 percentage point of GDP above its long-term trend until the credit boom peaked. It dropped below its long-term trend by 1-2 percentage points of GDP before deleveraging episodes reached their troughs. In the recent wave of credit surges in EMDEs, credit booms fueled more household consumption than did average credit booms in the past.
B. Change in investment during deleveraging episodes
A. Change in investment during credit booms
Sources: Bank for International Settlements; Haver Analytics; International Monetary Fund (International Financial Statistics and World Economic Outlook); World Bank (World Development Indicators). Note: The red lines show sample medians; the blue lines show the corresponding upper and lower quartiles. A credit boom is defined as an episode during which the cyclical component of the nonfinancial private sector credit-to-GDP ratio (derived by Hodrick-Prescott filter) is larger than 1.65 times its standard deviation in at least one year. The episode starts when the cyclical component first exceeds one standard deviation and ends in a peak year (“0”) when the nonfinancial private sector credit-to-GDP ratio declines in the following year. A deleveraging episode is defined correspondingly. To address the end-point problem of a Hodrick-Prescott filter, the dataset is expanded by setting the data for 2019-2021 to be equal to the data in 2018. In the case of China, the data for credit-to-GDP ratios in 2019-2021 will follow the declining trend between 2017-2018. Data are not available for Argentina until 1994, Brazil until 1993, China until 1984, Hungary until 1989, Poland until 1992, the Russian Federation until 1995, Saudi Arabia until 1993, and Turkey until 1986. EMDEs = emerging market and developing economies. A.B. The cyclical component of investment in percent of GDP (derived by Hodrick-Prescott filter). The yellow dashed line is the median cyclical component of investment in percent of GDP in the six EMDEs that were affected by the 1997-98 Asian financial crisis (year 1997 is set as t = 0). The light blue dashed line in A shows the sample median for the 18 countries that were in a credit boom in 2015 during 2012-18. C.D. The cyclical component of consumption in percent of GDP (derived by Hodrick-Prescott filter). In C, the light blue dashed line for 2012-18 shows the sample median for the 18 countries that were in a credit boom in 2015.
D. Change in consumption during deleveraging episodes
C. Change in consumption during credit booms
-4
-2
0
2
4
6
-3 -2 -1 0 1 2 3
Median Upper and lower quartiles
Percent of GDP
-6
-4
-2
0
2
4
6
-3 -2 -1 0 1 2 3
Median Upper and lower quartiles2012-18
Percent of GDP
-6
-4
-2
0
2
4
6
-3 -2 -1 0 1 2 3
Median
Upper and lower quartiles
Percent of GDP
-10-8-6-4-202468
-3 -2 -1 0 1 2 3
Median Upper and lower quartilesAsian financial crisis2012-18
Percent of GDP

184 CHAPTE R 4 A DECAD E AFT ER THE GLOB A L RECES S ION
during credit booms have not continued for long, consumption contractions during a typical deleveraging episode have tended to last for three to four years.
After the global financial crisis, the coincidence between credit booms and investment surges around the peak year of a credit boom dropped significantly in EMDEs (figure B4.1.2). Before 2008, half of credit booms were accompanied by investment surges or booms. After the global recession, however, the share of credit booms coinciding with investment surges or booms dropped to one-third.
In EMDEs, the number of investment surges peaked before the global recession, whereas the wave of credit booms in EMDEs reached its peak in 2015. The number of EMDEs in a credit boom increased from 3 in 2011 to 18 in 2015, subsequently falling to just 2 in 2018. Meanwhile, the number of EMDEs in an investment surge dropped from 10 in 2011 to 1 in 2016. In 2018, the number of EMDEs in an investment surge remained low.
In several countries, rapid credit growth fueled above-average consumption growth but no investment surge or boom. In EMDEs where a credit boom occurred in
BOX 4.1 Credit booms without investment booms (continued)
FIGURE B4.1.2 Coincidence between investment surges and credit booms
Before the global recession, half of all credit booms in EMDEs were accompanied by investment surges around the credit boom’s peak years. Since 2010, the share of credit booms accompanied by investment surges has dropped below the levels before the global financial crisis.
B. Investment surges during recent credit booms in EMDEs
A. Investment surges during past booms in EMDEs
Sources: Bank for International Settlements; Haver Analytics; International Monetary Fund (International Financial Statistics); World Bank (World Development Indicators). Note: A credit boom is defined as an episode during which the cyclical component of the nonfinancial private sector credit-to-GDP ratio (derived by Hodrick-Prescott filter) is larger than 1.65 times its standard deviation in at least one year. The episode starts when the cyclical component first exceeds one standard deviation and ends in a peak year (“0”) when the nonfinancial private sector credit-to-GDP ratio declines in the following year. Investment surge is defined as years when the cyclical component of the investment-to-GDP ratio is at least one standard deviation (1.65 for investment booms) above the Hodrick-Prescott filtered trend; investment slowdown is a year when the cyclical component of the investment-to-GDP ratio is at least one standard deviation below the Hodrick-Prescott filtered trend. Data are not available for Argentina until 1994, Brazil until 1993, China until 1984, Hungary until 1989, Poland until 1992, the Russian Federation until 1995, Saudi Arabia until 1993, and Turkey until 1986. EMDEs = emerging market and developing economies. A. Investment surges during the peak year (t = 0) or the following year.
0
10
20
30
40
50
Until 2007 2010 onward
Investment surgeInvestment boom
Percent of credit booms
0
5
10
15
20
25
30
2000
2001
2002
2003
2004
2005
2006
2007
2008
2009
2010
2011
2012
2013
2014
2015
2016
2017
2018
Credit boom with investment surgeCredit boom without investment surgeInvestment surge
Number of countries

CHAPTE R 4 185 A DECAD E AFT ER THE GLOB A L RECES S ION
2015, consumption was about 2 percentage points of GDP above trend—above its median expansion during previous credit boom episodes (1.5 percentage points).
Output during credit booms and deleveraging episodes
In general, output has expanded during credit booms, but by less than investment (Mendoza and Terrones 2008, 2012). Before a typical credit boom peaked, output increased, on average, by 3 percent above trend when the boom was accompanied by an investment surge, but by only 1 percent above trend when there was no investment surge (figure B4.1.3). Two years after the peak credit-to-GDP level, output was typically below trend by more than 2 percent in the absence of investment surges, but by only one-third as much following booms
BOX 4.1 Credit booms without investment booms (continued)
FIGURE B4.1.3 Output growth during credit booms and deleveraging episodes
In EMDEs, output on average rose above its trend by about 2.5 percent during credit booms and fell below trend by 2.0 percent during deleveraging episodes. Output growth during credit booms and in the run-up to deleveraging episodes tended to be stronger when accompanied by investment surges. During deleveraging episodes, declines were deeper when accompanied by investment slowdowns.
B. GDP during deleveraging episodes A. GDP during credit booms
Sources: Bank for International Settlements; Haver Analytics; International Monetary Fund (International Financial Statistics); World Bank (World Development Indicators). Note: A credit boom is defined as an episode during which the cyclical component of the nonfinancial private sector credit-to-GDP ratio (derived by Hodrick-Prescott filter) is larger than 1.65 times its standard deviation in at least one year. The episode starts when the cyclical component first exceeds one standard deviation and ends in a peak year (“0”) when the nonfinancial private sector credit-to-GDP ratio declines in the following year. A deleveraging episode is defined correspondingly. Investment surge is defined as years when the cyclical component of the investment-to-GDP ratio is at least one standard deviation (1.65 for investment booms) above the Hodrick-Prescott filtered trend; investment slowdown is a year when the cyclical component of the investment-to-GDP ratio is at least one standard deviation below the Hodrick-Prescott filtered trend. Data are not available for Argentina until 1994, Brazil until 1993, China until 1984, Hungary until 1989, Poland until 1992, the Russian Federation until 1995, Saudi Arabia until 1993, and Turkey until 1986. EMDEs = emerging market and developing economies. A. Group means for the cyclical components of GDP in percent of its trend (derived using a Hodrick-Prescott filter) for all credit booms (in blue), credit booms with investment surge (occurred in 1 year around t = 0, in red), and credit booms without investment surge (in yellow). The mean cyclical components of GDP in percent of its Hodrick-Prescott filtered trend for the 18 countries that were in a credit boom in 2015. B. Group means for the cyclical components of GDP in percent of its trend (derived using a Hodrick-Prescott filter) for all deleveraging episodes (in blue), deleveraging episodes with investment slowdown (occurred in 1 year around t = 0, in red), and deleveraging episodes without investment slowdown (in orange).
-3-2-1012345
-3 -2 -1 0 1 2 3
AllWith investment surgeWithout investment surge2012-18
Percent deviation from trend
-4
-3
-2
-1
0
1
2
3
-3 -2 -1 0 1 2 3
Percent deviation from trendAllWith investment slowdownWithout investment slowdown

186 CHAPTE R 4 A DECAD E AFT ER THE GLOB A L RECES S ION
BOX 4.1 Credit booms without investment booms (continued)
accompanied by investment surges. The larger output loss in the aftermath of credit booms without investment surges may reflect the lack of a boost to potential output from capital accumulation that could have been created by an investment surge. In the recent postcrisis wave of credit surges, EMDE output has evolved similarly to that of an average past credit boom, largely supported by rising consumption around the peak of the boom.
During a typical deleveraging episode, output fell, on average, to a level almost 2 percent below trend. If accompanied by an investment slowdown, the decline in output was sharper as output fell from near trend in the run-up to the deleveraging to about 3 percent below trend at its trough. Output remained below trend one year after reaching the trough of a deleveraging episode and moved back to its trend shortly afterward.
Conclusion
Since the global recession, several EMDEs have experienced rapid private sector credit growth. In contrast to many precrisis episodes, these credit surges have typically not been accompanied by investment surges and have largely fueled consumption in some EMDEs. In the past, output contracted as credit booms unwound and it contracted more when credit booms occurred without investment surges.
percent of GDP, respectively, in the decade leading up to end-2018. Meanwhile, credit to the nonfinancial corporate sector surged in Turkey—by nearly 40 percent of GDP, to 70 percent—and Chile—by 33 percent of GDP, to 99 percent. Households in EMDEs have been accumulating debt at a somewhat slower pace compared to the corporate sector. At the end of 2018, average credit to households stood at 29 percent of GDP. Household debt remains modest in Argentina, India, and Turkey (at 7 percent, 11 percent, and 15 percent of GDP, respectively). In Malaysia and Thailand, however, household debt now accounts for two-thirds of GDP.
Riskier composition of private debt. This rapid increase in private debt was accompanied by a shift toward riskier borrowing, at least in some EMDEs (Alfaro et al. 2019; Beltran, Garud, and Rosenblum 2017; Feyen et al. 2017; IMF 2018b; World Bank 2018a). On average across the 21 EMDEs with available data, foreign currency-denominated corporate debt rose from 21 percent of GDP in 2007 to 28 percent in 2018, although its share of total corporate debt remained around 40 percent over this period (IIF 2019b). By end-2018, one-third of the 21 EMDEs with available data had foreign currency-denominated corporate debt above 20 percent of GDP.
This rise in foreign currency-denominated corporate debt between 2007 and 2018 was mainly concentrated in LAC, where it rose by 15 percentage points to 50 percent of

CHAPTE R 4 187 A DECAD E AFT ER THE GLOB A L RECES S ION
total corporate debt and its ratio to GDP rose by 19 percentage points on average. In contrast, in ECA and EAP (excluding China), the share of foreign currency-denominated corporate debt has declined since 2007 by about 5 percentage points, to 25 and 13 percent of GDP in the two regions, respectively.
Moreover, a greater share of corporate debt than before the global financial crisis is held by firms with riskier financial profiles, because supportive financing conditions have allowed firms to issue more debt with weaker credit quality (Beltran and Collins 2018; Feyen et al. 2017; IMF 2015a). The postcrisis decline in syndicated lending from advanced economies has also reduced the supply of long-term finance to corporate borrowers in EMDEs. Increased reliance on short-term debt has raised rollover risks and reduced the scope to undertake long-term investments such as infrastructure projects (World Bank 2015). In some EMDEs, the investor base has broadened, and the liquidity of local bond markets has increased. The continued reliance on bank credit, high costs and risks associated with issuing local bonds, and insufficient market infrastructure still limit the scale and sophistication of domestic debt markets in many economies (Goswami and Sharma 2011).
Rising external private debt and foreign exchange risks. After the global recession, the low cost of international borrowing prompted many EMDE corporations to finance the accumulation of local currency-denominated assets with proceeds from international bond issuance (Bruno and Shin 2018). Increasing issuance of foreign currency-denominated debt in EMDEs has contributed to rising currency mismatches and heightened the risks of financial distress in the corporate sector and the banking system. U.S. dollar appreciation could substantially increase the local currency cost of servicing foreign debts, raise corporate defaults, and weaken banks’ balance sheets, threatening their capacity to provide domestic credit.20
It is increasingly apparent that the appreciation of local currencies against the U.S. dollar is associated with increased portfolio flows into EMDEs, and that outflows often occur when currencies depreciate (BIS 2019b; Hofmann, Shim, and Shin 2016). This means that local currency depreciations may significantly amplify the negative impact of tighter global liquidity on EMDEs’ borrowing costs and access to external financing (BIS 2018a; Hofmann, Shim, and Shin 2019).
The U.S. dollar is also an indicator of global risk appetite and can therefore influence real investment activity in EMDEs. A stronger U.S. dollar can be associated with increased risk aversion and a reduced willingness of global banks to extend cross-border loans to EMDEs, which in turn can weaken local credit supply and investment activity (Avdjiev et al. 2018).
Greater shadow banking activities. Shadow banking refers to nonbank financial intermediation that takes place outside of the regulated financial system and may provide credit to riskier borrowers who often lack access to bank credit. Shadow banking
20 This appreciation could be triggered, for example, by reversals of capital flows to EMDEs on heightened global risk aversion.
188 CHAPTE R 4 A DECAD E AFT ER THE GLOB A L RECES S ION
BOX 4.2 Negative interest rate policies: Implications for emerging market and developing economies A number of central banks in advanced economies have implemented negative interest rate policies (NIRPs) in recent years as part of their unconventional monetary policy toolkit. Although their implications for advanced economies and EMDEs are broadly similar to the implications of other unconventional expansionary monetary policies, NIRPs could pose new risks. These risks include an erosion of profitability for banks and other financial intermediaries, as well as excessive risk-taking by investors in advanced economies, which can contribute to higher volatility of capital flows to EMDEs. Macroprudential policies, along with strong supervisory and regulatory frameworks, can mitigate such risks and reduce the volatility of financial cycles.
Introduction
In recent years, a number of central banks in advanced economies—including in Denmark, Japan, Sweden, Switzerland, and the euro area—have adopted negative interest rate policies (NIRPs) to provide additional monetary policy stimulus. The central banks implementing NIRPs are charging (instead of paying) commercial banks for their excess reserves, effectively taxing banks for hoarding cash and potentially encouraging them to boost lending.
In principle, cutting policy rates slightly below zero should lead to lower market interest rates and encourage lending. Given the downward rigidity of deposit rates arising from the guaranteed zero nominal yield on cash, however, NIRPs tend to shrink banks’ interest margins and reduce their profitability, potentially posing a financial stability risk. Weaker profits of banks in advanced economies can affect EMDEs through cutbacks in banks’ cross-border operations.
At the same time, profit erosion due to NIRPs and an increasing volume of negative-yielding bonds can accelerate search for higher yields, including through capital inflows to EMDEs, leading to their increasing exposure to the volatility of capital flows. These potential spillovers of NIRPs to EMDEs highlight the importance of having an appropriate policy framework to mitigate risks.
On the basis of the findings of a recent comprehensive study (Arteta et al. 2018), this box addresses the following questions regarding NIRPs:
How can NIRPs affect financial markets?
How can NIRPs affect financial stability?
What policies can EMDEs use to mitigate the associated risks?
Impact on financial markets
NIRPs have important transmission channels that affect financial markets in advanced economies (Eggertsson et al. 2019). In particular, negative policy rates
Note: This box was prepared by Carlos Arteta and Temel Taskin.

CHAPTE R 4 189 A DECAD E AFT ER THE GLOB A L RECES S ION
can be expected to reduce the rates at which financial intermediaries borrow and lend, which should lead to an increase in private sector demand for other assets such as equities, resulting in rising stock prices. Banks are encouraged to expand lending to avoid negative returns on their excess reserves at central banks. Households and nonfinancial corporations enjoy a lower external finance premium through strengthening balance sheets, and hence demand more credit.
Despite the potential benefits of NIRPs, associated complications could limit their effectiveness in boosting financial intermediation, particularly if they have adverse effects on the financial sector. For example, in order to prevent a loss of their deposit base, commercial banks may hesitate to impose negative rates on depositors (Heider, Saidi, and Schepens 2019). This may either limit the pass-through to lending rates, as banks seek to maintain interest margins, or adversely affect profitability, which could weaken the transmission of monetary policy (Erikson and Vestin 2019; Ulate Campos 2019; Waller 2016).
By affecting the profitability of banks in advanced economies, NIRPs can also have implications for financial markets in EMDEs.a Lower profits of banks in advanced economies can spill over to EMDEs through the reduction in cross-border operations. An additional reduction would exacerbate the retrenchment of a number of major global banks from EMDEs that has already taken place in recent years.
NIRPs have also generally been associated with a downward shift in the yield curve—a broad-based decline in interest rates, with most short-term government bond yields and some longer-term yields having turned negative in NIRP countries. The impact of NIRPs on bond yields appears to reflect primarily a downward shift in expectations about the future path of policy rates, rather than a further compression of term premia from already low levels.
Impact on financial stability
NIRPs could pose specific risks to financial stability in the advanced economies implementing them, particularly if rates go substantially below zero or if NIRPs are employed for a protracted period of time. A decade of record low interest rates has compressed banks’ net interest margins (Claessens, Coleman, and Donnelly 2018). Some bank surveys also indicate a perception that NIRPs have had an adverse impact on bank profits (figure B4.2.1). Investors may be encouraged by negative policy rates and low or negative bond yields to take excessive risk, leading to asset bubbles (Arteta et al. 2018).
BOX 4.2 Negative interest rate policies: Implications for emerging market and developing economies (continued)
a. Molyneux, Reghezz, and Xie (2019) find that bank margins and profits fell in countries that adopted NIRPs compared to countries where this policy was not implemented.

190 CHAPTE R 4 A DECAD E AFT ER THE GLOB A L RECES S ION
NIRPs could also have financial stability implications for EMDEs, by potentially triggering excessive capital inflows and exacerbating volatility. Under persistently low or negative government bond yields in advanced economies, investors may divert funds to EMDEs in search of higher yield. Negative policy rates and bond yields were accompanied by a rebound in capital flows to EMDEs in 2016-17. In recent months, however, capital flows have moderated, reflecting heightened risk aversion and flight to safety amid deteriorating global growth prospects.
More generally, the significant increase in portfolio flows to EMDEs after the global recession, including in the period of NIRPs, has already contributed to elevated corporate debt in EMDEs, heightening the risk of abrupt deleveraging. Capital inflow surges to EMDEs are usually followed by credit booms, as extensively documented in the literature. Credit booms, if not accompanied by appropriate prudential policies, could increase financial risks and eventually lead to credit busts and financial crises. Credit booms that are not accompanied by investment booms can be particularly problematic, because they are associated with slower economic growth after the boom episodes (box 4.1).
BOX 4.2 Negative interest rate policies: Implications for emerging market and developing economies (continued)
FIGURE B4.2.1 Bank profitability and government bond yields
Survey results indicate a perception that NIRPs have an adverse impact on euro area bank profits. Government bond yields have fallen into negative territory in NIRP economies, encouraging investors to search for higher yield in EMDEs.
B. Two-year government bond yields A. Impact of ECB’s NIRP on banks
Sources: Arteta et al. (2018); Bloomberg; European Central Bank; World Bank. Note: ECB = European Central Bank; EMDEs = emerging market and developing economies; NIRP = negative interest rate policy. A. Results from ECB’s Bank Lending Survey in April 2016. Questions start: “Given the ECB's negative deposit facility rate, did or will this measure, either directly or indirectly, contribute to…” Net percent is calculated as the difference between the sum of responses mentioning “increased considerably” and “increased somewhat” and the sum of responses mentioning “decreased somewhat” and “decreased considerably,” divided by the number of responding banks that did not reply “not applicable.” B. “Euro area” yield is the European Central Bank’s euro area two-year government benchmark bond yield estimation. Last observation is June 2019.
-90
-50
-10
30
Ne
t in
tere
stin
com
e
Lend
ing
ma
rgin
Lend
ing
rate
Lend
ing
volu
me
No
n-in
tere
stch
arg
e
Lend
ing
ma
rgin
Lend
ing
rate
Lend
ing
volu
me
No
n-in
tere
stch
arg
e
Enterprises Households for housepurchase
Past six months Next six monthsNet percent
-2
-1
0
1
2
Jun
-12
Jun
-13
Jun
-14
Jun
-15
Jun
-16
Jun
-17
Jun
-18
Jun
-19
Euro area Denmark Sweden
Switzerland Japan
Percent

CHAPTE R 4 191 A DECAD E AFT ER THE GLOB A L RECES S ION
This box employs event studies (similar to Chen et al. 2011 and Gagnon 2016) to assess the immediate impact of NIRP announcements on financial market developments across EMDEs, which can be interpreted as providing information about market participants’ expectations of the longer-run effects of NIRPs on EMDEs. The event study tracks three major EMDE variables: exchange rates, EMBI spreads, and equity prices on the day of rate cuts into or within negative territory by central banks in advanced economies.
On average, the response of EMDE assets is broadly consistent with prior estimates and the previous literature. EMDE currencies appreciated, bond spreads narrowed, and equity prices in EMDEs increased on the day of NIRP announcements (figure B4.2.2). The average impact on EMDEs is directionally consistent with previous estimates for other unconventional monetary policies by major advanced economies. The reaction of asset prices varies across countries, which likely reflects domestic developments or other changes in international financial markets on the day of the announcements (figure B4.2.2).
The immediate reaction of EMDE assets, reflected in declining bond yields, rising equity prices, and appreciating currencies, is also consistent with the longer-term trends in EMDE financial markets in the postcrisis period. In particular, surges in capital inflows to EMDEs have been accompanied by significant upswings in private sector debt amid favorable funding costs, as well as increases in foreign currency-denominated corporate debt.
Policies to mitigate risks
In an environment of weak growth, depressed real interest rates, and low inflation expectations, NIRPs can help provide additional monetary policy stimulus in the economies implementing them—as long as policy interest rates are only modestly negative and do not stay negative for too long, so that lasting adverse effects on the financial sector can be avoided. Shrinking interest margins, accompanied by negative bond yields, can lead to the erosion of bank profitability in NIRP economies. Thus, although negative policy interest rates have a place in a policy maker’s toolkit, they need to be handled with care in order to secure their benefits and mitigate their risks.
Because NIRPs and other unconventional monetary policies tend to lower interest rates in advanced economies, they can trigger capital inflows to EMDEs as investors search for higher yields. Given the risks associated with high capital flow volatility, macroprudential policies should be employed to mitigate systemic risks and reduce the procyclicality of domestic credit supply. Such policies can include a range of instruments, including caps on loan-to-value or debt-to-income ratios, dynamic provisioning, and credible stress tests. Banks and nonfinancial
BOX 4.2 Negative interest rate policies: Implications for emerging market and developing economies (continued)
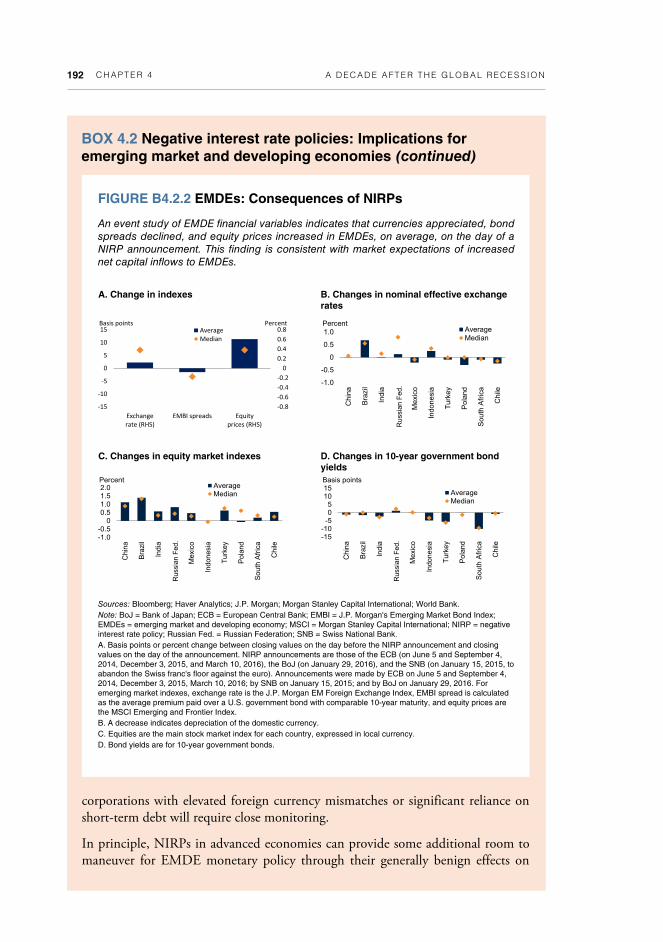
192 CHAPTE R 4 A DECAD E AFT ER THE GLOB A L RECES S ION
corporations with elevated foreign currency mismatches or significant reliance on short-term debt will require close monitoring.
In principle, NIRPs in advanced economies can provide some additional room to maneuver for EMDE monetary policy through their generally benign effects on
BOX 4.2 Negative interest rate policies: Implications for emerging market and developing economies (continued)
FIGURE B4.2.2 EMDEs: Consequences of NIRPs
An event study of EMDE financial variables indicates that currencies appreciated, bond spreads declined, and equity prices increased in EMDEs, on average, on the day of a NIRP announcement. This finding is consistent with market expectations of increased net capital inflows to EMDEs.
B. Changes in nominal effective exchange rates
A. Change in indexes
Sources: Bloomberg; Haver Analytics; J.P. Morgan; Morgan Stanley Capital International; World Bank. Note: BoJ = Bank of Japan; ECB = European Central Bank; EMBI = J.P. Morgan's Emerging Market Bond Index; EMDEs = emerging market and developing economy; MSCI = Morgan Stanley Capital International; NIRP = negative interest rate policy; Russian Fed. = Russian Federation; SNB = Swiss National Bank. A. Basis points or percent change between closing values on the day before the NIRP announcement and closing values on the day of the announcement. NIRP announcements are those of the ECB (on June 5 and September 4, 2014, December 3, 2015, and March 10, 2016), the BoJ (on January 29, 2016), and the SNB (on January 15, 2015, to abandon the Swiss franc's floor against the euro). Announcements were made by ECB on June 5 and September 4, 2014, December 3, 2015, March 10, 2016; by SNB on January 15, 2015; and by BoJ on January 29, 2016. For emerging market indexes, exchange rate is the J.P. Morgan EM Foreign Exchange Index, EMBI spread is calculated as the average premium paid over a U.S. government bond with comparable 10-year maturity, and equity prices are the MSCI Emerging and Frontier Index. B. A decrease indicates depreciation of the domestic currency. C. Equities are the main stock market index for each country, expressed in local currency. D. Bond yields are for 10-year government bonds.
D. Changes in 10-year government bond yields
C. Changes in equity market indexes
-1.0
-0.5
0.0
0.5
1.0
Chi
na
Bra
zil
Indi
a
Ru
ssia
Me
xico
Indo
ne
sia
Tu
rkey
Po
land
Sou
th A
fric
a
Ch
ile
AverageMedian
Percent
Rus
sian
Fed
.
-1.0-0.50.00.51.01.52.0
Chi
na
Bra
zil
Indi
a
Rus
sia
Mex
ico
Indo
nesi
a
Tur
key
Pol
and
Sou
th A
fric
a
Chi
le
AverageMedian
Percent
Rus
sian
Fed
. -15-10
-505
1015
Chi
na
Bra
zil
Indi
a
Rus
sia
Mex
ico
Indo
nesi
a
Tur
key
Pol
and
Sou
th A
fric
a
Chi
leAverageMedian
Basis points
Rus
sian
Fed
.
‐0.8
‐0.6
‐0.4
‐0.2
0.0
0.2
0.4
0.6
0.8
‐15
‐10
‐5
0
5
10
15
Exchangerate (RHS)
EMBI spreads Equityprices (RHS)
AverageMedian
PercentBasis points

CHAPTE R 4 193 A DECAD E AFT ER THE GLOB A L RECES S ION
BOX 4.2 Negative interest rate policies: Implications for emerging market and developing economies (continued)
global financing conditions. Low global interest rates may not necessarily translate into a commensurate decline in EMDE bond yields and spreads, however, particularly in the more vulnerable economies. Adverse financial developments, such as sharp currency depreciations, can constrain the ability of EMDEs to pursue monetary policy accommodation.
The availability of fiscal policy buffers as a countercyclical tool thus remains important for EMDEs. On the one hand, downward pressure from NIRPs on global interest rates can help contain borrowing costs in many EMDEs and create some fiscal space to maneuver, if needed. On the other hand, fiscal policy can lean against temporary capital inflows associated with exceptionally accommodative monetary policies in advanced economies, including NIRPs, and rebuild buffers before global financing conditions eventually tighten (Arteta et al. 2015, 2018).
Conclusion
A number of central banks in advanced economies have employed NIRPs to provide additional monetary policy stimulus over the past few years. Countries with short-term policy rates in negative territory now account for one-fourth of world GDP. NIRPs have been accompanied by a decline in advanced economy bond yields, sometimes into negative territory. The global economy has never before witnessed negative interest rates on such a large scale. The unprecedented step of deploying NIRPs in multiple countries has implications for both advanced economies and EMDEs.
In principle, rate cuts into negative territory can be expected to reduce the rates at which financial intermediaries conduct their borrowing and lending activities. Using NIRPs, however, may result in complications that limit policy effectiveness, particularly if they have adverse effects on financial institutions. In particular, downward rigidity in deposit rates, due to the guaranteed zero nominal yield on cash, tends to shrink interest margins and reduce the profitability of banks.
By affecting bond yields and the profitability of banks, NIRPs can have spillovers to EMDEs. Specifically, investors are encouraged to search for yield amid negative yields in advanced economies, potentially resulting in capital flow surges into EMDEs. The debt overhang in EMDEs, following the credit booms in the postcrisis period, makes them vulnerable to global and regional shocks. Moreover, debt accumulation threatens to reduce the asset quality of banks in some EMDEs. In this context, macroprudential policies should be used appropriately against excessive capital flows to avoid credit boom/bust cycles and financial crises, while supervisory and regulatory frameworks should be strengthened to reduce the associated risks.
194 CHAPTE R 4 A DECAD E AFT ER THE GLOB A L RECES S ION
systems, which were small before the global recession, have expanded rapidly in a number of EMDEs, particularly in large economies such as China and India (IMF 2014). In these two countries, assets of nonbank financial institutions now represent over a third of total financial system assets. In China alone, this share has more than doubled over the last decade, and the size and complexity of its nonbank financial sector is becoming comparable to those of advanced economies (Ehlers, Kong, and Zhu 2018).
A decade of relatively light regulation and rapid growth has increased maturity mismatches and credit risks in shadow banking (IMF 2019a). Financial stress in shadow banking may quickly propagate to the rest of the financial system, owing to its interconnectedness with banks. A recent shift toward stricter regulations and supervision of shadow banking in China and a default of one of the largest nonbank lenders in India have already created tighter financial conditions for the private sector in those economies (IMF 2019d).
Rising private debt in LICs. Private sector credit in LICs, which stalled in the aftermath of the global recession, resumed growing markedly in 2011. Average credit to the private sector in LICs increased to 19 percent of GDP in 2017, from 12 percent in 2007. The rise in credit was most pronounced in West Africa, where pan-African banks became more active after the onset of the global recession. For example, between 2007 and 2017, the ratio of private sector credit to GDP in Burkina Faso, Senegal, Mali, and Togo almost doubled—to 30, 29, 26, and 41 percent, respectively. Such a rapid acceleration of credit has created regulatory challenges in LICs (Arena et al. 2015). In many of these countries, financial oversight infrastructure tends to be weaker and less developed, and incomplete disclosure of information by financial institutions impedes proper assessment and mitigation of financial stability risks.
Less robust financial system balance sheets in EMDEs. In the past, unsustainable and inadequately supervised acceleration of credit has sometimes precipitated sharp slowdowns in economic growth, accompanied and followed by prolonged deleveraging (see Albanesi, De Giorgi, and Nosal 2017; Bernanke 2018; Cerutti, Dell'Ariccia, and Dagher 2017; Duffie 2019; Gertler and Gilchrist 2018; Mian, Sufi, and Verner 2017). The recent rapid rise in credit growth among EMDEs has led to similar concerns about the health and resilience of their financial sector balance sheets.
Asset quality. In nearly two-thirds of EMDEs, asset quality has deteriorated since the crisis (figure 4.7). Between 2007 and 2017, nonperforming loan ratios rose in 57 percent of the EMDEs with available data. The asset quality deterioration has been particularly pronounced in smaller state-controlled banks in SAR and commodity-exporting ECA economies as a result of a growth slowdown during 2015-16 and allocative inefficiencies among public sector banks. Meanwhile, bank exposures to governments have increased steadily since the crisis, exacerbating the risks to bank asset quality should sovereign creditworthiness deteriorate (figure 4.7)
Funding stability. The funding models of some EMDE banking systems may have become more fragile, because some banks have increased their reliance on short-term wholesale funding, albeit from a low base, in response to improved access to
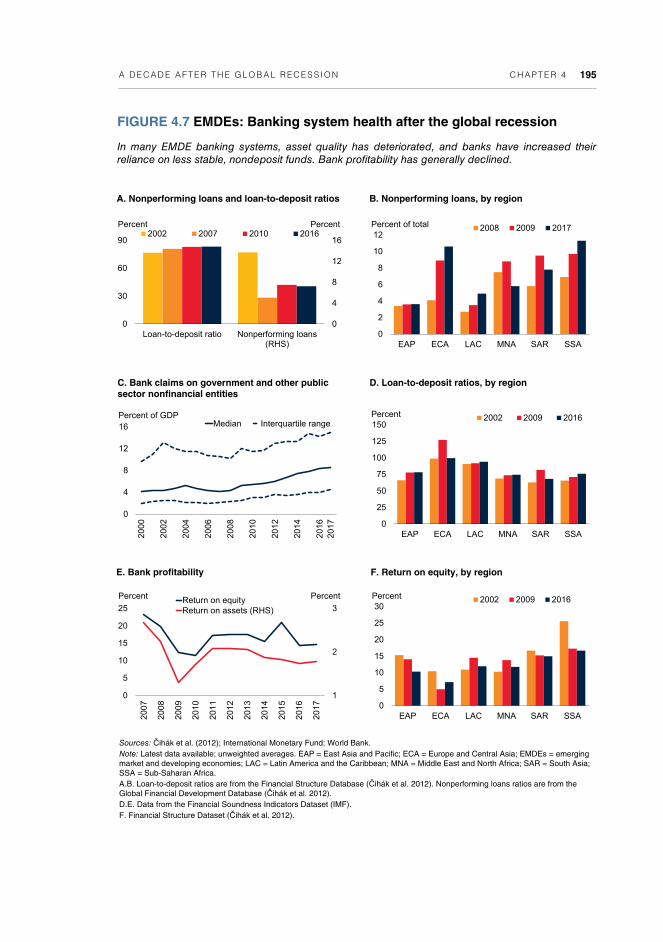
CHAPTE R 4 195 A DECAD E AFT ER THE GLOB A L RECES S ION
FIGURE 4.7 EMDEs: Banking system health after the global recession
In many EMDE banking systems, asset quality has deteriorated, and banks have increased their reliance on less stable, nondeposit funds. Bank profitability has generally declined.
B. Nonperforming loans, by region A. Nonperforming loans and loan-to-deposit ratios
D. Loan-to-deposit ratios, by region C. Bank claims on government and other public sector nonfinancial entities
Sources: Čihák et al. (2012); International Monetary Fund; World Bank. Note: Latest data available; unweighted averages. EAP = East Asia and Pacific; ECA = Europe and Central Asia; EMDEs = emerging market and developing economies; LAC = Latin America and the Caribbean; MNA = Middle East and North Africa; SAR = South Asia; SSA = Sub-Saharan Africa. A.B. Loan-to-deposit ratios are from the Financial Structure Database (Čihák et al. 2012). Nonperforming loans ratios are from the Global Financial Development Database (Čihák et al. 2012). D.E. Data from the Financial Soundness Indicators Dataset (IMF). F. Financial Structure Dataset (Čihák et al. 2012).
F. Return on equity, by region E. Bank profitability
0
2
4
6
8
10
12
EAP ECA LAC MNA SAR SSA
2008 2009 2017Percent of total
0
4
8
12
16
20
00
20
02
20
04
20
06
20
08
20
10
20
12
20
14
20
16
20
17
Median Interquartile rangePercent of GDP
0
25
50
75
100
125
150
EAP ECA LAC MNA SAR SSA
2002 2009 2016Percent
1
2
3
0
5
10
15
20
25
20
07
20
08
20
09
20
10
20
11
20
12
20
13
20
14
20
15
20
16
20
17
Return on equityReturn on assets (RHS)
Percent Percent
0
5
10
15
20
25
30
EAP ECA LAC MNA SAR SSA
2002 2009 2016Percent
0
4
8
12
16
0
30
60
90
Loan-to-deposit ratio Nonperforming loans(RHS)
2002 2007 2010 2016Percent Percent

196 CHAPTE R 4 A DECAD E AFT ER THE GLOB A L RECES S ION
capital markets and continued growth of private sector credit. In the average EMDE, the loan-to-deposit ratio edged up to 86 percent in 2017 from 80 percent in 2007, but with notable regional variations (figure 4.7).
Profitability. Banks’ returns on assets and equity in EMDEs have generally declined since the onset of the global recession (figure 4.7). In some EMDEs, bank profitability has weakened more recently as postrecession credit booms receded, economic growth slowed, and loan quality deteriorated (BIS 2018b).
Changes in financial markets
Domestic banks—particularly state-owned banks in some large EMDEs such as China and India—remain the primary source of private credit in EMDEs.21 EMDE private sector borrowing from international capital markets, however, has increased since the global recession. Moreover, the role of regional banks has increased, following the retrenchment of large international banks.
Retrenchment of EU- and U.S.-headquartered banks. EU- and U.S.-headquartered banks have downsized their EMDE operations—especially in ECA, and, to a lesser extent, in LAC and SSA—partly as a response to stricter financial regulations in advanced economies.22 In some cases, government bailouts required an exit from noncore activities abroad (BIS 2018b; Cetorelli and Goldberg 2011; Claessens and Van Horen 2015; McCauley et al. 2017; World Bank 2018b). Several global, systemically important financial institutions have sharply reduced their foreign operations, triggering a sharp contraction of cross-border bank lending to some EMDEs (figure 4.8).23 After the global recession, a number of banking systems in advanced economies, especially in the euro area, have suffered from weak profitability, reflecting lackluster growth and persistently low—and even negative—interest rates (BIS 2019b; box 4.2). These profitability issues may have contributed to weak cross-border bank lending from advanced economies to some EMDE regions.
Increasing regional concentration of EMDE banks. As large international banks retrenched, cross-border bank lending to EMDEs shifted to EMDE-headquartered
21 In several EMDEs, large state-owned banks (and in particular state-owned development banks in Brazil, China, and Mexico) played a countercyclical role in stabilizing credit by expanding their loan portfolios and through various credit guarantee schemes. Several studies show that credit provision by state-owned banks is less procyclical compared to credit extended by private banks, which may help mitigate credit cycles. Countercyclical lending by state-owned banks, however, crowds out lending by private banks and results in long-term fiscal and economic costs in the form of contingent government liabilities and misallocation of credit (see World Bank 2012 for a detailed discussion and literature review).
22 The postcrisis overhaul of financial regulations in advanced economies has greatly strengthened crisis prevention measures, including stricter liquidity and capital requirements. Meanwhile, new resolution mechanisms gave regulators more powers to dismantle and liquidate systemically important financial institutions, including large international banks (Metrick and Rhee 2018).
23 For example, since 2016, Barclays has reduced its stake in Barclays Africa Group Ltd. (an important lender in Kenya, Botswana, Tanzania, Ghana, and South Africa) and ended entirely its nearly 100-year presence in SSA in mid-2018. HSBC reduced the number of its countries of operation to 67 from 88, especially in EAP, LAC, and SAR. U.K.-based Standard Chartered sold its retail operations in Thailand in 2016. U.S.-headquartered Citi has withdrawn from retail banking in Argentina, Brazil, and Colombia.

CHAPTE R 4 197 A DECAD E AFT ER THE GLOB A L RECES S ION
FIGURE 4.8 EMDEs: Changes in financial intermediation
As EU- and U.S.-headquartered banks have downsized their EMDE operations, cross-border bank lending to EMDEs shifted to EMDE-headquartered banks. EMDE corporate and sovereign borrowers have increasingly turned to capital markets to raise new debt.
B. Changing sources of cross-border bank loans A. Cross-border bank lending to EMDEs
D. Global assets of 10 largest G-SIBs by bank domicile
C. Panregional banks
Sources: Bank for International Settlements (BIS); International Monetary Fund (IMF); World Bank. Note: EAP = East Asia and Pacific; ECA = Europe and Central Asia; EMDEs = emerging market and developing economies; GFC = global financial crisis; G-SIBs = global systemically important banks; LAC = Latin America and the Caribbean; MNA = Middle East and North Africa; SAR = South Asia; SSA = Sub-Saharan Africa. A. Sample has 140 EMDEs; ratios of the total stock of cross-border bank claims on the region to its aggregate GDP. B. Sample includes 115 EMDEs excluding China (data for only 77 EMDEs in 2018). Lending by non-BIS banks is estimated as total bank loans and deposits from the IMF Balance of Payment Statistics (excluding central banks) minus cross-border lending by BIS reporting banks. This difference mostly accounts for the banking flows originating from non-BIS reporting countries (IIF 2016). C. Based on annual bank statements; before the GFC—2008 or 2009 depending on data availability; after GFC—2018, or latest data available. D. Based on the Financial Stability Board 2018 list of G-SIBs. E. Debt securities outstanding. Data for Argentina, Brazil, Colombia, India, Indonesia, Malaysia, Mexico, Philippines, the Russian Federation, South Africa, Thailand, and Turkey. F. Data on EMDE aggregates are from BIS (2019a). BIS estimates of the claims by foreign banks on official sector; sample comprises Argentina, Brazil, Chile, Colombia, Hungary, India, Indonesia, Israel, Mexico, Malaysia, Poland, Russia, Thailand, Turkey, South Africa, and Republic of Korea. BIS estimates of claims by foreign banks are available from 2006.
F. Claims on the official sector E. Debt issuance, EMDEs excluding China
-1
0
1
2
3
4
5
2002
2003
2004
2005
2006
2007
2008
2009
2010
2011
2012
2013
2014
2015
2016
2017
2018
BIS reporting banksNon-BIS reporting banks
Percent of GDP
0
200
400
600
beforeGFC
afterGFC
beforeGFC
afterGFC
beforeGFC
afterGFC
SSA ECA EAP
Within regionOther EMDEs
Number of branches and subsidaries
0
25
50
75
100
2007 2018
European Union United States ChinaPercent of total assets of top ten G-SIBs
0
10
20
30
40
50
60
2007 2010 2018
International Domestic
Percent of GDP
0
10
20
30
40
2007 2010 2017
Nonbank creditBank creditClaims by foreign banks
Percent of GDP
0
6
12
18
24
EM
DE
s
EA
P
EC
A
LAC
MN
A
SA
R
SS
A
2017 2007Percent of GDP

198 CHAPTE R 4 A DECAD E AFT ER THE GLOB A L RECES S ION
banks, which greatly expanded their regional presence, most notably in SSA (Cerutti and Zhou 2017, 2018; IMF 2015b; World Bank 2018b; figure 4.8). Chinese banks accounted for two-thirds of EMDE-to-EMDE lending between 2013 and 2017—and for most of the doubling in cross-border claims on SSA economies in the same period, to over 10 percent of GDP on average (Cerutti, Koch, and Pradhan 2018; Dollar 2016). Other EMDE banks have also increased their presence in EMDEs within their respective regions. In all, the share of assets held by banks headquartered outside Organisation for Economic Co-operation and Development countries in 2013 more than doubled compared to 2007, to 11 percent of all foreign bank assets, highlighting that foreign bank presence is now more regionally focused (Claessens and van Horen 2015).
In SSA, banks headquartered in Nigeria, South Africa, and Togo have expanded rapidly to other EMDEs in the region (Arizala et al. 2018; IMF 2015c). In ECA, Russian Federation banks initially expanded within the region after the crisis, as Western European banks withdrew.24 LAC was an exception. Domestic banks expanded by acquiring assets from exiting foreign lenders, whereas banks from elsewhere in the region played a limited role (IMF 2017).
Despite the large presence of foreign-owned banks in the financial systems of many EMDEs, few EMDEs have put in place regulatory frameworks to deal with the resolution of international banks (World Bank 2019c). The regional expansion of EMDE banks points to the urgency of establishing an effective set of rules for cross-border resolution of global and regional banks. These rules are particularly important during crises, when cross-jurisdictional cooperation could become more challenging because of political constraints.
Increasing EMDE reliance on capital markets. Both corporate and sovereign borrowers have increasingly accessed capital markets, in some regions following the retrenchment of large international banks. Foreign portfolio investors are also becoming more active in local bond markets, accounting for an increasing share of local currency-denominated sovereign bonds. As a result, EMDE financial markets are now more tightly integrated into the global financial system, which could in some circumstances facilitate the contagion of global financial shocks both to foreign currency and, to a lesser extent, local currency debt markets (Agur et al. 2018).
Nonfinancial corporations in many EMDEs have reduced, in varying degrees, their dependence on bank credit after the global recession (CGFS 2019). The share of corporate debt financed by debt securities on average rose from 16 percent to 25 percent of total lending between end-2007 and end-2018. This increase included issuance on both international and domestic debt markets. The volume of international debt securities issued by EMDEs increased by more than three times between 2007 and 2018. Domestic debt issuance excluding China increased from 33 percent of GDP in 2007 to 47 percent of GDP in 2018 (figure 4.8).
24 For example, Russia’s largest lender, Sberbank, acquired Volksbanken’s VBI Eastern European operations in 2012.
CHAPTE R 4 199 A DECAD E AFT ER THE GLOB A L RECES S ION
EMDE sovereign borrowers are also relying more heavily on capital markets. Since 2007, government debt in EMDEs has risen rapidly—by 17 percentage points of GDP—to a weighted average of 50 percent of GDP in 2018, with debt issuances playing an increasing role. From 2007 to 2017, debt securities issued by EMDE governments increased by 4.4 percentage points of GDP on average, to 22 percent of GDP. Sovereign debt issuance has grown particularly rapidly in domestic bond markets, especially in EAP (G20 2018a; figure 4.8). In some EMDEs, the share of nonresident investors in local currency sovereign bond holdings exceeds 30 percent, which makes these economies more vulnerable to sudden shifts in investor confidence (G20 2018a).
Increasing role of financial technology and mobile banking in EMDEs. In many EMDEs, digital technology, such as nonbank payment systems, has greatly expanded access to financial services for unbanked and underbanked firms and households. For example, in SSA one in five adults has a mobile money account—the highest penetration rate of mobile banking across EMDEs (World Bank 2018d). SSA is home to all 10 economies worldwide in which more adults have a mobile money account than a bank account.25
A broader adoption of technological innovations in finance in EMDEs, such as mobile banking and payments, makes it easier and less expensive for people to use financial services (World Bank 2014). Better access to financial services improves financial literacy, permits more efficient use of domestic savings, and reduces the costs of acquiring and sharing credit information, reinforcing the development of deeper and more inclusive financial systems.
The financial systems in EMDEs will continue to evolve as new financial and information technologies are more widely adopted, supporting innovation and expanding access to finance. This evolution, however, will also present new challenges to financial regulators. For example, new financial technologies will enable the provision of financial services by unregulated nonbank institutions. Data privacy and cybersecurity risks arising from the spread of digital technologies in finance are also a potential concern (FSB 2017b). Regulators will need to address gaps in the current monitoring and supervisory frameworks, as well as develop a better understanding of how technological innovations in finance reshape linkages and shock propagation channels across markets (Claessens et al. 2018; IMF and World Bank Group 2019).
New forms of infrastructure finance. Infrastructure finance, which remains predominantly bank-based, has declined in EMDEs following the sharp reduction in cross-border lending and stricter postcrisis regulations in the financial sector (FSB 2018b; G20 2013).26 In many EMDEs, infrastructure bonds also remain rare because of
25 The benefits of this trend are exemplified by Kenya’s experience: About 75 percent of adults in that country own a mobile money account, and increased access to financial services has helped reduce poverty and improved economic outcomes for women (Suri and Jack 2016).
26 Grants and concessional loans are the primary source of infrastructure finance in LICs, with bank lending providing a complementary source of funding only in a small number of countries (Gurara et al. 2017).

200 CHAPTE R 4 A DECAD E AFT ER THE GLOB A L RECES S ION
shallow capital markets, regulatory risks, weak institutions, poor design of concession contracts, and, outside of several large EMDEs, lack of data and experience with project finance to perform project evaluation. As a result, institutional investors account for less than 1 percent of all EMDE investment in infrastructure (World Bank 2018e). A number of recent initiatives, backed by multilateral development banks, aim to bring institutional investors to EMDE infrastructure finance through co-lending programs.27
Conclusion
During the global recession, private sector credit growth in the average EMDE slowed only moderately, resuming apace in 2011-16. Some EMDE regions experienced deep credit crunches, especially those, such as ECA, with heavy reliance on cross-border lending before the crisis.
During 2011-16, large capital inflows, supported by accommodative global financial conditions, fueled credit booms in nearly a quarter of all EMDEs with available data. By the end of 2016, some of these credit booms had started to recede because of higher EMDE borrowing costs, monetary policy tightening in some advanced economies, stricter macroprudential regulations, and weakening commodity prices and slowing growth in commodity producers. Although financial deepening can improve capital allocation and long-run growth prospects, the credit booms following the global recession have left a legacy of high debt that makes private sectors more vulnerable to increases in borrowing cost.
In addition, changes in EMDE financial systems since the global recession may have created new fragilities. Compared to 2007, EMDEs now rely more on international bond markets, which may amplify the impact of sudden stops of capital flows and adverse shocks to global sentiment. Growing cross-border bank lending between EMDEs may have reduced exposure to financial shocks originating in the banking systems of advanced economies; however, it has also made financial links among EMDEs stronger and increased the potential for inter-EMDE contagion of adverse shocks. Inflows from international capital markets since the global recession may thus exacerbate vulnerabilities to rollover risk or borrowing cost increases. This possibility underscores the importance of developing a strong domestic institutional base to mitigate large fluctuations in a country’s ability to access external finance.
Finally, there are signs that rapid credit growth and the accumulation of risks in lightly regulated segments of financial systems have created pressures on the health of financial sector balance sheets in some EMDEs, as suggested by deteriorating asset quality, increased reliance on short-term wholesale funding, declining bank profitability, and increasing exposure to sovereign debt. These developments raise concerns that future financial shocks could be more disruptive to financial systems in EMDEs than those that took place during the global recession.
27 For example, the International Finance Corporation’s Managed Co-Lending Portfolio Program (MCPP) for Infrastructure was created to facilitate access by institutional investors to infrastructure debt in EMDEs.

CHAPTE R 4 201 A DECAD E AFT ER THE GLOB A L RECES S ION
References Adrian, T., J. Kiff, and H. S. Shin. 2018. “Liquidity, Leverage, and Regulation 10 Years After the Global Financial Crisis.” Annual Review of Financial Economics 10 (1):1-24.
Aghion, P., P. Bacchetta, and A. Banerjeee. 2004. “Financial Development and The Instability of Open Economies.” Journal of Monetary Economics 51 (6): 1077-106.
Agur, I., M. Chan, M. Goswami, and S. Sharma. 2018. “On International Integration of Emerging Sovereign Bond Markets.” IMF Working Paper 18/18, International Monetary Fund, Washington, DC.
Ahmed, S., and A. Zlate. 2014. “Capital Flows to Emerging Market Economies: A Brave New World?” Journal of International Money and Finance 48 (B): 221-48.
Albanesi, S., G. De Giorgi, and J. Nosal. 2017. “Credit Growth and The Financial Crisis: A New Narrative.” NBER Working Paper 23740, National Bureau of Economic Research, Cambridge, MA.
Alfaro, L., G. Asis, A. Chari, and U. Panizza. 2019. “Corporate Debt, Firm Size and Financial Fragility in Emerging Markets.” NBER Working Paper 25459, National Bureau of Economic Research, Cambridge, MA.
Allen, F., T. Beck, E. Carletti, P. Lane, D. Schoenmaker, and W. Wagner. 2011. Cross-Border Banking in Europe: Implications for Financial Stability and Macroeconomic Policies. London: Centre for Economic Policy Research.
In this environment of elevated financial vulnerabilities, financial regulators have become increasingly aware of the urgency to identify and mitigate systemic risks to financial stability. Regulators in some countries were caught off guard by the scale and magnitude of financial disruptions during the global recession, which exposed policy challenges arising from complications related to measuring and mitigating financial cycles (Stellinga 2019). Financial regulations have since been overhauled and strengthened in both advanced economies and EMDEs, and regulatory agencies are now generally better equipped to detect and resolve systemic financial stability risks.
Despite these improvements, the resilience of this new regulatory infrastructure has yet to be tested—especially in EMDEs, where macroprudential policies are a relatively recent addition to their macroeconomic policy toolkits. Governments in EMDEs need to accelerate the appropriate reform of regulatory and monitoring frameworks in the financial sector, as well as implement macroprudential instruments that can adapt to the rapidly changing nature of financial systems.
Finally, as EMDEs become more deeply integrated both through global capital markets and regional cross-border lending, coordination of policy responses across countries will be needed to limit the contagion of financial shocks. For example, new regional financing arrangements can be set up to reflect the increasing role of EMDE-to-EMDE financial flows. Cooperation between various regional and international organizations needs to be enhanced to ensure that all layers of the global financial safety nets are effectively deployed during episodes of financial stress (ECB 2018; G20 2018b).

202 CHAPTE R 4 A DECAD E AFT ER THE GLOB A L RECES S ION
Arena, M., S. Bouza, E. Dabla-Norris, K. Gerling, and L. Njie. 2015. “Credit Booms and Macroeconomic Dynamics: Stylized Facts and Lessons for Low-Income Countries.” IMF Working Paper 15/11, International Monetary Fund, Washington, DC.
Arizala, F., M. Bellon, M. MacDonald, M. Mlachila, and M. Yenice. 2018. “Regional Spillovers in Sub-Saharan Africa: Exploring Different Channels.” Spillover Notes 18/01, International Monetary Fund, Washington, DC.
Arslanalp, S., and T. Tsuda. 2015. “Emerging Market Portfolio Flows: The Role of Benchmark-Driven Investors.” IMF Working Paper 15/263, International Monetary Fund, Washington, DC.
Arteta, C., M. A. Kose, F. Ohnsorge, and M. Stocker. 2015. “The Coming U.S. Interest Rate Tightening Cycle: Smooth Sailing or Stormy Waters?” Policy Research Note 2, World Bank, Washington, DC.
Arteta, C., M. A. Kose, M. Stocker, and T. Taskin. 2018. “Implications of Negative Interest Rate Policies: An Early Assessment.” Pacific Economic Review 23 (1): 8-26.
Avdjiev, S., V. Bruno, C. Koch, and H. Shin. 2018. “The Dollar Exchange Rate as a Global Risk Factor: Evidence from Investment.” BIS Working Papers 695, Bank for International Settlements, Basel, Switzerland.
Avdjiev, S., L. Gambacorta, L. Goldberg, and S. Schiaffi. 2017. “The Shifting Drivers of Global Liquidity.” BIS Working Paper 644, Bank for International Settlements, Basel.
Beck, T., A. Demirgüç-Kunt, and R. Levine. 2006. “Bank Concentration, Competition and Crises: First Results.” Journal of Banking and Finance 30 (5): 1581-603.
Beltran, D., and C. Collins. 2018. “How Vulnerable Are EME Corporates?” IFDP Notes, Board of Governors of the Federal Reserve System, Washington, DC.
Beltran, D., K. Garud, and A. Rosenblum. 2017. “Emerging Market Nonfinancial Corporate Debt: How Concerned Should We Be?” International Finance Discussion Paper Note, Board of Governors of the Federal Reserve System, Washington, DC.
Bernanke, B. 2018. “The Real Effects of Disrupted Credit. Evidence from the Global Financial Crisis.” Brookings Papers on Economic Activity, conference draft, September 13-14.
BIS (Bank for International Settlements). 2018a. Annual Economic Report. Basel: Bank for International Settlements.
BIS (Bank for International Settlements). 2018b. “Structural Changes in Banking After the Crisis.” CGFS Paper 60, Committee on the Global Financial System, Bank for International Settlements, Basel.
BIS (Bank for International Settlements). 2019a. BIS Quarterly Review: International Banking and Financial Market Development. March. Basel: Bank for International Settlements.
BIS (Bank for International Settlements). 2019b. Annual Economic Report. Basel: Bank for International Settlements.
Bräuning, F., and V. Ivashina. 2019. “U.S. Monetary Policy and Emerging Market Credit Cycles.” Journal of Monetary Economics. Advance online publication. https://doi.org/10.1016/j.jmoneco.2019.02.005.
Briault, C., E. Feyen, I. Gonzalez Del Mazo, J. Rademacher, B. Kwok Chung Yee, and I. Skamnelos. 2018. “Cross-Border Spillover Effects of the G20 Financial Regulatory Reforms:

CHAPTE R 4 203 A DECAD E AFT ER THE GLOB A L RECES S ION
Results from a Pilot Survey.” Policy Research Working Paper 8300, World Bank, Washington, DC.
Broto, C., J. Díaz-Cassou, and A. Erce. 2011. “Measuring and Explaining the Volatility of Capital Flows to Emerging Countries.” Journal of Banking & Finance 35 (8): 1941-53.
Bruno, V., and H. Shin. 2014. “Globalization of Corporate Risk Taking.” Journal of International Business Studies. 45 (7): 800-20.
Bruno, V., and H. Shin. 2018. “Currency Depreciation and Emerging Market Corporate Distress.” BIS Working Paper 753, Bank for International Settlements, Basel.
Cerutti, E., S. Claessens, and L. Laeven. 2017. “The Use and Effectiveness of Macroprudential Policies: New Evidence.” Journal of Financial Stability 28 (February): 203-24.
Cerutti, E., S. Claessens, and D. Puy. 2019. “Push Factors and Capital Flows to Emerging Markets: Why Knowing Your Lender Matters More Than Fundamentals.” Journal of International Economics 119 (C): 133-49.
Cerutti, E., S. Claessens, and L. Ratnovski. 2017. “Global Liquidity and Cross-Border Bank Flows.” Economic Policy 32 (89): 81-125.
Cerutti, E., G. Dell’Ariccia, and J. Dagher. 2017. “Housing Finance and Real Estate Booms: A Cross-country Perspective.” Journal of Housing Economics 38 (December): 1–13.
Cerutti, E., C. Koch, and S. Pradhan. 2018. “The Growing Footprint of EME Banks in the International Banking System.” In BIS Quarterly Review. December. Basel: Bank for International Settlements.
Cerutti, M., and H. Zhou. 2017. “The Global Banking Network in the Aftermath of the Crisis: Is There Evidence of De-globalization?” IMF Working Paper 17/232, International Monetary Fund, Washington, DC.
Cerutti, M., and H. Zhou. 2018. “The Global Banking Network: What Is Behind the Increasing Regionalization Trend?” IMF Working Paper 18/46, International Monetary Fund, Washington, DC.
Cetorelli, N., and L. Goldberg. 2011. “Global Banks and International Shock Transmission: Evidence from the Crisis.” IMF Economic Review 59 (1): 41-76.
CGD (Center for Global Development). 2019. Making Basel III Work for Emerging Markets and Developing Economies. A CGD Task Force Report. Washington, DC: Center for Global Development.
CGFS (Committee on the Global Financial System). 2019. “Establishing Viable Capital Markets.” CGFS Papers 62, Bank for International Settlements, Basel.
Chen, Q., A. Filardo, D. He, and F. Zhu. 2011. “International Spillovers of Central Bank Balance Sheet Policies.” BIS Working Papers 66, Bank for International Settlements, Basel.
Čihák, M., A. Demirgüç-Kunt, E. Feyen, and R. Levine. 2012. “Benchmarking Financial Systems around the World.” Policy Research Working Paper 6175, World Bank, Washington, DC.
Claessens, S. 2017. “Global Banking: Recent Developments and Insights from Research.” Review of Finance 21 (4): 1513-55.

204 CHAPTE R 4 A DECAD E AFT ER THE GLOB A L RECES S ION
Claessens, S., N. Coleman, and M. Donnelly. 2018. “Low-For-Long” Interest Rates and Banks’ Interest Margins and Profitability: Cross-Country Evidence.” Journal of Financial Intermediation 35 (A): 1-16.
Claessens, S., J. Frost, G. Turner, and F. Zhu. 2018. “Fintech Credit Markets Around the World: Size, Drivers and Policy Issues.” In BIS Quarterly Review. September. Basel: Bank for International Settlements.
Claessens, S., M. A. Kose, and M. Terrones. 2011. “How Do Business and Financial Cycles Interact?” IMF Working Paper 11/88, International Monetary Fund, Washington, DC.
Claessens, S., and N. van Horen. 2015. “The Impact of the Global Financial Crisis on Banking Globalization.” IMF Economic Review 63 (4): 868-918.
De Haas, R., Y. Korniyenko, E. Loukoianova, and A. Pivovarsky. 2012. “Foreign Banks and the Vienna Initiative: Turning Sinners into Saints?” IMF Working Paper 12/117, International Monetary Fund, Washington, DC.
Dollar, D. 2016. China’s Engagement with Africa: From Natural Resources to Human Resources. Washington, DC: Brookings Institution.
Duffie, D. 2019. “Prone to Fail: The Pre-Crisis Financial System.” Journal of Economic Perspective 33 (1): 81-106.
ECB (European Central Bank). 2018. “Strengthening the Global Financial Safety Net.” Occasional Paper Series 207, European Central Bank, Frankfurt, Germany.
Eggertsson, J., R. Juelsrud, L. Summers, and E. Wold. 2019. “Negative Nominal Interest Rates and the Bank Lending Channel.” NBER Working Paper 25416, National Bureau of Economic Research, Cambridge, MA.
Ehlers, T., S. Kong, and F. Zhu. 2018. “Mapping Shadow Banking in China: Structure and Dynamics.” BIS Working Paper 701, Bank for International Settlements, Basel.
Eichengreen, B., and P. Gupta. 2016. “Managing Sudden Stops.” Policy Research Working Paper 7639, World Bank, Washington, DC.
Elekdag, S., and Y. Wu. 2011. “Rapid Credit Growth: Boon or Boom-Bust?” IMF Working Paper 11/241, International Monetary Fund, Washington, DC.
Erikson, H., and D. Vestin. 2019. “Pass-through at Mildly Negative Policy Rates: The Swedish Case.” VoxEU.org, CEPR Policy Portal, January 22.
Feyen E., N. Fiess, I. Zuccardi Huertas, and L. Pillonca. 2017. “Which Emerging Markets and Developing Economies Face Corporate Balance Sheet Vulnerabilities? A Novel Monitoring Framework.” Policy Research Working Paper 8198, World Bank, Washington, DC.
Feyen E., S. Ghosh, K. Kibuuka, and S. Farazi. 2015. “Global Liquidity and External Bond Issuance in Emerging Markets and Developing Economies.” Policy Research Working Paper 7363, World Bank, Washington, DC.
Feyen E., and I. Gonzalez del Mazo. 2013. “European Bank Deleveraging and Global Credit Conditions: Implications of a Multi-Year Process on Long-Term Finance and Beyond.” Policy Research Working Paper 6388, World Bank, Washington, DC.
Feyen, E., R. Letelier, I. Love, S. Maimbo, and R. Rocha. 2014. “The Impact of Funding Models and Foreign Bank Ownership on Bank Credit Growth: Is Central and Eastern Europe Different?”

CHAPTE R 4 205 A DECAD E AFT ER THE GLOB A L RECES S ION
Policy Research Working Paper 6783, World Bank, Washington, DC.
Fratzscher, M. 2012. “Capital Flows, Push Versus Pull Factors and The Global Financial Crisis.” Journal of International Economics 88 (2): 341-56.
FSB (Financial Stability Board). 2017a. Assessment of Shadow Banking Activities, Risks and The Adequacy of Post-Crisis Policy Tools to Address Financial Stability Concerns. Basel: Financial Stability Board.
FSB (Financial Stability Board). 2017b. “Financial Stability Implications from FinTech: Supervisory and Regulatory Issues that Merit Authorities’ Attention.” Financial Stability Board, Basel.
FSB (Financial Stability Board). 2018a. Global Monitoring Report on Non-Bank Financial Intermediation 2018. Basel: Financial Stability Board.
FSB (Financial Stability Board). 2018b. Evaluation of the Effects of Financial Regulatory Reforms on Infrastructure Finance. Basel: Financial Stability Board.
Gagnon, J. 2016. “Quantitative Easing: An Underappreciated Success.” Policy Brief 16-4, Peterson Institute for International Economics, Washington, DC.
G20 (Group of 20). 2013. “Long-Term Investment Financing for Growth and Development: Umbrella Paper.”
G20 (Group of 20). 2018a. “Recent Development of Local Currency Bond Markets in Emerging Economies.” Staff Note, International Financial Architecture Working Group.
G20 (Group of 20). 2018b. “Making the Global Financial System Work for All.” Report of the G20 Eminent Persons Group on Global Financial Governance, October. https://www.global financialgovernance.org/assets/pdf/G20EPG-Full%20Report.pdf.
Gertler, M., and S. Gilchrist. 2018. “What Happened: Financial Factors in the Great Recession.” Journal of Economic Perspectives 32 (3): 3-30.
Goswami, M., and S. Sharma. 2011. “The Development of Local Debt Markets in Asia” IMF Working Paper 11/132, International Monetary Fund, Washington, DC.
Gurara, D., V. Klyuev, N. Mwase, A. Presbitero, X. Xu, and G. Bannister. 2017. “Trends and Challenges in Infrastructure Investment in Low-Income Developing Countries.” IMF Working Paper 17/233, International Monetary Fund, Washington, DC.
Hannan, S. 2018. “Revisiting the Determinants of Capital Flows to Emerging Markets-A Survey of the Evolving Literature.” IMF Working Paper 18/214, International Monetary Fund, Washington, DC.
Harding, D., and A. Pagan. 2002. “Dissecting the Cycle: A Methodological Investigation.” Journal of Monetary Economics 49 (2): 365-81.
Heider, F., F. Saidi, and G. Schepens. 2019. “Life below Zero: Bank Lending under Negative Policy Rates.” The Review of Financial Studies 32 (10): 3728-61.
Hofmann, B., I. Shim, and H. Shin. 2016. “Sovereign Yields and the Risk-Taking Channel of Currency Appreciation.” BIS Working Papers 538, Bank for International Settlements, Basel.
Hofmann, B., I. Shim, and H. Shin. 2019. “Bond Risk Premia and the Exchange Rate.” BIS Working Papers 775, Bank for International Settlements, Basel.

206 CHAPTE R 4 A DECAD E AFT ER THE GLOB A L RECES S ION
Igan, D., H. Moussawi, A. Tieman, A. Zdzienicka, G. Dell’Ariccia, and P. Mauro. 2019. “The Long Shadow of the Global Financial Crisis: Public Interventions in the Financial Sector.” IMF Working Paper 19/164, International Monetary Fund, Washington, DC.
IIF (International Institute of Finance). 2016. “EM Cross-border Bank Flow-New Patterns, New Vulnerabilities.” June. International Institute of Finance, Washington, DC.
IIF (International Institute of Finance). 2019a. “Capital Flows Report. The EM Positioning Overhang.” April. International Institute of Finance, Washington, DC.
IIF (International Institute of Finance). 2019b. “Nonfinancial Corporate Debt Database.” International Institute of Finance, Washington, DC. Database available at https://www.iif.com/.
IMF (International Monetary Fund). 2009. The Implications of the Global Financial Crisis for Low-Income Countries. Washington, DC: International Monetary Fund.
IMF (International Monetary Fund). 2010. Impact of the Global Financial Crisis on the Gulf Cooperation Council Countries and Challenges Ahead. Washington, DC: International Monetary Fund.
IMF (International Monetary Fund). 2014. Global Financial Stability Report: Risk Taking, Liquidity, and Shadow Banking. October. Washington, DC: International Monetary Fund.
IMF (International Monetary Fund). 2015a. Global Financial Stability Report: Vulnerabilities, Legacies, and Policy Challenges - Risks Rotating to Emerging Markets. October. Washington, DC: International Monetary Fund.
IMF (International Monetary Fund). 2015b. Global Financial Stability Report: Navigating Monetary Policy Challenges and Managing Risks. April. Washington, DC: International Monetary Fund.
IMF (International Monetary Fund). 2015c. Pan-African Banks: Opportunities and Challenges for Cross-Border Oversight. Washington, DC: International Monetary Fund.
IMF (International Monetary Fund). 2017. Financial Integration in Latin America: A New Strategy for a New Normal. Washington, DC: International Monetary Fund.
IMF (International Monetary Fund). 2018a. “Financial Sector Assessment Program (FSAP): Factsheet.” International Monetary Fund, Washington, DC.
IMF (International Monetary Fund). 2018b. Global Financial Stability Report. A Decade after the Global Financial Crisis: Are We Safer? Washington, DC: International Monetary Fund.
IMF (International Monetary Fund). 2019a. Global Financial Stability Reports. Vulnerabilities in a Maturing Credit Cycle. April. Washington, DC: International Monetary Fund.
IMF (International Monetary Fund). 2019b. Global Financial Stability Report: Lower for Longer. October. Washington, DC: International Monetary Fund.
IMF (International Monetary Fund). 2019c. Sub-Saharan Africa. Sub-Saharan Africa Regional Economic Outlook: Recovery Amid Elevated Uncertainty. Washington, DC: International Monetary Fund.
IMF (International Monetary Fund). 2019d. “People’s Republic of China Article IV Consultation Staff Report.” International Monetary Fund, Washington, DC.
IMF (International Monetary Fund) and World Bank. 2019. “Fintech: The Experience So Far.” IMF Policy Paper 19/024, International Monetary Fund and World Bank, Washington, DC.

CHAPTE R 4 207 A DECAD E AFT ER THE GLOB A L RECES S ION
Koepke, R. 2019. “What Drives Capital Flows to Emerging Markets? A Survey of The Empirical Literature.” Journal of Economic Surveys 33 (2): 516-40.
Laeven, L., and F. Valencia. 2018. “Systematic Banking Crises Revisited.” IMF Working Paper 18/206, International Monetary Fund, Washington, DC.
Loayza, N., A. Ouazad, and R. Ranciere. 2017. “Financial Development, Growth, and Crisis. Is There a Trade-Off?” Policy Research Working Paper 8237, World Bank, Washington, DC.
McCauley, R., A. Bénétrix, P. McGuire, and G. von Peter. 2017. “Financial Deglobalization in Banking?” BIS Working Paper 650, Bank for International Settlements, Basel.
Mendoza, E., and M. Terrones. 2008. “An Anatomy of Credit Booms: Evidence from Macro Aggregates and Micro Data.” NBER Working Paper 14049, National Bureau of Economic Research, Cambridge, MA.
Mendoza, E., and M. Terrones. 2012. “An Anatomy of Credit Booms and their Demise” NBER Working Paper 18379, National Bureau of Economic Research, Cambridge. MA.
Metrick, A., and J. Rhee. 2018. “Regulatory Reform.” Annual Review of Financial Economics 10 (November): 153-72.
Mian, A., A. Sufi, and E. Verner. 2017. “Household Debt and Business Cycles Worldwide.” The Quarterly Journal of Economics 132 (4): 1755-817.
Miyajima, K., and I. Shim. 2014. “Asset Managers in Emerging Market Economies.” BIS Quarterly Review (September): 19-34.
Molyneux, P., A. Reghezz, and R. Xie. 2019. “Bank Margins and Profits in a World of Negative Rates.” Journal of Banking and Finance 107 (October). Advance online publication. https://doi.org/10.1016/j.jbankfin.2019.105613.
Ohnsorge, F., and S. Yu. 2016. “Recent Credit Surge in Historical Context.” Policy Research Working Paper 7704, World Bank, Washington, DC.
Pagliari, M., and S. Hannan. 2017. “The Volatility of Capital Flows in Emerging Markets: Measures and Determinants.” IMF Working Paper 17/41, International Monetary Fund, Washington, DC.
Purfield, C., and C. Rosenberg. 2010. “Adjustment Under a Currency Peg : Estonia, Latvia and Lithuania During the Global Financial Crisis 2008-09.” IMF Working Paper 10/213, International Monetary Fund, Washington, DC.
Rodrik, D. 2015. “Back to Fundamentals in Emerging Markets.” Project Syndicate, August 13. https://www.project-syndicate.org/commentary/emerging-market-growth-by-dani-rodrik-2015-08.
Schaeck, K., and M. Čihák. 2012. “Banking Competition and Capital Ratios.” European Financial Management 18 (5): 836-66.
Stellinga, B. 2019. “The Open-Endedness of Macroprudential Policy - Endogenous Risks as an Obstacle to Countercyclical Financial Regulation.” Business and Politics (August), 1-28.
Suri, T., and W. Jack. 2016. “The Long-Run Poverty and Gender Impacts of Mobile Money.” Science 354 (6317): 1288-92.
Ulate Campos, M. 2019. “Going Negative at the Zero Lower Bound: The Effects of Negative Nominal Interest Rates.” Federal Reserve Bank of San Francisco Working Paper 2019-21.
208 CHAPTE R 4 A DECAD E AFT ER THE GLOB A L RECES S ION
Waller, C. J. 2016. “Negative Interest Rates: A Tax in Sheep’s Clothing.” On the Economy (blog), Federal Reserve Bank of St. Louis. May 2.
Wise C., L. Armijo, and S. Katada, eds. 2015. Unexpected Outcomes: How Emerging Economies Survived the Global Financial Crisis. Washington, DC: Brookings Institution Press.
World Bank. 2012. Global Financial Development Report 2013: Rethinking the Role of the State in Finance. Washington, DC: World Bank.
World Bank. 2014. Global Financial Development Report 2014: Financial Inclusion. Washington, DC: World Bank.
World Bank. 2015. Global Financial Development Report 2015/2016: Long-Term Finance. Washington, DC: World Bank.
World Bank. 2016. Global Economic Prospects: Divergences and Risks. June. Washington, DC: World Bank.
World Bank. 2018a. Global Economic Prospects: The Turning of the Tide? June. Washington, DC: World Bank.
World Bank. 2018b. Global Financial Development Report 2017/2018: Bankers Without Borders. Washington, DC: World Bank..
World Bank. 2018c. Global Economic Prospects: Broad-Based Upturn, but for How Long? January. Washington, DC: World Bank.
World Bank. 2018d. The Global Findex Database 2017: Measuring Financial Inclusion and the Fintech Revolution. Washington, DC: World Bank.
World Bank. 2018e. Contribution of Institutional Investors Private Investment in Infrastructure 2011-H1 2017. Washington, DC: World Bank.
World Bank. 2019a. Global Economic Prospects: Heightened Tensions, Subdued Investments. June. Washington, DC: World Bank.
World Bank. 2019b. Global Economic Prospects: Darkening Skies. January. Washington, DC: World Bank.
World Bank. 2019c. Global Financial Development Report 2019/2020: Bank Regulation and Supervision a Decade after the Global Financial Crisis. Washington, DC: World Bank.
Copyright © 2022 FDOKUMEN