Labour market participation of ageing workers. Micro-financial incentives and policy considerations
81
DNB Occasional Studies Occasional Studies Vol.3/Nr.1 (2005) Labour market participation of ageing workers Micro-financial incentives and policy considerations W. Allard Bruinshoofd en Sybille G. Grob
-
Upload
independent -
Category
Documents
-
view
2 -
download
0
Transcript of Labour market participation of ageing workers. Micro-financial incentives and policy considerations

DN
B O
cc
asi
on
al
St
ud
ies
Occasiona l S t ud ie sVol.3/Nr.1 (2005)
Labour market pa r t ic ipat ion
of age ing workers
Mic ro - f inanc ia l incent ives and
pol ic y considerat ions
W. Allard Bruinshoofd en Sybil l e G. Grob

Occasiona l S t ud ie sVol.3/Nr.1 (2005)
Labour market pa r t ic ipat ion
of age ing workers
Mic ro - f inanc ia l incent ives and
pol ic y considerat ions
W. Allard Bruinshoofd en Sybil l e G. Grob
De Nederlandsche Bank

©2005 De Nederlandsche Bank nv
Authors: W. Allard Bruinshoofd en Sybille G. Grobe-mail: [email protected] en [email protected]
Aim and scope of dnb Occasional Studies are to disseminate thinking on relevant national andinternational policy discussions and analysis.Views expressed are those of the individual authors and do not necessarily reflect official positions ofDe Nederlandsche Bank.
Editorial CommitteeLex Hoogduin (chairman), Eelco van den Berg (secretary), Hans Brits, Maria Demertzis, MaartenGelderman, Klaas Knot, Bram Scholten, Job Swank.
All rights reserved. No part of this publication may be reproduced, stored in a retrieval system, ortransmitted in any form by any means, electronic, mechanical, photocopy, recording or otherwise,without the prior written permission of the Nederlandsche Bank.
Subscription orders for dnb Occasional Studies and requests for specimen copies should be sent to:
De Nederlandsche Bank nvCommunication Departmentp.o. Box 981000 ab AmsterdamThe NetherlandsInternet: www.dnb.nl

Labour market participation of ageing workersMicro-financial incentives and policy considerations
W. Allard Bruinshoofd*Sybille G. Grob*
SummaryThe Netherlands is ageing. The proportion of Dutch citizens aged 65 or older,expressed as a percentage of all Dutch residents in the 20-65 age bracket – the so-termed grey burden – currently stands at about 22. Expectations are that this num-ber will at least double in the next few decades. This study focuses on the issue ofhow to increase the labour supply of older Dutch workers as a means to absorb thegrowing grey burden. Of key importance is whether changes in the design of pen-sion provisions will induce people to work longer. The main results are summarisedas follows. In the first place, we demonstrate that for the Netherlands much is to begained in terms of economic growth from the stimulation of labour marketparticipation by ageing workers. Subsequently, in an international comparison ofthe institutional design of old-age pensions we show that financial incentives playan important role in labour market participation of older workers. This outcome iscorroborated by a survey that we conducted among Dutch households: a largeproportion of the Dutch population is sensitive to (financial) stimuli to work longer.In pension provisions, these stimuli may be effected through the level of the even-tual (early) retirement pension benefits and the number of years over which a fullpension can be accrued. In addition, the survey results demonstrate that the actualmoment of retirement is highly dependent on whether or not the level of thepension benefit varies with it. Finally, a large share of the Dutch proves willing toparticipate in the labour process longer if they can do so on a part-time basis.
* De Nederlandsche Bank – Research Division. E-mail: W.A. [email protected]; S.G. [email protected]
We are grateful to Jan-Marc Berk, Peter van Els, Ralph de Haas, Lex Hoogduin, Jessica du Marchie Sarvaas,Maarten van Rooij, Corrie Vis and Jasper de Winter for their comments and advice regarding thequestionnaire and/or previous versions of this document. The remaining errors should be attributed tous alone. The opinions set out in this study do not necessarily reflect those of De Nederlandsche Bankor the European System of Central Banks.
3

Table of contents
1. Introduction and conclusion 7
2. A greying population: demographic trends, labour supply and fiscal sustain-ability in a comparative perspective 11
2.1 Introduction 112.2 Demographic developments and their consequences for public finance 122.3 The effective age of retirement since the 1970s 142.4 Developments of labour participation in a comparative perspective 162.5 The economic benefit of increased participation of older workers 19 2.6 Summary and conclusion 21
3 Institutional differences between old-age pension systems and theirimplications 24
3.1. Introduction 243.2. Theoretical background 243.3 De institutional design of regular old-age pension systems in seven
countries 263.3.1 Definitions 263.3.2 Germany 283.3.3 France 283.3.4 Italy 293.3.5 The Netherlands 293.3.6 United Kingdom 303.3.7 United States 303.3.8 Sweden 313.4 Early retirement incentives compared 323.5 Summary and conclusions 38
4 Dutch retirement decisions: the role of financial considerations 404.1 Introduction 404.2 Background 414.3 Empirical analysis 424.4 Retirement decisions 444.4.1 The importance of the retirement decision 444.4.2 Expected retirement age 45
5
Labour market participation of ageing workers

4.5 Incentives for working longer 464.5.1 Classifying preferences 464.5.2 Working beyond one’s 65th birthday 484.5.3 Higher net wages for older workers 494.6 A higher pension benefit for delaying retirement 504.6.1. Intertemporal substitution 514.6.2 The wealth effect 554.6.3 Robustness: preferences revealed 574.7 Summary and conclusions 60
5 Summary and policy considerations 715.1 Labour market participation of ageing workers 715.2 Micro-financial incentives 725.3 Policy considerations 73
Appendix 4.1. Construction of pension knowledge, impatience and risk tolerance 62
Appendix 4.2. Preparedness to continue working before 65 and from 65 onwards 69
References 74
6

1 Introduction and conclusion
The Netherlands is ageing. The number of Dutch citizens aged 65 and over,expressed as a percentage of all Dutch residents in the 20-65 age bracket – the so-termed grey burden – currently stands at about 22. In the four long-term scenariosrecently published by the cpb, the Netherlands Bureau for Economic Policy Analy-sis, the grey burden will mount to over 40 in the most favourable scenario, and toas much as over 50 in the most unfavourable case (Huizinga and Smid, 2004). In oth-er words, in the long term, the grey burden in the Netherlands will at least double.
The greying population issue concentrates on the costs attendant on the increas-ing grey burden by way of a rising demand for healthcare provisions and a risingnumber of claims on regular old-age pension benefits as well as on the related sus-tainability of public finance (e.g. Van Ewijk et al., 2000) and the pension system’sshock resistance (e.g., Westerhout et al., 2004). Key to the greying population issueis how a declining population can continue to produce the pie (i.e. the gross domes-tic product or gdp) required to feed a growing number of mouths. Herein lie theprincipal fields of tension of, as well as the solutions to, the issue at hand. A firstsolution presents itself by way of a smaller piece of the pie for each and everyone.However, this has a discouraging effect on people’s willingness to pull their weightin producing the pie, as their effort will be less well rewarded. An alternative wouldtherefore be to give only the non-producing consumers a smaller piece of the pie,thus ensuring that the producing part of the population need not be the worse forit. This solution in turn conflicts with the solidarity principle. The only solutionholding up is to strive for a greater pie, e.g. by increasing the productivity of the piemakers. In the recent past factor productivity in the Netherlands proved to be aphenomenon hard to grasp so there are no clear policy measures at hand to increaseit (e.g. Van Leeuwen and Van der Wiel, 2003). This study will therefore explore thefeasibility of an alternative way to increase the pie, viz. getting people more inten-sively involved in its production.
In Table 1.1., we have abandoned the analogy with the pie in order to look at thecontribution of the factor labour to the production of the Dutch income, compar-ing this with it’s contribution in the large euro countries (Germany, France, Italy),two Anglo-Saxon economies (the us and the uk) and Sweden (as an example of a‘functioning welfare state’). From this table it can be inferred that, in an internation-al comparison, the Netherlands scores well as regards the proportion of the popula-tion participating in the labour process or available to do so. At 76%, in the Nether-lands gross labour participation of the 15-64 age bracket is similar to the levels
7
Labour market participation of ageing workers

recorded in the Anglo-Saxon countries, and only (slightly) surpassed by Sweden.Also if gross labour participation is considered separately for men and women, theNetherlands scores well. In terms of male labour participation, the Netherlands eventakes the lead, together with the uk, at 84%. And where female labour participationis concerned, it is only amply exceeded by Sweden and, to a lesser degree, by theAnglo-Saxon countries. Besides, it is broadly expected that the total Dutch femalelabour supply will increase due to the so-termed cohort effect, since the labour par-ticipation rate of younger generations of women equals that of their male contem-poraries. As the emancipated generation shifts through the population pyramid, tak-ing the place of senior (housekeeping) women, the average participation of womenin the 15-64 age bracket will automatically rise. This makes the female participationincrease a highly autonomous process.
From the table it can also be read that, at 1354 hours, Dutch employees work thelowest number of hours per year of all the countries in the comparison. In Germanyand France, the average number of hours worked per employee is 7% higher, inSweden 16% higher, and in Italy 18%. The contrast is strongest with the Anglo-Saxon countries, for in the uk and the us the numbers of hours worked per yearaverage out at 24% and 32%, respectively, more than in the Netherlands. Therelatively low number of hours worked per year is largely explained by the high per-centage of part-time jobs, i.e. about 33% in all. In no other country do so many peo-ple work on a part-time basis. Even so, this observation does not immediately implythat a wealth-enhancing solution to the ageing population issue is achieved by low-ering the part-time factor. Euwals and Hogerbrugge (2004), for example, see indica-tions that the high percentage of part-time jobs and the corresponding low number
Table 1.1 International comparison of the labour supply structure in 2003
Netherlands
Germany
France
Italy
Sweden
United Kingdom
United States
Gross labour participation of the 15-64 age bracket
Ditto of55-64 agebracker
Total
45.043.139.531.572.557.562.4
Percent-age ofpart-timejobs1
33.918.813.711.913.823.013.1
1 Fewer than 30 hours per week.Source: oecd (2004).
Numberof hoursworkedper year
1354
1446
1453
1591
1564
1673
1792
Total
75.971.369.561.678.976.675.8
Men
83.778.075.5
74.880.883.982.2
Woman
67.964.563.748.376.969.269.7
8

of hours worked is mainly the corollary of Dutch employees’ preferences.1 Howev-er, there are also indications that institutional obstacles play a role in the high per-centage of part-time jobs (De Nederlandsche Bank, 2005).
From Table 1.1, finally, it can be read that labour participation in the Netherlandsby citizens aged 55 and over is more than thirty percentage points below that of thetotal labour force. With this score, the Netherlands performs as poorly as the threelarge euro countries and well below the labour rates recorded for the age group inquestion in the Anglo-Saxon countries and Sweden. Duval (2003) demonstrates forthe oecd countries a strong correlation between the level of the financial incentivesto retire early and the labour participation rate of older workers. Thus viewed, thelow figures for the countries presented in this context in Table 1.1 may be attributedto the financial incentives in the pension provisions rather than to preferences. Thisstudy will therefore focus on the issue of how to increase the labour supply of Dutchworkers of 55 and over. Central to this issue is the question whether such changes tothe design of pension provisions are conceivable as will induce people to opt forextending their participation in the labour process.
To serve this issue, the present study is built up as follows. Chapter 2 deals atlength with the participation of senior citizens in an international comparativeperspective. It also projects, on the basis of demographic trends and insightful model simulations, what the economic effects might be of a higher labour partici-pation rate of the 55-plus bracket of the population. Chapter 3 addresses the institu-tional design of old-age pension provisions, again, in an international comparativeperspective. Central to that chapter is the question whether there is a correlationbetween differences in this institutional design and differences in labour participa-tion rates perceived between countries. In Chapter 4, the study turns its focus exclu-sively to the Netherlands, showing, on the basis of a survey among Dutch house-holds, how strongly the labour participation rate responds to hypothetical changesin the design of the old-age pension system. Chapter 5, finally, contains a summaryof the previous chapters and conclusions.
We arrive at the conclusion that the Netherlands does have an ageing populationproblem but, compared to its neighbouring countries, not to an excessive degree. Inthe three large euro countries, Germany, France and Italy, this problem is of a muchlarger magnitude as in those countries major demographic shifts, the low labourparticipation by the 55-plus and the pay-as-you-go pension system go hand in hand.On the other end of the spectrum are the United States, the United Kingdom andSweden. While these countries, too, are faced with a greying population, they havebeen more successful in keeping the 55-plus component of their population in thelabour force.
In an international comparison of pension systems, we find indications that thedesign of the pension system proper may be of influence on labour participation bythe 55-plus. Bearing in mind that the analysis is merely tentative, we have been ableto record that the nature and size of the financial incentives provided for by the sys-tem are related to the labour participation rate of citizens aged 55 and over.
9
Labour market participation of ageing workers

This conclusion is corroborated by the survey results for the Netherlands. In thissurvey, three out of every five Dutch citizens stated they could be motivated intoworking longer. A policy stimulating continued labour participation by seniorworkers on a part-time basis appears to be the most effective way to keep the saidcategory longer on the workforce. We demonstrate that, under such circumstances,employees are willing to continue working for another eighteen months on average.In addition, for most people it holds that, given the right financial stimuli, they canbe induced to stay active for a longer time on the labour market. The survey resultsshow that people are willing to work longer provided they are financially compen-sated in the short term. Besides, in the (early)retirement provisions, financial stim-uli may also be reflected in the benefit level as well as in the degree of flexibility ofthe actual retirement decision and the benefit level linked to it. A retrenchment ofthe pension rights to the effect that labour participation must be extended by onemore year in order for maximum pension benefits to be built up will induce employ-ees to postpone their retirement by six months on average. If, in addition, the annu-al pension benefit rises by six per cent for each additional year worked, employeeswill be willing to put off their retirement by another period of just under six monthson average. In other words, it would seem that by observance of this reward princi-ple in pension schemes much is to be gained by way of higher labour participationof older workers, while these financial stimuli may also be offered cost-effectively inactuarial terms and even some room remains to safeguard a measure of solidarityamong the generations.
The generosity of the benefits in many early retirement schemes largely dependson the tax-friendly accrual of the early pension capital. The results of this studyindicate that the positive effects of cuts in early retirement provisions – e.g. achievedthrough abolition of this tax facility – on labour participation may be considerable.
10

2 A greying population: demographic trends,labour supply and fiscal sustainability in acomparative perspective
2.1 Introduction
The first national, compulsory insurance against loss of income was instituted inGermany, under the Bismarck regime. Bismarck was aware that, to build up oneGerman nation, the industrial labour class had to be bound to the state. In the 1880s,this insight resulted in a statutory health care insurance, an accident insurance anda disability insurance. In the course of time, the structures of these insurances haveserved as examples to many a country (De Swaan, 1996).
Bismarck’s disability insurance may be regarded as predecessor of the statutoryold-age pension as well as the labour disability benefits. Bismarck’s disability insur-ance provided a fully disabled labourer with a benefit amounting to two-thirds of hiswages, at a minimum of five contribution years. In addition, the Act provided forentitlement to an old-age pension on reaching the age of 70 years (and after a mini-mum of thirty contribution years). This considered, old age was regarded as a formof disability. Indeed, in those days, it was highly likely that a septuagenarian labour-er was unable to support himself owing to infirmities attendant on advanced age.Under the Act, a widow received 20% of her late husband’s wages. By the turn of thecentury, male life expectancy in Germany (excl. infant mortality) had risen to slight-ly over 55 years. At the time, only 8% of the German population was older than 60(Bundesinstitut für Bevölkerungsforschung, 2003). Obviously, this demographicstructure held the costs entailed by the Act under control. However, life expectancyhas increased considerably since those days. In 2003, life expectancy of Germanmales and females was 74 and 80, respectively, while at 76 and 81, respectively, thisrate is even higher for Dutch males and females. The Central Bureau of Statisticsexpects that by 2050 these figures will have risen further by another three years formales and another eighteen months for females.
In other words: the Dutch population is growing older and older. This processplaces the affordability of the pension benefits under pressure. But the Netherlandsis not the only country facing the issue of an ageing population. To gain insight inthe gravity of this problem, we place the developments in the Netherlands in acomparative perspective. In the following paragraphs of this chapter we shall firstlook at the demographic developments projected for the coming fifty years and theirimplications for public finance. Subsequently, we shall dwell on the trend toadvance the age of retirement and the implied extension of the pension benefitperiod. And, subsequently, since the number of active labour participants eventual-
11
Labour market participation of ageing workers

ly forms the basis for the affordability of the increasing pension burden, we shall dealwith the development of the labour participation rate in the recent past, in particu-lar that of older workers. In the final section, this chapter provides an indicationbased on model simulations of the economic advantage that may be realised if apolicy change succeeded in inducing a greater part of the 55-plus bracket of thepopulation to work longer, and winds up with a summary and conclusions.
2.2 Demographic developments and their consequences for public finance
The ageing population issue arises from the increasing number of elderly citizens,with, moreover, an increasing life expectancy. In addition, in many countries thebirth rate is declining. As a result, the rising burden of the greying population willneed to be shouldered by a stagnant, if not shrinking, active labour population. Atpresent, the grey burden in the Netherlands is 22 to 100, which, compared to othercountries, is not exceptionally high. For example, at 24 old-age pensioners to 100 eco-nomically active citizens, the oecd average exceeds the Dutch average (see Table 2.1).Of the countries considered by us in our comparison, the Netherlands even turnsout to have the least aged population, together with the United States. In Italy andSweden, already about 29 senior citizens must be supported by 100 active workers.
The second column of Table 2.1 shows the increases in the ratio of the 65-pluspopulation to the labour force for the coming 50 years as projected by the oecd. Asis clear from these figures, the expected rise of the grey burden is anything but anexclusively Dutch problem. For the Netherlands, the oecd assumes that the greypressure will double to 45 senior citizens per 100 workers. This projection, too, is wellbelow the average for the oecd countries, i.e. almost 50 senior citizens to 100 eco-nomically active citizens. The projected increase in the percentage of the 65-pluspopulation may be called moderate in comparison with, e.g., Italy, where in fiftyyears’ time the ratio will have risen to as many as 67 senior citizens to 100 econom-ically active citizens. Column 3 shows that in 2050, also the average age of the labourforce will be higher than it is now. By then, in the Netherlands the share of the 55-plus age group in the total labour force will be 5.2% higher; an increase that is closeto the average for all oecd countries together.
The public finance component absorbed by old-age pensions in 2000 is reflect-ed by column 4, and the corresponding costs increase projected by the oecd for thecoming 50 years in columns 5 and 6. Here, a distinction is made between the addi-tional costs arising from (exogenous) demographic developments (column 5) and theassumed cost savings as a result of policy measures (column 6). For the correct inter-pretation of the figures, we emphasize that the costs and projections reflected hereonly relate to the old-age pension. The figures presented therefore do not provide acomplete survey of the consequences of the greying population for the publicbudget. First, the possible effects of early retirement arrangements on the public bud-
12
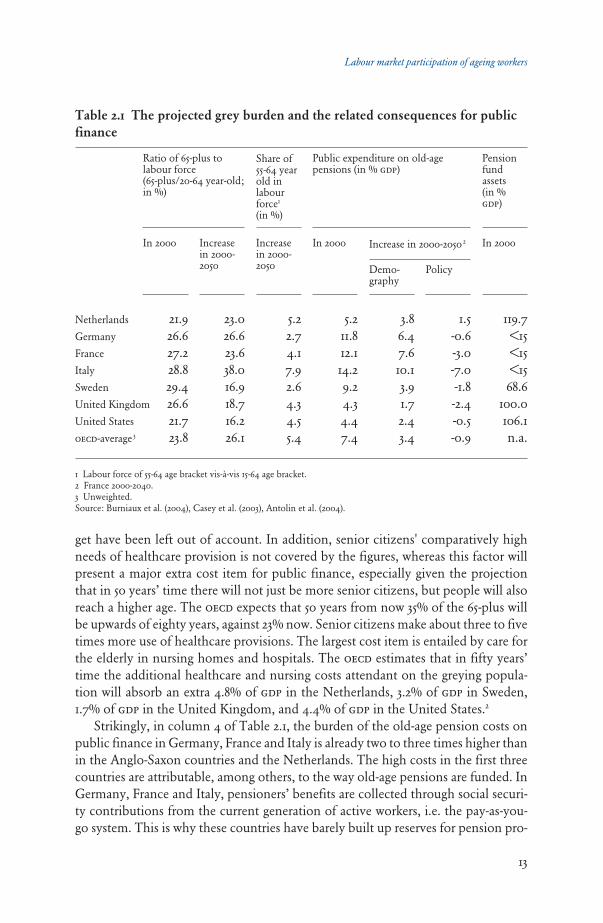
get have been left out of account. In addition, senior citizens' comparatively highneeds of healthcare provision is not covered by the figures, whereas this factor willpresent a major extra cost item for public finance, especially given the projectionthat in 50 years’ time there will not just be more senior citizens, but people will alsoreach a higher age. The oecd expects that 50 years from now 35% of the 65-plus willbe upwards of eighty years, against 23% now. Senior citizens make about three to fivetimes more use of healthcare provisions. The largest cost item is entailed by care forthe elderly in nursing homes and hospitals. The oecd estimates that in fifty years’time the additional healthcare and nursing costs attendant on the greying popula-tion will absorb an extra 4.8% of gdp in the Netherlands, 3.2% of gdp in Sweden,1.7% of gdp in the United Kingdom, and 4.4% of gdp in the United States.2
Strikingly, in column 4 of Table 2.1, the burden of the old-age pension costs onpublic finance in Germany, France and Italy is already two to three times higher thanin the Anglo-Saxon countries and the Netherlands. The high costs in the first threecountries are attributable, among others, to the way old-age pensions are funded. InGermany, France and Italy, pensioners’ benefits are collected through social securi-ty contributions from the current generation of active workers, i.e. the pay-as-you-go system. This is why these countries have barely built up reserves for pension pro-
13
Labour market participation of ageing workers
Table 2.1 The projected grey burden and the related consequences for public
finance
In 2000
119.7<15<15<1568.6
100.0106.1 n.a.
Increasein 2000-2050
5.22.74.17.92.64.34.5 5.4
Increasein 2000-2050
23.026.623.638.016.918.716.2 26.1
In 2000
5.211.812.114.29.24.34.4 7.4
Demo-graphy
3.86.47.610.13.91.72.4 3.4
Policy
1.5-0.6-3.0-7.0-1.8-2.4-0.5 -0.9
Pensionfundassets(in %gdp)
In 2000
21.926.627.228.829.426.621.7 23.8
Increase in 2000-20502
1 Labour force of 55-64 age bracket vis-à-vis 15-64 age bracket.2 France 2000-2040.3 Unweighted.Source: Burniaux et al. (2004), Casey et al. (2003), Antolin et al. (2004).
Netherlands
Germany
France
Italy
Sweden
United Kingdom
United States
oecd-average 3
Ratio of 65-plus tolabour force (65-plus/20-64 year-old;in %)
Share of55-64 yearold inlabourforce1
(in %)
Public expenditure on old-agepensions (in % gdp)

visions (see column 7). The projected negative effect of the demographic shift on thegovernment budget in these countries is also the most pronounced (see column 5).This is attributable, on the one hand, to the population ageing rates in these coun-tries being higher than anywhere else and, on the other hand, to the funding system.In an ageing society, a pay-as-you-go system comes under increasing pressure as a ris-ing number of citizens must be supported by a stagnant, if not shrinking labourforce. For lack of reserves, extra benefits can only be provided if the contributionslevied are raised correspondingly. Unlike these countries, the Anglo-Saxon countriesand the Netherlands have built up vast pension reserves through saving. In thesecountries, the basic (minimum) pension benefit is the only pension componentraised via a pay-as-you-go system of contributions levied by the state. The supple-mentary pension is capital-funded. This considerably reduces the effects of the age-ing population on the public budget 3. Sweden takes a middle position4.
The figure in column 6 reflects the combined (policy) effect of the change in thenumber of pensioners and the change in the level of the benefit. This column alsoincorporates the effect of the increase in the number of individual pension rights asa result of the rise in female labour participation. Several countries have seen a num-ber of far-reaching pension reforms affecting both the future number of pensionersand the level of the future benefits. Cases in point are Sweden and Italy, which haveadopted the Notional Defined Contribution system (see Chapter 3). In Italy, in par-ticular, this will make for substantial savings as it will compensate for about 70% ofthe cost increase arising from the demographic development.
2.3 The effective age of retirement since the 1970s
Although in most countries the statutory age of retirement is 65 5, the effective age ofretirement proves much lower. As a consequence of this phenomenon – besides theautonomous rise in life expectancy – (early) pensioners draw benefits over an increas-ingly longer period of time. In a comparative survey, Table 2.2 shows where theNetherlands stands in the development of the effective age of retirement and lifeexpectancy at retirement.
At 61.6 years, the average effective age of retirement in the Netherlands is one totwo years above that in Germany, France and Italy, but two to three years below thatin Sweden and the United States. The average effective retirement age is about ashigh as it was thirty years ago (compare columns 1 and 2). However, these figures hidethe marked swing in the effective retirement age that the Netherlands has seen in thepast thirty years. Starting in the early 1970s, the age of retirement steadily declinedto an absolute low of 58.7 years between 1980 and 1985, and has gradually risen since,so that today we are back to where we were thirty years ago.
How to account for this fluctuation? In the past, early retirement was oftenrealised through the ‘vut’ (early retirement) arrangement based on a pay-as-you-gofunding mechanism. After a somewhat hesitant start, in the early 1980s the vut
14
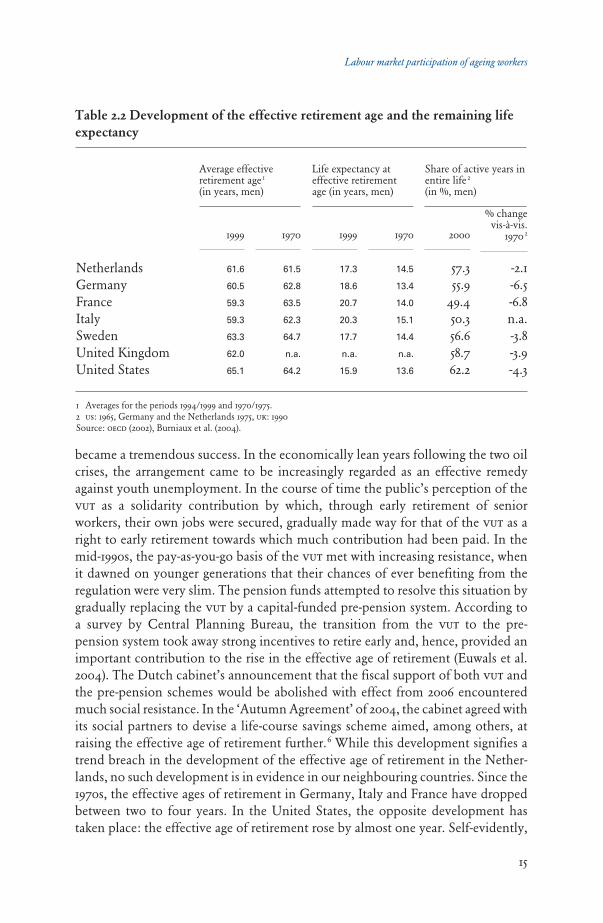
became a tremendous success. In the economically lean years following the two oilcrises, the arrangement came to be increasingly regarded as an effective remedyagainst youth unemployment. In the course of time the public’s perception of thevut as a solidarity contribution by which, through early retirement of seniorworkers, their own jobs were secured, gradually made way for that of the vut as aright to early retirement towards which much contribution had been paid. In themid-1990s, the pay-as-you-go basis of the vut met with increasing resistance, whenit dawned on younger generations that their chances of ever benefiting from theregulation were very slim. The pension funds attempted to resolve this situation bygradually replacing the vut by a capital-funded pre-pension system. According toa survey by Central Planning Bureau, the transition from the vut to the pre-pension system took away strong incentives to retire early and, hence, provided animportant contribution to the rise in the effective age of retirement (Euwals et al.2004). The Dutch cabinet’s announcement that the fiscal support of both vut andthe pre-pension schemes would be abolished with effect from 2006 encounteredmuch social resistance. In the ‘Autumn Agreement’ of 2004, the cabinet agreed withits social partners to devise a life-course savings scheme aimed, among others, atraising the effective age of retirement further.6 While this development signifies atrend breach in the development of the effective age of retirement in the Nether-lands, no such development is in evidence in our neighbouring countries. Since the1970s, the effective ages of retirement in Germany, Italy and France have droppedbetween two to four years. In the United States, the opposite development hastaken place: the effective age of retirement rose by almost one year. Self-evidently,
15
Labour market participation of ageing workers
Table 2.2 Development of the effective retirement age and the remaining life
expectancy
NetherlandsGermanyFranceItalySwedenUnited KingdomUnited States
1999
17.3
18.6
20.7
20.3
17.7
n.a.
15.9
1970
61.5
62.8
63.5
62.3
64.7
n.a.
64.2
1970
14.5
13.4
14.0
15.1
14.4
n.a.
13.6
2000
57.355.9
49.450.356.658.762.2
% changevis-à-vis.
19702
-2.1-6.5-6.8n.a.-3.8-3.9-4.3
Average effectiveretirement age 1
(in years, men)
Life expectancy ateffective retirementage (in years, men)
Share of active years inentire life 2
(in %, men)
1 Averages for the periods 1994/1999 and 1970/1975.2 us: 1965, Germany and the Netherlands 1975, uk: 1990Source: oecd (2002), Burniaux et al. (2004).
1999
61.6
60.5
59.3
59.3
63.3
62.0
65.1

lowering the effective age of retirement immediately amounts to extending the peri-od of entitlement to pension benefits (see Table 2.2, columns 3 and 4). In France,the average period of pension entitlement has increased approximately 50 per centover the past thirty years; in Italy and Germany between 30 and 40 per cent. Theincreases in the periods of pension benefit entitlement in the Netherlands and theUnited States by less than 20 per cent seem moderate by comparison. Indeed, theincreases recorded in these two countries mainly reflect the autonomous rises in lifeexpectancy. In the last two columns of Table 2.2, we see the development outlinedabove reflected in a different form. In France and Italy men participate only halftheir lives in the labour force. American males, by contrast spend 62% of their livesworking. The other countries, the Netherlands included, take positions betweenthese extremes.
2.4 Developments of labour participation in a comparative perspective
In view of the imminent ageing of the population it is therefore desirable that thelabour force is kept as large as possible. To be able to support the grey burden, indus-trialised countries simply cannot afford to send large numbers of older but produc-tive and healthy citizens on retirement, the more so since in the years ahead anincreasing proportion of the labour force will be made up of the 55-plus. 7
Chart 2.1 reflects the development of gross labour participation in the Nether-lands in a comparative perspective with the United States, the European Union andSweden. The upper part shows the development of labour participation of all citi-zens in the 15-64 age bracket; the lower part shows the development of the participa-tion of the 55-plus. 7
Until the early 1990s, labour participation of Dutch residents in the 15-64 agebracket fluctuated around the eu average. From then onwards, the participation raterose rapidly, reaching the level recorded in the United States (76%). Strikingly, in theUnited States and Sweden it was, and still is, far more common practice not to retireearly than in the European Union or the Netherlands. Across the period, the partic-ipation rates of older workers in the United States and Sweden are substantially high-er. The second noticeable development is that of labour participation of the 55-plus,which from the late 1970s onwards falls (far) below the eu average. The low point isreached around the 1990s, when labour participation was a mere 30%. Since then, itwent up again, returning to the eu average of 45% in 2003.
While not differing all that much, the 2003 and 1970 figures for the participationrates of the 55-plus in the European Union and the Netherlands are indicative ofdifferent developments for men and women. In Table 2.3, these differences areworked out further with the aid of separate participation rates for men and womenfor three sample years.
16

17
Labour market participation of ageing workers
Chart 2.1 Development of the gross participation rate from 1970 to 2003
Chart 2.1a 15-64 year-old
75 80 85 90 95 0070
us eu15 Sweden Netherlands
0
10
20
30
40
50
60
70
80
90
0
10
20
30
40
50
60
70
80
70 75 80 85 90 95 00
us eu15 Sweden Netherlands
Source: oecd (2004) and in-house calculations.
Source: oecd (2004) and in-house calculations.
Chart 2.1b 55-64 year-old

From the table it appears that total gross labour participation in the Netherlandshas increased by 13.5 percentage points since 1971. Most of this increase was notrealised until after 1990. The rise in paid labour participation is mostly accounted forby women. Indeed, while being still 16 percentage points below its male counterpart,over the past thirty years female participation almost doubled. Bear in mindhowever, that full-time and part-time jobs are assigned the same weight in Table 2.3,whereas in the Netherlands part-time jobs are primarily held by women (60%women, against 15% men). While, on the one hand, female participation shows asharp rise across the period, the level of male participation in 1990, on the otherhand, was 9 percentage points below that in 1971. The male participation rate,although higher again in 2003, is still below the 1971 level.
From Table 2.3 it also appears that the male participation rate movements for allage brackets are largely accounted for by changes in the participation rate of men inthe 55-64 age bracket. While, in 1971, the participation rate of males aged 55 and overis barely lower than that of males in all age groups combined, 1990 presents analtogether different picture. In that year, the participation rate of this group declinedto almost 46%. Since 1990, labour participation of males in the 55-plus category hasrecovered. It is still below the 1971 level, though, by almost one third. Unlike that ofolder males, participation of older females was low in 1971. Back then, only one in fivewomen held a paid job. It appears that, in 1990, participation of women fell, just asthat of men but not to the same extent. From 1990 upwards, participation of womenaged 55 and over gained momentum. In 2003, almost one in every three women in thisage category held a paid job. This phenomenon can be partially accounted for by theso-termed cohort effect: the autonomous increase in labour supply as emancipatedworking women advance in age and take the place of housewives in the statistics.
18
Table 2.3 Breakdown of labour participation by gender for the Netherlands
and the eu-15
Percentages
Netherlands- Total (15-64 year-old)- 55-64 year-old
European Union- Total (15-64 year-old)- 55-64 year-old
1971
62.450.3
59.846.1
1990
66.730.8
67.541.6
2003
83.757.9
78.654.6
1990
80.045.7
80.157.3
1971
89.084.6
80.869.2
Total Male Female
Source: oecd (2004) and in-house calculations.
2003
75.945.0
70.244.1
2003
67.931.9
61.633.9
1970
53.116.7
54.827.0
1971
35.319.4
39.626.9

While, since 1990, total labour participation of the 55-plus in the Netherlands hasgrown by 14 percentage points, it is still below the 1971 level. A recovery of the par-ticipation rate of men aged 55 and over to the 1971 level may present a significantimprovement. It is expected that the cohort effect will yet lead to a further increasein senior female labour participation for some time to come.
At the European level, total labour participation increased by 10.4 percentagepoints between 1971 and 2003. Here, too, the rise in female participation is aconsiderable contributing factor, be it that compared to the Netherlands, theincrease is less pronounced. Where female labour participation is concerned, theNetherlands has partially made up the arrears. In 1971, the female participation rateaverage for Europe was above that for the Netherlands, whereas in 2003, this situa-tion reversed. The male participation rate in the European Union shows a slightdecline between 1971 and 2003. Unlike the situation in the Netherlands, however, themale participation rate in the European Union as a whole shows no improvementsince the 1990s.
Also at the European level, changes in the participation rate of the 55-plus to alarge extent account for the movements in the participation rates of the entire labourforce. Just as in the Netherlands, senior female participation in the European Unionas a whole started to rise in 1990, but at a much lower rate than in the Netherlands.The level of participation in the European Union in 1990 was higher, though, thanin the Netherlands. The most relevant conclusion within the present scope,however, is that the figures for the European Union contain no indication of a trendbreach in the low participation level of senior males: the participation of older work-ers in the European Union in 2003 is 2.7 percentage points below the 1990 level. Weestablish that the Netherlands is already on course to realise further participationgains, while in the European Union as a whole efforts still need to be directed atreversing the declining trend.
2.5 The economic benefit of increased participation of older workers
Suppose that Dutch economic policy succeeds in keeping older workers longer andmore often involved in the production process. What benefits would this bringeconomically? Example: in the Netherlands labour participation of the 55 to 65 year-olds stands at 59% of the total labour force. In Sweden, the corresponding percent-age is 92 (also see Table 1.1.). Total labour supply in the Netherlands would be 5.4%higher if Dutch citizens aged 55 and over were to participate to an equal extent astheir Swedish counterparts.
To give an indication of the scope of the possible effects, we simulated a 1% risein the labour supply using the macroeconomic structure model nigem, the Niesr8
Global Econometric Model. As its name suggests, nigem is a global model, coveringthe 36 most important economies, including all eu countries. The rest of the worldis reflected by several geographic blocks.
19
Labour market participation of ageing workers

We performed the simulation twice. On both occasions, labour supply at the startof year 1 rises permanently by 1%. The first simulation assumes that the Netherlandsis the only country pursuing a policy that stimulates the 55 years and over bracket ofthe labour force to work more and longer. In the foregoing, we saw, however, thatthe low participation rate of the 55–plus in the euro area is even more serious an issueas it is in the Netherlands. In the second simulation, we therefore assume a 1%increase in labour supply in all euro countries. Table 2.4 shows the effects of the 1%increase in labour supply, both for the Netherlands and the euro area.9
A 1% rise in labour supply in the Netherlands will first lead to an increase in theunemployment rate by 0.8%. Through rising unemployment, however, the extralabour supply will depress wages, as a result of which more jobs will be created. Afterfive years, more than half of the new labour supply will be absorbed. In addition, asthe lower wage costs will translate into a lower price level, the real wage decrease willbe much lower than the nominal wage decrease. Eventually, after ten years, the extrasupply of workers added to the production process will account for a 0.5% rise ofreal gdp, mainly by way of extra consumption and investment. The weight assignedto the Netherlands in the total labour supply of the euro area is a mere 5%, i.e. toolittle to make a perceivable difference at the aggregate euro area level.
Conversely, the developments in the euro area are of much importance to theNetherlands indeed. As said, the low participation rate of the 55-plus is a problemthroughout the euro area. That is why we performed a second simulation. At theEuropean level, we see the same mechanism operating as in the Netherlands (seeTable 2.4.b). The extra labour supply leads to lower wages, which in turn are con-ducive to a higher gdp through the creation of more jobs and a lower price level. As,this time, the lower European price level will actually result in lower interest rates,the effects will be more favourable for the Netherlands than in the first simulation.The unemployment rate will drop faster and the gdp gains will be larger. Besideslower interest rates, the extra import demand from the other euro countries also playsa positive role in this context. While under the current European policy the pressureof the unemployment rate on wages and prices is lower, the lower interest rate isexerting additional pressure on prices. As a consequence, the eventual effects on theprice level of consumption in the Netherlands in both simulations will hardly differfrom each other. This exercise demonstrates that a joint European approach makesfor better results for the Netherlands.
Another factor coming into play is the phenomenon that since the launch of themonetary union the effects of one country’s policy tend to extend more often toother countries. This means that, if the ageing population issue should threaten toundermine the sustainability of public finance in Germany, France or Italy, theNetherlands will be affected as well via higher interest rates, increased inflation anda weaker currency. So the Netherlands has become more susceptible to the policyconducted in other European countries. This effect is not reflected in the simulationresults, however, as the simulation assumes that all countries conduct a fiscallysustainable policy.
20

2.6 Summary and conclusion
Since the introduction of the first social security Acts, the population’s life expectan-cy has risen. In addition, the population is ageing: the proportion of senior citizensis increasing, whereas the birth rate per woman is dropping. The grey pressure willrise sharply in the future as a result. This is not a topical issue in the Netherlandsalone, but in industrialised countries in general. Also, in an international perspec-tive, the situation in the Netherlands is not extraordinarily unfavourable.
In the economically lean times after the two oil crises, the continental Europeanwelfare states in particular sought remedy against the high unemployment in early
Labour market participation of ageing workers
Labour supply
Real gdp
Consumer prices
Unemployment rate1
Netherlands euro area
1 Absolute deviation.
year 5
1.0
0.4-0.60.2
year 2
1.0
0.2-0.20.6
year 1
1.0
0.10.00.8
b. In the euro area
year 10
1.0
0.6-0.70.1
year 1
1.0
0.2-0.10.6
year 2
1.0
0.3-0.20.4
year 5
1.0
0.5-0.50.1
year 10
1.0
0.6-0.60.1
Table 2.4 Effects of a permanent rise of labour supply by 1% as measured by
nigem(per cent deviations vis-à-vis the base line)
Labour supply
Real gdp
Consumer prices
Unemployment rate1
year 1
0.05
0.00.00.0
year 10
1.0
0.5-0.70.1
year 2
0.05
0.00.00.0
year 5
0.05
0.00.00.0
year 10
0.05
0.00.00.0
Netherlands euro area
1 Absolute deviation .
year 5
1.0
0.3-0.60.4
year 2
1.0
0.1-0.30.7
year 1
1.0
0.1-0.10.8
a. In the Netherlands
21

retirement arrangements. As a result, participation of the 55-plus dropped sharply andthe average effective age of retirement is now significantly lower than the official ageof retirement. Considering the number of senior and elderly citizens that will requirecare in the future, it is inopportune to continue sending productive citizens on retire-ment now and it will be impossible to do so in the future. In the Netherlands, a trendbreach is already perceivable, however, for the participation rate of the 55-plus hasbeen on the increase since 1990. It is still below the 1971 level, though, despite thefact that the participation of older females has risen sharply since then. This isaccounted for by older males’ participation still being amply below the 1971 level,which signifies that a lot is to be gained yet in this category. For the European Unionas a whole, however, no such trend breach is in evidence. The oecd expects the largest demographic shifts to evolve in Italy, Germany andFrance. In these countries, which combine the lowest effective retirement age withthe lowest participation rate of workers aged 55 and over as well as observing the pay-as-you-go system for pensions, the burden on public finance as a result of the grey-ing population is by far the heaviest. To alleviate this pressure, Italy has meanwhileproceeded to restructure its pension system radically. The potential economic gain to be achieved from a rise in participation of olderworkers may be considerable. A labour supply increase by 1 per cent may eventual-ly cause gdp to increase 0.5%. Given that the greying population and low participa-tion of the 55-plus is a common European problem, coordination at European levelis desirable. In any case, the outcome of model simulations is that in this context apolicy pursued at the European level will lead to higher labour participation acrossthe Union as well as more favourable effects for the Netherlands than if the Nether-lands were to pursue this policy on its own.10
Since the introduction of the Monetary Union, mutual dependence of the par-ticipating countries of each other’s policy has increased. Hence, any negative exter-nal effects cannot be excluded. We demonstrate that, in the long term, the greyingpopulation may exert considerable pressure on public finance in Germany, Franceand Italy. This perspective underscores the relevance and necessity of the agreementsconcluded regarding the maximum allowable budget deficits as laid down in the Sta-bility and Growth Pact.
The conclusion seems justified that the Netherlands does have an ageing issue,but, compared to the countries around it, not to an excessive degree. This is not tosay that no action is required. The magnitude of the problem is still such that mea-sures are called for to prevent the bounds of the social welfare state coming in sight.In Italy, France and Germany, however, the problem is of a larger scale. These threelarge euro countries have to cope with major demographic shifts and low partici-pation in the 55 years and over bracket of the labour force, while relying on a pay-as-you-go pension system, i.e. a system more vulnerable to the ongoing ageingof the population than a capital-funded system.
On the other end of the spectrum we find the two Anglo-Saxon countries andSweden. While these countries, too, are faced with greying populations, they are far
22

23
Labour market participation of ageing workers
more successful at keeping citizens aged 55 and over in the labour force than theNetherlands and the other continental European countries. The wide divergencebetween the labour participation rates of the countries compared in this study is per-haps partly attributable to the differences in design of the pension provisionsinvolved. In the next chapter, we shall therefore compare the structure of the Dutchpension system with those of the three large euro countries, Germany, France andItaly, the two Anglo-Saxon countries, the United States, the United Kingdom, andSweden.

3.1 Introduction
The previous chapter identified large differences in effective retirement ages andlabour participation of workers aged 55 and over. Whereas in Sweden, participationof the 55–64 age bracket is 92% of the overall rate for people of working age, this figure for Italy comes to only 51%. With rates just below 60%, Germany, France andthe Netherlands score slightly better on senior participation. In the United Statesand the United Kingdom senior participation rates, at 82% and 75% of overall rates,respectively, are above those of continental European countries but below theSwedish rate.
Where do these differences come from? One possible explanation is that thevarious participation rates of older workers are primarily an expression of nationaldifferences in cultural preferences. In that case, lower rates simply reflect a greaterpreference for leisure in Italian, French, German and Dutch older citizens comparedto their American, English or Swedish counterparts. On the other hand a person’sindividual decision to retire from work is also determined by the design of thepension system. In that case, (early) retirement systems prevailing in continentalEuropean countries must be regarded as ‘an offer one cannot refuse’, whereas this ismuch less true of schemes prevalent in the us, the uk and Sweden. In this chapter,we try to clarify this issue by means of an institutional comparison between pensionlegislations. First, by way of theoretical background, we provide the conceptualframework underlying our analysis. We continue with a brief description of thedifferent national legal arrangements that determine the old-age pension system ofeach country, taking account wherever possible of recent reforms which althoughofficially adopted have not had time to take (full) effect. Next, we compare thestrength of the incentives for (early) retirement which these systems generate. Asummary and conclusions complete this chapter.
3.2 Theoretical background
The issue of population ageing has both a temporary and a structural component.On the one hand, the post-ww2 generation now about to reach retirement age is largein numerical terms, and on the other, as people live to increasingly advanced ages,they remain entitled to pension benefits for longer periods. The often-cited image
24
3 Institutional differences between old-agepension systems and their implications

of the ‘baby boom generation’ as a lump moving upward through the populationpyramid illustrates the temporary nature of the numbers problem: at some point intime, the post-war generation will have passed away, and the worst of the populationageing problem will be over. The oecd expects the adverse effect to peak between2025 and 2035. Increased life expectancy, however, poses a structural problem.11
Diamond (2001) states that in the hypothetical case without any social securityan individual can choose from three possible coping strategies, given increased lifeexpectancy: (1) he may consume less and save more during his working age span; (2)he can consume less during retirement; or (3) he can continue working for longer. Ina situation where there is a collective pension scheme, strategy (1) translates intohigher contributions by the economically active; strategy (2) translates into reducedretirement benefits; while strategy (3) translates into an increase of the effective retire-ment age. According to Diamond, a mix of all three strategies makes the most sense.12
We have already seen how in many countries the effective retirement age hascome down since the 1970s. According to Diamond’s paradigm, a reverse develop-ment in terms of the ‘continued work’ strategy must, all else being equal, be offsetby opposite movements in terms of the other two strategies: ‘higher contributions’and/or ‘reduced benefits’.
The trend towards early retirement may have several different causes, both directand indirect. The most-cited direct causes are: improved standard of living, increaseddemand for leisure, and also government policy. In the lean years of the 1970s and’80s, early retirement was not only encouraged by government policies, but in somecases even regarded as a solution for (youth) unemployment. Other social legisla-tion, for instance unemployment or disability Acts, may also provide a disincentiveon the participation of older workers. The more indirect causes of reduced partici-pation in the 55+ age bracket lie in the area of employers’ decreased demand for thisage group. Often-mentioned examples of this phenomenon are: declining relativeproductivity of low-education workers as a result of rapid technological develop-ments; insufficient training levels among older workers leading to low wage-earningcapacity; and temporary negative demand shocks resulting in the irreversible retire-ment of older employees.
If the early retirement trend does indeed reflect an increased preference for leisureand increased welfare, then policies to encourage senior participation will, in prin-ciple, reduce welfare. For in this case every extra hour of work is counterbalanced byan hour of leisure less, which is valued more than the remuneration for the hour ofwork. Duval (2003), however, conducting a panel analysis across all oecd countries,found a strong correlation between the size of financial incentives to retire (early)and the participation rate of seniors. In other words, there are empirical indicationsthat the reduced participation of older workers is a consequence of the institutionaldesign of the retirement systems themselves. In addition, Duval’s study found a sta-tistically significant ‘discouraged worker effect’, i.e. indications that as opportunitieson the labour market develop unfavourably, more and more people tend to turntheir backs on that market for good. This is in line with findings for the Netherlands
25
Labour market participation of ageing workers

by the Bureau for Economic Policy Analyses (cpb) on the characteristics of earlyretirees: for someone with low education – typically less likely to find a job – thelikelihood of early retirement is above average, whereas it is significantly lower foruniversity-educated employees (Roodenburg and Rijn, 2002). Moreover, the higher-educated exhibit a demonstrably stronger preference to continue working. A possi-ble explanation for this could be that they find their work more rewarding and thatthe work they do is often less strenuous physically (De Nederlandsche Bank, 2004).
3.3 The institutional design of regular old-age pension systems in seven
countries
3.3.1 Definitions
This section discusses the institutional design of regular pension systems. We willfind large differences between countries. This may come as no surprise, since thecurrent design of such systems is the end result of a long history, in which nationalpreferences, local value patterns and the existence and design of other institutionshave played important roles. Let us give a few examples: while in some countries,the provision of old-age benefits is predominantly a public responsibility, in otherspension entitlements are largely individually funded. Also, current arrangements inmany countries have come under pressure from the oncoming wave of demograph-ic ageing. Some countries have recently decided on reforms, while in others reformhas been the subject of (sometimes heated) debate. Examples of countries that haverecently implemented far-reaching reforms are Sweden and Italy.
For a better understanding of different types of schemes, we will first discuss twobasic principles underlying the architecture of pension systems, which are (1) fund-ing methods and (2) the degree of certainty about the level of future pension bene-fits.
(1) Pay-as-you-go vs. funding Under a pay-as-you-go (payg) system, contributionspaid by the current generation of wage-earners are redistributed by a public author-ity to the current generation of old-age pensioners as pension benefits. There is noactual ‘piggy-bank’, as opposed to what happens under a funded system. Under afunded system, personal savings are managed (i.e. invested) by (independent)pension funds. The total capital thus saved should, in principle, be sufficient to payall entitlements.13
(2) Defined Benefit (DB) VS. Defined Contribution (DC) Under a db system, the size offuture pension entitlements is guaranteed to some degree, usually in terms of a fixedpercentage of average or last-earned wages. Capital shortages and surpluses, shouldthey occur, are compensated for through adjustment of the required contributionpayments. Contrasting with this is the dc system, under which the level of contri-butions is fixed but there is no certainty as to the level of the eventual benefits, whichdepend on the capital build-up resulting from invested contributions. A db system
26

has the benefit of allowing a degree of risk-sharing, also across generations. In theo-ry, this could have a beneficial effect on welfare. Conversely, however, such a sys-tem may reinforce the effects of a negative capital shock on the economy, throughthe contribution increase required to absorb that shock. Recent examples are thecontribution increases that were needed to enhance Dutch pension funds’ solvencyrates due to poor stock market performance. In addition to the direct effect ofreduced asset prices on consumption, increased pension contributions also workedto reduce Dutch households’ purchasing power.14 Under a dc system, by contrast,every individual has to bear their individual loss, which is why such a system is, bydefinition, neutral in terms of the macroeconomic implications of asset shocks(Westerhout et al., 2004).15
Both pairs of principles, regarding funding method and benefit assurance, respec-tively, may occur in any of the possible four combinations. A system guaranteeingdefined benefits may be funded either by accrued capital (Netherlands) or by a paygmethod (Germany). Defined contribution systems are found mostly in Anglo-Saxon countries, usually supplementing a basic guaranteed benefit scheme. Suchsupplementary pension arrangements are of the funded type and involve fixedperiodic transfers of funds into individual accounts. Thus such a scheme has a fair-ly close resemblance to a (frozen) individual investment account.
A relatively novel development is the advent of Notional Defined Contribution(ndc) schemes, which should be seen as a hybrid between a dc and a payg system.ndc systems are introduced in an attempt to translate the labour supply stimuliinherent in a defined contribution system to a payg system, in cases where the tran-sition to a capital funding system is ruled out for financial reasons (see footnote 13).Under an ndc system, individual accounts are kept, but the actual contributions,instead of being invested, are used to pay current benefits. Individual capital build-up is therefore ‘notional’, or virtual. At retirement time, the built-up virtual capitalis converted into a retirement benefit by means of a formula that is very similar tothe one used to calculate a life annuity, in that it takes into account the remaininglife expectancy of the respective birth cohort. When life expectancy increases, thesame capital amount has to be spread out across more years, resulting in lowerbenefits. Many ndc systems allow for early retirement in exchange for more or lessproportionally lower retirement benefits. Thus such a system provides strong finan-cial incentives to ‘sing for one’s supper’. Under an ndc system, future benefits aresurrounded by less uncertainty than they are under a pure dc system. 16
By applying the annuity formula, an ndc system lays the burden of longevity onthe shoulders of the long-lived generation itself, just as a dc system does. However,it fails to relieve the temporary problem of the numerically large baby-boomgeneration, which requires today’s workers to provide pensions to a strongly grow-ing population of seniors under the payg principle.
The remainder of this section describes the chief characteristics of the differentnational pension systems, based on studies by Yoo and de Serres (2004) andWhitehouse (2003). We discuss each system in terms of the three pillars on which it
27
Labour market participation of ageing workers
is built. The first pillar is a mandatory scheme independent from a person’s pastemployment record. The benefits under such a scheme constitute a social safety netfor senior citizens and are, by and large, guaranteed. In most countries, the first pil-lar is funded through contributions, although one also finds benefits paid fromgeneral public funds. Participation in the second pillar is also mandatory, but relat-ed to wages and employment duration. Second pillar pension systems differ widelybetween countries. One finds pure payg systems, fully funded systems and combi-nations of both. In most countries, second-pillar benefits are guaranteed, althoughin some countries, a shift towards dc schemes can be discerned. Participation in thethird pension pillar, finally, is voluntary. Usually, one finds individual tax exemp-tions for certain well-defined types of contractual pension savings. These may beeither of a defined benefit type, such as annuities, or of a defined contribution type,such as frozen investment accounts.
In order to compare national systems, the oecd has created, for each country, avirtual person called the Average Production Worker (apw), whose remuneration isused here to scale the various schemes.17 On a final note, we should add that ourstudy has no pretensions at exhaustiveness but merely attempts to offer an overviewof the most salient characteristics.
3.3.2 Germany
The public pension system in Germany is a payg system in which the first two pillarsare combined into one. Income-related retirement pension is based on a gradingsystem, with grades being assigned on the basis of the number of contribution yearsand the average income during those years. The pensionable base is limited to 200%of apw. Up to this maximum, a full pension entitles the retiree to 70% of formerwages, gradually declining to 64% in 2010. The pensionable age is 65 years.18 How-ever, after 35 contribution years retirement at 63 is allowed. German governmentemployees have a separate scheme that guarantees 75% of the last-earned salary forsomeone with fully accrued entitlement.
German seniors with a shortfall in accrued entitlement may use a social safety netcalled Sozialhilfe, amounting to 13% of apw for a single person and to 23% of apw forcouples. The third pillar consist mostly of individually bought life insurance orprivate pension schemes in combination with tax benefits. Circa 25% of employeestake part in company pension schemes offered mainly by big companies. Relativelyweakly developed, such schemes provide only 5% of total pensioner income inGermany.
3.3.3 France
In France, too, the first and second pillars of the pension system coincide.
28

Participation is mandatory and schemes include both an income-related componentand a redistribution component. The statutory pensionable age is 60 years. Employ-ees in private companies are required to participate in two job-related pensionschemes called the ‘General regime’ and the ‘Supplementary regime’. The Generalregime is a public payg system with employers and employees sharing the contribu-tion burden. A full pension entitles the retiree to 50% of the average wage during thehighest-earning 25 employment years. Different supplementary regimes apply toblue-collar and white-collar workers, but both systems are publicly guaranteed ndcsystems. Government employees are covered by a separated public payg systementitling them to 75% of last-earned salary after fewer contribution years than applyto private-sector workers. The third pillar consists of tax benefits on individualannuities or other pension schemes either offered by employers or taken outindividually.
3.3.4. Italy
The Italian system underwent two engulfing waves of reform during the 1990s, whilefurther adjustments are being debated. The second, income-related pillar was trans-formed to a public ndc system. The regular pensionable age under the new systemis now 65 years, but retirement is possible from 57 years in return for a discount onpension benefits. The remaining life expectation of a pensioner’s age bracket is fac-tored into the calculation of pension benefits. However, the government retains thepower to depart from the calculated rates to allow pensioners to benefit fromfavourable economic developments. A fully accrued pension comes to 70% of last-earned pay. This income replacement rate is expected to fall significantly over time,however, because retirees have been given additional entitlements during the transi-tion period. Contributions are paid jointly by employers and employees. On theintroduction of the new first-pillar system, minimum state pensions were dis-continued and replaced by the Assegno Sociale for the elderly. This scheme guaran-tees a minimum income of 17% of apw for singles and twice that amount for cou-ples. A fledgling third pillar in Italy is still in its earliest stages of development, whichis explained by the generosity and scope of the old regime.
3.3.5 The Netherlands
The first pillar consists of the mandatory basic public pension scheme, with fullentitlement accrued on the fact of residency in the Netherlands between ages 15 and65. The benefit is an amount fixed at 55% of apw for singles and 70% of apw for cou-ples. Contributions are paid entirely by employees as a percentage of income up to90% of apw. This so-called aow scheme is a payg system supplemented, in recentyears, from public funds in case of shortfalls. The second pillar, for both private-
29
Labour market participation of ageing workers

sector and government employees, is a system of funded company pension funds.Although employers are not required to offer pension schemes, almost everyemployer does so. If a company pension is offered, participation is mandatory foremployees. As a result, the scope of company pensions is large, extending to 90% ofemployees. Some 95% of pensions are of the defined benefit type. A fully accruedpension income, including the fixed aow state pension, usually comes to 70% of theaverage or last-earned salary.19 The pensionable age is 65. Persons whose pensionaccrual is less than 70% of the last-earned salary may supplement their pension upto that level via the third pillar, through the purchase of tax-supported annuities.
3.3.6 United Kingdom
The uk has a complex pension system consisting of a mix of db and dc schemes,with savings accrued on either a collective or an individual basis, or both. The pub-lic system is payg-funded and combines both the first and the second pillars: the firstpillar entitles a fully pensionable person to a fixed amount of 20% of apw (30% apwif there is a dependant partner). The second pillar is income-related, with benefitlevels determined on the basis of an incremental bracket system. Because this sys-tem includes only three brackets that set low limits on pensionable salaries, thesecond pillar in the public system has a strongly redistributive character. Contribu-tions are paid jointly by employees and employers. Benefits are paid from age 65 formen and age 60 for women. Employees are free to opt out of the second public pen-sion pillar on condition that they participate in an alternative supplementary pen-sion scheme. These further conditions apply to the level of guaranteed benefits,under a db scheme, or to the level of contributions in the case of a dc scheme. If anemployee opts out the public system, both he and his employer pay lower contribu-tions. 65% of employees have opted out, with almost 40% of employees participat-ing in a company scheme instead. At retirement time, a standard (full) companypension scheme will disburse a lump sum of twice the last-earned yearly salary, ofwhich 75% is usually paid out at once while the rest is used to buy an annuity.Another 25% of employees use the contributions saved by opting out to buy intoindividual dc-type schemes marketed by banks and insurers. Under the third pillar,employees may save for a higher pension by making voluntary extra contributionsto the schemes mentioned above. Finally, a social safety net provides for an income-dependent supplement, guaranteeing a minimum income of 25% of apw minimumto single seniors, and of 40% of apw to retired couples.
3.3.7 United States
The income-dependent public system under the second pillar has strong redistribu-tive features, with mandatory contributions taken out of (pensionable) salaries up to
30

225% of apw. The official retirement age used to be 65 until recently, but is now beingvery gradually raised to 67 by 2022. The system is part payg (with contributions paidby both employees and employers) and part funded. This collective pension schemeprovides some 44% of senior citizens’ incomes. In the absence of (sufficient) accruedentitlement or private wealth, a first-pillar safety net called Supplemental SecurityIncome provides a minimum income of 21% of apw to singles and of 32% of apw tocouples. Some states also offer a supplementary benefit scheme. At 20% of total pen-sioners’ incomes, additional savings under the third pillar are an important factor aswell. The two main tax-supported schemes are the so-called ‘401(k)’ schemes offeredby employers and the ‘Individual Retirement Accounts’ or iras. Some 45% ofemployees participate in company pension schemes, about half of which are of thedb type. About 7% of employees participate in individual ira supplementaryschemes.
3.3.8 Sweden
In Sweden, reforms in 1999 included the introduction of an ndc system. Everyonewho was under the age of 45 at the time is fully covered by the new system, whileproportional arrangements apply to older persons. Since 2001, the second pillar hasconsisted of two parts: a main part, which is an ndc-based payg scheme and an addi-tional part, which is a dc-type funded scheme. Contributions to the main part aremandatory and paid as a percentage of income up to 120% of apw. Contributions tothe additional part are invested, with participants being offered a wide range ofinvestments to choose from. Entitlements may be granted on social grounds in cir-cumstances such as illness or pregnancy and during e.g. training courses or care leave.Employees may opt to retire between ages 61 and 70, with deferred retirement trans-lating into higher benefits. The remaining life expectancy of the retiree’s age brack-et is factored into the benefit amount. Since 2003, a first pillar has come into forcein the shape of a social safety net guaranteeing a minimum retirement income of 33%of apw to singles and 60% of apw to couples. The third pillar in Sweden is, again,divided into two parts, namely company pension funds and individual schemes.Like their Dutch counterparts, Swedish company pension schemes are quasi-manda-tory, resulting in 90% participation. While most of these funds are (largely) funded,pension funds for government employees are only partly so. In recent years compa-ny funds have begun to shift away from db-type schemes towards dc-type schemes.The resulting increased income uncertainty is regarded as acceptable because suchschemes largely serve as income supplements and target the higher income brackets.Company pension funds provide some 10% of total pensioner incomes. In addition,almost 50% of employees participate in individual pension plans.
31
Labour market participation of ageing workers

3.4 Early retirement incentives compared
According to Duval (2003) an employee’s decision to retire is determined by threefactors: the pension system’s statutory retirement age, the income replacement rateand the system’s degree of actuarial neutrality. After a brief discussion of each ofthese concepts, we will have a set of tools to compare the incentives provided by thevarious systems in the second part of this section.
(1) The statutory retirement age shapes retirement customs and determines what isgenerally felt to be the ‘normal’ retirement age. In many countries, it also works asan effective upper limit, because employees who reach the statutory retirement ageare automatically discharged regardless of whether they would have been willing tocontinue working.
(2) The (expected) income replacement rate is defined as the (expected) pensionincome as a share of previous income from work, and is a measure of the generosityof the system. Representing the income effect of retirement, this ratio is calculatedby the oecd for all participating countries and for both gross and net incomes (i.e.before and after tax). The larger the income replacement rate, the more easily anemployee can afford to retire. A high rate would allow one, for instance, to quit work-ing without the backing of substantial savings.
(3) The change in pension capital resulting from one extra year of work. Pension capital,here, is defined as the cash value of the future flow of pension benefits the benefi-ciary is to receive for the rest of his life. If an extra year of work reduces that capital(i.e. the increase in benefit does not compensate for the extra contribution paid plusthe pension benefit waived that year), this may be regarded as an implicit tax on con-tinued working. Conversely, an increase in pension capital represents an implicitsubsidy on continued working. A schematic illustration of the concept is providedin figure 3.1. For simplicity’s sake, we have not visualised the decline in the pensionbenefits’ discounted value.
Let us assume an employee has reached retirement age at time t. Until thatmoment, the employee has received a salary out of which he has paid pension con-tributions. From time t, the now retired employee receives regular pension benefitsuntil time t+k, with k representing the remaining life expectancy in years at the timeof retirement (see situation a). Now assume the employee decides not to retire, butto continue working for one year. This decision entails costs (see situation b) in termsof the payment of an extra year’s worth of pension contributions (the rectanglemarked x) plus that year’s worth of unpaid pension benefits (the rectangle markedy). Offsetting these costs is the fact that the pension benefits from time t+1 will behigher than in situation a. If the increase of total pension payments (the rectanglemarked z) is exactly equal to x+y, the costs will be matched precisely by the bene-fits. The change in pension capital will be nil, and the pension scheme will be whatis called ‘actuarially neutral’. An actuarially neutral system does not generate anypositive or negative incentives affecting the employee’s labour supply decision.
32

The traditional early retirement scheme (known as vut in the Netherlands) used tohave a strongly discouraging effect on participation of older workers. In the mostextreme cases, one year of extra work brought only costs with it in terms of contin-ued contribution payments x and unpaid pension benefits y, with no extra benefitsz to compensate for them (i.e. z = 0). The implicit tax rate, in this case, is 100%. Apension system involving high implicit taxation of continued work provides a strongincentive to substitute leisure for income. Duval (2003), for instance, on the basis ofhis empirical survey, estimated that a decline by 10% in this implicit tax rate will leadto a 1.5% increase in labour supply of older workers.
Table 3.1 provides an overview of the calculations made by Casey et al. (2003) inthe context of an oecd study into the strength of the three retirement incentives men-tioned above. Before discussing the table in greater detail, we should make certainprovisos. In the first place, the figures only present the results of all mandatory pen-sion schemes including, for Sweden and the Netherlands, the quasi-mandatory com-pany schemes. This means that the table disregards third-pillar individual savings,which especially in the us and the uk are very important pension income factorsenjoying wide demographic distribution. Secondly, the calculations relate to a 100%apw income, assuming fully accrued entitlement. However, income replacement ratesmay vary substantially between income brackets, since in some countries pensionschemes are strongly redistributive. We will return to this latter point further down.
33
Labour market participation of ageing workers
pension contribution
salarypension benefits
t
t
t+k
t+1
t+1
t+k
a
b
x
y
z
pension contribution
salarypension benefits
Figure 3.1 Graphical representation of the concept of actuarial neutrality

34
Table 3.1 Retirement incentives inherent in pension schemes at 100% apwincomes
Netherlands
Germany
France
Italy
Sweden
United Kingdom
United States
Age
60636057616562
Changein pen-sioncapital1
0-6
-66-97-241815
Grossincomereplace-mentrate
80436355513431
Netincomereplace-mentrate
83687765634040
Changein pen-sioncapital1
-820
-66-21-41n/a
5
At ‘regular’ retirement age At earliest possible retirement age
1 Resulting from one year of extra work as a percentage of pay.Source: Casey et al. (2003).
Netincomereplace-mentrate
92777797824047
Grossincomereplace-mentrate
70486388743437
Age
65656065656565
The table presents the size of the incentives both at the ‘normal’ retirement age,which usually coincides with the statutory retirement age, and at the earliest possi-ble retirement age. The ages corresponding to each situation is given in the table: Inall countries, the pensionable age is 65, except in France, where it is 60. In the uk,early retirement is not possible. The ndc systems in Sweden and Italy allow for ear-ly retirement with compensation taken out of retirement benefits. In Germany andthe us, early retirement is possible after completing the full number of contributionyears. For the Netherlands, the table includes the calculations for the ‘classical’ vutearly retirement scheme. The average implicit tax rate was highest under the Dutchvut scheme, at 82%, followed by the French system, at 66%.20 The net (after-tax)income replacement rate was also most generous in the Netherlands and France. Inthe meantime, many vut schemes have been replaced by ‘pre-pension’ schemes thatcome closer to actuarial neutrality. The figures in the table clearly show that discon-tinuation of the vut scheme was desirable with a view to encourage the labour par-ticipation of older workers. In France, the regular scheme is also characterised byhigh implicit taxation, because the ‘normal’ and the earliest possible retirement dateare both at the relatively low age of 60.
The table also shows that in Sweden and Italy the new systems have beendesigned to include less than full actuarial neutrality. In the us, there actually is asmall implicit subsidy on continued work during the early retirement period.The picture is different at the regular retirement age. The Dutch aow scheme, forinstance, is actuarially neutral – the sole criterion for eligibility being the comple-

35
Labour market participation of ageing workers
tion of one’s 65th year. No income or wealth assessment is performed. In Italy, bycontrast, the implicit tax rate for employees approaching the retirement age rises toalmost 100%. The pension systems of the us and the uk grant implicit subsidies oncontinued work of 15% and 18%, respectively. In all countries, net income replace-ment rates are higher than gross replacement rates. This reflects the considerable taxbenefits enjoyed by the over-65 in many countries. In addition, they are in many cas-es exempted from paying various social contributions. In the Netherlands and Italy,the net replacement rate for retirees over 65 is almost 100%, which means that avail-able income after retirement is hardly less than before. Compared to this, incomereplacement rates of the us and uk pension systems may be called low. Hence indi-vidual savings provide an important compensation for regular pensions in the lattertwo countries.
As we have seen, the pension systems of the various countries are based on dif-ferent philosophies. Two broad streams may be distinguished here: one whichintends pension schemes to provide the elderly with a basic income, and one whichaims to provide a broad range of salaried workers with a fixed share of their erstwhilesalary income. Chart 3.2 illustrates the differences by showing gross income replace-ment rates for different income levels at the ‘normal’ retirement age. The dots in thechart represent available figures, while the connecting lines are shown for visualeffect. Because data for France were unavailable, this country is not represented inthe chart.In the uk, the us and Germany, gross income replacement rates decline
Chart. 3.2 Gross income replacement rate for different income brackets
In % apw
0
10
20
30
40
50
60
70
80
90
100
0.5 1 1.5 2 2.5 3 3.5 4 4.5 5
Germany Italy Netherlands uk us Sweden
income (in apw)
Source: Whitehouse (2003)

sharply as income increase as a result of the relatively low ceilings in either pension-able salaries or pension benefits, or both. The systems of these countries are strong-ly redistributive in character. In Italy and Sweden, by contrast, the ceilings are putat 250% of apw, while in the Netherlands, no ceiling applies at all. Here gross pen-sion benefits will replace 70% of even a 500% of apw salary.
Can the different incentives provided by the pension schemes in Table 3.1 helpexplain the national differences in senior participation rates? Chart 3.3 shows grossparticipation rates in 2003 by gender, for the total 15–64 years age bracket as well asfor the 55–59 and the 60–64 age brackets.
In contrasting these data, we should keep the following provisos in mind. First,if older workers’ decision to retire is determined (in part) by financial incentives,these incentives are unlikely to be generated by the pension system only. For a fulldiscussion, therefore, the attractiveness of alternative retirement opportunities pro-vided by, e.g., unemployment or disability legislation should also be analysed. Sec-ond, current senior participation rates are unlikely to reflect only the current regime,but should instead be regarded as an indication of the system’s financial attractive-ness over time. A clear example of this is given by Italy, which has recently made far-reaching changes to its pension system. Italy’s new ndc system provides substantial-ly weaker financial disincentives on deferred retirement than the old system.However, current participation rates result largely from decisions taken in the pastunder the old pension regime. Although these provisos show that our analysis canonly be tentative, some conclusions do suggest themselves.
1) The relatively high participation rates for the 55–64 age bracket in the uk, theus and Sweden which we have found in preceding chapters are mostly accounted forby considerably higher participation rates for 60–64-year-olds. In the Netherlands,Germany, France and Italy, participation among this age bracket is considerably low-er. Can the incentives shown in Table 3.1 suggest an explanation for this difference?The country with the lowest 60+ participation rate is France, at a mere 14%. An obvi-ous explanation is that France is unique in having a state retirement age of 60.According to the table, the financial reward for one year of continued work is low-est in France (and in the Netherlands under the old vut regime), whereas early retire-ment is most affordable there because of the high net income replacement rate. InGermany, low participation of 60+ seniors is explained in part by the fact that untilrecently the official retirement age for German women was 60. Currently it is beinggradually raised to that of men (65). Little can be said about Italy or Sweden, becauseboth countries have recently implemented far-reaching system changes. A likelyassumption would be that the low Italian participation rates are a relic from the gen-erosity and scope of the old system. The traditionally low participation of Italianwomen also contributes. In the case of Sweden, the lack of easily available alterna-tive retirement routes may play a role, while the traditionally high participation rateof Swedish women also helps to push up the figure.
The low income replacement rates and the actuarially neutral character of the usand uk pension systems are consistent with the high participation of 60–64-year-olds
36

37
Labour market participation of ageing workers
NL GR FR IT SW UK US
0
20
40
60
80
100
15-64 55-59 60-64
Chart 3.3 Gross Participation rates of different age groups in 2003, by gender
NL GR FR IT SW UK US
0
20
40
60
80
100
Woman
Source: oecd (2004)
NL GE FR IT SW UK US
0
20
40
60
80
100
Men
Men and woman

38
in those countries. In the uk it is not possible to retire on a pension before the ageof 65. The fact that the uk’s state retirement age for women is 60 explains the lowparticipation rate of British women.
2) Also notable is the fact that in most countries, the participation rates of the55–59 age bracket are not much below those for the entire working-age population,except in the case of the Netherlands, France and Italy. In the Netherlands, this ismostly accounted for by the low participation of older women. However, it is expect-ed that these rates will rise in the future as a result of the cohort effect discussedbefore. In the case of Italy, too, low participation of women offers part of the expla-nation. Also standing out is the relatively low participation of men of this age brack-et in Italy, but also in France. This is an indication of the relatively easy availabilityof alternative retirement routes, as through unemployment or disability schemes. InSweden, the participation of 55–59 year-olds, both men and women, is in fact abovethat of the general working-age population.
3.5 Summary and conclusions
If the system of collective pension schemes is to be maintained on a financiallysound basis in the face of increasing life expectancy, a mix of three adjustment strate-gies must be pursued: pension contributions must be increased; benefits must bereduced; and labour force participation of older workers must be increased. Thesethree strategies operate like communicating vessels: Because since the 1970s, theeffective retirement age has come down in most countries, either this trend will haveto be reversed or additional efforts will be required with respect to the other twostrategies. One often-expressed view is that the ongoing tendency to retire from thelabour process at ever younger ages primarily reflects changing preferences. Yeteconometric studies have identified a strong correlation between early retirementand financial incentives. One way such incentives might be given is through thedesign of pension schemes.
The actual design of pension schemes varies widely across countries. Pension sys-tems might differ in the way they are funded (pay-as-you-go versus capital funding)and in their inherent degree of uncertainty about future benefit levels (db versus dc).All four possible combinations of both pairs of principles are observed in one ormore of the seven countries under consideration. There are clear differences inunderlying philosophies: in continental Europe, old-age pensions for a wide rangeof income brackets are largely the responsibility of collective entities including thepublic sector. In Anglo-Saxon countries the emphasis is on individual schemes, withcollective entities providing for a low basic benefit and a social safety net, while thehigher income brackets are assumed to be able to provide for higher pensions on anindividual basis. Therefore, the collective part of the pension system is strongly redis-tributive in character.
We briefly discussed the national pension systems, applying a breakdown across

three pillars, with participation in the first two being mandatory. The first pillar pro-vides for a basic scheme or social safety net and its benefits are independent of a per-son’s employment record. Benefits under the second pillar, however, are dependenton income and the number of contribution years. The third pillar, finally, is option-al and usually takes the form of individual tax benefits on particular savings schemes.
The strength of the incentives to retire early inherent in the various pension sys-tems has been expressed in terms of three concepts: the statutory retirement age, theincome replacement rate and the change in pension capital as a result of continuingworking by one more year. Using these tools, we looked at whether the design of apension system can contribute to an explanation for participation differences in the55+ age group. Despite the tentative nature of our analysis, we were able to establishthat the nature and the strength of the incentives inherent in each national systemcorrespond to the relative participation rate among the over-55. Sweden and Italywere left out of the analysis because of recent, far-reaching changes in their pensionsystems.
In the next chapter, we will narrow our focus from international comparisondown to the Netherlands, considering questions such as: Where do our country-men’s preferences lie? Are we, in principle, prepared to continue working beyondthe statutory retirement age? And if so, how should this be compensated for?
39
Labour market participation of ageing workers

4 Dutch retirement decisions: the role of financial considerations
4.1 Introduction
Obviously, the participation rate of older employees will have to be raised if demo-graphic ageing is to remain affordable in the Netherlands. This chapter addresses theham question: how? Dutch employees set great store by leisure. Normally, the ques-tion is not whether one will be retiring early, but how early. This picture seems to beconfirmed by public resistance to the measures taken by the current Governmentwith regard to early retirement and pre-pensions, which suggests that delayed retire-ment is an unpopular theme. The figures in Chapter 2 show clearly, however, thatthe participation rate of older Dutch employees went up in the 1990s, while Chap-ter 3 shows that this trend coincided with the widespread abolition of financiallyattractive early retirement schemes. These findings run counter to the image ofDutch workers who will do just about anything in order to be able to stop workingas soon as they can. In this Chapter, we will show, with the aid of the dnb House-hold Survey (dhs), that retirement decisions are largely underlain by financial con-siderations. This means, on the one hand, that people can be stimulated to stay inwork if more of the consequent gains fall to individuals via the level of their even-tual pension benefit.21 On the other hand, people feel compelled to continue work-ing if the price of (early) retirement goes up, for instance, because implicit and/orexplicit subsidies are removed. These findings support the correlation between thehigher participation rate of older workers and pension cuts entailing that individu-als themselves bear the costs of early retirement and reap the benefits of retiring lat-er. Obviously, the answers given in the survey, and hence its results, are based oncurrent (early) retirement schemes and institutional frameworks. The results for theNetherlands are, however, consistent with research in other countries and offer sev-eral concrete handles for further policy measures aimed at encouraging olderemployees to stay in work; when explicitly confronted with the true costs and gainsof early retirement, the Dutch opt for a longer working life.
The analysis in this Chapter addresses only the supply side of the labour market,i.e. the preparedness to take part in the labour process. Increased preparedness onthe part of older employees to remain economically active does not mean their par-ticipation rate will immediately go up. The model simulations in Chapter 2 showthat an increased supply of labour will initially fuel a (temporary) rise in unemploy-ment.
This Chapter is organised as follows. Section 4.2 goes into the importance of
40

financial considerations for retirement decisions observed in the economic litera-ture. Section 4.3 then sets out how the results in this Chapter were obtained. Theideas and expectations of dhs respondents are charted in section 4.4, while sections4.5 and 4.6 discuss how they are influenced by financial considerations. In section4.5, the emphasis is on ranking the motives underlying longer working and the effi-cacy of income tax incentives, while section 4.6 focuses on the financial stimuli con-tained in retirement schemes. Section 4.7 presents a summary and conclusions.
4.2 Background
The economic literature generally acknowledges that individual retirement decisionsare determined by financial considerations (e.g. Gruber and Wise, 1997). Berkel andBörsch-Supan (2003) show the sensitivity of German retirement decisions to finan-cial motives. Simulations based on their results demonstrate that the effective retire-ment age goes up when the implicit tax on continuing to work is reduced. Duval(2003) arrives at a similar conclusion in his analysis of all oecd countries. Mastrogia-como et al. (2004) show that the Dutch, too, are motivated by financial considera-tions. They find notably that incentives and pension options are major determinantsof retirement decisions. Research also shows that, all other things being equal, high-er-income earners in the Netherlands are, on average, keener to retire early (De Ned-erlandsche Bank, 2004). This would indicate the role played in retirement decisionsby financial feasibility. Moreover, higher educated, male and single employees tendto work longer. The actual moment of retirement is determined largely by factorssuch as health and employer pressure (reorganisations).
The financial feasibility of retiring (early) also plays an important role in the linkbetween wealth and retirement. Blake (2004) shows that higher pension or homeassets stimulate early retirement in the uk.22 Van Els et al. (2004) find indications thatfor Dutch households, too, home assets may be considered a substitute for pensionassets. Such results correspond with the long-term trend of cashing an increase inprosperity in the form of a shorter and less intensive working life.23
Changes in the set-up of pension schemes seem to have considerable effects onthe behaviour of employees. Disney et al. (1994) analysed the retirement behaviourof employees in the uk with collective versus individual pension arrangements.Employees subject to collective arrangements have fewer options of retiring very ear-ly. On the other hand, the chances of retiring rise very rapidly for these employeesonce they reach the pensionable age. This means that the terms of the pensionarrangement strongly determine the retirement age. In a more general sense, Meghirand Whitehouse (1997) show that employees in the uk base their retirement deci-sions largely on economic considerations; higher wages make people delay theirretirement decisions, while the existence and the level of social security reduce thevalue added of working.24 Diamond (2001) agrees. He points out that when a pen-sion system is reformed – and people are confronted more explicitly with the actu-
41
Labour market participation of ageing workers

al costs of (early) retirement – alternative ways of withdrawing from the labour force(such as disability or unemployment schemes) should be blocked to abuse. For theNetherlands, Mastrogiacomo et al. (2004) show that, when the level of the state oldage pension depends on the labour market status of the partner, younger partnersmay be more inclined to retire early, rather than that older partners opt to worklonger.
Research also shows that Dutch employees are not very knowledgeable about theirown pension provisions, even though the majority say that they are sufficiently towell informed (e.g. De Nederlandsche Bank, 2004).25 Van Els et al. (2004) find a pos-itive correlation between knowledge of one’s own pension entitlements and age, edu-cation and income. On the basis of u.s. data, Chan and Stevens (2003) show that thisphenomenon is not specifically Dutch; u.s. workers, too, are far from adequatelyinformed about their pension arrangements. Though most employees know littleabout their own pension provisions, they do react to what they think they know. Thishas two major consequences for policy-making. To begin with, even if the existingprovisions contain sufficient stimuli to delay retirement, major labour supply effectscan be achieved through an information campaign. It must be kept in mind that theobserved average behaviour reaction to financial pension considerations is generatedby a minority of well-informed people. Information should therefore be explicitlyacknowledged as a link between stimulus and behaviour. Secondly, pension reformsmay have a disappointingly insignificant effect on behaviour if they are not accom-panied by a well-considered communication plan. Chan and Stevens (2003) make sev-eral interesting remarks on supplying information. For instance, some individuals cando without financial information because they do not use it when taking their retire-ment decisions (for example, partners who work part-time and are not the main bread-winner in the household). They also show that persons who stand to gain the mostfrom a sound retirement decision are, on average, better informed. This means thatknowledge of pension arrangements is not an exogenous variable in retirement deci-sions. This is supported by the finding that, on average, people become betterinformed as they get older; this goes for Dutch employees, too.26
The literature clearly shows that financial considerations play a major role in theretirement decisions taken in most countries. Also, retirement and various forms ofinactivity seem communicating vessels when it comes to retiring early. This meansthat economically desirable retirement behaviour can be stimulated by passing moreof the actual costs of early retirement and the actual gains of retiring later on to indi-viduals, while limiting the opportunities for a free lunch in the form of an alterna-tive way of early retirement. Below, the financial sensitivity of the pension behav-iour of Dutch employees is analysed empirically.
4.3 Empirical analysis
For the purpose of this study, Dutch households were asked to state their expecta-
42

tions and preferences for retirement and continuing to work at an older age. To thisend, the panel members of the dnb Household Survey (dhs) were presented with aquestionnaire in January 2005, which contained direct and indirect questions as topreferences and expectations with regard to retiring later and the role played byfinancial considerations. The bulk of the information presented here comes fromthe answers to these questions, given by a total of 1,614 panel members.
In the presentation of the survey results, all observations have been weighted, inorder to correct for overrepresentation of higher incomes and home ownership. Fur-thermore, the answers to some questions were related to a list with background char-acteristics of the respondent (or his/her household) with the aid of a logit model.Information about many of these background characteristics was obtained throughthe regular consultation of the panel in 2004. These characteristics are the respon-dent’s age, gender and education and the household’s annual income. The dhs’s reg-ular questionnaires also deal with many aspects of the financial behaviour of Dutchhouseholds, see, for example, Alessie et al. (2002) and Van Els et al. (2004). We sum-marised this financial behaviour in terms of home ownership and stock marketinvestments. Finally, we construct indicators of the respondents’ knowledge of theirown pension provisions, as well as their impatience and risk tolerance when it comesto taking decisions (see Appendix 4.1 for the technical details). Impatience gives anindication of the time horizon of the respondent’s decision. A high degree of impa-tience means that the respondent tends to value short-term proceeds relatively morethan proceeds which will take longer to realise. The risk-averse, however, may simi-larly prefer short-term to longer-term proceeds because the latter are more uncertain.In the following analyses, we therefore checked for both impatience and risk toler-ance, so as not to confuse the two when interpreting the results. The backgroundcharacteristics of the respondent were defined as follows.– Gender: 1 = male; 0 = female.– Age: in years.– Education: 1 = primary education; 2 = lower vocational education; 3 = generalsecondary education/pre-university education; 4 = upper vocational education; 5 =professional education; 6 = university education.– Job: 1 = paid work; 0 = otherwise.– Pension: 1 = retired (early) with a pension benefit; 0 = otherwise.– Partner: 1 = married or cohabiting; 0 = otherwise.– Income: 1 = net annual income of household below eur 13,000; 2 = income betweeneur 13,000 and eur 20,000; 3 = income between eur 20,000 and eur 26,000; 4 = inco-me above eur 26,000.27
– Home ownership: 1 = home owner; 0 = not a home owner.– Share holdings: 1 = invests in shares or investment funds; 0 = does not invest in sha-res or investment funds.– Pension knowledge: degree of knowledge about own pension provisions, a highervalue indicating more knowledge (see Appendix 4.1).
43
Labour market participation of ageing workers
– Impatience: emphasis on the present in decision-making and action-taking, a hig-her value indicating a high degree of impatience (see Appendix 4.1).– Risk tolerance: degree to which the respondent is prepared to accept risk in exchan-ge for a higher return (see Appendix 4.1).– Physical: the physical burden of the respondent’s job, on a scale of 1 (very light) to5 (very strenuous).– Mental: the mental burden of the respondent’s job, on a scale of 1 (very light) to 5(very demanding).
4.4 Retirement decisions
To begin with, we are curious about respondents’ expectations as to the age at whichthey expect to retire, and the intensity of their thoughts about retirement. Theexpected or desired retirement age is the logical measure with which hypotheticalchanges in policy, put before the respondents later, may be compared, because itreflects the current (early) retirement schemes and institutional frameworks. Theintensity with which respondents think about retirement gives an indication of theaccuracy of the signals emanating from the answers.
4.4.1 The importance of the retirement decision
The panel members were asked to indicate, on a scale of 1 to 5, the intensity of theirretirement thoughts, with 1 standing for ‘not at all’ and 5 for ‘very intensively’. Fourout of five respondents do not think about retirement (at all), while only one intwelve thinks about retirement (very) intensively, see Chart 4.1. This is in line withthe outcome of an earlier survey, where nearly half of the respondents agreed withthe statement ‘I don’t worry about my pension, I will think about it when the timecomes’ (De Nederlandsche Bank, 2003, p. 49).
Confrontation of this intensity with individual background characteristics bymeans of logit analysis furthermore shows that older respondents think about retire-ment more intensively. This is in line with the results of Chan and Stevens (2003)who pose that age determines when information is collected. Also, male respondentsthink more intensively about retirement, as do home owners and more patientrespondents (who have a longer decision horizon). Finally, respondents with a phys-ically strenuous job think relatively intensively about retirement.28
Chart 4.2 shows that the widely publicised debate between employers and tradeunions about the reforms of early retirement and pre-pension schemes have had lit-tle effect on this intensity: five out of six respondents say they do not think aboutretirement more intensively; one in ten now thinks about retirement more intensive-ly, and one in fourteen now does so less intensively.
44

4.4.2 Expected retirement age
One finding which may result from the debate is the fact that last year one in sixrespondents indicated not knowing when to retire, against one in ten, i.e. far fewer,in January 2005. On average, respondents expect to retire at 62.1 years; if allowanceis made for sample uncertainty, this corresponds with what the panel expected a yearago.
We then confronted the age at which people expect to retire with the backgroundcharacteristics.29 The expected retirement age shows a negative correlation with theintensity with which people think about retirement. Respondents who indicated that
Labour market participation of ageing workers
Chart 4.1 The intensity of thinking about retirement
Percentage of respondents
11
8
81
Not (at all)
Neutral
(Very) intensively
Source: dnb Household Survey, January 2005.
Chart 4.2 Has the intensity been changed by the pension debate?
Percentage of respondents
Source: dnb Household Survey, January 2005
No
Yes, more intensive
Yes, less intensive
7 10
83
45
they do not worry about retirement (at all), expect to retire at an average of 62.6, whilerespondents saying that they think (very) intensively about retirement expect toretire at 58.4.30 Respondents who think about retirement, but not (very) intensively,expect to retire as early as 61.0. This could indicate that early retirement remains anoption for people who are sufficiently interested in their own pension arrangements.This explanation runs counter, however, to the result that people who know moreabout their own pension provisions expect to retire later. The negative correlationbetween intensity and retirement age may alternatively be explained as a selectioneffect: people who would like to retire early are also more intensively engaged inexploring how to achieve this goal. This explanation is also in line with the argu-ments used by Chan and Stevens (2003) who pose that people who stand to benefitmost from information about retirement options are also the ones who most active-ly seek this information. The analysis further shows that, on average, men expect toretire nearly eighteen months later than women, while respondents with a partnerexpect to retire a year earlier, on average, than those without. On average, incomehas a downward effect on the expected retirement age, which again supports thehypothesis that the expected retirement age is influenced in part by financial feasi-bility (cf. De Nederlandsche Bank, 2004). Finally, respondents with a physicallystrenuous job expect to retire earlier.
4.5 Incentives for working longer
This section deals with how employees can be stimulated to work longer. Before con-fronting the panel with hypothetical financial incentives, section 4.5.1 charts the pref-erences for continuing to work at an older age, and the underlying factors. Therespondents were found to be quite willing to continue working beyond 65. This pre-paredness is dissected in section 4.5.2, while section 4.5.3 discusses whether respon-dents can be motivated to work longer by a reduction of marginal wage tax rates.
4.5.1 Classifying preferences
Respondents were asked whether they would consider working longer if a) they weregiven a higher pension in exchange, b) they were to earn higher net wages inexchange, c) the direct working environment requested them to do so, or d) theycould do so part-time. The first two possibilities were included in order to checkwhether respondents mainly valued short-term financial rewards (i.e. higher netwages) or whether they appreciate primarily long-term financial rewards (i.e. higherpensions) for working longer. The results are presented in Table 4.1. Around 60% ofthe respondents indicated that they might consider working longer than they hadindicated earlier, for a number of reasons. To begin with, 19% said they would if theycould do so part-time. In the second place comes continuing to work for higher net
46

47
Labour market participation of ageing workers
wages (12%), just before higher pensions (9%). Finally, 14% said they might wish tocontinue working for another reason, enjoyment of their work being a much-citedreason. Continuing to work because the direct work environment requests it is rela-tively unpopular, with a mere 6% of respondents citing this as the primary motivefor delaying retirement.
The respondents were also asked to state their second and third most importantmotives for delaying retirement. For 37% of respondents, the possibility of workingpart-time is one of the three main reasons for working longer, followed by higher netwages (32%) and higher pensions (27%). This means that the largest increase in theparticipation rate of older workers can simply be achieved by (further) stimulatingpart-time working of older employees. A major step in the right direction has alreadybeen set by the conversion of final-pay into average-pay systems, so that the implic-it penalty on part-time working at the end of one’s career has been removed.31 Fur-ther gains can be made by expanding the possibilities for part-time retirement.
A higher net wage is a more important incentive for delaying retirement than ahigher pension. This suggests that, on average, people react more strongly to finan-cial incentives which make themselves felt in the short term. In line with this, a log-it analysis – controlling for the degree of risk tolerance – shows that respondents whoare stimulated to work longer primarily by higher net wages are more impatient thanthose who give higher net wages as the second or third incentive.32
Table 4.1 also shows the average number of years that respondents are preparedto work longer per motivation. This reflects the order of the preferences; if they canwork part-time, the panel members are prepared to delay retirement by, on average,
Table 4.1 Ranking preferences
Respondent prepared to delayretirement?
Yes, for a higher pensionYes, for higher wagesYes, for colleaguesYes, part-timeOther 1
No
Total
1.1
1.3
0.8
1.5
0.6
1st to 3rdchoice
2732203714
Up to65
0.4
0.5
0.3
0.6
0.3
After 65
0.7
0.8
0.5
0.9
0.3
Response (as % of total)Average gain(# years by whichretirement is delayed) 2
1 The reply ‘Other’ could not be given as second or third choice.2 The average gain is expressed as the unconditional number of years that the panel members delay retirement for thereason stated; i.e. the product of the chance that the respondent is prepared to continue working for the reason stated,and the average number of years indicated. See Appendix 4.2 for the breakdown of this gain into the gain up to 65years of age and the gain from 65 onwards.
3rdchoice
6765-
18
2ndchoice
1113712-
17
1stchoice
9126
191439

1.5 years33; for higher net wages, 1.3 years; and for a higher pension 1.1 years. The tablefurthermore shows how many years the respondents are prepared to continue work-ing, on average, before and after 65; this is derived from the expected retirement agein combination with the number of years by which respondents say they are pre-pared to go on working per motivation (see Appendix 4.2 for an extensive explana-tion of this breakdown). The results of this exercise are remarkable, because theyshow that most of the extra years worked will be from 65 onwards.34 In the followingsection, we will be checking whether the respondents were fully aware of this fact byasking directly whether they are prepared to continue working from 65 onwards.
4.5.2 Working beyond one’s 65th birthday
As in previous waves of the dhs, the panel members were again asked directlywhether they would be prepared to work from 65 onwards, the age at which theybecome eligible for a state old age pension, if they were able to keep that pension.The answers are summarised in Chart 4.3. The Chart shows, first of all, that the pan-el’s answers in the survey of January 2005 are comparable to those in earlier surveys;34% of respondents are prepared to continue working from 65 onwards (either full-time or part-time), 56% are not prepared to do so, and 9% don’t know.35 Also, theresponse is roughly the same as the preparedness to continue working part-time, asdiscussed in the preceding section (37% being prepared to continue working part-time, see Table 4.1). On average, the respondents are prepared to continue workingtwo days a week for 1.4 years, from 65 onwards, which means that, compared to Table4.1, they are willing to work six months longer.36 This leads us to conclude that therespondents, when ranking their preferences, were already consciously indicating
48
Chart 4.3 Are you prepared to work from 65 onwards?
Percentage of respondents
Source: dnb Household Survey, January 2005
57
9No
Yes, part-time
Don’t no
Yes, fulltime
2
32

49
Labour market participation of ageing workers
that they were prepared to continue working from 65 onwards. In addition, roughly30% of retired respondents said they would like to re-enter the work force. Like thosestill working, the retired are also prepared to work about two days a week for about1.4 years.
Analysis of the characteristics of the respondents who are prepared to work from65 onwards shows that notably younger and male respondents, and those without apartner, indicate that they would be prepared to do so. Respondents with a lowerincome, a higher education or a higher risk tolerance are also more prepared to delayretirement. The panel members were further asked if they expected pension arrange-ments to become more sober (more generous) as a result of Government policy, andwhether they expect to have to work longer (be able to retire earlier). The more peo-ple are convinced that they will have to work longer and that the pension system willbe toned down, the more they are prepared to delay retirement. Thus the notion thatour pension provisions should be more sober in order to make them sustainableseems to be reflected already in expectations.
4.5.3 Higher net wages for older workers
The results show that one in eight respondents sees higher net wages as the primarymotive for working longer, while one in three sees it as one of the main three motivesfor delaying retirement (see Table 4.1). This financial incentive can come in severalguises. One possibility is to stop an employee’s pension accrual at a certain age, eventhough he continues to work (part-time). The employer’s and employee’s pensioncontributions are then stopped, which creates scope for higher net wages.37 The alter-native laid before the panel was a reduction of the marginal wage tax rates from a cer-tain age onwards. This option was chosen notably because it is unlikely to be misun-derstood by the panel, while allowing for a broader interpretation of the results.
All panel members were explicitly asked if they would work longer than they hadindicated earlier if they were to enjoy a wage tax reduction from a certain age onwards.We proposed a 10 percentage point reduction of the marginal wage tax rates. The ageat which employees become eligible for such a reduction varies from 61 to 63. Theresults are summarised in Table 4.2. 22% of the respondents are willing to delay retire-ment if this reduction is applied to wages earned as from 63. This percentage risesmarginally, if the age is lowered to 62. A more discernible increase is recorded if thereduction starts at 61; 27% of respondents are then prepared to work longer.38
Next to the summary, Table 4.2 also shows how this translates into the averagenumber of years which the respondents are prepared to work longer per motivation.This reflects earlier results (cf. Table 4.1); the panel members are prepared to contin-ue working 1.3 years when the tax reduction applies from 61 onwards of, which aboutone quarter before they turn 65 and about three quarters after that. The smaller theperiod over which they enjoy the wage tax reduction, the less prepared the panelmembers are to continue working.

The background characteristics of the respondents who are prepared to delay retire-ment show again that these are notably younger, male and better educated, as wellas those without a partner. There are also indications that, like respondents invest-ing in shares, lower-income respondents are more inclined to continue working forthe tax reduction. Finally, respondents who have above-average knowledge of theirown pension arrangements seem more prepared to work longer. This is probably dueto the fact that the overwhelming majority of respondents who are willing to con-tinue working wish to do so part-time, i.e. about two-and-a-half days a week. Respon-dents who know much about their own pension provision are probably more awareof the fact that most pension schemes have been converted from final-pay to aver-age-pay, which means that working longer part-time does not detract from the even-tual pension benefit.
4.6 A higher pension benefit for delayed retirement
The results presented in the preceding section show that one out of eleven respon-dents considers a higher pension the primary motive for delaying retirement, where-as one in four respondents sees it as one of the main three incentives. In this section,we will try to quantify this incentive. With the aid of two lists of questions, we seekto gain insight in sections 4.6.1 and 4.6.2 into the intertemporal substitution andwealth effects in retirement decisions. Here, intertemporal substitution refers to thetrade-off between the costs of working an extra year and the benefits of a higherannual pension benefit. The wealth effect refers to the influence which accumulat-ed (pension) wealth has on retirement decisions. With the aid of a third list of ques-tions, we then check in section 4.6.3 the consistency of our findings.
50
Table 4.2 Will you continue working if wage tax is reduced from age...
… 63?… 62?… 61?
Total
0.9
1.1
1.3
Up to 65
0.2
0.3
0.3
From 65onwards
0.7
0.8
1.0
Response (as % of total) Average gain(# years by which retirementis delayed) 1
1 The average gain is expressed as the unconditional number of years by which the panel members delay retirementfor the reason stated: i.e. the product of the chance that the respondent is prepared to continue working for the reasonstated, and the average number of years indicated. See Appendix 4.2 for the breakdown of this gain into gain up to 65and gain from 65 onwards.
Don’t Know
202122
No
585651
Yes
222327

4.6.1 Intertemporal substitution
Blake (2004) describes the intertemporal substitution effect as the preparedness todelay retirement in exchange for a higher annual pension benefit. The intertempo-ral substitution effect – if relevant to a retirement decision – is obviously a majorissue in the reform of the pension system towards a more actuarially neutral system.After all, such a reform is meaningful only if people really make an intertemporalchoice when considering when to retire. The measure of intertemporal substitutionby respondents in the dhs was charted by asking them directly how much longerthey would continue working, or how much earlier they would stop working, at agiven increase/decrease in the annual pension benefit.
Appreciation of a higher pension benefitThe panel was first asked whether they would be willing to work longer for a 5 per-centage point increase in their annual pension benefit. As an alternative for workinglonger, respondents could indicate that they were willing to pay a higher pensioncontribution, possibly in combination with working longer. Respondents could alsoindicate that they were not prepared to work longer or to pay higher pension contri-butions. Over 50% of the respondents stated that they were not prepared to worklonger for the above increase, see Table 4.3. More than 20% of the respondents arewilling to continue working, while a further 25% are prepared to (partly) pay a high-er contribution for a higher pension benefit.
Depending on their willingness to work longer or to pay for a higher pension,the respondents were asked to quantify this willingness. Respondents willing to worklonger for a higher pension indicated that they are prepared to do so for nearly twoyears. Those ready to pay more for a higher pension are, on average, willing to sac-rifice 21/2% of their gross wages. Respondents who opt for a combination of workinglonger and paying a higher contribution were then asked how long they were pre-pared to go on working and how much extra contribution they were prepared to pay.They turned out to be willing to work more than 11/2 years longer, and to pay a high-er contribution, averaging 2% of gross wages.39 Although this means that they are lessprepared to continue working, and to pay less extra contribution, their readiness topay resembles that of respondents who have opted for either working longer or pay-ing more. This outcome suggests that the succession of the two extra questions is notinterpreted by the respondents as such.40 In the further analysis, we therefore foundlittle difference between respondents willing to continue working and pay extra con-tribution and those willing to work who are not prepared to pay extra. It is notablyyounger, male respondents, and those without a live-in partner who are prepared atall to work longer or to pay for a higher pension benefit. In addition, notably respon-dents with a lower income are willing to work longer for a higher pension, whilerespondents with higher incomes are more prepared to pay extra for a higher pen-sion. A preference for a combination of working longer and paying extra is alsoevinced relatively more often by home owners.
51
Labour market participation of ageing workers

The will towards intertemporal substitution can be summarised as follows. 21% to34% of respondents say they are willing to work 11/2-2 years for a 5 percentage pointhigher pension. On the basis of a conservative estimation (21% willing to work 11/2
years longer)41, it follows that the panel is prepared to delay retirement by 0.3 year inorder to raise their pension benefit by 5 percentage points. An optimistic estimation(34% willing to work 2 years longer) puts the average period by which retirement isdelayed at 0.7 year. The economic consequences of these results are discussed indetail later.
Compensation for a lower pension benefitIn order to gain insight into the symmetry of the intertemporal substitution effect,the panel members were also asked their opinion on a lower pension benefit in
52
a) What are you prepared to do for a 5 percentage point increase in your pensionbenefit (for example, from 70% of final pay to 75%)?– I am prepared to work longer– I am prepared to pay a higher contribution– I am prepared to work longer and pay a higher contribution– I am satisfied with the level of my pension benefit and am not
prepared to work longer nor to pay a higher contribution
– half a year– one year– one-and-a-half years – two years– two-and-a-half years– three years– more than three years
b) How many years are you prepared to work for this 5 percentage point increasein your pension benefit?
– 1% of my gross wages– 2% of my gross wages– 3% of my gross wages– 4% of my gross wages– 5% of my gross wages– 6% of my gross wages– more than 6% of my gross wages
c) How much contribution, as a percentage of your wages, are you prepared to payfor a 5 percentage point increase in your pension benefit?
21%10%13%
56%
Table 4.3 Effort required for a 5 percentage point increase in the pension benefit

exchange for early retirement or a lower pension contribution. Here, too, the respon-dents could indicate whether they wished to be compensated for a 5 percentage pointreduction of the pension benefit in the form of early retirement and/or lower pen-sion contributions, or whether they consider such a reduction of the pension bene-fit totally undesirable in the face of the compensations proposed, see also Table 4.4.Nearly 50% of the respondents considered the proposed compensation for the low-er benefit sufficient. Yet it would seem that it is not only the prospect of being ableto retire early which explains the preparedness to accept a lower pension benefit, asthe number of respondents demanding to be fully compensated in the form of ear-ly retirement remains roughly 20%. The large difference is accounted for by the shareof respondents who consider a combination of early retirement and lower pensioncontributions a satisfactory compensation for a lower pension benefit. This is now18%, as against 13% who are ready to work longer and pay a higher contribution inorder to receive a higher pension benefit.
Another difference vis-à-vis the preceding scenario of a higher pension benefit isthat, on average, respondents desire a greater compensation for a reduction of theirpension benefit than they are prepared to give for the same increase of their pensionbenefit. Respondents who consider as a full compensation for lower pension bene-fits a lower contribution, wish to contribute an average of 41/2% of their gross wageless, while being prepared to pay a mere 21/2% of their gross wage extra for the sameincrease in their pension benefits.42 Here, too, respondents who consider a combi-nation of early retirement and lower contributions a satisfactory compensationseem, on average, to seek the desired combination mainly in the sum of the two. Onaverage, they wish to retire 21/2 year earlier, and to pay, on average, about 4% less pen-sion contribution.43 Respondents who consider retiring earlier to be full compensa-tion for a lower pension benefit wish to retire, on average, over 2 years earlier, statis-tically the same number of years that they are prepared to continue working for thesame increase of the pension benefit. In terms of the intertemporal substitutioneffect, it turns out that for a 5 percentage point reduction of the pension benefit, peo-ple wish to retire 0.4-0.8 year earlier, which is slightly more, but largely comparablewith the earlier estimation of this effect.44
In this scenario, too, it is mainly younger, male respondents who are prepared toaccept a lower pension benefit in exchange for early retirement and/or a lower con-tribution. Furthermore, patient respondents and home owners are more prepared toaccept a lower pension benefit. For home owners, there is probably the added factorthat they can use their home assets as a buffer against a lower pension benefit (cf.Blake, 2004). Respondents with share holdings have a relatively frequent preferencefor a combination of early retirement and a lower contribution. Finally, respondentswith a relatively low income are more inclined to opt for a combination of earlyretirement and a lower contribution in compensation for a lower pension benefit.Possibly, they cannot afford a full compensation for the lower pension benefit in theform of early retirement, which corresponds with the finding that respondents witha lower income are more prepared to continue working for a higher pension benefit.
53
Labour market participation of ageing workers
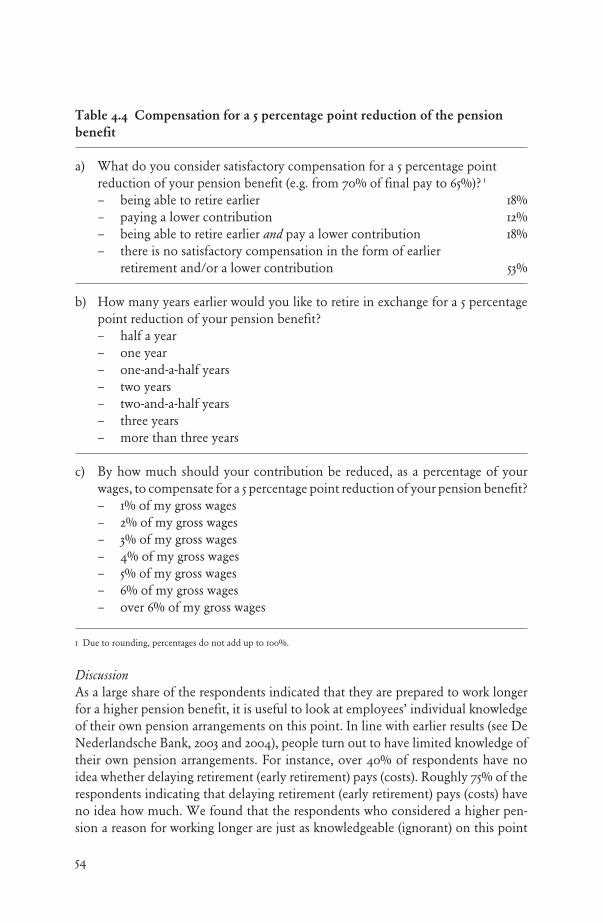
DiscussionAs a large share of the respondents indicated that they are prepared to work longerfor a higher pension benefit, it is useful to look at employees’ individual knowledgeof their own pension arrangements on this point. In line with earlier results (see DeNederlandsche Bank, 2003 and 2004), people turn out to have limited knowledge oftheir own pension arrangements. For instance, over 40% of respondents have noidea whether delaying retirement (early retirement) pays (costs). Roughly 75% of therespondents indicating that delaying retirement (early retirement) pays (costs) haveno idea how much. We found that the respondents who considered a higher pen-sion a reason for working longer are just as knowledgeable (ignorant) on this point
54
a) What do you consider satisfactory compensation for a 5 percentage pointreduction of your pension benefit (e.g. from 70% of final pay to 65%)? 1
– being able to retire earlier– paying a lower contribution– being able to retire earlier and pay a lower contribution– there is no satisfactory compensation in the form of earlier
retirement and/or a lower contribution
– half a year– one year– one-and-a-half years – two years– two-and-a-half years– three years– more than three years
b) How many years earlier would you like to retire in exchange for a 5 percentagepoint reduction of your pension benefit?
– 1% of my gross wages– 2% of my gross wages– 3% of my gross wages– 4% of my gross wages– 5% of my gross wages– 6% of my gross wages– over 6% of my gross wages
c) By how much should your contribution be reduced, as a percentage of yourwages, to compensate for a 5 percentage point reduction of your pension benefit?
1 Due to rounding, percentages do not add up to 100%.
Table 4.4 Compensation for a 5 percentage point reduction of the pension
benefit
18%12%18%
53%

as respondents who do not consider this a reason to delay retirement. This is an indi-cation of the uncertainty margin with which we must interpret the efficacy of thisfinancial incentive.45 It also indicates that much may be gained by providing moreinformation.
The results in this section also show that the effects of a reform of the pensionsystem on behaviour depend largely on the nature of the reform(s). On the one hand,employees may be given the choice between delayed retirement with a higher pen-sion benefit and early retirement with a lower pension benefit. According to ourresults, people with lower incomes will continue working in order to supplementtheir old age income. With the conversion of early retirement schemes into pre-pen-sion schemes, the retirement age has already become flexible, with consequences forthe level of the pension benefit. This means that part of the gain in terms of the par-ticipation rate has already been achieved. However, as many people are not aware ofthese incentives, some gains may as yet be achieved via an information campaign.On the other hand, employees can be given more freedom to vary the level of thepension contribution, with consequences for the level of their pension benefits. Ourresults show that, in this case mainly higher-income employees are prepared to paymore contribution for a higher benefit. This all seems to suggest that reform of thepension system also has distribution aspects.46
4.6.2 The wealth effect
We saw above that relatively wealthy respondents take a different view of a changein the pension benefit than relatively poor respondents. A purely intertemporal sub-stitution effect is clearly hard to distinguish from a wealth effect. The wealth effectsummarises the effect of greater wealth or a higher guaranteed pension income onpension decisions (cf. Blake, 2004). In this section, we seek to isolate this wealtheffect by asking the panel members to give their opinion on an increase of the pen-sion accrual percentage, in combination with an unchanged pension contribution.47
We then check whether the respondents react to this exogenous increase in (pen-sion) wealth mainly by retiring early, or whether they prefer a higher pension bene-fit. In order to show the (a)symmetry of the wealth effect, we also asked them to com-ment on the same decrease of the accrual percentage. The results are summarised inTable 4.5.
The respondents could indicate whether they would react to a change in theaccrual percentage by retiring earlier or later, by accepting a higher or lower pensionbenefit, or a combination of both. In reaction to an increase in pension wealth (ahigher accrual percentage), 40% of respondents indicated that they would opt forearlier retirement, and 34% for a higher pension benefit. The remaining 26% chosea combination of early retirement and a higher pension benefit. Of the latter, a widemajority set equal store by retiring early and a higher pension, while 6% preferredearly retirement and the remaining 4% a higher pension. This means that a total 46%
55
Labour market participation of ageing workers
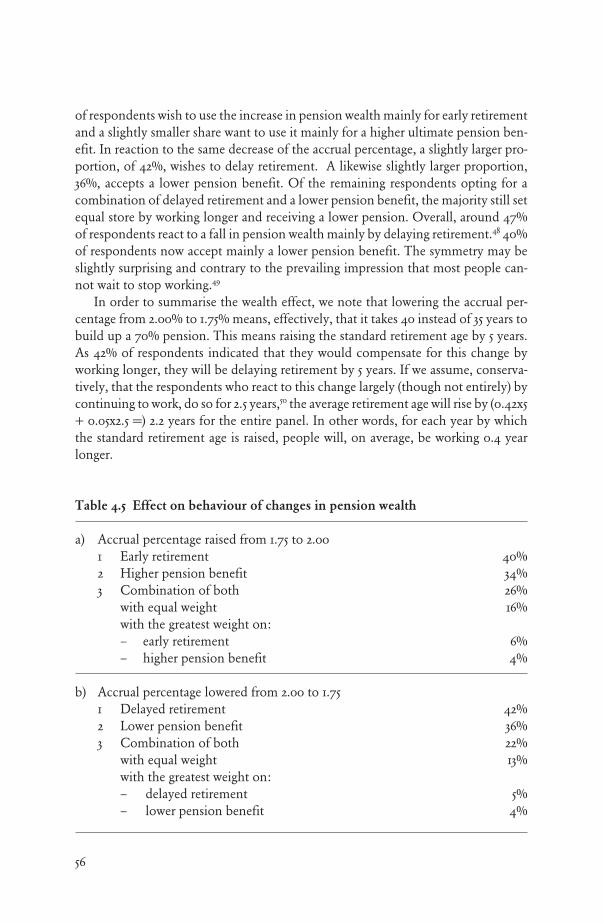
of respondents wish to use the increase in pension wealth mainly for early retirementand a slightly smaller share want to use it mainly for a higher ultimate pension ben-efit. In reaction to the same decrease of the accrual percentage, a slightly larger pro-portion, of 42%, wishes to delay retirement. A likewise slightly larger proportion,36%, accepts a lower pension benefit. Of the remaining respondents opting for acombination of delayed retirement and a lower pension benefit, the majority still setequal store by working longer and receiving a lower pension. Overall, around 47%of respondents react to a fall in pension wealth mainly by delaying retirement.48 40%of respondents now accept mainly a lower pension benefit. The symmetry may beslightly surprising and contrary to the prevailing impression that most people can-not wait to stop working.49
In order to summarise the wealth effect, we note that lowering the accrual per-centage from 2.00% to 1.75% means, effectively, that it takes 40 instead of 35 years tobuild up a 70% pension. This means raising the standard retirement age by 5 years.As 42% of respondents indicated that they would compensate for this change byworking longer, they will be delaying retirement by 5 years. If we assume, conserva-tively, that the respondents who react to this change largely (though not entirely) bycontinuing to work, do so for 2.5 years,50 the average retirement age will rise by (0.42x5+ 0.05x2.5 =) 2.2 years for the entire panel. In other words, for each year by whichthe standard retirement age is raised, people will, on average, be working 0.4 yearlonger.
56
Table 4.5 Effect on behaviour of changes in pension wealth
1 Early retirement2 Higher pension benefit3 Combination of both
with equal weightwith the greatest weight on:– early retirement– higher pension benefit
b) Accrual percentage lowered from 2.00 to 1.75
40%34%26%16%
6%4%
42%36%22%13%
5%4%
a) Accrual percentage raised from 1.75 to 2.00
1 Delayed retirement2 Lower pension benefit3 Combination of both
with equal weightwith the greatest weight on:– delayed retirement– lower pension benefit
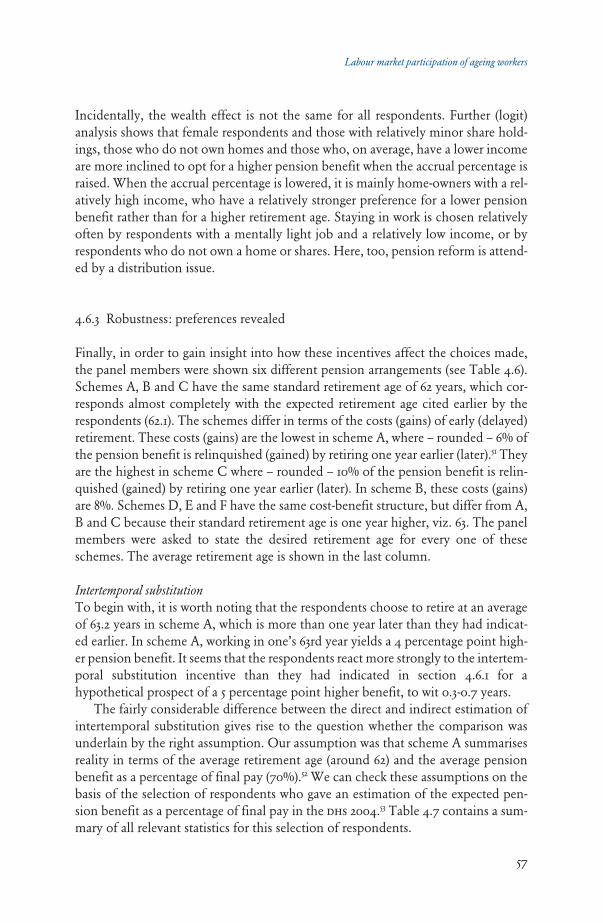
57
Labour market participation of ageing workers
Incidentally, the wealth effect is not the same for all respondents. Further (logit)analysis shows that female respondents and those with relatively minor share hold-ings, those who do not own homes and those who, on average, have a lower incomeare more inclined to opt for a higher pension benefit when the accrual percentage israised. When the accrual percentage is lowered, it is mainly home-owners with a rel-atively high income, who have a relatively stronger preference for a lower pensionbenefit rather than for a higher retirement age. Staying in work is chosen relativelyoften by respondents with a mentally light job and a relatively low income, or byrespondents who do not own a home or shares. Here, too, pension reform is attend-ed by a distribution issue.
4.6.3 Robustness: preferences revealed
Finally, in order to gain insight into how these incentives affect the choices made,the panel members were shown six different pension arrangements (see Table 4.6).Schemes A, B and C have the same standard retirement age of 62 years, which cor-responds almost completely with the expected retirement age cited earlier by therespondents (62.1). The schemes differ in terms of the costs (gains) of early (delayed)retirement. These costs (gains) are the lowest in scheme A, where – rounded – 6% ofthe pension benefit is relinquished (gained) by retiring one year earlier (later).51 Theyare the highest in scheme C where – rounded – 10% of the pension benefit is relin-quished (gained) by retiring one year earlier (later). In scheme B, these costs (gains)are 8%. Schemes D, E and F have the same cost-benefit structure, but differ from A,B and C because their standard retirement age is one year higher, viz. 63. The panelmembers were asked to state the desired retirement age for every one of theseschemes. The average retirement age is shown in the last column.
Intertemporal substitutionTo begin with, it is worth noting that the respondents choose to retire at an averageof 63.2 years in scheme A, which is more than one year later than they had indicat-ed earlier. In scheme A, working in one’s 63rd year yields a 4 percentage point high-er pension benefit. It seems that the respondents react more strongly to the intertem-poral substitution incentive than they had indicated in section 4.6.1 for ahypothetical prospect of a 5 percentage point higher benefit, to wit 0.3-0.7 years.
The fairly considerable difference between the direct and indirect estimation ofintertemporal substitution gives rise to the question whether the comparison wasunderlain by the right assumption. Our assumption was that scheme A summarisesreality in terms of the average retirement age (around 62) and the average pensionbenefit as a percentage of final pay (70%).52 We can check these assumptions on thebasis of the selection of respondents who gave an estimation of the expected pen-sion benefit as a percentage of final pay in the dhs 2004.53 Table 4.7 contains a sum-mary of all relevant statistics for this selection of respondents.
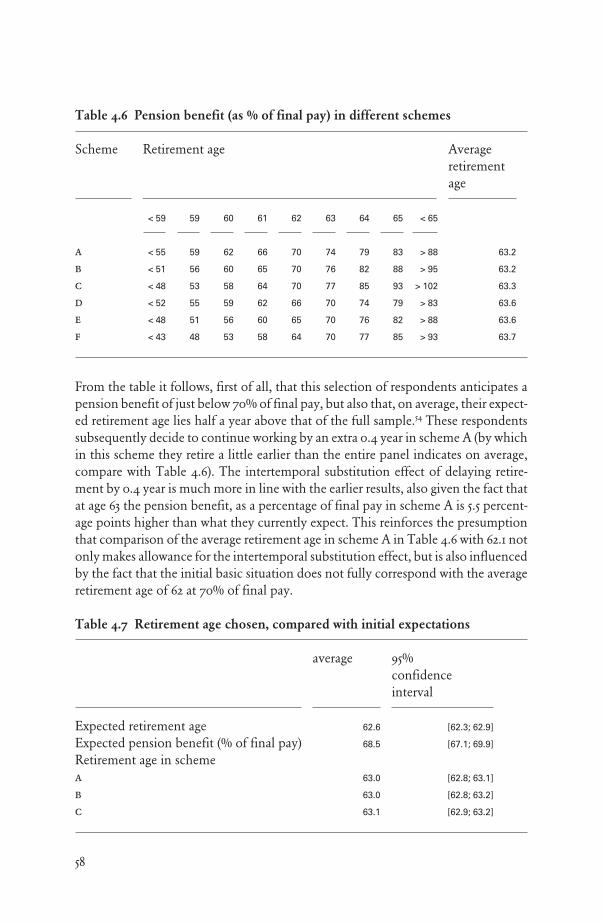
From the table it follows, first of all, that this selection of respondents anticipates apension benefit of just below 70% of final pay, but also that, on average, their expect-ed retirement age lies half a year above that of the full sample.54 These respondentssubsequently decide to continue working by an extra 0.4 year in scheme A (by whichin this scheme they retire a little earlier than the entire panel indicates on average,compare with Table 4.6). The intertemporal substitution effect of delaying retire-ment by 0.4 year is much more in line with the earlier results, also given the fact thatat age 63 the pension benefit, as a percentage of final pay in scheme A is 5.5 percent-age points higher than what they currently expect. This reinforces the presumptionthat comparison of the average retirement age in scheme A in Table 4.6 with 62.1 notonly makes allowance for the intertemporal substitution effect, but is also influencedby the fact that the initial basic situation does not fully correspond with the averageretirement age of 62 at 70% of final pay.
58
Table 4.6 Pension benefit (as % of final pay) in different schemes
65
83
88
93
79
82
85
< 65
> 88
> 95
> 102
> 83
> 88
> 93
63.2
63.2
63.3
63.6
63.6
63.7
Retirement ageScheme Averageretirementage
64
79
82
85
74
76
77
63
74
76
77
70
70
70
62
70
70
70
66
65
64
61
66
65
64
62
60
58
60
62
60
58
59
56
53
59
59
56
53
55
51
48
< 59
< 55
< 51
< 48
< 52
< 48
< 43
abcdef
Table 4.7 Retirement age chosen, compared with initial expectations
[62.3; 62.9]
[67.1; 69.9]
[62.8; 63.1]
[62.8; 63.2]
[62.9; 63.2]
average 95% confidenceinterval
62.6
68.5
63.0
63.0
63.1
Expected retirement ageExpected pension benefit (% of final pay)Retirement age in schemeabc

We also see in Table 4.6 that, on average, the panel members choose the same retire-ment age of 63.2 in scheme b as in scheme a, and only a slightly higher retirementage in scheme c, where the intertemporal substitution incentive is the strongest.55 Inthese schemes, continuing to work in the 64th year yields a higher benefit of 6 and8 percentage points, respectively. The size of wealth in the basic situation could bedecisive for the degree to which people are prepared to undertake intertemporal sub-stitution. We will look into this later. First, it must be noted that the intertemporalsubstitution incentives contained in scheme c cannot be provided cost-effectively;the Nederlandsche Bank’s pension model palmnet provides for an actuarially neu-tral remuneration for an extra year’s work of roughly 8% (Van Rooij et al., 2004b),while in scheme c (and f, too) the pension benefit is raised by – rounded – 10% forevery extra year worked. According to this measure, schemes b and e contain incen-tives which are exactly cost-effective, while schemes a and d compensate contribu-tors insufficiently, in actuarial terms, for the extra years worked. In this light, theresults suggest that pension schemes need not be completely actuarially neutral inorder to have major participation effects on older employees; the average retirementage in scheme a is already much higher than indicated earlier by the respondents,while the extra gains from the stronger incentives contained in scheme B are minor.Analysis of the background characteristics of the respondents shows, incidentally,that it is notably younger respondents and those without a live-in partner, with a rel-atively low income or mentally light work, but also home-owners, who are inclinedto continue working when the intertemporal substitution incentives are stronger;this is largely in line with earlier findings.
Wealth effectsTable 4.6 also harbours a wealth effect which we can compare with the answers tothe direct questions about wealth and retirement in section 4.6.2. As the standardretirement age in schemes d, e and f is one year higher than in schemes a, b and c,we would have expected, on the basis of earlier findings, the average retirement agein schemes d, e and f to be 0.4 year higher than in schemes a, b and c. These expec-tations correspond with the average retirement age indicated in the latter threeschemes, which is 0.4 year higher than in the corresponding scheme with the lowerstandard retirement age.56 This means that toning down pension schemes has a con-siderable positive effect on the retirement age. Incidentally, boosting the intertem-poral substitution incentives has little effect on these leaner schemes, as the averageretirement age remains virtually constant at around 63.6 years.57 Analysis of the back-ground characteristics shows that notably respondents with considerable knowledgeof their own pension arrangements, as well as younger and male respondents are pre-pared to work longer when pensions are toned down. This means that when a pen-sion system is toned down, it may take some time before the effects show up in ahigher actual retirement age.
Labour market participation of ageing workers
59

4.7 Summary and conclusions
The survey results discussed in this section indicate that three out of every five Dutchemployees can be motivated to delay retirement. (Further) stimulating the possibil-ities for older employees to continue working, part-time, seems the most effectiveway of keeping them involved in the labour process. We show that they are then, onaverage, prepared to continue working one-and-a-half years longer. As most pensionschemes have now been converted from final pay to average pay, part-time workingat the end of one’s career is no longer disproportionately detrimental to the pensionbenefit. In addition, most people can be motivated to stay in work by means of finan-cial incentives. The survey results show that people are prepared to continue work-ing if they are financially compensated for doing so in the short term. In combina-tion with the above, this outcome suggests, for instance, that part-time retirementhas considerable positive effects on participation, especially if part-time retirees areno longer required to pay pension contributions. This would be in line with the pre-paredness of respondents to continue working, but part-time, and their wish to earna larger net amount while doing so.
Financial incentives can furthermore be incorporated into (early) retirementschemes in the shape of the level of the benefit and the flexibility of the retirementage with the attending remuneration or, as the case may be, price. Toning down apension scheme so that employees are required to work one year longer in order toobtain a full benefit makes employees delay their retirement by, on average, half ayear. If, in addition, the annual pension benefit increases by 6% for every extra yearworked, employees are prepared to delay retirement by, on average, nearly sixmonths more. Apparently, if people are rewarded in their pension schemes for work-ing longer, considerable gains can be achieved in terms of a higher participation rateof older people; moreover, such financial stimuli can be provided in an actuariallyneutral manner, and there is even some scope for maintaining intergenerational sol-idarity. As many pension schemes already include such elements, the extra gains tobe made in terms of financial incentives may be limited.
In many early retirement schemes, the generosity of the benefits depends large-ly on the fiscally friendly accrual of early retirement wealth. The results in this Chap-ter indicate that cutting down on early retirement schemes – for instance by abolish-ing such a fiscal facility – may have important positive effects on the participationrate. On the one hand, the abolition of the fiscally friendly payment of early retire-ment contributions makes saving for early retirement relatively unattractive (withmore net pay now having to be surrendered for the same duration of early retire-ment). On the other, in a defined contribution scheme, the early retirement benefitis reduced when the fiscally friendly treatment of the accrual of early retirementwealth is abolished (as it takes longer to accumulate early retirement wealth whencontributions remain the same).
As it is mostly younger people who are prepared to continue working when facedwith various measures, the initial effects of alternative incentives could prove mod-
60

est, however. This needs to be taken into account in an evaluation of the efficacy ofpolicy measures; policy adjustments will only make themselves felt in full in thelonger term, when the expectations and behaviour of younger employees havechanged. The current austerity measures already seem to be making themselves feltin part among younger employees; on average, they expect to stop working at a lat-er age than their older colleagues. Stimulating employees aged 65 and older to work(part-time) can, however, have a fairly direct result as the survey results indicate thatfor a substantial proportion of retirees this is an incentive to re-enter the labourprocess.
Another important conclusion follows from the confrontation of the prepared-ness to continue working with the income and wealth characteristics of the respon-dent or his or her household. Policy induced changes in the financial considerationsof employees can have major distribution effects. Employees with lower incomes orlittle wealth are generally more prepared to delay retirement, if this means receivinga higher pension. Employees with a higher income or more wealth, however, aremore prepared to pay extra for a higher pension, and prefer to run down their wealthrather than delay retirement. This distribution issue will be given the necessaryweight in the discussion about the actual reform of a pension system that has alwaysset great store by solidarity.
Moreover, allowance must be made for the fact that three out of four respon-dents are not thinking (at all) about when to stop working. In addition, the surveyresults show that many people have little knowledge of their own pension provision.This would indicate that compared to earlier surveys little has changed with regardto the interest displayed by the average Dutch employee in his or her pensionarrangements. The ensuing policy recommendation is twofold. To begin with, thegovernment could, under the motto ‘What you don’t know can’t help you’, embarkon an information campaign in its effort to raise the participation rate of olderemployees by drawing attention to the financial stimuli already provided for in cur-rent pension schemes. Furthermore, policy changes aimed at boosting financialincentives will clearly have to be attended by a well-considered communication strat-egy in order to have maximum effect.
The general picture emerging from this Chapter is that there are no insurmount-able limitations on the supply side of the older segment of the labour market whichthwart an increase in the participation rate of older employees. One question whichcould not be addressed in the household survey remains: Does the supply of olderlabour automatically create demand? Although this study did not look at the func-tioning of the older segment of the labour market, it is reassuring to note that incountries where the participation rate of older employees is high, the employmentrate of older employees is also high (Casey et al., 2003). Model simulations (see Chap-ter 2) indicate that the extra supply of labour will eventually be absorbed.
61
Labour market participation of ageing workers

62
Appendix 4.1Construction of pension knowledge, impatienceand risk tolerance
Individual pension knowledge can be gleaned by means of four questions about spe-cific aspects of the respondents’ own pension arrangements, see Box A4.1 (cf. VanEls et al., 2004). We assumed that a respondent has knowledge of an aspect of hispension arrangements if he does not answer the question with ‘don’t know’. Withthe aid of factor analysis, the knowledge of these four aspects was then summarisedin a single figure showing how knowledgeable the respondent is about his own pen-sion provision. Analysis shows that knowledge of all four aspects shares a single com-mon, unobserved factor, which has a positive correlation with the knowledge of eachof the four individual aspects.58 We therefore call this factor pension knowledge.
As the response to question 3 is much lower than to the other questions, we ulti-mately constructed the variable pension knowledge on the basis of questions 1, 2 and4 only. This raised the number of useful observations by over one third. Here, too,factor analysis resulted in a single, unobserved, common factor in the answers to
Table A4.1 Pension knowledge
Independent variable Estimatedparameters
GenderAgeEducationJobPensionPartnerIncomeHome ownershipShare holdingsConstant term
Number of observationsAdj-R2
0.28 (6.7)
0.02 (10.8)
0.06 (3.8)
0.16 (2.9)
0.19 (1.9)
-0.15 (2.9)
0.15 (6.4)
0.11 (2.2)
0.12 (2.5)
-2.02 (14.7)
941
27.6
Noten: ols estimation results. The dependent variable is pension knowledge, i.e. the respondent’s knowledge of his orher own pension arrangements, measured on the basis of factor analysis. Absolute t-values are shown in parentheses.

63
Labour market participation of ageing workers
915
1520
Box A4.1. Knowledge of four aspects of pension arrangements
1. What pension arrangement do you have?1 final pay2 average pay 3 defined contribution 4 other5 don’t know
2. Pension arrangements may contain a provision that the levelof pension entitlements, pensions already being paid, or both,will be adjusted. Such an adjustment may be on the basis of aprice or wage index, or a combination of both. This is calledindex-linking. Is your (future) pension index-linked?1 yes2 no3 don’t know
3. What pension entitlements have you accumulated as per 1January 2002, according to the pension statement, at the pen-sion fund of your current/last employer? These entitlements are the amount paid to you annually, ifyou had stopped working from then on. Note: The answer to this question should be based on yourcurrent marital status. No allowance should be made for yourentitlement to a state old age pension.amount in euro9999999 don’t know
4. What percentage of your final net pay do you expect your netpension (including the state old age pension) to be? (Forthose who have already retired early, this question refers tofinal pay before early retirement.) percentage of final net pay before retirement9999 don’t know
# answers1468
1468

these three questions; this factor again showed a positive correlation with awarenessof each of the three individual aspects of pension arrangements. This factor, whichwe call pension knowledge, has an average value of 0 and varies between a minimumof -1.16 and a maximum of 0.80. Tables A4.1 and A4.2 show the correlation betweenpension knowledge and a set of personal and household characteristics, as well as thecorrelation between the underlying components of pension knowledge and the sameset of personal and household characteristics. The results are consistent with thoseof Van Els et al. (2004).
ImpatienceIndividual impatience can be gleaned from the degree to which respondents agreewith twelve statements about the future, in combination with the answers to twoquestions about their spending habits (see Box A4.2). Someone is impatient whenhe or she is more concerned with issues with which he/she will be confronted with-in the near future. An impatient person will therefore be more inclined to agree with
64
Table A4.2 Knowledge of individual aspects of pension arrangements
(outcomes and marginal effects in percentage points)
Notes: Marginal effects of a change in the independent variable on the chance of a positive answer, on the basis oflogit analysis. For 0-1 dummies, the marginal effect refers to a discrete change in the dummy variable from 0 to 1, forthe other independent variables the sample average is used as the reference value. Absolute t-values are shown inparentheses.1 Percentage of the respondents answering anything but ‘don’t know’ to questions on individual pensionarrangements (see Box A4.1).
… how thepension is builtup
… indexation … pensionentitlements
… the ultimatelevel of thepensionbenefit
71
12.3 (4.2)
1.3 (8.7)
3.8 (3.9)
9.4 (2.4)
-3.6 (0.6)
-5.1 (1.7)
5.6 (3.9)
6.9 (2.1)
5.6 (1.8)
1132
16.4
18.1 (5.3)
1.5 (8.1)
2.8 (2.3)
-0.8 (0.2)
13.1 (2.1)
-7.5 (1.9)
11.8 (6.3)
11.1 (2.8)
7.8 (2.1)
1132
21.8
58 50
1.3 (0.3)
1.6 (6.7)
6.5 (4.1)
10.8 (1.8)
27.5 (2.9)
-3.5 (0.7)
5.9 (2.3)
9.2 (1.8)
1.2 (0.2)
685
11.4
54
15.4 (4.8)
0.6 (3.8)
3.5 (3.0)
9.3 (2.4)
19.9 (2.8)
-5.3 (1.3)
5.4 (3.1)
2.7 (0.7)
11.4 (2.9)
1153
8.0
% of respondents who areaware of … 1
GenderAgeEducationJobPensionPartnerIncomeHome ownershipShare holdings
Number of observationsPseudo-R2

65
Labour market participation of ageing workers
Box A4.2 Indicators of impatience
Statements about the futurePlease indicate, on a scale of 1 (indicating total disagreement) to 7 (indicating total agree-ment), to what extent you agree with the following statements. 1. I think about how things could be in the future, and try to influence them in my daily
life.2. I often think about matters which will only begin to have consequences in several
years’ time.3. I only think about current matters, and assume that things will work out in the future.4. I always think only about the immediate consequences (in terms of days or weeks) of
whatever I am doing.5. Convenience is a major consideration in my decisions and actions. 6. I am prepared to sacrifice my current well-being for certain results in the future.7. I believe it is important to take warnings about the negative consequences of my
actions seriously, even if these negative consequences were to make themselves feltonly in the distant future.
8. I believe it is more important to think about matters which will have major consequen-ces in the future, than about matters which have immediate but less important conse-quences.
9. I generally ignore warnings about future problems because I think they will solve them-selves.
10. I consider it unnecessary to make sacrifices for future matters because they can alwaysbe sorted out later.
11. I react only to immediate problems, on the assumption that I will deal with later pro-blems when they present themselves.
12. I get clear results in my daily work; this is more important to me than working withvague results.
Questions on spending behaviour1. Some people spend all the money they receive immediately. Others save for a nest egg.
Please indicate on a scale of 1 to 7 what you do with the money left after you have paidfor food, the rent, and other daily necessities, with 1 indicating that you intend tospend your money immediately and 7 that you intend to save as much as possible.
2. People use different time horizons when deciding how much of their income to spendor to save. Which of the time horizons set out below is most important to you whenmaking spending and saving decisions?1 the next couple of months2 the next year3 the next few years4 the next five to ten years5 more than ten years ahead

66
statements 3, 4, 5, 9, 10, 11 and 12 and less with the other statements. That person willalso score low on the two questions about spending habits.
Factor analysis shows one common factor in the response to these statements andquestions.59 It follows from the factor weights presented in Box A4.3, that this factorsummarises the respondent’s impatience very well, as the weight is positive for allstatements on which we expect impatient respondents to score high and negative forthe other statements and the questions, on which we expect impatient persons toscore low. Impatience can be determined for 2083 respondents, it has an average val-ue of 0 and moves between a minimum of -2.52 and a maximum of 2.95.
Risk toleranceThe measure of risk tolerance determines what weight a respondent assigns to riskand return in a (financial) decision. The greater the risk tolerance, the more valuepeople attach to return and the less to the uncertainty of this return. The greater therisk aversion, however, the greater the weight given to uncertainty, and consequent-ly a lower the return is accepted in exchange for a more certain return. We gleanedthe individual measure of risk tolerance from the measure of agreement evinced bythe respondents with six questions about saving and risk-taking, in combination withinformation about their investment behaviour and preferences with regard to pen-sion arrangements, see box A4.4.
Risk tolerance was determined in three ways by means of factor analysis. First ofall, on the basis of the six statements about saving and risk-taking only. This result-ed in a single common factor which – given the factor weights in Box A4.5 – suffi-ciently summarised the risk tolerance of 1967 respondents.60 In the second analysis,we also included the characteristics of the respondent’s investment behaviour. We
Box A4.3 Factor weights on impatience
Statement 1Statement 2Statement 3Statement 4Statement 5Statement 6Statement 7Statement 8Statement 9Statement 10Statement 11Statement 12Question 1Question 2
-0.42
-0.53
0.69
0.24
0.07
-0.29
-0.27
-0.34
0.58
0.63
0.71
0.53
-0.21
-0.34

67
Labour market participation of ageing workers
Box A4.4 Indicators of risk tolerance
Statements about saving and risk-takingPlease indicate, on a scale of 1 (indicating total disagreement) to 7 (indicating totalagreement), to what extent you agree with the following statements.1. I prefer safe investments and a guaranteed return rather than take risks in the
hope of achieving the highest return. 2. I shall never invest in shares because I consider the risk too great.3. If I believe an investment will be profitable, I am prepared to borrow to make
that investment. 4. I want my investments to be sound.5. I am increasingly convinced that I need to take more financial risk if I wish to
improve my financial position.6. I am prepared to risk loss, in order to make money.
Characteristics of investment behaviourInvesting in shares: 1 = invests in shares or investment funds; 0 = does not investin shares or investment funds.Investing in derivatives: 1 = owns/writes put options, call options, falcons, war-rants; 0 = does not own/write derivatives.
Preferences as to pension arrangements and risk-takingPension1 Which of the following statements applies to you most?1. I prefer to pay less contribution for a pension which is expected to be equally
high on average, but where the ultimate pension benefit may be higher or lower,as a result of the investment form chosen (pension assets invested largely in sha-res). (risk tolerant)
2. Don’t know. (risk neutral)3. I prefer to pay more contribution for a guaranteed pension (pension assets inves-
ted largely in bonds). (risk averse)Pension2 Imagine the following two pension arrangements:A: your pension is guaranteed to be 70% of final pay.B: your pension is:
A chance of 1 in 10 - 50% of final payA chance of 2 in 10 - 60% of final payA chance of 4 in 10 - 70% of final payA chance of 2 in 10 - 80% of final payA chance of 1 in 10 - 90% of final pay
Suppose the standard pension arrangement is b.How much extra contribution are you prepared to pay monthly for the security ofarrangement a?1. No extra contribution, preference for arrangement b. (risk tolerant)2. Don’t know. (risk neutral)3. 0.25% to over 2% of gross wages. (risk averse)

68
expected that more risk-tolerant respondents would also be more inclined to investin shares and derivatives. This more detailed determination of risk tolerance couldbe constructed for 1611 respondents; it also resulted in a single common factor and– given the correlation with the first risk tolerance analysis – is in line with the lessdetailed exercise. In the final analysis, we also included risk preferences in the pen-sion domain. This most detailed analysis again resulted in a single common factor,reflecting the degree of risk tolerance of 1113 respondents, and showed a strong cor-relation with the other two less detailed measures of risk tolerance.61
Box A4.5 Factor weights on risk tolerance
Statement 1Statement 2Statement 3Statement 4Statement 5Statement 6Share holdingsHoldings of derivativesPension1Pension2
# observations
correlation with12
2
-0.11
-0.24
0.14
-0.12
0.18
0.41
0.12
0.03
1611
0.986
1
-0.11
-0.19
0.15
-0.12
0.21
0.48
1967
3
-0.13
-0.22
0.12
-0.12
0.17
0.42
0.11
0.02
-0.04
-0.02
1113
0.986
0.998

Labour market participation of ageing workers
69
Appendix 4.2Preparedness to continue working before 65and from 65 onwards
This appendix briefly explains how the preparedness to delay retirement was brokendown by the preparedness to continue working before 65 and from 65 onwards. Thisbreakdown was made for two reasons. To begin with, respondents indicating a pre-paredness to continue working for higher net wages, for a higher pension benefit, ifallowed to do so part-time, if colleagues ask them to do so, or for another reason,indicate, on average, that they are willing to work for another four years. Given theexpected average retirement age of roughly 62, this raises the question to what extentpeople are prepared to continue working after the (possibly psychological) age lim-it of 65. Secondly, the breakdown allows us to compare later results on the prepared-ness to continue working from 65 onwards with these results.
The breakdown was made as follows. Respondents indicated at what age theyexpect to stop working; this is a in Figure 4.1. They then indicated per motivationwhether they are (situations 3, 4, 5) or are not (situations 1 and 2) willing to continueworking. Where they indicate that they are not prepared to continue working, thismay coincide with an expected retirement age below 65 (situation 1) or an expectedretirement age of 65 and over (situation 2). For our purposes, the distinction has lit-
B1
A
A
A
A
A
65
B3B2
B4
Figure A4.1 Preparedness to continue working before and after the 65th birthday
Prepared to continue working?
1 No
2 No
3 Yes
4 Yes
5 Yes
Age

70
tle relevance. Where respondents indicate that they are prepared to continue work-ing, this may also coincide with an expected retirement age below 65 (situations 3 and4) or 65 and over (situation 5). The total number of years worked before the 65th birth-day is b1 times the number of respondents in situation 3, plus b2 times the numberof respondents in situation 4. The average number of years that respondents are will-ing to work for a given motivation before the 65th birthday is obtained by dividingthe total number of years by the total number of respondents in situations 1 to 5. Inthe same way, b3 and b4 and the number of respondents in situations 4 and 5 yieldthe average number of years that respondents are prepared to work after their 65thbirthday.

5 Summary and policy considerations
5.1 Labour market participation of ageing workers
The ageing problem is caused by the growing number of elderly people, with a ris-ing life expectancy to boot. At the same time, birth rates in many countries arefalling. The burden of an ageing population will consequently weigh increasinglyheavily on the shoulders of a steady or even contracting labour force. Where thefinancial burden of ageing is concerned, a distinction should be made between thevarious ways in which pension schemes are financed. In the capital funding system,which forms the second pillar of the Dutch pension system, the growing cohort ofelderly people accumulated their own pension wealth during their working lives. Inthe pay-as-you-go system which forms the first pillar, the Dutch state old age pen-sion system, the pensions of a growing group of elderly people are funded by thesteady or contracting group of people who work. In an ageing society, increasingpressure is consequently brought to bear on a pay-as-you-go system. The internation-al comparison in Chapter 2 shows that the Anglo-Saxon countries and the Nether-lands, with large accumulated pension reserves, compare favourably in this respect.In the Netherlands, the average effective retirement age is, however, virtually thesame as it was thirty years ago. In this context, it must be noted that, between theearly 1970s and the mid-1980s, the participation rate of older workers in the Nether-lands dropped far below the European average. The catching-up process, which onlybegan in the early 1990s, has now brought the participation rate of older Dutchemployees back to around the European average. The participation rate of bothDutch and European older workers is low, over 25 percentage points below the cur-rent Swedish rate. In this respect, much can still be gained in the Netherlands andEurope from policy measures aimed at stimulating older employees to continueworking. This is shown in model simulations. These show that an individual Dutchstimulus will already yield considerable economic gains in five to ten years’ time.The results show that raising the Dutch participation rate to the Swedish level willgenerate over 11/2% more economic activity in the Netherlands in five years’ time.The Netherlands stands to benefit even more from a joint European approach,because the economic activity of our European trading partners will then alsoexpand. After five years, the Netherlands will then have economic gains of nearly21/4%. These potential economic gains justify analysis of possible policy measureswhich could make the participation rates of older workers go up that much.
Labour market participation of ageing workers
71

5.2 Micro-financial incentives
In this context, Chapter 3 looks at why the participation rates of older people differamong countries. Earlier studies support the view that differences in the institution-al shape of pension schemes are a major determinant of diverging participation rates.Chapter 3 looks at the financial incentives inherent in pension schemes. The inter-national comparison shows up the relatively sober and actuarially neutral nature ofpension schemes in the Anglo-Saxon countries, which is attended by a relativelyhigh participation rate of older workers. Pension provisions in the European coun-tries are much more generous, with fewer older employees staying in work, except inSweden. Incidentally, pension reforms have already been effected or are about to beintroduced in various European countries. The nature of these reforms makesallowance for the importance of financial incentives in the participation decisionsof older workers. Until recently, most pension schemes were defined-benefitschemes, which did not fully reflect the number of years of pension accrual in theultimate level of the pension benefit. More and more these schemes are beingreformed, with the emphasis now increasingly being shifted to individual capitalaccrual. This also links pension benefits more explicitly to the number of years ofpension accrual, which is an incentive to work longer.
In Chapter 4, the sensitivity of retirement decisions to financial incentives isexamined in more detail for the Netherlands, on the basis of a survey held amongDutch households. The survey results show that a considerable proportion of theDutch population can be (financially) stimulated to retire later. To begin with, (fur-ther) stimulation of possibilities for older workers to work part-time as they grow old-er seems the most effective – and fiscally a relatively cheap – way of keeping themin the labour force. Stimulating part-time working for older employees will evenhave a fairly direct effect, as the survey results show that retirees also consider thisan incentive to re-enter the labour process. Dutch employees are prepared to con-tinue working part-time by nearly eighteen months. Greater variety of part-timeretirement arrangements could cater to this preference. Secondly, older employeescan be stimulated to work longer if their net wage goes up. In the survey, this finan-cial incentive was presented as a reduction in wage taxes. An alternative could be toallow workers to stop their pension accrual from a certain age onwards, while con-tinuing to work (part-time). Thirdly, stimuli to delay retirement could be found inadjustment of the generosity and actuarial neutrality of pension schemes. Toningdown pension provisions by raising the standard retirement age by one year makesworkers delay retirement by, on average, six months. Introducing an actuarial adjust-ment of the level of the pension benefit for workers who stay in work makes themdelay retirement by a comparable period. Incidentally, the survey results suggest thatpension schemes need not be completely actuarially neutral in order to have a majoreffect on the participation rate of older employees. This means that there is scopefor both maintaining some intergenerational solidarity in the pension scheme andincluding incentives to encourage people to work longer.
72

5.3 Policy considerations
These results reflect the preferences of employees, against the background of the cur-rent pension system. It must be remembered that these preferences may be serious-ly distorted by the fiscal support given to early retirement schemes, which makes ear-ly retirement seem cheaper than it is. As a result, more people wish to retire earlythan if the costs and benefits of early retirement were weighed without distortion.Subsidising early retirement was a political choice62, induced at the time by the desireto stimulate older workers to make way for younger unemployed people. Ageing haschanged the labour market situation, and the fiscal support for early retirement isusually no longer seen as desirable. The Balkenende ii Government has thereforedecided to withdraw fiscal support for early retirement schemes and to contain ear-ly retirement possibilities in regular pension provisions. If the withdrawal of fiscalsupport means that early retirement schemes will be toned down, our survey resultsindicate that people will work longer. However, in exchange for wage moderation,the possibilities of early retirement within the pension system were widened againlast year. In addition, the life course savings scheme was created, which offersemployees a tax-friendly facility for individual saving for leave. Early retirementusing increased pension accruals, in combination with the individual life course sav-ings scheme, allows for the full or partial compensation for the abolition of fiscalsupport for other early retirement or pre-pension schemes. Retirement decisions byDutch employees therefore continue to be determined partly by incentives to stopworking.
73
Labour market participation of ageing workers

References
Alessie, R.J.M., Hochguertel, S., and A. van Soest (2002), ‘Household portfoliosin the Netherlands,’ in: L. Guiso, M. Haliasos and T. Japelli (eds.), Household portfo-lios, Cambridge (ma): mit Press, pp. 341-388.Antolin, P., de Serres, A., and C. de la Maisonneuve (2004), ‘Long-term budgetaryimplications of tax-favoured retirement plans,’ OECD Economics Department WorkingPaper 393, Organisation for Economic Co-operation and Development, Paris.Berkel, B., and A. Börsch-Supan (2003), ‘Pension reform in Germany: the impacton retirement decisions,’ NBER Working Paper Series 9913, National Bureau of Econom-ic Research, Cambridge (ma).Blake, D. (2004), ‘The impact of wealth on consumption and retirement behaviourin the uk,’ Applied Financial Economics 14, pp. 555-576.Boskin, M.J. (1977), ‘Social security and retirement decisions,’ Economic Enquiry 15,pp. 1-25.Boskin, M. J., and M. D. Hurd (1978), ‘The effect of social security on early retire-ment,’ Journal of Public Economics 10, pp. 361-377.Bovenberg, L. (2003), ‘Pensioenleeftijd als buffer,’ Economisch Statistische Berichten 88,pp. 584-586.Browning, M. J. (1982), ‘Savings and pensions: some uk evidence,’ Economic Journal92, pp. 954-963.Burniaux, J.-M., Duval, R., and F. Jaumotte (2004), ‘Coping with ageing: a dynam-ic approach to quantify the impact of alternative policy options on future laboursupply in oecd countries,’ OECD Economics Department Working Paper 371, Organisa-tion for Economic Co-operation and Development, Paris.Bundesinstitut für Bevölkerungsforschung (2003), ‘Bevölkerung: Fakten-Trends-Ursachen-Erwartungen,’ Bundesinstitut für Bevölkerungsforschung, Wiesbaden(http:\\www.bib-demografie.de).Casey, B., Oxley, H., Whitehouse, E., Antolin, P., Duval, R., and W. Leibfritz
(2003), ‘Policies for an ageing society: recent measures and areas for further reform,’OECD Economics Department Working Paper 369, Organisation for Economic Co-oper-ation and Development, Paris.Coile, C., and J. Gruber (2000), ‘Social security and retirement,’ NBER Working PaperSeries 7830, National Bureau of Economic Research, Cambridge (ma).Chan, S., and A.H. Stevens (2003), ‘What you don’t know can’t help you: pensionknowledge and retirement decision making,’ NBER Working Paper Series 10185, Nation-al Bureau of Economic Research, Cambridge (ma).
74

Crawford, P. C., and D. M. Lilien (1981), ‘Social security and the retirement deci-sion,’ Quarterly Journal of Economics 46, pp. 505-529.De Nederlandsche Bank (2003), ‘Financial behaviour of Dutch households,’ Quar-terly Bulletin September 2003, pp. 39-50.De Nederlandsche Bank (2004), ‘Financial behaviour of Dutch households,’ Quar-terly Bulletin September 2004, pp. 69-81.De Nederlandsche Bank (2005a), ‘Obstacles to increasing Dutch working hours,’Quarterly Bulletin March 2005, pp. 39-47.De Nederlandsche Bank (2005b), Pensioenmonitor 2004, (http:\\www.statistics.dnb.nl)Diamond, P.A. (2001), ‘Social security reform with a focus on the Netherlands,’ DeEconomist 149, pp. 1-12.Disney, R., Meghir, C., and E. Whitehouse (1994), ‘Retirement behaviour inBritain,’ Fiscal Studies 15, pp. 24-43.Duval, R. (2003), ‘The retirement effects of old-age pension and early retirementschemes in oecd countries,’ OECD Economics Department Working Paper 370, Organisa-tion for Economic Co-operation and Development, Paris.Els, P.J.A. van, End, W.A. van den, and M.C.J. van Rooij (2004), ‘Pensions andpublic opinion: a survey among Dutch households,’ De Economist 152, pp. 101-116.Euwals, R., and M. Hogerbrugge (2004), ‘Explaining the growth of part-timeemployment: factors of supply and demand,’ CPB Discussion Paper 31, NetherlandsBureau for Economic Policy Analysis, Den Haag.Euwals, R., Vuuren, D. van, and R. Wolthoff (2004), ‘Prepensioen en het uittred-ingsgedrag van de oudere werknemers,’ Economisch Statistische Berichten 89, pp. 565-567. Ewijk, C. van, Kuipers, B., Rele, H. ter, Ven, M. van de, and E. Westerhout
(2000), Ageing in the Netherlands, Netherlands Bureau for Economic Policy Analysis,The Hague: SDU Uitgevers.Feldstein, M. (1974), Social security, induced retirement and aggregate capital accu-mulation,’ Journal of Political Economy 82, pp. 905-926.Gruber, J., and D. Wise (1997), ‘Social security programs and retirement around theworld,’ NBER Working Paper Series 6134, National Bureau of Economic Research, Cam-bridge (ma).Huizinga, F., and B. Smid (2004), ‘Vier vergezichten op Nederland. Productie,arbeid en sectorstructuur in vier scenario’s tot 2040’ CPB Special Publications 55, Nether-lands Bureau for Economic Policy Analysis, The Hague.Leeuwen, G. van, and H. van der Wiel (2003), ‘Do ict spillovers matter? – Empir-ical evidence for the Netherlands,’ CPB Discussion Paper 26, Netherlands Bureau forEconomic Policy Analysis, The Hague.Mastrogiacomo, M., Alessie, R.J.M., and M. Lindeboom (2004), ‘Retirementbehaviour of Dutch elderly households: diversity in retirement patterns across dif-ferent household types,’ Journal of Applied Econometrics 19, pp. 777-793.Meghir, C., and E. Whitehouse (1997), ‘Labour market transitions and the retire-
75
Labour market participation of ageing workers

ment of men in the uk,’ Journal of Econometrics 79, pp. 327-354.oecd (2002), Economic Outlook 72, Organisation for Economic Co-operation andDevelopment, Paris.oecd (2004), Labour Force Statistics 2003, Organisation for Economic Co-operationand Development, Paris.Roodenburg, H., and J. Rijn (2002), ‘Kenmerken van uittreders’, CPB Memorandum49, Netherlands Bureau for Economic Policy Analysis, The Hague.Rooij, M.C.J. van, Kool, C.J.M., and H.M. Prast (2004a), ‘Risk-return preferencesin the pension domain: are people able to choose?’ dnb Working Paper 025/2004,De Nederlandsche Bank, Amsterdam.Rooij, M.C.J. van, Siegmann, A.H., and P.J.G. Vlaar (2004b), ‘palmnet: a pensionassets and liabilities model for the Netherlands,’ DNB Research Memorandum WO
760/2004, De Nederlandsche Bank, Amsterdam. Sheshinski, E. (1978), ‘A model of social security and retirement decisions,’ Journalof Public Economics 10, pp. 337-360.Swaan, A. de (1996): Zorg en de staat. Welzijn, onderwijs en gezondheidszorg in Europaen de Verenigde Staten in de nieuwe tijd, Amsterdam: Uitgeverij Bert Bakker.Westerhout, E., Ven, M. van de, Ewijk, C. van, and N. Draper (2004), ‘Naar eenschokbestendig pensioenstelsel,’ CPB Document 67, Netherlands Bureau for Econom-ic Policy Analysis, The Hague.Whitehouse, E. (2003), ‘The value of pension entitlements: a model of nine oecdcountries,’ OECD Social, Employment and Migration Working Papers 9, Organisation forEconomic Co-operation and Development, Paris.Yoo, K.-Y., and A. de Serres (2004), ‘Tax treatment of private pension savings inoecd countries and the net tax cost per unit of contribution to tax-favouredschemes,’ OECD Economics Department Working Paper 406, Organisation for Econom-ic Co-operation and Development, Paris.
76
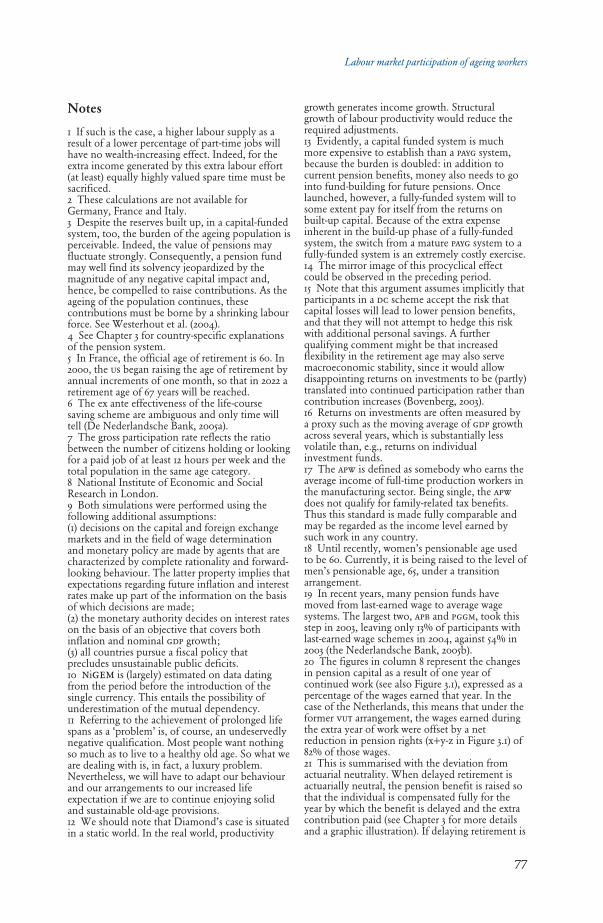
77
Labour market participation of ageing workers
Notes
1 If such is the case, a higher labour supply as aresult of a lower percentage of part-time jobs willhave no wealth-increasing effect. Indeed, for theextra income generated by this extra labour effort(at least) equally highly valued spare time must besacrificed. 2 These calculations are not available forGermany, France and Italy.3 Despite the reserves built up, in a capital-fundedsystem, too, the burden of the ageing population isperceivable. Indeed, the value of pensions mayfluctuate strongly. Consequently, a pension fundmay well find its solvency jeopardized by themagnitude of any negative capital impact and,hence, be compelled to raise contributions. As theageing of the population continues, thesecontributions must be borne by a shrinking labourforce. See Westerhout et al. (2004). 4 See Chapter 3 for country-specific explanationsof the pension system. 5 In France, the official age of retirement is 60. In2000, the us began raising the age of retirement byannual increments of one month, so that in 2022 aretirement age of 67 years will be reached. 6 The ex ante effectiveness of the life-coursesaving scheme are ambiguous and only time willtell (De Nederlandsche Bank, 2005a).7 The gross participation rate reflects the ratiobetween the number of citizens holding or lookingfor a paid job of at least 12 hours per week and thetotal population in the same age category.8 National Institute of Economic and SocialResearch in London.9 Both simulations were performed using thefollowing additional assumptions: (1) decisions on the capital and foreign exchangemarkets and in the field of wage determinationand monetary policy are made by agents that arecharacterized by complete rationality and forward-looking behaviour. The latter property implies thatexpectations regarding future inflation and interestrates make up part of the information on the basisof which decisions are made;(2) the monetary authority decides on interest rateson the basis of an objective that covers bothinflation and nominal gdp growth;(3) all countries pursue a fiscal policy thatprecludes unsustainable public deficits. 10 nigem is (largely) estimated on data datingfrom the period before the introduction of thesingle currency. This entails the possibility ofunderestimation of the mutual dependency.11 Referring to the achievement of prolonged lifespans as a ‘problem’ is, of course, an undeservedlynegative qualification. Most people want nothingso much as to live to a healthy old age. So what weare dealing with is, in fact, a luxury problem.Nevertheless, we will have to adapt our behaviourand our arrangements to our increased lifeexpectation if we are to continue enjoying solidand sustainable old-age provisions.12 We should note that Diamond’s case is situatedin a static world. In the real world, productivity
growth generates income growth. Structuralgrowth of labour productivity would reduce therequired adjustments.13 Evidently, a capital funded system is muchmore expensive to establish than a payg system,because the burden is doubled: in addition tocurrent pension benefits, money also needs to gointo fund-building for future pensions. Oncelaunched, however, a fully-funded system will tosome extent pay for itself from the returns onbuilt-up capital. Because of the extra expenseinherent in the build-up phase of a fully-fundedsystem, the switch from a mature payg system to afully-funded system is an extremely costly exercise.14 The mirror image of this procyclical effectcould be observed in the preceding period.15 Note that this argument assumes implicitly thatparticipants in a dc scheme accept the risk thatcapital losses will lead to lower pension benefits,and that they will not attempt to hedge this riskwith additional personal savings. A furtherqualifying comment might be that increasedflexibility in the retirement age may also servemacroeconomic stability, since it would allowdisappointing returns on investments to be (partly)translated into continued participation rather thancontribution increases (Bovenberg, 2003).16 Returns on investments are often measured bya proxy such as the moving average of gdp growthacross several years, which is substantially lessvolatile than, e.g., returns on individualinvestment funds.17 The apw is defined as somebody who earns theaverage income of full-time production workers inthe manufacturing sector. Being single, the apwdoes not qualify for family-related tax benefits.Thus this standard is made fully comparable andmay be regarded as the income level earned bysuch work in any country.18 Until recently, women’s pensionable age usedto be 60. Currently, it is being raised to the level ofmen’s pensionable age, 65, under a transitionarrangement.19 In recent years, many pension funds havemoved from last-earned wage to average wagesystems. The largest two, apb and pggm, took thisstep in 2003, leaving only 13% of participants withlast-earned wage schemes in 2004, against 54% in2003 (the Nederlandsche Bank, 2005b).20 The figures in column 8 represent the changesin pension capital as a result of one year ofcontinued work (see also Figure 3.1), expressed as apercentage of the wages earned that year. In thecase of the Netherlands, this means that under theformer vut arrangement, the wages earned duringthe extra year of work were offset by a netreduction in pension rights (x+y-z in Figure 3.1) of82% of those wages.21 This is summarised with the deviation fromactuarial neutrality. When delayed retirement isactuarially neutral, the pension benefit is raised sothat the individual is compensated fully for theyear by which the benefit is delayed and the extracontribution paid (see Chapter 3 for more detailsand a graphic illustration). If delaying retirement is

78
not actuarially neutral, there is an implicit tax(subsidy) on continuing to work if the individualreceives an insufficient (excessive) increase in thepension benefit as compensation for delayingretirement and the extra contributions made. 22 Blake (2004) also demonstrates that collectiveschemes stimulate (early) retirement, whereasindividual provisions usually mean retiring later. 23 As noted earlier, at the end of the 19th century,life expectancy was around 65, while peoplereceived old age pensions when they reached 70.At the beginning of the 21st century, lifeexpectancy is creeping up to 80, while old agepensions are paid from 65 onwards.24 See also Feldstein (1974), Boskin (1977),Sheshinski (1978), Boskin and Hurd (1978),Crawford and Lilien (1981), Browning (1982), Coileand Gruber (2000).25 Van Rooij et al. (2004a) also conclude that theaverage Dutch employee is not really motivated toaugment his knowledge on this point.26 In order to be able to absorb shocks to thepension system, however, people should react asrapidly as possible. The longer the adjustment ispostponed, namely, the more painful it typicallyturns out.27 Variable constructed on the basis of thehousehold’s exact annual income, at least whenknown to the respondent (959 respondents),supplemented with household incomes on thebasis of rough categories of incomes forrespondents who did not know the exacthousehold income (975 respondents).28 For the other background characteristics(education, pension knowledge, partner, income, sharesand mental burden) no link was found with theintensity with which the respondent thinks aboutretirement.29 In this case, we made use of regression analysis,given the continuous nature of the dependentvariable.30 A discrepancy which differs statistically from 0with a 99% confidence level.31 The results in this section suggest that theconversion of final-pay into average-pay systemsnot only augments the pension funds’ financialposition via the direct channel of lower pensionliabilities, but also has favourable indirect effectsbecause participants contribute longer.32 Respondents who consider higher wages one ofthe three primary motives for delaying retirementturn out to be neither more impatient nor less risktolerant than respondents who see a higherpension benefit as one of the primary motives tocontinue working.33 It must be noted that, in man-years, workerswill work less than eighteen months longer.34 This result is partly based on the observationthat those who indicate that they are prepared towork longer, for some reason or another, indicatedearlier that they expected to retire later than thosewho cannot be motivated to continue working.While the average expected retirement age is 62.1,the respondents who can be motivated to delayretirement said that, in the absence of this incentive,
they would be prepared to continue working until,on average, 62.8.35 In June 2004, 28% of the respondents answeredthat they would be willing to continue working,either full-time or part-time, 60% were notprepared to do so and 12% didn’t know. 36 Which differs statistically from 0 with 95%confidence. 37 Possibly in combination with lower total wagecosts for the employer.38 We asked the respondents to assume, whenanswering these questions, that the marginal taxrates for 2005, including the lower rates alreadyapplicable to those aged 65+, would remain inforce during their entire working life. Van Els et al.(2004) show, however, that half of the respondentsexpect the tax advantage for people aged 65 andover to be reduced in the future. Those panelmembers who also expected this set less store bylabour income from 65 onwards than by labourincome before 65. This would distort the answersagainst the preparedness to continue working intoold age. In order to estimate the relevance of thisselection effect, we coupled our figures to theinformation available to Van Els et al. (2004). Wewere then able to identify the respondents whoexpect the tax advantage for those aged 65+ to bereduced in the future, and the respondents whoexpect it to remain unchanged or have no idea.We found no correlation between thepreparedness to continue working at lowermarginal rates and the expected development ofthe tax advantage for people aged 65+. 39 The discrepancies vis-à-vis respondents who arewilling to work longer or pay more contributiondiffer statistically from 0 with 99% reliability.40 The respondents indicating they are preparedto delay retirement and pay a higher contributionfor a higher pension benefit were first asked howmany years they are prepared to continue workingand then how much extra contribution they areready to pay. If the respondents interpret thesuccession of these two extra questions as they aremeant to do, it may be expected that respondentswho are, for example, relatively more prepared towork longer, are also relatively less prepared to payextra contribution. In other words, we then expecta negative correlation between the number of yearsthat people are prepared to continue working andthe level of the extra contribution which they areready to pay. There is, however, a positivecorrelation between the preparedness to pay byworking longer and the preparedness to pay in theform of an extra contribution.41 And also assuming that the other respondents(including those who were prepared to pay ahigher contribution for a higher pension) will notas yet decide to work longer.42 This discrepancy differs statistically from 0with a 99% confidence level. 43 Statistically, it is smaller than the 41/2%, (with95% confidence) desired by respondents whodesire a lower contribution only.44 The conservative estimate is that 18% of panelmembers retire two years earlier; the liberal

79
Labour market participation of ageing workers
estimate that 36% retire 21/2 years earlier.45 The knowledge of the cost (reward) of early(postponed) retirement correlates positively withpension knowledge (cf. Van Els et al., 2004).Additionally, older respondents and those withlonger decision horizons (scoring lower onimpatience) are more aware of these incentives.Also see Appendix 4.1.46 In their search for a shockproof pensionsystem, Westerhout et al. (2004) arrive at the sameconclusion.47 A higher accrual percentage, in combinationwith unchanged contributions and the samenumber of accrual years results in higher pensionwealth. We therefore use an increase inaccumulated pension wealth and a rise in theaccrual percentage interchangeably in the rest ofthis Chapter.48 Statistically, they cannot be distinguished fromthose who opt to retire early when their pensionassets undergo an exogenous increase.49 Where state old age pensions are concerned,De Nederlandsche Bank (2004) concludes thatpeople prefer a lower benefit to a later benefit.50 Given the very small proportion of respondentsto which this assumption relates, it has only alimited influence on the ultimate estimation of thewealth effect. Assuming that these respondents willcontinue working by 0 to 2.5 years, the wealtheffect varies from 0.420 to 0.445 year. However, ifthey are prepared to continue working 3 to 5 years,the wealth effect varies from 0.450 to 0.470 year.51 In scheme A, continuing to work at 62 yields a 4percentage point increase in the pension benefit,from 70% to 74%; this is an increase of 5.7%. 52 Although most schemes have now beenconverted to average-pay schemes, the pensionbenefit was expressed in the question as apercentage of final pay, for the sake of simplicity.We suspect that for many people, final pay stillrepresents a measure of the level of the pensionbenefit; this formulation is largely in line with theway respondents think about their pension.53 29% of the respondents who answered thequestions in Table 4.6 gave this percentage, theremainder didn’t know or was not consulted in thedhs 2004.54 This is not surprising, as we already saw in theconstruction of pension knowledge (see AppendixA4.1) that people score higher on pension knowledgewhen they know what percentage of final pay theywill get. In addition, the results discussed earlier(see section 4.2) show that people who score highon pension knowledge on average expect to retirelater.55 Statistically, there is a 46% chance that theretirement age in schemes a and c is the same.56 Statistically, the differences exceed 0 with a99% confidence level in all cases. They lie between0.2 and 0.5 year, with a 95% confidence level.57 There is a 31% chance that the averageretirement age in scheme f equals that in schemee.58 The hypothesis that there is no common factoris rejected (χ2(4)=435,46), as is the hypothesis that
there are more common factors (χ2(2)=35,09).59 The hypothesis that there is no common factoris rejected (χ2(14)=3986,39), as is the hypothesis thatthere are more common factors (χ2(77)=2522,02).60 The hypothesis that there is no common factoris rejected (χ2(6)=1680,08), as is the hypothesis thatthere are more common factors (χ2(9)=674,27).61 The hypothesis that there is no common factoris rejected (χ2(10)=1255,04), as is the hypothesis thatthere are more common factors (χ2(35)=574,92).Nevertheless there are indications that the measureof risk tolerance could be refined further, in theform of three additional factors which combinedhave little extra explanatory power. These factorsindicate specific risk-avoiding behaviour withregard to pension arrangements, a specific risk-aversion with regard to share investments, and aspecific risk tolerance aimed at investment return.62 It goes without saying that subsidising regularold age pensions is also a political choice.

80
Publications in this series since January 2003
Vol.1/Nr.1 (2003) Requirements for successful currency regimes:The Dutch and Thai experiencesRobert-Paul Berben, Jan Marc Berk, Ekniti Nitihanprapas,Kanit Sangsuphan, Pisit Puapan and Piyaporn Sodsriwiboon
Vol.1/Nr.2 (2003) The blurring of distinctions between financial sectors:fact or fiction?Annemarie van der Zwet
Vol.1/Nr.3 (2003) Intermediation, integration and internationalisation:a survey on banking in EuropeJaap Bikker and Sandra Wesseling
Vol.1/Nr.4 (2003) A Survey of Institutional Frameworks for Financial StabilitySander Oosterloo and Jakob de Haan
Vol.2/Nr.1 (2004) Towards a framework for financial stabilityAerdt Houben, Jan Kakes and Garry Schinasi
Vol.2/Nr.2 (2004) Depositor and investor protection in the Netherlands:past, present and futureGillian Garcia and Henriëtte Prast
Vol.3/Nr.1 (2005) Arbeidsparticipatie van ouderen:Microfinanciële motivaties en beleidsaspectenW. Allard Bruinshoofd en Sybille G. Grob