
Promoting healthy ageing - Maastricht University
255
Promoting healthy ageing Citation for published version (APA): Connell, N. J. (2021). Promoting healthy ageing: in pursuit of metabolic health through nutritional intervention, physical activity, and the molecular clock. Ridderprint. https://doi.org/10.26481/dis.20210122nc Document status and date: Published: 01/01/2021 DOI: 10.26481/dis.20210122nc Document Version: Publisher's PDF, also known as Version of record Please check the document version of this publication: • A submitted manuscript is the version of the article upon submission and before peer-review. There can be important differences between the submitted version and the official published version of record. People interested in the research are advised to contact the author for the final version of the publication, or visit the DOI to the publisher's website. • The final author version and the galley proof are versions of the publication after peer review. • The final published version features the final layout of the paper including the volume, issue and page numbers. Link to publication General rights Copyright and moral rights for the publications made accessible in the public portal are retained by the authors and/or other copyright owners and it is a condition of accessing publications that users recognise and abide by the legal requirements associated with these rights. • Users may download and print one copy of any publication from the public portal for the purpose of private study or research. • You may not further distribute the material or use it for any profit-making activity or commercial gain • You may freely distribute the URL identifying the publication in the public portal. If the publication is distributed under the terms of Article 25fa of the Dutch Copyright Act, indicated by the “Taverne” license above, please follow below link for the End User Agreement: www.umlib.nl/taverne-license Take down policy If you believe that this document breaches copyright please contact us at: [email protected] providing details and we will investigate your claim. Download date: 05 Jul. 2022
-
Upload
khangminh22 -
Category
Documents
-
view
0 -
download
0
Transcript of Promoting healthy ageing - Maastricht University
Promoting healthy ageing
Citation for published version (APA):
Connell, N. J. (2021). Promoting healthy ageing: in pursuit of metabolic health through nutritionalintervention, physical activity, and the molecular clock. Ridderprint.https://doi.org/10.26481/dis.20210122nc
Document status and date:Published: 01/01/2021
DOI:10.26481/dis.20210122nc
Document Version:Publisher's PDF, also known as Version of record
Please check the document version of this publication:
• A submitted manuscript is the version of the article upon submission and before peer-review. There canbe important differences between the submitted version and the official published version of record.People interested in the research are advised to contact the author for the final version of the publication,or visit the DOI to the publisher's website.• The final author version and the galley proof are versions of the publication after peer review.• The final published version features the final layout of the paper including the volume, issue and pagenumbers.Link to publication
General rightsCopyright and moral rights for the publications made accessible in the public portal are retained by the authors and/or other copyrightowners and it is a condition of accessing publications that users recognise and abide by the legal requirements associated with theserights.
• Users may download and print one copy of any publication from the public portal for the purpose of private study or research.• You may not further distribute the material or use it for any profit-making activity or commercial gain• You may freely distribute the URL identifying the publication in the public portal.
If the publication is distributed under the terms of Article 25fa of the Dutch Copyright Act, indicated by the “Taverne” license above,please follow below link for the End User Agreement:
www.umlib.nl/taverne-license
Take down policyIf you believe that this document breaches copyright please contact us at:
providing details and we will investigate your claim.
Download date: 05 Jul. 2022

Promoting healthy ageingIn pursuit of metabolic health through nutritional intervention,
physical activity, and the molecular clock
Promoting healthy ageing
Niels J. Connell
Niels J. C
onnell
Met
abol
ic h
ealth
Age
NAD+
Physical activityMolecular clock
Brown adipose tissueCreatine
Deregulated nutrient sensing
Mitochondrial dysfunction
Niels_Omslag.indd 2-3Niels_Omslag.indd 2-3 02/12/2020 13:45:2002/12/2020 13:45:20

Promoting healthy ageingIn pursuit of metabolic health through nutritional
intervention, physical activity, and the molecular clock
Niels J. Connell
Niels_Proefschrift.indd 1Niels_Proefschrift.indd 1 08/12/2020 18:04:0408/12/2020 18:04:04
Promoting healthy ageing: In pursuit of metabolic health through nutritional intervention, physical activity, and the molecular clock. Niels J. Connell.ISBN: 978-94-6416-294-3
Cover and layout design: Lara Leijtens, persoonlijkproefschrift.nlPrinting: Ridderprint, www.ridderprint.nl
This dissertation and all the studies included were performed within NUTRIM School of Nutrition and Translational Research in Metabolism.
Chapters 2, 5, and 6 presented in this thesis were supported by a grant of the Dutch Cardiovascular Research Initiative (CVON2014-02 ENERGISE).
Chapters 3 and 4 presented in this thesis were performed within the framework of TiFN.
Copyright © Niels J. Connell, 2020, the Netherlands.
Niels_Proefschrift.indd 2Niels_Proefschrift.indd 2 08/12/2020 18:04:0508/12/2020 18:04:05

1
Promoting healthy ageing
In pursuit of metabolic health through nutritional
intervention, physical activity, and the molecular clock
Dissertation
to obtain the degree of doctor at Maastricht University, on the authority of the Rector Magnificus,
Prof. Dr. Rianne M. Letschert, in accordance with the decision of the Board of Deans,
to be defended in public on Friday January 22nd, 2021 at 14:00 hours
by
Niels J. Connell
Born in Boxtel, the Netherlands, on May 30th, 1991
Niels_Proefschrift.indd 3Niels_Proefschrift.indd 3 08/12/2020 18:04:0508/12/2020 18:04:05
2
Promotor: Prof. Dr. P. Schrauwen
Copromotors:
Dr. J. Hoeks
Dr. B. Havekes
Assessment Committee:
Prof. Dr. M.C.G.J. Brouwers (Chairman)
Prof. Dr. Ir. E.E. Blaak
Dr. C. Cantó Alvarez (Nestlé Research, Laussanne, CH)
Prof. Dr. Ir. C.P.G.M. de Groot (Wageningen University & Research)
Dr. A.H.V. Remels
Niels_Proefschrift.indd 4Niels_Proefschrift.indd 4 08/12/2020 18:04:0508/12/2020 18:04:05
Table of contents
Chapter 1 General Introduction 7
Chapter 2 NAD+ metabolism as a target for metabolic health: have we found the silver bullet?
21
Chapter 3 NAD+-precursor supplementation with L-tryptophan, nicotinic acid, and nicotinamide does not improve mitochondrial function and skeletal muscle function in physically compromised older adults
49
Chapter 4 Impact of ageing and exercise on skeletal muscle mitochondrial capacity, energy metabolism, and physical function: a cross-sectional study
83
Chapter 5 Day-night rhythm of skeletal muscle metabolism is disturbed in older, metabolically compromised individuals
139
Chapter 6 No Evidence For Brown Adipose Tissue Activation After Creatine Supplementation In Adult Vegetarians
169
Chapter 7 General Discussion 203
Impact Paragraaf 223
Samenvatting 229
About the Author 237
Publications 241
Dankwoord 245
Niels_Proefschrift.indd 5Niels_Proefschrift.indd 5 08/12/2020 18:04:0508/12/2020 18:04:05

Niels_Proefschrift.indd 6Niels_Proefschrift.indd 6 08/12/2020 18:04:0508/12/2020 18:04:05

1General Introduction
Niels_Proefschrift.indd 7Niels_Proefschrift.indd 7 08/12/2020 18:04:1908/12/2020 18:04:19

8
Chapter 1
Over the past two centuries, global human life expectancy at birth has risen to 72.0 years in 2016 (1) and even to 80.8 years in high-income countries (2) following the implementation of hygiene, continuous advancements in health care, and improved access to better nutrition. Simultaneously, the proportion of older adults aged over 65 is progressively growing as a consequence of the increase in life expectancy; in 2019, 9.1% of the global population was over the age of 65, and this is envisioned to rise to 15.9% in 2050, and 22.6% by 2100 (3). This phenomenon is exaggerated in high-income countries such as the Netherlands, with 19.2% of the population over the age of 65 in 2019, which is projected to surpass 25% as soon as 2040 (4). With advanced age, however, quality of life is also impacted and susceptible to decline. There is an increased risk of morbidity with advanced age stemming from noncommunicable diseases such as type 2 diabetes mellitus (T2DM), cardio-vascular disease (CVD), malignancies, and degenerative diseases (5), which are dominantly represented amongst the leading causes of mortality in high-income countries (6). Together, the increase in life expectancy, the change in demographic composition, and the chronic nature of noncommunicable disease are driving the increasing socio-economic burden of disease, with the Netherlands projected to face an annual increase of 2.8% in health care expenditure until 2040 (7), thus warranting a switch in focus from improving lifespan to improving healthspan.
The challenge of ageing is not just a matter of time
The rate of ageing is unique to an individual and thus age should be separated in two forms; one being chronological age, the other biological age. Chronological ageing is purely subject to the passing of time and cannot be influenced as such. Contrastingly, an individual’s biological ageing is more fluid and can be accelerated or slowed depending on factors such as genetic background, lifestyle and nutrition, socio-economic status, and environmental influences such as health care (8, 9). The biological processes involved in ageing are complex and are predominantly driven by stochastic damage acquired by cells and tissues over time (10), thereby defining ageing as the time-dependent decline of function through the loss of physiological integrity (5).
Nine hallmarks of ageing were defined in order to provide structure to the research effort pursuing the prolongation of human healthspan (5). These
Niels_Proefschrift.indd 8Niels_Proefschrift.indd 8 08/12/2020 18:04:1908/12/2020 18:04:19
9
General Introduction
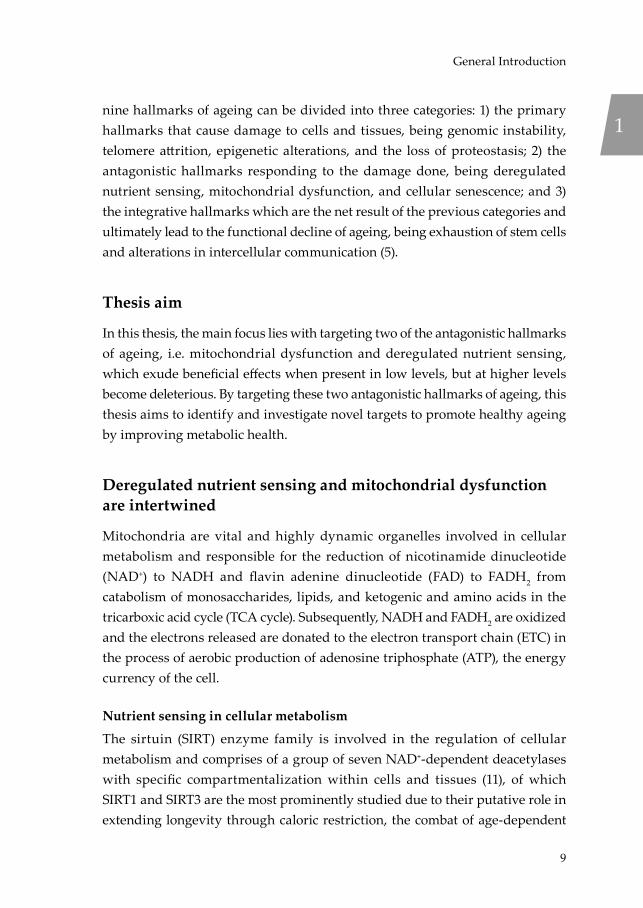
nine hallmarks of ageing can be divided into three categories: 1) the primary hallmarks that cause damage to cells and tissues, being genomic instability, telomere attrition, epigenetic alterations, and the loss of proteostasis; 2) the antagonistic hallmarks responding to the damage done, being deregulated nutrient sensing, mitochondrial dysfunction, and cellular senescence; and 3) the integrative hallmarks which are the net result of the previous categories and ultimately lead to the functional decline of ageing, being exhaustion of stem cells and alterations in intercellular communication (5).
Thesis aim
In this thesis, the main focus lies with targeting two of the antagonistic hallmarks of ageing, i.e. mitochondrial dysfunction and deregulated nutrient sensing, which exude beneficial effects when present in low levels, but at higher levels become deleterious. By targeting these two antagonistic hallmarks of ageing, this thesis aims to identify and investigate novel targets to promote healthy ageing by improving metabolic health.
Deregulated nutrient sensing and mitochondrial dysfunction are intertwined
Mitochondria are vital and highly dynamic organelles involved in cellular metabolism and responsible for the reduction of nicotinamide dinucleotide (NAD+) to NADH and flavin adenine dinucleotide (FAD) to FADH2 from catabolism of monosaccharides, lipids, and ketogenic and amino acids in the tricarboxic acid cycle (TCA cycle). Subsequently, NADH and FADH2 are oxidized and the electrons released are donated to the electron transport chain (ETC) in the process of aerobic production of adenosine triphosphate (ATP), the energy currency of the cell.
Nutrient sensing in cellular metabolism
The sirtuin (SIRT) enzyme family is involved in the regulation of cellular metabolism and comprises of a group of seven NAD+-dependent deacetylases with specific compartmentalization within cells and tissues (11), of which SIRT1 and SIRT3 are the most prominently studied due to their putative role in extending longevity through caloric restriction, the combat of age-dependent
1
Niels_Proefschrift.indd 9Niels_Proefschrift.indd 9 08/12/2020 18:04:1908/12/2020 18:04:19

10
Chapter 1
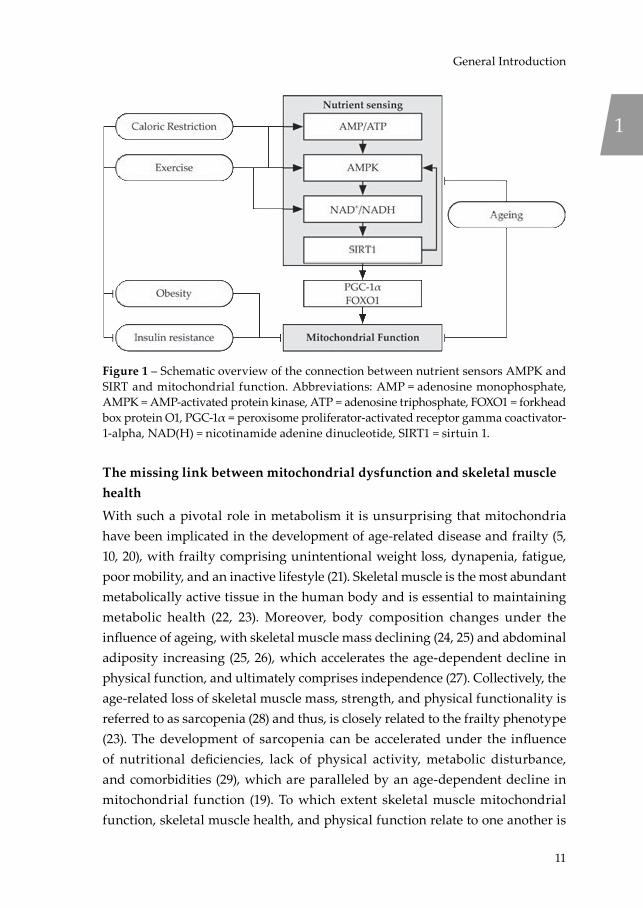
disease, and control of metabolic homeostasis (12). SIRT1 resides in the nucleus and cytosol of the cell and orchestrates, among others, mitochondrial biogenesis through deacetylation of peroxisome proliferator-activated receptor gamma coactivator-1-alpha (PGC-1α) and controls glucose and lipid metabolism following deacetylation of forkhead box protein O1 (FOXO1). SIRT3 is located in the mitochondria and acts as the main mitochondrial deacetylase and controlling metabolic homeostasis and the stress response to reactive oxygen species (ROS) (12). Notably, SIRT1 is a downstream target of AMP-activated protein kinase (AMPK) activation, which reflects the energy status of the cell based on the adenosine monophosphate (AMP) and adenosine diphosphate (ADP) levels relative to ATP levels (13). Activation of AMPK leads to induction of nicotinamide phosphoribosyltransferase (NAMPT), the rate-limiting enzyme in NAD+ synthesis from nicotinamide (NAM), thereby facilitating activation of SIRT1, which is sensitive to the NAD+/NADH redox potential (14). Additionally, SIRT1 and AMPK can enforce a positive feedback loop to coordinate a unified response to low energetic states (15). Together, AMPK and SIRT1 are thought of as nutrient sensors, sensitive to a low-energy status of the cell and catabolism (13, 16), with downstream targets beneficial to overall metabolic health (Figure 1) (5). With NAD+ levels (17, 18) and mitochondrial function (19) known to decline with age, NAD+-supplementation through dietary intervention has been proposed as a potential effective strategy to improve mitochondrial function and metabolic health, and is the focus of Chapters 2 and 3.
Niels_Proefschrift.indd 10Niels_Proefschrift.indd 10 08/12/2020 18:04:1908/12/2020 18:04:19
11
General Introduction
Figure 1 – Schematic overview of the connection between nutrient sensors AMPK and SIRT and mitochondrial function. Abbreviations: AMP = adenosine monophosphate, AMPK = AMP-activated protein kinase, ATP = adenosine triphosphate, FOXO1 = forkhead box protein O1, PGC-1α = peroxisome proliferator-activated receptor gamma coactivator-1-alpha, NAD(H) = nicotinamide adenine dinucleotide, SIRT1 = sirtuin 1.
The missing link between mitochondrial dysfunction and skeletal muscle health
With such a pivotal role in metabolism it is unsurprising that mitochondria have been implicated in the development of age-related disease and frailty (5, 10, 20), with frailty comprising unintentional weight loss, dynapenia, fatigue, poor mobility, and an inactive lifestyle (21). Skeletal muscle is the most abundant metabolically active tissue in the human body and is essential to maintaining metabolic health (22, 23). Moreover, body composition changes under the influence of ageing, with skeletal muscle mass declining (24, 25) and abdominal adiposity increasing (25, 26), which accelerates the age-dependent decline in physical function, and ultimately comprises independence (27). Collectively, the age-related loss of skeletal muscle mass, strength, and physical functionality is referred to as sarcopenia (28) and thus, is closely related to the frailty phenotype (23). The development of sarcopenia can be accelerated under the influence of nutritional deficiencies, lack of physical activity, metabolic disturbance, and comorbidities (29), which are paralleled by an age-dependent decline in mitochondrial function (19). To which extent skeletal muscle mitochondrial function, skeletal muscle health, and physical function relate to one another is
1
Niels_Proefschrift.indd 11Niels_Proefschrift.indd 11 08/12/2020 18:04:2108/12/2020 18:04:21
12
Chapter 1
the subject of Chapter 4, aiming to increase our understanding of muscle health in order to identify novel targets for future interventions to counteract the onset of sarcopenia and frailty.
Time is of the essence
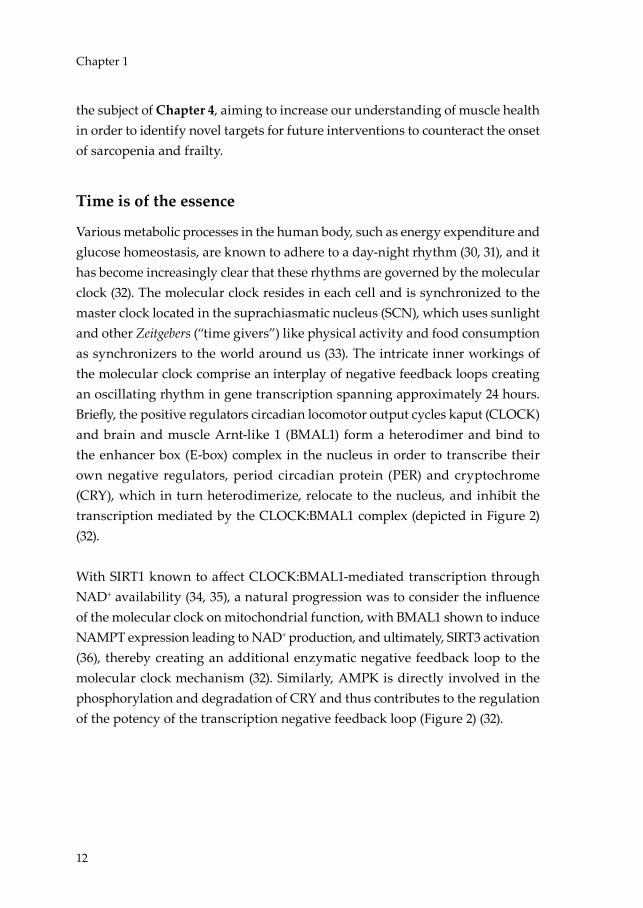
Various metabolic processes in the human body, such as energy expenditure and glucose homeostasis, are known to adhere to a day-night rhythm (30, 31), and it has become increasingly clear that these rhythms are governed by the molecular clock (32). The molecular clock resides in each cell and is synchronized to the master clock located in the suprachiasmatic nucleus (SCN), which uses sunlight and other Zeitgebers (“time givers”) like physical activity and food consumption as synchronizers to the world around us (33). The intricate inner workings of the molecular clock comprise an interplay of negative feedback loops creating an oscillating rhythm in gene transcription spanning approximately 24 hours. Briefly, the positive regulators circadian locomotor output cycles kaput (CLOCK) and brain and muscle Arnt-like 1 (BMAL1) form a heterodimer and bind to the enhancer box (E-box) complex in the nucleus in order to transcribe their own negative regulators, period circadian protein (PER) and cryptochrome (CRY), which in turn heterodimerize, relocate to the nucleus, and inhibit the transcription mediated by the CLOCK:BMAL1 complex (depicted in Figure 2) (32).
With SIRT1 known to affect CLOCK:BMAL1-mediated transcription through NAD+ availability (34, 35), a natural progression was to consider the influence of the molecular clock on mitochondrial function, with BMAL1 shown to induce NAMPT expression leading to NAD+ production, and ultimately, SIRT3 activation (36), thereby creating an additional enzymatic negative feedback loop to the molecular clock mechanism (32). Similarly, AMPK is directly involved in the phosphorylation and degradation of CRY and thus contributes to the regulation of the potency of the transcription negative feedback loop (Figure 2) (32).
Niels_Proefschrift.indd 12Niels_Proefschrift.indd 12 08/12/2020 18:04:2208/12/2020 18:04:22

13
General Introduction
Figure 2 – Overview of the transcription and enzymatic feedback loops connecting the molecular clock to cellular metabolism. Abbreviations: AMPK = AMP-activated protein kinase, BMAL1 = brain and muscle Arnt-like 1, CLOCK = circadian locomotor output cycles kaput, Cry = cryptochrome, E-box = enhancer box, Per = period circadian protein, NAD(H) = nicotinamide adenine dinucleotide, NAM = nicotinamide, NAMPT = nicotinamide phosphoribosyltransferase, SIRT1 = sirtuin 1.Adapted from: Eckel-Mahan et al. Metabolism and the Circadian Clock Converge. Physiological Reviews. 2013.
Recently, mitochondrial function has been demonstrated to exhibit a rhythmic day-night cycle in young, healthy, lean men (37), thereby confirming the link between the molecular clock and mitochondrial function. With mitochondrial function known to be impaired in older adults (19) and insulin resistant individuals (38, 39), the question raised is whether an impaired mitochondrial function also translates into an impairment in molecular clock functionality, which is investigated in Chapter 5, thereby possibly revealing a novel target for the combat of mitochondrial dysfunction in ageing and insulin resistance.
The obesity pandemic: tipping the scales in the wrong direction
The prevailing obesity pandemic constitutes a major risk for the development of noncommunicable diseases (40), and as of 2016, 38.9% of all adults globally were overweight (body mass index (BMI) >25 kg/m2) (41) and 13.1% were obese (BMI >30 kg/m2) (42). Unfortunately, these numbers are still on the rise, in part by the aggravation of the development of obesity seen with ageing, thereby adding more weight to the socio-economic burden of disease.
In essence, obesity is the consequence of a chronic state of energy abundance as a result of energy consumption outweighing energy expenditure. Thus, a great
1
Niels_Proefschrift.indd 13Niels_Proefschrift.indd 13 08/12/2020 18:04:2308/12/2020 18:04:23
14
Chapter 1
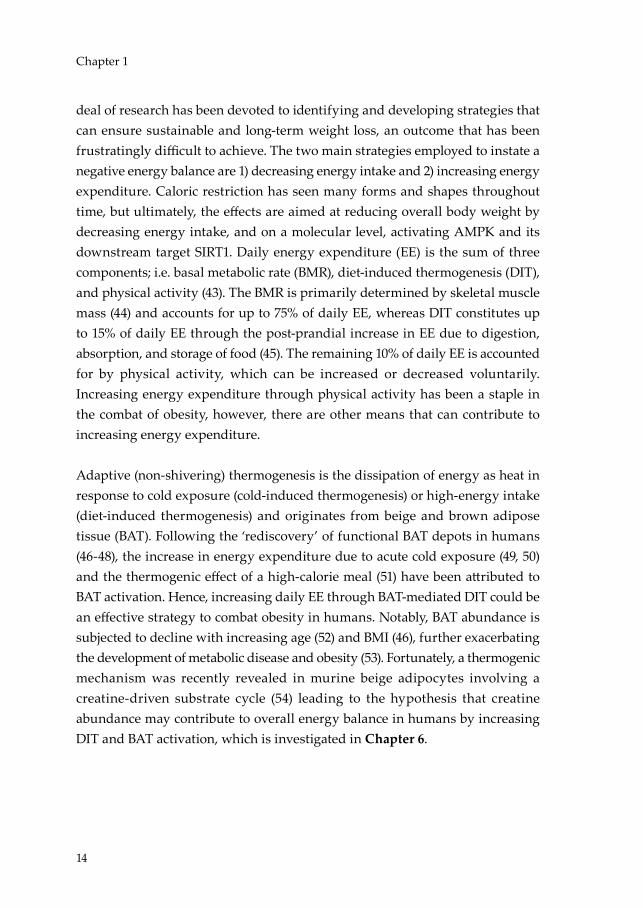
deal of research has been devoted to identifying and developing strategies that can ensure sustainable and long-term weight loss, an outcome that has been frustratingly difficult to achieve. The two main strategies employed to instate a negative energy balance are 1) decreasing energy intake and 2) increasing energy expenditure. Caloric restriction has seen many forms and shapes throughout time, but ultimately, the effects are aimed at reducing overall body weight by decreasing energy intake, and on a molecular level, activating AMPK and its downstream target SIRT1. Daily energy expenditure (EE) is the sum of three components; i.e. basal metabolic rate (BMR), diet-induced thermogenesis (DIT), and physical activity (43). The BMR is primarily determined by skeletal muscle mass (44) and accounts for up to 75% of daily EE, whereas DIT constitutes up to 15% of daily EE through the post-prandial increase in EE due to digestion, absorption, and storage of food (45). The remaining 10% of daily EE is accounted for by physical activity, which can be increased or decreased voluntarily. Increasing energy expenditure through physical activity has been a staple in the combat of obesity, however, there are other means that can contribute to increasing energy expenditure.
Adaptive (non-shivering) thermogenesis is the dissipation of energy as heat in response to cold exposure (cold-induced thermogenesis) or high-energy intake (diet-induced thermogenesis) and originates from beige and brown adipose tissue (BAT). Following the ‘rediscovery’ of functional BAT depots in humans (46-48), the increase in energy expenditure due to acute cold exposure (49, 50) and the thermogenic effect of a high-calorie meal (51) have been attributed to BAT activation. Hence, increasing daily EE through BAT-mediated DIT could be an effective strategy to combat obesity in humans. Notably, BAT abundance is subjected to decline with increasing age (52) and BMI (46), further exacerbating the development of metabolic disease and obesity (53). Fortunately, a thermogenic mechanism was recently revealed in murine beige adipocytes involving a creatine-driven substrate cycle (54) leading to the hypothesis that creatine abundance may contribute to overall energy balance in humans by increasing DIT and BAT activation, which is investigated in Chapter 6.
Niels_Proefschrift.indd 14Niels_Proefschrift.indd 14 08/12/2020 18:04:2308/12/2020 18:04:23

15
General Introduction
Thesis outline
This thesis aims to identify and investigate novel targets with the aim to promote healthspan by improving metabolic health. Encompassing a narrative review, two cross-sectional studies, and two intervention trials, this thesis focusses on a number of targets aiming to combat metabolic disease stemming from mitochondrial dysfunction and dysregulated nutrient sensing as seen in ageing, obesity, and insulin resistance (depicted in Figure 3).
Figure 3 – An overview of the contents of this thesis. The numbers denote the chapters with each major topic.
In Chapter 2, the state-of-the-art concerning the efficacy of influencing the NAD+ metabolism in humans is reviewed with the aim to identify strategies to improve metabolic health. Chapter 3 takes inspiration from the preceding chapter and investigates the efficacy of a dietary approach to NAD+ supplementation on skeletal muscle mitochondrial function in fourteen community-dwelling, physically compromised, older adults in a randomised, controlled trial. Chapter 4 investigates the relationship between skeletal muscle mitochondrial function and its respective relationship with skeletal muscle health and physical function in the presence of ageing. These relationships are studied through detailed metabolic phenotyping of 59 individuals including older adults with a range in physical function, varying from frail to athletes, and healthy, young adult controls. Chapter 5 investigates the rhythmicity of skeletal muscle mitochondrial function in a group of twelve overweight, middle-aged to older, insulin resistant men though serial skeletal muscle biopsies under strictly controlled living conditions. In Chapter 6, the role of creatine abundance on brown adipose tissue
1
Niels_Proefschrift.indd 15Niels_Proefschrift.indd 15 08/12/2020 18:04:2508/12/2020 18:04:25

16
Chapter 1
activation and diet-induced thermogenesis is investigated in fourteen healthy, vegetarian adults in a randomised, placebo-controlled trial.
In conclusion, Chapter 7 will reflect on the major findings of the preceding experimental chapters in this thesis and discuss their relevance and impact in the broader perspective of the scientific status quo, culminating in recommendations for future research in the field of ageing and metabolic research.
Niels_Proefschrift.indd 16Niels_Proefschrift.indd 16 08/12/2020 18:04:2508/12/2020 18:04:25

17
General Introduction
References1. WHO. World health statistics: Life expectancy and Healthy life expectancy, 2000-
2016 Geneva; 2018 [Available from: https://apps.who.int/gho/data/view.main.SDG2016LEXREGv?lang=en.
2. WHO. World health statistics 2019: monitoring health for the SDGs, sustainable development goals. Geneva; 2019.
3. UN. World Population Prospects 2019: Highlights (ST/ESA/SER.A/423). Department of Economic and Social Affairs PD; 2019.
4. CBS. Prognose bevolking; kerncijfers, 2018-2060 2018 [Available from: https://www.volksgezondheidenzorg.info/onderwerp/bevolking/cijfers-context/bevolkingsomvang#node-prognose-bevolkingsopbouw.
5. Lopez-Otin C, Blasco MA, Partridge L, Serrano M, Kroemer G. The hallmarks of aging. Cell. 2013;153(6):1194-217.
6. WHO. Global Health Estimates 2016: Deaths by Cause, Age, Sex, by Country and by Region, 2000-2016. Geneva; 2018.
7. RIVM. Toekomstverkenning zorguitgaven 2015-2060. Kwantitatief vooronderzoek in opdracht van de Wetenschappelijke Raad voor het Regeringsbeleid. Deel 1: toekomstprojecties. 2020.
8. Ridout KK, Levandowski M, Ridout SJ, Gantz L, Goonan K, Palermo D, et al. Early life adversity and telomere length: a meta-analysis. Mol Psychiatry. 2018;23(4):858-71.
9. Blackburn EH, Epel ES, Lin J. Human telomere biology: A contributory and interactive factor in aging, disease risks, and protection. Science. 2015;350(6265):1193-8.
10. Akbari M, Kirkwood TBL, Bohr VA. Mitochondria in the signaling pathways that control longevity and health span. Ageing Res Rev. 2019;54:100940.
11. Houtkooper RH, Auwerx J. Exploring the therapeutic space around NAD+. J Cell Biol. 2012;199(2):205-9.
12. Houtkooper RH, Pirinen E, Auwerx J. Sirtuins as regulators of metabolism and healthspan. Nat Rev Mol Cell Biol. 2012;13(4):225-38.
13. Lin SC, Hardie DG. AMPK: Sensing Glucose as well as Cellular Energy Status. Cell Metab. 2018;27(2):299-313.
14. Canto C, Jiang LQ, Deshmukh AS, Mataki C, Coste A, Lagouge M, et al. Interdependence of AMPK and SIRT1 for metabolic adaptation to fasting and exercise in skeletal muscle. Cell Metab. 2010;11(3):213-9.
15. Price NL, Gomes AP, Ling AJ, Duarte FV, Martin-Montalvo A, North BJ, et al. SIRT1 is required for AMPK activation and the beneficial effects of resveratrol on mitochondrial function. Cell Metab. 2012;15(5):675-90.
16. Canto C, Menzies KJ, Auwerx J. NAD(+) Metabolism and the Control of Energy Homeostasis: A Balancing Act between Mitochondria and the Nucleus. Cell Metab. 2015;22(1):31-53.
17. de Guia RM, Agerholm M, Nielsen TS, Consitt LA, Sogaard D, Helge JW, et al. Aerobic and resistance exercise training reverses age-dependent decline in NAD(+) salvage capacity in human skeletal muscle. Physiol Rep. 2019;7(12):e14139.
18. Massudi H, Grant R, Braidy N, Guest J, Farnsworth B, Guillemin GJ. Age-associated changes in oxidative stress and NAD+ metabolism in human tissue. PLoS One. 2012;7(7):e42357.
1
Niels_Proefschrift.indd 17Niels_Proefschrift.indd 17 08/12/2020 18:04:2508/12/2020 18:04:25

18
Chapter 1
19. Short KR, Bigelow ML, Kahl J, Singh R, Coenen-Schimke J, Raghavakaimal S, et al. Decline in skeletal muscle mitochondrial function with aging in humans. Proc Natl Acad Sci U S A. 2005;102(15):5618-23.
20. Andreux PA, van Diemen MPJ, Heezen MR, Auwerx J, Rinsch C, Groeneveld GJ, et al. Mitochondrial function is impaired in the skeletal muscle of pre-frail elderly. Sci Rep. 2018;8(1):8548.
21. Fried LP, Tangen CM, Walston J, Newman AB, Hirsch C, Gottdiener J, et al. Frailty in older adults: evidence for a phenotype. J Gerontol A Biol Sci Med Sci. 2001;56(3):M146-56.
22. Hesselink MK, Schrauwen-Hinderling V, Schrauwen P. Skeletal muscle mitochondria as a target to prevent or treat type 2 diabetes mellitus. Nat Rev Endocrinol. 2016;12(11):633-45.
23. Fougere B, Vellas B, van Kan GA, Cesari M. Identification of biological markers for better characterization of older subjects with physical frailty and sarcopenia. Transl Neurosci. 2015;6(1):103-10.
24. Silva AM, Shen W, Heo M, Gallagher D, Wang Z, Sardinha LB, et al. Ethnicity-related skeletal muscle differences across the lifespan. Am J Hum Biol. 2010;22(1):76-82.
25. Goodpaster BH, Park SW, Harris TB, Kritchevsky SB, Nevitt M, Schwartz AV, et al. The loss of skeletal muscle strength, mass, and quality in older adults: the health, aging and body composition study. J Gerontol A Biol Sci Med Sci. 2006;61(10):1059-64.
26. Kuk JL, Saunders TJ, Davidson LE, Ross R. Age-related changes in total and regional fat distribution. Ageing Res Rev. 2009;8(4):339-48.
27. Bell JA, Sabia S, Singh-Manoux A, Hamer M, Kivimaki M. Healthy obesity and risk of accelerated functional decline and disability. Int J Obes (Lond). 2017;41(6):866-72.
28. Cruz-Jentoft AJ, Landi F. Sarcopenia. Clin Med (Lond). 2014;14(2):183-6.29. Dhillon RJ, Hasni S. Pathogenesis and Management of Sarcopenia. Clin Geriatr
Med. 2017;33(1):17-26.30. Van Cauter E, Polonsky KS, Scheen AJ. Roles of circadian rhythmicity and sleep
in human glucose regulation. Endocr Rev. 1997;18(5):716-38.31. Fraser G, Trinder J, Colrain IM, Montgomery I. Effect of sleep and circadian cycle
on sleep period energy expenditure. J Appl Physiol (1985). 1989;66(2):830-6.32. Eckel-Mahan K, Sassone-Corsi P. Metabolism and the circadian clock converge.
Physiol Rev. 2013;93(1):107-35.33. Eckel-Mahan KL, Patel VR, de Mateo S, Orozco-Solis R, Ceglia NJ, Sahar S,
et al. Reprogramming of the circadian clock by nutritional challenge. Cell. 2013;155(7):1464-78.
34. Ramsey KM, Yoshino J, Brace CS, Abrassart D, Kobayashi Y, Marcheva B, et al. Circadian clock feedback cycle through NAMPT-mediated NAD+ biosynthesis. Science. 2009;324(5927):651-4.
35. Nakahata Y, Sahar S, Astarita G, Kaluzova M, Sassone-Corsi P. Circadian control of the NAD+ salvage pathway by CLOCK-SIRT1. Science. 2009;324(5927):654-7.
36. Peek CB, Affinati AH, Ramsey KM, Kuo HY, Yu W, Sena LA, et al. Circadian clock NAD+ cycle drives mitochondrial oxidative metabolism in mice. Science. 2013;342(6158):1243417.
37. van Moorsel D, Hansen J, Havekes B, Scheer F, Jorgensen JA, Hoeks J, et al. Demonstration of a day-night rhythm in human skeletal muscle oxidative capacity. Mol Metab. 2016;5(8):635-45.
Niels_Proefschrift.indd 18Niels_Proefschrift.indd 18 08/12/2020 18:04:2508/12/2020 18:04:25
19
General Introduction
38. de Ligt M, Bruls YMH, Hansen J, Habets MF, Havekes B, Nascimento EBM, et al. Resveratrol improves ex vivo mitochondrial function but does not affect insulin sensitivity or brown adipose tissue in first degree relatives of patients with type 2 diabetes. Mol Metab. 2018;12:39-47.
39. Phielix E, Schrauwen-Hinderling VB, Mensink M, Lenaers E, Meex R, Hoeks J, et al. Lower intrinsic ADP-stimulated mitochondrial respiration underlies in vivo mitochondrial dysfunction in muscle of male type 2 diabetic patients. Diabetes. 2008;57(11):2943-9.
40. Khaodhiar L, McCowen KC, Blackburn GL. Obesity and its comorbid conditions. Clin Cornerstone. 1999;2(3):17-31.
41. Prevalence of overweight among adults, BMI ≥ 25, age-standardized [Internet]. 2017. Available from: https://apps.who.int/gho/data/view.main.GLOBAL2461A?lang=en.
42. Prevalence of obesity among adults, BMI ≥ 30, age-standardized [Internet]. 2017. Available from: https://apps.who.int/gho/data/view.main.REGION2480A?lang=en.
43. Marlatt KL, Ravussin E. Brown Adipose Tissue: an Update on Recent Findings. Curr Obes Rep. 2017;6(4):389-96.
44. Zurlo F, Larson K, Bogardus C, Ravussin E. Skeletal muscle metabolism is a major determinant of resting energy expenditure. J Clin Invest. 1990;86(5):1423-7.
45. Ravussin E, Lillioja S, Anderson TE, Christin L, Bogardus C. Determinants of 24-hour energy expenditure in man. Methods and results using a respiratory chamber. J Clin Invest. 1986;78(6):1568-78.
46. van Marken Lichtenbelt WD, Vanhommerig JW, Smulders NM, Drossaerts JM, Kemerink GJ, Bouvy ND, et al. Cold-activated brown adipose tissue in healthy men. N Engl J Med. 2009;360(15):1500-8.
47. Cypess AM, Lehman S, Williams G, Tal I, Rodman D, Goldfine AB, et al. Identification and importance of brown adipose tissue in adult humans. N Engl J Med. 2009;360(15):1509-17.
48. Virtanen KA, Lidell ME, Orava J, Heglind M, Westergren R, Niemi T, et al. Functional brown adipose tissue in healthy adults. N Engl J Med. 2009;360(15):1518-25.
49. van der Lans AA, Hoeks J, Brans B, Vijgen GH, Visser MG, Vosselman MJ, et al. Cold acclimation recruits human brown fat and increases nonshivering thermogenesis. J Clin Invest. 2013;123(8):3395-403.
50. Vijgen GH, Bouvy ND, Teule GJ, Brans B, Schrauwen P, van Marken Lichtenbelt WD. Brown adipose tissue in morbidly obese subjects. PLoS One. 2011;6(2):e17247.
51. Vosselman MJ, Brans B, van der Lans AA, Wierts R, van Baak MA, Mottaghy FM, et al. Brown adipose tissue activity after a high-calorie meal in humans. Am J Clin Nutr. 2013;98(1):57-64.
52. Saito M, Okamatsu-Ogura Y, Matsushita M, Watanabe K, Yoneshiro T, Nio-Kobayashi J, et al. High incidence of metabolically active brown adipose tissue in healthy adult humans: effects of cold exposure and adiposity. Diabetes. 2009;58(7):1526-31.
53. Graja A, Gohlke S, Schulz TJ. Aging of Brown and Beige/Brite Adipose Tissue. Handb Exp Pharmacol. 2019;251:55-72.
54. Kazak L, Chouchani ET, Jedrychowski MP, Erickson BK, Shinoda K, Cohen P, et al. A creatine-driven substrate cycle enhances energy expenditure and thermogenesis in beige fat. Cell. 2015;163(3):643-55.
1
Niels_Proefschrift.indd 19Niels_Proefschrift.indd 19 08/12/2020 18:04:2508/12/2020 18:04:25

Niels_Proefschrift.indd 20Niels_Proefschrift.indd 20 08/12/2020 18:04:2508/12/2020 18:04:25
2NAD+ metabolism as a target for metabolic health: have we found the silver bullet?
Niels J. Connell1, Riekelt H. Houtkooper2, and Patrick Schrauwen1
1 Department of Nutrition and Movement Sciences, NUTRIM School for Nutrition and Translational
Research in Metabolism, Maastricht University, Universiteitssingel 50, P.O. Box 616, 6200 MD
Maastricht, the Netherlands2 Laboratory Genetic Metabolic Diseases, Amsterdam Gastroenterology and Metabolism,
Amsterdam UMC, University of Amsterdam, Amsterdam, the Netherlands
Received: 18 September 2018 / Accepted: 28 December 2018Diabetologia. 2019;62:888
Niels_Proefschrift.indd 21Niels_Proefschrift.indd 21 08/12/2020 18:04:3408/12/2020 18:04:34
22
Chapter 2
Created with BioRender.com.
Niels_Proefschrift.indd 22Niels_Proefschrift.indd 22 08/12/2020 18:04:3508/12/2020 18:04:35
23
NAD+ Metabolism as a Target for Metabolic Health
Abstract
NAD+ has gone in and out of fashion within the scientific community a number of times since its discovery in the early 1900s. Over the last decade, NAD+ has emerged as a potential target for combatting metabolic disturbances and the mitochondrial dysfunction that is mediated through sirtuin (SIRT) enzymes. The beneficial metabolic effects of the NAD+/SIRT axis have triggered an increased interest in NAD+ as an enhancer of energy metabolism. As a result, a myriad of publications have focused on NAD+ metabolism, with the majority of the work having been performed using in vitro models, and in vivo work largely consisting of interventions in Caenorhabditis elegans and rodents. Human intervention trials, on the other hand, are scarce. The aim of this review is to provide an overview of the state-of-the-art on influencing NAD+ metabolism in humans and to set the stage for what the future of this exciting field may hold.
Keywords Diabetes, Energy metabolism, Human, Metabolic disease, NAD+, Review
Abbreviations
AMPK AMP-activated protein kinaseHFD High-fat dietNAMPT Nicotinamide phosphoribosyltransferaseNMN Nicotinamide mononucleotidePARP-1 Poly(ADP-ribose) polymerase-1PBMC Peripheral blood mononuclear cellPGC-1α Peroxisome proliferator-activated receptor gamma coactivator 1αSIRT SirtuinTrp l-Tryptophan
2
Niels_Proefschrift.indd 23Niels_Proefschrift.indd 23 08/12/2020 18:04:3508/12/2020 18:04:35
24
Chapter 2
Introduction
In recent years, a tremendous effort has been made to identify approaches for combatting metabolic disturbances and mitochondrial dysfunction, such as those seen in ageing [1] and type 2 diabetes mellitus [2, 3] by specifically targeting the sirtuin (SIRT) enzyme family [4]. SIRTs are NAD+-dependent deacetylating enzymes that regulate cellular metabolism [5]. To date, seven mammalian SIRT enzymes (SIRT1–7) have been identified, each having its own characteristic tissue and subcellular compartment expression, enzyme activity and targets. We kindly refer readers to Houtkooper et al [6] for a comprehensive review on SIRTs.
Several SIRT-targeting strategies have been deployed, demonstrating the metabolic benefits of SIRT activation. In mice, a SIRT1 gain-of-function mutation evoked a metabolic profile that protected against insulin-resistant diabetes by increasing hepatic insulin sensitivity, hepatic glucose tolerance and overall metabolic efficiency [7, 8]. Moreover, a proposed SIRT1 activator, SRT1720, increased mitochondrial respiration and improved insulin sensitivity [9], mimicking the signalling profile observed with caloric restriction [10] in high-fat-diet (HFD)-challenged mice. Resveratrol, an AMP-activated protein kinase (AMPK)-activating polyphenol that activates SIRT1, improved skeletal muscle mitochondrial function in healthy obese men, in individuals with type 2 diabetes and in first-degree relatives of those with type 2 diabetes, although the observed metabolic health effects are inconsistent [11, 12]. Together, these studies indicate that SIRT activation promotes metabolic health.
Why NAD+?
The concept of influencing NAD+ bioavailability to activate the SIRTs was recently proposed for combatting metabolic disturbances and mitochondrial dysfunction in humans [13, 14]. This is supported by reports that decreased NAD bioavailability contributes to metabolic disturbances in ageing mice [15, 16] and humans [17, 18], and also in a rodent model of type 2 diabetes mellitus [16]. SIRTs are important consumers of NAD+ and depend on this rate-limiting substrate to act as metabolic sensors, responding to the level of available NAD+.
Considering the limited scope of this review, we will not digress into detail of the NAD+ metabolism and refer the reader to more comprehensive reviews on
Niels_Proefschrift.indd 24Niels_Proefschrift.indd 24 08/12/2020 18:04:3608/12/2020 18:04:36

25
NAD+ Metabolism as a Target for Metabolic Health
this topic [5, 19-21]. Briefly, however, as NADH is the predominant electron donor to the electron transport chain, NADH/NAD+ redox potential is an important indicator of the bioenergetic status of the cell and is tightly regulated [21]. The cytosolic and mitochondrial NADH/NAD+ and NADPH/NADP+ redox states are strongly connected. These states depend on the formation of NAD+ from NADH through cellular processes, such as the glycolytic enzyme activity, the citric acid cycle and the electron transport chain [20], thereby exemplifying the essentiality of NAD+ and its redox potential within cellular metabolism. The NAD+ pool is maintained through a continuous process of biosynthesis and breakdown, stemming from the salvage and the Preiss–Handler pathways or from de novo biosynthesis at one end, and enzymatic consumption at the other [20] (Fig. 1). When NAD+ levels rise, SIRTs activate and deac(et)ylate or mono-ADP-ribosylate a variety of metabolic substrates, such as peroxisome proliferator-activated receptor gamma coactivator 1α (PGC-1α) and forkhead box protein O1 (FOXO1). This elicits an array of metabolic adaptations, including mitochondrial biogenesis in skeletal muscle [19] and enhanced oxidative metabolism in skeletal muscle, brown adipose tissue and the liver [22, 23]. On a physiological level, this may lead to improved insulin sensitivity [24, 25], improved metabolic flexibility [26] and increased mitochondrial function [26, 27].
Figure 1 – Summary of NAD+ metabolism. NAD+ can be synthesised from Trp through the de novo biosynthesis pathway in the liver and kidneys. Nicotinic acid (more commonly known as vitamin B3) enters the NAD+ pool through the Preiss–Handler pathway, whereas nicotinamide, nicotinamide riboside and NMN (re-)enter the NAD+ pool through the salvage pathway. NAD+ is consumed by SIRTs, CD38, and PARP enzymes, producing nicotinamide, which enters the pool of NAD+ precursors for resynthesis into NAD+. Dashed arrow, movement of NAD+ within the NAD+ pool. NA, nicotinic acid; NAAD, nicotinic acid adenine dinucleotide; NAM, nicotinamide; NR, nicotinamide riboside.
2
Niels_Proefschrift.indd 25Niels_Proefschrift.indd 25 08/12/2020 18:04:3808/12/2020 18:04:38
26
Chapter 2
NAD+ boosting strategies: preclinical evidence
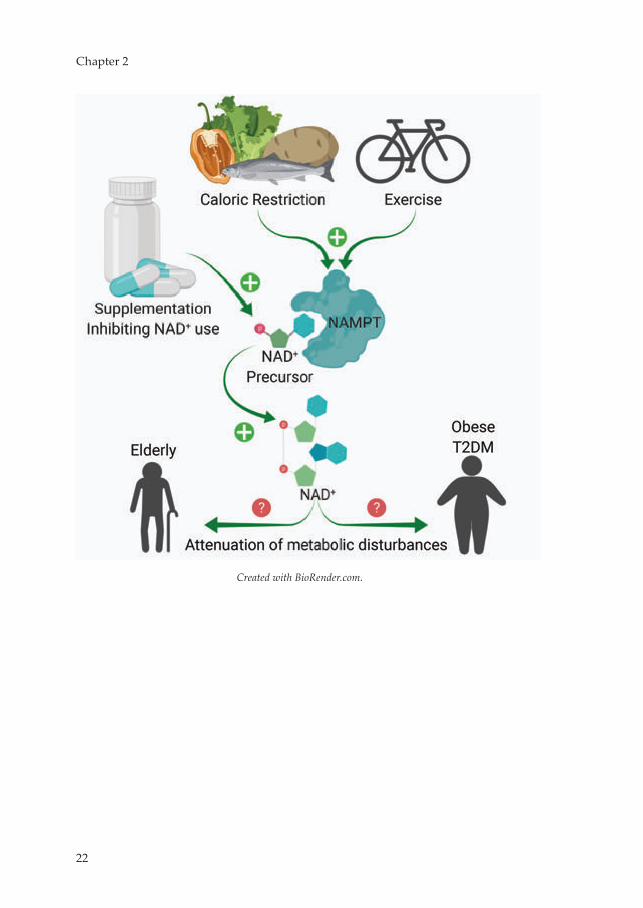
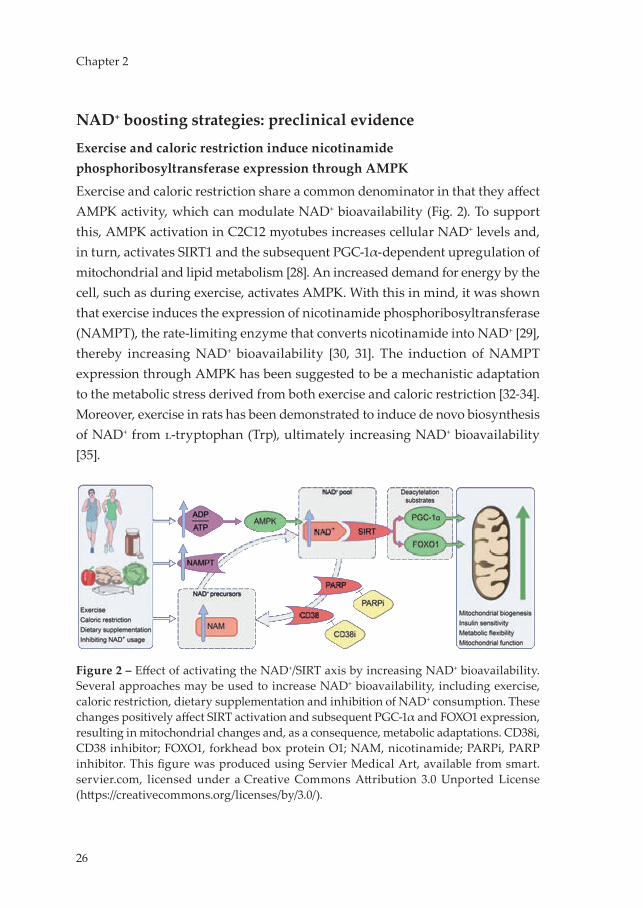
Exercise and caloric restriction induce nicotinamide phosphoribosyltransferase expression through AMPK
Exercise and caloric restriction share a common denominator in that they affect AMPK activity, which can modulate NAD+ bioavailability (Fig. 2). To support this, AMPK activation in C2C12 myotubes increases cellular NAD+ levels and, in turn, activates SIRT1 and the subsequent PGC-1α-dependent upregulation of mitochondrial and lipid metabolism [28]. An increased demand for energy by the cell, such as during exercise, activates AMPK. With this in mind, it was shown that exercise induces the expression of nicotinamide phosphoribosyltransferase (NAMPT), the rate-limiting enzyme that converts nicotinamide into NAD+ [29], thereby increasing NAD+ bioavailability [30, 31]. The induction of NAMPT expression through AMPK has been suggested to be a mechanistic adaptation to the metabolic stress derived from both exercise and caloric restriction [32-34]. Moreover, exercise in rats has been demonstrated to induce de novo biosynthesis of NAD+ from l-tryptophan (Trp), ultimately increasing NAD+ bioavailability [35].
Figure 2 – Effect of activating the NAD+/SIRT axis by increasing NAD+ bioavailability. Several approaches may be used to increase NAD+ bioavailability, including exercise, caloric restriction, dietary supplementation and inhibition of NAD+ consumption. These changes positively affect SIRT activation and subsequent PGC-1α and FOXO1 expression, resulting in mitochondrial changes and, as a consequence, metabolic adaptations. CD38i, CD38 inhibitor; FOXO1, forkhead box protein O1; NAM, nicotinamide; PARPi, PARP inhibitor. This figure was produced using Servier Medical Art, available from smart.servier.com, licensed under a Creative Commons Attribution 3.0 Unported License (https://creativecommons.org/licenses/by/3.0/).
Niels_Proefschrift.indd 26Niels_Proefschrift.indd 26 08/12/2020 18:04:4108/12/2020 18:04:41

27
NAD+ Metabolism as a Target for Metabolic Health
NAD+ precursors increase NAD+ bioavailability and activate SIRTs
Various research groups have pursued sustained SIRT activation through an increase in endogenous NAD+ bioavailability. Preclinical research in ageing or HFD-challenged mice has shown that boosting NAD+ levels by supplementation with NAD+ precursors, such as nicotinamide mononucleotide (NMN) or nicotinamide riboside, attenuates age-related decline of muscle strength [1, 36], increases lifespan and healthspan [36]. In addition, oxidative metabolism and activation of SIRT1 and SIRT3 are enhanced in HFD-fed mice supplemented with NAD+ precursors [26]. In aged mice, NAD+ precursor supplementation also restored arterial SIRT1 activity, which was associated with improved vascular function and decreased aortic stiffness [37]. These findings demonstrate the feasibility of altering NAD+ bioavailability and subsequent SIRT activation.
More specifically, in HFD-fed mice, exogenous administration of the NAD+ precursor nicotinamide mononucleotide (NMN) was demonstrated to be a viable method of increasing endogenous NAD+ bioavailability and inducing SIRT1 activity, thereby attenuating the effects of the HFD and improving glucose tolerance and hepatic insulin sensitivity [16]. Long-term administration of NMN was also found to mitigate the age-associated decline in energy metabolism, insulin sensitivity and lipid metabolism [36]. Similarly, supplementation of HFD-challenged mice with nicotinamide riboside (another NAD+ precursor), also improved hepatic insulin sensitivity [26]. Additionally, an improved glucose tolerance and lipid profile were observed in mouse models of age-induced type 2 diabetes upon NMN supplementation [16].
The NAD+ precursors nicotinic acid and nicotinamide have also been used to supplement HFD-challenged mice, increasing hepatic NAD+ levels and improving glucose tolerance. In one study, nicotinamide proved to be a more potent booster of NAD+ than nicotinic acid as it was also found to specifically alter the expression of SIRT1, SIRT2 and SIRT6 [38]. Lastly, Acipimox, a synthetic nicotinic acid analogue, has been shown to elevate NAD+ in C2C12 myotubes [39].
Together, these preclinical data suggest that dietary supplementation of NAD+ precursors can increase NAD+ levels and beneficially affect metabolic health.
2
Niels_Proefschrift.indd 27Niels_Proefschrift.indd 27 08/12/2020 18:04:4108/12/2020 18:04:41

28
Chapter 2
Inhibition of NADases increases NAD+ bioavailability and SIRT1 activity
Preclinical research has explored compounds that can inhibit the NADases CD38 [40] and poly(ADP-ribose) polymerase-1 (PARP-1), reducing the enzymatic competition for their shared substrate, for example by reducing their NAD+-binding capacity, and thus enhancing SIRT1 activity (Fig. 2). Following this line of thought, a decrease in PARP-1 activity coincides with a rise in SIRT activity and NAD+ levels in worms [41] and mice [27], with PARP-1−/− mice displaying a leaner phenotype with higher energy expenditure compared with PARP-1+/+ mice. In line with this, in skeletal muscle, PARP-1 inhibitor-induced increases in SIRT1 activity were accompanied by improved mitochondrial function, enhanced energy expenditure and endurance performance [42]. In endothelial progenitor cells, PARP-1 inhibition also preserved cellular NAD+ content [43]. Similarly, Cd38 knockout mice have elevated NAD+ levels and are protected against HFD-induced metabolic inflexibility [44]. Moreover, the compounds apigenin, quercetin [45] and 78c [46] have all been demonstrated to enhance NAD+ levels and SIRT1 activity by inhibiting CD38.
How to boost NAD+ in humans?
Increasing NAD+ bioavailability through exercise and caloric restriction
Regular exercise and caloric restriction are well known to improve metabolic health in humans [47]. Alongside improving insulin sensitivity, metabolic flexibility and mitochondrial function, exercise also upregulates the expression of NAMPT in human skeletal muscle [48] (Fig. 2). Endurance-trained athletes have a twofold higher expression of NAMPT in skeletal muscle compared with baseline levels in sedentary obese, non-obese and type 2 diabetic individuals. After completing a 3 week training intervention, the non-obese group displayed increased NAMPT expression over baseline. NAMPT levels correlated positively with PGC-1α expression, mitochondrial content, maximal mitochondrial ATP synthesis in skeletal muscle and overall maximal aerobic capacity [48]. Concordantly, increased skeletal muscle SIRT3 content and PGC-1α expression were reported in men who were sedentary obese at baseline after a 12 week aerobic exercise intervention [49]. In a 6 week one-leg endurance exercise intervention, NAMPT protein levels only increased in the trained leg as compared with the untrained leg [34], further supporting the paradigm of activating the NAD+/SIRT axis through exercise and NAMPT induction.
Niels_Proefschrift.indd 28Niels_Proefschrift.indd 28 08/12/2020 18:04:4108/12/2020 18:04:41

29
NAD+ Metabolism as a Target for Metabolic Health
Continuing, during a caloric restriction-induced weight-loss intervention, NAMPT and subsequent SIRT1 expression were found to be increased in adipose tissue of healthy obese participants [50] when compared with healthy lean participants. The participants were studied prior to, and after 5 months and 12 months, of the intervention, with the intervention resulting in a loss of 17.1 % of body weight in the obese group. At baseline, gene expression of SIRT1, SIRT3, SIRT7 and NAMPT were significantly lower and PARP-1 activity significantly higher in the obese participants when compared with the lean group, indicating a state of low NAD+ bioavailability in obese individuals. With weight loss, SIRT1 expression increased, whereas PARP-1 activity declined in the subcutaneous adipose tissue of the obese group [50]. Evidence that a state of obesity or overnutrition indeed lowers NAD+ levels also comes from studies of longer-term overfeeding using an HFD for 8 weeks in young, healthy men. This resulted in reduced NAD+ levels and SIRT activity in skeletal muscle when compared with baseline [51]. This was further supported by PGC-1α hyperacetylation in the same skeletal muscle biopsies. Concurring with these findings, a study in young adult monozygotic twins (n=26 obesity-discordant pairs and n=14 obesity-concordant pairs) reported that obesity was associated with lower NAD+/SIRT axis activation in subcutaneous adipose tissue [14]. Together, these findings suggest that a state of energy abundance is prone to reduce the activity of the NAD+/SIRT axis and that inducing a state of energy demand may aid to restore NAD+ levels.
Supplementation of NAD+ precursors
From a human dietary perspective, Trp, nicotinic acid, nicotinamide, and nicotinamide riboside are the predominant NAD+ precursors currently used in intervention trials, with nicotinamide riboside being the latest addition to the array of dietary NAD+ precursors (Fig. 1). The efficacy and safety of treatment with each of these NAD+ precursors are discussed in more detail below.
Nicotinamide Phase 0 and phase 1 trials have demonstrated tolerance and safety of nicotinamide in daily pharmacological doses up to 3.5 g [52-56] and single doses of up to 6 g [57-59]. However, at doses above this, nicotinamide can become hepatotoxic [60].
Nicotinic acid and Acipimox Nicotinic acid is the most effective pharmacological drug available for elevating HDL-cholesterol and lowering total cholesterol, LDL-
2
Niels_Proefschrift.indd 29Niels_Proefschrift.indd 29 08/12/2020 18:04:4108/12/2020 18:04:41

30
Chapter 2
cholesterol and triacylglycerol levels, thereby reducing the overall cardiovascular risk profile of the user [61]. However, nicotinic acid can elevate plasma glucose levels by inducing insulin resistance following a rebound increase in circulating NEFAs [62]. This poses a challenge when using nicotinic acid as (add-on to statin) therapy for dyslipidaemia in individuals with impaired glucose tolerance, impaired fasted glucose or type 2 diabetes, with the reduction in overall cardiovascular disease risk on one hand and compromised glycaemic control on the other. The worsening of hyperglycaemia with nicotinic acid use would possibly require additional therapeutic fine tuning to be implemented on an individual level to maintain glycaemic control. Alternatively, a reduction in the dose of nicotinic acid could improve glycaemic control, however, this may require acceptance of reciprocal compromise of the lipid profile or additional therapy to be initiated.
A large clinical trial evaluated the efficacy of nicotinic acid as a treatment for hypercholesterolaemia, with a daily dose of 1–3 g, for a duration of 96 weeks [63]. Overall, nicotinic acid was well tolerated. However, flushing was reported as a major adverse event. In contrast to nicotinamide, nicotinic acid is a vasoactive compound [64] and activates the G protein-coupled receptor, GPR109A, thereby inducing flushing [65]. In an attempt to reduce the occurrence of flushing and improve adherence, synthetic and extended- and sustained-release formulations of nicotinic acid were developed. Acipimox is a synthetic nicotinic acid analogue and, thereby, an NAD+ precursor that can be utilised by the Preiss–Handler pathway (Fig. 1). Although Acipimox displays the vasoactive properties that lead to flushing, we previously showed that treating individuals with type 2 diabetes with Acipimox for 2 weeks resulted in an improvement in skeletal muscle mitochondrial function [39]. In two other trials, Acipimox therapy improved insulin sensitivity [66, 67]. However, Acipimox is mainly used for lowering circulating NEFA levels and these human experiments do not allow us to conclude whether the beneficial effects observed were due to NAD+ boosting actions alone, although, in the first trial [39], the improved mitochondrial function with Acipimox therapy was accompanied with elevated (as opposed to lower) NEFA levels due to a known rebound effect. Unfortunately, the newer formulations of nicotinic acid have been associated with a higher occurrence of gastro-intestinal complaints, hepatotoxicity and hyperglycaemia, and a decreased HDL-cholesterol-raising efficacy compared with regular nicotinic acid
Niels_Proefschrift.indd 30Niels_Proefschrift.indd 30 08/12/2020 18:04:4108/12/2020 18:04:41
31
NAD+ Metabolism as a Target for Metabolic Health
[61]. Together, the side effects limit the use of nicotinic acid for further clinical exploration and implementation.
NADH NADH supplementation has also been used to boost NAD+ levels in humans. In a small study, 80 adults with chronic fatigue syndrome received daily doses of 20 mg of NADH combined with 200 mg of coenzyme Q10 and were compared with placebo-treated individuals [68, 69]. The intervention improved reported fatigue [68] and increased maximal heart rate after 8 weeks of treatment [69] but did not alter body weight or blood pressure. Additionally, in peripheral blood mononuclear cells (PBMCs), the intervention significantly reduced NAD+ levels and increased NADH levels, thus, significantly lowering the NAD+/NADH ratio over baseline. Furthermore, ATP content and citrate synthase activity were significantly increased in PBMCs [68]. Unfortunately, it cannot be distinguished whether the observed results were solely attributed to NADH supplementation considering the co-administration of coenzyme Q10 in this study.
Nicotinamide riboside In contrast to nicotinic acid, nicotinamide riboside is not vasoactive and does not cause flushing [70], thereby overcoming one of the adverse effects of nicotinic acid supplementation. In a recently published placebo-controlled, double-blind, randomised, phase 1 crossover trial, a daily dose of 1000 mg of nicotinamide riboside for 6 weeks was demonstrated to be well tolerated and adverse events were no more frequent than in the placebo arm [71]. These findings are confirmatory of the preceding phase 1 trials [72-74]. Additionally, nicotinic acid adenine dinucleotide (NAAD) has been confirmed as a reliable and sensitive biomarker for assessing changes in NAD+ levels following nicotinamide riboside supplementation [72].
Daily nicotinamide riboside supplementation of up to 2000 mg can effectively enhance blood NAD+ levels, achieving higher steady-state concentrations over baseline [73]. Concordantly, a more recent study demonstrated that nicotinamide riboside supplementation increased NAAD and NAD+ levels by ~60% in PBMCs. In this study, the effect of 6 weeks of nicotinamide riboside supplementation vs placebo was tested in healthy middle-aged and older adults. It was also found that 6 weeks of nicotinamide riboside supplementation tended to improve systolic blood pressure and pulse-wave velocity, both of which are markers of cardiovascular health [71]. However, no effect of nicotinamide riboside
2
Niels_Proefschrift.indd 31Niels_Proefschrift.indd 31 08/12/2020 18:04:4108/12/2020 18:04:41
32
Chapter 2
supplementation was found on physical performance outcomes, such as the 4 metre or 6 minute walk test, handgrip strength or maximum torque. Moreover, metabolic variables, such as VO2max during a treadmill exhaustion test, respiratory exchange ratio, and insulin sensitivity assessed by an IVGTT, did not differ between the groups. From these findings, it was concluded that long-term nicotinamide riboside supplementation is a viable strategy for enhancing NAD+ in humans and potentially has cardiovascular benefits that require further exploration in larger trials.
Most recently, an RCT of daily treatment with 2000 mg of nicotinamide riboside for 12 weeks was reported, evaluating safety, insulin sensitivity and other metabolic variables in 40 healthy, obese, middle-aged men [75]. Overall, nicotinamide riboside was well tolerated and only four adverse events were reported: pruritus, excessive sweating, bloating and transient changes in stools. Nicotinamide riboside supplementation increased NAD+ metabolism, as was seen by an increase in urinary metabolites. Using the hyperinsulinaemic–euglycaemic clamp technique, insulin sensitivity was found to be unchanged before and after supplementation and when compared with the placebo condition. In addition, resting energy expenditure and respiratory exchange ratio were not affected by nicotinamide riboside supplementation. Also, intrahepatic lipid content and body composition remained unchanged in the treatment group vs baseline and compared with the placebo group. Finally, a significant but modest increase in serum triacylglycerol levels was detected after nicotinamide riboside supplementation when compared with baseline values. The authors concluded that this study was underpowered and future studies should be larger and focus on other variables of metabolic health, such as intrahepatic lipid content, which showed significant changes in rodents [76, 77] treated with nicotinamide riboside and approached significance in this study.
Tryptophan Another dietary NAD+ precursor, Trp, is an essential amino acid and is metabolised into NAD+ through de novo biosynthesis in the liver and kidneys [20]. This route is critical for maintaining the NAD+ pool, even though the conversion ratio of Trp to NAD+ is low in humans, averaging 60:1 [78]. Nonetheless, Trp is deemed capable of meeting the metabolic demands of NAD+ metabolism in nicotinic acid- and nicotinamide-deficient diets, and is
Niels_Proefschrift.indd 32Niels_Proefschrift.indd 32 08/12/2020 18:04:4108/12/2020 18:04:41

33
NAD+ Metabolism as a Target for Metabolic Health
well tolerated at high doses, between 30 and 50 mg/kg bodyweight, apart from drowsiness/sleepiness [79].
Recently, higher circulating Trp levels were identified as a predictive marker for the development of type 2 diabetes in a large prospective Chinese cohort [80]. However, to date, no dietary supplementation studies are available that directly assess whether boosting NAD+ through Trp might be metabolically beneficial in humans.
Inhibition of NAD+ consumers
The drawback of pharmacological strategies involving CD38 and PARP-1 inhibition is the original intended therapeutic use in malignancies [81, 82]. As such, no clinical trials with PARP-1 or CD38 inhibitors that focus on improving metabolic variables have been conducted in humans. This, however, does not imply that this strategy must be abandoned altogether, as a viable work-around to exploit the theoretical metabolic benefit of inhibition of NAD+ consumers may present itself in due time, allowing us to assess their efficacy in clinical trials.
Future perspective
The current evidence base from preclinical research on NAD+ is setting the stage for trials in humans by identifying the points at which intervening in the NAD+ metabolism process seems to be clinically and physiologically relevant (see Summary text box). Even though many results have not been replicated in humans at this point in time, phase 0 and phase 1 trials have proven the feasibility and safety of NAD+ boosting in humans. As most evidence that increased in NAD+ levels may be beneficial to human metabolism comes from indirect observations, such as exercise and weight loss interventions, the assessment of efficacy in well-powered phase 2 and phase 3 trials is urgently awaited in order to draw clear conclusions. Additionally, studies in metabolically disturbed individuals must be considered as these are more in line with the preclinical models used. To date, generally healthy populations have been included in studies in this area, in which the range of improvement may be too small to detect significant changes. The combination of strategies to increase NAD+, such as exercise, caloric restriction, or CD38 and PARP-1 inhibitors, with NAD+ precursor supplementation may also be considered, to evaluate added
2
Niels_Proefschrift.indd 33Niels_Proefschrift.indd 33 08/12/2020 18:04:4208/12/2020 18:04:42

34
Chapter 2
efficacy of such approaches, as seen in mice [15] (see Recommendations text box).
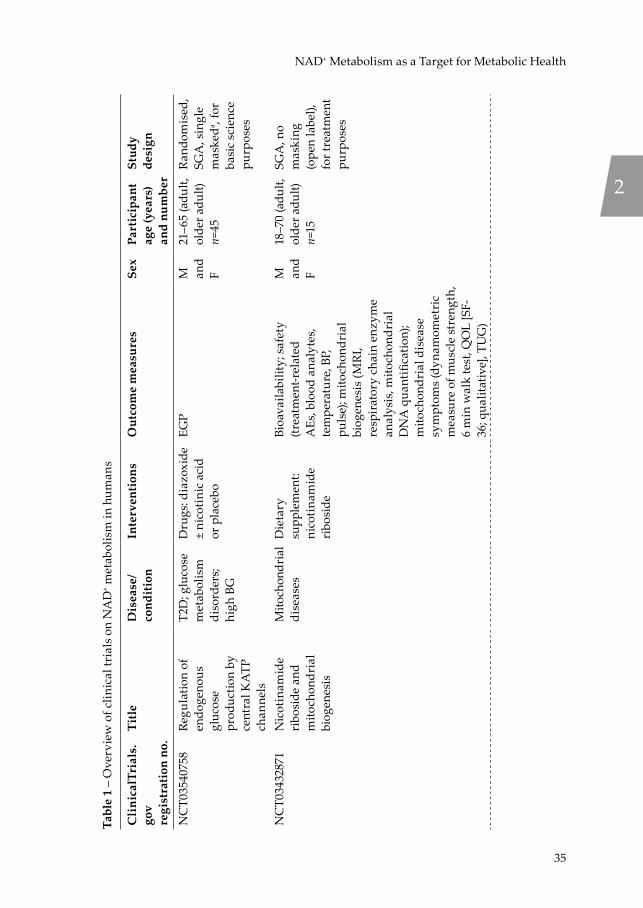
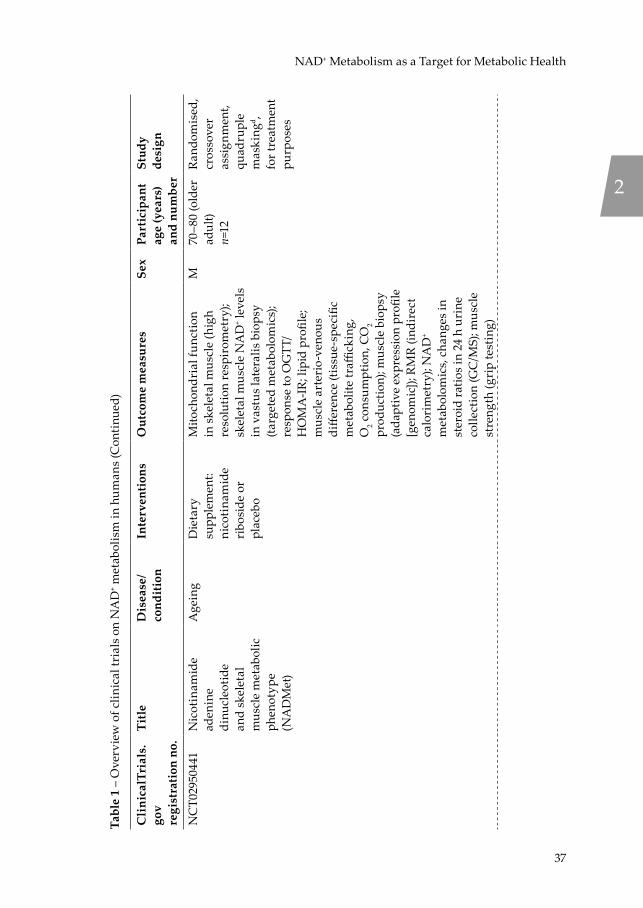
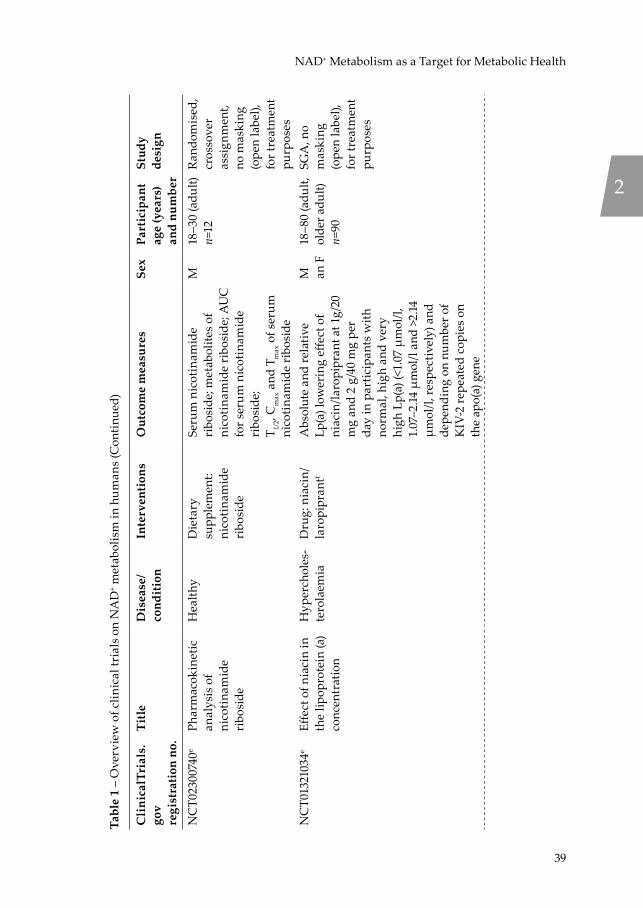
Currently, a number of clinical trials (Table 1) are underway in which NAD+ precursor supplementation is being used to improve (often disturbed) metabolic health variables. The coming years will prove whether the promising results observed in preclinical studies can indeed find human translation.
Recommendations for future NAD+-boosting strategies
• Combining NAD+-boosting strategies may be more effective at increasing NAD+ bioavailability than focusing on a single strategy alone
• Future clinical trials should focus on individuals with metabolic disturbances, such as those with type 2 diabetes or the elderly
Summary of NAD+-boosting strategies in humans
• Exercise and caloric restriction enhance NAMPT expression and, thereby, NAD+ levels
• NAD+ precursors can elevate NAD+ levels and are generally well tolerated, especially nicotinamide riboside
• Human clinical trials investigating the impact of CD38 and PARP-1 inhibitors or Trp on NAD+ availability are lacking
• Conclusive evidence that increasing NAD+ levels attenuates metabolic disturbances in humans is also still eagerly awaited
Niels_Proefschrift.indd 34Niels_Proefschrift.indd 34 08/12/2020 18:04:4208/12/2020 18:04:42
35
NAD+ Metabolism as a Target for Metabolic Health
Tabl
e 1
– O
verv
iew
of c
linic
al tr
ials
on
NA
D+ m
etab
olis
m in
hum
ans
Cli
nica
lTri
als.
gov
regi
stra
tion
no.
Titl
eD
isea
se/
cond
itio
nIn
terv
enti
ons
Out
com
e m
easu
res
Sex
Part
icip
ant
age
(yea
rs)
and
num
ber
Stud
y de
sign
NC
T035
4075
8Re
gula
tion
of
endo
geno
us
gluc
ose
prod
uctio
n by
ce
ntra
l KA
TP
chan
nels
T2D
; glu
cose
m
etab
olis
m
diso
rder
s; hi
gh B
G
Dru
gs: d
iazo
xide
±
nico
tini
c ac
id
or p
lace
bo
EGP
M
and
F
21–6
5 (a
dult,
ol
der a
dult)
n=45
Ran
dom
ised
, SG
A, s
ingl
e m
aske
da , fo
r ba
sic
scie
nce
purp
oses
NC
T034
3287
1N
icot
inam
ide
ribo
side
and
m
itoch
ondr
ial
biog
enes
is
Mito
chon
dria
l di
seas
esD
ieta
ry
supp
lem
ent:
nico
tina
mid
e ri
bosi
de
Bioa
vaila
bilit
y; s
afet
y (tr
eatm
ent-r
elat
ed
AEs
, blo
od a
naly
tes,
tem
pera
ture
, BP,
pu
lse)
; mito
chon
dria
l bi
ogen
esis
(MR
I, re
spir
ator
y ch
ain
enzy
me
anal
ysis
, mito
chon
dria
l D
NA
qua
ntifi
catio
n);
mito
chon
dria
l dis
ease
sy
mpt
oms
(dyn
amom
etri
c m
easu
re o
f mus
cle
stre
ngth
, 6
min
wal
k te
st, Q
OL
[SF-
36; q
ualit
ativ
e], T
UG
)
M
and
F
18–7
0 (a
dult,
ol
der a
dult)
n=15
SGA
, no
mas
king
(o
pen
labe
l),
for t
reat
men
t pu
rpos
es
2
Niels_Proefschrift.indd 35Niels_Proefschrift.indd 35 08/12/2020 18:04:4208/12/2020 18:04:42

36
Chapter 2
Tabl
e 1
– O
verv
iew
of c
linic
al tr
ials
on
NA
D+ m
etab
olis
m in
hum
ans
(Con
tinu
ed)
Cli
nica
lTri
als.
gov
regi
stra
tion
no.
Titl
eD
isea
se/
cond
itio
nIn
terv
enti
ons
Out
com
e m
easu
res
Sex
Part
icip
ant
age
(yea
rs)
and
num
ber
Stud
y de
sign
NC
T033
1003
4N
AD
su
pple
men
tatio
n st
udy
(NA
DS)
Age
ing
Die
tary
su
pple
men
t: N
AD
+ pre
curs
ors
(nic
otin
ic a
cid,
ni
coti
nam
ide
and
Trp)
or c
ontr
ol
Ex v
ivo
mito
chon
dria
l re
spir
atio
n; b
asal
m
etab
olic
rate
; in
vivo
m
itoch
ondr
ial c
apac
ity;
subm
axim
al e
xerc
ise
ener
gy e
xpen
ditu
re;
gluc
ose
tole
ranc
e; e
ctop
ic
lipid
acc
umul
atio
n;
acet
ylca
rniti
ne le
vels
; ph
ysic
al fu
nctio
n
M
and
F
65–7
5 (o
lder
ad
ult)
n=14
Ran
dom
ised
, cr
osso
ver
assi
gnm
ent,
doub
le
mas
king
b , fo
r ba
sic
scie
nce
purp
oses
NC
T031
5170
7Th
e eff
ects
of
nico
tina
mid
e ri
bosi
de
supp
lem
enta
tion
on N
AD
+ /N
AD
H ra
tio a
nd
bioe
nerg
etic
s
Hea
lthy
Dru
g:
nico
tina
mid
e ri
bosi
de
Brai
n N
AD
+ /NA
DH
ratio
; br
ain
PCr/A
TP ra
tio;
crea
tine
kin
ase
enzy
me
rate
M
and
F
18–6
5 (a
dult,
ol
der a
dult)
n=60
SGA
, no
mas
king
(o
pen
labe
l),
for t
reat
men
t pu
rpos
es
NC
T031
5123
9Eff
ect o
f ‘n
icot
inam
ide
mon
onuc
leot
ide’
(N
MN
) on
card
iom
etab
olic
fu
nctio
n
Glu
cose
m
etab
olis
m
diso
rder
s
Die
tary
su
pple
men
t: N
MN
or p
lace
bo
Insu
lin s
ensi
tivity
; bet
a ce
ll fu
nctio
nF
55–7
5 (a
dult,
ol
der a
dult)
n=50
Ran
dom
ised
, pa
ralle
l as
sign
men
t, tr
iple
m
aski
ngc ,
for
basi
c sc
ienc
e pu
rpos
es
Niels_Proefschrift.indd 36Niels_Proefschrift.indd 36 08/12/2020 18:04:4208/12/2020 18:04:42
37
NAD+ Metabolism as a Target for Metabolic Health
Tabl
e 1
– O
verv
iew
of c
linic
al tr
ials
on
NA
D+ m
etab
olis
m in
hum
ans
(Con
tinu
ed)
Cli
nica
lTri
als.
gov
regi
stra
tion
no.
Titl
eD
isea
se/
cond
itio
nIn
terv
enti
ons
Out
com
e m
easu
res
Sex
Part
icip
ant
age
(yea
rs)
and
num
ber
Stud
y de
sign
NC
T029
5044
1N
icot
inam
ide
aden
ine
dinu
cleo
tide
and
skel
etal
m
uscl
e m
etab
olic
ph
enot
ype
(NA
DM
et)
Age
ing
Die
tary
su
pple
men
t: ni
coti
nam
ide
ribo
side
or
plac
ebo
Mito
chon
dria
l fun
ctio
n in
skel
etal
mus
cle
(hig
h re
solu
tion
resp
irom
etry
); sk
elet
al m
uscl
e N
AD
+ lev
els
in v
astu
s la
tera
lis b
iops
y (ta
rget
ed m
etab
olom
ics)
; re
spon
se to
OG
TT/
HO
MA
-IR;
lipi
d pr
ofile
; m
uscl
e ar
teri
o-ve
nous
di
ffere
nce
(tiss
ue-s
peci
fic
met
abol
ite tr
affick
ing,
O
2 con
sum
ptio
n, C
O2
prod
uctio
n); m
uscl
e bi
opsy
(a
dapt
ive
expr
essi
on p
rofil
e [g
enom
ic]);
RM
R (in
dire
ct
calo
rim
etry
); N
AD
+ m
etab
olom
ics,
chan
ges
in
ster
oid
ratio
s in
24
h ur
ine
colle
ctio
n (G
C/M
S); m
uscl
e st
reng
th (g
rip
test
ing)
M70
–80
(old
er
adul
t)n=
12
Ran
dom
ised
, cr
osso
ver
assi
gnm
ent,
quad
rupl
e m
aski
ngd ,
for t
reat
men
t pu
rpos
es
2
Niels_Proefschrift.indd 37Niels_Proefschrift.indd 37 08/12/2020 18:04:4208/12/2020 18:04:42

38
Chapter 2Ta
ble
1 –
Ove
rvie
w o
f clin
ical
tria
ls o
n N
AD
+ met
abol
ism
in h
uman
s (C
onti
nued
)
Cli
nica
lTri
als.
gov
regi
stra
tion
no.
Titl
eD
isea
se/
cond
itio
nIn
terv
enti
ons
Out
com
e m
easu
res
Sex
Part
icip
ant
age
(yea
rs)
and
num
ber
Stud
y de
sign
NC
T028
3566
4eN
icot
inam
ide
ribo
side
and
m
etab
olic
hea
lth
Obe
sity
; in
sulin
re
sist
ance
Die
tary
su
pple
men
t: ni
coti
nam
ide
ribo
side
or
plac
ebo
Mus
cle
and
live
insu
lin
sens
itivi
ty; e
x vi
vo m
uscl
e m
itoch
ondr
ial f
unct
ion;
ec
topi
c lip
id a
ccum
ulat
ion;
BA
T ac
tivity
; car
diov
ascu
lar
risk
var
iabl
es; w
hole
bod
y EE
; bod
y co
mpo
sitio
n;
acet
ylca
rniti
ne le
vels
M
and
F
45–6
5 (a
dult,
ol
der a
dult)
n=15
Ran
dom
ised
, cr
osso
ver
assi
gnm
ent,
quad
rupl
e m
aski
ngd ,
for t
reat
men
t pu
rpos
es
NC
T026
8988
2ePh
arm
acok
inet
ic
stud
y of
ni
coti
nam
ide
ribo
side
Met
abol
ic
dist
urba
nce
Die
tary
su
pple
men
t: ni
coti
nam
ide
ribo
side
Ave
rage
Css
of
nico
tina
mid
e ri
bosi
de a
nd
NA
D fo
llow
ing
up-t
itrat
ion
to 1
000
mg
by m
outh
twic
e da
ily; s
erum
leve
ls o
f K+ ,
crea
tine
kin
ase,
glu
cose
, ur
ic a
cid
and
ALT
M
and
F
21–5
0 (a
dult)
n=8
SGA
, no
mas
king
(o
pen
labe
l)
NC
T023
0348
3eTh
e eff
ect o
f vi
tam
in B
3 on
sub
stra
te
met
abol
ism
, in
sulin
sen
sitiv
ity,
and
body
co
mpo
sitio
n in
ob
ese
men
Obe
sity
Die
tary
su
pple
men
t: ni
coti
nam
ide
ribo
side
or
plac
ebo
Insu
lin s
ensi
tivity
; su
bstr
ate
met
abol
ism
; bod
y co
mpo
sitio
n; a
ctiv
atio
n of
sat
ellit
e ce
lls; l
ipid
ac
cum
ulat
ion
in li
ver a
nd
skel
etal
mus
cle;
glu
cose
tu
rnov
er; i
nsul
in s
igna
lling
in
skel
etal
mus
cle
and
adip
ose
tissu
e bi
opsi
es;
palm
itate
turn
over
; gut
m
icro
biot
a; in
cret
in
horm
one
secr
etio
n
M40
–70
(adu
lt,
olde
r adu
lt)n=
40
Ran
dom
ised
, pa
ralle
l as
sign
men
t, qu
adru
ple
mas
king
d , fo
r tre
atm
ent
purp
oses
Niels_Proefschrift.indd 38Niels_Proefschrift.indd 38 08/12/2020 18:04:4208/12/2020 18:04:42
39
NAD+ Metabolism as a Target for Metabolic Health
Tabl
e 1
– O
verv
iew
of c
linic
al tr
ials
on
NA
D+ m
etab
olis
m in
hum
ans
(Con
tinu
ed)
Cli
nica
lTri
als.
gov
regi
stra
tion
no.
Titl
eD
isea
se/
cond
itio
nIn
terv
enti
ons
Out
com
e m
easu
res
Sex
Part
icip
ant
age
(yea
rs)
and
num
ber
Stud
y de
sign
NC
T023
0074
0ePh
arm
acok
inet
ic
anal
ysis
of
nico
tina
mid
e ri
bosi
de
Hea
lthy
Die
tary
su
pple
men
t: ni
coti
nam
ide
ribo
side
Seru
m n
icot
inam
ide
ribo
side
; met
abol
ites
of
nico
tina
mid
e ri
bosi
de; A
UC
fo
r ser
um n
icot
inam
ide
ribo
side
;T 1/
2, C
max
and
Tm
ax o
f ser
um
nico
tina
mid
e ri
bosi
de
M18
–30
(adu
lt)n=
12R
ando
mis
ed,
cros
sove
r as
sign
men
t, no
mas
king
(o
pen
labe
l),
for t
reat
men
t pu
rpos
esN
CT0
1321
034e
Effec
t of n
iaci
n in
th
e lip
opro
tein
(a)
conc
entr
atio
n
Hyp
erch
oles
-te
rola
emia
Dru
g: n
iaci
n/la
ropi
pran
tfA
bsol
ute
and
rela
tive
Lp(a
) low
erin
g eff
ect o
f ni
acin
/laro
pipr
ant a
t 1g/
20
mg
and
2 g/
40 m
g pe
r da
y in
par
ticip
ants
with
no
rmal
, hig
h an
d ve
ry
high
Lp(
a) (<
1.07
µm
ol/l,
1.
07–2
.14 µ
mol
/l an
d >2
.14
µmol
/l, re
spec
tivel
y) a
nd
depe
ndin
g on
num
ber o
f K
IV-2
repe
ated
cop
ies
on
the
apo(
a) g
ene
M
an F
18–8
0 (a
dult,
ol
der a
dult)
n=90
SGA
, no
mas
king
(o
pen
labe
l),
for t
reat
men
t pu
rpos
es
2
Niels_Proefschrift.indd 39Niels_Proefschrift.indd 39 08/12/2020 18:04:4208/12/2020 18:04:42
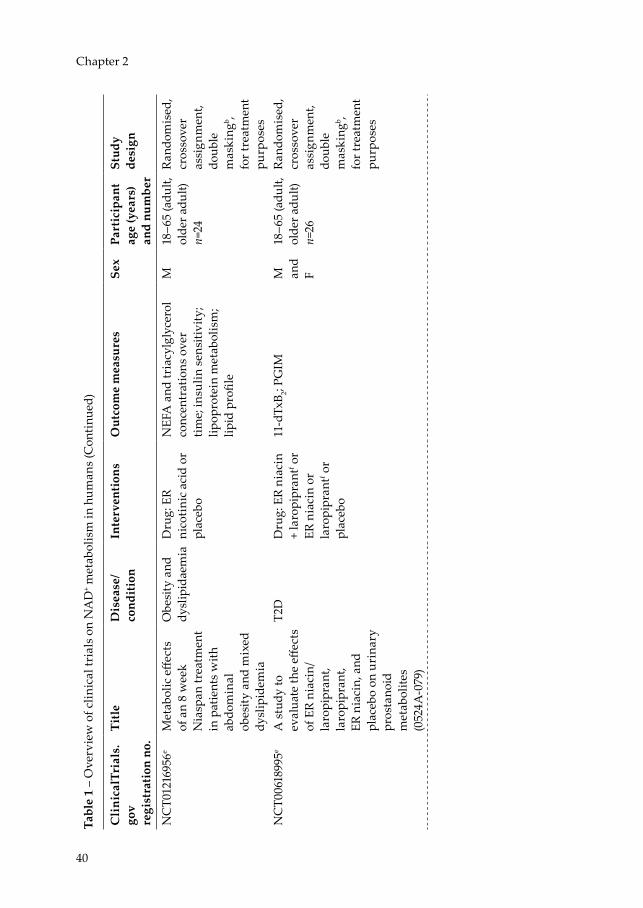
40
Chapter 2
Tabl
e 1
– O
verv
iew
of c
linic
al tr
ials
on
NA
D+ m
etab
olis
m in
hum
ans
(Con
tinu
ed)
Cli
nica
lTri
als.
gov
regi
stra
tion
no.
Titl
eD
isea
se/
cond
itio
nIn
terv
enti
ons
Out
com
e m
easu
res
Sex
Part
icip
ant
age
(yea
rs)
and
num
ber
Stud
y de
sign
NC
T012
1695
6eM
etab
olic
effe
cts
of a
n 8
wee
k N
iasp
an tr
eatm
ent
in p
atie
nts
with
ab
dom
inal
ob
esity
and
mix
ed
dysl
ipid
emia
Obe
sity
and
dy
slip
idae
mia
Dru
g: E
R ni
coti
nic
acid
or
plac
ebo
NEF
A a
nd tr
iacy
lgly
cero
l co
ncen
trat
ions
ove
r tim
e; in
sulin
sen
sitiv
ity;
lipop
rote
in m
etab
olis
m;
lipid
pro
file
M18
–65
(adu
lt,
olde
r adu
lt)n=
24
Ran
dom
ised
, cr
osso
ver
assi
gnm
ent,
doub
le
mas
king
b , fo
r tre
atm
ent
purp
oses
NC
T006
1899
5eA
stu
dy to
ev
alua
te th
e eff
ects
of
ER
niac
in/
laro
pipr
ant,
laro
pipr
ant,
ER n
iaci
n, a
nd
plac
ebo
on u
rina
ry
pros
tano
id
met
abol
ites
(052
4A-0
79)
T2D
Dru
g: E
R ni
acin
+
laro
pipr
antf o
rER
nia
cin
or
laro
pipr
antf o
r pl
aceb
o
11-d
TxB 2;
PGIM
M
and
F
18–6
5 (a
dult,
ol
der a
dult)
n=26
Ran
dom
ised
, cr
osso
ver
assi
gnm
ent,
doub
le
mas
king
b , fo
r tre
atm
ent
purp
oses
Niels_Proefschrift.indd 40Niels_Proefschrift.indd 40 08/12/2020 18:04:4308/12/2020 18:04:43

41
NAD+ Metabolism as a Target for Metabolic Health
Tabl
e 1
– O
verv
iew
of c
linic
al tr
ials
on
NA
D+ m
etab
olis
m in
hum
ans
(Con
tinu
ed)
Cli
nica
lTri
als.
gov
regi
stra
tion
no.
Titl
eD
isea
se/
cond
itio
nIn
terv
enti
ons
Out
com
e m
easu
res
Sex
Part
icip
ant
age
(yea
rs)
and
num
ber
Stud
y de
sign
NC
T004
8575
8eEx
tend
ed n
iaci
n/la
ropi
pran
t in
patie
nts
with
type
2
diab
etes
(052
4A-
069)
T2D
Dru
g: E
R ni
acin
/la
ropi
pran
tf or
pla
cebo
(u
nspe
cifie
d)
LDL-
c; H
DL-
c;
tria
cycl
glyc
erol
M
and
F
18–8
0 (a
dult,
ol
der a
dult)
n =
796
Ran
dom
ised
, pa
ralle
l as
sign
men
t, do
uble
m
aski
ngb ,
for t
reat
men
t pu
rpos
es
Dat
a ar
e fr
om tr
ials
regi
ster
ed o
n C
linic
alTr
ials
.gov
a Par
ticip
ant o
nly
b Par
ticip
ant a
nd in
vest
igat
orc P
artic
ipan
t, ca
re p
rovi
der a
nd in
vest
igat
ord P
artic
ipan
t, ca
re p
rovi
der,
inve
stig
ator
and
out
com
es a
sses
sor
e Tri
al h
as b
een
com
plet
edf L
arop
ipra
nt: p
rost
agla
ndin
D2 r
ecep
tor s
ubty
pe D
P 1 rec
epto
r ant
agon
ist t
hat c
omba
ts n
icot
inic
aci
d-in
duce
d flu
shin
gA
E, a
dver
se e
vent
; ALT
, ala
nine
am
inot
rans
fera
se; B
AT,
bro
wn
adip
ose
tissu
e; B
G, b
lood
glu
cose
; Css
, ste
ady-
stat
e co
ncen
trat
ion;
11-
dTxB
2, ur
inar
y 11
-deh
ydro
thro
mbo
xane
B2;
EE, e
nerg
y ex
pend
iture
; EG
P, e
ndog
enou
s glu
cose
pro
duct
ion;
ER,
ext
ende
d-re
leas
e; F
, fem
ale;
HD
L-c,
H
DL-
chol
este
rol;
KIV
-2, k
ring
le IV
type
2; L
DL-
c, L
DL-
chol
este
rol;
Lp(a
), lip
opro
tein
(a);
M, m
ale;
PC
r, ph
osph
ocre
atin
e; P
GIM
, pro
stag
land
in
I m
etab
olite
; QO
L, q
ualit
y of
life
; RM
R, r
esti
ng m
etab
olic
rat
e; S
F-36
, sho
rt f
orm
(36)
hea
lth s
urve
y qu
estio
nnai
re; S
GA
, sin
gle
grou
p as
sign
men
t; T2
D, t
ype
2 di
abet
es; T
UG
, tim
ed u
p an
d go
test
.
2
Niels_Proefschrift.indd 41Niels_Proefschrift.indd 41 08/12/2020 18:04:4308/12/2020 18:04:43
42
Chapter 2
Acknowledgements
We acknowledge the support from the Netherlands Cardiovascular Research Initiative: an initiative with support of the Dutch Heart Foundation (CVON2014-02 ENERGISE).
Duality of interest
The authors declare that there is no duality of interest associated with this manuscript.
Contribution statement
All authors were responsible for drafting the article and revising it critically for important intellectual content. All authors approved the version to be published
Niels_Proefschrift.indd 42Niels_Proefschrift.indd 42 08/12/2020 18:04:4308/12/2020 18:04:43
43
NAD+ Metabolism as a Target for Metabolic Health
References[1] Frederick DW, Loro E, Liu L, et al. (2016) Loss of NAD homeostasis leads to
progressive and reversible degeneration of skeletal muscle. Cell Metab 24: 269-282[2] Lowell BB, Shulman GI (2005) Mitochondrial dysfunction and type 2 diabetes.
Science 307: 384-387[3] Hesselink MK, Schrauwen-Hinderling V, Schrauwen P (2016) Skeletal muscle
mitochondria as a target to prevent or treat type 2 diabetes mellitus. Nat Rev Endocrinol 12: 633-645
[4] Milne JC, Lambert PD, Schenk S, et al. (2007) Small molecule activators of SIRT1 as therapeutics for the treatment of type 2 diabetes. Nature 450: 712-716
[5] Houtkooper RH, Auwerx J (2012) Exploring the therapeutic space around NAD+. J Cell Biol 199: 205-209
[6] Houtkooper RH, Pirinen E, Auwerx J (2012) Sirtuins as regulators of metabolism and healthspan. Nat Rev Mol Cell Biol 13: 225-238
[7] Banks AS, Kon N, Knight C, et al. (2008) SirT1 gain of function increases energy efficiency and prevents diabetes in mice. Cell Metab 8: 333-341
[8] Pfluger PT, Herranz D, Velasco-Miguel S, Serrano M, Tschop MH (2008) Sirt1 protects against high-fat diet-induced metabolic damage. Proc Natl Acad Sci U S A 105: 9793-9798
[9] Minor RK, Baur JA, Gomes AP, et al. (2011) SRT1720 improves survival and healthspan of obese mice. Sci Rep 1: 70
[10] Smith JJ, Kenney RD, Gagne DJ, et al. (2009) Small molecule activators of SIRT1 replicate signaling pathways triggered by calorie restriction in vivo. BMC Syst Biol 3: 31
[11] de Ligt M, Bruls YMH, Hansen J, et al. (2018) Resveratrol improves ex vivo mitochondrial function but does not affect insulin sensitivity or brown adipose tissue in first degree relatives of patients with type 2 diabetes. Mol Metab 12: 39-47
[12] Timmers S, de Ligt M, Phielix E, et al. (2016) Resveratrol as add-on therapy in subjects with well-controlled type 2 diabetes: a randomized controlled trial. Diabetes Care 39: 2211-2217
[13] Imai S (2010) “Clocks” in the NAD world: NAD as a metabolic oscillator for the regulation of metabolism and aging. Biochim Biophys Acta 1804: 1584-1590
[14] Jukarainen S, Heinonen S, Ramo JT, et al. (2016) Obesity is associated with low NAD+/SIRT pathway expression in adipose tissue of BMI-discordant monozygotic twins. J Clin Endocrinol Metab 101: 275-283
[15] Camacho-Pereira J, Tarrago MG, Chini CCS, et al. (2016) CD38 dictates age-related NAD decline and mitochondrial dysfunction through an SIRT3-dependent mechanism. Cell Metab 23: 1127-1139
[16] Yoshino J, Mills KF, Yoon MJ, Imai S (2011) Nicotinamide mononucleotide, a key NAD+ intermediate, treats the pathophysiology of diet- and age-induced diabetes in mice. Cell Metab 14: 528-536
[17] Zhu XH, Lu M, Lee BY, Ugurbil K, Chen W (2015) In vivo NAD assay reveals the intracellular NAD contents and redox state in healthy human brain and their age dependences. Proc Natl Acad Sci U S A 112: 2876-2881
2
Niels_Proefschrift.indd 43Niels_Proefschrift.indd 43 08/12/2020 18:04:4308/12/2020 18:04:43

44
Chapter 2
[18] Massudi H, Grant R, Braidy N, Guest J, Farnsworth B, Guillemin GJ (2012) Age-associated changes in oxidative stress and NAD+ metabolism in human tissue. PLoS One 7: e42357
[19] Mouchiroud L, Houtkooper RH, Auwerx J (2013) NAD+ metabolism: a therapeutic target for age-related metabolic disease. Crit Rev Biochem Mol Biol 48: 397-408
[20] Houtkooper RH, Canto C, Wanders RJ, Auwerx J (2010) The secret life of NAD+: an old metabolite controlling new metabolic signaling pathways. Endocr Rev 31: 194-223
[21] Canto C, Menzies KJ, Auwerx J (2015) NAD+ metabolism and the control of energy homeostasis: a balancing act between mitochondria and the nucleus. Cell Metab 22: 31-53
[22] Feige JN, Lagouge M, Canto C, et al. (2008) Specific SIRT1 activation mimics low energy levels and protects against diet-induced metabolic disorders by enhancing fat oxidation. Cell Metab 8: 347-358
[23] Ratajczak J, Joffraud M, Trammell SA, et al. (2016) NRK1 controls nicotinamide mononucleotide and nicotinamide riboside metabolism in mammalian cells. Nat Commun 7: 13103
[24] Schenk S, McCurdy CE, Philp A, et al. (2011) Sirt1 enhances skeletal muscle insulin sensitivity in mice during caloric restriction. J Clin Invest 121: 4281-4288
[25] Wang RH, Kim HS, Xiao C, Xu X, Gavrilova O, Deng CX (2011) Hepatic Sirt1 deficiency in mice impairs mTorc2/Akt signaling and results in hyperglycemia, oxidative damage, and insulin resistance. J Clin Invest 121: 4477-4490
[26] Canto C, Houtkooper RH, Pirinen E, et al. (2012) The NAD+ precursor nicotinamide riboside enhances oxidative metabolism and protects against high-fat diet-induced obesity. Cell Metab 15: 838-847
[27] Bai P, Canto C, Oudart H, et al. (2011) PARP-1 inhibition increases mitochondrial metabolism through SIRT1 activation. Cell Metab 13: 461-468
[28] Canto C, Gerhart-Hines Z, Feige JN, et al. (2009) AMPK regulates energy expenditure by modulating NAD+ metabolism and SIRT1 activity. Nature 458: 1056-1060
[29] Revollo JR, Grimm AA, Imai S (2004) The NAD biosynthesis pathway mediated by nicotinamide phosphoribosyltransferase regulates Sir2 activity in mammalian cells. J Biol Chem 279: 50754-50763
[30] Frederick DW, Davis JG, Davila A, Jr., et al. (2015) Increasing NAD synthesis in muscle via nicotinamide phosphoribosyltransferase is not sufficient to promote oxidative metabolism. J Biol Chem 290: 1546-1558
[31] Costford SR, Brouwers B, Hopf ME, et al. (2018) Skeletal muscle overexpression of nicotinamide phosphoribosyl transferase in mice coupled with voluntary exercise augments exercise endurance. Mol Metab 7: 1-11
[32] Fulco M, Cen Y, Zhao P, et al. (2008) Glucose restriction inhibits skeletal myoblast differentiation by activating SIRT1 through AMPK-mediated regulation of Nampt. Dev Cell 14: 661-673
[33] Canto C, Jiang LQ, Deshmukh AS, et al. (2010) Interdependence of AMPK and SIRT1 for metabolic adaptation to fasting and exercise in skeletal muscle. Cell Metab 11: 213-219
[34] Brandauer J, Vienberg SG, Andersen MA, et al. (2013) AMP-activated protein kinase regulates nicotinamide phosphoribosyl transferase expression in skeletal muscle. J Physiol 591: 5207-5220
Niels_Proefschrift.indd 44Niels_Proefschrift.indd 44 08/12/2020 18:04:4308/12/2020 18:04:43

45
NAD+ Metabolism as a Target for Metabolic Health
[35] Ito Y, Yonekura R, Maruta K, et al. (2003) Tryptophan metabolism was accelerated by exercise in rat. Adv Exp Med Biol 527: 531-535
[36] Mills KF, Yoshida S, Stein LR, et al. (2016) Long-term administration of nicotinamide mononucleotide mitigates age-associated physiological decline in mice. Cell Metab 24: 795-806
[37] de Picciotto NE, Gano LB, Johnson LC, et al. (2016) Nicotinamide mononucleotide supplementation reverses vascular dysfunction and oxidative stress with aging in mice. Aging Cell 15: 522-530
[38] Yang SJ, Choi JM, Kim L, et al. (2014) Nicotinamide improves glucose metabolism and affects the hepatic NAD-sirtuin pathway in a rodent model of obesity and type 2 diabetes. J Nutr Biochem 25: 66-72
[39] van de Weijer T, Phielix E, Bilet L, et al. (2015) Evidence for a direct effect of the NAD+ precursor acipimox on muscle mitochondrial function in humans. Diabetes 64: 1193-1201
[40] Haffner CD, Becherer JD, Boros EE, et al. (2015) Discovery, synthesis, and biological evaluation of thiazoloquin(az)olin(on)es as potent CD38 inhibitors. J Med Chem 58: 3548-3571
[41] Fang Evandro F, Scheibye-Knudsen M, Brace Lear E, et al. (2014) Defective mitophagy in XPA via PARP-1 hyperactivation and NAD+/SIRT1 reduction. Cell 157: 882-896
[42] Pirinen E, Canto C, Jo YS, et al. (2014) Pharmacological inhibition of poly(ADP-ribose) polymerases improves fitness and mitochondrial function in skeletal muscle. Cell Metab 19: 1034-1041
[43] Zha S, Li Z, Cao Q, Wang F, Liu F (2018) PARP1 inhibitor (PJ34) improves the function of aging-induced endothelial progenitor cells by preserving intracellular NAD+ levels and increasing SIRT1 activity. Stem Cell Res Ther 9: 224
[44] Chiang SH, Harrington WW, Luo G, et al. (2015) Genetic ablation of CD38 protects against western diet-induced exercise intolerance and metabolic inflexibility. PLoS One 10: e0134927
[45] Escande C, Nin V, Price NL, et al. (2013) Flavonoid apigenin is an inhibitor of the NAD+ ase CD38: implications for cellular NAD+ metabolism, protein acetylation, and treatment of metabolic syndrome. Diabetes 62: 1084-1093
[46] Tarrago MG, Chini CCS, Kanamori KS, et al. (2018) A potent and specific CD38 inhibitor ameliorates age-related metabolic dysfunction by reversing tissue NAD+ decline. Cell Metab 27: 1081-1095 e1010
[47] Smith RL, Soeters MR, Wust RCI, Houtkooper RH (2018) Metabolic flexibility as an adaptation to energy resources and requirements in health and disease. Endocr Rev 39: 489-517
[48] Costford SR, Bajpeyi S, Pasarica M, et al. (2010) Skeletal muscle NAMPT is induced by exercise in humans. American journal of physiology Endocrinology and metabolism 298: E117-E126
[49] Vargas-Ortiz K, Perez-Vazquez V, Figueroa A, Diaz FJ, Montano-Ascencio PG, Macias-Cervantes MH (2018) Aerobic training but no resistance training increases SIRT3 in skeletal muscle of sedentary obese male adolescents. Eur J Sport Sci 18: 226-234
[50] Rappou E, Jukarainen S, Rinnankoski-Tuikka R, et al. (2016) weight loss is associated with increased NAD+/SIRT1 expression but reduced PARP activity in white adipose tissue. J Clin Endocrinol Metab 101: 1263-1273
2
Niels_Proefschrift.indd 45Niels_Proefschrift.indd 45 08/12/2020 18:04:4308/12/2020 18:04:43

46
Chapter 2
[51] Seyssel K, Alligier M, Meugnier E, et al. (2014) Regulation of energy metabolism and mitochondrial function in skeletal muscle during lipid overfeeding in healthy men. J Clin Endocrinol Metab 99: E1254-E1262
[52] Mendola G, Casamitjana R, Gomis R (1989) Effect of nicotinamide therapy upon B-cell function in newly diagnosed type 1 (insulin-dependent) diabetic patients. Diabetologia 32: 160-162
[53] Pozzilli P, Visalli N, Ghirlanda G, Manna R, Andreani D (1989) Nicotinamide increases C-peptide secretion in patients with recent onset type 1 diabetes. Diabet Med 6: 568-572
[54] Vague P, Picq R, Bernal M, Lassmann-Vague V, Vialettes B (1989) Effect of nicotinamide treatment on the residual insulin secretion in type 1 (insulin-dependent) diabetic patients. Diabetologia 32: 316-321
[55] Pozzilli P, Visalli N, Signore A, et al. (1995) Double blind trial of nicotinamide in recent-onset IDDM (the IMDIAB III study). Diabetologia 38: 848-852
[56] Visalli N, Cavallo MG, Signore A, et al. (1999) A multi-centre randomized trial of two different doses of nicotinamide in patients with recent-onset type 1 diabetes (the IMDIAB VI). Diabetes/metabolism research and reviews 15: 181-185
[57] Stratford MR, Rojas A, Hall DW, et al. (1992) Pharmacokinetics of nicotinamide and its effect on blood pressure, pulse and body temperature in normal human volunteers. Radiother Oncol 25: 37-42
[58] Dragovic J, Kim SH, Brown SL, Kim JH (1995) Nicotinamide pharmacokinetics in patients. Radiother Oncol 36: 225-228
[59] Petley A, Macklin B, Renwick AG, Wilkin TJ (1995) The pharmacokinetics of nicotinamide in humans and rodents. Diabetes 44: 152-155
[60] Winter SL, Boyer JL (1973) Hepatic toxicity from large doses of vitamin B3 (nicotinamide). N Engl J Med 289: 1180-1182
[61] Birjmohun RS, Hutten BA, Kastelein JJ, Stroes ES (2005) Efficacy and safety of high-density lipoprotein cholesterol-increasing compounds: a meta-analysis of randomized controlled trials. J Am Coll Cardiol 45: 185-197
[62] Poynten AM, Gan SK, Kriketos AD, et al. (2003) Nicotinic acid-induced insulin resistance is related to increased circulating fatty acids and fat oxidation but not muscle lipid content. Metabolism 52: 699-704
[63] Capuzzi DM, Guyton JR, Morgan JM, et al. (1998) Efficacy and safety of an extended-release niacin (Niaspan): a long-term study. Am J Cardiol 82: 74U-81U
[64] Ranchoff RE, Tomecki KJ (1986) Niacin or niacinamide? Nicotinic acid or nicotinamide? What is the difference? J Am Acad Dermatol 15: 116-117
[65] Benyo Z, Gille A, Bennett CL, Clausen BE, Offermanns S (2006) Nicotinic acid-induced flushing is mediated by activation of epidermal langerhans cells. Mol Pharmacol 70: 1844-1849
[66] Santomauro AT, Boden G, Silva ME, et al. (1999) Overnight lowering of free fatty acids with Acipimox improves insulin resistance and glucose tolerance in obese diabetic and nondiabetic subjects. Diabetes 48: 1836-1841
[67] Cusi K, Kashyap S, Gastaldelli A, Bajaj M, Cersosimo E (2007) Effects on insulin secretion and insulin action of a 48-h reduction of plasma free fatty acids with Acipimox in nondiabetic subjects genetically predisposed to type 2 diabetes. American journal of physiology Endocrinology and metabolism 292: E1775-1781
Niels_Proefschrift.indd 46Niels_Proefschrift.indd 46 08/12/2020 18:04:4308/12/2020 18:04:43
47
NAD+ Metabolism as a Target for Metabolic Health
[68] Castro-Marrero J, Cordero MD, Segundo MJ, et al. (2015) Does oral coenzyme Q10 plus NADH supplementation improve fatigue and biochemical parameters in chronic fatigue syndrome? Antioxidants & redox signaling 22: 679-685
[69] Castro-Marrero J, Saez-Francas N, Segundo MJ, et al. (2016) Effect of coenzyme Q10 plus nicotinamide adenine dinucleotide supplementation on maximum heart rate after exercise testing in chronic fatigue syndrome - a randomized, controlled, double-blind trial. Clinical nutrition 35: 826-834
[70] Bogan KL, Brenner C (2008) Nicotinic acid, nicotinamide, and nicotinamide riboside: a molecular evaluation of NAD+ precursor vitamins in human nutrition. Annu Rev Nutr 28: 115-130
[71] Martens CR, Denman BA, Mazzo MR, et al. (2018) Chronic nicotinamide riboside supplementation is well-tolerated and elevates NAD+ in healthy middle-aged and older adults. Nat Commun 9: 1286
[72] Trammell SA, Schmidt MS, Weidemann BJ, et al. (2016) Nicotinamide riboside is uniquely and orally bioavailable in mice and humans. Nat Commun 7: 12948
[73] Airhart SE, Shireman LM, Risler LJ, et al. (2017) An open-label, non-randomized study of the pharmacokinetics of the nutritional supplement nicotinamide riboside (NR) and its effects on blood NAD+ levels in healthy volunteers. PLoS One 12: e0186459
[74] Dellinger RW, Santos SR, Morris M, et al. (2017) Repeat dose NRPT (nicotinamide riboside and pterostilbene) increases NAD+ levels in humans safely and sustainably: a randomized, double-blind, placebo-controlled study. NPJ Aging Mech Dis 3: 17
[75] Dollerup OL, Christensen B, Svart M, et al. (2018) A randomized placebo-controlled clinical trial of nicotinamide riboside in obese men: safety, insulin-sensitivity, and lipid-mobilizing effects. Am J Clin Nutr 108: 343-353
[76] Zhou CC, Yang X, Hua X, et al. (2016) Hepatic NAD+ deficiency as a therapeutic target for non-alcoholic fatty liver disease in ageing. Br J Pharmacol 173: 2352-2368
[77] Gariani K, Menzies KJ, Ryu D, et al. (2016) Eliciting the mitochondrial unfolded protein response by nicotinamide adenine dinucleotide repletion reverses fatty liver disease in mice. Hepatology 63: 1190-1204
[78] Fukuwatari T, Shibata K (2013) Nutritional aspect of tryptophan metabolism. Int J Tryptophan Res 6: 3-8
[79] Fernstrom JD (2012) Effects and side effects associated with the non-nutritional use of tryptophan by humans. J Nutr 142: 2236S-2244S
[80] Chen T, Zheng X, Ma X, et al. (2016) Tryptophan predicts the risk for future type 2 diabetes. PLoS One 11: e0162192
[81] Fong PC, Boss DS, Yap TA, et al. (2009) Inhibition of poly(ADP-ribose) polymerase in tumors from BRCA mutation carriers. N Engl J Med 361: 123-134
[82] McKeage K (2016) Daratumumab: first global approval. Drugs 76: 275-28
2
Niels_Proefschrift.indd 47Niels_Proefschrift.indd 47 08/12/2020 18:04:4308/12/2020 18:04:43

Niels_Proefschrift.indd 48Niels_Proefschrift.indd 48 08/12/2020 18:04:4308/12/2020 18:04:43

3NAD+-precursor supplementation with L-tryptophan, nicotinic acid, and nicotinamide does not improve mitochondrial function and skeletal muscle function in physically compromised older adults
N.J. Connell1, L. Grevendonk1, C.E. Fealy1, E. Kornips-Moonen1, Y.M.H. Bruls2, V.B. Schrauwen-Hinderling1,2, J. de Vogel4, R. Hageman4, J. Geurts5, R. Zapata-Perez6, R.H. Houtkooper6, B. Havekes1,3, J. Hoeks1, P. Schrauwen1.
1 Department of Nutrition and Movement Sciences, NUTRIM School for Nutrition and Translational
Research in Metabolism, Maastricht University, 6200 MD Maastricht, the Netherlands2 Department of Radiology and Nuclear Medicine, NUTRIM School for Nutrition and Translational
Research in Metabolism, Maastricht University Medical Center+, 5800 AZ Maastricht, the
Netherlands3 Department of Internal Medicine, Division of Endocrinology, NUTRIM School for Nutrition and
Translational Research in Metabolism, Maastricht University Medical Center+, 5800 AZ Maastricht,
the Netherlands4 Danone Nutricia Research, P.O. Box 80141, 3508 TC Utrecht, the Netherlands.5 Friesland Campina, 3818 LE Amersfoort, The Netherlands6 Laboratory Genetic Metabolic Diseases, Amsterdam UMC, University of Amsterdam, Amsterdam
Gastroenterology, Endocrinology and Metabolism, Amsterdam Cardiovascular Sciences,
Meibergdreef 9, 1105 AZ Amsterdam, The Netherlands.
Submitted
Niels_Proefschrift.indd 49Niels_Proefschrift.indd 49 08/12/2020 18:04:5108/12/2020 18:04:51

50
Chapter 3
Abbreviations1H-MRS 1H-Magnetic resonance spectroscopyADP Adenosine diphosphateADPr Adenosine diphosphate ribosideAMPK 5’ adenosine monophosphate-activated protein kinaseATP Adenosine triphosphateBMI Body mass indexBMR Basal metabolic rateCytC Cytochrome CDBP Diastolic blood pressureETC Electron transport chainFCCP Carbonylcyanide-4-(trifluoromethoxy)-phenylhydrazoneFFA Free fatty acidsGEE Gross exercise efficiencyMAP Mean arterial pressureNA Nicotinic acidNAAD Nicotinic acid adenine dinucleotideNAD(H) Nicotinamide dinucleotideNADP(H) Nicotinamide dinucleotide phosphateNAM NicotinamideNE Niacin equivalentNEE Net exercise efficiencyNR Nicotinamide ribosidePCr PhosphocreatineQA Quinolinic acidSBP Systolic blood pressureSPPB Short physical performance batteryTG TriglyceridesTrp L-TryptophanRER Respiratory exchange ratioUCP1 Uncoupling protein 1
Niels_Proefschrift.indd 50Niels_Proefschrift.indd 50 08/12/2020 18:04:5208/12/2020 18:04:52
51
NAD+-Precursor Supplementation in Older Adults
Abstract
Nicotinamide dinucleotide (NAD+) supplementation has been proposed as a potential modality capable of promoting healthy ageing and negating age-dependent decline of skeletal muscle mass and function. To investigate the efficacy of NAD+-precursor supplementation with L-tryptophan, nicotinic acid, and nicotinamide on skeletal muscle mitochondrial function, we conducted a randomized, double-blind, controlled trial in fourteen community-dwelling, older adults with impaired physical function. We supplemented with 207.5 mg of niacin equivalents for 32 days, therein resembling an increased dietary intake. Following supplementation, skeletal muscle NAD+ concentrations were not significantly different compared to the control condition (p = 0.123), whereas skeletal muscle methyl-nicotinamide (MeNAM) levels were significantly higher under NAD+-precursor supplementation (p = 0.001), suggesting increased NAD+ metabolism. Conversely, ex vivo mitochondrial respiration capacity did not improve under NAD+-precursor supplementation (State 3: p = 0.716, State U: p = 0.495), neither did net exercise efficiency (p = 0.636) during the submaximal cycling test. Overall, our findings are consistent with previous findings on NAD+ efficacy in humans and we show in community-dwelling, older adults with impaired physical function that NAD+-precursor supplementation through L-tryptophan, nicotinic acid, and nicotinamide does not improve mitochondrial or skeletal muscle function.
3
Niels_Proefschrift.indd 51Niels_Proefschrift.indd 51 08/12/2020 18:04:5208/12/2020 18:04:52
52
Chapter 3
Introduction
Ageing has been defined as the time-dependent decline of function (1), with one of the most striking features of the ageing process being the progressive loss of skeletal muscle mass (sarcopenia), and in turn, the decline of skeletal muscle physical function (2). The loss of skeletal muscle mass and function leads to mobility impairments, increased risk of falls, physical frailty, and metabolic impairments (3). Hence, a compromised physical function increases the risk of dependency in activities of daily living and care need. With society confronted with an ever-ageing population, a large effort of research has focussed on identifying strategies to promote healthy ageing.
Interestingly, the loss of skeletal muscle function is paralleled by an age-dependent decline in mitochondrial function (1), an established hallmark of ageing that is considered to be a driving force behind skeletal muscle ageing (4-6). Therefore, promoting mitochondrial metabolism may be a promising strategy to negate the metabolic and functional disturbances seen in skeletal muscle during ageing (7).
One pathway that has received much attention in this context is the nicotinamide adenine dinucleotide (NAD+) - sirtuin (SIRT)-axis (8-11). The SIRT enzyme family is comprised by NAD+-dependent deacetylases involved in the regulation of mitochondrial metabolism (12) and act as sensors to the bioavailability of NAD+ (13). The co-enzyme NAD+ and its reduced form NADH are critical to the cellular redox potential and are the predominant electron donor in the electron transport chain (ETC). NAD+, however, is the rate-limiting substrate in SIRT activity, and NAD+ bioavailability has been shown to decline with increasing age in mice (4, 10) and humans (14, 15). The human body derives NAD+ from various dietary sources, as it can be synthesised de novo from the essential amino-acid L-tryptophan (Trp), or from vitamin B3 compounds such as nicotinic acid (NA) through the Preiss-Handler pathway or salvaged from nicotinamide (NAM) and nicotinamide riboside (NR) (16). From a dietary perspective, NR is a trace element, whereas Trp, NA, and NAM are more abundantly available in our diets (17).
Preclinical work in murine models of ageing has demonstrated the efficacy of supplementing with NAD+-precursors, such as NR and nicotinamide
Niels_Proefschrift.indd 52Niels_Proefschrift.indd 52 08/12/2020 18:04:5208/12/2020 18:04:52

53
NAD+-Precursor Supplementation in Older Adults
mononucleotide (NMN), to negate the effects of ageing induced by declining NAD+ levels (4, 18), promote longevity (18), and improve energy metabolism, body weight, and mitochondrial oxidative metabolism (11). Following suit, several human intervention studies have focussed on the use of the NAD+-precursor NR to improve cardiovascular health in middle-aged to older adults (19), to combat metabolic dysfunction in middle-aged obese individuals (20, 21), and to improve skeletal muscle metabolism in older adults (22). Although these studies provide some evidence on the efficacy of supplementation with NAD+-precursors in older adults to increase NAD+ levels in blood and skeletal muscle through NR supplementation, evidence stemming from studies involving older adults with a compromised physical function and focussing on skeletal muscle function are still lacking.
Furthermore, other than through supplementation with high doses of NR or NA, there is only limited evidence discerning NAD+-precursor supplementation at lower doses. Dietary supplements bearing more resemblance of increased dietary intake may also has the potency to increase NAD+ bioavailability in humans (23, 24). Moreover, increasing NAD+ synthesis from Trp by inhibiting the ACMSD enzyme also leads to activation of SIRT1 and its downstream health benefits (25). Here, we aim to elucidate the efficacy of NAD+-precursor supplementation though a novel combination of Trp, NA, and NAM on skeletal muscle mitochondrial function in community-dwelling, older adults with impaired physical function.
Methods and Materials
Participants
Fourteen physically compromised, older adults (65 years and older, BMI 20 – 30 km/m2) were recruited from the general population in the vicinity of Maastricht through advertisements. The study was conducted in accordance with the principles of the declaration of Helsinki and approved by the Ethics Committee of the Maastricht University Medical Center+. All participants provided written informed consent and the study was registered at clinicaltrials.gov (NCT03310034).
All participants (4 females, 10 males) were Caucasian, non-smokers, and generally healthy as predetermined by a medical questionnaire and physical examination by a physician, with only 7 participants using prescription medication, with amongst others: anti-hypertensives, statins, and proton pump inhibitors
3
Niels_Proefschrift.indd 53Niels_Proefschrift.indd 53 08/12/2020 18:04:5208/12/2020 18:04:52
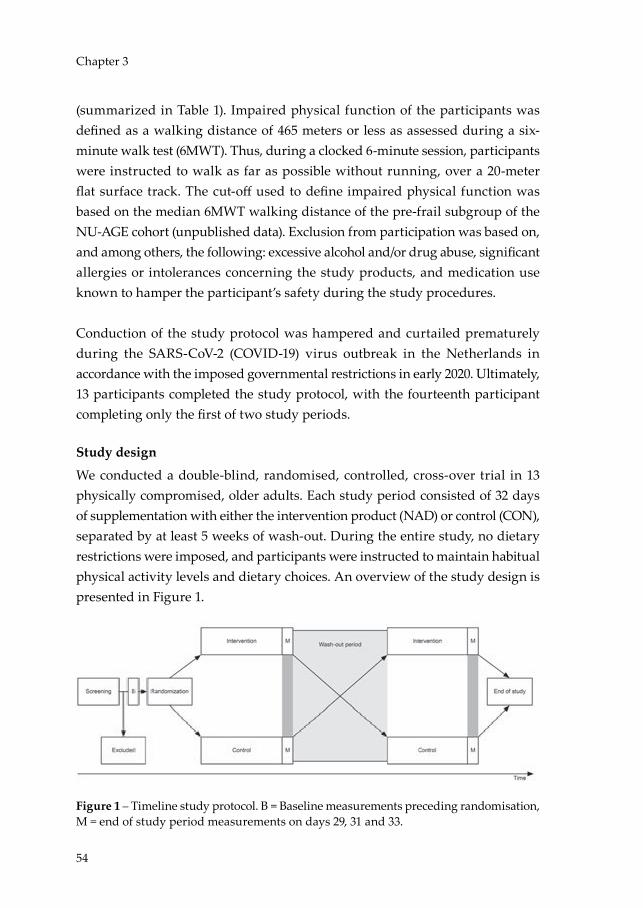
54
Chapter 3
(summarized in Table 1). Impaired physical function of the participants was defined as a walking distance of 465 meters or less as assessed during a six-minute walk test (6MWT). Thus, during a clocked 6-minute session, participants were instructed to walk as far as possible without running, over a 20-meter flat surface track. The cut-off used to define impaired physical function was based on the median 6MWT walking distance of the pre-frail subgroup of the NU-AGE cohort (unpublished data). Exclusion from participation was based on, and among others, the following: excessive alcohol and/or drug abuse, significant allergies or intolerances concerning the study products, and medication use known to hamper the participant’s safety during the study procedures.
Conduction of the study protocol was hampered and curtailed prematurely during the SARS-CoV-2 (COVID-19) virus outbreak in the Netherlands in accordance with the imposed governmental restrictions in early 2020. Ultimately, 13 participants completed the study protocol, with the fourteenth participant completing only the first of two study periods.
Study design
We conducted a double-blind, randomised, controlled, cross-over trial in 13 physically compromised, older adults. Each study period consisted of 32 days of supplementation with either the intervention product (NAD) or control (CON), separated by at least 5 weeks of wash-out. During the entire study, no dietary restrictions were imposed, and participants were instructed to maintain habitual physical activity levels and dietary choices. An overview of the study design is presented in Figure 1.
Figure 1 – Timeline study protocol. B = Baseline measurements preceding randomisation, M = end of study period measurements on days 29, 31 and 33.
Niels_Proefschrift.indd 54Niels_Proefschrift.indd 54 08/12/2020 18:04:5308/12/2020 18:04:53

55
NAD+-Precursor Supplementation in Older Adults
Supplementation protocol
The intervention product (NAD) was composed of a whey protein-powder as a source of tryptophan, to which NA and NAM were added. In total, the equivalent of 207.5 mg niacin equivalents (NE) of NAD+-precursors were supplemented through Trp (210 mg at a 60:1 conversion rate (26, 27)), NA (4 mg), and NAM (200 mg). The control product (CON) was composed of an amino acid powder mixture resembling whey protein, but lacking Trp, NA, and NAM. Participants received the dietary supplements in a single daily serving, to be ingested during breakfast after dissolving the powder in 200 mL of orange juice. Production and packaging of the supplements were done by Danone Research and approved by the Toxicology and Safety department of Danone Research.
Measurements
Baseline testingAt baseline, participants underwent a maximal cycling test determining maximal aerobic capacity (VO2max) and maximal power output (Wmax) on an electronically braked cycle ergometer (Lode Excalibur, Groningen, The Netherlands). O2 consumption and CO2 production were measured using indirect calorimetry (Omnical, IDEE, Maastricht, the Netherlands) and the respiratory exchange ratio (RER) was monitored as a verification of the participant’s maximal effort. Briefly, after a warming-up lasting five minutes at 50 Watt, the workload was increased with 50 Watt every 2.5 minutes. When the heart rate of participants reached 80% of their predicted maximal heart rate (= 220 minus age), the workload was increased with steps of 25 Watt until exhaustion, or until the participant was no longer able to pedal above 60 rotations per minute.
Day 1 – Start of supplementationFollowing the baseline cycling test, subjects were randomly allocated to the intervention or control arm and supplementation was initiated. Subjects then reported to our facility on Day 1 and 15 to measure blood pressure and to fill out the RAND-36 Health Survey 1.0 questionnaire (28, 29).
Blood pressure was measured in sitting position on the non-dominant arm with an oscillometric cuff (Omron M6 Comfort, OMRON Healthcare Europe B.V., Hoofddorp, the Netherlands) in triplicate from which mean arterial pressure (MAP) was estimated from the systolic blood pressure (SBP) and diastolic blood
3
Niels_Proefschrift.indd 55Niels_Proefschrift.indd 55 08/12/2020 18:04:5308/12/2020 18:04:53

56
Chapter 3
pressure (DBP) mean values of the measurement and calculated as MAP = [(2/3 x DBP) + (1/3 x SBP)].
Day 29 – Hepatic lipid contentOn day 29, participants reported to our facility in the fasted state at 7 AM to undergo proton magnetic resonance spectroscopy (1H-MRS) for the quantification of hepatic lipid content (intrahepatic lipid, IHL) with a 3T whole-body MR system (Achieva 3Tx; Philips Healthcare, Best, the Netherlands). Liver spectra were obtained with the participant in headfirst in the supine position. During the scan, in the right lobe of the liver, a voxel of 18 cm3 was positioned wherein the 1H-MRS spectra were acquired (repetition time (RT) of 4000 ms, echo time of 32.5 ms, and 2048 sample points). To prevent motion artefacts, subjects were asked to breathe in the rhythm of the spectroscopic measurement. Subsequently, the water signal dominating the proton spectra was suppressed using frequency-selective pre-pulses and the spectra was fitted to quantify the lipid peak. The lipid / water ratio was used as a parameter of intrahepatic lipid content, as previously reported (30).
Next, a venous blood sample was acquired, the RAND-36 Health Survey 1.0 questionnaire was repeated and the short physical performance battery (SPPB) (31) was performed to assess physical function of the lower extremities.
Day 31 – Muscle volumeThe participants underwent another MRI session at 5 PM on Day 31 to determine the muscle volume of the upper leg. Henceforth, the participant was positioned in the 3T MRI scanner (Achieva 3Tx; Philips Heathcare, Best, the Netherlands) in the supine position, feet first. T2 weighted MRI measurements were acquired covering the from the patella to the art. coxae, allowing muscle volume to be determined using 3D segmentation.
Day 33 – Submaximal cycling test and skeletal muscle biopsyOn the last day of the study period (Day 33), participants reported to the research facility in the fasted state (from 10 PM the evening before). Body composition was measured by means of air displacement plethysmography (BodPod®, COSMED, Rome, Italy). Subsequently, indirect calorimetry through a ventilated hood
Niels_Proefschrift.indd 56Niels_Proefschrift.indd 56 08/12/2020 18:04:5308/12/2020 18:04:53
57
NAD+-Precursor Supplementation in Older Adults
system was used to determine the basal metabolic rate (BMR) and respiratory exchange ratio (RER) over a period of 30 minutes.
Next, a skeletal muscle biopsy was obtained from the m. vastus lateralis according to the Bergstrom method (32) with a side-cutting needle under local anaesthesia using 1.0% lidocaine (10 mg/mL) without epinephrine, from which a portion was kept in a preservation medium and freshly used to prepare permeabilized muscle fibres according to Hoeks et al. (33). Subsequently, ex vivo high-resolution respirometry was performed using a two chamber Oxygraph (OROBOROS Instruments, Innsbruck, Austria) using a multiple substrate/inhibitor titration protocol to extensively characterize the mitochondrial capacity of skeletal muscle tissue, as previously reported (34). Measurements were performed in quadruplicate and the integrity of the outer mitochondrial membrane was assessed by the addition of cytochrome c (CytC) upon maximal coupled respiration (State 3) and deemed intact if the response to the CytC addition remained under 10%, hence 16 out of 100 individual measurements were excluded.
Following the muscle biopsy, participants were submitted to a submaximal exercise session of one hour on an electrically braked cycling ergometer (Lode Excalibur, Groningen, The Netherlands) at 50% of their Wmax achieved in the maximal cycling test at baseline. indirect calorimetry was measured during the second and fourth quarter of the one-hour session.
Calculations
From the indirect calorimetry data, energy expenditure and substrate oxidation rates were calculated using Weir’s formula under the assumption of negligible protein oxidation (35). In addition, gross exercise efficiency (GEE) was calculated as [Wext / Etot] and net exercise efficiency (NEE) as [Wext / (Etot - Erest)] (36) from the submaximal exercise indirect calorimetry data.
Biochemical analyses
Plasma metabolitesUsing EDTA plasma, glucose (Horiba, Montpellier, France), insulin (Crystal Chem, Elk Grove Village, Illinois, USA), FFA (Wako, Neuss, Germany), and TGs (Sigma, Saint Louis, Missouri, USA) were determined in samples collected on
3
Niels_Proefschrift.indd 57Niels_Proefschrift.indd 57 08/12/2020 18:04:5308/12/2020 18:04:53
58
Chapter 3
Day 1 and 29 by means enzymatic quantification with the ABX Pentra C400 (Horiba, Montpellier, France). All time points of one participant were measured in the same run with insulin and FFA levels measured in duplicates.
Acylcarnitine analysis2-4 mg of freeze-dried muscle tissue were placed in 2 mL Eppendorf vials and the exact mass of the sample determined using a microbalance. 1 mL 80% acetonitrile containing 50 µL of the internal standards d3-C0 (650 µM), d3-C3 (5 µM), d3-C6, d3-C8, d3-C10 and d3-C16 (2 µM) was then added and each sample was homogenized using a TissueLyser II (Qiagen) bead mill during 5 minutes at 30 pulses per second. After centrifugation at 16000g, the resulting supernatant was dried under a stream of nitrogen at 40 °C and derivatized by addition of 1-propanol/acetylchloride (4/1, v/v) during 15 minutes at 60 °C. After evaporation under nitrogen at 40 °C, samples were redissolved in pure acetonitrile. Quantitative determination of the propylated acylcarnitines in the medium was performed using tandem mass spectrometry in an Acquity UPLC System (Waters) coupled to a Quattro Premier XE Tandem Quadrupole Mass Spectrometer (Waters). The internal standards d3-C0, d3-C3, d3-C6, d3-C8, d3-C10 and d3-C16 carnitine were purchased from Dr. Herman J. ten Brink (Vrije Universiteit Medical Hospital, Amsterdam, The Netherlands).
Enzymatic cyclic assay for quantitative NAD determination1-5 mg of freeze-dried muscle tissue were homogenized in 250 µL of 2M HClO4 using a TissueLyser II (Qiagen) bead mill during 5 minutes at 30 pulses per second. After centrifugation at 16000g, 100 µL of the acidic supernatant were neutralized by addition of 150 µL 2M/0.6M KOH/MOPS and centrifuged again to remove precipitated salts. NAD+ content was determined using an enzymatic spectrophotometric cycling assay based on the coupled reaction of malate and alcohol dehydrogenases, as previously described (37). Enzymes used for NAD+ determination (alcohol dehydrogenase from yeast, malate dehydrogenase from pig heart, and glutamate oxaloacetic transaminase from pig liver) were purchased from Sigma.
Metabolomics procedure2-4 mg of freeze-dried muscle tissue were transferred to 2 mL tubes, and then 425 µL water and 500 µL methanol were added to each sample. A 75 µL mixture
Niels_Proefschrift.indd 58Niels_Proefschrift.indd 58 08/12/2020 18:04:5308/12/2020 18:04:53
59
NAD+-Precursor Supplementation in Older Adults
of the following internal standards in water was also added: adenosine-15N5-monophosphate (100 µM), adenosine-15N5-triphosphate (1 mM), D4-alanine (100 µM), D7-arginine (100 µM), D3-aspartic acid (100 µM), D4-citric acid (100 µM), 13C1-citrulline (100 µM), 13C6-fructose-1,6-diphosphate (100 µM), guanosine-15N5-monophosphate (100 µM), guanosine-15N5-triphosphate (1 mM), 13C6-glucose (1 mM), 13C6-glucose-6-phosphate(100 µM), D3-glutamic acid (100 µM), D5-glutamine (100 µM), 13C6-isoleucine (100 µM), D3-leucine (100 µM), D4-lysine (100 µM), D3-methionine (100 µM), D6-ornithine (100 µM), D5-phenylalanine (100 µM), D7-proline (100 µM), 13C3-pyruvate (100 µM), D3-serine (100 µM), D5-tryptophan (100 µM), D4-tyrosine (100 µM), D8-valine (100 µM), 13C5-nicotinamide adenine dinucleotide (100 µM). Samples were homogenized as described before, followed by addition of 1000 µL chloroform and thorough mixing. After centrifugation, the top layer containing the polar phase was transferred to 1.5 mL tubes and dried in a vacuum evaporator at 60 °C. Dried samples were reconstituted in 100 µL methanol/water (6/4, v/v).
Metabolite analysis was carried out in an Aquity UPLC system (Waters) coupled to an Impact IITM Ultra-High Resolution Qq-Time-Of-Flight mass spectrometer (Bruker). Chromatographic separation of the compounds was achieved using a SeQuant ZIC-cHILIC column (PEEK 100 x 2.1 mm, 3 µm particle size, Merck, Darmstadt, Germany) at 30 °C. The LC method consisted in a gradient running at 0.25 mL/min from 100% mobile phase B (9:1 acetonitrile:water with 5 mM ammonium acetate pH 6.8) to 100% mobile phase A (1:9 acetonitrile:water with 5 mM ammonium acetate pH 6.8) in 28 minutes, followed by are-equilibration step at 100% B of 5 minutes. MS data were acquired both in negative and positive ionization modes in full scan mode over the range of m/z 50-1200.
Statistical analyses
Statistical analysis was performed in SPSS 26 for Mac OS (IBM® SPSS® Statistics, USA) and graphs were made in Prism 8.4.2 for Windows (GraphPad Software, Inc., USA). Descriptive statistics were reported for all data parameters as mean ± standard deviation (SD), unless otherwise stated. Normality of the data distributions were evaluated with the Kolmogorov-Smirnov normality test. The paired Students t-test was used to compare the results of the intervention to the control, or the equivalent Wilcoxon signed rank test was used if normality was not met. In the event of missing values, the values were not replaced and
3
Niels_Proefschrift.indd 59Niels_Proefschrift.indd 59 08/12/2020 18:04:5408/12/2020 18:04:54
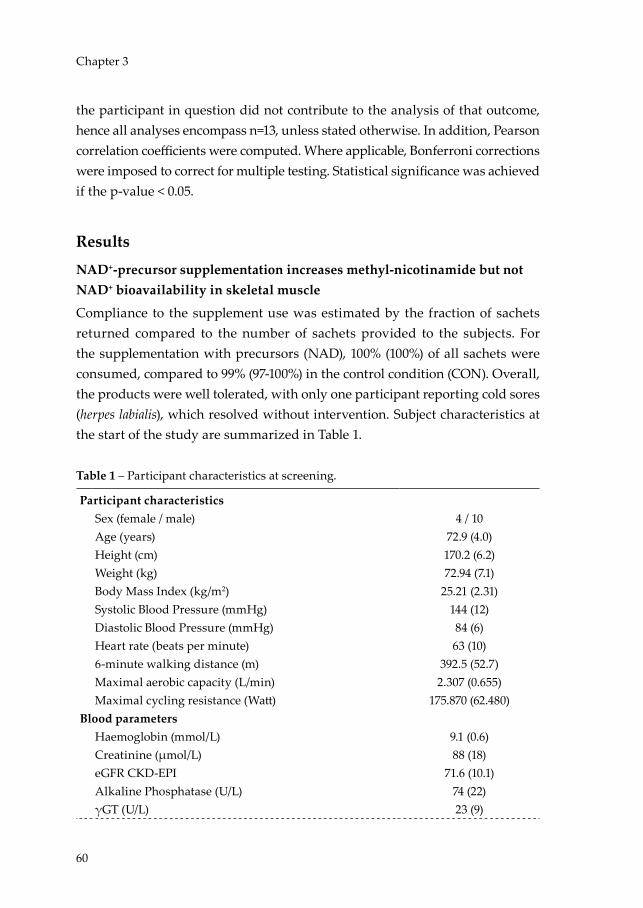
60
Chapter 3
the participant in question did not contribute to the analysis of that outcome, hence all analyses encompass n=13, unless stated otherwise. In addition, Pearson correlation coefficients were computed. Where applicable, Bonferroni corrections were imposed to correct for multiple testing. Statistical significance was achieved if the p-value < 0.05.
Results
NAD+-precursor supplementation increases methyl-nicotinamide but not NAD+ bioavailability in skeletal muscle
Compliance to the supplement use was estimated by the fraction of sachets returned compared to the number of sachets provided to the subjects. For the supplementation with precursors (NAD), 100% (100%) of all sachets were consumed, compared to 99% (97-100%) in the control condition (CON). Overall, the products were well tolerated, with only one participant reporting cold sores (herpes labialis), which resolved without intervention. Subject characteristics at the start of the study are summarized in Table 1.
Table 1 – Participant characteristics at screening.
Participant characteristicsSex (female / male) 4 / 10Age (years) 72.9 (4.0)Height (cm) 170.2 (6.2)Weight (kg) 72.94 (7.1)Body Mass Index (kg/m2) 25.21 (2.31)Systolic Blood Pressure (mmHg) 144 (12)Diastolic Blood Pressure (mmHg) 84 (6)Heart rate (beats per minute) 63 (10)6-minute walking distance (m) 392.5 (52.7)Maximal aerobic capacity (L/min) 2.307 (0.655)Maximal cycling resistance (Watt) 175.870 (62.480)
Blood parametersHaemoglobin (mmol/L) 9.1 (0.6)Creatinine (µmol/L) 88 (18)eGFR CKD-EPI 71.6 (10.1)Alkaline Phosphatase (U/L) 74 (22)γGT (U/L) 23 (9)
Niels_Proefschrift.indd 60Niels_Proefschrift.indd 60 08/12/2020 18:04:5408/12/2020 18:04:54

61
NAD+-Precursor Supplementation in Older Adults
Table 1 – Participant characteristics at screening. (Continued)
AST (U/L) 23 (5)ALT (U/L) 21 (5)Bilirubin (µmol/L) 11.5 (5.0)Cholesterol (mmol/L) 5.1 (0.7)HDL-Cholesterol (mmol/L) 1.7 (0.5)LDL-Cholesterol (mmol/L) 2.9 (0.6)Triglycerides (mmol/L) 1.03 (0.32)Free Fatty Acids (mmol/L) 0.47 (0.11)Hb1Ac (%) 5.4 (0.3)Glucose (mmol/L) 5.1 (0.6)
Baecke Physical Activity Index 7.260 (1.341)Work Index 1.617 (0.981)Sport Index 2.250 (0.490)Leisure Index 3.393 (0.413)
Medication used (n)Statin 1Proton pump inhibitor 1Thrombocyte aggregation inhibitor 1Calcium / Vitamin D 2Thyromimetic 1Anti-hypertensive drugs 3Alfa blocker 1NSAID 1Benzodiazepine 1
Data is presented as mean (SD) for n = 14. Abbreviations: ALT = alanine transaminase, AST = aspartate transaminase, eGRF CKD-EPI = estimated glomerular filtration rate chronic kidney disease epidemiology collaboration, Hb1Ac = haemoglobin 1Ac, HDL = high-density lipoprotein, LDL = low-density lipoprotein, NSAID = non-steroidal anti-inflammatory drug, γGT = gamma-glutamyltransferase.
In order to determine the efficacy of the NAD+-precursor supplementation, the concentration of NAD+ as well as several metabolites of the NAD+ synthesis pathways were measured in skeletal muscle tissue, obtained from the m. vastus lateralis. These analyses showed that NAD+ levels were similar between NAD (1.115 nmol/mg dry weight [95%CI 1.009, 1.221]) and CON (1.022 nmol/mg dry weight [95%CI 0.861, 1.184], p = 0.123, Figure 2).
3
Niels_Proefschrift.indd 61Niels_Proefschrift.indd 61 08/12/2020 18:04:5408/12/2020 18:04:54

62
Chapter 3
From the de novo biosynthesis pathway, Trp, kynurenine, and quinolinic acid (QA) did not differ between NAD and CON (p > 0.05, n = 11, Figure 2). Synthesis of NAD+ from nicotinic acid (NA) through the Preiss-Handler pathway leads to synthesis of nicotinic acid adenine dinucleotide (NAAD), which was not different between NAD and CON (p = 0.262, n = 11, Figure 2). NAD+ can also be salvaged from NMN, NAM, and NR, but also in these precursors no differences between NAD and CON were observed (p > 0.05, n = 11, Figure 2). Consumption of NAD yields NAM and ADPr, with no differences observed in ADPr levels between NAD and CON (p = 0.413, n = 11, Figure 2). Conversely, the concentration of the primary breakdown product of NAM, methyl-NAM (MeNAM), which is also commonly described as a marker for increased NAD turnover (22), was measured and revealed significantly higher MeNAM concentrations in NAD compared to CON (p = 0.001, Figure 2). Alternatively, NAD+ can be phosphorylated into nicotinamide dinucleotide phosphate (NADP+), in which we did not observe a difference between conditions (p = 0.833, n = 11, Figure 2). The respective reduced forms, NADH and NADPH, also did not differ between conditions (p = 0.389, p = 0.365 respectively, n = 11, Figure 2).
Niels_Proefschrift.indd 62Niels_Proefschrift.indd 62 08/12/2020 18:04:5408/12/2020 18:04:54
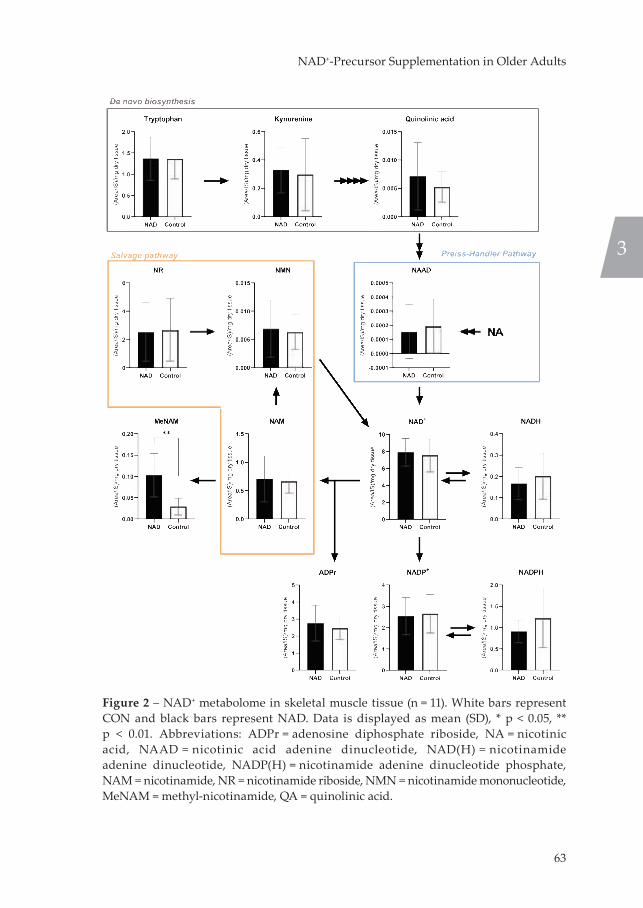
63
NAD+-Precursor Supplementation in Older Adults
Figure 2 – NAD+ metabolome in skeletal muscle tissue (n = 11). White bars represent CON and black bars represent NAD. Data is displayed as mean (SD), * p < 0.05, ** p < 0.01. Abbreviations: ADPr = adenosine diphosphate riboside, NA = nicotinic acid, NAAD = nicotinic acid adenine dinucleotide, NAD(H) = nicotinamide adenine dinucleotide, NADP(H) = nicotinamide adenine dinucleotide phosphate, NAM = nicotinamide, NR = nicotinamide riboside, NMN = nicotinamide mononucleotide, MeNAM = methyl-nicotinamide, QA = quinolinic acid.
3
Niels_Proefschrift.indd 63Niels_Proefschrift.indd 63 08/12/2020 18:05:0208/12/2020 18:05:02
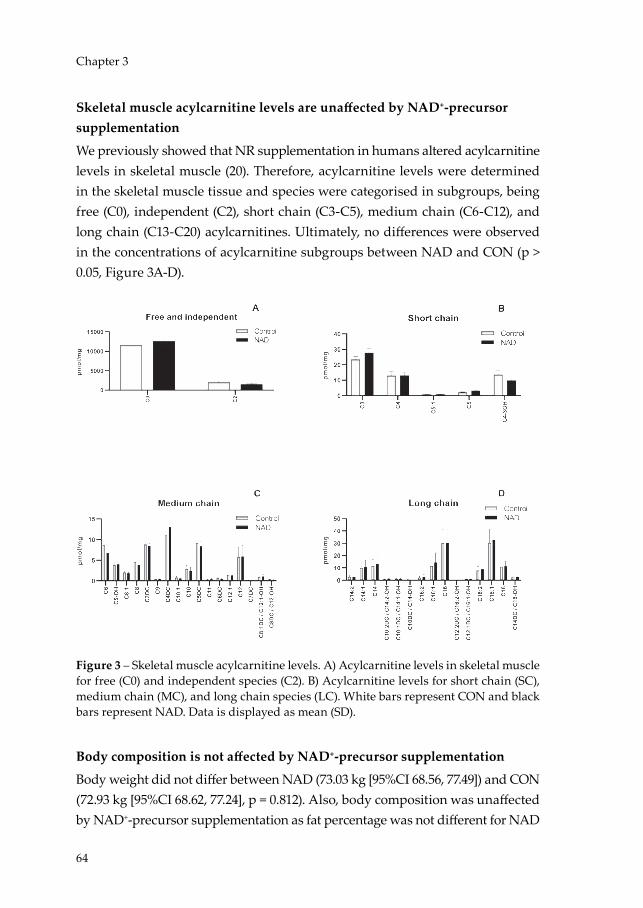
64
Chapter 3
Skeletal muscle acylcarnitine levels are unaffected by NAD+-precursor supplementation
We previously showed that NR supplementation in humans altered acylcarnitine levels in skeletal muscle (20). Therefore, acylcarnitine levels were determined in the skeletal muscle tissue and species were categorised in subgroups, being free (C0), independent (C2), short chain (C3-C5), medium chain (C6-C12), and long chain (C13-C20) acylcarnitines. Ultimately, no differences were observed in the concentrations of acylcarnitine subgroups between NAD and CON (p > 0.05, Figure 3A-D).
Figure 3 – Skeletal muscle acylcarnitine levels. A) Acylcarnitine levels in skeletal muscle for free (C0) and independent species (C2). B) Acylcarnitine levels for short chain (SC), medium chain (MC), and long chain species (LC). White bars represent CON and black bars represent NAD. Data is displayed as mean (SD).
Body composition is not affected by NAD+-precursor supplementation
Body weight did not differ between NAD (73.03 kg [95%CI 68.56, 77.49]) and CON (72.93 kg [95%CI 68.62, 77.24], p = 0.812). Also, body composition was unaffected by NAD+-precursor supplementation as fat percentage was not different for NAD
Niels_Proefschrift.indd 64Niels_Proefschrift.indd 64 08/12/2020 18:05:0508/12/2020 18:05:05

65
NAD+-Precursor Supplementation in Older Adults
and CON (34.26% [95%CI 29.31, 39.22] and 33.25% [95%CI 27.60, 38.91] respectively, p = 0.121).
NAD+-precursor supplementation does not improve overall ex vivo mitochondrial respiration capacity
To determine skeletal muscle mitochondrial capacity, we performed ex vivo high-resolution respirometry on permeabilized muscle fibres obtained from skeletal muscle biopsies. In the presence of substrates alone (State 2, Figure 4A), oxygen flux was similar in NAD and CON, although a slight but significant difference was observed upon malate + glutamate (MG, p = 0.010) between NAD and CON. Also, the assessment of ADP-stimulated (State 3) respiration fuelled by complex I-linked substrates (MO: Figure 4B, p = 0.882) did not reveal any differences between NAD and CON. If anything, state 3 respiration upon malate + glutamate tended to be lower in NAD vs. CON (MG: p = 0.054, Figure 4C). State 3 respiration upon parallel electron input into complex I and II showed no differences between NAD and CON with the substrate combinations malate + octanoyl-carnitine + glutamate (MOG, p = 0.753), malate + octanoyl-carnitine + glutamate + succinate (MOGS, p = 0.716), or malate + glutamate + succinate (MGS, p = 0.388, Figure 4D). Maximal uncoupled respiration (State 3U), a reflection of the maximal capacity of the electron transport chain, did not differ between NAD and CON (p = 0.495, Figure 4E). Lastly, mitochondrial proton leak (State 4o) was assessed through the addition of oligomycin and did not differ between NAD and CON (p = 0.888, Figure 4F). CytC responses were on average 1.32% for NAD and 0.73% for CON and did not differ between conditions (p = 0.368).
3
Niels_Proefschrift.indd 65Niels_Proefschrift.indd 65 08/12/2020 18:05:0508/12/2020 18:05:05

66
Chapter 3
Figure 4 – States of mitochondrial respiration. A) State 2 respiration. B) State 3 respiration under ADP-stimulation with lipid substrates. C) State 3 respiration with substrates focussing on Complex I. E) State 3 respiration with parallel substrates focus on Complex I and II. F) Uncoupled respiration under FCCP addition. G) State 4o respiration uncoupled from ATP-synthase. Black bars represent NAD; white bars represent CON. Values are represented as mean (SD), n = 13. Abbreviations: FCCP = carbonylcyanide-4-(trifluoromethoxy)-phenylhydrazone, G = glutamate, M = malate, O = octanoyl-carnitine, S = succinate, * p < 0.05.
NAD+-precursor supplementation does not affect plasma substrate concentrations
Plasma samples obtained on Day 29 of each research period were analysed for the concentrations of glucose, insulin, FFA, and TG. Glucose concentrations did not differ for NAD (5.866 mmol/L [95%CI 5.568, 6.164] and CON (5.763 mmol/L [95%CI 5.519, 6.008], p = 0.223). Correspondingly, insulin levels were not different between NAD (9.414 mU/L [95%CI 4.178, 14.650]) and CON (9.117 mU/L [95%CI 5.397, 12.835], p = 0.807). Concentrations of FFA showed no differences between NAD (496.289 μmol/L [95%CI 397.317, 595.261]) and CON (512.443 μmol/L [95%CI 416.057, 608.828], p = 0.812). Lastly, plasma TG levels were not different between NAD (0.830 mmol/L [IQR 0.675, 1.030]) and CON (0.990 mmol/L [IQR 0.610, 1.430], p = 0.266).
Niels_Proefschrift.indd 66Niels_Proefschrift.indd 66 08/12/2020 18:05:0908/12/2020 18:05:09

67
NAD+-Precursor Supplementation in Older Adults
Basal metabolic rate and exercise efficiency are not altered by NAD+-precursor supplementation
Basal metabolic rate and fasting RER were similar in NAD and CON (p = 0.824 and p = 0.297 respectively, Figure 5A and B). As a result, neither carbohydrate nor lipid oxidation in the fasted state were different between NAD and CON (p = 0.588, Figure 5C and p = 0.787, Figure 5D, respectively).
Besides assessment in resting conditions, substrate utilization was also determined during a submaximal cycling test. All participants completed the first 30 minutes of the cycling test, however, 6 out of 14 participants could not proceed with the cycling test at the set resistance and either decided to cease testing (n = 2), or required the resistance to be reduced (n = 4) in order to complete the remaining 30 minutes of the test. Therefore, we only report parameters measured in the first half hour of the cycling test.
3
Niels_Proefschrift.indd 67Niels_Proefschrift.indd 67 08/12/2020 18:05:0908/12/2020 18:05:09

68
Chapter 3
Figure 5 – Basal metabolic rate (A) and respiratory exchange ratio (B), with corresponding carbohydrate oxidation rate (C) and lipid oxidation rate (D). Submaximal exercise energy expenditure (E) with corresponding respiratory exchange ratio (F) with corresponding carbohydrate (G) and lipid (H) oxidation rates. Gross (I) and net (J) exercise efficiency from submaximal cycling test. White bars represent CON and black bars represent NAD. Data is represented as mean (SD), n = 13.
Besides substrate utilization, also gross (GEE) and net (NEE) exercise efficiency were also evaluated during the submaximal cycling test. Total energy expenditure during cycling did not differ between NAD (30.0 kJ/min [95%CI 25.7, 34.3]) and CON (28.5 kJ/min [95%CI 24.8, 32.2], p = 0.103, Figure 6E), nor did cycling RER, carbohydrate oxidation, or lipid oxidation rates differ between NAD and CON (p = 0.366, p = 0.186, p = 0.466 respectively, Figure 6F-H). GEE was 17.3 % [95%CI 15.6, 18.9] for NAD and 17.6 % [95%CI 15.8, 19.4] for CON and did not differ between conditions (p = 0.419, Figure 6I). NEE (i.e. GEE corrected for the BMR,) was 20.1 % [IQR 17.8, 22.3] for NAD and 20.6 % [IQR 18.7, 22.2] for CON and was also not different between conditions (p = 0.636, Figure 6J).
Niels_Proefschrift.indd 68Niels_Proefschrift.indd 68 08/12/2020 18:05:1208/12/2020 18:05:12
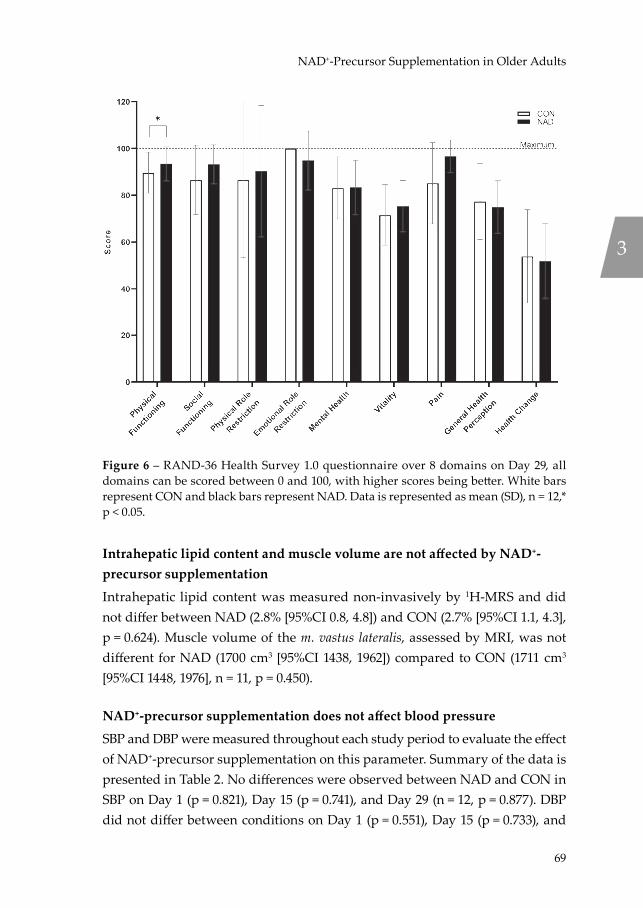
69
NAD+-Precursor Supplementation in Older Adults
Figure 6 – RAND-36 Health Survey 1.0 questionnaire over 8 domains on Day 29, all domains can be scored between 0 and 100, with higher scores being better. White bars represent CON and black bars represent NAD. Data is represented as mean (SD), n = 12,* p < 0.05.
Intrahepatic lipid content and muscle volume are not affected by NAD+-precursor supplementation
Intrahepatic lipid content was measured non-invasively by 1H-MRS and did not differ between NAD (2.8% [95%CI 0.8, 4.8]) and CON (2.7% [95%CI 1.1, 4.3], p = 0.624). Muscle volume of the m. vastus lateralis, assessed by MRI, was not different for NAD (1700 cm3 [95%CI 1438, 1962]) compared to CON (1711 cm3 [95%CI 1448, 1976], n = 11, p = 0.450).
NAD+-precursor supplementation does not affect blood pressure
SBP and DBP were measured throughout each study period to evaluate the effect of NAD+-precursor supplementation on this parameter. Summary of the data is presented in Table 2. No differences were observed between NAD and CON in SBP on Day 1 (p = 0.821), Day 15 (p = 0.741), and Day 29 (n = 12, p = 0.877). DBP did not differ between conditions on Day 1 (p = 0.551), Day 15 (p = 0.733), and
3
Niels_Proefschrift.indd 69Niels_Proefschrift.indd 69 08/12/2020 18:05:1508/12/2020 18:05:15
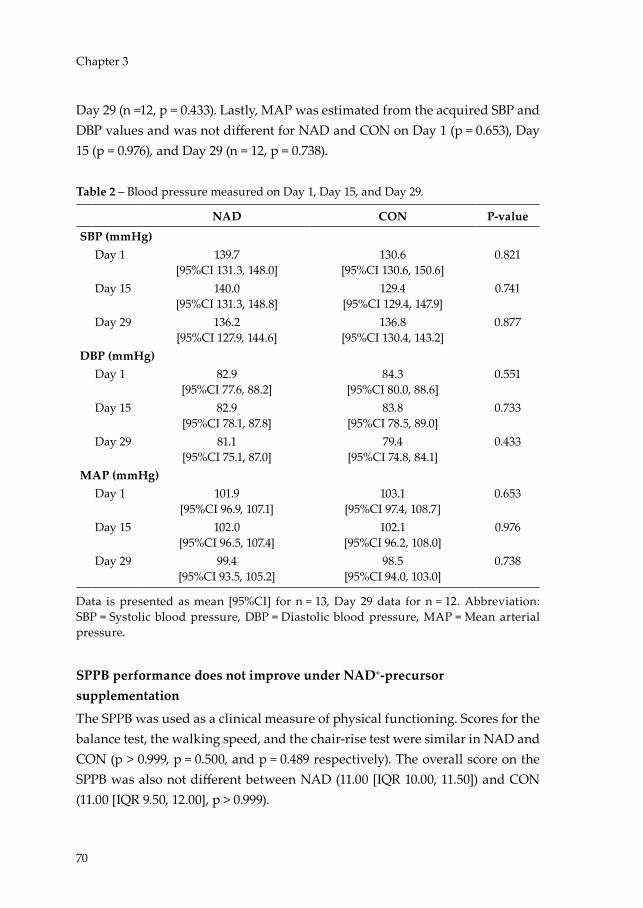
70
Chapter 3
Day 29 (n =12, p = 0.433). Lastly, MAP was estimated from the acquired SBP and DBP values and was not different for NAD and CON on Day 1 (p = 0.653), Day 15 (p = 0.976), and Day 29 (n = 12, p = 0.738).
Table 2 – Blood pressure measured on Day 1, Day 15, and Day 29.
NAD CON P-valueSBP (mmHg)
Day 1 139.7[95%CI 131.3, 148.0]
130.6[95%CI 130.6, 150.6]
0.821
Day 15 140.0[95%CI 131.3, 148.8]
129.4[95%CI 129.4, 147.9]
0.741
Day 29 136.2[95%CI 127.9, 144.6]
136.8[95%CI 130.4, 143.2]
0.877
DBP (mmHg)Day 1 82.9
[95%CI 77.6, 88.2]84.3
[95%CI 80.0, 88.6]0.551
Day 15 82.9[95%CI 78.1, 87.8]
83.8[95%CI 78.5, 89.0]
0.733
Day 29 81.1[95%CI 75.1, 87.0]
79.4[95%CI 74.8, 84.1]
0.433
MAP (mmHg)Day 1 101.9
[95%CI 96.9, 107.1]103.1
[95%CI 97.4, 108.7]0.653
Day 15 102.0[95%CI 96.5, 107.4]
102.1[95%CI 96.2, 108.0]
0.976
Day 29 99.4[95%CI 93.5, 105.2]
98.5[95%CI 94.0, 103.0]
0.738
Data is presented as mean [95%CI] for n = 13, Day 29 data for n = 12. Abbreviation: SBP = Systolic blood pressure, DBP = Diastolic blood pressure, MAP = Mean arterial pressure.
SPPB performance does not improve under NAD+-precursor supplementation
The SPPB was used as a clinical measure of physical functioning. Scores for the balance test, the walking speed, and the chair-rise test were similar in NAD and CON (p > 0.999, p = 0.500, and p = 0.489 respectively). The overall score on the SPPB was also not different between NAD (11.00 [IQR 10.00, 11.50]) and CON (11.00 [IQR 9.50, 12.00], p > 0.999).
Niels_Proefschrift.indd 70Niels_Proefschrift.indd 70 08/12/2020 18:05:1508/12/2020 18:05:15
71
NAD+-Precursor Supplementation in Older Adults
Perceived physical functioning is positively influenced by NAD+-precursor supplementation
The RAND-36 Health Survey 1.0 questionnaire was used as a measure of perceived health status. Although measured physical functioning was unaffected by NAD+-precursor supplementation, significantly higher scores were observed for the perceived physical functioning domain in NAD (92.00 [IQR 90.00, 100.00]) as compared to CON (90.00 [IQR 86.25, 93.75], n = 12, p = 0.031, Figure 6). However, the other 8 out of 9 domains of the RAND-36 did not show any differences between NAD and CON on Day 29 (p > 0.05, Figure 6).
Discussion
Mitochondrial dysfunction is an established hallmark of ageing and together with declining NAD+ levels, these factors are thought to drive the age-dependent decline in skeletal muscle physical function. Here, we hypothesised that supplementation with the NAD+-precursors Trp, NA, and NAM, in a dose that could be achieved through increased dietary intake, would improve mitochondrial oxidative capacity in community-dwelling, older adults with impaired physical function. We tested this hypothesis by conducting a double-blind, randomized, controlled, cross-over trial with detailed metabolic phenotyping. We show that supplementing with Trp, NA, and NAM does elevate MeNAM concentrations in skeletal muscle tissue, but in discordance with our hypothesis, we found no improvement in mitochondrial respiration capacity in older adults with an impaired physical function.
In the current study, we did not observe an improvement in mitochondrial respiratory capacity in skeletal muscle under NAD+-precursor supplementation compared to the control condition. This finding is in accordance with similar recent observations with NR supplementation in obese individuals (38, 39) and in older adults (22), and extends this observation to physically compromised older adults. Along the same lines, SPPB performance, energy expenditure, substrate utilization, and exercise efficiency were all unaffected by NAD+-precursor supplementation. These findings are in agreement with Martens et al. (19), who investigated the effect of NR supplementation in healthy, lean, middle-aged to older adults on parameters of physical function such as resting energy expenditure, maximum aerobic capacity, and body composition, and found no
3
Niels_Proefschrift.indd 71Niels_Proefschrift.indd 71 08/12/2020 18:05:1508/12/2020 18:05:15

72
Chapter 3
differences between NR and placebo. In accordance, Elhassan et al. (22) showed that three weeks of NR supplementation does not increase handgrip strength in older adults. In contrast to our previous finding that NR supplementation resulted in a minor but significant reduction in fat mass in middle-aged obese humans (38), we did not find any effect on body composition upon NAD+-precursor supplementation in the current study. Also, muscle volume was similar in both conditions.
Blood pressure has also been reported to be susceptible to NAD+-precursor supplementation in humans (19). However, we did not observe a change in SBP, DBP, or MAP under NAD+-precursor supplementation. This is in agreement with our previous NR supplementation study in healthy obese humans, which revealed no improvements in SBP, DBP, or MAP by performing 36-hour blood pressure measurements (38). These data, however, conflict with previous findings from Martens et al. (19) showing improvements in SBP and DBP in healthy middle-aged to older adults following 6 weeks of NR supplementation, which may be explained by discrepancies in the methodologies used to measure blood pressure, such as the higher dose used and duration of the supplementation.
Several studies have demonstrated the ability of NAD+-precursor supplementation to reduce IHL content in mice (40-42). Moreover, Dollerup et al. (21) have reported the tendency for IHL content to decline in obese humans following 12 weeks of NR supplementation. Although this observation did not reach statistical significance, the majority of the NR supplemented group (13 out of 20 participants) had an IHL content greater than 5% prior to supplementation, and 9 out of these 13 individuals had reduced IHL content after supplementation. Here, we did not observe a beneficial effect of NAD+-precursor supplementation
on IHL content. This is possibly due to the already low IHL content in our cohort, with only two participants displaying IHL contents greater than 5%, which is representative of non-alcoholic fatty liver disease (NAFLD) (43), thereby limiting the potential for a reduction in IHL content.
It was previously shown that ageing is associated with reduced intracellular NAD+ levels in skeletal muscle in humans (14, 15). It is now generally accepted that NAD+ metabolism is a main pathway in the regulation of mitochondrial function in skeletal muscle and would be a target for intervention to stimulate
Niels_Proefschrift.indd 72Niels_Proefschrift.indd 72 08/12/2020 18:05:1508/12/2020 18:05:15
73
NAD+-Precursor Supplementation in Older Adults
mitochondrial function and thereby prevent age-related decline in muscle physical function. In this light, Pirinen et al. have shown that a titration protocol of 250 mg to 1000 mg of niacin over 4 weeks is able to rescue mitochondrial respiration in adult-onset mitochondrial myopathy patients (44), demonstrating the potential and efficacy of NAD+-precursor supplementation in humans with pre-existent conditions. Notably, the window of opportunity for NAD+-precursor supplementation in this population with vitamin B3 deficiency by far exceeds the possibilities in populations who are not vitamin B3 deficient. Here, we studied a group of community-dwelling, older adults with an impaired physical function and, in measuring the NAD+ levels in skeletal muscle tissue, we found that NAD+ concentrations in skeletal muscle remained unaffected upon supplementation. We supplemented with three separate NAD+-precursors, being Trp, NA, and NAM, aiming to take advantage of their respective pathways to contribute to the overall NAD+ pool, as illustrated in Figure 2. Recently, de novo biosynthesis of NAD+ from Trp has received more attention as a viable dietary source of NAD+ (25). Katsyuba et al. demonstrated that upon the inhibition of the α-amino-β-carboxymuconate-ε-semialdehyde decarboxylase (ACMSD) enzyme in liver and kidney, the conversion of Trp to NAD+ has the potential to induce SIRT1 activation and, thereby, improve mitochondrial function (25). Here, we did not observe an increase in metabolites belonging to the kynurenine pathway from Trp to QA and subsequently to NAAD, a suggested sensitive biomarker of NAD+-precursor supplementation efficacy (45). It is possible that the majority of the Trp ingested was consumed by the ACSMD enzyme instead of allowing for spontaneous cyclisation of ACSM into QA and further enzymatic conversion to NAAD and ultimately NAD+. However, this remains speculative, as this can only be investigated by acquiring liver tissue, which we have not done in this study.
Moreover, we opted to use a low dose of 4 mg of NA daily in order to limit the occurrence of flushing due to its vasoactive properties (46). NAAD is the point of convergence for Trp and NA metabolism towards NAD+ synthesis. However, NAAD concentrations did not increase in skeletal muscle, suggesting either an insufficient dose or the preference of skeletal muscle tissue for another NAD+-precursor. With respect to the latter, skeletal muscle has indeed been shown to exhibit a differing response to individual NAD+-precursors; being highly responsive to NR, but not NAM (47). Additionally, Liu et al. have shown through
3
Niels_Proefschrift.indd 73Niels_Proefschrift.indd 73 08/12/2020 18:05:1508/12/2020 18:05:15

74
Chapter 3
isotope-tracer methodology that Trp, NA, and NAM are the predominant physiological circulatory NAD+-precursors (47). Labelling of Trp and NA showed that these precursors are converted to NAD+ in the liver and subsequently excreted into the circulation as NAM, and that NAM exchange from the circulation to skeletal muscle tissue is slow, in addition to skeletal muscle tissue exhibiting a low turnover rate of NAD+ (47). This may possibly explain why we did not observe an increase in NAM in skeletal muscle tissue in this study, or any other metabolite of the NAD+-precursors used in our supplementation protocol. Herein, our results contrast with observations of increasing NAAD in skeletal muscle made by us and others previously when supplementing with high doses of NR in obese (38) and aged individuals (22), suggesting that NAAD may be a sensitive, yet specific biomarker for NR supplementation efficacy.
The concentrations of NAD+ in skeletal muscle tissue observed in both conditions of the current study appear to be comparable to concentrations found previously by us in a group of healthy, middle-aged, obese individuals supplemented with 1000 mg of NR, and demonstrating unresponsive NAD+ levels to NR supplementation compared to placebo (20). This raises the question whether NAD+ levels per se are determinants of efficacy of NAD+-precursor supplementation, or that fluxes of NAD+ are more reliable measures of efficacy. We found that the NAD+ concentrations in skeletal muscle tissue were unresponsive to supplementation under differing supplementation strategies in two different populations (the present study and (20)) and observed increased levels of MeNAM in both studies. This observation is also in line with the observations of Elhassan et al. (22) in NR supplemented older adults showing increased MeNAM levels in skeletal muscle, admit unchanged NAD+ concentrations. From the above, one could speculate that the concentration of NAD+ in skeletal muscle tissue is likely to be near the homeostatic maximum in humans in the absence of disease or vitamin B3 deficiency, as illustrated by the study of Pirinen et al. (44). This has also been proposed in the ‘second hit’ theory by Elhassan et al. (22), in which NAD+ levels may only decline if chronological age is struck by a second trigger leading to metabolic stress, such as physical inactivity or (chronic) disease. In accordance with this reasoning, we previously showed that supplementation with the synthetic NA-analogue Acipimox increased skeletal muscle mitochondrial respiration capacity in individuals with T2DM, who are characterized by a relative low mitochondrial capacity compared
Niels_Proefschrift.indd 74Niels_Proefschrift.indd 74 08/12/2020 18:05:1508/12/2020 18:05:15
75
NAD+-Precursor Supplementation in Older Adults
to BMI-matched healthy controls (48). From the above, it could be concluded that there is potential little room for improvement in skeletal muscle NAD+ levels in healthy individuals through supplementation with NAD+-precursors, with as a consequence, little or no effect on downstream targets such as mitochondrial function, such as observed in the current study.
We acknowledge that this study is susceptible to limitations. The participants may represent the ‘cream of the crop’ in terms of older adults with an impaired physical function. As per the 6MWT distances recorded during the screening, the average walking speed in this cohort is 1.09 m/s, fitting of a healthy older (49) and prefrail population (50). Although individual 6MWT performance met our inclusion criterium, performance on the maximal cycling test yielded a larger variation in overall maximum cycling performance leading to a more heterogenous cohort than expected. Walking performance is a good predictor of physical function and frailty, co-morbidity, and death (49), but it is hard to distinguish whether walking performance is limited by muscle function or may be limited by other health problems; i.e. a decreased walking performance does not necessarily have to translate to a reduced cycling performance, as joint issues could be the limiting factor and may be less prominent during cycling compared to walking. Secondly, the selected dose of 207.5 mg NE, although being 12-15 times the RDA for vitamin B3, may be insufficient to elevate NAD+ levels in humans. The recommended daily allowance (RDA) of vitamin B3 for adult humans is set at 16 mg NE (niacin equivalents) for males and 14 mg for females (17). However, no guidelines exist for older adults specifically. To date, only a small number of studies have looked into the NAD+ boosting ability of lower doses of NAD+-precursors in humans (23, 24), and found that doses of 100 mg, 250 mg, and 300 mg NE are able to increase plasma NAD+ metabolite levels over baseline, such as NAM and MeNAM. However, these studies did not investigate intracellular levels in target tissues such as skeletal muscle. Here, we have supplemented older adults with 207.5 mg NE per day, a level of supplementation emulating increased dietary intake, and show that this is insufficient to increase levels of NAD+ and its metabolites in skeletal muscle tissue but does increase skeletal muscle MeNAM levels, suggesting an increase in skeletal muscle NAD+ metabolism. Lastly, the duration of the intervention was set at 32 days, which may be relatively short for health benefits to surface. However, we have shown that 30 days of resveratrol supplementation in obese
3
Niels_Proefschrift.indd 75Niels_Proefschrift.indd 75 08/12/2020 18:05:1508/12/2020 18:05:15
76
Chapter 3
individuals improves mitochondrial respiration capacity (51), supporting the notion that short-term interventions can positively affect human metabolism.
In summary, we investigated the efficacy of NAD+-precursor supplementation on mitochondrial function aiming to combat the age-dependent decline in skeletal muscle function. We show in community-dwelling, older adults with impaired physical function that of Trp, NA, and NAM did increase MeNAM levels in skeletal muscle tissue but did not improve mitochondrial function and skeletal muscle function. Notwithstanding, further research is merited to elucidate the full potential of NAD+-precursor supplementation in specific groups with more prominent metabolic dysfunction, such as (morbidly) obese and T2DM individuals. Future studies must also tailor their interventions towards the tissues targeted, optimising delivery, and taking the fate of the chosen NAD+-precursor into account.
Acknowledgements
This work was supported by the Top Institute Food and Nutrition (TIFN) research program Mitochondrial Health under grant number 16NH01.
Duality of interest
The authors declare that there is no duality of interest associated with this manuscript.
Contribution statement
N.J.C., L.G., J.d.V., R.H., J.G., B.H., J.H., and P.S. designed research; N.J.C., L.G., C.E.F., and Y.M.H.B. performed research; N.J.C., E.K.M., Y.M.H.B., V.B.S.H., B.H., R.Z.P., R.H.H., J.H., and P.S. analyzed samples and data. N.J.C., J.H., and P.S. wrote the manuscript and all authors critically reviewed the manuscript. P.S. is the guarantor of this work and, as such, had full access to all the data in the study and takes responsibility for the integrity of the data and the accuracy of the data analysis. P.S. is the corresponding author of this work. All authors approved the version to be published.
Niels_Proefschrift.indd 76Niels_Proefschrift.indd 76 08/12/2020 18:05:1508/12/2020 18:05:15
77
NAD+-Precursor Supplementation in Older Adults
References1. Lopez-Otin C, Blasco MA, Partridge L, Serrano M, Kroemer G. The hallmarks of
aging. Cell. 2013;153(6):1194-217.2. Roubenoff R. Sarcopenia and its implications for the elderly. Eur J Clin Nutr.
2000;54 Suppl 3:S40-7.3. Crescenzo R, Bianco F, Mazzoli A, Giacco A, Liverini G, Iossa S. Skeletal muscle
mitochondrial energetic efficiency and aging. Int J Mol Sci. 2015;16(5):10674-85.4. Gomes AP, Price NL, Ling AJ, Moslehi JJ, Montgomery MK, Rajman L, et
al. Declining NAD(+) induces a pseudohypoxic state disrupting nuclear-mitochondrial communication during aging. Cell. 2013;155(7):1624-38.
5. Conley KE, Jubrias SA, Esselman PC. Oxidative capacity and ageing in human muscle. J Physiol. 2000;526 Pt 1:203-10.
6. Kim Y, Triolo M, Hood DA. Impact of Aging and Exercise on Mitochondrial Quality Control in Skeletal Muscle. Oxid Med Cell Longev. 2017;2017:3165396.
7. Andreux PA, Houtkooper RH, Auwerx J. Pharmacological approaches to restore mitochondrial function. Nat Rev Drug Discov. 2013;12(6):465-83.
8. Camacho-Pereira J, Tarrago MG, Chini CCS, Nin V, Escande C, Warner GM, et al. CD38 Dictates Age-Related NAD Decline and Mitochondrial Dysfunction through an SIRT3-Dependent Mechanism. Cell Metab. 2016;23(6):1127-39.
9. Zhu XH, Lu M, Lee BY, Ugurbil K, Chen W. In vivo NAD assay reveals the intracellular NAD contents and redox state in healthy human brain and their age dependences. Proc Natl Acad Sci U S A. 2015;112(9):2876-81.
10. Yoshino J, Mills KF, Yoon MJ, Imai S. Nicotinamide mononucleotide, a key NAD(+) intermediate, treats the pathophysiology of diet- and age-induced diabetes in mice. Cell Metab. 2011;14(4):528-36.
11. Mills KF, Yoshida S, Stein LR, Grozio A, Kubota S, Sasaki Y, et al. Long-Term Administration of Nicotinamide Mononucleotide Mitigates Age-Associated Physiological Decline in Mice. Cell Metab. 2016;24(6):795-806.
12. Houtkooper RH, Pirinen E, Auwerx J. Sirtuins as regulators of metabolism and healthspan. Nat Rev Mol Cell Biol. 2012;13(4):225-38.
13. Canto C, Auwerx J. Targeting sirtuin 1 to improve metabolism: all you need is NAD(+)? Pharmacol Rev. 2012;64(1):166-87.
14. de Guia RM, Agerholm M, Nielsen TS, Consitt LA, Sogaard D, Helge JW, et al. Aerobic and resistance exercise training reverses age-dependent decline in NAD(+) salvage capacity in human skeletal muscle. Physiol Rep. 2019;7(12):e14139.
15. Massudi H, Grant R, Braidy N, Guest J, Farnsworth B, Guillemin GJ. Age-associated changes in oxidative stress and NAD+ metabolism in human tissue. PLoS One. 2012;7(7):e42357.
16. Mouchiroud L, Houtkooper RH, Auwerx J. NAD(+) metabolism: a therapeutic target for age-related metabolic disease. Crit Rev Biochem Mol Biol. 2013;48(4):397-408.
17. Bogan KL, Brenner C. Nicotinic acid, nicotinamide, and nicotinamide riboside: a molecular evaluation of NAD+ precursor vitamins in human nutrition. Annu Rev Nutr. 2008;28:115-30.
3
Niels_Proefschrift.indd 77Niels_Proefschrift.indd 77 08/12/2020 18:05:1508/12/2020 18:05:15

78
Chapter 3
18. Zhang H, Ryu D, Wu Y, Gariani K, Wang X, Luan P, et al. NAD(+) repletion improves mitochondrial and stem cell function and enhances life span in mice. Science. 2016;352(6292):1436-43.
19. Martens CR, Denman BA, Mazzo MR, Armstrong ML, Reisdorph N, McQueen MB, et al. Chronic nicotinamide riboside supplementation is well-tolerated and elevates NAD(+) in healthy middle-aged and older adults. Nat Commun. 2018;9(1):1286.
20. Remie CME, Roumans KHM, Moonen MPB, Connell NJ, Havekes B, Mevenkamp J, et al. Nicotinamide riboside supplementation alters body composition and skeletal muscle acetylcarnitine concentrations in healthy obese humans. The American journal of clinical nutrition. 2020.
21. Dollerup OL, Christensen B, Svart M, Schmidt MS, Sulek K, Ringgaard S, et al. A randomized placebo-controlled clinical trial of nicotinamide riboside in obese men: safety, insulin-sensitivity, and lipid-mobilizing effects. The American journal of clinical nutrition. 2018;108(2):343-53.
22. Elhassan YS, Kluckova K, Fletcher RS, Schmidt MS, Garten A, Doig CL, et al. Nicotinamide Riboside Augments the Aged Human Skeletal Muscle NAD(+) Metabolome and Induces Transcriptomic and Anti-inflammatory Signatures. Cell Rep. 2019;28(7):1717-28 e6.
23. Irie J, Inagaki E, Fujita M, Nakaya H, Mitsuishi M, Yamaguchi S, et al. Effect of oral administration of nicotinamide mononucleotide on clinical parameters and nicotinamide metabolite levels in healthy Japanese men. Endocr J. 2020;67(2):153-60.
24. Conze D, Brenner C, Kruger CL. Safety and Metabolism of Long-term Administration of NIAGEN (Nicotinamide Riboside Chloride) in a Randomized, Double-Blind, Placebo-controlled Clinical Trial of Healthy Overweight Adults. Sci Rep. 2019;9(1):9772.
25. Katsyuba E, Mottis A, Zietak M, De Franco F, van der Velpen V, Gariani K, et al. De novo NAD(+) synthesis enhances mitochondrial function and improves health. Nature. 2018;563(7731):354-9.
26. Dietary Reference Intakes for Thiamin, Riboflavin, Niacin, Vitamin B6, Folate, Vitamin B12, Pantothenic Acid, Biotin, and Choline. The National Academies Collection: Reports funded by National Institutes of Health. Washington (DC)1998.
27. Fukuwatari T, Shibata K. Nutritional aspect of tryptophan metabolism. Int J Tryptophan Res. 2013;6(Suppl 1):3-8.
28. VanderZee KI, Sanderman R, Heyink JW, de Haes H. Psychometric qualities of the RAND 36-Item Health Survey 1.0: a multidimensional measure of general health status. Int J Behav Med. 1996;3(2):104-22.
29. VanderZee KI, Sanderman R. Het meten van de algemene gezondheidstoestand met de RAND-36, een handleiding. UMGC / Rijksuniversiteit Groningen, Research Institute SHARE. 2012;Tweede herziene druk.
30. Lindeboom L, Nabuurs CI, Hesselink MK, Wildberger JE, Schrauwen P, Schrauwen-Hinderling VB. Proton magnetic resonance spectroscopy reveals increased hepatic lipid content after a single high-fat meal with no additional modulation by added protein. The American journal of clinical nutrition. 2015;101(1):65-71.
31. Guralnik JM, Simonsick EM, Ferrucci L, Glynn RJ, Berkman LF, Blazer DG, et al. A short physical performance battery assessing lower extremity function: association with self-reported disability and prediction of mortality and nursing home admission. Journal of gerontology. 1994;49(2):M85-94.
Niels_Proefschrift.indd 78Niels_Proefschrift.indd 78 08/12/2020 18:05:1608/12/2020 18:05:16

79
NAD+-Precursor Supplementation in Older Adults
32. Bergstrom J. Percutaneous needle biopsy of skeletal muscle in physiological and clinical research. Scand J Clin Lab Invest. 1975;35(7):609-16.
33. Hoeks J, van Herpen NA, Mensink M, Moonen-Kornips E, van Beurden D, Hesselink MK, et al. Prolonged fasting identifies skeletal muscle mitochondrial dysfunction as consequence rather than cause of human insulin resistance. Diabetes. 2010;59(9):2117-25.
34. Phielix E, Meex R, Ouwens DM, Sparks L, Hoeks J, Schaart G, et al. High oxidative capacity due to chronic exercise training attenuates lipid-induced insulin resistance. Diabetes. 2012;61(10):2472-8.
35. Weir JB. New methods for calculating metabolic rate with special reference to protein metabolism. J Physiol. 1949;109(1-2):1-9.
36. Matomaki P, Linnamo V, Kyrolainen H. A Comparison of Methodological Approaches to Measuring Cycling Mechanical Efficiency. Sports Med Open. 2019;5(1):23.
37. Kato T, Berger SJ, Carter JA, Lowry OH. An enzymatic cycling method for nicotinamide-adenine dinucleotide with malic and alcohol dehydrogenases. Anal Biochem. 1973;53(1):86-97.
38. Remie CM, Roumans KH, Moonen MP, Connell NJ, Havekes B, Mevenkamp J, et al. Nicotinamide riboside supplementation alters body composition and skeletal muscle acetylcarnitine concentrations in healthy obese humans. The American journal of clinical nutrition. 2020.
39. Dollerup OL, Chubanava S, Agerholm M, Sondergard SD, Altintas A, Moller AB, et al. Nicotinamide riboside does not alter mitochondrial respiration, content or morphology in skeletal muscle from obese and insulin-resistant men. J Physiol. 2020;598(4):731-54.
40. Zhou CC, Yang X, Hua X, Liu J, Fan MB, Li GQ, et al. Hepatic NAD(+) deficiency as a therapeutic target for non-alcoholic fatty liver disease in ageing. Br J Pharmacol. 2016;173(15):2352-68.
41. Gariani K, Menzies KJ, Ryu D, Wegner CJ, Wang X, Ropelle ER, et al. Eliciting the mitochondrial unfolded protein response by nicotinamide adenine dinucleotide repletion reverses fatty liver disease in mice. Hepatology. 2016;63(4):1190-204.
42. Trammell SA, Weidemann BJ, Chadda A, Yorek MS, Holmes A, Coppey LJ, et al. Nicotinamide Riboside Opposes Type 2 Diabetes and Neuropathy in Mice. Sci Rep. 2016;6:26933.
43. Gaggini M, Morelli M, Buzzigoli E, DeFronzo RA, Bugianesi E, Gastaldelli A. Non-alcoholic fatty liver disease (NAFLD) and its connection with insulin resistance, dyslipidemia, atherosclerosis and coronary heart disease. Nutrients. 2013;5(5):1544-60.
44. Pirinen E, Auranen M, Khan NA, Brilhante V, Urho N, Pessia A, et al. Niacin Cures Systemic NAD(+) Deficiency and Improves Muscle Performance in Adult-Onset Mitochondrial Myopathy. Cell Metab. 2020;31(6):1078-90 e5.
45. Trammell SA, Schmidt MS, Weidemann BJ, Redpath P, Jaksch F, Dellinger RW, et al. Nicotinamide riboside is uniquely and orally bioavailable in mice and humans. Nat Commun. 2016;7:12948.
46. Benyo Z, Gille A, Bennett CL, Clausen BE, Offermanns S. Nicotinic acid-induced flushing is mediated by activation of epidermal langerhans cells. Mol Pharmacol. 2006;70(6):1844-9.
3
Niels_Proefschrift.indd 79Niels_Proefschrift.indd 79 08/12/2020 18:05:1608/12/2020 18:05:16
80
Chapter 3
47. Liu L, Su X, Quinn WJ, 3rd, Hui S, Krukenberg K, Frederick DW, et al. Quantitative Analysis of NAD Synthesis-Breakdown Fluxes. Cell Metab. 2018;27(5):1067-80 e5.
48. van de Weijer T, Phielix E, Bilet L, Williams EG, Ropelle ER, Bierwagen A, et al. Evidence for a direct effect of the NAD+ precursor acipimox on muscle mitochondrial function in humans. Diabetes. 2015;64(4):1193-201.
49. Abellan van Kan G, Rolland Y, Andrieu S, Bauer J, Beauchet O, Bonnefoy M, et al. Gait speed at usual pace as a predictor of adverse outcomes in community-dwelling older people an International Academy on Nutrition and Aging (IANA) Task Force. J Nutr Health Aging. 2009;13(10):881-9.
50. Tompkins BA, DiFede DL, Khan A, Landin AM, Schulman IH, Pujol MV, et al. Allogeneic Mesenchymal Stem Cells Ameliorate Aging Frailty: A Phase II Randomized, Double-Blind, Placebo-Controlled Clinical Trial. The journals of gerontology Series A, Biological sciences and medical sciences. 2017;72(11):1513-22.
51. de Ligt M, Bruls YMH, Hansen J, Habets MF, Havekes B, Nascimento EBM, et al. Resveratrol improves ex vivo mitochondrial function but does not affect insulin sensitivity or brown adipose tissue in first degree relatives of patients with type 2 diabetes. Mol Metab. 2018;12:39-47.
Niels_Proefschrift.indd 80Niels_Proefschrift.indd 80 08/12/2020 18:05:1608/12/2020 18:05:16

81
NAD+-Precursor Supplementation in Older Adults
3
Niels_Proefschrift.indd 81Niels_Proefschrift.indd 81 08/12/2020 18:05:1608/12/2020 18:05:16

Niels_Proefschrift.indd 82Niels_Proefschrift.indd 82 08/12/2020 18:05:1608/12/2020 18:05:16
4Impact of ageing and exercise on skeletal muscle mitochondrial capacity, energy metabolism, and physical function: a cross-sectional study
L. Grevendonk1, N.J. Connell1, C. McCrum1, C.E. Fealy1, L. Bilet1, Y.M.H. Bruls2, V.B. Schrauwen-Hinderling1,2, J.A. Jörgensen1, E. Kornips-Moonen1, G. Schaart1, B. Havekes1,3, J. de Vogel4, M.C.E. Bragt-van Wijngaarden5, K. Meijer1, P. Schrauwen1, J. Hoeks1.
1 Department of Nutrition and Movement Sciences, NUTRIM School for Nutrition and Translational
Research in Metabolism, Maastricht University, 6200 MD Maastricht, the Netherlands2 Department of Radiology and Nuclear Medicine, NUTRIM School for Nutrition and Translational
Research in Metabolism, Maastricht University Medical Center+, 5800 AZ Maastricht, the
Netherlands3 Department of Internal Medicine, Division of Endocrinology, NUTRIM School for Nutrition and
Translational Research in Metabolism, Maastricht University Medical Center+, 5800 AZ Maastricht,
the Netherlands4 Danone Nutricia Research, P.O. Box 80141, 3508 TC Utrecht, the Netherlands.5 Friesland Campina, 3818 LE Amersfoort, the Netherlands
Submitted
Niels_Proefschrift.indd 83Niels_Proefschrift.indd 83 08/12/2020 18:05:1608/12/2020 18:05:16

84
Chapter 4
Abbreviations31P-MRS 31Phosphorus Magnetic resonance spectroscopyFCCP Carbonylcyanide-4-(trifluoromethoxy)-phenylhydrazoneGEE Gross exercise efficiencyHIPA High-intensity physical activityIO Physically impaired older adultsLIPA Low-intensity physical activityMRI Magnetic resonance imagingNEE Net exercise efficiencyO Older adultsPA Physical activityPCr PhosphocreatinePGC-1α Peroxisome proliferator-activated receptor gamma co-activator 1αREE Resting energy expenditureRER Respiratory exchange ratioSPPB Short physical performance batteryTO Trained older adultsY Young adults
Niels_Proefschrift.indd 84Niels_Proefschrift.indd 84 08/12/2020 18:05:1608/12/2020 18:05:16

85
Ageing and Skeletal Muscle and Mitochondrial Health
Abstract
Background The relationship between age-associated decline in mitochondrial function and its effect on skeletal muscle physiology and function continues to generate considerable debate. Thus, the age-associated decline in mitochondrial capacity may not be attributable to ageing per se and instead, could be explained by an age-related decline in physical activity. In the current study, we aimed to delineate to which extent physical activity contributes to the decline in mitochondrial function and muscle health during ageing.
Methods Therefore, we first compared mitochondrial function in young (Y, 20 – 30 years; n = 17) and older adults (O, 65 - 80 years; n = 17), similar in habitual physical activity levels. Next, we studied older adults with a range in habitual physical activity and physical functionality, i.e. trained older adults (TO, 65 – 80 years, n = 19) and physically impaired older adults (IO, 65 – 80 years, n = 6). Skeletal muscle mitochondrial capacity was determined by ex vivo high resolution respirometry in permeabilized muscle fibres and in vivo through post-exercise 31Phosphorus magnetic resonance spectroscopy of the phosphocreatine recovery rate. Additionally, clinically relevant assessments of muscle function (including strength, volume, insulin sensitivity, gait stability and adaptability, exercise capacity, and exercise efficiency) were performed.
Results O displayed a lower in vivo and ex vivo mitochondrial capacity (p = 0.003 and p = 0.006, respectively), maximal aerobic capacity (p < 0.001), exercise efficiency (p < 0.001), muscle strength (p < 0.001), insulin sensitivity (p = 0.050), gait stability to a perturbation (p = 0.010), and walking performance (p = 0.032) compared to Y, despite similar habitual physical activity. In comparison to OA with a normal level of physical activity, TO displayed a higher ex vivo mitochondrial function (p = 0.002), maximal aerobic capacity (p = 0.003), exercise efficiency (p = 0.006), muscle strength (p < 0.001), and insulin sensitivity (p = 0.023). Moreover, in the entire cohort, mitochondrial function associated with muscle strength, maximal aerobic capacity, exercise efficiency, and insulin sensitivity. Measures for muscle health and mitochondrial capacity in IO were not shown to be different from O with normal levels of physical activity.
4
Niels_Proefschrift.indd 85Niels_Proefschrift.indd 85 08/12/2020 18:05:1608/12/2020 18:05:16

86
Chapter 4
Conclusions Ageing is associated with a decline in mitochondrial capacity, exercise capacity and efficiency, gait stability, muscle function, and insulin sensitivity, irrespective of habitual physical activity. Nevertheless, a higher physical activity level, achieved through regular exercise training, can partially negate effects of ageing. Finally, the observed correlations between mitochondrial capacity and muscle strength, exercise efficiency, and insulin sensitivity, support the notion that mitochondria may represent effective targets to attenuate the ageing-associated deterioration of skeletal muscle.
Niels_Proefschrift.indd 86Niels_Proefschrift.indd 86 08/12/2020 18:05:1608/12/2020 18:05:16
87
Ageing and Skeletal Muscle and Mitochondrial Health
Introduction
A large portion of the world’s population is of middle to older age, and in high-income countries, the proportion of people over the age of 60 is growing faster than any other age category (1,2). Since ageing is associated with a variety of comorbidities resulting in rapidly increasing health care costs, this demographic change is one of the major societal challenges of the current decade (3).
One of the distinct features of the ageing process is the progressive loss of muscle mass and physical function (collectively known as sarcopenia) (4). The loss of skeletal muscle mass and tissue function has been related to mobility impairments (5), such as difficulties walking short distances or standing up from a chair (6,7), an increased risk of falls (8,9), physical frailty (10), and metabolic impairments (11), ultimately leading to a loss of physical independence and increased care need (12). Improving muscle function, balance and mobility, and reducing falls are important factors for public health in older adults in order to reduce fall-related consequences such as fractures, further functional decline, immobility, and death (13).
In parallel with the progressive loss of muscle function, mitochondrial respiratory capacity in human skeletal muscle has been shown to decrease with advancing age in healthy men and women (14–17). Furthermore, protein levels of the mitochondrial master regulator peroxisome proliferator-activated receptor gamma co-activator 1α (PGC-1α) were found to correlate with walking speed in healthy older adults (18). Therefore, it is tempting to speculate that augmenting mitochondrial function could be a potential strategy to counteract ageing-associated decline in physical function. Some preclinical studies even suggest that the reduction in muscle mitochondrial function may underlie the decline in muscle health during ageing. Thus, an accelerated manifestation of sarcopenia is seen in transgenic mice lacking the antioxidant enzyme superoxide dismutase 1 (SOD1), which are characterized by both a diminished mitochondrial bioenergetic function and an induction of mitochondrial-mediated apoptosis (19). In addition, in rats, age-related increases in mitochondrial abnormalities have been shown to associate with muscle fibre splitting and atrophy (20). Although some human studies have addressed age-related alterations in muscle mitochondrial function in relation to the decline in skeletal muscle function
4
Niels_Proefschrift.indd 87Niels_Proefschrift.indd 87 08/12/2020 18:05:1608/12/2020 18:05:16

88
Chapter 4
(6,21–23), the available data in humans is scarce and the few available studies often focus on either the decline in muscle function or concentrate primarily on the mitochondrial alterations. Additionally, the age-associated decline in mitochondrial function is not completely attributable to ageing per se and may also be explained, in part, by an age-related decline in physical activity (PA) (19,20). As such, it remains unclear to which extent both components contribute to the decline in mitochondrial function and muscle health during ageing.
In an attempt to delineate these relationships, we conducted a cross-sectional study with detailed phenotyping in groups of young versus older human subjects, with a range in oxidative capacity and physical function. The first aim of the study was to assess the age-related alterations in mitochondrial capacity and muscle health by comparing young versus older individuals with a similar level of habitual PA. Thus, we performed a wide array of assessments of skeletal muscle functionality (including strength, volume, insulin sensitivity, gait stability and adaptability, exercise capacity and exercise efficiency) as well as in and ex vivo measurements to characterize mitochondrial respiration capacity. The second aim of the study was to investigate the role of performing regular exercise training on mitochondrial function and muscle health in older adults. As such – using these methods – older adults with a normal PA were also compared to older adults with a high oxidative capacity (exercise-trained individuals, high PA) as well as to older adults with a low physical function (physically impaired individuals, low PA). We also performed correlative analysis between skeletal muscle mitochondrial function, physical function, and muscle health during ageing.
Methods
Participants
Fifty-nine participants including 17 young (9 male and 8 female) and 42 older individuals (23 male and 19 female) were recruited in the community of Maastricht and its surroundings through advertisements at Maastricht University, in newspapers, supermarkets, and at sports clubs. The study protocol was approved by the institutional Medical Ethical Committee and conducted in accordance with the declaration of Helsinki. All participants provided their
Niels_Proefschrift.indd 88Niels_Proefschrift.indd 88 08/12/2020 18:05:1708/12/2020 18:05:17

89
Ageing and Skeletal Muscle and Mitochondrial Health
written informed consent and the study was registered at clinicaltrials.gov under identifier NCT03666013.
Prior to inclusion, all subjects underwent a medical screening that included a medical questionnaire, a physical examination by a physician, and an assessment of physical function by means of a Short Physical Performance Battery (SPPB), which includes a standing balance test, a 4-meter walk test, and a chair-stand test (26). The SPPB score was calculated according to the cut-off points determined by Guralnik in vivo (22). A sitting blood pressure measurement and an electrocardiogram (ECG) were performed, respectively. After the screening procedure, participants were assigned to one of the following study groups: Young individuals with normal physical activity (Y, 20 – 30 years), older adults with normal physical activity (O, 65 – 80 years), trained older adults (TO, 65 – 80 years), and physically impaired older adults (IO, 65 – 80 years). Participants were considered normally physically active if they completed no more than one structured exercise session per week, whereas participants were considered trained if they engaged in at least three structured exercise sessions of at least one hour each per week for an uninterrupted period of at least one year. Participants were classified as older adults with impaired physical function (IO) in case of an SPPB score of ≤ 9.
Exclusion criteria were contra-indications for MRI examination, uncontrolled hypertension, the use of medication that could interfere with the results of the study, and a medical history of cardiovascular disease, type 2 diabetes mellitus, or other health problems that may hamper the safety of the individual during participation. Impairments in parameters of liver and kidney function were examined via determination of plasma aspartate aminotransferase (ASAT), alanine aminotransferase (ALAT), gamma-glutamyltransferase (γGT), bilirubin, and creatine.
Experimental design
This cross-sectional study was conducted at Maastricht University Medical Centre, The Netherlands, between September 2017 and March 2020, and involved detailed phenotyping of skeletal muscle health and mitochondrial oxidative capacity.
4
Niels_Proefschrift.indd 89Niels_Proefschrift.indd 89 08/12/2020 18:05:1708/12/2020 18:05:17

90
Chapter 4
The detailed assessment of muscle health consisted of various measurements that were divided over five study visits, equally distributed over a period of 5 weeks to allow sufficient recovery between each visit and to prevent interference between the various measurements (Table S1). During the participation, subjects were instructed to maintain their habitual diet and physical activity pattern, and in the three days preceding the test days participants refrained from strenuous physical activity.
Hyperinsulinemic-euglycemic clamp
A hyperinsulinemic-euglycemic clamp was performed to assess peripheral insulin sensitivity, as previously described (27). Briefly, subjects reported to the laboratory at 8 AM after an overnight fast from 10 PM. A fasted blood sample was taken and subsequently a primed-continuous infusion of d-[6,6–2H2]-glucose (16.8 mg/mL, 0.04 ml/kg/min) was initiated (28). After 3 hours (t = 180 min), infusion of insulin (40 mU/m2/min) was started for a period of 2.5 hours. Based on the continuously monitored plasma glucose concentrations, the glucose infusion rate (GIR) was adjusted to maintain a steady-state plasma glucose level of approximately 5.0 mmol/L. Subsequently, insulin sensitivity was determent by calculating the M-value (mg/kg/min). During the basal period (t = 150 – 180 min) and during the last 30 min of insulin infusion (t = 300 – 330 min) blood samples were collected and indirect calorimetry (Omnical, IDEE, Maastricht, the Netherlands) was performed.
Three individuals in the IO group were excluded from participation in the clamp on grounds of safety, as such we compared insulin sensitivity between Y versus O, and amongst the older adults only O versus TO.
Maximal aerobic capacity
Maximal aerobic capacity (VO2max) was assessed with concurrent ECG during a graded cycling test until exhaustion, as described previously (29). Briefly, after a warming-up period of 5 minutes at 50 Watt, the power output was increased every 2.5 minutes with 50 Watt until the heart rate rose above 80% of the predicted maximal heart rate (= 220 minus age) were monitored. After this point the test continued, and power output was increased every 25 Watt every 2.5 minutes until the participant was no longer able to pedal above 60 rotations per minute. Consumed O2 and expired CO2 were measured continuously throughout
Niels_Proefschrift.indd 90Niels_Proefschrift.indd 90 08/12/2020 18:05:1708/12/2020 18:05:17
91
Ageing and Skeletal Muscle and Mitochondrial Health
the test using indirect calorimetry (Omnical, IDEE, Maastricht, the Netherlands) to determine VO2max.
Habitual physical activity
Habitual physical activity was determined using an ActivPAL3 monitor (PAL Technologies, Glasgow, Scotland) for a consecutive period of 5 days, which always included the 2 weekend days. The monitor was wrapped and attached to the skin on the anterior face of the upper leg using Tegaderm (3M™) in a waterproof fashion; non-wear was therefore not an issue. Data were uploaded using the software provided by ActivPAL and processed using customized software written in MATLAB R2013b (MathWorks, Natick, MA, USA). Besides the total amount of steps per day, the total stepping time was calculated in proportion to waking time per day. Stepping time (i.e. physical activity) was further classified into high-intensity physical activity (HIPA; minutes with a step frequency > 110 steps/min in proportion to waking time) and low-intensity physical activity (LIPA; minutes with a step frequency ≤ 110 steps/min in proportion to waking time) (30). Waking time was determined according to Van der Berg et al. (31).
Body composition
Body composition (fat and fat-free mass) was determined at 8AM after an overnight fast from 10PM the previous evening using air displacement plethysmography (BodPod®, COSMED, Inc., Rome, Italy) (32).
Muscle strength
Muscle contractile performance was measured using the Biodex System 3 Pro dynamometer (Biodex® Medical Systems, Inc., Shirley, NY, USA). For the measurements, the participants were stabilized in the device with shoulder, leg, and abdominal straps to prevent compensatory movement, and the test was performed with the left leg in all participants. To measure maximal muscle strength, each participant performed 30 consecutive extension and flexion movements (range of motion 120 degrees/s). The peak torque of each extension and flexion was recorded and maximal isokinetic knee-extensor and knee-flexor torque was defined of the highest peak torque and corrected for body weight (Nm/kg).
4
Niels_Proefschrift.indd 91Niels_Proefschrift.indd 91 08/12/2020 18:05:1708/12/2020 18:05:17

92
Chapter 4
Resting energy expenditure
Resting energy expenditure (REE) and substrate utilization were measured at 8 AM, after an overnight fast from 10 PM the preceding evening. Gas exchange was measured by open circuit respirometry with an automated ventilated hood system for 45 minutes. During the measurement participants were instructed to take a supine resting position on the research bed.
Submaximal exercise test and exercise energy expenditure
After assessing resting energy expenditure, participants performed a 1-hour submaximal exercise bout in the fasted state on an electronically braked cycle ergometer. To reach equal levels of exercise intensity, submaximal cycle test was performed at 50% of Wmax as measured during the maximal aerobic cycling test. Subjects were instructed to pedal at a controlled cadence between 60 and 70 rotations per minute. To calculate exercise energy expenditure (EEE) and substrate oxidation, O2 consumption and CO2 production were recorded using indirect calorimetry for 15 minutes at 2 time points (T = 15 and T = 45). The submaximal cycle test was performed at 50% of Wmax and averaged 109.2 Watt (28.7) versus 74.0 Watt (23.1) in young versus older adults respectively (p < 0.001). The TO individuals performed the sub-maximal cycle test at a higher absolute power (96.8 Watt (27.9)) in comparison with O (74.0 Watt (23.1), p = 0.030) and IO (59.4 Watt (25.6), p = 0.017).
Calculations of energy expenditure and exercise efficiency
Energy expenditure (EE) was measured in rest, upon insulin stimulation during the hyperinsulinemic-euglycemic clamp, and during the submaximal cycle test using indirect calorimetry. The Weir equation (33) was used to calculate whole body energy expenditure from measurements of O2 consumption and CO2 production. Carbohydrate and fat oxidation rates were calculated using the non-protein equations by Péronnet and Massicotte (34).
During exercise, gross energy efficiency (GEE) was computed as the power output (watts converted in kJ/min) over exercise energy expenditure (in kJ/min) during the 1-hour submaximal bike test and expressed as a ratio (Equation 1) as described by (35). Mean values of work, VO2, VCO2 were averaged over 15-minute periods at 2 time points (t = 15 min and t = 45 min). Data from the first 5 and last 2 min were omitted.
Niels_Proefschrift.indd 92Niels_Proefschrift.indd 92 08/12/2020 18:05:1708/12/2020 18:05:17
93
Ageing and Skeletal Muscle and Mitochondrial Health
Equation 1: GEE (%) = (Work (kJ/min) / EEE (kJ/min)) * 100
Net energy efficiency (NEE) was measured from the submaximal test as power output (watts converted in kJ/min) over EE during exercise (EEE) minus REE (Equation 2) as described by (35). REE was measured on the same day as described above.
Equation 2: NEE (%) = (Work (kJ/min) / (EEE (kJ/min) – REE (kJ/min)) * 100
Skeletal muscle biopsy
Prior to the submaximal exercise test, a muscle biopsy was obtained from the m. vastus lateralis under local anesthesia (1.0% lidocaine without epinephrine) according to the Bergström method (36). Part of the biopsy was immediately placed in ice-cold preservation medium (BIOPS, OROBOROS Instruments, Innsbruck, Austria) and used for measurement of ex vivo mitochondrial oxidative capacity. The remaining part of the muscle biopsy was immediately frozen in melting isopentane and stored at –80°C until further analysis.
Ex vivo high-resolution respirometry
Permeabilized skeletal muscle fibres were immediately prepared from the muscle tissue collected in the preservation medium, as described previously (37,38). Subsequently, the permeabilized muscle fibres (~2.5 mg wet weight) were analysed for mitochondrial function using an oxygraph (OROBOROS Instruments, Innsbruck, Austria), in essence according to Hoeks et al. (38). To prevent oxygen limitation, the respiration chambers were hyper-oxygenated up to ~400 µmol/L O 2. Subsequently, two different multi-substrate/inhibition protocols were used in which substrates and inhibitors were added consecutively in saturating concentrations. State 2 respiration was measured after the addition of malate (4 mmol/L) plus octanoyl-carnitine (50 µmol/L) or malate (4 mmol/L) plus glutamate (10 mmol/L). Subsequently, an excess of 2 mmol/L of ADP was added to determine coupled (state 3) respiration. Coupled respiration was then maximized with convergent electron input through Complex I and Complex II by adding saturating concentrations of succinate (10 mmol/L). Finally, the chemical uncoupler carbonylcyanide-4-(trifluoromethoxy)-phenylhydrazone (FCCP) was titrated or oligomycin (2 µg/ml) was added to assess the maximal capacity of the electron transport chain and the respiration not coupled to ATP synthesis
4
Niels_Proefschrift.indd 93Niels_Proefschrift.indd 93 08/12/2020 18:05:1708/12/2020 18:05:17

94
Chapter 4
(state 4o respiration), respectively. The integrity of the outer mitochondrial membrane was assessed by the addition of cytochrome C (10 µmol/L) upon maximal coupled respiration. If cytochrome C increased oxygen consumption >15% the measurement was excluded to assure the viability and quality of the muscle mitochondrial measurement. All measurements were performed in quadruplicate.
Magnetic resonance imaging and spectroscopy
All magnetic resonance imaging (MRI) experiments were performed during the on the same day on a 3T whole body MRI scanner (Achieva 3T-X; Philips Healthcare, Best, the Netherlands). To standardize food intake, participants consumed a light lunch at noon and remained fasted until completion of all MRI experiments. Subjects reported to the university in the afternoon at 2:30 PM and were seated in the waiting room for at least 30 minutes to minimize the possible effect of prior muscle activity. At 3 PM, participants were positioned supine in the MRI scanner (feet first) to determine muscle volume of the upper leg using the body coil. Subsequently, a series of T1-weighted images were acquired of the upper leg (slice thickness = 10.0 mm, no gap between slices, in-plane resolution = is 0.78 x 0.78 mm). A custom-build MATLAB script was used to semi-automatically segment adipose tissue and muscle and quantify muscle volume. The muscle segmentation was performed in the consecutive slices between the lower end of the m. rectus femoris and the lower end of the m. gluteus maximus.
Subsequently, phosphorus magnetic resonance spectroscopy (31P-MRS) at 3T was used to measure in vivo mitochondrial function in m. vastus lateralis as previously described (39), using a 6 cm surface coil to acquire spectra. A series of 150 unlocalized 31P-spectra was acquired with parameters: single acquisitions (NSA = 1); repetition time (TR) = 4000 ms; spectral bandwidth = 3000 Hz; number of points = 1024. 150 spectra were acquired with 10 spectra at rest, 70 spectra during knee-extension exercise, and 70 spectra of recovery. Exercise within the scanner was performed to an auditory cue (0.5 Hz) in a custom-built knee-extension device with adjustable weight. The intensity was chosen to correspond to 50-60% of the predetermined maximal weight (determined on a separate day). Acquired spectra were analysed with a custom-made MATLAB script (The Mathworks Inc. Natick, MA, USA). The PCr recovery was fitted with a mono-exponential function and the rate constant (κ) was determined as previously
Niels_Proefschrift.indd 94Niels_Proefschrift.indd 94 08/12/2020 18:05:1708/12/2020 18:05:17
95
Ageing and Skeletal Muscle and Mitochondrial Health
described (39). The PCr resynthesis rate constant κ is entirely dependent on ATP produced by oxidative phosphorylation and can therefore be used as a parameter of in vivo oxidative capacity (40).
Walking performance and unperturbed and perturbed walking stability
Walking performance and stability were quantitatively assessed during a self-paced 6-minute walk test (6MWT), during multiple fixed-speed gait trials, and during a repeated balance disturbance trial. All tasks were measured using a dual-belt, force plate-instrumented (1000 Hz) treadmill with a virtual environment that provided optic flow during walking (Computer Assisted Rehabilitation Environment Extended, CAREN; Motekforce Link, Amsterdam, the Netherlands) and a 12-camera motion capture system (100 Hz; Vicon Motion Systems, Oxford, UK).
The 6MWT began with an explanation and one familiarization session (including two “start-ups” to let participants become accustomed to the self-paced function) on the CAREN prior to completing the recorded 6MWT. The 6-minute walk distance was taken to represent performance.
To assess gait variability in a systematic manner, the means and coefficients of variation of step time, step length, step width, and double support time were assessed during fixed-speed trials. This session again began with familiarisation trials, comprised of 1 to 2 minutes at speeds of 0.4 m/s up to 1.8 m/s (when possible) in 0.2 m/s steps. Following a short break, the same speeds achieved during familiarisation were repeated and recorded, this time for between 2 and 3 minutes to ensure at least 60 strides (120 steps) could be recorded.
Following the fixed-speed walking trials and while participants rested, the data was analysed in order to calculate a stability-normalised walking speed for each participant individually for use in the gait perturbation trial. The stability-normalised walking speed was calculated for a margin of stability (MoS (41)) of 0.05 m as described previously (42), ensuring a comparable baseline gait stability for all groups (43,44).
The perturbation trial then began with 3 to 4 minutes of unperturbed walking at the stability normalised walking speed, followed by 10 unannounced unilateral
4
Niels_Proefschrift.indd 95Niels_Proefschrift.indd 95 08/12/2020 18:05:1708/12/2020 18:05:17
96
Chapter 4
treadmill belt acceleration perturbations, each occurring every 30 to 90 seconds. The first and tenth accelerations were applied to the right leg, while the second to ninth accelerations were applied to the left leg as described previously (43,44). For the current study, the first perturbation to each limb were analysed (Pert1R and Pert2L) representing novel disturbances and simulating the unexpected situations that may occur in daily life, as well as the ninth perturbation (final left leg perturbation; Pert9L) to indicate adaptation in gait following eight repeated perturbations. Participants were told that they would complete a walking balance challenge and to try to continue walking as normally as possible. Participants were not aware of the specifics of the protocol (i.e. limbs to be perturbed, type, number, timing, magnitude of the perturbations). The anteroposterior MoS at foot touchdown were calculated as the anteroposterior distance between the anterior boundary of the base of support and the extrapolated centre of mass (41), adapted for our validated reduced kinematic model (45). The MoS was calculated for the following steps: the mean MoS of the eleventh to second last step before each perturbation (Base); the final step before each perturbation (Pre); and the first eight recovery steps following each perturbation (Post1-8).
The MoS is based on an inverted pendulum model of human walking. More positive values indicate that the inverted pendulum will not freely swing forward without additional motor action, whereas more negative values indicate that the inverted pendulum will continue to swing freely forward. In the current study’s context, more positive and more negative MoS values indicate a need to move in a way that “pushes” and “catches” the centre of mass anteriorly, respectively, to continue or return to normal walking. The number of steps needed to return to pre-perturbation stability was determined by calculating the number of steps within 0.05 m of the MoS value of Base for each individual, counting back from the eighth recovery step, using custom written R code (R version 3.6.0 (46)).
For all three gait tasks, initial data processing was conducted in MATLAB (2016a, The MathWorks, Inc., Natick, MA, USA). The three-dimensional coordinates of the markers were filtered using a low pass second order Butterworth filter (zero-phase) with a 12 Hz cut-off frequency. Foot touchdown and toe-off were detected using a combined method of force plate data (50 N threshold) and foot marker data (47), as described in detail previously (48).
Niels_Proefschrift.indd 96Niels_Proefschrift.indd 96 08/12/2020 18:05:1708/12/2020 18:05:17
97
Ageing and Skeletal Muscle and Mitochondrial Health
Statistics
Statistical analyses were performed using SPSS 26.0 (IBM, Chicago, IL, USA). Data are reported as mean (SD), unless stated otherwise. Analyses were performed for n = 59 unless otherwise specified. The distribution of sex across groups was determined by χ2 test. Differences between Y and O were tested by independent samples t-test. Group differences between O, TO, and IO were determined by means of a one-way analysis of variance followed by a post-hoc Tukey’s or a Kruskal–Wallis followed by Bonferroni correction, as appropriate.
GraphPad Prism version 8.02 for Windows was used for statistical analysis of the gait tasks (GraphPad Software Inc., La Jolla, California, USA). For the fixed-speed gait trials, mixed-effects models using the restricted maximum likelihood method with group (Y and O or O and TO) and walking speed (repeated measure: 0.4, 0.6, 0.8, 1.0, 1.2, 1.4, and 1.6 m/s) as factors were conducted for the mean gait parameters and their variability. This approach was taken to cope with a small number of missing data points that were excluded due to technical issues in processing the motion capture data (a total of 12 missing data points). For the perturbation trials, two-way repeated measures ANOVA with group (Y and O or O and TO) and step (repeated measures; Base, Pre, Post1-8) as factors were conducted for perturbations Pert1R, Pert2L, and Pert9L. Dunnett’s tests for multiple comparisons were used to compare the MoS for each step to the Base value to indicate for how many recovery steps were needed to return to values not significantly different to unperturbed walking and Sidak’s tests for multiple comparisons were used to compare the MoS between groups at the individual step level. Regarding the number of recovery steps required, Wilcoxon matched-pairs signed rank tests were used to test for differences between the perturbations with the groups and Mann-Whitney tests were used to compare the groups to each other. P < 0.05 was considered statistically significant. To assess associations between variables we conducted bivariate Pearson correlation and partial correlation analyses corrected for sex, age, and body mass index (BMI).
Results
Mitochondrial function and muscle health decrease with age
To assess the effect of age on mitochondrial function and muscle health we first compared young (Y) versus older (O) individuals with normal PA. Table 1
4
Niels_Proefschrift.indd 97Niels_Proefschrift.indd 97 08/12/2020 18:05:1708/12/2020 18:05:17

98
Chapter 4
summarizes the main participant characteristics. Average age was 24 years (3) for Y and 71 years (4) for O (p < 0.001). Sex distribution was identical between the two groups (8 male and 9 female participants in both groups, p > 0.999). O displayed an increased BMI (p = 0.007) and an increased body fat mass percentage (p = 0.007) as compared to Y. Fat free mass (FFM) was 52.17 kg (9.87) in Y and 49.54 kg (10.84) in O (p = 0.471). In line with the defined inclusion criteria, both age groups performed a comparable number of steps per day (10,075 steps/day (3,160) versus 9,983 steps/day (2,781)), in Y versus O respectively; p = 0.146) and showed no significant difference in time spent on HIPA or LIPA (p = 0.496 and p = 0.737 respectively) indicating comparable levels of physical activity in daily life between Y and O. Furthermore, no significant differences were observed in the balance test, the 4-meter walk test, and chair-stand test, assessed during screening as part of the SPPB (p > 0.05).
Table 1 – Participant body composition characteristics, physical activity, and physical function
Young (Y) Older adults (O)N 17 17Male (%)† 9 (52%) 9 (52%)Age (years) 24 (3)* 71 (4)BMI (kg/m2) 22.73 (2.88)* 25.80 (3.31)Fat mass (%) 24.41 (8.15)* 33.12 (9.23)Fat mass (kg) 16.80 (6.09)* 24.462 (7.87)Fat free mass (kg) 52.17 (9.87) 49.54 (10.84)Steps/day 9,983 (2,781) 10,207 (2,832)HIPA time/wake time (%) 2.2 (1.2) 2.2 (1.2)LIPA time/wake time (%) 11.4 (2.4) 11.7 (2.6)SPPB 4-m walk speed (m/s) 1.100 (0.202) 1.143 (0.161)SPPB Chair-stand test (s) 9.012 (2.56) 10.070 (1.430)
Data are presented as mean (SD) * Indicates significant difference between 2 groups (p < 0.05 independent sample t-test). † Sex distribution across groups was tested by χ2 test (p > 0.999). Body composition and physical activity could not be measured in one subject of the Y group due to implications of the SARS-CoV-19 crisis. Abbreviations: BMI, body mass index; HIPA, higher intensity physical activity: LIPA, lower intensity physical activity; SPPB, short physical performance battery.
Niels_Proefschrift.indd 98Niels_Proefschrift.indd 98 08/12/2020 18:05:1708/12/2020 18:05:17

99
Ageing and Skeletal Muscle and Mitochondrial Health
Reduced skeletal muscle functionality, strength, volume and endurance in older adults
During the 6MWT, O walked at a slower speed (Y 1.781 m/s (0.119) versus O 1.622 m/s (0.256), p = 0.032) and as a result, covered a ~10% shorter distance in comparison with Y (p = 0.032, Figure 1A). O also displayed a lower cardiorespiratory fitness as indicated by a ~35% lower maximal aerobic capacity (VO2max, corrected for fat free mass) in comparison with Y (p < 0.001, Figure 1B). Likewise, maximal power output was lower in O (2.941 W/kgFFM (0.456)) as compared to Y (4.185 (0.557) W/kgFFM, p < 0.001, Figure 1C). In addition, a lower isokinetic muscle strength was observed in older adults as compared to young (p < 0.001, Figure 1D and E). Muscle volume, measured in the upper leg my MRI, was comparable between young and older individuals (p = 0.151, Figure 1F), in accordance with a similar FFM between Y and O.
Comparable resting energy expenditure but reduced exercise efficiency in older adults
Besides maximal exercise capacity, we also assessed exercise efficiency and substrate utilization during a sub-maximal exercise test. REE was observed to be comparable between Y and O (p = 0.275, Figure 2A) and no differences were observed in respiratory exchange rate (RER) between Y and O, both when measured during the sub-maximal exercise (Y 0.864 (0.045) versus O 0.857 (0.039), p = 0.624, Figure 2B) and resting conditions (Y 0.806 (0.036) versus O 0.810 (0.054), p = 0.852, Figure 2B). Both GEE (~20%, p < 0.001) and NEE (~18%, p < 0.001) exercise efficiency were found to be lower in the O as compared to Y (Figure 2C and D).
4
Niels_Proefschrift.indd 99Niels_Proefschrift.indd 99 08/12/2020 18:05:1708/12/2020 18:05:17
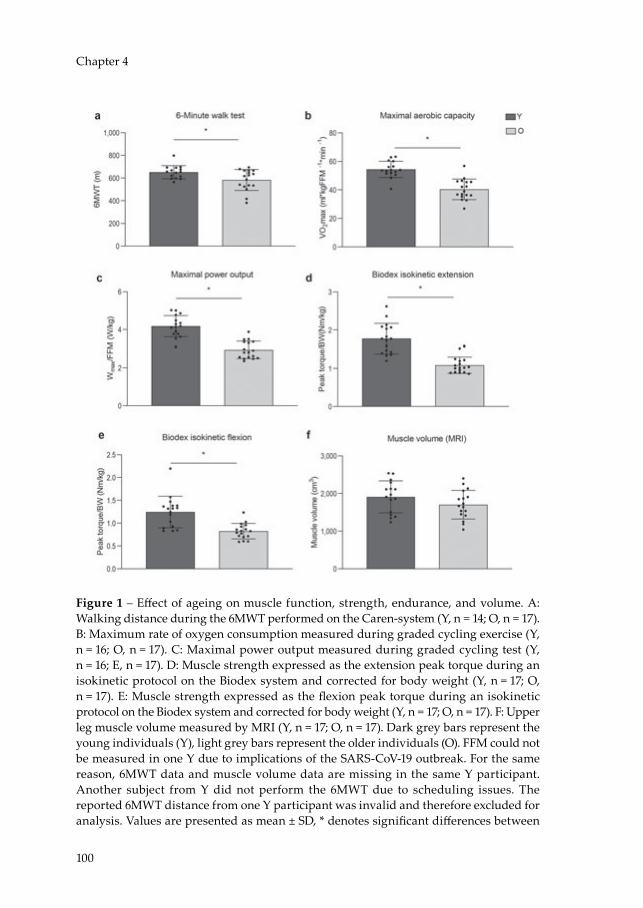
100
Chapter 4
Figure 1 – Effect of ageing on muscle function, strength, endurance, and volume. A: Walking distance during the 6MWT performed on the Caren-system (Y, n = 14; O, n = 17). B: Maximum rate of oxygen consumption measured during graded cycling exercise (Y, n = 16; O, n = 17). C: Maximal power output measured during graded cycling test (Y, n = 16; E, n = 17). D: Muscle strength expressed as the extension peak torque during an isokinetic protocol on the Biodex system and corrected for body weight (Y, n = 17; O, n = 17). E: Muscle strength expressed as the flexion peak torque during an isokinetic protocol on the Biodex system and corrected for body weight (Y, n = 17; O, n = 17). F: Upper leg muscle volume measured by MRI (Y, n = 17; O, n = 17). Dark grey bars represent the young individuals (Y), light grey bars represent the older individuals (O). FFM could not be measured in one Y due to implications of the SARS-CoV-19 outbreak. For the same reason, 6MWT data and muscle volume data are missing in the same Y participant. Another subject from Y did not perform the 6MWT due to scheduling issues. The reported 6MWT distance from one Y participant was invalid and therefore excluded for analysis. Values are presented as mean ± SD, * denotes significant differences between
Niels_Proefschrift.indd 100Niels_Proefschrift.indd 100 08/12/2020 18:05:1808/12/2020 18:05:18

101
Ageing and Skeletal Muscle and Mitochondrial Health
the two groups (p < 0.05, independent sample t-test). Abbreviations: 6MWT, 6-minute walking test; VO2max, maximal oxygen flow; Nm, newton meters; FFM, fat-free mass; BW, body weight.
Figure 2 – Effect of ageing on exercise efficiency, substrate selection, and resting metabolic rate in rest and upon exercise stimulation. A: Resting energy expenditure measured before submaximal exercise. B: Respiratory exchange rate measured before, in resting conditions, and during submaximal exercise. C: Gross exercise efficiency measured during a submaximal cycle test. D: Gross exercise efficiency corrected for resting energy expenditure and expressed as net exercise efficiency. Dark grey bars represent the young individuals (Y, n = 15); light grey bars represent older individuals (O, n = 17). One Y subject failed to complete the submaximal cycle test due to exhaustion. In another Y subject the test could not be performed due to implications of the SARS-CoV-19 outbreak. Values are presented as mean ± SD, * denotes significant differences between the two groups (p < 0.05, independent sample t-test).
Reduced metabolic muscle health and insulin sensitivity in older adults
To further characterize skeletal muscle health, insulin sensitivity was determined during a hyperinsulinemic-euglycemic clamp. During the clamp, the GIR required to maintain euglycemia, was ~19% lower in O in comparison with Y (p = 0.050, Figure 3A), suggesting a lower insulin sensitivity in O. To determine metabolic flexibility, the RER was measured in the fasted state and during the last
4
Niels_Proefschrift.indd 101Niels_Proefschrift.indd 101 08/12/2020 18:05:1808/12/2020 18:05:18
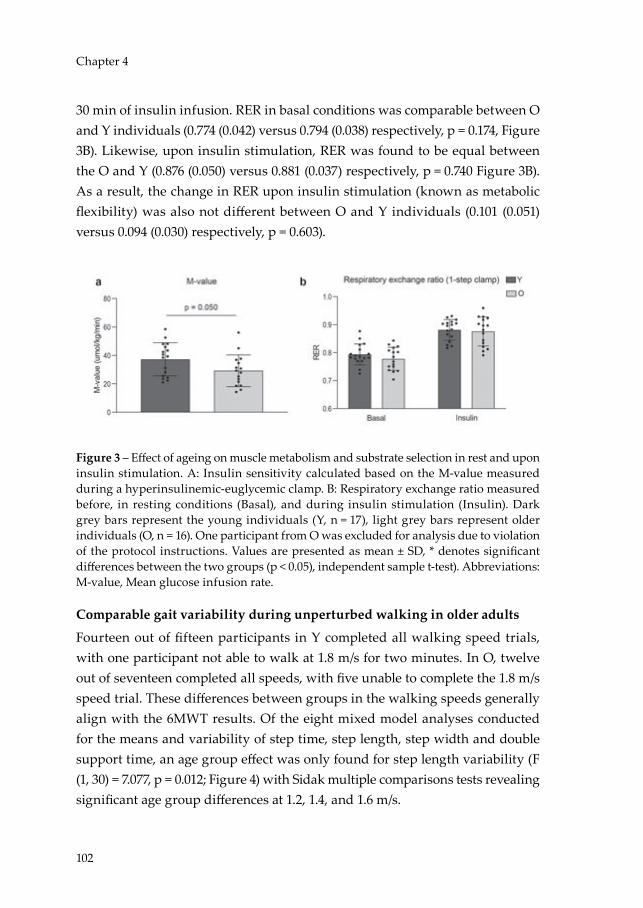
102
Chapter 4
30 min of insulin infusion. RER in basal conditions was comparable between O and Y individuals (0.774 (0.042) versus 0.794 (0.038) respectively, p = 0.174, Figure 3B). Likewise, upon insulin stimulation, RER was found to be equal between the O and Y (0.876 (0.050) versus 0.881 (0.037) respectively, p = 0.740 Figure 3B). As a result, the change in RER upon insulin stimulation (known as metabolic flexibility) was also not different between O and Y individuals (0.101 (0.051) versus 0.094 (0.030) respectively, p = 0.603).
Figure 3 – Effect of ageing on muscle metabolism and substrate selection in rest and upon insulin stimulation. A: Insulin sensitivity calculated based on the M-value measured during a hyperinsulinemic-euglycemic clamp. B: Respiratory exchange ratio measured before, in resting conditions (Basal), and during insulin stimulation (Insulin). Dark grey bars represent the young individuals (Y, n = 17), light grey bars represent older individuals (O, n = 16). One participant from O was excluded for analysis due to violation of the protocol instructions. Values are presented as mean ± SD, * denotes significant differences between the two groups (p < 0.05), independent sample t-test). Abbreviations: M-value, Mean glucose infusion rate.
Comparable gait variability during unperturbed walking in older adults
Fourteen out of fifteen participants in Y completed all walking speed trials, with one participant not able to walk at 1.8 m/s for two minutes. In O, twelve out of seventeen completed all speeds, with five unable to complete the 1.8 m/s speed trial. These differences between groups in the walking speeds generally align with the 6MWT results. Of the eight mixed model analyses conducted for the means and variability of step time, step length, step width and double support time, an age group effect was only found for step length variability (F (1, 30) = 7.077, p = 0.012; Figure 4) with Sidak multiple comparisons tests revealing significant age group differences at 1.2, 1.4, and 1.6 m/s.
Niels_Proefschrift.indd 102Niels_Proefschrift.indd 102 08/12/2020 18:05:1808/12/2020 18:05:18

103
Ageing and Skeletal Muscle and Mitochondrial Health
Figure 4 – Effect of ageing on gait variability. Panels on the left: Absolute values for of step time, step length, step with, and double support time at different walking speeds. Panels on the right: Coefficients of variation (CV) of step time, step length, step with, and double support time at different walking speeds. Dark grey bars represent the young individuals (Y, n = 14); light grey bars represent older individuals (O, n = 17). One Y participant was excluded due to issue in data collection and two Y participants were not measured (one due to technical issues and one due to SARS-CoV-19 restrictions). Values are presented as mean ± SD, * denotes significant differences between the two groups (p < 0.05).
Lower gait stability but comparable adaptability during balance disturbances in older adults
All participants were able to recover from the gait perturbations without harness assistance. We observed significant effects of age group on MoS for Pert1R but not for Pert2L and Pert9L (Pert1R: F(1, 28) = 7.7, p = 0.010; Pert2L: F(1, 29) = 0.6, p = 0.435; Pert9L: F(1, 29) = 0.001, p = 0.976) indicating that O initially perform poorer than Y, but the ability of O to adapt gait in response to repeated
4
Niels_Proefschrift.indd 103Niels_Proefschrift.indd 103 08/12/2020 18:05:1808/12/2020 18:05:18

104
Chapter 4
perturbations is intact. Significant step by age group interaction effects on MoS were found for Pert1R and Pert2L but not Pert9L (Pert1R: F(9, 252) = 6.3, p < 0.001; Pert2L: F(9, 261) = 3.539, p < 0.001; Pert9L: F(9, 261) = 1.413, p = 0.182), indicative of different age-related recovery stepping behaviour in the first two perturbations, but not in the ninth perturbation. For all perturbations, the O’s recovery steps, in comparison to those of Y, were more frequently different to Base, and these differences also occurred in later recovery steps (Figure 5A). The MoS in Post1 and Post2 in Pert1R and Post1 in Pert2L were significantly different (Figure 5A), indicating that the largest differences between Y and O at the step level occurred only in the first two perturbations and only immediately following the perturbations.
Following Pert1R, Pert2L, and Pert9L, Y required 5.7 recovery steps (1.8), 5.7 recovery steps (1.6), and 3.6 recovery steps (2.1) respectively (Figure 5B). Following the same perturbations, O required 6.2 recovery steps (2.4), 6.2 recovery steps (2.1), and 4.2 recovery steps (2.1) respectively (Figure 5B). Both Y and O required significantly fewer recovery steps during Pert9L than both Pert1R and Pert2L (Figure 5B). No significant group differences on number of recovery steps for each perturbation were observed.
Reduced ex vivo and in vivo mitochondrial function in older adults
Skeletal muscle mitochondrial capacity was determined both ex vivo in permeabilized muscle fibres and in vivo via non-invasive assessment of PCr recovery rates using 31P-MRS. In permeabilized muscle fibres, mitochondrial state 2 respiration (i.e., respiration in the presence of substrate alone) was similar between Y and O on most substrate combinations, apart from malate + octanoyl-carnitine, which showed lower respiration rates in older individuals (MO, p = 0.044, Figure 6A). ADP-stimulated (state 3) respiration, fuelled by complex I-linked substrates (malate + glutamate, MG, p = 0.032, Figure 6B), was lower in O whereas state 3 respiration upon a lipid substrate (MO, Figure 6C) was not significantly different between Y and O (p > 0.05). ADP-stimulated respiration upon parallel electron input to both Complex I and II was also found to be lower in O compared to Y. Thus, state 3 respiration upon malate + octanoyl-carnitine + glutamate (MOG, p = 0.014, Figure 6D), malate + octanoyl-carnitine + glutamate + succinate (MOGS, p = 0.006, Figure 6D) and malate + glutamate + succinate (MGS, p = 0.077, Figure 6D) was ~12-17% lower in O as compared
Niels_Proefschrift.indd 104Niels_Proefschrift.indd 104 08/12/2020 18:05:1908/12/2020 18:05:19

105
Ageing and Skeletal Muscle and Mitochondrial Health
to Y, although the latter did not reach statistical significance. Maximal FCCP-induced uncoupled respiration, reflecting the maximal capacity of the electron transport chain, was ~21% lower in O compared to Y (p = 0.008, Figure 6E). State 4o respiration, reflecting mitochondrial proton leak, was similar between the Y and O (p = 0.379, Figure 6F). The negligible increase in oxygen consumption upon cytochrome C (2.30 % (3.24) versus 2.27 % (2.26) in Y versus O, respectively) underscores the viability and quality of the muscle fibres and was similar in both groups (p = 0.976).
Assessment of in vivo mitochondrial function revealed a ~19% lower PCr recovery rate constant in O as compared to Y (p = 0.003, Figure 6G), further confirming a decreased mitochondrial oxidative capacity in O. The exercise-induced PCr depletion and pH were similar between Y and O (p > 0.05) and pH remained above 6.9 indicating no substantial exercise-induced acidification.
4
Niels_Proefschrift.indd 105Niels_Proefschrift.indd 105 08/12/2020 18:05:1908/12/2020 18:05:19
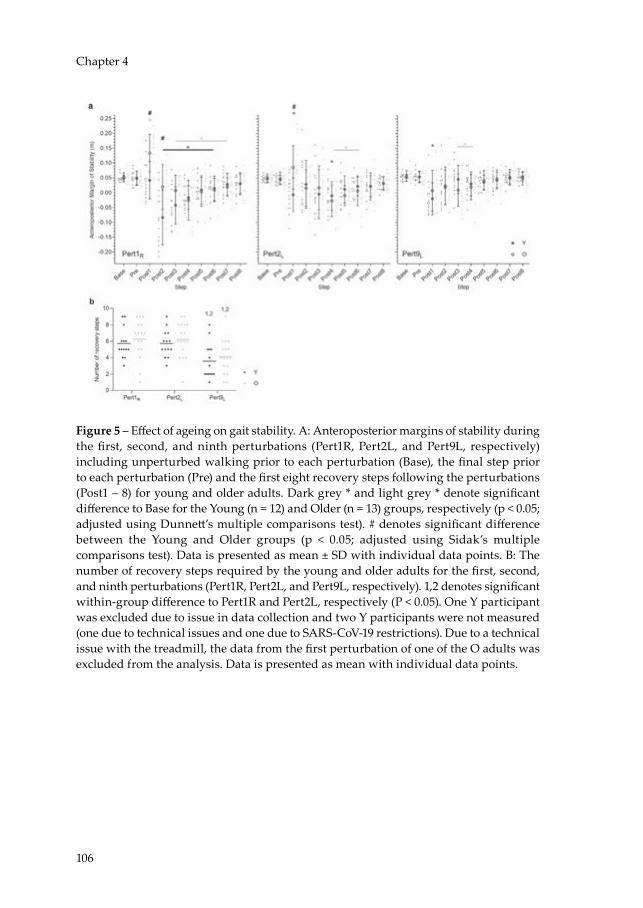
106
Chapter 4
Figure 5 – Effect of ageing on gait stability. A: Anteroposterior margins of stability during the first, second, and ninth perturbations (Pert1R, Pert2L, and Pert9L, respectively) including unperturbed walking prior to each perturbation (Base), the final step prior to each perturbation (Pre) and the first eight recovery steps following the perturbations (Post1 – 8) for young and older adults. Dark grey * and light grey * denote significant difference to Base for the Young (n = 12) and Older (n = 13) groups, respectively (p < 0.05; adjusted using Dunnett’s multiple comparisons test). # denotes significant difference between the Young and Older groups (p < 0.05; adjusted using Sidak’s multiple comparisons test). Data is presented as mean ± SD with individual data points. B: The number of recovery steps required by the young and older adults for the first, second, and ninth perturbations (Pert1R, Pert2L, and Pert9L, respectively). 1,2 denotes significant within-group difference to Pert1R and Pert2L, respectively (P < 0.05). One Y participant was excluded due to issue in data collection and two Y participants were not measured (one due to technical issues and one due to SARS-CoV-19 restrictions). Due to a technical issue with the treadmill, the data from the first perturbation of one of the O adults was excluded from the analysis. Data is presented as mean with individual data points.
Niels_Proefschrift.indd 106Niels_Proefschrift.indd 106 08/12/2020 18:05:1908/12/2020 18:05:19

107
Ageing and Skeletal Muscle and Mitochondrial Health
Figure 6 – Effect of ageing on skeletal muscle mitochondrial energetics. A: Mitochondrial respiration upon substrates only (state 2). B: State 3 respiration fuelled by Complex I-linked substrates C: ADP-stimulated respiration (state 3) upon a lipid substrate. D: Maximal ex vivo state 3 respiration upon parallel electron input into Complex II and I. E: Maximal uncoupled respiration. F: Mitochondrial respiration uncoupled from ATP synthesis (state 4o). G: 31P-MRS in vivo assessment of mitochondrial oxidative capacity (κ). Dark grey bars represent the young individuals (Y, n = 15); light grey bars represent older individuals (O, n = 16). One biopsy in Y is missing due technical issues and another
4
Niels_Proefschrift.indd 107Niels_Proefschrift.indd 107 08/12/2020 18:05:1908/12/2020 18:05:19
108
Chapter 4
Y biopsy due to implications of the SARS-CoV-19 outbreak. For the latter reason, also PCr recovery data is missing in the same Y participant. PCr data from one O has been excluded from analysis due to a pH decline below 6.9. PCr data from a Y participant has been excluded due to issues regarding the analysis. Values are presented as mean ± SD, * denotes significant differences between the two groups (p < 0.05, independent sample t-test). Abbreviations: M = malate; O = octanoyl-carnitine; G = glutamate; S = succinate; κ = phosphocreatine resynthesis rate constant.
Mitochondrial function and muscle health are affected by exercise training and physical impairment
Next, we compared muscle function and mitochondrial capacity of O with a normal physical activity to TO as well as to IO (n = 6). Table 2 summarizes the main participant characteristics of the three older groups. Sex distribution was shown to be comparable across the groups (p = 0.982). Average age was 71 years (4) for the O, 72 years (5) for IO, whereas TO were slightly younger at 68 years (2) in comparison with O (p = 0.023). In accordance with their training status, TO displayed a lower BMI and a lower body fat mass percentage as compared to both O (p = 0.046 and p = 0.050, respectively) and IO (p = 0.024 and p = 0.021, respectively). Average FFM was 49.54 kg (10.84) in O, 50.68 kg (9.66) in TO, and 49.61 kg (10.84) in IO and comparable (p > 0.05) between the groups. TO displayed a higher average step count per day as compared to O (p = 0.050) and IO (p = 0.004), further underscoring their active lifestyle. TO also spent a significantly higher proportion of their waking time at HIPA compared to O (p = 0.049) and IO (p = 0.005). The proportion of waking time spent at a LIPA was similar between TO and O and between TO and IO (p > 0.05), but higher in O compared to IO (p = 0.038). As anticipated, IO performed significantly poorer on the chair-stand test as compared to O (p = 0.015) and TO (p = 0.001). Walking speed during the 4-meter walk test was also lower in IO when compared to TO (p = 0.009) but not to O (p = 0.227).
Increased skeletal muscle function, strength, volume, and endurance in trained older adults
During the 6MWT, IO displayed the slowest walking speed (1.270 m/s (0.368)), which was significantly different from both O and TO (1.622 m/s (0.256), p = 0.013 and 1.700 m/s (0.460), p = 0.005, respectively), and hence IO covered a ~22% shorter distance compared to the O group (p = 0.013, Figure 7A) and a ~30% shorter distance compared to the TO group (p = 0.005, Figure 7A). Not surprisingly, TO displayed the highest cardiorespiratory fitness levels as exemplified by an
Niels_Proefschrift.indd 108Niels_Proefschrift.indd 108 08/12/2020 18:05:1908/12/2020 18:05:19
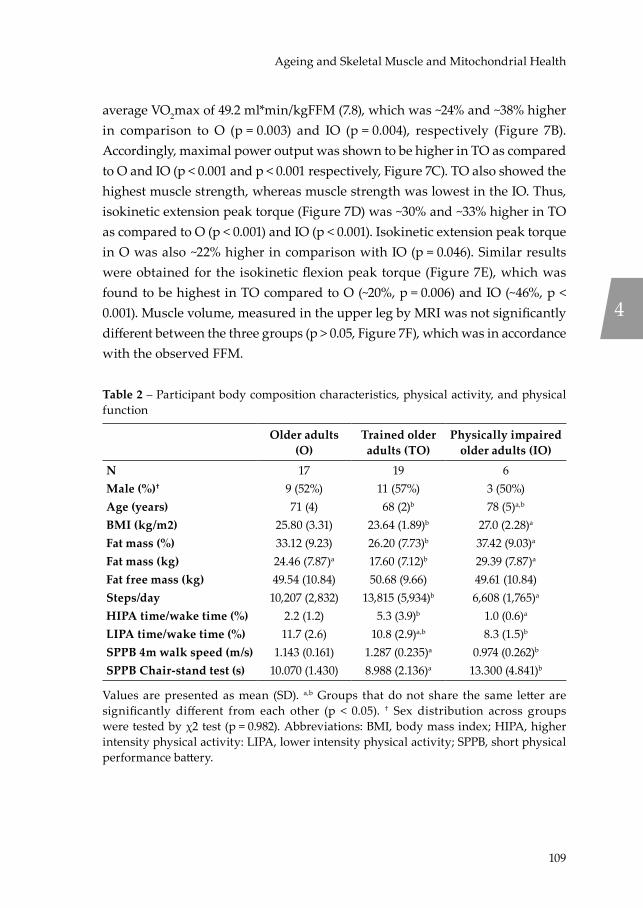
109
Ageing and Skeletal Muscle and Mitochondrial Health
average VO2max of 49.2 ml*min/kgFFM (7.8), which was ~24% and ~38% higher in comparison to O (p = 0.003) and IO (p = 0.004), respectively (Figure 7B). Accordingly, maximal power output was shown to be higher in TO as compared to O and IO (p < 0.001 and p < 0.001 respectively, Figure 7C). TO also showed the highest muscle strength, whereas muscle strength was lowest in the IO. Thus, isokinetic extension peak torque (Figure 7D) was ~30% and ~33% higher in TO as compared to O (p < 0.001) and IO (p < 0.001). Isokinetic extension peak torque in O was also ~22% higher in comparison with IO (p = 0.046). Similar results were obtained for the isokinetic flexion peak torque (Figure 7E), which was found to be highest in TO compared to O (~20%, p = 0.006) and IO (~46%, p < 0.001). Muscle volume, measured in the upper leg by MRI was not significantly different between the three groups (p > 0.05, Figure 7F), which was in accordance with the observed FFM.
Table 2 – Participant body composition characteristics, physical activity, and physical function
Older adults (O)
Trained older adults (TO)
Physically impaired older adults (IO)
N 17 19 6Male (%)† 9 (52%) 11 (57%) 3 (50%)Age (years) 71 (4) 68 (2)b 78 (5)a,b
BMI (kg/m2) 25.80 (3.31) 23.64 (1.89)b 27.0 (2.28)a
Fat mass (%) 33.12 (9.23) 26.20 (7.73)b 37.42 (9.03)a
Fat mass (kg) 24.46 (7.87)a 17.60 (7.12)b 29.39 (7.87)a
Fat free mass (kg) 49.54 (10.84) 50.68 (9.66) 49.61 (10.84)Steps/day 10,207 (2,832) 13,815 (5,934)b 6,608 (1,765)a
HIPA time/wake time (%) 2.2 (1.2) 5.3 (3.9)b 1.0 (0.6)a
LIPA time/wake time (%) 11.7 (2.6) 10.8 (2.9)a,b 8.3 (1.5)b
SPPB 4m walk speed (m/s) 1.143 (0.161) 1.287 (0.235)a 0.974 (0.262)b
SPPB Chair-stand test (s) 10.070 (1.430) 8.988 (2.136)a 13.300 (4.841)b
Values are presented as mean (SD). a,b Groups that do not share the same letter are significantly different from each other (p < 0.05). † Sex distribution across groups were tested by χ2 test (p = 0.982). Abbreviations: BMI, body mass index; HIPA, higher intensity physical activity: LIPA, lower intensity physical activity; SPPB, short physical performance battery.
4
Niels_Proefschrift.indd 109Niels_Proefschrift.indd 109 08/12/2020 18:05:2008/12/2020 18:05:20
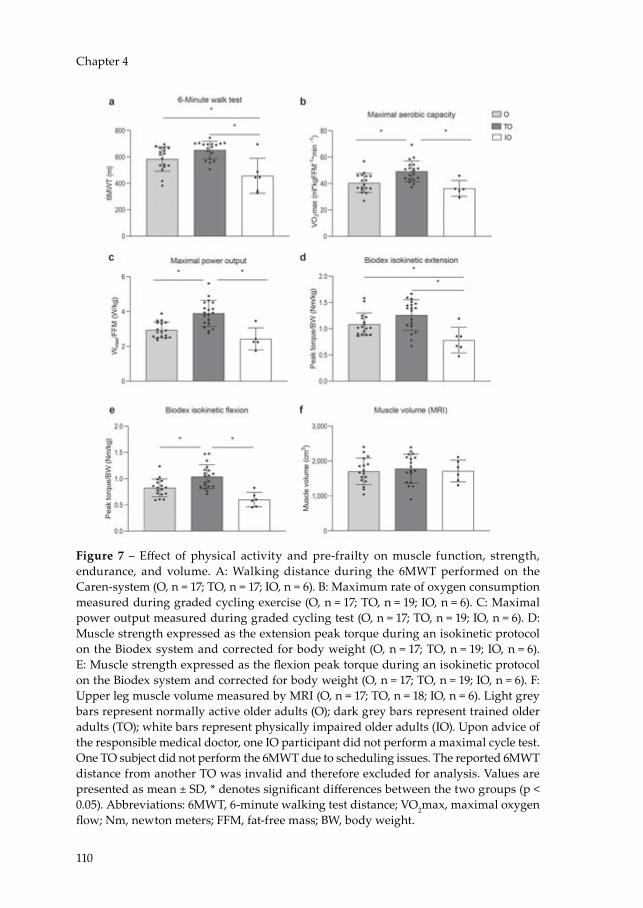
110
Chapter 4
Figure 7 – Effect of physical activity and pre-frailty on muscle function, strength, endurance, and volume. A: Walking distance during the 6MWT performed on the Caren-system (O, n = 17; TO, n = 17; IO, n = 6). B: Maximum rate of oxygen consumption measured during graded cycling exercise (O, n = 17; TO, n = 19; IO, n = 6). C: Maximal power output measured during graded cycling test (O, n = 17; TO, n = 19; IO, n = 6). D: Muscle strength expressed as the extension peak torque during an isokinetic protocol on the Biodex system and corrected for body weight (O, n = 17; TO, n = 19; IO, n = 6). E: Muscle strength expressed as the flexion peak torque during an isokinetic protocol on the Biodex system and corrected for body weight (O, n = 17; TO, n = 19; IO, n = 6). F: Upper leg muscle volume measured by MRI (O, n = 17; TO, n = 18; IO, n = 6). Light grey bars represent normally active older adults (O); dark grey bars represent trained older adults (TO); white bars represent physically impaired older adults (IO). Upon advice of the responsible medical doctor, one IO participant did not perform a maximal cycle test. One TO subject did not perform the 6MWT due to scheduling issues. The reported 6MWT distance from another TO was invalid and therefore excluded for analysis. Values are presented as mean ± SD, * denotes significant differences between the two groups (p < 0.05). Abbreviations: 6MWT, 6-minute walking test distance; VO2max, maximal oxygen flow; Nm, newton meters; FFM, fat-free mass; BW, body weight.
Niels_Proefschrift.indd 110Niels_Proefschrift.indd 110 08/12/2020 18:05:2008/12/2020 18:05:20

111
Ageing and Skeletal Muscle and Mitochondrial Health
Increased exercise efficiency but comparable resting metabolic rate in trained older adults
REE was comparable across the three groups (p > 0.05, Figure 8A) and the resting RER was also similar between the groups (p > 0.05, Figure 8B). Furthermore, during the 1-hour sub-maximal cycling test at 50% of Wmax, no differences were observed in RER in TO as compared to O and IO (TO: 0.863 (0.035) versus O: 0.857 (0.039) versus IO: 0.853 (0.048), p > 0.05, Figure 8B). Nevertheless, TO showed a ~13% higher gross exercise efficiency in comparison to O (p = 0.001, Figure 8C) and a ~22% higher gross exercise efficiency in comparison with IO (p < 0001, Figure 8C). Likewise, the net exercise efficiency (Figure 8D) was ~10% and ~17% higher in TO compared to both O (p = 0.006) and IO (p = 0.002).
Figure 8 – Effect of physical activity and pre-frailty on exercise efficiency and substrate selection upon exercise stimulation. A) Resting energy expenditure measured before submaximal exercise. B) Respiratory exchange rate measured before, in resting conditions, and during submaximal exercise. C) Gross exercise efficiency during a submaximal cycle test. D Gross exercise efficiency corrected for resting energy expenditure and expressed as net efficiency (NE). Light grey bars represent normally active older adults (O, n = 17); dark grey bars represent trained older adults (TO, n = 19); white bars represent physically impaired older adults (IO, n = 5). Upon advice of the responsible medical doctor, one IO participant did not perform a submaximal cycle test. Values are presented as mean ± SD, * denotes significant differences between two groups (p < 0.05).
4
Niels_Proefschrift.indd 111Niels_Proefschrift.indd 111 08/12/2020 18:05:2008/12/2020 18:05:20

112
Chapter 4
Increased metabolic health and insulin sensitivity in trained older adults
Glucose infusion rate during the clamp was ~24% higher in TO when compared to O (p = 0.023, Figure 9A), indicating that TO were more insulin sensitive. Substrate utilization, as assessed by the RER, was comparable between TO and O, both in the basal state (0.775 (0.027) versus 0.775 (0.042) respectively, p > 0.05, Figure 9B) and upon insulin stimulation (0.890 (0.040) versus 0.876 (0.050), respectively, p > 0.05, Figure 9B). As a result, metabolic flexibility was also comparable between TO and O (0.112 (0.039) versus 0.101 (0.051) respectively, p > 0.05).
Figure 9 – Effect of physical activity on muscle metabolism and substrate selection upon insulin stimulation. A) Insulin sensitivity calculated based on the M-value measured during a hyperinsulinemic-euglycemic clamp. B) Respiratory exchange ratio measured before, in resting conditions (Basal), and during insulin stimulation (Insulin). Light grey bars represent normally active older adults (O, n = 16); dark grey bars represent trained older adults (TO, n = 19). Because only 3 IO participants could undergo the hyperinsulinemic-euglycemic clamp, these results were not considered. One O participant was excluded for analysis due to violation of the protocol instructions. Values are presented as mean ± SD, * denotes significant differences between the two groups (p < 0.05). Abbreviations: M-value, Mean glucose infusion rate.
Comparable gait variability during unperturbed walking in trained older adults
In O, twelve out of seventeen completed all speeds, with five unable to complete the 1.8 m/s speed. Of TO, all eighteen participants could complete all speeds. For IO, one participant completed all speeds, one completed all speeds except 1.8 m/s, two reached 1.4 m/s, and one reached 1.2 m/s. These differences between groups in the walking speeds achieved generally align with the 6MWT results. Of the eight mixed model analyses conducted for the means and variability of step time, step length, step width and double support time, no significant effect of group (O vs. TO) was found (Figure 10).
Niels_Proefschrift.indd 112Niels_Proefschrift.indd 112 08/12/2020 18:05:2008/12/2020 18:05:20
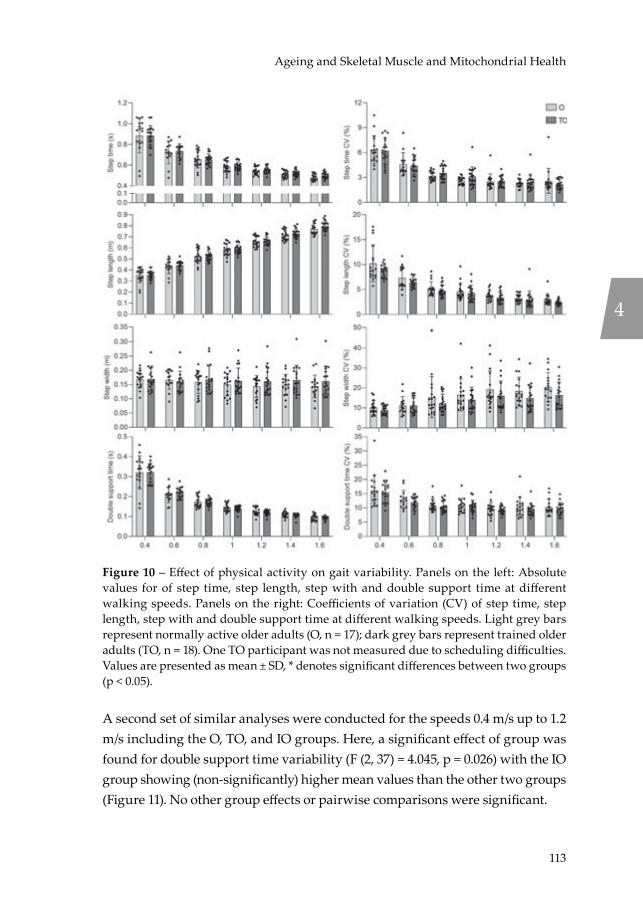
113
Ageing and Skeletal Muscle and Mitochondrial Health
Figure 10 – Effect of physical activity on gait variability. Panels on the left: Absolute values for of step time, step length, step with and double support time at different walking speeds. Panels on the right: Coefficients of variation (CV) of step time, step length, step with and double support time at different walking speeds. Light grey bars represent normally active older adults (O, n = 17); dark grey bars represent trained older adults (TO, n = 18). One TO participant was not measured due to scheduling difficulties. Values are presented as mean ± SD, * denotes significant differences between two groups (p < 0.05).
A second set of similar analyses were conducted for the speeds 0.4 m/s up to 1.2 m/s including the O, TO, and IO groups. Here, a significant effect of group was found for double support time variability (F (2, 37) = 4.045, p = 0.026) with the IO group showing (non-significantly) higher mean values than the other two groups (Figure 11). No other group effects or pairwise comparisons were significant.
4
Niels_Proefschrift.indd 113Niels_Proefschrift.indd 113 08/12/2020 18:05:2008/12/2020 18:05:20
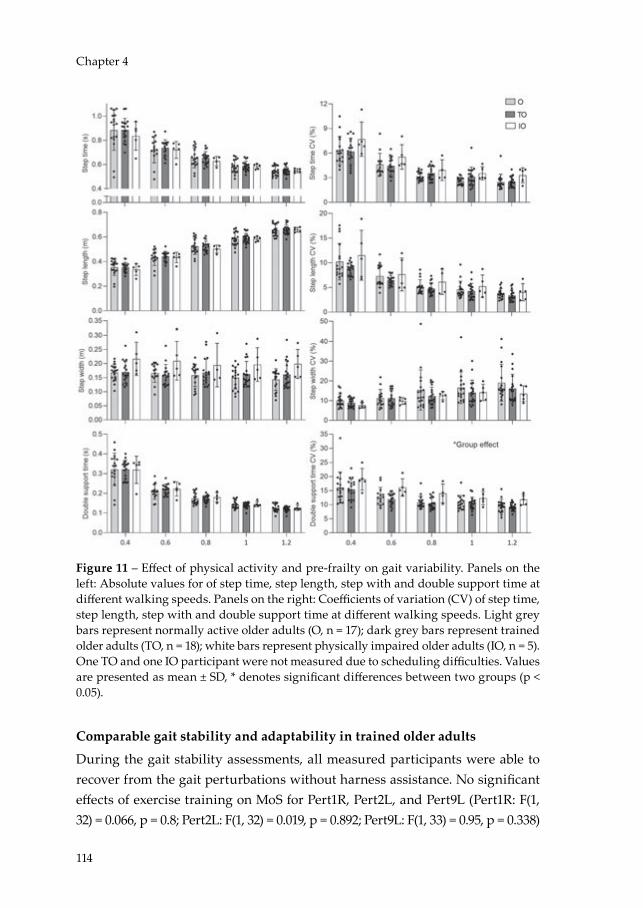
114
Chapter 4
Figure 11 – Effect of physical activity and pre-frailty on gait variability. Panels on the left: Absolute values for of step time, step length, step with and double support time at different walking speeds. Panels on the right: Coefficients of variation (CV) of step time, step length, step with and double support time at different walking speeds. Light grey bars represent normally active older adults (O, n = 17); dark grey bars represent trained older adults (TO, n = 18); white bars represent physically impaired older adults (IO, n = 5). One TO and one IO participant were not measured due to scheduling difficulties. Values are presented as mean ± SD, * denotes significant differences between two groups (p < 0.05).
Comparable gait stability and adaptability in trained older adults
During the gait stability assessments, all measured participants were able to recover from the gait perturbations without harness assistance. No significant effects of exercise training on MoS for Pert1R, Pert2L, and Pert9L (Pert1R: F(1, 32) = 0.066, p = 0.8; Pert2L: F(1, 32) = 0.019, p = 0.892; Pert9L: F(1, 33) = 0.95, p = 0.338)
Niels_Proefschrift.indd 114Niels_Proefschrift.indd 114 08/12/2020 18:05:2108/12/2020 18:05:21

115
Ageing and Skeletal Muscle and Mitochondrial Health
were observed. No significant step by group interaction effects on MoS were found for Pert1R, Pert2L, or Pert9L (Pert1R: F(9, 288) = 0.62, p = 0.784; Pert2L: F(9, 288) = 0.88, p = 0.544; Pert9L: F(9, 297) = 1.64, p = 0.102). These results indicate no significant stability or stepping behaviour difference between the three groups. The MoS for each step to the Base indicated that O and TO required 7 and 8 recovery steps, respectively to return to MoS values not significantly different to Base in Pert1R whereas only 5 and 3 recovery steps, respectively were required in Pert9L (Figure 12A). No significant differences in MoS between the groups at step level were observed.
Following Pert1R, Pert2L, and Pert9L, O required 6.2 recovery steps (2.4), 6.2 recovery steps (2.1), and 4.2 recovery steps (2.1), respectively (Figure 12B). Following the same perturbations, TO required 6.1 recovery steps (2.2), 5.2 recovery steps (2.1), and 4.4 recovery steps (2.5), respectively (Figure 12B). O required significantly fewer recovery steps during Pert9L than both Pert1R and Pert2L, while TO required significantly fewer recovery steps during Pert9L than Pert1R (Figure 12B). No significant group differences on number of recovery steps for each perturbation were revealed. Three participants of the IO group started and completed the perturbation trial, with three IO participants unable to walk fast enough to maintain the stability-normalised walking speed. Therefore, they were not included in the previous analyses. Following Pert1R, Pert2L, and Pert9L, IO required 7.6, 6.0, and 4.6 recovery steps, respectively, with all three IO participants reducing their number of required recovery steps.
4
Niels_Proefschrift.indd 115Niels_Proefschrift.indd 115 08/12/2020 18:05:2108/12/2020 18:05:21

116
Chapter 4
Figure 12 – Effect of physical activity on gait stability. A) Anteroposterior margins of stability during the first, second, and ninth perturbations (Pert1R, Pert2L, and Pert9L, respectively) including unperturbed walking prior to each perturbation (Base), the final step prior to each perturbation (Pre) and the first eight recovery steps following the perturbations (Post1 – 8) for normally active older and trained older adults. Dark grey * and light grey * denote significant difference to Base for the O (n = 13) and TO (n = 15) groups, respectively (p < 0.05; adjusted using Dunnett’s multiple comparisons test). Data is presented as mean ± SD with individual data points. B) The number of recovery steps (means and individual values) required by the normally active older and trained older adults for the first, second and ninth perturbations (Pert1R, Pert2L, and Pert9L, respectively). 1,2 denotes significant within-group difference to Pert1R and Pert2L, respectively (p < 0.05). One TO participant was not measured due to scheduling difficulties. Due to a technical issue with the treadmill, the data from the first perturbation of one of the O participants and from the second perturbation of one of the TO participants were excluded from the analyses. Data is presented as mean with individual data points.
Increased mitochondrial function in trained older adults
In permeabilized muscle fibres, mitochondrial state 2 respiration was significantly higher in the TO individuals compared to O on all of the substrate combinations studied (Figure 13A, p < 0.05). Also, ADP-stimulated (state 3) respiration on complex I-linked substrates as well as a lipid substrate was higher in TO compared to O. Thus, state 3 respiration fuelled by malate + glutamate (MG) and malate + octanoylcarnitine (MO) were both ~29% higher in the TO group as
Niels_Proefschrift.indd 116Niels_Proefschrift.indd 116 08/12/2020 18:05:2108/12/2020 18:05:21
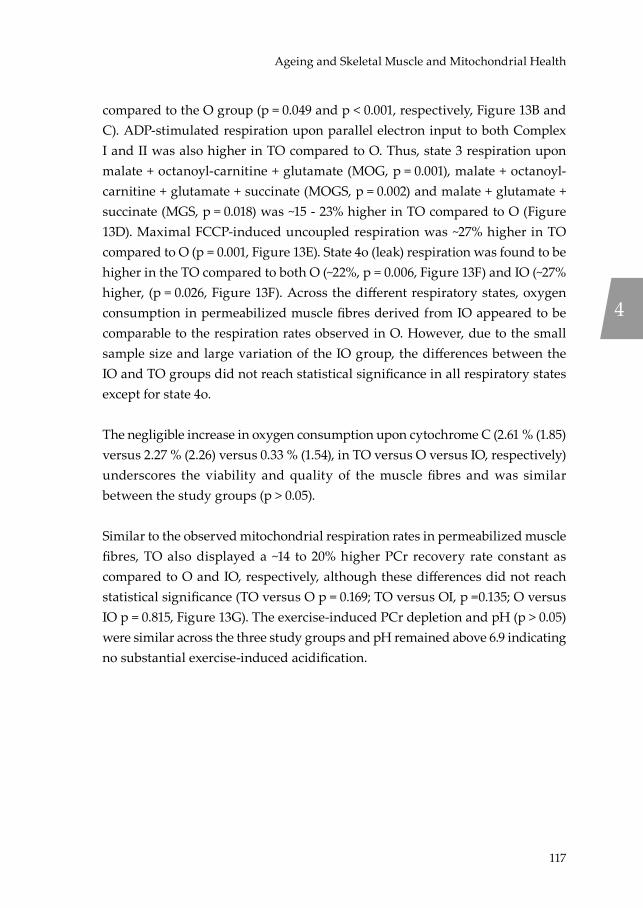
117
Ageing and Skeletal Muscle and Mitochondrial Health
compared to the O group (p = 0.049 and p < 0.001, respectively, Figure 13B and C). ADP-stimulated respiration upon parallel electron input to both Complex I and II was also higher in TO compared to O. Thus, state 3 respiration upon malate + octanoyl-carnitine + glutamate (MOG, p = 0.001), malate + octanoyl-carnitine + glutamate + succinate (MOGS, p = 0.002) and malate + glutamate + succinate (MGS, p = 0.018) was ~15 - 23% higher in TO compared to O (Figure 13D). Maximal FCCP-induced uncoupled respiration was ~27% higher in TO compared to O (p = 0.001, Figure 13E). State 4o (leak) respiration was found to be higher in the TO compared to both O (~22%, p = 0.006, Figure 13F) and IO (~27% higher, (p = 0.026, Figure 13F). Across the different respiratory states, oxygen consumption in permeabilized muscle fibres derived from IO appeared to be comparable to the respiration rates observed in O. However, due to the small sample size and large variation of the IO group, the differences between the IO and TO groups did not reach statistical significance in all respiratory states except for state 4o.
The negligible increase in oxygen consumption upon cytochrome C (2.61 % (1.85) versus 2.27 % (2.26) versus 0.33 % (1.54), in TO versus O versus IO, respectively) underscores the viability and quality of the muscle fibres and was similar between the study groups (p > 0.05).
Similar to the observed mitochondrial respiration rates in permeabilized muscle fibres, TO also displayed a ~14 to 20% higher PCr recovery rate constant as compared to O and IO, respectively, although these differences did not reach statistical significance (TO versus O p = 0.169; TO versus OI, p =0.135; O versus IO p = 0.815, Figure 13G). The exercise-induced PCr depletion and pH (p > 0.05) were similar across the three study groups and pH remained above 6.9 indicating no substantial exercise-induced acidification.
4
Niels_Proefschrift.indd 117Niels_Proefschrift.indd 117 08/12/2020 18:05:2108/12/2020 18:05:21
118
Chapter 4
Figure 13 – Effect of physical activity and pre-frailty on skeletal muscle mitochondrial energetics. A-F: Ex vivo mitochondrial respiration (O, n = 16; TO, n = 19; IO, n = 6). A) Mitochondrial respiration upon substrates only (state 2). B) State 3 respiration fuelled by Complex I-linked substrates. C) ADP-stimulated respiration (state 3) upon a lipid substrate. D) Maximal ex vivo state 3 respiration upon parallel electron input into Complex I and II. E) Maximal uncoupled respiration. F) Mitochondrial respiration uncoupled from ATP synthesis (state 4o). G) In vivo 31P-MRS estimate of mitochondrial oxidative capacity κ (O, n = 16; TO, n = 18; IO, n = 6). Light grey bars represent normally active older adults (O); dark grey bars represent trained older adults (TO); white bars represent physically
Niels_Proefschrift.indd 118Niels_Proefschrift.indd 118 08/12/2020 18:05:2108/12/2020 18:05:21

119
Ageing and Skeletal Muscle and Mitochondrial Health
impaired older adults (IO). PCr data from one O participant has been excluded from analysis due to a pH decline below 6.9. PCr from a TO participant has been excluded due to issues regarding the analysis. Values are presented as mean ± SE, * denotes significant differences between two groups (p < 0.05). Abbreviations: M, malate; O, octanoyl-carnitine; G, glutamate; S, succinate; κ = phosphocreatine resynthesis rate constant.
Mitochondrial function, muscle health and exercise efficiency are related
To further explore the relationship between mitochondrial energetics, muscle quality and physical function, correlations were performed based on the combined data from the entire study cohort. Pearson correlation outcomes are summarized in Table 3 and illustrated in Figure 14. As anticipated, correlations were observed between the different measures for mitochondrial function and oxidative capacity (ex vivo respiration, in vivo PCr recovery rate, and VO2max). Furthermore, measures for ex vivo mitochondrial capacity – but not in vivo PCr recovery rate - were found to significantly correlate with 6MWT, isokinetic extension isokinetic flexion, M-value, and steps per day as a marker for walking performance, muscle strength, insulin sensitivity, and physical activity levels (Table 3, Figure 14A-C). Moreover, ex vivo mitochondrial coupled respiration rates were found to correlate significantly with GEE (Table 3, Figure 14D). Interestingly, GEE and NEE showed the strongest correlations with multiple aspects of muscle health including endurance, physical function, muscle strength, insulin sensitivity and PA, as illustrated by the significant correlations with VO2max, 6MWT, the chair-stand test, isokinetic extension, M-value, and steps per day (Table 3, Figure 14E-F).
4
Niels_Proefschrift.indd 119Niels_Proefschrift.indd 119 08/12/2020 18:05:2108/12/2020 18:05:21

120
Chapter 4
Figure 14 – Bivariate correlations between energetics and physical muscle function. A) Correlation between muscle strength and ex vivo maximal coupled mitochondrial respiration. B) Correlation physical activity and ex vivo mitochondrial function. C) Correlation between insulin sensitivity and maximal coupled mitochondrial respiration. D) Correlation between gross exercise efficiency and in vivo PCr recovery rate. E) Correlation between gross exercise efficiency and maximal coupled mitochondrial respiration 6MWT. F) Correlation between gross exercise efficiency and SPPB chair-stand
Niels_Proefschrift.indd 120Niels_Proefschrift.indd 120 08/12/2020 18:05:2208/12/2020 18:05:22
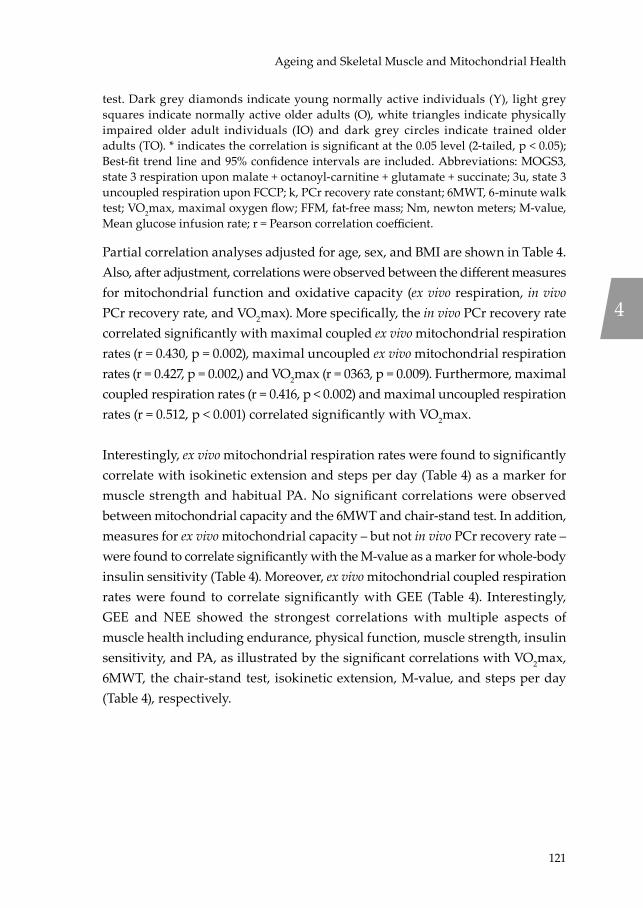
121
Ageing and Skeletal Muscle and Mitochondrial Health
test. Dark grey diamonds indicate young normally active individuals (Y), light grey squares indicate normally active older adults (O), white triangles indicate physically impaired older adult individuals (IO) and dark grey circles indicate trained older adults (TO). * indicates the correlation is significant at the 0.05 level (2-tailed, p < 0.05); Best-fit trend line and 95% confidence intervals are included. Abbreviations: MOGS3, state 3 respiration upon malate + octanoyl-carnitine + glutamate + succinate; 3u, state 3 uncoupled respiration upon FCCP; k, PCr recovery rate constant; 6MWT, 6-minute walk test; VO2max, maximal oxygen flow; FFM, fat-free mass; Nm, newton meters; M-value, Mean glucose infusion rate; r = Pearson correlation coefficient.
Partial correlation analyses adjusted for age, sex, and BMI are shown in Table 4. Also, after adjustment, correlations were observed between the different measures for mitochondrial function and oxidative capacity (ex vivo respiration, in vivo PCr recovery rate, and VO2max). More specifically, the in vivo PCr recovery rate correlated significantly with maximal coupled ex vivo mitochondrial respiration rates (r = 0.430, p = 0.002), maximal uncoupled ex vivo mitochondrial respiration rates (r = 0.427, p = 0.002,) and VO2max (r = 0363, p = 0.009). Furthermore, maximal coupled respiration rates (r = 0.416, p < 0.002) and maximal uncoupled respiration rates (r = 0.512, p < 0.001) correlated significantly with VO2max.
Interestingly, ex vivo mitochondrial respiration rates were found to significantly correlate with isokinetic extension and steps per day (Table 4) as a marker for muscle strength and habitual PA. No significant correlations were observed between mitochondrial capacity and the 6MWT and chair-stand test. In addition, measures for ex vivo mitochondrial capacity – but not in vivo PCr recovery rate – were found to correlate significantly with the M-value as a marker for whole-body insulin sensitivity (Table 4). Moreover, ex vivo mitochondrial coupled respiration rates were found to correlate significantly with GEE (Table 4). Interestingly, GEE and NEE showed the strongest correlations with multiple aspects of muscle health including endurance, physical function, muscle strength, insulin sensitivity, and PA, as illustrated by the significant correlations with VO2max, 6MWT, the chair-stand test, isokinetic extension, M-value, and steps per day (Table 4), respectively.
4
Niels_Proefschrift.indd 121Niels_Proefschrift.indd 121 08/12/2020 18:05:2208/12/2020 18:05:22

122
Chapter 4Ta
ble
3 –
Biva
riat
e an
alys
is to
exp
lore
the
rela
tions
hips
bet
wee
n en
erge
tics
and
phys
ical
mus
cle
func
tion
Mea
sure
men
tV
aria
bles
6MW
T (m
)† C
hair
-st
and
test
(s)
VO
2max
(m
l*m
in/
kgFF
M)
Isok
inet
ic
exte
nsio
n (N
m/k
g)
Isok
inet
ic
flexi
on
(Nm
/kg)
M-v
alue
(μ
mol
/kg
/min
)
Step
s/da
yG
ross
ex
erci
se
effici
ency
(%)
Mito
chon
dria
l fu
nctio
nM
axim
al c
oupl
ed re
spir
atio
n M
OG
S3 (p
mol
/(s*m
g))
r0.
335*
-0.11
10.
436*
0.49
5*0.
316*
0.37
9*0.
326*
0.34
5*p
0.01
50.
415
0.00
2<0
.001
0.01
80.
006
0.01
40.
011
Max
imal
unc
oupl
ed
resp
irat
ion
(pm
ol/(s
*mg)
)r
0.31
0*-0
.146
0.51
2*0.
546*
0.35
6*0.
407*
0.37
2*0.
402*
p0.
025
0.28
2<0
.001
<0.0
010.
007
0.00
30.
005
0.00
3PC
r rec
over
y ra
te (1
/s)r
0.24
0-0
.075
0.48
2*0.
225*
0.16
40.
228
0.25
80.
315
p0.
090
0.58
70.
001
0.09
90.
231
0.10
80.
057
0.02
1Ex
erci
se
effici
ency
Gro
ss e
xerc
ise
effici
ency
(%)
r0.
679*
-0.4
85*
0.71
1*0.
364*
0.47
5*0.
495*
0.26
8*
p<0
.001
<0.0
01<0
.001
0.00
6<0
.001
<0.0
010.
046
Net
exe
rcis
e effi
cien
cy (%
)r
0.59
6*0.
454*
0.62
3*0.
275*
0.35
9*0.
480*
0.20
7p
<0.0
01<0
.001
<0.0
010.
040
0.00
7<0
.001
0.12
7
Dat
a ar
e fr
om a
ll fo
ur g
roup
s (to
tal n
> 5
1). *
Indi
cate
s th
e co
rrel
atio
n is
sig
nific
ant (
2-ta
iled,
p <
0.0
5); † I
ndic
ates
var
iabl
es th
at w
ere
log
tran
sfor
med
. Abb
revi
atio
ns: M
OG
S3, s
tate
3 r
espi
ratio
n up
on m
alat
e +
octa
noyl
-car
niti
ne +
glu
tam
ate
+ su
ccin
ate;
6M
WT,
6-m
inut
e w
alk
test
; VO
2max
, max
imal
oxy
gen
flow
; FFM
, fat
-fre
e m
ass;
Nm
, new
ton
met
ers;
M-v
alue
, Mea
n gl
ucos
e in
fusi
on ra
te, r
= P
ears
on c
orre
latio
n co
effici
ent.
Niels_Proefschrift.indd 122Niels_Proefschrift.indd 122 08/12/2020 18:05:2208/12/2020 18:05:22
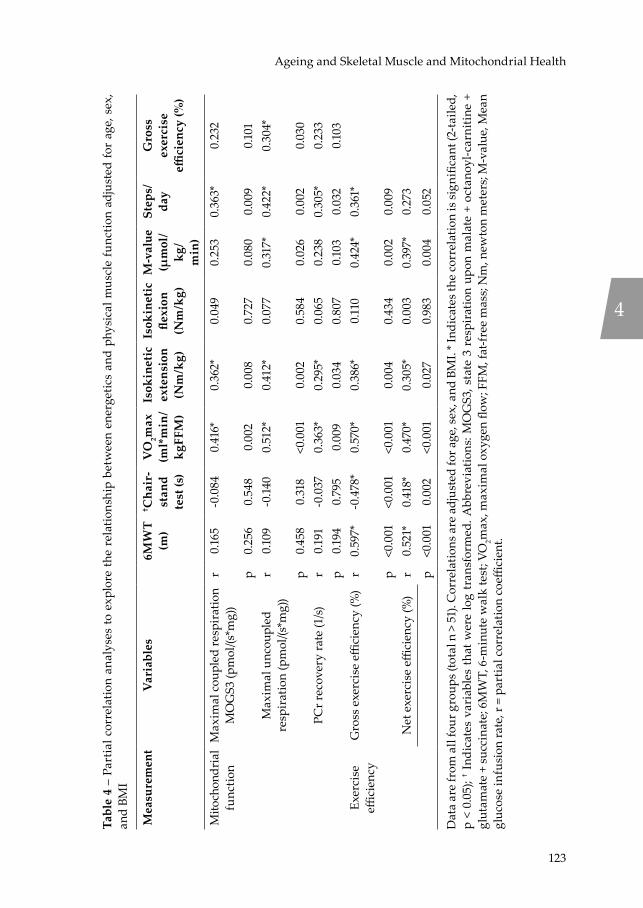
123
Ageing and Skeletal Muscle and Mitochondrial Health
Tabl
e 4
– Pa
rtia
l cor
rela
tion
anal
yses
to e
xplo
re t
he r
elat
ions
hip
betw
een
ener
getic
s an
d ph
ysic
al m
uscl
e fu
nctio
n ad
just
ed fo
r ag
e, s
ex,
and
BMI
Mea
sure
men
tV
aria
bles
6MW
T (m
)† C
hair
-st
and
test
(s)
VO
2max
(m
l*m
in/
kgFF
M)
Isok
inet
ic
exte
nsio
n (N
m/k
g)
Isok
inet
ic
flexi
on
(Nm
/kg)
M-v
alue
(μ
mol
/kg
/m
in)
Step
s/da
yG
ross
ex
erci
se
effici
ency
(%)
Mito
chon
dria
l fu
nctio
nM
axim
al c
oupl
ed re
spir
atio
n M
OG
S3 (p
mol
/(s*m
g))
r0.
165
-0.0
840.
416*
0.36
2*0.
049
0.25
30.
363*
0.23
2
p0.
256
0.54
80.
002
0.00
80.
727
0.08
00.
009
0.10
1M
axim
al u
ncou
pled
re
spir
atio
n (p
mol
/(s*m
g))
r0.
109
-0.14
00.
512*
0.41
2*0.
077
0.31
7*0.
422*
0.30
4*
p0.
458
0.31
8<0
.001
0.00
20.
584
0.02
60.
002
0.03
0PC
r rec
over
y ra
te (1
/s)r
0.19
1-0
.037
0.36
3*0.
295*
0.06
50.
238
0.30
5*0.
233
p0.
194
0.79
50.
009
0.03
40.
807
0.10
30.
032
0.10
3Ex
erci
se
effici
ency
Gro
ss e
xerc
ise
effici
ency
(%)
r0.
597*
-0.4
78*
0.57
0*0.
386*
0.11
00.
424*
0.36
1*
p<0
.001
<0.0
01<0
.001
0.00
40.
434
0.00
20.
009
Net
exe
rcis
e effi
cien
cy (%
)r
0.52
1*0.
418*
0.47
0*0.
305*
0.00
30.
397*
0.27
3p
<0.0
010.
002
<0.0
010.
027
0.98
30.
004
0.05
2
Dat
a ar
e fr
om a
ll fo
ur g
roup
s (to
tal n
> 5
1). C
orre
latio
ns a
re a
djus
ted
for a
ge, s
ex, a
nd B
MI.
* Ind
icat
es th
e co
rrel
atio
n is
sign
ifica
nt (2
-taile
d,
p <
0.05
); † I
ndic
ates
var
iabl
es t
hat w
ere
log
tran
sfor
med
. Abb
revi
atio
ns: M
OG
S3, s
tate
3 r
espi
ratio
n up
on m
alat
e +
octa
noyl
-car
niti
ne +
gl
utam
ate
+ su
ccin
ate;
6M
WT,
6-m
inut
e w
alk
test
; VO
2max
, max
imal
oxy
gen
flow
; FFM
, fat
-fre
e m
ass;
Nm
, new
ton
met
ers;
M-v
alue
, Mea
n gl
ucos
e in
fusi
on ra
te, r
= p
artia
l cor
rela
tion
coeffi
cien
t.
4
Niels_Proefschrift.indd 123Niels_Proefschrift.indd 123 08/12/2020 18:05:2208/12/2020 18:05:22
124
Chapter 4
Discussion
Mitochondrial function has been shown to decline with age and may underlie the decline in muscle health during ageing. To understand the role of a reduced mitochondrial capacity in human ageing and its relationship with the age-associated decline in skeletal muscle health, we extensively characterised (mitochondrial) oxidative capacity as well as various aspects of skeletal muscle function in young and older adults with similar habitual PA. Additionally, the relationships between mitochondrial function and clinically relevant assessments of muscle metabolism and physical function were studied in a group of older adults with a range in habitual PA and physical functional. Briefly, we found that mitochondrial respiration as well as post-exercise PCr recovery rate, maximal aerobic capacity, gait stability after perturbation, exercise efficiency, muscle strength, insulin sensitivity, and certain aspects of muscle function were lower in older compared to younger subjects in the presence of similar habitual PA. In addition, exercise trained older subjects showed higher mitochondrial function, maximal aerobic capacity, exercise efficiency, muscle strength, and insulin sensitivity compared to older adults with normal PA.
The impact of ageing and physical activity on physical function and muscle quality
In this study, the young and older adult groups both averaged approximately 10,000 steps daily, indicating reasonable overall levels of physical activity for a healthy adult (49). Despite similar habitual PA, we observed a lower walking performance and maximal aerobic capacity in the older adults compared to the young adults. These finding are in line with a previous observation from a study comparing adults < 65 years and > 65 years, which observed the peak VO2 and 400 m gait speed to be lower with higher age (6). With an average of more than 12,500 steps per day, the trained older participants in the current study are considered to be highly physically active, whereas physically impaired older adults averaged less than 7,500 steps/day, reflecting a sedentary lifestyle (49). The differences in PA between the groups of older adults translated to walking performance and maximal aerobic capacity, confirming previous evidence (7,23,50) and supporting the notion that at advanced age, increasing PA can help to preserve physical function and performance.
Niels_Proefschrift.indd 124Niels_Proefschrift.indd 124 08/12/2020 18:05:2208/12/2020 18:05:22

125
Ageing and Skeletal Muscle and Mitochondrial Health
We could not detect a statistical difference in muscle volume between young and older adults with similar levels of habitual PA, indicating that habitual PA may be an important factor in the age-associated loss in muscle volume that has been observed previously (51–53). In our study, however, training status did not affect muscle volume in older adults, although this may be explained by the fact that particularly endurance trained athletes were included and endurance training has a smaller probability to improve lean mass compared to strength training (54). Despite the lack of a significant difference in muscle volume, muscle strength was lower in older subjects and differences in muscle strength corresponded to the habitual PA stratification applied to the three older adult groups, which is in agreement with previous comparisons between active and sedentary older adults (7,55).
The influence of chronological age and physical activity on exercise efficiency
A lower net exercise efficiency was observed in the older participants compared to young adults in the present study, underlining an increased energy expenditure during exercise in the presence of comparable resting metabolic rate. This observation is in line with findings from a recent study by Distefano et al. (7), showing a lower exercise efficiency in older adults when compared to young older adults with comparable levels of PA (~8,500 versus ~10,500 steps per day, respectively). Furthermore, our findings fit the impaired tolerance to high-intensity physical activity previously observed in older adults (56–58). A reduced exercise efficiency implies an increase in the energy expenditure of exercise, which likely contributes to impairments in exercise capacity and physical activity (56,59).
Findings of the present study show a relative difference of ~24% in exercise efficiency in the trained older adults compared to the older adults with normal PA. These results are in line with two previous studies suggesting that exercise training interventions have the potential to reverse these age-related changes by increasing exercise efficiency up to ~30% in sedentary (56) and endurance exercising volunteers (58). These findings are further confirmed by a cross-sectional study observing a higher exercise efficiency in athletic adults compared to sedentary older adults (23). Interestingly, mitochondrial function has been suggested to play a possible role in improving exercise efficiency in athletic older
4
Niels_Proefschrift.indd 125Niels_Proefschrift.indd 125 08/12/2020 18:05:2208/12/2020 18:05:22

126
Chapter 4
adult populations by allowing conservation of energy at moderate workloads (23,59).
The influence of chronological age and physical activity on insulin sensitivity
Although several studies have reported a decline in insulin sensitivity with advancing age (60,61), other studies indicate that age per se is not a major determinant of insulin sensitivity, but rather obesity and physical inactivity (62–65). In the present study, insulin sensitivity was lower in older adults compared to the young controls, despite a similar PA. Besides chronological age, we can however not rule out a contribution of body composition to the lower insulin sensitivity, since BMI was significantly higher in the older adults as compared to the young individuals. In the older groups, higher levels of insulin sensitivity were observed in the trained group. These results underscore the ability of physical exercise to improve insulin sensitivity and glucose uptake, also at an older age (66,67), however these results may be influenced by differences in BMI between the older adult groups. Metabolic flexibility, the degree to which the body can switch between carbohydrate and lipid oxidation, as assessed during the hyperinsulinemic-euglycemic clamp was found to be equal between young and old which is in contrast with some previous findings (68). Possibly, changes in metabolic flexibility with advancing age are primarily due to the associated decline in habitual PA across young and old, as previously reviewed (69). Interestingly, insulin sensitivity as well as habitual PA were reasonably high in the cohort of the present study.
The impact of chronological age and physical activity on gait stability
Older adults responded in a less effective manner to the first perturbation when compared to the young participants, underlining the higher risk of falls is this population (8), even when PA is comparable. This observation confirms numerous other studies demonstrating age-related differences in the ability to cope with such perturbations (70–73). This might suggest that an increasing fall risk with age cannot be entirely attributed to a decrease in physical activity as is often assumed, as PA was comparable in this study between young and older adults. That being said, during unperturbed walking, most spatiotemporal parameters and their variability were not affected by age, indicating that perhaps steady state walking is more readily preserved with physical activity. Although this only
Niels_Proefschrift.indd 126Niels_Proefschrift.indd 126 08/12/2020 18:05:2208/12/2020 18:05:22
127
Ageing and Skeletal Muscle and Mitochondrial Health
seems to be confirmed to a certain extent so far, as the trained older adults in the current study did not have significantly different unperturbed gait outcomes than the normally active older adults. One previous study reported in a mixed group of older and younger adults that those who were recreational runners performed better on a forward falling task than the non-active participants (74). This pattern was not observed in the current study, as there were no clear differences between the TO and O groups on the perturbation tasks. It could be argued that this may be partly due to the fact that the O group actually had quite a high habitual PA but this did not seem to result in a lack of difference to the young adults. Another possibility is that the current gait perturbation task, which is more dynamic and in which it is practically impossible to predict and prepare for the perturbations, is simply more complex than the ‘forward lean and release task’ in such a way that high levels of physical activity do not benefit the performance of the task as much.
Adaptability following repeated gait perturbations to improve stability was observed to be preserved in older adults with normal PA when compared to young adults. Furthermore, both the O and TO groups significantly reduced their required recovery steps by the ninth perturbation. These results confirm many previous reports of adaptability to gait perturbations being preserved at older age and reinforcing the potential value of perturbation-based balance training in this population (44,75–77). It does appear, however, that high levels of physical activity in older participants are not necessarily of direct benefit to adaptability to perturbations. This might reflect the fact that adaptability to such tasks relies on intact sensory and nervous systems and only when these systems are disrupted does adaptability to perturbations seem to reduce (78).
The impact of chronological age and physical activity on mitochondrial function
In the current study, we found that both in vivo PCr recovery rate and ex vivo mitochondrial respiration in skeletal muscle was lower in older adults when compared to young. It is important to note that these two groups displayed a similar habitual PA. These findings are in contrast with previous observations by Distefano et al. (7) who found no chronological age effect on in vivo and ex vivo mitochondrial function in young and older adults with comparable levels of PA. This discrepancy could be explained by differences in the study design.
4
Niels_Proefschrift.indd 127Niels_Proefschrift.indd 127 08/12/2020 18:05:2208/12/2020 18:05:22

128
Chapter 4
The present study had greater power and better gender balance, as we included 9 male and 8 female volunteers in both groups whilst Distefano et al. included 8 male and 2 female participants in each group, which could hinder to reveal the age differences in mitochondrial function. Moreover, the findings of the present study are supported by the age-related decline the mitochondrial ATP production rate (MAPR) observed in young and older adults who both exercised for less than 30 min a week (17,63). An even more prominent age-related decline in MARP was observed comparing young and older adults who were similarly endurance-trained (63) further hinting towards an independent, ageing-induced decline in skeletal muscle mitochondrial function.
Interestingly, ex vivo ADP-stimulated mitochondrial respiration in permeabilized muscle fibres was ~17 % lower in older adults when compared to young adults; whereas trained older adults displayed a ~23 % higher respiration in comparison to older adults with normal PA. These findings support the retainment of skeletal muscle plasticity in response to exercise with ageing and indicate that mitochondrial respiratory function can be preserved through exercise (7,63). In contrast with ex vivo assessed mitochondrial respiration results, in vivo mitochondrial function, assessed by the PCr recovery rate, was not found to be different between the older adult groups. This discrepancy could be explained by the fact that 31P-MRS may be sensitive to limiting systemic factors such as adequate perfusion and oxygen delivery during and after exercise (79), and other characteristics of the microenvironment. Alternatively, we could be limited by insufficient power in this analysis for this parameter.
We did not observe a difference in either ex vivo or in vivo skeletal muscle mitochondrial capacity in physically impaired older individuals as compared to healthy older adults with normal PA. Due to the small sample size of this group, however, these outcomes should be interpreted with caution. Nevertheless, in a similarly small group of 7 pre-frail older adults, St-Jean-Pelletier et al. (80) also did not observe a specific skeletal muscle phenotype of pre-frailty.
Mitochondrial function associates with muscle quality and physical function
To further explore the relation between mitochondrial oxidative capacity and multiple aspects of muscle health, we subjected the entire cohort of the
Niels_Proefschrift.indd 128Niels_Proefschrift.indd 128 08/12/2020 18:05:2308/12/2020 18:05:23

129
Ageing and Skeletal Muscle and Mitochondrial Health
present study (n = 59) to correlative analyses. We found that besides ex vivo mitochondrial capacity also in vivo mitochondrial function measures associate with muscle strength and maximal aerobic capacity which further supports that mitochondrial energetics are likely important factors in loss of muscle quality with ageing. Similar results have recently been found by Distefano et al. (7) and Gonzalez-Freire in vivo (81). Interestingly, we found that GEE and NEE correlate strongly with muscle strength and physical function parameters such as the 6MWT and the chair-stand test. Maximal uncoupled mitochondrial respiration correlated with GEE, suggesting that the electron transport chain capacity is linked to exercise efficiency. Moreover, maximal uncoupled mitochondrial respiration was found to correlate positively with insulin sensitivity, further supporting evidence for the potential role of mitochondrial dysfunction in insulin resistance (60), as seen in metabolic disease such as T2DM (61).
We acknowledge that this study is susceptible to limitations. The characteristics of the different study groups revealed small but significant differences in BMI and body composition across the groups and these factors have been suggested to also influence skeletal muscle mitochondrial capacity (24,82). However, it should be noted that these latter findings were obtained in obese versus lean populations with much larger differences in BMI, questioning their relevance for the minor differences in BMI observed in the present study. In addition, due to recruitment difficulties, this study included only a few participants with a lower physical function, resulting in reduced power in these analyses.
Taken together, our results suggest that ageing is associated with a low in vivo and ex vivo mitochondrial capacity, maximal aerobic capacity, exercise efficiency, gait stability, muscle strength, insulin sensitivity and physical function, despite similar habitual physical activity. Maintaining a higher physical activity through regular exercise training partially protects against these age-related declines in (mitochondrial) oxidative capacity and muscle health. Finally, we showed that mitochondrial capacity was positively correlated with muscle strength, exercise efficiency and insulin sensitivity, supporting the idea that mitochondria represent competent therapeutic target to negate the ageing-associated deterioration of skeletal muscle health in order to preserve physical function and performance.
4
Niels_Proefschrift.indd 129Niels_Proefschrift.indd 129 08/12/2020 18:05:2308/12/2020 18:05:23

130
Chapter 4
Supplemental Table S1 – Study outline
Screening Visit #1Week 1
Visit #2Week 2
Visit #3Week 3
Visit #4Week 4
Visit #5Week 5
Medical questionnaire
1-step hyperinsulinemic-euglycemic clamp
6MWT (Caren)
Body-composition
(BodPod)
Resting metabolic
rate
Muscle volume (MRI)
Physical examination
VO2max cycle test
Dynamic balance test
(Caren)
Muscle biopsy
In vivo PCr recovery(31P-MRS)
Physical function
assessment
31P-MRS pre-test
Muscle strength (Biodex)
Ex vivo respirometry
Submaximal cycle test
Visit #1 consisted of a 1-step hyperinsulinemic-euglycemic clamp. On Visit #2, participants completed a 6-minute walk test (6MWT) and a VO2max measurement. Furthermore, an ActivPAL accelerometer was provided to determine free living physical activity over a period of 5 days. On Visit #3, participants completed a body composition measurement, a dynamic balance test, and quadriceps strength tests. On study Visit #4, fasting blood samples were drawn, and resting energy expenditure was determined by indirect calorimetry followed by the muscle biopsy procedure. Participants then completed the submaximal exercise test on a cycle ergometer followed. On Visit #5, participants completed the magnetic resonance imaging (MRI) and 31P magnetic resonance spectroscopy (MRS).
Niels_Proefschrift.indd 130Niels_Proefschrift.indd 130 08/12/2020 18:05:2308/12/2020 18:05:23
131
Ageing and Skeletal Muscle and Mitochondrial Health
References1. Beard JR, Officer A, de Carvalho IA, Sadana R, Pot AM, Michel J-P, et al. The World
report on ageing and health: a policy framework for healthy ageing. The Lancet. 2016 May;387(10033):2145–54.
2. Vaupel JW. Biodemography of human ageing. Nature. 2010 Mar;464(7288):536–42.3. Rodrigues R, Huber M, Lamura G. Facts and Figures on Healthy Ageing and
Long-term Care. Europe and North America, Occasional Reports Series 8 Vienna: European Centre. 2012;
4. Roubenoff R. Sarcopenia and its implications for the elderly. Eur J Clin Nutr. 2000 Jun;54(S3):S40–7.
5. Janssen I, Heymsfield SB, Ross R. Low Relative Skeletal Muscle Mass (Sarcopenia) in Older Persons Is Associated with Functional Impairment and Physical Disability. Journal of the American Geriatrics Society. 2002 May;50(5):889–96.
6. Choi S, Reiter DA, Shardell M, Simonsick EM, Studenski S, Spencer RG, et al. 31 P Magnetic Resonance Spectroscopy Assessment of Muscle Bioenergetics as a Predictor of Gait Speed in the Baltimore Longitudinal Study of Aging. GERONA. 2016 Dec;71(12):1638–45.
7. Distefano G, Standley RA, Zhang X, Carnero EA, Yi F, Cornnell HH, et al. Physical activity unveils the relationship between mitochondrial energetics, muscle quality, and physical function in older adults: Mitochondria, muscle quality and physical function in aging. Journal of Cachexia, Sarcopenia and Muscle. 2018 Apr;9(2):279–94.
8. Talbot LA, Musiol RJ, Witham EK, Metter EJ. Falls in young, middle-aged and older community dwelling adults: perceived cause, environmental factors and injury. BMC Public Health. 2005 Dec;5(1):86.
9. Gadelha AB, Neri SGR, Bottaro M, Lima RM. The relationship between muscle quality and incidence of falls in older community-dwelling women: An 18-month follow-up study. Experimental Gerontology. 2018 Sep;110:241–6.
10. Fried LP, Tangen CM, Walston J, Newman AB, Hirsch C, Gottdiener J, et al. Frailty in Older Adults: Evidence for a Phenotype. The Journals of Gerontology Series A: Biological Sciences and Medical Sciences. 2001 Mar 1;56(3):M146–57.
11. Crescenzo R, Bianco F, Mazzoli A, Giacco A, Liverini G, Iossa S. Skeletal Muscle Mitochondrial Energetic Efficiency and Aging. IJMS. 2015 May 11;16(12):10674–85.
12. dos Santos L, Cyrino ES, Antunes M, Santos DA, Sardinha LB. Sarcopenia and physical independence in older adults: the independent and synergic role of muscle mass and muscle function: Sarcopenia and physical independence in older adults. Journal of Cachexia, Sarcopenia and Muscle. 2017 Apr;8(2):245–50.
13. Terroso M, Rosa N, Torres Marques A, Simoes R. Physical consequences of falls in the elderly: a literature review from 1995 to 2010. Eur Rev Aging Phys Act. 2014 Apr;11(1):51–9.
14. Gonzalez-Freire M, de Cabo R, Bernier M, Sollott SJ, Fabbri E, Navas P, et al. Reconsidering the Role of Mitochondria in Aging. GERONA. 2015 Nov;70(11):1334–42.
15. López-Otín C, Blasco MA, Partridge L, Serrano M, Kroemer G. The Hallmarks of Aging. Cell. 2013 Jun;153(6):1194–217.
4
Niels_Proefschrift.indd 131Niels_Proefschrift.indd 131 08/12/2020 18:05:2308/12/2020 18:05:23

132
Chapter 4
16. Boffoli D, Scacco SC, Vergari R, Solarino G, Santacroce G, Papa S. Decline with age of the respiratory chain activity in human skeletal muscle. Biochimica et Biophysica Acta (BBA) - Molecular Basis of Disease. 1994 Apr 12;1226(1):73–82.
17. Short KR, Bigelow ML, Kahl J, Singh R, Coenen-Schimke J, Raghavakaimal S, et al. Decline in skeletal muscle mitochondrial function with aging in humans. Proceedings of the National Academy of Sciences. 2005 Apr 12;102(15):5618–23.
18. Joseph A-M, Adhihetty PJ, Buford TW, Wohlgemuth SE, Lees HA, Nguyen LM-D, et al. The impact of aging on mitochondrial function and biogenesis pathways in skeletal muscle of sedentary high- and low-functioning elderly individuals: Mitochondrial function in elderly individuals. Aging Cell. 2012 Oct;11(5):801–9.
19. Jang YC, Lustgarten MS, Liu Y, Muller FL, Bhattacharya A, Liang H, et al. Increased superoxide in vivo accelerates age-associated muscle atrophy through mitochondrial dysfunction and neuromuscular junction degeneration. FASEB J. 2010 May;24(5):1376–90.
20. Wanagat J, Cao Z, Pathare P, Aiken JM. Mitochondrial DNA deletion mutations colocalize with segmental electron transport system abnormalities, muscle fiber atrophy, fiber splitting, and oxidative damage in sarcopenia. The FASEB Journal. 2001;15(2):322–32.
21. Coen PM, Jubrias SA, Distefano G, Amati F, Mackey DC, Glynn NW, et al. Skeletal Muscle Mitochondrial Energetics Are Associated With Maximal Aerobic Capacity and Walking Speed in Older Adults. The Journals of Gerontology: Series A. 2013 Apr;68(4):447–55.
22. Zane AC, Reiter DA, Shardell M, Cameron D, Simonsick EM, Fishbein KW, et al. Muscle strength mediates the relationship between mitochondrial energetics and walking performance. Aging Cell. 2017 Jun;16(3):461–8.
23. Broskey NT, Boss A, Fares E-J, Greggio C, Gremion G, Schlüter L, et al. Exercise efficiency relates with mitochondrial content and function in older adults. Physiol Rep. 2015 Jun;3(6):e12418.
24. Distefano G, Standley RA, Dubé JJ, Carnero EA, Ritov VB, Stefanovic-Racic M, et al. Chronological Age Does not Influence Ex-vivo Mitochondrial Respiration and Quality Control in Skeletal Muscle. GERONA. 2016 Jun 20;glw102.
25. Larsen S, Hey-Mogensen M, Rabøl R, Stride N, Helge JW, Dela F. The influence of age and aerobic fitness: effects on mitochondrial respiration in skeletal muscle. Acta Physiol (Oxf). 2012 Jul;205(3):423–32.
26. Guralnik JM, Simonsick EM, Ferrucci L, Glynn RJ, Berkman LF, Blazer DG, et al. A short physical performance battery assessing lower extremity function: association with self-reported disability and prediction of mortality and nursing home admission. J Gerontol. 1994 Mar;49(2):M85-94.
27. DeFronzo RA, Tobin JD, Andres R. Glucose clamp technique: a method for quantifying insulin secretion and resistance. Am J Physiol. 1979 Sep;237(3):E214-223.
28. Steele R. Influences of glucose loading and of injected insulin on hepatic glucose output. Ann N Y Acad Sci. 1959 Sep 25;82:420–30.
29. Kuipers H, Verstappen FTJ, Keizer HA, Geurten P, van Kranenburg G. Variability of Aerobic Performance in the Laboratory and Its Physiologic Correlates. Int J Sports Med. 2008 Mar 14;06(04):197–201.
30. Tudor-Locke C, Craig CL, Brown WJ, Clemes SA, De Cocker K, Giles-Corti B, et al. How many steps/day are enough? for adults. Int J Behav Nutr Phys Act. 2011;8(1):79.
Niels_Proefschrift.indd 132Niels_Proefschrift.indd 132 08/12/2020 18:05:2308/12/2020 18:05:23

133
Ageing and Skeletal Muscle and Mitochondrial Health
31. van der Berg JD, Willems PJB, van der Velde JHPM, Savelberg HHCM, Schaper NC, Schram MT, et al. Identifying waking time in 24-h accelerometry data in adults using an automated algorithm. Journal of Sports Sciences. 2016 Oct;34(19):1867–73.
32. Dempster P, Aitkens S. A new air displacement method for the determination of human body composition. Med Sci Sports Exerc. 1995 Dec;27(12):1692–7.
33. Weir JB de V. New methods for calculating metabolic rate with special reference to protein metabolism. The Journal of Physiology. 1949 Aug 1;109(1–2):1–9.
34. Péronnet F, Massicotte D. Table of nonprotein respiratory quotient: an update. Can J Sport Sci. 1991 Mar;16(1):23–9.
35. Matomäki P, Linnamo V, Kyröläinen H. A Comparison of Methodological Approaches to Measuring Cycling Mechanical Efficiency. Sports Med - Open. 2019 Dec;5(1):23.
36. Bergström J, Hermansen L, Hultman E, Saltin B. Diet, Muscle Glycogen and Physical Performance. Acta Physiologica Scandinavica. 1967;71(2–3):140–50.
37. Boushel R, Gnaiger E, Schjerling P, Skovbro M, Kraunsøe R, Dela F. Patients with type 2 diabetes have normal mitochondrial function in skeletal muscle. Diabetologia. 2007 Mar 2;50(4):790–6.
38. Phielix E, Schrauwen-Hinderling VB, Mensink M, Lenaers E, Meex R, Hoeks J, et al. Lower Intrinsic ADP-Stimulated Mitochondrial Respiration Underlies In vivo Mitochondrial Dysfunction in Muscle of Male Type 2 Diabetic Patients. Diabetes. 2008 Nov 1;57(11):2943–9.
39. Schrauwen-Hinderling VB, Kooi ME, Hesselink MKC, Jeneson JAL, Backes WH, van Echteld CJA, et al. Impaired in vivo mitochondrial function but similar intramyocellular lipid content in patients with type 2 diabetes mellitus and BMI-matched control subjects. Diabetologia. 2007 Jan;50(1):113–20.
40. Kemp GJ, Radda GK. Quantitative interpretation of bioenergetic data from 31P and 1H magnetic resonance spectroscopic studies of skeletal muscle: an analytical review. Magn Reson Q. 1994 Mar;10(1):43–63.
41. Hof AL, Gazendam MGJ, Sinke WE. The condition for dynamic stability. Journal of Biomechanics. 2005 Jan;38(1):1–8.
42. McCrum C, Willems P, Karamanidis K, Meijer K. Stability-normalised walking speed: A new approach for human gait perturbation research. Journal of Biomechanics. 2019 Apr;87:48–53.
43. McCrum C, Karamanidis K, Willems P, Zijlstra W, Meijer K. Retention, savings and interlimb transfer of reactive gait adaptations in humans following unexpected perturbations. Commun Biol. 2018 Dec;1(1):230.
44. McCrum C, Karamanidis K, Grevendonk L, Zijlstra W, Meijer K. Older adults demonstrate interlimb transfer of reactive gait adaptations to repeated unpredictable gait perturbations. GeroScience. 2020 Feb;42(1):39–49.
45. Süptitz F, Catalá MM, Brüggemann G-P, Karamanidis K. Dynamic stability control during perturbed walking can be assessed by a reduced kinematic model across the adult female lifespan. Human Movement Science. 2013 Dec;32(6):1404–14.
46. R Core Team (2019). R: A language and environment for statistical computing. R Foundation for Statistical Computing, Vienna, Austria. [Internet]. [cited 2020 Sep 2]. Available from: https://www.r-project.org/
47. Zeni JA, Richards JG, Higginson JS. Two simple methods for determining gait events during treadmill and overground walking using kinematic data. Gait & Posture. 2008 May;27(4):710–4.
4
Niels_Proefschrift.indd 133Niels_Proefschrift.indd 133 08/12/2020 18:05:2308/12/2020 18:05:23

134
Chapter 4
48. McCrum C, Lucieer F, van de Berg R, Willems P, Pérez Fornos A, Guinand N, et al. The walking speed-dependency of gait variability in bilateral vestibulopathy and its association with clinical tests of vestibular function. Sci Rep. 2019 Dec;9(1):18392.
49. Tudor-Locke C, Hatano Y, Pangrazi RP, Kang M. Revisiting ‘How Many Steps Are Enough?’: Medicine & Science in Sports & Exercise. 2008 Jul;40(Supplement):S537–43.
50. Santanasto AJ, Coen PM, Glynn NW, Conley KE, Jubrias SA, Amati F, et al. The relationship between mitochondrial function and walking performance in older adults with a wide range of physical function. Experimental Gerontology. 2016 Aug;81:1–7.
51. Maden-Wilkinson TM, McPhee JS, Rittweger J, Jones DA, Degens H. Thigh muscle volume in relation to age, sex and femur volume. AGE. 2014 Feb;36(1):383–93.
52. Delmonico MJ, Harris TB, Visser M, Park SW, Conroy MB, Velasquez-Mieyer P, et al. Longitudinal study of muscle strength, quality, and adipose tissue infiltration. Am J Clin Nutr. 2009 Dec;90(6):1579–85.
53. Frontera WR, Hughes VA, Fielding RA, Fiatarone MA, Evans WJ, Roubenoff R. Aging of skeletal muscle: a 12-yr longitudinal study. Journal of Applied Physiology. 2000 Apr 1;88(4):1321–6.
54. Lai C-C, Tu Y-K, Wang T-G, Huang Y-T, Chien K-L. Effects of resistance training, endurance training and whole-body vibration on lean body mass, muscle strength and physical performance in older people: a systematic review and network meta-analysis. Age and Ageing. 2018 May 1;47(3):367–73.
55. Goodpaster BH, Chomentowski P, Ward BK, Rossi A, Glynn NW, Delmonico MJ, et al. Effects of physical activity on strength and skeletal muscle fat infiltration in older adults: a randomized controlled trial. J Appl Physiol. 2008;105:6.
56. Woo JS, Derleth C, Stratton JR, Levy WC. The Influence of Age, Gender, and Training on Exercise Efficiency. Journal of the American College of Cardiology. 2006 Mar;47(5):1049–57.
57. Peiffer J, Abbiss CR, Sultana F, Bernard T, Brisswalter J. Comparison of the influence of age on cycling efficiency and the energy cost of running in well-trained triathletes. Eur J Appl Physiol. 2016 Jan;116(1):195–201.
58. Wang E, Nyberg SK, Hoff J, Zhao J, Leivseth G, Tørhaug T, et al. Impact of maximal strength training on work efficiency and muscle fiber type in the elderly: Implications for physical function and fall prevention. Experimental Gerontology. 2017 May;91:64–71.
59. Conley KE, Jubrias SA, Cress ME, Esselman P. Exercise efficiency is reduced by mitochondrial uncoupling in the elderly: Mitochondrial uncoupling impacts exercise efficiency. Experimental Physiology. 2013 Mar;98(3):768–77.
60. Fink RI, Wallace P, Olefsky JM. Effects of aging on glucose-mediated glucose disposal and glucose transport. J Clin Invest. 1986 Jun 1;77(6):2034–41.
61. Rowe JW, Minaker KL, Pallotta JA, Flier JS. Characterization of the insulin resistance of aging. J Clin Invest. 1983 Jun 1;71(6):1581–7.
62. Lalia AZ, Dasari S, Johnson ML, Robinson MM, Konopka AR, Distelmaier K, et al. Predictors of Whole-Body Insulin Sensitivity Across Ages and Adiposity in Adult Humans. The Journal of Clinical Endocrinology & Metabolism. 2016 Feb;101(2):626–34.
Niels_Proefschrift.indd 134Niels_Proefschrift.indd 134 08/12/2020 18:05:2308/12/2020 18:05:23

135
Ageing and Skeletal Muscle and Mitochondrial Health
63. Lanza IR, Short DK, Short KR, Raghavakaimal S, Basu R, Joyner MJ, et al. Endurance Exercise as a Countermeasure for Aging. Diabetes. 2008 Nov 1;57(11):2933–42.
64. Amati F, Dube JJ, Coen PM, Stefanovic-Racic M, Toledo FGS, Goodpaster BH. Physical Inactivity and Obesity Underlie the Insulin Resistance of Aging. Diabetes Care. 2009 Aug 1;32(8):1547–9.
65. Karakelides H, Irving BA, Short KR, O’Brien P, Nair KS. Age, Obesity, and Sex Effects on Insulin Sensitivity and Skeletal Muscle Mitochondrial Function. Diabetes. 2010 Jan 1;59(1):89–97.
66. Dubé JJ, Amati F, Stefanovic-Racic M, Toledo FGS, Sauers SE, Goodpaster BH. Exercise-induced alterations in intramyocellular lipids and insulin resistance: the athlete’s paradox revisited. American Journal of Physiology-Endocrinology and Metabolism. 2008 May;294(5):E882–8.
67. Biensø RS, Olesen J, Gliemann L, Schmidt JF, Matzen MS, Wojtaszewski JFP, et al. Effects of Exercise Training on Regulation of Skeletal Muscle Glucose Metabolism in Elderly Men. The Journals of Gerontology: Series A. 2015 Jul;70(7):866–72.
68. Stull AJ, Galgani JE, Johnson WD, Cefalu WT. The contribution of race and diabetes status to metabolic flexibility in humans. Metabolism. 2010 Sep;59(9):1358–64.
69. Smith RL, Soeters MR, Wüst RCI, Houtkooper RH. Metabolic Flexibility as an Adaptation to Energy Resources and Requirements in Health and Disease. Endocr Rev. 2018 Apr 24;39(4):489–517.
70. Tang P-F, Woollacott MH. Inefficient Postural Responses to Unexpected Slips During Walking in Older Adults. The Journals of Gerontology Series A: Biological Sciences and Medical Sciences. 1998 Nov 1;53A(6):M471–80.
71. Mille M-L, Johnson-Hilliard M, Martinez KM, Zhang Y, Edwards BJ, Rogers MW. One Step, Two Steps, Three Steps More … Directional Vulnerability to Falls in Community-Dwelling Older People. The Journals of Gerontology: Series A. 2013 Dec;68(12):1540–8.
72. Karamanidis K, Arampatzis A, Mademli L. Age-related deficit in dynamic stability control after forward falls is affected by muscle strength and tendon stiffness. Journal of Electromyography and Kinesiology. 2008 Dec;18(6):980–9.
73. Konig M, Epro G, Seeley J, Potthast W, Karamanidis K. Retention and generalizability of balance recovery response adaptations from trip perturbations across the adult life span. Journal of Neurophysiology. 2019 Sep 11;122(5):1884–93.
74. Karamanidis K, Arampatzis A. Age-related degeneration in leg-extensor muscle–tendon units decreases recovery performance after a forward fall: compensation with running experience. Eur J Appl Physiol. 2006 Nov 20;99(1):73–85.
75. Bohm S, Mademli L, Mersmann F, Arampatzis A. Predictive and Reactive Locomotor Adaptability in Healthy Elderly: A Systematic Review and Meta-Analysis. Sports Med. 2015 Dec;45(12):1759–77.
76. Grabiner MD, Crenshaw JR, Hurt CP, Rosenblatt NJ, Troy KL. Exercise-based fall prevention: can you be a bit more specific? Exerc Sport Sci Rev. 2014 Oct;42(4):161–8.
77. Gerards MHG, McCrum C, Mansfield A, Meijer K. Perturbation-based balance training for falls reduction among older adults: Current evidence and implications for clinical practice: Perturbation training for older adults. Geriatr Gerontol Int. 2017 Dec;17(12):2294–303.
4
Niels_Proefschrift.indd 135Niels_Proefschrift.indd 135 08/12/2020 18:05:2308/12/2020 18:05:23

136
Chapter 4
78. Karamanidis K, Epro G, McCrum C, König M. Improving Trip- and Slip-Resisting Skills in Older People: Perturbation Dose Matters. Exercise and Sport Sciences Reviews. 2020 Jan;48(1):40–7.
79. Adelnia F, Cameron D, Bergeron CM, Fishbein KW, Spencer RG, Reiter DA, et al. The Role of Muscle Perfusion in the Age-Associated Decline of Mitochondrial Function in Healthy Individuals. Front Physiol. 2019 Apr 12;10:427.
80. St-Jean-Pelletier F, Pion CH, Leduc-Gaudet J-P, Sgarioto N, Zovilé I, Barbat-Artigas S, et al. The impact of ageing, physical activity, and pre-frailty on skeletal muscle phenotype, mitochondrial content, and intramyocellular lipids in men: Muscle phenotype, mitochondrial mass, and lipid content in human ageing. Journal of Cachexia, Sarcopenia and Muscle. 2017 Apr;8(2):213–28.
81. Gonzalez-Freire M, Scalzo P, D’Agostino J, Moore ZA, Diaz-Ruiz A, Fabbri E, et al. Skeletal muscle ex vivo mitochondrial respiration parallels decline in vivo oxidative capacity, cardiorespiratory fitness, and muscle strength: The Baltimore Longitudinal Study of Aging. Aging Cell. 2018 Apr;17(2):e12725.
82. Bharadwaj MS, Tyrrell DJ, Leng I, Demons JL, Lyles MF, Carr JJ, et al. Relationships between mitochondrial content and bioenergetics with obesity, body composition and fat distribution in healthy older adults. BMC Obes. 2015 Dec;2(1):40.
Niels_Proefschrift.indd 136Niels_Proefschrift.indd 136 08/12/2020 18:05:2308/12/2020 18:05:23

137
Ageing and Skeletal Muscle and Mitochondrial Health
4
Niels_Proefschrift.indd 137Niels_Proefschrift.indd 137 08/12/2020 18:05:2308/12/2020 18:05:23

Niels_Proefschrift.indd 138Niels_Proefschrift.indd 138 08/12/2020 18:05:2308/12/2020 18:05:23

5Day-night rhythm of skeletal muscle metabolism is disturbed in older, metabolically compromised individuals
Jakob Wefers1, Niels J. Connell1,*, Ciarán E. Fealy1,*, Charlotte Andriessen1, Vera de Wit1, Dirk van Moorsel2, Esther Moonen-Kornips1, Johanna A. Jörgensen1, Matthijs K. C. Hesselink1, Bas Havekes1,2, Joris Hoeks1, Patrick Schrauwen1.
1Department of Nutrition and Movement Sciences, NUTRIM School for Nutrition and Translational
Research in Metabolism, Maastricht University Medical Center, 6200 MD Maastricht, The
Netherlands,2Division of Endocrinology, Department of Internal Medicine, Maastricht University Medical
Center, 6200 MD Maastricht, The Netherlands
* these authors contributed equally
Received: 16 April 2020 / Accepted: 6 July 2020Molecular Metabolism. 2020:101050.
Niels_Proefschrift.indd 139Niels_Proefschrift.indd 139 08/12/2020 18:05:2308/12/2020 18:05:23

140
Chapter 5
Abstract
Objective. Skeletal muscle mitochondrial function and energy metabolism displays day-night rhythmicity in healthy, young individuals. 24-h rhythmicity of metabolism has been implicated in the etiology of age-related metabolic disorders. Whether day-night rhythmicity in skeletal muscle mitochondrial function and energy metabolism is altered in older, metabolically comprised humans is so far unknown.
Methods. Twelve male overweight volunteers with impaired glucose tolerance and insulin sensitivity stayed in a metabolic research unit for 2 days under free living conditions with regular meals. Indirect calorimetry was performed at five time points (8AM, 1PM, 6PM, 11PM, 4AM), followed by a muscle biopsy. Mitochondrial oxidative capacity was measured in permeabilized muscle fibers using high-resolution respirometry.
Results. Mitochondrial oxidative capacity did not display rhythmicity. The expression of circadian core clock genes BMAL1 and REV-ERBA showed a clear day-night rhythm (p < 0.001), peaking at the end of the waking period. Remarkably, the repressor clock gene PER2 did not show rhythmicity, whereas PER1 and PER3 were strongly rhythmic (p < 0.001). On the whole-body level resting energy expenditure was highest in the late evening (p < 0.001). Respiratory exchange ratio did not decrease in the night, indicating metabolic inflexibility.
Conclusions. Mitochondrial oxidative capacity does not show a day-night rhythm in older, overweight participants with impaired glucose tolerance and insulin sensitivity. In addition, gene expression of PER2 in skeletal muscle indicates that rhythmicity of the negative feedback loop of the molecular clock is disturbed.
Niels_Proefschrift.indd 140Niels_Proefschrift.indd 140 08/12/2020 18:05:2408/12/2020 18:05:24
141
Day-Night Rhythm of Skeletal Muscle Metabolism
Introduction
Metabolic processes in the human body are highly dynamic and adapt rapidly to increased demand during physical activity and to energy intake in the postprandial period. The body’s circadian timing system is intertwined with metabolism at various levels, thereby anticipating metabolic challenges such as increased energy demand during the daytime. It is therefore not surprising that acute and chronic disturbance of the biological clock are related to disturbances in metabolic health. For example, chronic shift work is associated with increased risk for type 2 diabetes [1] and simulated shift work in human volunteers leads to glucose intolerance [2]. Furthermore, we have recently shown that a rapid day-night shift in healthy humans leads to a reduction in insulin sensitivity, which could specifically be attributed to a reduction in skeletal muscle insulin sensitivity [3].
In humans, circadian rhythmicity (i.e. 24-h rhythm that persists under constant conditions) or a 24-h day-night rhythm (i.e. recurring 24-h rhythm under free living conditions) has been observed for a variety of metabolic processes. One of the earliest reports observed higher glucose tolerance in the morning than in the afternoon [4]. Subsequent investigations showed rhythmicity in metabolic gene expression [5; 6], protein abundance [7] and parts of the lipidome and metabolome [8]. We recently reported a pronounced day-night rhythm in human skeletal muscle mitochondrial oxidative capacity in young, lean, healthy volunteers [9]. Mitochondrial oxidative capacity was highest in the late evening, which was consistent with the pattern in whole body energy expenditure. We also observed a day-night rhythm in the expression of the biological clock genes BMAL1, PER2 and CRY1, suggestive of metabolic and circadian cohesion in skeletal muscle.
Obesity, aging and insulin resistance have been reported to result both in decreased mitochondrial oxidative capacity [10], as well as in reduced metabolic flexibility [11]. Therefore, it can be suggested that a reduced mitochondrial function mediates this metabolic inflexibility in skeletal muscle.
In light of these findings, one can hypothesize that the day-night rhythm in skeletal muscle mitochondrial oxidative capacity we observed previously in young, healthy individuals is a prerequisite for metabolic health. However, so far human data about the day-night rhythmicity of skeletal muscle mitochondrial
5
Niels_Proefschrift.indd 141Niels_Proefschrift.indd 141 08/12/2020 18:05:2408/12/2020 18:05:24
142
Chapter 5
capacity and energy metabolism in older, metabolically comprised individuals is lacking. Here we provide a detailed characterization of 24-h energy and substrate metabolism, including rhythmicity in skeletal muscle oxidative capacity using tissue from sequentially sampled skeletal muscle biopsies, in older individuals with a comprised metabolic health.
Materials and methods
Participants
Male, overweight volunteers between the ages of 40 – 75 years were recruited through advertisements in the vicinity of Maastricht. Participants were non-smokers and generally healthy, as determined by a medical questionnaire and examination by a physician. Only participants with a habitual bed time of 11 PM ± 2 hours and 7 – 9 hours sleep per day were included. Participants were excluded from the study if they performed shift work or traveled across more than one time zone in the three months before the study. By means of the Morningness-Eveningness Questionnaire Self-Assessment Version 1.3 (MEQ-SA; Score between: 35 - 70) we excluded extreme morning or evening types. To establish volunteers with a reduced metabolic health, we selected participants with impaired glucose tolerance and insulin sensitivity. To that end, participants had to fulfill at least one of 4 criteria in order to be included into the study: 1) Impaired fasting glucose (IFG) 6.1mmol/L - 6.9 mmol/L; 2) impaired glucose tolerance (IGT) 7.8 mmol/L - 11.1 mmol/L 2 hours after 75 gram glucose consumption; 3) HbA1c of 5.7 – 6.4%; or 4) low insulin sensitivity defined as glucose clearance rate ≤ 360ml/kg/min according to the OGIS model [12]. Criteria 1 and 2 are derived from the World Health Organization recommendations [13], criteria 3 is according to the definition of prediabetes from the American Diabetes Association [14]. The study was conducted in accordance with the principles of the declaration of Helsinki and approved by the Ethics Committee of the Maastricht University Medical Center. All participants provided written informed consent. The study was registered at https://clinicaltrials.gov with identifier NCT03733743.
Study conditions
During a 7-day run-in period prior to admission to the research facility, participants were instructed to adhere to a fixed lifestyle that resembled the experimental conditions during the overnight stay. During this run-in period
Niels_Proefschrift.indd 142Niels_Proefschrift.indd 142 08/12/2020 18:05:2408/12/2020 18:05:24
143
Day-Night Rhythm of Skeletal Muscle Metabolism
participants had to refrain from alcohol and caffeinated drinks, sleep only between 11 PM and 7 AM, and only eat three meals per day at 8 AM, 1 PM and 6 PM. Standardized meals with fixed caloric content adjusted to the participants’ needs (described below) were provided for the last two days before the visit to the lab. Furthermore, participants were instructed to refrain from exercise for the last three days of the run-in period. Adherence to the activity protocol and sleeping times at home was checked using actigraphy (Actiwatch) and a sleep diary. Meal times were registered in a food diary for one week, and meal contents were noted for the last three days before the visit to the lab.
Overnight visit
All study procedures were performed as described previously in the study by van Moorsel et al. [9]. Participants were admitted to the research unit at 12 PM on test day 1 and stayed for 44 h in total, under standardized conditions mimicking a real-life situation. The first test day was used to standardize and monitor meals, physical activity and bedtime. Meals were provided at 1PM and 6PM in our research facilities. One hour after every meal, participants went for a 15-minute low-intensity walk accompanied by a researcher in order to standardize physical activity. Directly hereafter, participants were instructed to stand for 15 minutes before they were allowed to sit again. Between meals, physical activity and tests, the participants stayed in a respiration chamber; a small room with a bed, toilet, sink, desk, chair, TV and computer. At 11 PM, the lights of the respiration chamber were turned off and the participants were instructed to try to sleep. During the first night, sleeping metabolic rate was measured by whole-room indirect calorimetry (Omnical, Maastricht Instruments, Maastricht, The Netherlands) [15].
On the second test day, participants were woken up at 6:30 AM and participants swallowed a telemetric pill for measurement of core-body temperature (Equivital, Philips-Respironics, Murrysville PA, USA). Next, an intravenous cannula was placed in the forearm for subsequent blood-draws. The first blood-draw was at 8 AM, followed by an indirect calorimetry measurement using a ventilated hood while awake and at rest in supine posture to calculate resting energy expenditure and substrate oxidation. Directly hereafter, the first skeletal muscle biopsy was taken (described below). These measurements (blood draw, indirect calorimetry and skeletal muscle biopsy) were repeated five times within 24-h: at 8 AM, 1 PM,
5
Niels_Proefschrift.indd 143Niels_Proefschrift.indd 143 08/12/2020 18:05:2408/12/2020 18:05:24
144
Chapter 5
6 PM, 11 PM and at 4 AM of the next day. Additional blood samples were taken at 2-hour intervals (10 AM, 12 PM, 2 PM, 4 PM, 8 PM, 10 PM, 0 AM, 2 AM, 6 AM and 8 AM). The meals on the second test day were provided immediately after the muscle biopsies and were thus delayed by approximately 1 hour compared to the run-in period and the first test day. After the 11 PM biopsy, participants returned to the respiration chamber to sleep with lights off. At 4 AM, the participants were woken up, and the last measurements were performed, after which the subject was allowed to sleep until 7 AM. After the 8 AM blood draw the study protocol ended. All indirect calorimetry measurements and muscle biopsies were performed in normal room light conditions.
Study meals
Two days before admission to the metabolic research unit, and during the study, the participants were provided with standardized meals that were based on Dutch dietary guidelines and matched for energy expenditure. Caloric intake for consumption at home was calculated by multiplying the estimated resting metabolic rate, obtained with the Harris-Benedict formula [16] with an activity factor of 1.5. Participants were provided with optional extra snacks to eat with their meals if they were still hungry, up to an activity factor of 1.7. For the first test day in the laboratory, energy requirement was calculated by multiplying the estimated resting metabolic rate with an activity factor of 1.35, because of limited physical activity in the research facility. For the second test day, energy requirement was calculated by multiplying the sleeping metabolic rate of the first study night (measured by whole-room indirect-calorimetry) by 1.5.
During the study days, participants received 3 meals daily. Breakfast accounted for ~ 21 energy% (E%), lunch for ~ 30 E% and dinner for ~ 49 E%. Daily macronutrient composition was ~ 52 E% as carbohydrates, ~ 31 E% as fat (~ 9 E% saturated) and ~ 14 E% as protein. Breakfast and lunch were bread based and thus the percentage of energy from carbohydrates was higher compared to the dinner. No snacks or drinks other than water were provided in-between meals.
Skeletal muscle biopsies
Five skeletal muscle biopsies were obtained from the m. vastus lateralis according to the Bergstrom method [17] under local anesthesia (1% lidocaine, without epinephrine). Each biopsy was taken from a separate incision at least 2
Niels_Proefschrift.indd 144Niels_Proefschrift.indd 144 08/12/2020 18:05:2408/12/2020 18:05:24
145
Day-Night Rhythm of Skeletal Muscle Metabolism
cm from the previous incision, moving from distal to proximal. The first biopsy was randomly taken from the left or right leg, and each subsequent biopsy was taken from the other leg. After the biopsies of 11 PM and 4 AM, participants lay in bed and tried to sleep. All biopsies were taken at least 4 hours after the last meal to prevent any acute influence of meal ingestion. Part of the biopsy was immediately placed in ice-cold preservation medium (BIOPS, OROBOROS Instruments, Innsbruck, Austria) and used for the preparation of permeabilized muscle fibers and subsequent measurement of mitochondrial oxidative capacity. The remaining part of the muscle biopsy was immediately frozen in melting isopentane and stored in -80 °C until further analysis.
High resolution respirometry
Permeabilized muscle fibers were prepared freshly from biopsies, as described previously [18]. In permeabilized muscle fibers, oxygen consumption was measured by high-resolution respirometry using an Oxygraph (OROBOROS Instruments). During the experiment, a multisubstrate-uncoupler protocol with malate, octanoylcarnitine, ADP, glutamate, succinate and carbonylcyanide p-trifluoromethoxyphenylhydrazone (FCCP) was performed, as described previously [19]. The integrity of the outer mitochondrial membrane was assessed by the addition of cytochrome C upon maximal coupled respiration. All oxygen consumption measurements were performed in quadruplicate.
Indirect calorimetry
Oxygen consumption and carbon dioxide production were measured with an automated respiratory gas analyzer using a ventilated hood system (Omnical; IDEE, Maastricht, the Netherlands) and were used to calculate whole-body energy expenditure, respiratory exchange ratio (RER), glucose- and fat oxidation. Calculations of energy expenditure and substrate oxidation were made with the assumption of a negligible protein oxidation [20].
Core body temperature
After waking up on the second test day, participants ingested a thermometer capsule (Equivital, Philips-Respironics, Murrysville PA, USA) to measure core-body temperature (CBT) for 24-h. Due to premature excretion of the capsule or technical failure, complete CBT measurements were obtained in 11 participants only.
5
Niels_Proefschrift.indd 145Niels_Proefschrift.indd 145 08/12/2020 18:05:2408/12/2020 18:05:24

146
Chapter 5
Protein analysis
Western blot analyses were performed in Bioplex-lysates of human muscle tissue. Protein concentration was determined with the Bio-Rad RC/DC protein assay kit (Bio-Rad Laboratories, Veenendaal, The Netherlands). Equal amounts of protein were loaded on 12% TGX stain-free gels (Bio-Rad Laboratories) or 4-12% Bolt gradient gels (Novex, Thermo Fisher Scientific, Bleiswijk, The Netherlands). Proteins were transferred to nitrocellulose with the Trans-Blot Turbo transfer system (Bio-Rad Laboratories). Protein load was controlled in the stain-free gels [21] and blots and with the REVERT stain (REVERT total protein stain, LI-COR, Lincon, USA) in the 4 – 12% gradient gels. Primary antibodies: a cocktail of mouse monoclonal antibodies directed against human OXPHOS (dilution 1:5,000; ab110411, Abcam, Cambridge, UK), two mitochondrial markers directed against TOMM20 (dilution 1:10,000; ab186734; Abcam), porin/VDAC (dilution 1:5,000; sc-8828, Santa Cruz Biotechnology, Dallas, Texas), FIS-1 (dilution 1:1000, sc-98900, Santa Cruz Biotechnology, Dallas, Texas), PINK-1 (dilution 1:2000, sc-33796, Santa Cruz Biotechnology, Dallas, Texas) and OPA-1 (dilution 1:2500, 612,606, Becton Dickinson). The specific proteins were detected using secondary antibodies conjugated with IRDye680 or IRDye800, and were quantified with the CLx Odyssey Near Infrared Imager (Li-COR, Westburg, Leusden, The Netherlands).
Gene transcript quantification
RNA was isolated from 10 mg of muscle material by TRIzol lysis (Qiagen, Hilden, Germany). RNA was further purified by the RNeasy kit from Qiagen (Hilden, Germany). RNA yield was measured using a NanoDrop spectrophotometer (Thermo Fisher Scientific, Waltham, USA). The high-capacity RNA-to-cDNA kit from Applied Biosystems (Foster City, USA) was used for transcribing 200 ng RNA to cDNA. Transcript abundance was determined using a CFX384 Real-Time System (Biorad-Laboratories, Veenendaal, NL). To minimize the variability in reference gene normalization, the geometric mean of three reference genes (RPL26, GUSB and CYPB), which were individually stably expressed in time, was used. This geometric mean was used as the internal reference for comparative gene expression analysis in the remainder of the study [22].
Statistics
Data are presented as mean ± SEM (standard error of the mean) unless indicated otherwise. Statistical analyses were performed with the use of IBM Statistical
Niels_Proefschrift.indd 146Niels_Proefschrift.indd 146 08/12/2020 18:05:2408/12/2020 18:05:24
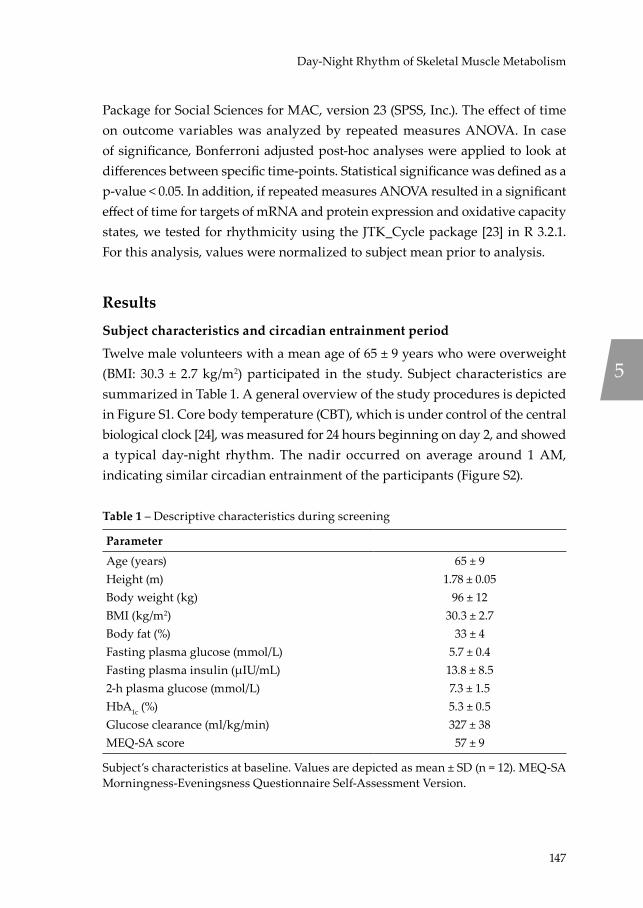
147
Day-Night Rhythm of Skeletal Muscle Metabolism
Package for Social Sciences for MAC, version 23 (SPSS, Inc.). The effect of time on outcome variables was analyzed by repeated measures ANOVA. In case of significance, Bonferroni adjusted post-hoc analyses were applied to look at differences between specific time-points. Statistical significance was defined as a p-value < 0.05. In addition, if repeated measures ANOVA resulted in a significant effect of time for targets of mRNA and protein expression and oxidative capacity states, we tested for rhythmicity using the JTK_Cycle package [23] in R 3.2.1. For this analysis, values were normalized to subject mean prior to analysis.
Results
Subject characteristics and circadian entrainment period
Twelve male volunteers with a mean age of 65 ± 9 years who were overweight (BMI: 30.3 ± 2.7 kg/m2) participated in the study. Subject characteristics are summarized in Table 1. A general overview of the study procedures is depicted in Figure S1. Core body temperature (CBT), which is under control of the central biological clock [24], was measured for 24 hours beginning on day 2, and showed a typical day-night rhythm. The nadir occurred on average around 1 AM, indicating similar circadian entrainment of the participants (Figure S2).
Table 1 – Descriptive characteristics during screening
ParameterAge (years) 65 ± 9Height (m) 1.78 ± 0.05Body weight (kg) 96 ± 12BMI (kg/m2) 30.3 ± 2.7Body fat (%) 33 ± 4Fasting plasma glucose (mmol/L) 5.7 ± 0.4Fasting plasma insulin (µIU/mL) 13.8 ± 8.52-h plasma glucose (mmol/L) 7.3 ± 1.5HbA1c (%) 5.3 ± 0.5Glucose clearance (ml/kg/min) 327 ± 38MEQ-SA score 57 ± 9
Subject’s characteristics at baseline. Values are depicted as mean ± SD (n = 12). MEQ-SA Morningness-Eveningsness Questionnaire Self-Assessment Version.
5
Niels_Proefschrift.indd 147Niels_Proefschrift.indd 147 08/12/2020 18:05:2408/12/2020 18:05:24
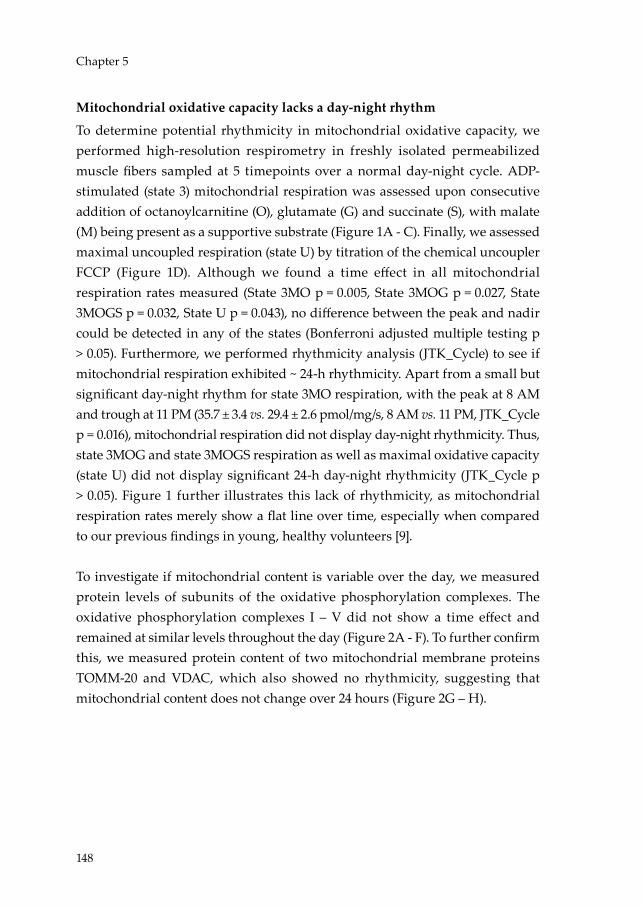
148
Chapter 5
Mitochondrial oxidative capacity lacks a day-night rhythm
To determine potential rhythmicity in mitochondrial oxidative capacity, we performed high-resolution respirometry in freshly isolated permeabilized muscle fibers sampled at 5 timepoints over a normal day-night cycle. ADP-stimulated (state 3) mitochondrial respiration was assessed upon consecutive addition of octanoylcarnitine (O), glutamate (G) and succinate (S), with malate (M) being present as a supportive substrate (Figure 1A - C). Finally, we assessed maximal uncoupled respiration (state U) by titration of the chemical uncoupler FCCP (Figure 1D). Although we found a time effect in all mitochondrial respiration rates measured (State 3MO p = 0.005, State 3MOG p = 0.027, State 3MOGS p = 0.032, State U p = 0.043), no difference between the peak and nadir could be detected in any of the states (Bonferroni adjusted multiple testing p > 0.05). Furthermore, we performed rhythmicity analysis (JTK_Cycle) to see if mitochondrial respiration exhibited ~ 24-h rhythmicity. Apart from a small but significant day-night rhythm for state 3MO respiration, with the peak at 8 AM and trough at 11 PM (35.7 ± 3.4 vs. 29.4 ± 2.6 pmol/mg/s, 8 AM vs. 11 PM, JTK_Cycle p = 0.016), mitochondrial respiration did not display day-night rhythmicity. Thus, state 3MOG and state 3MOGS respiration as well as maximal oxidative capacity (state U) did not display significant 24-h day-night rhythmicity (JTK_Cycle p > 0.05). Figure 1 further illustrates this lack of rhythmicity, as mitochondrial respiration rates merely show a flat line over time, especially when compared to our previous findings in young, healthy volunteers [9].
To investigate if mitochondrial content is variable over the day, we measured protein levels of subunits of the oxidative phosphorylation complexes. The oxidative phosphorylation complexes I – V did not show a time effect and remained at similar levels throughout the day (Figure 2A - F). To further confirm this, we measured protein content of two mitochondrial membrane proteins TOMM-20 and VDAC, which also showed no rhythmicity, suggesting that mitochondrial content does not change over 24 hours (Figure 2G – H).
Niels_Proefschrift.indd 148Niels_Proefschrift.indd 148 08/12/2020 18:05:2408/12/2020 18:05:24
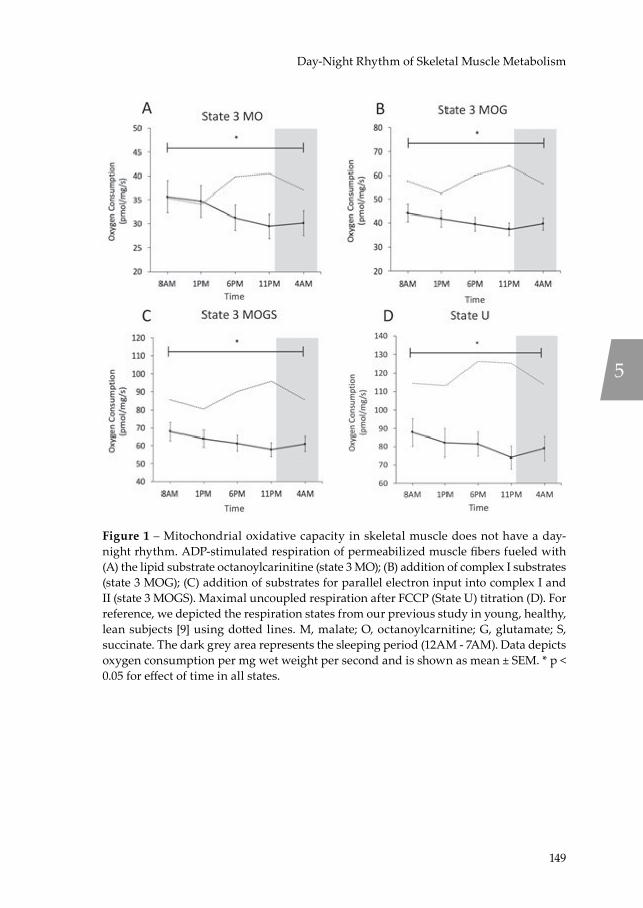
149
Day-Night Rhythm of Skeletal Muscle Metabolism
Figure 1 – Mitochondrial oxidative capacity in skeletal muscle does not have a day-night rhythm. ADP-stimulated respiration of permeabilized muscle fibers fueled with (A) the lipid substrate octanoylcarinitine (state 3 MO); (B) addition of complex I substrates (state 3 MOG); (C) addition of substrates for parallel electron input into complex I and II (state 3 MOGS). Maximal uncoupled respiration after FCCP (State U) titration (D). For reference, we depicted the respiration states from our previous study in young, healthy, lean subjects [9] using dotted lines. M, malate; O, octanoylcarnitine; G, glutamate; S, succinate. The dark grey area represents the sleeping period (12AM - 7AM). Data depicts oxygen consumption per mg wet weight per second and is shown as mean ± SEM. * p < 0.05 for effect of time in all states.
5
Niels_Proefschrift.indd 149Niels_Proefschrift.indd 149 08/12/2020 18:05:2508/12/2020 18:05:25

150
Chapter 5
Figure 2 – Mitochondrial respiratory chain proteins are not rhythmic. Proteins levels of oxidative phosphorylation complexes I – V (A - E). Representative western blot of one subject depicting the oxidative phosphorylation complexes of all time points (F). Protein levels of the two mitochondrial membrane proteins TOMM-20 and VDAC (G - H). Jointly, these data indicate that mitochondrial content does not possess 24-hour rhythmicity. Representative western blot images are displayed below the quantification graphs. Proteins of interest were normalized to total protein content using stain-free technology. The dark grey area represents the sleeping period (12AM - 7AM). Data is presented as mean ± SEM.
Niels_Proefschrift.indd 150Niels_Proefschrift.indd 150 08/12/2020 18:05:2508/12/2020 18:05:25
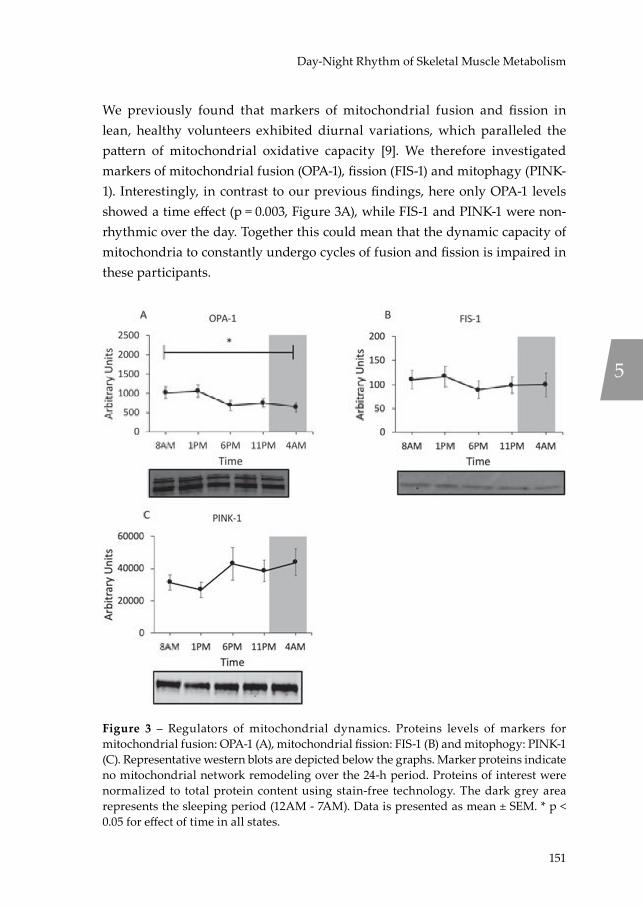
151
Day-Night Rhythm of Skeletal Muscle Metabolism
We previously found that markers of mitochondrial fusion and fission in lean, healthy volunteers exhibited diurnal variations, which paralleled the pattern of mitochondrial oxidative capacity [9]. We therefore investigated markers of mitochondrial fusion (OPA-1), fission (FIS-1) and mitophagy (PINK-1). Interestingly, in contrast to our previous findings, here only OPA-1 levels showed a time effect (p = 0.003, Figure 3A), while FIS-1 and PINK-1 were non-rhythmic over the day. Together this could mean that the dynamic capacity of mitochondria to constantly undergo cycles of fusion and fission is impaired in these participants.
Figure 3 – Regulators of mitochondrial dynamics. Proteins levels of markers for mitochondrial fusion: OPA-1 (A), mitochondrial fission: FIS-1 (B) and mitophogy: PINK-1 (C). Representative western blots are depicted below the graphs. Marker proteins indicate no mitochondrial network remodeling over the 24-h period. Proteins of interest were normalized to total protein content using stain-free technology. The dark grey area represents the sleeping period (12AM - 7AM). Data is presented as mean ± SEM. * p < 0.05 for effect of time in all states.
5
Niels_Proefschrift.indd 151Niels_Proefschrift.indd 151 08/12/2020 18:05:2608/12/2020 18:05:26

152
Chapter 5
Whole body substrate oxidation shows metabolic inflexibility
To investigate if whole-body energy expenditure and substrate oxidation display day-night variation, we performed indirect calorimetry in the resting state at the 5 timepoints of the mitochondrial function assessment, i.e. prior to taking each muscle biopsy. In addition, we plotted the whole-room calorimetry measurement from the first night in order to verify that measurements obtained at 4 AM after waking up were similar to an undisturbed condition while asleep (Figure 4A - D). Resting metabolic rate (RMR) showed clear differences over the day, with lowest values occurring at 8 AM and 4 AM and peak energy expenditure at 11 PM at the end of the waking period (p < 0.001 for the time effect; p = 0.001 for Bonferroni adjusted post-hoc analysis 8 AM vs. 11 PM; Figure 4A). Respiratory exchange ratio (RER) increased over the day and plateaued in the late evening and night, showing increased reliance on carbohydrate oxidation over the day (Figure 4B). Statistical analysis revealed a significant time effect for RER (p < 0.001 for the time effect). The mean difference between peak and trough was 0.05 ± 0.01 (0.80 ± 0.01 vs. 0.85 ± 0.01, 8 AM vs. 4 AM (p = 0.001 for Bonferroni adjusted post-hoc analysis), illustrating the relatively modest day-night variation in these older, insulin resistant participants. For reference, the day-night variation in RER in lean, healthy volunteers in our previous study was 0.08 ± 0.02 [9]. Interestingly, RER remained high under fasting conditions at 4 AM even though the last meal was provided at 7 PM in the evening. As exemplified by the RER, carbohydrate oxidation increased during the day with highest values at 11 PM (p < 0.001 for the overall time effect; p < 0.001 for Bonferroni adjusted post-hoc analysis; Figure 4C). Fat oxidation decreased accordingly, with highest fat oxidation at 8 AM (p < 0.001 for the overall time effect; p = 0.003 for Bonferroni adjusted post-hoc analysis; Figure 4D).
Niels_Proefschrift.indd 152Niels_Proefschrift.indd 152 08/12/2020 18:05:2608/12/2020 18:05:26
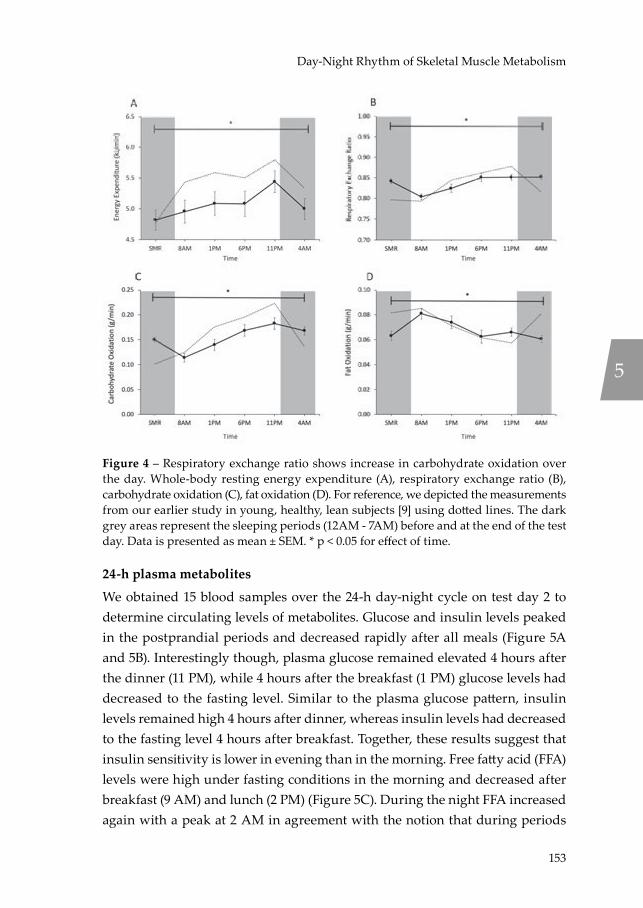
153
Day-Night Rhythm of Skeletal Muscle Metabolism
Figure 4 – Respiratory exchange ratio shows increase in carbohydrate oxidation over the day. Whole-body resting energy expenditure (A), respiratory exchange ratio (B), carbohydrate oxidation (C), fat oxidation (D). For reference, we depicted the measurements from our earlier study in young, healthy, lean subjects [9] using dotted lines. The dark grey areas represent the sleeping periods (12AM - 7AM) before and at the end of the test day. Data is presented as mean ± SEM. * p < 0.05 for effect of time.
24-h plasma metabolites
We obtained 15 blood samples over the 24-h day-night cycle on test day 2 to determine circulating levels of metabolites. Glucose and insulin levels peaked in the postprandial periods and decreased rapidly after all meals (Figure 5A and 5B). Interestingly though, plasma glucose remained elevated 4 hours after the dinner (11 PM), while 4 hours after the breakfast (1 PM) glucose levels had decreased to the fasting level. Similar to the plasma glucose pattern, insulin levels remained high 4 hours after dinner, whereas insulin levels had decreased to the fasting level 4 hours after breakfast. Together, these results suggest that insulin sensitivity is lower in evening than in the morning. Free fatty acid (FFA) levels were high under fasting conditions in the morning and decreased after breakfast (9 AM) and lunch (2 PM) (Figure 5C). During the night FFA increased again with a peak at 2 AM in agreement with the notion that during periods
5
Niels_Proefschrift.indd 153Niels_Proefschrift.indd 153 08/12/2020 18:05:2708/12/2020 18:05:27

154
Chapter 5
of fasting FFA are released from adipose tissue to provide energy. Triglyceride (TG) levels increased over the course of the day and after each meal, and kept increasing until 12 AM (midnight) – 5 hours after the last meal (Figure 5D). Throughout the sleeping period (12 AM until 7 AM), TG levels decreased until they reached fasting levels in the next morning.
Figure 5 – Daily variations in glucose, insulin, FFA and triglyceride are predominantly influenced by feeding. Plasma levels of glucose (A), insulin (B), free fatty acids (C), triglycerides (D). For reference, we depicted the measurements from our earlier study in young, healthy, lean subjects [9] using dotted lines. The dark grey area represents the sleeping period (12AM - 7AM). Data is presented as mean ± SEM. * p < 0.05 for effect of time.
Muscle clock gene analysis indicates phase shift of PER2 and CRY1
We and others previously reported that clock gene expression exhibit 24-h day-night rhythmicity in human skeletal muscle of lean volunteers, both when measured in human muscle biopsies and in primary human myotubes [6; 9; 25]. Here we investigated whether the core clock genes display a day-night rhythm in older, metabolically compromised volunteers. To this end, we measured the positive (BMAL1, CLOCK and REV-ERBa) and the negative (PER2 and CRY1) regulators of the muscle clock in all 5 biopsies over the day (Figure 6).
Niels_Proefschrift.indd 154Niels_Proefschrift.indd 154 08/12/2020 18:05:2808/12/2020 18:05:28

155
Day-Night Rhythm of Skeletal Muscle Metabolism
Consistent with our previous findings [9], BMAL1 and REV-ERBa exhibited robust oscillations with a peak at the end of the waking period and a trough at noon (BMAL1 p < 0.001 for the overall time effect; JTK_Cycle p < 0.001; REV-ERBa p < 0.001 for the overall time effect; JTK_Cycle p < 0.001; Figure 6A and 6E respectively). In contrast, the negative regulator CRY1 peaked in the morning (p = 0.084 for the overall time effect, JTK_Cycle p = 0.005; Figure 6D). Even more remarkable, the expression of the negative regulator PER2 showed that there was no day-night rhythmicity (p = 0.170 for the overall time effect; p = 0.101 for JTK_Cycle; Figure 6C). We therefore subsequently analyzed the other two PER-isoforms PER1 and PER3 and found a strong rhythmic expression pattern (PER1: p < 0.001 for the overall time effect; JTK_Cycle p < 0.001; PER3 p < 0.001 for the overall time effect; JTK_Cycle p < 0.001; Figure 6F - 6G).
5
Niels_Proefschrift.indd 155Niels_Proefschrift.indd 155 08/12/2020 18:05:2808/12/2020 18:05:28
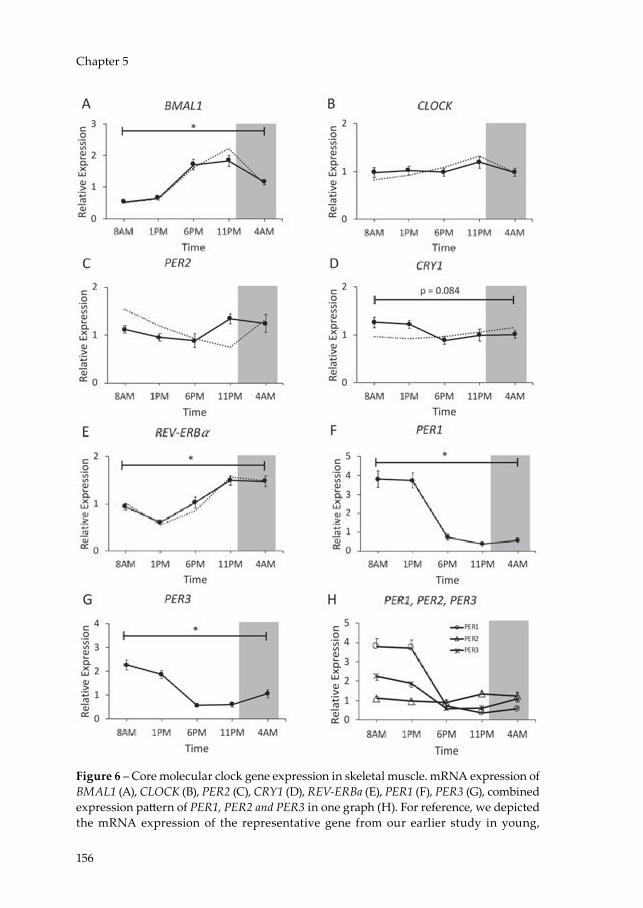
156
Chapter 5
Figure 6 – Core molecular clock gene expression in skeletal muscle. mRNA expression of BMAL1 (A), CLOCK (B), PER2 (C), CRY1 (D), REV-ERBa (E), PER1 (F), PER3 (G), combined expression pattern of PER1, PER2 and PER3 in one graph (H). For reference, we depicted the mRNA expression of the representative gene from our earlier study in young,
Niels_Proefschrift.indd 156Niels_Proefschrift.indd 156 08/12/2020 18:05:2908/12/2020 18:05:29

157
Day-Night Rhythm of Skeletal Muscle Metabolism
healthy, lean subjects [9] using dotted lines. Data are normalized to the geometric of 3 housekeeping genes. The dark grey area represents the sleeping period (12AM - 7AM). Data is presented as mean ± SEM. * p < 0.05 for effect of time.
Discussion
We previously showed that skeletal muscle displays 24-h day-night rhythmicity in core molecular clock gene expression and mitochondrial oxidative capacity in young, healthy humans. This day-night rhythmicity was paralleled by day-night rhythms in whole-body energy and substrate metabolism, including a typical feeding-fasting cycle of substrate oxidation [9]. Higher age, excess body fat and insulin resistance are all characteristic for reduced metabolic health and are typically associated with low skeletal muscle mitochondrial function [26; 27] and metabolic flexibility [28]. To the best of our knowledge, we here show for the first time in humans that skeletal muscle of older, metabolically comprised individuals is characterized by a lack of 24-h day-night rhythmicity in mitochondrial oxidative capacity and by disturbed molecular clock gene expression, paralleled by alterations in 24-h energy and substrate metabolism.
In the current study, mitochondrial oxidative capacity was determined in older, insulin resistant or glucose intolerant participants using an identical methodology as in several of our previous studies [18; 19; 29], allowing the comparison of the absolute values. Mitochondrial respiration rates were clearly lower as compared to a group of young, lean participants [9], thereby confirming previous results in a comparable, older pre-diabetic population [29]. More interestingly however, older, metabolically comprised participants did not show the 24-h day-night rhythmicity in mitochondrial respiration that we previously observed in young, lean, healthy volunteers (indicated with dotted lines in Figure 1 [9]). Thus, in our previous study mitochondrial oxidative capacity displayed a clear day-night rhythm with a peak in mitochondrial respiration at the end of active period and a trough at 1 PM [9]. In the current study however, lowest respiration occurred at 11 PM suggesting that the peak in mitochondrial respiration that is observed in the young lean participants is completely lost. This shows that the ability to adjust mitochondrial oxidative capacity over the 24-h day-night cycle is a characteristic feature of young, lean participants, which is lost in older, overweight participants. Interestingly, this finding was paralleled by a blunted metabolic flexibility as indicated by only a marginal variation in resting RQ over
5
Niels_Proefschrift.indd 157Niels_Proefschrift.indd 157 08/12/2020 18:05:2908/12/2020 18:05:29
158
Chapter 5
the 24-h period (max variation in RQ over 24 hours: 0.05 in older, overweight versus 0.08 in young, lean, see dotted line in Figure 4B). This lack of oscillation in mitochondrial oxidative capacity throughout the 24-h day-night cycle suggests that restoration of circadian rhythmicity is a potentially interesting target to improve metabolic health. The mechanisms underlying the lack of day-night rhythmicity in mitochondrial function in older, overweight volunteers cannot be deduced from the current study and requires further investigation. Nonetheless, we found that the marker of mitochondrial fission FIS-1 protein was not rhythmic – contrary to our previously published data – suggesting that altered mitochondrial dynamics may play a role in the absence of rhythmic respiration [30; 31]. Interestingly, rhythmicity of FIS1 and PINK1 on the mRNA and protein in liver is dependent on BMAL1 [30]. We therefore measured expression of these mitochondrial dynamics markers to see if the lack of rhythmicity is also present on the mRNA level. We found that FIS-1 was borderline significant for a time effect (p = 0.052), while PINK-1 and BNIP-3 showed significant 24-h variation (PINK-1 p = 0.031; BNIP-3 p = 0.004). This discrepancy between rhythmicity on the mRNA and protein level might indicate that rhythmicity of FIS-1 and PINK-1 protein levels is affected by a posttranscriptional mechanism [32].
In order to investigate if the lack of rhythmicity in mitochondrial oxidative capacity was due to a disturbed skeletal muscle circadian clock, we measured the core clock genes in skeletal muscle. Interestingly, the positive limb of the feedback loop (BMAL1 and CLOCK) was remarkably similar to our previous study with young, lean participants. Also, the clock gene REV-ERBa was expressed almost identically in both studies. Previous research in mice showed that knock out of REV-ERBa in skeletal muscle leads to reduced mitochondrial oxidative capacity and that overexpression might increase oxidative capacity [33]. The current results do not suggest that REV-ERBa is linked to the lack of rhythmicity in mitochondrial oxidative capacity in our older, overweight participants. Contrary to the positive limb of the feedback loop, expression of the negative regulator PER2 was not rhythmic in skeletal muscle. We also analyzed the expression of the other two isoforms of the PER gene family, PER1 and PER3, which did show rhythmic expression. This finding is interesting because in mice, knock out of PER2 leads to loss of rhythmic oxidative capacity [34]. Moreover, a recent study reported a pathway in which inflammation induced the transcription factor NF-κB, which directly repressed PER2 and CRY1 leading
Niels_Proefschrift.indd 158Niels_Proefschrift.indd 158 08/12/2020 18:05:2908/12/2020 18:05:29

159
Day-Night Rhythm of Skeletal Muscle Metabolism
to impaired rhythmicity in liver [35]. Thus, it is possible that aging, obesity and insulin resistance, which are associated with inflammation [36], may contribute to the observed impairment in clock gene expression. Whether the loss of rhythm in PER2 is specific to skeletal muscle tissue remains to be established and cannot be answered from the current study. However, a recent study reported that rhythmicity of PER2 expression in adipose tissue of both overweight T2DM patients and lean healthy controls was similar, suggesting that in adipose tissue PER2 expression is not altered [37].
In contrast to the lack of day-night rhythmicity in mitochondrial capacity, resting metabolic rate displayed a clear pattern over the 24-h day-night cycle with a peak in the late evening at 11PM. This rhythm is very similar to our previous study in which RMR displayed the same pattern and is in agreement with another study of a 24-h measurement in resting energy expenditure [38]. Whole body substrate oxidation changed during the day, with an increased relative carbohydrate oxidation and a lowered fat oxidation in the evening compared to the morning. The last meal was provided at 7 PM, but even several hours later (11 PM and 4 AM) the RER had not decreased. This is in contrast to our findings in young, lean participants, even though composition of the meals was similar in the two studies and indicates metabolic inflexibility in the older, overweight and insulin resistant participants. A decrease in metabolic flexibility is typically observed in obesity [28], prediabetes [39], and diabetes [10], but is usually measured under fasting conditions in the morning or in the postprandial phase. In the present study we found that metabolic inflexibility persisted throughout the entire 24-h day-night cycle and especially in the sleeping period at night, suggesting that especially at night our participants did not enter in the typical fasted state. This observation is remarkable, as volunteers were fed in energy balance, suggesting that this lack of feeding-fasting cycle is a characteristic of these older, overweight participants.
The lack of a feeding-fasting cycle is further confirmed by the higher glucose, insulin and TG levels, as well as lower FFA levels after the breakfast and lunch in comparison to the lean, young participants from our previous study, again despite that participants were fed in energy balance in both studies. Despite insulin being ~60% higher 1 hour after breakfast in the current study, glucose also remained elevated in comparison to the young and lean group,
5
Niels_Proefschrift.indd 159Niels_Proefschrift.indd 159 08/12/2020 18:05:2908/12/2020 18:05:29

160
Chapter 5
confirming the insulin resistant state of the participants in the current study. Interestingly, the glucose peak after the dinner was similar to the earlier study, but glucose levels only returned to fasting values at 2AM in the night (vs. 10 PM in young, lean participants, Figure 5A), showing that despite higher insulin levels, glucose homeostasis was not reached until 6 hours after dinner. Whether this observation is only attributable to muscle insulin sensitivity or also due to blunted suppression of hepatic glucose production cannot be inferred from these data. Future studies could measure insulin signaling markers, such as phosphorylation status of AKT or AS160 in muscle biopsies taken around the clock. However, due to lack of muscle material this was not possible in the current study. Furthermore, FFA levels – substrates that are released from adipose tissue under fasting conditions – were high in the fasted state, but had a relatively small amplitude over the 24-h period compared to the profile of young and lean participants, again suggesting that in our older, overweight population the effect of fasting on substrate oxidation was attenuated. Elevated postprandial insulin levels may play a role herein, as insulin inhibits adipose tissue lipolysis [40]. Finally, triglyceride levels increased during the day and only started to decline after midnight at 12 AM. The increase in TG during the day might be explained in part by chylomicrons that enter the circulation postprandially. Indeed, also in the previous study, TG increased clearly after the dinner, which had the highest fat content of all meals (Figure 5D). However, compared to the lean, healthy volunteers, TG levels in the present study are consistently high and keep increasing until midnight, again in agreement with a prolonged fed state. An alternative mechanism underlying this observation might be increased hepatic VLDL-TG production that is stimulated by higher postprandial insulin levels in the insulin resistant state [41; 42].
This study does not come without limitations. The lack of a control group with similar age but normal weight or insulin sensitive prevents us from drawing conclusions whether aging, overweight or insulin resistance it responsible for the lack of rhythmicity. Furthermore, we only included Caucasian men in both our current and previous study and our findings need to be confirmed in a more diverse population.
Niels_Proefschrift.indd 160Niels_Proefschrift.indd 160 08/12/2020 18:05:2908/12/2020 18:05:29
161
Day-Night Rhythm of Skeletal Muscle Metabolism
Conclusions
We show here that in older, metabolically comprised participants, mitochondrial oxidative capacity of skeletal muscle does not exhibit a day-night rhythm. Furthermore, we report that the rhythmicity of PER2, a member of the internal circadian clock is affected. Additional metabolic parameters demonstrate that features of metabolic inflexibility can be observed during over the full 24-h day-night cycle and that older, insulin resistant participants do not enter a typical feeding-fasting cycle, even when fed in energy balance. Future studies are needed to explore strategies that can restore the day-night rhythm in mitochondrial oxidative capacity and substrate oxidation.
Author contributions
J.W., N.J.C., D.v.M., M.K.C.H., B.H., J.H., P.S. designed research; J.W., N.J.C., C.E.F., C.A. V.d.W. performed research; J.W., C.E.F., E.M-K., J.A.J, J.H., P.S. analyzed samples and data. J.W., P.S. wrote the manuscript. P.S. is the guarantor of this work and, as such, had full access to all the data in the study and takes responsibility for the integrity of the data and the accuracy of the data analysis.
Acknowledgements
We thank the research volunteers for their participation. This work is partly financed by the Netherlands Organization for Scientific Research (TOP 40-00812-98-14047 to P.S.). We acknowledge the support from the Netherlands Cardiovascular Research Initiative: an initiative with support of the Dutch Heart Foundation (CVON2014-02 ENERGISE). J. Hoeks is supported by a Vidi Grant (917.14.358) for innovative research from the Netherlands Organization for Scientific Research (NWO) and a Senior Fellowship from the Dutch Diabetes Research Foundation (grant number 2013.82.1639).
5
Niels_Proefschrift.indd 161Niels_Proefschrift.indd 161 08/12/2020 18:05:2908/12/2020 18:05:29

162
Chapter 5
Supplemental Figures
Supplemental Figure 1 – Study design. Subjects stayed in a room of the metabolic research for a total of 44 hours. Meals were determined based on metabolic rate of the subjects: B, breakfast; L, lunch; D, dinner. M, measurement indicates timepoint of indirect calorimetry followed by muscle biopsy.
Supplemental Figure 2 – Core Body Temperature (CBT) during day of the study protocol. Temperature (°C) was recorded every 15 seconds and averaged per subject into 30 min bins. The dark grey area represents the sleeping period (12AM - 7AM). The characteristic drop in CBT beginning in the evening shows similar entrainment of the central circadian clock between subjects. Depicted is CBT mean ± SEM of n=11 subjects.
Niels_Proefschrift.indd 162Niels_Proefschrift.indd 162 08/12/2020 18:05:3308/12/2020 18:05:33
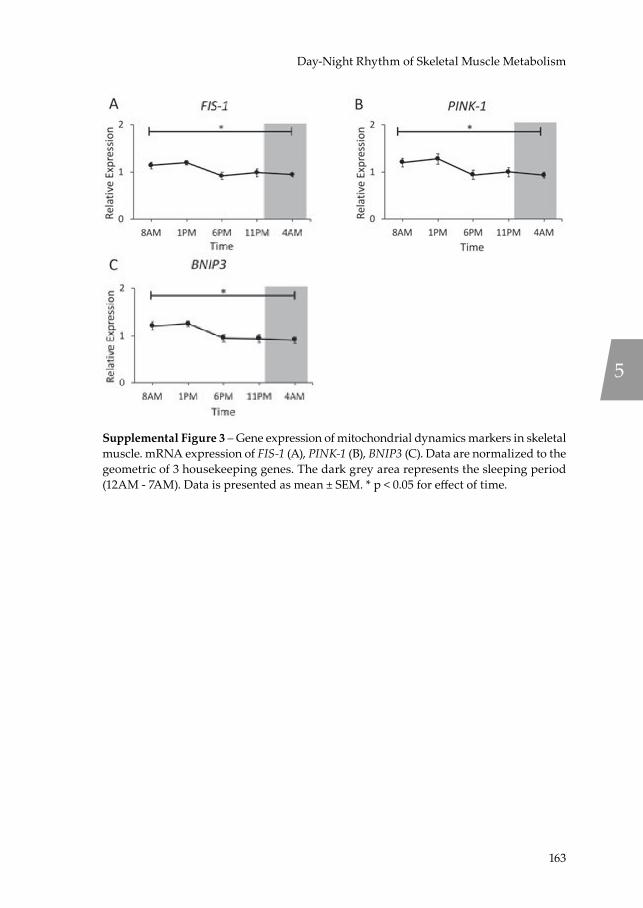
163
Day-Night Rhythm of Skeletal Muscle Metabolism
Supplemental Figure 3 – Gene expression of mitochondrial dynamics markers in skeletal muscle. mRNA expression of FIS-1 (A), PINK-1 (B), BNIP3 (C). Data are normalized to the geometric of 3 housekeeping genes. The dark grey area represents the sleeping period (12AM - 7AM). Data is presented as mean ± SEM. * p < 0.05 for effect of time.
5
Niels_Proefschrift.indd 163Niels_Proefschrift.indd 163 08/12/2020 18:05:3408/12/2020 18:05:34
164
Chapter 5
References[1] Vetter, C., Dashti, H.S., Lane, J.M., Anderson, S.G., Schernhammer, E.S., Rutter,
M.K., et al., 2018. Night Shift Work, Genetic Risk, and Type 2 Diabetes in the UK Biobank. Diabetes Care 41(4):762-769.
[2] Morris, C.J., Yang, J.N., Garcia, J.I., Myers, S., Bozzi, I., Wang, W., et al., 2015. Endogenous circadian system and circadian misalignment impact glucose tolerance via separate mechanisms in humans. Proc Natl Acad Sci U S A 112(17):E2225-2234.
[3] Wefers, J., van Moorsel, D., Hansen, J., Connell, N.J., Havekes, B., Hoeks, J., et al., 2018. Circadian misalignment induces fatty acid metabolism gene profiles and compromises insulin sensitivity in human skeletal muscle. Proc Natl Acad Sci U S A 115(30):7789-7794.
[4] Jarrett, R.J., Keen, H., 1969. Diurnal variation of oral glucose tolerance: a possible pointer to the evolution of diabetes mellitus. Br Med J 2(5653):341-344.
[5] Archer, S.N., Laing, E.E., Moller-Levet, C.S., van der Veen, D.R., Bucca, G., Lazar, A.S., et al., 2014. Mistimed sleep disrupts circadian regulation of the human transcriptome. Proc Natl Acad Sci U S A 111(6):E682-691.
[6] Perrin, L., Loizides-Mangold, U., Chanon, S., Gobet, C., Hulo, N., Isenegger, L., et al., 2018. Transcriptomic analyses reveal rhythmic and CLOCK-driven pathways in human skeletal muscle. Elife 7.
[7] Depner, C.M., Melanson, E.L., McHill, A.W., Wright, K.P., Jr., 2018. Mistimed food intake and sleep alters 24-hour time-of-day patterns of the human plasma proteome. Proc Natl Acad Sci U S A 115(23):E5390-e5399.
[8] Ang, J.E., Revell, V., Mann, A., Mantele, S., Otway, D.T., Johnston, J.D., et al., 2012. Identification of human plasma metabolites exhibiting time-of-day variation using an untargeted liquid chromatography-mass spectrometry metabolomic approach. Chronobiol Int 29(7):868-881.
[9] van Moorsel, D., Hansen, J., Havekes, B., Scheer, F.A., Jorgensen, J.A., Hoeks, J., et al., 2016. Demonstration of a day-night rhythm in human skeletal muscle oxidative capacity. Mol Metab 5(8):635-645.
[10] Ritov, V.B., Menshikova, E.V., He, J., Ferrell, R.E., Goodpaster, B.H., Kelley, D.E., 2005. Deficiency of subsarcolemmal mitochondria in obesity and type 2 diabetes. Diabetes 54(1):8-14.
[11] Goodpaster, B.H., Sparks, L.M., 2017. Metabolic Flexibility in Health and Disease. Cell Metab 25(5):1027-1036.
[12] Mari, A., Pacini, G., Murphy, E., Ludvik, B., Nolan, J.J., 2001. A model-based method for assessing insulin sensitivity from the oral glucose tolerance test. Diabetes Care 24(3):539-548.
[13] 2006. World Health Organization. Definition and diagnosis of diabetes mellitus and intermediate hyperglycaemia: report of a WHO/IDF consultation.
[14] 2017. 2. Classification and Diagnosis of Diabetes. Diabetes Care 40(Suppl 1):S11-s24.[15] Schoffelen, P.F., Westerterp, K.R., Saris, W.H., Ten Hoor, F., 1997. A dual-respiration
chamber system with automated calibration. J Appl Physiol (1985) 83(6):2064-2072.[16] Harris, J.A., Benedict, F.G., 1918. A Biometric Study of Human Basal Metabolism.
Proc Natl Acad Sci U S A 4(12):370-373.
Niels_Proefschrift.indd 164Niels_Proefschrift.indd 164 08/12/2020 18:05:3408/12/2020 18:05:34

165
Day-Night Rhythm of Skeletal Muscle Metabolism
[17] Bergstrom, J., 1975. Percutaneous needle biopsy of skeletal muscle in physiological and clinical research. Scand J Clin Lab Invest 35(7):609-616.
[18] Phielix, E., Schrauwen-Hinderling, V.B., Mensink, M., Lenaers, E., Meex, R., Hoeks, J., et al., 2008. Lower intrinsic ADP-stimulated mitochondrial respiration underlies in vivo mitochondrial dysfunction in muscle of male type 2 diabetic patients. Diabetes 57(11):2943-2949.
[19] Hoeks, J., van Herpen, N.A., Mensink, M., Moonen-Kornips, E., van Beurden, D., Hesselink, M.K., et al., 2010. Prolonged fasting identifies skeletal muscle mitochondrial dysfunction as consequence rather than cause of human insulin resistance. Diabetes 59(9):2117-2125.
[20] Weir, J.B., 1949. New methods for calculating metabolic rate with special reference to protein metabolism. J Physiol 109(1-2):1-9.
[21] Rivero-Gutierrez, B., Anzola, A., Martinez-Augustin, O., de Medina, F.S., 2014. Stain-free detection as loading control alternative to Ponceau and housekeeping protein immunodetection in Western blotting. Anal Biochem 467:1-3.
[22] Hellemans, J., Mortier, G., De Paepe, A., Speleman, F., Vandesompele, J., 2007. qBase relative quantification framework and software for management and automated analysis of real-time quantitative PCR data. Genome Biol 8(2):R19.
[23] Hughes, M.E., Hogenesch, J.B., Kornacker, K., 2010. JTK_CYCLE: an efficient nonparametric algorithm for detecting rhythmic components in genome-scale data sets. J Biol Rhythms 25(5):372-380.
[24] Klerman, E.B., Gershengorn, H.B., Duffy, J.F., Kronauer, R.E., 2002. Comparisons of the variability of three markers of the human circadian pacemaker. J Biol Rhythms 17(2):181-193.
[25] Hansen, J., Timmers, S., Moonen-Kornips, E., Duez, H., Staels, B., Hesselink, M.K., et al., 2016. Synchronized human skeletal myotubes of lean, obese and type 2 diabetic patients maintain circadian oscillation of clock genes. Sci Rep 6:35047.
[26] Petersen, K.F., Befroy, D., Dufour, S., Dziura, J., Ariyan, C., Rothman, D.L., et al., 2003. Mitochondrial dysfunction in the elderly: possible role in insulin resistance. Science 300(5622):1140-1142.
[27] Kelley, D.E., He, J., Menshikova, E.V., Ritov, V.B., 2002. Dysfunction of mitochondria in human skeletal muscle in type 2 diabetes. Diabetes 51(10):2944-2950.
[28] Kelley, D.E., Goodpaster, B., Wing, R.R., Simoneau, J.A., 1999. Skeletal muscle fatty acid metabolism in association with insulin resistance, obesity, and weight loss. Am J Physiol 277(6):E1130-1141.
[29] de Ligt, M., Bruls, Y.M.H., Hansen, J., Habets, M.F., Havekes, B., Nascimento, E.B.M., et al., 2018. Resveratrol improves ex vivo mitochondrial function but does not affect insulin sensitivity or brown adipose tissue in first degree relatives of patients with type 2 diabetes. Mol Metab 12:39-47.
[30] Jacobi, D., Liu, S., Burkewitz, K., Kory, N., Knudsen, N.H., Alexander, R.K., et al., 2015. Hepatic Bmal1 Regulates Rhythmic Mitochondrial Dynamics and Promotes Metabolic Fitness. Cell Metab 22(4):709-720.
[31] Dahlmans, D., Houzelle, A., Schrauwen, P., Hoeks, J., 2016. Mitochondrial dynamics, quality control and miRNA regulation in skeletal muscle: implications for obesity and related metabolic disease. Clin Sci (Lond) 130(11):843-852.
[32] Gobet, C., Naef, F., 2017. Ribosome profiling and dynamic regulation of translation in mammals. Curr Opin Genet Dev 43:120-127.
5
Niels_Proefschrift.indd 165Niels_Proefschrift.indd 165 08/12/2020 18:05:3408/12/2020 18:05:34
166
Chapter 5
[33] Woldt, E., Sebti, Y., Solt, L.A., Duhem, C., Lancel, S., Eeckhoute, J., et al., 2013. Rev-erb-alpha modulates skeletal muscle oxidative capacity by regulating mitochondrial biogenesis and autophagy. Nat Med 19(8):1039-1046.
[34] Neufeld-Cohen, A., Robles, M.S., Aviram, R., Manella, G., Adamovich, Y., Ladeuix, B., et al., 2016. Circadian control of oscillations in mitochondrial rate-limiting enzymes and nutrient utilization by PERIOD proteins. Proc Natl Acad Sci U S A.
[35] Hong, H.K., Maury, E., Ramsey, K.M., Perelis, M., Marcheva, B., Omura, C., et al., 2018. Requirement for NF-kappaB in maintenance of molecular and behavioral circadian rhythms in mice. Genes Dev 32(21-22):1367-1379.
[36] Tantiwong, P., Shanmugasundaram, K., Monroy, A., Ghosh, S., Li, M., DeFronzo, R.A., et al., 2010. NF-kappaB activity in muscle from obese and type 2 diabetic subjects under basal and exercise-stimulated conditions. Am J Physiol Endocrinol Metab 299(5):E794-801.
[37] Stenvers, D.J., Jongejan, A., Atiqi, S., Vreijling, J.P., Limonard, E.J., Endert, E., et al., 2019. Diurnal rhythms in the white adipose tissue transcriptome are disturbed in obese individuals with type 2 diabetes compared with lean control individuals. Diabetologia 62(4):704-716.
[38] McHill, A.W., Melanson, E.L., Higgins, J., Connick, E., Moehlman, T.M., Stothard, E.R., et al., 2014. Impact of circadian misalignment on energy metabolism during simulated nightshift work. Proc Natl Acad Sci U S A 111(48):17302-17307.
[39] Corpeleijn, E., Mensink, M., Kooi, M.E., Roekaerts, P.M., Saris, W.H., Blaak, E.E., 2008. Impaired skeletal muscle substrate oxidation in glucose-intolerant men improves after weight loss. Obesity (Silver Spring) 16(5):1025-1032.
[40] Frayn, K.N., 2002. Adipose tissue as a buffer for daily lipid flux. Diabetologia 45(9):1201-1210.
[41] Grundy, S.M., Mok, H.Y., Zech, L., Steinberg, D., Berman, M., 1979. Transport of very low density lipoprotein triglycerides in varying degrees of obesity and hypertriglyceridemia. J Clin Invest 63(6):1274-1283.
[42] Gill, J.M., Sattar, N., 2011. Hepatic VLDL overproduction: is hyperinsulinemia or insulin resistance the culprit? J Clin Endocrinol Metab 96(7):2032-2034.
Niels_Proefschrift.indd 166Niels_Proefschrift.indd 166 08/12/2020 18:05:3408/12/2020 18:05:34

167
Day-Night Rhythm of Skeletal Muscle Metabolism
5
Niels_Proefschrift.indd 167Niels_Proefschrift.indd 167 08/12/2020 18:05:3408/12/2020 18:05:34

Niels_Proefschrift.indd 168Niels_Proefschrift.indd 168 08/12/2020 18:05:3408/12/2020 18:05:34

6No Evidence For Brown Adipose Tissue Activation After Creatine Supplementation In Adult Vegetarians
N.J. Connell1, D. Doligkeit1, C. Andriessen1, E. Kornips-Moonen1, Y.M.H. Bruls2, V.B. Schrauwen-Hinderling1,2, T. van de Weijer1,2, W.D. van Marken-Lichtenbelt1, B. Havekes1,3, L. Kazak4,5, B.M. Spiegelman6, J. Hoeks1, P. Schrauwen1.
1 Department of Nutrition and Movement Sciences, NUTRIM School for Nutrition and Translational
Research in Metabolism, Maastricht University, 6200 MD Maastricht, the Netherlands2 Department of Radiology and Nuclear Medicine, NUTRIM School for Nutrition and Translational
Research in Metabolism, Maastricht University Medical Center+, 5800 AZ Maastricht, the
Netherlands3 Department of Internal Medicine, Division of Endocrinology, NUTRIM School for Nutrition and
Translational Research in Metabolism, Maastricht University Medical Center+, 5800 AZ Maastricht,
the Netherlands4 Goodman Cancer Research Centre, McGill University, Montreal, Quebec, Canada.5 Department of Biochemistry, McGill University, Montreal, Quebec, Canada.6 Dana-Farber Cancer Institute, Department of Cell Biology, Harvard Medical School, Boston, MA,
USA
Nature Metabolism. In press.
Niels_Proefschrift.indd 169Niels_Proefschrift.indd 169 08/12/2020 18:05:3408/12/2020 18:05:34
170
Chapter 6
Abbreviations18F-FDG 18F-Fluordeoxyglucose31P-MRS 31P-Magnetic resonance spectroscopyADP Adenosine diphosphateAMPK 5’ adenosine monophosphate-activated protein kinaseATP Adenosine triphosphateBAT Brown adipose tissueBMI Body mass indexBMR Basal metabolic rateCIT Cold-induced thermogenesisCytC Cytochrome CDIT Diet-induced thermogenesisE2 EstradiolFFA Free fatty acidsFCCP Carbonylcyanide-4-(trifluoromethoxy)-phenylhydrazoneGAMT Glycine amidinotransferaseGLUT4 Glucose transporter 4NST Non-shivering thermogenesisMBq MegabecquerelPCr PhosphocreatinePET-CT Positron emission tomography – computed tomographyPET-MRI Positron emission tomography – magnetic resonance imagingPPARα Peroxisome proliferator-activated receptor alphaRER Respiratory exchange ratioSUV Standard uptake valueTG TriglyceridesUCP1 Uncoupling protein 1WAT White adipose tissue
Niels_Proefschrift.indd 170Niels_Proefschrift.indd 170 08/12/2020 18:05:3408/12/2020 18:05:34

171
Creatine and Brown Adipose Tissue
Abstract
Recently, creatine availability in adipose tissue has been shown to have profound effects on thermogenesis and energy balance in mice. We investigated the potential of creatine supplementation in brown adipose tissue (BAT) activation in humans, aiming to elucidate the therapeutic potential to combat obesity. Therefore, we conducted a double-blind, randomized, placebo-controlled, cross-over trial (NCT04086381 at clinicaltrials.gov) and we supplemented fourteen young, healthy, vegetarian adults with 20 grams of creatine monohydrate daily, who are characterised by low creatine levels. Participants were eligible if they met the following criteria: male or female, Caucasian, 18 - 30 years of age, consuming a vegetarian diet (≥ 6 months), BMI 20 - 25 kg/m2. BAT activation following acute cold exposure was determined by calculating standard uptake values (SUV) acquired by 18F-fluorodeoxyglucose (18F-FDG) positron emission tomography - magnetic resonance imaging (PET-MRI). BAT volume (-31,32 (19.32) SUV [95%CI -73.06, 10.42; p = 0.129]), SUVmean (-0.34 (0.29) SUV [95%CI -0.97, 0.28; p = 0.254]), and SUVmax (-2.49 (2.64) SUV [95%CI -8.20, 3.21; p = 0.362]) upon acute cold exposure were similar between placebo and creatine supplementation. No side effects of creatine supplementation were reported, one participant experienced bowel complaints during placebo which resolved without intervention. We show, that creatine monohydrate supplementation in young, healthy, lean vegetarian adults does not enhance BAT activation after acute cold exposure.
6
Niels_Proefschrift.indd 171Niels_Proefschrift.indd 171 08/12/2020 18:05:3408/12/2020 18:05:34

172
Chapter 6
Introduction
Obesity is the result of a positive energy balance, i.e. a chronic surplus in energy intake as compared to energy expended. Therefore, pathways involved in promoting energy expenditure have gained attention in light of the prevailing obesity pandemic. Over the last decade, much research has been devoted to brown adipose tissue (BAT), a tissue capable of dissipating energy as heat through non-shivering thermogenesis (NST) by means of uncoupling protein 1 (UCP1), which uncouples oxygen consumption from adenosine triphosphate (ATP) production 1. Over the past years, the paradigm of classical, UCP1-dependent BAT depots has been expanded upon, as white adipose tissue depots in rodents have demonstrated the capacity to rapidly switch into energy-consuming brown-like adipocytes, also called beige adipocytes 2-4. Furthermore, we, and others, were able to demonstrate that adult humans also have functional BAT depots that produce heat upon cold exposure 5-7 and after intake of a high-energy meal 8, underscoring that stimulating NST is a potentially effective strategy to combat obesity in humans 9,10. However, there is a low prevalence of detectable BAT depots in humans 11, which is paralleled by an age-dependent decline of BAT 12 and an inverse relationship between active BAT and body mass index (BMI) 5. Together, these factors complicate the implementation of promising (pre-)clinical findings to combat obesity in humans.
The majority of research conducted in this area has revolved around the activation of UCP1 in BAT through cold or β-adrenergic stimulation. Earlier work had shown that the requirement for UCP1 in cold-resistance was only observed in inbred mouse strains; F1 crosses of UCP1 knock-outs in two different mouse strains were cold-resistant 13. Interestingly, in 2015, Kazak et al. uncovered a creatine-driven substrate cycle that supports thermogenesis in murine beige adipocytes 14. Subsequent disruption of creatine abundance in adipose tissue via adipocyte-specific glycine amidinotransferase (GATM) knock-out in mice 15 and through adipocyte-specific ablation of the creatine transporter 16 revealed a mild reduction in cold-tolerance, a reduced diet-induced thermogenesis (DIT) capacity in response to a high fat diet (60% kcal from fat), an increased metabolic efficiency, and reduced glucose tolerance 15,16. Importantly, dietary supplementation with creatine prolonged the capacity of a β3 agonist (CL 316, 243) to sustain adrenergic activation of metabolic rate in GATM knock-out mice, without changing the maximal β3 agonist-dependent response 15. In wild-type
Niels_Proefschrift.indd 172Niels_Proefschrift.indd 172 08/12/2020 18:05:3508/12/2020 18:05:35
173
Creatine and Brown Adipose Tissue
mice, dietary creatine supplementation yielded higher β3 adrenergic agonist-dependent energy expenditure when simultaneously challenged with a high-fat diet in comparison with non-supplemented littermates 16. Importantly, no response to creatine supplementation was elicited upon creatine supplementation on low fat chow diet 16. Together, these studies indicate that creatine availability may have profound effects on DIT and play a substantial role in the regulation of energy balance. Nonetheless, very little is known about the relevance of this pathway in human energy metabolism. Furthermore, whether creatine supplementation, without the concomitant addition of a β3 agonist, is sufficient on its own to activate cold or diet-induced thermogenesis has not been studied. Some support for a link between creatine metabolism and BAT activity in humans comes from a retrospective analysis of positron emission tomography – computed tomography (PET-CT) scans, showing a positive association between the estimated renal creatinine clearance and BAT activation 17. Cultured human brown adipose cells also show a dependence on creatine for cellular respiration 14. However, to date, the evidence supporting the notion that creatine availability in human subjects enhances the capacity for DIT and/or BAT activity is lacking. To this end, we here aimed to determine whether creatine monohydrate supplementation can increase diet-induced thermogenesis and activate brown adipose tissue in healthy, vegetarian adults who are characterized by low creatine availability 18-21.
Methods and materials
Participants
Fourteen Caucasian, young, vegetarian adults (aged 18 – 30 years, BMI 20 – 25 kg/m2) were recruited from the general population in the vicinity of Maastricht, the Netherlands, through advertisements. The study was conducted in accordance with the principles of the declaration of Helsinki and approved by the Ethics Committee of the Maastricht University Medical Center+. All participants provided written informed consent. The study was registered under identifier NCT04086381 at https://clinicaltrials.gov. Due to an administrative error, the status of the study was not changed to ‘public’ at the time of registration and therefore the registration date is after the start of the study. Supportive documentation was provided to the editorial office to confirm the unintentional late registration. The study was conducted between May 2018 and January 2020 and concluded meeting the required sample size of n = 14 for the primary outcome of the study.
6
Niels_Proefschrift.indd 173Niels_Proefschrift.indd 173 08/12/2020 18:05:3508/12/2020 18:05:35
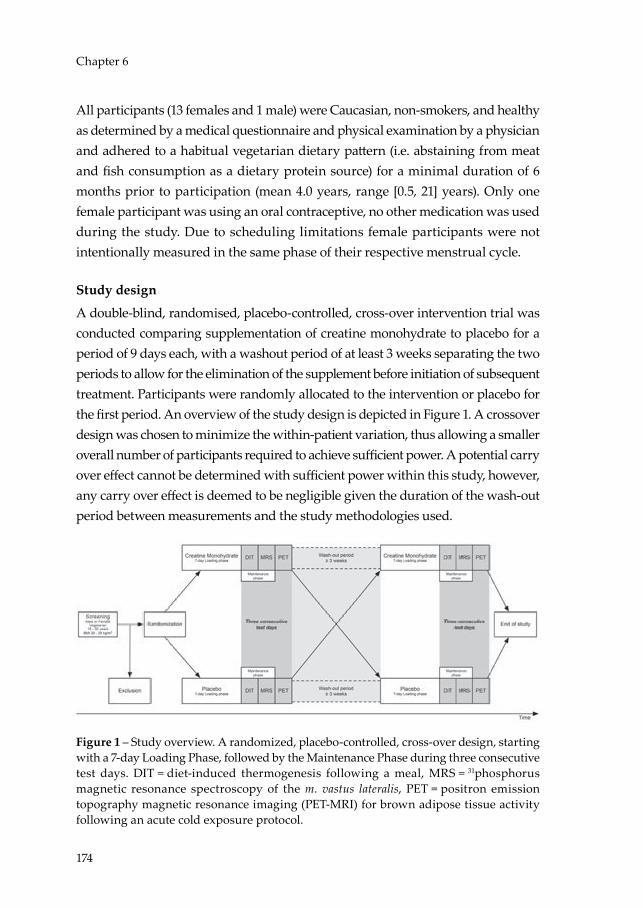
174
Chapter 6
All participants (13 females and 1 male) were Caucasian, non-smokers, and healthy as determined by a medical questionnaire and physical examination by a physician and adhered to a habitual vegetarian dietary pattern (i.e. abstaining from meat and fish consumption as a dietary protein source) for a minimal duration of 6 months prior to participation (mean 4.0 years, range [0.5, 21] years). Only one female participant was using an oral contraceptive, no other medication was used during the study. Due to scheduling limitations female participants were not intentionally measured in the same phase of their respective menstrual cycle.
Study design
A double-blind, randomised, placebo-controlled, cross-over intervention trial was conducted comparing supplementation of creatine monohydrate to placebo for a period of 9 days each, with a washout period of at least 3 weeks separating the two periods to allow for the elimination of the supplement before initiation of subsequent treatment. Participants were randomly allocated to the intervention or placebo for the first period. An overview of the study design is depicted in Figure 1. A crossover design was chosen to minimize the within-patient variation, thus allowing a smaller overall number of participants required to achieve sufficient power. A potential carry over effect cannot be determined with sufficient power within this study, however, any carry over effect is deemed to be negligible given the duration of the wash-out period between measurements and the study methodologies used.
Figure 1 – Study overview. A randomized, placebo-controlled, cross-over design, starting with a 7-day Loading Phase, followed by the Maintenance Phase during three consecutive test days. DIT = diet-induced thermogenesis following a meal, MRS = 31phosphorus magnetic resonance spectroscopy of the m. vastus lateralis, PET = positron emission topography magnetic resonance imaging (PET-MRI) for brown adipose tissue activity following an acute cold exposure protocol.
Niels_Proefschrift.indd 174Niels_Proefschrift.indd 174 08/12/2020 18:05:3608/12/2020 18:05:36

175
Creatine and Brown Adipose Tissue
During the entire study, subjects were requested to maintain their habitual dietary pattern, without further dietary restrictions, thereby limiting dietary interference with the intervention.
Screening procedure
During the screening, eligibility of the participants was determined based on a medical history questionnaire, habitual physical activity as assessed by Baecke’s Habitual Physical Activity Questionnaire 22, height, weight and blood pressure were measured, and a fasted venous blood sample was acquired for assessment of glucose, creatinine, and haemoglobin (summarised in Table 1). Reasons for exclusion included: non-vegetarian habitual diet, excessive alcohol and/or drug abuse, significant allergies or intolerances concerning the study products, medication use known to hamper the participant’s safety during the study procedures.
Table 1 – Participant characteristics at screening.
Participant characteristicsSex (female / male) 13 / 1Age (years) 21.4 (2.5)Duration of being vegetarian (years) 4.0 (5.4)Height (cm) 168.2 (7.8)Weight (kg) 64.7 (7.0)Body Mass Index (kg/m2) 22.85 (1.49)Systolic Blood Pressure (mmHg) 113 (7)Diastolic Blood Pressure (mmHg) 76 (6)Heart rate (beats per minute) 71 (11)
Blood parametersHaemoglobin (mmol/L) 8.1 (0.5)Creatinine (µmol/L) 69 (8)Glucose (mmol/L) 5.1 (0.4)
Baecke Physical Activity Index 8.655 (0.779)Work Index 1.959 (0.360)Sport Index 2.732 (0.268)Leisure Index 3.964 (0.414)
Data is presented as mean (standard deviation) for n = 14.
6
Niels_Proefschrift.indd 175Niels_Proefschrift.indd 175 08/12/2020 18:05:3608/12/2020 18:05:36
176
Chapter 6
Supplementation protocol
For 7 consecutive days, subjects consumed four daily servings of 5 grams of creatine monohydrate (Creapure, AlzChem Trostberg GmbH) and 10 grams of maltodextrin (MD20, Avebe) which were ingested with lukewarm water just before a meal or sleep, to ensure saturation of the creatine stores (Loading Phase). On day 8 and 9, the participants continued with two daily servings to maintain the saturation levels (Maintenance Phase) (see Figure 1). The maintenance doses on Day 8 were consumed after completion of the measurements during dinner and before sleep on Day 8. On Day 9, the doses were consumed during breakfast and before sleep with measurements conducted in the afternoon. Maltodextrin was added to aid the absorption of the creatine monohydrate 23,24. In order to keep the intervention and placebo isocaloric and maintain the same powder volume, the placebo consisted of 5 grams of carboxymethylcellulose (Carboxymethylcellulose, Boom B.V.) combined with 5 grams of maltodextrin.
Measurements
On Day 8, following the 7-day Loading Phase and following an overnight fast from 10 PM, body composition (i.e. fat mass, fat-free mass) and total body mass were determined using air displacement plethysmopgraphy (BodPod®, Cosmed, Rome, Italy). Thereafter, the basal metabolic rate (BMR) and respiratory exchange ratio (RER) were determined by means of indirect calorimetry (Omnical, IDEE, Maastricht, the Netherlands) by measuring whole-body oxygen consumption and carbon dioxide production in the resting state. Whole-body energy expenditure, respiratory exchange ratio (RER) and carbohydrate and lipid oxidation rates were calculated with the assumption of a negligible protein oxidation 25. Next, a skeletal muscle biopsy was obtained from the m. vastus lateralis according to the Bergström method 26 using a side-cutting needle under local anaesthesia using 1.0% lidocaine (10 mg/mL) without epinephrine. A portion of the biopsy was immediately placed in ice-cold preservation medium (BIOPS, OROBOROS Instruments, Innsbruck, Austria) and used for the preparation of permeabilized muscle fibres and subsequent measurement of mitochondrial oxidative capacity. The remaining portion of the muscle biopsy was immediately frozen in melting isopentane and stored at minus 80 degrees Celsius for later analyses.
Subsequently, participants consumed a high-calorie, carbohydrate-rich meal and indirect calorimetry was performed for a continuous period of 5 hours,
Niels_Proefschrift.indd 176Niels_Proefschrift.indd 176 08/12/2020 18:05:3608/12/2020 18:05:36

177
Creatine and Brown Adipose Tissue
whilst the participants remained in the supine position. DIT was quantified by subtracting BMR from the whole-body energy expenditure during the 5-hour measurement. Directly prior to (T0) and following ingestion of the meal, venous blood samples were obtained at T30, T60, T90, T120, T180, T240 and T300 minutes. The meal consisted of approximately 40% of the participant’s daily energy intake, as determined by the Harris – Benedict formula 27 multiplied with a physical activity factor of 1.4. The average energy value of the ingested meals was 3449 kJ [95%CI 3294, 3603] for the creatine condition versus 3475 kJ [95%CI 3314, 3637] in the placebo condition. Meal composition was ~81% carbohydrate, ~13% protein, and ~6% fat as described and performed previously by Vosselman et al. 8, using medical nutritional products to ensure swift absorption in the gut (Nutridrink Compact and NutriCal, Nutricia Advanced Medical Nutrition). Participants were instructed to ingest the meal in 3 minutes or less, after which the continuous indirect calorimetry and time series blood sampling commenced.
On Day 9, the quantification of phosphorus energy metabolites (phosphocreatine (PCr) and ATP) in the m. vastus lateralis was performed by means of 31Phosphorous Magnetic Resonance Spectroscopy (31P-MRS) in the resting state, during exercise, and during recovery from exercise. To this end, the participant was positioned in the supine position with a surface coil of 5-6 cm diameter on the m. vastus lateralis in the 3T MRI scanner (Achieva Tx; Philips Heathcare, Best, the Netherlands) in an exercise device to perform knee-extension exercise. At first, a spectrum at rest was acquired with long repetition time (FID, TR = 15s, BW = 3000Hz, number of points = 2048, NSA = 8) and PCr and ATP resonances were quantified and corrected for T1 saturation in order to calculate resting PCr/ATP. Absolute PCr concentrations were calculated assuming a concentration of ATP of 8.2 mMol. The participants performed knee-extension exercises for 5 minutes at a rate of 30 repetitions per minute. Before, during and after exercise, spectra were acquired every 4 seconds (FID, TR = 4s, BW = 3000 Hz, number of points = 2048). The area under the curve of the PCr and ATP peaks was determined by fitting the spectra with custom-written software in MATLAB (Mathworks, Inc., USA). PCr recovery kinetics follow a mono-exponential curve, as such, the data was fitted to compute the rate constant k of the PCr recovery.
On the last day (Day 10), participants were instructed to come into our facility after an overnight fast from 10 PM to undergo a personalized stepwise cooling
6
Niels_Proefschrift.indd 177Niels_Proefschrift.indd 177 08/12/2020 18:05:3608/12/2020 18:05:36
178
Chapter 6
protocol. Firstly, iButtons (iButton®, Thermochron) were attached with an adhesive to measure skin temperature continuously 28. Mean skin temperatures and gradients were calculated using skin temperatures measured at 14 predefined ISO9886 sites 29. Hereafter, participants were instructed to lay on a bed in a water-perfused suit (ThermaWrap Universal 3166 MTRE; Advanced Technologies Ltd.) which was connected to two water CSZ Blanketrol III Hyper-Hypothermia Temperature Management Systems (Soma Technology, Inc., USA) set at 36 degrees Celsius. Over the following three hours, and in preparation of the 18F-fluorodeoxyglucose (18F-FDG) positron emission tomography - magnetic resonance imaging (PET-MRI) scan to quantify activated BAT, participants were subjected to a stepwise cooling protocol, during which, the temperature of the water-perfused suit was decreased by 4 degrees Celsius every 15 minutes until the onset of shivering as reported by the participant and subsequently observed by the researcher. At the point of shivering, the participants went through a heat-cycle for 10 minutes with the suit at 34 degrees Celsius to cease shivering. The temperature of the suit was then dropped back down to 2 degrees above the shivering threshold and stabilized to induce maximal NST. Prior to and after the cooling protocol, whole body energy expenditure was measured for 30 minutes by means of indirect calorimetry (EZCal, IDEE, Maastricht, the Netherlands). The first 30 minutes were measured under baseline conditions at 36 degrees Celsius, the second 30 minutes was measured once the participant was stabilized just above the shivering threshold. At the end of each indirect calorimetry measurement, a venous blood sample was acquired.
Skeletal muscle mitochondrial function
Permeabilized muscle fibres were prepared freshly from the obtained muscle biopsies, as described previously 30. In permeabilized muscle fibres, oxygen consumption was measured by high-resolution respirometry using a two-chamber Oxygraph system (OROBOROS Instruments). During the experiment, a multisubstrate-uncoupler protocol was performed in quadruplicate, with substrates used including: malate, octanoyl-carnitine, adenosine diphosphate (ADP), glutamate, succinate and carbonylcyanide-4-(trifluoromethoxy)-phenylhydrazone (FCCP), as described previously 31. The integrity of the outer mitochondrial membrane was assessed by the addition of cytochrome C (CytC) upon maximal coupled respiration (State 3) and deemed intact if the response
Niels_Proefschrift.indd 178Niels_Proefschrift.indd 178 08/12/2020 18:05:3608/12/2020 18:05:36

179
Creatine and Brown Adipose Tissue
to the cytochrome C addition remained under 10%, hence we excluded 13 experiments for exceeding this limit.
Brown adipose tissue activation through 18F-FDG PET-MRI
BAT, white adipose tissue (WAT), and skeletal muscle tissue tracer uptake were measured by means of a 18F-FDG PET-MRI scan. Participants were injected through an antecubital venous catheter with a standardized amount of ~75 MBq of 18F-FDG at approximately 12:45 and rested in the water-perfused suit for one hour in dim-light, silent conditions with the temperature set just above the shivering threshold. Subsequently, the participants were statically scanned in the PET-MRI (Biograph mMR, Siemens, Best, the Netherlands) at approximately 13:45 from the base of the skull to the pelvic basin in 20 to 30 minutes.
BAT tracer uptake was quantified using Standard Uptake Values (SUV) calculated within the PMOD 3.7 (PMOD Technologies LLC, Switzerland) software package and in compliance with the BARCIST 1.0 (where applicable) 32. Two models to quantify BAT uptake were used: 1) Fixed volume spheres were placed in standardized locations throughout the upper body to quantify background SUVs (see Supplemental Table 1); 2) The metabolic volume of BAT was quantified using a threshold of SUV ≥ 1.5, from the base of the skull to vertebrae T12 taking all BAT probable depots into account, excluding all mediastinal metabolic volumes, after which the metabolic volume was adjusted by outlining the contours of anatomically probable BAT depots.
Biochemical analyses
Plasma and serum metabolite concentrations were quantified enzymatically with the ABX Pentra C400 (Horiba, Montpellier, France). Glucose concentrations were determined in NaF plasma (Horiba, Montpellier, France), whereas concentrations of insulin (Crystal Chem, Elk Grove Village, Illinois, USA) were measured in EDTA plasma, and free fatty acids (FFA) (Wako, Neuss, Germany) and triglycerides (TG) (Sigma, Saint Louis, Missouri, USA) were determined in serum. Creatine concentrations were determined in EDTA plasma and skeletal muscle tissue (Sigma, Saint Louis, Missouri, USA). All time points of one participant were measured in the same run.
6
Niels_Proefschrift.indd 179Niels_Proefschrift.indd 179 08/12/2020 18:05:3608/12/2020 18:05:36

180
Chapter 6
Randomization
After enrollment, participants were randomly allocated to one of the two study arms (Creatine or Placebo). The participants were randomized in blocks of 4 using the website Randomizer.org for randomisation by an independent researcher. Participants received the supplemenents in sequentially numbered containers. Both participant and investigators were blinded to the contents of the supplement containers, following the packaging of the supplements and labeling of the containers in accordance with the generated randomisation key by an independent reseacher.
Statistics
The standard deviation of the difference between an intervention and control condition for SUVmean of the glucose uptake of BAT (σ = 0.56) was previously established during a pre- and post-intervention PET-CT scan for BAT activation 9. To detect a difference of similar magnitude (m = 0.43) with our intervention, which we feel is physiologically relevant and achievable, 14 subjects must be included with power (π) of 80% and a significance level (α) of 0.05.
Statistical analysis was performed using SPSS 26 for Mac OS (IBM® SPSS® Statistics, USA) and Prism 8.3 for Windows 10 (GraphPad Software, Inc., USA). Descriptive statistics were reported for all data parameters for n = 14, unless otherwise stated, and were reported as mean (standard deviation). Pre-post changes were calculated from absolute values without correcting for baseline values and are also reported as descriptive statistic, i.e. mean (standard deviation). The paired t-test was used to compare results of the intervention and control periods. Linear regression was used to correlate outcomes. Data was presented as least square mean difference (standard error) [95% confidence interval; P-value] for outcomes of the trial. P-values < 0.05 were deemed statistically significant.
Data availability
The data that support the graphs within this paper and other findings of this study are available from the corresponding author upon reasonable request.
Niels_Proefschrift.indd 180Niels_Proefschrift.indd 180 08/12/2020 18:05:3708/12/2020 18:05:37

181
Creatine and Brown Adipose Tissue
Results
Compliance
Compliance was calculated based on the number of prescribed servings relative to the number of servings returned at the end of each study period. In Placebo, compliance was 99% (91% – 100%), with one participant omitting three sequential doses on Day 7 of the Loading Phase due to bowel complaints, which resolved without intervention. Compliance in the intervention condition (Creatine) was 100% (100%), with no adverse events reported. As a result, plasma creatine levels increased in Creatine following supplementation from Day 1 to Day 8 (13.94 (7.21) ng/µL) and did not change in Placebo from Day 1 to Day 8 (0.24 (1.09) ng/µL). Comparing Creatine to Placebo, plasma creatine levels were similar on Day 1 (0.02 (1.13) ng/µL) and higher in Creatine on Day 8 (13.72 (7.45) ng/µL). In agreement, skeletal muscle creatine concentrations were higher in Creatine than in Placebo on Day 8 (0.84 (0.88) µg/mg tissue).
Body composition remained unchanged upon creatine supplementation
Upon creatine loading a minor gain in body weight is known to occur due to a short-term retention of fluid following an increase in intracellular osmotic gradient. Here, body weight was similar between Creatine and Placebo (Table 3). In concordance, body fat percentage was not significantly different between Creatine and Placebo (Table 3).
Creatine supplementation does not enhance brown adipose tissue activation following acute cold exposure
To evaluate the effect of creatine monohydrate supplementation on the activation of BAT, a 18F-FDG PET-MRI scan was performed following acute cold exposure. Overall, BAT activation following acute cold exposure was successful in all subjects, albeit with a large variance, as illustrated by the example PET-MRI images shown in Figure 2A-C. Personalized shivering threshold temperature was not significantly different between Creatine and Placebo (-0.79 (2.83) °C). Average skin temperatures at different sites of the body were lower after cold exposure compared to baseline conditions, but mean differences in temperature changes were similar between conditions (All sensors: -0.32 °C (0.80), Proximal sensors: -0.61 °C (1.10), Distal sensors: 0.54 °C (1.86), Elbow-finger gradient: 1.04 °C (2.51)). The temperature gradient between the trunk (proximal sensors) and the
6
Niels_Proefschrift.indd 181Niels_Proefschrift.indd 181 08/12/2020 18:05:3708/12/2020 18:05:37
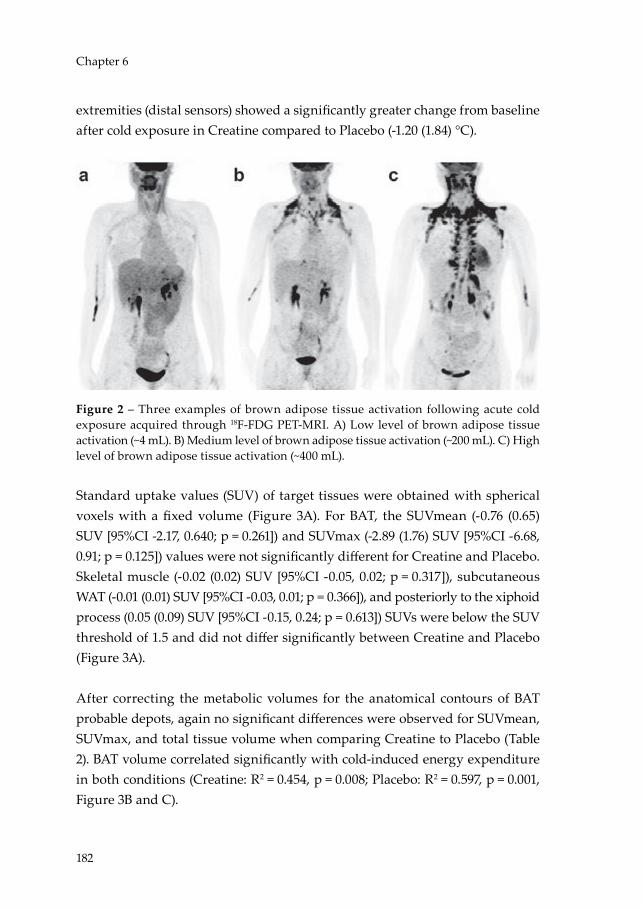
182
Chapter 6
extremities (distal sensors) showed a significantly greater change from baseline after cold exposure in Creatine compared to Placebo (-1.20 (1.84) °C).
Figure 2 – Three examples of brown adipose tissue activation following acute cold exposure acquired through 18F-FDG PET-MRI. A) Low level of brown adipose tissue activation (~4 mL). B) Medium level of brown adipose tissue activation (~200 mL). C) High level of brown adipose tissue activation (~400 mL).
Standard uptake values (SUV) of target tissues were obtained with spherical voxels with a fixed volume (Figure 3A). For BAT, the SUVmean (-0.76 (0.65) SUV [95%CI -2.17, 0.640; p = 0.261]) and SUVmax (-2.89 (1.76) SUV [95%CI -6.68, 0.91; p = 0.125]) values were not significantly different for Creatine and Placebo. Skeletal muscle (-0.02 (0.02) SUV [95%CI -0.05, 0.02; p = 0.317]), subcutaneous WAT (-0.01 (0.01) SUV [95%CI -0.03, 0.01; p = 0.366]), and posteriorly to the xiphoid process (0.05 (0.09) SUV [95%CI -0.15, 0.24; p = 0.613]) SUVs were below the SUV threshold of 1.5 and did not differ significantly between Creatine and Placebo (Figure 3A).
After correcting the metabolic volumes for the anatomical contours of BAT probable depots, again no significant differences were observed for SUVmean, SUVmax, and total tissue volume when comparing Creatine to Placebo (Table 2). BAT volume correlated significantly with cold-induced energy expenditure in both conditions (Creatine: R2 = 0.454, p = 0.008; Placebo: R2 = 0.597, p = 0.001, Figure 3B and C).
Niels_Proefschrift.indd 182Niels_Proefschrift.indd 182 08/12/2020 18:05:3908/12/2020 18:05:39

183
Creatine and Brown Adipose Tissue
To investigate if seasonal temperature could have affected the results on BAT activity, the average temperature of the ten days prior to the PET-MRI scan of each condition was calculated based on public records from the Royal Netherlands Meteorology Institute (KNMI) weather station in Maastricht, which did not differ significantly between Creatine and Placebo (-2.27 (7.47) °C). Also, ambient temperatures did not correlate with cold-induced thermogenesis (CIT) in Creatine (R2 = -0.217, p = 0.456) or in Placebo (R2 = 0.226, p = 0.437).
Table 2 – Primary trial outcomes.
Placebo Creatine Treatment difference
P-value
Brown adipose tissueSUVmean LS mean (SE) 3.55 (0.31) 3.21 (0.35) -0.34 (0.29) 0.254
[95% CI] [2.88, 4.23] [2.45, 3.96] [-0.97, 0.28]SUVmax LS mean (SE) 17.61 (2.58) 15.11 (2.89) -2.49 (2.64) 0.362
[95% CI] [12.04, 23.18] [8.87, 21.35] [-8.20, 3.21]Volume (mL) LS mean (SE) 196.40 (27.15) 165.07 (31.31) -31.32 (19.32) 0.129
[95% CI] [137.73, 255.06] [97.44, 232.71] [-73.06, 10.42]Diet-induced Thermogenesis (n = 13)iAUC (kJ) LS mean (SE) 222.82 (24.10) 215.49 (24.95) -7.33 (27.66) 0.796
[95% CI] [170.31, 275.32] [161.13, 269.85] [-67.58, 52.93]
Data is presented for n = 14, unless otherwise specified. 95% CI = 95% confidence interval; iAUC = incremental area under the curve; LS = least square; SE = standard error.
6
Niels_Proefschrift.indd 183Niels_Proefschrift.indd 183 08/12/2020 18:05:3908/12/2020 18:05:39
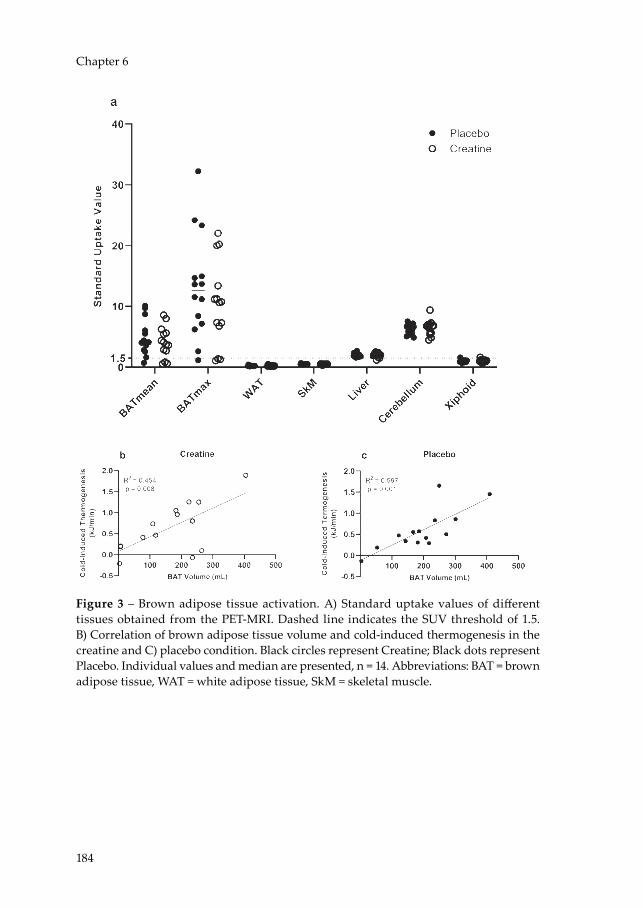
184
Chapter 6
Figure 3 – Brown adipose tissue activation. A) Standard uptake values of different tissues obtained from the PET-MRI. Dashed line indicates the SUV threshold of 1.5. B) Correlation of brown adipose tissue volume and cold-induced thermogenesis in the creatine and C) placebo condition. Black circles represent Creatine; Black dots represent Placebo. Individual values and median are presented, n = 14. Abbreviations: BAT = brown adipose tissue, WAT = white adipose tissue, SkM = skeletal muscle.
Niels_Proefschrift.indd 184Niels_Proefschrift.indd 184 08/12/2020 18:05:4108/12/2020 18:05:41

185
Creatine and Brown Adipose Tissue
Tabl
e 3
– Se
cond
ary
tria
l out
com
es.
Plac
ebo
Cre
atin
eTr
eatm
ent d
iffer
ence
P-va
lue
Body
com
posi
tion
Body
wei
ght (
kg)
LS m
ean
(SE)
63.7
8 (1
.62)
64.0
6 (1
.74)
-0.2
8 (0
.42)
0.52
0[9
5% C
I][6
0.29
, 67.2
7][6
0.31
, 67.8
0][-1
.20,
0.6
4]Bo
dy fa
t (%
)LS
mea
n (S
E)27
.98
(2.1
2)28
.10 (2
.01)
-0.1
2 (0
.85)
0.88
8[9
5% C
I][2
3.40
, 32.
55]
[23.
76, 3
2.44
][-1
.95,
1.7
1]A
cute
col
d ex
posu
re fr
om b
asel
ine
Δ E
nerg
y ex
pend
iture
(kJ/m
in)
LS m
ean
(SE)
0.59
3 (0
.128
)0.
644
(0.16
0)-0
.051
(0.1
36)
0.71
5[9
5% C
I][0
.317
, 0.8
70]
[0.2
99, 0
.988
][-0
.344
, 0.2
42]
Δ R
espi
rato
ry e
xcha
nge
ratio
LS m
ean
(SE)
-0.0
08 (0
.014
)-0
.014
(0.0
15)
0.00
6 (0
.021
)0.
780
[95%
CI]
[-0.0
38, 0
.022
][-0
.046
, 0.0
17]
[-0.0
40, 0
.052
]Δ
Car
bohy
drat
e ox
idat
ion
(g/m
in)
LS m
ean
(SE)
0.00
4 (0
.013
)0.
003
(0.0
14)
0.00
1 (0
.019
)0.
977
[95%
CI]
[-0.0
24, 0
.032
][-0
.027
, 0.0
34]
[-0.0
41, 0
.042
]Δ
Lip
id o
xida
tion
(g/m
in)
LS m
ean
(SE)
0.01
4 (0
.006
)0.
015
(0.0
07)
-0.0
02 (0
.008
)0.
859
[95%
CI]
[-0.0
01, 0
.027
][-0
.001
, 0.0
31]
[-0.0
19, 0
.016
]C
old-
indu
ced
ther
mog
enes
is (k
J/min
)LS
mea
n (S
E)0.
59 (0
.13)
0.64
(0.16
)-0
.05
(0.14
)0.
715
[95%
CI]
[0.3
2, 0
.87]
[0.3
0, 0
.99]
[-0.3
5, 0
.24]
Δ G
luco
se (m
mol
/L) (
n =
11)
LS m
ean
(SE)
-0.14
7 (0
.073
)-0
.186
(0.0
63)
0.03
9 (0
.093
)0.
684
[95%
CI]
[-0.2
88, -
0.00
7][-0
.350
, -0.
023]
[-0.16
9, 0
.247
]Δ
Insu
lin (m
U/L
) (n
= 9)
LS m
ean
(SE)
-0.7
04 (0
.555
)0.
103
(0.7
50)
0.80
7 (0
.792
)0.
338
[95%
CI]
[-1.9
85, 0
.577
][-1
.627
, 1.8
33]
[-1.0
18, 2
.633
]Δ
Fre
e fa
tty a
cids
(μm
ol/L
) (n
= 11
)LS
mea
n (S
E)19
3.62
(55.
37)
185.
79 (6
0.04
)7.8
3 (5
1.82
)0.
883
[95%
CI]
[70.
25, 3
16.9
9][5
2.01
, 319
.57]
[-107
.64,
123
.30]
Δ T
rigl
ycer
ides
(mm
ol/L
) (n
= 11
)LS
mea
n (S
E)0.
120
(0.0
24)
0.12
1 (0
.021
)-0
.001
(0.0
29)
0.96
4
6
Niels_Proefschrift.indd 185Niels_Proefschrift.indd 185 08/12/2020 18:05:4108/12/2020 18:05:41
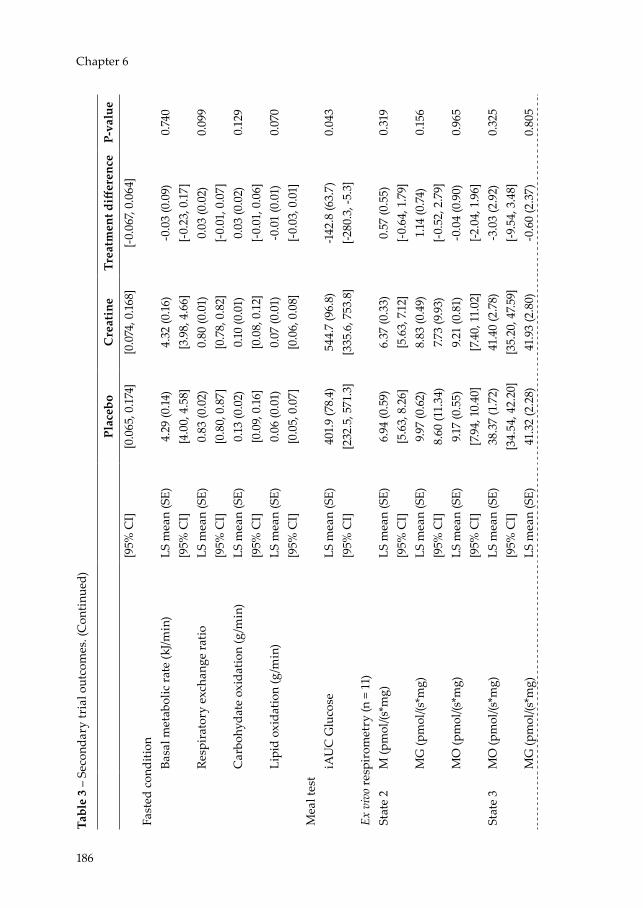
186
Chapter 6Ta
ble
3 –
Seco
ndar
y tr
ial o
utco
mes
. (C
onti
nued
)
Plac
ebo
Cre
atin
eTr
eatm
ent d
iffer
ence
P-va
lue
[95%
CI]
[0.0
65, 0
.174
][0
.074
, 0.16
8][-0
.067
, 0.0
64]
Fast
ed c
ondi
tion
Basa
l met
abol
ic ra
te (k
J/min
)LS
mea
n (S
E)4.
29 (0
.14)
4.32
(0.16
)-0
.03
(0.0
9)0.
740
[95%
CI]
[4.0
0, 4
.58]
[3.9
8, 4
.66]
[-0.2
3, 0
.17]
Resp
irat
ory
exch
ange
ratio
LS m
ean
(SE)
0.83
(0.0
2)0.
80 (0
.01)
0.03
(0.0
2)0.
099
[95%
CI]
[0.8
0, 0
.87]
[0.7
8, 0
.82]
[-0.0
1, 0
.07]
Car
bohy
date
oxi
datio
n (g
/min
)LS
mea
n (S
E)0.
13 (0
.02)
0.10
(0.0
1)0.
03 (0
.02)
0.12
9[9
5% C
I][0
.09,
0.16
][0
.08,
0.1
2][-0
.01,
0.0
6]Li
pid
oxid
atio
n (g
/min
)LS
mea
n (S
E)0.
06 (0
.01)
0.07
(0.0
1)-0
.01
(0.0
1)0.
070
[95%
CI]
[0.0
5, 0
.07]
[0.0
6, 0
.08]
[-0.0
3, 0
.01]
Mea
l tes
tiA
UC
Glu
cose
LS m
ean
(SE)
401.
9 (7
8.4)
544.
7 (9
6.8)
-142
.8 (6
3.7)
0.04
3[9
5% C
I][2
32.5
, 571
.3]
[335
.6, 7
53.8
][-2
80.3
, -5.
3]Ex
viv
o re
spir
omet
ry (n
= 1
1)St
ate
2M
(pm
ol/(s
*mg)
LS m
ean
(SE)
6.94
(0.5
9)6.
37 (0
.33)
0.57
(0.5
5)0.
319
[95%
CI]
[5.6
3, 8
.26]
[5.6
3, 7.
12]
[-0.6
4, 1
.79]
MG
(pm
ol/(s
*mg)
LS m
ean
(SE)
9.97
(0.6
2)8.
83 (0
.49)
1.14
(0.7
4)0.
156
[95%
CI]
8.60
(11.
34)
7.73
(9.9
3)[-0
.52,
2.7
9]M
O (p
mol
/(s*m
g)LS
mea
n (S
E)9.1
7 (0
.55)
9.21
(0.8
1)-0
.04
(0.9
0)0.
965
[95%
CI]
[7.9
4, 1
0.40
][7
.40,
11.
02]
[-2.0
4, 1
.96]
Stat
e 3
MO
(pm
ol/(s
*mg)
LS m
ean
(SE)
38.3
7 (1
.72)
41.4
0 (2
.78)
-3.0
3 (2
.92)
0.32
5[9
5% C
I][3
4.54
, 42.
20]
[35.
20, 4
7.59]
[-9.5
4, 3
.48]
MG
(pm
ol/(s
*mg)
LS m
ean
(SE)
41.3
2 (2
.28)
41.9
3 (2
.80)
-0.6
0 (2
.37)
0.80
5
Niels_Proefschrift.indd 186Niels_Proefschrift.indd 186 08/12/2020 18:05:4208/12/2020 18:05:42

187
Creatine and Brown Adipose Tissue
Tabl
e 3
– Se
cond
ary
tria
l out
com
es. (
Con
tinu
ed)
Plac
ebo
Cre
atin
eTr
eatm
ent d
iffer
ence
P-va
lue
[95%
CI]
[36.
25, 4
6.40
][3
5.70
, 48.
15]
[-5.8
9, 4
.68]
MO
G (p
mol
/(s*m
g)LS
mea
n (S
E)51
.01
(2.7
0)54
.20
(2.3
5)-3
.19 (3
.66)
0.40
5[9
5% C
I][4
5.00
, 57.0
2][4
8.97
, 59.
43]
[-11.
35, 4
.98]
MO
GS
(pm
ol/(s
*mg)
LS m
ean
(SE)
82.7
3 (3
.77)
85.0
1 (3
.98)
-2.2
8 (4
.66)
0.63
5[9
5% C
I][7
4.33
, 91.1
2][7
6.13
, 93.
88]
[-12.
65, 8
.09]
MG
S (p
mol
/(s*m
g)LS
mea
n (S
E)82
.07
(3.6
0)83
.57
(4.6
8)-1
.50
(3.6
2)0.
687
[95%
CI]
[74.
05, 9
0.09
][7
3.14
, 94.
00]
[-9.5
6, 6
.56]
Stat
e U
MO
GS
(pm
ol/(s
*mg)
LS m
ean
(SE)
107.1
9 (4
.46)
111.
08 (6
.64)
-3.8
9 (7
.10)
0.59
6[9
5% C
I][9
7.25,
117
.13]
[96.
29, 1
25.8
6][-1
9.70
, 11.
92]
Stat
e 4o
MG
S (p
mol
/(s*m
g)LS
mea
n (S
E)29
.99
(1.8
5)28
.24
(1.2
0)1.
76 (1
.35)
0.22
2[9
5% C
I][2
5.87
, 34.
11]
[25.
57, 3
0.90
][-1
.25,
4.7
6]31
P-M
RS
PCr K
inet
ics
(n =
13)
κ (s
-1)
LS m
ean
(SE)
0.04
1 (0
.003
)0.
038
(0.0
02)
0.00
3 (0
.003
)0.
325
[95%
CI]
[0.0
34, 0
.047
][0
.033
, 0.0
42]
[-0.0
03, 0
.009
]pH
LS m
ean
(SE)
6.98
(0.0
2)6.
96 (0
.02)
0.02
(0.0
3)0.
540
[95%
CI]
[6.9
3, 7.
03]
[6.9
1, 7.
01]
[-0.0
5, 0
.09]
PCr/A
TP ra
tioLS
mea
n (S
E)3.
51 (0
.11)
3.88
(0.16
)-0
.38
(0.2
1)0.
096
[95%
CI]
[3.2
8, 3
.74]
[3.5
3, 4
.24]
[-0.8
3, 0
.08]
PCr (
mM
)LS
mea
n (S
E)28
.75
(0.8
7)31
.85
(1.3
5)-3
.10 (1
.71)
0.09
6[9
5% C
I][2
6.86
, 30.
64]
[28.
91, 3
4.79
][-6
.83,
0.6
4]
Dat
a is
pre
sent
ed f
or n
= 1
4, u
nles
s ot
herw
ise
spec
ified
. 31P-
MR
S =
31Ph
osph
orus
– m
agne
tic r
eson
ance
spe
ctro
scop
y; 9
5% C
I = 9
5%
confi
denc
e in
terv
al; A
TP =
Ade
nosi
ne tr
ipho
spha
te; i
AU
C =
i ncr
emen
tal a
rea
unde
r the
cur
ve; G
= g
luta
mat
e; L
S =
l eas
t squ
are;
M =
mal
ate;
PC
r = P
hosp
hocr
eati
ne; O
= o
ctan
oyl-c
arni
tine
; S =
suc
cina
te; S
E =
stan
dard
err
or.
6
Niels_Proefschrift.indd 187Niels_Proefschrift.indd 187 08/12/2020 18:05:4208/12/2020 18:05:42

188
Chapter 6
Cold-induced energy expenditure is not altered upon creatine supplementation
As expected, energy expenditure upon acute cold exposure increased significantly in both conditions, but contrary to our hypothesis, no significant differences between Creatine and Placebo were observed (Table 3). In agreement, CIT was not significantly different between Creatine and Placebo (Table 3). Also, the change in respiratory exchange ratio following acute cold exposure from baseline was not significantly different between Creatine and Placebo, and also changes in rates for carbohydrate and lipid oxidation were similar (Table 3).
Following acute cold exposure, plasma glucose decreased in both conditions, but no significant differences were observed between Creatine and Placebo (Table 3). Plasma insulin levels remained similar following cooling and no significant differences between Creatine and Placebo were observed (Table 3). Serum FFA and TG levels increased after cooling but the degree of change did not differ between Creatine and Placebo (Table 3).
Diet-induced thermogenesis is not affected by creatine supplementation
In order to evaluate the effect of creatine monohydrate supplementation on DIT, a meal test was conducted. BMR and fasting RER did not differ significantly between conditions (Table 3). In the fasted state, carbohydrate oxidation was similar, but lipid oxidation tended to be higher in Creatine compared to Placebo (Table 3). DIT, defined as the incremental increase of EE over BMR, is depicted in Figure 4A. Total DIT, calculated as the iAUC of energy expenditure over the entire 5 hours, was similar in both conditions (Table 2). Post-prandial RER, carbohydrate oxidation and lipid oxidation rates are depicted in Figure 4B-D and did not differ between Creatine and Placebo.
Next, we determined plasma glucose and insulin, and serum TG and FFA over time. Glucose levels are depicted in Figure 5A, with the iAUC of the glucose curve observed to be significantly higher in Creatine compared to Placebo (Table 3). The insulin, FFA, and TG levels are depicted in Figure 5B-D and were not different between Creatine and Placebo.
Niels_Proefschrift.indd 188Niels_Proefschrift.indd 188 08/12/2020 18:05:4208/12/2020 18:05:42
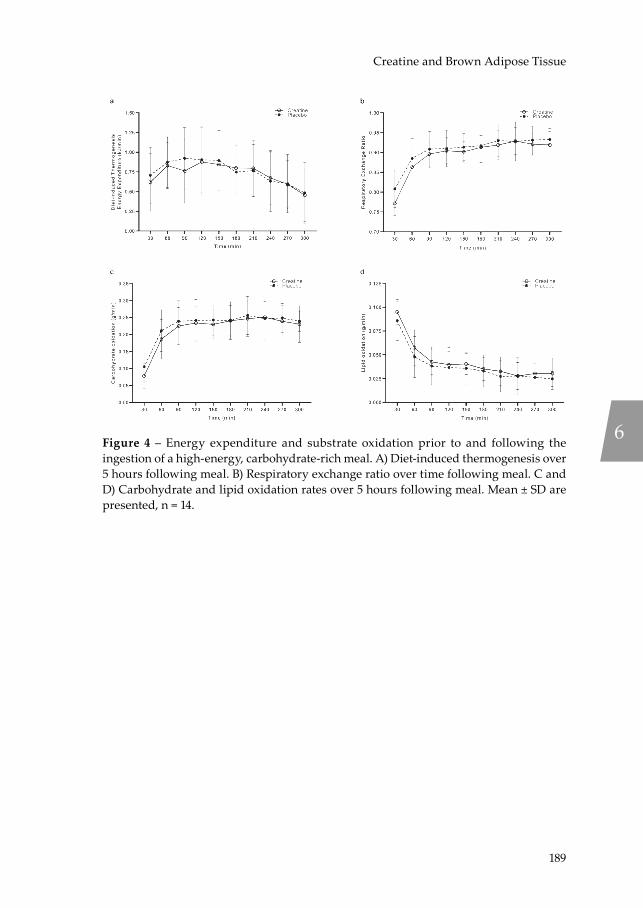
189
Creatine and Brown Adipose Tissue
Figure 4 – Energy expenditure and substrate oxidation prior to and following the ingestion of a high-energy, carbohydrate-rich meal. A) Diet-induced thermogenesis over 5 hours following meal. B) Respiratory exchange ratio over time following meal. C and D) Carbohydrate and lipid oxidation rates over 5 hours following meal. Mean ± SD are presented, n = 14.
6
Niels_Proefschrift.indd 189Niels_Proefschrift.indd 189 08/12/2020 18:05:4408/12/2020 18:05:44
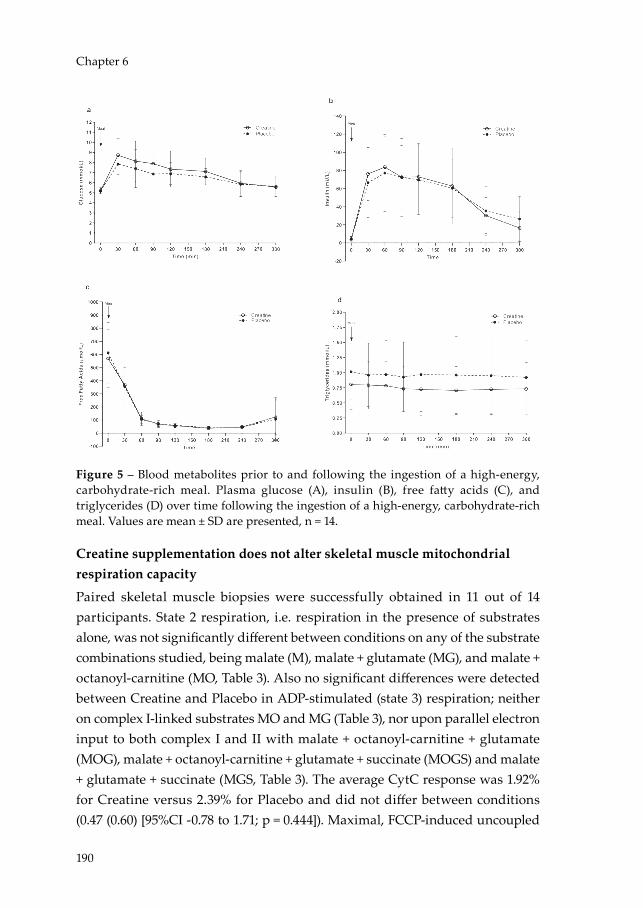
190
Chapter 6
Figure 5 – Blood metabolites prior to and following the ingestion of a high-energy, carbohydrate-rich meal. Plasma glucose (A), insulin (B), free fatty acids (C), and triglycerides (D) over time following the ingestion of a high-energy, carbohydrate-rich meal. Values are mean ± SD are presented, n = 14.
Creatine supplementation does not alter skeletal muscle mitochondrial respiration capacity
Paired skeletal muscle biopsies were successfully obtained in 11 out of 14 participants. State 2 respiration, i.e. respiration in the presence of substrates alone, was not significantly different between conditions on any of the substrate combinations studied, being malate (M), malate + glutamate (MG), and malate + octanoyl-carnitine (MO, Table 3). Also no significant differences were detected between Creatine and Placebo in ADP-stimulated (state 3) respiration; neither on complex I-linked substrates MO and MG (Table 3), nor upon parallel electron input to both complex I and II with malate + octanoyl-carnitine + glutamate (MOG), malate + octanoyl-carnitine + glutamate + succinate (MOGS) and malate + glutamate + succinate (MGS, Table 3). The average CytC response was 1.92% for Creatine versus 2.39% for Placebo and did not differ between conditions (0.47 (0.60) [95%CI -0.78 to 1.71; p = 0.444]). Maximal, FCCP-induced uncoupled
Niels_Proefschrift.indd 190Niels_Proefschrift.indd 190 08/12/2020 18:05:4708/12/2020 18:05:47

191
Creatine and Brown Adipose Tissue
respiration (reflecting the maximal capacity of the electron transport chain) and state 4o respiration (reflecting mitochondrial proton leak) were also similar between Placebo and Creatine (Table 3).
PCr recovery rates in skeletal muscle are not affected by creatine supplementation
As an in vivo measure of mitochondrial function, PCr recovery rate constant κ were determined in the m. vastus lateralis, and the constant κ was not significantly different between Creatine and Placebo (Table 3). pH values averaged pH 6.96 in Creatine and pH 6.98 in Placebo and were not significantly different between conditions (Table 3). Additionally, we determined the PCr/ATP ratio and the PCr concentration as a measure of creatine abundance in the m. vastus lateralis. The PCr/ATP ratio was not statistically different between conditions, as neither were the PCr concentrations between Creatine and Placebo (Table 3).
Discussion
Creatine availability in adipose tissue has been proposed as a novel target to enhance DIT capacity and affect energy balance but data in humans is lacking. Here we hypothesised that creatine supplementation in participants with a low habitual creatine intake enhances BAT activation following acute cold exposure and increases DIT capacity. To test this hypothesis, we conducted a double-blind, randomised, placebo-controlled, cross-over trial with detailed metabolic phenotyping in healthy, lean, vegetarian humans. Contrary to our hypothesis, we show that creatine supplementation does not enhance BAT activation following acute cold exposure, nor does creatine supplementation affect DIT in young, healthy, lean, vegetarian adults.
A disruption of adipocyte-specific creatine availability in mice diminished the thermogenic response following β-adrenergic stimulation 15,16. Analogous to direct β-adrenergic stimulation, acute cold exposure mediates an adaptive thermogenic response of BAT through β-adrenergic stimulation of the sympathetic nervous system. Ultimately, however, we did not observe an increase in whole body energy expenditure during acute cold exposure or in CIT in the creatine supplemented condition. Nor did we observe a change in cold
6
Niels_Proefschrift.indd 191Niels_Proefschrift.indd 191 08/12/2020 18:05:4808/12/2020 18:05:48

192
Chapter 6
sensitivity between conditions in our human participants as per the shivering threshold determined during the individualized cooling protocols.
Recently, Kazak et al. demonstrated an increase in β3 adrenergic agonist-dependent whole-body energy expenditure upon an acute high-fat diet challenge of creatine-supplemented wild-type mice, which subsequently yielded greater creatine abundance in BAT compared to mice on the chow diet 16. Together, these findings suggest that adipocyte creatine may interact with components of a high-fat diet and/or BAT increases creatine uptake under high-fat feeding. Additionally, mRNA sequencing of genes regulating creatine abundance in humans showed that the expression of CRT inversely correlates with BMI, suggesting creatine-transport to be an important mediator of adipocyte creatine-energetics in humans 16. Here, we included lean opposed to obese individuals, thus possibly negating any reductions in CRT expression and subsequent declines in tissue creatine abundance, in spite of the creatine supplementation protocol used, aimed to create a window of opportunity in creatine abundance. Moreover, we subjected our participants to a single high-carbohydrate meal instead of a high-fat meal or prolonged high-fat diet, potentially creating suboptimal conditions to detect alterations in DIT capacity. Furthermore, in contrast to 16, we did not combine our DIT protocol with a β3 adrenergic receptor agonist or other form of cAMP activation of BAT.
Unexpectedly, we observed a reduced post-prandial glucose clearance in the creatine condition. This finding contradicts the majority of literature suggesting creatine supplementation (especially when combined with exercise) may positively affect glycaemic control 33, as creatine is thought to upregulate glucose transporter type 4 (GLUT4) translocation directly, in addition to the ergogenic effect maximizing the effect of exercise on insulin sensitivity through GLUT4 and 5’ adenosine monophosphate-activated protein kinase (AMPK). Nevertheless, a reduced glucose clearance with an unaltered insulin response has been reported previously in creatine supplemented vegetarians 34, therefore, additional research is merited to elucidate the mechanisms behind the altered glucose clearance in vegetarians under creatine supplementation.
TG levels remained unaffected during the meal test in both conditions, which is a similar response to the high-energy, carbohydrate-rich meal we reported
Niels_Proefschrift.indd 192Niels_Proefschrift.indd 192 08/12/2020 18:05:4808/12/2020 18:05:48
193
Creatine and Brown Adipose Tissue
previously 8. In the fasted state, hepatic secretion is the only source of plasma TG. Creatine supplementation has been anointed with lipid-lowering effects in humans in the past 35. More recently, preclinical work in rats on a high-fat diet showed an increased hepatic lipoprotein secretion following creatine supplementation 36, demonstrating the ability of creatine to modulate hepatic lipid metabolism in vivo. This effect is thought to be mediated by an upregulation of peroxisome proliferator-activated receptor alpha (PPARα), through a direct effect of creatine on hepatocytes 37. This is accompanied by an increase in lipid oxidation, of which we observed a trend in the fasted condition. These observations, on the other hand, are flanked by two studies which demonstrated that blood lipid profiles of healthy, young individuals adhering to an aerobic 38 or resistance 39 exercise intervention were unaffected by additional creatine supplementation.
Lastly, we explored the idea of altering PCr recovery kinetics through creatine supplementation. The PCr recovery constant and PCr concentration were not different between conditions despite the creatine supplementation showing increased plasma and skeletal muscle creatine levels, contrasting results from previous studies reporting improvement in PCr recovery rate 40 following creatine supplementation. A creatine loading protocol of ~0.3 g/kg/day for 5 to 7 days has proven most effective in quickly saturating skeletal muscle creatine levels in humans 41,42; i.e. an adult weighing 70 kg would receive 21 grams of creatine monohydrate daily. Here, we supplemented participants for 7 consecutive days with 20 grams of creatine monohydrate daily, combined with maltodextrin to aid absorption of creatine from the gut 23,24, thereby, supplying our participants, on average, with 0.31 g/kg of creatine monohydrate daily, consequently leading to increased creatine levels in skeletal muscle. Reductions in PCr recovery rates are seen in insulin resistant populations 43, which are also characterised by an overall reduction in mitochondrial respiration capacity 30,44. The unchanged PCr recovery kinetics is in line with the ex vivo results on mitochondrial respiration capacity which were also similar in both conditions. We therefore conclude that the creatine supplementation in the current study did not affect mitochondrial capacity.
A potential limitation of our study is the uneven inclusion of sex, which may be fuelled by the skewed representation of females to males within the vegetarian
6
Niels_Proefschrift.indd 193Niels_Proefschrift.indd 193 08/12/2020 18:05:4808/12/2020 18:05:48
194
Chapter 6
population in western society 45,46. Another limitation is that we cannot directly compare baseline BAT activity values in our vegetarian volunteers to a non-vegetarian cohort of women as control cohort. Additionally, we did not match the timing of the measurements within the same period of the menstrual cycle due to scheduling limitations. Hence, the fluctuations of sex hormone levels, particularly oestradiol (E2), within the female participants may have influenced the outcomes of this study, as E2 is known to promote BAT activity through mitochondrial biogenesis and β-adrenergic receptor expression, and thereby, modulate energy expenditure by facilitating NST 47. However, post-prandial substrate utilization and diet-induced thermogenesis have been reported not to differ between the follicular phase and luteal phase of the menstrual cycle, despite an increased resting metabolic rate in the luteal phase 48. Further, although we used a novel imaging modality to quantify cold-induced BAT activation, the use of the 18F-FDG tracer is not the only method to estimate BAT activity, as glucose uptake is not mandatory for BAT thermogenesis 49, nor is BAT thermogenesis mandatory for glucose uptake 50,51, and BAT also relies on FFA oxidation for thermogenesis 52. This may potentially contribute to an underestimation of BAT activity in this study, thus further exemplifying the need for alternative and more physiologically relevant tracers for the non-invasive study of BAT. Moreover, we did not perform dynamic PET-MR scans here, thereby limiting the ability to accurately quantify glucose uptake in specific tissues with low glucose uptake such as WAT. Finally, we could not measure creatine levels in BAT, and we cannot exclude that the creatine pool in BAT may have been unaltered with our supplementation regimen. However, it has previously been suggested that BAT sequesters creatine from circulation at the same rate as skeletal muscle 53. Since skeletal muscle creatine content was increased following supplementation in this study, it can be anticipated that also BAT creatine content was increased upon creatine supplementation in the current study.
Conclusion
Here, we investigated the thermogenic potential of creatine supplementation in humans, aiming to elucidate the therapeutic potential to combat obesity. We show that creatine monohydrate supplementation, on its own, in young, healthy, lean vegetarian adults does not enhance brown adipose tissue activation after acute cold exposure and does not increase diet-induced thermogenesis. These
Niels_Proefschrift.indd 194Niels_Proefschrift.indd 194 08/12/2020 18:05:4808/12/2020 18:05:48

195
Creatine and Brown Adipose Tissue
data are consistent with prior work on creatine supplementation in mice 16. Future research focussing on obese individuals or individuals subjected to a high-fat diet, variations in the timing and dose of creatine, along with combining creatine supplementation with a β3 adrenergic receptor agonist is merited to conclusively elucidate the role of creatine in adipocyte metabolism and its therapeutic potential to aid in combatting obesity in humans.
Acknowledgements
We acknowledge the support from the Netherlands Cardiovascular Research Initiative: an initiative with support of the Dutch Heart Foundation (CVON2014-02 ENERGISE).
Duality of interest
The authors declare that there is no duality of interest associated with this manuscript.
Contribution statement
N.J.C., W.D.v.M.L., B.H., J.H., and P.S. designed research; N.J.C., D.D., and C.A. performed research; N.J.C., D.D., C.A., E.K.M., Y.B., V.B.S.H., T.v.d.W., W.D.v.M.L., B.H., J.H., and P.S. analysed samples and data. N.J.C., J.H., and P.S. wrote the manuscript and all authors critically reviewed the manuscript. P.S. is the guarantor of this work and, as such, had full access to all the data in the study and takes responsibility for the integrity of the data and the accuracy of the data analysis. P.S. is the corresponding author of this work. All authors approved the version to be published.
6
Niels_Proefschrift.indd 195Niels_Proefschrift.indd 195 08/12/2020 18:05:4808/12/2020 18:05:48
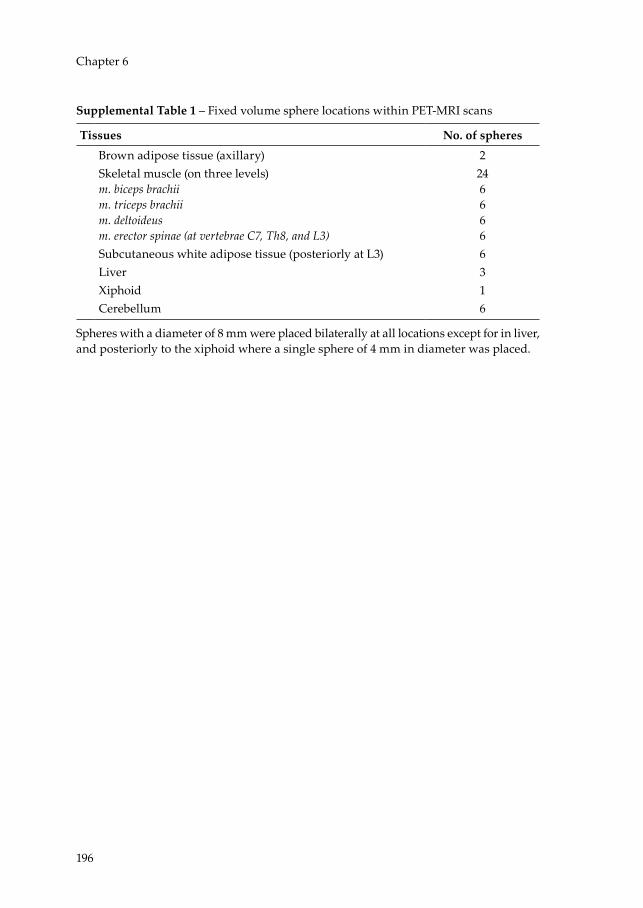
196
Chapter 6
Supplemental Table 1 – Fixed volume sphere locations within PET-MRI scans
Tissues No. of spheresBrown adipose tissue (axillary) 2Skeletal muscle (on three levels)m. biceps brachiim. triceps brachiim. deltoideusm. erector spinae (at vertebrae C7, Th8, and L3)
246666
Subcutaneous white adipose tissue (posteriorly at L3) 6Liver 3Xiphoid 1Cerebellum 6
Spheres with a diameter of 8 mm were placed bilaterally at all locations except for in liver, and posteriorly to the xiphoid where a single sphere of 4 mm in diameter was placed.
Niels_Proefschrift.indd 196Niels_Proefschrift.indd 196 08/12/2020 18:05:4808/12/2020 18:05:48

197
Creatine and Brown Adipose Tissue
Extended Data Figure
6
Niels_Proefschrift.indd 197Niels_Proefschrift.indd 197 08/12/2020 18:05:5608/12/2020 18:05:56

198
Chapter 6
References1 Argyropoulos, G. & Harper, M. E. Uncoupling proteins and thermoregulation. J
Appl Physiol (1985) 92, 2187-2198, doi:10.1152/japplphysiol.00994.2001 (2002).2 Rosenwald, M., Perdikari, A., Rulicke, T. & Wolfrum, C. Bi-directional interconversion
of brite and white adipocytes. Nat Cell Biol 15, 659-667, doi:10.1038/ncb2740 (2013).3 Rosenwald, M. & Wolfrum, C. The origin and definition of brite versus white and
classical brown adipocytes. Adipocyte 3, 4-9, doi:10.4161/adip.26232 (2014).4 Wu, J. et al. Beige adipocytes are a distinct type of thermogenic fat cell in mouse
and human. Cell 150, 366-376, doi:10.1016/j.cell.2012.05.016 (2012).5 van Marken Lichtenbelt, W. D. et al. Cold-activated brown adipose tissue in healthy
men. N Engl J Med 360, 1500-1508, doi:10.1056/NEJMoa0808718 (2009).6 Cypess, A. M. et al. Identification and importance of brown adipose tissue in adult
humans. N Engl J Med 360, 1509-1517, doi:10.1056/NEJMoa0810780 (2009).7 Virtanen, K. A. et al. Functional brown adipose tissue in healthy adults. N Engl J
Med 360, 1518-1525, doi:10.1056/NEJMoa0808949 (2009).8 Vosselman, M. J. et al. Brown adipose tissue activity after a high-calorie meal in
humans. Am. J. Clin. Nutr. 98, 57-64, doi:10.3945/ajcn.113.059022 (2013).9 van der Lans, A. A. et al. Cold acclimation recruits human brown fat and increases
nonshivering thermogenesis. J. Clin. Invest. 123, 3395-3403, doi:10.1172/JCI68993 (2013).10 Vijgen, G. H. et al. Brown adipose tissue in morbidly obese subjects. PLoS One 6,
e17247, doi:10.1371/journal.pone.0017247 (2011).11 Becker, A. S., Nagel, H. W., Wolfrum, C. & Burger, I. A. Anatomical Grading for
Metabolic Activity of Brown Adipose Tissue. PLoS One 11, e0149458, doi:10.1371/journal.pone.0149458 (2016).
12 Saito, M. et al. High incidence of metabolically active brown adipose tissue in healthy adult humans: effects of cold exposure and adiposity. Diabetes 58, 1526-1531, doi:10.2337/db09-0530 (2009).
13 Hofmann, W. E., Liu, X., Bearden, C. M., Harper, M. E. & Kozak, L. P. Effects of genetic background on thermoregulation and fatty acid-induced uncoupling of mitochondria in UCP1-deficient mice. J Biol Chem 276, 12460-12465, doi:10.1074/jbc.M100466200 (2001).
14 Kazak, L. et al. A creatine-driven substrate cycle enhances energy expenditure and thermogenesis in beige fat. Cell 163, 643-655, doi:10.1016/j.cell.2015.09.035 (2015).
15 Kazak, L. et al. Genetic Depletion of Adipocyte Creatine Metabolism Inhibits Diet-Induced Thermogenesis and Drives Obesity. Cell Metab 26, 660-671 e663, doi:10.1016/j.cmet.2017.08.009 (2017).
16 Kazak, L. et al. Ablation of adipocyte creatine transport impairs thermogenesis and causes diet-induced obesity. Nat Metab 1, 360-370, doi:10.1038/s42255-019-0035-x (2019).
17 Gerngross, C., Schretter, J., Klingenspor, M., Schwaiger, M. & Fromme, T. Active Brown Fat During (18)F-FDG PET/CT Imaging Defines a Patient Group with Characteristic Traits and an Increased Probability of Brown Fat Redetection. J Nucl Med 58, 1104-1110, doi:10.2967/jnumed.116.183988 (2017).
Niels_Proefschrift.indd 198Niels_Proefschrift.indd 198 08/12/2020 18:05:5608/12/2020 18:05:56
199
Creatine and Brown Adipose Tissue
18 Watt, K. K., Garnham, A. P. & Snow, R. J. Skeletal muscle total creatine content and creatine transporter gene expression in vegetarians prior to and following creatine supplementation. Int J Sport Nutr Exerc Metab 14, 517-531, doi:10.1123/ijsnem.14.5.517 (2004).
19 Burke, D. G. et al. Effect of creatine and weight training on muscle creatine and performance in vegetarians. Med Sci Sports Exerc 35, 1946-1955, doi:10.1249/01.MSS.0000093614.17517.79 (2003).
20 Maccormick, V. M., Hill, L. M., Macneil, L., Burke, D. G. & Smith-Palmer, T. Elevation of creatine in red blood cells in vegetarians and nonvegetarians after creatine supplementation. Can J Appl Physiol 29, 704-713, doi:10.1139/h04-045 (2004).
21 Blancquaert, L. et al. Changing to a vegetarian diet reduces the body creatine pool in omnivorous women, but appears not to affect carnitine and carnosine homeostasis: a randomised trial. Br J Nutr 119, 759-770, doi:10.1017/S000711451800017X (2018).
22 Baecke, J. A., Burema, J. & Frijters, J. E. A short questionnaire for the measurement of habitual physical activity in epidemiological studies. The American journal of clinical nutrition 36, 936-942 (1982).
23 Solis, M. Y. et al. Effect of age, diet, and tissue type on PCr response to creatine supplementation. J Appl Physiol (1985) 123, 407-414, doi:10.1152/japplphysiol.00248.2017 (2017).
24 Kreider, R. B. et al. International Society of Sports Nutrition position stand: safety and efficacy of creatine supplementation in exercise, sport, and medicine. J Int Soc Sports Nutr 14, 18, doi:10.1186/s12970-017-0173-z (2017).
25 Weir, J. B. New methods for calculating metabolic rate with special reference to protein metabolism. J Physiol 109, 1-9 (1949).
26 Bergstrom, J. Percutaneous needle biopsy of skeletal muscle in physiological and clinical research. Scand J Clin Lab Invest 35, 609-616 (1975).
27 Harris, J. A. & Benedict, F. G. A Biometric Study of Human Basal Metabolism. Proc Natl Acad Sci U S A 4, 370-373 (1918).
28 van Marken Lichtenbelt, W. D. et al. Evaluation of wireless determination of skin temperature using iButtons. Physiol Behav 88, 489-497, doi:10.1016/j.physbeh.2006.04.026 (2006).
29 International Organization for Standardization. (ISO, Geneva, 2004).30 Phielix, E. et al. Lower intrinsic ADP-stimulated mitochondrial respiration
underlies in vivo mitochondrial dysfunction in muscle of male type 2 diabetic patients. Diabetes 57, 2943-2949, doi:10.2337/db08-0391 (2008).
31 Hoeks, J. et al. Prolonged fasting identifies skeletal muscle mitochondrial dysfunction as consequence rather than cause of human insulin resistance. Diabetes 59, 2117-2125 (2010).
32 Chen, K. Y. et al. Brown Adipose Reporting Criteria in Imaging STudies (BARCIST 1.0): Recommendations for Standardized FDG-PET/CT Experiments in Humans. Cell Metab 24, 210-222, doi:10.1016/j.cmet.2016.07.014 (2016).
33 Pinto, C. L., Botelho, P. B., Pimentel, G. D., Campos-Ferraz, P. L. & Mota, J. F. Creatine supplementation and glycemic control: a systematic review. Amino Acids 48, 2103-2129, doi:10.1007/s00726-016-2277-1 (2016).
34 Rooney, K. B., Bryson, J. M., Digney, A. L., Rae, C. D. & Thompson, C. H. Creatine supplementation affects glucose homeostasis but not insulin secretion in humans. Ann Nutr Metab 47, 11-15, doi:10.1159/000068908 (2003).
6
Niels_Proefschrift.indd 199Niels_Proefschrift.indd 199 08/12/2020 18:05:5608/12/2020 18:05:56
200
Chapter 6
35 Earnest, C. P., Almada, A. L. & Mitchell, T. L. High-performance capillary electrophoresis-pure creatine monohydrate reduces blood lipids in men and women. Clin Sci (Lond) 91, 113-118, doi:10.1042/cs0910113 (1996).
36 da Silva, R. P., Leonard, K. A. & Jacobs, R. L. Dietary creatine supplementation lowers hepatic triacylglycerol by increasing lipoprotein secretion in rats fed high-fat diet. J Nutr Biochem 50, 46-53, doi:10.1016/j.jnutbio.2017.08.010 (2017).
37 da Silva, R. P., Kelly, K. B., Leonard, K. A. & Jacobs, R. L. Creatine reduces hepatic TG accumulation in hepatocytes by stimulating fatty acid oxidation. Biochim Biophys Acta 1841, 1639-1646, doi:10.1016/j.bbalip.2014.09.001 (2014).
38 Gualano, B. et al. Does creatine supplementation improve the plasma lipid profile in healthy male subjects undergoing aerobic training? J Int Soc Sports Nutr 5, 16, doi:10.1186/1550-2783-5-16 (2008).
39 Volek, J. S. et al. No effect of heavy resistance training and creatine supplementation on blood lipids. Int J Sport Nutr Exerc Metab 10, 144-156, doi:10.1123/ijsnem.10.2.144 (2000).
40 Yquel, R. J., Arsac, L. M., Thiaudiere, E., Canioni, P. & Manier, G. Effect of creatine supplementation on phosphocreatine resynthesis, inorganic phosphate accumulation and pH during intermittent maximal exercise. J Sports Sci 20, 427-437, doi:10.1080/026404102317366681 (2002).
41 Hultman, E., Soderlund, K., Timmons, J. A., Cederblad, G. & Greenhaff, P. L. Muscle creatine loading in men. J Appl Physiol (1985) 81, 232-237 (1996).
42 Harris, R. C., Soderlund, K. & Hultman, E. Elevation of creatine in resting and exercised muscle of normal subjects by creatine supplementation. Clin Sci (Lond) 83, 367-374 (1992).
43 Schrauwen-Hinderling, V. B. et al. Impaired in vivo mitochondrial function but similar intramyocellular lipid content in patients with type 2 diabetes mellitus and BMI-matched control subjects. Diabetologia 50, 113-120, doi:10.1007/s00125-006-0475-1 (2007).
44 de Ligt, M. et al. Resveratrol improves ex vivo mitochondrial function but does not affect insulin sensitivity or brown adipose tissue in first degree relatives of patients with type 2 diabetes. Mol Metab 12, 39-47, doi:10.1016/j.molmet.2018.04.004 (2018).
45 Rosenfeld, D. L. Gender differences in vegetarian identity: How men and women construe meatless dieting. Food Qual Prefer 81, doi:ARTN 103859
10.1016/j.foodqual.2019.103859 (2020).46 Pfeiler, T. M. & Egloff, B. Examining the “Veggie” personality: Results from a
representative German sample. Appetite 120, 246-255, doi:10.1016/j.appet.2017.09.005 (2018).
47 Lopez, M. & Tena-Sempere, M. Estradiol and brown fat. Best Pract Res Clin Endocrinol Metab 30, 527-536, doi:10.1016/j.beem.2016.08.004 (2016).
48 Melanson, K. J., Saltzman, E., Russell, R. & Roberts, S. B. Postabsorptive and postprandial energy expenditure and substrate oxidation do not change during the menstrual cycle in young women. J Nutr 126, 2531-2538, doi:10.1093/jn/126.10.2531 (1996).
49 Blondin, D. P. et al. Selective Impairment of Glucose but Not Fatty Acid or Oxidative Metabolism in Brown Adipose Tissue of Subjects With Type 2 Diabetes. Diabetes 64, 2388-2397, doi:10.2337/db14-1651 (2015).
Niels_Proefschrift.indd 200Niels_Proefschrift.indd 200 08/12/2020 18:05:5608/12/2020 18:05:56

201
Creatine and Brown Adipose Tissue
50 Hankir, M. K. et al. Dissociation Between Brown Adipose Tissue (18)F-FDG Uptake and Thermogenesis in Uncoupling Protein 1-Deficient Mice. J Nucl Med 58, 1100-1103, doi:10.2967/jnumed.116.186460 (2017).
51 Olsen, J. M. et al. beta3-Adrenergically induced glucose uptake in brown adipose tissue is independent of UCP1 presence or activity: Mediation through the mTOR pathway. Mol Metab 6, 611-619, doi:10.1016/j.molmet.2017.02.006 (2017).
52 Blondin, D. P. et al. Inhibition of Intracellular Triglyceride Lipolysis Suppresses Cold-Induced Brown Adipose Tissue Metabolism and Increases Shivering in Humans. Cell Metab 25, 438-447, doi:10.1016/j.cmet.2016.12.005 (2017).
53 Berlet, H. H., Bonsmann, I. & Birringer, H. Occurrence of free creatine, phosphocreatine and creatine phosphokinase in adipose tissue. Biochim Biophys Acta 437, 166-174, doi:10.1016/0304-4165(76)90358-5 (1976).
6
Niels_Proefschrift.indd 201Niels_Proefschrift.indd 201 08/12/2020 18:05:5608/12/2020 18:05:56

Niels_Proefschrift.indd 202Niels_Proefschrift.indd 202 08/12/2020 18:05:5608/12/2020 18:05:56

7General Discussion
Niels_Proefschrift.indd 203Niels_Proefschrift.indd 203 08/12/2020 18:05:5608/12/2020 18:05:56
204
Chapter 7
Targeting deregulated nutrient sensing and mitochondrial dysfunction
In cellular metabolism, adenosine monophosphate-activated protein kinase (AMPK) and sirtuin 1 (SIRT1) are regarded as nutrient sensors, susceptible to changes in the energy status of the cell, which is reflected by the adenosine monophosphate (AMP) / adenosine triphosphate (ATP)-ratio and the nicotinamide adenine dinucleotide (NAD+)/NADH redox potential, respectively (1, 2). A high AMP/ATP-ratio and NAD+/NADH redox potential reflects a state of energy demand and invokes a response to optimize catabolic cellular metabolism. This response originates from AMPK and activates SIRT1 and its downstream targets peroxisome proliferator-activated receptor gamma coactivator-1-alpha (PCG-1α) and forkhead box protein O1 (FOXO1). These factors, in turn, elicit mitochondrial biogenesis and control carbohydrate and fatty acid oxidation, thereby, promoting mitochondrial function and overall metabolic health (3, 4). The most straight-forward way to invoke a state of energy demand is by increasing energy expenditure through physical activity. Exercise extensively affects the human body, which will adapt acutely to maintain homeostasis and support the physical effort to the best of its ability. Repeated exercise bouts, i.e. exercise training, will invoke AMPK activation that promotes mitochondrial function (5) and metabolic health (6). Alternatively, caloric restriction (i.e. a ~20-50% reduction of daily energy intake), is a proven physiological intervention known to promote lifespan in vivo by activating both AMPK and SIRT1, whilst improving overall health and negating age-dependent disease (7). Central to the activation of AMPK and SIRT1 is the NAD+/NADH redox potential and, therefore, influencing NAD+ metabolism poses as a prime target to elicit the downstream effects of this axis.
NAD+: the silver bullet that needs to be loaded into the right gun
It is generally accepted that NAD+ levels are a main regulator of mitochondrial function in skeletal muscle. Furthermore, SIRT activity is limited by NAD+ bioavailability (8), which is suggested to decline with increasing age in mice (9, 10) and humans (11, 12). Hence, manipulating NAD+ levels represents a target for intervention to prevent the age-related decline in skeletal muscle physical function by improving metabolism and mitochondrial function. NAD+ can be
Niels_Proefschrift.indd 204Niels_Proefschrift.indd 204 08/12/2020 18:05:5708/12/2020 18:05:57

205
General Discussion
derived from various dietary sources as it can be synthesised de novo from the essential amino-acid L-tryptophan (Trp) or from vitamin B3 compounds such as nicotinic acid (NA, niacin) through the Preiss-Handler pathway or salvaged from nicotinamide (NAM) and nicotinamide riboside (NR) (13).
In Chapters 2 and 3, the potential of influencing the NAD+ metabolism in humans has been reviewed and investigated respectively in order to promote metabolic health and mitochondrial function. Whilst a number of studies agree with Chapter 3 in demonstrating that different exogenous NAD+-precursors can elevate NAD+ intermediates and/or metabolites such as methyl-nicotinamide (MeNAM) in vivo, no downstream effects on mitochondrial function have been observed in middle-aged to older adults who were normal to overweight (Chapter 3)(14, 15) and middle-aged to older, obese individuals (16, 17). However, improvements in skeletal muscle mitochondrial function have been observed in Acipimox – a synthetic NA-analogue – treated individuals with type 2 diabetes mellitus (T2DM) (18). Interestingly, the polyphenol resveratrol, a direct stimulator of AMPK (19) and SIRT1 (20), has been shown to improve skeletal muscle mitochondrial respiration capacity in obese (21) and insulin resistant humans (22, 23). Moreover, the biguanide metformin, the predominant first-line pharmacological treatment for T2DM, also elicits improvements in mitochondrial function in a AMPK-dependent fashion (24) and promotes mitochondrial complex 1 respiration in individuals with T2DM (25). Together, there is evidence to support that pharmacological or nutraceutical targeting of the AMPK/SIRT1-axis can mimic the effects on mitochondrial function seen upon caloric restriction or exercise interventions, but it does illustrate that NAD+-precursor supplementation efficacy on mitochondrial function is ambiguous in humans.
In Chapter 3, no improvements in mitochondrial function or physical function parameters were observed in physically compromised, older adults supplemented with NAD+-precursors. One possible explanation could be that these participants actually did not experience a decline in NAD+ levels. Alternatively, the supplementation doses of the various precursors used in Chapter 3 may have been insufficient to increase NAD+ levels. However, Elhassan et al. (14) also did not observe any alterations in mitochondrial respiration capacity, despite the fact that they supplemented healthy, older adults with 1000 mg of NR – a dose almost five times greater than the one used in Chapter 3. This suggests that
7
Niels_Proefschrift.indd 205Niels_Proefschrift.indd 205 08/12/2020 18:05:5708/12/2020 18:05:57

206
Chapter 7
the dose used in Chapter 3 may not be the predominant reason behind the lack of downstream effects on mitochondrial function. In this context, Elhassan et al. (14) have proposed a ‘second hit’ theory, stating that NAD+ levels might only be susceptible to decline with age if combined with metabolic disease or physical inactivity leading to a reduction in NAD+ salvage through NAMPT or increased NAD+ consumption by CD38 and/or poly(ADP-ribose) polymerase (PARP). Hence, it is possible that the cohort of older adults in Chapter 3 is still too physically active for NAD+ levels to decline in the absence of additional metabolic disease, and therefore do not have reduced levels of NAD+. The degree of metabolic disruption needed to allow NAD+ levels to decline, and thus become susceptible to supplementation, is illustrated by the study of Pirinen et al. (26), who demonstrated the efficacy of niacin supplementation in improving mitochondrial function and increasing muscle mass in vitamin B3-deficient patients with mitochondrial myopathy; this in large contrast to the healthy control group who displayed unaffected mitochondrial function and muscle mass whilst receiving identical treatment.
The skeletal muscle NAD+ concentrations measured following supplementation with NAD+-precursors in Chapter 3 seem to be of similar magnitude when comparing with skeletal muscle NAD+ concentrations in healthy, obese individuals (16), admit a 5-fold difference in supplementation dose and population differences such as BMI and age. This study follows a similar pattern of unresponsiveness of skeletal muscle NAD+ levels to NR supplementation in healthy, older adults, as stated previously (14). The comparable NAD+ concentrations observed in Chapter 3 and the previous study in obese individuals (16) may suggest NAD+ levels to be at their homeostatic maximum, contributing to a lack of downstream effects following supplementation. Admittingly, NAD+ concentrations are known to decline with age under increased consumption by PARP and CD38 (12, 27), yet NAD+ resynthesis capacity can be restored through exercise through NAMPT induction (11).
With the NAD+ pool resulting from the balance between (re)synthesis and consumption (10, 28, 29), elevating NAD+ availability through supplementation alone could potentially be insufficient to influence downstream targets in the absence of (severe) disease. Thus, it is tempting to hypothesise that it may not be NAD+ levels per se that dictate downstream effects, but the overall flux of NAD+ (re)synthesis and consumption. Therefore, based on the observations made in Chapters
Niels_Proefschrift.indd 206Niels_Proefschrift.indd 206 08/12/2020 18:05:5708/12/2020 18:05:57
207
General Discussion
3 and 4, it would be interesting as a next step to assess NAD+ concentrations in the skeletal muscle tissue acquired from young and older adults to determine whether NAD+ levels actually decline with age in tandem with a reduction in mitochondrial respiration capacity as observed in Chapter 4. Alternatively, the assessment of the NAD+/NADH redox potential and NAD(P)H metabolite concentrations through magnetic resonance spectroscopy (MRS) would allow for the study of NAD+ levels in vivo in real-time in a non-invasive manner (30), analogous to the 31P-MRS measurements in Chapters 4 and 6 to determine phosphocreatine kinetics during exercise recovery. Next, it would be of great interest to determine NAD+ levels in an age-matched cohort of older adults with differing levels of habitual physical activity (Chapter 4); is the homeostatic maximum of NAD+ constant irrespective of physical activity, or does the homeostatic maximum vary and reflect the metabolic profiles? If the later indeed turns out to be the case, strategies focussing on influencing the NAD+ metabolism may have to provide a greater flux of NAD+ (re)synthesis and consumption to achieve downstream benefits in mitochondrial function and metabolism.
To this end, Chapter 2 provides insight in alternative strategies which merit investigation in order to increase the potential of interventions focussing on NAD+ metabolism. One strategy with the potential to be greater than the sum of its parts is the combination of exercise and NAD+ supplementation (Chapter 2). Exercise is known to activate AMPK, which in turn increases the NAD+/NADH redox potential by elevating NAD+ levels through NAMPT induction (11, 31, 32). Interestingly, VO2peak is a known predictor of NAMPT levels in young and older adults (11, 31), with NAMPT abundance shown to decline with age (11). In Chapter 4, VO2max declines with age and with decreasing levels of habitual physical activity amongst older adults, which may be suggestive of declining NAMPT levels. Moreover, VO2max correlates with mitochondrial function, the primary target of the NAD+-precursor supplementation in Chapter 3. Young adults demonstrated to have a higher mitochondrial oxidative capacity than older adults with similar levels of habitual physical activity, whereas trained older adults demonstrated a higher mitochondrial oxidative capacity than age-matched adults with lower levels of habitual physical activity (Chapter 4). As such, with mitochondrial function being a downstream target of SIRT activation under the influence of NAD+ levels, NAMPT induction through exercise could elevate NAD+ levels and possibly improve mitochondrial function.
7
Niels_Proefschrift.indd 207Niels_Proefschrift.indd 207 08/12/2020 18:05:5708/12/2020 18:05:57

208
Chapter 7
NAMPT has been established as the rate-limiting enzyme in NAD+ resynthesis through the salvage pathways (33, 34), transforming NAM into nicotinamide mononucleotide (NMN), and has a reported low Km which was determined to be 0.94 μM (33) and 1.24 μM (34) for NAM in two separate studies. The high affinity of NAMPT for NAM results in a rapid saturation of the enzymatic capacity of NAMPT in the presence of abundant NAM, with NAMPT duly becoming the bottleneck of the reaction. It is within reason to state that when substrate levels are sufficient to saturate the enzymatic capacity, increasing the substrate concentration will not yield a greater product concentration. At high levels, NAM is also known to inhibit SIRT1 activity (35, 36). Hence, increasing enzyme availability alongside increased substrate concentrations would allow for the flux through the reaction to be lifted to a higher plain. This, in theory, could yield elevated product concentrations over baseline, which in this case yields higher NMN concentrations from NAM, to be converted into NAD+, allowing for a greater degree of consumption by SIRT1 and increasing its activation and eliciting downstream benefits.
Interestingly, SIRT, NAD+, and NAMPT are also known to form the enzymatic feedback loop of the molecular clock, thus interventions focussing on NAD+ metabolism may also benefit the function of the molecular clock as an integral controller of metabolism and will be discussed further on.
Use it, or lose it?
Frailty and sarcopenia are closely related (37) and both characterised by reduced physical function and overall low physical activity levels, which in turn contributes to the development of obesity and the progressive loss of muscle mass; ultimately initiating a vicious cycle of decline aggravating the process of ageing. Fortunately, both frailty and sarcopenia are reversible to a certain degree but require dedicated intervention to accomplish this. Skeletal muscle is generally accepted as one of the most plastic tissues in the human body, with an acute ability to adapt to differing contractile activity, loading conditions, substrate supply, or environmental factors (38).
In Chapter 4, a group of young adults and three groups of older adults with differing levels of habitual physical activity, notably in terms of intensity of
Niels_Proefschrift.indd 208Niels_Proefschrift.indd 208 08/12/2020 18:05:5708/12/2020 18:05:57

209
General Discussion
the physical activity performed, were cross-sectionally assessed. Interestingly, young and older adults with similar levels of physical activity – both groups managed approximately 10,000 steps a day – demonstrated to have similar levels of muscle mass but differed in mitochondrial function, muscle strength, and trended towards a difference in insulin sensitivity. Classical physiology teaches us to ‘use it or lose it’ regarding muscle mass. As such, it has been repeatedly demonstrated that immobilisation causes muscle atrophy (39), which is reversible upon reinstation of muscle loading (40), even at older age (41). The disuse of skeletal muscle through unloading in mice (42) and in humans (43) is known to induce a state of anabolic resistance, which is difficult to abate through anabolic stimuli in the early phase of recovery, in addition to an absence in restoration of insulin sensitivity and mitochondrial oxidative capacity (42). In Chapter 4, no statistically significant differences were observed in skeletal muscle mass between the young and old, or between the older adults with differing levels of habitual physical activity. This unexpected finding could be explained by lower levels of habitual physical activity are sufficient to maintain muscle mass, whilst experiencing dynapenia at older age; or the included cohort of older adults were not old enough to experience greater loss of muscle mass.
Chapter 4 provides evidence supporting the notion that higher levels of physical activity profoundly negate the effects of ageing on skeletal muscle function and mitochondrial function, which are also reflected by increased insulin sensitivity and a more favourable body composition; with a lower percentage of overweight or obese participants observed amongst the trained older adults compared to the normal and inactive older adults included in this study. The trained older adults in Chapter 4 are predominantly aerobically trained individuals, thus corroborating previous findings that a 6-month exercise intervention of aerobic exercise alone or combined with resistance exercise significantly improves insulin sensitivity in older adults (44). In addition to a large body of evidence pointing in the direction of the beneficial effects of physical activity or exercise training to maintain skeletal muscle mass and skeletal muscle function while aging (45), a greater gait stability and perturbation recovery amongst the trained older adults compared to normally active older adults is now added (Chapter 4). Moreover, clear differences in measures of mitochondrial oxidative capacity amongst the three older adult groups were observed, parameters that strongly correlated with muscle strength and daily step count, respectively.
7
Niels_Proefschrift.indd 209Niels_Proefschrift.indd 209 08/12/2020 18:05:5708/12/2020 18:05:57

210
Chapter 7
Recently, daily step count has been associated with all-cause mortality irrespective of age, with especially individuals over the age of 65 benefitting from marked reductions in all-cause mortality with increasing daily step count (46). In Chapter 4, positive associations between in and ex vivo measures of skeletal muscle mitochondrial oxidative capacity and daily step count were observed irrespective of age, sex, and BMI. Taken from this, the ability to walk, may alone, provide great individual and populational health gains by maintaining skeletal muscle mitochondrial function.
Collectively, the observations in Chapter 4 illustrate the beneficial effect of increased physical activity or exercise training as an important parameter of metabolic health, emphasising the need to stay or become (more) physically active with advancing age, as maintaining skeletal muscle mass and function can slow or abate the onset of the vicious cycle of decline and promote healthy ageing.
Rewinding the clock
It was previously established that mitochondrial respiratory capacity is rhythmic in conjunction with the day-night cycle in young, healthy male individuals (47). In Chapter 4, a decline in mitochondrial respiration capacity in the older adults compared to the young was observed. This finding poses the question whether the loss of mitochondrial respiration capacity could be also related to a loss of rhythmicity. Indeed, Chapter 5 revealed a lack of rhythmicity in skeletal muscle mitochondrial respiration capacity in older, insulin resistant individuals.
Besides regulating cellular metabolism, SIRT1 is also known to be essential in the transcription and deacetylation of the core-clock components BMAL1 (48), CLOCK (48), and period circadian protein homolog 2 (Per2) (49). Interestingly, Per2 gene transcription proved to be non-rhythmic in older, insulin resistant volunteers in Chapter 5, suggesting the involvement of SIRT1 and NAD+ within the loss of rhythmicity seen in this negative regulator of the molecular clock. Previously, mutations in Per2 resulted in decreased complex I activity, the site of NADH oxidation into NAD+, yielding a low NAD+/NADH redox potential (50). Additionally, NAD+ (51, 52) and NADH (53) levels are known to both display oscillating rhythms, reflecting the interplay of SIRT1 and NAMPT under the control of the molecular clock components (51, 52). Although Chapter 3 did not
Niels_Proefschrift.indd 210Niels_Proefschrift.indd 210 08/12/2020 18:05:5708/12/2020 18:05:57

211
General Discussion
reveal a change in mitochondrial respiration capacity or NAD+ levels following supplementation with NAD+-precursors, it should be noted that mitochondrial function and NAD+ were only measured at one time point in the day, thus prohibiting the assessment of circadian oscillations in these parameters; if these are even still present in older, insulin-resistant individuals, a question that deserves further research on its own merit. Interestingly, a recent study in mice found that increasing NAD+ levels through supplementation in aged mice can restore rhythmicity of clock gene transcription and mitochondrial respiration, with the animals also becoming more physically active (54). It is within reason to state that circadian oscillations of NAD+ govern SIRT1, and thereby, induce rhythmicity of mitochondrial respiration capacity in conjunction with the day-night cycle as seen in young, healthy males (47), thus suggesting that influencing the NAD+ metabolism flux in humans may be a modality through which clock and mitochondrial rhythmicity can be restored.
The loss of rhythmicity in mitochondrial metabolism in Chapter 5 is paralleled by 24-hour metabolic inflexibility, the inability to align substrate utilization to the energy demand and substrate availability, resulting in the absence of a normal feeding-fasting cycle in spite of being fed in energy balance. This result implicates the presence of metabolic inflexibility over 24-hours to be an intrinsic characteristic of insulin resistance, a finding that may be transferable to metabolic inflexibility observed previously in obesity (55) and T2DM (56). Moreover, these observations are in line with the hypothesis by Canto et al. (4) in 2009, proposing defects in mitochondrial oxidative function and the subsequent decrease in energy expenditure contribute to metabolic dysfunctions as seen in insulin resistance, T2DM, and ageing. The BMR and mitochondrial respiration capacity observed in Chapter 5 are lower when comparing the insulin resistant cohort to the reference of the young, healthy cohort (47). However, it is impossible to contribute this decline to either ageing, insulin resistance, or a combination of the two.
With multiple components of the transcription feedback loop being governed by the activity of the nutrient sensors AMPK and SIRT1, it is tempting to consider a combined intervention of exercise and NAD+ supplementation aiming to improve nutrient sensing and mitochondrial function to combat dysfunction of the molecular clock and potentially restore rhythmicity to mitochondrial metabolism and improve substrate utilization.
7
Niels_Proefschrift.indd 211Niels_Proefschrift.indd 211 08/12/2020 18:05:5708/12/2020 18:05:57
212
Chapter 7
“Creatine” new possibilities
Recruitment of brown adipose tissue (BAT) has been proposed as a potential strategy to increase daily energy expenditure to combat the development of obesity. A number of strategies have been pursued aiming at inducing non-shivering thermogenesis (NST) in BAT through the sympathetic nervous system, e.g. pharmacological targeting of BAT with Mirabegron (a selective β3-receptor agonist), via (acute) cold exposure (57) or high-energy intake (58). Conversely, declining BAT abundancy and activity with increasing age and BMI (59, 60) prohibit the implementation of BAT-centric interventions despite promising preclinical studies in the wake of the societal obesity and ageing challenges. Additionally, the fundamental difference in reliance on BAT functionality in small mammals compared to the situation in humans must be considered (61), even though the evolutionary conservancy of BAT across species is likely driven by a need to maintain core body temperature when exposed to cold, but not to burn off excess caloric intake (62). Nevertheless, a newly discovered creatine-driven substrate cycle that supports thermogenesis in murine beige adipocytes (63) opens up a new avenue to exploit the potential of NST in humans.
Two retrospective studies of BAT activation in humans concluded that BAT activation is observed most in females and in younger, leaner individuals (64, 65). In chapter 6, young, healthy, lean and mostly female individuals who adhered to a vegetarian diet were included, as these individuals present a high probability of detecting and recruiting BAT and are prone to have a healthy, yet low, creatine availability status (66-69). Although preclinical research has suggested a role for creatine in BAT thermogenesis (70-72), no effects of creatine supplementation on diet-induced thermogenesis or BAT activation in healthy, lean vegetarians were reported (Chapter 6). In retrospect, the results presented in Chapter 6 are in agreement with preclinical findings to date, which demonstrated that differing levels of creatine abundance alone does not reconstitute impairments in diet-induced thermogenesis or β-adrenergic stimulated energy expenditure (71, 72). The thermogenic effect of the creatine-driven substrate cycle in mice only prevails when the following three conditions are met: 1) creatine abundance, 2) high-fat diet, and 3) β-adrenergic stimulation (72). In wild-type mice fed a high-fat diet, dietary creatine supplementation yielded higher acute β3-adrenergic agonist-dependent energy expenditure in comparison with
Niels_Proefschrift.indd 212Niels_Proefschrift.indd 212 08/12/2020 18:05:5708/12/2020 18:05:57
213
General Discussion
non-supplemented littermates, suggesting a possible interaction between the creatine supplementation and high-fat diet or an increase in creatine uptake by BAT, or a combination of these two factors (72). The approach taken did not include the high-fat diet component, suggesting its necessity for the efficacy of the pathway as recently seen in mice (72). Thus Chapter 6 raises the question whether the lack of reproduction of the preclinical findings (71, 72) in humans comes down to a difference in physiology between mouse and man, or, that the selection of young, healthy, lean individuals does not represent the target population for BAT-centric intervention due to a lack of potential metabolic improvement and the lack of the high-fat diet component or challenge, in spite of a large window of opportunity considering creatine availability. Moreover, Kazak et al. has demonstrated creatine transporter (CRT) expression in WAT to be negatively correlated with obesity and insulin resistance in humans (72), suggesting a relationship between creatine transport and the development of obesity. Interestingly, insulin resistant individuals could be devided in low or high CRT expresion subgroups, with the low CRT expression subgroup having a higher BMI than the high CRT expression subgroup (72), thus meriting further investigation into the role creatine in human physiology.
Traditionally, creatine is used as an ergogenic aid to enhance exercise performance (73, 74), by increasing skeletal muscle creatine and phosphocreatine (PCr) concentrations (74, 75) and positively influencing the PCr recovery rate (76), ultimately enhancing the resynthesis of ATP to support the exercise effort. PCr recovery is a non-invasive in vivo measure of mitochondrial function, and although no changes in PCr recovery rate or ex vivo mitochondrial respiration capacity in healthy lean individuals were observed in Chapter 6 following creatine supplementation, lower PCr recovery rates are seen with insulin resistance (77), corresponding to lower ex vivo mitochondrial respiration capacity (22, 78). Creatine supplementation has been credited with hypoglycaemic effects in humans, especially when combined with an exercise intervention (79). However, evidence concerning the effect of creatine supplementation on insulin sensitivity, especially in T2DM individuals, is scarce and merits additional investigation in its own right. The use of creatine as an ergogenic supplement is a safe modality to support exercise efforts (80) and could elevate the efficacy of exercise interventions aiming to secure (long-term) weight loss and, thereby, improve metabolic health.
7
Niels_Proefschrift.indd 213Niels_Proefschrift.indd 213 08/12/2020 18:05:5708/12/2020 18:05:57
214
Chapter 7
Future perspectives
The aim of this thesis is to identify and investigate novel targets to promote healthy ageing by improving metabolic health. As stated in Chapter 2, NAD+ supplementation may require a combined approach with another intervention to extract its full potential, as supplementation with NAD+-precursors alone did not improve mitochondrial function (Chapter 3). Chapter 4 provides clear evidence that exercise at advanced age is beneficial for maintaining overall metabolic health and physical performance. Therefore, it remains to be elucidated whether NAD+ supplementation as an add-on therapy to an exercise intervention would have synergistic effects by promoting exercise tolerance, mitochondrial function, and physical function to a greater extent than exercise alone in older adults in the absence of metabolic disease. Coincidingly, individuals with metabolic disease such as T2DM would potentially be more susceptible to the rebalancing of the nutrient sensing pathways through NAD+-precursor supplementation alone or combined with exercise.
Under the notion that the NAD+ consumers and NAD+ itself reciprocally regulate the molecular clock components (81), the decline of NAD+ reported with aging may be a factor in the loss of rhythmicity in mitochondrial function and components of the molecular clock, as found in Chapter 5. However, as the volunteers were affected by a combination of obesity, insulin resistance, and advanced age, it is impossible to distinguish what role each of these components plays in the loss of rhythmicity. Therefore, it is recommended to conduct additional trials using a similar design to assess mitochondrial rhythmicity and the functionality of the core clock components in healthy, older adults to elucidate the effect of ageing on the molecular clock specifically. In the event that ageing indeed contributes to loss of rhythmicity, it would be interesting to subsequently assess strategies aiming to restore the rhythm, which could be done though an exercise intervention, NAD+ supplementation, or a combined approach.
The harnessing of NST as a strategy to combat obesity remains an intriguing prospect but requires additional research to elucidate the true therapeutic potential in humans. With the recent discovery that the β2-adrenergic receptor is responsible for BAT activation in humans (82), future research can take advantage of targeted
Niels_Proefschrift.indd 214Niels_Proefschrift.indd 214 08/12/2020 18:05:5708/12/2020 18:05:57

215
General Discussion
pharmacological stimulation of BAT using specific β2-agonists. Moreover, a series of preclinical studies revealed a creatine-driven substrate cycle that is capable of producing heat in murine beige adipocytes. Although no effects of creatine supplementation on BAT activation or diet-induced thermogenesis were observed in Chapter 6, the role of creatine abundance in NST in humans requires further investigation to be fully elucidated. Additionally, it must be kept in mind that following a lower probability of detecting and activating BAT in obese individuals will require larger trails to attain sufficient power to allow reliable conclusions to be drawn. It is, therefore, recommended to further research into the role of creatine abundance in energy balance in humans, emphasising on metabolic impairment as seen in overweight and obese individuals in order to elucidate the potential efficacy of this mechanism to aid in the combat of obesity.
Concluding remarks
In order to find translation to everyday practice, interventions aiming to promote healthspan by improving metabolic health will require a dedicated approach which must be sustainable to allow for long-term adherence and compliance. Illustrated by the contents of this thesis, one cannot solely rely on the use of supplements to negate deregulated nutrient sensing and mitochondrial dysfunction, as the importance of physical activity and the role of the molecular clock within metabolic health must be factored in; thus warranting the use of combined approaches to elicit the maximal potential of the chosen intervention. Through improving and maintaining physical function and reducing obesity, our biological age can be positively influenced, and simultaneously, maintain and improve skeletal muscle mitochondrial function and overall metabolic health, and ultimately, prolong healthspan in humans.
7
Niels_Proefschrift.indd 215Niels_Proefschrift.indd 215 08/12/2020 18:05:5708/12/2020 18:05:57
216
Chapter 7
References1. Lin SC, Hardie DG. AMPK: Sensing Glucose as well as Cellular Energy Status.
Cell Metab. 2018;27(2):299-313.2. Canto C, Menzies KJ, Auwerx J. NAD(+) Metabolism and the Control of Energy
Homeostasis: A Balancing Act between Mitochondria and the Nucleus. Cell Metab. 2015;22(1):31-53.
3. Houtkooper RH, Pirinen E, Auwerx J. Sirtuins as regulators of metabolism and healthspan. Nat Rev Mol Cell Biol. 2012;13(4):225-38.
4. Canto C, Auwerx J. PGC-1alpha, SIRT1 and AMPK, an energy sensing network that controls energy expenditure. Curr Opin Lipidol. 2009;20(2):98-105.
5. Marcinko K, Steinberg GR. The role of AMPK in controlling metabolism and mitochondrial biogenesis during exercise. Exp Physiol. 2014;99(12):1581-5.
6. Thyfault JP, Bergouignan A. Exercise and metabolic health: beyond skeletal muscle. Diabetologia. 2020;63(8):1464-74.
7. Fontana L, Partridge L, Longo VD. Extending healthy life span--from yeast to humans. Science. 2010;328(5976):321-6.
8. Canto C, Auwerx J. Targeting sirtuin 1 to improve metabolism: all you need is NAD(+)? Pharmacol Rev. 2012;64(1):166-87.
9. Gomes AP, Price NL, Ling AJ, Moslehi JJ, Montgomery MK, Rajman L, et al. Declining NAD(+) induces a pseudohypoxic state disrupting nuclear-mitochondrial communication during aging. Cell. 2013;155(7):1624-38.
10. Yoshino J, Mills KF, Yoon MJ, Imai S. Nicotinamide mononucleotide, a key NAD(+) intermediate, treats the pathophysiology of diet- and age-induced diabetes in mice. Cell Metab. 2011;14(4):528-36.
11. de Guia RM, Agerholm M, Nielsen TS, Consitt LA, Sogaard D, Helge JW, et al. Aerobic and resistance exercise training reverses age-dependent decline in NAD(+) salvage capacity in human skeletal muscle. Physiol Rep. 2019;7(12):e14139.
12. Massudi H, Grant R, Braidy N, Guest J, Farnsworth B, Guillemin GJ. Age-associated changes in oxidative stress and NAD+ metabolism in human tissue. PLoS One. 2012;7(7):e42357.
13. Mouchiroud L, Houtkooper RH, Auwerx J. NAD(+) metabolism: a therapeutic target for age-related metabolic disease. Crit Rev Biochem Mol Biol. 2013;48(4):397-408.
14. Elhassan YS, Kluckova K, Fletcher RS, Schmidt MS, Garten A, Doig CL, et al. Nicotinamide Riboside Augments the Aged Human Skeletal Muscle NAD(+) Metabolome and Induces Transcriptomic and Anti-inflammatory Signatures. Cell Rep. 2019;28(7):1717-28 e6.
15. Martens CR, Denman BA, Mazzo MR, Armstrong ML, Reisdorph N, McQueen MB, et al. Chronic nicotinamide riboside supplementation is well-tolerated and elevates NAD(+) in healthy middle-aged and older adults. Nat Commun. 2018;9(1):1286.
16. Remie CME, Roumans KHM, Moonen MPB, Connell NJ, Havekes B, Mevenkamp J, et al. Nicotinamide riboside supplementation alters body composition and skeletal muscle acetylcarnitine concentrations in healthy obese humans. Am J Clin Nutr. 2020.
Niels_Proefschrift.indd 216Niels_Proefschrift.indd 216 08/12/2020 18:05:5708/12/2020 18:05:57

217
General Discussion
17. Dollerup OL, Christensen B, Svart M, Schmidt MS, Sulek K, Ringgaard S, et al. A randomized placebo-controlled clinical trial of nicotinamide riboside in obese men: safety, insulin-sensitivity, and lipid-mobilizing effects. Am J Clin Nutr. 2018;108(2):343-53.
18. van de Weijer T, Phielix E, Bilet L, Williams EG, Ropelle ER, Bierwagen A, et al. Evidence for a direct effect of the NAD+ precursor acipimox on muscle mitochondrial function in humans. Diabetes. 2015;64(4):1193-201.
19. Baur JA, Pearson KJ, Price NL, Jamieson HA, Lerin C, Kalra A, et al. Resveratrol improves health and survival of mice on a high-calorie diet. Nature. 2006;444(7117):337-42.
20. Howitz KT, Bitterman KJ, Cohen HY, Lamming DW, Lavu S, Wood JG, et al. Small molecule activators of sirtuins extend Saccharomyces cerevisiae lifespan. Nature. 2003;425(6954):191-6.
21. Timmers S, Konings E, Bilet L, Houtkooper RH, van de Weijer T, Goossens GH, et al. Calorie restriction-like effects of 30 days of resveratrol supplementation on energy metabolism and metabolic profile in obese humans. Cell Metab. 2011;14(5):612-22.
22. de Ligt M, Bruls YMH, Hansen J, Habets MF, Havekes B, Nascimento EBM, et al. Resveratrol improves ex vivo mitochondrial function but does not affect insulin sensitivity or brown adipose tissue in first degree relatives of patients with type 2 diabetes. Mol Metab. 2018;12:39-47.
23. Timmers S, de Ligt M, Phielix E, van de Weijer T, Hansen J, Moonen-Kornips E, et al. Resveratrol as Add-on Therapy in Subjects With Well-Controlled Type 2 Diabetes: A Randomized Controlled Trial. Diabetes Care. 2016;39(12):2211-7.
24. Wang Y, An H, Liu T, Qin C, Sesaki H, Guo S, et al. Metformin Improves Mitochondrial Respiratory Activity through Activation of AMPK. Cell Rep. 2019;29(6):1511-23 e5.
25. Larsen S, Rabol R, Hansen CN, Madsbad S, Helge JW, Dela F. Metformin-treated patients with type 2 diabetes have normal mitochondrial complex I respiration. Diabetologia. 2012;55(2):443-9.
26. Pirinen E, Auranen M, Khan NA, Brilhante V, Urho N, Pessia A, et al. Niacin Cures Systemic NAD(+) Deficiency and Improves Muscle Performance in Adult-Onset Mitochondrial Myopathy. Cell Metab. 2020;32(1):144.
27. Camacho-Pereira J, Tarrago MG, Chini CCS, Nin V, Escande C, Warner GM, et al. CD38 Dictates Age-Related NAD Decline and Mitochondrial Dysfunction through an SIRT3-Dependent Mechanism. Cell Metab. 2016;23(6):1127-39.
28. Aksoy P, White TA, Thompson M, Chini EN. Regulation of intracellular levels of NAD: a novel role for CD38. Biochem Biophys Res Commun. 2006;345(4):1386-92.
29. Bai P, Canto C, Oudart H, Brunyanszki A, Cen Y, Thomas C, et al. PARP-1 inhibition increases mitochondrial metabolism through SIRT1 activation. Cell Metab. 2011;13(4):461-8.
30. Conley KE, Ali AS, Flores B, Jubrias SA, Shankland EG. Mitochondrial NAD(P)H In vivo: Identifying Natural Indicators of Oxidative Phosphorylation in the (31)P Magnetic Resonance Spectrum. Front Physiol. 2016;7:45.
31. Costford SR, Bajpeyi S, Pasarica M, Albarado DC, Thomas SC, Xie H, et al. Skeletal muscle NAMPT is induced by exercise in humans. Am J Physiol Endocrinol Metab. 2010;298(1):E117-26.
7
Niels_Proefschrift.indd 217Niels_Proefschrift.indd 217 08/12/2020 18:05:5808/12/2020 18:05:58

218
Chapter 7
32. Brandauer J, Vienberg SG, Andersen MA, Ringholm S, Risis S, Larsen PS, et al. AMP-activated protein kinase regulates nicotinamide phosphoribosyl transferase expression in skeletal muscle. J Physiol. 2013;591(20):5207-20.
33. Rongvaux A, Shea RJ, Mulks MH, Gigot D, Urbain J, Leo O, et al. Pre-B-cell colony-enhancing factor, whose expression is up-regulated in activated lymphocytes, is a nicotinamide phosphoribosyltransferase, a cytosolic enzyme involved in NAD biosynthesis. Eur J Immunol. 2002;32(11):3225-34.
34. Revollo JR, Grimm AA, Imai S. The NAD biosynthesis pathway mediated by nicotinamide phosphoribosyltransferase regulates Sir2 activity in mammalian cells. J Biol Chem. 2004;279(49):50754-63.
35. Bitterman KJ, Anderson RM, Cohen HY, Latorre-Esteves M, Sinclair DA. Inhibition of silencing and accelerated aging by nicotinamide, a putative negative regulator of yeast sir2 and human SIRT1. J Biol Chem. 2002;277(47):45099-107.
36. Anderson RM, Bitterman KJ, Wood JG, Medvedik O, Sinclair DA. Nicotinamide and PNC1 govern lifespan extension by calorie restriction in Saccharomyces cerevisiae. Nature. 2003;423(6936):181-5.
37. Fougere B, Vellas B, van Kan GA, Cesari M. Identification of biological markers for better characterization of older subjects with physical frailty and sarcopenia. Transl Neurosci. 2015;6(1):103-10.
38. Fluck M, Hoppeler H. Molecular basis of skeletal muscle plasticity--from gene to form and function. Rev Physiol Biochem Pharmacol. 2003;146:159-216.
39. Backx EMP, Horstman AMH, Marzuca-Nassr GN, van Kranenburg J, Smeets JS, Fuchs CJ, et al. Leucine Supplementation Does Not Attenuate Skeletal Muscle Loss during Leg Immobilization in Healthy, Young Men. Nutrients. 2018;10(5).
40. Campbell EL, Seynnes OR, Bottinelli R, McPhee JS, Atherton PJ, Jones DA, et al. Skeletal muscle adaptations to physical inactivity and subsequent retraining in young men. Biogerontology. 2013;14(3):247-59.
41. Suetta C, Hvid LG, Justesen L, Christensen U, Neergaard K, Simonsen L, et al. Effects of aging on human skeletal muscle after immobilization and retraining. J Appl Physiol (1985). 2009;107(4):1172-80.
42. Zhang X, Trevino MB, Wang M, Gardell SJ, Ayala JE, Han X, et al. Impaired Mitochondrial Energetics Characterize Poor Early Recovery of Muscle Mass Following Hind Limb Unloading in Old Mice. J Gerontol A Biol Sci Med Sci. 2018;73(10):1313-22.
43. Suetta C, Frandsen U, Mackey AL, Jensen L, Hvid LG, Bayer ML, et al. Ageing is associated with diminished muscle re-growth and myogenic precursor cell expansion early after immobility-induced atrophy in human skeletal muscle. J Physiol. 2013;591(15):3789-804.
44. Davidson LE, Hudson R, Kilpatrick K, Kuk JL, McMillan K, Janiszewski PM, et al. Effects of exercise modality on insulin resistance and functional limitation in older adults: a randomized controlled trial. Arch Intern Med. 2009;169(2):122-31.
45. McPhee JS, French DP, Jackson D, Nazroo J, Pendleton N, Degens H. Physical activity in older age: perspectives for healthy ageing and frailty. Biogerontology. 2016;17(3):567-80.
46. Saint-Maurice PF, Troiano RP, Bassett DR, Jr., Graubard BI, Carlson SA, Shiroma EJ, et al. Association of Daily Step Count and Step Intensity With Mortality Among US Adults. JAMA. 2020;323(12):1151-60.
Niels_Proefschrift.indd 218Niels_Proefschrift.indd 218 08/12/2020 18:05:5808/12/2020 18:05:58

219
General Discussion
47. van Moorsel D, Hansen J, Havekes B, Scheer F, Jorgensen JA, Hoeks J, et al. Demonstration of a day-night rhythm in human skeletal muscle oxidative capacity. Mol Metab. 2016;5(8):635-45.
48. Nakahata Y, Kaluzova M, Grimaldi B, Sahar S, Hirayama J, Chen D, et al. The NAD+-dependent deacetylase SIRT1 modulates CLOCK-mediated chromatin remodeling and circadian control. Cell. 2008;134(2):329-40.
49. Asher G, Gatfield D, Stratmann M, Reinke H, Dibner C, Kreppel F, et al. SIRT1 regulates circadian clock gene expression through PER2 deacetylation. Cell. 2008;134(2):317-28.
50. Magnone MC, Langmesser S, Bezdek AC, Tallone T, Rusconi S, Albrecht U. The Mammalian circadian clock gene per2 modulates cell death in response to oxidative stress. Front Neurol. 2014;5:289.
51. Nakahata Y, Sahar S, Astarita G, Kaluzova M, Sassone-Corsi P. Circadian control of the NAD+ salvage pathway by CLOCK-SIRT1. Science. 2009;324(5927):654-7.
52. Ramsey KM, Yoshino J, Brace CS, Abrassart D, Kobayashi Y, Marcheva B, et al. Circadian clock feedback cycle through NAMPT-mediated NAD+ biosynthesis. Science. 2009;324(5927):651-4.
53. Huang G, Zhang Y, Shan Y, Yang S, Chelliah Y, Wang H, et al. Circadian Oscillations of NADH Redox State Using a Heterologous Metabolic Sensor in Mammalian Cells. J Biol Chem. 2016;291(46):23906-14.
54. Levine DC, Hong H, Weidemann BJ, Ramsey KM, Affinati AH, Schmidt MS, et al. NAD(+) Controls Circadian Reprogramming through PER2 Nuclear Translocation to Counter Aging. Mol Cell. 2020;78(5):835-49 e7.
55. Kelley DE, Goodpaster B, Wing RR, Simoneau JA. Skeletal muscle fatty acid metabolism in association with insulin resistance, obesity, and weight loss. Am J Physiol. 1999;277(6):E1130-41.
56. Ritov VB, Menshikova EV, He J, Ferrell RE, Goodpaster BH, Kelley DE. Deficiency of subsarcolemmal mitochondria in obesity and type 2 diabetes. Diabetes. 2005;54(1):8-14.
57. van der Lans AA, Hoeks J, Brans B, Vijgen GH, Visser MG, Vosselman MJ, et al. Cold acclimation recruits human brown fat and increases nonshivering thermogenesis. J Clin Invest. 2013;123(8):3395-403.
58. Vosselman MJ, Brans B, van der Lans AA, Wierts R, van Baak MA, Mottaghy FM, et al. Brown adipose tissue activity after a high-calorie meal in humans. Am J Clin Nutr. 2013;98(1):57-64.
59. Saito M, Okamatsu-Ogura Y, Matsushita M, Watanabe K, Yoneshiro T, Nio-Kobayashi J, et al. High incidence of metabolically active brown adipose tissue in healthy adult humans: effects of cold exposure and adiposity. Diabetes. 2009;58(7):1526-31.
60. van Marken Lichtenbelt WD, Vanhommerig JW, Smulders NM, Drossaerts JM, Kemerink GJ, Bouvy ND, et al. Cold-activated brown adipose tissue in healthy men. N Engl J Med. 2009;360(15):1500-8.
61. Palmer BF, Clegg DJ. Non-shivering thermogenesis as a mechanism to facilitate sustainable weight loss. Obes Rev. 2017;18(8):819-31.
62. Fernandez-Verdejo R, Marlatt KL, Ravussin E, Galgani JE. Contribution of brown adipose tissue to human energy metabolism. Mol Aspects Med. 2019;68:82-9.
63. Kazak L, Chouchani ET, Jedrychowski MP, Erickson BK, Shinoda K, Cohen P, et al. A creatine-driven substrate cycle enhances energy expenditure and thermogenesis in beige fat. Cell. 2015;163(3):643-55.
7
Niels_Proefschrift.indd 219Niels_Proefschrift.indd 219 08/12/2020 18:05:5808/12/2020 18:05:58
220
Chapter 7
64. Becker AS, Nagel HW, Wolfrum C, Burger IA. Anatomical Grading for Metabolic Activity of Brown Adipose Tissue. PLoS One. 2016;11(2):e0149458.
65. Gerngross C, Schretter J, Klingenspor M, Schwaiger M, Fromme T. Active Brown Fat During (18)F-FDG PET/CT Imaging Defines a Patient Group with Characteristic Traits and an Increased Probability of Brown Fat Redetection. J Nucl Med. 2017;58(7):1104-10.
66. Watt KK, Garnham AP, Snow RJ. Skeletal muscle total creatine content and creatine transporter gene expression in vegetarians prior to and following creatine supplementation. Int J Sport Nutr Exerc Metab. 2004;14(5):517-31.
67. Burke DG, Chilibeck PD, Parise G, Candow DG, Mahoney D, Tarnopolsky M. Effect of creatine and weight training on muscle creatine and performance in vegetarians. Med Sci Sports Exerc. 2003;35(11):1946-55.
68. Maccormick VM, Hill LM, Macneil L, Burke DG, Smith-Palmer T. Elevation of creatine in red blood cells in vegetarians and nonvegetarians after creatine supplementation. Can J Appl Physiol. 2004;29(6):704-13.
69. Blancquaert L, Baguet A, Bex T, Volkaert A, Everaert I, Delanghe J, et al. Changing to a vegetarian diet reduces the body creatine pool in omnivorous women, but appears not to affect carnitine and carnosine homeostasis: a randomised trial. Br J Nutr. 2018;119(7):759-70.
70. Yamashita H, Ohira Y, Wakatsuki T, Yamamoto M, Kizaki T, Oh-ishi S, et al. Increased growth of brown adipose tissue but its reduced thermogenic activity in creatine-depleted rats fed beta-guanidinopropionic acid. Biochim Biophys Acta. 1995;1230(1-2):69-73.
71. Kazak L, Chouchani ET, Lu GZ, Jedrychowski MP, Bare CJ, Mina AI, et al. Genetic Depletion of Adipocyte Creatine Metabolism Inhibits Diet-Induced Thermogenesis and Drives Obesity. Cell Metab. 2017;26(4):660-71 e3.
72. Kazak L, Rahbani JF, Samborska B, Lu GZ, Jedrychowski MP, Lajoie M, et al. Ablation of adipocyte creatine transport impairs thermogenesis and causes diet-induced obesity. Nat Metab. 2019;1(3):360-70.
73. Vandenberghe K, Goris M, Van Hecke P, Van Leemputte M, Vangerven L, Hespel P. Long-term creatine intake is beneficial to muscle performance during resistance training. J Appl Physiol (1985). 1997;83(6):2055-63.
74. Casey A, Constantin-Teodosiu D, Howell S, Hultman E, Greenhaff PL. Creatine ingestion favorably affects performance and muscle metabolism during maximal exercise in humans. Am J Physiol. 1996;271(1 Pt 1):E31-7.
75. Smith MB, Briggs RW, Shoubridge EA, Hayes DJ, Radda GK. A comparison of in vivo catalysis by creatine kinase in avian skeletal muscles with different fibre composition. Biochim Biophys Acta. 1985;846(1):174-8.
76. Yquel RJ, Arsac LM, Thiaudiere E, Canioni P, Manier G. Effect of creatine supplementation on phosphocreatine resynthesis, inorganic phosphate accumulation and pH during intermittent maximal exercise. J Sports Sci. 2002;20(5):427-37.
77. Schrauwen-Hinderling VB, Kooi ME, Hesselink MK, Jeneson JA, Backes WH, van Echteld CJ, et al. Impaired in vivo mitochondrial function but similar intramyocellular lipid content in patients with type 2 diabetes mellitus and BMI-matched control subjects. Diabetologia. 2007;50(1):113-20.
Niels_Proefschrift.indd 220Niels_Proefschrift.indd 220 08/12/2020 18:05:5808/12/2020 18:05:58

221
General Discussion
78. Phielix E, Schrauwen-Hinderling VB, Mensink M, Lenaers E, Meex R, Hoeks J, et al. Lower intrinsic ADP-stimulated mitochondrial respiration underlies in vivo mitochondrial dysfunction in muscle of male type 2 diabetic patients. Diabetes. 2008;57(11):2943-9.
79. Pinto CL, Botelho PB, Pimentel GD, Campos-Ferraz PL, Mota JF. Creatine supplementation and glycemic control: a systematic review. Amino Acids. 2016;48(9):2103-29.
80. Kreider RB, Kalman DS, Antonio J, Ziegenfuss TN, Wildman R, Collins R, et al. International Society of Sports Nutrition position stand: safety and efficacy of creatine supplementation in exercise, sport, and medicine. J Int Soc Sports Nutr. 2017;14:18.
81. Katsyuba E, Romani M, Hofer D, Auwerx J. NAD(+) homeostasis in health and disease. Nat Metab. 2020;2(1):9-31.
82. Blondin DP, Nielsen S, Kuipers EN, Severinsen MC, Jensen VH, Miard S, et al. Human Brown Adipocyte Thermogenesis Is Driven by β2-AR Stimulation. Cell Metabolism. 2020;32(2):287-300.e7.
7
Niels_Proefschrift.indd 221Niels_Proefschrift.indd 221 08/12/2020 18:05:5808/12/2020 18:05:58

Niels_Proefschrift.indd 222Niels_Proefschrift.indd 222 08/12/2020 18:05:5808/12/2020 18:05:58

AAppendix Impact Paragraaf
Niels_Proefschrift.indd 223Niels_Proefschrift.indd 223 08/12/2020 18:06:0808/12/2020 18:06:08

224
Impact Paragraaf
Wat is het doel van het onderzoeken in dit proefschrift en wat zijn de belangrijkste conclusies?
Met een goede stofwisseling word je gezonder ouder, is de algemene gedachte. Het doel van dit proefschrift is om nieuwe aanknopingspunten te vinden om de stofwisseling van de (oudere) mens te verbeteren. In de cellen van het menselijk lichaam zitten energiecentrales die mitochondriën worden genoemd. Een manier om de werking van de mitochondriën, en daarmee de stofwisseling, te verbeteren, is met behulp van een stof die NAD+ wordt genoemd. NAD+ is een stof die in de mitochondriën nodig is om energie op te wekken. Om meer NAD+ in de mitochondriën aan te maken is vitamine B3 nodig. Door het innemen van extra vitamine B3 kan de hoeveelheid NAD+ in de mitochondriën worden verhoogd, waardoor de mitochondriën mogelijk beter werken. Op deze manier kan de stofwisseling verbeterd worden.
In Hoofdstuk 2 is een literatuurstudie gedaan naar het effect van het innemen van extra vitamine B3 op de stofwisseling in mensen. Het innemen van extra vitamine B3 alléén blijkt niet genoeg om de stofwisseling te verbeteren. Als het innemen van extra vitamine B3 samengaat met regelmatig sporten, dan kan extra vitamine B3 innemen misschien wel de stofwisseling verbeteren.
We weten dat de hoeveelheid NAD+ in de mitochondriën minder wordt met het ouder worden. Dit roept de vraag op of het innemen van extra vitamine B3 door oudere mensen kan zorgen voor een betere stofwisseling?
In Hoofdstuk 3 is dit idee verder onderzocht. Een groep oudere mensen consumeerde een maand lang extra vitamine B3. Vervolgens is de werking van de mitochondriën in de spieren van deze oudere mensen onderzocht. Deze mitochondriën bleken echter niet beter te functioneren na het innemen van extra vitamine B3.
In Hoofdstuk 4 is onderzocht of regelmatig sporten bepaalde effecten van ouder worden kan tegengaan. Allereerst is een groep oudere mensen vergeleken met een groep jonge volwassenen. Hieruit bleek dat de werking van de mitochondriën in de spieren van oudere mensen inderdaad slechter is dan die van jonge mensen. Ook zijn verschillende groepen oudere mensen, die veel of weinig sporten,
Niels_Proefschrift.indd 224Niels_Proefschrift.indd 224 08/12/2020 18:06:0908/12/2020 18:06:09

225
Impact Paragraaf
onderzocht met betrekking tot de werking van de mitochondriën in de spieren en de spieren zelf. Door deze groepen met elkaar te vergelijken is onderzocht wat het effect is van lichaamsbeweging op hogere leeftijd. Met regelmatig sporten op hogere leeftijd kan worden voorkomen dat de werking van de mitochondriën minder wordt. Het veelvuldig (intensief) blijven bewegen op hogere leeftijd is dus goed voor het onderhouden van de gezondheid van de stofwisseling en de werking van de mitochondriën.
Ook het dag-nacht ritme is heel belangrijk voor het goed werken van de stofwisseling en het voorkómen van bijvoorbeeld suikerziekte. Onderzoek in jonge mensen heeft laten zien dat ook de mitochondriën een dag-nacht ritme hebben. In Hoofdstuk 5 is onderzocht of het dag-nacht ritme van de mitochondriën nog aanwezig is bij een groep oudere mannen, die vanwege overgewicht een groter risico hebben op het krijgen van suikerziekte. De werking van de mitochondriën in de spieren is onderzocht op vijf momenten verspreid over één dag en nacht (24 uur). Hieruit bleek dat het dag-nacht ritme van de mitochondriën van deze groep oudere mannen met overgewicht verstoord was. Maar wat is daar de reden van? Het overgewicht? De hogere leeftijd? Of een combinatie van deze factoren? Meer onderzoek is nodig om deze vraag te kunnen beantwoorden. Mogelijk leidt dit tot nieuwe inzichten om het dag-nacht ritme van de mitochondriën te herstellen.
Tijdens het ouder worden neemt de kans op het krijgen van overgewicht toe. Overgewicht geeft een groter risico op het krijgen van ziekten zoals kanker, suikerziekte en/of hart- en vaatziekten. Daarom is het belangrijk om te voorkomen dat mensen overgewicht krijgen. Een van de manieren is ervoor te zorgen dat we meer energie gebruiken dan dat we innemen. Het actief maken van bruin vet kan hiervoor zorgen. Bruin vet is een speciaal soort vet dat heel veel mitochondriën bevat. Mitochondriën in bruin vet zijn bijzonder omdat ze energie kunnen omzetten in warmte. Dit kan worden vergeleken met een straalkachel die elektriciteit omzet in warmte. Als bruin vet veel warmte gaat maken ga je dus meer energie gebruiken waardoor je mogelijk kunt afvallen.
In muizen met overgewicht kan het stofje creatine ervoor zorgen dat bruin vet actiever wordt waardoor het helpt bij het voorkomen van overgewicht. Het is alleen nog niet bekend of dit in mensen ook zo werkt. Daarom is in Hoofdstuk
A
Niels_Proefschrift.indd 225Niels_Proefschrift.indd 225 08/12/2020 18:06:0908/12/2020 18:06:09

226
Impact Paragraaf
6 onderzocht of het innemen van extra creatine het bruin vet in mensen actiever maakt. Een groep jonge volwassenen kreeg negen dagen lang extra creatine om in te nemen. Na deze negen dagen is gemeten of het bruin vet actiever was geworden. De extra creatine zorgde er niet voor dat het bruin vet actiever werd in deze groep volwassenen. In tegensteling tot de muizenstudies, hadden de deelnemers aan het onderzoek geen overgewicht. Daarom moet er verder onderzoek worden gedaan in mensen met overgewicht om uit te zoeken of het innemen van extra creatine bij mensen met overgewicht het bruin vet wel actiever maakt en zo bij te dragen aan het voorkomen van overgewicht.
Wat is de bijdrage van de resultaten aan de wetenschap en maatschappelijke uitdagingen?
De resultaten van de onderzoeken die in dit proefschrift worden beschreven dragen bij aan de bestaande kennis die we hebben over de werking en de gezondheid van de stofwisseling van de mens. Met deze nieuwe kennis is er weer een nieuw puzzelstukje bijgekomen waarmee ons begrip van werking van de stofwisseling verder uitbreidt. Uit de onderzoeken kunnen nieuwe ideeën ontstaan voor onderzoeken waarmee nieuwe en betere manieren kunnen worden gevonden om mensen te helpen gezond ouder te worden. Ook kunnen de resultaten worden gebruikt door bijvoorbeeld overheids- of gezondheidszorginstanties om adviezen op te stellen hoe het aanpassen van de leefwijze kan helpen gezonder ouder te worden.
Mensen worden namelijk steeds ouder en er zijn steeds meer ouderen in verhouding tot het aantal jongeren. Dit fenomeen wordt ‘vergrijzing’ genoemd. Het omgaan met de vergrijzing is een grote maatschappelijke uitdaging, omdat de kans op het krijgen van een ziekte groter is met het ouder worden. Ziektes zoals suikerziekte, kanker en hart- en vaatziekten hebben een grote invloed op het leven en gezondheid van mensen. Ook dragen deze ziektes fors bij aan de stijgende kosten van de gezondheidszorg. Om de gezondheidszorg betaalbaar en de kwaliteit van leven goed te houden is het dus belangrijk dat mensen gezonder oud(er) worden.
Niels_Proefschrift.indd 226Niels_Proefschrift.indd 226 08/12/2020 18:06:0908/12/2020 18:06:09

227
Impact Paragraaf
Voor wie zijn de onderzoeksresultaten interessant en relevant?
De resultaten van de onderzoeken in dit proefschrift zijn voor verschillende groepen mensen interessant. Als eerste voor onderzoekers, omdat de resultaten van de onderzoeken bijdragen aan het beter leren begrijpen hoe de stofwisseling van de mens werkt en hoe deze verandert als we ouder worden. Met deze kennis kunnen onderzoekers nieuwe ideeën gaan onderzoeken met als doel om steeds betere manieren te vinden om gezond oud(er) te worden. Als tweede zijn de resultaten interessant voor de gezondheidszorg. Zo kan er beter advies en uitleg worden gegeven worden aan patiënten over het hoe en waarom van goede voeding, het nut van blijven bewegen, en waarom het hebben van een gezond gewicht en een goed dag-nacht ritme belangrijk zijn voor een goed werkende stofwisseling én om deze te behouden. Ook kan de overheid de resultaten gebruiken om nieuwe, algemene adviezen te maken voor (oudere) mensen over de manier waarop zij leven en hoeveel zij bewegen. Als laatste zijn de resultaten van deze onderzoeken van belang voor iedereen in de samenleving. Iedereen wil oud worden, maar gezond oud worden draagt enorm bij aan een betere kwaliteit van leven.
De resultaten van de onderzoeken zijn beschreven in een aantal artikelen die met het publiek worden gedeeld in tijdschriften, op websites en op sociale media zoals Facebook of Twitter. Ook worden de resultaten van de onderzoeken gepresenteerd op landelijke en internationale bijeenkomsten met lezingen waar andere onderzoekers aanwezig zijn. Als laatste kunnen de resultaten worden gebruikt voor het onderwijs aan studenten of om lezingen voor het algemene publiek te maken.
A
Niels_Proefschrift.indd 227Niels_Proefschrift.indd 227 08/12/2020 18:06:0908/12/2020 18:06:09

Niels_Proefschrift.indd 228Niels_Proefschrift.indd 228 08/12/2020 18:06:0908/12/2020 18:06:09

Appendix Samenvatting
A
Niels_Proefschrift.indd 229Niels_Proefschrift.indd 229 08/12/2020 18:06:1908/12/2020 18:06:19

230
Samenvatting
Het bevorderen van gezond ouder wordenHet nastreven van metabole gezondheid door middel van
voedingsinterventie, fysieke activiteit en de biologische klok
Relevantie
Gedurende de afgelopen 200 jaar is de wereldwijde levensverwachting van de mens fors gestegen. Deze stijging is het gevolg van het implementeren van hygiëne maatregelen, de voortdurende vooruitgang van de gezondheidszorg en de verkrijgbaarheid van betere voeding. Tegelijkertijd neemt binnen de bevolking het aandeel ouderen boven de 65 jaar gestaag toe als gevolg van de stijgende levensverwachting. Dit wordt ook wel ‘vergrijzing’ genoemd. Met een hogere leeftijd wordt de kwaliteit van leven echter ook (negatief) beïnvloed. Er is namelijk een verhoogd risico op morbiditeit met gevorderde leeftijd als gevolg van niet-overdraagbare ziekten zoals diabetes mellitus type 2 (T2DM), hart- en vaatziekten, maligniteiten en degeneratieve ziekten. Deze ziektebeelden zijn dominant vertegenwoordigd in de lijst van de belangrijkste oorzaken van sterfte. Samen zorgen de stijging van de levensverwachting, de verandering van de demografische samenstelling door de vergrijzing én de chronische aard van niet-overdraagbare ziekten voor een toename van de sociaaleconomische belasting van de maatschappij. Deze toenemende belasting rechtvaardigt daarom een verschuiving in het denken van het nastreven van een langere levensduur naar het verbeteren van de gezondheidsduur.
Doel van het proefschrift
In dit proefschrift ligt de focus op het aanpakken van twee kenmerken van veroudering, namelijk de mitochondriële disfunctie en de ontregelde energiestatus van de cel. Het doel van dit proefschrift is deze twee kenmerken van veroudering te beïnvloeden en zo nieuwe doelen te identificeren en te onderzoeken die het gezond ouder worden kunnen bevorderen door het verbeteren van de metabole gezondheid.
De enzymen adenosinemonofosfaat-geactiveerde proteïnekinase (AMPK) en sirtuin 1 (SIRT1) worden beschouwd als sensoren die gevoelig zijn voor
Niels_Proefschrift.indd 230Niels_Proefschrift.indd 230 08/12/2020 18:06:1908/12/2020 18:06:19

231
Samenvatting
veranderingen in het energieniveau van de cel. De energiestatus van een cel wordt weerspiegeld door de verhouding tussen adenosinemonofosfaat (AMP) en adenosinetrifosfaat (ATP) en door de redoxpotentiaal van nicotinamide-adenine-dinucleotide (NAD+) en NADH. Een hoge verhouding tussen AMP en ATP of een hoge redoxpotentiaal van NAD+/NADH weerspiegelt een tekort aan energie en roept een reactie op om het katabole cellulaire metabolisme te optimaliseren. Deze reactie is afkomstig van AMPK die vervolgens SIRT1 activeert, die op zijn beurt peroxisoom-proliferator-geactiveerde receptor gamma-co-activator-1-alfa (PCG-1α) en forkhead box proteïne O1 (FOXO1) activeert. Deze factoren zorgen voor de aanmaak van nieuwe mitochondriën, ook wel mitochondriële biogenese genoemd, en coordineren de verbranding van koolhydraten en vetzuren, waardoor de mitochondriële functie en de algehele metabole gezondheid worden bevorderd.
De redoxpotentiaal van NAD+/NADH speelt een centrale rol bij de activering van AMPK en SIRT1. Daarom is het beïnvloeden van het NAD+ metabolisme een belangrijk doelwit om de gunstige gezondheidseffecten van de AMPK/SIRT1-as op te wekken.
In Hoofdstuk 2 wordt de beschikbare literatuur over de effectiviteit van het beïnvloeden van het NAD+ metabolisme bij de mens bestudeerd met als doel het identificeren van strategieën om de metabole gezondheid in mensen te verbeteren. Deze evaluatie leidt tot de volgende conclusies: 1) lichaamsbeweging en calorische restrictie versterken de expressie van nicotinamide-fosforibosyltransferase (NAMPT) en waardoor de NAD+ niveaus toenemen; 2) NAD+-precursoren kunnen de NAD+ spiegels verhogen en worden over het algemeen goed verdragen door de mens, vooral in de vorm van nicotinamide riboside; 3) klinische humane interventiestudies die de impact van CD38-remmers, poly(ADP-ribose) polymerase-1-remmers of L-tryptofaan hebben onderzocht op de beschikbaarheid van NAD+ ontbreken vooralsnog; en 4) er wordt nog steeds reikhalzend uitgekeken naar overtuigend bewijs dat het verhogen van de NAD+ spiegels metabole stoornissen is de mens kunnen herstellen.
Op basis van de literatuurstudie in Hoofdstuk 2 lijkt de suppletie van NAD+-precursoren via de voeding een manier om het gezond ouder worden te bevorderen
A
Niels_Proefschrift.indd 231Niels_Proefschrift.indd 231 08/12/2020 18:06:1908/12/2020 18:06:19

232
Samenvatting
en de leeftijdsafhankelijke achteruitgang van skeletspiermassa en functie tegen te gaan. Om dit te onderzoeken is in Hoofdstuk 3 het effect van suppletie met NAD+-precursoren op de mitochondriële functie van de skeletspieren onderzocht in veertien fysiek beperkte ouderen in een gerandomiseerde en gecontroleerde klinische studie. De deelnemers hebben gedurende 32 dagen 207.5 mg NAD+-precursoren (bestaande uit L-tryptofaan, nicotinezuur en nicotinamide) als supplement ingenomen, of er is een controlemiddel ingenomen zonder de NAD+-precursoren. Alle deelnemers hebben beide periodes doorlopen waarbij niet bekend was in welke volgorde zij de supplementen ontvingen. De resultaten laten zien dat hoewel de NAD+ concentraties in de skeletspier niet significant verschillend bleken in vergelijking met de controleconditie, de concentratie van het afbraakproduct methyl-nicotinamide significant hoger was na suppletie met NAD+-precursoren. Dit resultaat wijst mogelijk op een verhoogd NAD+ metabolisme. Omgekeerd verbeterde de mitochondriële respiratiecapaciteit niet door suppletie met NAD+-precursoren. Ook de efficiëntie voor het leveren van inspanning was niet veranderd na suppletie met NAD+-precursoren. Daarmee zijn deze bevindingen in overeenstemming met eerdere bevindingen over de werkzaamheid NAD+-precursoren in mensen. NAD+ suppletie door middel van L-tryptofaan, nicotinezuur en nicotinamide verhoogt dus de methyl-nicotinamide niveaus in skeletspierweefsel, maar verbetert de mitochondriële functie en skeletspierfunctie niet in fysiek beperkte ouderen.
De relatie tussen de leeftijdsgebonden achteruitgang van de mitochondriële functie en het effect hiervan op de werking van de skeletspieren is nog niet helemaal duidelijk. De leeftijdsgebonden afname van de mitochondriële capaciteit is mogelijk te wijten aan veroudering, maar kan ook worden verklaard door een leeftijdsgebonden afname van fysieke activiteit. Hoofdstuk 4 brengt in kaart in welke mate fysieke activiteit bijdraagt aan de afname van de mitochondriële functie en spiergezondheid tijdens het verouderingsproces. Dit werd bestudeerd door middel van een gedetailleerde metabole fenotypering van 59 personen met verschillende niveaus aan fysieke activiteit variërend van kwetsbare ouderen tot atleten op leeftijd, en gezonde jonge volwassen die als controle golden. Het vergelijken van deze groepen laat zien dat veroudering geassocieerd is met een afname van de mitochondriële capaciteit, inspanningscapaciteit en -efficiëntie, loopstabiliteit, spierfunctie en insulinegevoeligheid. Bovendien kan een hoger niveau van fysieke activiteit door regelmatige inspanning de effecten van
Niels_Proefschrift.indd 232Niels_Proefschrift.indd 232 08/12/2020 18:06:1908/12/2020 18:06:19
233
Samenvatting
veroudering gedeeltelijk tegengaan. Deze resultaten ondersteunen het idee dat de mitochondriën een therapeutisch doelwit zijn om de achteruitgang van de gezondheid van skeletspieren door veroudering tegen te gaan en om de fysieke functie en prestaties van de skeletspieren te kunnen behouden.
Het is bekend dat het 24-uurs ritme van het metabolisme betrokken is bij de ontwikkeling van leeftijdsgebonden metabole stoornissen. Recent is aangetoond dat de mitochondriële functie van de skeletspieren en het energiemetabolisme een dag-nachtritme vertonen in gezonde jonge mannen. Of het dag-nachtritme in de mitochondriële functie van de skeletspieren en het energiemetabolisme veranderd is in ouderen met metabole stoornissen is nog onbekend. In Hoofdstuk 5 is onderzocht of het ritme van de mitochondriële functie van de skeletspieren is veranderd in een groep van twaalf mannen van middelbare tot oudere leeftijd met overgewicht en insulineresistentie door middel van een reeks skeletspierbiopten verspreid over 24 uur. De mitochondriële functie vertoonde geen dag-nachtritme bij deze groep deelnemers. Bovendien was het ritme van genexpressie van PER2 (de negatieve terugkoppeling van de biologische klok) verstoord. Eveneens bleek er gedurende de 24 uur sprake te zijn van metabole inflexibiliteit. Deze resultaten illustreren het belang van de biologische klok voor het goed functioneren van het metabolisme en vergen nader onderzoek met interventies die erop gericht zijn het ritme te herstellen.
Het verouderingsproces gaat gepaard met een toegenomen mate van overgewicht en obesitas, wat op zijn beurt weer bijdraagt aan de ontwikkeling van niet-overdraagbare ziekten. Omdat overgewicht het resultaat is van een chronische positieve balans tussen de inname van energie vergeleken met de gebruikte energie, is er meer aandacht gekomen voor het onderzoeken van methodes om de energiebalans weer te herstellen. Het activeren van bruin vetweefsel, vetweefsel dat bijzonder rijk is aan mitochondriën en energie uit voedsel kan omzetten in warmte (thermogenese), kan mogelijk bijdragen aan het herstellen van de energiebalans in de mens. Onlangs is aangetoond dat de beschikbaarheid van creatine in vetweefsel vergaande effecten heeft op de thermogenese en de energiebalans in muizen. Welk effect creatine heeft op de thermogenese en de energiebalans in de mens is nog onbekend. In Hoofdstuk 6 werd in 14 gezonde volwassen vegetariërs in een gerandomiseerde placebo-gecontroleerde studie het effect van creatine suppletie op de activering van het bruin vetweefsel en
A
Niels_Proefschrift.indd 233Niels_Proefschrift.indd 233 08/12/2020 18:06:1908/12/2020 18:06:19
234
Samenvatting
op de dieet-geïnduceerde thermogenese onderzocht. Suppletie met creatine bij deze jonge gezonde volwassene leidt niet tot een verbeterde activering van het bruin vetweefsel na blootstelling aan kou. Ook neemt de dieet-geïnduceerde thermogenese niet toe. Deze resultaten sluiten niet uit dat creatine suppletie in mensen met obesitas mogelijk wel van toegevoegde waarde is voor het toenemen van bruin vet activatie en dieet-geïnduceerde thermogenese, dus is er aanvullend onderzoek nodig om deze vraag te beantwoorden.
Conclusies
Het doel van dit proefschrift was om nieuwe doelen te identificeren en te onderzoeken om het gezond ouder worden te bevorderen door de metabole gezondheid te verbeteren. Hoofdstuk 2 suggereert dat voor NAD+ suppletie een gecombineerde aanpak met een andere interventie vereist om het volledige potentieel te benutten, aangezien suppletie met NAD+-precursoren alleen de mitochondriele functie niet verbeterde (Hoofdstuk 3). Tevens levert Hoofdstuk 4 duidelijk bewijs dat lichaamsbeweging op hogere leeftijd gunstig is voor het behoud van de algehele metabole gezondheid en fysieke prestaties.
Aangezien NAD+ betrokken is bij de aansturing van de biologische klok kan de afname van NAD+ met veroudering een factor zijn in het verlies van het ritme in de mitochondriale functie en componenten van de biologische klok zoals gevonden in Hoofdstuk 5. In het geval dat veroudering inderdaad bijdraagt aan het verlies van het 24 uurs ritme van de stofwisseling zou het interessant zijn om vervolgens strategieën te onderzoeken die erop gericht zijn het ritme te herstellen.
Hoewel er geen effecten van creatinesuppletie op bruin vet activering of door dieet-geïnduceerde thermogenese werden waargenomen in Hoofdstuk 6, moet de rol van creatine binnen de energiebalans van de mens verder worden onderzocht om volledig te worden opgehelderd.
Niels_Proefschrift.indd 234Niels_Proefschrift.indd 234 08/12/2020 18:06:1908/12/2020 18:06:19

235
Samenvatting
A
Niels_Proefschrift.indd 235Niels_Proefschrift.indd 235 08/12/2020 18:06:1908/12/2020 18:06:19

Niels_Proefschrift.indd 236Niels_Proefschrift.indd 236 08/12/2020 18:06:1908/12/2020 18:06:19

Appendix About the author
A
Niels_Proefschrift.indd 237Niels_Proefschrift.indd 237 08/12/2020 18:06:2908/12/2020 18:06:29

238
About the Author
Niels_Proefschrift.indd 238Niels_Proefschrift.indd 238 08/12/2020 18:06:2908/12/2020 18:06:29
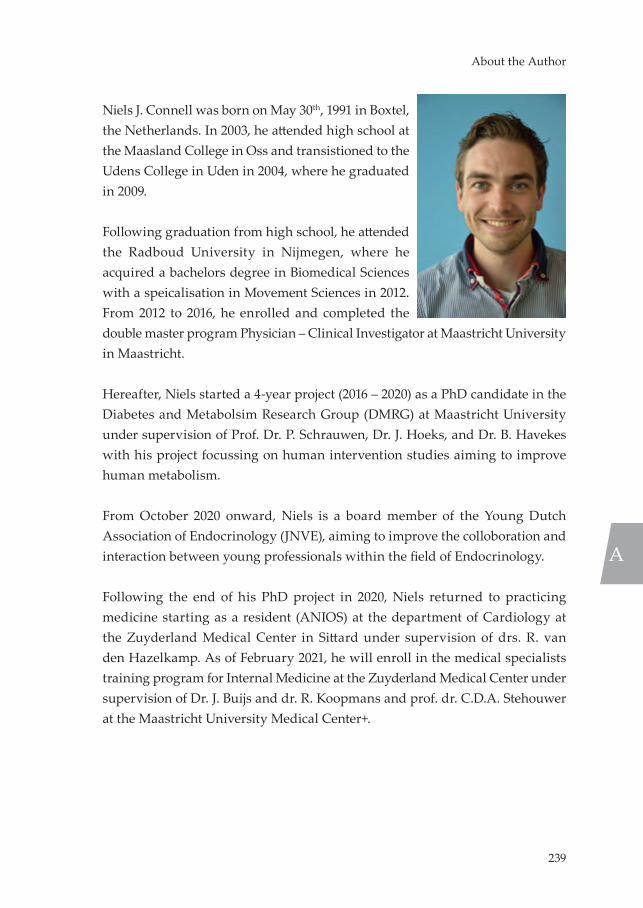
239
About the Author
Niels J. Connell was born on May 30th, 1991 in Boxtel, the Netherlands. In 2003, he attended high school at the Maasland College in Oss and transistioned to the Udens College in Uden in 2004, where he graduated in 2009.
Following graduation from high school, he attended the Radboud University in Nijmegen, where he acquired a bachelors degree in Biomedical Sciences with a speicalisation in Movement Sciences in 2012. From 2012 to 2016, he enrolled and completed the double master program Physician – Clinical Investigator at Maastricht University in Maastricht.
Hereafter, Niels started a 4-year project (2016 – 2020) as a PhD candidate in the Diabetes and Metabolsim Research Group (DMRG) at Maastricht University under supervision of Prof. Dr. P. Schrauwen, Dr. J. Hoeks, and Dr. B. Havekes with his project focussing on human intervention studies aiming to improve human metabolism.
From October 2020 onward, Niels is a board member of the Young Dutch Association of Endocrinology (JNVE), aiming to improve the colloboration and interaction between young professionals within the field of Endocrinology.
Following the end of his PhD project in 2020, Niels returned to practicing medicine starting as a resident (ANIOS) at the department of Cardiology at the Zuyderland Medical Center in Sittard under supervision of drs. R. van den Hazelkamp. As of February 2021, he will enroll in the medical specialists training program for Internal Medicine at the Zuyderland Medical Center under supervision of Dr. J. Buijs and dr. R. Koopmans and prof. dr. C.D.A. Stehouwer at the Maastricht University Medical Center+.
A
Niels_Proefschrift.indd 239Niels_Proefschrift.indd 239 08/12/2020 18:06:3108/12/2020 18:06:31

Niels_Proefschrift.indd 240Niels_Proefschrift.indd 240 08/12/2020 18:06:3108/12/2020 18:06:31

Appendix Publications
A
Niels_Proefschrift.indd 241Niels_Proefschrift.indd 241 08/12/2020 18:06:4008/12/2020 18:06:40

242
Publications
Niels_Proefschrift.indd 242Niels_Proefschrift.indd 242 08/12/2020 18:06:4008/12/2020 18:06:40

243
Publications
Publications
1. Wefers J, Connell NJ, Fealy CE, Andriessen C, de Wit V, van Moorsel D, et al. Day-Night Rhythm of Skeletal Muscle Metabolism is Disturbed in Older, Metabolically Compromised Individuals. Mol Metab. 2020:101050.
2. Pallubinsky H, Phielix E, Dautzenberg B, Schaart G, Connell NJ, de Wit-Verheggen V, et al. Passive exposure to heat improves glucose metabolism in overweight humans. Acta Physiologica. 2020.
3. Remie CM, Roumans KH, Moonen MP, Connell NJ, Havekes B, Mevenkamp J, et al. Nicotinamide riboside supplementation alters body composition and skeletal muscle acetylcarnitine concentrations in healthy obese humans. The American journal of clinical nutrition. 2020.
4. Connell NJ, Houtkooper RH, Schrauwen P. NAD+ metabolism as a target for metabolic health: have we found the silver bullet? Diabetologia. 2019;62(6):888-99.
5. Connell NJ, Tran-Duy A, Vanmolkot FH, Souverein PC, de Wit NJ, Stehouwer CD, et al. Use of proton pump inhibitors and risk of iron deficiency: a population-based case–control study. Journal of internal medicine. 2019;285(2):205-14.
6. Wefers J, van Moorsel D, Hansen J, Connell NJ, Havekes B, Hoeks J, et al. Circadian misalignment induces fatty acid metabolism gene profiles and compromises insulin sensitivity in human skeletal muscle. Proceedings of the National Academy of Sciences. 2018;115(30):7789-94.
7. Connell NJ, Schols RM, Stassen LP. Near-infrared fluorescence imaging for real-time intraoperative anatomical guidance in minimally invasive surgery: a systematic review of the literature. World journal of surgery. 2015;39(5):1069-79.
A
Niels_Proefschrift.indd 243Niels_Proefschrift.indd 243 08/12/2020 18:06:4008/12/2020 18:06:40

Niels_Proefschrift.indd 244Niels_Proefschrift.indd 244 08/12/2020 18:06:4008/12/2020 18:06:40

Appendix Dankwoord
A
Niels_Proefschrift.indd 245Niels_Proefschrift.indd 245 08/12/2020 18:06:4908/12/2020 18:06:49

246
Dankwoord
Ik heb ontzettend genoten van de afgelopen vier jaar en ik ben trots op het boekje dat nu in jouw handen ligt. Net als vele promotietrajecten, heeft ook mijn promotietraject op zijn tijd momenten van frustratie gekend, maar gelukkig waren er veel meer momenten waar ik met plezier en trots op terugkijk! De tijd is voorbijgevlogen, met alle onregelmatige werktijden en lange testdagen en -nachten die erbij kwamen kijken. Ik had dit ook zeker niet alleen kunnen doen…
Als eerste wil ik mijn promotieteam bedanken, Patrick, Joris en Bas. Dank jullie wel voor de fijne en betrokken begeleiding. Vanaf het begin voelde ik me op mijn gemak bij jullie en jullie gaven mij het vertrouwen om alles uit mezelf te halen. Ook kon ik altijd bij jullie terecht met vragen of dit nu werk of privé betrof, en ik heb daarom ook de deur regelmatig bij jullie platgelopen. Gek genoeg vonden de leukste gesprekken altijd plaats in de auto op weg naar of op de terugweg van een congres! Ik heb ontzettend veel van jullie geleerd en hoop dat we de samenwerking in de toekomst kunnen voorzetten. Ik had me geen beter promotieteam kunnen wensen, dank jullie wel!
Verder wil ik de rest van de board van DMRG, Matthijs, Vera en Esther, bedanken voor al jullie begeleiding en steun de afgelopen jaren! Dank jullie wel voor het vertrouwen, jullie begeleiding en betrokkenheid de afgelopen vier jaar!
Ik wil de beoordelingscommissie en de leden van de corona, Prof. Dr. M.C.G.J. Brouwers, Prof. Dr. Ir. E.E. Blaak, Dr. C. Cantó Alvarez, Prof. Dr. Ir. C.P.G.M. de Groot en Dr. A.H.V. Remels bedanken voor het beoordelen en goedkeuren van mijn proefschrift en jullie aanwezigheid tijdens mijn verdediging.
Een grote dank aan alle leden van het TiFN consortium voor alle input, feedback en prettige samenwerking, met in het bijzonder Johan de Vogel, Robert Hageman en Jan Geurts.
A special thank you to all co-authors of the manuscripts in this thesis for their valuable input and contributions!
A big thank you to all the other members of DMRG, new and old, Charlotte, Jeremy, Sten, Maaike, Yvonne, Bas, Daniel, Edmundo, Ciarán, Anne, Frieder,
Niels_Proefschrift.indd 246Niels_Proefschrift.indd 246 08/12/2020 18:06:4908/12/2020 18:06:49

247
Dankwoord
Stephanie, Johanna, Yvo, Esther, Manon, Marlies, Rodrigo, Julian, Emmani, Nynke, Kay, Gert, Froukje, Anna, Pandi, Jeroen, Mijke, Tineke, Vera, Lena, Sabine, Dennis, Eva, Jan, Elena, Lucas, Sarah, Dirk, Carlijn, Domenico, Jakob, en Evelyn! Thank you for all your held and the great atmosphere! I wish you all the best with your future endeavours!
Helaas hebben we gedurende de afgelopen maanden geen kans meer gehad om samen op het lab te staan, maar ik wil jullie, Gert, Esther K. en Johanna, bedanken voor jullie betrokkenheid en alles wat jullie mij hebben geleerd de afgelopen jaren!
Een speciale dank voor Desiree en Yolanda. Ik ga het ‘even binnenlopen om te kletsen en dan 30 minuten later pas weer weglopen’ missen! Dank jullie wel voor al jullie hulp en ondersteuning de afgelopen jaren.
Bedankt aan alle leden van de TherNU groep, met in het bijzonder Wouter, Michiel en Pascal voor jullie input en hulp bij de CreaBAT studie!
Roomie! Marlies, jij bent als enige vanaf mijn allereerste stappen in het MRUM tot aan de laatste stappen in de aula, als mijn paranimf, bij mijn promotietraject betrokken. Ik had me geen betere roomie kunnen wensen! Jouw werkethos en nauwgezette, systematische nauwkeurigheid zijn een voorbeeld voor velen en ook voor mij! Dank je wel voor alles, de pranks, de koffie om half 9 precies, de pecan broodjes, het aanhoren van mijn klaagzang en nog zo veel meer!
Sten, mijn andere paranimpf! Jouw komst bracht een forse extra dosis Brabant naar de DMRG die ons al heel snel bij elkaar bracht! Dank je wel voor al jouw hulp met de testdagen, de leuke gesprekken, de pranks en het lachen, gieren en brullen op de werkvloer! Ik vind het heel tof dat jij mijn paranimpf bent!
Daniel, thank you for being the best intern and colleague I could have wished for. I couldn’t have done all those test days without your help. You gave me the confidence and peace of mind knowing that you would take care of everything with great care and precision. I’ve really enjoyed working togehter with you and hope we can one day do another project together.
A
Niels_Proefschrift.indd 247Niels_Proefschrift.indd 247 08/12/2020 18:06:4908/12/2020 18:06:49

248
Dankwoord
Tineke, dank je wel voor al jouw hulp en jouw eindeloze aanvoer van zoetigheid op het kantoor!
Joey, dank je wel voor jouw hulp met biopteren, de koppen koffie, en de toffe avonden met een bierjte!
Jan, Jakob and Dirk, the Chronos Special Ops, the original Circadian Rhythm team. You three took me on when I just started out as a PhD student and taught me the ropes of running a test day and really put me through my paces. Thank you for all the awesome nights of testing!
Aan alle leden van VBW en HB: dank jullie wel voor de hulp en de prettige samenwerking. In het bijzonder een grote dank aan Marc, Paul, Loek, Gabby en Wendy voor alle technische ondersteuning!
Ik wil iedereen van de afdeling Radiologie en Nucleaire Geneeskunde bedanken die heeft geholpen bij met de onderzoeken en in het bijzonder Roel, Rick, Roland, Kim, Axel, en alle dames van de PET-MR!
Een speciale en grote dank aan alle deelnemers van de onderzoeken!
De “babies”, Tom, Tim, Rob, Rob, Jasper, Jeroen, Joep en Etienne, dank jullie wel voor alle ontspanning en feest tussen het werken door!
Marco, dank je wel voor jouw eindeloze interesse in al die gekke onderzoeken van mij en voor het aanhoren van mijn frustraties als het weer eens niet zo liep zoals ik wilde. Ik kijk uit naar de nog talloze playdates met de jongens en de concerten die we nog gaan bezoeken met een ontspannend glaasje erbij!
Ik wil mijn familie, Mama en Ben, Zoë en Ruud en Jens, bedanken voor hun steun en vertrouwen! Ook wil ik mijn schoonfamilie, Anne-Marie en Wim, Opa, Robert, en Daphne en Laurence, bedanken voor hun hulp en luisterend oor!
Lieve Loes, ik had dit project echt niet zonder jou kunnen doen. Jij bent mijn steun en toeverlaat. Jij had altijd begrip als ik vroeg op moest, laat of helemaal niet ’s nachts thuiskwam. Jij luistert naar mijn frustraties en zorgen, stelt me
Niels_Proefschrift.indd 248Niels_Proefschrift.indd 248 08/12/2020 18:06:4908/12/2020 18:06:49

249
Dankwoord
gerust, bent mijn klankbord en motiveert me altijd om door te gaan. Jij geeft mij een thuis om naar terug te komen en de rust om tot rust te komen. Ik kijk uit naar onze toekomst samen, samen met onze kinderen! Ik hou van jou en dat zal altijd zo blijven!
Lieve Mees, mijn trots en mijn lieve, kleine, ondeugende ventje! Jij was er altijd om mij eraan te herinneren dat het tijd was voor een fruit pauze, een boterham en een paar slaapjes als ik thuis aan het werken was. Ik ben trots dat ik jouw papa ben!
En als laatste, ‘Mini’. Jij bent nog zo klein en groeit iedere dag. Ik kan niet wachten tot jouw mama, grote broer en ik jou in onze armen kunnen sluiten. Tot snel, ventje!
Voor iedereen die hier niet expliciet is genoemd en heeft bijgedragen aan dit werk, DANK JE WEL‼!
A
Niels_Proefschrift.indd 249Niels_Proefschrift.indd 249 08/12/2020 18:06:4908/12/2020 18:06:49

Niels_Proefschrift.indd 250Niels_Proefschrift.indd 250 08/12/2020 18:06:4908/12/2020 18:06:49


Promoting healthy ageingIn pursuit of metabolic health through nutritional intervention,
physical activity, and the molecular clock
Promoting healthy ageing
Niels J. Connell
Niels J. C
onnell
Met
abol
ic h
ealth
Age
NAD+
Physical activityMolecular clock
Brown adipose tissueCreatine
Deregulated nutrient sensing
Mitochondrial dysfunction
Niels_Omslag.indd 2-3Niels_Omslag.indd 2-3 02/12/2020 13:45:2002/12/2020 13:45:20