
Imaging of tumor hypoxia with PET - Maastricht University
226
Imaging of tumor hypoxia with PET Citation for published version (APA): Zegers, C. M. L. (2016). Imaging of tumor hypoxia with PET: a step towards individualized cancer treatment. Maastricht University. https://doi.org/10.26481/dis.20160309cz Document status and date: Published: 01/01/2016 DOI: 10.26481/dis.20160309cz Document Version: Publisher's PDF, also known as Version of record Please check the document version of this publication: • A submitted manuscript is the version of the article upon submission and before peer-review. There can be important differences between the submitted version and the official published version of record. People interested in the research are advised to contact the author for the final version of the publication, or visit the DOI to the publisher's website. • The final author version and the galley proof are versions of the publication after peer review. • The final published version features the final layout of the paper including the volume, issue and page numbers. Link to publication General rights Copyright and moral rights for the publications made accessible in the public portal are retained by the authors and/or other copyright owners and it is a condition of accessing publications that users recognise and abide by the legal requirements associated with these rights. • Users may download and print one copy of any publication from the public portal for the purpose of private study or research. • You may not further distribute the material or use it for any profit-making activity or commercial gain • You may freely distribute the URL identifying the publication in the public portal. If the publication is distributed under the terms of Article 25fa of the Dutch Copyright Act, indicated by the “Taverne” license above, please follow below link for the End User Agreement: www.umlib.nl/taverne-license Take down policy If you believe that this document breaches copyright please contact us at: [email protected] providing details and we will investigate your claim. Download date: 11 Jan. 2022
-
Upload
khangminh22 -
Category
Documents
-
view
1 -
download
0
Transcript of Imaging of tumor hypoxia with PET - Maastricht University
Imaging of tumor hypoxia with PET
Citation for published version (APA):
Zegers, C. M. L. (2016). Imaging of tumor hypoxia with PET: a step towards individualized cancertreatment. Maastricht University. https://doi.org/10.26481/dis.20160309cz
Document status and date:Published: 01/01/2016
DOI:10.26481/dis.20160309cz
Document Version:Publisher's PDF, also known as Version of record
Please check the document version of this publication:
• A submitted manuscript is the version of the article upon submission and before peer-review. There canbe important differences between the submitted version and the official published version of record.People interested in the research are advised to contact the author for the final version of the publication,or visit the DOI to the publisher's website.• The final author version and the galley proof are versions of the publication after peer review.• The final published version features the final layout of the paper including the volume, issue and pagenumbers.Link to publication
General rightsCopyright and moral rights for the publications made accessible in the public portal are retained by the authors and/or other copyrightowners and it is a condition of accessing publications that users recognise and abide by the legal requirements associated with theserights.
• Users may download and print one copy of any publication from the public portal for the purpose of private study or research.• You may not further distribute the material or use it for any profit-making activity or commercial gain• You may freely distribute the URL identifying the publication in the public portal.
If the publication is distributed under the terms of Article 25fa of the Dutch Copyright Act, indicated by the “Taverne” license above,please follow below link for the End User Agreement:
www.umlib.nl/taverne-license
Take down policyIf you believe that this document breaches copyright please contact us at:
providing details and we will investigate your claim.
Download date: 11 Jan. 2022
Imaging of tumor hypoxia with PET
Karen Zegers
Karen ZegersIm
aging of tumor hypoxia with PET a step towards individualized cancer treatm
ent
a step towards individualized cancer treatment
Omslag Karen Zegers 352x240 V1.indd 1 3-2-2016 11:45:39

Production Printing: Datawyse | Universitaire Pers Maastricht ISBN: 978 94 6159 537 9 © Copyright C.M.L. Zegers, Maastricht 2016
Imaging of tumor hypoxia with PET: a step towards individualized cancer treatment
Proefschrift
ter verkrijging van de graad van doctor aan de Universiteit Maastricht, op gezag van de Rector Magnificus Prof. Dr. L.L.G. Soete,
volgens het besluit van het College van Decanen, in het openbaar te verdedigen
op woensdag 9 maart 2016 om 14:00 uur
door
Catharina Maria Louise Zegers
UNIVERSITAIREPERS MAASTRICHT
U P
M

Promotor Prof. Dr. P. Lambin Copromotoren Dr. W. van Elmpt Dr. L. Dubois Beoordelingscommissie Prof. Dr. F. Ramaekers (Maastricht University, voorzitter) Prof. Dr. M. Vooijs (Maastricht University) Prof. Dr. D. Zips (University Tübingen) Dr. J. Bussink (Radboud University Medical Centre Nijmegen)
CONTENTS
Introduction Chapter 1 Introduction and outline of the thesis 9
Chapter 2 Review: Current preclinical and clinical applications of hypoxia PET imaging using 2-nitroimidazoles
21
Imaging of tumor hypoxia Chapter 3 A comparative study of the hypoxia PET tracers [18F]HX4,
[18F]FAZA and [18F]FMISO in a preclinical tumor model
55
Chapter 4 Repeatability of hypoxia PET imaging using [18F]HX4 in lung and head and neck cancer patients
75
Chapter 5 Hypoxia imaging with [18F]HX4 PET in NSCLC patients: defining optimal imaging parameters
95
Clinical potential and therapeutic targets Chapter 6 In vivo quantification of hypoxic and metabolic status of
NSCLC using [18F]HX4 and [18F]FDG PET/CT imaging
115
Chapter 7 Imaging of tumor hypoxia and metabolism in patients with HNSCC
135
Chapter 8 Evaluation of tumor hypoxia during radiotherapy using [18F]HX4 PET imaging and blood biomarkers in HNSCC
149
Chapter 9 TH-302 in combination with radiotherapy enhances the thera-peutic outcome and is associated with pretreatment [18F]HX4 PET imaging.
165
Discussion Chapter 10 General discussion and summary
189
Chapter 11 Concluding remarks and future perspectives 199 Valorization addendum 205 Curriculum vitae List of publications
211215
Dankwoord 221


INTRODUCTION


CHAPTER
Introduction and outline of the thesis

Introduction and outline of the thesis 11
INTRODUCTION
Cancer
Cancer is one of the leading causes of death worldwide. The number of new cancer cases is expected to increase from 14 million in 2012 to 22 million within the next 20 years (1). Cancer originates from normal cells that undergo several genetic alterations, leading to a malignant, uncontrolled cell growth. There are more than 100 distinct types of cancer, which have various essential alterations in common. These so-called hallmarks of cancer are (i) independence in the production of growth signals, (ii) insensitivity to signals that inhibit growth, (iii) escape from programmed cell death, (iv) unlimited replicative poten-tial, (v) sustained angiogenesis (vi) the ability to invade other tissues and metastasize, (vii) reprogramming of cellular energy metabolism and (viii) avoiding immune destruction. Due to the combination of these hallmarks, cancer cells are able to circumvent the anticancer defense mechanism of normal cells (2, 3). The ultimate aim of anti-cancer therapy is to provide a personalized treatment based on patient-specific tumor characteristics. The three main cancer treatment modalities are surgery, radiotherapy and chemotherapy. Where surgery physically removes the malig-nant lesions, radiotherapy will deposit a high local dose of radiation to the tumor with the aim to kill all present tumor cells. Systemic chemotherapy on the other hand, targets the cancer cells based on their high proliferative characteristics. Frequently these methods are combined to provide the optimal anti-cancer treatment for each specific tumor site, taking into account the effects on healthy tissues and potential morbidity.
Tumor hypoxia
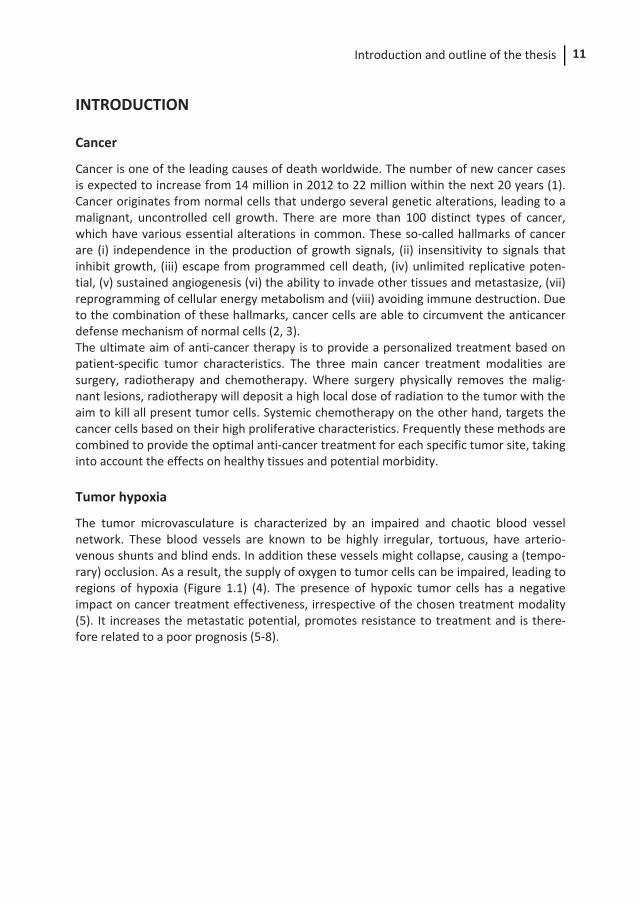
The tumor microvasculature is characterized by an impaired and chaotic blood vessel network. These blood vessels are known to be highly irregular, tortuous, have arterio-venous shunts and blind ends. In addition these vessels might collapse, causing a (tempo-rary) occlusion. As a result, the supply of oxygen to tumor cells can be impaired, leading to regions of hypoxia (Figure 1.1) (4). The presence of hypoxic tumor cells has a negative impact on cancer treatment effectiveness, irrespective of the chosen treatment modality (5). It increases the metastatic potential, promotes resistance to treatment and is there-fore related to a poor prognosis (5-8).
Chapter 1 12
Figure 1.1: Schematic representation of the vasculature in normal and malignant tissues. [Reproduced from Brown and Giaccia (4)] Tumor hypoxia influences malignancy through several mechanisms. The tumors adapt to a low oxygen concentration by the activation of several physiological responses, for exam-ple an increased anaerobic glycolysis and angiogenesis. Also, a natural selection takes place, since only cells that are able to cope with the low oxygen concentration will survive and proliferate, causing a more malignant phenotype. In addition hypoxia can alter the DNA repair capacity, which promotes genomic instability and can accelerate the cancer development (9). For radiotherapy, the presence of oxygen has a beneficial value. DNA damage is induced directly or indirectly by the formation of free radicals after irradiation. These radicals are unstable and will react rapidly with oxygen to produce a stable chemical composition. The damage to the DNA is chemically ‘fixed’ (5, 9). This reaction cannot take place in the absence of oxygen, since the ionized target molecules are able to repair themselves. The extent of the DNA damage is therefore dependent on the presence or absence of oxygen. The ratio of radiation dose which will kill the same number of hypoxic cells, in comparison to normoxic cells is called the oxygen enhancement ratio and is in general around 3 (9). Theoretically, the radiation dose to hypoxic tumors should be increased to effectively treat these lesions. However, the dose to the whole tumor cannot be increased without conse-quences regarding healthy tissue toxicity. Smart solutions, targeting the hypoxic tumor cells (i.e. providing only a local high dose) or enhancing the susceptibility of hypoxic tumor cells to therapy (i.e. by anti-hypoxia targeting) have the potential to increase the thera-peutic window of radiotherapy. However, to target tumor hypoxia, an accurate and reliable detection and visualization of tumor hypoxia is needed (10).
Introduction and outline of the thesis 13
PET imaging
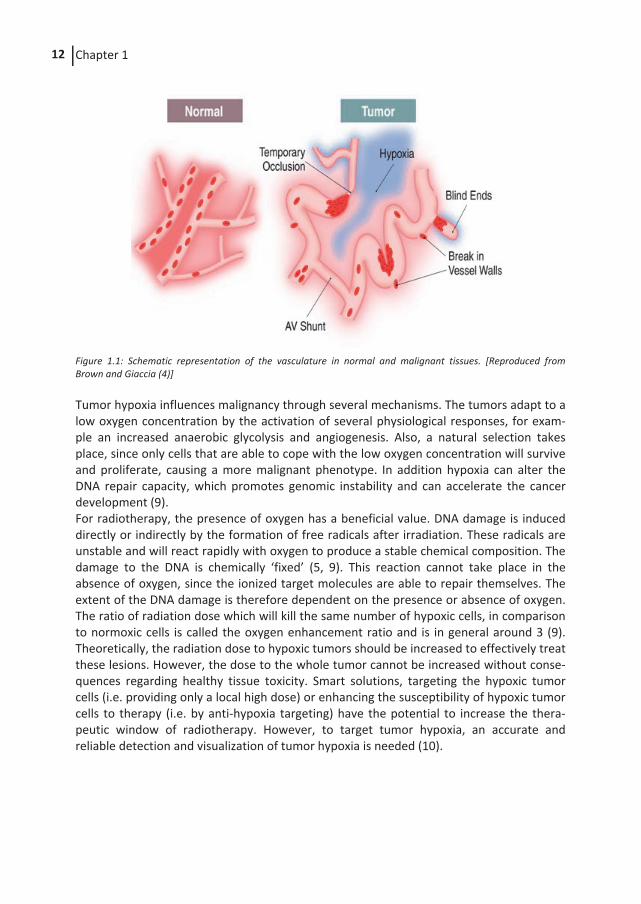
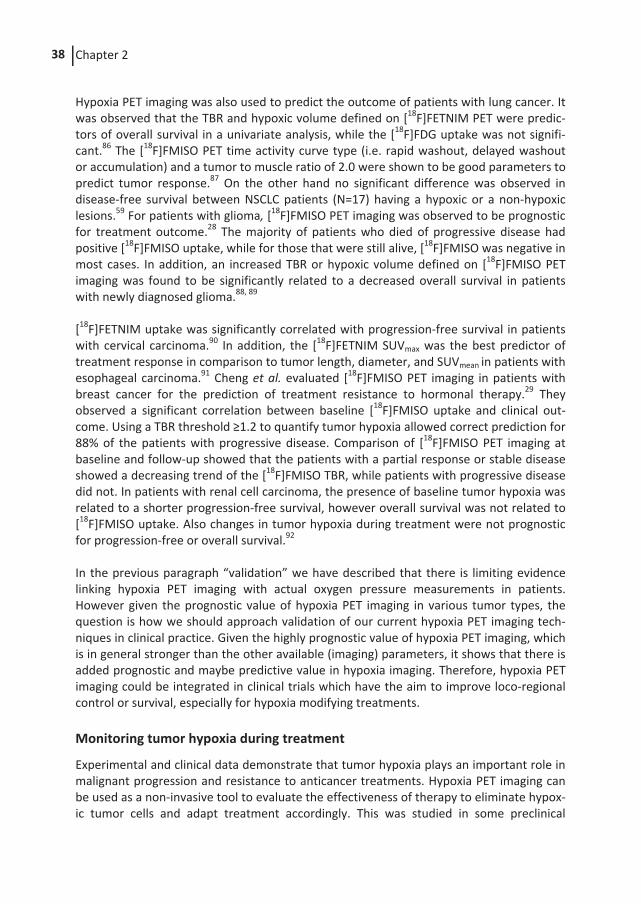
Positron Emission Tomography (PET) is a non-invasive imaging technique, which uses radioactive labeled molecules (tracers) to visualize specific molecular interactions within the body. The radionuclide will decay, emitting a positron which reacts with a nearby electron, producing 2 photons which are emitted opposite to each other. After intrave-nous injection, the tracer will distribute through the body and accumulate in certain regions (e.g. the tumour), the PET scanner detects the emitted gamma photons and, after image reconstruction, visualizes the location of the radioactive tracer within the body (Figure 1.2). In general the PET scanner is combined with a computed tomography (CT) scanner to visualize the anatomy of the patient and to correct for the attenuation of the gamma photons (11, 12).
Figure 1.2: Schematic illustration of the detection of a radioactive tracer within the body. Positrons released from the radionuclide react with electrons in the tissue, releasing two gamma photons which can be detected by the PET scanner [Reproduced from van der Veldt et al. (11)].
Metabolic imaging
The most frequently used PET tracer is the Fluor-18 [18F] labeled glucose analog, fluorode-oxyglucose (FDG). Organs with a high glucose metabolism like the brain, heart and cancer heavily consume this tracer. In contrast to normal cells, which rely primarily on oxidative phosphorylation to generate energy, most cancer cells produce energy by a high rate of aerobic glycolysis, the ‘Warburg effect’ (13). This upregulation of glycolysis results in an increased glucose consumption, which can be visualized with [18F]FDG PET imaging (14). [18F]FDG PET is used to detect and stage malignancies, guide radiotherapist in the delinea-tion of the target volume and to monitor the response to treatment. In addition, previous studies have shown that the subvolumes of the tumor with the highest FDG PET uptake, were more susceptible to develop a local recurrence after (chemo)radiotherapy (15-18). Therefore, ongoing clinical studies are initiated to investigate whether a higher radiation dose to the high FDG subvolumes will increase the local tumor control (19-21).
Chapter 1 14
Hypoxia imaging
Hypoxia PET imaging is an interesting research topic for several years, but has not reached the routine clinical practice. The majority of hypoxia PET tracers are based on radioactive [18F] labeled 2-nitroimidazoles, which are bioreduced in hypoxic tumor cells and therefore specifically bound in these cells. There are many tracers available to visualize tumor hypoxia (10, 22). The first hypoxia PET tracer was [18F]misonidazole (FMISO), which was followed by the radioactive labeled etanidazole radiosensitizers ([18F]EF3 and [18F]EF5). These three hypoxia PET tracers have a relatively high lipophilicity, which allows them to easily penetrate the cell membranes, but therefore show a slow clearance of unbound tracer from the normal tissues. This causes a low image contrast between the hypoxic tumor and normal tissues. Therefore, more hydrophilic PET tracers were developed, to allow a faster clearance from the non-hypoxic tissues, with the aim to obtain a higher image contrast. Examples of these hydrophilic PET tracers are fluoroerythronitroimidazole ([18F]FETNIM) and fluoroazomycin arabinoside ([18F]FAZA). The most recently developed, very hydrophilic PET tracer is flortanidazole [18F]HX4, which aims for preferred pharmaco-kinetics and clearance properties. [18F]HX4 was used in preclinical setting in a rat rhabdo-myosarcoma model. In this model the uptake of [18F]HX4 was significantly correlated to the immunohistochemistry staining for hypoxia (pimonidazole), providing the evidence that [18F]HX4 accumulates specifically in the hypoxic subvolumes of the tumor (23). The biodistribution and radiation dosimetry of [18F]HX4 was assessed in monkeys and humans, showing that the effective dose of [18F]HX4 PET was comparable to other PET imaging modalities with the [18F] radionuclide (24). The first clinical phase I study with [18F]HX4 proved the feasibility and safety of [18F]HX4 PET in patients without toxicity (25). Based on these promising results, new preclinical and clinical studies were initiated using [18F]HX4 PET imaging. The current status of hypoxia PET imaging with [18F]HX4 will be presented in the next chapters of this thesis.
Lung and head & neck cancer
The use of radioactive labeled nitroimidazoles to assess tumor hypoxia by PET imaging is described for various carcinomas. The literature is however, dominated by studies in patients with head and neck cancer and lung cancer. In 1996 Rasey et al. already described the quantification of tumor hypoxia, using [18F]FMISO, in patients with non-small-cell-lung cancer (NSCLC) and head and neck cancer. They observed tumor hypoxia in all NSCLC and head and neck cancer lesions, however a broad range (0.2 – 94.7%) of the fractional hypoxic volume was reported (26). Also, more recent studies confirm that in the majority of head and neck cancer and lung cancer patients a significant amount of tumor hypoxia is present, which can counteract the treatment effectiveness in these patients (7, 27-29). The meta-analysis published by Overgaard et al. (30, 31) showed that hypoxia modifying treatment has the potential to improve tumor control in patients with head and neck cancer. In addition, in patients with locally advanced non-small cell lung cancer (NSCLC) there is a need to improve the tumor control, since the standard treatment modality (radiotherapy in combination with chemotherapy), has a limited progression free survival (32). Therefore, the focus of this thesis will be the use of hypoxia PET imaging in patients with head and neck and lung cancer.
Introduction and outline of the thesis 15
OBJECTIVE AND OUTLINE OF THE THESIS
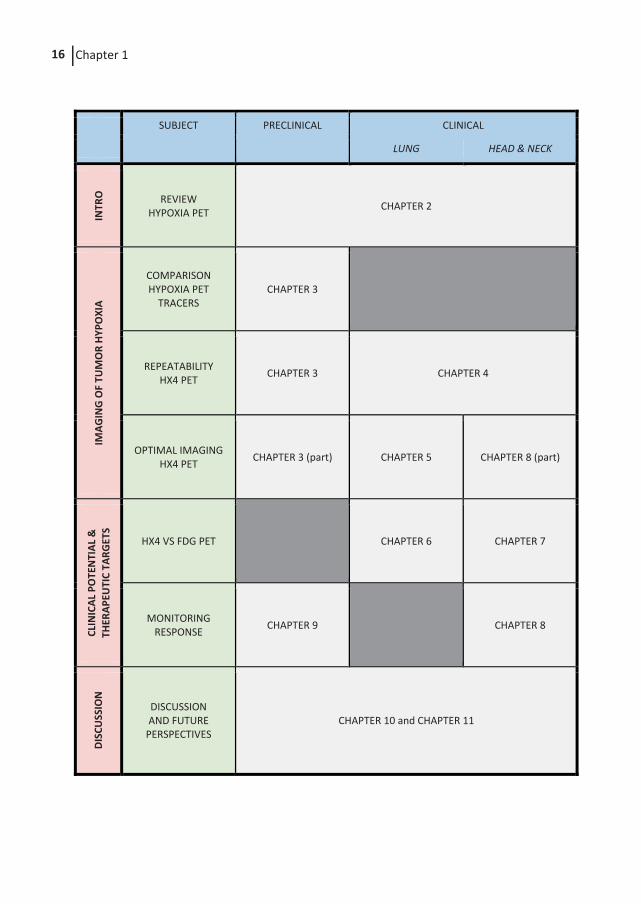
The general objective of this thesis is to show that non-invasive imaging of tumor hypoxia has the potential to contribute to individualized anti-cancer treatment by (i) the accurate and reliable identification of hypoxic (sub)volumes within the tumor and (ii) the ability to monitor the response to treatment. In Chapter 2 a literature overview is presented including preclinical and clinical research using 2-nitroimidazole based hypoxia PET tracers. Topics regarding the validation and quantification of hypoxia PET imaging and its (clinical) applications are addressed. The next three chapters are focused on the ability to select the optimal hypoxia tracer and its implementation in clinical practice. Chapter 3 describes a pre-clinical study comparing frequently used 2-nitroimidazole based hypoxia PET tracers FAZA, FMISO and HX4 within one tumor model. In Chapter 4 the repeatability of the hypoxia PET tracer HX4 is ad-dressed in patients with head and neck and lung cancer. The focus of Chapter 5 is the definition of optimal imaging parameters for HX4 PET imaging in patients with non-small cell lung cancer (NSCLC). The second part of this thesis shows the clinical results of HX4 PET imaging and its potential use for therapeutic targeting. Chapter 6 and Chapter 7 evaluate the added value of hypoxia PET imaging with HX4 to the frequently used meta-bolic PET tracer FDG in patients with NSCLC and head and neck cancer, respectively. Chapter 8 provides insight in the changes of tumor hypoxia during treatment in patients with HNSCC. In addition the link between imaging and blood biomarkers is addressed. In Chapter 9 the results are presented of the addition of the hypoxia targeted drug TH-302 to radiotherapy in combination with hypoxia PET imaging. In Chapter 10 a general discussion and summary are provided. Finally, in Chapter 11 the concluding remarks and future perspectives on the topics presented within this thesis are discussed.
Chapter 1 16
SUBJECT PRECLINICAL CLINICAL
LUNG HEAD & NECK
INTR
O
REVIEW HYPOXIA PET CHAPTER 2
IMAG
ING
OF
TUM
OR
HYPO
XIA
COMPARISON HYPOXIA PET
TRACERS CHAPTER 3
REPEATABILITY HX4 PET CHAPTER 3 CHAPTER 4
OPTIMAL IMAGING HX4 PET CHAPTER 3 (part) CHAPTER 5 CHAPTER 8 (part)
CLIN
ICAL
PO
TEN
TIAL
&
THER
APEU
TIC
TARG
ETS
HX4 VS FDG PET CHAPTER 6 CHAPTER 7
MONITORING RESPONSE CHAPTER 9 CHAPTER 8
DI
SCU
SSIO
N
DISCUSSION AND FUTURE
PERSPECTIVES CHAPTER 10 and CHAPTER 11
Introduction and outline of the thesis 17
REFERENCES
1. World Health Organisation. February 2015 [Available from: http://www.who.int/ mediacentre/factsheets/fs297/en/]
2. Hanahan D, Weinberg RA. The hallmarks of cancer. Cell. 2000;100:57-70. 3. Hanahan D, Weinberg RA. Hallmarks of cancer: the next generation. Cell. 2011;144:
646-74. 4. Brown JM, Giaccia AJ. The unique physiology of solid tumors: opportunities (and
problems) for cancer therapy. Cancer Res. 1998;58:1408-16. 5. Pettersen EO, Ebbesen P, Gieling RG, Williams KJ, Dubois L, Lambin P, et al. Targeting
tumour hypoxia to prevent cancer metastasis. From biology, biosensing and technology to drug development: the METOXIA consortium. J Enzyme Inhib Med Chem. 2014:1-33.
6. Nordsmark M, Bentzen SM, Rudat V, Brizel D, Lartigau E, Stadler P, et al. Prognostic value of tumor oxygenation in 397 head and neck tumors after primary radiation therapy. An international multi-center study. Radiother Oncol. 2005;77:18-24.
7. Zips D, Zophel K, Abolmaali N, Perrin R, Abramyuk A, Haase R, et al. Exploratory prospective trial of hypoxia-specific PET imaging during radiochemotherapy in patients with locally advanced head-and-neck cancer. Radiother Oncol. 2012;105:21-8.
8. Milosevic M, Warde P, Menard C, Chung P, Toi A, Ishkanian A, et al. Tumor hypoxia predicts biochemical failure following radiotherapy for clinically localized prostate cancer. Clin Cancer Res. 2012;18:2108-14.
9. Joiner M, van der Kogel A. Basic Clinical Radiobiology. 2009. 10. Horsman MR, Mortensen LS, Petersen JB, Busk M, Overgaard J. Imaging hypoxia to
improve radiotherapy outcome. Nat Rev Clin Oncol. 2012;9:674-87. 11. van der Veldt AA, Smit EF, Lammertsma AA. Positron Emission Tomography as a
Method for Measuring Drug Delivery to Tumors in vivo: The Example of [(11)C] docetaxel. Front Oncol. 2013;3:208.
12. Gambhir SS. Molecular imaging of cancer with positron emission tomography. Nat Rev Cancer. 2002;2:683-93.
13. Vander Heiden MG, Cantley LC, Thompson CB. Understanding the Warburg effect: the metabolic requirements of cell proliferation. Science. 2009;324:1029-33.
14. Gatenby RA, Gillies RJ. Why do cancers have high aerobic glycolysis? Nat Rev Cancer. 2004;4:891-9.
15. Aerts HJ, van Baardwijk AA, Petit SF, Offermann C, Loon J, Houben R, et al. Identification of residual metabolic-active areas within individual NSCLC tumours using a pre-radiotherapy (18)Fluorodeoxyglucose-PET-CT scan. Radiother Oncol. 2009;91:386-92.
16. Due AK, Vogelius IR, Aznar MC, Bentzen SM, Berthelsen AK, Korreman SS, et al. Recurrences after intensity modulated radiotherapy for head and neck squamous cell carcinoma more likely to originate from regions with high baseline [18F]-FDG uptake. Radiother Oncol. 2014;111:360-5.
17. Calais J, Thureau S, Dubray B, Modzelewski R, Thiberville L, Gardin I, et al. Areas of high 18F-FDG uptake on preradiotherapy PET/CT identify preferential sites of local
Chapter 1 18
relapse after chemoradiotherapy for non-small cell lung cancer. J Nucl Med. 2015;56:196-203.
18. Calais J, Dubray B, Nkhali L, Thureau S, Lemarignier C, Modzelewski R, et al. High FDG uptake areas on pre-radiotherapy PET/CT identify preferential sites of local relapse after chemoradiotherapy for locally advanced oesophageal cancer. Eur J Nucl Med Mol Imaging. 2015;42:858-67.
19. Heukelom J, Hamming O, Bartelink H, Hoebers F, Giralt J, Herlestam T, et al. Adaptive and innovative Radiation Treatment FOR improving Cancer treatment outcomE (ARTFORCE); a randomized controlled phase II trial for individualized treatment of head and neck cancer. BMC Cancer. 2013;13:84.
20. van Elmpt W, De Ruysscher D, van der Salm A, Lakeman A, van der Stoep J, Emans D, et al. The PET-boost randomised phase II dose-escalation trial in non-small cell lung cancer. Radiother Oncol. 2012;104:67-71.
21. Berwouts D, Olteanu LA, Duprez F, Vercauteren T, De Gersem W, De Neve W, et al. Three-phase adaptive dose-painting-by-numbers for head-and-neck cancer: initial results of the phase I clinical trial. Radiother Oncol. 2013;107:310-6.
22. Lopci E, Grassi I, Chiti A, Nanni C, Cicoria G, Toschi L, et al. PET radiopharmaceuticals for imaging of tumor hypoxia: a review of the evidence. Am J Nucl Med Mol Imaging. 2014;4:365-84.
23. Dubois LJ, Lieuwes NG, Janssen MH, Peeters WJ, Windhorst AD, Walsh JC, et al. Preclinical evaluation and validation of [18F]HX4, a promising hypoxia marker for PET imaging. Proc Natl Acad Sci U S A. 2011;108:14620-5.
24. Doss M, Zhang JJ, Belanger MJ, Stubbs JB, Hostetler ED, Alpaugh K, et al. Biodistribution and radiation dosimetry of the hypoxia marker 18F-HX4 in monkeys and humans determined by using whole-body PET/CT. Nucl Med Commun. 2010;31:1016-24.
25. van Loon J, Janssen MH, Ollers M, Aerts HJ, Dubois L, Hochstenbag M, et al. PET imaging of hypoxia using [18F]HX4: a phase I trial. Eur J Nucl Med Mol Imaging. 2010;37:1663-8.
26. Rasey JS, Koh WJ, Evans ML, Peterson LM, Lewellen TK, Graham MM, et al. Quantifying regional hypoxia in human tumors with positron emission tomography of [18F]fluoromisonidazole: a pretherapy study of 37 patients. Int J Radiat Oncol Biol Phys. 1996;36:417-28.
27. Bollineni VR, Wiegman EM, Pruim J, Groen HJ, Langendijk JA. Hypoxia imaging using Positron Emission Tomography in non-small cell lung cancer: implications for radiotherapy. Cancer Treat Rev. 2012;38:1027-32.
28. Mortensen LS, Johansen J, Kallehauge J, Primdahl H, Busk M, Lassen P, et al. FAZA PET/CT hypoxia imaging in patients with squamous cell carcinoma of the head and neck treated with radiotherapy: results from the DAHANCA 24 trial. Radiother Oncol. 2012;105:14-20.
29. Grootjans W, de Geus-Oei LF, Troost EG, Visser EP, Oyen WJ, Bussink J. PET in the management of locally advanced and metastatic NSCLC. Nat Rev Clin Oncol. 2015.
30. Overgaard J, Horsman MR. Modification of Hypoxia-Induced Radioresistance in Tumors by the Use of Oxygen and Sensitizers. Semin Radiat Oncol. 1996;6:10-21.

Introduction and outline of the thesis 19
31. Overgaard J. Hypoxic modification of radiotherapy in squamous cell carcinoma of the head and neck--a systematic review and meta-analysis. Radiother Oncol. 2011;100:22-32.
32. van Baardwijk A, Reymen B, Wanders S, Borger J, Ollers M, Dingemans AM, et al. Mature results of a phase II trial on individualised accelerated radiotherapy based on normal tissue constraints in concurrent chemo-radiation for stage III non-small cell lung cancer. Eur J Cancer. 2012;48:2339-46.

CHAPTER
Current preclinical and clinical applications of hypoxia PET imaging using 2-nitroimidazoles
Sarah G.J.A. Peeters*, Catharina M.L. Zegers*, Ala Yaromina, Wouter van Elmpt, Ludwig Dubois and Philippe Lambin *contributed equally Published in: Q J NUcl Med Mol Imaging. 2015; 59(1):39-57
Chapter 2 22
ABSTRACT
Hypoxia is a common characteristic of solid tumors and is associated with poor prognosis. Positron emission tomography (PET) can visualize tumor hypoxia in a non-invasive, 3-dimensional manner and can be used to acquire information longitudinally. Multiple 2-nitroimidazole based PET tracers are developed, validated and quantified in the search for the ideal hypoxia tracer and several tracers have shown to reliably represent tumor hypoxia. Furthermore, multiple studies describe the prognostic value of hypoxia PET imaging and the ability to monitor hypoxia during treatment. These applications can be of great potential and their role in treatment planning and modification needs to be further assessed with respect to personalized chemoradiation therapy. In this review we focus on the tracers that were positively validated in preclinical and clinical studies and report accurate quantification and visualization of hypoxia. The characteristics of these tracers are summarized for both preclinical and clinical studies. Furthermore, the clinical applica-tions of hypoxia PET imaging are addressed with a focus on the ability to reliably monitor tumor hypoxia during treatment and the prognostic potential. Also the feasibility studies for hypoxia guided intensity modulated radiation therapy and the patient stratification for hypoxia targeted drugs are assessed.
Current applications of hypoxia PET imaging 23
INTRODUCTION
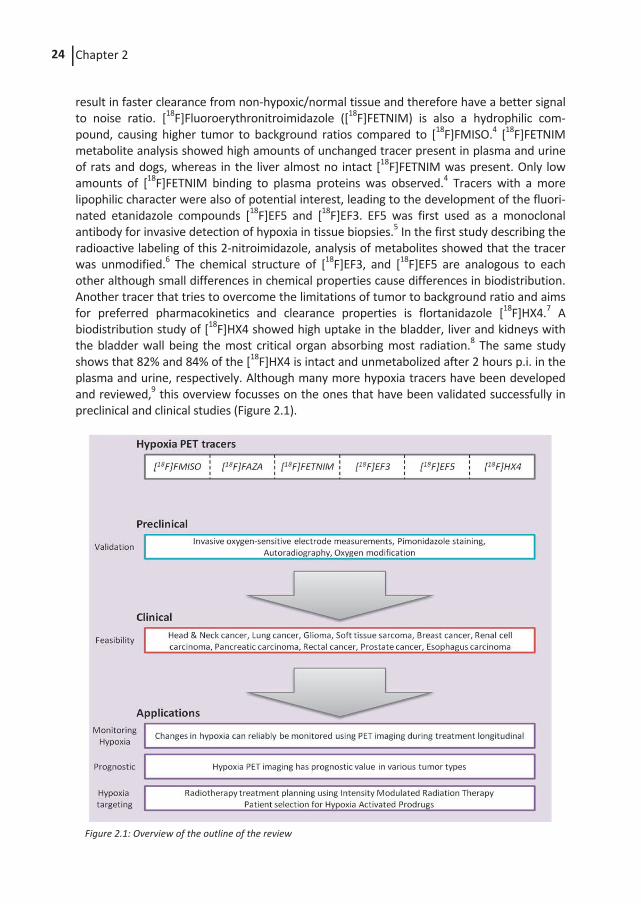
Hypoxia in solid tumors is a negative prognostic factor for treatment outcome.1 Due to impaired and chaotic blood vessel development, cells outgrow the blood supply or vessels collapse leading to regions of chronic and acute hypoxia. Gold standard techniques for the detection of hypoxic regions consist of measuring oxygen concentrations directly with the Eppendorf oxygen sensitive electrode or immunohistochemistry of tumor biopsies. How-ever both techniques are invasive and do not represent the tumor in three dimensions. In contrast, hypoxia position emission tomography (PET) imaging gives the opportunity to visualize the extent of hypoxia in a non-invasive manner, in three dimensions and addi-tionally is able to provide information longitudinally, i.e. hypoxia status can be monitored over the course of treatment. For these reasons, hypoxia PET imaging has been widely studied over the last decade and is developing from a diagnostic technique that can detect hypoxia, into a tool that can be integrated versatile, i.e. in the treatment monitoring, out-come prediction and treatment targeting. Multiple tracers have been developed, validated and shown to exhibit different characteristics. In this review we focus on nitroimidazole-based tracers that were validated in preclinical and clinical studies and report accurate and reproducible quantification of hypoxia for multiple cancer sites. We discuss the ability of these hypoxia PET tracers to monitor treatment response and address their prognostic and predictive value for treatment outcome. Furthermore we assess current and future oppor-tunities of hypoxia PET imaging as a tool to support treatment decisions (Figure 2.1).
HYPOXIA PET TRACERS
Most PET tracers suitable for the detection of hypoxia are based on the principle of 2-nitroimidazoles. After injection this molecule can diffuse freely from the vascular compart-ment to surrounding tissues where an electron reduction occurs which is reversed again under normal oxygen conditions. However, upon low oxygen conditions or in the presence of certain nitroreductase enzymes the molecule undergoes a second electron reduction and binds covalently to cellular components, causing the tracer to get trapped. Because of this specific accumulation in hypoxic tumor regions, and washout of the tracer in normal oxy-genated tissues, these tumor areas can be clearly visualized by detection of the radioactive label connected to the tracer. The perfect hypoxia tracer should fulfill certain criteria, i.e. a large difference in washout rate between background and oxygen deprived tissues for high signal to noise ratios and specific and irreversible binding to hypoxic regions. Furthermore, the hydrophilicity of a tracer is of importance for the amount of clearance in well oxygenat-ed tissues while more lipophilic tracers accumulate more easily in hypoxic tissues. The first developed hypoxia PET tracer based on the 2-nitroimidazole principle is [18F] labeled fluo-romisonidazole ([18F]FMISO). However, some concerns were raised about the stability of [18F]FMISO, the metabolite formation2 and the slow clearance from background tissues, causing modest signal to noise ratios.3 Therefore, second generation hypoxia PET tracers have been developed to overcome these concerns. [18F]Fluoroazomycin arabinoside ([18F]FAZA) is a nitroimidazole coupled to an arabinose sugar making the tracer more hydro-philic compared to [18F]FMISO. Due to this property the visualization of the tracer should
Chapter 2 24
result in faster clearance from non-hypoxic/normal tissue and therefore have a better signal to noise ratio. [18F]Fluoroerythronitroimidazole ([18F]FETNIM) is also a hydrophilic com-pound, causing higher tumor to background ratios compared to [18F]FMISO.4 [18F]FETNIM metabolite analysis showed high amounts of unchanged tracer present in plasma and urine of rats and dogs, whereas in the liver almost no intact [18F]FETNIM was present. Only low amounts of [18F]FETNIM binding to plasma proteins was observed.4 Tracers with a more lipophilic character were also of potential interest, leading to the development of the fluori-nated etanidazole compounds [18F]EF5 and [18F]EF3. EF5 was first used as a monoclonal antibody for invasive detection of hypoxia in tissue biopsies.5 In the first study describing the radioactive labeling of this 2-nitroimidazole, analysis of metabolites showed that the tracer was unmodified.6 The chemical structure of [18F]EF3, and [18F]EF5 are analogous to each other although small differences in chemical properties cause differences in biodistribution. Another tracer that tries to overcome the limitations of tumor to background ratio and aims for preferred pharmacokinetics and clearance properties is flortanidazole [18F]HX4.7 A biodistribution study of [18F]HX4 showed high uptake in the bladder, liver and kidneys with the bladder wall being the most critical organ absorbing most radiation.8 The same study shows that 82% and 84% of the [18F]HX4 is intact and unmetabolized after 2 hours p.i. in the plasma and urine, respectively. Although many more hypoxia tracers have been developed and reviewed,9 this overview focusses on the ones that have been validated successfully in preclinical and clinical studies (Figure 2.1).
Figure 2.1: Overview of the outline of the review
Current applications of hypoxia PET imaging 25
VALIDATION
An important step in the assessment of a successful hypoxia PET tracer is the validation of these agents, to ensure that the observed PET uptake in the tumor represents actual tumor hypoxia. First of all this can be done in a direct comparison between the hypoxia PET characteristics, like standardized uptake value or tumor to background ratio, and the gold standard which assesses the partial oxygen pressure in the tumor, i.e. Eppendorf pO2 measurements. In addition, hypoxia PET imaging can be correlated to immunohistochemi-cal markers which directly or indirectly represent tumor hypoxia. Another validation method to detect hypoxia specific tracer accumulation is by exposing subjects to modified oxygen concentration breathing just before and after the tracer injection. Preclinical studies form the ideal platform for the first feasibility and validation studies. However, since pharmacokinetics differ between humans and rodents, further validation in clinical trials is necessary.
[18F]FMISO
The validation of [18F]FMISO has been performed in multiple studies which assessed the uptake and distribution of [18F]FMISO in different tumor models using a range of valida-tion techniques. A selection of these studies is reported here. The first assessment of oxygen dependency of [18F]FMISO was demonstrated in porcine livers.10 Feasibility of hypoxia imaging using [18F]FMISO was shown in tumor-bearing mice although no correlation was found with oxygen partial pressure as detected by polaro-graphic oxygen-sensitive electrodes. However, autoradiography showed more [18F]FMISO uptake in the tumor of ambient air breathing animals compared to better oxygenated tumors in animals exposed to carbogen (95% O2, 5% CO2) breathing.11 In a rat rhabdomyo-sarcoma tumor model a heterogeneous pattern was observed on autoradiography for both [18F]FMISO uptake and pimonidazole staining.12 Furthermore a significant correlation was observed between hypoxic volumes assessed by [18F]FMISO PET and pimonidazole immunostaining in tumor sections. A weak but significant correlation was found for 10 different human primary head and neck xenograft tumor models comparing [18F]FMISO uptake with pimonidazole staining, however, the correlation was stronger when the pattern of hypoxia was ribbon-like and had a micro-regional distribution instead of a homogeneous distribution.13 In addition a relationship between [18F]FMISO and pimonida-zole was observed in Dunning R3327-AT bearing rats, although some mismatch was found possibly due to incomplete washout of [18F]FMISO from the well-perfused areas.14 Moreo-ver, [18F]FMISO PET imaging was able to detect hypoxic micro-metastases as confirmed by autoradiography and pimonidazole staining.15 Responsiveness of [18F]FMISO to different oxygen concentrations (10% O2, normal air or carbogen) was shown in a SCCVII tumor model and corresponded with pimonidazole uptake.16
Dogs bearing spontaneous sarcomas were imaged using [18F]FMISO and these data con-firmed the Eppendorf pO2 measurements.17 Similar findings were observed in R3327-AT bearing rats where oxygen probe measurements broadly corresponded with [18F]FMISO
Chapter 2 26
uptake.18 However, Chang et al reported that although the overall data were positive, large variation was observed between individual data pairs indicating that [18F]FMISO PET imaging might be problematic.19 Using the combined diffusion-retention dynamic infor-mation of two [18F]FMISO scans performed at 0-15 min p.i. and 4h p.i., reported to give an accurate measure of the median oxygen concentration comparable to average oxygen probe measurements.20
In clinical setting, most validation studies using the Eppendorf pO2 measurements are performed in the head and neck cancer patient population, because of the relative easy accessible tumor location. Several publications correlate the [18F]FMISO PET uptake with pO2 measurements, however with contradictory results. Mortensen et al.21 observed no correlation, while Gagel et al.22 and Zimny et al.23 reported respectively a moderate and strong correlation. The validation of hypoxia PET imaging in 13 patients with accessible soft tissue sarcomas was performed by Bentzen et al. in combination with Eppendorf pO2 measurements.24 A lack of concordance between the PET results and the oxygen meas-urements was observed, suggesting that [18F]FMISO PET imaging was not able to detect tumor hypoxia or its extend as defined by pO2 measurements. The clinical [18F]FMISO characteristics were also compared to the immunohistochemical staining of endogenous hypoxia markers. A weak but significant correlation between the [18F]FMISO hypoxic volume and HIF1α expression was found in head and neck cancer patients.25, 26 In patients with non-small-cell-lung cancer (NSCLC) no correlation was observed between the [18F]FMISO uptake and the immunohistochemical tumor markers microvessel density, HIF1α, VEGF and GLUT1.27 In contrast, in patients with glioma brain tumors a significant correlation between [18F]FMISO PET imaging and the vascular endo-thelial growth factor receptor (VEGF) and the cell proliferation associated antigen (Ki67) expression was observed. The relationship between tumor hypoxia and Ki67 expression could be explained by the fact that both tumor parameters were related to the tumor grade.28 In addition HIF1α expression showed a (non-significant) trend towards increased uptake. In breast cancer patients there was no correlation between hypoxia PET imaging using [18F]FMISO and HIF1-α expression, however, a significant correlation was observed with the proliferation marker Ki67.29 In renal cell carcinoma an increased microvessel density was present in comparison to the normal kidney parenchyma, however, this was not correlated to [18F]FMISO PET imaging.30
[18F]FAZA
Feasibility of [18F]FAZA visualization was assessed in a squamous cell carcinoma of the head and neck (FaDu), a cervix (SiHa) tumor model and two murine tumor models. [18F]FAZA uptake based on microPET imaging was compared to Eppendorf pO2 measure-ments, autoradiography and pimonidazole immunohistochemistry staining. Based on the invasive Eppendorf electrode measurements all tumors were assigned as being very hypoxic which was confirmed by pimonidazole staining and [18F]FAZA PET images. Fur-thermore significant correlations were observed between the autoradiography images and pimonidazole uptake, while overall an inverse relationship was found with the perfu-sion marker Hoechst 33342.31, 32 These data were confirmed in the same murine tumor
Current applications of hypoxia PET imaging 27
model on multiple time points post tracer injection and supplemented with biodistribution data confirming the previous findings.33 In addition [18F]FAZA uptake was shown to corre-late with the mRNA expression of CA9 and GLUT-1 after fragmenting the tumor in milli-gram-sized portions, which, according to the authors, allows multiple pairwise measure-ments at the smallest volumetric scale possible.34 Autoradiography of [18F]FAZA distribu-tion in a SQ20b xenograft model also showed a clear positive relationship with pimonida-zole and CAIX staining.35 Another validation study for [18F]FAZA uptake was performed by exposing rhabdomyosarcoma bearing rats to carbogen breathing which resulted in a decreased uptake of the hypoxia tracer.36 Moreover, [18F]FAZA PET correlated with the hypoxic fraction as measured by oxyLite pO2, Electron Paramagnetic Resonance (EPR) and 19F-MRI suggesting that [18F]FAZA PET is a promising imaging technique for hypoxia evalu-ation36 In an orthotropic brain tumor model the detection of hypoxia using [18F]FAZA PET imaging revealed low tumor to background ratios at 18-20 days post tumor implantation while high ratios were observed after 28-30 days.37 Bioluminescence imaging of the luciferase activity induced under the control of ‘hypoxia responsive elements’ confirmed that hypoxia development started around day 18 and increased from this day onward.
[18F]FETNIM
In preclinical setting, the paper describing the synthesis and first validation of [18F]FETNIM reports high tumor to blood (TBR) and tumor to muscle (TMR) at 4h p.i. as detected by biodistribution. In addition on autoradiography hypoxic regions could be differentiated from necrotic regions.38 In NSCLC patients, Hu et al. observed a significant correlation between [18F]FETNIM hypoxia PET imaging and the immunohistochemical markers HIF1α, GLUT-1 and VEGF. Since all these immunohistochemical markers are up-regulated in the absence of oxygen, this result provides the indirect evidence that [18F]FETNIM uptake gives an accurate indication of tumor hypoxia.39
[18F]EF5 & [18F]EF3
Studies comparing [18F]EF5 with pO2 or pimonidazole assessed hypoxic fractions are not available. However, validation of [18F]EF5 in a HCT116 model reported feasibility of PET acquisition based on ex vivo gamma counting.40 Feasibility of [18F]EF5 imaging was also shown in a rat model where tumors with high hypoxic values demonstrated a TMR be-tween 1.2-1.7 while for low hypoxic tumors a TMR below unity was observed.41 In the tumor models H460, HCT116 and PC3, PET imaging of [18F]EF5 was performed followed by autoradiography and staining for immunofluorescence hypoxia marker EF5. The spatial relationship was found to be dependent on the tumor model being the highest in the PC3 model followed by the HCT116 and the H460 model. Notably the uptake of [18F]EF5 was influenced by the simultaneous injection of nonradioactive EF5 which might have im-portant clinical implication when hypoxia tracer is combined with hypoxia targeting drugs with similar properties.42 Furthermore, Silén et al. reported in preclinical head and neck xenograft models that high [18F]EF5 PET uptake was observed in tumor models having high CAIX, GLUT1 and HIF1α expression, while low values of these endogenous markers were detected in models with low [18F]EF5 uptake.43
Chapter 2 28
A first validation study for [18F]EF3 revealed a biodistribution based TBR ranging from 1.2 to 2.9 and ranking of the different tumor models based on [18F]EF3 uptake was compara-ble with ranking based on the amount of hypoxia as detected by EF5 immuno-fluorescence.44 Furthermore a significant correlation was observed between [18F]EF3 and EF5 immunofluorescence after exposing the tumor bearing animals to either carbogen or 10% oxygen breathing45 while pharmacological intervention could not improve TMR.46
[18F]HX4
The first validation of [18F]HX4 was performed in a rat rhabdomyosarcoma model and demonstrated a significant spatial relationship at tumor-regional level between [18F]HX4 distribution and pimonidazole staining indicating that [18F]HX4 does accumulate specifical-ly in hypoxic regions.47 Furthermore [18F]HX4 uptake was causally related to the tumor oxygenation, since exposing animals to altered oxygen concentrations resulted in a de-pendent [18F]HX4 accumulation in the tumor. Carlin et al. reported that the tracer distribu-tion on autoradiography showed a clear positive relationship with pimonidazole and CAIX staining, indicating that HX4 accumulates in the hypoxic regions.35
All PET tracers discussed here show feasibility of detecting hypoxic tumor regions although each tracer has its own characteristics. Since studies are performed in different animal tumor models, using various conditions and validation methods, comparisons between different tracers is difficult. For some tracers this is assessed in separate quantification studies (vide infra). Overall, from the clinical validation studies we can conclude that there is limited evidence linking hypoxia PET imaging with actual oxygen pressure measurements. This might be due to the limitation of oxygen electrode measurements or biopsies to quantify the heterogeneous presence of hypoxia in 3D, which is assessed with hypoxia PET, or hand the limitation of hypoxia PET to visualize the presence of tumor hypoxia on a micrometer scale given the spatial resolution of current PET CT imaging. Although the uptake of several hypoxia PET tracers correlated with pimonidazole staining in preclinical studies, the use of exogenous pimonidazole hypoxia marker is not very common in clinical studies. Therefore endogenous markers are used which report diverse and inconsistent correlations within or between different tumor types. This diversity might at least partially be explained by possible oxygen-independent regulation of these proteins. Although the often used endogenous hypoxia markers HIF1α, CAIX and GLUT1 are regulated in response to low oxygen concentrations, their expression does not always correlate with the hypoxic regions.48 Therefore, the results of comparisons between hypoxia tracers and endogenous markers should be interpreted with caution.
QUANTIFICATION
Quantification of the tracers’ uptake is most often determined on the combined PET/CT images, providing both functional (hypoxia) and anatomical information. The amount of
Current applications of hypoxia PET imaging 29
tracer present in the tumor can be quantified as the “standardized uptake value” (SUV) or tumor-to-background ratio. Based on predefined thresholds, the hypoxic volume or hypoxic fraction can be calculated. Reproducibility is another important measure in hypoxia PET imaging. Quantification of the hypoxic fraction has no use if data are not reproducible over a short or even longer period. Therefore both quantification and repro-ducibility are evaluated. Comparative studies in preclinical tumor models can easily quantify the uptake of multiple tracers within one tumor model hereby providing important information on the perfor-mance of the tracers with regard to each other (Figure 2.2). Furthermore the implementa-tion of experimental procedures to increase or decrease the hypoxic fraction can easily be applied to investigate the tracer’s behavior to these altered conditions. A first comparison study investigating both [18F]FMISO with [18F]FAZA PET uptake in the Walker 256 rat carcinosarcoma model showed an increase in SUV and TBR values from 1 to 3 hours p.i. The [18F]FMISO uptake values were higher than those for [18F]FAZA.49 Contradicting results were obtained in EMT6, AR42J and A431 tumor models where biodistribution based TMR was significantly higher for [18F]FAZA as compared with [18F]FMISO.50 The presence of hypoxia was confirmed using invasive electrode pO2 meas-urements. Furthermore, exposing animals to 100% O2 breathing conditions revealed reduced [18F]FAZA PET uptake compared to ambient air breathing conditions, which was confirmed by autoradiography. These results were confirmed in another study on A431 tumor bearing mice.51 Although the specific uptake in the tumor was higher for [18F]FMISO, the TBR and TMR were significantly higher for [18F]FAZA on both PET imaging and biodistribution. Sensitivity to increased oxygen concentrations was reported for [18F]FAZA uptake detected by PET and biodistribution. Accumulation of [18F]FAZA was indicated to be crucial in the first hour post injection.52 Exposing tumor bearing animals to enhanced oxygen concentrations either from 1 hour pre injection till 3 hours post injection or only from 2 minutes pre injection till 1 hour post injection gave similar modified results compared to ambient air breathing. A preclinical comparative study on [18F]FETNIM and [18F]FMISO in C3H mammary carcino-ma bearing mice used biodistribution to investigate TBR and TMR under ambient air and carbogen breathing. For both tracers, TBR was decreased under carbogen breathing with higher ratios for [18F]FETNIM (5.8±2.5 for air and 2.8±1.3 for carbogen) than for [18F]FMISO (4.3±2.0 for air and 2.3±0.5 for carbogen) whereas TMR was comparable between the two tracers ([18F]FETNIM 6.2±2.1 and [18F]FMISO 6.4±3.3 both in normal air).53
A comparative study investigated the TBR of [18F]EF3 and [18F]FMISO in the same rat rhabdomyosarcoma model. At 2h p.i. TBR of [18F]FMISO was significantly higher than [18F]EF3, but [18F]EF3 values at 4h p.i were comparable to those of [18F]FMISO. This demonstrates that with respect to TBR values [18F]EF3 is not superior to [18F]FMISO.54 This was partially confirmed in a FSA II tumor model where [18F]FMISO TMR was significantly higher only at 55 and 330 minutes compared to [18F]EF3 and not at other time points. Furthermore, [18F]EF3 TMR remained low under carbogen breathing, while [18F]FMISO values kept increasing, suggesting that [18F]EF3 is more sensitive to reduced hypoxia by
Chapter 2 30
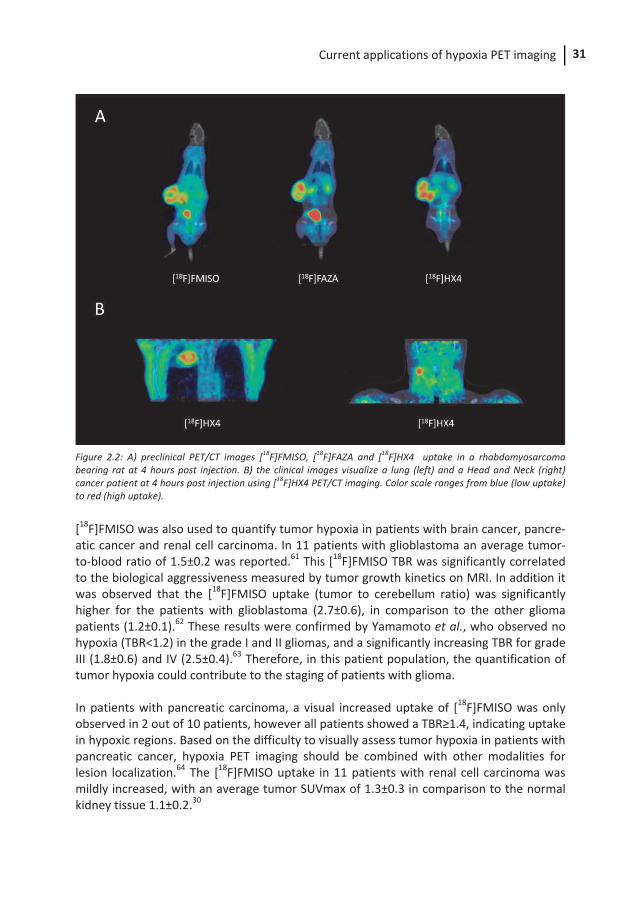
carbogen breathing.55 Overall, [18F]EF3 seems to be a good hypoxia tracer although it might not be superior to [18F]FMISO. A comparative study performed in our laboratory characterized [18F]FMISO, [18F]FAZA and [18F]HX4 within one rhabdomyosarcoma tumor model on TBR, reproducibility and reversi-bility.56 Within this tumor model [18F]HX4 reached the highest TBR at 3h p.i. while [18F]FAZA reached a stable TBR at 2h p.i. and [18F]FMISO did not reach a plateau. Two PET acquisitions over a 48 hour time period revealed high reproducibility and good overlap in hypoxic regions for both [18F]FMISO and [18F]HX4, while [18F]FAZA did perform worse on this characteristic. Furthermore, [18F]FMISO showed to be sensitive to decreasing hypoxic fractions while [18F]FAZA and [18F]HX4 were responsive to increasing hypoxia. These alterations of oxygen concentrations were introduced by exposing animals to either high or low oxygen concentrations 2.5 hours after tracer injection while PET acquisition was performed just before and immediately after this modification.56 In a SQ20b head and neck xenograft model microPET imaging was performed at only one time point, 80-90 minutes p.i., and demonstrated a tumor to muscle ratio of 1.6±0.4 for [18F]FMISO, 1.4±0.1 for [18F]HX4 and 1.3±0.3 for [18F]FAZA.35 The previously described tracers [18F]FMISO, [18F]FAZA, [18F]HX4, [18F]EF5, and [18F]FETNIM were used for hypoxia PET imaging in patients with head and neck cancer (Figure 2.2; [18F]HX4 image of head and neck cancer patient). A huge variation of data is reported with no standardized imaging acquisition protocol or image analysis. The PET imaging time point p.i. ranges from 1.5h to 4h p.i. In addition, the selected background tissue (“normal” tissue, muscle, blood, cerebellum) and the thresholds to define tumor hypoxia are diverse; for example, selecting the voxels with a tumor-to-background ≥1.2, ≥1.25, ≥1.3, ≥1.4, ≥1.5, or selecting voxels above the background uptake +3 standard deviations. This makes it very difficult or even impossible to compare the different tracers based on the currently available clinical literature. Only one study compared two tracers in the same patient popu-lation; however the authors used different acquisition protocols.57 [18F]FMISO imaging was performed at 2h p.i., while [18F]HX4 imaging was performed at 1.5h p.i. The study showed similar hot spots for both tracers and comparable TBR ratios for the time points used. In patients with NSCLC the tracers [18F]FMISO, [18F]FAZA and [18F]HX4 were used to visual-ize tumor hypoxia (Figure 2.2; [18F]HX4 image of lung cancer patient). Rasey et al. already quantified tumor hypoxia, using [18F]FMISO, in 1996. They observed tumor hypoxia in all NSCLC lesions, however a broad range of the extent of hypoxia was shown with a fraction-al hypoxic volume ranging from 1.3-94.7%.2 [18F]FAZA PET/CT imaging in patients with NSCLC was performed by Postema et al.58 and Trinkaus et al.59 who observed tumor hypoxia in respectively 54% and 65% of the patients. These results were confirmed with [18F]HX4, reporting an increased uptake in 72% of all NSCLC lesions.60 All these results show that the majority of NSCLC lesions are hypoxic and therefore lung cancer patients could be good candidates for hypoxia targeted therapies.
Current applications of hypoxia PET imaging 31
Figure 2.2: A) preclinical PET/CT images [18F]FMISO, [18F]FAZA and [18F]HX4 uptake in a rhabdomyosarcoma bearing rat at 4 hours post injection. B) the clinical images visualize a lung (left) and a Head and Neck (right) cancer patient at 4 hours post injection using [18F]HX4 PET/CT imaging. Color scale ranges from blue (low uptake) to red (high uptake).
[18F]FMISO was also used to quantify tumor hypoxia in patients with brain cancer, pancre-atic cancer and renal cell carcinoma. In 11 patients with glioblastoma an average tumor-to-blood ratio of 1.5±0.2 was reported.61 This [18F]FMISO TBR was significantly correlated to the biological aggressiveness measured by tumor growth kinetics on MRI. In addition it was observed that the [18F]FMISO uptake (tumor to cerebellum ratio) was significantly higher for the patients with glioblastoma (2.7±0.6), in comparison to the other glioma patients (1.2±0.1).62 These results were confirmed by Yamamoto et al., who observed no hypoxia (TBR<1.2) in the grade I and II gliomas, and a significantly increasing TBR for grade III (1.8±0.6) and IV (2.5±0.4).63 Therefore, in this patient population, the quantification of tumor hypoxia could contribute to the staging of patients with glioma. In patients with pancreatic carcinoma, a visual increased uptake of [18F]FMISO was only observed in 2 out of 10 patients, however all patients showed a TBR≥1.4, indicating uptake in hypoxic regions. Based on the difficulty to visually assess tumor hypoxia in patients with pancreatic cancer, hypoxia PET imaging should be combined with other modalities for lesion localization.64 The [18F]FMISO uptake in 11 patients with renal cell carcinoma was mildly increased, with an average tumor SUVmax of 1.3±0.3 in comparison to the normal kidney tissue 1.1±0.2.30
Chapter 2 32
In patients with rectal cancer both [18F]FMISO and [18F]FAZA was used to assess tumor hypoxia. Loi et al performed [18F]FMISO PET imaging, as part of a phase 1 trial in 6 patients with rectal cancer. Tumor hypoxia was observed in 67% of the primary lesions and in 83% of the metastases at baseline.65 In addition it was reported that [18F]FAZA uptake in rectal tumors was significantly higher than the reference tissues, with an average tumor to muscle ratio of 2.0.66 An additional, important message in this manuscript is a practical issue regarding the influence of scattered activity from the bladder, which can influence the quantitative analysis of [18F]FAZA PET uptake in the rectum. [18F]FAZA was additionally used to investigate tumor hypoxia in patients with prostate carcinoma, with negative results. The attempt to visualize tumor hypoxia in 14 patients with histology proven prostate cancer failed to show any significant uptake in the tumor lesions.67 [18F]FETNIM hypoxia PET imaging was used to describe tumor hypoxia in 28 patients with esophageal carcinoma. Increased uptake of [18F]FETNIM inside the primary tumor was observed which was the first evidence for hypoxia PET quantification in esophageal cancer. From all these studies, it can be concluded that the imaging contrast of nitroimidazole based hypoxia tracers is limited, however sufficient to quantify tumor hypoxia and extract valuable information for most clinical tumor types.
PHARMACOKINETIC ANALYSIS
Besides static PET imaging, quantification of tumor hypoxia can be performed using dynamic PET acquisitions and image analysis. This pharmacokinetic analysis can be used to provide additional tumor specific values of tracer retention and tumor perfusion. In a preclinical investigation in Dunning R3327-AT prostate tumor bearing nude rats the rela-tionship between the [18F]FMISO pharmacokinetic rate constants was assessed, using an irreversible two-tissue compartment model, in relationship to pO2 measurements. They showed that the rate-constant k3, representing the trapping rate, was better than the standard tumor-to-plasma ratio, to identify tumor hypoxia.68 In addition Busk et al. per-formed pharmacokinetic modeling of [18F]FAZA in three murine squamous cell carcinomas using also an irreversible two-tissue compartment model. The time activity curves of the tumors varied between the different tumor types. Correlation of the rate-constants to static 3h p.i. [18F]FAZA PET imaging, showed a poor correlation for k3 for 2 out of 3 tumor types, however a good correlation was observed with Ki, the influx rate constant; (k1xk3)/(k2+k3).69 Clinically pharmacokinetic analysis of [18F]FMISO was only performed in patients with head and neck cancer. In agreement with pre-clinical data, an irreversible 2-tissue compartment model was used to describe the kinetics of [18F]FMISO.70, 71 A positive correlation was observed between the influx rate Ki and the standard tumor to blood ratio, measured on static [18F]FMISO images.70 Another study used pharmacokinetic modeling to differentiate between tumor perfusion and hypoxia, providing the opportuni-ty to stratify patients in three categories, 1) high perfusion, no hypoxia; 2) perfusion and hypoxia; and 3) severe hypoxia and reduced perfusion, which could be related to the radiotherapy outcome. For [18F]FAZA, kinetic analysis was clinically performed in patients with NSCLC. Three different compartment models were evaluated; the reversible single-
Current applications of hypoxia PET imaging 33
tissue, reversible two-tissue and irreversible two-tissue compartment model. In this patient population, the reversible two-tissue compartment model is found to best repre-sent [18F]FAZA kinetics.72 Using this model, the calculated volume of distribution (VT; k1/k2 (1+k3/k4)) showed a good correlation to the statically measured SUV values and TBR. From the clinical literature we observe a difference in model preference for [18F]FMISO, irreversible and [18F]FAZA, reversible, which could be explained by the different properties of the tracers. However, studies were performed in different patient populations (head and neck versus NSCLC). To make a useful comparison kinetic analysis of the different tracers within the same patient population is necessary. Note that for both [18F]FMISO and [18F]FAZA, the kinetic parameters Ki or VT were correlated to the static parameter TBR or SUV, which justifies a standard static analysis for these PET tracers.
APPLICATIONS
PET hypoxia imaging can be used for multiple applications. It has been shown to have a prognostic value and can be useful in the monitoring of tumor hypoxia during the course of treatment. Furthermore the assessment of tumor hypoxia can be used to select pa-tients that might benefit from a certain therapy.
Prognostic/ predictive value of hypoxia PET imaging
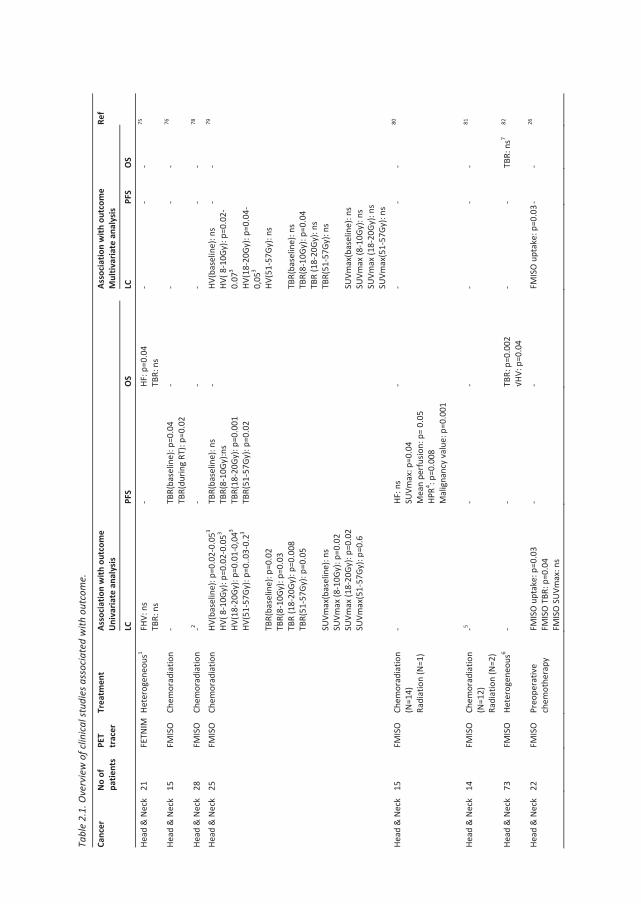
In a preclinical setting the prognostic value of [18F]FAZA was assessed by performing a hypoxia PET scan combined with the invasive oxygen sensitive electrode measurement, followed by a single dose of irradiation (55Gy). Most animals were exposed to ambient oxygen breathing while a fraction of the animals was exposed to carbogen breathing from 10 minutes prior to and during both hypoxia measurements and radiotherapy. Both methods could distinguish between the more and less hypoxic tumors resulting in signifi-cantly higher local tumor control.73 Another study reported that discrimination between normoxic and hypoxic tumors based on pretreatment [18F]FAZA PET imaging could predict the effectiveness of the combined treatment of radiotherapy with the hypoxia specific cytotoxin tirapazamine.74 In the clinic the relationship between hypoxia PET imaging and treatment outcome was investigated by several groups (Table 2.I). The use of [18F]FMISO, [18F]FETNIM and [18F]EF5 was correlated with the outcome of head and neck cancer patients. Lehtio et al. showed in 21 patients that the fractional hypoxic volume, measured before treatment on [18F]FETNIM PET imaging, was predictive for 3-years overall survival.75 In addition it was reported that there is a significant decrease in disease free survival for hypoxic versus non-hypoxic tumors.76, 77 On the other hand, no correlation was shown between outcome and pre- or mid-treatment [18F]FMISO imaging for patients treated with several cycles of platinum based chemotherapy and IMRT (Intensity Modulated Radiation Therapy). How-ever, this conclusion was based on a 3-year local and regional progression-free survival rate of 100% and 95%. Only one patient showed regional failure after treatment, but did not have a positive [18F]FMISO PET/CT scan during treatment.78 The association between
Chapter 2 34
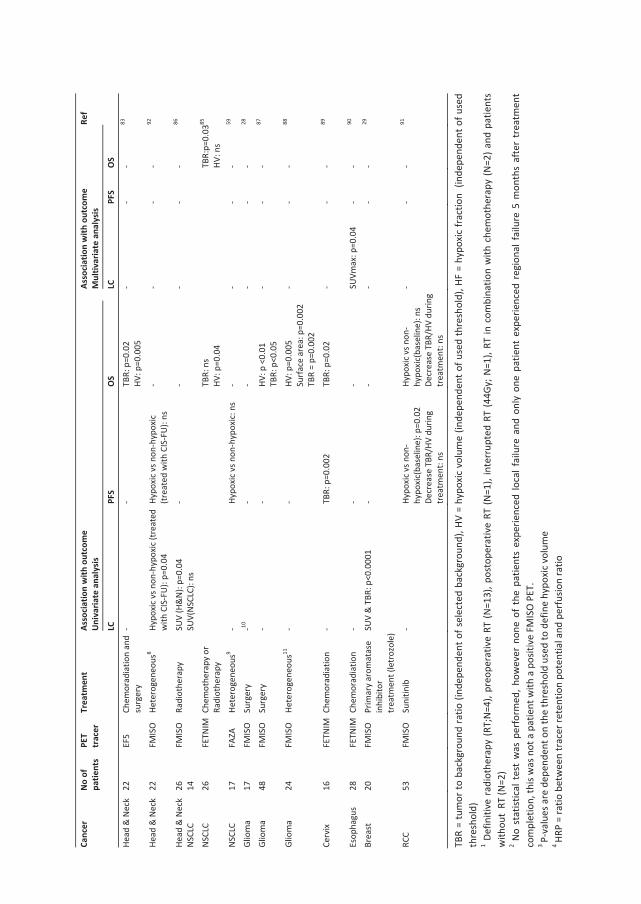
local progression-free survival and [18F]FMISO PET imaging before and during chemo-radiotherapy was investigated and showed that [18F]FMISO PET imaging during treatment had a higher prognostic power than baseline hypoxia imaging.79 In addition, parameters extracted from the kinetic analysis of [18F]FMISO PET imaging and its changes during treatment were highly correlated to radiotherapy outcome.80, 81 Rischin et al. for the first time demonstrated the predictive value of [18F]FMISO in patients with head and neck cancer randomized in a Phase II trial for chemoradiotherapy alone or in combination with hypoxic cell cytotoxin tirapazamine. Pretreatment [18F]FMISO tumor hypoxia was associated with a high risk of locoregional failure after chemoradiotherapy alone. A considerable improvement in locoregional control was found in patients with hypoxic tumors treated with tirapazamine, whereas tirapazamine could not improve the outcome of chemoradiotherapy in non-hypoxic tumors.82 Several studies investigated the prognostic value of hypoxia PET imaging for patients with head and neck cancer in comparison to standard metabolic PET imaging using [18F]FDG. In an univariate analysis it was shown that the nodal stage and [18F]FMISO PET parameters (TBR and hypoxic volume) were significantly correlated with survival, while the [18F]FDG SUVmax was not.83 These results were confirmed by another study which observed a signifi-cant correlation between FMISO PET uptake and chemotherapy response, while [18F]FDG uptake was not correlated.26 A relationship between overall survival, the hypoxic sub-volume, defined on [18F]EF5 PET imaging, and the metabolic active tumor volume, defined on the [18F]FDG-PET was observed.84 However, also in this study, the hypoxia PET uptake was stronger correlated with overall survival in comparison to [18F]FDG. All these studies show the prognostic potential of hypoxia PET imaging over metabolic [18F]FDG PET imag-ing. However, Thorwarth et al. showed in a small cohort of patients (N.=12) that a param-eter based on the voxel-wise comparison of both tracers quantifying discrepancies be-tween [18F]FMISO and [18F]FDG PET was the most significant variable,85 suggesting that a combination of two tracers on a voxel level may increase both their prognostic signifi-cance.
Tabl
e 2.
1. O
verv
iew
of c
linic
al st
udie
s ass
ocia
ted
with
out
com
e.
Canc
er
No
of
patie
nts
PET
trac
er
Trea
tmen
t As
soci
atio
n w
ith o
utco
me
Uni
varia
te a
naly
sis
Asso
ciat
ion
with
out
com
e M
ultiv
aria
te a
naly
sis
Ref
LC
PFS
OS
LC
PF
S O
S
Head
& N
eck
21
FETN
IM H
eter
ogen
eous
1 FH
V: n
s TB
R: n
s -
HF: p
=0.0
4 TB
R: n
s -
- -
75
Head
& N
eck
15
FMIS
O
Chem
orad
iatio
n -
TBR(
base
line)
: p=0
.04
TBR(
durin
g RT
): p=
0.02
-
- -
- 76
Head
& N
eck
28
FMIS
O
Chem
orad
iatio
n -2
- -
- -
- 78
Head
& N
eck
25
FMIS
O
Chem
orad
iatio
n HV
(bas
elin
e): p
=0.0
2-0.
053
HV( 8
-10G
y): p
=0.0
2-0.
053
HV(1
8-20
Gy):
p=0.
01-0
,043
HV(5
1-57
Gy):
p=0.
.03-
0.23
TBR(
base
line)
: p=0
.02
TBR(
8-10
Gy):
p=0.
03
TBR
(18-
20Gy
): p=
0.00
8 TB
R(51
-57G
y): p
=0.0
5 SU
Vmax
(bas
elin
e): n
s SU
Vmax
(8-1
0Gy)
: p=0
.02
SUVm
ax (1
8-20
Gy):
p=0.
02
SUVm
ax(5
1-57
Gy):
p=0.
6
TBR(
base
line)
: ns
TBR(
8-10
Gy):n
s TB
R(18
-20G
y): p
=0.0
01
TBR(
51-5
7Gy)
: p=0
.02
- HV
(bas
elin
e): n
s
HV( 8
-10G
y): p
=0.0
2-0.
073
HV(1
8-20
Gy):
p=0.
04-
0,05
3
HV(5
1-57
Gy):
ns
TBR(
base
line)
: ns
TBR(
8-10
Gy):
p=0.
04
TBR
(18-
20Gy
): ns
TB
R(51
-57G
y): n
s SU
Vmax
(bas
elin
e): n
s SU
Vmax
(8-1
0Gy)
: ns
SUVm
ax (1
8-20
Gy):
ns
SUVm
ax(5
1-57
Gy):
ns -
- 79
Head
& N
eck
15
FMIS
O
Chem
orad
iatio
n (N
=14)
Ra
diat
ion
(N=1
)
- HF
: ns
SUVm
ax: p
=0.0
4 M
ean
perf
usio
n: p
= 0.
05
HPR4 : p
=0.0
08
Mal
igna
ncy
valu
e: p
=0.0
01
- -
- -
80
Head
& N
eck
14
FMIS
O
Chem
orad
iatio
n (N
=12)
Ra
diat
ion
(N=2
)
-5 -
- -
- -
81
Head
& N
eck
73
FMIS
O
Hete
roge
neou
s6 -
- TB
R: p
=0.0
02
√HV:
p=0
.04
- -
TBR:
ns7
82
Head
& N
eck
22
FMIS
O
Preo
pera
tive
chem
othe
rapy
FM
ISO
upt
ake:
p=0
.03
FMIS
O T
BR: p
=0.0
4 FM
ISO
SU
Vmax
: ns
- -
FMIS
O u
ptak
e: p
=0.0
3 -
- 26
Canc
er
No
of
patie
nts
PET
trac
er
Trea
tmen
t As
soci
atio
n w
ith o
utco
me
Uni
varia
te a
naly
sis
Asso
ciat
ion
with
out
com
e M
ultiv
aria
te a
naly
sis
Ref
LC
PFS
OS
LC
PF
S O
S
Head
& N
eck
22
EF5
Chem
orad
iatio
n an
d su
rger
y -
- TB
R: p
=0.0
2 HV
: p=0
.005
-
- -
83
Head
& N
eck
22
FMIS
O
Hete
roge
neou
s8 Hy
poxi
c vs
non
-hyp
oxic
(tre
ated
w
ith C
IS-F
U):
p=0.
04
Hypo
xic
vs n
on-h
ypox
ic
(trea
ted
with
CIS
-FU
): ns
-
- -
- 92
Head
& N
eck
N
SCLC
26
14
FM
ISO
Ra
diot
hera
py
SUV
(H&
N):
p=0.
04
SUV(
NSC
LC):
ns
- -
- -
- 86
NSC
LC
26
FETN
IM C
hem
othe
rapy
or
Radi
othe
rapy
TB
R: n
s HV
: p=0
.04
TBR:
p=0.
03
HV: n
s
85
NSC
LC
17
FAZA
He
tero
gene
ous9
- Hy
poxi
c vs
non
-hyp
oxic
: ns
- -
- -
59
Glio
ma
17
FMIS
O
Surg
ery
-10
- -
- -
- 28
Glio
ma
48
FMIS
O
Surg
ery
- -
HV: p
<0.
01
TBR:
p<0
.05
- -
- 87
Glio
ma
24
FMIS
O
Hete
roge
neou
s11
- -
HV: p
=0.0
05
Surf
ace
area
: p=0
.002
TB
R =
p=0.
002
- -
- 88
Cerv
ix
16
FETN
IM C
hem
orad
iatio
n -
TBR:
p=0
.002
TBR:
p=0
.02
- -
- 89
Esop
hagu
s 28
FE
TNIM
Che
mor
adia
tion
- -
- SU
Vmax
: p=0
.04
- -
90
Brea
st
20
FMIS
O
Prim
ary
arom
atas
e in
hibi
tor
trea
tmen
t (le
troz
ole)
SUV
& T
BR: p
<0.0
001
- -
- -
- 29
RCC
53
FMIS
O
Suni
tinib
-
Hypo
xic
vs n
on-
hypo
xic(
base
line)
: p=0
.02
Decr
ease
TBR
/HV
durin
g tr
eatm
ent:
ns
Hypo
xic
vs n
on-
hypo
xic(
base
line)
: ns
Decr
ease
TBR
/HV
durin
g tr
eatm
ent:
ns
- -
- 91
TBR
= tu
mor
to b
ackg
roun
d ra
tio (i
ndep
ende
nt o
f sel
ecte
d ba
ckgr
ound
), HV
= h
ypox
ic v
olum
e (in
depe
nden
t of u
sed
thre
shol
d), H
F =
hypo
xic
frac
tion
(ind
epen
dent
of u
sed
thre
shol
d)
1 Def
initi
ve r
adio
ther
apy
(RT;
N=4
), pr
eope
rativ
e RT
(N=1
3), p
osto
pera
tive
RT (N
=1),
inte
rrup
ted
RT (4
4Gy;
N=1
), RT
in c
ombi
natio
n w
ith c
hem
othe
rapy
(N=2
) and
pat
ient
s w
ithou
t RT
(N=2
) 2
No
stat
istic
al t
est
was
per
form
ed, h
owev
er n
one
of t
he p
atie
nts
expe
rienc
ed lo
cal f
ailu
re a
nd o
nly
one
patie
nt e
xper
ienc
ed r
egio
nal f
ailu
re 5
mon
ths
afte
r tr
eatm
ent
com
plet
ion,
this
was
not
a p
atie
nt w
ith a
pos
itive
FM
ISO
PET
. 3
P-va
lues
are
dep
ende
nt o
n th
e th
resh
old
used
to d
efin
e hy
poxi
c vo
lum
e 4
HRP
= ra
tio b
etw
een
trac
er re
tent
ion
pote
ntia
l and
per
fusio
n ra
tio
5 N
o st
atist
ical
test
was
per
form
ed, h
owev
er re
port
ed w
as th
at c
hang
e of
cur
ve ty
pe w
as c
orre
late
d w
ith p
atie
nt o
utco
me
6 De
finiti
ve ra
diot
hera
py w
ith o
r with
out c
hem
othe
rapy
or d
efin
itive
rese
ctio
n w
ith o
r with
out a
djuv
ant r
adio
ther
apy
7 M
ultiv
aria
te a
naly
sis w
as p
erfo
rmed
on
50 p
atie
nts (
whi
ch h
ad b
oth
FDG
and
FMIS
O im
agin
g)
8 Ran
dom
ized
tria
l, tr
eatm
ent o
f pat
ient
s was
radi
othe
rapy
in c
ombi
natio
n w
ith e
ither
tira
paza
min
e an
d ci
spla
tine
(CIS
-TPZ
), or
cisp
latin
and
fluo
rour
acil
(CIS
-FU
). 9
Patie
nts w
ere
trea
ted
with
stan
dard
che
mor
adia
tion
or a
com
bina
tion
of c
arbo
plat
in, p
aclit
axel
, gef
itini
b an
d ra
diat
ion.
10
No
stat
istic
al a
naly
sis w
as p
erfo
rmed
, how
ever
of t
he p
atie
nts
who
die
d, 7
had
pos
itive
FM
ISO
upt
ake,
1 e
quiv
ocal
and
1 n
egat
ive,
whi
le o
f tho
se a
live,
5 h
ad n
egea
tive
upta
ke a
nd e
quiv
ocal
in 1
. 11
Imag
ing
was
per
form
ed b
efor
e op
erat
ion
or st
ereo
tact
ic b
iops
y (N
=11)
, aft
er re
sect
ion
and
befo
re ra
diat
ion
ther
apy
(N-7
) or a
fter
rese
ctio
n an
d ra
diot
hera
py (N
=11)
.
Chapter 2 38
Hypoxia PET imaging was also used to predict the outcome of patients with lung cancer. It was observed that the TBR and hypoxic volume defined on [18F]FETNIM PET were predic-tors of overall survival in a univariate analysis, while the [18F]FDG uptake was not signifi-cant.86 The [18F]FMISO PET time activity curve type (i.e. rapid washout, delayed washout or accumulation) and a tumor to muscle ratio of 2.0 were shown to be good parameters to predict tumor response.87 On the other hand no significant difference was observed in disease-free survival between NSCLC patients (N=17) having a hypoxic or a non-hypoxic lesions.59 For patients with glioma, [18F]FMISO PET imaging was observed to be prognostic for treatment outcome.28 The majority of patients who died of progressive disease had positive [18F]FMISO uptake, while for those that were still alive, [18F]FMISO was negative in most cases. In addition, an increased TBR or hypoxic volume defined on [18F]FMISO PET imaging was found to be significantly related to a decreased overall survival in patients with newly diagnosed glioma.88, 89 [18F]FETNIM uptake was significantly correlated with progression-free survival in patients with cervical carcinoma.90 In addition, the [18F]FETNIM SUVmax was the best predictor of treatment response in comparison to tumor length, diameter, and SUVmean in patients with esophageal carcinoma.91 Cheng et al. evaluated [18F]FMISO PET imaging in patients with breast cancer for the prediction of treatment resistance to hormonal therapy.29 They observed a significant correlation between baseline [18F]FMISO uptake and clinical out-come. Using a TBR threshold ≥1.2 to quantify tumor hypoxia allowed correct prediction for 88% of the patients with progressive disease. Comparison of [18F]FMISO PET imaging at baseline and follow-up showed that the patients with a partial response or stable disease showed a decreasing trend of the [18F]FMISO TBR, while patients with progressive disease did not. In patients with renal cell carcinoma, the presence of baseline tumor hypoxia was related to a shorter progression-free survival, however overall survival was not related to [18F]FMISO uptake. Also changes in tumor hypoxia during treatment were not prognostic for progression-free or overall survival.92 In the previous paragraph “validation” we have described that there is limiting evidence linking hypoxia PET imaging with actual oxygen pressure measurements in patients. However given the prognostic value of hypoxia PET imaging in various tumor types, the question is how we should approach validation of our current hypoxia PET imaging tech-niques in clinical practice. Given the highly prognostic value of hypoxia PET imaging, which is in general stronger than the other available (imaging) parameters, it shows that there is added prognostic and maybe predictive value in hypoxia imaging. Therefore, hypoxia PET imaging could be integrated in clinical trials which have the aim to improve loco-regional control or survival, especially for hypoxia modifying treatments.
Monitoring tumor hypoxia during treatment
Experimental and clinical data demonstrate that tumor hypoxia plays an important role in malignant progression and resistance to anticancer treatments. Hypoxia PET imaging can be used as a non-invasive tool to evaluate the effectiveness of therapy to eliminate hypox-ic tumor cells and adapt treatment accordingly. This was studied in some preclinical
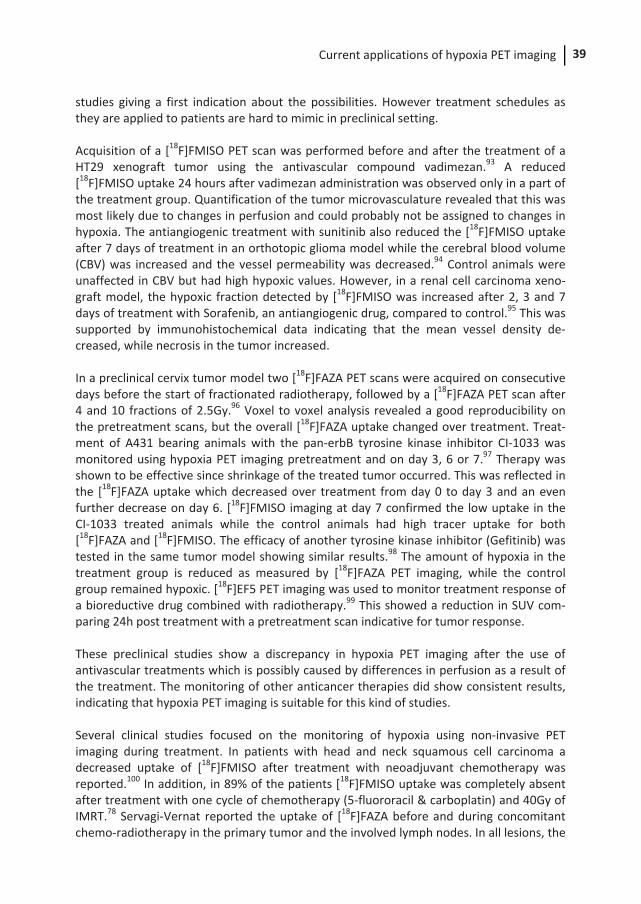
Current applications of hypoxia PET imaging 39
studies giving a first indication about the possibilities. However treatment schedules as they are applied to patients are hard to mimic in preclinical setting. Acquisition of a [18F]FMISO PET scan was performed before and after the treatment of a HT29 xenograft tumor using the antivascular compound vadimezan.93 A reduced [18F]FMISO uptake 24 hours after vadimezan administration was observed only in a part of the treatment group. Quantification of the tumor microvasculature revealed that this was most likely due to changes in perfusion and could probably not be assigned to changes in hypoxia. The antiangiogenic treatment with sunitinib also reduced the [18F]FMISO uptake after 7 days of treatment in an orthotopic glioma model while the cerebral blood volume (CBV) was increased and the vessel permeability was decreased.94 Control animals were unaffected in CBV but had high hypoxic values. However, in a renal cell carcinoma xeno-graft model, the hypoxic fraction detected by [18F]FMISO was increased after 2, 3 and 7 days of treatment with Sorafenib, an antiangiogenic drug, compared to control.95 This was supported by immunohistochemical data indicating that the mean vessel density de-creased, while necrosis in the tumor increased. In a preclinical cervix tumor model two [18F]FAZA PET scans were acquired on consecutive days before the start of fractionated radiotherapy, followed by a [18F]FAZA PET scan after 4 and 10 fractions of 2.5Gy.96 Voxel to voxel analysis revealed a good reproducibility on the pretreatment scans, but the overall [18F]FAZA uptake changed over treatment. Treat-ment of A431 bearing animals with the pan-erbB tyrosine kinase inhibitor CI-1033 was monitored using hypoxia PET imaging pretreatment and on day 3, 6 or 7.97 Therapy was shown to be effective since shrinkage of the treated tumor occurred. This was reflected in the [18F]FAZA uptake which decreased over treatment from day 0 to day 3 and an even further decrease on day 6. [18F]FMISO imaging at day 7 confirmed the low uptake in the CI-1033 treated animals while the control animals had high tracer uptake for both [18F]FAZA and [18F]FMISO. The efficacy of another tyrosine kinase inhibitor (Gefitinib) was tested in the same tumor model showing similar results.98 The amount of hypoxia in the treatment group is reduced as measured by [18F]FAZA PET imaging, while the control group remained hypoxic. [18F]EF5 PET imaging was used to monitor treatment response of a bioreductive drug combined with radiotherapy.99 This showed a reduction in SUV com-paring 24h post treatment with a pretreatment scan indicative for tumor response. These preclinical studies show a discrepancy in hypoxia PET imaging after the use of antivascular treatments which is possibly caused by differences in perfusion as a result of the treatment. The monitoring of other anticancer therapies did show consistent results, indicating that hypoxia PET imaging is suitable for this kind of studies. Several clinical studies focused on the monitoring of hypoxia using non-invasive PET imaging during treatment. In patients with head and neck squamous cell carcinoma a decreased uptake of [18F]FMISO after treatment with neoadjuvant chemotherapy was reported.100 In addition, in 89% of the patients [18F]FMISO uptake was completely absent after treatment with one cycle of chemotherapy (5-fluororacil & carboplatin) and 40Gy of IMRT.78 Servagi-Vernat reported the uptake of [18F]FAZA before and during concomitant chemo-radiotherapy in the primary tumor and the involved lymph nodes. In all lesions, the
Chapter 2 40
fractional hypoxic volume and SUVmax decreased after 17 fractions of radiotherapy.101 The changes in [18F]FMISO kinetics after treatment with (chemo-)radiotherapy were also studied. Three different curve types were defined, representing a severe, intermediate and low degree of hypoxia.80 Based on these curves, a decreased amount of hypoxia in the majority of patients was shown. From these studies we can conclude that in patients with head and neck cancer, hypoxia decreases during (chemo-) radiation treatment, indicating therapy induced reoxygenation. In patients with NSCLC, the evaluation of hypoxia changes during treatment was investi-gated using [18F]FMISO PET imaging. One study observed an average decrease in tumor hypoxia during radiotherapy, however the changes were unpredictable and only one patient had no detectable tumor hypoxia by the end of radiotherapy.102 Another study observed no significant changes in [18F]FMISO uptake before and during treatment with chemo-radiotherapy.103 On the other hand in a study using [18F]FAZA, tumor hypoxia was eliminated after treatment with chemo-radiotherapy in the majority of NSCLC patients.59 For cervical carcinoma [18F]FAZA PET imaging was performed before, during and after radiotherapy. Before the start of radiotherapy positive [18F]FAZA uptake was observed in 5 out of 15 patients. During treatment persistent hypoxia was observed in 4 patients, while after radiotherapy no remaining hypoxia was observed.104 As part of a multimodality imaging trial [18F]FMISO imaging was performed in sarcomas before, during and after chemotherapy.105 All soft tissue sarcomas presented a hypoxic volume before the start of treatment, which remained present during and after treatment. The changes of tumor hypoxia during treatment were diverse among the patient population. Rajendran et al. confirms these results, reporting tumor hypoxia in 14 out of 19 patients with soft tissue sarcoma, which decreased, increased or remained stable during treatment in 6, 2 and 2 patients respectively.106 Both studies reported that there was no association between the hypoxic volume in soft tissue sarcomas and the tumor grade. Comparing the results of the different tumor types, it is striking that in majority of head and neck studies a decrease of tumor hypoxia is observed during treatment, while these results are diverse in NSCLC, cervical cancer and sarcomas. This might suggest that tumor hypoxia is more persistent in these cancer types, or the given treatment is not effective in eradicating the hypoxic cells. This might also explain the results of Overgaard et al. show-ing that oxygen modification in addition to radiotherapy provides a significantly increased tumor control for head and neck cancer patients, however not for uterine cervix or NSCLC.107
Hypoxia targeting
Based on clinical studies showing an association between hypoxia and treatment out-come, hypoxia PET imaging might be a powerful tool for patient selection and treatment adaptation. The available literature mainly focuses on the adaptation of radiotherapy based on hypoxia PET imaging information and so far only feasibility studies have been reported. Furthermore the patients that are sensitive to hypoxia targeted treatments could be selected, moving in the direction of individualized medicine.
Current applications of hypoxia PET imaging 41
One possibility to target hypoxic tumor subvolumes is to escalate radiation dose. The feasibility of [18F]FMISO PET based IMRT to the hypoxic tumor volume was investigated for 8 patients with head and neck cancer.108 They were able to perform a dose-escalation (78Gy) to the hypoxic tumor volume in 6 out of 8 patients without increasing the normal tissue doses. Additionally, [18F]FMISO-based boost plans could provide an increased tumor control probability without increasing expected complications.109 A theoretical model also indicated the potential for dose sparing by focusing the dose to the radioresistant hypoxic tumor volumes.110 In addition, Chang et al. performed a biological modeling study in 8 HNSCC patients, using [18F]FMISO PET imaging for radiotherapy dose painting.111 They compared the standard radiotherapy plan with uniform dose escalation and hypoxia-based dose painting. Hypoxia-based dose painting demonstrated the advantage to in-crease the tumor control probability without increasing the normal tissue toxicity, there-fore increasing the chances for an uncomplicated tumor control probability. These results confirm that it is theoretically possible to perform hypoxia-based radiotherapy in patients with head and neck cancer. However, it is essential to know whether the defined hypoxic volume is accurate and extensive enough to target the radioresistant areas. For example, it was shown that all recurrences (N=9) after chemoradiotherapy were located within the [18F]FDG avid regions, however 3 of these recurrences were located outside the baseline hypoxic volume, defined on [18F]FMISO PET imaging.76 Therefore it is essential to assess the spatial relationship between hypoxic volumes and the recurrences before adapting radiation treatment plans. Since tumor hypoxia is a dynamic process involving acute and chronic hypoxia, it is of importance to investigate the effect of hypoxia changes during treatment and its effect on the hypoxia PET based radiation treatment plan. A relative stable spatial distribution of the [18F]FMISO PET uptake was observed during chemoradiotherapy in 16 patients with locally advanced head and neck cancer.112 While Lin et al. observed a change in the hypox-ic volume in 4 out of 7 patients, resulting in decreased radiation coverage based on the initial hypoxia PET based treatment plan.113 Nevertheless, hypoxia dose painting still increased the equivalent uniform dose to the hypoxic volume. This dose could however be further increased by incorporating serial hypoxia PET imaging in the radiotherapy plan. These results were confirmed by a study using [18F]FAZA PET imaging, before and during radiation therapy, here also fluctuations of hypoxia were observed during treatment and adaptive radiotherapy was recommended.101 Besides the use for radiotherapy, hypoxia PET imaging could provide useful information for the selection of patients for hypoxia-targeted drugs. The use of [18F]FMISO during hypoxia targeted therapy with tirapazamine in combination with chemoradiation was investigated in 16 patients with head and neck cancer.114 All tumor sites showed a reduced uptake after 4 weeks of treatment with chemoradiation and tirapazamine, which was consistent with an effect after hypoxia-targeted therapy. These results were confirmed by a later study which showed that [18F]FMISO PET imaging is associated with a higher risk of locoregional failure in patients treated with (standard) chemo-radiation. In patients with a hypoxic tumor the locoregional control could be improved by additional treatment with tirapazamine, while in patients without tumor hypoxia additional therapy with tirapa-
Chapter 2 42
zamine was not effective. This study demonstrates that [18F]FMISO may identify patients who may benefit from hypoxia targeting drugs.82 At the moment there is no literature available regarding the use of hypoxia PET imaging with nitroimidazoles for hypoxia targeting in patients with lung cancer. However there is an ongoing trial investigating the effect of nitroglycerin (a nitric oxide donor, known as a vasodilating agent) on [18F]HX4 hypoxia PET imaging (NCT01210378). This trial is an exam-ple of a new interesting approach of ‘window-of-opportunity’ clinical trials, to gain insights about the antitumor activity of nitroglycerin or for example other hypoxia modifiers in a disease state not disturbed by previous or simultaneous treatments. In addition a termi-nated trial is reported (NCT00862134), where patients were treated with the hypoxia activated drug PR104, in combination with [18F]FMISO PET imaging. For patients with renal cell carcinoma, [18F]FMISO PET imaging was used to assess the changes of tumor hypoxia after treatment with sunitinib. In this study patients with baseline tumor hypoxia showed a decreased [18F]FMISO uptake during treatment with sunitinib, while the [18F]FMISO uptake remained stable in the non-hypoxic lesions.92 To our knowledge no other hypoxia-targeted drugs were investigated in combination with hypoxia PET imaging. However, we believe that the addition of hypoxia PET imaging to the currently investigated antihypoxia treatments is essential. In this way patients and ac-quired results can be stratified based on the presence of tumor hypoxia, creating the evidence for future patient selection.
FUTURE PERSPECTIVES
Several nitroimidazole-based PET tracers have shown their ability not only to reliably measure tumor hypoxia but also demonstrated the prognostic significance for treatment outcome in several cancers. Preclinical and clinical studies confirm a value of PET in moni-toring important changes in tumor hypoxia during treatment and show the feasibility of integrating hypoxia PET imaging for patient’s stratification, therapy optimization before initiation of treatment and/or during therapy. Although the results of the clinical studies incorporating hypoxia PET imaging are promising, none of the hypoxia PET tracers have yet been adequately validated to justify its use in routine clinical practice. Prospective randomized clinical trials, integrating hypoxia PET imaging, testing relevant interventions and evaluating dose escalation strategies are therefore necessary.
ACKNOWLEDGEMENTS
Authors acknowledge financial support from the QuIC-ConCePT project, which is partly funded by EFPI A companies and the Innovative Medicine Initiative Joint Undertaking (IMI JU) under Grant Agreement No. 115151. Authors also acknowledge financial support from the National Institute of Health (NIH-USA U01 CA 143062-01, Radiomics of NSCLC), EU 6th
Current applications of hypoxia PET imaging 43
(Euroxy no: 502932) and 7th framework program (Metoxia no: 222741 and ARTFORCE no: 257144), euroCAT (IVA Interreg - www.eurocat.info), Kankeronderzoekfonds Limburg from the Health Foundation Limburg and the Dutch Cancer Society (KWF UM 2008-4210, KWF UM 2009-4454, KWF UM 2011-5020, KWF MAC 2011-4970 , KWF UM 2012-5394, KWF MAC 2013-6425).
REFERENCES
1. Nordsmark M, Overgaard J A confirmatory prognostic study on oxygenation status and loco-regional control in advanced head and neck squamous cell carcinoma treated by radiation therapy. Radiother Oncol 2000;57:39-43.
2. Rasey JS, Koh WJ, Evans ML, Peterson LM, Lewellen TK, Graham MM et al. Quantifying regional hypoxia in human tumors with positron emission tomography of [18F]fluoromisonidazole: a pretherapy study of 37 patients. Int J Radiat Oncol Biol Phys 1996;36:417-28.
3. Krohn KA, Link JM, Mason RP Molecular imaging of hypoxia. J Nucl Med 2008;49 Suppl 2:129S-48S.
4. Gronroos T, Eskola O, Lehtio K, Minn H, Marjamaki P, Bergman J et al. Pharmacokinetics of [18F]FETNIM: a potential marker for PET. J Nucl Med 2001;42:1397-404.
5. Lord EM, Harwell L, Koch CJ Detection of Hypoxic Cells by Monoclonal-Antibody Recognizing 2-Nitroimidazole Adducts. Cancer Res 1993;53:5721-6.
6. Dolbier WR, Jr., Li AR, Koch CJ, Shiue CY, Kachur AV [18F]-EF5, a marker for PET detection of hypoxia: synthesis of precursor and a new fluorination procedure. Appl Radiat Isot 2001;54:73-80.
7. Kolb HC, Finn MG, Sharpless KB Click Chemistry: Diverse Chemical Function from a Few Good Reactions. Angew Chem Int Ed Engl 2001;40:2004-21.
8. Doss M, Zhang JJ, Belanger MJ, Stubbs JB, Hostetler ED, Alpaugh K et al. Biodistribution and radiation dosimetry of the hypoxia marker 18F-HX4 in monkeys and humans determined by using whole-body PET/CT. Nucl Med Commun 2010;31:1016-24.
9. Lopci E, Grassi I, Chiti A, Nanni C, Cicoria G, Toschi L et al. PET radiopharmaceuticals for imaging of tumor hypoxia: a review of the evidence. Am J Nucl Med Mol Imaging 2014;4:365-84.
10. Piert M, Machulla H, Becker G, Stahlschmidt A, Patt M, Aldinger P et al. Introducing fluorine-18 fluoromisonidazole positron emission tomography for the localisation and quantification of pig liver hypoxia. Eur J Nucl Med 1999;26:95-109.
11. Bentzen L, Keiding S, Horsman MR, Gronroos T, Hansen SB, Overgaard J Assessment of hypoxia in experimental mice tumours by [18F]fluoromisonidazole PET and pO2 electrode measurements. Influence of tumour volume and carbogen breathing. Acta Oncol 2002;41:304-12.
12. Dubois L, Landuyt W, Haustermans K, Dupont P, Bormans G, Vermaelen P et al. Evaluation of hypoxia in an experimental rat tumour model by
Chapter 2 44
[(18)F]fluoromisonidazole PET and immunohistochemistry. Brit J Cancer 2004;91: 1947-54.
13. Troost EG, Laverman P, Philippens ME, Lok J, van der Kogel AJ, Oyen WJ et al. Correlation of [18F]FMISO autoradiography and pimonidazole [corrected] immunohistochemistry in human head and neck carcinoma xenografts. Eur J Nucl Med Mol Imaging 2008;35:1803-11.
14. Cho H, Ackerstaff E, Carlin S, Lupu ME, Wang Y, Rizwan A et al. Noninvasive multimodality imaging of the tumor microenvironment: registered dynamic magnetic resonance imaging and positron emission tomography studies of a preclinical tumor model of tumor hypoxia. Neoplasia 2009;11:247-59, 2p following 59.
15. Huang T, Civelek AC, Zheng H, Ng CK, Duan X, Li J et al. (18)F-misonidazole PET imaging of hypoxia in micrometastases and macroscopic xenografts of human non-small cell lung cancer: a correlation with autoradiography and histological findings. Am J Nucl Med Mol Imaging 2013;3:142-53.
16. Matsumoto K, Szajek L, Krishna MC, Cook JA, Seidel J, Grimes K et al. The influence of tumor oxygenation on hypoxia imaging in murine squamous cell carcinoma using [64Cu]Cu-ATSM or [18F]Fluoromisonidazole positron emission tomography. Int J Oncol 2007;30:873-81.
17. Bruehlmeier M, Kaser-Hotz B, Achermann R, Bley CR, Wergin M, Schubiger PA et al. Measurement of tumor hypoxia in spontaneous canine sarcomas. Vet Radiol Ultrasound 2005;46:348-54.
18. O'Donoghue JA, Zanzonico P, Pugachev A, Wen B, Smith-Jones P, Cai S et al. Assessment of regional tumor hypoxia using 18F-fluoromisonidazole and 64Cu(II)-diacetyl-bis(N4-methylthiosemicarbazone) positron emission tomography: Comparative study featuring microPET imaging, Po2 probe measurement, autoradiography, and fluorescent microscopy in the R3327-AT and FaDu rat tumor models. Int J Radiat Oncol Biol Phys 2005;61:1493-502.
19. Chang J, Wen B, Kazanzides P, Zanzonico P, Finn RD, Fichtinger G et al. A robotic system for 18F-FMISO PET-guided intratumoral pO2 measurements. Med Phys 2009;36:5301-9.
20. Monnich D, Troost EG, Kaanders JH, Oyen WJ, Alber M, Zips D et al. Correlation between tumor oxygenation and 18F-fluoromisonidazole PET data simulated based on microvessel images. Acta Oncol 2013;52:1308-13.
21. Mortensen LS, Buus S, Nordsmark M, Bentzen L, Munk OL, Keiding S et al. Identifying hypoxia in human tumors: A correlation study between 18F-FMISO PET and the Eppendorf oxygen-sensitive electrode. Acta Oncol 2010;49:934-40.
22. Gagel B, Piroth M, Pinkawa M, Reinartz P, Zimny M, Kaiser HJ et al. pO polarography, contrast enhanced color duplex sonography (CDS), [18F] fluoromisonidazole and [18F] fluorodeoxyglucose positron emission tomography: validated methods for the evaluation of therapy-relevant tumor oxygenation or only bricks in the puzzle of tumor hypoxia? BMC Cancer 2007;7:113.
23. Zimny M, Gagel B, DiMartino E, Hamacher K, Coenen HH, Westhofen M et al. FDG--a marker of tumour hypoxia? A comparison with [18F]fluoromisonidazole and pO2-polarography in metastatic head and neck cancer. Eur J Nucl Med Mol Imaging 2006;33:1426-31.
Current applications of hypoxia PET imaging 45
24. Bentzen L, Keiding S, Nordsmark M, Falborg L, Hansen SB, Keller J et al. Tumour oxygenation assessed by 18F-fluoromisonidazole PET and polarographic needle electrodes in human soft tissue tumours. Radiother Oncol 2003;67:339-44.
25. Norikane T, Yamamoto Y, Maeda Y, Kudomi N, Matsunaga T, Haba R et al. Correlation of (18)F-fluoromisonidazole PET findings with HIF-1alpha and p53 expressions in head and neck cancer: comparison with (18)F-FDG PET. Nucl Med Commun 2014;35:30-5.
26. Sato J, Kitagawa Y, Yamazaki Y, Hata H, Asaka T, Miyakoshi M et al. Advantage of FMISO-PET over FDG-PET for predicting histological response to preoperative chemotherapy in patients with oral squamous cell carcinoma. Eur J Nucl Med Mol Imaging 2014.
27. Cherk MH, Foo SS, Poon AM, Knight SR, Murone C, Papenfuss AT et al. Lack of correlation of hypoxic cell fraction and angiogenesis with glucose metabolic rate in non-small cell lung cancer assessed by 18F-Fluoromisonidazole and 18F-FDG PET. J Nucl Med 2006;47:1921-6.
28. Cher LM, Murone C, Lawrentschuk N, Ramdave S, Papenfuss A, Hannah A et al. Correlation of hypoxic cell fraction and angiogenesis with glucose metabolic rate in gliomas using 18F-fluoromisonidazole, 18F-FDG PET, and immunohistochemical studies. J Nucl Med 2006;47:410-8.
29. Cheng J, Lei L, Xu J, Sun Y, Zhang Y, Wang X et al. 18F-fluoromisonidazole PET/CT: a potential tool for predicting primary endocrine therapy resistance in breast cancer. J Nucl Med 2013;54:333-40.
30. Lawrentschuk N, Poon AM, Foo SS, Putra LG, Murone C, Davis ID et al. Assessing regional hypoxia in human renal tumours using 18F-fluoromisonidazole positron emission tomography. BJU Int 2005;96:540-6.
31. Busk M, Horsman MR, Jakobsen S, Bussink J, van der Kogel A, Overgaard J Cellular uptake of PET tracers of glucose metabolism and hypoxia and their linkage. Eur J Nucl Med Mol Imaging 2008;35:2294-303.
32. Busk M, Horsman MR, Jakobsen S, Keiding S, van der Kogel AJ, Bussink J et al. Imaging hypoxia in xenografted and murine tumors with 18F-fluoroazomycin arabinoside: a comparative study involving microPET, autoradiography, PO2-polarography, and fluorescence microscopy. Int J Radiat Oncol Biol Phys 2008;70:1202-
33. Busk M, Horsman MR, Jakobsen S, Hansen KV, Bussink J, van der Kogel A et al. Can hypoxia-PET map hypoxic cell density heterogeneity accurately in an animal tumor model at a clinically obtainable image contrast? Radiother Oncol 2009;92:429-36.
34. Busk M, Toustrup K, Sorensen BS, Alsner J, Horsman MR, Jakobsen S et al. In vivo identification and specificity assessment of mRNA markers of hypoxia in human and mouse tumors. BMC Cancer 2011;11:63.
35. Carlin S, Zhang H, Reese M, Ramos NN, Chen Q, Ricketts SA A comparison of the imaging characteristics and microregional distribution of 4 hypoxia PET tracers. J Nucl Med 2014;55:515-21.
36. Tran LB, Bol A, Labar D, Jordan B, Magat J, Mignion L et al. Hypoxia imaging with the nitroimidazole 18F-FAZA PET tracer: a comparison with OxyLite, EPR oximetry and 19F-MRI relaxometry. Radiother Oncol 2012;105:29-35.
Chapter 2 46
37. Lo Dico A, Valtorta S, Martelli C, Belloli S, Gianelli U, Tosi D et al. Validation of an engineered cell model for in vitro and in vivo HIF-1alpha evaluation by different imaging modalities. Mol Imaging Biol 2014;16:210-23.
38. Yang DJ, Wallace S, Cherif A, Li C, Gretzer MB, Kim EE et al. Development of F-18-labeled fluoroerythronitroimidazole as a PET agent for imaging tumor hypoxia. Radiology 1995;194:795-800.
39. Hu M, Xing L, Mu D, Yang W, Yang G, Kong L et al. Hypoxia imaging with 18F-fluoroerythronitroimidazole integrated PET/CT and immunohistochemical studies in non-small cell lung cancer. Clin Nucl Med 2013;38:591-6.
40. Chitneni SK, Bida GT, Dewhirst MW, Zalutsky MR A simplified synthesis of the hypoxia imaging agent 2-(2-Nitro-1H-imidazol-1-yl)-N-(2,2,3,3,3-[(18)F]pentafluoro-propyl)-acetamide ([18F]EF5). Nucl Med Biol 2012;39:1012-8.
41. Ziemer LS, Evans SM, Kachur AV, Shuman AL, Cardi CA, Jenkins WT et al. Noninvasive imaging of tumor hypoxia in rats using the 2-nitroimidazole 18F-EF5. Eur J Nucl Med Mol Imaging 2003;30:259-66.
42. Chitneni SK, Bida GT, Zalutsky MR, Dewhirst MW Comparison of the Hypoxia PET Tracer 18F-EF5 to Immunohistochemical Marker EF5 in 3 Different Human Tumor Xenograft Models. J Nucl Med 2014;55:1192-7.
43. Silen J, Hogel H, Kivinen K, Silvoniemi A, Forsback S, Loyttyniemi E et al. Uptake of [F]EF5 as a Tracer for Hypoxic and Aggressive Phenotype in Experimental Head and Neck Squamous Cell Carcinoma. Transl Oncol 2014.
44. Mahy P, De Bast M, Leveque PH, Gillart J, Labar D, Marchand J et al. Preclinical validation of the hypoxia tracer 2-(2-nitroimidazol-1-yl)- N-(3,3,3-[(18)F]trifluoro-propyl)acetamide, [(18)F]EF3. Eur J Nucl Med Mol Imaging 2004;31:1263-72.
45. Mahy P, De Bast M, Gillart J, Labar D, Gregoire V Detection of tumour hypoxia: comparison between EF5 adducts and [18F]EF3 uptake on an individual mouse tumour basis. Eur J Nucl Med Mol Imaging 2006;33:553-6.
46. Christian N, Bol A, De Bast M, Labar D, Lee J, Mahy P et al. Determination of tumour hypoxia with the PET tracer [18F]EF3: improvement of the tumour-to-background ratio in a mouse tumour model. Eur J Nucl Med Mol Imaging 2007;34:1348-54.
47. Dubois LJ, Lieuwes NG, Janssen MH, Peeters WJ, Windhorst AD, Walsh JC et al. Preclinical evaluation and validation of [18F]HX4, a promising hypoxia marker for PET imaging. Proc Natl Acad Sci U S A 2011;108:14620-5.
48. Rademakers SE, Lok J, van der Kogel AJ, Bussink J, Kaanders JH Metabolic markers in relation to hypoxia; staining patterns and colocalization of pimonidazole, HIF-1alpha, CAIX, LDH-5, GLUT-1, MCT1 and MCT4. BMC Cancer 2011;11:167.
49. Sorger D, Patt M, Kumar P, Wiebe LI, Barthel H, Seese A et al. [18F]Fluoroazomy-cinarabinofuranoside (18FAZA) and [18F]Fluoromisonidazole (18FMISO): a comparative study of their selective uptake in hypoxic cells and PET imaging in experimental rat tumors. Nucl Med Biol 2003;30:317-26.
50. Piert M, Machulla HJ, Picchio M, Reischl G, Ziegler S, Kumar P et al. Hypoxia-specific tumor imaging with 18F-fluoroazomycin arabinoside. J Nucl Med 2005;46:106-
51. Reischl G, Dorow DS, Cullinane C, Katsifis A, Roselt P, Binns D et al. Imaging of tumor hypoxia with [124I]IAZA in comparison with [18F]FMISO and [18F]FAZA--first small animal PET results. J Pharm Pharm Sci 2007;10:203-11.
Current applications of hypoxia PET imaging 47
52. Maier FC, Kneilling M, Reischl G, Cay F, Bukala D, Schmid A et al. Significant impact of different oxygen breathing conditions on noninvasive in vivo tumor-hypoxia imaging using [(1)(8)F]-fluoro-azomycinarabino-furanoside ([(1)(8)F]FAZA). Radiat Oncol 2011;6:165.
53. Gronroos T, Bentzen L, Marjamaki P, Murata R, Horsman MR, Keiding S et al. Comparison of the biodistribution of two hypoxia markers [18F]FETNIM and [18F]FMISO in an experimental mammary carcinoma. Eur J Nucl Med Mol Imaging 2004;31:513-20.
54. Dubois L, Landuyt W, Cloetens L, Bol A, Bormans G, Haustermans K et al. [18F]EF3 is not superior to [18F]FMISO for PET-based hypoxia evaluation as measured in a rat rhabdomyosarcoma tumour model. Eur J Nucl Med Mol Imaging 2009;36:209-18.
55. Mahy P, De Bast M, de Groot T, Cheguillaume A, Gillart J, Haustermans K et al. Comparative pharmacokinetics, biodistribution, metabolism and hypoxia-dependent uptake of [18F]-EF3 and [18F]-MISO in rodent tumor models. Radiother Oncol 2008;89:353-60.
56. Peeters SG, Zegers CM, Lieuwes NG, Van Elmpt W, Eriksson J, Van Dongen GA et al. A comparative study of [18F]HX4, [18F]FAZA and [18F]FMISO hypoxia PET tracers in a preclinical tumor model. Int J Radiat Oncol Biol Phys 2014.
57. Chen L, Zhang Z, Kolb HC, Walsh JC, Zhang J, Guan Y (1)(8)F-HX4 hypoxia imaging with PET/CT in head and neck cancer: a comparison with (1)(8)F-FMISO. Nucl Med Commun 2012;33:1096-102.
58. Postema EJ, McEwan AJ, Riauka TA, Kumar P, Richmond DA, Abrams DN et al. Initial results of hypoxia imaging using 1-alpha-D: -(5-deoxy-5-[18F]-fluoroarabinofuranosyl)-2-nitroimidazole ( 18F-FAZA). Eur J Nucl Med Mol Imaging 2009;36:1565-73.
59. Trinkaus ME, Blum R, Rischin D, Callahan J, Bressel M, Segard T et al. Imaging of hypoxia with 18F-FAZA PET in patients with locally advanced non-small cell lung cancer treated with definitive chemoradiotherapy. J Med Imaging Radiat Oncol 2013;57:475-
60. Zegers CM, van Elmpt W, Wierts R, Reymen B, Sharifi H, Ollers MC et al. Hypoxia imaging with [(1)(8)F]HX4 PET in NSCLC patients: defining optimal imaging parameters. Radiother Oncol 2013;109:58-64.
61. Szeto MD, Chakraborty G, Hadley J, Rockne R, Muzi M, Alvord EC, Jr. et al. Quantitative metrics of net proliferation and invasion link biological aggressiveness assessed by MRI with hypoxia assessed by FMISO-PET in newly diagnosed glioblastomas. Cancer Res 2009;69:4502-9.
62. Hirata K, Terasaka S, Shiga T, Hattori N, Magota K, Kobayashi H et al. (1)(8)F-Fluoromisonidazole positron emission tomography may differentiate glioblastoma multiforme from less malignant gliomas. Eur J Nucl Med Mol Imaging 2012;39:760-70.
63. Yamamoto Y, Maeda Y, Kawai N, Kudomi N, Aga F, Ono Y et al. Hypoxia assessed by 18F-fluoromisonidazole positron emission tomography in newly diagnosed gliomas. Nucl Med Commun 2012;33:621-5.
64. Segard T, Robins PD, Yusoff IF, Ee H, Morandeau L, Campbell EM et al. Detection of hypoxia with 18F-fluoromisonidazole (18F-FMISO) PET/CT in suspected or proven pancreatic cancer. Clin Nucl Med 2013;38:1-6.
Chapter 2 48
65. Loi S, Ngan SY, Hicks RJ, Mukesh B, Mitchell P, Michael M et al. Oxaliplatin combined with infusional 5-fluorouracil and concomitant radiotherapy in inoperable and metastatic rectal cancer: a phase I trial. Brit J Cancer 2005;92:655-61.
66. Havelund BM, Holdgaard PC, Rafaelsen SR, Mortensen LS, Theil J, Bender D et al. Tumour hypoxia imaging with 18F-fluoroazomycinarabinofuranoside PET/CT in patients with locally advanced rectal cancer. Nucl Med Commun 2013;34:155-61.
67. Garcia-Parra R, Wood D, Shah RB, Siddiqui J, Hussain H, Park H et al. Investigation on tumor hypoxia in resectable primary prostate cancer as demonstrated by 18F-FAZA PET/CT utilizing multimodality fusion techniques. Eur J Nucl Med Mol Imaging 2011;38:1816-23.
68. Bartlett RM, Beattie BJ, Naryanan M, Georgi JC, Chen Q, Carlin SD et al. Image-guided PO2 probe measurements correlated with parametric images derived from 18F-fluoromisonidazole small-animal PET data in rats. J Nucl Med 2012;53:1608-15.
69. Busk M, Munk OL, Jakobsen S, Wang T, Skals M, Steiniche T et al. Assessing hypoxia in animal tumor models based on pharmocokinetic analysis of dynamic FAZA PET. Acta Oncol 2010;49:922-33.
70. Wang W, Lee NY, Georgi JC, Narayanan M, Guillem J, Schoder H et al. Pharmacokinetic analysis of hypoxia (18)F-fluoromisonidazole dynamic PET in head and neck cancer. J Nucl Med 2010;51:37-45.
71. Thorwarth D, Eschmann SM, Paulsen F, Alber M A kinetic model for dynamic [18F]-Fmiso PET data to analyse tumour hypoxia. Phys Med Biol 2005;50:2209-24.
72. Verwer EE, van Velden FH, Bahce I, Yaqub M, Schuit RC, Windhorst AD et al. Pharmacokinetic analysis of [18F]FAZA in non-small cell lung cancer patients. Eur J Nucl Med Mol Imaging 2013;40:1523-31.
73. Mortensen LS, Busk M, Nordsmark M, Jakobsen S, Theil J, Overgaard J et al. Accessing radiation response using hypoxia PET imaging and oxygen sensitive electrodes: a preclinical study. Radiother Oncol 2011;99:418-23.
74. Beck R, Roper B, Carlsen JM, Huisman MC, Lebschi JA, Andratschke N et al. Pretreatment 18F-FAZA PET predicts success of hypoxia-directed radiochemotherapy using tirapazamine. J Nucl Med 2007;48:973-80.
75. Lehtio K, Eskola O, Viljanen T, Oikonen V, Gronroos T, Sillanmaki L et al. Imaging perfusion and hypoxia with PET to predict radiotherapy response in head-and-neck cancer. Int J Radiat Oncol Biol Phys 2004;59:971-82.
76. Dirix P, Vandecaveye V, De Keyzer F, Stroobants S, Hermans R, Nuyts S Dose painting in radiotherapy for head and neck squamous cell carcinoma: value of repeated functional imaging with (18)F-FDG PET, (18)F-fluoromisonidazole PET, diffusion-weighted MRI, and dynamic contrast-enhanced MRI. J Nucl Med 2009;50:1020-7.
77. Mortensen LS, Johansen J, Kallehauge J, Primdahl H, Busk M, Lassen P et al. FAZA PET/CT hypoxia imaging in patients with squamous cell carcinoma of the head and neck treated with radiotherapy: results from the DAHANCA 24 trial. Radiother Oncol 2012;105:14-20.
78. Lee N, Nehmeh S, Schoder H, Fury M, Chan K, Ling CC et al. Prospective trial incorporating pre-/mid-treatment [18F]-misonidazole positron emission tomography for head-and-neck cancer patients undergoing concurrent chemoradiotherapy. Int J Radiat Oncol Biol Phys 2009;75:101-8.
Current applications of hypoxia PET imaging 49
79. Zips D, Zophel K, Abolmaali N, Perrin R, Abramyuk A, Haase R et al. Exploratory prospective trial of hypoxia-specific PET imaging during radiochemotherapy in patients with locally advanced head-and-neck cancer. Radiother Oncol 2012;105:21-8.
80. Eschmann SM, Paulsen F, Bedeshem C, Machulla HJ, Hehr T, Bamberg M et al. Hypoxia-imaging with (18)F-Misonidazole and PET: changes of kinetics during radiotherapy of head-and-neck cancer. Radiother Oncol 2007;83:406-10.
81. Thorwarth D, Eschmann SM, Scheiderbauer J, Paulsen F, Alber M Kinetic analysis of dynamic 18F-fluoromisonidazole PET correlates with radiation treatment outcome in head-and-neck cancer. BMC Cancer 2005;5:152.
82. Rischin D, Hicks RJ, Fisher R, Binns D, Corry J, Porceddu S et al. Prognostic significance of [18F]-misonidazole positron emission tomography-detected tumor hypoxia in patients with advanced head and neck cancer randomly assigned to chemoradiation with or without tirapazamine: a substudy of Trans-Tasman Radiation Oncology Group Study 98.02. J Clin Oncol 2006;24:2098-104.
83. Rajendran JG, Schwartz DL, O'Sullivan J, Peterson LM, Ng P, Scharnhorst J et al. Tumor hypoxia imaging with [F-18] fluoromisonidazole positron emission tomography in head and neck cancer. Clin Cancer Res 2006;12:5435-41.
84. Komar G, Lehtio K, Seppanen M, Eskola O, Levola H, Lindholm P et al. Prognostic value of tumour blood flow, [(18)F]EF5 and [ (18)F]FDG PET/CT imaging in patients with head and neck cancer treated with radiochemotherapy. Eur J Nucl Med Mol Imaging 2014;41:2042-50.
85. Thorwarth D, Eschmann SM, Holzner F, Paulsen F, Alber M Combined uptake of [18F]FDG and [18F]FMISO correlates with radiation therapy outcome in head-and-neck cancer patients. Radiother Oncol 2006;80:151-6.
86. Li L, Hu M, Zhu H, Zhao W, Yang G, Yu J Comparison of 18F-Fluoroery-thronitroimidazole and 18F-fluorodeoxyglucose positron emission tomography and prognostic value in locally advanced non-small-cell lung cancer. Clin Lung Cancer 2010;11:335-40.
87. Eschmann SM, Paulsen F, Reimold M, Dittmann H, Welz S, Reischl G et al. Prognostic impact of hypoxia imaging with 18F-misonidazole PET in non-small cell lung cancer and head and neck cancer before radiotherapy. J Nucl Med 2005;46:253-60.
88. Kawai N, Lin W, Cao WD, Ogawa D, Miyake K, Haba R et al. Correlation between (18)F-fluoromisonidazole PET and expression of HIF-1alpha and VEGF in newly diagnosed and recurrent malignant gliomas. Eur J Nucl Med Mol Imaging 2014;41:1870-8.
89. Swanson KR, Chakraborty G, Wang CH, Rockne R, Harpold HL, Muzi M et al. Complementary but distinct roles for MRI and 18F-fluoromisonidazole PET in the assessment of human glioblastomas. J Nucl Med 2009;50:36-44.
90. Vercellino L, Groheux D, Thoury A, Delord M, Schlageter MH, Delpech Y et al. Hypoxia imaging of uterine cervix carcinoma with (18)F-FETNIM PET/CT. Clin Nucl Med 2012;37:1065-8.
91. Yue J, Yang Y, Cabrera AR, Sun X, Zhao S, Xie P et al. Measuring tumor hypoxia with (1)(8)F-FETNIM PET in esophageal squamous cell carcinoma: a pilot clinical study. Dis Esophagus 2012;25:54-61.
92. Hugonnet F, Fournier L, Medioni J, Smadja C, Hindie E, Huchet V et al. Metastatic renal cell carcinoma: relationship between initial metastasis hypoxia, change after 1
Chapter 2 50
month's sunitinib, and therapeutic response: an 18F-fluoromisonidazole PET/CT study. J Nucl Med 2011;52:1048-55.
93. Oehler C, O'Donoghue JA, Russell J, Zanzonico P, Lorenzen S, Ling CC et al. 18F-fluromisonidazole PET imaging as a biomarker for the response to 5,6-dimethylxanthenone-4-acetic acid in colorectal xenograft tumors. J Nucl Med 2011;52:437-44.
94. Valable S, Petit E, Roussel S, Marteau L, Toutain J, Divoux D et al. Complementary information from magnetic resonance imaging and (18)F-fluoromisonidazole positron emission tomography in the assessment of the response to an antiangiogenic treatment in a rat brain tumor model. Nucl Med Biol 2011;38:781-93.
95. Murakami M, Zhao S, Zhao Y, Chowdhury NF, Yu W, Nishijima K et al. Evaluation of changes in the tumor microenvironment after sorafenib therapy by sequential histology and 18F-fluoromisonidazole hypoxia imaging in renal cell carcinoma. Int J Oncol 2012;41:1593-600.
96. Busk M, Mortensen LS, Nordsmark M, Overgaard J, Jakobsen S, Hansen KV et al. PET hypoxia imaging with FAZA: reproducibility at baseline and during fractionated radiotherapy in tumour-bearing mice. Eur J Nucl Med Mol Imaging 2013;40:186-97.
97. Dorow DS, Cullinane C, Conus N, Roselt P, Binns D, McCarthy TJ et al. Multi-tracer small animal PET imaging of the tumour response to the novel pan-Erb-B inhibitor CI-1033. Eur J Nucl Med Mol Imaging 2006;33:441-52.
98. Solomon B, Binns D, Roselt P, Weibe LI, McArthur GA, Cullinane C et al. Modulation of intratumoral hypoxia by the epidermal growth factor receptor inhibitor gefitinib detected using small animal PET imaging. Mol Cancer Ther 2005;4:1417-22.
99. Chitneni SK, Bida GT, Yuan H, Palmer GM, Hay MP, Melcher T et al. 18F-EF5 PET imaging as an early response biomarker for the hypoxia-activated prodrug SN30000 combined with radiation treatment in a non-small cell lung cancer xenograft model. J Nucl Med 2013;54:1339-46.
100. Yamane T, Kikuchi M, Shinohara S, Senda M Reduction of [(18)F]fluoromisonidazole uptake after neoadjuvant chemotherapy for head and neck squamous cell carcinoma. Mol Imaging Biol 2011;13:227-31.
101. Servagi-Vernat S, Differding S, Hanin FX, Labar D, Bol A, Lee JA et al. A prospective clinical study of (1)(8)F-FAZA PET-CT hypoxia imaging in head and neck squamous cell carcinoma before and during radiation therapy. Eur J Nucl Med Mol Imaging 2014;41:1544-52.
102. Koh WJ, Bergman KS, Rasey JS, Peterson LM, Evans ML, Graham MM et al. Evaluation of oxygenation status during fractionated radiotherapy in human nonsmall cell lung cancers using [F-18]fluoromisonidazole positron emission tomography. Int J Radiat Oncol Biol Phys 1995;33:391-8.
103. Vera P, Bohn P, Edet-Sanson A, Salles A, Hapdey S, Gardin I et al. Simultaneous positron emission tomography (PET) assessment of metabolism with (1)(8)F-fluoro-2-deoxy-d-glucose (FDG), proliferation with (1)(8)F-fluoro-thymidine (FLT), and hypoxia with (1)(8)fluoro-misonidazole (F-miso) before and during radiotherapy in patients with non-small-cell lung cancer (NSCLC): a pilot study. Radiother Oncol 2011;98:109-16.
104. Schuetz M, Schmid MP, Potter R, Kommata S, Georg D, Lukic D et al. Evaluating repetitive 18F-fluoroazomycin-arabinoside (18FAZA) PET in the setting of MRI guided adaptive radiotherapy in cervical cancer. Acta Oncol 2010;49:941-7.
Current applications of hypoxia PET imaging 51
105. Eary JF, Link JM, Muzi M, Conrad EU, Mankoff DA, White JK et al. Multiagent PET for risk characterization in sarcoma. J Nucl Med 2011;52:541-6.
106. Rajendran JG, Mankoff DA, O'Sullivan F, Peterson LM, Schwartz DL, Conrad EU et al. Hypoxia and glucose metabolism in malignant tumors: evaluation by [18F]fluoro-misonidazole and [18F]fluorodeoxyglucose positron emission tomography imaging. Clin Cancer Res 2004;10:2245-52.
107. Overgaard J, Horsman MR Modification of Hypoxia-Induced Radioresistance in Tumors by the Use of Oxygen and Sensitizers. Semin Radiat Oncol 1996;6:10-21.
108. Choi W, Lee SW, Park SH, Ryu JS, Oh SJ, Im KC et al. Planning study for available dose of hypoxic tumor volume using fluorine-18-labeled fluoromisonidazole positron emission tomography for treatment of the head and neck cancer. Radiother Oncol 2010;97:176-82.
109. Hendrickson K, Phillips M, Smith W, Peterson L, Krohn K, Rajendran J Hypoxia imaging with [F-18] FMISO-PET in head and neck cancer: potential for guiding intensity modulated radiation therapy in overcoming hypoxia-induced treatment resistance. Radiother Oncol 2011;101:369-75.
110. Toma-Dasu I, Uhrdin J, Antonovic L, Dasu A, Nuyts S, Dirix P et al. Dose prescription and treatment planning based on FMISO-PET hypoxia. Acta Oncol 2012;51:222-30.
111. Chang JH, Wada M, Anderson NJ, Lim Joon D, Lee ST, Gong SJ et al. Hypoxia-targeted radiotherapy dose painting for head and neck cancer using (18)F-FMISO PET: a biological modeling study. Acta Oncol 2013;52:1723-9.
112. Bittner MI, Wiedenmann N, Bucher S, Hentschel M, Mix M, Weber WA et al. Exploratory geographical analysis of hypoxic subvolumes using 18F-MISO-PET imaging in patients with head and neck cancer in the course of primary chemoradiotherapy. Radiother Oncol 2013;108:511-6.
113. Lin Z, Mechalakos J, Nehmeh S, Schoder H, Lee N, Humm J et al. The influence of changes in tumor hypoxia on dose-painting treatment plans based on 18F-FMISO positron emission tomography. Int J Radiat Oncol Biol Phys 2008;70:1219-28.
114. Hicks RJ, Rischin D, Fisher R, Binns D, Scott AM, Peters LJ Utility of FMISO PET in advanced head and neck cancer treated with chemoradiation incorporating a hypoxia-targeting chemotherapy agent. Eur J Nucl Med Mol Imaging 2005;32:1384-91.


IMAGING OF TUMOR HYPOXIA

CHAPTER
A comparative study of the hypoxia PET tracers [18F]HX4, [18F]FAZA and[18F]FMISO in a
preclinical tumor model
Sarah G.J.A. Peeters, Catharina M.L. Zegers, Natasja G. Lieuwes, Wouter van Elmpt, Jonas Eriksson, Guus A.M.S. van Dongen, Ludwig Dubois*, Philippe Lambin* Published in: Int J Radiat Oncol Biol Phys. 2015; 91(2):351-9

Chapter 3 56
ABSTRACT
Purpose: Several individual clinical and preclinical studies have shown the possibility to evaluate tumor hypoxia by using noninvasive positron emission tomography (PET). The current study compared 3 hypoxia PET tracers frequently used in the clinic, [18F]FMISO, [18F]FAZA and [18F]HX4 in a preclinical tumor model. Tracer uptake was evaluated for the optimal time point for imaging, tumor-to-blood ratios (TBR), spatial reproducibility and sensitivity towards oxygen modifications. Methods and Materials: PET/computed tomotgraphy (CT) images of rhadomyosarcoma R1 bearing WAG/Rij rats were acquired at multiple time points post injection (p.i.) with one of the hypoxia tracers. TBR values were calculated and reproducibility was investigated by voxel-to-voxel analysis, represented as correlation coefficients (R) or DICE similarity coefficient of the high-uptake volumes. Tumor oxygen modifications were induced by exposure to either carbogen/nicotinamide treatment or 7% oxygen breathing. Results: TBR was stabilized and maximal at 2 hours p.i. for [18F]FAZA (4.0±0.5) and at 3 hours p.i. for [18F]HX4 (7.2±0.7) whereas [18F]FMISO showed a constant increasing TBR (9.0±0.8 at 6 hours p.i.). High spatial reproducibility was observed by voxel-to-voxel comparisons and DICE similarity coefficient calculations on the 30% highest uptake volume for both [18F]FMISO (R=0.86, DICE coefficient=0.76) and [18F]HX4 (R=0.76, DICE coeffi-cient=0.70) whereas [18F]FAZA was less reproducible (R=0.52 DICE coefficient=0.49). Modifying the hypoxic fraction resulted in enhanced mean standardized uptake values for both [18F]HX4 and [18F]FAZA upon 7% oxygen breathing. Only [18F]FMISO uptake was found to be reversible upon exposure to nicotinamide and carbogen. Conclusions: This study indicates that each tracer has its own strengths and, depending on the question to be answered, a different tracer can be put forward.
Comparative study of hypoxia PET tracers 57
INTRODUCTION
Tumor hypoxia is an important factor in worsening cancer patients’ treatment outcome. Regions of low oxygen concentration are a well-known characteristic of solid tumors and can be caused by impaired blood vessel development, temporal occlusions of blood vessels or excessive tumor growth (1, 2). Knowledge about the extension and location of hypoxia would provide additional information that could be integrated into strategies of conventional treatments, potentially leading to improved therapeutic outcome (3). Posi-tron Emission Tomography (PET) has been shown to be a suitable, non-invasive, 3-dimensional imaging technique for the detection of hypoxic tumor regions. PET tracers containing the oxygen-sensitive nitroimidazole group are specifically designed to detect hypoxic regions, and the feasibility of these tracers has been studied extensively in several independent clinical and preclinical studies (1). 18F- labeled fluoromisonidazole ([18F]FMISO) was the first specific hypoxia PET tracer and, although it may be the most frequently used tracer for this purpose, its suitability is limited because of slow tumor-specific accumulation and nonspecific washout (4). Second generation 2-nitroimidazole tracers with different clearance and hydrophilicity character-istics have been developed in an attempt to overcome these disadvantages:, [18F]fluoroazomycin arabinoside (FAZA), [18F]fluoroerythronitroimidazole (FETNIM), and [18F]tri-fluoroetanidazole (EF3). In preclinical settings, these tracers have been investigat-ed separately or solely in comparison to hypoxia immunohistochemical staining or [18F]FMISO PET imaging, using different experimental set-ups, tumor models and acquisi-tion protocols (5-8). Next, the third-generation hypoxia tracer [18F]flortanidazole (HX4) was developed and evaluated in a preclinical rhabdomyosarcoma tumor model, where it was found to be dependent on tumoral oxygenation status (9). Only recently, a compara-tive study in preclinical animal models reported a clear relationship among the uptake of [18F]FMISO, [18F]FAZA and [18F]HX4 and with immunohistochemical stainings for perfusion, hypoxia and carbonic anhydrase IX (10). With respect to patients usage of PET tumor hypoxia for patient imaging, clinical studies have indicated that both [18F]FAZA and [18F]FMISO have prognostic potential (11, 12) and a phase I clinical study demonstrated that imaging using [18F]HX4 was feasible and non-toxic (13). In this study, we compare the 3 most frequently used and clinically available hypoxia tracers, [18F]FMISO, [18F]FAZA and [18F]HX4, along with the metabolic tracer [18F]fluorodeoxyglucose (FDG) in a preclinical tumor model. We investigated the uptake of each tracer over time and determined the tumor-to-background ratios. A second PET scan was performed on the same animal after 48 hours to assess spatial reproducibility. Fur-thermore, tracer uptake was challenged by exposing the animals to modified oxygen concentrations. The focus of this study was to investigate the performance and character-istics of the different hypoxia PET tracer, using the same tumor model.
Chapter 3 58
MATERIALS AND METHODS
Tracer synthesis, tumor model, experimental design
Tracer synthesis of [18F]FMISO, [18F]FAZA and [18F]HX4 (Figure 3.1A) was performed as described previously (14-17). All animal experimental procedures were approved by the Animal Ethical Committee of Maastricht University and were in accordance with the Helsinki Declaration of 1975, as revised in 2000. Adult WAG/Rij rats received subcutane-ous implants of the syngeneic rhabdomyosarcoma R1 tumors (1mm3) in the lateral flank. Experiments were started when tumors reached a minimal volume of 3 cm3 to meet the resolution of the PET scanner and to have a stable hypoxic (18) and necrotic (5) area.
Average tumor volume for [18F]FDG= 21±12 cm3, 16±6 cm3 for [18F]FAZA, 13±6 cm3 for [18F]FMISO and 11±5 cm3 for [18F]HX4. During the experimental procedures, rats were anesthetized with intraperitoneal injections of sodium pentobarbital (60mg/kg). Animals were immobilized on a board and placed outside the scanner between scans to maintain and monitor anesthesia. Radioactive tracers (radiochemical purity was maintained at >95% and synthesis yield at 5.2±2.5 GBq) were injected into the lateral tail vein by using an intravenous line (0.4 mm G27 Venoflux needle; Vygon Vet, Ecouen, France) flushed with 10% heparin solution (21±2 MBq for [18F]FDG, 17±5 MBq for [18F]FAZA, 21±2 MBq for [18F]FMISO, and 21±2 MBq for [18F]HX4).
Image acquisition and analysis
Images were acquired and analyzed using a clinical PET/CT scanner (Siemens Biograph 40, Siemens Healthcare) and dedicated software (TrueD VC60; Siemens) as described in more detail in the supplement section and previously (9). Tumor to blood ratios (TBR) and tumor to muscle ratios (TMR) were determined using heart and muscle of the hind leg as background tissue, respectively. Spatial reproducibility scans were performed in the same animal within short time frames, using rigid registration voxel to voxel analysis (from 2 to 6 hours post injection [p.i].) or 48 hours apart using nonrigid registration (details in sup-plement section) of the tumor for long-term comparison to overcome the 24% tumor growth (which were 31±2% for [18F]FDG, 26±2% for [18F]FAZA, 23±1% for [18F]FMISO, and 22±3% for [18F]HX4). Furthermore, a voxel-wise comparison of the 2 scans was performed for which a correlation coefficient was calculated. Imaging schedules for oxygen modifica-tion using either nicotinamide (500mg/kg, intraperitoneal) and carbogen (95% O2, 5% CO2, flow 5l/min) or 7% oxygen (residual N2, flow 2,5l/min) breathing are shown in Figure 3.1B. In short, after injection of the tracer, a first basal scan was performed at 2 hours p.i., followed by oxygen modification treatment and a second scan at 5 hours p.i.
Statistics
Prism version 5.01 software (GraphPad) for Windows (Microsoft) was used to perform statistical analyses. To determine the statistical significance of differences between 2 independent groups of variables, we used the nonparametric Mann-Whitney-U test for small groups. Spatial reproducibility was analyzed using either a DICE similarity coefficient
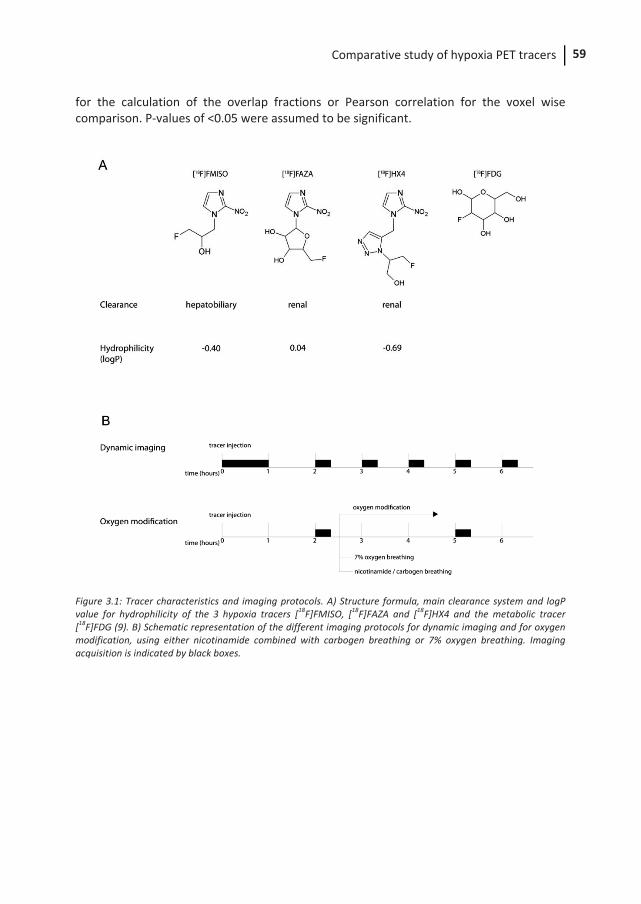
Comparative study of hypoxia PET tracers 59
for the calculation of the overlap fractions or Pearson correlation for the voxel wise comparison. P-values of <0.05 were assumed to be significant.
Figure 3.1: Tracer characteristics and imaging protocols. A) Structure formula, main clearance system and logP value for hydrophilicity of the 3 hypoxia tracers [18F]FMISO, [18F]FAZA and [18F]HX4 and the metabolic tracer [18F]FDG (9). B) Schematic representation of the different imaging protocols for dynamic imaging and for oxygen modification, using either nicotinamide combined with carbogen breathing or 7% oxygen breathing. Imaging acquisition is indicated by black boxes.
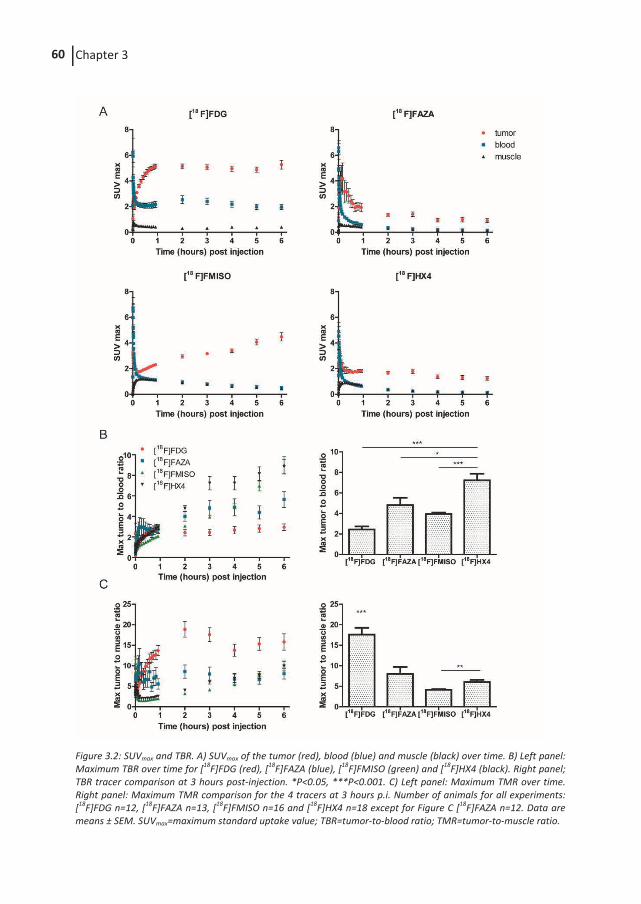
Chapter 3 60
Figure 3.2: SUVmax and TBR. A) SUVmax of the tumor (red), blood (blue) and muscle (black) over time. B) Left panel: Maximum TBR over time for [18F]FDG (red), [18F]FAZA (blue), [18F]FMISO (green) and [18F]HX4 (black). Right panel; TBR tracer comparison at 3 hours post-injection. *P<0.05, ***P<0.001. C) Left panel: Maximum TMR over time. Right panel: Maximum TMR comparison for the 4 tracers at 3 hours p.i. Number of animals for all experiments: [18F]FDG n=12, [18F]FAZA n=13, [18F]FMISO n=16 and [18F]HX4 n=18 except for Figure C [18F]FAZA n=12. Data are means ± SEM. SUVmax=maximum standard uptake value; TBR=tumor-to-blood ratio; TMR=tumor-to-muscle ratio.

Comparative study of hypoxia PET tracers 61
RESULTS
PET/CT imaging was performed to assess tracer accumulation over time for the 4 different tracers, using a dynamic imaging schedule (Figure 3.1A, B). Each tracer had a different accumulation pattern within the tumor, represented by maximum (SUVmax Figure 3.2A) and mean (SUVmean Figure S3.1A) standardized uptake values, whereas blood and muscle tracer uptake exhibited a similar pattern. Due to clearance of the nonspecific binding and specific trapping in hypoxic tumor regions, all TBRs were greater than 1 (Figure 3.2B and Figure S3.1B). Furthermore, clearance rates for heart and muscle were comparable, giving a muscle to blood ratio around unity (Figure S3.1D). For the metabolic tracer [18F]FDG, the maximal TBR of 2.4±0.3 was reached at 2 hours p.i. Of all the hypoxia tracers, [18F]FAZA was the first to reach a plateau phase for TBR at 2 hours p.i. (4.0±0.5), followed by [18F]HX4 (TBR 7.2±0.7) at 3 hours p.i. (Figure 3.2B). TBR for [18F]FMISO kept increasing; TBR of [18F]FMISO at 6 hours p.i. was comparable to that of [18F]HX4 at 3 hours p.i. At the first stable time point for [18F]HX4 (3 hours p.i.), this tracer had a significantly higher TBR than either [18F]FAZA (P=0.0154) or [18F]FMISO (P<0.0001) (Figure 3.2B right panel) even at 2 hours p.i. [18F]HX4 had already reached a TBR that was equal to or higher than that of [18F]FMISO or [18F]FAZA. When muscle tissue was used as tissue reference, trends were shown for the hypoxia tracers that were similar to maximal TBR (Figure 3.2C and Figure S3.1C). Uptake images from 2, 3, 4 and 5 hours p.i. were compared to the 6 hours p.i. scan to perform a voxel-to-voxel comparison of the absolute tumor uptake. A correlation coeffi-cient was calculated from the 2 scans (see Figure 3.3A). Averaged correlation coefficients demonstrated a stable uptake pattern in the tumor for all investigated tracers over short time periods (up to 6 hours) (Figure 3.3B). Reproducibility was studied by comparing 2 PET scans acquired within a 48 hour time interval using voxel-to-voxel analyses. Calculated correlation coefficients were high for [18F]FDG (0.87), [18F]FMISO (0.86) and [18F]HX4 (0.76); whereas [18F]FAZA had a significantly (P<0.05) lower correlation coefficient (0.52) (Figure 3.3C). To further investigate spatial reproducibility, we calculated an overall DICE similarity coefficient in which the high uptake region as a percentage of the total tumor volume from the first scan was compared to the same percentage of total volume area from a second scan (Figure 3.3D). This analysis showed a high reproducibility for [18F]FDG (0.83), [18F]FMISO (0.85), [18F]HX4 (0.79) and [18F]FAZA (0.71) in a comparison of the 50% tumor volume with the highest tracer uptake. However, when only the 10% highest uptake of the tumor volume was selected, [18F]FDG, [18F]FMISO and [18F]HX4 showed high spatial reproducibility (0.65, 0.59 and 0.49, respectively), whereas [18F]FAZA showed a significant lower (p<0.05) spatial reproducibility of 0.14 (Figure 3.3E).
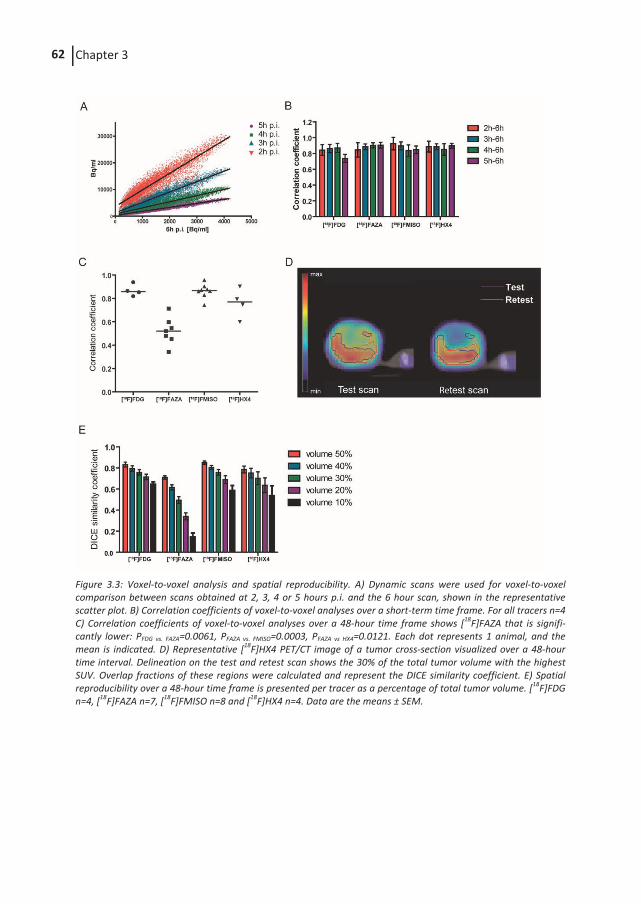
Chapter 3 62
Figure 3.3: Voxel-to-voxel analysis and spatial reproducibility. A) Dynamic scans were used for voxel-to-voxel comparison between scans obtained at 2, 3, 4 or 5 hours p.i. and the 6 hour scan, shown in the representative scatter plot. B) Correlation coefficients of voxel-to-voxel analyses over a short-term time frame. For all tracers n=4 C) Correlation coefficients of voxel-to-voxel analyses over a 48-hour time frame shows [18F]FAZA that is signifi-cantly lower: PFDG vs. FAZA=0.0061, PFAZA vs. FMISO=0.0003, PFAZA vs HX4=0.0121. Each dot represents 1 animal, and the mean is indicated. D) Representative [18F]HX4 PET/CT image of a tumor cross-section visualized over a 48-hour time interval. Delineation on the test and retest scan shows the 30% of the total tumor volume with the highest SUV. Overlap fractions of these regions were calculated and represent the DICE similarity coefficient. E) Spatial reproducibility over a 48-hour time frame is presented per tracer as a percentage of total tumor volume. [18F]FDG n=4, [18F]FAZA n=7, [18F]FMISO n=8 and [18F]HX4 n=4. Data are the means ± SEM.
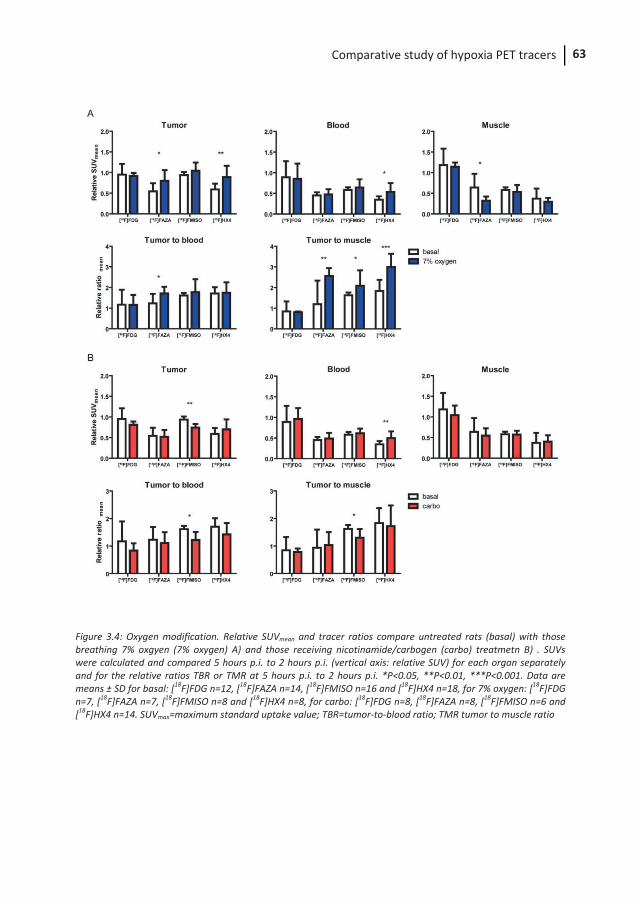
Comparative study of hypoxia PET tracers 63
Figure 3.4: Oxygen modification. Relative SUVmean and tracer ratios compare untreated rats (basal) with those breathing 7% oxgyen (7% oxygen) A) and those receiving nicotinamide/carbogen (carbo) treatmetn B) . SUVs were calculated and compared 5 hours p.i. to 2 hours p.i. (vertical axis: relative SUV) for each organ separately and for the relative ratios TBR or TMR at 5 hours p.i. to 2 hours p.i. *P<0.05, **P<0.01, ***P<0.001. Data are means ± SD for basal: [18F]FDG n=12, [18F]FAZA n=14, [18F]FMISO n=16 and [18F]HX4 n=18, for 7% oxygen: [18F]FDG n=7, [18F]FAZA n=7, [18F]FMISO n=8 and [18F]HX4 n=8, for carbo: [18F]FDG n=8, [18F]FAZA n=8, [18F]FMISO n=6 and [18F]HX4 n=14. SUVmax=maximum standard uptake value; TBR=tumor-to-blood ratio; TMR tumor to muscle ratio
Chapter 3 64
Rats were exposed to 7% oxygen breathing (Figure 3.1B), mimicking acute hypoxia. The relative SUVmean tracer uptake after 7% oxygen treatment was significantly increased for [18F]HX4 (P<0.01) and [18F]FAZA (P<0.05) in the tumor, compared to that in the untreated animals (Figure 3.4A). The mean TBR for [18F]FAZA was significantly increased (P<0.05); the mean TMR showed a significant increase for all 3 hypoxia tracers ([18F]FAZA P<0.01, [18F]FMISO P<0.05 and [18F]HX4 P<0.01) (Figure 3.4A). When the effect of maximal tumor uptake on increased hypoxia was studied, no significant effects were observed, although there was a trend towards increased uptake of [18F]HX4 in the tumor (Figure S3.2A). The reversibility of tracer uptake on tumor reoxygenation was examined by treating the rats with nicotinamide and carbogen (Fig 3.1B). Relative SUVmean (Figure S3.1A) indicated that [18F]FMISO remained stable over time in the baseline situation, whereas for other tracers decreased. Influencing tumors towards a more oxygenated state only caused a decrease in [18F]FMISO tumor uptake and did not change uptake of [18F]HX4 and [18F]FAZA(Fig 3.4B). Blood uptake values increased for [18F]HX4, but uptake in the muscle was not influenced. Mean TBR and TMR significantly decreased for [18F]FMISO and maxi-mal values demonstrated comparable results (Figure S3.2B).
DISCUSSION
This study compares the frequently used hypoxia PET tracers [18F]FMISO, [18F]FAZA, [18F]HX4 and the metabolic tracer [18F]FDG in an animal tumor model to assess their tumor-to-background ratios, spatial reproducibility and sensitivity to oxygen modification. The rat rhabdomyosarcoma R1 model with a large hypoxic fraction (18) was chosen to ensure sufficient visualization of the uptake of hypoxia tracers using a preclinical model on a clinical PET/CT scanner. Although some variation in tumor volume was seen, the hypoxic fraction was shown to be stable within this tumor model (18). PET acquisition was per-formed from the time of injection untill 6 hours p.i. to determine the optimal uptake in the tumor and highest TBR. In this study, we found the most optimal TBR for [18F]FAZA at 2 hours p.i. This finding is consistent with clinical studies in head and neck squamous cell carcinoma and non-small cell lung cancer (NSCLC) where imaging at 4 hours p.i. did not improve the TBR compared to 2 hours p.i. (19-21). [18F]HX4 shows an optimal TBR at 3 hours p.i which was also observed in an NSCLC patient study where image contrast did improve from 2 to 4 hours p.i. (22). As clinically demonstrated, [18F]FMISO does not show plateau formation, and has better TBR at later time points (23) which was also observed in this preclinical study. Comparative studies already have indicated that [18F]HX4 imaging in head and neck cancer patients at 1.5 hours p.i. was found to have TMR properties similar to those of [18F]FMISO at 2 hours p.i. (24). This is also reflected in the biological half-life of the tracers, which is much higher in normal tissue for [18F]FMISO (clinical:12-13 hours (22), preclinical: 4.5 hours) than for [18F]HX4 (clinical: 4.3 hours (22), preclinical: 2.2 hours) or [18F]FAZA (preclinical: 2.8 hours). The findings from this preclinical study are in line with those from available clinical studies and although caution needs to be taken in extrapola-tion of the data, this might indicate that the results found here in this animal model can be translated to some extend to the clinical setting.
Comparative study of hypoxia PET tracers 65
One disparity between clinical and preclinical studies is the use of anesthetic drugs. In this study pentobarbital was used, and although it was shown that this causes a reduction in the radioactivity in blood and muscle, it did not influence tracer uptake in the tumor, nor did it lead to a significant change in tumor-to-background ratios (25). The ultimate goal of tumor hypoxia imaging is to improve treatment outcome either by detecting hypoxia to aid in the decision to add specific anti-hypoxia drugs or by adapting radiation therapy using image guidance. Considering that hypoxia imaging can be used to generate personalized intensity modulated radiation therapy plans in which these radia-tion-resistant parts of the tumor can be boosted (26, 27), it would be desirable to have a tracer that shows stable uptake over time so that a single scan could be used for several days of treatment. Voxel-to-voxel analyses resulted in high reproducibility for all tracers within a 6-hour scan. Examining spatial reproducibility by comparing a high uptake region revealed good overlap between 2 consecutive scans 48h apart for [18F]FMISO, [18F]HX4 and [18F]FDG. For [18F]FMISO this was also reported in a recent clinical head and neck patient study in which 2 scans were highly reproducible over 48 hours (28). However, voxel-to-voxel analysis of [18F]FMISO uptake over a 3-day interval found a correlation of the hypoxic distribution in less than 50% of the head and neck cancer patients (29). [18F]FMISO in the same patient population and during chemoradiotherapy showed a stable conformation of the hypoxic subvolumes (30). Our data show that reproducibility of [18F]FAZA is poor after 48 hours, even without additional anticancer treatment. This is surprising given the fact that all investigated hypoxia tracers are based on the same nitroimidazole trapping mechanism. Contradictions in [18F]FAZA reproducibility are ob-served between different preclinical and clinical studies, which might also be caused by the differences in metabolism among organisms. Preclinical micro-PET analysis on [18F]FAZA uptake showed voxel-to-voxel reproducibility between 2 baseline scans 24 hours apart; even after fractionated radiation therapy, a fairly stable intratumoral tracer distri-bution was observed (31). However, in a clinical trial, [18F]FAZA uptake was evaluated after several rounds of radiation therapy treatment and hypoxic regions were found not to be in the same location (19). Although [18F]HX4 shows good reproducibility in first clinical experiments (22), the stability of [18F]HX4 in detecting the hypoxic fraction during therapy needs to be further assessed. Uptake of [18F]FDG was clearly distinguishable from back-ground and was highly reproducible, demonstrating the outstanding application of [18F]FDG in the detection of tumors. However, we consider [18F]FDG to be a metabolic tracer rather that a marker for hypoxia. Because tumor hypoxia is a dynamic process that consists of both chronic and acute hypoxia, a tumor’s oxygen status changes continuously, and most hypoxia tracers mainly detect the chronic hypoxic fraction. However, there are suggestions that acute hypoxia also plays a prominent role in determining the treatment outcome (32). Changing a tumor’s oxygen status by clamping or reduced oxygen breathing mimics this dynamic process and gives the opportunity to study the behavior of tracer uptake under these conditions. In the ideal situation, one would wish a hypoxia tracer to rapidly and specifical-ly accumulate in the hypoxic regions with fast clearance in the nonhypoxic tissues. Binding of the tracer would be irreversible, and no circulating free available tracer would be present.
Chapter 3 66
Previous studies have shown that a treatment combining nicotinamide and carbogen increases a tumor’s oxygen status (9, 33), whereas 7% oxygen breathing increases the hypoxic fraction (9). In this study, the oxygen modification was applied only 2.5 hours after tracer injection. Increasing the hypoxic fraction during tracer accumulation is dependent on the presence of unbound, circulating tracer. For all hypoxia tracers, circulating tracer was present after 3 hours, based on the measured activity in the blood (SUV of 2.4 for [18F]FDG; 0.3 for [18F]FAZA; 0.8 for [18F]FMISO, and 0.3 for [18F]HX4) however only [18F]FAZA and [18F]HX4 showed increased uptake in the tumor after 7% oxygen breathing. This effect was observed mainly in the mean values rather than in the maximum values, indicating that the tumor’s overall oxygenation was altered, whereas the maximum value is determined by the severe hypoxic regions that will be less affected by this treatment. Exposure to high oxygen concentrations at 2.5 hours after tracer injection would prevent further accumulation or reverse tracer binding. For [18F]FAZA, preclinical data are available that show reduced uptake after pure oxygen or carbogen breathing in tumor bearing mice (8, 34). In our experimental setting only [18F]FMISO showed a lower uptake upon reduced hypoxia. Together with the results of constant accumulation of [18F]FMISO in the tumor over time these data suggest that further accumulation is prevented when reducing the hypoxic fraction. Previous studies observed that [18F]FMISO uptake in squamous cell carcinoma bearing mice was influenced by the altered breathing condition (35). These experiments challenged the tracers to their limits and tried to mimic the changing oxygen concentrations in a tumor. It must be kept in mind that these results are influenced by tumor and animal model chosen and that the tracer metabolism is different in patients. Furthermore, exposing animals to modified oxygen concentration will introduce changes to the whole organism that might influence the distribution and metabolism of the tracer. Our data suggest that [18F]HX4 and [18F]FAZA are more sensitive to acute hypoxia while [18F]FMISO uptake is influenced by reoxygenation.
CONCLUSIONS
In conclusion, all investigated tracers showed different characteristics. The ultimate hypoxia tracer has not been developed, but this and other studies show that hypoxia imaging using the existing tracers gives extra information that can be very useful in the treatment of cancer patients.
Comparative study of hypoxia PET tracers 67
ACKNOWLEDGEMENTS
We acknowledge financial support from the Center for Translational Molecular Medicine framework 030-103 (AIR FORCE), European Union seventh framework programmes (METOXIA grant agreement no: 222741 and ARTFORCE grant agreement no: 257144) and the Kankeronderzoekfonds Limburg from the Health Foundation Limburg.
CONFLICTS OF INTEREST
The authors declare that they have no conflict of interest.
Chapter 3 68
SUPPLEMENTARY DATA
Supplementary Materials and Methods
Images were acquired using a clinical PET/CT scanner (Siemens Biograph 40, Siemens Healthcare) with an axial field of view (FoV) of 162 mm, a transaxial FoV of 605 mm and a spatial resolution of 5.3 mm FWHM at the center of the FoV. The PET data were attenua-tion corrected using the acquired CT images. Also, correction for scatter (3D), randoms, dead time and decay of injected radionuclides was applied. First a topogram was acquired followed by a whole body CT scan using a 1mm reconstructed slice thickness and a pitch of 0.8. For PET imaging an emission scan in list mode (LM) in one bed position was started simultaneously with tracer injection. LM data were rebinned using Fourier rebinning, and PET images were reconstructed for dynamic 60 minute imaging as 8x15 sec, 4x30 sec, 2x1 minute, 2x2 minutes and 10x5 minutes. The reconstructed voxel size was 3.04 mm in all dimensions. Every hour a similar scan was performed till 6 hours p.i. using a 20 minute emission scan, reconstructed as 4x5 minutes. Reconstructed PET/CT images were analyzed in dedicated software (TrueD VC60; Sie-mens). Manual delineation of the volume of interest (VOI) was performed on the com-bined PET/CT image to obtain activity values (Bq/ml) for the tumor, muscle of the hind leg and blood pool (heart). After correcting the activity data for decay, data were quantified by calculating the SUV (activity in VOI / (injected dose/weight of animal)). SUVmax indicates the averaged maximum SUV inside the VOI, SUVmean is the averaged mean activity in the VOI. Tumor-to-blood ratios (TBR) and tumor-to-muscle (TMR) ratios were calculated (SUV tumor / SUV blood or muscle, respectively) using either mean or maximal values for both VOIs. Non-rigid registration of the tumor was performed using in house developed registration software (36). The tumor contours were non-rigidly registered using an intensity based registration method (Morphons, 10 iterations, 8 resolution scales). A weighted sum accumulation of the deformation field was performed with a Gaussian regularization filter of 1.5 times the voxel size. The resulting deformation field was applied to the CT and the PET image of the rat. Next, the 50% of the total tumor volume with the highest SUV was defined, and the overlapping volume was calculated between the two scans. This was repeated on 40, 30, 20 and 10% of the total tumor volume.
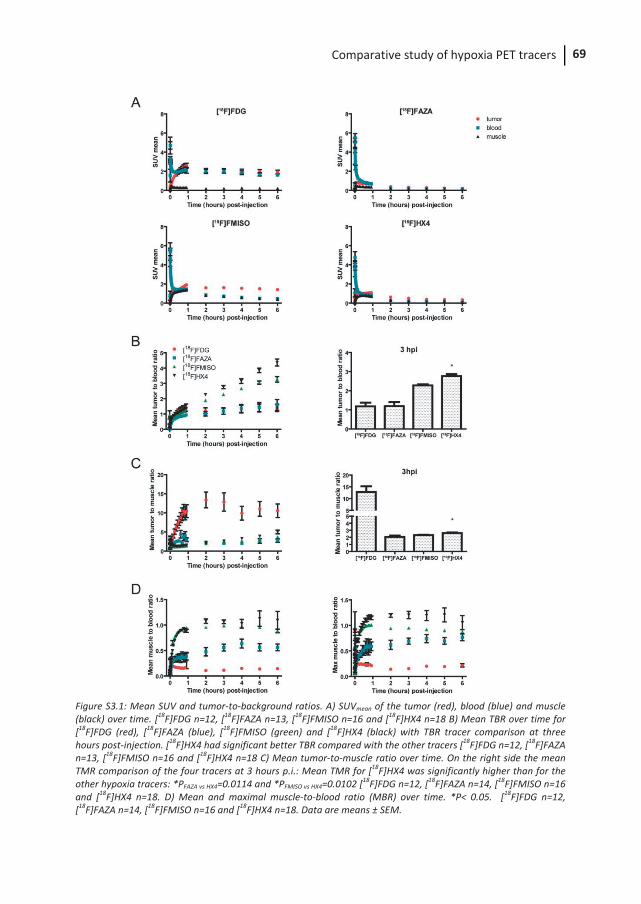
Comparative study of hypoxia PET tracers 69
Figure S3.1: Mean SUV and tumor-to-background ratios. A) SUVmean of the tumor (red), blood (blue) and muscle (black) over time. [18F]FDG n=12, [18F]FAZA n=13, [18F]FMISO n=16 and [18F]HX4 n=18 B) Mean TBR over time for [18F]FDG (red), [18F]FAZA (blue), [18F]FMISO (green) and [18F]HX4 (black) with TBR tracer comparison at three hours post-injection. [18F]HX4 had significant better TBR compared with the other tracers [18F]FDG n=12, [18F]FAZA n=13, [18F]FMISO n=16 and [18F]HX4 n=18 C) Mean tumor-to-muscle ratio over time. On the right side the mean TMR comparison of the four tracers at 3 hours p.i.: Mean TMR for [18F]HX4 was significantly higher than for the other hypoxia tracers: *PFAZA vs HX4=0.0114 and *PFMISO vs HX4=0.0102 [18F]FDG n=12, [18F]FAZA n=14, [18F]FMISO n=16 and [18F]HX4 n=18. D) Mean and maximal muscle-to-blood ratio (MBR) over time. *P< 0.05. [18F]FDG n=12, [18F]FAZA n=14, [18F]FMISO n=16 and [18F]HX4 n=18. Data are means ± SEM.

Chapter 3 70
Figure S3.2: Oxygen modification. Relative SUVmax or tracer ratios comparing untreated rats (basal) with A) 7% oxygen breathing (7% oxygen) or B) nicotinamide/carbogen (carbo) treated rats. SUV’s are calculated and represented as 5 hours p.i. relative to 2 hours p.i. for each organ separately or for the calculated TBR or TMR. *P<0.05, **P<0.01. Data are means ± SD for basal: [18F]FDG n=12, [18F]FAZA n=14, [18F]FMISO n=16 and [18F]HX4 n=18, for 7% oxygen: [18F]FDG n=7, [18F]FAZA n=7, [18F]FMISO n=8 and [18F]HX4 n=8, for carbo: [18F]FDG n=8, [18F]FAZA n=8, [18F]FMISO n=6 and [18F]HX4 n=14 .
Comparative study of hypoxia PET tracers 71
REFERENCES
1. Hammond EM, Asselin MC, Forster D, O'Connor JP, Senra JM, Williams KJ. The meaning, measurement and modification of hypoxia in the laboratory and the clinic. Clin Oncol (R Coll Radiol). 2014;26:277-88.
2. Horsman MR, Mortensen LS, Petersen JB, Busk M, Overgaard J. Imaging hypoxia to improve radiotherapy outcome. Nat Rev Clin Oncol. 2012;9:674-87.
3. Brown JM, Giaccia AJ. The unique physiology of solid tumors: opportunities (and problems) for cancer therapy. Cancer Res. 1998;58:1408-16.
4. Krohn KA, Link JM, Mason RP. Molecular imaging of hypoxia. J Nucl Med. 2008;49 Suppl 2:129S-48S.
5. Dubois L, Landuyt W, Cloetens L, Bol A, Bormans G, Haustermans K, et al. [18F]EF3 is not superior to [18F]FMISO for PET-based hypoxia evaluation as measured in a rat rhabdomyosarcoma tumour model. Eur J Nucl Med Mol Imaging. 2009;36:209-18.
6. Gronroos T, Bentzen L, Marjamaki P, Murata R, Horsman MR, Keiding S, et al. Comparison of the biodistribution of two hypoxia markers [18F]FETNIM and [18F]FMISO in an experimental mammary carcinoma. Eur J Nucl Med Mol Imaging. 2004;31:513-20.
7. Mahy P, De Bast M, de Groot T, Cheguillaume A, Gillart J, Haustermans K, et al. Comparative pharmacokinetics, biodistribution, metabolism and hypoxia-dependent uptake of [18F]-EF3 and [18F]-MISO in rodent tumor models. Radiother Oncol. 2008;89:353-60.
8. Reischl G, Dorow DS, Cullinane C, Katsifis A, Roselt P, Binns D, et al. Imaging of tumor hypoxia with [124I]IAZA in comparison with [18F]FMISO and [18F]FAZA--first small animal PET results. J Pharm Pharm Sci. 2007;10:203-11.
9. Dubois LJ, Lieuwes NG, Janssen MH, Peeters WJ, Windhorst AD, Walsh JC, et al. Preclinical evaluation and validation of [18F]HX4, a promising hypoxia marker for PET imaging. Proc Natl Acad Sci U S A. 2011;108:14620-5.
10. Carlin S, Zhang H, Reese M, Ramos NN, Chen Q, Ricketts SA. A comparison of the imaging characteristics and microregional distribution of 4 hypoxia PET tracers. Journal of nuclear medicine: official publication, Society of Nuclear Medicine. 2014;55:515-21.
11. Eschmann SM, Paulsen F, Reimold M, Dittmann H, Welz S, Reischl G, et al. Prognostic impact of hypoxia imaging with 18F-misonidazole PET in non-small cell lung cancer and head and neck cancer before radiotherapy. J Nucl Med. 2005;46:253-60.
12. Mortensen LS, Johansen J, Kallehauge J, Primdahl H, Busk M, Lassen P, et al. FAZA PET/CT hypoxia imaging in patients with squamous cell carcinoma of the head and neck treated with radiotherapy: results from the DAHANCA 24 trial. Radiother Oncol. 2012;105:14-20.
13. van Loon J, Janssen MH, Ollers M, Aerts HJ, Dubois L, Hochstenbag M, et al. PET imaging of hypoxia using [18F]HX4: a phase I trial. Eur J Nucl Med Mol Imaging. 2010;37:1663-8.
14. Doss M, Zhang JJ, Belanger MJ, Stubbs JB, Hostetler ED, Alpaugh K, et al. Biodistribution and radiation dosimetry of the hypoxia marker 18F-HX4 in monkeys
Chapter 3 72
and humans determined by using whole-body PET/CT. Nucl Med Commun. 2010; 31:1016-24.
15. Lim JL, Berridge MS. An efficient radiosynthesis of [18F]fluoromisonidazole. Appl Radiat Isot. 1993;44:1085-91.
16. Reischl G, Ehrlichmann W, Bieg C, Solbach C, Kumar P, Wiebe LI, et al. Preparation of the hypoxia imaging PET tracer [18F]FAZA: reaction parameters and automation. Appl Radiat Isot. 2005;62:897-901.
17. Walsh JC, Kolb HC. Applications of click chemistry in radiopharmaceutical development. Chimia (Aarau). 2010;64:29-33.
18. Dubois L, Landuyt W, Haustermans K, Dupont P, Bormans G, Vermaelen P, et al. Evaluation of hypoxia in an experimental rat tumour model by [(18)F]fluoro-misonidazole PET and immunohistochemistry. Br J Cancer. 2004;91:1947-54.
19. Servagi-Vernat S, Differding S, Hanin FX, Labar D, Bol A, Lee JA, et al. A prospective clinical study of F-FAZA PET-CT hypoxia imaging in head and neck squamous cell carcinoma before and during radiation therapy. European journal of nuclear medicine and molecular imaging. 2014.
20. Souvatzoglou M, Grosu AL, Roper B, Krause BJ, Beck R, Reischl G, et al. Tumour hypoxia imaging with [18F]FAZA PET in head and neck cancer patients: a pilot study. European journal of nuclear medicine and molecular imaging. 2007;34:1566-75.
21. Trinkaus ME, Blum R, Rischin D, Callahan J, Bressel M, Segard T, et al. Imaging of hypoxia with 18F-FAZA PET in patients with locally advanced non-small cell lung cancer treated with definitive chemoradiotherapy. J Med Imaging Radiat Oncol. 2013;57:475-81.
22. Zegers CM, van Elmpt W, Wierts R, Reymen B, Sharifi H, Ollers MC, et al. Hypoxia imaging with [(1)(8)F]HX4 PET in NSCLC patients: defining optimal imaging parameters. Radiotherapy and oncology : journal of the European Society for Therapeutic Radiology and Oncology. 2013;109:58-64.
23. Abolmaali N, Haase R, Koch A, Zips D, Steinbach J, Baumann M, et al. Two or four hour [(1)(8)F]FMISO-PET in HNSCC. When is the contrast best? Nuklearmedizin. 2011;50:22-7.
24. Chen L, Zhang Z, Kolb HC, Walsh JC, Zhang J, Guan Y. (1)(8)F-HX4 hypoxia imaging with PET/CT in head and neck cancer: a comparison with (1)(8)F-FMISO. Nucl Med Commun. 2012;33:1096-102.
25. Christian N, Bol A, De Bast M, Labar D, Lee J, Mahy P, et al. Determination of tumour hypoxia with the PET tracer [18F]EF3: improvement of the tumour-to-background ratio in a mouse tumour model. Eur J Nucl Med Mol Imaging. 2007;34:1348-54.
26. Hendrickson K, Phillips M, Smith W, Peterson L, Krohn K, Rajendran J. Hypoxia imaging with [F-18] FMISO-PET in head and neck cancer: potential for guiding intensity modulated radiation therapy in overcoming hypoxia-induced treatment resistance. Radiother Oncol. 2011;101:369-75.
27. Thorwarth D, Eschmann SM, Paulsen F, Alber M. Hypoxia dose painting by numbers: a planning study. Int J Radiat Oncol Biol Phys. 2007;68:291-300.
28. Okamoto S, Shiga T, Yasuda K, Ito YM, Magota K, Kasai K, et al. High reproducibility of tumor hypoxia evaluated by 18F-fluoromisonidazole PET for head and neck cancer. J Nucl Med. 2013;54:201-7.
Comparative study of hypoxia PET tracers 73
29. Nehmeh SA, Lee NY, Schroder H, Squire O, Zanzonico PB, Erdi YE, et al. Reproducibility of intratumor distribution of (18)F-fluoromisonidazole in head and neck cancer. Int J Radiat Oncol Biol Phys. 2008;70:235-42.
30. Bittner MI, Wiedenmann N, Bucher S, Hentschel M, Mix M, Weber WA, et al. Exploratory geographical analysis of hypoxic subvolumes using 18F-MISO-PET imaging in patients with head and neck cancer in the course of primary chemoradiotherapy. Radiother Oncol. 2013;108:511-6.
31. Busk M, Mortensen LS, Nordsmark M, Overgaard J, Jakobsen S, Hansen KV, et al. PET hypoxia imaging with FAZA: reproducibility at baseline and during fractionated radiotherapy in tumour-bearing mice. Eur J Nucl Med Mol Imaging. 2013;40:186-97.
32. Brown M. Henry S. Kaplan Distinguished Scientist Award Lecture 2007. The remarkable yin and yang of tumour hypoxia. Int J Radiat Biol. 2010;86:907-17.
33. Horsman MR, Overgaard J. Preclinical studies on how to deal with patient intolerance to nicotinamide and carbogen. Radiother Oncol. 2004;70:301-9.
34. Piert M, Machulla HJ, Picchio M, Reischl G, Ziegler S, Kumar P, et al. Hypoxia-specific tumor imaging with 18F-fluoroazomycin arabinoside. J Nucl Med. 2005;46:106-13.
35. Matsumoto K, Szajek L, Krishna MC, Cook JA, Seidel J, Grimes K, et al. The influence of tumor oxygenation on hypoxia imaging in murine squamous cell carcinoma using [64Cu]Cu-ATSM or [18F]Fluoromisonidazole positron emission tomography. Int J Oncol. 2007;30:873-81.
36. Janssens G, de Xivry JO, Fekkes S, Dekker A, Macq B, Lambin P, et al. Evaluation of nonrigid registration models for interfraction dose accumulation in radiotherapy. Med Phys. 2009;36:4268-76.

CHAPTER
Repeatability of hypoxia PET imaging using [18F]HX4 in lung and head and neck cancer patients:
a prospective multicenter trial
Catharina M.L. Zegers, Wouter van Elmpt, Katrin Szardenings, Hartmuth Kolb, Alan Waxman, Rathan M. Subramaniam, Dae Hyuk Moon, Jacqueline C. Brunet-ti, Shyam M. Srinivas, Philippe Lambin, David Chien
Published in: Eur J Nucl Med Mol Imaging. 2015 42(12): 1840-9
Chapter 4 76
ABSTRACT
Purpose: Hypoxia is an important parameter influencing tumor progression and treatment efficacy. The aim of this study was to investigate the repeatability of hypoxia PET imaging with [18F]HX4 in patients with head and neck and lung cancer. Methods: Nine patients with lung cancer and ten with head and neck cancer were includ-ed in the analysis (NCT01075399). Two sequential pretreatment [18F]HX4 PET/CT scans were acquired within 1 week. The maximal and mean standardized uptake values (SUVmax
and SUVmean) were defined and the tumor-to-background ratios (TBR) were calculated. In addition, hypoxic volumes were determined as the volume of the tumor with a TBR>1.2 (HV1.2). Bland Altman analysis of the uptake parameters was performed and coefficients of repeatability were calculated. To evaluate the spatial repeatability of the uptake, the PET/CT images were registered and a voxel-wise comparison of the uptake was per-formed, providing a correlation coefficient. Results: All parameters of [18F]HX4 uptake were significantly correlated between scans: SUVmax (r=0.958, p<0.001), SUVmean (r=0.946, p<0.001), TBRmax (r=0.962, p<0.001) and HV1.2 (r=0.995, p<0.001). The relative coefficients of repeatability were 15% (SUVmean), 17% (SUVmax) and 17% (TBRmax). Voxel-wise analysis of the spatial uptake pattern within the tumors provided an average correlation of 0.65±0.14. Conclusions: Repeated hypoxia PET scans with [18F]HX4 provide reproducible and spatially stable results in patients with head and neck cancer and patients with lung cancer. [18F]HX4 PET imaging can be used to assess the hypoxic status of tumors and has the potential to aid hypoxia targeted treatments.
Repeatability of [18F]HX4 PET imaging 77
INTRODUCTION
[18F]HX4 is a new 2-nitroimidazole PET imaging agent for hypoxia, in which structure-activity relationships have been used to optimize pharmacokinetic and clearance proper-ties (1, 2). Tumor hypoxia is a condition where insufficiently vascularized tumor cells deprived of oxygen not only become more aggressive and malignant, but also more resistant to treatment by radiation and chemotherapy (3-5). The presence of hypoxia is therefore generally considered a poor prognostic disease marker in cancer patients (6). However, it is difficult to measure oxygen levels reproducibly and non-invasively in a highly heterogeneous tumor environment. Reliable diagnostic methods to detect and quantify tumor hypoxia are therefore needed. It has been hypothesized and currently being investigated that inclusion of hypoxic cell sensitizers during treatment, i.e., the delivery of higher radiotherapy doses to hypoxic regions (7) or the use of hypoxia-targeting therapy (8-11), might improve the outcome in patients with hypoxic tumors (12). [18F]HX4 has the potential to serve as a clinically useful diagnostic tool to aid the applica-tion of hypoxia targeting therapies to those patients who will most likely benefit from them (13, 14). This pilot phase 2 study was primarily designed as a test-retest study to investigate the repeatability of [18F]HX4 as a non-invasive PET imaging marker for detection of tumor hypoxia regions. Here we present the results in patients with lung cancer and patients with head and neck (H&N) cancer.
MATERIALS AND METHODS
Patients
This multicentered study (NCT01075399) was conducted in accordance with the ethical principles of Good Clinical Practice, according to the International Conference on Harmo-nization of Technical Requirements for Registration of Pharmaceuticals for Human Use (ICH). Both the FDA and the institutional review boards of the participating institutions approved the study protocol and the informed consent form. All participants reviewed and signed the informed consent form before study entry. [18F]HX4 PET/CT images were acquired of 19 patients: 9 with lung cancer and 10 with H&Ncancer. The patients under-went two sequential pre-treatment [18F]HX4 PET/CT scans within 1 week to assess repeat-ability. Patient characteristics are presented in Table 4.1.
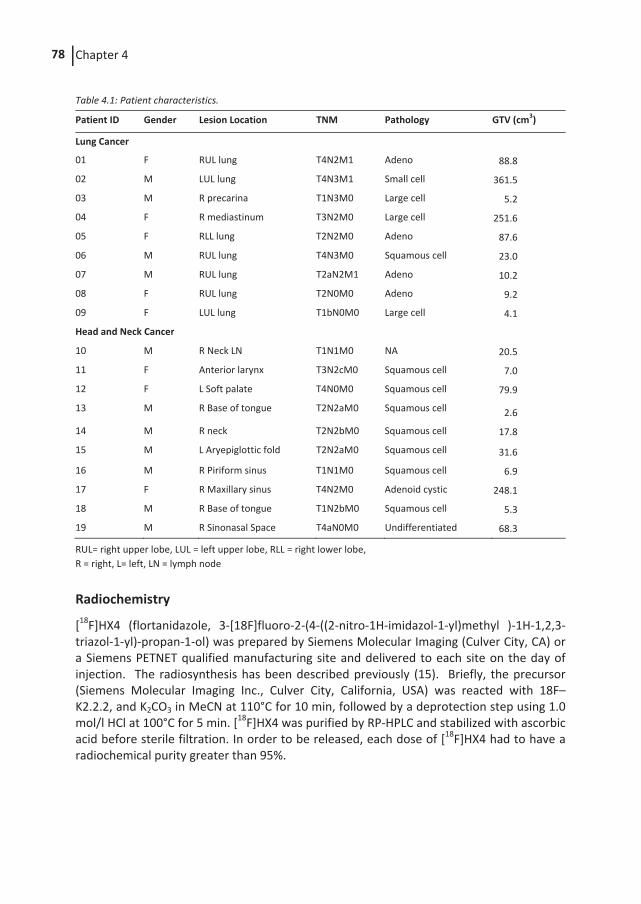
Chapter 4 78
Table 4.1: Patient characteristics.
Patient ID Gender Lesion Location TNM Pathology GTV (cm3)
Lung Cancer
01 F RUL lung T4N2M1 Adeno 88.8
02 M LUL lung T4N3M1 Small cell 361.5
03 M R precarina T1N3M0 Large cell 5.2
04 F R mediastinum T3N2M0 Large cell 251.6
05 F RLL lung T2N2M0 Adeno 87.6
06 M RUL lung T4N3M0 Squamous cell 23.0
07 M RUL lung T2aN2M1 Adeno 10.2
08 F RUL lung T2N0M0 Adeno 9.2
09 F LUL lung T1bN0M0 Large cell 4.1
Head and Neck Cancer
10 M R Neck LN T1N1M0 NA 20.5
11 F Anterior larynx T3N2cM0 Squamous cell 7.0
12 F L Soft palate T4N0M0 Squamous cell 79.9
13 M R Base of tongue T2N2aM0 Squamous cell 2.6
14 M R neck T2N2bM0 Squamous cell 17.8
15 M L Aryepiglottic fold T2N2aM0 Squamous cell 31.6
16 M R Piriform sinus T1N1M0 Squamous cell 6.9
17 F R Maxillary sinus T4N2M0 Adenoid cystic 248.1
18 M R Base of tongue T1N2bM0 Squamous cell 5.3
19 M R Sinonasal Space T4aN0M0 Undifferentiated 68.3
RUL= right upper lobe, LUL = left upper lobe, RLL = right lower lobe, R = right, L= left, LN = lymph node
Radiochemistry
[18F]HX4 (flortanidazole, 3-[18F]fluoro-2-(4-((2-nitro-1H-imidazol-1-yl)methyl )-1H-1,2,3-triazol-1-yl)-propan-1-ol) was prepared by Siemens Molecular Imaging (Culver City, CA) or a Siemens PETNET qualified manufacturing site and delivered to each site on the day of injection. The radiosynthesis has been described previously (15). Briefly, the precursor (Siemens Molecular Imaging Inc., Culver City, California, USA) was reacted with 18F–K2.2.2, and K2CO3 in MeCN at 110°C for 10 min, followed by a deprotection step using 1.0 mol/l HCl at 100°C for 5 min. [18F]HX4 was purified by RP-HPLC and stabilized with ascorbic acid before sterile filtration. In order to be released, each dose of [18F]HX4 had to have a radiochemical purity greater than 95%.
Repeatability of [18F]HX4 PET imaging 79
Scanners and technical parameters
[18F]HX4 PET/CT scans were performed using high-resolution full-ring PET/CT scanners, including a GE Discovery, GE Discovery LS, Philips Gemini, and a Siemens Biograph PET/CT scanner. Images were reconstructed using scanner-specific parameters in accordance to each facility’s standard procedure, including at least attenuation and scatter correction. Repeat scans were performed on the same PET/CT scanner, using the same protocol and patient positioning without respiratory gating.
[18F]HX4 PET/CT imaging
For each [18F]HX4 PET/CT scan, the patient received a single intravenous bolus injection of 368±48 MBq (range: 199 – 488 MBq) of [18F]HX4, followed by a saline flush. A static PET/CT scan was acquired with an acquisition time of 3 minutes (range 1.7 - 5 min) per bed position, after an uptake time of 99±10 minutes (range: 89-125 min). The average difference in uptake time between repeat PET scans was 6±7 min (range: 0-27min).
Image evaluation of [18F]HX4
[18F]HX4 PET/CT scans were analyzed using an Inveon Research Workplace (Edition 4.0.0.3, Siemens, Germany). Gross tumor volumes (GTV) of the primary lesion or largest lymph node were defined in centimeters cubed by manual contouring the tumor on the CT images by one observer (D.C.). These tumor delineations were applied to the PET images and the maximal and mean standardized uptake values (SUVmax, SUVmean) were measured in grams per milliliter. Under the assumption of water density, the SUV is reported as unitless. For each patient, the reference tissue was defined by contouring a volume of interest (VOI; sphere with a radius of 25 mm) in a large (thigh) muscle on the CT image. From this muscle VOI the SUVmean (M) was determined. Tumor to background ratios (TBR) were calculated by dividing Tumor SUVmax and SUVmean by Muscle SUVmean (M) TBRmax = Tumor SUVmax / M
TBRmean = Tumor SUVmean / M
The hypoxic volume (HV; in centimeters cubed) of each tumor was defined as the [18F]HX4 tumor volume with a TBR > 1.2 (HV1.2) or TBR>1.4 (HV1.4) :
HV1.2 = Volume within GTV with TBR > 1.2 HV1.4 = Volume within GTV with TBR > 1.4
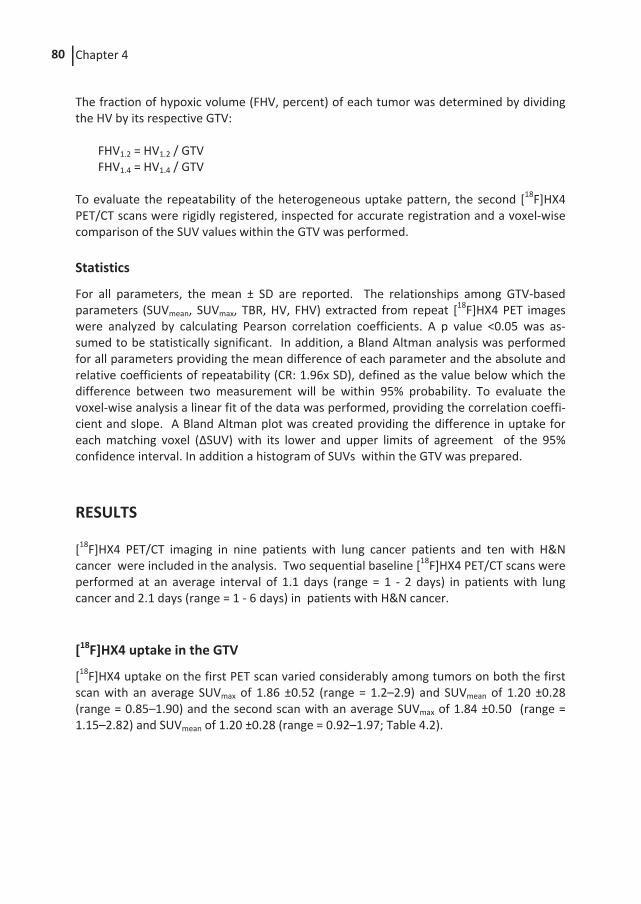
Chapter 4 80
The fraction of hypoxic volume (FHV, percent) of each tumor was determined by dividing the HV by its respective GTV:
FHV1.2 = HV1.2 / GTV FHV1.4 = HV1.4 / GTV
To evaluate the repeatability of the heterogeneous uptake pattern, the second [18F]HX4 PET/CT scans were rigidly registered, inspected for accurate registration and a voxel-wise comparison of the SUV values within the GTV was performed.
Statistics
For all parameters, the mean ± SD are reported. The relationships among GTV-based parameters (SUVmean, SUVmax, TBR, HV, FHV) extracted from repeat [18F]HX4 PET images were analyzed by calculating Pearson correlation coefficients. A p value <0.05 was as-sumed to be statistically significant. In addition, a Bland Altman analysis was performed for all parameters providing the mean difference of each parameter and the absolute and relative coefficients of repeatability (CR: 1.96x SD), defined as the value below which the difference between two measurement will be within 95% probability. To evaluate the voxel-wise analysis a linear fit of the data was performed, providing the correlation coeffi-cient and slope. A Bland Altman plot was created providing the difference in uptake for each matching voxel (ΔSUV) with its lower and upper limits of agreement of the 95% confidence interval. In addition a histogram of SUVs within the GTV was prepared.
RESULTS
[18F]HX4 PET/CT imaging in nine patients with lung cancer patients and ten with H&N cancer were included in the analysis. Two sequential baseline [18F]HX4 PET/CT scans were performed at an average interval of 1.1 days (range = 1 - 2 days) in patients with lung cancer and 2.1 days (range = 1 - 6 days) in patients with H&N cancer.
[18F]HX4 uptake in the GTV
[18F]HX4 uptake on the first PET scan varied considerably among tumors on both the first scan with an average SUVmax of 1.86 ±0.52 (range = 1.2–2.9) and SUVmean of 1.20 ±0.28 (range = 0.85–1.90) and the second scan with an average SUVmax of 1.84 ±0.50 (range = 1.15–2.82) and SUVmean of 1.20 ±0.28 (range = 0.92–1.97; Table 4.2).

Repeatability of [18F]HX4 PET imaging 81
Table 4.2: Repeatability of the [18F]HX4 uptake and hypoxic tumor volume (HV) and fraction (FHV) using a threshold of 1.2 times background
SUVmean SUVmax TBRmax HV1.2 [cm3] FHV1.2 [%]
ID Scan1 Scan2 Scan1 Scan2 Scan1 Scan2 Scan1 Scan2 Scan1 Scan2
Lung Cancer
01 1.20 1.09 2.15 2.21 1.72 1.87 14.01 11.15 15.78 11.33
02 1.38 1.49 2.87 2.74 2.40 2.10 147.30 148.30 40.76 38.55
03 1.17 1.19 1.47 1.60 1.20 1.27 0.06 0.26 1.23 9.30
04 1.90 1.97 2.93 2.82 2.03 1.94 177.60 203.30 70.62 74.95
05 1.16 1.10 1.68 1.67 1.50 1.66 18.82 18.50 21.48 36.04
06 0.89 0.90 1.46 1.55 1.49 1.62 2.49 1.80 10.85 9.52
07 0.94 1.03 1.57 1.64 1.47 1.51 0.45 1.45 4.41 9.67
08 1.36 1.51 1.98 2.25 1.64 1.75 3.58 4.58 38.85 47.92
09 1.19 1.07 1.63 1.47 1.17 1.16 0.00 0.00 0.00 0.00
Mean± SD
1.24± 0.29
1.26± 0.33
1.97± 0.57
1.99± 0.53
1.63± 0.39
1.65± 0.31
40.5± 69.9
43.3± 76.6
22.6± 23.4
26.4± 24.6
Head and Neck Cancer
10 0.91 0.92 1.25 1.29 1.04 1.01 0.00 0.00 0.00 0.00
11 0.89 0.99 1.23 1.31 1.04 1.08 0.00 0.00 0.00 0.00
12 1.85 1.72 2.52 2.39 1.32 1.27 3.90 1.54 4.89 2.02
13 1.09 0.97 1.30 1.15 1.17 1.09 0.00 0.00 0.00 0.00
14 1.15 0.99 1.71 1.37 1.42 1.28 0.90 0.13 5.04 0.67
15 1.17 1.12 1.72 1.80 1.44 1.69 3.65 5.57 11.56 20.57
16 0.98 1.05 1.77 1.96 1.79 2.08 1.01 2.03 14.55 33.83
17 1.23 1.17 2.48 2.33 3.35 3.15 211.20 203.70 85.14 80.03
18 1.15 1.18 1.49 1.39 1.36 1.23 0.60 0.27 11.33 5.11
19 1.26 1.28 2.12 2.05 1.96 1.99 28.73 41.24 42.07 57.56
Mean± SD
1.17± 0.27
1.14± 0.23
1.76± 0.48
1.70± 0.46
1.59± 0.69
1.59± 0.67
25.0± 66.0
25.5± 63.9
17.5± 26.9
20.0± 28.5
Mean± SD
1.20± 0.28
1.20± 0.28
1.86± 0.52
1.84± 0.50
1.61± 0.55
1.62± 0.52
32.3± 66.4
33.9± 68.8
19.9± 24.7
23.0± 26.2
The uptake parameters from the first and second scans were highly correlated: r = 0.958 for SUVmax (p < 0.001, Figure 4.1) and r = 0.946 for SUVmean (, p < 0.001, Figure S4.1) High correlations between scans were also seen within each subgroup of cancer patients: r = 0.972 for SUVmax ( p < 0.001) and r = 0.960 for SUVmean (p < 0.001) in those with lung cancer, and r = 0.945 for SUVmax (p < 0.001) and r = 0.952 for SUVmean (p < 0.001) in those with H&N cancer. In the Bland Altman analysis, SUVmax, showed a mean difference of 0.02 with an absolute CR of 0.29 and a repeatability percentage of 17% (Figure 4.1) and SUVmean showed a mean difference of 0.01 with an absolute CR of 0.18 and a repeatability per-centage of 15% .
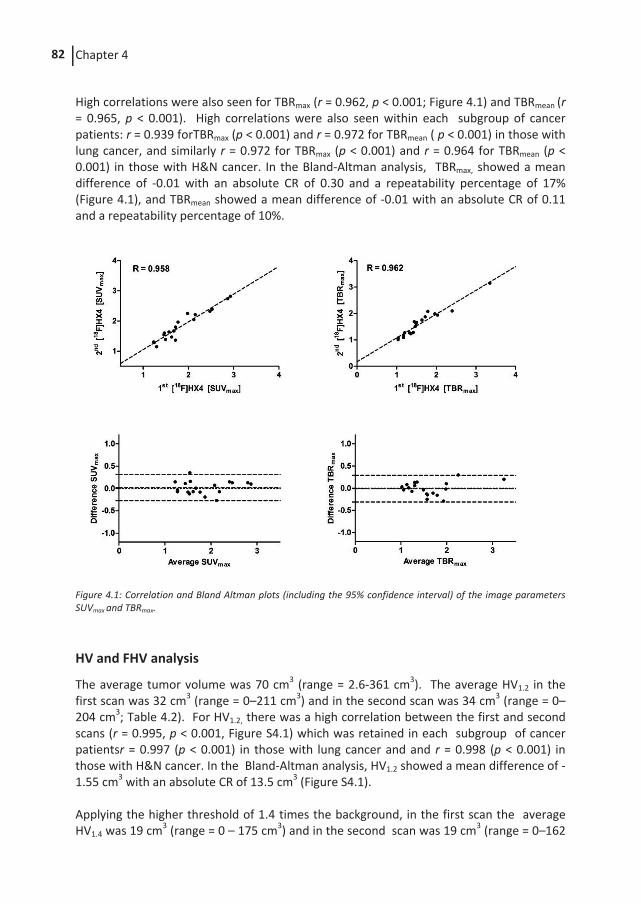
Chapter 4 82
High correlations were also seen for TBRmax (r = 0.962, p < 0.001; Figure 4.1) and TBRmean (r = 0.965, p < 0.001). High correlations were also seen within each subgroup of cancer patients: r = 0.939 forTBRmax (p < 0.001) and r = 0.972 for TBRmean ( p < 0.001) in those with lung cancer, and similarly r = 0.972 for TBRmax (p < 0.001) and r = 0.964 for TBRmean (p < 0.001) in those with H&N cancer. In the Bland-Altman analysis, TBRmax, showed a mean difference of -0.01 with an absolute CR of 0.30 and a repeatability percentage of 17% (Figure 4.1), and TBRmean showed a mean difference of -0.01 with an absolute CR of 0.11 and a repeatability percentage of 10%.
Figure 4.1: Correlation and Bland Altman plots (including the 95% confidence interval) of the image parameters SUVmax and TBRmax.
HV and FHV analysis
The average tumor volume was 70 cm3 (range = 2.6-361 cm3). The average HV1.2 in the first scan was 32 cm3 (range = 0–211 cm3) and in the second scan was 34 cm3 (range = 0–204 cm3; Table 4.2). For HV1.2, there was a high correlation between the first and second scans (r = 0.995, p < 0.001, Figure S4.1) which was retained in each subgroup of cancer patientsr = 0.997 (p < 0.001) in those with lung cancer and and r = 0.998 (p < 0.001) in those with H&N cancer. In the Bland-Altman analysis, HV1.2 showed a mean difference of -1.55 cm3 with an absolute CR of 13.5 cm3 (Figure S4.1). Applying the higher threshold of 1.4 times the background, in the first scan the average HV1.4 was 19 cm3 (range = 0 – 175 cm3) and in the second scan was 19 cm3 (range = 0–162
Repeatability of [18F]HX4 PET imaging 83
cm3; Table S4.1). For HV1.4,there was also a consistently high correlation between the first and second scans (r = 0.982, p < 0.001) which was retained in each subgroup of patients: r = 0.959 (p < 0.001) in those with lung cancer. and r = 0.999 (p < 0.001) in those with H&N cancer . In the Bland-Altman analysis, HV1,4 showed a mean difference of 0.08 cm3 with a confidence interval from -17.2 to 17.4 cm3. There was a wide range of FHV1.2 due to varying levels of hypoxia among the tumors. In the first scan the average FHV1.2 was20 ±25% (range = 0 – 85%) and in the second scan the average FHV1.2 was 23 ±26% (range = 0 – 80%; Table 4.2). This was also seen when the higher threshold of 1.4 times the background was applied: in the first scan the average FHV1.4 was 9±18% (range 0 -71%) and in the second scan the average FHV1.4 was 10 ±17% (range: 0 - 63%; Table S4.1). For FHV1.2 there was a high correlation between the first and second scans (r = 0.957, p < 0.001) whih was retained in each subgroup of cancer patients r = 0.966 (p < 0.001) in those withlung cancer and r = 0.950 (p < 0.001)in those with H&N cancer. For FHV1.4 there was also a high correlation between the first and second scans (r = 0.975, p < 0.001), which was retained in each subgroup of cancer patients r = 0.963 (p < 0.001) in those with lung cancer and r = 0.985(p < 0.001) in those with H&N cancer. In the Bland-Altman analysis, FHV1.2 showed a mean difference of -3.1% with an absolute CR of 14.9%, and FHV1.4. showed a mean difference of -0.9% and an absolute CR of 7.8%. Using 1.2 times the background as the threshold to determine FHV, 79% of the tumors (15/19) were found to have some level of hypoxia but when the higher threshold of 1.4 times the background was applied to determine the FHV, only 47% of the tumors (9/19) were characterized as having tumor hypoxia.
Repeatability of the spatial uptake pattern
An example of voxel-wise image analysis in a patient with head and neck cancer (patient 12) is shown in Figure 4.2. Comparison of the heterogeneous uptake within the GTV between the first and second [18F]HX4 PET scan showed a moderate to strong correlation in the majority of patients, with an average correlation coefficient of 0.65±0.14. There were two exceptions (Patient 14 and 16) in whom a poor correlation was observed (R = 0.38 and 0.39). The average slope and intercept of the linear fit of the data were 0.56±0.17 and 0.47±0.19, respectively. The Bland-Altman analysis showed an average ΔSUV of 0.02±0.06, with a lower and upper limit of agreement of 0.15 ± 0.09 and 0.19±0.08. Examples of voxel-wise image analysis in patients with lung cancer (patient 1 and 4) are shown in Figure 4.3. In addition, the results for each patient are shown in Table 4.3.
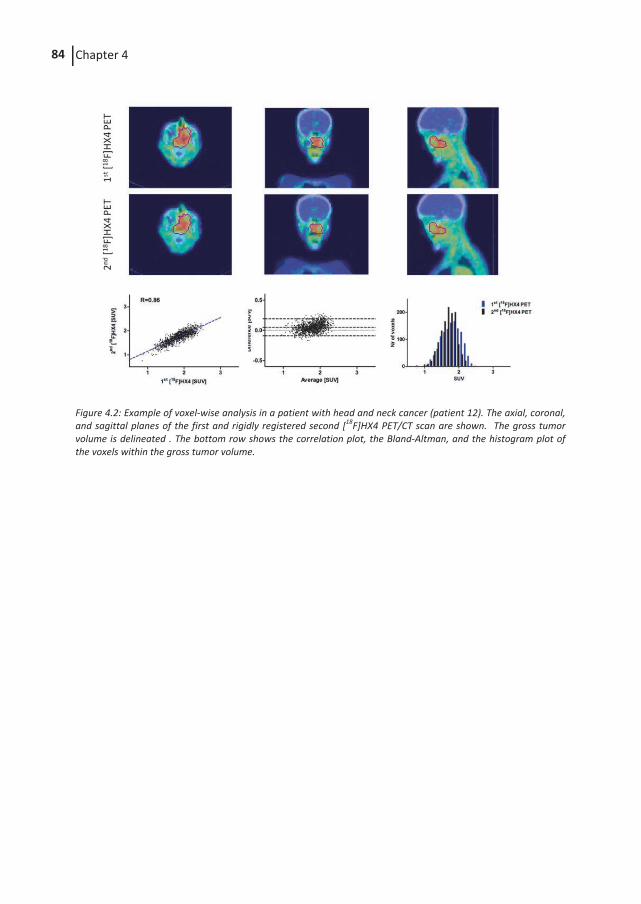
Chapter 4 84
Figure 4.2: Example of voxel-wise analysis in a patient with head and neck cancer (patient 12). The axial, coronal, and sagittal planes of the first and rigidly registered second [18F]HX4 PET/CT scan are shown. The gross tumor volume is delineated . The bottom row shows the correlation plot, the Bland-Altman, and the histogram plot of the voxels within the gross tumor volume.
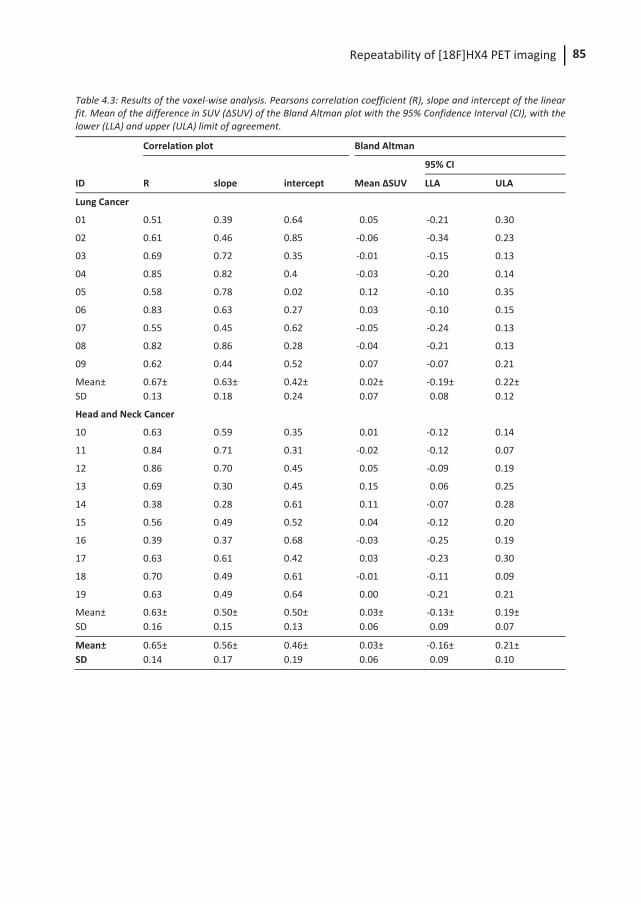
Repeatability of [18F]HX4 PET imaging 85
Table 4.3: Results of the voxel-wise analysis. Pearsons correlation coefficient (R), slope and intercept of the linear fit. Mean of the difference in SUV (ΔSUV) of the Bland Altman plot with the 95% Confidence Interval (CI), with the lower (LLA) and upper (ULA) limit of agreement.
Correlation plot Bland Altman
95% CI
ID R slope intercept Mean ΔSUV LLA ULA
Lung Cancer
01 0.51 0.39 0.64 0.05 -0.21 0.30
02 0.61 0.46 0.85 -0.06 -0.34 0.23
03 0.69 0.72 0.35 -0.01 -0.15 0.13
04 0.85 0.82 0.4 -0.03 -0.20 0.14
05 0.58 0.78 0.02 0.12 -0.10 0.35
06 0.83 0.63 0.27 0.03 -0.10 0.15
07 0.55 0.45 0.62 -0.05 -0.24 0.13
08 0.82 0.86 0.28 -0.04 -0.21 0.13
09 0.62 0.44 0.52 0.07 -0.07 0.21
Mean± SD
0.67± 0.13
0.63± 0.18
0.42± 0.24
0.02± 0.07
-0.19± 0.08
0.22± 0.12
Head and Neck Cancer
10 0.63 0.59 0.35 0.01 -0.12 0.14
11 0.84 0.71 0.31 -0.02 -0.12 0.07
12 0.86 0.70 0.45 0.05 -0.09 0.19
13 0.69 0.30 0.45 0.15 0.06 0.25
14 0.38 0.28 0.61 0.11 -0.07 0.28
15 0.56 0.49 0.52 0.04 -0.12 0.20
16 0.39 0.37 0.68 -0.03 -0.25 0.19
17 0.63 0.61 0.42 0.03 -0.23 0.30
18 0.70 0.49 0.61 -0.01 -0.11 0.09
19 0.63 0.49 0.64 0.00 -0.21 0.21
Mean± SD
0.63± 0.16
0.50± 0.15
0.50± 0.13
0.03± 0.06
-0.13± 0.09
0.19± 0.07
Mean± SD
0.65± 0.14
0.56± 0.17
0.46± 0.19
0.03± 0.06
-0.16± 0.09
0.21± 0.10
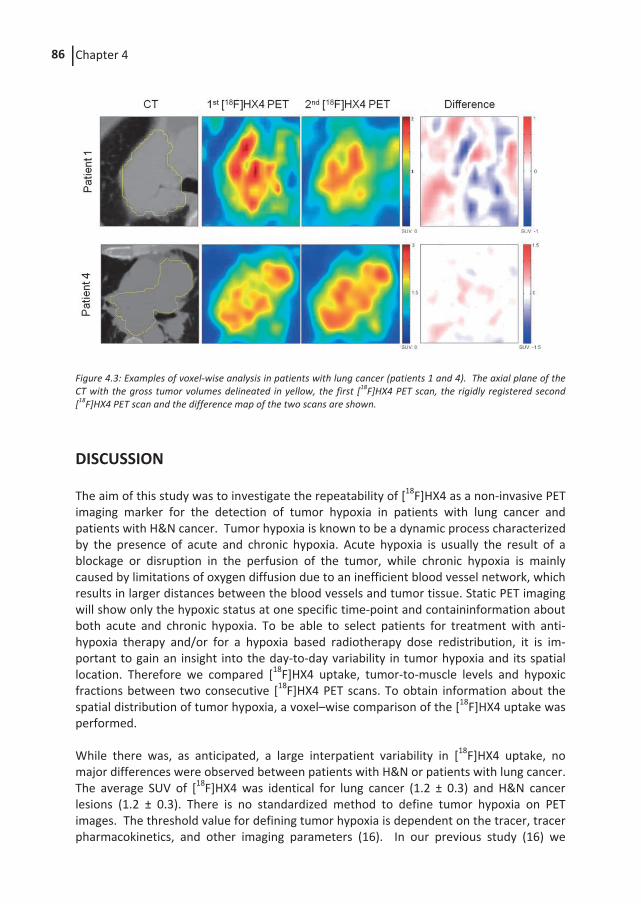
Chapter 4 86
Figure 4.3: Examples of voxel-wise analysis in patients with lung cancer (patients 1 and 4). The axial plane of the CT with the gross tumor volumes delineated in yellow, the first [18F]HX4 PET scan, the rigidly registered second [18F]HX4 PET scan and the difference map of the two scans are shown.
DISCUSSION
The aim of this study was to investigate the repeatability of [18F]HX4 as a non-invasive PET imaging marker for the detection of tumor hypoxia in patients with lung cancer and patients with H&N cancer. Tumor hypoxia is known to be a dynamic process characterized by the presence of acute and chronic hypoxia. Acute hypoxia is usually the result of a blockage or disruption in the perfusion of the tumor, while chronic hypoxia is mainly caused by limitations of oxygen diffusion due to an inefficient blood vessel network, which results in larger distances between the blood vessels and tumor tissue. Static PET imaging will show only the hypoxic status at one specific time-point and containinformation about both acute and chronic hypoxia. To be able to select patients for treatment with anti-hypoxia therapy and/or for a hypoxia based radiotherapy dose redistribution, it is im-portant to gain an insight into the day-to-day variability in tumor hypoxia and its spatial location. Therefore we compared [18F]HX4 uptake, tumor-to-muscle levels and hypoxic fractions between two consecutive [18F]HX4 PET scans. To obtain information about the spatial distribution of tumor hypoxia, a voxel–wise comparison of the [18F]HX4 uptake was performed. While there was, as anticipated, a large interpatient variability in [18F]HX4 uptake, no major differences were observed between patients with H&N or patients with lung cancer. The average SUV of [18F]HX4 was identical for lung cancer (1.2 ± 0.3) and H&N cancer lesions (1.2 ± 0.3). There is no standardized method to define tumor hypoxia on PET images. The threshold value for defining tumor hypoxia is dependent on the tracer, tracer pharmacokinetics, and other imaging parameters (16). In our previous study (16) we
Repeatability of [18F]HX4 PET imaging 87
showed that a threshold of 1.2 times background at 2h after injection provides a similar FHV and hypoxic lesion detection rate to imaging using a threshold of 1.4 times back-ground at 4 hours after injection . In the current analysis we included both thresholds to quantify the HV. First we defined the threshold as an uptake above 1.2 times the back-ground level. In this case 89% (8/9) of the lung and 70% (7/10) of the head and neck cancer patients had a hypoxic tumor volume. These percentages are in agreement with previously published results showing, for example, hypoxia in 72% of non-small-cell lung cancer patients (16) or 84% of those with H&N cancer (17). Increasing the threshold to 1.4 times background level, results in decreases in the proportion of hypoxic lesions detected to 67% of lung cancer lesions (6/9) and 30% of H&N cancer lesions(3/10). At the tumor-level we observed a high correlation for the frequently used parameters to quantify tumor hypoxia (SUVmax, SUVmean, TBR, HV and FHV). This is in agreement with the results ofa study by Okamoto et al. (18), who evaluated the reproducibility of the hypoxia PET tracer [18F]FMISO in patients with H&N cancer. They found a high correlation for SUVmax, TBR and HV. However, these results do not agreewith the previous results of Nehmeh et al. (19), who found a considerable variability in the intratumoral uptake between repeat [18F]FMISO PET scans. The reproducibility of the hypoxia PET tracer [18F]FAZA was evaluated by Busk et al. (20) in a mouse model and showed good reproduc-ibility. In comparison to [18F]FDG PET/CT imaging, our observed repeatability percentages (SUVmax 17% and SUVmean 15%) are smaller than the relative differences required to exceed test-retest variability, which should be larger than 25% for SUVmax and 20% for SUVmean (21). Since [18F]HX4 has a lower uptake than [18F]FDG, results from comparison of the two tracers should be interpreted with caution. However, comparing our relative coefficients of repeatability with the results of the low uptake [18F]FDG measurements (Figure 1C of de Langen et al. (21)), the observed [18F]HX4 repeatability percentage of the SUVmax (17%) is much lower than expected based on [18F]FDG (approximately 35%). This high repeatability of [18F]HX4 PET imaging parameters at the tumor level provides confi-dence that hypoxia PET imaging using [18F]HX4 can be used to reliably detect and quantify tumor hypoxia. This is essential for the use of hypoxia PET imaging as a predictor of treatment response or for the monitoring of changes in hypoxia during treatment. The detection of hypoxia using [18F]HX4 PET/CT at the tumor level could therefore be used to identify patients who might benefit from hypoxia-targeted treatment (22). To evaluate the stability of the heterogeneous uptake pattern of [18F]HX4, a voxel-wise comparison was performed. This analysis showed reproducible results (R>0.5) in the majority (17 out of 19) patients with lung cancer or H&N cancer. The observed repeatabil-ity is in agreement with the previous publication of Peeters et al., showing a high repeata-bility of the [18F]HX4 uptake in a rat rhabdomyosarcoma model (23). Repeatability studies using the alternative hypoxia tracer [18F]FMISO reported contradictory results: Okamoto et al. (18) and Bittner et al. (24) found good repeatability, while Nehmeh et al. (19) ob-served variability in the spatial uptake. For the hypoxia tracer [18F]FAZA, repeated PET/CT imaging was performed during the course of radiotherapy. While Mortensen et al. (25) found a stable location of the HV during treatment, Servagi-Vernat (26) found a spatial move of the HV. The spatial reproducibility of tumor hypoxia, as measured by a hypoxia PET tracer is essential for hypoxia PET-based radiotherapy planning. Three-dimensional-
Chapter 4 88
information of the hypoxic areas within the tumor can be used to tailor radiotherapy treatment to give a higher radiation dose to the hypoxic subvolumes (27). In this study, [18F]HX4 PET/CT imaging was able to identify stable hypoxic areas in the majority of patients. Therefore, this imaging technique could potentially enable the reliable treatment of hypoxic areas with an increased radiotherapy dose. Several studies have already shown that it is feasible to perform radiotherapy dose planning based on hypoxia PET images (12, 28, 29). There are some limitations to this study. First, patients with very heterogeneous disease were included. These tumors have a different histology and might therefore express a different phenotype regarding acute versus chronic tumor hypoxia, which could possibly affect the reproducibility of tracer uptake. Nevertheless, even in this heterogeneous population, a high repeatability in [18F]HX4 PET/CT uptake was observed. Second, the study design was multi-centric; therefore different PET/CT scanners were used with different physical characteristics and different acquisition protocols. Differences in resolu-tion among the scanners might have led to differences in the tumor hypoxia detection rates. In general we expect with all scanners a partial volume effect, and particularly in small lesions with low uptake and with a small HV this would cause larger differences in absolute uptake measurements. Also, breathing motion in patients with the lung cancer could have caused blurring of the PET signal. The differences in acquisition protocol, i.e. acquisition time per bed position and uptake period, will lead to differences in the ob-served signal-to-noise ratios, and TBR and SUV measurements (30, 31). Nevertheless, since we used each patient as his or her own control, the partial volume effect and the effect of different scanners should have had only a minor influence on the repeatability results. Third, the [18F]HX4 PET scans were on average, acquired at 99 min after injection, with a maximal difference in the time from injection toacquisition of 27 min. Studies reported after this study was completed have shown that the contrast between tumor and background increases up to 4 hafter injection. Therefore the image contrast might be suboptimal and differences in uptake parameters observed might have been due to the differences in the time from injection to acquisition(31). In conclusion, repeated PET imaging with the hypoxia tracer [18F]HX4 provides reliable and reproducible results regarding the (spatial) uptake in patients with head and neck and lung cancer. [18F]HX4 has the potential to quantify hypoxia in tumors and aid hypoxia-targeted treatments.
ACKNOWLEDGEMENTS
Authors acknowledge financial support from the Dutch technology Foundation STW (grant n° 10696 DuCAT), which is the applied science division of NWO, and the Technology Programme of the Ministry of Economic Affairs. Authors also acknowledge financial support from EU 7th framework program (ARTFORCE - n° 257144), Kankeronderzoekfonds Limburg from the Health Foundation Limburg and the Dutch Cancer Society (KWF UM 2011-5020, KWF MAC 2013-6425).

Repeatability of [18F]HX4 PET imaging 89
CONFLICTS OF INTEREST
K. Szardenings is an employee at Threshold Pharmaceuticals, the company which owns and develops [18F]HX4.

Chapter 4 90
SUPPLEMENTARY DATA
Table S4.1: Repeatability of the [18F]HX4 hypoxic tumor volume(HV) and fraction (FHV) using a threshold of 1.4 times background
HV1.4 [cm3] FHV1.4[%]
Patient ID Scan 1 Scan 2 Scan 1 Scan 2
Lung Cancer
01 3.05 2.33 3.43 2.37
02 77.43 54.67 21.42 14.21
03 0.00 0.00 0.00 0.00
04 96.00 121.34 38.16 44.73
05 1.60 3.52 1.83 6.86
06 0.45 0.25 1.95 1.32
07 0.05 0.15 0.49 1.00
08 1.39 1.79 15.11 18.75
09 0.00 0.00 0.00 0.00
Mean±SD (Lung) 20.0±38.1 20.5±41.8 9.2±13.3 9.9±14.7
Head and Neck Cancer
10 0.00 0.00 0.00 0.00
11 0.00 0.00 0.00 0.00
12 0.00 0.00 0.00 0.00
13 0.00 0.00 0.00 0.00
14 0.06 0.00 0.36 0.00
15 0.13 1.41 0.41 5.20
16 0.31 0.52 4.42 8.68
17 175.37 161.63 70.68 63.50
18 0.00 0.00 0.00 0.00
19 12.06 18.74 17.66 26.15
Mean±SD (HN) 18.8±55.1 18.2±50.7 9.4±22.2 10.2±17.4
Mean±SD (total) 19.4±46.6 19.3±45.4 9.3±18.0 10.4±20.4
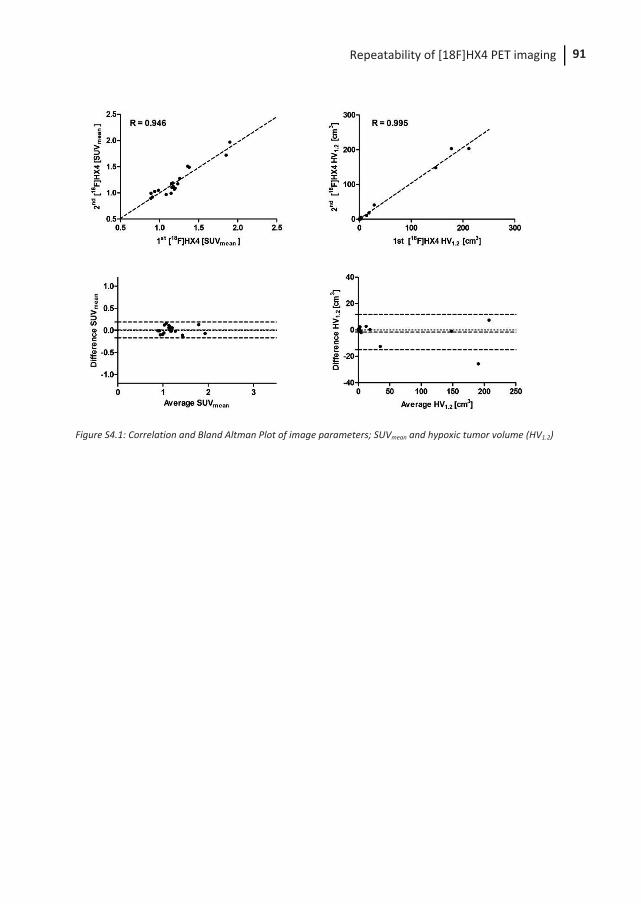
Repeatability of [18F]HX4 PET imaging 91
Figure S4.1: Correlation and Bland Altman Plot of image parameters; SUVmean and hypoxic tumor volume (HV1.2)
Chapter 4 92
REFERENCES
1. Dubois LJ, Lieuwes NG, Janssen MH, Peeters WJ, Windhorst AD, Walsh JC, et al. Preclinical evaluation and validation of [18F]HX4, a promising hypoxia marker for PET imaging. Proc Natl Acad Sci U S A. 2011;108:14620-5.
2. Chen L, Zhang Z, Kolb HC, Walsh JC, Zhang J, Guan Y. (1)(8)F-HX4 hypoxia imaging with PET/CT in head and neck cancer: a comparison with (1)(8)F-FMISO. Nucl Med Commun. 2012;33:1096-102.
3. Wouters BG, van den Beucken T, Magagnin MG, Lambin P, Koumenis C. Targeting hypoxia tolerance in cancer. Drug resistance updates : reviews and commentaries in antimicrobial and anticancer chemotherapy. 2004;7:25-40.
4. Walsh JC, Lebedev A, Aten E, Madsen K, Marciano L, Kolb HC. The Clinical Importance of Assessing Tumor Hypoxia: Relationship of Tumor Hypoxia to Prognosis and Therapeutic Opportunities. Antioxidants & redox signaling. 2014.
5. Wouters BG, Koritzinsky M, Chiu RK, Theys J, Buijsen J, Lambin P. Modulation of cell death in the tumor microenvironment. Seminars in radiation oncology. 2003;13:31-41.
6. Nordsmark M, Overgaard J. A confirmatory prognostic study on oxygenation status and loco-regional control in advanced head and neck squamous cell carcinoma treated by radiation therapy. Radiother Oncol. 2000;57:39-43.
7. Thorwarth D, Eschmann SM, Paulsen F, Alber M. Hypoxia dose painting by numbers: a planning study. Int J Radiat Oncol Biol Phys. 2007;68:291-300.
8. Sun JD, Liu Q, Wang J, Ahluwalia D, Ferraro D, Wang Y, et al. Selective tumor hypoxia targeting by hypoxia-activated prodrug TH-302 inhibits tumor growth in preclinical models of cancer. Clin Cancer Res. 2012;18:758-70.
9. Wilson WR, Hay MP. Targeting hypoxia in cancer therapy. Nature reviews Cancer. 2011;11:393-410.
10. Rami M, Dubois L, Parvathaneni NK, Alterio V, van Kuijk SJ, Monti SM, et al. Hypoxia-targeting carbonic anhydrase IX inhibitors by a new series of nitroimidazole-sulfonamides/sulfamides/sulfamates. Journal of medicinal chemistry. 2013;56:8512-20.
11. Dubois L, Peeters SG, van Kuijk SJ, Yaromina A, Lieuwes NG, Saraya R, et al. Targeting carbonic anhydrase IX by nitroimidazole based sulfamides enhances the therapeutic effect of tumor irradiation: a new concept of dual targeting drugs. Radiother Oncol. 2013;108:523-8.
12. Thorwarth D, Alber M. Implementation of hypoxia imaging into treatment planning and delivery. Radiother Oncol. 2010;97:172-5.
13. Lambin P, van Stiphout RG, Starmans MH, Rios-Velazquez E, Nalbantov G, Aerts HJ, et al. Predicting outcomes in radiation oncology--multifactorial decision support systems. Nature reviews Clinical oncology. 2013;10:27-40.
14. van Loon J, Janssen MH, Ollers M, Aerts HJ, Dubois L, Hochstenbag M, et al. PET imaging of hypoxia using [18F]HX4: a phase I trial. Eur J Nucl Med Mol Imaging. 2010;37:1663-8.
15. Doss M, Zhang JJ, Belanger MJ, Stubbs JB, Hostetler ED, Alpaugh K, et al. Biodistribution and radiation dosimetry of the hypoxia marker 18F-HX4 in monkeys and humans determined by using whole-body PET/CT. Nuclear medicine communications. 2010;31:1016-24.
Repeatability of [18F]HX4 PET imaging 93
16. Zegers CM, van Elmpt W, Wierts R, Reymen B, Sharifi H, Ollers MC, et al. Hypoxia imaging with [(18)F]HX4 PET in NSCLC patients: Defining optimal imaging parameters. Radiother Oncol. 2013;109:58-64.
17. Zips D, Zophel K, Abolmaali N, Perrin R, Abramyuk A, Haase R, et al. Exploratory prospective trial of hypoxia-specific PET imaging during radiochemotherapy in patients with locally advanced head-and-neck cancer. Radiother Oncol. 2012;105:21-8.
18. Okamoto S, Shiga T, Yasuda K, Ito YM, Magota K, Kasai K, et al. High reproducibility of tumor hypoxia evaluated by 18F-fluoromisonidazole PET for head and neck cancer. J Nucl Med. 2013;54:201-7.
19. Nehmeh SA, Lee NY, Schroder H, Squire O, Zanzonico PB, Erdi YE, et al. Reproducibility of intratumor distribution of (18)F-fluoromisonidazole in head and neck cancer. Int J Radiat Oncol Biol Phys. 2008;70:235-42.
20. Busk M, Mortensen LS, Nordsmark M, Overgaard J, Jakobsen S, Hansen KV, et al. PET hypoxia imaging with FAZA: reproducibility at baseline and during fractionated radiotherapy in tumour-bearing mice. Eur J Nucl Med Mol Imaging. 2013;40:186-97.
21. de Langen AJ, Vincent A, Velasquez LM, van Tinteren H, Boellaard R, Shankar LK, et al. Repeatability of 18F-FDG uptake measurements in tumors: a metaanalysis. J Nucl Med. 2012;53:701-8.
22. Peeters SG, Zegers CM, Yaromina A, van Elmpt W, Dubois L, Lambin P. Current pre-clinical and clinical applications of hypoxia PET imaging using 2-nitroimidazoles. Q J Nucl Med Mol Imaging. 2014.
23. Peeters SG, Zegers CM, Lieuwes NG, van Elmpt W, Eriksson J, van Dongen GA, et al. A Comparative Study of the Hypoxia PET Tracers [F]HX4, [F]FAZA, and [F]FMISO in a Preclinical Tumor Model. Int J Radiat Oncol Biol Phys. 2014.
24. Bittner MI, Wiedenmann N, Bucher S, Hentschel M, Mix M, Weber WA, et al. Exploratory geographical analysis of hypoxic subvolumes using 18F-MISO-PET imaging in patients with head and neck cancer in the course of primary chemoradiotherapy. Radiother Oncol. 2013;108:511-6.
25. Mortensen LS, Johansen J, Kallehauge J, Primdahl H, Busk M, Lassen P, et al. FAZA PET/CT hypoxia imaging in patients with squamous cell carcinoma of the head and neck treated with radiotherapy: results from the DAHANCA 24 trial. Radiother Oncol. 2012;105:14-20.
26. Servagi-Vernat S, Differding S, Hanin FX, Labar D, Bol A, Lee JA, et al. A prospective clinical study of F-FAZA PET-CT hypoxia imaging in head and neck squamous cell carcinoma before and during radiation therapy. Eur J Nucl Med Mol Imaging. 2014.
27. Zegers CM, van Elmpt W, Reymen B, Even AJ, Troost EG, Ollers MC, et al. In vivo quantification of hypoxic and metabolic status of NSCLC tumors using [18F]HX4 and [18F]FDG-PET/CT imaging. Clin Cancer Res. 2014;20:6389-97.
28. Petit SF, Dekker AL, Seigneuric R, Murrer L, van Riel NA, Nordsmark M, et al. Intra-voxel heterogeneity influences the dose prescription for dose-painting with radiotherapy: a modelling study. Physics in medicine and biology. 2009;54:2179-96.
29. Clausen MM, Hansen AE, Af Rosenschold PM, Kjaer A, Kristensen AT, McEvoy FJ, et al. Dose escalation to high-risk sub-volumes based on non-invasive imaging of hypoxia and glycolytic activity in canine solid tumors: a feasibility study. Radiation oncology. 2013;8:262.

Chapter 4 94
30. Zegers CM, van Elmpt W, Wierts R, Reymen B, Sharifi H, Ollers MC, et al. Hypoxia imaging with [(1)(8)F]HX4 PET in NSCLC patients: defining optimal imaging parameters. Radiother Oncol. 2013;109:58-64.
31. Boellaard R. Standards for PET image acquisition and quantitative data analysis. J Nucl Med. 2009;50 Suppl 1:11S-20S.
CHAPTER
Hypoxia imaging with [18F]HX4 PET in NSCLC: defining optimal imaging parameters
Catharina M.L. Zegers, Wouter van Elmpt, Roel Wierts, Bart Reymen, Hoda Sharifi, Michel C. Öllers, Frank Hoebers, Esther G.C. Troost, Rinus Wanders, Angela van Baardwijk, Jonas Eriksson, Bert Windhorst, Felix M. Mottaghy, Dirk De Ruysscher, Philippe Lambin
Published in: Radiother Oncol. 2013; 109(1):58-64
Chapter 5 96
ABSTRACT
Background and Purpose: [18F]HX4 is a promising hypoxia PET-tracer. Uptake, spatio-temporal stability and optimal acquisition parameters for [18F]HX4 PET imaging were evaluated in non-small cell lung cancer (NSCLC) patients. Materials and methods: [18F]HX4 PET/CT images of 15 NSCLC patients were acquired 2 h and 4 h after injection (p.i.). Maximum standardized-uptake-value (SUVmax), tumor-to-blood-ratio (TBRmax), hypoxic fraction (HF) and contrast-to-noise-ratio (CNR) were deter-mined for all lesions. To evaluate spatio-temporal stability, DICE-similarity and Pearson correlation coefficients were calculated. Optimal acquisition-duration was assessed by comparing 30, 20, 10 and 5min acquisitions. Results: Considerable uptake (TBR > 1.4) was observed in 18/25 target lesions. TBRmax increased significantly from 2 h (1.6 ± 0.3) to 4 h p.i. (2.0 ± 0.6). Uptake patterns at 2 h and 4 h p.i. showed a strong correlation (R = 0.77 ± 0.10) with a DICE similarity coefficient of 0.69 ± 0.08 for the 30% highest uptake volume. Reducing acquisition-time resulted in significant changes in SUVmax and CNR. TBRmax and HF were only affected for scan-times of 5 min. Conclusions: The majority of NSCLC lesions showed considerable [18F]HX4 uptake. The heterogeneous uptake pattern was stable between 2 h and 4 h p.i. [18F]HX4 PET imaging at 4 h p.i. is superior to 2 h p.i. to reach highest contrast. Acquisition time may be reduced to 10 min without significant effects on TBRmax and HF.
Optimal [18F]HX4 PET image parameters 97
INTRODUCTION
Radiotherapy combined with chemotherapy is the standard treatment modality for pa-tients with locally advanced non-small cell lung cancer (NSCLC). Unfortunately, after treatment, progression free survival is short with a median of 14 months (1). Tumor cell hypoxia is known to be a major factor that negatively influences treatment effectiveness, it promotes resistance to radiotherapy and chemotherapy and increases tumor aggres-siveness, angiogenesis, and metastatic potential, resulting in a poor prognosis. (2, 3). Detection and quantification of tumor cell hypoxia using non-invasive positron emission tomography (PET) could help selecting patients who may benefit from treatment adapta-tion counteracting hypoxia (4, 5). The selective binding and retention of 2-nitroimidazoles allows detection and quantification of tumor hypoxia with PET imaging prior to and during treatment (6-11). In addition, it provides the opportunity to display the spatial distribution of hypoxia, which is essential for its integration in radiation dose distribution (12). An increased radiation dose to the radio-resistant/hypoxic areas may result in an increased local control (13-15). Therefore accurate identification and stable detection of the intra-tumor hypoxic sub-volumes is of importance (16). Several 2-nitroimidazoles, labeled with fluor-18 [18F], have already been applied in pa-tients to identify hypoxia (17). The 2-nitroimidazole nucleoside analog: 3-[18F]fluoro-2-(4-((2-nitro-1H-imidazol-1-yl)methyl)-1H-1,2,3-triazol-1-yl)propan-1-ol [18F]HX4, was devel-oped as a potential marker to visualize hypoxic tumor cells (18). It has a high water solubil-ity and fast clearance from non-hypoxic tissue, therefore generating a tracer with pre-ferred pharmacokinetic properties (18-20). Previous preclinical and clinical studies have shown that [18F]HX4 is a promising and non-toxic tracer to visualize tumor hypoxia (18-21). In a rat rhabdomyosarcoma model the [18F]HX4 PET contrast (tumor-to-blood ratio; TBR) increased significantly over time, reaching a plateau and optimal imaging at 4 h after injection (18). In an inter-patient comparison [18F]HX4 yielded a similar tumor-to-muscle ratio at 1.5 h post-injection (p.i.) than [18F]MISO at 2 h p.i., suggesting that [18F]HX4 may be used with a shorter injection-acquisition time than [18F]MISO (21). The aims of this study were to evaluate the [18F]HX4 uptake in NSCLC patients, to report spatio-temporal stability, compare imaging at different time-points and evaluate the possibility to reduce acquisition time.
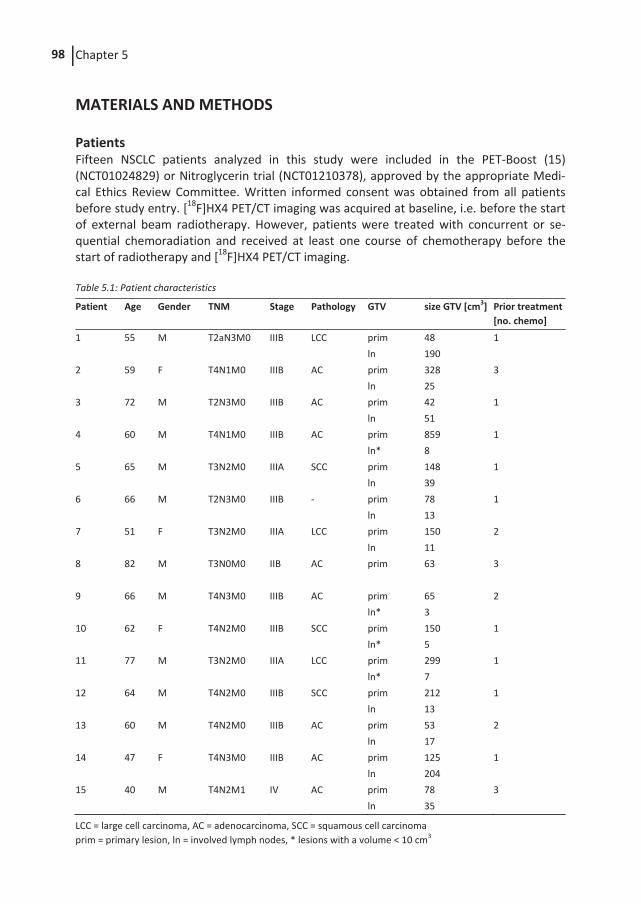
Chapter 5 98
MATERIALS AND METHODS
Patients Fifteen NSCLC patients analyzed in this study were included in the PET-Boost (15) (NCT01024829) or Nitroglycerin trial (NCT01210378), approved by the appropriate Medi-cal Ethics Review Committee. Written informed consent was obtained from all patients before study entry. [18F]HX4 PET/CT imaging was acquired at baseline, i.e. before the start of external beam radiotherapy. However, patients were treated with concurrent or se-quential chemoradiation and received at least one course of chemotherapy before the start of radiotherapy and [18F]HX4 PET/CT imaging. Table 5.1: Patient characteristics
Patient Age Gender TNM Stage Pathology GTV size GTV [cm3] Prior treatment [no. chemo]
1 55 M T2aN3M0 IIIB LCC prim 48 1 ln 190 2 59 F T4N1M0 IIIB AC prim 328 3 ln 25 3 72 M T2N3M0 IIIB AC prim 42 1 ln 51 4 60 M T4N1M0 IIIB AC prim 859 1 ln* 8 5 65 M T3N2M0 IIIA SCC prim 148 1 ln 39 6 66 M T2N3M0 IIIB - prim 78 1 ln 13 7 51 F T3N2M0 IIIA LCC prim 150 2 ln 11 8 82 M T3N0M0 IIB AC prim 63 3 9 66 M T4N3M0 IIIB AC prim 65 2 ln* 3 10 62 F T4N2M0 IIIB SCC prim 150 1 ln* 5 11 77 M T3N2M0 IIIA LCC prim 299 1 ln* 7 12 64 M T4N2M0 IIIB SCC prim 212 1 ln 13 13 60 M T4N2M0 IIIB AC prim 53 2 ln 17 14 47 F T4N3M0 IIIB AC prim 125 1 ln 204 15 40 M T4N2M1 IV AC prim 78 3 ln 35
LCC = large cell carcinoma, AC = adenocarcinoma, SCC = squamous cell carcinoma prim = primary lesion, ln = involved lymph nodes, * lesions with a volume < 10 cm3
Optimal [18F]HX4 PET image parameters 99
PET/CT imaging
Images were acquired on a Philips Gemini TF 64 PET/CT scanner (Philips Healthcare, Best, The Netherlands) with an axial field of view of 18 cm, slice thickness of 4 mm, in plane pixel spacing of 4 mm and a spatial resolution of approximately 5 mm FWHM. CT based attenuation correction and scatter correction (SS-SIMUL) were performed. The PET images were reconstructed using 3D ordered-subset iterative time-of-flight reconstruction tech-nique (BLOB-OS-TF) using 3 iterations and 33 subsets. The patient was scanned in radio-therapy position, positioned on a flat tabletop using a movable laser alignment system with the arms in an arm-support positioned above the head. The field of view for CT and PET imaging was positioned on the primary tumor. [18F]HX4 was produced as described in previous publications (18-21). The injected activity of [18F]HX4 was 423 ± 72 MBq based on a previous phase I trial(19). After intravenous administration of [18F]HX4, PET/CT imaging was performed at 2 h and 4 h p.i. A single bed-position PET was acquired with a total acquisition time of 30 min. Analysis Gross tumor volumes of the primary tumor (GTVprim) and involved lymph nodes (GTVln) were defined by an experienced radiation oncologist and evaluated by a second radiation oncologist, on the [18F]fluorodeoxyglucose (FDG) PET/CT scan used for radiotherapy planning purposes, acquired in the same week as the [18F]HX4 PET/CT. [18F]FDG-based GTVs were copied to the [18F]HX4 PET/CT images by rigid registration and a visual check was performed. No matching problems occurred. In addition a volume of interest (VOI) in the aorta was defined as background region. Scan time point The optimal imaging time point was evaluated by determining image parameters in the 2 h and 4 h p.i. [18F]HX4 PET scans. The mean and maximum standardized uptake values (SUVmean and SUVmax, respectively) in the GTVs and aorta were extracted (PMOD v3.0, Zurich, Switzerland). The tumor-to-background ratio (TBRmax) was defined as the ratio of GTV SUVmax and aorta SUVmean. The tumor hypoxic fraction (HF) was calculated based on the [18F]HX4 uptake. A threshold for the definition of hypoxia has not been formally established, based on previous publications, a TBR larger than 1.4 was used as the stand-ard threshold to define tumor hypoxia (18, 22-24). In addition, the HF was calculated based on a threshold ranging from TBR >1.1 to TBR >1.6. Spatio-temporal stability The spatio-temporal stability was evaluated using two methods, first by calculating the DICE similarity coefficient of the hypoxic volumes and second with a voxel-wise compari-son of the [18F]HX4 uptake at 2 h and 4 h p.i. For both methods the CT acquired at 2 h p.i. (CT2h) was rigidly registered to the CT at 4 h p.i. (CT4h). The resulting deformation field was applied to co-register the PET at 2 h p.i. (PET2h
) to the PET at 4 h p.i. (PET4h ). To calculate the DICE similarity coefficient; First the percentile of the GTV with the highest uptake on PET2h and PET4h was defined, by using percentiles ranging from 50% to 90%. Second, only for lesions with a HF >5%, the hypoxic volume on the PET4h and its corre-
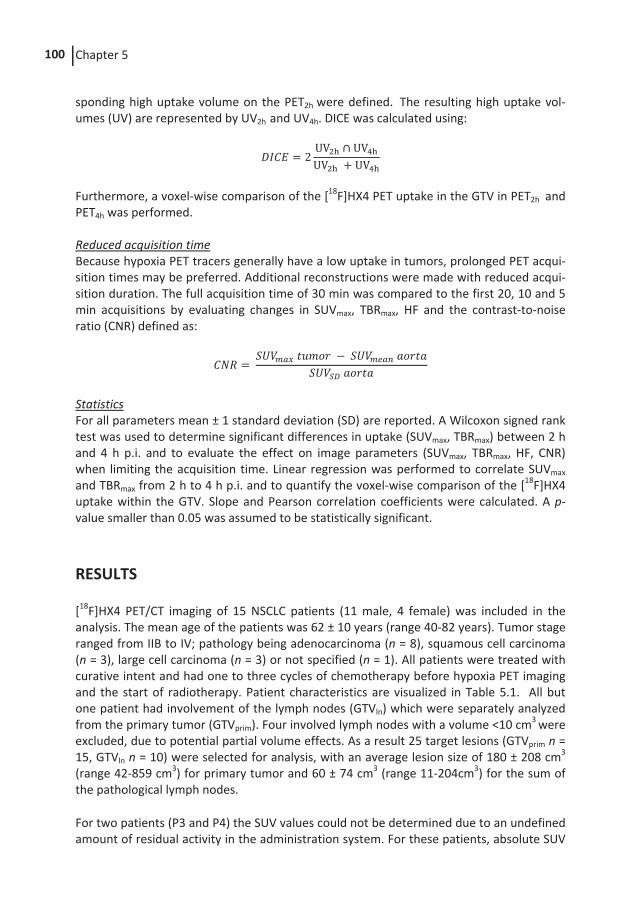
Chapter 5 100
sponding high uptake volume on the PET2h were defined. The resulting high uptake vol-umes (UV) are represented by UV2h and UV4h. DICE was calculated using: = 2 UV ∩ UVUV + UV
Furthermore, a voxel-wise comparison of the [18F]HX4 PET uptake in the GTV in PET2h and
PET4h was performed. Reduced acquisition time Because hypoxia PET tracers generally have a low uptake in tumors, prolonged PET acqui-sition times may be preferred. Additional reconstructions were made with reduced acqui-sition duration. The full acquisition time of 30 min was compared to the first 20, 10 and 5 min acquisitions by evaluating changes in SUVmax, TBRmax, HF and the contrast-to-noise ratio (CNR) defined as: = −
Statistics For all parameters mean ± 1 standard deviation (SD) are reported. A Wilcoxon signed rank test was used to determine significant differences in uptake (SUVmax, TBRmax) between 2 h and 4 h p.i. and to evaluate the effect on image parameters (SUVmax, TBRmax, HF, CNR) when limiting the acquisition time. Linear regression was performed to correlate SUVmax
and TBRmax from 2 h to 4 h p.i. and to quantify the voxel-wise comparison of the [18F]HX4 uptake within the GTV. Slope and Pearson correlation coefficients were calculated. A p-value smaller than 0.05 was assumed to be statistically significant.
RESULTS
[18F]HX4 PET/CT imaging of 15 NSCLC patients (11 male, 4 female) was included in the analysis. The mean age of the patients was 62 ± 10 years (range 40-82 years). Tumor stage ranged from IIB to IV; pathology being adenocarcinoma (n = 8), squamous cell carcinoma (n = 3), large cell carcinoma (n = 3) or not specified (n = 1). All patients were treated with curative intent and had one to three cycles of chemotherapy before hypoxia PET imaging and the start of radiotherapy. Patient characteristics are visualized in Table 5.1. All but one patient had involvement of the lymph nodes (GTVln) which were separately analyzed from the primary tumor (GTVprim). Four involved lymph nodes with a volume <10 cm3 were excluded, due to potential partial volume effects. As a result 25 target lesions (GTVprim n = 15, GTVln n = 10) were selected for analysis, with an average lesion size of 180 ± 208 cm3
(range 42-859 cm3) for primary tumor and 60 ± 74 cm3 (range 11-204cm3) for the sum of the pathological lymph nodes.
For two patients (P3 and P4) the SUV values could not be determined due to an undefined amount of residual activity in the administration system. For these patients, absolute SUV

Optimal [18F]HX4 PET image parameters 101
was calculated based on the estimated activity in the syringe before injection, but exclud-ed from statistical analysis. TBRmax, HF and CNR calculations were not affected by this spill and therefore included in the analysis. Tumor hypoxia, defined as TBRmax >1.4 on the 4 h p.i. acquisition, was observed in 80% (12/15) of the primary tumors and 60% (6/10) of lymph node regions. An example of a 2 h and 4 h p.i. PET/CT image is shown in Figure 5.1. Comparing 2 h with 4 h p.i., there was a high correlation for both SUVmax (R = 0.96) and TBRmax (R = 0.94). Within the hypoxic lesions, the tumor SUVmax decreased between 2 h p.i. and 4 h p.i. for both GTVprim (1.5 ± 0.4 to 1.4 ± 0.4; P < 0.001) and GTVln (1.4 ± 0.2 to 1.2 ± 0.2; P = 0.16). However, due to clearance of [18F]HX4 in the blood, the TBRmax increased significantly from 2 h to 4 h p.i. (GTVprim: 1.6 ± 0.3 to 2.0 ± 0.6; P < 0.001 and GTVln: 1.5 ± 0.3 to 2.1 ± 0.6; P = 0.03 ) as shown in Table 5.2 and Figure 5.2. The SUVmean measured within the aorta VOI was 1.0 ± 0.2 and 0.7 ± 0.2 at 2 h p.i. and 4 h p.i respectively. Assuming an exponen-tial clearance of HX4 in the blood, this resulted in an estimated biological half life of 4.3 h.
Figure 5.1: Example of two transversal slices of the [18F]HX4 CT/PET image of patient 14 at 2 h and 4 h p.i. showing the primary tumor (GTVprim) and involved lymph nodes (GTVln)
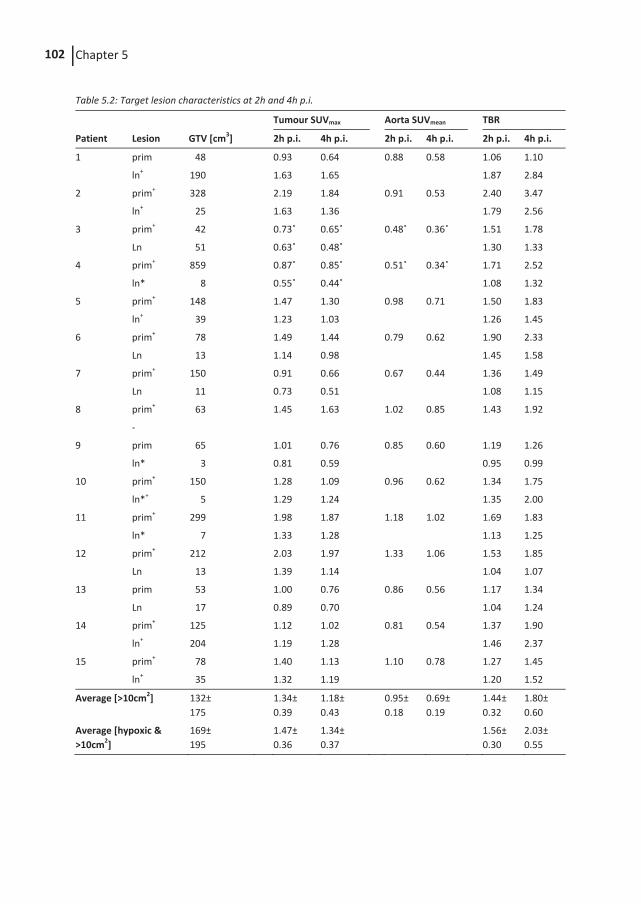
Chapter 5 102
Table 5.2: Target lesion characteristics at 2h and 4h p.i.
Tumour SUVmax Aorta SUVmean TBR
Patient Lesion GTV [cm3] 2h p.i. 4h p.i. 2h p.i. 4h p.i. 2h p.i. 4h p.i.
1 prim 48 0.93 0.64 0.88 0.58 1.06 1.10
ln+ 190 1.63 1.65 1.87 2.84
2 prim+ 328 2.19 1.84 0.91 0.53 2.40 3.47
ln+ 25 1.63 1.36 1.79 2.56
3 prim+ 42 0.73˟ 0.65˟ 0.48˟ 0.36˟ 1.51 1.78
Ln 51 0.63˟ 0.48˟ 1.30 1.33
4 prim+ 859 0.87˟ 0.85˟ 0.51˟ 0.34˟ 1.71 2.52
ln* 8 0.55˟ 0.44˟ 1.08 1.32
5 prim+ 148 1.47 1.30 0.98 0.71 1.50 1.83
ln+ 39 1.23 1.03 1.26 1.45
6 prim+ 78 1.49 1.44 0.79 0.62 1.90 2.33
Ln 13 1.14 0.98 1.45 1.58
7 prim+ 150 0.91 0.66 0.67 0.44 1.36 1.49
Ln 11 0.73 0.51 1.08 1.15
8 prim+ 63 1.45 1.63 1.02 0.85 1.43 1.92
-
9 prim 65 1.01 0.76 0.85 0.60 1.19 1.26
ln* 3 0.81 0.59 0.95 0.99
10 prim+ 150 1.28 1.09 0.96 0.62 1.34 1.75
ln*+ 5 1.29 1.24 1.35 2.00
11 prim+ 299 1.98 1.87 1.18 1.02 1.69 1.83
ln* 7 1.33 1.28 1.13 1.25
12 prim+ 212 2.03 1.97 1.33 1.06 1.53 1.85
Ln 13 1.39 1.14 1.04 1.07
13 prim 53 1.00 0.76 0.86 0.56 1.17 1.34
Ln 17 0.89 0.70 1.04 1.24
14 prim+ 125 1.12 1.02 0.81 0.54 1.37 1.90
ln+ 204 1.19 1.28 1.46 2.37
15 prim+ 78 1.40 1.13 1.10 0.78 1.27 1.45
ln+ 35 1.32 1.19 1.20 1.52
Average [>10cm2] 132± 175
1.34± 0.39
1.18± 0.43
0.95± 0.18
0.69± 0.19
1.44± 0.32
1.80± 0.60
Average [hypoxic & >10cm2]
169± 195
1.47± 0.36
1.34± 0.37
1.56± 0.30
2.03± 0.55
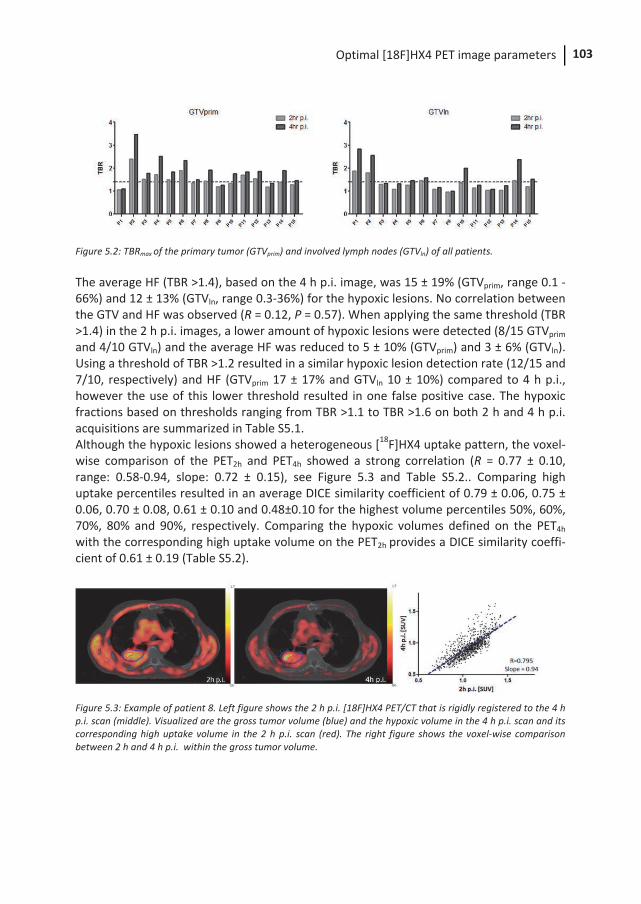
Optimal [18F]HX4 PET image parameters 103
Figure 5.2: TBRmax of the primary tumor (GTVprim) and involved lymph nodes (GTVln) of all patients.
The average HF (TBR >1.4), based on the 4 h p.i. image, was 15 ± 19% (GTVprim, range 0.1 - 66%) and 12 ± 13% (GTVln, range 0.3-36%) for the hypoxic lesions. No correlation between the GTV and HF was observed (R = 0.12, P = 0.57). When applying the same threshold (TBR >1.4) in the 2 h p.i. images, a lower amount of hypoxic lesions were detected (8/15 GTVprim and 4/10 GTVln) and the average HF was reduced to 5 ± 10% (GTVprim) and 3 ± 6% (GTVln). Using a threshold of TBR >1.2 resulted in a similar hypoxic lesion detection rate (12/15 and 7/10, respectively) and HF (GTVprim 17 ± 17% and GTVln 10 ± 10%) compared to 4 h p.i., however the use of this lower threshold resulted in one false positive case. The hypoxic fractions based on thresholds ranging from TBR >1.1 to TBR >1.6 on both 2 h and 4 h p.i. acquisitions are summarized in Table S5.1. Although the hypoxic lesions showed a heterogeneous [18F]HX4 uptake pattern, the voxel-wise comparison of the PET2h and PET4h showed a strong correlation (R = 0.77 ± 0.10, range: 0.58-0.94, slope: 0.72 ± 0.15), see Figure 5.3 and Table S5.2.. Comparing high uptake percentiles resulted in an average DICE similarity coefficient of 0.79 ± 0.06, 0.75 ± 0.06, 0.70 ± 0.08, 0.61 ± 0.10 and 0.48±0.10 for the highest volume percentiles 50%, 60%, 70%, 80% and 90%, respectively. Comparing the hypoxic volumes defined on the PET4h
with the corresponding high uptake volume on the PET2h provides a DICE similarity coeffi-cient of 0.61 ± 0.19 (Table S5.2).
Figure 5.3: Example of patient 8. Left figure shows the 2 h p.i. [18F]HX4 PET/CT that is rigidly registered to the 4 h p.i. scan (middle). Visualized are the gross tumor volume (blue) and the hypoxic volume in the 4 h p.i. scan and its corresponding high uptake volume in the 2 h p.i. scan (red). The right figure shows the voxel-wise comparison between 2 h and 4 h p.i. within the gross tumor volume.
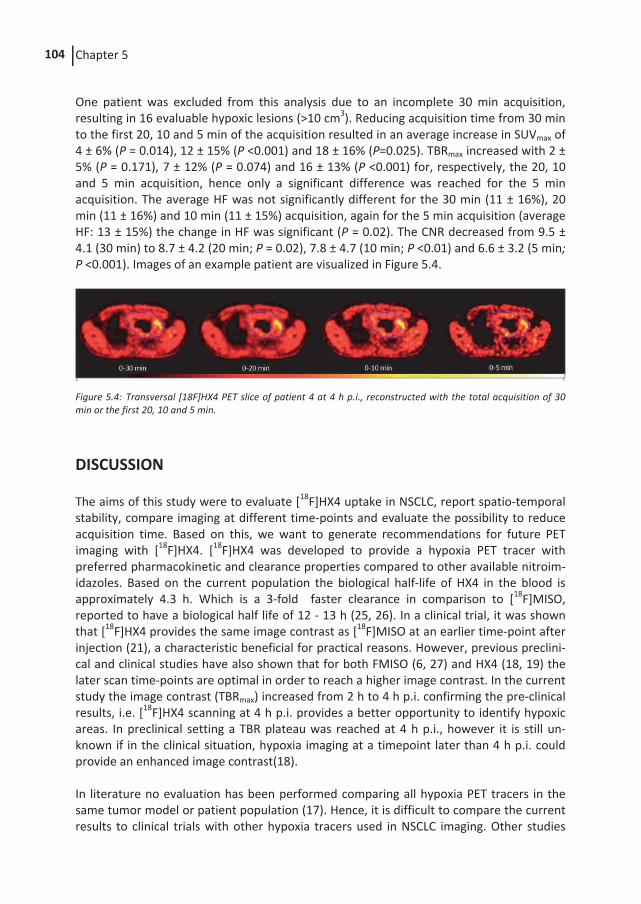
Chapter 5 104
One patient was excluded from this analysis due to an incomplete 30 min acquisition, resulting in 16 evaluable hypoxic lesions (>10 cm3). Reducing acquisition time from 30 min to the first 20, 10 and 5 min of the acquisition resulted in an average increase in SUVmax of 4 ± 6% (P = 0.014), 12 ± 15% (P <0.001) and 18 ± 16% (P=0.025). TBRmax increased with 2 ± 5% (P = 0.171), 7 ± 12% (P = 0.074) and 16 ± 13% (P <0.001) for, respectively, the 20, 10 and 5 min acquisition, hence only a significant difference was reached for the 5 min acquisition. The average HF was not significantly different for the 30 min (11 ± 16%), 20 min (11 ± 16%) and 10 min (11 ± 15%) acquisition, again for the 5 min acquisition (average HF: 13 ± 15%) the change in HF was significant (P = 0.02). The CNR decreased from 9.5 ± 4.1 (30 min) to 8.7 ± 4.2 (20 min; P = 0.02), 7.8 ± 4.7 (10 min; P <0.01) and 6.6 ± 3.2 (5 min; P <0.001). Images of an example patient are visualized in Figure 5.4.
Figure 5.4: Transversal [18F]HX4 PET slice of patient 4 at 4 h p.i., reconstructed with the total acquisition of 30 min or the first 20, 10 and 5 min.
DISCUSSION
The aims of this study were to evaluate [18F]HX4 uptake in NSCLC, report spatio-temporal stability, compare imaging at different time-points and evaluate the possibility to reduce acquisition time. Based on this, we want to generate recommendations for future PET imaging with [18F]HX4. [18F]HX4 was developed to provide a hypoxia PET tracer with preferred pharmacokinetic and clearance properties compared to other available nitroim-idazoles. Based on the current population the biological half-life of HX4 in the blood is approximately 4.3 h. Which is a 3-fold faster clearance in comparison to [18F]MISO, reported to have a biological half life of 12 - 13 h (25, 26). In a clinical trial, it was shown that [18F]HX4 provides the same image contrast as [18F]MISO at an earlier time-point after injection (21), a characteristic beneficial for practical reasons. However, previous preclini-cal and clinical studies have also shown that for both FMISO (6, 27) and HX4 (18, 19) the later scan time-points are optimal in order to reach a higher image contrast. In the current study the image contrast (TBRmax) increased from 2 h to 4 h p.i. confirming the pre-clinical results, i.e. [18F]HX4 scanning at 4 h p.i. provides a better opportunity to identify hypoxic areas. In preclinical setting a TBR plateau was reached at 4 h p.i., however it is still un-known if in the clinical situation, hypoxia imaging at a timepoint later than 4 h p.i. could provide an enhanced image contrast(18). In literature no evaluation has been performed comparing all hypoxia PET tracers in the same tumor model or patient population (17). Hence, it is difficult to compare the current results to clinical trials with other hypoxia tracers used in NSCLC imaging. Other studies
Optimal [18F]HX4 PET image parameters 105
allowed different treatment modalities before imaging, with differences in scan time p.i. or definition of background tissue (muscle (7), mediastinum (6, 28), venous blood sam-pling (22, 29), lung (30), heart (31), not specified (32)). Nevertheless it seems that the average SUVmax resulting from the current analysis are similar compared to other trials with [18F]FMISO (6-8, 30), FAZA (32) or FETNIM (29). The definition of the hypoxic volume in the literature is diverse and based on different tracers. For [18F]FMISO imaging, a comparison with immunohistochemistry (24), normal tissue differences (22) and in vivo bio-distribution data (23) a threshold of TBR >1.4 can be supported. For [18F]HX4 imaging a good correlation with immunohistochemistry was observed when HX4 positive voxels (TBR >1.4) were compared to pimonidazole staining (18), however the optimal TBR in a clinical setting is still under investigation. Using the TBR >1.4 threshold a significant amount of tumor hypoxia was observed in 80% of the primary tumors and 60% of the involved lymph nodes. Note that although the lesion size of GTVln was in general smaller than GTVprim, still no relationship was found between GTV and HF. An average HF of 14 ± 17% was observed, which is lower in comparison to a previous study of Rasey et al. (22) where a median HF of 58% was reported. The discrepancy might be explained due to the fact that all patients in the current study had at least one cycle of chemotherapy before [18F]HX4 PET scans, which may reduce tumor hypoxia (9, 33), result-ing in a lower SUVmax, TBR and HF. Note that, this is a situation frequently occurring in clinical practice. However, the hypoxic status of the lesion was assessed before the start of radiotherapy, which is of utmost importance in dose redistribution strategies. The TBR threshold of 1.4 should not be interpreted as a rigid value to determine tumor hypoxia. Due to tracer kinetics, the threshold should be optimized based on scan time post-injection. An alternative threshold of TBR >1.2, also used in several trials (31, 34, 35), provides in the current study a similar amount of detected lesions at 2 h p.i. in comparison to 4 h p.i. using a TBR >1.4, however the risk of misclassifying lesions increases. This might also explain the difference between the studies of Nehmeh et al. (34) and Okamoto et al. (36) using [18F]MISO PET imaging in head and neck cancer patients. Nehmeh et al. used a threshold of TBR >1.2 and observed that the measured fractional hypoxic volumes were variable over time. Whereas Okamoto et al. using a threshold of TBR >1.4 found a high reproducibility of tumor hypoxia. In the ideal situation, clinical PET imaging should be correlated with tumor pathological specimens (37), to evaluate the threshold to define tumor hypoxia. For future dose re-distribution studies it is of importance to gain insight into the spatio-temporal stability of the PET tracer. A rigid registration was performed to compare the [18F]HX4 PET images at 2 h and 4 h p.i. Small errors in the registration can strongly affect the observed correlations negatively (38). In the current study PET scans were acquired in treatment position reducing the possibility for registration errors. Patients were free-breathing during PET-acquisitions, which might cause a blurring of the PET signal. Howev-er, this will not affect the registration, since breathing motion is the same for both acquisi-tions. By using a careful scan procedure and image registration a good spatio-temporal stability was found.
Chapter 5 106
Limiting the acquisition time is beneficial for practical reasons, to reduce patient move-ment and to increase patient comfort. As expected, image noise increases when reducing the acquisition time. This results in a significant change in CNR and SUVmax for all reduced acquisition times. However TBRmax and HF are only significantly influenced when acquisi-tion time is reduced to 5 min. This is in agreement with the results previously showed by Boellaard et al. (39), that SUVmax is more sensitive to image noise than SUV ratios like TBR. For this reason SUVmax is not be the best parameter to evaluate the uptake of hypoxia makers. A trade-off has to be made between image noise and practical issues, nonethe-less, the acquisition-time for [18F]HX4 PET imaging at 4 h p.i. should be at least 10 min, with the current administered activity and a modern Time-of-Flight PET/CT scanner. This provides the opportunity to acquire more bed positions, capturing the entire thorax in a 30 min time frame. Another option is to reduce the amount of injected activity, which will have a similar effect on image noise as a reduction of acquisition time. In conclusion, significant hypoxia was observed in 72% of the NSCLC target lesions (80% of primary tumors and 60% of the involved lymph nodes). The heterogeneous [18F]HX4 uptake pattern was stable between 2 h and 4 h p.i., however the TBRmax increased over time, suggesting that imaging at 4 h p.i. is better to reach the highest contrast in [18F]HX4 PET images. [18F]HX4 PET acquisition time can be reduced to 10 minwithout significant effects on TBRmax and HF.
ACKNOWLEDGEMENTS
The authors like to thank the patients who agreed to participate and R. Franssen and C. Urbach from the Department of Nuclear Medicine MUMC for their contribution to the data acquisition. We acknowledge financial support from the CTMM framework (AIR-FORCE project), EU 6th and 7th framework program (ARTFORCE and METOXIA program), Interreg (www.eurocat.info), STW (DuCAT), the Kankeronderzoekfonds Limburg from the Health Foundation Limburg and the Dutch Cancer Society (KWF UM 2011-5020, KWF UM 2009-4454, KWF MAC 2011-4970).
SUPPLEMENTARY DATA
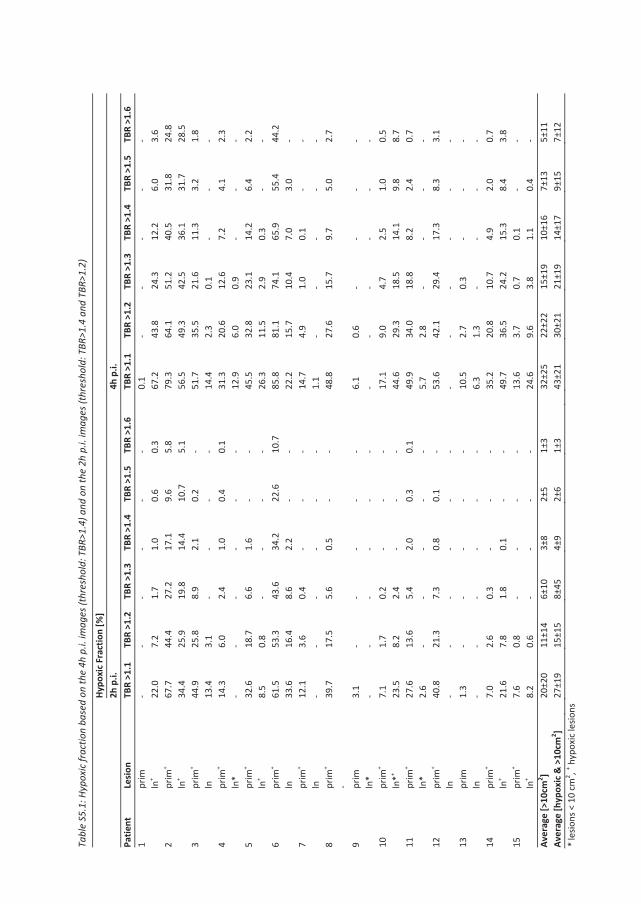
Tabl
e S5
.1: H
ypox
ic fr
actio
n ba
sed
on th
e 4h
p.i.
imag
es (t
hres
hold
: TBR
>1.4
) and
on
the
2h p
.i. im
ages
(thr
esho
ld: T
BR>1
.4 a
nd T
BR>1
.2)
Hy
poxi
c Fr
actio
n [%
]
2h p
.i.
4h
p.i.
Pa
tient
Le
sion
TBR
>1.1
TB
R >1
.2
TBR
>1.3
TB
R >1
.4
TBR
>1.5
TB
R >1
.6
TB
R >1
.1
TBR
>1.2
TB
R >1
.3
TBR
>1.4
TB
R >1
.5
TBR
>1.6
1
prim
- -
- -
- -
0.
1 -
- -
- -
ln
+
22.0
7.
2 1.
7 1.
0 0.
6 0.
3
67.2
43
.8
24.3
12
.2
6.0
3.6
2 pr
im+
67
.7
44.4
27
.2
17.1
9.
6 5.
8
79.3
64
.1
51.2
40
.5
31.8
24
.8
ln
+
34.4
25
.9
19.8
14
.4
10.7
5.
1
56.5
49
.3
42.5
36
.1
31.7
28
.5
3 pr
im+
44
.9
25.8
8.
9 2.
1 0.
2 -
51
.7
35.5
21
.6
11.3
3.
2 1.
8
ln
13
.4
3.1
- -
- -
14
.4
2.3
0.1
- -
- 4
prim
+
14.3
6.
0 2.
4 1.
0 0.
4 0.
1
31.3
20
.6
12.6
7.
2 4.
1 2.
3
ln*
-
- -
- -
-
12.9
6.
0 0.
9 -
- -
5 pr
im+
32
.6
18.7
6.
6 1.
6 -
-
45.5
32
.8
23.1
14
.2
6.4
2.2
ln
+
8.5
0.8
- -
- -
26
.3
11.5
2.
9 0.
3 -
- 6
prim
+
61.5
53
.3
43.6
34
.2
22.6
10
.7
85
.8
81.1
74
.1
65.9
55
.4
44.2
ln
33
.6
16.4
8.
6 2.
2 -
-
22.2
15
.7
10.4
7.
0 3.
0 -
7 pr
im+
12
.1
3.6
0.4
- -
-
14.7
4.
9 1.
0 0.
1 -
-
ln
-
- -
- -
-
1.1
- -
- -
- 8
prim
+
39.7
17
.5
5.6
0.5
- -
48
.8
27.6
15
.7
9.7
5.0
2.7
-
9 pr
im
3.
1 -
- -
- -
6.
1 0.
6 -
- -
-
ln*
-
- -
- -
-
- -
- -
- -
10
prim
+
7.1
1.7
0.2
- -
-
17.1
9.
0 4.
7 2.
5 1.
0 0.
5
ln*+
23
.5
8.2
2.4
- -
-
44.6
29
.3
18.5
14
.1
9.8
8.7
11
prim
+
27.6
13
.6
5.4
2.0
0.3
0.1
49
.9
34.0
18
.8
8.2
2.4
0.7
ln
*
2.6
- -
- -
-
5.7
2.8
- -
- -
12
prim
+
40.8
21
.3
7.3
0.8
0.1
-
53.6
42
.1
29.4
17
.3
8.3
3.1
ln
- -
- -
- -
-
- -
- -
- 13
pr
im
1.
3 -
- -
- -
10
.5
2.7
0.3
- -
-
ln
-
- -
- -
-
6.3
1.3
- -
- -
14
prim
+
7.0
2.6
0.3
- -
-
35.2
20
.8
10.7
4.
9 2.
0 0.
7
ln+
21
.6
7.8
1.8
0.1
- -
49
.7
36.5
24
.2
15.3
8.
4 3.
8 15
pr
im+
7.
6 0.
8 -
- -
-
13.6
3.
7 0.
7 0.
1 -
-
ln+
8.
2 0.
6 -
- -
-
24.6
9.
6 3.
8 1.
1 0.
4 -
Aver
age
[>10
cm2 ]
20
±20
11±1
4 6±
10
3±8
2±5
1±3
32
±25
22±2
2 15
±19
10±1
6 7±
13
5±11
Av
erag
e [h
ypox
ic &
>10
cm2 ]
27
±19
15±1
5 8±
45
4±9
2±6
1±3
43
±21
30±2
1 21
±19
14±1
7 9±
15
7±12
*
lesio
ns <
10
cm2 , + h
ypox
ic le
sions
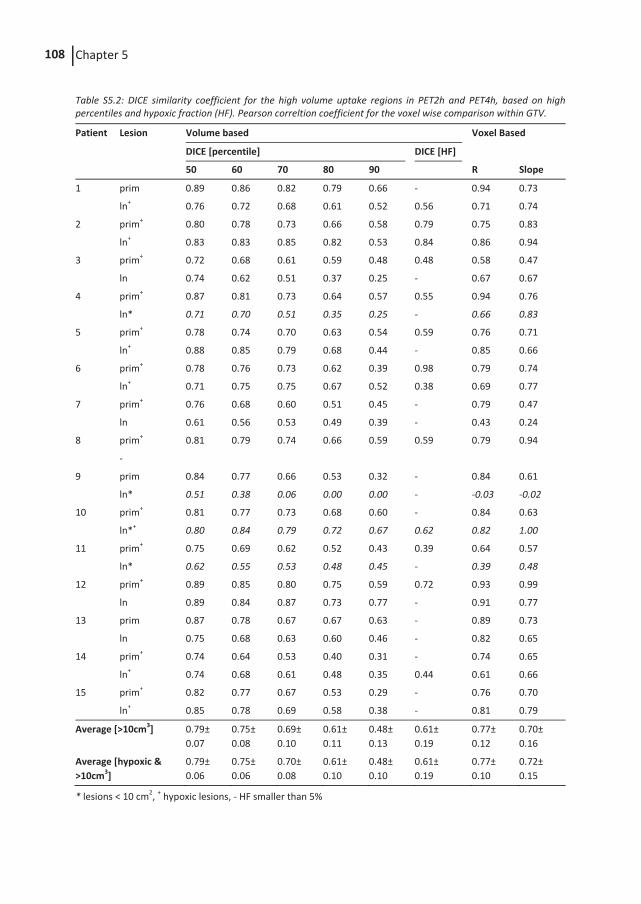
Chapter 5 108
Table S5.2: DICE similarity coefficient for the high volume uptake regions in PET2h and PET4h, based on high percentiles and hypoxic fraction (HF). Pearson correltion coefficient for the voxel wise comparison within GTV.
Patient Lesion Volume based Voxel Based
DICE [percentile] DICE [HF]
50 60 70 80 90 R Slope
1 prim 0.89 0.86 0.82 0.79 0.66 - 0.94 0.73
ln+ 0.76 0.72 0.68 0.61 0.52 0.56 0.71 0.74
2 prim+ 0.80 0.78 0.73 0.66 0.58 0.79 0.75 0.83
ln+ 0.83 0.83 0.85 0.82 0.53 0.84 0.86 0.94
3 prim+ 0.72 0.68 0.61 0.59 0.48 0.48 0.58 0.47
ln 0.74 0.62 0.51 0.37 0.25 - 0.67 0.67
4 prim+ 0.87 0.81 0.73 0.64 0.57 0.55 0.94 0.76
ln* 0.71 0.70 0.51 0.35 0.25 - 0.66 0.83
5 prim+ 0.78 0.74 0.70 0.63 0.54 0.59 0.76 0.71
ln+ 0.88 0.85 0.79 0.68 0.44 - 0.85 0.66
6 prim+ 0.78 0.76 0.73 0.62 0.39 0.98 0.79 0.74
ln+ 0.71 0.75 0.75 0.67 0.52 0.38 0.69 0.77
7 prim+ 0.76 0.68 0.60 0.51 0.45 - 0.79 0.47
ln 0.61 0.56 0.53 0.49 0.39 - 0.43 0.24
8 prim+ 0.81 0.79 0.74 0.66 0.59 0.59 0.79 0.94
-
9 prim 0.84 0.77 0.66 0.53 0.32 - 0.84 0.61
ln* 0.51 0.38 0.06 0.00 0.00 - -0.03 -0.02
10 prim+ 0.81 0.77 0.73 0.68 0.60 - 0.84 0.63
ln*+ 0.80 0.84 0.79 0.72 0.67 0.62 0.82 1.00
11 prim+ 0.75 0.69 0.62 0.52 0.43 0.39 0.64 0.57
ln* 0.62 0.55 0.53 0.48 0.45 - 0.39 0.48
12 prim+ 0.89 0.85 0.80 0.75 0.59 0.72 0.93 0.99
ln 0.89 0.84 0.87 0.73 0.77 - 0.91 0.77
13 prim 0.87 0.78 0.67 0.67 0.63 - 0.89 0.73
ln 0.75 0.68 0.63 0.60 0.46 - 0.82 0.65
14 prim+ 0.74 0.64 0.53 0.40 0.31 - 0.74 0.65
ln+ 0.74 0.68 0.61 0.48 0.35 0.44 0.61 0.66
15 prim+ 0.82 0.77 0.67 0.53 0.29 - 0.76 0.70
ln+ 0.85 0.78 0.69 0.58 0.38 - 0.81 0.79
Average [>10cm3]
0.79± 0.07
0.75± 0.08
0.69± 0.10
0.61± 0.11
0.48± 0.13
0.61± 0.19
0.77± 0.12
0.70± 0.16
Average [hypoxic & >10cm3]
0.79± 0.06
0.75± 0.06
0.70± 0.08
0.61± 0.10
0.48± 0.10
0.61± 0.19
0.77± 0.10
0.72± 0.15
* lesions < 10 cm2, + hypoxic lesions, - HF smaller than 5%
Optimal [18F]HX4 PET image parameters 109
REFERENCES 1. van Baardwijk A, Reymen B, Wanders S, Borger J, Ollers M, Dingemans AM, et al.
Mature results of a phase II trial on individualised accelerated radiotherapy based on normal tissue constraints in concurrent chemo-radiation for stage III non-small cell lung cancer. Eur J Cancer. 2012;48:2339-46.
2. Wouters BG, van den Beucken T, Magagnin MG, Lambin P, Koumenis C. Targeting hypoxia tolerance in cancer. Drug Resist Updat. 2004;7:25-40.
3. Lambin P, van Stiphout RG, Starmans MH, Rios-Velazquez E, Nalbantov G, Aerts HJ, et al. Predicting outcomes in radiation oncology--multifactorial decision support systems. Nat Rev Clin Oncol. 2013;10:27-40.
4. Overgaard J. Hypoxic modification of radiotherapy in squamous cell carcinoma of the head and neck - A systematic review and meta-analysis. Radiother Oncol. 2011;100:22-32.
5. Mortensen LS, Johansen J, Kallehauge J, Primdahl H, Busk M, Lassen P, et al. FAZA PET/CT hypoxia imaging in patients with squamous cell carcinoma of the head and neck treated with radiotherapy: results from the DAHANCA 24 trial. Radiother Oncol. 2012;105:14-20.
6. Eschmann SM, Paulsen F, Reimold M, Dittmann H, Welz S, Reischl G, et al. Prognostic impact of hypoxia imaging with 18F-misonidazole PET in non-small cell lung cancer and head and neck cancer before radiotherapy. J Nucl Med. 2005;46:253-60.
7. Gagel B, Reinartz P, Demirel C, Kaiser HJ, Zimny M, Piroth M, et al. [18F] fluoromisonidazole and [18F] fluorodeoxyglucose positron emission tomography in response evaluation after chemo-/radiotherapy of non-small-cell lung cancer: a feasibility study. BMC Cancer. 2006;6:51.
8. Vera P, Bohn P, Edet-Sanson A, Salles A, Hapdey S, Gardin I, et al. Simultaneous positron emission tomography (PET) assessment of metabolism with (1)(8)F-fluoro-2-deoxy-d-glucose (FDG), proliferation with (1)(8)F-fluoro-thymidine (FLT), and hypoxia with (1)(8)fluoro-misonidazole (F-miso) before and during radiotherapy in patients with non-small-cell lung cancer (NSCLC): a pilot study. Radiother Oncol. 2011;98:109-16.
9. Bittner MI, Wiedenmann N, Bucher S, Hentschel M, Mix M, Weber WA, et al. Exploratory geographical analysis of hypoxic subvolumes using F-MISO-PET imaging in patients with head and neck cancer in the course of primary chemoradiotherapy. Radiother Oncol. 2013.
10. Bollineni VR, Kerner GS, Pruim J, Steenbakkers RJ, Wiegman EM, Koole MJ, et al. PET Imaging of Tumor Hypoxia Using 18F-Fluoroazomycin Arabinoside in Stage III-IV Non-Small Cell Lung Cancer Patients. J Nucl Med. 2013.
11. Zips D, Boke S, Kroeber T, Meinzer A, Bruchner K, Thames HD, et al. Prognostic Value of Radiobiological Hypoxia during Fractionated Irradiation for Local Tumor Control. Strahlenther Onkol. 2011;187:306-10.
12. Lambin P, Petit SF, Aerts HJ, van Elmpt WJ, Oberije CJ, Starmans MH, et al. The ESTRO Breur Lecture 2009. From population to voxel-based radiotherapy: exploiting intra-tumour and intra-organ heterogeneity for advanced treatment of non-small cell lung cancer. Radiother Oncol. 2010;96:145-52.
13. Hendrickson K, Phillips M, Smith W, Peterson L, Krohn K, Rajendran J. Hypoxia imaging with [F-18] FMISO-PET in head and neck cancer: potential for guiding
Chapter 5 110
intensity modulated radiation therapy in overcoming hypoxia-induced treatment resistance. Radiother Oncol. 2011;101:369-75.
14. Thorwarth D, Eschmann SM, Paulsen F, Alber M. Hypoxia dose painting by numbers: a planning study. Int J Radiat Oncol Biol Phys. 2007;68:291-300.
15. van Elmpt W, De Ruysscher D, van der Salm A, Lakeman A, van der Stoep J, Emans D, et al. The PET-boost randomised phase II dose-escalation trial in non-small cell lung cancer. Radiother Oncol. 2012;104:67-71.
16. Bollineni VR, Wiegman EM, Pruim J, Groen HJ, Langendijk JA. Hypoxia imaging using Positron Emission Tomography in non-small cell lung cancer: implications for radiotherapy. Cancer Treat Rev. 2012;38:1027-32.
17. Horsman MR, Mortensen LS, Petersen JB, Busk M, Overgaard J. Imaging hypoxia to improve radiotherapy outcome. Nat Rev Clin Oncol. 2012;9:674-87.
18. Dubois LJ, Lieuwes NG, Janssen MH, Peeters WJ, Windhorst AD, Walsh JC, et al. Preclinical evaluation and validation of [18F]HX4, a promising hypoxia marker for PET imaging. Proc Natl Acad Sci U S A. 2011;108:14620-5.
19. van Loon J, Janssen MH, Ollers M, Aerts HJ, Dubois L, Hochstenbag M, et al. PET imaging of hypoxia using [18F]HX4: a phase I trial. Eur J Nucl Med Mol Imaging. 2010;37:1663-8.
20. Doss M, Zhang JJ, Belanger MJ, Stubbs JB, Hostetler ED, Alpaugh K, et al. Biodistribution and radiation dosimetry of the hypoxia marker 18F-HX4 in monkeys and humans determined by using whole-body PET/CT. Nucl Med Commun. 2010;31:1016-24.
21. Chen L, Zhang Z, Kolb HC, Walsh JC, Zhang J, Guan Y. (1)(8)F-HX4 hypoxia imaging with PET/CT in head and neck cancer: a comparison with (1)(8)F-FMISO. Nucl Med Commun. 2012;33:1096-102.
22. Rasey JS, Koh WJ, Evans ML, Peterson LM, Lewellen TK, Graham MM, et al. Quantifying regional hypoxia in human tumors with positron emission tomography of [18F]fluoromisonidazole: a pretherapy study of 37 patients. Int J Radiat Oncol Biol Phys. 1996;36:417-28.
23. Koh WJ, Bergman KS, Rasey JS, Peterson LM, Evans ML, Graham MM, et al. Evaluation of oxygenation status during fractionated radiotherapy in human nonsmall cell lung cancers using [F-18]fluoromisonidazole positron emission tomography. Int J Radiat Oncol Biol Phys. 1995;33:391-8.
24. Dubois L, Landuyt W, Haustermans K, Dupont P, Bormans G, Vermaelen P, et al. Evaluation of hypoxia in an experimental rat tumour model by [(18)F]fluoromi-sonidazole PET and immunohistochemistry. Br J Cancer. 2004;91:1947-54.
25. Gray AJ, Dische S, Adams GE, Flockhart IR, Foster JL. Clinical testing of the radiosensitiser Ro-07-0582. I. Dose tolerance, serum and tumour concentrations. Clin Radiol. 1976;27:151-7.
26. Saunders ME, Dische S, Anderson P, Flockhart IR. The neurotoxicity of misonidazole and its relationship to dose, half-life and concentration in the serum. Br J Cancer Suppl. 1978;3:268-70.
27. Abolmaali N, Haase R, Koch A, Zips D, Steinbach J, Baumann M, et al. Two or four hour [(1)(8)F]FMISO-PET in HNSCC. When is the contrast best? Nuklearmedizin. 2011;50:22-7.
Optimal [18F]HX4 PET image parameters 111
28. Hu M, Xing L, Mu D, Yang W, Yang G, Kong L, et al. Hypoxia Imaging With 18F-Fluoroerythronitroimidazole Integrated PET/CT and Immunohistochemical Studies in Non-Small Cell Lung Cancer. Clin Nucl Med. 2013;38:591-6.
29. Li L, Hu M, Zhu H, Zhao W, Yang G, Yu J. Comparison of 18F-Fluoroerythronitro-imidazole and 18F-fluorodeoxyglucose positron emission tomography and prognostic value in locally advanced non-small-cell lung cancer. Clin Lung Cancer. 2010;11:335-40.
30. Cherk MH, Foo SS, Poon AM, Knight SR, Murone C, Papenfuss AT, et al. Lack of correlation of hypoxic cell fraction and angiogenesis with glucose metabolic rate in non-small cell lung cancer assessed by 18F-Fluoromisonidazole and 18F-FDG PET. J Nucl Med. 2006;47:1921-6.
31. Trinkaus ME, Blum R, Rischin D, Callahan J, Bressel M, Segard T, et al. Imaging of hypoxia with (18) F-FAZA PET in patients with locally advanced non-small cell lung cancer treated with definitive chemoradiotherapy. J Med Imaging Radiat Oncol. 2013;57:475-81.
32. Postema EJ, McEwan AJ, Riauka TA, Kumar P, Richmond DA, Abrams DN, et al. Initial results of hypoxia imaging using 1-alpha-D: -(5-deoxy-5-[18F]-fluoroarabino-furanosyl)-2-nitroimidazole ( 18F-FAZA). Eur J Nucl Med Mol Imaging. 2009;36:1565-73.
33. Grau C, Overgaard J. Effect of cancer chemotherapy on the hypoxic fraction of a solid tumor measured using a local tumor control assay. Radiother Oncol. 1988;13:301-9.
34. Nehmeh SA, Lee NY, Schroder H, Squire O, Zanzonico PB, Erdi YE, et al. Reproducibility of intratumor distribution of (18)F-fluoromisonidazole in head and neck cancer. Int J Radiat Oncol Biol Phys. 2008;70:235-42.
35. Dirix P, Vandecaveye V, De Keyzer F, Stroobants S, Hermans R, Nuyts S. Dose painting in radiotherapy for head and neck squamous cell carcinoma: value of repeated functional imaging with (18)F-FDG PET, (18)F-fluoromisonidazole PET, diffusion-weighted MRI, and dynamic contrast-enhanced MRI. J Nucl Med. 2009;50:1020-7.
36. Okamoto S, Shiga T, Yasuda K, Ito YM, Magota K, Kasai K, et al. High reproducibility of tumor hypoxia evaluated by 18F-fluoromisonidazole PET for head and neck cancer. J Nucl Med. 2013;54:201-7.
37. van Baardwijk A, Dooms C, van Suylen RJ, Verbeken E, Hochstenbag M, Dehing-Oberije C, et al. The maximum uptake of (18)F-deoxyglucose on positron emission tomography scan correlates with survival, hypoxia inducible factor-1alpha and GLUT-1 in non-small cell lung cancer. Eur J Cancer. 2007;43:1392-8.
38. Nyflot MJ, Harari PM, Yip S, Perlman SB, Jeraj R. Correlation of PET images of metabolism, proliferation and hypoxia to characterize tumor phenotype in patients with cancer of the oropharynx. Radiother Oncol. 2012;105:36-40.
39. Boellaard R, Krak NC, Hoekstra OS, Lammertsma AA. Effects of noise, image resolution, and ROI definition on the accuracy of standard uptake values: a simulation study. J Nucl Med. 2004;45:1519-27.

CLINICAL POTENTIAL AND THERAPEUTIC TARGETS

CHAPTER
In vivo quantification of hypoxic and metabolic status of NSCLC using
[18F]HX4 and [18F]FDG PET/CT imaging
Catharina M.L. Zegers, Wouter van Elmpt, Bart Reymen, Aniek J.G. Even, Esther G.C. Troost, Michel C. Öllers, Frank J.P. Hoebers, Ruud M.A. Houben, Jonas Eriksson, Albert D.Windhorst, Felix M. Mottaghy, Dirk De Ruysscher, Philippe Lambin
Published in: Clin Cancer Res. 2014; 20(24): 6389-97
Chapter 6 116
ABSTRACT
Purpose: Increased tumor metabolism and hypoxia are related to poor prognosis in solid tumors, including non-small cell lung cancer (NSCLC). PET imaging is a non-invasive tech-nique which is frequently used to visualize and quantify tumor metabolism and hypoxia. The aim of this study was to perform an extensive comparison of tumor metabolism using 2[18F]fluoro-2-deoxy-D-glucose (FDG)-PET and hypoxia using HX4-PET imaging. Experimental Design: FDG- and HX4-PET/CT images of 25 NSCLC patients were coregis-tered. At a global tumor level, HX4 and FDG parameters were extracted from the gross tumor volume. The HX4 high-fraction (HX4-HF) and high-volume (HX4-HV) were defined using a tumor-to-blood ratio > 1.4. For FDG high-fraction (FDG-HF) and high-volume (FDG-HV) a standardized uptake value (SUV) > 50% of SUVmax
was used. We evaluated the spatial correlation between HX4 and FDG uptake within the tumor, to quantify the (mis)match between volumes with a high FDG and high HX4 uptake. Results: At a tumor-level, significant correlations were observed between FDG and HX4 parameters. For the primary GTV, the HX4-HF was three times smaller compared to the FDG-HF. In 53% of the primary lesions, less than 1cm3 of the HX4-HV was outside the FDG-HV; for 37% this volume was 1.9 to 12cm3. Remarkably, a distinct uptake pattern was observed in 11%, with large hypoxic volumes localized outside the FDG-HV. Conclusion: Hypoxic tumor volumes are smaller than metabolic active volumes. Approxi-mately half of the lesions showed a good spatial correlation between the PET tracers. In the other cases, a (partial) mismatch was observed. The addition of HX4-PET imaging has the potential to individualize patient treatment.
Hypoxic and metabolic status of NSCLC 117
INTRODUCTION
Lung cancer has the highest death rate among leading cancer types (1). Standard treat-ment for advanced stage non-small cell lung cancer (NSCLC) is the combination of radio-therapy and chemotherapy, administered either sequentially or concurrently (2). Tumor cell hypoxia has a negative impact on cancer treatment effectiveness, it promotes re-sistance to radiotherapy and chemotherapy, increases the metastatic potential, and is therefore related to a poor prognosis (3-5). Tumor hypoxia is present in the majority of NSCLCs, which can be visualized and quantified using functional PET imaging with radio-labeled 2-nitroimidazoles (6, 7). 3-[18F]fluoro-2-(4-((2-nitro-1H-imidazol-1-yl)methyl)-1H-1,2,3-triazol-1-yl)propan-1-ol ([18F]HX4) is a relatively new nitroimidazole with attractive pharmacokinetic properties that has successfully completed preclinical and clinical testing (8-10). In standard clinical practice, a combination of anatomic computed tomography (CT) and functional 2[18F]fluoro-2-deoxy-D-glucose (FDG) PET imaging is frequently used to visual-ize, detect and stage malignancies. In addition, FDG-PET can be used to identify sub-volumes with a high metabolism, which are more susceptible to local recurrence after (chemo)radiotherapy (11, 12). Aerts and colleagues showed that the residual tumor volume after radiotherapy is mainly located within the pre-radiotherapy high FDG-uptake volume. However, 30% of the residual volume did not correspond to the high FDG volume (11, 13). This may be caused by tumor regrowth in pre-radiotherapy hypoxic tumor sub-volumes located outside the high FDG volume. Therefore, it is of great interest to investi-gate the correlation between both unfavorable biological features (high tumor metabo-lism, hypoxia) because they can be used to predict treatment outcome. In addition, imaging-derived tumor features have the potential to guide treatment with hypoxic modifiers or radiotherapy dose-painting (14-16). The uptake of FDG in the cell is depend-ent on the over-expression of glucose transporters (GLUT), which can be upregulated in the absence of oxygen, through the HIF1α-mediated pathway (17). This may suggest a possible overlap between volumes of high FDG uptake and tumor hypoxia, even though they represent different biological properties of tumors. The aim of this study was to perform an extensive comparison of tumor metabolism, using FDG, and hypoxia, using HX4, to fully characterize the relationship between both PET tracers on a global tumor and voxel level for primary NSCLC and the regional lymph node metastases.
Chapter 6 118
MATERIALS AND METHODS
Patients
FDG- and HX4-PET/CT images of 25 NSCLC patients (17 male and 8 female) were acquired before the start of external beam radiotherapy. The average age of the patients was 63 years (range, 40-82 years). Tumor stage ranged from IIB-IV, pathology being adenocarci-noma (N=13), squamous cell carcinoma (SCC; N = 5), and large cell carcinoma (N = 7). Patients were treated with radical radiotherapy (N = 3) or chemoradiation (N = 22), with the majority of patients receiving at least one cycle of chemotherapy before PET imaging and before the start of radiotherapy (Table S6.1). PET data were acquired in the transla-tional research part of two phase II trials [PET-Boost, NCT01024829 (18); Nitroglycerin (NCT01210378)], both having identical PET imaging procedures. The clinical trials were approved by the appropriate medical ethical review committee, and all patients provided written informed consent before study entry.
PET/CT imaging
HX4 was produced as described in previous publications (8-10, 19). After intravenous administration of 429 ± 57 MBq HX4, PET/CT imaging was performed at 4h postinjection (p.i.) for 20 to 30 minutes in a single bed position centered around the primary tumor. HX4-PET/CT images were acquired on a Gemini TF 64 scanner (Philips Healthcare, Best, the Netherlands), with a spatial resolution of approximately 5 mm FWHM. We performed CT-based attenuation correction and scatter correction (SS-SIMUL), and reconstructed PET images using 3D ordered subset iterative time-of-flight reconstruction technique (BLOB-OS-TF) with three iterations and 33 subsets in a 144 x 144 matrix and voxel sizes of 4 x 4 mm. The injected activity of FDG was based on the patient’s body weight according to the national guidelines (20). PET/CT imaging was performed one hour after intravenous administration of FDG. FDG PET/CT scans were acquired using a Biograph 40 PET/CT scanner (Siemens Healthcare, Erlangen, Germany).Scatter and attenuation corrections were applied. PET images were reconstructed using OSEM 2D (Ordered Subset Expecta-tion Maximization, four iterations, eight subsets) and a Gaussian filter of 5 mm. A respira-tory correlated CT was performed, with the mid-ventilation scan selected for the attenua-tion correction and fusion with the FDG PET. HX4- and FDG-PET/CT scans were acquired in the same week for all except 1 patient. The median interval between both PET scans was 3 days (range: 1-14 days). No interventions (e.g. radiotherapy or chemotherapy) were performed between the FDG- and HX4-PET scans. Both scans were acquired with the patient positioned in radiotherapy position, on a flat tabletop using a laser alignment system with arms in an arm-support positioned above the head.
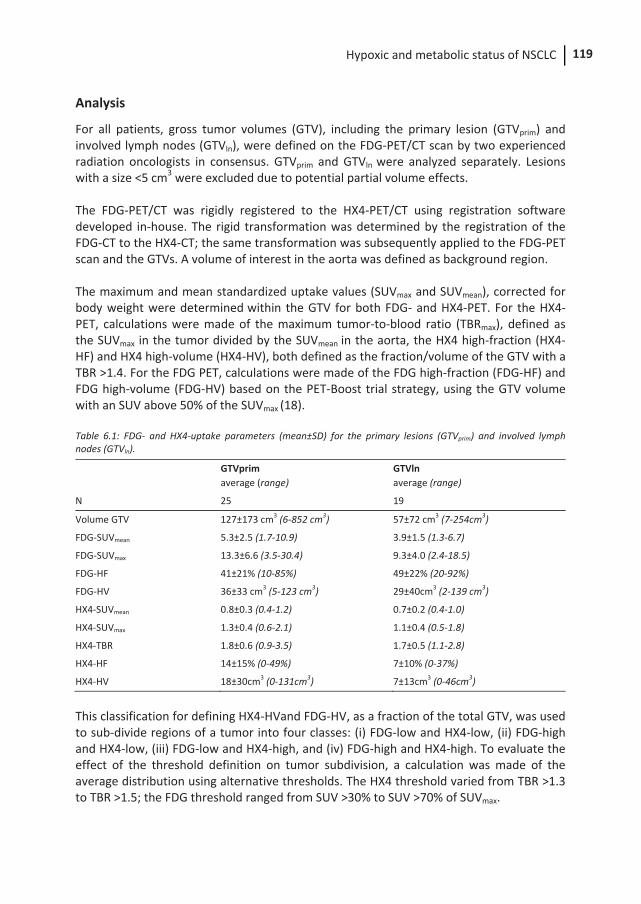
Hypoxic and metabolic status of NSCLC 119
Analysis
For all patients, gross tumor volumes (GTV), including the primary lesion (GTVprim) and involved lymph nodes (GTVln), were defined on the FDG-PET/CT scan by two experienced radiation oncologists in consensus. GTVprim and GTVln were analyzed separately. Lesions with a size <5 cm3 were excluded due to potential partial volume effects. The FDG-PET/CT was rigidly registered to the HX4-PET/CT using registration software developed in-house. The rigid transformation was determined by the registration of the FDG-CT to the HX4-CT; the same transformation was subsequently applied to the FDG-PET scan and the GTVs. A volume of interest in the aorta was defined as background region. The maximum and mean standardized uptake values (SUVmax and SUVmean), corrected for body weight were determined within the GTV for both FDG- and HX4-PET. For the HX4-PET, calculations were made of the maximum tumor-to-blood ratio (TBRmax), defined as the SUVmax in the tumor divided by the SUVmean in the aorta, the HX4 high-fraction (HX4-HF) and HX4 high-volume (HX4-HV), both defined as the fraction/volume of the GTV with a TBR >1.4. For the FDG PET, calculations were made of the FDG high-fraction (FDG-HF) and FDG high-volume (FDG-HV) based on the PET-Boost trial strategy, using the GTV volume with an SUV above 50% of the SUVmax (18). Table 6.1: FDG- and HX4-uptake parameters (mean±SD) for the primary lesions (GTVprim) and involved lymph nodes (GTVln).
GTVprim average (range)
GTVln average (range)
N 25 19
Volume GTV 127±173 cm3 (6-852 cm3) 57±72 cm3 (7-254cm3)
FDG-SUVmean 5.3±2.5 (1.7-10.9) 3.9±1.5 (1.3-6.7)
FDG-SUVmax 13.3±6.6 (3.5-30.4) 9.3±4.0 (2.4-18.5)
FDG-HF 41±21% (10-85%) 49±22% (20-92%)
FDG-HV 36±33 cm3 (5-123 cm3) 29±40cm3 (2-139 cm3)
HX4-SUVmean 0.8±0.3 (0.4-1.2) 0.7±0.2 (0.4-1.0)
HX4-SUVmax 1.3±0.4 (0.6-2.1) 1.1±0.4 (0.5-1.8)
HX4-TBR 1.8±0.6 (0.9-3.5) 1.7±0.5 (1.1-2.8)
HX4-HF 14±15% (0-49%) 7±10% (0-37%)
HX4-HV 18±30cm3 (0-131cm3) 7±13cm3 (0-46cm3)
This classification for defining HX4-HVand FDG-HV, as a fraction of the total GTV, was used to sub-divide regions of a tumor into four classes: (i) FDG-low and HX4-low, (ii) FDG-high and HX4-low, (iii) FDG-low and HX4-high, and (iv) FDG-high and HX4-high. To evaluate the effect of the threshold definition on tumor subdivision, a calculation was made of the average distribution using alternative thresholds. The HX4 threshold varied from TBR >1.3 to TBR >1.5; the FDG threshold ranged from SUV >30% to SUV >70% of SUVmax.
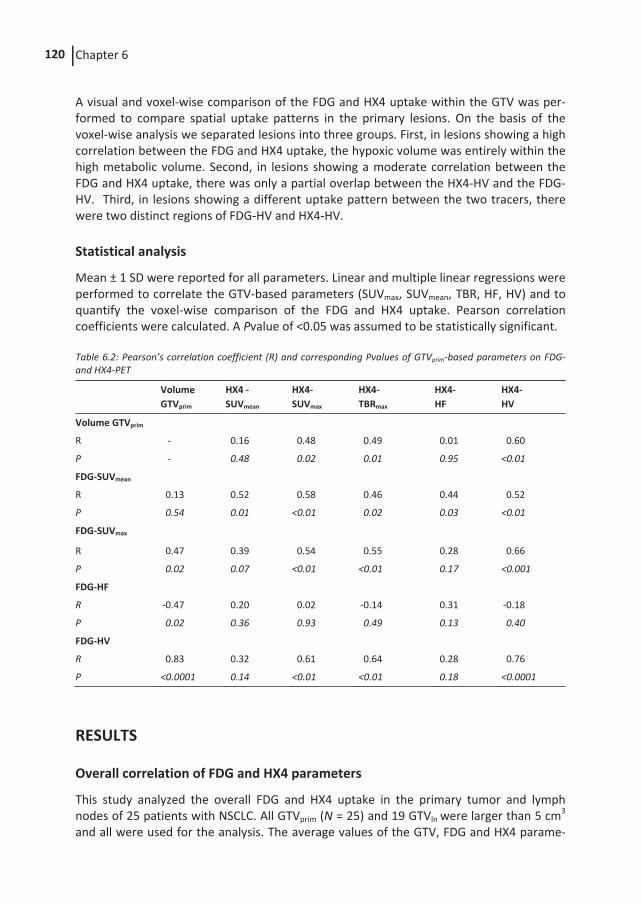
Chapter 6 120
A visual and voxel-wise comparison of the FDG and HX4 uptake within the GTV was per-formed to compare spatial uptake patterns in the primary lesions. On the basis of the voxel-wise analysis we separated lesions into three groups. First, in lesions showing a high correlation between the FDG and HX4 uptake, the hypoxic volume was entirely within the high metabolic volume. Second, in lesions showing a moderate correlation between the FDG and HX4 uptake, there was only a partial overlap between the HX4-HV and the FDG-HV. Third, in lesions showing a different uptake pattern between the two tracers, there were two distinct regions of FDG-HV and HX4-HV.
Statistical analysis
Mean ± 1 SD were reported for all parameters. Linear and multiple linear regressions were performed to correlate the GTV-based parameters (SUVmax, SUVmean, TBR, HF, HV) and to quantify the voxel-wise comparison of the FDG and HX4 uptake. Pearson correlation coefficients were calculated. A Pvalue of <0.05 was assumed to be statistically significant. Table 6.2: Pearson’s correlation coefficient (R) and corresponding Pvalues of GTVprim-based parameters on FDG- and HX4-PET
Volume GTVprim
HX4 - SUVmean
HX4- SUVmax
HX4- TBRmax
HX4- HF
HX4- HV
Volume GTVprim
R - 0.16 0.48 0.49 0.01 0.60
P - 0.48 0.02 0.01 0.95 <0.01
FDG-SUVmean
R 0.13 0.52 0.58 0.46 0.44 0.52
P 0.54 0.01 <0.01 0.02 0.03 <0.01
FDG-SUVmax
R 0.47 0.39 0.54 0.55 0.28 0.66
P 0.02 0.07 <0.01 <0.01 0.17 <0.001
FDG-HF
R -0.47 0.20 0.02 -0.14 0.31 -0.18
P 0.02 0.36 0.93 0.49 0.13 0.40
FDG-HV
R 0.83 0.32 0.61 0.64 0.28 0.76
P <0.0001 0.14 <0.01 <0.01 0.18 <0.0001
RESULTS
Overall correlation of FDG and HX4 parameters
This study analyzed the overall FDG and HX4 uptake in the primary tumor and lymph nodes of 25 patients with NSCLC. All GTVprim (N = 25) and 19 GTVln were larger than 5 cm3
and all were used for the analysis. The average values of the GTV, FDG and HX4 parame-
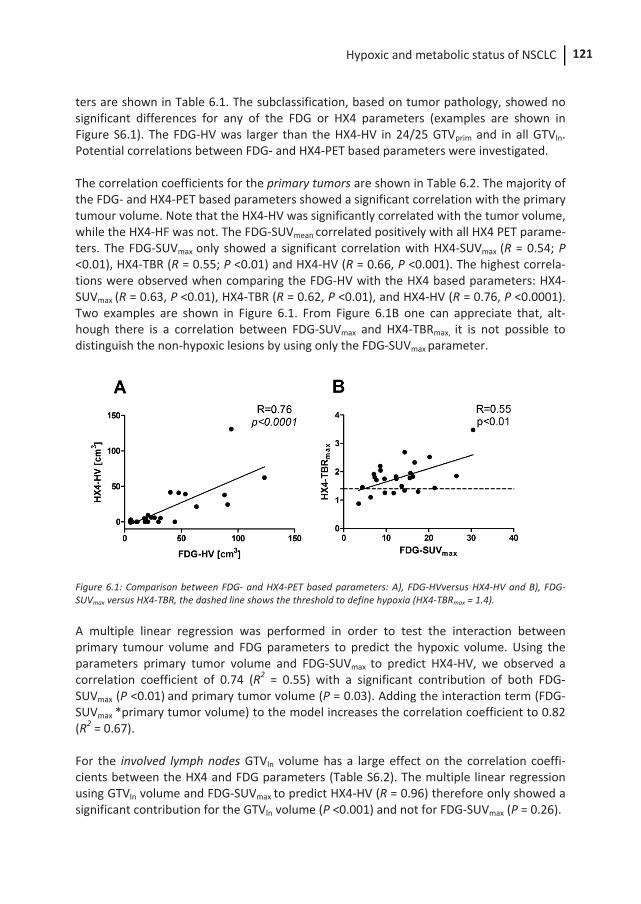
Hypoxic and metabolic status of NSCLC 121
ters are shown in Table 6.1. The subclassification, based on tumor pathology, showed no significant differences for any of the FDG or HX4 parameters (examples are shown in Figure S6.1). The FDG-HV was larger than the HX4-HV in 24/25 GTVprim and in all GTVln. Potential correlations between FDG- and HX4-PET based parameters were investigated. The correlation coefficients for the primary tumors are shown in Table 6.2. The majority of the FDG- and HX4-PET based parameters showed a significant correlation with the primary tumour volume. Note that the HX4-HV was significantly correlated with the tumor volume, while the HX4-HF was not. The FDG-SUVmean
correlated positively with all HX4 PET parame-ters. The FDG-SUVmax only showed a significant correlation with HX4-SUVmax (R = 0.54; P <0.01), HX4-TBR (R = 0.55; P <0.01) and HX4-HV (R = 0.66, P <0.001). The highest correla-tions were observed when comparing the FDG-HV with the HX4 based parameters: HX4-SUVmax (R = 0.63, P <0.01), HX4-TBR (R = 0.62, P <0.01), and HX4-HV (R = 0.76, P <0.0001). Two examples are shown in Figure 6.1. From Figure 6.1B one can appreciate that, alt-hough there is a correlation between FDG-SUVmax and HX4-TBRmax, it is not possible to distinguish the non-hypoxic lesions by using only the FDG-SUVmax parameter.
Figure 6.1: Comparison between FDG- and HX4-PET based parameters: A), FDG-HVversus HX4-HV and B), FDG-SUVmax versus HX4-TBR, the dashed line shows the threshold to define hypoxia (HX4-TBRmax = 1.4). A multiple linear regression was performed in order to test the interaction between primary tumour volume and FDG parameters to predict the hypoxic volume. Using the parameters primary tumor volume and FDG-SUVmax to predict HX4-HV, we observed a correlation coefficient of 0.74 (R2 = 0.55) with a significant contribution of both FDG-SUVmax (P <0.01) and primary tumor volume (P = 0.03). Adding the interaction term (FDG-SUVmax
*primary tumor volume) to the model increases the correlation coefficient to 0.82 (R2 = 0.67). For the involved lymph nodes GTVln volume has a large effect on the correlation coeffi-cients between the HX4 and FDG parameters (Table S6.2). The multiple linear regression using GTVln volume and FDG-SUVmax
to predict HX4-HV (R = 0.96) therefore only showed a significant contribution for the GTVln volume (P <0.001) and not for FDG-SUVmax (P = 0.26).
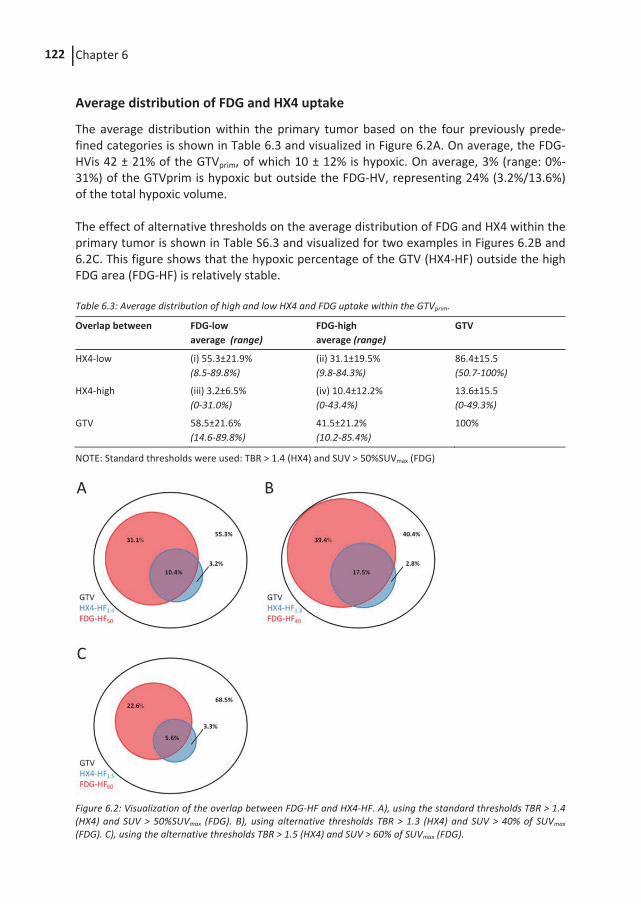
Chapter 6 122
Average distribution of FDG and HX4 uptake
The average distribution within the primary tumor based on the four previously prede-fined categories is shown in Table 6.3 and visualized in Figure 6.2A. On average, the FDG-HVis 42 ± 21% of the GTVprim, of which 10 ± 12% is hypoxic. On average, 3% (range: 0%-31%) of the GTVprim is hypoxic but outside the FDG-HV, representing 24% (3.2%/13.6%) of the total hypoxic volume. The effect of alternative thresholds on the average distribution of FDG and HX4 within the primary tumor is shown in Table S6.3 and visualized for two examples in Figures 6.2B and 6.2C. This figure shows that the hypoxic percentage of the GTV (HX4-HF) outside the high FDG area (FDG-HF) is relatively stable. Table 6.3: Average distribution of high and low HX4 and FDG uptake within the GTVprim.
Overlap between FDG-low average (range)
FDG-high average (range)
GTV
HX4-low (i) 55.3±21.9% (8.5-89.8%)
(ii) 31.1±19.5% (9.8-84.3%)
86.4±15.5 (50.7-100%)
HX4-high (iii) 3.2±6.5% (0-31.0%)
(iv) 10.4±12.2% (0-43.4%)
13.6±15.5 (0-49.3%)
GTV 58.5±21.6% (14.6-89.8%)
41.5±21.2% (10.2-85.4%)
100%
NOTE: Standard thresholds were used: TBR > 1.4 (HX4) and SUV > 50%SUVmax (FDG)
Figure 6.2: Visualization of the overlap between FDG-HF and HX4-HF. A), using the standard thresholds TBR > 1.4 (HX4) and SUV > 50%SUVmax (FDG). B), using alternative thresholds TBR > 1.3 (HX4) and SUV > 40% of SUVmax (FDG). C), using the alternative thresholds TBR > 1.5 (HX4) and SUV > 60% of SUVmax (FDG).
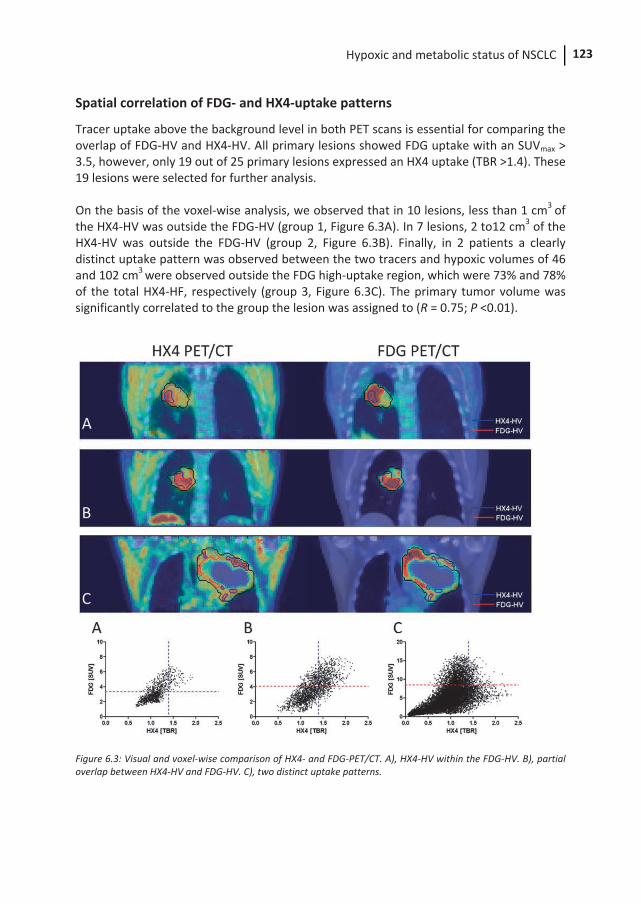
Hypoxic and metabolic status of NSCLC 123
Spatial correlation of FDG- and HX4-uptake patterns
Tracer uptake above the background level in both PET scans is essential for comparing the overlap of FDG-HV and HX4-HV. All primary lesions showed FDG uptake with an SUVmax > 3.5, however, only 19 out of 25 primary lesions expressed an HX4 uptake (TBR >1.4). These 19 lesions were selected for further analysis. On the basis of the voxel-wise analysis, we observed that in 10 lesions, less than 1 cm3 of the HX4-HV was outside the FDG-HV (group 1, Figure 6.3A). In 7 lesions, 2 to12 cm3 of the HX4-HV was outside the FDG-HV (group 2, Figure 6.3B). Finally, in 2 patients a clearly distinct uptake pattern was observed between the two tracers and hypoxic volumes of 46 and 102 cm3 were observed outside the FDG high-uptake region, which were 73% and 78% of the total HX4-HF, respectively (group 3, Figure 6.3C). The primary tumor volume was significantly correlated to the group the lesion was assigned to (R = 0.75; P <0.01).
Figure 6.3: Visual and voxel-wise comparison of HX4- and FDG-PET/CT. A), HX4-HV within the FDG-HV. B), partial overlap between HX4-HV and FDG-HV. C), two distinct uptake patterns.
Chapter 6 124
DISCUSSION
This study was initiated to assess the correlation of (spatial) uptake patterns of hypoxia (using HX4-PET) and tumor metabolism (using FDG-PET) in primary NSCLC and associated lymph node metastases. Both biological features are known to have an adverse impact on treatment outcome in NSCLC. FDG-PET is routinely used in clinical practice for staging, radiotherapy planning and treatment response monitoring, while the use of hypoxia (HX4) PET imaging is still limited to clinical trials. We show in 25 NSCLC patients, with different histopathological subtypes, that HX4-PET imaging provides additional information to FDG PET which can be used to individualize patient treatment. The relationship between HX4- and FDG-PET was investigated at a tumor level by compar-ing the overall uptake within the GTVs of the primary tumor and lymph node metastases. Significant correlations were observed between GTV, HX4- and FDG-PET image parame-ters. Previous studies comparing the overall uptake of hypoxia PET and FDG PET showed varying results. No correlations were observed by Bollineni and colleagues (7) or Cherk and colleagues (21), while Vera and colleagues (22) reported a significant correlation. Gagel and colleagues (23) compared FDG and FMISO uptake to the gold standard of hypoxia measurements (pO2 polarography) and observed a moderate correlation for FMISO but no correlation for FDG. However, because both FDG-SUVmax and GTV are predictors of survival in NSCLC (24-26) and the amount of tumor hypoxia is related to outcome after radiotherapy (27), the reported correlation between hypoxia and FDG PET is plausible. Information about hypoxia on a tumor level can be used in clinical practice to select patients who may benefit from hypoxia modification before or during anti-cancer treat-ment. Previous studies have shown that the addition of hypoxic modification during radiotherapy results in an increased therapeutic benefit (28). Recently, Arrieta and col-leagues (29) investigated in NSCLC patients the use of nitroglycerin (an organic nitrate which causes vasodilatation, increased blow flow and reduces the expression of HIF1-α) in combination with chemo-radiation. In this study promising response rates were observed, however, there was also (mild) increased toxicity (e.g. headache, hypotension) due to nitroglycerin administration. Another promising compound is the hypoxia-activated prodrug TH-302 which releases bromo isophosphoramide mustard, a potent DNA alkylat-ing agent, in hypoxic regions. Saggar and Tannock (30) recently demonstrated that TH-302 administered together with chemotherapy enhances the antitumor effect but also in-creases toxicity. From these recent studies, we acknowledge the therapeutic effect of additional anti-hypoxia treatment, but also the importance to limit unnecessary toxicity by selecting patients who will benefit from these modifications. We show that we can non-invasively visualize and quantify tumor hypoxia, using HX4 PET, in patients with NSLSC. In addition, our results show that patients with a larger tumor size and higher FDG uptake are more likely to have a larger hypoxic volume. This combination (GTV size and FDG uptake) could be used as a surrogate for hypoxia PET imaging, however, despite the correlation between hypoxia and FDG parameters, the distinction between hypoxic and
Hypoxic and metabolic status of NSCLC 125
non-hypoxic tumors based on FDG PET can be misleading, since non-hypoxic tumors are present in a broad range of FDG uptake (FDG-SUVmax: 3.5 - 17.5 also shown in Figure 6.1B). It is important to note that a correlation at a global tumor level provides no information about the intratumoral heterogeneity. At the moment, limited data is available concerning the correlation of hypoxia PET and FDG PET at a subvolume (e.g. voxel) level in NSCLC (7, 31). The spatial concordance and discordance of both PET modalities is of interest for radiotherapy boosting strategies. FDG-PET is already used in the context of clinical trials to boost highly metabolic tumor subvolumes (18, 32). We hypothesize that hypoxia PET imaging may be more selective in defining radioresistant voxels within the GTV, and can provide complementary information regarding the definition of radiotherapy boost vol-umes. A voxel-wise comparison was performed to evaluate the spatial distribution of the HX4 and FDG uptake. A reasonable correlation between both tracers was observed in the majority of patients. This is in contradiction to the previous published results of Bollineni and colleagues (7), who observed no correlation between FDG and the hypoxia PET tracer FAZA. This disagreement can probably be explained by the definition of the target lesion. Bollineni and colleagues used an FDG based threshold to define the target lesion, thereby excluding voxels with a low FDG uptake. Conversely, Lohith and colleagues (31) reported a similar spatial distribution of [62Cu]ATSM and FDG in 5 patients with an adenocarcinoma of the lung, which was not present in patients with SCC. Also, they observed a difference in intra-tumoral distribution between adenocarcinoma and SCC, which was not observed in our cohort of patients with NSCLC. It is well described that hypoxia leads to an increased uptake of glucose through various molecular mechanisms (33). Nevertheless, an increased glycolysis is also observed without hypoxia, e.g. by c-myc aberrations (34). From a molecu-lar point of view, it is therefore logical that FDG uptake and hypoxia is partially overlap-ping and is highly dependent on the genetics of the tumour. Thresholds were defined arbitrarily to define regions with a high or low uptake on both FDG- and HX4-PET. The high FDG-PET volume was defined based on the ongoing NSCLC boost trial (18), whereas the high HX4 region was based on previous publications, indicat-ing that a threshold of TBR>1.4 is rational to define hypoxia (6, 8, 35, 36). These thresholds showed the HX4-HV to be three times smaller on average than the FDG-HV. This work can be used in clinical setting to divide patients with a hypoxic lesion into different groups, stratifying lesions with an agreement or disagreement between the HX4- and FDG-PET uptake pattern. In the patients with a concordance, the use of HX4 PET has limited additional value for the selection of the radiotherapy boost volume, however, this volume could be limited to HX4-high areas only, facilitating further dose escalation with-out comprising the surrounding healthy tissue. In other patients a (partial) discordance between the HX4 and FDG PET uptake pattern was observed. In these patients, the boost region could be adjusted to either HX4 PET or a combination of HX4 and FDG PET with the aim to improve loco-regional control. On the basis of the current analysis, a radiation boost to the FDG high area (SUV > 50% SUVmax) would on average miss 24% of the hypoxic volume, which seems in agreement with the residual activity after radiotherapy outside the high-FDG area as reported by Aerts and colleagues (11). Previous studies have already shown that radiotherapy dose distribution based on tumor hypoxia is possible and promis-
Chapter 6 126
ing (37, 38). Currently there are strategies available to investigate the original location of local recurrences inside the tumor volume (39). These studies will characterize the sub-volumes inside the heteregenous tumour that are difficult to control. Ultimately, the effect of tumour subvolume characterization and targeting, by radiotherapy or other therapeutic interventions, needs to be assessed in a randomized trial. This study has several limitations. First, most patients received chemotherapy before the start of radiotherapy and PET imaging. Chemotherapy can reduce the amount of tumor hypoxia and downregulates metabolism, resulting in a decreased uptake of HX4 and FDG (40). However, the focus of our research is on the correlation between both imaging modalities, therefore treatment differences between patients are less relevant. In addi-tion, it is most important to have recent PET information before the start of (adaptive) radiotherapy. Second, we were not able to validate the current imaging observations on tumor specimens. Nevertheless, van Baardwijk and colleagues (41) showed previously that FDG-PET imaging is correlated to GLUT-1 and HIF-1α expression in NSCLC patients and Dubois and colleagues (8) showed a high correlation between HX4-PET uptake and pi-monidazole staining in a rat rhabdomyosarcoma model. Third, the study acquired PET scans in free-breathing, which might cause blurring of the PET signal. Although, since both the FDG and HX4 scans were obtained in this setting, we do not expect any substantial bias for the comparison. Furthermore, advanced stage tumors are known to show little breathing induced motion (42, 43). Fourth, the FDG-PET/CT was rigidly registered to the HX4-PET/CT scan to compare spatial uptake patterns. Small errors in registration can have a significant effect on correlation (44). However, patients in the current study were aligned in radiotherapy treatment position providing a strong basis for accurate registra-tion. Fifth, there was a small time interval between the FDG- and HX4-PET/CT scan. Changes in anatomy, tumor metabolism or hypoxia may have occurred in this interval and influenced the comparison results. The time interval in our study was short (median, 3 days) and no interventions (e.g., chemotherapy or radiotherapy) were performed between the two scans, limiting the chances of anatomical or physiological changes. Finally, the usability of a tracer for radiation dose-painting is dependent on its spatial reproducibility. Aerts and colleagues (45) showed that the location of low and high FDG volumes were stable during radiotherapy. The short-time reproducibility for HX4 (2 vs. 4 hours) was confirmed, but the long-term reproducibility is still unknown (6). However, a high repro-ducibility has been reported by Busk and colleagues (46) and Okamoto and colleagues (47) for the alternative hypoxia tracers FMISO and FAZA. In conclusion, there is a positive correlation between GTV, FDG- and HX4-uptake parame-ters on a tumor level. The hypoxic tumor volume is on average three times smaller than the metabolic active tumor volume. Approximately half of the lesions showed a good spatial correlation between the PET tracers. In the other cases, a (partial) mismatch was observed. Hypoxia PET imaging gives complimentary information to metabolic FDG imaging, which can potentially be used to individualize patient treatment by selecting patients for treatment with hypoxic sensitizers or hypoxia PET based radiotherapy dose escalation.
Hypoxic and metabolic status of NSCLC 127
ACKNOWLEDGEMENTS
The authors would like to thank the patients who agreed to participate, C. Overhof for handling the data-management for both clinical trials and R. Franssen for the data acquisi-tion. This study was financially supported by the NIH(NIH-USA U01 CA 143062-01, Radi-omics of NSCLC), the CTMM framework (AIRFORCE project, grant 030-103), the EU 6th and 7th framework program (METOXIA, EURECA, ARTFORCE), euroCAT (IVA Interreg - www.eurocat.info), and the Kankeronderzoekfonds Limburg of the Health Foundation Limburg and the Dutch Cancer Society (KWF UM 2011-5020, KWF UM 2009-4454, KWF MAC 2011-4970, KWF MAC 2013-6425).
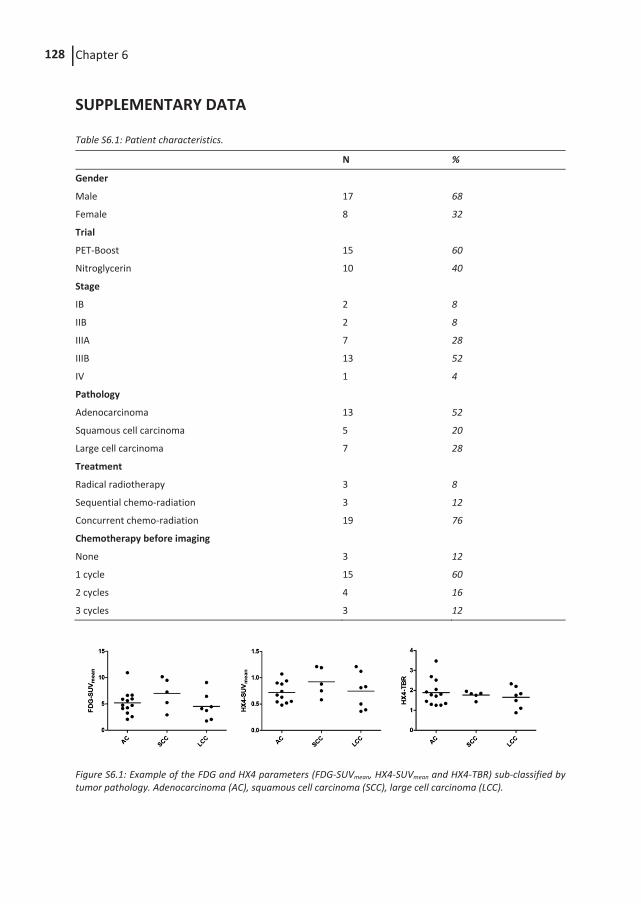
Chapter 6 128
SUPPLEMENTARY DATA
Table S6.1: Patient characteristics.
N %
Gender
Male 17 68
Female 8 32
Trial
PET-Boost 15 60
Nitroglycerin 10 40
Stage
IB 2 8
IIB 2 8
IIIA 7 28
IIIB 13 52
IV 1 4
Pathology
Adenocarcinoma 13 52
Squamous cell carcinoma 5 20
Large cell carcinoma 7 28
Treatment
Radical radiotherapy 3 8
Sequential chemo-radiation 3 12
Concurrent chemo-radiation 19 76
Chemotherapy before imaging
None 3 12
1 cycle 15 60
2 cycles 4 16
3 cycles 3 12
Figure S6.1: Example of the FDG and HX4 parameters (FDG-SUVmean, HX4-SUVmean and HX4-TBR) sub-classified by tumor pathology. Adenocarcinoma (AC), squamous cell carcinoma (SCC), large cell carcinoma (LCC).
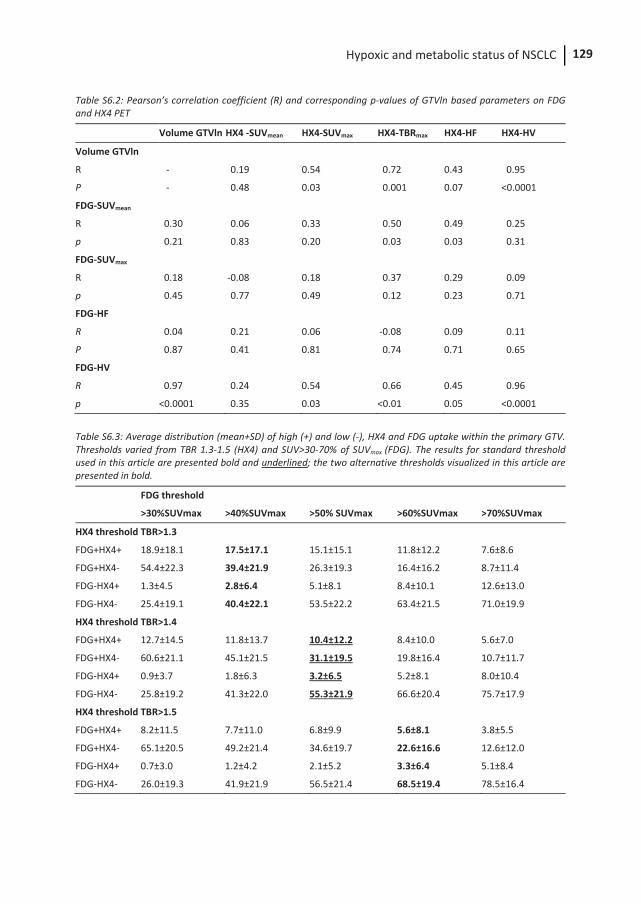
Hypoxic and metabolic status of NSCLC 129
Table S6.2: Pearson’s correlation coefficient (R) and corresponding p-values of GTVln based parameters on FDG and HX4 PET
Volume GTVln HX4 -SUVmean HX4-SUVmax HX4-TBRmax HX4-HF HX4-HV
Volume GTVln
R - 0.19 0.54 0.72 0.43 0.95
P - 0.48 0.03 0.001 0.07 <0.0001
FDG-SUVmean
R 0.30 0.06 0.33 0.50 0.49 0.25
p 0.21 0.83 0.20 0.03 0.03 0.31
FDG-SUVmax
R 0.18 -0.08 0.18 0.37 0.29 0.09
p 0.45 0.77 0.49 0.12 0.23 0.71
FDG-HF
R 0.04 0.21 0.06 -0.08 0.09 0.11
P 0.87 0.41 0.81 0.74 0.71 0.65
FDG-HV
R 0.97 0.24 0.54 0.66 0.45 0.96
p <0.0001 0.35 0.03 <0.01 0.05 <0.0001
Table S6.3: Average distribution (mean+SD) of high (+) and low (-), HX4 and FDG uptake within the primary GTV. Thresholds varied from TBR 1.3-1.5 (HX4) and SUV>30-70% of SUVmax (FDG). The results for standard threshold used in this article are presented bold and underlined; the two alternative thresholds visualized in this article are presented in bold.
FDG threshold
>30%SUVmax >40%SUVmax >50% SUVmax >60%SUVmax >70%SUVmax
HX4 threshold TBR>1.3
FDG+HX4+ 18.9±18.1 17.5±17.1 15.1±15.1 11.8±12.2 7.6±8.6
FDG+HX4- 54.4±22.3 39.4±21.9 26.3±19.3 16.4±16.2 8.7±11.4
FDG-HX4+ 1.3±4.5 2.8±6.4 5.1±8.1 8.4±10.1 12.6±13.0
FDG-HX4- 25.4±19.1 40.4±22.1 53.5±22.2 63.4±21.5 71.0±19.9
HX4 threshold TBR>1.4
FDG+HX4+ 12.7±14.5 11.8±13.7 10.4±12.2 8.4±10.0 5.6±7.0
FDG+HX4- 60.6±21.1 45.1±21.5 31.1±19.5 19.8±16.4 10.7±11.7
FDG-HX4+ 0.9±3.7 1.8±6.3 3.2±6.5 5.2±8.1 8.0±10.4
FDG-HX4- 25.8±19.2 41.3±22.0 55.3±21.9 66.6±20.4 75.7±17.9
HX4 threshold TBR>1.5
FDG+HX4+ 8.2±11.5 7.7±11.0 6.8±9.9 5.6±8.1 3.8±5.5
FDG+HX4- 65.1±20.5 49.2±21.4 34.6±19.7 22.6±16.6 12.6±12.0
FDG-HX4+ 0.7±3.0 1.2±4.2 2.1±5.2 3.3±6.4 5.1±8.4
FDG-HX4- 26.0±19.3 41.9±21.9 56.5±21.4 68.5±19.4 78.5±16.4
Chapter 6 130
REFERENCES
1. Siegel R, Naishadham D, Jemal A. Cancer statistics, 2013. CA Cancer J Clin. 2013;63:11-30.
2. Auperin A, Le Pechoux C, Rolland E, Curran WJ, Furuse K, Fournel P, et al. Meta-analysis of concomitant versus sequential radiochemotherapy in locally advanced non-small-cell lung cancer. J Clin Oncol. 2010;28:2181-90.
3. Nordsmark M, Bentzen SM, Rudat V, Brizel D, Lartigau E, Stadler P, et al. Prognostic value of tumor oxygenation in 397 head and neck tumors after primary radiation therapy. An international multi-center study. Radiother Oncol. 2005;77:18-24.
4. Zips D, Zophel K, Abolmaali N, Perrin R, Abramyuk A, Haase R, et al. Exploratory prospective trial of hypoxia-specific PET imaging during radiochemotherapy in patients with locally advanced head-and-neck cancer. Radiother Oncol. 2012;105:21-8.
5. Milosevic M, Warde P, Menard C, Chung P, Toi A, Ishkanian A, et al. Tumor hypoxia predicts biochemical failure following radiotherapy for clinically localized prostate cancer. Clin Cancer Res. 2012;18:2108-14.
6. Zegers CM, van Elmpt W, Wierts R, Reymen B, Sharifi H, Ollers MC, et al. Hypoxia imaging with [(18)F]HX4 PET in NSCLC patients: Defining optimal imaging parameters. Radiother Oncol. 2013;109:58-64.
7. Bollineni VR, Kerner GS, Pruim J, Steenbakkers RJ, Wiegman EM, Koole MJ, et al. PET Imaging of Tumor Hypoxia Using 18F-Fluoroazomycin Arabinoside in Stage III-IV Non-Small Cell Lung Cancer Patients. J Nucl Med. 2013.
8. Dubois LJ, Lieuwes NG, Janssen MH, Peeters WJ, Windhorst AD, Walsh JC, et al. Preclinical evaluation and validation of [18F]HX4, a promising hypoxia marker for PET imaging. Proc Natl Acad Sci U S A. 2011;108:14620-5.
9. van Loon J, Janssen MH, Ollers M, Aerts HJ, Dubois L, Hochstenbag M, et al. PET imaging of hypoxia using [18F]HX4: a phase I trial. Eur J Nucl Med Mol Imaging. 2010;37:1663-8.
10. Chen L, Zhang Z, Kolb HC, Walsh JC, Zhang J, Guan Y. (1)(8)F-HX4 hypoxia imaging with PET/CT in head and neck cancer: a comparison with (1)(8)F-FMISO. Nucl Med Commun. 2012;33:1096-102.
11. Aerts HJ, van Baardwijk AA, Petit SF, Offermann C, Loon J, Houben R, et al. Identification of residual metabolic-active areas within individual NSCLC tumours using a pre-radiotherapy (18)Fluorodeoxyglucose-PET-CT scan. Radiother Oncol. 2009;91:386-92.
12. Abramyuk A, Tokalov S, Zophel K, Koch A, Szluha Lazanyi K, Gillham C, et al. Is pre-therapeutical FDG-PET/CT capable to detect high risk tumor subvolumes responsible for local failure in non-small cell lung cancer? Radiother Oncol. 2009;91:399-404.
13. Spijkerman J, Fontanarosa D, Das M, van Elmpt W. Validation of nonrigid registration in pretreatment and follow-up PET/CT scans for quantification of tumor residue in lung cancer patients; 2014.
14. Lambin P, van Stiphout RG, Starmans MH, Rios-Velazquez E, Nalbantov G, Aerts HJ, et al. Predicting outcomes in radiation oncology--multifactorial decision support systems. Nat Rev Clin Oncol. 2013;10:27-40.
Hypoxic and metabolic status of NSCLC 131
15. Aerts HJ, Lambin P, Ruysscher DD. FDG for dose painting: a rational choice. Radiother Oncol. 2010;97:163-4.
16. Lambin P, Petit SF, Aerts HJ, van Elmpt WJ, Oberije CJ, Starmans MH, et al. The ESTRO Breur Lecture 2009. From population to voxel-based radiotherapy: exploiting intra-tumour and intra-organ heterogeneity for advanced treatment of non-small cell lung cancer. Radiother Oncol. 2010;96:145-52.
17. Pereira KM, Chaves FN, Viana TS, Carvalho FS, Costa FW, Alves AP, et al. Oxygen metabolism in oral cancer: HIF and GLUTs (Review). Oncol Lett. 2013;6:311-6.
18. van Elmpt W, De Ruysscher D, van der Salm A, Lakeman A, van der Stoep J, Emans D, et al. The PET-boost randomised phase II dose-escalation trial in non-small cell lung cancer. Radiother Oncol. 2012;104:67-71.
19. Doss M, Zhang JJ, Belanger MJ, Stubbs JB, Hostetler ED, Alpaugh K, et al. Biodistribution and radiation dosimetry of the hypoxia marker 18F-HX4 in monkeys and humans determined by using whole-body PET/CT. Nucl Med Commun. 2010;31:1016-24.
20. Boellaard R, Oyen WJ, Hoekstra CJ, Hoekstra OS, Visser EP, Willemsen AT, et al. The Netherlands protocol for standardisation and quantification of FDG whole body PET studies in multi-centre trials. European journal of nuclear medicine and molecular imaging. 2008;35:2320-33.
21. Cherk MH, Foo SS, Poon AM, Knight SR, Murone C, Papenfuss AT, et al. Lack of correlation of hypoxic cell fraction and angiogenesis with glucose metabolic rate in non-small cell lung cancer assessed by 18F-Fluoromisonidazole and 18F-FDG PET. J Nucl Med. 2006;47:1921-6.
22. Vera P, Bohn P, Edet-Sanson A, Salles A, Hapdey S, Gardin I, et al. Simultaneous positron emission tomography (PET) assessment of metabolism with (1)(8)F-fluoro-2-deoxy-d-glucose (FDG), proliferation with (1)(8)F-fluoro-thymidine (FLT), and hypoxia with (1)(8)fluoro-misonidazole (F-miso) before and during radiotherapy in patients with non-small-cell lung cancer (NSCLC): a pilot study. Radiother Oncol. 2011;98:109-16.
23. Gagel B, Piroth M, Pinkawa M, Reinartz P, Zimny M, Kaiser HJ, et al. pO polarography, contrast enhanced color duplex sonography (CDS), [18F] fluoromisonidazole and [18F] fluorodeoxyglucose positron emission tomography: validated methods for the evaluation of therapy-relevant tumor oxygenation or only bricks in the puzzle of tumor hypoxia? BMC Cancer. 2007;7:113.
24. Cistaro A, Quartuccio N, Mojtahedi A, Fania P, Filosso PL, Campenni A, et al. Prediction of 2 years-survival in patients with stage I and II non-small cell lung cancer utilizing (18)F-FDG PET/CT SUV quantification. Radiol Oncol. 2013;47:219-23.
25. Tanaka H, Hayashi S, Hoshi H. Pretreatment maximum standardized uptake value on 18F-fluorodeoxyglucose positron emission tomography is a predictor of outcome for stage I non-small cell lung cancer after stereotactic body radiotherapy. Asia Pac J Clin Oncol. 2013.
26. Satoh Y, Onishi H, Nambu A, Araki T. Volume-based parameters measured by using FDG PET/CT in patients with stage I NSCLC treated with stereotactic body radiation therapy: prognostic value. Radiology. 2014;270:275-81.
27. Eschmann SM, Paulsen F, Reimold M, Dittmann H, Welz S, Reischl G, et al. Prognostic impact of hypoxia imaging with 18F-misonidazole PET in non-small cell lung cancer and head and neck cancer before radiotherapy. J Nucl Med. 2005;46:253-60.
Chapter 6 132
28. Overgaard J. Hypoxic modification of radiotherapy in squamous cell carcinoma of the head and neck--a systematic review and meta-analysis. Radiother Oncol. 2011;100:22-32.
29. Arrieta O, Blake M, de la Mata-Moya MD, Corona F, Turcott J, Orta D, et al. Phase II study. Concurrent chemotherapy and radiotherapy with nitroglycerin in locally advanced non-small cell lung cancer. Radiother Oncol. 2014;111:311-5.
30. Saggar JK, Tannock IF. Activity of the hypoxia-activated pro-drug TH-302 in hypoxic and perivascular regions of solid tumors and its potential to enhance therapeutic effects of chemotherapy. Int J Cancer. 2014;134:2726-34.
31. Lohith TG, Kudo T, Demura Y, Umeda Y, Kiyono Y, Fujibayashi Y, et al. Pathophysi-ologic correlation between 62Cu-ATSM and 18F-FDG in lung cancer. J Nucl Med. 2009;50:1948-53.
32. Moller DS, Khalil AA, Knap MM, Muren LP, Hoffmann L. A planning study of radiotherapy dose escalation of PET-active tumour volumes in non-small cell lung cancer patients. Acta Oncol. 2011;50:883-8.
33. Vander Heiden MG, Cantley LC, Thompson CB. Understanding the Warburg effect: the metabolic requirements of cell proliferation. Science. 2009;324:1029-33.
34. Dang CV, Le A, Gao P. MYC-induced cancer cell energy metabolism and therapeutic opportunities. Clin Cancer Res. 2009;15:6479-83.
35. Dubois L, Landuyt W, Haustermans K, Dupont P, Bormans G, Vermaelen P, et al. Evaluation of hypoxia in an experimental rat tumour model by [(18)F]fluoro-misonidazole PET and immunohistochemistry. Br J Cancer. 2004;91:1947-54.
36. Rasey JS, Koh WJ, Evans ML, Peterson LM, Lewellen TK, Graham MM, et al. Quantifying regional hypoxia in human tumors with positron emission tomography of [18F]fluoromisonidazole: a pretherapy study of 37 patients. Int J Radiat Oncol Biol Phys. 1996;36:417-28.
37. Petit SF, Dekker AL, Seigneuric R, Murrer L, van Riel NA, Nordsmark M, et al. Intra-voxel heterogeneity influences the dose prescription for dose-painting with radiotherapy: a modelling study. Phys Med Biol. 2009;54:2179-96.
38. Thorwarth D, Eschmann SM, Paulsen F, Alber M. Hypoxia dose painting by numbers: a planning study. Int J Radiat Oncol Biol Phys. 2007;68:291-300.
39. Due AK, Vogelius IR, Aznar MC, Bentzen SM, Berthelsen AK, Korreman SS, et al. Recurrences after intensity modulated radiotherapy for head and neck squamous cell carcinoma more likely to originate from regions with high baseline [18F]-FDG uptake. Radiother Oncol. 2014;111:360-5.
40. Bittner MI, Wiedenmann N, Bucher S, Hentschel M, Mix M, Weber WA, et al. Exploratory geographical analysis of hypoxic subvolumes using 18F-MISO-PET imaging in patients with head and neck cancer in the course of primary chemoradiotherapy. Radiother Oncol. 2013;108:511-6.
41. van Baardwijk A, Dooms C, van Suylen RJ, Verbeken E, Hochstenbag M, Dehing-Oberije C, et al. The maximum uptake of (18)F-deoxyglucose on positron emission tomography scan correlates with survival, hypoxia inducible factor-1alpha and GLUT-1 in non-small cell lung cancer. Eur J Cancer. 2007;43:1392-8.
42. Bosmans G, van Baardwijk A, Dekker A, Ollers M, Boersma L, Minken A, et al. Intra-patient variability of tumor volume and tumor motion during conventionally
Hypoxic and metabolic status of NSCLC 133
fractionated radiotherapy for locally advanced non-small-cell lung cancer: a prospective clinical study. Int J Radiat Oncol Biol Phys. 2006;66:748-53.
43. Yu ZH, Lin SH, Balter P, Zhang L, Dong L. A comparison of tumor motion characteristics between early stage and locally advanced stage lung cancers. Radiother Oncol. 2012;104:33-8.
44. Nyflot MJ, Harari PM, Yip S, Perlman SB, Jeraj R. Correlation of PET images of metabolism, proliferation and hypoxia to characterize tumor phenotype in patients with cancer of the oropharynx. Radiother Oncol. 2012;105:36-40.
45. Aerts HJ, Bosmans G, van Baardwijk AA, Dekker AL, Oellers MC, Lambin P, et al. Stability of 18F-deoxyglucose uptake locations within tumor during radiotherapy for NSCLC: a prospective study. Int J Radiat Oncol Biol Phys. 2008;71:1402-7.
46. Busk M, Mortensen LS, Nordsmark M, Overgaard J, Jakobsen S, Hansen KV, et al. PET hypoxia imaging with FAZA: reproducibility at baseline and during fractionated radiotherapy in tumour-bearing mice. European journal of nuclear medicine and molecular imaging. 2013;40:186-97.
47. Okamoto S, Shiga T, Yasuda K, Ito YM, Magota K, Kasai K, et al. High reproducibility of tumor hypoxia evaluated by 18F-fluoromisonidazole PET for head and neck cancer. J Nucl Med. 2013;54:201-7.

CHAPTER
Imaging of tumour hypoxia and metabolism in patients with head and neck squamous cell carcinoma
Catharina M.L. Zegers, Wouter van Elmpt, Frank J.P. Hoebers, Esther G.C. Troost, Michel C. Öllers, Felix M. Mottaghy, Philippe Lambin
Published in: Acta Oncol. 2015 54(9): 1378-84
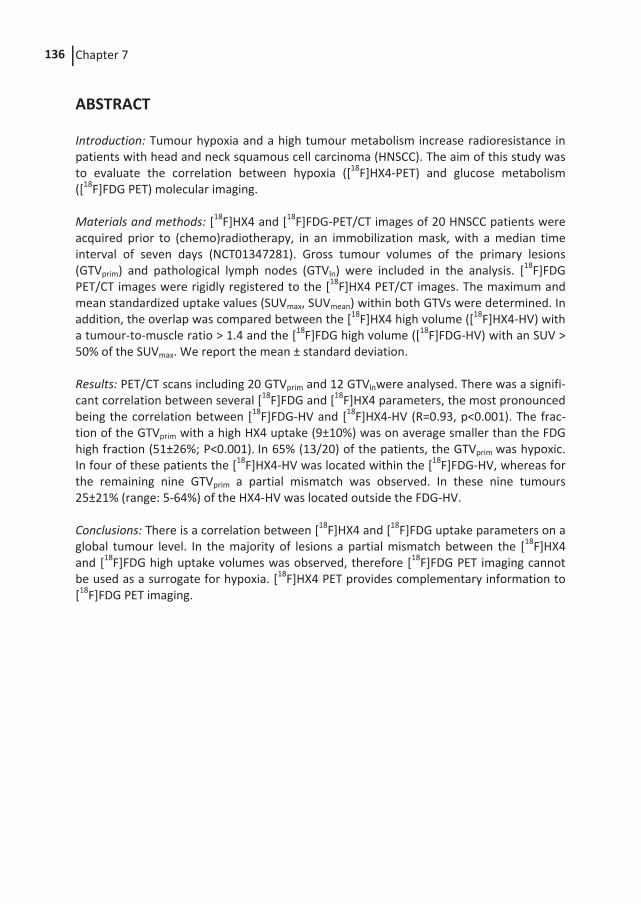
Chapter 7 136
ABSTRACT
Introduction: Tumour hypoxia and a high tumour metabolism increase radioresistance in patients with head and neck squamous cell carcinoma (HNSCC). The aim of this study was to evaluate the correlation between hypoxia ([18F]HX4-PET) and glucose metabolism ([18F]FDG PET) molecular imaging. Materials and methods: [18F]HX4 and [18F]FDG-PET/CT images of 20 HNSCC patients were acquired prior to (chemo)radiotherapy, in an immobilization mask, with a median time interval of seven days (NCT01347281). Gross tumour volumes of the primary lesions (GTVprim) and pathological lymph nodes (GTVln) were included in the analysis. [18F]FDG PET/CT images were rigidly registered to the [18F]HX4 PET/CT images. The maximum and mean standardized uptake values (SUVmax, SUVmean) within both GTVs were determined. In addition, the overlap was compared between the [18F]HX4 high volume ([18F]HX4-HV) with a tumour-to-muscle ratio > 1.4 and the [18F]FDG high volume ([18F]FDG-HV) with an SUV > 50% of the SUVmax. We report the mean ± standard deviation. Results: PET/CT scans including 20 GTVprim and 12 GTVlnwere analysed. There was a signifi-cant correlation between several [18F]FDG and [18F]HX4 parameters, the most pronounced being the correlation between [18F]FDG-HV and [18F]HX4-HV (R=0.93, p<0.001). The frac-tion of the GTVprim with a high HX4 uptake (9±10%) was on average smaller than the FDG high fraction (51±26%; P<0.001). In 65% (13/20) of the patients, the GTVprim was hypoxic. In four of these patients the [18F]HX4-HV was located within the [18F]FDG-HV, whereas for the remaining nine GTVprim a partial mismatch was observed. In these nine tumours 25±21% (range: 5-64%) of the HX4-HV was located outside the FDG-HV. Conclusions: There is a correlation between [18F]HX4 and [18F]FDG uptake parameters on a global tumour level. In the majority of lesions a partial mismatch between the [18F]HX4 and [18F]FDG high uptake volumes was observed, therefore [18F]FDG PET imaging cannot be used as a surrogate for hypoxia. [18F]HX4 PET provides complementary information to [18F]FDG PET imaging.
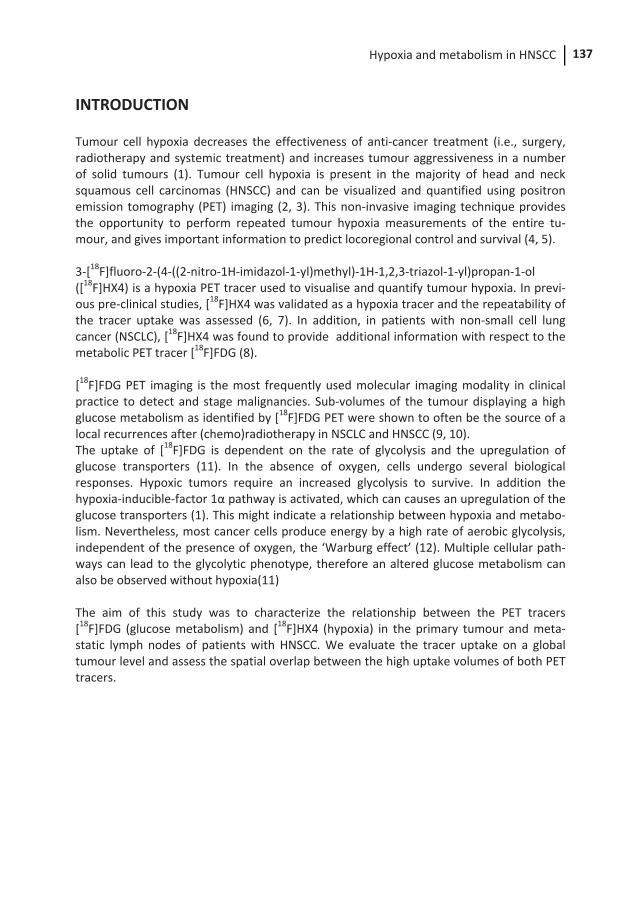
Hypoxia and metabolism in HNSCC 137
INTRODUCTION
Tumour cell hypoxia decreases the effectiveness of anti-cancer treatment (i.e., surgery, radiotherapy and systemic treatment) and increases tumour aggressiveness in a number of solid tumours (1). Tumour cell hypoxia is present in the majority of head and neck squamous cell carcinomas (HNSCC) and can be visualized and quantified using positron emission tomography (PET) imaging (2, 3). This non-invasive imaging technique provides the opportunity to perform repeated tumour hypoxia measurements of the entire tu-mour, and gives important information to predict locoregional control and survival (4, 5). 3-[18F]fluoro-2-(4-((2-nitro-1H-imidazol-1-yl)methyl)-1H-1,2,3-triazol-1-yl)propan-1-ol ([18F]HX4) is a hypoxia PET tracer used to visualise and quantify tumour hypoxia. In previ-ous pre-clinical studies, [18F]HX4 was validated as a hypoxia tracer and the repeatability of the tracer uptake was assessed (6, 7). In addition, in patients with non-small cell lung cancer (NSCLC), [18F]HX4 was found to provide additional information with respect to the metabolic PET tracer [18F]FDG (8). [18F]FDG PET imaging is the most frequently used molecular imaging modality in clinical practice to detect and stage malignancies. Sub-volumes of the tumour displaying a high glucose metabolism as identified by [18F]FDG PET were shown to often be the source of a local recurrences after (chemo)radiotherapy in NSCLC and HNSCC (9, 10). The uptake of [18F]FDG is dependent on the rate of glycolysis and the upregulation of glucose transporters (11). In the absence of oxygen, cells undergo several biological responses. Hypoxic tumors require an increased glycolysis to survive. In addition the hypoxia-inducible-factor 1α pathway is activated, which can causes an upregulation of the glucose transporters (1). This might indicate a relationship between hypoxia and metabo-lism. Nevertheless, most cancer cells produce energy by a high rate of aerobic glycolysis, independent of the presence of oxygen, the ‘Warburg effect’ (12). Multiple cellular path-ways can lead to the glycolytic phenotype, therefore an altered glucose metabolism can also be observed without hypoxia(11) The aim of this study was to characterize the relationship between the PET tracers [18F]FDG (glucose metabolism) and [18F]HX4 (hypoxia) in the primary tumour and meta-static lymph nodes of patients with HNSCC. We evaluate the tracer uptake on a global tumour level and assess the spatial overlap between the high uptake volumes of both PET tracers.
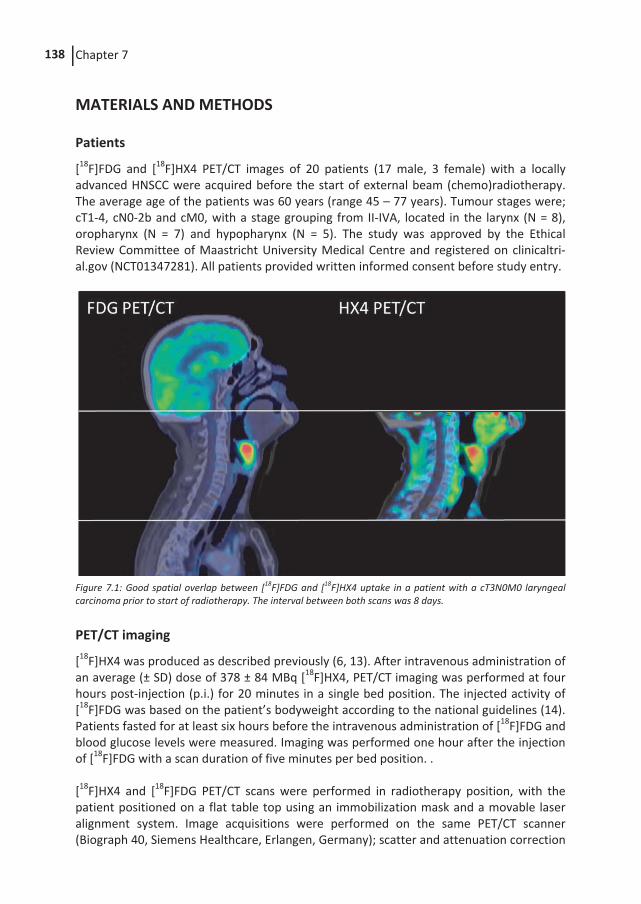
Chapter 7 138
MATERIALS AND METHODS
Patients
[18F]FDG and [18F]HX4 PET/CT images of 20 patients (17 male, 3 female) with a locally advanced HNSCC were acquired before the start of external beam (chemo)radiotherapy. The average age of the patients was 60 years (range 45 – 77 years). Tumour stages were; cT1-4, cN0-2b and cM0, with a stage grouping from II-IVA, located in the larynx (N = 8), oropharynx (N = 7) and hypopharynx (N = 5). The study was approved by the Ethical Review Committee of Maastricht University Medical Centre and registered on clinicaltri-al.gov (NCT01347281). All patients provided written informed consent before study entry.
Figure 7.1: Good spatial overlap between [18F]FDG and [18F]HX4 uptake in a patient with a cT3N0M0 laryngeal carcinoma prior to start of radiotherapy. The interval between both scans was 8 days.
PET/CT imaging
[18F]HX4 was produced as described previously (6, 13). After intravenous administration of an average (± SD) dose of 378 ± 84 MBq [18F]HX4, PET/CT imaging was performed at four hours post-injection (p.i.) for 20 minutes in a single bed position. The injected activity of [18F]FDG was based on the patient’s bodyweight according to the national guidelines (14). Patients fasted for at least six hours before the intravenous administration of [18F]FDG and blood glucose levels were measured. Imaging was performed one hour after the injection of [18F]FDG with a scan duration of five minutes per bed position. . [18F]HX4 and [18F]FDG PET/CT scans were performed in radiotherapy position, with the patient positioned on a flat table top using an immobilization mask and a movable laser alignment system. Image acquisitions were performed on the same PET/CT scanner (Biograph 40, Siemens Healthcare, Erlangen, Germany); scatter and attenuation correction
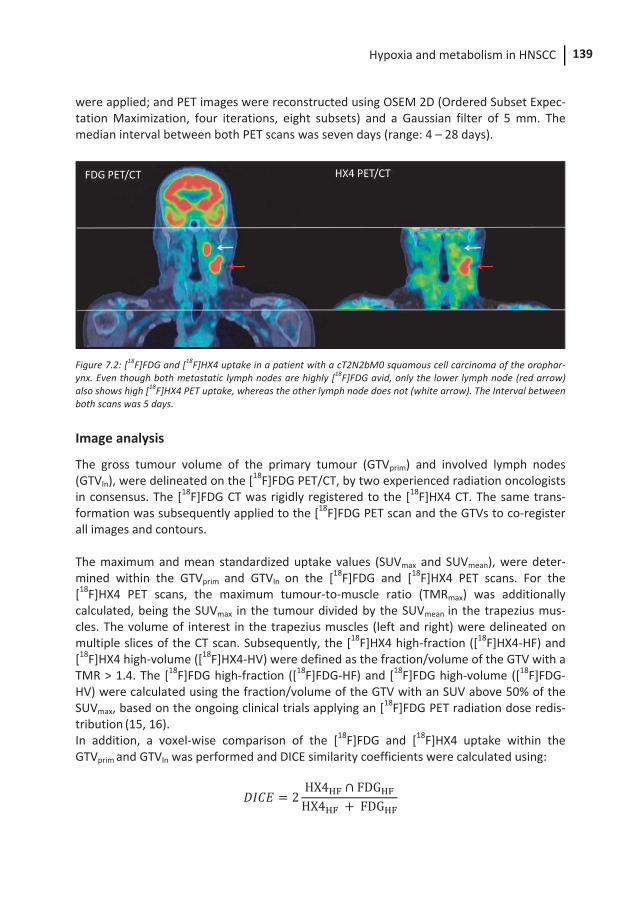
Hypoxia and metabolism in HNSCC 139
were applied; and PET images were reconstructed using OSEM 2D (Ordered Subset Expec-tation Maximization, four iterations, eight subsets) and a Gaussian filter of 5 mm. The median interval between both PET scans was seven days (range: 4 – 28 days).
Figure 7.2: [18F]FDG and [18F]HX4 uptake in a patient with a cT2N2bM0 squamous cell carcinoma of the orophar-ynx. Even though both metastatic lymph nodes are highly [18F]FDG avid, only the lower lymph node (red arrow) also shows high [18F]HX4 PET uptake, whereas the other lymph node does not (white arrow). The Interval between both scans was 5 days.
Image analysis
The gross tumour volume of the primary tumour (GTVprim) and involved lymph nodes (GTVln), were delineated on the [18F]FDG PET/CT, by two experienced radiation oncologists in consensus. The [18F]FDG CT was rigidly registered to the [18F]HX4 CT. The same trans-formation was subsequently applied to the [18F]FDG PET scan and the GTVs to co-register all images and contours. The maximum and mean standardized uptake values (SUVmax and SUVmean), were deter-mined within the GTVprim and GTVln on the [18F]FDG and [18F]HX4 PET scans. For the [18F]HX4 PET scans, the maximum tumour-to-muscle ratio (TMRmax) was additionally calculated, being the SUVmax in the tumour divided by the SUVmean in the trapezius mus-cles. The volume of interest in the trapezius muscles (left and right) were delineated on multiple slices of the CT scan. Subsequently, the [18F]HX4 high-fraction ([18F]HX4-HF) and [18F]HX4 high-volume ([18F]HX4-HV) were defined as the fraction/volume of the GTV with a TMR > 1.4. The [18F]FDG high-fraction ([18F]FDG-HF) and [18F]FDG high-volume ([18F]FDG-HV) were calculated using the fraction/volume of the GTV with an SUV above 50% of the SUVmax, based on the ongoing clinical trials applying an [18F]FDG PET radiation dose redis-tribution (15, 16). In addition, a voxel-wise comparison of the [18F]FDG and [18F]HX4 uptake within the GTVprim and GTVln was performed and DICE similarity coefficients were calculated using: = 2 HX4 ∩ FDGHX4 +FDG
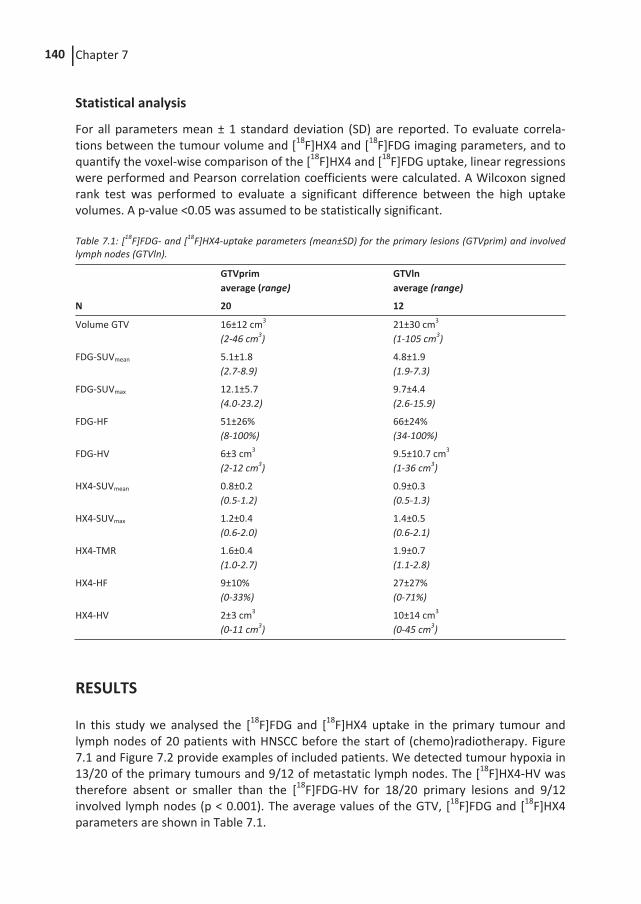
Chapter 7 140
Statistical analysis
For all parameters mean ± 1 standard deviation (SD) are reported. To evaluate correla-tions between the tumour volume and [18F]HX4 and [18F]FDG imaging parameters, and to quantify the voxel-wise comparison of the [18F]HX4 and [18F]FDG uptake, linear regressions were performed and Pearson correlation coefficients were calculated. A Wilcoxon signed rank test was performed to evaluate a significant difference between the high uptake volumes. A p-value <0.05 was assumed to be statistically significant.
RESULTS
In this study we analysed the [18F]FDG and [18F]HX4 uptake in the primary tumour and lymph nodes of 20 patients with HNSCC before the start of (chemo)radiotherapy. Figure 7.1 and Figure 7.2 provide examples of included patients. We detected tumour hypoxia in 13/20 of the primary tumours and 9/12 of metastatic lymph nodes. The [18F]HX4-HV was therefore absent or smaller than the [18F]FDG-HV for 18/20 primary lesions and 9/12 involved lymph nodes (p < 0.001). The average values of the GTV, [18F]FDG and [18F]HX4 parameters are shown in Table 7.1.
Table 7.1: [18F]FDG- and [18F]HX4-uptake parameters (mean±SD) for the primary lesions (GTVprim) and involved lymph nodes (GTVln).
GTVprim average (range)
GTVln average (range)
N 20 12
Volume GTV 16±12 cm3
(2-46 cm3) 21±30 cm3 (1-105 cm3)
FDG-SUVmean 5.1±1.8 (2.7-8.9)
4.8±1.9 (1.9-7.3)
FDG-SUVmax 12.1±5.7 (4.0-23.2)
9.7±4.4 (2.6-15.9)
FDG-HF 51±26% (8-100%)
66±24% (34-100%)
FDG-HV 6±3 cm3 (2-12 cm3)
9.5±10.7 cm3 (1-36 cm3)
HX4-SUVmean 0.8±0.2 (0.5-1.2)
0.9±0.3 (0.5-1.3)
HX4-SUVmax 1.2±0.4 (0.6-2.0)
1.4±0.5 (0.6-2.1)
HX4-TMR 1.6±0.4 (1.0-2.7)
1.9±0.7 (1.1-2.8)
HX4-HF 9±10% (0-33%)
27±27% (0-71%)
HX4-HV 2±3 cm3 (0-11 cm3)
10±14 cm3 (0-45 cm3)
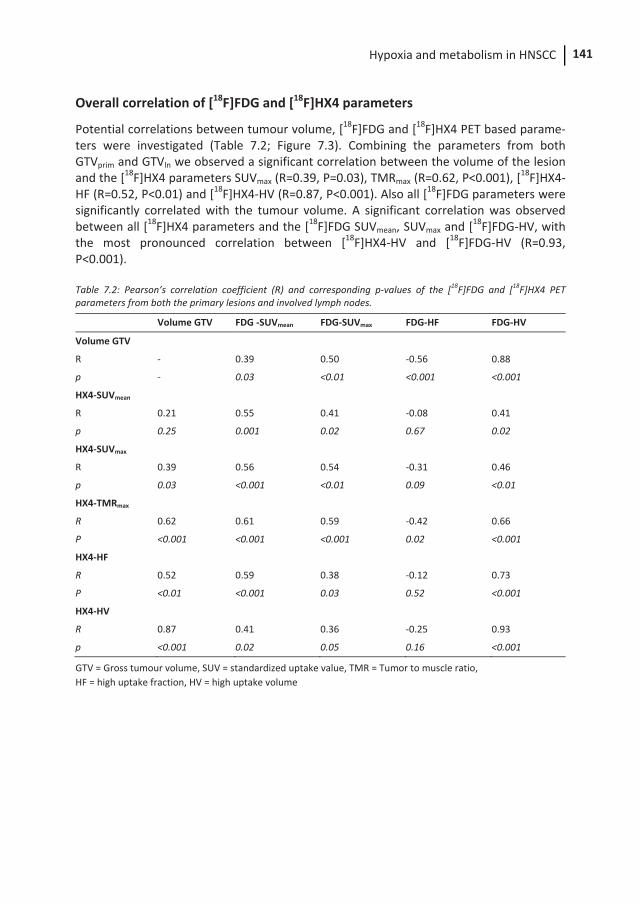
Hypoxia and metabolism in HNSCC 141
Overall correlation of [18F]FDG and [18F]HX4 parameters
Potential correlations between tumour volume, [18F]FDG and [18F]HX4 PET based parame-ters were investigated (Table 7.2; Figure 7.3). Combining the parameters from both GTVprim and GTVln we observed a significant correlation between the volume of the lesion and the [18F]HX4 parameters SUVmax (R=0.39, P=0.03), TMRmax (R=0.62, P<0.001), [18F]HX4-HF (R=0.52, P<0.01) and [18F]HX4-HV (R=0.87, P<0.001). Also all [18F]FDG parameters were significantly correlated with the tumour volume. A significant correlation was observed between all [18F]HX4 parameters and the [18F]FDG SUVmean, SUVmax and [18F]FDG-HV, with the most pronounced correlation between [18F]HX4-HV and [18F]FDG-HV (R=0.93, P<0.001). Table 7.2: Pearson’s correlation coefficient (R) and corresponding p-values of the [18F]FDG and [18F]HX4 PET parameters from both the primary lesions and involved lymph nodes.
Volume GTV FDG -SUVmean FDG-SUVmax FDG-HF FDG-HV
Volume GTV
R - 0.39 0.50 -0.56 0.88
p - 0.03 <0.01 <0.001 <0.001
HX4-SUVmean
R 0.21 0.55 0.41 -0.08 0.41
p 0.25 0.001 0.02 0.67 0.02
HX4-SUVmax
R 0.39 0.56 0.54 -0.31 0.46
p 0.03 <0.001 <0.01 0.09 <0.01
HX4-TMRmax
R 0.62 0.61 0.59 -0.42 0.66
P <0.001 <0.001 <0.001 0.02 <0.001
HX4-HF
R 0.52 0.59 0.38 -0.12 0.73
P <0.01 <0.001 0.03 0.52 <0.001
HX4-HV
R 0.87 0.41 0.36 -0.25 0.93
p <0.001 0.02 0.05 0.16 <0.001
GTV = Gross tumour volume, SUV = standardized uptake value, TMR = Tumor to muscle ratio, HF = high uptake fraction, HV = high uptake volume
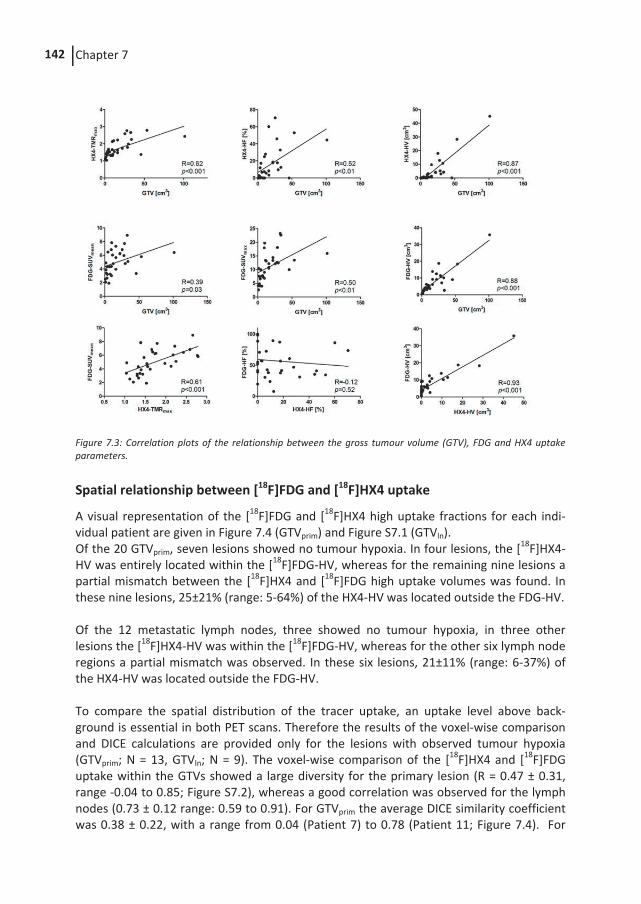
Chapter 7 142
Figure 7.3: Correlation plots of the relationship between the gross tumour volume (GTV), FDG and HX4 uptake parameters.
Spatial relationship between [18F]FDG and [18F]HX4 uptake
A visual representation of the [18F]FDG and [18F]HX4 high uptake fractions for each indi-vidual patient are given in Figure 7.4 (GTVprim) and Figure S7.1 (GTVln). Of the 20 GTVprim, seven lesions showed no tumour hypoxia. In four lesions, the [18F]HX4-HV was entirely located within the [18F]FDG-HV, whereas for the remaining nine lesions a partial mismatch between the [18F]HX4 and [18F]FDG high uptake volumes was found. In these nine lesions, 25±21% (range: 5-64%) of the HX4-HV was located outside the FDG-HV. Of the 12 metastatic lymph nodes, three showed no tumour hypoxia, in three other lesions the [18F]HX4-HV was within the [18F]FDG-HV, whereas for the other six lymph node regions a partial mismatch was observed. In these six lesions, 21±11% (range: 6-37%) of the HX4-HV was located outside the FDG-HV. To compare the spatial distribution of the tracer uptake, an uptake level above back-ground is essential in both PET scans. Therefore the results of the voxel-wise comparison and DICE calculations are provided only for the lesions with observed tumour hypoxia (GTVprim; N = 13, GTVln; N = 9). The voxel-wise comparison of the [18F]HX4 and [18F]FDG uptake within the GTVs showed a large diversity for the primary lesion (R = 0.47 ± 0.31, range -0.04 to 0.85; Figure S7.2), whereas a good correlation was observed for the lymph nodes (0.73 ± 0.12 range: 0.59 to 0.91). For GTVprim the average DICE similarity coefficient was 0.38 ± 0.22, with a range from 0.04 (Patient 7) to 0.78 (Patient 11; Figure 7.4). For
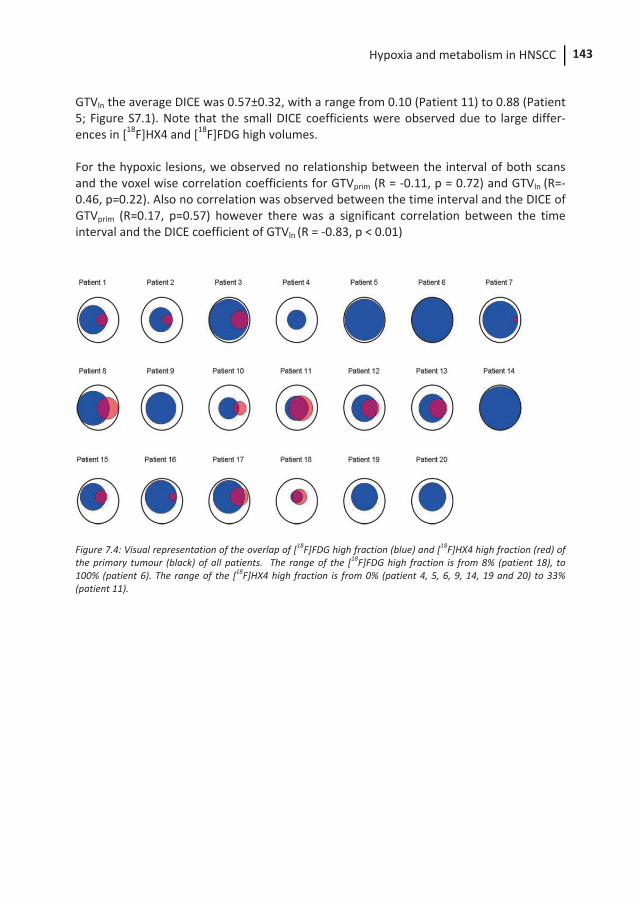
Hypoxia and metabolism in HNSCC 143
GTVln the average DICE was 0.57±0.32, with a range from 0.10 (Patient 11) to 0.88 (Patient 5; Figure S7.1). Note that the small DICE coefficients were observed due to large differ-ences in [18F]HX4 and [18F]FDG high volumes. For the hypoxic lesions, we observed no relationship between the interval of both scans and the voxel wise correlation coefficients for GTVprim (R = -0.11, p = 0.72) and GTVln (R=-0.46, p=0.22). Also no correlation was observed between the time interval and the DICE of GTVprim (R=0.17, p=0.57) however there was a significant correlation between the time interval and the DICE coefficient of GTVln (R = -0.83, p < 0.01)
Figure 7.4: Visual representation of the overlap of [18F]FDG high fraction (blue) and [18F]HX4 high fraction (red) of the primary tumour (black) of all patients. The range of the [18F]FDG high fraction is from 8% (patient 18), to 100% (patient 6). The range of the [18F]HX4 high fraction is from 0% (patient 4, 5, 6, 9, 14, 19 and 20) to 33% (patient 11).
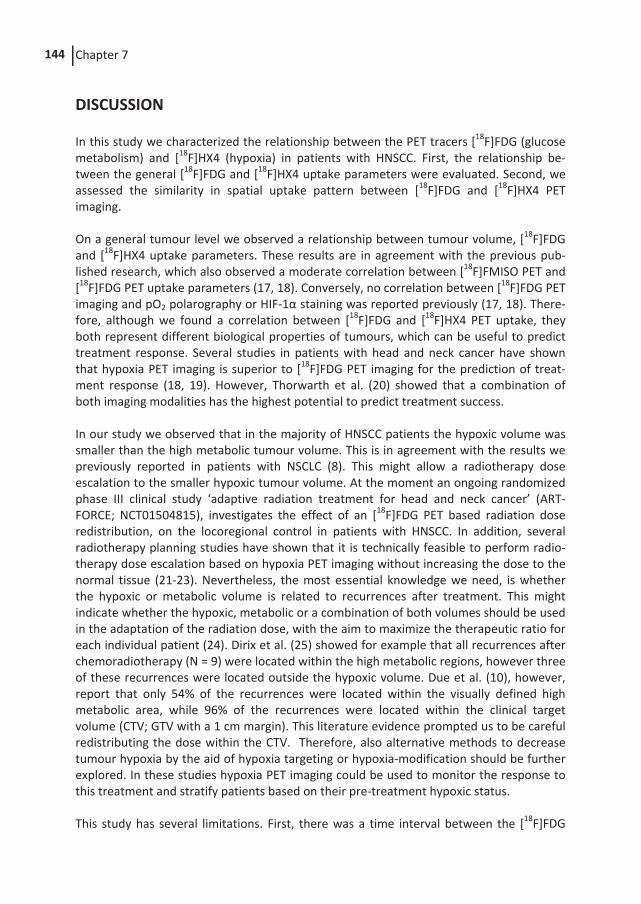
Chapter 7 144
DISCUSSION
In this study we characterized the relationship between the PET tracers [18F]FDG (glucose metabolism) and [18F]HX4 (hypoxia) in patients with HNSCC. First, the relationship be-tween the general [18F]FDG and [18F]HX4 uptake parameters were evaluated. Second, we assessed the similarity in spatial uptake pattern between [18F]FDG and [18F]HX4 PET imaging. On a general tumour level we observed a relationship between tumour volume, [18F]FDG and [18F]HX4 uptake parameters. These results are in agreement with the previous pub-lished research, which also observed a moderate correlation between [18F]FMISO PET and [18F]FDG PET uptake parameters (17, 18). Conversely, no correlation between [18F]FDG PET imaging and pO2 polarography or HIF-1α staining was reported previously (17, 18). There-fore, although we found a correlation between [18F]FDG and [18F]HX4 PET uptake, they both represent different biological properties of tumours, which can be useful to predict treatment response. Several studies in patients with head and neck cancer have shown that hypoxia PET imaging is superior to [18F]FDG PET imaging for the prediction of treat-ment response (18, 19). However, Thorwarth et al. (20) showed that a combination of both imaging modalities has the highest potential to predict treatment success. In our study we observed that in the majority of HNSCC patients the hypoxic volume was smaller than the high metabolic tumour volume. This is in agreement with the results we previously reported in patients with NSCLC (8). This might allow a radiotherapy dose escalation to the smaller hypoxic tumour volume. At the moment an ongoing randomized phase III clinical study ‘adaptive radiation treatment for head and neck cancer’ (ART-FORCE; NCT01504815), investigates the effect of an [18F]FDG PET based radiation dose redistribution, on the locoregional control in patients with HNSCC. In addition, several radiotherapy planning studies have shown that it is technically feasible to perform radio-therapy dose escalation based on hypoxia PET imaging without increasing the dose to the normal tissue (21-23). Nevertheless, the most essential knowledge we need, is whether the hypoxic or metabolic volume is related to recurrences after treatment. This might indicate whether the hypoxic, metabolic or a combination of both volumes should be used in the adaptation of the radiation dose, with the aim to maximize the therapeutic ratio for each individual patient (24). Dirix et al. (25) showed for example that all recurrences after chemoradiotherapy (N = 9) were located within the high metabolic regions, however three of these recurrences were located outside the hypoxic volume. Due et al. (10), however, report that only 54% of the recurrences were located within the visually defined high metabolic area, while 96% of the recurrences were located within the clinical target volume (CTV; GTV with a 1 cm margin). This literature evidence prompted us to be careful redistributing the dose within the CTV. Therefore, also alternative methods to decrease tumour hypoxia by the aid of hypoxia targeting or hypoxia-modification should be further explored. In these studies hypoxia PET imaging could be used to monitor the response to this treatment and stratify patients based on their pre-treatment hypoxic status. This study has several limitations. First, there was a time interval between the [18F]FDG
Hypoxia and metabolism in HNSCC 145
and [18F]HX4 PET/CT scans, in which changes in tumour metabolism or hypoxia may have occurred. We observed a relationship between the time interval and DICE coefficient of the GTVln, which might indicate that a shorter time interval could improve the spatial correlation between the [18F]FDG and [18F]HX4 uptake. However, this was not observed for the voxel-wise correlation coefficients. For most of the patients the time interval was small (median: seven days) and no interventions were performed between both scans. Second, small lesions were also included in the analysis. Small lesions are prone to present only a limited amount of tumour hypoxia. In addition, in these lesions the partial volume effect plays a larger role, causing an underestimation of the absolute uptake. This might influence the correlation between the tumour volume and the [18F]HX4 and [18F]FDG uptake measurements. Third, the thresholds to define a [18F]HX4 or [18F]FDG high uptake were defined based on previous literature and ongoing clinical trials, a change in this definition will influence the results. However, based on the results of our previous study in patients with NSCLC, we can state that the mismatch between high [18F]HX4 and high [18F]FDG volumes is relative stable for different thresholds (8). In conclusion, there is a positive correlation between [18F]HX4 and [18F]FDG uptake pa-rameters on a global tumour level. On average, the [18F]HX4-HV is smaller than the [18F]FDG-HV . In the majority of lesions a partial mismatch between the [18F]HX4 and [18F]FDG high uptake volumes was observed, therefore [18F]FDG PET imaging cannot be used as a surrogate for hypoxia. [18F]HX4 PET imaging provides complementary infor-mation to [18F]FDG PET imaging.
ACKNOWLEDGEMENTS
The authors like to thank the patients who agreed to participate to this study and the PET-CT group, data-management (Anita Botterweck) and trial-poli (Claudia Offermann and John Paulissen) of MAASTRO clinic for their contribution to the data acquisition. Authors acknowledge financial support from the QuIC-ConCePT project, which is partly funded by EFPI A companies and the Innovative Medicine Initiative Joint Undertaking (IMI JU) under Grant Agreement No. 115151. Authors also acknowledge financial support from EU 7th framework program (EURECA, ARTFORCE - n° 257144, REQUITE - n° 601826), Kanker-onderzoekfonds Limburg from the Health Foundation Limburg and the Dutch Cancer Society (KWF MAC 2011-4970).
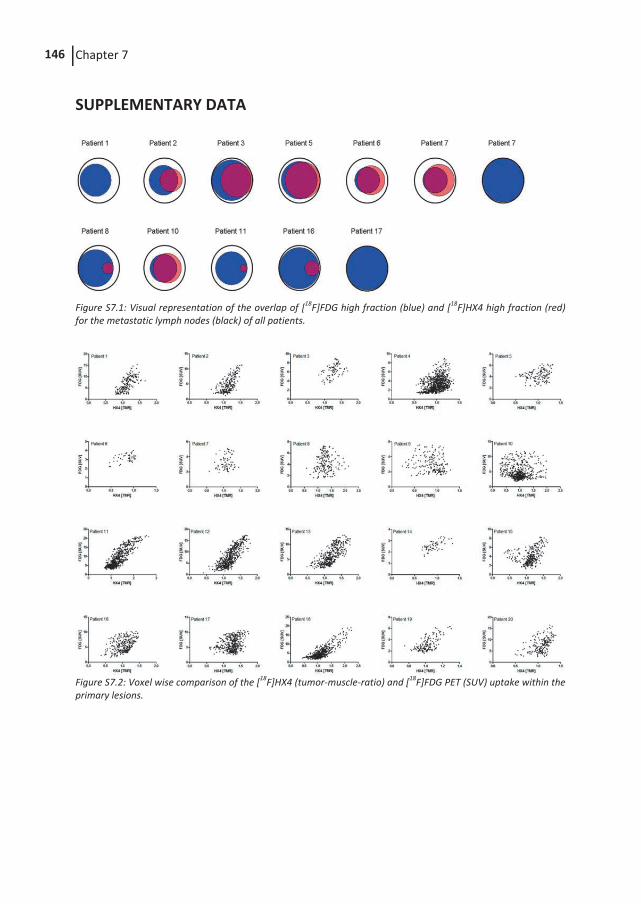
Chapter 7 146
SUPPLEMENTARY DATA
Figure S7.1: Visual representation of the overlap of [18F]FDG high fraction (blue) and [18F]HX4 high fraction (red) for the metastatic lymph nodes (black) of all patients.
Figure S7.2: Voxel wise comparison of the [18F]HX4 (tumor-muscle-ratio) and [18F]FDG PET (SUV) uptake within the primary lesions.
Hypoxia and metabolism in HNSCC 147
REFERENCES
1. Harris AL. Hypoxia--a key regulatory factor in tumour growth. Nat Rev Cancer. 2002;2:38-47.
2. Horsman MR, Mortensen LS, Petersen JB, Busk M, Overgaard J. Imaging hypoxia to improve radiotherapy outcome. Nat Rev Clin Oncol. 2012;9:674-87.
3. Troost EG, Schinagl DA, Bussink J, Boerman OC, van der Kogel AJ, Oyen WJ, et al. Innovations in radiotherapy planning of head and neck cancers: role of PET. J Nucl Med. 2010;51:66-76.
4. Peeters SG, Zegers CM, Yaromina A, Van Elmpt W, Dubois L, Lambin P. Current preclinical and clinical applications of hypoxia PET imaging using 2-nitroimidazoles. Q J Nucl Med Mol Imaging. 2015;59:39-57.
5. Zips D, Zophel K, Abolmaali N, Perrin R, Abramyuk A, Haase R, et al. Exploratory prospective trial of hypoxia-specific PET imaging during radiochemotherapy in patients with locally advanced head-and-neck cancer. Radiother Oncol. 2012;105:21-8.
6. Dubois LJ, Lieuwes NG, Janssen MH, Peeters WJ, Windhorst AD, Walsh JC, et al. Preclinical evaluation and validation of [18F]HX4, a promising hypoxia marker for PET imaging. Proc Natl Acad Sci U S A. 2011;108:14620-5.
7. Peeters SG, Zegers CM, Lieuwes NG, van Elmpt W, Eriksson J, van Dongen GA, et al. A Comparative Study of the Hypoxia PET Tracers [(18)F]HX4, [(18)F]FAZA, and [(18)F]FMISO in a Preclinical Tumor Model. Int J Radiat Oncol Biol Phys. 2015;91:351-9.
8. Zegers CM, van Elmpt W, Reymen B, Even AJ, Troost EG, Ollers MC, et al. In vivo quantification of hypoxic and metabolic status of NSCLC tumors using [18F]HX4 and [18F]FDG-PET/CT imaging. Clin Cancer Res. 2014;20:6389-97.
9. Aerts HJ, van Baardwijk AA, Petit SF, Offermann C, Loon J, Houben R, et al. Identification of residual metabolic-active areas within individual NSCLC tumours using a pre-radiotherapy (18)Fluorodeoxyglucose-PET-CT scan. Radiother Oncol. 2009;91:386-92.
10. Due AK, Vogelius IR, Aznar MC, Bentzen SM, Berthelsen AK, Korreman SS, et al. Recurrences after intensity modulated radiotherapy for head and neck squamous cell carcinoma more likely to originate from regions with high baseline [18F]-FDG uptake. Radiother Oncol. 2014;111:360-5.
11. Gatenby RA, Gillies RJ. Why do cancers have high aerobic glycolysis? Nat Rev Cancer. 2004;4:891-9.
12. Vander Heiden MG, Cantley LC, Thompson CB. Understanding the Warburg effect: the metabolic requirements of cell proliferation. Science. 2009;324:1029-33.
13. van Loon J, Janssen MH, Ollers M, Aerts HJ, Dubois L, Hochstenbag M, et al. PET imaging of hypoxia using [18F]HX4: a phase I trial. Eur J Nucl Med Mol Imaging. 2010;37:1663-8.
14. Boellaard R, Oyen WJ, Hoekstra CJ, Hoekstra OS, Visser EP, Willemsen AT, et al. The Netherlands protocol for standardisation and quantification of FDG whole body PET studies in multi-centre trials. European journal of nuclear medicine and molecular imaging. 2008;35:2320-33.
15. Heukelom J, Hamming O, Bartelink H, Hoebers F, Giralt J, Herlestam T, et al. Adaptive and innovative Radiation Treatment FOR improving Cancer treatment outcomE
Chapter 7 148
(ARTFORCE); a randomized controlled phase II trial for individualized treatment of head and neck cancer. BMC Cancer. 2013;13:84.
16. van Elmpt W, De Ruysscher D, van der Salm A, Lakeman A, van der Stoep J, Emans D, et al. The PET-boost randomised phase II dose-escalation trial in non-small cell lung cancer. Radiother Oncol. 2012;104:67-71.
17. Zimny M, Gagel B, DiMartino E, Hamacher K, Coenen HH, Westhofen M, et al. FDG--a marker of tumour hypoxia? A comparison with [18F]fluoromisonidazole and pO2-polarography in metastatic head and neck cancer. Eur J Nucl Med Mol Imaging. 2006;33:1426-31.
18. Sato J, Kitagawa Y, Yamazaki Y, Hata H, Okamoto S, Shiga T, et al. 18F-fluoro-misonidazole PET uptake is correlated with hypoxia-inducible factor-1alpha expression in oral squamous cell carcinoma. J Nucl Med. 2013;54:1060-5.
19. Komar G, Lehtio K, Seppanen M, Eskola O, Levola H, Lindholm P, et al. Prognostic value of tumour blood flow, [(1)(8)F]EF5 and [(1)(8)F]FDG PET/CT imaging in patients with head and neck cancer treated with radiochemotherapy. Eur J Nucl Med Mol Imaging. 2014;41:2042-50.
20. Thorwarth D, Eschmann SM, Holzner F, Paulsen F, Alber M. Combined uptake of [18F]FDG and [18F]FMISO correlates with radiation therapy outcome in head-and-neck cancer patients. Radiother Oncol. 2006;80:151-6.
21. Hoeben BA, Bussink J, Troost EG, Oyen WJ, Kaanders JH. Molecular PET imaging for biology-guided adaptive radiotherapy of head and neck cancer. Acta Oncol. 2013;52:1257-71.
22. Toma-Dasu I, Uhrdin J, Antonovic L, Dasu A, Nuyts S, Dirix P, et al. Dose prescription and treatment planning based on FMISO-PET hypoxia. Acta Oncol. 2012;51:222-30.
23. Chang JH, Wada M, Anderson NJ, Lim Joon D, Lee ST, Gong SJ, et al. Hypoxia-targeted radiotherapy dose painting for head and neck cancer using (18)F-FMISO PET: a biological modeling study. Acta Oncol. 2013;52:1723-9.
24. Grau C, Hoyer M, Alber M, Overgaard J, Lindegaard JC, Muren LP. Biology-guided adaptive radiotherapy (BiGART)--more than a vision? Acta Oncol. 2013;52:1243-7.
25. Dirix P, Vandecaveye V, De Keyzer F, Stroobants S, Hermans R, Nuyts S. Dose painting in radiotherapy for head and neck squamous cell carcinoma: value of repeated functional imaging with (18)F-FDG PET, (18)F-fluoromisonidazole PET, diffusion-weighted MRI, and dynamic contrast-enhanced MRI. J Nucl Med. 2009;50:1020-7.
CHAPTER
Evaluation of tumour hypoxia during radiotherapy using [18F]HX4 PET imaging and blood biomarkers in patients
with head and neck cancer
Catharina M.L. Zegers, Frank J.P. Hoebers, Wouter van Elmpt, Judith A. Bons, Michel C. Öllers, Esther G.C. Troost, Daniëlle Eekers, Leo Balmaekers, Marlies Arts-Pechtold, Felix M. Mottaghy, Philippe Lambin
Submitted
Chapter 8 150
ABSTRACT
Background and Purpose: Increased tumour hypoxia is associated with a worse overall survival in patients with head and neck squamous cell carcinoma (HNSCC). The aims of this study were to evaluate treatment-associated changes in [18F]HX4-PET, hypoxia-related blood biomarkers, and their interdependence. Material and Methods: [18F]HX4-PET/CT scans of 20 patients with HNSCC were acquired at baseline and after ±20Gy of radiotherapy. Within the gross-tumour-volumes (GTV; primary and lymph nodes), mean and maximum standardized uptake values, the hypoxic fraction (HF) and volume (HV) were calculated. Also, the changes in spatial uptake pattern were evaluated using [18F]HX4-PET/CT imaging. Of all patients, the plasma concentration of CAIX, osteopontin and VEGF was assessed. Results: At baseline tumour hypoxia was detected in 69% (22/32) of the GTVs. During therapy, we observed a significant decrease in all image parameters. The HF decreased from 21.7±19.8% (baseline) to 3.6±10.0% (during treatment; P<0.001). Only two patients had a HV>1cm3 during treatment which was located for >98% within the baseline HV. During treatment no significant changes in plasma CAIX or VEGF were observed, while osteopontin was increased. Conclusions: [18F]HX4-PET/CT imaging allows monitoring changes in hypoxia during (chemo)radiotherapy whereas the blood biomarkers were not able to detect a treatment-associated decrease in hypoxia.
Evaluation of hypoxia during radiotherapy 151
INTRODUCTION
Tumour cell hypoxia is known to promote resistance to cancer treatment, to increase tumour aggressiveness, and to be a prognostic factor for survival (1). Non-invasive imaging of tumour hypoxia by means of positron emission tomography (PET) has been shown to predict loco-regional control and survival, and may be used to select patients for addition-al anti-hypoxia therapy (2-4). In addition, PET imaging can be used to monitor the re-sponse to treatment. Previous studies using the hypoxia PET tracer [18F]FMISO and the metabolic PET tracer [18F]FDG observed that the uptake changes (early) during (chemo)radiotherapy had a higher predictive value than pre-treatment measurements (3, 5). Previously, Overgaard (6) showed that the modification of hypoxia during radiotherapy results in better loco-regional control and survival in patients with a squamous cell carci-noma of the head and neck (HNSCC). However, stratifying patients undergoing ARCON (accelerated radiotherapy with carbogen and nicotinamide) based on their pre-therapeutic hypoxic status (pimonidazole staining) demonstrated that the benefit in loco-regional control was specifically observed for patients with initial tumour hypoxia before the start of treatment (7, 8). The pimonidazole staining of a biopsy, however can only provide information about local hypoxia before the start of treatment. Non-invasive hypoxia PET imaging, on the other hand, provides to opportunity to perform repeated tumour hypoxia measurements in 3-dimensions. Therefore hypoxia PET measurements may be used to select patients likely to have a benefit of additional anti-hypoxia therapy. One of the hypoxia PET tracers to visualize and quantify tumour hypoxia is the 2-nitroimidazole3-[18F]fluoro-2-(4-((2-nitro-1H-imidazol-1-yl)methyl)-1H-1,2,3-triazol-1-yl)propan-1-ol, [18F]HX4. In previous pre-clinical studies [18F]HX4 was validated as a hypoxia tracer and the repeatability of the tracer uptake was assessed (9, 10). In addition, in patients with non-small cell lung cancer (NSCLC), [18F]HX4 showed promising results and was shown to provide additional value to the metabolic PET tracer [18F]FDG (11, 12). In this paper, we will investigate the potential of this tracer to detect treatment-associated changes in hypoxic tumour status in patients with HNSCC. Another method to obtain information on tumour hypoxia may be the measurement of hypoxia-related proteins or enzymes in plasma. Potential relevant hypoxia markers are plasma osteopontin, carbonic anhydrase IX (CAIX) and vascular endothelial growth factor (VEGF). Osteopontin is activated under hypoxic conditions and is inversely correlated with the PO2 value of the tumour (13). In addition plasma osteopontin is a significant predictor for the response to radiotherapy in patients with head and neck cancer (14). CAIX expres-sion is upregulated under the influence of tumour hypoxia. Also, in patients with NSCLC a high level of plasma CAIX was associated with a shorter overall survival (15). Last, hypoxia activates hypoxia inducible factor (HIF-1) which induces a high expression of VEGF, the primary cytokine related to angiogenesis. VEGF may therefore serve as an indirect marker of tumour hypoxia. These three markers might have the potential to stratify patients based on their hypoxic tumour status.
Chapter 8 152
The aims of this study were to evaluate the changes in hypoxia during treatment in pa-tients with HNSCC, the spatial stability of the uptake pattern and the presence of plasma osteopontin, CAIX and VEGF in relationship to hypoxia imaging.
MATERIALS AND METHODS
Patients
Between January 2012 and October 2014 we included 20 patients in this imaging study. Patient, tumour and treatment characteristics are shown in Table 8.1. The study was approved by the Ethical Review Committee of Maastricht University Medical Centre and registered on clinicaltrial.gov (NCT01347281). All patients provided written informed consent before study entry.
PET/CT imaging
[18F]HX4 was produced as described in previous publications (9, 16-18). After intravenous administration of an average (±SD) dose of 378±84 MBq [18F]HX4, PET/CT imaging was performed at 1.5h, 3h and 4h post-injection (p.i.) for 15, 15 and 20 minutes, respectively for a single bed position centred around the primary tumour. After 10 patients, an interim analysis showed highest contrast at the imaging time-point at 4h p.i., and this was used from then onwards. [18F]HX4 PET/CT scans were acquired before the start of external beam radiotherapy and during the radiation treatment; after an average (±SD) dose of 21±2 Gy using a Biograph 40 PET/CT scanner (Siemens Healthcare, Erlangen, Germany). Scatter and attenuation corrections were applied, PET images were reconstructed using OSEM 2D (Ordered Subset Expectation Maximization, 4 iterations, 8 subsets) and a Gaussian filter of 5 mm. Imaging was performed in radiotherapy position, with the patient positioned on a flat table top using an immobilization mask and a movable laser alignment system.
Image analysis
The gross tumour volume of the primary lesion (GTVprim) and involved lymph nodes (GTVln), were delineated on the [18F]FDG PET/CT, used for radiotherapy planning purposes, by two experienced radiation oncologists in consensus. These contours were copied to the [18F]HX4 PET scans by rigid registration. Maximum and mean standardized uptake values (SUVmax and SUVmean), were determined within the GTVs. In addition, the maximum tu-mour-to-muscle ratio (TMRmax), defined as the SUVmax in the tumour divided by the SU-Vmean in the trapezius muscles was calculated. The hypoxic fraction (HF) and hypoxic volume (HV) were defined as the fraction or volume of the GTV with a TMR larger than 1.4.
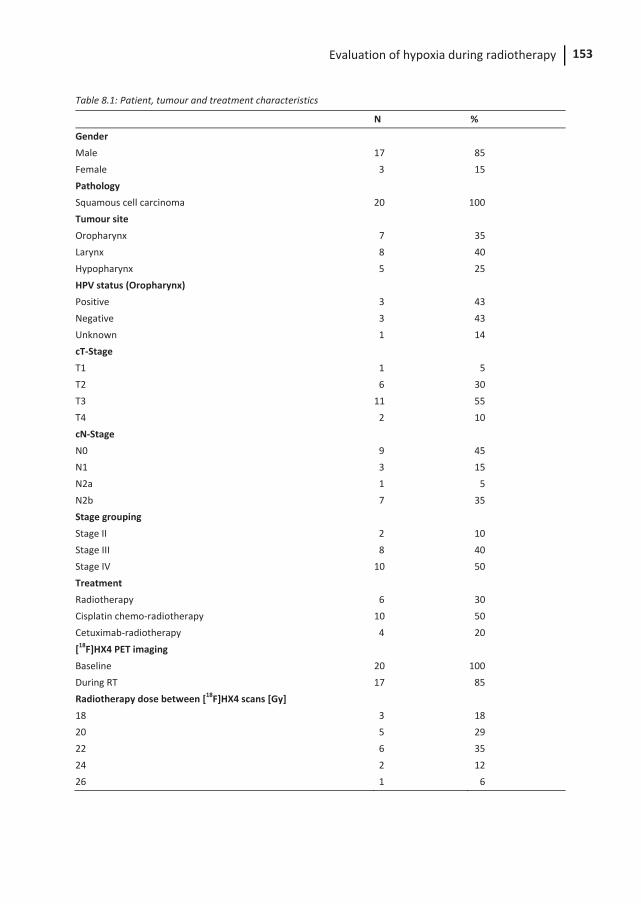
Evaluation of hypoxia during radiotherapy 153
Table 8.1: Patient, tumour and treatment characteristics
N %
Gender Male 17 85 Female 3 15 Pathology Squamous cell carcinoma 20 100 Tumour site Oropharynx 7 35 Larynx 8 40 Hypopharynx 5 25 HPV status (Oropharynx) Positive 3 43 Negative 3 43 Unknown 1 14 cT-Stage T1 1 5 T2 6 30 T3 11 55 T4 2 10 cN-Stage N0 9 45 N1 3 15 N2a 1 5 N2b 7 35 Stage grouping Stage II 2 10 Stage III 8 40 Stage IV 10 50 Treatment Radiotherapy 6 30 Cisplatin chemo-radiotherapy 10 50 Cetuximab-radiotherapy 4 20 [18F]HX4 PET imaging Baseline 20 100 During RT 17 85 Radiotherapy dose between [18F]HX4 scans [Gy] 18 3 18 20 5 29 22 6 35 24 2 12 26 1 6
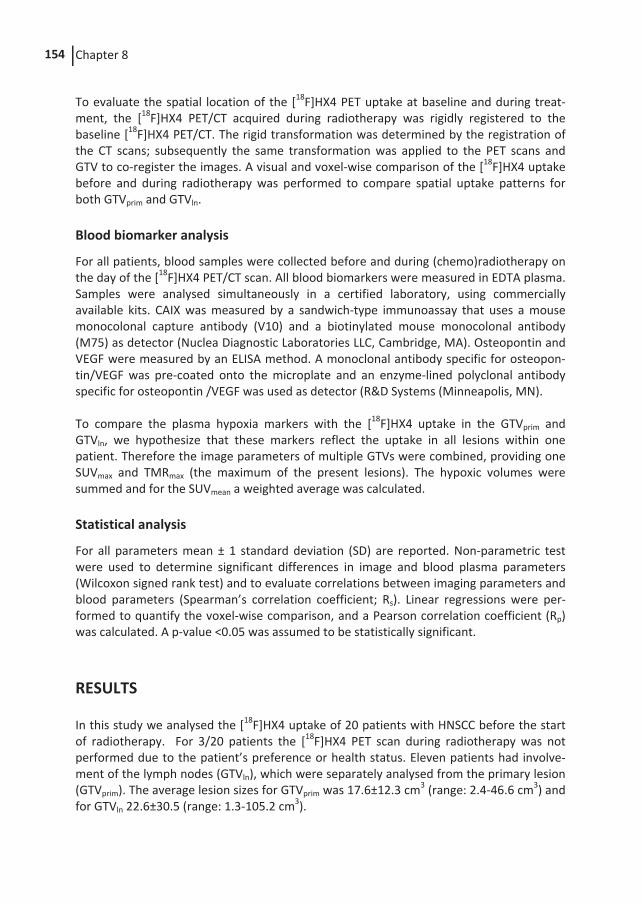
Chapter 8 154
To evaluate the spatial location of the [18F]HX4 PET uptake at baseline and during treat-ment, the [18F]HX4 PET/CT acquired during radiotherapy was rigidly registered to the baseline [18F]HX4 PET/CT. The rigid transformation was determined by the registration of the CT scans; subsequently the same transformation was applied to the PET scans and GTV to co-register the images. A visual and voxel-wise comparison of the [18F]HX4 uptake before and during radiotherapy was performed to compare spatial uptake patterns for both GTVprim and GTVln.
Blood biomarker analysis
For all patients, blood samples were collected before and during (chemo)radiotherapy on the day of the [18F]HX4 PET/CT scan. All blood biomarkers were measured in EDTA plasma. Samples were analysed simultaneously in a certified laboratory, using commercially available kits. CAIX was measured by a sandwich-type immunoassay that uses a mouse monocolonal capture antibody (V10) and a biotinylated mouse monocolonal antibody (M75) as detector (Nuclea Diagnostic Laboratories LLC, Cambridge, MA). Osteopontin and VEGF were measured by an ELISA method. A monoclonal antibody specific for osteopon-tin/VEGF was pre-coated onto the microplate and an enzyme-lined polyclonal antibody specific for osteopontin /VEGF was used as detector (R&D Systems (Minneapolis, MN). To compare the plasma hypoxia markers with the [18F]HX4 uptake in the GTVprim and GTVln, we hypothesize that these markers reflect the uptake in all lesions within one patient. Therefore the image parameters of multiple GTVs were combined, providing one SUVmax and TMRmax (the maximum of the present lesions). The hypoxic volumes were summed and for the SUVmean a weighted average was calculated.
Statistical analysis
For all parameters mean ± 1 standard deviation (SD) are reported. Non-parametric test were used to determine significant differences in image and blood plasma parameters (Wilcoxon signed rank test) and to evaluate correlations between imaging parameters and blood parameters (Spearman’s correlation coefficient; Rs). Linear regressions were per-formed to quantify the voxel-wise comparison, and a Pearson correlation coefficient (Rp) was calculated. A p-value <0.05 was assumed to be statistically significant.
RESULTS
In this study we analysed the [18F]HX4 uptake of 20 patients with HNSCC before the start of radiotherapy. For 3/20 patients the [18F]HX4 PET scan during radiotherapy was not performed due to the patient’s preference or health status. Eleven patients had involve-ment of the lymph nodes (GTVln), which were separately analysed from the primary lesion (GTVprim). The average lesion sizes for GTVprim was 17.6±12.3 cm3 (range: 2.4-46.6 cm3) and for GTVln 22.6±30.5 (range: 1.3-105.2 cm3).
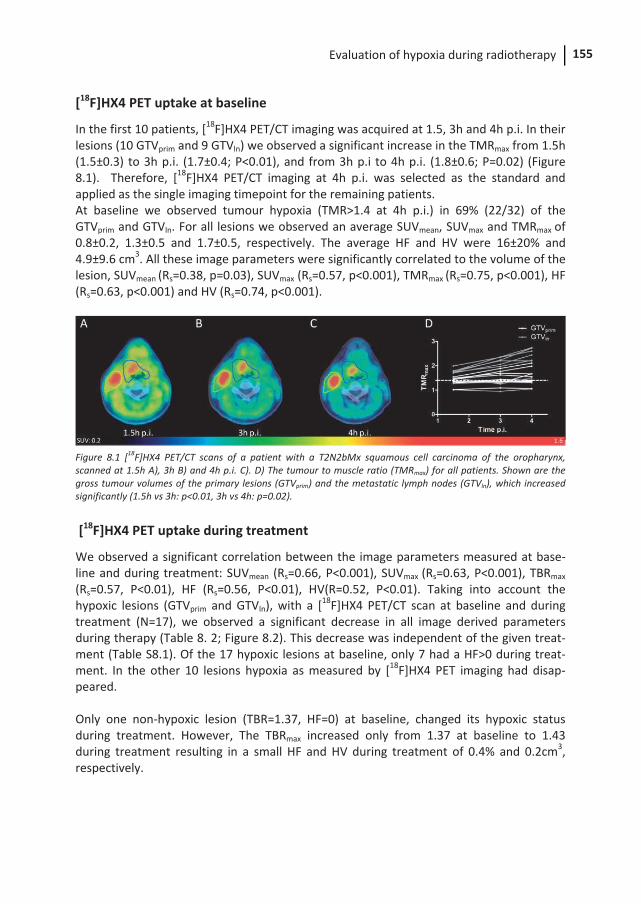
Evaluation of hypoxia during radiotherapy 155
[18F]HX4 PET uptake at baseline
In the first 10 patients, [18F]HX4 PET/CT imaging was acquired at 1.5, 3h and 4h p.i. In their lesions (10 GTVprim and 9 GTVln) we observed a significant increase in the TMRmax from 1.5h (1.5±0.3) to 3h p.i. (1.7±0.4; P<0.01), and from 3h p.i to 4h p.i. (1.8±0.6; P=0.02) (Figure 8.1). Therefore, [18F]HX4 PET/CT imaging at 4h p.i. was selected as the standard and applied as the single imaging timepoint for the remaining patients. At baseline we observed tumour hypoxia (TMR>1.4 at 4h p.i.) in 69% (22/32) of the GTVprim and GTVln. For all lesions we observed an average SUVmean, SUVmax and TMRmax of 0.8±0.2, 1.3±0.5 and 1.7±0.5, respectively. The average HF and HV were 16±20% and 4.9±9.6 cm3. All these image parameters were significantly correlated to the volume of the lesion, SUVmean (Rs=0.38, p=0.03), SUVmax (Rs=0.57, p<0.001), TMRmax (Rs=0.75, p<0.001), HF (Rs=0.63, p<0.001) and HV (Rs=0.74, p<0.001).
Figure 8.1 [18F]HX4 PET/CT scans of a patient with a T2N2bMx squamous cell carcinoma of the oropharynx, scanned at 1.5h A), 3h B) and 4h p.i. C). D) The tumour to muscle ratio (TMRmax) for all patients. Shown are the gross tumour volumes of the primary lesions (GTVprim) and the metastatic lymph nodes (GTVln), which increased significantly (1.5h vs 3h: p<0.01, 3h vs 4h: p=0.02).
[18F]HX4 PET uptake during treatment
We observed a significant correlation between the image parameters measured at base-line and during treatment: SUVmean (Rs=0.66, P<0.001), SUVmax (Rs=0.63, P<0.001), TBRmax
(Rs=0.57, P<0.01), HF (Rs=0.56, P<0.01), HV(R=0.52, P<0.01). Taking into account the hypoxic lesions (GTVprim and GTVln), with a [18F]HX4 PET/CT scan at baseline and during treatment (N=17), we observed a significant decrease in all image derived parameters during therapy (Table 8. 2; Figure 8.2). This decrease was independent of the given treat-ment (Table S8.1). Of the 17 hypoxic lesions at baseline, only 7 had a HF>0 during treat-ment. In the other 10 lesions hypoxia as measured by [18F]HX4 PET imaging had disap-peared. Only one non-hypoxic lesion (TBR=1.37, HF=0) at baseline, changed its hypoxic status during treatment. However, The TBRmax increased only from 1.37 at baseline to 1.43 during treatment resulting in a small HF and HV during treatment of 0.4% and 0.2cm3, respectively.
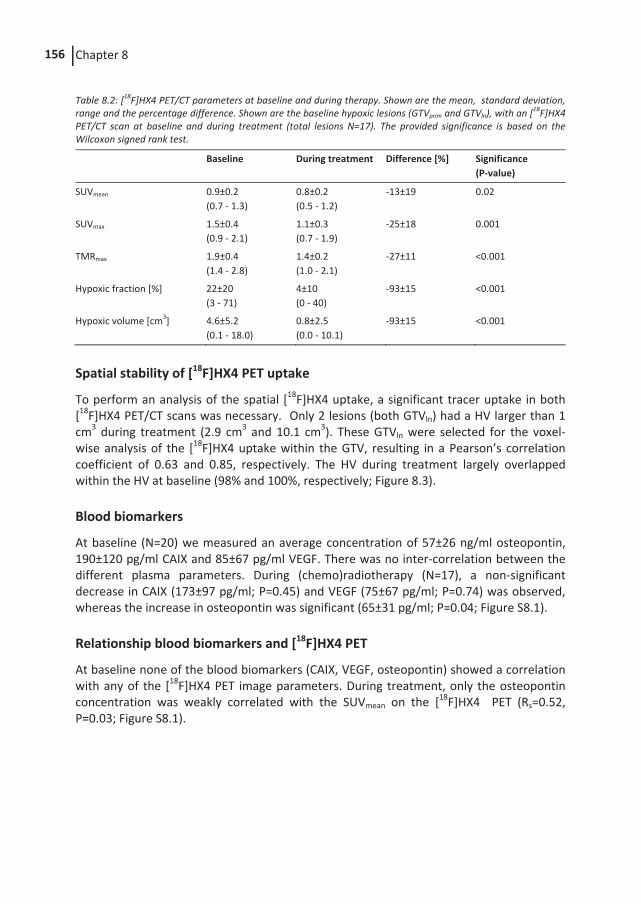
Chapter 8 156
Table 8.2: [18F]HX4 PET/CT parameters at baseline and during therapy. Shown are the mean, standard deviation, range and the percentage difference. Shown are the baseline hypoxic lesions (GTVprim and GTVln), with an [18F]HX4 PET/CT scan at baseline and during treatment (total lesions N=17). The provided significance is based on the Wilcoxon signed rank test.
Baseline During treatment Difference [%] Significance (P-value)
SUVmean 0.9±0.2 (0.7 - 1.3)
0.8±0.2 (0.5 - 1.2)
-13±19 0.02
SUVmax 1.5±0.4 (0.9 - 2.1)
1.1±0.3 (0.7 - 1.9)
-25±18 0.001
TMRmax 1.9±0.4 (1.4 - 2.8)
1.4±0.2 (1.0 - 2.1)
-27±11 <0.001
Hypoxic fraction [%] 22±20 (3 - 71)
4±10 (0 - 40)
-93±15 <0.001
Hypoxic volume [cm3] 4.6±5.2
(0.1 - 18.0) 0.8±2.5 (0.0 - 10.1)
-93±15 <0.001
Spatial stability of [18F]HX4 PET uptake
To perform an analysis of the spatial [18F]HX4 uptake, a significant tracer uptake in both [18F]HX4 PET/CT scans was necessary. Only 2 lesions (both GTVln) had a HV larger than 1 cm3 during treatment (2.9 cm3 and 10.1 cm3). These GTVln were selected for the voxel-wise analysis of the [18F]HX4 uptake within the GTV, resulting in a Pearson’s correlation coefficient of 0.63 and 0.85, respectively. The HV during treatment largely overlapped within the HV at baseline (98% and 100%, respectively; Figure 8.3).
Blood biomarkers
At baseline (N=20) we measured an average concentration of 57±26 ng/ml osteopontin, 190±120 pg/ml CAIX and 85±67 pg/ml VEGF. There was no inter-correlation between the different plasma parameters. During (chemo)radiotherapy (N=17), a non-significant decrease in CAIX (173±97 pg/ml; P=0.45) and VEGF (75±67 pg/ml; P=0.74) was observed, whereas the increase in osteopontin was significant (65±31 pg/ml; P=0.04; Figure S8.1).
Relationship blood biomarkers and [18F]HX4 PET
At baseline none of the blood biomarkers (CAIX, VEGF, osteopontin) showed a correlation with any of the [18F]HX4 PET image parameters. During treatment, only the osteopontin concentration was weakly correlated with the SUVmean on the [18F]HX4 PET (Rs=0.52, P=0.03; Figure S8.1).
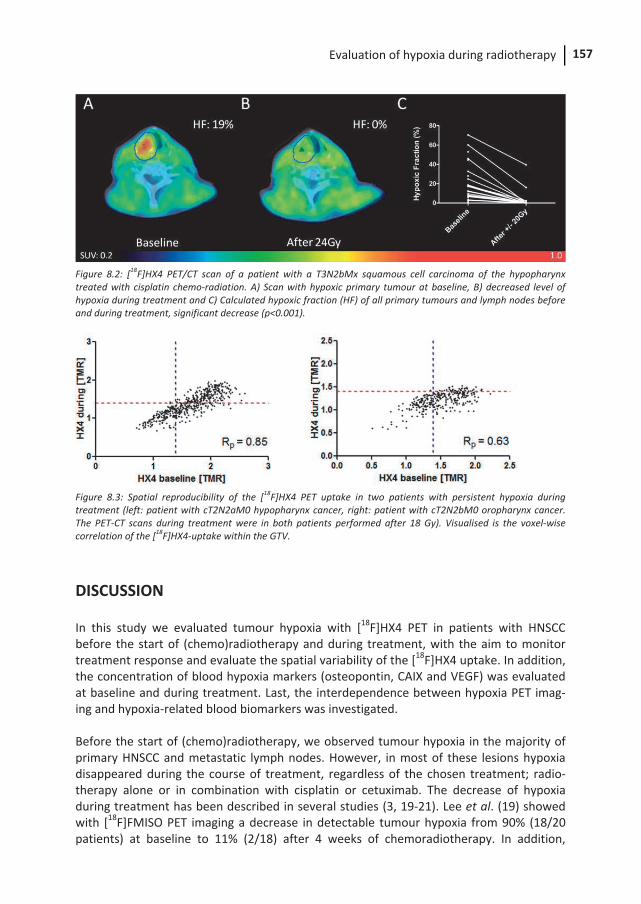
Evaluation of hypoxia during radiotherapy 157
Figure 8.2: [18F]HX4 PET/CT scan of a patient with a T3N2bMx squamous cell carcinoma of the hypopharynx treated with cisplatin chemo-radiation. A) Scan with hypoxic primary tumour at baseline, B) decreased level of hypoxia during treatment and C) Calculated hypoxic fraction (HF) of all primary tumours and lymph nodes before and during treatment, significant decrease (p<0.001).
Figure 8.3: Spatial reproducibility of the [18F]HX4 PET uptake in two patients with persistent hypoxia during treatment (left: patient with cT2N2aM0 hypopharynx cancer, right: patient with cT2N2bM0 oropharynx cancer. The PET-CT scans during treatment were in both patients performed after 18 Gy). Visualised is the voxel-wise correlation of the [18F]HX4-uptake within the GTV.
DISCUSSION
In this study we evaluated tumour hypoxia with [18F]HX4 PET in patients with HNSCC before the start of (chemo)radiotherapy and during treatment, with the aim to monitor treatment response and evaluate the spatial variability of the [18F]HX4 uptake. In addition, the concentration of blood hypoxia markers (osteopontin, CAIX and VEGF) was evaluated at baseline and during treatment. Last, the interdependence between hypoxia PET imag-ing and hypoxia-related blood biomarkers was investigated. Before the start of (chemo)radiotherapy, we observed tumour hypoxia in the majority of primary HNSCC and metastatic lymph nodes. However, in most of these lesions hypoxia disappeared during the course of treatment, regardless of the chosen treatment; radio-therapy alone or in combination with cisplatin or cetuximab. The decrease of hypoxia during treatment has been described in several studies (3, 19-21). Lee et al. (19) showed with [18F]FMISO PET imaging a decrease in detectable tumour hypoxia from 90% (18/20 patients) at baseline to 11% (2/18) after 4 weeks of chemoradiotherapy. In addition,
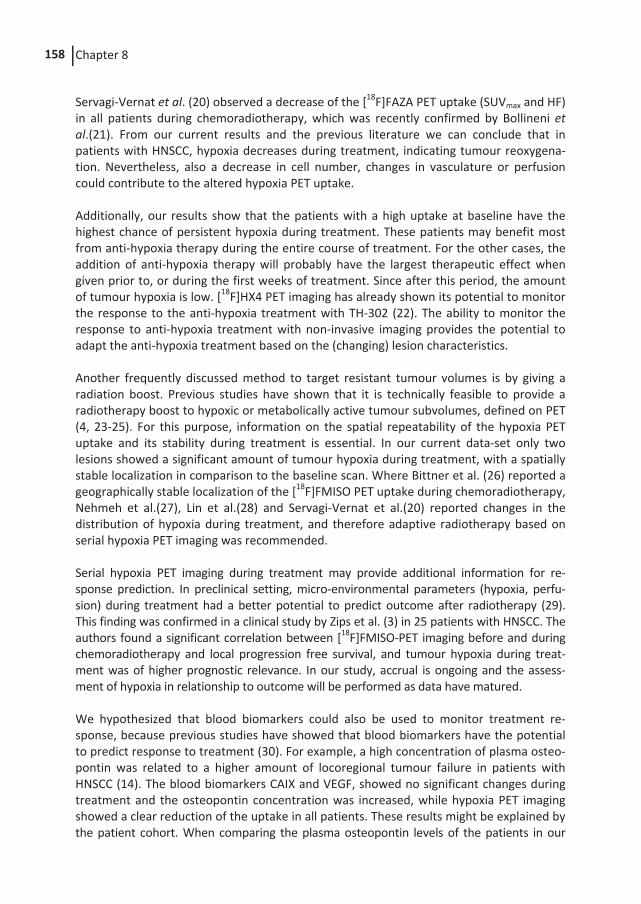
Chapter 8 158
Servagi-Vernat et al. (20) observed a decrease of the [18F]FAZA PET uptake (SUVmax and HF) in all patients during chemoradiotherapy, which was recently confirmed by Bollineni et al.(21). From our current results and the previous literature we can conclude that in patients with HNSCC, hypoxia decreases during treatment, indicating tumour reoxygena-tion. Nevertheless, also a decrease in cell number, changes in vasculature or perfusion could contribute to the altered hypoxia PET uptake. Additionally, our results show that the patients with a high uptake at baseline have the highest chance of persistent hypoxia during treatment. These patients may benefit most from anti-hypoxia therapy during the entire course of treatment. For the other cases, the addition of anti-hypoxia therapy will probably have the largest therapeutic effect when given prior to, or during the first weeks of treatment. Since after this period, the amount of tumour hypoxia is low. [18F]HX4 PET imaging has already shown its potential to monitor the response to the anti-hypoxia treatment with TH-302 (22). The ability to monitor the response to anti-hypoxia treatment with non-invasive imaging provides the potential to adapt the anti-hypoxia treatment based on the (changing) lesion characteristics. Another frequently discussed method to target resistant tumour volumes is by giving a radiation boost. Previous studies have shown that it is technically feasible to provide a radiotherapy boost to hypoxic or metabolically active tumour subvolumes, defined on PET (4, 23-25). For this purpose, information on the spatial repeatability of the hypoxia PET uptake and its stability during treatment is essential. In our current data-set only two lesions showed a significant amount of tumour hypoxia during treatment, with a spatially stable localization in comparison to the baseline scan. Where Bittner et al. (26) reported a geographically stable localization of the [18F]FMISO PET uptake during chemoradiotherapy, Nehmeh et al.(27), Lin et al.(28) and Servagi-Vernat et al.(20) reported changes in the distribution of hypoxia during treatment, and therefore adaptive radiotherapy based on serial hypoxia PET imaging was recommended. Serial hypoxia PET imaging during treatment may provide additional information for re-sponse prediction. In preclinical setting, micro-environmental parameters (hypoxia, perfu-sion) during treatment had a better potential to predict outcome after radiotherapy (29). This finding was confirmed in a clinical study by Zips et al. (3) in 25 patients with HNSCC. The authors found a significant correlation between [18F]FMISO-PET imaging before and during chemoradiotherapy and local progression free survival, and tumour hypoxia during treat-ment was of higher prognostic relevance. In our study, accrual is ongoing and the assess-ment of hypoxia in relationship to outcome will be performed as data have matured. We hypothesized that blood biomarkers could also be used to monitor treatment re-sponse, because previous studies have showed that blood biomarkers have the potential to predict response to treatment (30). For example, a high concentration of plasma osteo-pontin was related to a higher amount of locoregional tumour failure in patients with HNSCC (14). The blood biomarkers CAIX and VEGF, showed no significant changes during treatment and the osteopontin concentration was increased, while hypoxia PET imaging showed a clear reduction of the uptake in all patients. These results might be explained by the patient cohort. When comparing the plasma osteopontin levels of the patients in our
Evaluation of hypoxia during radiotherapy 159
current trial to the levels reported in the large randomized trial from Overgaard et al.(14), we observed that all our patients should be assigned to the low or intermediate concentra-tions of plasma osteopontin. Also in comparison to a study in 295 patients with advanced rectal cancer, our observed levels of osteopontin and CAIX were lower than their reported average values (30). In addition, plasma osteopontin is not only influenced by hypoxia, it is also known to play a role in the immune regulation and stress response (31). An elevated level of osteopontin was for example observed in patients with systemic inflammatory response syndrome or sepsis (32). The given anti-cancer treatment might have induced an immune/stress response causing an elevated level of hypoxia. Nevertheless, in the current population the blood biomarkers osteopontin, CAIX and VEGF were not suitable to measure a hypoxia related treatment response, which was measurable using [18F]HX4-PET. The correlation between the blood hypoxia markers and the [18F]HX4 PET uptake was absent to weakly present. This was in agreement with the results previously published by several groups comparing hypoxia PET imaging to tissue or blood markers. Vercellino et al.(33) observed no correlation between the uptake of the hypoxia tracer [18F]FETNIM and the plasma osteopontin concentration in 16 patients with cervical carcinoma. In addition, Gronroos et al.(34) found no correlation between hypoxia PET imaging using FETNIM and several tissue biomarkers in 15 patients with HNSCC. While in patients with newly diag-nosed glioma, the preoperative [18F]FMISO PET uptake was significantly, but weakly correlated to the expression of VEGF in the tumour(35). Although the current patient population is small, the results suggest that the tested blood biomarkers are not able to replace hypoxia PET imaging, or to pre-select patients for hypoxia PET imaging. To conclude, hypoxia PET imaging with [18F]HX4 is able to detect tumour hypoxia in pa-tients with HNSCC, in addition it can monitor a decrease of tumour hypoxia during treat-ment. In patients with persistent tumour hypoxia, a stable localization of the hypoxic volume was observed. This provides potential for radiotherapy dose escalation to the hypoxic volumes. The blood parameters osteopontin, CAIX and VEGF were not able to detect a decrease in hypoxia during treatment. In addition, there was no correlation between the blood plasma parameters CAIX and VEGF and hypoxia PET imaging, while only a weak correlation was observed between [18F]HX4 PET imaging and the osteopontin concentration during treatment. Based on the current data, we conclude that hypoxia PET imaging is the superior method to evaluate tumour hypoxia before and during treatment and cannot be replaced with the evaluated blood biomarkers.
ACKNOWLEDGEMENTS
The authors like to thank the patients who agreed to participate and the PET-CT group, data-management (Anita Botterweck) and trial-poli (Claudia Offermann and John Paulissen) of Maastro Clinic for their contribution to the data acquisition. Authors acknowledge financial support from the QuIC-ConCePT project, which is partly funded by EFPI A companies and the Innovative Medicine Initiative Joint Undertaking (IMI JU) under Grant Agreement No. 115151. Authors also acknowledge financial support from EU 7th framework program
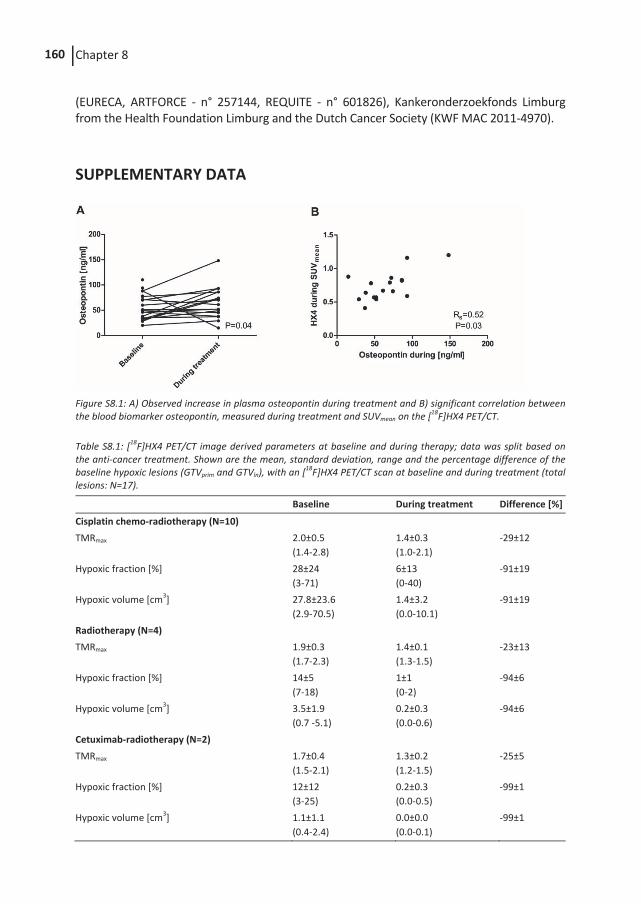
Chapter 8 160
(EURECA, ARTFORCE - n° 257144, REQUITE - n° 601826), Kankeronderzoekfonds Limburg from the Health Foundation Limburg and the Dutch Cancer Society (KWF MAC 2011-4970).
SUPPLEMENTARY DATA
Figure S8.1: A) Observed increase in plasma osteopontin during treatment and B) significant correlation between the blood biomarker osteopontin, measured during treatment and SUVmean on the [18F]HX4 PET/CT. Table S8.1: [18F]HX4 PET/CT image derived parameters at baseline and during therapy; data was split based on the anti-cancer treatment. Shown are the mean, standard deviation, range and the percentage difference of the baseline hypoxic lesions (GTVprim and GTVln), with an [18F]HX4 PET/CT scan at baseline and during treatment (total lesions: N=17).
Baseline During treatment Difference [%]
Cisplatin chemo-radiotherapy (N=10) TMRmax 2.0±0.5
(1.4-2.8) 1.4±0.3 (1.0-2.1)
-29±12
Hypoxic fraction [%] 28±24 (3-71)
6±13 (0-40)
-91±19
Hypoxic volume [cm3] 27.8±23.6 (2.9-70.5)
1.4±3.2 (0.0-10.1)
-91±19
Radiotherapy (N=4) TMRmax 1.9±0.3
(1.7-2.3) 1.4±0.1 (1.3-1.5)
-23±13
Hypoxic fraction [%] 14±5 (7-18)
1±1 (0-2)
-94±6
Hypoxic volume [cm3] 3.5±1.9 (0.7 -5.1)
0.2±0.3 (0.0-0.6)
-94±6
Cetuximab-radiotherapy (N=2) TMRmax 1.7±0.4
(1.5-2.1) 1.3±0.2 (1.2-1.5)
-25±5
Hypoxic fraction [%] 12±12 (3-25)
0.2±0.3 (0.0-0.5)
-99±1
Hypoxic volume [cm3] 1.1±1.1 (0.4-2.4)
0.0±0.0 (0.0-0.1)
-99±1
Evaluation of hypoxia during radiotherapy 161
REFERENCES
1. Nordsmark M, Bentzen SM, Rudat V, Brizel D, Lartigau E, Stadler P, et al. Prognostic value of tumor oxygenation in 397 head and neck tumors after primary radiation therapy. An international multi-center study. Radiother Oncol. 2005;77:18-24.
2. Horsman MR, Mortensen LS, Petersen JB, Busk M, Overgaard J. Imaging hypoxia to improve radiotherapy outcome. Nat Rev Clin Oncol. 2012;9:674-87.
3. Zips D, Zophel K, Abolmaali N, Perrin R, Abramyuk A, Haase R, et al. Exploratory prospective trial of hypoxia-specific PET imaging during radiochemotherapy in patients with locally advanced head-and-neck cancer. Radiother Oncol. 2012;105:21-8.
4. Hendrickson K, Phillips M, Smith W, Peterson L, Krohn K, Rajendran J. Hypoxia imaging with [F-18] FMISO-PET in head and neck cancer: potential for guiding intensity modulated radiation therapy in overcoming hypoxia-induced treatment resistance. Radiother Oncol. 2011;101:369-75.
5. van Elmpt W, Ollers M, Dingemans AM, Lambin P, De Ruysscher D. Response assessment using 18F-FDG PET early in the course of radiotherapy correlates with survival in advanced-stage non-small cell lung cancer. J Nucl Med. 2012;53:1514-20.
6. Overgaard J. Hypoxic modification of radiotherapy in squamous cell carcinoma of the head and neck--a systematic review and meta-analysis. Radiother Oncol. 2011;100:22-32.
7. Kaanders JH, Wijffels KI, Marres HA, Ljungkvist AS, Pop LA, van den Hoogen FJ, et al. Pimonidazole binding and tumor vascularity predict for treatment outcome in head and neck cancer. Cancer Res. 2002;62:7066-74.
8. Janssens GO, Rademakers SE, Terhaard CH, Doornaert PA, Bijl HP, van den Ende P, et al. Accelerated radiotherapy with carbogen and nicotinamide for laryngeal cancer: results of a phase III randomized trial. J Clin Oncol. 2012;30:1777-83.
9. Dubois LJ, Lieuwes NG, Janssen MH, Peeters WJ, Windhorst AD, Walsh JC, et al. Preclinical evaluation and validation of [18F]HX4, a promising hypoxia marker for PET imaging. Proc Natl Acad Sci U S A. 2011;108:14620-5.
10. Peeters SG, Zegers CM, Lieuwes NG, van Elmpt W, Eriksson J, van Dongen GA, et al. A Comparative Study of the Hypoxia PET Tracers [(18)F]HX4, [(18)F]FAZA, and [(18)F]FMISO in a Preclinical Tumor Model. Int J Radiat Oncol Biol Phys. 2015;91:351-9.
11. Zegers CM, van Elmpt W, Reymen B, Even AJ, Troost EG, Ollers MC, et al. In vivo quantification of hypoxic and metabolic status of NSCLC tumors using [18F]HX4 and [18F]FDG-PET/CT imaging. Clin Cancer Res. 2014;20:6389-97.
12. Zegers CM, van Elmpt W, Wierts R, Reymen B, Sharifi H, Ollers MC, et al. Hypoxia imaging with [(1)(8)F]HX4 PET in NSCLC patients: defining optimal imaging parameters. Radiother Oncol. 2013;109:58-64.
13. Nordsmark M, Eriksen JG, Gebski V, Alsner J, Horsman MR, Overgaard J. Differential risk assessments from five hypoxia specific assays: The basis for biologically adapted individualized radiotherapy in advanced head and neck cancer patients. Radiother Oncol. 2007;83:389-97.
14. Overgaard J, Eriksen JG, Nordsmark M, Alsner J, Horsman MR. Plasma osteopontin, hypoxia, and response to the hypoxia sensitiser nimorazole in radiotherapy of head

Chapter 8 162
and neck cancer: results from the DAHANCA 5 randomised double-blind placebo-controlled trial. Lancet Oncol. 2005;6:757-64.
15. Ilie M, Mazure NM, Hofman V, Ammadi RE, Ortholan C, Bonnetaud C, et al. High levels of carbonic anhydrase IX in tumour tissue and plasma are biomarkers of poor prognostic in patients with non-small cell lung cancer. Br J Cancer. 2010;102:1627-35.
16. van Loon J, Janssen MH, Ollers M, Aerts HJ, Dubois L, Hochstenbag M, et al. PET imaging of hypoxia using [18F]HX4: a phase I trial. Eur J Nucl Med Mol Imaging. 2010;37:1663-8.
17. Doss M, Zhang JJ, Belanger MJ, Stubbs JB, Hostetler ED, Alpaugh K, et al. Biodistribution and radiation dosimetry of the hypoxia marker 18F-HX4 in monkeys and humans determined by using whole-body PET/CT. Nucl Med Commun. 2010;31:1016-24.
18. Chen L, Zhang Z, Kolb HC, Walsh JC, Zhang J, Guan Y. (1)(8)F-HX4 hypoxia imaging with PET/CT in head and neck cancer: a comparison with (1)(8)F-FMISO. Nucl Med Commun. 2012;33:1096-102.
19. Lee N, Nehmeh S, Schoder H, Fury M, Chan K, Ling CC, et al. Prospective trial incorporating pre-/mid-treatment [18F]-misonidazole positron emission tomography for head-and-neck cancer patients undergoing concurrent chemoradiotherapy. Int J Radiat Oncol Biol Phys. 2009;75:101-8.
20. Servagi-Vernat S, Differding S, Hanin FX, Labar D, Bol A, Lee JA, et al. A prospective clinical study of (1)(8)F-FAZA PET-CT hypoxia imaging in head and neck squamous cell carcinoma before and during radiation therapy. Eur J Nucl Med Mol Imaging. 2014;41:1544-52.
21. Bollineni VR, Koole MJ, Pruim J, Brouwer CL, Wiegman EM, Groen HJ, et al. Dynamics of tumor hypoxia assessed by 18F-FAZA PET/CT in head and neck and lung cancer patients during chemoradiation: possible implications for radiotherapy treatment planning strategies. Radiother Oncol. 2014;113:198-203.
22. Peeters SG, Zegers CM, Biemans R, Lieuwes NG, van Stiphout RG, Yaromina A, et al. TH-302 in combination with radiotherapy enhances the therapeutic outcome and is associated with pretreatment [18F]HX4 hypoxia PET imaging. Clin Cancer Res. 2015.
23. Servagi-Vernat S, Differding S, Sterpin E, Hanin FX, Labar D, Bol A, et al. Hypoxia-guided adaptive radiation dose escalation in head and neck carcinoma: A planning study. Acta Oncol. 2015:1-9.
24. Choi W, Lee SW, Park SH, Ryu JS, Oh SJ, Im KC, et al. Planning study for available dose of hypoxic tumor volume using fluorine-18-labeled fluoromisonidazole positron emission tomography for treatment of the head and neck cancer. Radiother Oncol. 2010;97:176-82.
25. Berwouts D, Olteanu LA, Duprez F, Vercauteren T, De Gersem W, De Neve W, et al. Three-phase adaptive dose-painting-by-numbers for head-and-neck cancer: initial results of the phase I clinical trial. Radiother Oncol. 2013;107:310-6.
26. Bittner MI, Wiedenmann N, Bucher S, Hentschel M, Mix M, Weber WA, et al. Exploratory geographical analysis of hypoxic subvolumes using 18F-MISO-PET imaging in patients with head and neck cancer in the course of primary chemoradiotherapy. Radiother Oncol. 2013;108:511-6.
Evaluation of hypoxia during radiotherapy 163
27. Nehmeh SA, Lee NY, Schroder H, Squire O, Zanzonico PB, Erdi YE, et al. Reproducibility of intratumor distribution of (18)F-fluoromisonidazole in head and neck cancer. Int J Radiat Oncol Biol Phys. 2008;70:235-42.
28. Lin Z, Mechalakos J, Nehmeh S, Schoder H, Lee N, Humm J, et al. The influence of changes in tumor hypoxia on dose-painting treatment plans based on 18F-FMISO positron emission tomography. Int J Radiat Oncol Biol Phys. 2008;70:1219-28.
29. Yaromina A, Kroeber T, Meinzer A, Boeke S, Thames H, Baumann M, et al. Exploratory study of the prognostic value of microenvironmental parameters during fractionated irradiation in human squamous cell carcinoma xenografts. Int J Radiat Oncol Biol Phys. 2011;80:1205-13.
30. Buijsen J, van Stiphout RG, Menheere PP, Lammering G, Lambin P. Blood biomarkers are helpful in the prediction of response to chemoradiation in rectal cancer: a prospective, hypothesis driven study on patients with locally advanced rectal cancer. Radiother Oncol. 2014;111:237-42.
31. Wang KX, Denhardt DT. Osteopontin: role in immune regulation and stress responses. Cytokine Growth Factor Rev. 2008;19:333-45.
32. Vaschetto R, Nicola S, Olivieri C, Boggio E, Piccolella F, Mesturini R, et al. Serum levels of osteopontin are increased in SIRS and sepsis. Intensive Care Med. 2008;34:2176-84.
33. Vercellino L, Groheux D, Thoury A, Delord M, Schlageter MH, Delpech Y, et al. Hypoxia imaging of uterine cervix carcinoma with (18)F-FETNIM PET/CT. Clin Nucl Med. 2012;37:1065-8.
34. Gronroos TJ, Lehtio K, Soderstrom KO, Kronqvist P, Laine J, Eskola O, et al. Hypoxia, blood flow and metabolism in squamous-cell carcinoma of the head and neck: correlations between multiple immunohistochemical parameters and PET. BMC Cancer. 2014;14:876.
35. Kawai N, Lin W, Cao WD, Ogawa D, Miyake K, Haba R, et al. Correlation between (1)(8)F-fluoromisonidazole PET and expression of HIF-1alpha and VEGF in newly diagnosed and recurrent malignant gliomas. Eur J Nucl Med Mol Imaging. 2014;41:1870-8.

CHAPTER
TH-302 in combination with radiotherapy enhances the therapeutic outcome and is associated with pretreatment [18F]HX4 hypoxia PET imaging
Sarah G.J.A. Peeters, Catharina M.L. Zegers, Rianne Biemans, Natasja G. Lieuwes, Ruud G.P.M. van Stiphout, Ala Yaromina, Jessica D. Sun, Charles P. Hart, Albert D. Windhorst, Wouter van Elmpt, Ludwig Dubois*, Philippe Lambin* Published in: Clin Cancer Res. 2015 21(13):2984-92.
Chapter 9 166
ABSTRACT
Purpose: Conventional anticancer treatments are often impaired by the presence of hypoxia. TH-302 selectively targets hypoxic tumor regions where it is converted into a cytotoxic agent. This study assessed the efficacy of the combination treatment of TH-302 and radiotherapy in two preclinical tumor models. The effect of oxygen modification on the combination treatment was evaluated and the effect of TH-302 on the hypoxic frac-tion (HF) was monitored using [18F]HX4-PET imaging and pimonidazole IHC stainings. Experimental Design: Rhabdomyosarcoma R1 and H460 NSCLC tumor-bearing animals were treated with TH-302 and radiotherapy (8 Gy, single dose). The tumor oxygenation status was altered by exposing animals to carbogen (95% oxygen) and nicotinamide, 21% or 7% oxygen breathing during the course of the treatment. Tumor growth and treatment toxicity was monitored until the tumor reached 4 times its start volume (T4xSV). Results: Both tumor models showed a growth delay after TH-302 treatment which further increased when combined with radiotherapy (enhancement ratio rhabdomyosarcoma 1.23; H460 1.49). TH-302 decreases the HF in both models, consistent with its hypoxia-targeting mechanism of action. Treatment efficacy was dependent on tumor oxygenation; increasing the tumor oxygen status abolished the effect of TH-302, whereas enhancing the HF enlarged TH-302’s therapeutic effect. An association was observed in rhabdomyosar-coma tumors between the pretreatment HF as measured by [18F]HX4-PET imaging and the T4xSV. Conclusions: The combination of TH-302 and radiotherapy is promising and warrants clinical testing, preferably guided by the companion biomarker [18F]HX4 hypoxia PET imaging for patient selection.
Monitoring of hypoxia after radiation and TH-302 167
INTRODUCTION
Hypoxia is a common feature of solid tumors and is known to negatively influence treat-ment outcome (1, 2). Because of the disorganized vessel formation and consequently low oxygen concentrations, conventional chemotherapies and radiotherapies are less effec-tive. To overcome hypoxia-induced treatment resistance, drugs have been developed that specifically target hypoxic tumor regions. These so-called ‘hypoxia activated prodrugs’ (HAP) are non-toxic under normal oxygen concentrations but are activated in environ-ments with low oxygen concentrations. TH-302 is a second generation HAP of which the activation mechanism is based on the reduction of its 2-nitroimidazole moiety. Only in the presence of certain reductases under low oxygen concentrations is the toxic effector bromo-isophosphoramide mustard (Br-IPM) selectively released and able to crosslink DNA leading to cell death. Preclinical studies have assessed the therapeutic effect of TH-302 alone or in combination with conventional chemotherapies in multiple xenograft models. TH-302 monotherapy led to reduced tumor growth in many of the xenograft models profiled, and was dependent on the hypoxic fraction (HF; ref 3). Combining TH-302 with several clinically used chemo-therapeutics offers advantage over single-agent treatment, although the treatment schedule and order of administration is of importance (4). A phase 1 study demonstrated the safety of TH-302 monotherapy in patients with solid malignancies (5). Other clinical phase I and II trials successfully combined the standard treatment doxorubicin with intra-venous administration of TH-302 in patients with advanced soft tissue sarcoma (6, 7) and standard treatment gemcitabine with TH-302 in patients with advanced pancreatic cancer (8). However, there are no published studies to assess the combination therapy of TH-302 and radiotherapy. Radiotherapy is one of the conventional treatment options applied to multiple cancer types and tumor hypoxia is a known radioresistance factor. The combina-tion of TH-302 and radiotherapy is hypothesized to be complementary; where TH-302 specifically targets hypoxic cells, radiotherapy has the highest therapeutic gain in the well-oxygenated cells. PET imaging is a non-invasive method characterizing the tumor oxygenation status in a three-dimensional manner. Several PET tracers have been developed that specifically visualize hypoxic regions. One of those tracers, based on the same 2-nitroimidazole hypoxia sensing mechanism as TH-302, is [18F]HX4. Preclinical and clinical trials have shown that [18F]HX4 is a reliable tool for the noninvasive detection of hypoxic tumor regions (9-11). Because TH-302, like tirapazamine, is expected to have only a therapeutic effect when hypoxic regions are present in the tumor (12), [18F]HX4 PET imaging may function as a useful predictive biomarker. In the current study we investigated the treatment effect of TH-302 in combination with radiotherapy in two preclinical tumor models. We hypothesize that this combination therapy will enhance the therapeutic effect. Furthermore we investigate the causal rela-
Chapter 9 168
tionship between TH-302 efficacy and the modified tumor oxygenation status which was assessed before and after treatment using [18F]HX4 hypoxia PET imaging and only after treatment with pimonidazole staining. We hypothesize that the pretreatment hypoxia [18F]HX4 PET imaging will correlate with the treatment outcome.
MATERIALS AND METHODS
Animal, tumor models and treatment schedules
All animal experimental procedures were approved by the Animal Ethical Committee of Maastricht University and were in accordance with the Helsinki Declaration of 1975 as revised in 2000. All animals were monitored at least 3 times a week and their tumor volume was calculated using the formula: A x B x C x π/6 in which A, B and C are the three orthogonal diameters of the tumor as measured using a Vernier caliper, each corrected for the thickness of the skin. Animals were randomized into the different treatment groups (Figure S9.1A) and were monitored until four times start volume (T4xSV) was reached. For this calculation the start volume of the first day of TH-302 treatment was used and fitting of the data was based on the regrowth phase. TH-302 was supplied by Threshold Pharma-ceuticals and dissolved in 0.9% NaCl to a concentration of 5 mg/mL.
Experimental models
Syngeneic rhabdomyosarcoma R1 tumors (1 mm3) were implanted subcutaneously in the lateral flank of adult WAG/Rij rats. Experiments were started upon a mean tumor volume of 4.2 cm3 (range, 2.0-8.1) to ensure a stable HF. Treatment was administered on 4 con-secutive days (Figure S9.1A) and consisted of an intraperitoneal injection (i.p.; QDx4) with either NaCl or TH-302 (25, 50 or 75 mg/kg). Before the start of treatment a PET scan was made using [18F]HX4. Radiotherapy (Varian Truebeam linear accelerator; 15 MeV elec-trons) was applied in a single dose of 0, 4, 8 or 12 Gy on day 3 of the treatment, 3 hours after NaCl or TH-302 injection, 1 hour after oxygen modification. During both PET imaging and radiotherapy rats were anaesthetized using a mixture of ketamine/xylazine (i.p; 66.7 and 6.7 mg/kg, respectively). During the 5 days of treatment (1 day PET imaging, 4 days of injections with TH-302 or vehicle), animals were exposed to modified oxygen concentra-tions for 4 hours per day in order to alter the HF of the tumor. The combination oxygen modification of nicotinamide (i.p. 500mg/kg) and carbogen (95% oxygen, 5% CO2; 5 L/min) consisted of a nicotinamide injection and 30 minutes later the exposure to carbogen breathing for 3.5 hours. In the middle of the nicotinamide/carbogen treatment NaCl/TH-302 was administered. Reduced oxygen breathing (7%, residual N2; 2.5 L/min) was given for 4 hours with the NaCl/TH-302 injection after the first two hours. The injection of the [18F]HX4 PET tracer [mean 18.8 MBq, range 7.1-25.1 MBq; lateral tail vein using an intra-venous line (Venoflux 0.4mm G27) flushed with 10% heparine] was given 2 hours before the end of the oxygen modification. PET imaging was performed 3 hours after tracer injection, as previously assessed (13). [18F]HX4 PET scans could not be performed on all treated animals due to production and supply difficulties. For the histological control animals, PET imaging was also performed on day 4 of the treatment.
Monitoring of hypoxia after radiation and TH-302 169
H460 lung carcinoma cells were resuspended (1 x 10⁶ cells/mL; ATCC HTB-177) in Base-ment Membrane Matrix (MatrigelTM BD Biosciences) and injected in the lateral flank of NU-Foxn1-nu (NU/NU) mice. Experiments were started upon animals reaching a mean tumor volume of 225 mm3 (range 89-273 mm3). Mice were treated with either NaCl or TH-302 (50 mg/kg) for 5 consecutive days (QDx5). Treatment was combined with radiothera-py in a single dose of 0 or 8 Gy on day 4 for which the animals were anaesthetized using a mixture of ketamine/xylazine (i.p; 66.7 and 6.7 mg/kg respectively). During the 5 days of treatment, animals were exposed to different oxygen concentrations; either a combina-tion of nicotinamide (500 mg/kg i.p.) and carbogen breathing (95% oxygen, 5% CO2), 21% oxygen breathing (pressured air) or 7% oxygen breathing (residual N2). Total treatment time for all oxygen breathing schedules was 2.5 hours with the NaCl/TH-302 injection given 1 hour after the start of the treatment. Nicotinamide was administered 30 minutes before carbogen breathing was started, which was then applied for another 2 hours. Radiotherapy was given within 1 hour after the oxygen treatment. Histological controls were administered with pimonidazole (60 mg/kg, i.p.; Hypoxyprobe kit, HP3-1000; Bio-connect) and Hoechst 33342 (15 mg/kg, i.v.; Sigma-Aldrich) 1 hour and 1 minute before sacrificing, respectively, followed by excision of the tumors which were snap frozen in liquid nitrogen and stored at -80 degrees Celsius until being processed.
PET Image acquisition and analysis
Tracer synthesis of [18F]HX4 was performed as described previously (14). [18F]HX4 positron emission tomography (PET) images were acquired and analyzed using a clinical PET/CT scanner (Siemens Biograph 40, Siemens Healthcare) as previously described (13). A vol-ume of interest in the heart (sphere with a radius of 3mm) was defined as background region. The threshold to define the hypoxic fraction (HF) was set at 4.5 times the back-ground uptake, because this method results in a HF which is in agreement with the pi-monidazole staining- based results of a previous study on the rat rhabdomyosarcoma model (15).
Immunohistochemical staining and analysis
Frozen H460 xenograft tumors were sectioned (5 µm) and stained for hypoxia (pimonida-zole), blood vessels (CD31) and perfusion (Hoechst 33342). Sections were fixed using cold acetone, rehydrated in TBS with 0.2% Tween-20 (TBST) and preincubated with normal goat serum before exposing them to the primary antibody rabbit anti-pimonidazole (1:150; HP3-1000, Bio-connect) and rat anti-mouse CD31 (1:500; BD biosciences). After washing with TBST, incubation with the secondary antibody goat anti-rabbit Alexa594 (1:500) and goat anti-rat Alexa488 (1:750, both Invitrogen) was performed. Sections were mounted using fluorescent mounting medium (DakoCytomation) and scanned for pimoni-dazole, blood vessels and perfusion. After scanning, sections were stained for hematoxylin and eosin (H&E). Images were acquired using an Olympus BX51WI microscope equipped with a Hamamatsu EM-CCD C9100 digital camera, a motorized stage (Ludl Mac 2000) and a 10x objective. Micromanager 1.4 software was used for automated image acquisition (16). ImageJ version 1.49e (http://rsb.info.nih.gov/ij/) was used to stitch the images and perform
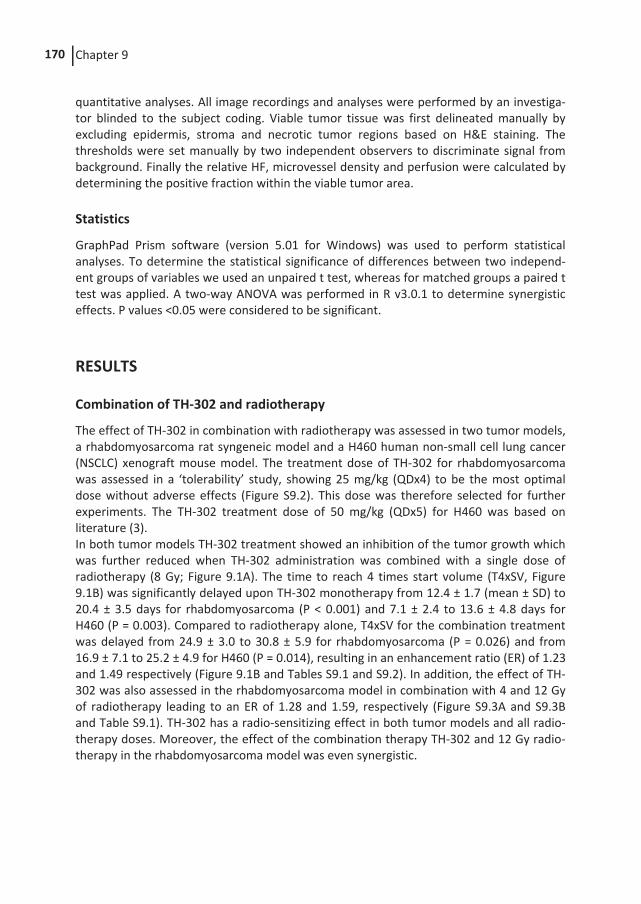
Chapter 9 170
quantitative analyses. All image recordings and analyses were performed by an investiga-tor blinded to the subject coding. Viable tumor tissue was first delineated manually by excluding epidermis, stroma and necrotic tumor regions based on H&E staining. The thresholds were set manually by two independent observers to discriminate signal from background. Finally the relative HF, microvessel density and perfusion were calculated by determining the positive fraction within the viable tumor area.
Statistics
GraphPad Prism software (version 5.01 for Windows) was used to perform statistical analyses. To determine the statistical significance of differences between two independ-ent groups of variables we used an unpaired t test, whereas for matched groups a paired t test was applied. A two-way ANOVA was performed in R v3.0.1 to determine synergistic effects. P values <0.05 were considered to be significant.
RESULTS
Combination of TH-302 and radiotherapy
The effect of TH-302 in combination with radiotherapy was assessed in two tumor models, a rhabdomyosarcoma rat syngeneic model and a H460 human non-small cell lung cancer (NSCLC) xenograft mouse model. The treatment dose of TH-302 for rhabdomyosarcoma was assessed in a ‘tolerability’ study, showing 25 mg/kg (QDx4) to be the most optimal dose without adverse effects (Figure S9.2). This dose was therefore selected for further experiments. The TH-302 treatment dose of 50 mg/kg (QDx5) for H460 was based on literature (3). In both tumor models TH-302 treatment showed an inhibition of the tumor growth which was further reduced when TH-302 administration was combined with a single dose of radiotherapy (8 Gy; Figure 9.1A). The time to reach 4 times start volume (T4xSV, Figure 9.1B) was significantly delayed upon TH-302 monotherapy from 12.4 ± 1.7 (mean ± SD) to 20.4 ± 3.5 days for rhabdomyosarcoma (P < 0.001) and 7.1 ± 2.4 to 13.6 ± 4.8 days for H460 (P = 0.003). Compared to radiotherapy alone, T4xSV for the combination treatment was delayed from 24.9 ± 3.0 to 30.8 ± 5.9 for rhabdomyosarcoma (P = 0.026) and from 16.9 ± 7.1 to 25.2 ± 4.9 for H460 (P = 0.014), resulting in an enhancement ratio (ER) of 1.23 and 1.49 respectively (Figure 9.1B and Tables S9.1 and S9.2). In addition, the effect of TH-302 was also assessed in the rhabdomyosarcoma model in combination with 4 and 12 Gy of radiotherapy leading to an ER of 1.28 and 1.59, respectively (Figure S9.3A and S9.3B and Table S9.1). TH-302 has a radio-sensitizing effect in both tumor models and all radio-therapy doses. Moreover, the effect of the combination therapy TH-302 and 12 Gy radio-therapy in the rhabdomyosarcoma model was even synergistic.
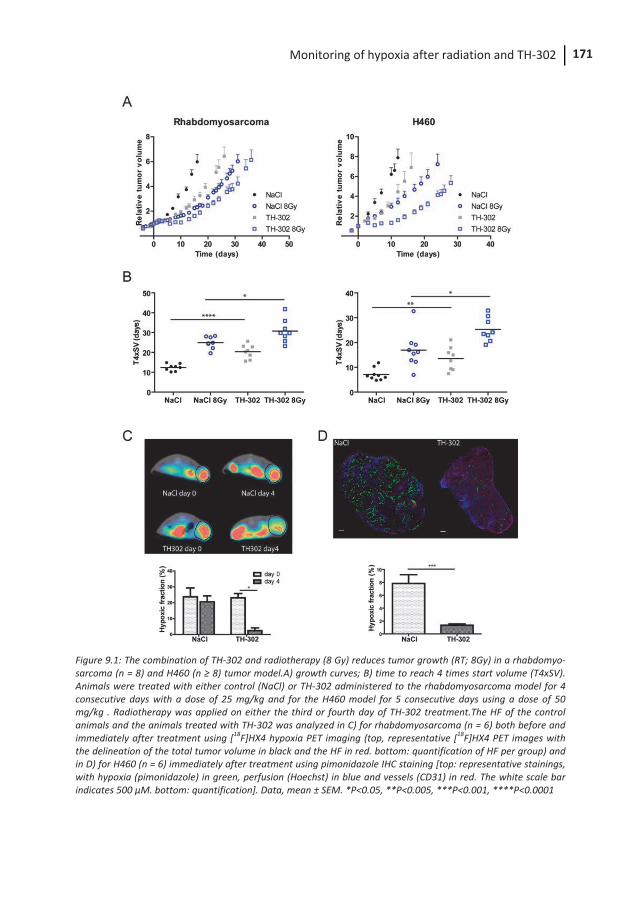
Monitoring of hypoxia after radiation and TH-302 171
Figure 9.1: The combination of TH-302 and radiotherapy (8 Gy) reduces tumor growth (RT; 8Gy) in a rhabdomyo-sarcoma (n = 8) and H460 (n ≥ 8) tumor model.A) growth curves; B) time to reach 4 times start volume (T4xSV). Animals were treated with either control (NaCl) or TH-302 administered to the rhabdomyosarcoma model for 4 consecutive days with a dose of 25 mg/kg and for the H460 model for 5 consecutive days using a dose of 50 mg/kg . Radiotherapy was applied on either the third or fourth day of TH-302 treatment.The HF of the control animals and the animals treated with TH-302 was analyzed in C) for rhabdomyosarcoma (n = 6) both before and immediately after treatment using [18F]HX4 hypoxia PET imaging (top, representative [18F]HX4 PET images with the delineation of the total tumor volume in black and the HF in red. bottom: quantification of HF per group) and in D) for H460 (n = 6) immediately after treatment using pimonidazole IHC staining [top: representative stainings, with hypoxia (pimonidazole) in green, perfusion (Hoechst) in blue and vessels (CD31) in red. The white scale bar indicates 500 µM. bottom: quantification]. Data, mean ± SEM. *P<0.05, **P<0.005, ***P<0.001, ****P<0.0001
Chapter 9 172
Figure 9.2: The effect of oxygen modification on the combination treatment of TH-302 and radiotherapy. A) exposing animals to 95% oxygen (nicotinamide 500 mg/kg i.p. / carbogen breathing 95% oxygen, 5% CO2), or 7% oxygen (residual N2) decreases or increases the hypoxic fraction respectively before the start of treatment compared to 21% oxygen breathing (ambient air). Representative [18F]HX4 PET images with the delineation of the tumor in black and the HF in red. *P<0.05, ****P<0.0001. Exposing the B) rhabdomyosarcoma (n ≥ 7) or C) H460 (n ≥ 8) model to modifying oxygen concentrations for the duration of the treatment for 4 and 2.5 hours per day, respectively. Data represent mean ± SEM.
Monitoring of hypoxia after radiation and TH-302 173
Hypoxic fraction
The effect of TH-302 on the HF in the rhabdomyosarcoma model was assessed using [18F]HX4 hypoxia PET imaging and revealed a significant decrease from a baseline of 23.1% ± 6.7 to 2.5% ± 4.2 after TH-302 treatment (P < 0.001). NaCl treatment, as expected, did not affect the HF (Figure 9.1C). In the H460 model the HF was assessed immediately after the treatment using histological controls injected with pimonidazole. The HF in subjects treated with TH-302 significantly decreased compared to the control animals (NaCl: 7.8% ± 3.0; TH-302: 1.3% ± 0.5; Figure 9.1D).
Effect of oxygen modification on the efficacy of TH-302 and radiotherapy
To investigate if a causal relationship exists between TH-302 efficacy and tumor oxygena-tion, the amount of oxygen present in the tumor was modified on the days of TH-302 treatment by 7% or 95% oxygen breathing to increase or decrease the HF, respectively. Oxygen modification was performed 1 day in advance for the rhabdomyosarcoma model in order to assess the effect of this modification on the baseline HF using [18F]HX4-PET imaging. Ambient air breathing animals had a HF of 22.2 ± 13.8%. A significant reduction in the HF to 2.1 ± 4.7% was seen after 95% oxygen breathing (P < 0.001), whereas 7% oxygen breathing significantly increased the HF to 29.5 ± 14.7% (P = 0.029; Figure 9.2A). Exposing rhabdomyosarcoma-bearing rats to increasing oxygen conditions abolished the effect of TH-302 and reduced the T4xSV from 20.4 ± 3.5 to 15.3 ± 2.5 days (P = 0.007, Figure 9.2B, Figure S9.3C and Table S9.1), whereas control animals had an increased T4xSV. Upon combination with radiotherapy, the T4xSV of TH-302 treated tumors decreased from 30.8 ± 5.9 (TH-302 + radiotherapy) to 25.7 ± 2.9 days (TH-302 + radiotherapy + 95% O2). This is comparable with the T4xSV of 23.2 ± 1.7 days for animals treated with NaCl + radiotherapy under 95% O2 conditions resulting in an ER of 1.11 (Table S9.1). Exposing animals to 7% oxygen breathing resulted in a T4xSV of 22.6 ± 4.2 days for TH-302 which is significantly delayed compared to the animals treated with NaCl (T4xSV: 16.1 ± 1.9, P = 0.001) although 7% oxygen treatment itself also had an effect on tumor growth in control animals. In the combination therapy of 7% oxygen breathing with radiotherapy, animals treated with TH-302 had a further reduction in the T4xSV to 35.4 ± 6.1 days with an ER of 1.29 compared to the animals treated with NaCl (Figure S9.3C and Table S9.1). Oxygen modification treatments were also applied to the H460 model where reducing the HF resulted in a decreased T4xSV from 25.2 ± 4.9 (TH-302 + radiotherapy) to 20.2 ±7.0 (TH-302 + radiotherapy + 95% O2) for the combination treatment. This decrease was not significant, however. The ER of TH-302 under high oxygen concentration remained stable at 1.50 versus 1.49 at 21% O2 breathing. The tumor growth rate itself was unaffected by 95% oxygen breathing (Figure 9.2C, Figure S9.3D and Table S9.2). Increasing the HF signifi-cantly enlarged the therapeutic potential of TH-302 compared to normal breathing ani-mals (P = 0.011), resulting in a T4xSV of 22.7 ± 7.9 (T4xSV TH-302 21% O2: 13.6 ± 4.8). While 7% oxygen breathing reduced the tumor growth slightly, radiotherapy increased the tumor growth of control animals under this condition.
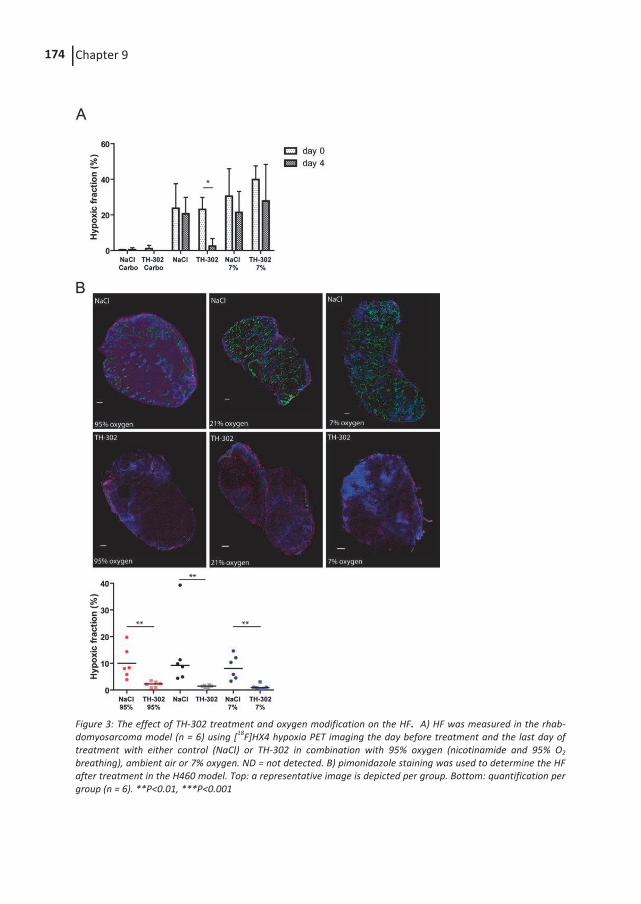
Chapter 9 174
Figure 3: The effect of TH-302 treatment and oxygen modification on the HF. A) HF was measured in the rhab-domyosarcoma model (n = 6) using [18F]HX4 hypoxia PET imaging the day before treatment and the last day of treatment with either control (NaCl) or TH-302 in combination with 95% oxygen (nicotinamide and 95% O2 breathing), ambient air or 7% oxygen. ND = not detected. B) pimonidazole staining was used to determine the HF after treatment in the H460 model. Top: a representative image is depicted per group. Bottom: quantification per group (n = 6). **P<0.01, ***P<0.001
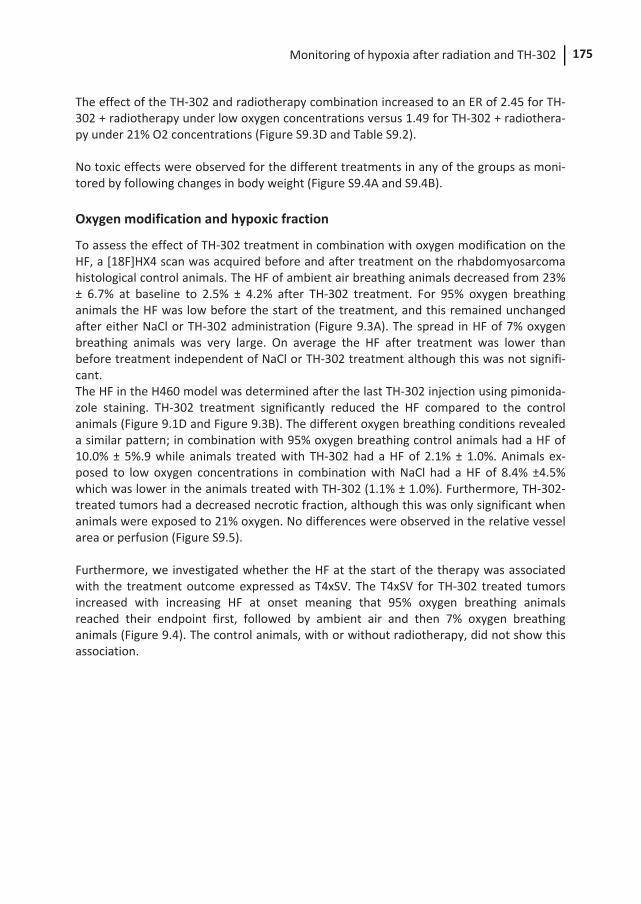
Monitoring of hypoxia after radiation and TH-302 175
The effect of the TH-302 and radiotherapy combination increased to an ER of 2.45 for TH-302 + radiotherapy under low oxygen concentrations versus 1.49 for TH-302 + radiothera-py under 21% O2 concentrations (Figure S9.3D and Table S9.2). No toxic effects were observed for the different treatments in any of the groups as moni-tored by following changes in body weight (Figure S9.4A and S9.4B).
Oxygen modification and hypoxic fraction
To assess the effect of TH-302 treatment in combination with oxygen modification on the HF, a [18F]HX4 scan was acquired before and after treatment on the rhabdomyosarcoma histological control animals. The HF of ambient air breathing animals decreased from 23% ± 6.7% at baseline to 2.5% ± 4.2% after TH-302 treatment. For 95% oxygen breathing animals the HF was low before the start of the treatment, and this remained unchanged after either NaCl or TH-302 administration (Figure 9.3A). The spread in HF of 7% oxygen breathing animals was very large. On average the HF after treatment was lower than before treatment independent of NaCl or TH-302 treatment although this was not signifi-cant. The HF in the H460 model was determined after the last TH-302 injection using pimonida-zole staining. TH-302 treatment significantly reduced the HF compared to the control animals (Figure 9.1D and Figure 9.3B). The different oxygen breathing conditions revealed a similar pattern; in combination with 95% oxygen breathing control animals had a HF of 10.0% ± 5%.9 while animals treated with TH-302 had a HF of 2.1% ± 1.0%. Animals ex-posed to low oxygen concentrations in combination with NaCl had a HF of 8.4% ±4.5% which was lower in the animals treated with TH-302 (1.1% ± 1.0%). Furthermore, TH-302-treated tumors had a decreased necrotic fraction, although this was only significant when animals were exposed to 21% oxygen. No differences were observed in the relative vessel area or perfusion (Figure S9.5). Furthermore, we investigated whether the HF at the start of the therapy was associated with the treatment outcome expressed as T4xSV. The T4xSV for TH-302 treated tumors increased with increasing HF at onset meaning that 95% oxygen breathing animals reached their endpoint first, followed by ambient air and then 7% oxygen breathing animals (Figure 9.4). The control animals, with or without radiotherapy, did not show this association.
Chapter 9 176
Figure 9.4: The association between the pretreatment [18F]HX4-based HF and the treatment outcome in rhabdo-myosarcoma tumors. HF (%) as measured before the start of the treatment plotted to the time to reach 4 times the start volume (T4xSV) for the control group (NaCl) and animals treated with TH-302 either with or without radiotherapy. Hypoxic fraction is determined using [18F]HX4 hypoxia PET imaging after 95% oxygen breathing (n = 32), ambient air breathing (n = 43) and 7% oxygen breathing (n = 33). The T4xSV is calculated for NaCl for all oxygen concentrations using 8 animals, TH-302 95% oxygen( n = 7), ambient air and 7% oxygen (n = 8). Data represent mean ± SEM.
DISCUSSION
This study demonstrates the combination efficacy of the HAP TH-302 with radiotherapy in two preclinical tumor models, which was causally related to the tumor oxygen status. Additionally, the [18F]HX4 determined HF was associated with the treatment outcome. Pharmacokinetic studies in nontumor-bearing rats showed no adverse effects when the animals were treated with TH-302 (17). Although rhabdomyosarcoma-bearing rats showed no adverse effect after a 25 mg/kg TH-302 dose, dose-dependent adverse effects, such as a significant drop in body weight, diarrhea and general malaise, were observed after higher dosing. Initial clinical studies also reported some adverse effects with skin and mucosal toxicities being dose limiting, while common adverse events were nausea, skin rash, fatigue and vomiting (5, 6). In this study two different methods were used to assess the HF: noninvasive, clinically used [18F]HX4 PET imaging (11, 13), and IHC of pimonidazole adducts (9). While [18F]HX4 hypoxia PET imaging represents the whole tumor in a noninvasive, reproducible, three-dimensional manner, IHC stainings can, in addition to hypoxia, extract more tumor micro-environmental information from the same tumor section. In both techniques, [18F]HX4 and pimonidazole, are reduced under low oxygen concentrations (18) and a significant colocal-ization relationship was demonstrated at the tumor sub-regional level (9). Although monitored by different techniques, these data indicate that TH-302 has the same reducing effect on the HF in both tumor models. Furthermore, based on these data, [18F]HX4 imaging could be used as biomarker of response in a window-of-opportunity clinical trial. By performing a pretreatment scan, the initial tumor HF can be determined, followed by a single injection of TH-302. A posttreatment [18F]HX4 hypoxia scan can assess whether there is a response in HF to this HAP, without interference of other anticancer therapies. This new approach is designed to test new molecular entities in a clinical trial while being cost and patient efficient (19, 20).
Monitoring of hypoxia after radiation and TH-302 177
A correlation has previously been reported between the HF and the tumor growth inhibi-tion in xenograft models (3). This endorses our findings of a pronounced effect of TH-302 since the preclinical tumor models in this study were observed to have respectively somewhat higher and lower HF than the reported HF of 18.6% for rhabdomyosarcoma (15) and 16.3% for H460 (3). Although the HF in tumors was significantly decreased after TH-302 treatment, not all hypoxic cells were eliminated, as observed in both tumor mod-els. The remaining hypoxic cells might be resistant, unreachable by TH-302, or caused by cycling hypoxia. In addition to the decrease in the HF, this study shows a decrease in the necrotic fraction of the TH-302 treated tumors. This indicates that the dead cells are resorbed, which is supported by the stagnation in tumor growth after 3 days of TH-302 treatment. Other microenvironmental characteristics like relative vessel area and perfu-sion were not affected by TH-302 treatment, suggesting that the tumor maintains its vasculature. This is in agreement with previously published results on solid tumors (3). Although TH-302 exhibits antitumor effects as a monotherapy, it has been shown that its therapeutic efficacy increases when combined with conventional anticancer therapies mainly targeting the nonhypoxic cells. On the basis of favorable outcomes of two clinical phase II trials (7, 8), phase III trials in metastatic or locally advanced unresectable pancre-atic adenocarcinoma (NCT01746979) and advanced soft-tissue sarcoma (NCT01440088) are currently ongoing. However, to our knowledge, no study has investigated the combi-nation treatment of TH-302 with radiotherapy and [18F]HX4 hypoxia imaging. This combi-nation is thought to be effective especially since radiotherapy can be locally applied, specifically targeting the tumor while preserving normal tissue. In this study we show that this combination is effective and causes a delayed tumor growth and increased T4xSV for both investigated tumor models, confirming the hypothesis that the combination therapy of TH-302 and radiotherapy will lead to an enhanced therapeutic effect. In the rhabdomy-osarcoma tumor model, TH-302 treatment was combined with a single dose of 4, 8 and 12 Gy of radiotherapy resulting in a dose dependent effect. In subsequent studies the single radiotherapy dose of 8 Gy was used, reasoning that the regrowth of the tumor solely depends on hypoxic cells (21), providing a basis for TH-302 efficacy. This approach is different from clinical practice where fractionated radiotherapy schedules are used. By applying 2 Gy fractions to the tumor, reoxygenation occurs and the HF gradually decreases (22, 23). We speculate that the combination of TH-302 with fractionated radiotherapy would also increase the therapeutic effect of the radiotherapy since the HF is reduced by the pretreatment of TH-302, increasing the potential of radiotherapy. In this study we further wanted to elucidate if TH-302 efficacy is dependent on the tumor oxygen status. Exposing animals to either nicotinamide and carbogen or 7% oxygen breathing has been demonstrated to be effective in modulating the HF in tumors (9, 24, 25). Altering oxygen breathing before the TH-302 treatment did modify the tumor HF in rhabdomyosarcoma animals as measured by [18F]HX4. However, in the H460 model, the HF was only determined after TH-302 treatment and at this point no differences were observed in control animals of the various oxygen modifications. A possible explanation would be that the mice adapted to the oxygen breathing schedule, preventing the tumor HF from changing, which has been observed for mice exposed to long-term carbogen breathing (26, 27). In the rhabdomyosarcoma model, the tumor growth of control animals
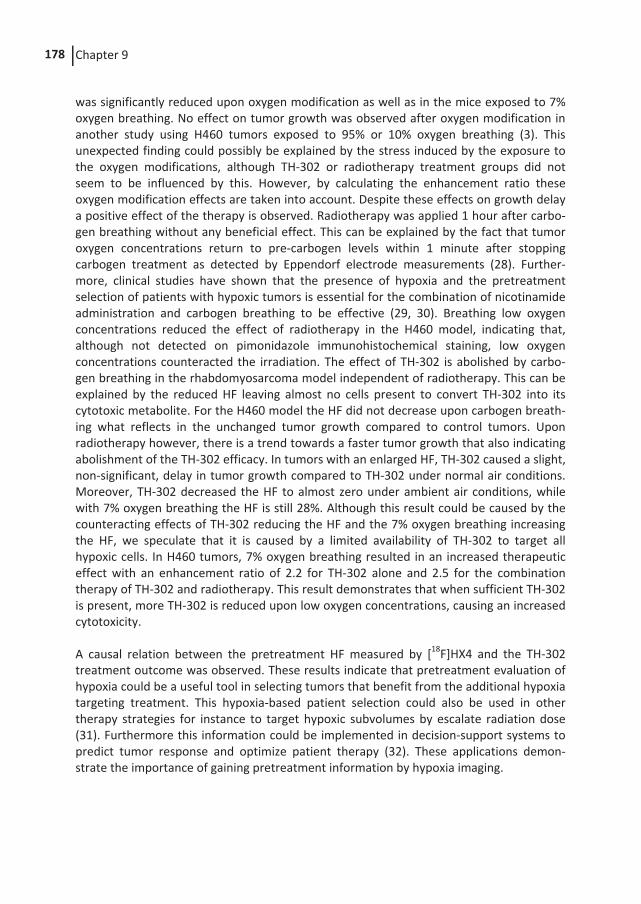
Chapter 9 178
was significantly reduced upon oxygen modification as well as in the mice exposed to 7% oxygen breathing. No effect on tumor growth was observed after oxygen modification in another study using H460 tumors exposed to 95% or 10% oxygen breathing (3). This unexpected finding could possibly be explained by the stress induced by the exposure to the oxygen modifications, although TH-302 or radiotherapy treatment groups did not seem to be influenced by this. However, by calculating the enhancement ratio these oxygen modification effects are taken into account. Despite these effects on growth delay a positive effect of the therapy is observed. Radiotherapy was applied 1 hour after carbo-gen breathing without any beneficial effect. This can be explained by the fact that tumor oxygen concentrations return to pre-carbogen levels within 1 minute after stopping carbogen treatment as detected by Eppendorf electrode measurements (28). Further-more, clinical studies have shown that the presence of hypoxia and the pretreatment selection of patients with hypoxic tumors is essential for the combination of nicotinamide administration and carbogen breathing to be effective (29, 30). Breathing low oxygen concentrations reduced the effect of radiotherapy in the H460 model, indicating that, although not detected on pimonidazole immunohistochemical staining, low oxygen concentrations counteracted the irradiation. The effect of TH-302 is abolished by carbo-gen breathing in the rhabdomyosarcoma model independent of radiotherapy. This can be explained by the reduced HF leaving almost no cells present to convert TH-302 into its cytotoxic metabolite. For the H460 model the HF did not decrease upon carbogen breath-ing what reflects in the unchanged tumor growth compared to control tumors. Upon radiotherapy however, there is a trend towards a faster tumor growth that also indicating abolishment of the TH-302 efficacy. In tumors with an enlarged HF, TH-302 caused a slight, non-significant, delay in tumor growth compared to TH-302 under normal air conditions. Moreover, TH-302 decreased the HF to almost zero under ambient air conditions, while with 7% oxygen breathing the HF is still 28%. Although this result could be caused by the counteracting effects of TH-302 reducing the HF and the 7% oxygen breathing increasing the HF, we speculate that it is caused by a limited availability of TH-302 to target all hypoxic cells. In H460 tumors, 7% oxygen breathing resulted in an increased therapeutic effect with an enhancement ratio of 2.2 for TH-302 alone and 2.5 for the combination therapy of TH-302 and radiotherapy. This result demonstrates that when sufficient TH-302 is present, more TH-302 is reduced upon low oxygen concentrations, causing an increased cytotoxicity. A causal relation between the pretreatment HF measured by [18F]HX4 and the TH-302 treatment outcome was observed. These results indicate that pretreatment evaluation of hypoxia could be a useful tool in selecting tumors that benefit from the additional hypoxia targeting treatment. This hypoxia-based patient selection could also be used in other therapy strategies for instance to target hypoxic subvolumes by escalate radiation dose (31). Furthermore this information could be implemented in decision-support systems to predict tumor response and optimize patient therapy (32). These applications demon-strate the importance of gaining pretreatment information by hypoxia imaging.
Monitoring of hypoxia after radiation and TH-302 179
CONCLUSION
This study demonstrates that TH-302 treatment together with conventional radiotherapy is a promising combination with an increased therapeutic potential, and warrants further testing. Furthermore, detecting the tumor hypoxic fraction by [18F]HX4 PET imaging may allow the ability to predict which patients will benefit most from the hypoxia targeted TH-302 treatment and gives the possibility to noninvasively monitor TH-302 efficacy in the context of window-of-opportunity trials. Based on this preclinical study we suggest a clinical trial for treating patients with the combination of TH-302 and radiotherapy while monitoring the hypoxic fraction before and during the treatment.
ACKNOWLEDGEMENTS
Authors acknowledge financial support from the QuIC-ConCePT project, which is partly funded by EFPI A companies and the Innovative Medicine Initiative Joint Undertaking (IMI JU) under Grant Agreement No. 115151. Authors also acknowledge financial support from the EU 6th and 7th framework program (METOXIA, EURECA, ARTFORCE), Kanker-onderzoekfonds Limburg from the Health Foundation Limburg and the Dutch Cancer Society (KWF UM 2011-5020, KWF MAC 2013-6425, KWF MAC 2013-6089). The micro-graphs in this paper were taken with a confocal spinning disk microscope financed by The Netherlands Organization for Scientific Research (NWO), grant number 911-06-003.
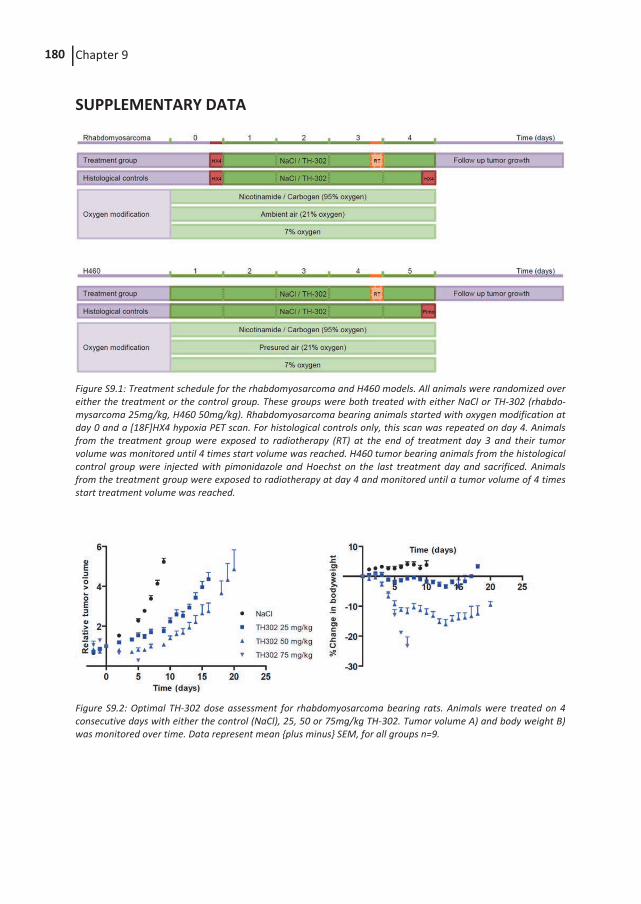
Chapter 9 180
SUPPLEMENTARY DATA
Figure S9.1: Treatment schedule for the rhabdomyosarcoma and H460 models. All animals were randomized over either the treatment or the control group. These groups were both treated with either NaCl or TH-302 (rhabdo-mysarcoma 25mg/kg, H460 50mg/kg). Rhabdomyosarcoma bearing animals started with oxygen modification at day 0 and a [18F]HX4 hypoxia PET scan. For histological controls only, this scan was repeated on day 4. Animals from the treatment group were exposed to radiotherapy (RT) at the end of treatment day 3 and their tumor volume was monitored until 4 times start volume was reached. H460 tumor bearing animals from the histological control group were injected with pimonidazole and Hoechst on the last treatment day and sacrificed. Animals from the treatment group were exposed to radiotherapy at day 4 and monitored until a tumor volume of 4 times start treatment volume was reached.
Figure S9.2: Optimal TH-302 dose assessment for rhabdomyosarcoma bearing rats. Animals were treated on 4 consecutive days with either the control (NaCl), 25, 50 or 75mg/kg TH-302. Tumor volume A) and body weight B) was monitored over time. Data represent mean {plus minus} SEM, for all groups n=9.

Monitoring of hypoxia after radiation and TH-302 181
Figure S9.3: A) Tumor growth of rhabdomyosarcoma bearing animals (n=8) treated with TH-302 (25mg/kg) in combination with 4, 8 or 12Gy of RT. Data represent mean {plus minus} SEM. B) T4xSV for rhabdomyosarcoma bearing animals treated with TH-302 in combination with RT 0, 4, 8 or 12Gy. C) T4xSV for rhabdomyosarcoma bearing animals exposed to different oxygen concentrations in combination with TH-302 and RT. D) T4xSV for H460 bearing animals exposed to different oxygen concentrations in combination with TH-302 and RT.
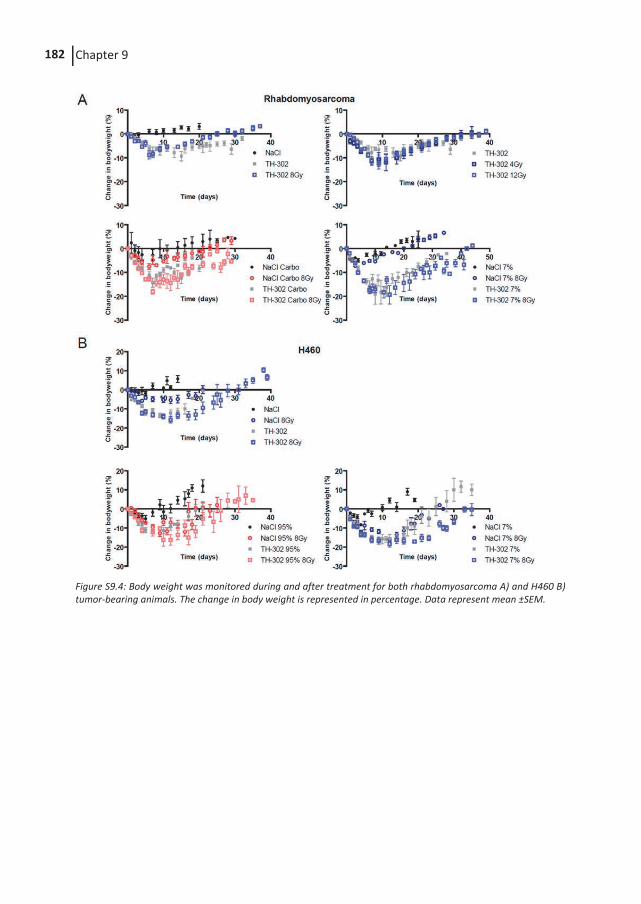
Chapter 9 182
Figure S9.4: Body weight was monitored during and after treatment for both rhabdomyosarcoma A) and H460 B) tumor-bearing animals. The change in body weight is represented in percentage. Data represent mean ±SEM.
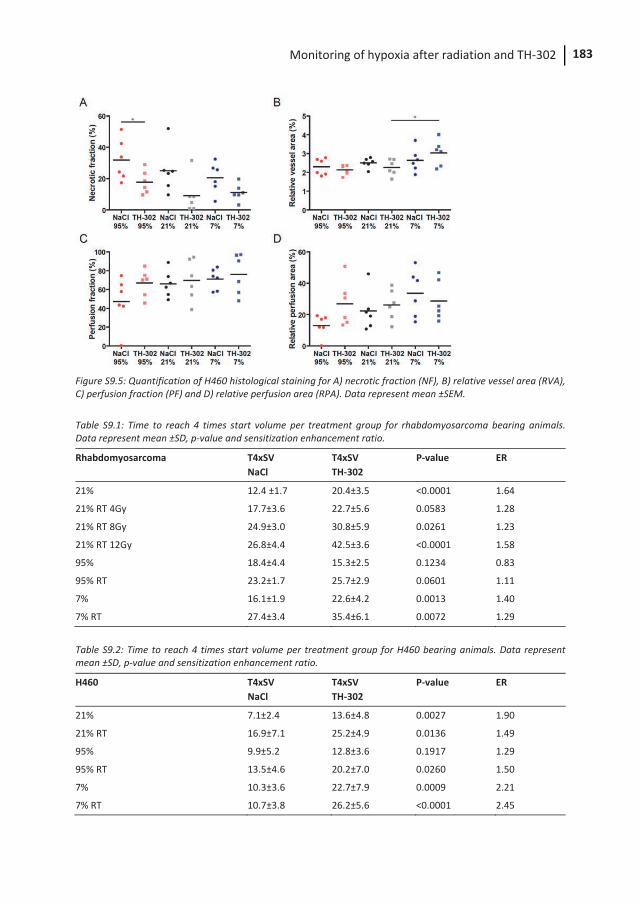
Monitoring of hypoxia after radiation and TH-302 183
Figure S9.5: Quantification of H460 histological staining for A) necrotic fraction (NF), B) relative vessel area (RVA), C) perfusion fraction (PF) and D) relative perfusion area (RPA). Data represent mean ±SEM.
Table S9.1: Time to reach 4 times start volume per treatment group for rhabdomyosarcoma bearing animals. Data represent mean ±SD, p-value and sensitization enhancement ratio.
Rhabdomyosarcoma T4xSV NaCl
T4xSV TH-302
P-value ER
21% 12.4 ±1.7 20.4±3.5 <0.0001 1.64
21% RT 4Gy 17.7±3.6 22.7±5.6 0.0583 1.28
21% RT 8Gy 24.9±3.0 30.8±5.9 0.0261 1.23
21% RT 12Gy 26.8±4.4 42.5±3.6 <0.0001 1.58
95% 18.4±4.4 15.3±2.5 0.1234 0.83
95% RT 23.2±1.7 25.7±2.9 0.0601 1.11
7% 16.1±1.9 22.6±4.2 0.0013 1.40
7% RT 27.4±3.4 35.4±6.1 0.0072 1.29
Table S9.2: Time to reach 4 times start volume per treatment group for H460 bearing animals. Data represent mean ±SD, p-value and sensitization enhancement ratio.
H460 T4xSV NaCl
T4xSV TH-302
P-value ER
21% 7.1±2.4 13.6±4.8 0.0027 1.90
21% RT 16.9±7.1 25.2±4.9 0.0136 1.49
95% 9.9±5.2 12.8±3.6 0.1917 1.29
95% RT 13.5±4.6 20.2±7.0 0.0260 1.50
7% 10.3±3.6 22.7±7.9 0.0009 2.21
7% RT 10.7±3.8 26.2±5.6 <0.0001 2.45
Chapter 9 184
REFERENCES
1. Horsman MR, Mortensen LS, Petersen JB, Busk M, Overgaard J. Imaging hypoxia to improve radiotherapy outcome. Nature reviews Clinical oncology. 2012;9:674-87.
2. Vaupel P, Mayer A. Hypoxia in cancer: significance and impact on clinical outcome. Cancer Metastasis Rev. 2007;26:225-39.
3. Sun JD, Liu Q, Wang J, Ahluwalia D, Ferraro D, Wang Y, et al. Selective tumor hypoxia targeting by hypoxia-activated prodrug TH-302 inhibits tumor growth in preclinical models of cancer. Clin Cancer Res. 2012;18:758-70.
4. Liu Q, Sun JD, Wang J, Ahluwalia D, Baker AF, Cranmer LD, et al. TH-302, a hypoxia-activated prodrug with broad in vivo preclinical combination therapy efficacy: optimization of dosing regimens and schedules. Cancer Chemother Pharmacol. 2012;69:1487-98.
5. Weiss GJ, Infante JR, Chiorean EG, Borad MJ, Bendell JC, Molina JR, et al. Phase 1 study of the safety, tolerability, and pharmacokinetics of TH-302, a hypoxia-activated prodrug, in patients with advanced solid malignancies. Clin Cancer Res. 2011;17:2997-3004.
6. Ganjoo KN, Cranmer LD, Butrynski JE, Rushing D, Adkins D, Okuno SH, et al. A phase I study of the safety and pharmacokinetics of the hypoxia-activated prodrug TH-302 in combination with doxorubicin in patients with advanced soft tissue sarcoma. Oncology. 2011;80:50-6.
7. Chawla SP, Cranmer LD, Van Tine BA, Reed DR, Okuno SH, Butrynski JE, et al. Phase II Study of the Safety and Antitumor Activity of the Hypoxia-Activated Prodrug TH-302 in Combination With Doxorubicin in Patients With Advanced Soft Tissue Sarcoma. J Clin Oncol. 2014.
8. Borad MJ, Reddy SG, Bahary N, Uronis HE, Sigal D, Cohn AL, et al. Randomized Phase II Trial of Gemcitabine Plus TH-302 Versus Gemcitabine in Patients With Advanced Pancreatic Cancer. J Clin Oncol. 2014.
9. Dubois LJ, Lieuwes NG, Janssen MH, Peeters WJ, Windhorst AD, Walsh JC, et al. Preclinical evaluation and validation of [18F]HX4, a promising hypoxia marker for PET imaging. Proc Natl Acad Sci U S A. 2011;108:14620-5.
10. Zegers CM, van Elmpt W, Wierts R, Reymen B, Sharifi H, Ollers MC, et al. Hypoxia imaging with [(1)(8)F]HX4 PET in NSCLC patients: defining optimal imaging parameters. Radiother Oncol. 2013;109:58-64.
11. Zegers CM, van Elmpt W, Reymen B, Even AJ, Troost EG, Ollers MC, et al. In Vivo Quantification of Hypoxic and Metabolic Status of NSCLC Tumors Using [18F]HX4 and [18F]FDG-PET/CT Imaging. Clin Cancer Res. 2014.
12. Rischin D, Hicks RJ, Fisher R, Binns D, Corry J, Porceddu S, et al. Prognostic significance of [18F]-misonidazole positron emission tomography-detected tumor hypoxia in patients with advanced head and neck cancer randomly assigned to chemoradiation with or without tirapazamine: a substudy of Trans-Tasman Radiation Oncology Group Study 98.02. J Clin Oncol. 2006;24:2098-104.
13. Peeters SG, Zegers CM, Lieuwes NG, van Elmpt W, Eriksson J, van Dongen GA, et al. A Comparative Study of the Hypoxia PET Tracers [F]HX4, [F]FAZA, and [F]FMISO in a Preclinical Tumor Model. Int J Radiat Oncol Biol Phys. 2014.
Monitoring of hypoxia after radiation and TH-302 185
14. van Loon J, Janssen MH, Ollers M, Aerts HJ, Dubois L, Hochstenbag M, et al. PET imaging of hypoxia using [18F]HX4: a phase I trial. Eur J Nucl Med Mol Imaging. 2010;37:1663-8.
15. Dubois L, Landuyt W, Haustermans K, Dupont P, Bormans G, Vermaelen P, et al. Evaluation of hypoxia in an experimental rat tumour model by [(18)F]fluoro-misonidazole PET and immunohistochemistry. Br J Cancer. 2004;91:1947-54.
16. Edelstein A, Amodaj N, Hoover K, Vale R, Stuurman N. Computer control of microscopes using microManager. Curr Protoc Mol Biol. 2010;Chapter 14:Unit14 20.
17. Jung D, Lin L, Jiao H, Cai X, Duan JX, Matteucci M. Pharmacokinetics of TH-302: a hypoxically activated prodrug of bromo-isophosphoramide mustard in mice, rats, dogs and monkeys. Cancer Chemother Pharmacol. 2012;69:643-54.
18. Wilson WR, Hay MP. Targeting hypoxia in cancer therapy. Nat Rev Cancer. 2011;11:393-410.
19. Fass L. Imaging and cancer: a review. Mol Oncol. 2008;2:115-52. 20. Orloff J, Douglas F, Pinheiro J, Levinson S, Branson M, Chaturvedi P, et al. The future
of drug development: advancing clinical trial design. Nat Rev Drug Discov. 2009;8:949-57.
21. Hill RP, Bush RS, Yeung P. The effect of anaemia on the fraction of hypoxic cells in an experimental tumour. Br J Radiol. 1971;44:299-304.
22. Stanley JA, Shipley WU, Steel GG. Influence of tumour size on hypoxic fraction and therapeutic sensitivity of Lewis lung tumour. Br J Cancer. 1977;36:105-13.
23. Wouters BG, Brown JM. Cells at intermediate oxygen levels can be more important than the "hypoxic fraction" in determining tumor response to fractionated radiotherapy. Radiat Res. 1997;147:541-50.
24. Horsman MR, Overgaard J. Preclinical studies on how to deal with patient intolerance to nicotinamide and carbogen. Radiotherapy and oncology : journal of the European Society for Therapeutic Radiology and Oncology. 2004;70:301-9.
25. Troost EG, Laverman P, Kaanders JH, Philippens M, Lok J, Oyen WJ, et al. Imaging hypoxia after oxygenation-modification: comparing [18F]FMISO autoradiography with pimonidazole immunohistochemistry in human xenograft tumors. Radiother Oncol. 2006;80:157-64.
26. Hou H, Dong R, Lariviere JP, Mupparaju SP, Swartz HM, Khan N. Synergistic combination of hyperoxygenation and radiotherapy by repeated assessments of tumor pO2 with EPR oximetry. J Radiat Res. 2011;52:568-74.
27. Khan N, Li H, Hou H, Lariviere JP, Gladstone DJ, Demidenko E, et al. Tissue pO2 of orthotopic 9L and C6 gliomas and tumor-specific response to radiotherapy and hyperoxygenation. Int J Radiat Oncol Biol Phys. 2009;73:878-85.
28. Martin L, Lartigau E, Weeger P, Lambin P, Le Ridant AM, Lusinchi A, et al. Changes in the oxygenation of head and neck tumors during carbogen breathing. Radiother Oncol. 1993;27:123-30.
29. Janssens GO, Rademakers SE, Terhaard CH, Doornaert PA, Bijl HP, van den Ende P, et al. Accelerated radiotherapy with carbogen and nicotinamide for laryngeal cancer: results of a phase III randomized trial. J Clin Oncol. 2012;30:1777-83.
30. Schuuring J, Bussink J, Bernsen HJ, Peeters W, van der Kogel AJ. Effect of carbogen breathing on the radiation response of a human glioblastoma xenograft: analysis of

Chapter 9 186
hypoxia and vascular parameters of regrowing tumors. Strahlenther Onkol. 2006;182:408-14.
31. Bentzen SM, Gregoire V. Molecular imaging-based dose painting: a novel paradigm for radiation therapy prescription. Semin Radiat Oncol. 2011;21:101-10.
32. Lambin P, van Stiphout RG, Starmans MH, Rios-Velazquez E, Nalbantov G, Aerts HJ, et al. Predicting outcomes in radiation oncology--multifactorial decision support systems. Nat Rev Clin Oncol. 2013;10:27-40.

DISCUSSION


CHAPTER
General discussion and summary
Chapter 10 190
GENERAL DISCUSSION AND SUMMARY
Tumor cell hypoxia is known to be a major factor that negatively influences treatment effectiveness, it promotes resistance to surgery, radiotherapy and chemotherapy and increases tumor aggressiveness, angiogenesis, and metastatic potential, resulting in a poor prognosis (1, 2). Tumor hypoxia is present in the majority of solid lesions. Detection and quantification of tumor hypoxia could help selecting patients who may benefit from hypoxia targeting treatment (3, 4). Non-invasive positron emission tomography (PET) imaging techniques provide the opportunity to perform repeated tumor hypoxia meas-urements, additionally it allows visualization of the spatial distribution of hypoxia (5, 6). Several 2-nitroimidazoles, labeled with fluor-18 [18F], have already been applied to identify hypoxia (5, 7). The selective binding and retention of 2-nitroimidazoles allows detection and quantification of tumor hypoxia prior to and during treatment (8-10). An extensive literature overview of hypoxia PET imaging, using 2-nitroimadazoles is given in chapter 2. The preclinical and clinical use of hypoxia PET imaging is described, with a focus on its validation, quantification and (clinical) applications. From this study we observed that several 2-nitroimidazole-based PET tracers have the ability to reliably measure tumor hypoxia, that these tracers have a prognostic value for treatment outcome in several cancers and that it is feasible to use hypoxia PET imaging to select patients for additional anti-hypoxia treatment.
Comparison of hypoxia PET tracers
The diversity in the available hypoxia PET tracers raises the question which tracer is the most optimal. In the available literature a large variety of different tracers, tumor models or patient populations were used, in addition, the scan time points and image analysis varied (5, 11). Therefore, there is a need for comparative studies, investigating different hypoxia PET tracers within one tumor model using the same acquisition protocol and analysis parameters. We performed an extensive comparison of the frequently used hypoxia PET tracers [18F]HX4, [18F]FAZA and [18F]FMISO within one preclinical (rat rhabdo-myosarcoma) tumor model. This tumor model was previously characterized and used for hypoxia PET imaging with [18F]FMISO, [18F]EF3 and [18F]HX4 and clinical relevant fractions of hypoxia were reported (12-14). The direct comparison of the tracers, described in chapter 3, provides more insight into the strengths and weaknesses of the hypoxia PET tracers. We observed that [18F]HX4 provides a significantly higher tumor-to-background ratio in comparison to [18F]FAZA or [18F]FMISO at the same image time point. These results are in agreement with the clinical observation of Chen et al. which showed that [18F]HX4 at 1.5h p.i. reached the same contrast than [18F]FMISO at 2h p.i. (15). Carlin et al. (16), on the other hand, reported no statistical difference in the tumor-to-muscle ratios of the hypoxia PET tracers [18F]HX4, [18F]FAZA and [18F]FMISO in mice bearing SQ20b xenograft tumors. This difference might be explained by the low number of tumors (3-5 per tracer) investigated by Carlin et al. and the short injection-acquisition time interval. In chapter 3 we also observed a high repeatability of the [18F]HX4 and [18F]FMISO uptake in a test-retest (48h interval) setting, while for [18F]FAZA lower spatial reproducibility was ob-served. However, in mice bearing a human SiHa cervix tumor xenograft [18F]FAZA PET
General discussion and summary 191
imaging showed a high spatial reproducibility (17). From the current literature and our analysis in chapter 3 we can conclude that each tracer has its own strengths. Nevertheless, in clinical practice a high image contract within a short time interval is preferred, since the patient has to wait between injection of the radioactive tracer and the scan time p.i. Also, a good (spatial) reproducibility is necessary to allow additional anti-hypoxia treatment based on hypoxia PET imaging.
Repeatability [18F]HX4 PET
The ultimate aim of anti-cancer therapy is to improve the outcome of patients. We believe that targeting of tumor hypoxia with the aid of hypoxic cell sensitizers or a higher radio-therapy dose to the hypoxic regions could contribute to reach this goal. To select patients for additional anti-hypoxia therapy and to monitor the response to treatment, it is im-portant to gain insight in the clinical day to day variability of the hypoxia PET uptake and the spatial location of the high uptake volumes. To answer this research question we performed image analysis on repeated [18F]HX4 PET data, acquired within a time interval of 1 to 6 days, from a multi-centered study (NCT01075399) in patients with head and neck and lung cancer (Chapter 4). The results of this study showed a high repeatability of the [18F]HX4 PET uptake parameters (SUVmax, SUVmean, TBR, hypoxic volume), with for example a repeatability percentage of 17% and 15% for SUVmax and SUVmean, respectively. These percentages are much lower than the repeatability expected based on [18F]FDG PET images, which would be approximately 35% in the SUV range (18). A previous study with [18F]FMISO in eleven patients with head and neck cancer reported similar results, showing a high reproducibility of the [18F]FMISO PET parameters SUVmax, TBR and hypoxic volume (19). The observed repeatability of the [18F]HX4 PET parameters provides evidence for a reliable detection and quantification of tumor hypoxia. [18F]HX4 PET parameters on a global tumor level might therefore be able to monitor the response to treatment or guide the identification of patients who might benefit from additional anti-hypoxia treatment (4). However, for radiotherapy dose escalation also the repeatability of the PET uptake on a sub-volume or voxel level is important, since this will provide information on the spatial distribution of tumor hypoxia and the possibility to target these radio-resistant sub-volumes with a higher radiation dose (5, 20). In the patient population studied in chapter 4, we observed also a high spatial repeatability in the majority of patients. These results confirmed the observation in the preclinical study (chapter 3). However, previous repeat-ability studies using the alternative hypoxia tracers [18F]FMISO or [18F]FAZA reported contradictory results regarding the spatial uptake pattern of the hypoxia PET tracers (10, 17, 19, 21). Nevertheless, our current results show that [18F]HX4 PET can reliably identify the hypoxic volumes before the start of treatment, which might benefit from treatment with an increased radiation dose.
Optimal imaging
The beneficial properties of [18F]HX4, observed in the preclinical tumor model (chapter 3), the promising results of the phase I clinical trial (22) and the observed clinical repeatability (chapter 4) provide a good basis for phase II clinical trials. [18F]HX4 PET imaging was incorporated as a translational research part in two clinical studies at Maastro Clinic
Chapter 10 192
(NCT01024829 & NCT01210378) and additionally a new imaging study with [18F]HX4 in patients with HNSCC was initiated (NCT01347281). As mentioned previously, the available hypoxia PET data in the literature is diverse and acquisition protocols frequently vary, which makes it hard to compare and combine the published hypoxia PET studies (5, 11). Our aim was to standardize acquisition and image analysis in an early stage. Therefore we defined in the first 15 non-small cell lung cancer (NSCLC) patients the optimal image parameters for [18F]HX4 PET/CT imaging (chapter 5). We observed heterogeneous but stable uptake patterns between PET images acquired at 2h or 4h p.i., indicating a high short-time reproducibility of the PET uptake. However, at 4h p.i. imaging contrast (tumor-background ratio) was superior to 2h p.i. These results were confirmed in the first 10 patients with a HNSCC, where the image contrast increased significantly up to 4h p.i. (chapter 8). In addition, preliminary results of another research group, investigating the use of [18F]HX4 PET in patients with pancreatic and esophageal cancer report similar observations (AMC Amsterdam, NCT01995084, (23)). Unfortunately, it was clinically not feasible to perform imaging beyond 4h p.i. and no information was acquired regarding the clinical [18F]HX4 PET image contrast at later time points. In preclinical setting the contrast in the images remained stable from 4h to 6h p.i. (12). However, comparing the preclinical and clinical results in this thesis, we observed that the estimated half life of [18F]HX4 (clearance from blood) was 2.2 hours for the rat rhabdomyosarcoma study (chapter 3), while this was 4.3 hours for the first NSCLC patients described in chapter 5. Therefore, a later acquisition time point might be beneficial in patients. Nevertheless, the continuing decay of the radionuclide would cause a decrease of the signal to noise ratio, requiring the injection of a higher tracer dose or a longer acquisition time. These technical aspects in combination with the practical disadvantages supports the decision not to increase the time interval between the [18F]HX4 injection and PET scan in clinical setting.
[18F]HX4 versus [18F]FDG PET
Hypoxia PET imaging is still in the research stage, and is not used in routine clinical prac-tice. [18F]FDG PET, on the other hand, is a frequently used tracer to visualize tumor me-tabolism and may indirectly reflect the tumor microenvironment, including areas of hypoxia (1, 24, 25). We defined the hypoxic and metabolic status of NSCLC (chapter 6) and HNSCC (chapter 7), with the aid of [18F]HX4 and [18F]FDG PET imaging. In both studies we observed a correlation between the volume of the lesion and the overall [18F]HX4 and [18F]FDG PET uptake. This was in agreement with previous studies investigating the corre-lation between [18F]FMISO PET and [18F]FDG PET parameters in patients with head and neck cancer (26-28). However, for patients with NSCLC contradictory results were report-ed in literature (29-31). General correlations on a tumor level, however, provide no infor-mation about the spatial orientation of a high metabolism or hypoxia. Therefore addition-al analysis on a sub-volume level were performed evaluating the agreement between volumes with a high metabolism (uptake>50% SUVmax) and tumor hypoxia (TBR>1.4). Note that the thresholds to define a high metabolism and hypoxia were defined arbitrarily, based on ongoing [18F]FDG boost trials (32, 33), and previous publications on hypoxia PET imaging (12, 13, 34, 35). A change in the definition will result in different high uptake volumes and results. In radiotherapy dose escalation, pre-defined thresholds are only
General discussion and summary 193
relevant if a ‘dose painting by contour’ approach is selected, treating the high uptake volumes with a higher dose level. For ‘dose painting by numbers’, on the other hand, thresholds do not play a role, since the dose is based on the local voxel intensity values within the tumor (36). Nevertheless, based on our predefined threshold to define high metabolism and hypoxia a (partial) mismatch was observed in approximately 50% and 70% of the primary NSCLC and HNSCC lesions, respectively (chapter 6 and 7). The fraction of the hypoxic volume, located outside the high [18F]FDG volume, was on average similar for NSCLC (24%) and HNSCC (25%). However, only in the NSCLC patients a distinct uptake pattern between the high [18F]HX4 and [18F]FDG uptake volumes was observed in 2 cases. This can be explained by the patient populations used in the studies. The NSCLC population consists of tumors with a heterogeneous pathology, including mainly patients with an adenocarcinoma of the lung, while the head and neck cancer patients all suffered from a squamous cell carcino-ma. In the literature it is described that adeno and squamous cell carcinomas show differ-ences in their metabolism. Where adenocarcinomas rely mainly on aerobic glycolysis, squamous cell carcinomas have a more physiologically metabolism, using mitochondrial oxidation with anaerobic glycolysis under hypoxia (37). Although we observed in both patient populations a partial agreement between the extend and location of hypoxia and metabolism, they represent different properties of the tumor and provide complementary information which can be used as a prognostic marker for outcome (2, 9, 38-40), to select patients for additional therapy (4, 41, 42) or to target the resistant (high metabolic or hypoxic) volumes within the tumor (32, 33, 43, 44).
Monitoring response
The ability to monitor the response to treatment could provide valuable information to adapt the treatment in an early stage. The results of previous studies showed that hypoxia PET imaging with [18F]FMISO and metabolic [18F]FDG PET imaging were able to observe changes in the uptake during (chemo)radiotherapy, and that these changes had a higher predictive value for the treatment outcome than pre-treatment measurements (9, 39, 45, 46). We performed a study to investigate the treatment-associated changes in tumor hypoxia using [18F]HX4 PET imaging and hypoxia-related blood biomarkers (chapter 8). In agreement with previous literature, a significant decrease of the hypoxia [18F]HX4 PET uptake was observed during treatment with radiotherapy alone or in combination with cisplatin or cetuximab. The evaluated blood biomarkers, on the other hand, were not specific enough to measure a significant decrease in tumor hypoxia during treatment. This might be caused by the included patient cohort, since the observed plasma levels of plasma osteopontin and CAIX were relative low in comparison to previous studies, report-ing the osteopontin and CAIX levels in large numbers of head and neck cancer and rectal cancer patients (42, 47). In addition, plasma osteopontin is also known to play a role in the immune regulation and stress response which might also be induced by radiation (48). In our patient cohort, and based on our definition of tumor hypoxia (TBR>1.4), only 2 lesions had a remaining hypoxic volume (>1cm3) during treatment. For these lesions, the localiza-tion of the hypoxic volume was (almost) completely within the hypoxic volume defined at baseline, which suggests that the localisation of persistent hypoxia is stable during treat-ment. This would allow the boosting of hypoxic subvolumes defined at the start of treat-
Chapter 10 194
ment. However, previous studies using alternative hypoxia PET tracers showed contradic-tory results, reporting a stable localisation (10) or a spatial move during treatment (21, 49, 50). All studies show results of a relative low number of patients, and should be interpret-ed with care. Nevertheless, potential changes in the spatial distribution of hypoxia should be taken into consideration when applying hypoxia-guided dose escalation (49-51).
Targeting of tumor hypoxia
Tumor hypoxia can be targeted with the aid of hypoxia-activated prodrugs, which are activated in an environment with a low oxygen concentration. TH302 is a one of these drugs, which is activated on the reduction of its 2-nitroimidazole component, eventually releasing the active drug bromo-isophosphoramide mustard that acts as a DNA cross-linker which leads to cell death. Several clinical Phase I and II studies have been per-formed, investigating the safety and the potential of TH302 in combination with chemo-therapy, with promising results (52-55). Since TH302 specifically targets the hypoxic cells, which are more resistant for radiation, the combination of radiotherapy with TH302 might have also the potential to improve tumor control. In chapter 9 we studied in a preclinical setting, for the first time, the effect of radiotherapy in combination with the anti-hypoxia drug TH302. [18F]HX4 PET was used to evaluate the response to treatment. In addition the relationship between hypoxia PET imaging and the therapeutic outcome was assessed. We observed that the efficiency of the treatment was dependent on the oxygenation status, where a decreased oxygenation status increased the therapeutic effect of TH302. The pre-treatment hypoxic fraction was associated with tumor growth delay (time to reach 4x startvolume) and [18F]HX4 PET imaging was able to detect a decrease in the hypoxic fraction after treatment with TH302. These results confirm that hypoxia PET imaging could be used to select patients with a hypoxic tumor, which will benefit the most from the additional treatment with TH302. In addition, serial imaging of tumor hypoxia could be useful to assess the effect of TH302. These promising results will be translated to a clinical trial in patients with esophageal cancer, with the aim to assess the maximum tolerated dose and anti-tumor activity of TH302 in combination with chemoradiation. In addition the prognostic value of [18F]HX4 PET imaging at baseline and after administration of TH302 will be explored.
General discussion and summary 195
REFERENCES
1. Harris AL. Hypoxia—a key regulatory factor in tumour growth. Nat Rev Cancer. 2002;2:38-47.
2. Lambin P, van Stiphout RG, Starmans MH, Rios-Velazquez E, Nalbantov G, Aerts HJ, et al. Predicting outcomes in radiation oncology--multifactorial decision support systems. Nat Rev Clin Oncol. 2013;10:27-40.
3. Overgaard J. Hypoxic modification of radiotherapy in squamous cell carcinoma of the head and neck - A systematic review and meta-analysis. Radiother Oncol. 2011;100:22-32.
4. Wilson WR, Hay MP. Targeting hypoxia in cancer therapy. Nat Rev Cancer. 2011;11:393-410.
5. Horsman MR, Mortensen LS, Petersen JB, Busk M, Overgaard J. Imaging hypoxia to improve radiotherapy outcome. Nat Rev Clin Oncol. 2012;9:674-87.
6. Bussink J, van Herpen CM, Kaanders JH, Oyen WJ. PET-CT for response assessment and treatment adaptation in head and neck cancer. Lancet Oncol. 2010;11:661-9.
7. Lopci E, Grassi I, Chiti A, Nanni C, Cicoria G, Toschi L, et al. PET radiopharmaceuticals for imaging of tumor hypoxia: a review of the evidence. Am J Nucl Med Mol Imaging. 2014;4:365-84.
8. Bollineni VR, Wiegman EM, Pruim J, Groen HJ, Langendijk JA. Hypoxia imaging using Positron Emission Tomography in non-small cell lung cancer: implications for radiotherapy. Cancer Treat Rev. 2012;38:1027-32.
9. Zips D, Zophel K, Abolmaali N, Perrin R, Abramyuk A, Haase R, et al. Exploratory prospective trial of hypoxia-specific PET imaging during radiochemotherapy in patients with locally advanced head-and-neck cancer. Radiother Oncol. 2012;105:21-8.
10. Bittner MI, Wiedenmann N, Bucher S, Hentschel M, Mix M, Weber WA, et al. Exploratory geographical analysis of hypoxic subvolumes using 18F-MISO-PET imaging in patients with head and neck cancer in the course of primary chemoradiotherapy. Radiother Oncol. 2013;108:511-6.
11. Thorwarth D, Monnich D, Zips D. Methodological aspects on hypoxia PET acquisition and image processing. Q J Nucl Med Mol Imaging. 2013;57:235-43.
12. Dubois LJ, Lieuwes NG, Janssen MH, Peeters WJ, Windhorst AD, Walsh JC, et al. Preclinical evaluation and validation of [18F]HX4, a promising hypoxia marker for PET imaging. Proc Natl Acad Sci U S A. 2011;108:14620-5.
13. Dubois L, Landuyt W, Haustermans K, Dupont P, Bormans G, Vermaelen P, et al. Evaluation of hypoxia in an experimental rat tumour model by [(18)F] fluoromisonidazole PET and immunohistochemistry. Br J Cancer. 2004;91:1947-54.
14. Dubois L, Landuyt W, Cloetens L, Bol A, Bormans G, Haustermans K, et al. [18F]EF3 is not superior to [18F]FMISO for PET-based hypoxia evaluation as measured in a rat rhabdomyosarcoma tumour model. Eur J Nucl Med Mol Imaging. 2009;36:209-18.
15. Chen L, Zhang Z, Kolb HC, Walsh JC, Zhang J, Guan Y. (1)(8)F-HX4 hypoxia imaging with PET/CT in head and neck cancer: a comparison with (1)(8)F-FMISO. Nucl Med Commun. 2012;33:1096-102.
Chapter 10 196
16. Carlin S, Zhang H, Reese M, Ramos NN, Chen Q, Ricketts SA. A comparison of the imaging characteristics and microregional distribution of 4 hypoxia PET tracers. J Nucl Med. 2014;55:515-21.
17. Busk M, Mortensen LS, Nordsmark M, Overgaard J, Jakobsen S, Hansen KV, et al. PET hypoxia imaging with FAZA: reproducibility at baseline and during fractionated radiotherapy in tumour-bearing mice. Eur J Nucl Med Mol Imaging. 2013;40:186-97.
18. de Langen AJ, Vincent A, Velasquez LM, van Tinteren H, Boellaard R, Shankar LK, et al. Repeatability of 18F-FDG uptake measurements in tumors: a metaanalysis. J Nucl Med. 2012;53:701-8.
19. Okamoto S, Shiga T, Yasuda K, Ito YM, Magota K, Kasai K, et al. High reproducibility of tumor hypoxia evaluated by 18F-fluoromisonidazole PET for head and neck cancer. J Nucl Med. 2013;54:201-7.
20. Grootjans W, de Geus-Oei LF, Troost EG, Visser EP, Oyen WJ, Bussink J. PET in the management of locally advanced and metastatic NSCLC. Nat Rev Clin Oncol. 2015.
21. Nehmeh SA, Lee NY, Schroder H, Squire O, Zanzonico PB, Erdi YE, et al. Reproducibility of intratumor distribution of (18)F-fluoromisonidazole in head and neck cancer. Int J Radiat Oncol Biol Phys. 2008;70:235-42.
22. van Loon J, Janssen MH, Ollers M, Aerts HJ, Dubois L, Hochstenbag M, et al. PET imaging of hypoxia using [18F]HX4: a phase I trial. Eur J Nucl Med Mol Imaging. 2010;37:1663-8.
23. Klaassen R, van Laarhoven H, Tienhoven G, Bijlsma M, Geijsen E, Besselink M, et al. Timing and reproducibility of [18F]HX4 PET-CT for the detection of hypoxia in esophageal and pancreatic cancer Journal of nuclear medicine; May 2014 vol 55, abstract 1433 2014.
24. Gatenby RA, Gillies RJ. Why do cancers have high aerobic glycolysis? Nat Rev Cancer. 2004;4:891-9.
25. Dierckx RA, Van de Wiele C. FDG uptake, a surrogate of tumour hypoxia? Eur J Nucl Med Mol Imaging. 2008;35:1544-9.
26. Rajendran JG, Mankoff DA, O'Sullivan F, Peterson LM, Schwartz DL, Conrad EU, et al. Hypoxia and glucose metabolism in malignant tumors: evaluation by [18F]fluoromisonidazole and [18F]fluorodeoxyglucose positron emission tomography imaging. Clin Cancer Res. 2004;10:2245-52.
27. Zimny M, Gagel B, DiMartino E, Hamacher K, Coenen HH, Westhofen M, et al. FDG--a marker of tumour hypoxia? A comparison with [18F]fluoromisonidazole and pO2-polarography in metastatic head and neck cancer. Eur J Nucl Med Mol Imaging. 2006;33:1426-31.
28. Sato J, Kitagawa Y, Yamazaki Y, Hata H, Okamoto S, Shiga T, et al. 18F-fluoromisonidazole PET uptake is correlated with hypoxia-inducible factor-1alpha expression in oral squamous cell carcinoma. J Nucl Med. 2013;54:1060-5.
29. Bollineni VR, Kerner GS, Pruim J, Steenbakkers RJ, Wiegman EM, Koole MJ, et al. PET Imaging of Tumor Hypoxia Using 18F-Fluoroazomycin Arabinoside in Stage III-IV Non-Small Cell Lung Cancer Patients. J Nucl Med. 2013.
30. Cherk MH, Foo SS, Poon AM, Knight SR, Murone C, Papenfuss AT, et al. Lack of correlation of hypoxic cell fraction and angiogenesis with glucose metabolic rate in non-small cell lung cancer assessed by 18F-Fluoromisonidazole and 18F-FDG PET. J Nucl Med. 2006;47:1921-6.
General discussion and summary 197
31. Vera P, Bohn P, Edet-Sanson A, Salles A, Hapdey S, Gardin I, et al. Simultaneous positron emission tomography (PET) assessment of metabolism with (1)(8)F-fluoro-2-deoxy-d-glucose (FDG), proliferation with (1)(8)F-fluoro-thymidine (FLT), and hypoxia with (1)(8)fluoro-misonidazole (F-miso) before and during radiotherapy in patients with non-small-cell lung cancer (NSCLC): a pilot study. Radiother Oncol. 2011;98:109-16.
32. van Elmpt W, De Ruysscher D, van der Salm A, Lakeman A, van der Stoep J, Emans D, et al. The PET-boost randomised phase II dose-escalation trial in non-small cell lung cancer. Radiother Oncol. 2012;104:67-71.
33. Heukelom J, Hamming O, Bartelink H, Hoebers F, Giralt J, Herlestam T, et al. Adaptive and innovative Radiation Treatment FOR improving Cancer treatment outcomE (ARTFORCE); a randomized controlled phase II trial for individualized treatment of head and neck cancer. BMC Cancer. 2013;13:84.
34. Zegers CM, van Elmpt W, Wierts R, Reymen B, Sharifi H, Ollers MC, et al. Hypoxia imaging with [(18)F]HX4 PET in NSCLC patients: Defining optimal imaging parameters. Radiother Oncol. 2013;109:58-64.
35. Rasey JS, Koh WJ, Evans ML, Peterson LM, Lewellen TK, Graham MM, et al. Quantifying regional hypoxia in human tumors with positron emission tomography of [18F]fluoromisonidazole: a pretherapy study of 37 patients. Int J Radiat Oncol Biol Phys. 1996;36:417-28.
36. Thorwarth D, Geets X, Paiusco M. Physical radiotherapy treatment planning based on functional PET/CT data. Radiother Oncol. 2010;96:317-24.
37. Meijer TW, Schuurbiers OC, Kaanders JH, Looijen-Salamon MG, de Geus-Oei LF, Verhagen AF, et al. Differences in metabolism between adeno- and squamous cell non-small cell lung carcinomas: spatial distribution and prognostic value of GLUT1 and MCT4. Lung Cancer. 2012;76:316-23.
38. Thorwarth D, Eschmann SM, Holzner F, Paulsen F, Alber M. Combined uptake of [18F]FDG and [18F]FMISO correlates with radiation therapy outcome in head-and-neck cancer patients. Radiother Oncol. 2006;80:151-6.
39. van Elmpt W, Ollers M, Dingemans AM, Lambin P, De Ruysscher D. Response assessment using 18F-FDG PET early in the course of radiotherapy correlates with survival in advanced-stage non-small cell lung cancer. J Nucl Med. 2012;53:1514-20.
40. Sato J, Kitagawa Y, Yamazaki Y, Hata H, Asaka T, Miyakoshi M, et al. Advantage of FMISO-PET over FDG-PET for predicting histological response to preoperative chemotherapy in patients with oral squamous cell carcinoma. Eur J Nucl Med Mol Imaging. 2014;41:2031-41.
41. Rischin D, Hicks RJ, Fisher R, Binns D, Corry J, Porceddu S, et al. Prognostic significance of [18F]-misonidazole positron emission tomography-detected tumor hypoxia in patients with advanced head and neck cancer randomly assigned to chemoradiation with or without tirapazamine: a substudy of Trans-Tasman Radiation Oncology Group Study 98.02. J Clin Oncol. 2006;24:2098-104.
42. Overgaard J, Eriksen JG, Nordsmark M, Alsner J, Horsman MR. Plasma osteopontin, hypoxia, and response to the hypoxia sensitiser nimorazole in radiotherapy of head and neck cancer: results from the DAHANCA 5 randomised double-blind placebo-controlled trial. Lancet Oncol. 2005;6:757-64.
43. Thorwarth D, Eschmann SM, Paulsen F, Alber M. Hypoxia dose painting by numbers: a planning study. Int J Radiat Oncol Biol Phys. 2007;68:291-300.
Chapter 10 198
44. Toma-Dasu I, Uhrdin J, Antonovic L, Dasu A, Nuyts S, Dirix P, et al. Dose prescription and treatment planning based on FMISO-PET hypoxia. Acta Oncol. 2012;51:222-30.
45. Servagi-Vernat S, Differding S, Hanin FX, Labar D, Bol A, Lee JA, et al. A prospective clinical study of (1)(8)F-FAZA PET-CT hypoxia imaging in head and neck squamous cell carcinoma before and during radiation therapy. Eur J Nucl Med Mol Imaging. 2014;41:1544-52.
46. Bollineni VR, Koole MJ, Pruim J, Brouwer CL, Wiegman EM, Groen HJ, et al. Dynamics of tumor hypoxia assessed by 18F-FAZA PET/CT in head and neck and lung cancer patients during chemoradiation: possible implications for radiotherapy treatment planning strategies. Radiother Oncol. 2014;113:198-203.
47. Buijsen J, van Stiphout RG, Menheere PP, Lammering G, Lambin P. Blood biomarkers are helpful in the prediction of response to chemoradiation in rectal cancer: a prospective, hypothesis driven study on patients with locally advanced rectal cancer. Radiother Oncol. 2014;111:237-42.
48. Wang KX, Denhardt DT. Osteopontin: role in immune regulation and stress responses. Cytokine Growth Factor Rev. 2008;19:333-45.
49. Lin Z, Mechalakos J, Nehmeh S, Schoder H, Lee N, Humm J, et al. The influence of changes in tumor hypoxia on dose-painting treatment plans based on 18F-FMISO positron emission tomography. Int J Radiat Oncol Biol Phys. 2008;70:1219-28.
50. Servagi-Vernat S, Differding S, Hanin FX, Labar D, Bol A, Lee JA, et al. A prospective clinical study of F-FAZA PET-CT hypoxia imaging in head and neck squamous cell carcinoma before and during radiation therapy. European journal of nuclear medicine and molecular imaging. 2014.
51. Servagi-Vernat S, Differding S, Sterpin E, Hanin FX, Labar D, Bol A, et al. Hypoxia-guided adaptive radiation dose escalation in head and neck carcinoma: A planning study. Acta Oncol. 2015:1-9.
52. Weiss GJ, Infante JR, Chiorean EG, Borad MJ, Bendell JC, Molina JR, et al. Phase 1 study of the safety, tolerability, and pharmacokinetics of TH-302, a hypoxia-activated prodrug, in patients with advanced solid malignancies. Clin Cancer Res. 2011;17:2997-3004.
53. Borad MJ, Reddy SG, Bahary N, Uronis HE, Sigal D, Cohn AL, et al. Randomized Phase II Trial of Gemcitabine Plus TH-302 Versus Gemcitabine in Patients With Advanced Pancreatic Cancer. J Clin Oncol. 2015;33:1475-81.
54. Ganjoo KN, Cranmer LD, Butrynski JE, Rushing D, Adkins D, Okuno SH, et al. A phase I study of the safety and pharmacokinetics of the hypoxia-activated prodrug TH-302 in combination with doxorubicin in patients with advanced soft tissue sarcoma. Oncology. 2011;80:50-6.
55. Chawla SP, Cranmer LD, Van Tine BA, Reed DR, Okuno SH, Butrynski JE, et al. Phase II study of the safety and antitumor activity of the hypoxia-activated prodrug TH-302 in combination with doxorubicin in patients with advanced soft tissue sarcoma. J Clin Oncol. 2014;32:3299-306.

CHAPTER
Concluding remarks and future perspectives
Chapter 11 200
CONCLUDING REMARKS AND FUTURE PERSPECTIVES
In this thesis we described hypoxia PET imaging with [18F]HX4 in preclinical setting, in patients with NSCLC and HNSCC. We showed its potential to reliably detect, visualize and quantify tumor hypoxia. Also, the additional value hypoxia PET imaging in comparison to metabolic FDG PET imaging was observed and we showed the ability to monitor the response to treatment with the aid of [18F]HX4 PET.
[18F]HX4 PET for other solid lesions.
The focus of this thesis was the use of hypoxia PET imaging in patients with head and neck and lung cancer. However, hypoxia also plays an important role in other solid cancers and [18F]HX4 PET might have the potential to visualise and quantify hypoxia in more divers tumor types (1-6). For this reason we initiated clinical trials to investigate the potential of [18F]HX4 PET in patients with cervical cancer (NCT02233387), esophagus, prostate, glioblas-toma, rectum or brain metastases (submitted to Medical Ethical Review Board). In addition, another research group recently completed a clinical trial investigating [18F]HX4 PET in patients with pancreatic and esophageal cancer (AMC Amsterdam, NCT01995084, (7)).
Anti-hypoxia treatment
A more individualized anti-cancer treatment could be obtained by the selection of patients for additional anti-hypoxia therapy. Studies including hypoxia PET imaging as part of the anti-hypoxia treatment intervention should be initiated, to stratify patients based on their hypoxic status. For example, treatment with accelerated radiotherapy in combination with carbogen inhalation and nicotinamide (ARCON; to decrease diffusion and perfusion limited hypoxia) was shown to result in additional benefit only in patients with a hypoxic tumor, which was assessed by pimonidazole staining (8). Also, the Phase II study of Rischin et al. (9) showed that the addition of the hypoxic cell cytotoxin tirapazamine to the stand-ard chemoradiotherapy treatment was shown to be beneficial only for patients with a hypoxic tumor, which was identified by [18F]FMISO PET imaging. Previous results have also shown that the hypoxic status (based on plasma osteopontin concentration) had an important impact on the treatment effectiveness of the radiosensitizer nimorazole in combination with radiotherapy (10). This was confirmed in preclinical setting, where stratification of tumors, based [18F]FAZA PET imaging, showed only a significant improve-ment of the additional treatment with nimorazole in group with more tumor hypoxia (11). At MAASTRO Clinic we are currently investigating or initiating ‘window-of-opportunity’ trials. Using repeated hypoxia PET imaging before and after the therapeutic intervention, the effect of the drug on the hypoxic tumor status can be evaluated. One ongoing trial is evaluating the effect of the nitric oxide donor, nitroglycerin on the hypoxic status of NSCLC lesions. Our preliminary results show that nitroglycerin reduces the hypoxic frac-tion in patients with NSCLC (Figure 11.1, (12)). The effect of nitroglycerin in combination with radiotherapy on loco-regional control and the influence of the hypoxic status on the treatment effect are research questions that can be answered as soon as accrual and follow up has completed (NCT01210378). In addition, we will initiate a clinical trial, as-sessing the effect of TH302 in combination with chemoradiation. Also in this setting
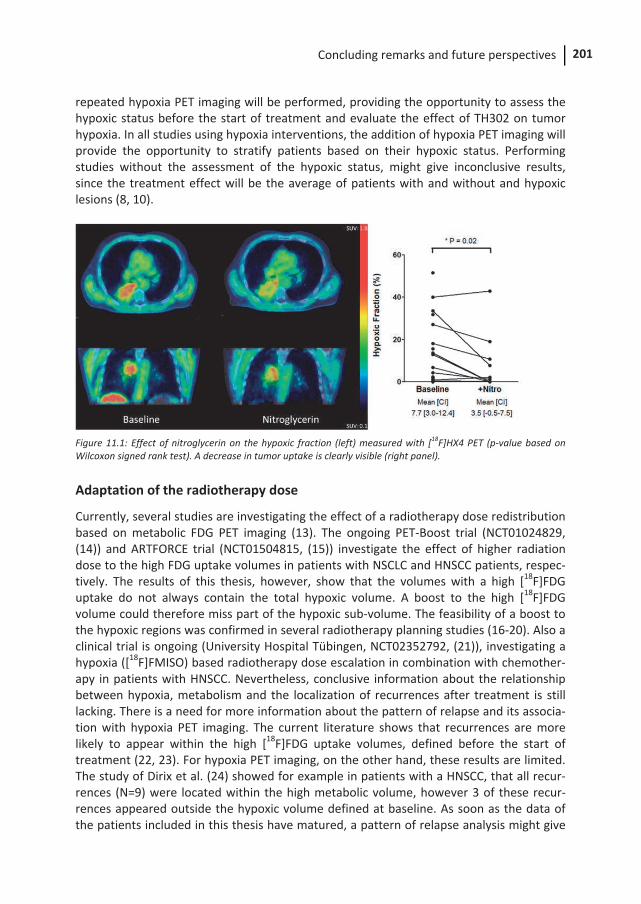
Concluding remarks and future perspectives 201
repeated hypoxia PET imaging will be performed, providing the opportunity to assess the hypoxic status before the start of treatment and evaluate the effect of TH302 on tumor hypoxia. In all studies using hypoxia interventions, the addition of hypoxia PET imaging will provide the opportunity to stratify patients based on their hypoxic status. Performing studies without the assessment of the hypoxic status, might give inconclusive results, since the treatment effect will be the average of patients with and without and hypoxic lesions (8, 10).
Figure 11.1: Effect of nitroglycerin on the hypoxic fraction (left) measured with [18F]HX4 PET (p-value based on Wilcoxon signed rank test). A decrease in tumor uptake is clearly visible (right panel).
Adaptation of the radiotherapy dose
Currently, several studies are investigating the effect of a radiotherapy dose redistribution based on metabolic FDG PET imaging (13). The ongoing PET-Boost trial (NCT01024829, (14)) and ARTFORCE trial (NCT01504815, (15)) investigate the effect of higher radiation dose to the high FDG uptake volumes in patients with NSCLC and HNSCC patients, respec-tively. The results of this thesis, however, show that the volumes with a high [18F]FDG uptake do not always contain the total hypoxic volume. A boost to the high [18F]FDG volume could therefore miss part of the hypoxic sub-volume. The feasibility of a boost to the hypoxic regions was confirmed in several radiotherapy planning studies (16-20). Also a clinical trial is ongoing (University Hospital Tübingen, NCT02352792, (21)), investigating a hypoxia ([18F]FMISO) based radiotherapy dose escalation in combination with chemother-apy in patients with HNSCC. Nevertheless, conclusive information about the relationship between hypoxia, metabolism and the localization of recurrences after treatment is still lacking. There is a need for more information about the pattern of relapse and its associa-tion with hypoxia PET imaging. The current literature shows that recurrences are more likely to appear within the high [18F]FDG uptake volumes, defined before the start of treatment (22, 23). For hypoxia PET imaging, on the other hand, these results are limited. The study of Dirix et al. (24) showed for example in patients with a HNSCC, that all recur-rences (N=9) were located within the high metabolic volume, however 3 of these recur-rences appeared outside the hypoxic volume defined at baseline. As soon as the data of the patients included in this thesis have matured, a pattern of relapse analysis might give
Chapter 11 202
more information about the relationship between the localization of a high metabolism, hypoxia and loco-regional recurrences.
Conclusion
Imaging of tumor hypoxia with the aid of [18F]HX4 PET has the potential to contribute to individualized anti-cancer treatment by the accurate identification and quantification of tumor hypoxia and has the potential to monitor the response to treatment. Clinical stud-ies investigating the use of hypoxia PET imaging to select patients for additional anti-hypoxia therapy, and an extensive pattern of relapse analysis are necessary to bring individualized treatment with the aid of hypoxia PET to the next level.
Concluding remarks and future perspectives 203
REFERENCES
1. Carnell DM, Smith RE, Daley FM, Saunders MI, Bentzen SM, Hoskin PJ. An immunohistochemical assessment of hypoxia in prostate carcinoma using pimonidazole: implications for radioresistance. Int J Radiat Oncol Biol Phys. 2006;65:91-9.
2. Movsas B, Chapman JD, Hanlon AL, Horwitz EM, Greenberg RE, Stobbe C, et al. Hypoxic prostate/muscle pO2 ratio predicts for biochemical failure in patients with prostate cancer: preliminary findings. Urology. 2002;60:634-9.
3. Yue J, Yang Y, Cabrera AR, Sun X, Zhao S, Xie P, et al. Measuring tumor hypoxia with (18) F-FETNIM PET in esophageal squamous cell carcinoma: a pilot clinical study. Dis Esophagus. 2011.
4. Szeto MD, Chakraborty G, Hadley J, Rockne R, Muzi M, Alvord EC, Jr., et al. Quantitative metrics of net proliferation and invasion link biological aggressiveness assessed by MRI with hypoxia assessed by FMISO-PET in newly diagnosed glioblastomas. Cancer Res. 2009;69:4502-9.
5. Tanaka N, Kato H, Inose T, Kimura H, Faried A, Sohda M, et al. Expression of carbonic anhydrase 9, a potential intrinsic marker of hypoxia, is associated with poor prognosis in oesophageal squamous cell carcinoma. Br J Cancer. 2008;99:1468-75.
6. Vercellino L, Groheux D, Thoury A, Delord M, Schlageter MH, Delpech Y, et al. Hypoxia imaging of uterine cervix carcinoma with (18)F-FETNIM PET/CT. Clin Nucl Med. 2012;37:1065-8.
7. Klaassen R, van Laarhoven H, Tienhoven G, Bijlsma M, Geijsen E, Besselink M, et al. Timing and reproducibility of [18F]HX4 PET-CT for the detection of hypoxia in esophageal and pancreatic cancer Journal of nuclear medicine; May 2014 vol 55, abstract 1433 2014.
8. Janssens GO, Rademakers SE, Terhaard CH, Doornaert PA, Bijl HP, van den Ende P, et al. Accelerated radiotherapy with carbogen and nicotinamide for laryngeal cancer: results of a phase III randomized trial. J Clin Oncol. 2012;30:1777-83.
9. Rischin D, Hicks RJ, Fisher R, Binns D, Corry J, Porceddu S, et al. Prognostic significance of [18F]-misonidazole positron emission tomography-detected tumor hypoxia in patients with advanced head and neck cancer randomly assigned to chemoradiation with or without tirapazamine: a substudy of Trans-Tasman Radiation Oncology Group Study 98.02. J Clin Oncol. 2006;24:2098-104.
10. Overgaard J, Eriksen JG, Nordsmark M, Alsner J, Horsman MR. Plasma osteopontin, hypoxia, and response to the hypoxia sensitiser nimorazole in radiotherapy of head and neck cancer: results from the DAHANCA 5 randomised double-blind placebo-controlled trial. Lancet Oncol. 2005;6:757-64.
11. Tran LB, Bol A, Labar D, Cao-Pham TT, Jordan B, Gregoire V, et al. Predictive value of (18)F-FAZA PET imaging for guiding the association of radiotherapy with nimorazole: a preclinical study. Radiother Oncol. 2015;114:189-94.
12. Reymen B, Van Gisbergen M, Zegers CM, Dubois L, Lambin P. Nitroglycerin as a sensitizer in the treatment of non small cell lung cancer: from cells tin vitro to phase 3 trial. 3rd ESTRO Forum abstract SP-0597. 2015.
Chapter 11 204
13. Grootjans W, de Geus-Oei LF, Troost EG, Visser EP, Oyen WJ, Bussink J. PET in the management of locally advanced and metastatic NSCLC. Nat Rev Clin Oncol. 2015.
14. van Elmpt W, De Ruysscher D, van der Salm A, Lakeman A, van der Stoep J, Emans D, et al. The PET-boost randomised phase II dose-escalation trial in non-small cell lung cancer. Radiother Oncol. 2012;104:67-71.
15. Heukelom J, Hamming O, Bartelink H, Hoebers F, Giralt J, Herlestam T, et al. Adaptive and innovative Radiation Treatment FOR improving Cancer treatment outcomE (ARTFORCE); a randomized controlled phase II trial for individualized treatment of head and neck cancer. BMC Cancer. 2013;13:84.
16. Hendrickson K, Phillips M, Smith W, Peterson L, Krohn K, Rajendran J. Hypoxia imaging with [F-18] FMISO-PET in head and neck cancer: potential for guiding intensity modulated radiation therapy in overcoming hypoxia-induced treatment resistance. Radiother Oncol. 2011;101:369-75.
17. Toma-Dasu I, Uhrdin J, Antonovic L, Dasu A, Nuyts S, Dirix P, et al. Dose prescription and treatment planning based on FMISO-PET hypoxia. Acta Oncol. 2012;51:222-30.
18. Choi W, Lee SW, Park SH, Ryu JS, Oh SJ, Im KC, et al. Planning study for available dose of hypoxic tumor volume using fluorine-18-labeled fluoromisonidazole positron emission tomography for treatment of the head and neck cancer. Radiother Oncol. 2010;97:176-82.
19. Thorwarth D, Eschmann SM, Paulsen F, Alber M. Hypoxia dose painting by numbers: a planning study. Int J Radiat Oncol Biol Phys. 2007;68:291-300.
20. Servagi-Vernat S, Differding S, Sterpin E, Hanin FX, Labar D, Bol A, et al. Hypoxia-guided adaptive radiation dose escalation in head and neck carcinoma: A planning study. Acta Oncol. 2015:1-9.
21. Thorwarth D. Hypoxia PET imaging for delineation and response assessment during radiotherapy. 3rd ESTRO Forum abstract SP-0362. 2015.
22. Aerts HJ, van Baardwijk AA, Petit SF, Offermann C, Loon J, Houben R, et al. Identification of residual metabolic-active areas within individual NSCLC tumours using a pre-radiotherapy (18)Fluorodeoxyglucose-PET-CT scan. Radiother Oncol. 2009;91:386-92.
23. Due AK, Vogelius IR, Aznar MC, Bentzen SM, Berthelsen AK, Korreman SS, et al. Recurrences after intensity modulated radiotherapy for head and neck squamous cell carcinoma more likely to originate from regions with high baseline [18F]-FDG uptake. Radiother Oncol. 2014;111:360-5.
24. Dirix P, Vandecaveye V, De Keyzer F, Stroobants S, Hermans R, Nuyts S. Dose painting in radiotherapy for head and neck squamous cell carcinoma: value of repeated functional imaging with (18)F-FDG PET, (18)F-fluoromisonidazole PET, diffusion-weighted MRI, and dynamic contrast-enhanced MRI. J Nucl Med. 2009;50:1020-7.

VALORISATION ADDENDUM

Valorisation addendum 207
VALORISATION ADDENDUM
Tumor hypoxia is a property of cancer with a negative impact on the prognosis of the patient. In this thesis the possibilities to visualize, monitor and target tumor hypoxia are described. Since cancer is one of the leading causes of death in the Netherlands and its incidence is expected to rise due to an increased life expectancy of our elderly population, the scientific results of this thesis can be of benefit for the general society.
Social relevance
The treatment of cancer patients is continuously improving, with the aim to tailor cancer treatment to the needs of each individual patient. The presence of tumor hypoxia is known to have detrimental effects on the ability to control the disease. The non-invasive detection of tumor hypoxia provides the opportunity to individualize anti-cancer treat-ment by the ability (1) to improve the prediction of the response to treatment, (2) to monitor the response to treatment and (3) to select patients for additional anti-hypoxia treatment. There are several prediction models available which estimate the chances of survival or local recurrences in cancer patients based on their general health and tumor characteris-tics. Several studies have shown that hypoxia is an important prognostic marker for treatment response. The addition of hypoxia PET parameters to already existing prediction models could improve the accuracy of these predictions. In the future these models can be used to intensify treatment in patients with a high chance of local recurrences. The visualization of tumor hypoxia during treatment allows us to monitor the response to the given treatment and provides the ability to act on this information. This window-of-opportunity trial design might be very useful in the development of anti-hypoxia treat-ment strategies. The effect of hypoxia targeting by visualization before and after the treatment shows the effect of the (additional) treatment and its potential to target hypox-ia. These studies are very effective, because with a limited amount of patients the effect of the treatment can be visualized, since each patient acts as its own control. In addition, hypoxia imaging before treatment and the effect of anti-hypoxia treatment in the individual patients can be used for patient selection. Only patients with tumor hypoxia will have additional gain of anti-hypoxia treatment. Also the anti-hypoxia treatment should cause a decrease in hypoxia in the individual patient. Therefore patients that do not have significant hypoxia before the start of treatment, or patients that do not have a response to the additional treatment, could be excluded from unnecessary anti-hypoxia treatments. Besides the clinical benefit, the ability to stratify patients based on their hypoxia status also provides economical benefit, since additional treatments to counteract hypoxia can be applied to only those patients who benefit from it, increasing their prognosis. There-fore, also unnecessary treatment, with additional costs and potential side-effects, can be omitted in the patients with no clinical benefit.
Chapter 11 208
Target groups
Patients and their doctors could benefit from the implementation of hypoxia imaging and targeting. An optimized and individualized treatment can be given, with less recurrences and a longer life expectancy. In addition, in the current health care environment patients are more and more involved in the treatment decisions. Improved prediction models and treatment monitoring will guide the doctors and patients in their treatment decisions. Last, the opportunity to visualize tumor hypoxia can be of general interest to all health care companies which develop hypoxia targeted agents. The hypoxia PET tracers allow in an early stage to detect, in vivo, the effect of a hypoxia targeting drug, which can guide them in the development.
Activities and products
In this thesis the included number of patients is still limited. However, patient accrual is still ongoing in the described clinical trials and new clinical trials are initiated. As soon as sufficient data are gathered, the additional value of hypoxia PET imaging to the current prediction models can be evaluated. There are already several prediction models available (for example on www.predictcancer.org). Hypoxia PET imaging data could be integrated into these prediction models. The current data might provide additional information improving the response prediction. At Maastro there is a research group investigating the potential of quantitative features from medical images (RADIOMICS) to monitor the response to treatment http://www.radiomics.org/. At the moment research is performed mainly on CT and [18F]FDG PET imaging. Hypoxia PET imaging could be integrated in this extensive image analysis, and analysis are planned for the near future.
Innovation
The detection of tumor hypoxia is not new. However the clinical use of hypoxia PET imaging to monitor or predict the response to treatment is limited. Also, treatment selec-tion based on hypoxia PET imaging is not yet implemented. In this thesis we mainly de-scribe the use of the hypoxia PET tracer HX4, this is a relative new PET tracer for hypoxia PET imaging. Comparing this tracer with the alternative hypoxia PET tracers on the market showed beneficial characteristics which motivated the use of this tracer in clinical trials. We showed the ability of HX4 PET imaging to monitor the response to radiotherapy, in patients with head and neck cancer, and the response to TH302 treatment in preclinical setting.
Planning and realisation
The research described in this thesis is the basis of several new initiatives to implement hypoxia PET imaging. The follow-up data of all patients described in this thesis will provide information on the ability to predict the response to treatment. This information on tumor hypoxia will be implemented in the available prediction models. To perform the research described in this thesis, a close collaboration with Threshold Pharmaceuticals was started.
Valorisation addendum 209
This led to new opportunities regarding clinical trials. The next step is a phase I trial inves-tigating the use of TH302 in combination with radiotherapy in patients with esophageal cancer. In this setting HX4 PET imaging will be used to monitor the effect of the treatment. Also, preclinical trials are performed investigating radiotherapy dose escalation based on HX4 PET imaging, in comparison to FDG-PET imaging. The information from these studies will be essential for the clinical implementation of hypoxia boost trials. Last, the use of hypoxia PET imaging in the RADIOMICS project will be started in the near future, which will show us if hypoxia PET imaging provides additional information to the image features derived from standard CT (and FDG-PET) imaging for response prediction. To summarize, this thesis provides valuable information on the use of hypoxia HX4 PET imaging. The implementation of hypoxia PET imaging in our clinical trial setting is opti-mized and based on the results of this thesis new initiatives are taken, with the aim to improve our cancer treatment. This thesis was therefore an important step to individual-ized cancer treatment.


CURRICULUM VITAE

Curriculum Vitae 213
CURRICULUM VITAE
Karen Zegers werd geboren op 30 april 1984 in Heerlen. Zij voltooide in 2002 het VWO op scholengemeenschap Sophianum te Gulpen en vervolgde haar studie met de opleiding Pedagogi-sche Wetenschappen aan de Radboud Universiteit in Nijmegen. Na twee jaar besloot zij haar focus te verleggen en te starten met de opleiding Technische Geneeskunde aan de Universiteit Twen-te in Enschede. De specialisatie van haar Master opleiding was medische robotica en beeldvorming. Na diverse stages binnen de disciplines radiologie, chirurgie en elektrofysiologie voltooide zij in 2010 haar afstudeeropdracht ‘dosimetrie voor radio-immuno-therapie’ op de afdeling nucleaire geneeskunde van het Radboud
Universitair Medisch Centrum in Nijmegen. Binnen deze afdeling bleef zij nog drie maan-den in dienst als onderzoeksassistent. In januari 2011 startte zij met haar promotie onder-zoek bij MAASTRO clinic, waar ze in 2014 de Maastro Research Award won. Vanaf juni 2015 is zij werkzaam als klinisch technoloog binnen de groep Fysica Innovatie van Maastro Clinic.


LIST OF PUBLICATIONS

Publications 217
LIST OF PUBLICATIONS
Zegers CM, van Elmpt W, Szardenings K, Kolb H, Waxman A, Subramaniam RM, Moon DH, Brunetti JC, Srinivas SM, Lambin P, Chien D. Repeatability of hypoxia PET imaging using [18F]HX4 in lung and head and neck cancer patients: a prospective multicenter trial. Eur J Nucl Med Mol Imaging. 2015 Nov;42(12):1840-9. Lambin P, Zindler J, Vanneste B, van de Voorde L, Jacobs M, Eekers D, Peerlings J, Reymen B, Larue RT, Deist TM, de Jong EE, Even AJ, Berlanga AJ, Roelofs E, Cheng Q, Carvalho S, Leijenaar RT, Zegers CM, van Limbergen E, Berbee M, van Elmpt W, Oberije C, Houben R, Dekker A, Boersma L, Verhaegen F, Bosmans G, Hoebers F, Smits K, Walsh S. Modern clinical research: How rapid learning health care and cohort multiple randomised clinical trials complement traditional evidence based medicine. Acta Oncol. 2015 Oct;54(9):1289-300. Zegers CM, van Elmpt W, Hoebers FJ, Troost EG, Öllers MC, Mottaghy FM, Lambin P. Imaging of tumour hypoxia and metabolism in patients with head and neck squamous cell carcinoma. Acta Oncol. 2015 Oct;54(9):1378-84 Wack LJ, Mönnich D, van Elmpt W, Zegers CM, Troost EG, Zips D, Thorwarth D. Compari-son of [18F]-FMISO, [18F]-FAZA and [18F]-HX4 for PET imaging of hypoxia - a simulation study. Acta Oncol. 2015 Oct;54(9):1370-7. Rekers NH, Zegers CM, Yaromina A, Lieuwes NG, Biemans R, Senden-Gijsbers BL, Losen M, Van Limbergen EJ, Germeraad WT, Neri D, Dubois L, Lambin P. Combination of radiothera-py with the immunocytokine L19-IL2: Additive effect in a NK cell dependent tumour model. Radiother Oncol. 2015 Sep;116(3):438-42. van Elmpt W, Zegers CM, Reymen B, Even AJ, Dingemans AC, Oellers M, Wildberger JE, Mottaghy FM, Das M, Troost EG, Lambin P. Multiparametric imaging of patient and tumour heterogeneity in non-small-cell lung cancer: quantification of tumour hypoxia, metabolism and perfusion. Eur J Nucl Med Mol Imaging. 2015 Dubois LJ, Niemans R, van Kuijk SJ, Panth KM, Parvathaneni NK, Peeters SG, Zegers CM, Rekers NH, van Gisbergen MW, Biemans R, Lieuwes NG, Spiegelberg L, Yaromina A, Winum JY, Vooijs M, Lambin P. New ways to image and target tumour hypoxia and its molecular responses. Radiother Oncol. 2015 Sep;116(3):352-7. Even AJ, van der Stoep J, Zegers CM, Reymen B, Troost EG, Lambin P, van Elmpt W. PET-based dose painting in non-small cell lung cancer: Comparing uniform dose escalation with boosting hypoxic and metabolically active sub-volumes. Radiother Oncol. 2015 Aug;116(2):281-6. Peeters SG, Zegers CM, Biemans R, Lieuwes NG, van Stiphout RG, Yaromina A, Sun JD, Hart CP, Windhorst AD, van Elmpt W, Dubois LJ, Lambin P. TH-302 in Combination with Radio-
218
therapy Enhances the Therapeutic Outcome and Is Associated with Pretreatment [18F]HX4 Hypoxia PET Imaging. Clin Cancer Res. 2015 Jul 1;21(13):2984-92. Rekers NH, Zegers CM, Germeraad WT, Dubois L, Lambin P. Long-lasting antitumor effects provided by radiotherapy combined with the immunocytokine L19-IL2. Oncoimmunology. 2015 Apr 2;4(8) Zegers CM*, Rekers NH*, Quaden DH, Lieuwes NG, Yaromina A, Germeraad WT, Wieten L, Biessen EA, Boon L, Neri D, Troost EG, Dubois LJ, Lambin P. Radiotherapy combined with the immunocytokine L19-IL2 provides long-lasting antitumor effects. Clin Cancer Res. 2015 Mar 1;21(5):1151-60. Peeters SG*, Zegers CM*, Yaromina A, Van Elmpt W, Dubois L, Lambin P. Current preclini-cal and clinical applications of hypoxia PET imaging using 2-nitroimidazoles. Q J Nucl Med Mol Imaging. 2015 Mar;59(1):39-57. Peeters SG, Zegers CM, Lieuwes NG, van Elmpt W, Eriksson J, van Dongen GA, Dubois L, Lambin P. A comparative study of the hypoxia PET tracers [18F]HX4, [18F]FAZA, and [18F]FMISO in a preclinical tumor model. Int J Radiat Oncol Biol Phys. 2015 Feb 1;91(2): 351-9. Zegers CM, van Elmpt W, Reymen B, Even AJ, Troost EG, Ollers MC, Hoebers FJ, Houben RM, Eriksson J, Windhorst AD, Mottaghy FM, De Ruysscher D, Lambin P. In vivo quantifica-tion of hypoxic and metabolic status of NSCLC tumors using [18F]HX4 and [18F]FDG-PET/CT imaging. Clin Cancer Res. 2014 Dec 15;20(24):6389-97. Rekers NH, Troost EG, Zegers CM, Germeraad WT, Dubois LJ, Lambin P. Stereotactic ablative body radiotherapy combined with immunotherapy: present status and future perspectives. Cancer Radiother. 2014 Oct;18(5-6):391-5. van Elmpt W, Zegers CM, Das M, De Ruysscher D. Imaging techniques for tumour delinea-tion and heterogeneity quantification of lung cancer: overview of current possibilities. J Thorac Dis. 2014 Apr;6(4):319-27. Zegers CM, Peeters SG, Dubois L, Lambin P Patiëntspecifieke behandeling met behulp van hypoxie PET. Oncology News International. 2014 Feb;8(1) van Elmpt W, Das M, Hüllner M, Sharifi H, Zegers CM, Reymen B, Lambin P, Wildberger JE, Troost EG, Veit-Haibach P, De Ruysscher D. Characterization of tumor heterogeneity using dynamic contrast enhanced CT and FDG-PET in non-small cell lung cancer. Radiother Oncol. 2013 Oct;109(1):65-70. Zegers CM, van Elmpt W, Wierts R, Reymen B, Sharifi H, Öllers MC, Hoebers F, Troost EG, Wanders R, van Baardwijk A, Brans B, Eriksson J, Windhorst B, Mottaghy FM, De Ruysscher D, Lambin P. Hypoxia imaging with [18F]HX4 PET in NSCLC patients: defining optimal imaging parameters. Radiother Oncol. 2013 Oct;109(1):58-64.
Publications 219
Lambin P, Roelofs E, Reymen B, Velazquez ER, Buijsen J, Zegers CM, Carvalho S, Leijenaar RT, Nalbantov G, Oberije C, Scott Marshall M, Hoebers F, Troost EG, van Stiphout RG, van Elmpt W, van der Weijden T, Boersma L, Valentini V, Dekker A. 'Rapid Learning health care in oncology' - an approach towards decision support systems enabling customised radio-therapy'. Radiother Oncol. 2013 Oct;109(1):159-64. Zegers CM, Reymen B, Buijsen J, van Stiphout R, Peeters S, Lammering G, Hoebers F, Troost E, van Baardwijk A., Ollers M, van Elmpt W, Lambin P. De bijdrage van PET-beeldvorming in radiotherapie. Kankerbreed 2012 Dec;4(4) Lambin P, Rios-Velazquez E, Leijenaar R, Carvalho S, van Stiphout RG, Granton P, Zegers CM, Gillies R, Boellard R, Dekker A, Aerts HJ. Radiomics: extracting more information from medical images using advanced feature analysis. Eur J Cancer. 2012 Mar;48(4):441-6. Stillebroer AB*, Zegers CM*, Boerman OC, Oosterwijk E, Mulders PF, O'Donoghue JA, Visser EP, Oyen WJ. Dosimetric analysis of 177Lu-cG250 radioimmunotherapy in renal cell carcinoma patients: correlation with myelotoxicity and pretherapeutic absorbed dose predictions based on 111In-cG250 imaging. J Nucl Med. 2012 Jan;53(1):82-9. * indicates equal contribution


DANKWOORD

Dankwoord 223
DANKWOORD
Een van de genoegens van het voltooien van mijn proefschrift is het terug blikken op de reis en herinneren hoe vele collega’s, vrienden en familie me door de jaren heen hebben gesteund. Allereerst wil ik mijn dank uitspreken aan mijn promotor Prof. Dr. Philippe Lambin en copromotoren Dr. Wouter van Elmpt and Dr. Ludwig Dubois voor alle tijd en energie die zij in mijn promotie hebben gestoken. Philippe wekte mijn interesse voor de wetenschap en stond daarmee aan het begin van mijn wetenschappelijke carrière. Hij bood veel ervaring en onmisbare hulp in de structurering van het onderzoek waardoor ik mij heb kunnen ontwikkelen tot een zelfstandig onderzoeker. Wouter, je deur stond altijd voor me open, waar ik veelvuldig gebruik van gemaakt heb. Bedankt voor je betrokkenheid en waardevol-le feedback, onze gesprekken over het onderzoek gaven mij vaak nieuwe energie. Ludwig, je enthousiasme werkt aanstekelijk, bedankt voor je supervisie en kennis, welke een bron van inspiratie voor mij zijn geweest. Graag wil ik ook de leden van de beoordelingscommissie bedanken (Prof. Dr. F. Ramae-kers, Prof Dr. M. Vooijs, Prof Dr. D. Zips en Dr. J. Bussink) voor het lezen en kritisch beoor-delen van mijn thesis. Dit proefschrift bevat data van meerdere klinische studies, welke tot stand zijn gekomen met de hulp van vele mensen. In het bijzonder wil ik alle patiënten bedanken die deelge-nomen hebben aan de studies. Daarnaast dank aan alle medewerkers die zich ingezet hebben in de acquisitie van de data. Het datamanagement van Maastro Clinic, met in het bijzonder Anita, ik heb fijne herinneringen aan onze samenwerking m.b.t. de HX4-hoofd hals studie. Trots ben ik dan ook dat we deze studie samen succesvol hebben kunnen afsluiten. Ook speciale dank aan de trial-poli van Maastro, John en Claudia, jullie bijdrage is onmisbaar in de klinische studies binnen Maastro. Veel dank voor jullie support. Ook wil ik mijn dank uitspreken naar alle PET-CT laboranten die in de avonduren patiënten ge-scand hebben. In het bijzonder Leo en Marlies bedankt voor al jullie raad en daad bij de PET-CT. Dank ook aan de groep klinische fysica, Lars en Michel bedankt voor jullie bijdrage in het opzetten en uitvoeren van de klinische studies. Als laatste wil ik de collega’s van de nucleaire geneeskunde bedanken voor de prettige samenwerking. Renee, Christian, Roel, Ivo, Stefan en Felix, bedankt dat ik altijd bij jullie terecht kon. Tijdens mijn promotie heb ik ook met veel plezier in het Maastro Lab gewerkt. Ik wil alle medewerkers van het lab bedanken voor de gastvrijheid en gezelligheid waarmee ik ontvangen ben. Ik heb ontzettend veel van jullie geleerd. Sarah, jouw werk is van onschat-bare waarde geweest voor de totstandkoming van dit proefschrift. Bedankt voor de leuke en gezellige samenwerking. Ik wens je heel veel plezier en succes in je verdere carrière in Oxford. Natasja, jij hebt mij de praktische aspecten van het labwerk geleerd. Je rust en geduld hebben mij het zelfvertrouwen gegeven om zelfstandig in het lab te werken. Nicolle, helaas heeft het pronkstuk van onze samenwerking geen plekje gekregen in dit proefschrift, maar ik ben trots dat het artikel wel in jouw proefschrift zal verschijnen. We
224
zijn samen een goed team gebleken op zowel de werkvloer als de dansvloer. Ik wens je veel succes met het afronden van je promotie. Hartelijk dank aan al mijn coauteurs, voor het tot stand komen van de manuscripten. In het bijzonder, Frank, bedankt voor al je begeleiding en advies bij het opzetten en uitvoe-ren van de hoofd-hals studie, ik heb met veel plezier met je samen gewerkt. Dirk en Bart, bedankt dat ik direct kon meewerken en gebruik maken van de data verkregen in de long studies. Jullie input kwam de kwaliteit van de artikelen zeker ten goede. Esther, bedankt voor je enthousiasme en waardevolle input in de revisie van de manuscripten. Judith, bedankt voor de analyse van de bloedsamples. Katrin and David, thank you for the oppor-tunity to work together, perseverance always wins, I am proud of the final result. Speciale dank gaat uit naar mijn paranimfen, Skadi en Sara. Ik vind het een eer dat jullie op 9 maart letterlijk en figuurlijk achter mij staan. Met veel plezier denk ik terug aan onze tijd bij Maastro, we hebben veel beleefd samen en ik hoop dat er nog veel mooie momenten zullen volgen. Skadi, Geert en Olav, heel veel plezier met jullie drietjes, ik wens jullie een hele mooie toekomst samen. Sara, thank you for organizing all the fun shopping trips and Christmas lunches. Obrigado o sucesso no futuro e se divertir com Nuno em Londres. Hoda and Ruud, the last angel and our Charlie, you’re both out of sight however not out of my mind. I hope we will all meet again. A big ‘thank you!’ to all my fellow researchers. Patrick, Guillaume, Emmanuel, Skadi, Marco, Ruud, Georgi, Daniela, Fiere, Sara, Shane, Evelyn, Aniek, Ralph, Esther, Ruben, Jurgen, Timo, Stefan, Gabriel, Mark, Lotte, Isabel, Sean, Adriana, Lucas, Daan, Davide, Francesco, Hoda, Celine, Pouya, Scott, Arthur, Bregtje, Pedro, Raghu, Mathieu, Abir, Ester, Qing, Janita, Nicolle, Dana, Sarah, Sanaz, Marike, Kranthi, Arjan, Tessa. All of you and the dynamics of the group made me come to work each day with pleasure. I enjoyed our fun discussions and have great memories of the humorous moments in the ‘big room’, our cheerful lunches, awesome conference visits and special moments in the night life of Maastricht. Good luck with your next paper! Graag wil ik mijn lieve (schoon)familie en vrienden bedanken voor al het meeleven met belangrijke en minder belangrijke momenten in mijn leven. Leonie en Theo, Sybilla en Rick: bedankt voor jullie interesse en steun, ik wens jullie alvast heel veel plezier met jullie aankomende wondertje. Ron en Tessa, goed voorbeeld doet goed volgen. Bedankt voor jullie adviezen en veel geluk in nabije toekomst met jullie kleine prinsje of prinsesje. Lieve pap en mam, bedankt voor al jullie vertrouwen, raad en daad, en onvoorwaardelijke steun! Als laatste wil ik de twee belangrijkste mannen in mijn leven bedanken. Philip, lieve sjat, we hebben de afgelopen jaren veel moois meegemaakt. Bedankt dat je er altijd voor me was, met al je liefde, steun en humor. Jij krijgt me altijd weer met beide benen op de grond. Ik weet zeker dat er een mooie toekomst voor ons in het verschiet ligt. Quin, je bent zo klein, maar hebt nu al de grootste veranderingen in mij teweeg gebracht. Er is een titel die meer waard is dan mijn doctoraat, namelijk dat ik mij jouw moeder mag noemen.

Imaging of tumor hypoxia with PET
Karen Zegers
Karen ZegersIm
aging of tumor hypoxia with PET a step towards individualized cancer treatm
ent
a step towards individualized cancer treatment
Omslag Karen Zegers 352x240 V1.indd 1 3-2-2016 11:45:39