Hepatic hemangioendothelioma: Clinical experience and management strategy
Upload
khangminh22Category
view
1download
0
© The Author 2012. Published by Oxford University Press on behalf of the Society of Toxicology. All rights reserved. For permissions, please email: [email protected]
Pregabalin Induces Hepatic Hypoxia and Increases Endothelial Cell Proliferation in Mice, a Process Inhibited by Dietary
Vitamin E Supplementation
Kay A. Criswell,*,1 Jon C. Cook,* Dennis Morse,* Michael Lawton,* Christopher Somps,* Leslie Obert,* Marc Roy,* Sharon Sokolowski,* Petra Koza-Taylor,* Jennifer Colangelo,* Kimberly Navetta,* Joseph Brady,* David Pegg,2
Zbigniew Wojcinski,3 Ramin Rahbari, Steven Duddy,4 and Timothy Anderson*
*Pfizer Worldwide Research & Development, Drug Safety Research & Development, Groton, Connecticut 06340 Present addresses: 2PharmDev Solutions, LLC, Plymouth, MI 48170; 3Integrated Nonclinical Development Solutions, Inc., 3005 Miller Ave., Ann Arbor,
MI 48103; 4Drug Development Preclinical Services, LLC, 4782 Northgate Drive, Ann Arbor, MI 48103.
1To whom correspondence should be addressed at Pfizer Worldwide Research & Development, Drug Safety Research & Development, 2400 Eastern Point Road, Groton, CT 06340. Fax: (860) 441-7049. E-mail: [email protected].
Received November 8, 2011; accepted April 3, 2012
The preceding article identified key components of pregaba-lin’s mode of action on nongenotoxic hemangiosarcoma forma-tion in mice, including increased serum bicarbonate leading to decreased respiratory rate, increased blood pH, increased ven-ous oxygen saturation, increased vascular endothelial growth factor and basic fibroblast growth factor expression, increased hepatic vascular endothelial growth factor receptor 2 expres-sion, and increased iron-laden macrophages. Increased platelet count and platelet activation were early, species-specific bio-markers in mice. Dysregulated erythropoiesis, macrophage ac-tivation, and elevations of tissue growth factors were consistent with the unified mode of action for nongenotoxic hemangiosar-coma recently proposed at an international hemangiosarcoma workshop (Cohen, S. M., Storer, R. D., Criswell, K. A., Doerrer, N. G., Dellarco, V. L., Pegg, D. G., Wojcinski, Z. W., Malarkey, D. E., Jacobs, A. C., Klaunig, J. E., et al. (2009). Hemangiosarco-ma in rodents: Mode-of-action evaluation and human relevance. Toxicol. Sci. 111, 4–18). In this article, we present evidence that pregabalin induces hypoxia and increases endothelial cell (EC) proliferation in a species-specific manner. Dietary administra-tion of pregabalin produced a significant 35% increase in an immunohistochemical stain for hypoxia (Hypoxyprobe) in livers from pregabalin-treated mice. Increased Hypoxyprobe staining was not observed in the liver, bone marrow, or spleen of rats, supporting the hypothesis that pregabalin produces local tissue hypoxia in a species-specific manner. Transcriptional analysis supports that rats, unlike mice, adapt to pregabalin-induced hypoxia. Using a dual-label method, increased EC proliferation was observed as early as 2 weeks in mouse liver and 12 weeks in bone marrow following pregabalin administration. These same assays showed decreased EC proliferation in hepatic ECs of rats, further supporting species specificity. Dietary supplemen-tation with vitamin E, which is known to have antioxidant and antiangiogenic activity, inhibited pregabalin-induced increases in mouse hepatic EC proliferation, providing confirmatory
evidence for the proposed mode of action and its species-specific response.
Key Words: pregabalin; hypoxia; endothelial proliferation; Hif1α.
Pregabalin [(S)-3-(aminomethyl)-5-methylhexanoic acid] binds with high affinity to the α
2δ subunit of voltage-gated cal-
cium channels, exerting analgesic, antiseizure, and anxiolytic activities (Dooley et al., 2007; Taylor et al., 2006). Pregaba-lin treatment increased the incidence of hemangiosarcoma in mice, predominantly in liver, spleen, and bone marrow, by a nongenotoxic mechanism (Pegg et al., 2012). Pregabalin did not increase the incidence of any tumor type when given to rats. The studies described in this article evaluate the action of pre-gabalin on local tissue hypoxia in the liver and on endothelial cell (EC) proliferation, a prerequisite for nongenotoxic forma-tion of hemangiosarcoma in mice.
Pregabalin is not unique in its ability to produce mouse-specific hemangiosarcomas. Indeed, numerous pharmaceutical and chemical compounds have been associated with increased incidences of hemangiosarcomas in mice. The pharmacology of these compounds is diverse and includes calcium channel blockers, antipsychotics, phosphodiesterase-5 inhibitors, dipeptidyl peptidase-4 inhibitors, antiarrhythmics, gonadotropin receptor antagonists, antisense compounds, nitric oxide releasers, hemolytic compounds, and vascular endothelial growth factor (VEGF) inducers (Cohen et al., 2009). A recent international hemangiosarcoma workshop developed a unified mode of action for nongenotoxic hemangiosarcoma in mice, which suggests that these different compounds share a common point of intersection and interaction with growth regulatory pathways (Cohen et al., 2009). A critical component of the
toxicological sciences 128(1), 42–56 (2012)doi:10.1093/toxsci/kfs148Advance Access publication April 26, 2012
Dow
nloaded from https://academ
ic.oup.com/toxsci/article/128/1/42/1637707 by guest on 04 February 2022
proposed unified mode of action was the concept that local tissue hypoxia coupled with dysregulated angiogenesis or erythropoiesis would result in hypoxia inducible factor 1 alpha (Hif1α) and/or macrophage activation. Hif1α stimulation increases VEGF levels, whereas macrophage activation stimulates interleukin-6 (IL-6) production, both of which can increase EC proliferation. In addition, macrophage activation would increase reactive oxygen species (ROS), which can also contribute to DNA damage of ECs (Corthals et al., 2006; Klaunig and Kamendulis, 2005; Park et al., 2002a,b; Siesky et al., 2002).
The components of the unified mode of action for hemangio-sarcoma proposed above are consistent with the mechanistic data from 2-butoxyethanol (2-BE), a chemical solvent that is hemolytic and has been shown to induce hemangiosarcomas mainly in livers of male mice (Nyska et al., 2004), with some occurrence in the bone marrow and spleen after inhalation ex-posure (NTP, 2000). In a series of studies conducted by Klaunig and coworkers (Corthals et al., 2006; Klaunig and Kamendulis, 2005; Park et al., 2002a,b; Siesky et al., 2002), a nongenotoxic mode of action was proposed that centers on macrophage ac-tivation due to iron accumulation resulting from the hemolytic effect of the compound (Klaunig and Kamendulis, 2005; Park et al., 2002a,b). Macrophage activation, in turn, was proposed to promote EC proliferation and DNA damage via the produc-tion of ROS and cytokines (Klaunig and Kamendulis, 2005; Park et al., 2002a,b; Siesky et al., 2002). In addition to the proposed EC proliferation caused by macrophage activation, it is possible that localized or systemic hypoxia associated with hemolysis could also contribute to EC proliferation induced by 2-BE.
In a recent publication, a systems-biology approach using Causal Network Modeling (CNM) demonstrated that tissue hypoxia could indeed contribute to the induction of heman-giosarcoma by 2-BE (Laifenfeld et al., 2010). This work also confirmed previous findings that 2-BE induces macrophage ac-tivation and inflammation in the liver (Corthals et al., 2006; Klaunig and Kamendulis, 2005). In addition, an immunohis-tochemistry (IHC) stain for hypoxia (Hypoxyprobe) demon-strated that tissue hypoxia was present in the spleen and bone marrow of 2-BE–treated mice (Laifenfeld et al., 2010). Hence, 2-BE may produce hemangiosarcoma via hemolysis-induced dysregulated erythropoiesis, which leads to local tissue hypox-ia and subsequent macrophage activation, consistent with the recently proposed unified mode of action for hemangiosarcoma (Cohen et al., 2009).
Tissue hypoxia stimulates physiologic angiogenesis and results in increased EC proliferation. Under regulated physi-ologic conditions, this increase in EC proliferation leads to new blood vessel formation to provide oxygenation to the hypoxic tissue ceasing the hypoxia-induced angiogenesis. However, under dysregulated conditions, normal blood vessel formation does not occur for reasons unknown, and hypoxia-driven in-creases in EC proliferation lead to hemangiosarcoma forma-
tion, a malignant tumor of vascular endothelium. It is plausible that species with a high metabolic demand for oxygen and a high spontaneous rate of hemangiosarcoma formation, such as the mouse, may be more prone to drug-induced hemangiosar-coma formation when tissue oxygenation is perturbed.
Previous work has demonstrated that pregabalin increased bicarbonate levels as an early event that leads to an increase in pH and is hypothesized by the Bohr effect to inhibit oxy-gen release from hemoglobin and hence provide conditions that are conducive to local tissue hypoxia in mice (Criswell et al., 2012). In addition, the decrease in respiration rate and minute volume, macrophage activation, and increased tissue angio-genic growth factor expression in mice are consistent with the occurrence of hypoxia in this species; however, direct evidence for hypoxia was not provided (Criswell et al., 2012). This study was designed to evaluate hypoxia in mice and rats treated with pregabalin in diet using transcriptomics and an IHC stain for hypoxia (Hypoxyprobe) and EC proliferation using a dual-labeled methodology specific for sinusoidal ECs. Before this dual-label methodology was available, EC proliferation was measured using an exclusion methodology that has been shown to be less sensitive for detecting sinusoidal EC proliferation (Cohen et al., 2009). Finally, this study evaluated the ability of vitamin E to block pregabalin-induced increases in EC pro-liferation based on previous work with 2-BE (Cunningham, 2002; Siesky et al., 2002). In this article, we provide evidence that pregabalin increases hypoxia and EC proliferation in the livers of mice, but not in those of rats. In addition, vitamin E supplementation achieving serum and liver levels equivalent to levels in rats blocked hepatic EC proliferation in mice, provid-ing confirmatory evidence for the proposed mode of action and its species-specific response. These studies provide additional evidence for components of the unified mode-of-action frame-work for induction of hemangiosarcoma by nongenotoxic com-pounds (Cohen et al., 2009).
MATERIALS AND METHODS
General conditions for all studies. Nine- to 11-week-old B6C3F1 female mice, weighing 18.5–22 g (Charles River Breeding Laboratories, Raleigh, NC), or 6- to 8-week-old Wistar (Crl:WI) female rats, weighing 151–250 g (Charles River Breeding Laboratories), were acclimatized, randomized into treatment groups, and housed individually. Room environmental conditions had design specifications as follows: minimum of 12 air changes per hour with air filtered through 90–95% efficiency filters and then through HEPA filters, relative hu-midity of 50 6 10%, temperature of 70°F 6 5°F, and a 12-h light/dark cycle. Certified Rodent Diet 5002 (PMI Feeds, Inc., St Louis, MO) or Purified Rodent Diet, DYET no. 100000 (Dyets, Inc., Bethlehem, PA; for vitamin E interven-tion study) and municipal drinking water, further purified by reverse osmo-sis, were provided ad libitum. The animal care and experimental procedures of these studies were conducted in compliance with the U.S. Animal Welfare Act and were performed in accordance with the standards of the Institute of Laboratory Animal Resources Guide (1996). The Association for Assessment and Accreditation of Laboratory Animal Care International has accredited the Pfizer facility in which the studies were conducted.
VITAMIN E INHIBITS EC PROLIFERATION IN MICE 43
Dow
nloaded from https://academ
ic.oup.com/toxsci/article/128/1/42/1637707 by guest on 04 February 2022
Tissue Hypoxia Studies. The rationale for the hypoxia study time points and drug dosages was based upon the initial respiratory compensation studies (Criswell et al., 2012). It was determined that rats were able to adequately compensate for the decreased respiratory rate by increasing their RBC count by day 8 post-treatment, restoring tissue oxygenation. Thus, tissue hypoxia as a driver of endothelial proliferation would not be present beyond day 8. This was confirmed by negative endothelial proliferation results obtained for the 2- and 4-week time points and corroborates the negative endothelial proliferation data that were obtained in the original 18-month study and the lack of an increased incidence of hemangiosarcoma formation in the 2-year carcinogenicity study. Hypoxia is an initiating event in the cascade of steps leading to endothelial proliferation and ultimately hemangiosarcoma formation. Thus, evaluation of earlier time points would provide the best opportunity to detect this initiating event prior to any potential compensation. Likewise, the drug dosage was maxi-mized to achieve more sensitivity at these earlier time points versus evaluation of lower drug dosages over a longer time period.
Study design. Mice (n = 10–20) were administered pregabalin at 5000 mg/kg in the diet or administered standard diet 5002 alone for 1 day or 2, 4, or 12 weeks. Rats were administered pregabalin at 900 mg/kg in the diet or admin-istered standard diet 5002 alone for 1 day or 2 or 4 weeks. These doses were the maximum tolerable doses in the mouse and rat carcinogenicity studies and achieved equivalent area under curve values. The 1-day and 2-week mouse and rat dose groups were injected with 100 mg/kg of pimonidazole HCl in sterile PBS (Hypoxyprobe; NPI, Burlington, MA) ip ~2.5 h prior to sacrifice. The 1-day and 2-week treatment groups that were evaluated for transcriptomics and Hypoxyprobe IHC were euthanized by cervical dislocation under ketamine/acepromazine (75/2.5 mg/kg) anesthesia, ip to minimize artifactual tissue hy-poxia associated with other methods of euthanasia.
Hypoxia-positive control generation in mice and rats. Mice were ex-posed to hypoxia as described previously (Laifenfeld et al., 2010). Rats were exposed to hypoxia in a manner similar to mice. Briefly, rats (n = 5) were injected ip with pimonidazole HCl at 100 mg/kg in 10 mg/ml sterile PBS just prior to placement in hypoxia chambers (ProOx Model 110; BioSpherix Inc., Lacona, NY). The rats received decreasing oxygen concentrations from 21 to 6% O
2 for ~30 min then remained an additional 120 min at 6% O
2 prior to
euthanasia by cervical dislocation under ketamine/acepromazine (75/2.5 mg/kg) anesthesia, ip. The spleen, liver, and bone marrow were evaluated for gene expression and Hypoxyprobe IHC.
Hypoxyprobe immunohistochemical staining. Hypoxia was assessed in the liver, spleen, and bone marrow using Hypoxyprobe IHC (www.hypoxy-probe.com) as described previously (Laifenfeld et al., 2010). Briefly, tissue sections were stained and scanned on a Hamamatsu Nanozoomer virtual slide scanner (Olympus, Center Valley, PA), and then analyzed using Definiens Enterprise Image Intelligence (Munich, Germany) for the ratio of Hypoxyprobe stain area to total tissue area for each section. Labstats XP 2.1 in Excel was used to calculate means and standard deviations for group measurements. Prior to assessing significance, the variability between the compared groups was considered using Levine’s test for equality of variances. These results used a selection of equal variance, two-sample unpaired t-test to determine the signifi-cance of treatment upon the measured parameter. No multiple testing adjust-ments were applied for reported p values.
Assessment of transcriptomic effects—RNA isolation, transcriptional pro-filing, and determination of expression changes. The liver, bone marrow, and spleen samples from the 1-day and 2-week time points of the tissue hy-poxia studies (mice and rats treated with pregabalin at 5000 mg/kg/day and 900 mg/kg/day, respectively, and diet-only controls) were used for transcriptomic analysis. RNA isolation, transcriptional profiling, and quantification of expres-sion changes were conducted as described previously (Laifenfeld et al., 2010). Briefly, total RNA was extracted from the liver, spleen, and bone marrow from a minimum of four mice and cDNA synthesized. cRNA was transcribed from cDNA using the GeneChip One-Cycle Labeling Kit from Affymetrix, hy-bridized to Mouse M430 v2.0 or Rat RAE230 v2.0 GeneChip microarrays, and analyzed using the “affy” and “limma” packages of the Bioconductor
suite of microarray analysis tools available for the R statistical environment (Gentleman, 2005; Gentleman et al., 2004; Irizarry et al., 2003). Probe sets were considered to have changed qualitatively in a specific comparison if an adjusted p value of 0.05 was obtained, their average expression intensity was above 250 in either treatment group, and they had an absolute fold change greater than 1.3. To improve detection, more relaxed criteria of 100 for average intensity and 0.10 for adjusted p value were used for the 15-day studies. Genes represented by multiple probe sets were considered to have changed if at least one probe set was observed to change. Gene expression changes that met these criteria were called “statistically significant RNA expression changes” and have the directional qualities of “up” or “down” (i.e., they can be upregulated or downregulated in response to treatment).
Knowledge assembly models and CNM. The substrates for the analysis of statistically significant RNA gene expression changes in response to a given treatment are the Mouse and Rat Knowledge Assembly Models, which are derived from the global Genstruct knowledge base. This knowledge base is a collection of biological concepts and entities and their causal relationships that is derived from peer-reviewed scientific literature and public and proprietary databases. CNM interrogates the appropriate Knowledge Assembly Model to identify upstream controllers for the statistically significant gene expression changes observed in the experiment. These upstream controllers are called “hypotheses” as they are statistically significant potential explanations of the gene expression changes. For this study, only three hypotheses were evaluated:
response to hypoxia, and the transcriptional activities of Hif1α and Epas1. These hypotheses were defined in previous work with reference compounds/treatments (Laifenfeld et al., 2010).
EC proliferation studies. The endothelial proliferation studies were com-pleted over a 10-year time frame, and the information gained from the initial single-antibody studies was utilized to design the more recent two-antibody studies. The intention of the two-antibody studies was to evaluate initiating events and a more acute EC proliferation response. Thus, the drug dosage was maximized to achieve more sensitivity at these earlier time points.
Study design—Single-antibody EC proliferation assay study. Pregabalin (> 99% active drug) was given as a dietary admixture at doses of 50, 200, and 1000 mg/kg to mice (n = 57–61/group) and 900 mg/kg to rats (n = 60/group) for up to 2 years. Control animals were given a diet without pregabalin. In mice, 50 mg/kg was chosen as a no-effect dose level, 1000 mg/kg as a dose shown pre-viously to be tumorigenic in mice, and 200 mg/kg to examine potential dose-response relationships. In rats, 900 mg/kg was the highest dose level tolerated for chronic studies of up to 2-year duration; hemangiosarcoma was not induced in rats treated with pregabalin.
Assessment of EC proliferation using a single antibody. Hepatic EC pro-liferation was assessed in mice treated with 0, 50, 200, and 1000 mg/kg prega-balin for up to 12 months and rats treated with 900 mg/kg pregabalin for up to 18 months. Four days prior to euthanasia, animals were implanted with Alzet Model 2001 osmotic pumps filled with a solution of 100 mg/ml bromodeoxyu-ridine (BrdU) in 0.5 N aqueous sodium carbonate. The pumps delivered 1 µl/h (100 µg BrdU/h) over the 4-day labeling period.
Paraffin liver blocks were prepared from fixed, BrdU-labeled liver samples, and 3-µm sections were cut, placed on charged slides, and air-dried. Dried slides were deparaffinized and processed for immunohistochemical staining on a Nexes Autostainer (Ventana Medical Systems [VMS], Oro Valley, AZ). Slides were stained using a heat protocol that incorporated protease 2 treat-ment (VMS), followed by sequential staining with an antimacrophage antibody (diaminobenzidine detection; VMS), incubation in NH
4Cl, and staining with an
anti-BrdU antibody (alkaline phosphatase red detection kit; VMS).
Following immunohistochemical processing, and prior to imaging, slides were stained for 15 min with Yo-Pro-1 (Molecular Probes, Eugene, OR) and then rinsed in water for 5 min. Brightfield (RGB color), fluorescent green (nu-clei), and fluorescent red (BrdU) images were captured from 10 randomly se-lected areas per slide using a Spot RT CCD camera (Diagnostic Instruments, Sterling Heights, MI) mounted on a Zeiss Axioplan 2 microscope (Carl Zeiss,
44 CRISWELL ET AL.
Dow
nloaded from https://academ
ic.oup.com/toxsci/article/128/1/42/1637707 by guest on 04 February 2022
Thornwood, NY). An image of a micrometer scale was used to calibrate the optical path of the microscope. All cells were recorded and classified as hepato-cyte, Kupffer cell, or EC based on staining characteristics. Each cell was further characterized as proliferating, having incorporated BrdU into the nucleus, or nonproliferating. The percentage of proliferating cells for each cell type was reported in relation to the total number of that cell type.
Assessment of EC Proliferation Using a Dual-Labeled Technique. Study design—Dual-labeled antibody EC proliferation study. Mice (n = 10–20/group) were administered pregabalin at 5000 mg/kg in the diet or standard diet 5002 alone for 2, 4, or 12 weeks, whereas rats were administered pregabalin at 900 mg/kg in the diet or standard diet 5002 alone for 2 or 4 weeks. These doses were the maximum tolerable doses in respective carcinogenicity studies. Mouse dose groups were further subdivided into two arms designated as either BrdU or 5-ethynyl-2′-deoxyuridine (EdU). The rat 2- and 4-week dose groups were only evaluated with BrdU. Alzet osmotic pumps (Model 2001 at ~1.0 µl/h for mice and Model 2ML1 at ~10.0 µl/h for rats) were filled with 20 mg/ml BrdU in 0.9% saline, 20 mg/ml EdU in 0.9% saline, or 0.9% saline. The saline had a pH between 7.4 and 7.6. The filled pumps were placed in sterile 0.9% saline at 37°C for ~4 h prior to implantation. Seven days prior to sacrifice, the mice were anesthetized with isoflurane (Anaquest, Madison, WI), and primed osmotic pumps were implanted subcutaneously. Animals were euthanized by carbon dioxide anesthesia followed by exsanguination.
Hepatic EC proliferation using BrdU and IHC. Livers were collected from BrdU-treated mice and rats and fixed in 10% neutral buffered formalin for 24 h, routinely processed, and embedded in paraffin. ECs were labeled using anti-vascular endothelial growth factor receptor 2 (VEGFR2) IHC. Proliferating cells were identified via anti-BrdU IHC. Antigen retrieval was done with Borg (BioCare, Concord, CA) using high heat and pressure followed by an avidin-bi-otin block (Dako, Carpinteria, CA), protein block (Dako), anti-VEGFR2 (Cell Signal, Danvers, MA), goat antirabbit secondary (Vector Laboratories, Inc., Burlingame, CA), streptavidin phosphatase (KPL, Gaithersburg, MD), and al-kaline phosphatase substrate Kit I (Vector Laboratories). This was followed by protein block (Dako), anti-BrdU (Novus, Littleton, CO), and donkey anti-sheep Alexa Fluor 488 4′,6-diamidino-2-phenylindole (DAPI) (Invitrogen, Carlsbad, CA) and mounted with Prolong Gold (Invitrogen). Proliferating ECs were measured using the iCyte Laser Scanning Cytometer (Compucyte, Westwood, MA). A scanning protocol was created on the iCyte Laser Scanning Cytometer using a mosaic scan of the entire tissue section created at 20× objective and 20-µm step size. A large portion of the tissue was then selected for high-resolution image capture with a 40× objective and 0.25-µm step size. A 405-nm laser was used for DAPI excitation, whereas Alexa Fluor 488 and Vector Red were ex-cited with a 488-nm laser. Contour thresholds were individually optimized per sample group to adjust for variations in sample preparation and scanning condi-tions. Similar to flow cytometry, scatter grams of contoured nuclei (DAPI) and VEGFR2-positive areas (ECs) demonstrated event density and location. Nuclei within VEGFR2 regions were selected as EC nuclei, and those labeling for BrdU were measured as proliferating EC nuclei.
Bone marrow and spleen EC proliferation using EdU and flow cytom-etry. For EdU evaluations, mice were implanted subcutaneously with primed osmotic pumps containing EdU on the afternoon of the day prior to study day 1. At necropsy, the right femurs were collected from mice and trimmed to allow openings at both ends. The bone marrow was then flushed immediately with 5 ml of fetal calf serum, and the suspension was placed on ice. The spleen was removed and transferred to a tube containing Royal Park Memorial Institute media and 2% fetal bovine serum and was further processed to a single-cell suspension. ECs in the single-cell suspensions were labeled and identified with the markers, antimouse CD31APC and antimouse CD45PerCP (Pharmingen-Becton Dickinson, San Diego, CA). Proliferating cells were identified using the EdU Click-IT kit (Invitrogen). The endothelial CD31+CD45– and EdU+ cell subset was calculated as the percent of total nucleated cells (TNC) as determined by flow cytometry. Subsequently, these percentages were used to determine absolute cell counts based on the TNCs from the Advia hematol-ogy analyzer (Siemens, Tarrytown, NY). The percentage of proliferating ECs
CD31+CD45–EdU+ was calculated as percent of the EdU+ cells. These percent-ages were used to determine absolute cell counts based on the EdU+ abso-lute counts. Data were collected and analyzed using a Becton and Dickinson FACSCanto II Flow Cytometer (Becton Dickinson Co., Franklin Lakes, NJ) and DIVA software.
Vitamin E Intervention Study with Serum and Liver Vitamin E Analysis. Study design—Vitamin E intervention. Female B6C3F1 mice (n = 20/group) were administered either a control diet (Dyets; AIN-76A Purified Rodent Diet, DYET no. 100000) or diet supplemented with a vitamin E (alpha-tocopherol acetate, 1000 IU/kg, AIN-76A Purified Rodent Diet, DYET no. 119694; Dyets) for 14 days. A subset of each group (n = 10) was administered pregabalin at 5000 mg/kg in diet for 14 days, continuing with their assigned diet. On the day of scheduled necropsy, mice were euthanized by carbon dioxide anesthesia followed by exsanguination. EC proliferation was determined in the liver, and vitamin E concentrations were determined in both serum and liver.
Reagent preparation. Alpha-tocopherol (vitamin E) and vitamin A ace-tate, used as the internal standard (IS), were purchased from Sigma-Aldrich (St Louis, MO). All solvents were of high pressure liquid chromatography (HPLC) grade and were purchased from J.T. Baker (Phillipsburg, NJ). All vitamin work was conducted under yellow lighting, and amber glassware was used whenever possible to avoid light-induced vitamin degradation. Stock solutions for vita-min E and the IS (vitamin A acetate) were prepared by dissolving approximate-ly 1 mg of vitamin standard in either 33/67 (v/v) combination of acetonitrile and ethanol (vitamin E) or 100% acetonitrile (vitamin A acetate). The working standards were prepared by appropriate dilution of the concentrated stock solu-tions in acetonitrile. Combined working standard solutions ranged from 0.1 to 500 µg/ml. All solutions were stored at 5°C.
Collection of tissue and serum samples. A portion of the left lateral lobe of the liver was collected at necropsy and flash frozen in liquid nitrogen. To ob-tain serum, whole blood was collected by cardiac puncture, allowed to clot, and centrifuged. All serum and liver samples were stored at –80°C until analysis.
Liver and serum preparation. Weighed portion (~40 mg) of the left lateral liver lobe or 100 ul of vitamin E standard was placed into a tissue collection microtube to which 0.9 ml of hexane, 20 µl of IS, and a 5-mm stainless steel bead (Qiagen Inc., Valencia, CA) were added. The tube was then processed in the Tissuelyser (Qiagen) benchtop homogenizer at a speed of 20 Hz for 2 min. The tubes were centrifuged, and the supernatant was removed and placed in a 96-well plate. The solvent was evaporated to dryness under a stream of nitro-gen, and the plate was placed onto the HPLC system for analysis.
To prepare for serum sample analysis, either 100 µl of serum or vitamin standard was placed in a 96-well plate followed by the addition of 10 µl of IS at 100 µg/ml and 300 µl of acetone. After placing the plate on a multitube vortex mixer for 30 s, the plate was centrifuged, and the acetone layer was removed, placed in a clean 96-well plate, and evaporated to dryness under a light stream of nitrogen. The plate was then analyzed using HPLC.
HPLC analysis and quantification. The dried samples were reconstituted in either 50 µl (serum) or 60 µl (liver) of acetonitrile and mixed, and 20 µl was injected onto the HPLC system. The HPLC consisted of an Agilent 1100 series HPLC system (Wilmington, DE), including a degasser (Model no. G1379A), a quaternary pump (Model no. 1311A), a thermostated (Model no. 1367A) well plate autosampler (Model no. 1330B) maintained at 5°C, and a diode array de-tector (Model no. 1315A). Prior to UV detection, the analytes and IS were sep-arated from other sample components at room temperature on a Phenomenex Prodigy 5 µm ODS (2) column (2.0 × 150 mm, Torrance, CA) facilitated by a gradient mobile phase of three solvent mixtures. Solvent A consisted of 25% (v/v) tetrahydrofuran in acetonitrile, solvent B was acetonitrile, and solvent C contained 1% (v/v) methanol in water. The flow rate was maintained at 0.5 ml/min. A gradient system was utilized with an initial mobile phase composition of 90%/10% (v/v) solvent B/solvent C. After holding the initial mobile phase composition for 1 min, a linear gradient was applied to obtain 100% solvent B in 1 min. After holding for 1 min, the mobile phase composition was immedi-ately changed to 90%/10% (v/v) solvent A/solvent B and was held for 5 min.
VITAMIN E INHIBITS EC PROLIFERATION IN MICE 45
Dow
nloaded from https://academ
ic.oup.com/toxsci/article/128/1/42/1637707 by guest on 04 February 2022
The gradient was then changed to 100% solvent A and held for 3 min. The col-umn was then returned to original conditions for 3 min of re-equilibration. The IS (vitamin A acetate) was detected at a wavelength of 325 nm, and vitamin E was detected at 285 nm.
Standard curves for vitamin E were constructed by plotting the ratio of ana-lyte: (vitamin E) peak areas to IS (vitamin A acetate) peak areas versus fortified concentration over the range of 0.10–500 µg/mg. Slope and intercept were cal-culated using a 1/×2 weighted linear regression. Accuracy and precision were calculated by analyzing three sets of quality control standards representing low, mid, and high concentrations of the standard curve.
Determination of pregabalin plasma concentraion in satellite animals. Five female mice received 5000 mg/kg pregabalin, and an additional five fe-male mice received 5000 mg/kg pregabalin and 1000 IU/kg vitamin E for 14 days for the determination of pregabalin concentration levels. Both pregabalin and vitamin E were administered in diet. Blood samples for plasma drug con-centration analysis were collected within 3 h after the start of the light cycle by cardiocentesis on day 15 using K
2EDTA as an anticoagulant. Approximately
0.5–1.0 ml of blood was collected from each animal. Blood samples were centrifuged at approximately 4°C and stored in plastic tubes at ≤ –20°C until analyzed. Plasma concentrations of pregabalin were determined using a vali-dated LC-MS/MS (API 4000) method with a limit of quantitation of 0.100 µg/ml. Data were derived using Watson Version 7.2 for generation of regression curves, quantitation of plasma concentration, and statistical calculations.
RESULTS
Analysis of tissue hypoxia. Short-term studies were con-ducted in male mice and rats with reduced atmospheric O
2
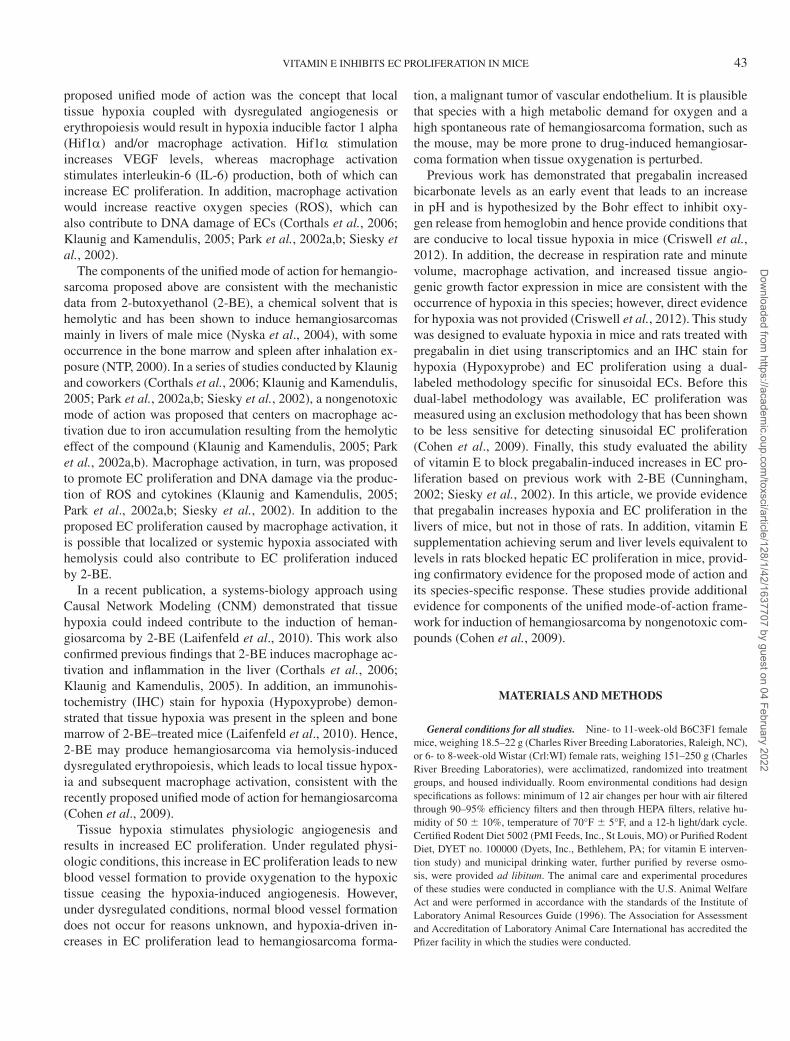
(6–8% for 90–120 min) to evaluate methods for detection of tissue hypoxia by Hypoxyprobe (100 mg/kg pimonidazole HCl) IHC and to examine transcriptional profiling employing CNM. Immunohistochemical methods detected hypoxia in the liver (Fig. 1; Table 1), spleen, and bone marrow (Table 1) after reduced O
2. Reduced O
2 also led to increased transcriptional
response to hypoxia and increased transcriptional activities of both Hif1α and Epas1 (Hif2α) in the spleen, liver, and bone marrow of mice and rats (Table 2; Supplemental tables 1–3).
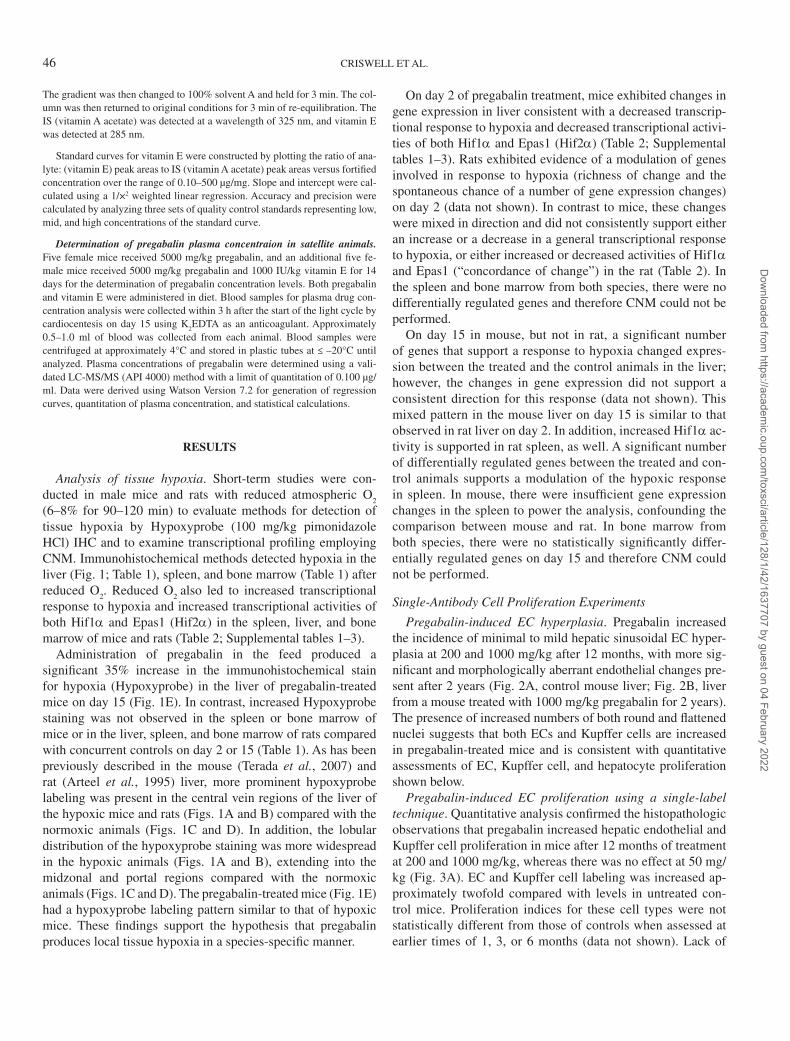
Administration of pregabalin in the feed produced a significant 35% increase in the immunohistochemical stain for hypoxia (Hypoxyprobe) in the liver of pregabalin-treated mice on day 15 (Fig. 1E). In contrast, increased Hypoxyprobe staining was not observed in the spleen or bone marrow of mice or in the liver, spleen, and bone marrow of rats compared with concurrent controls on day 2 or 15 (Table 1). As has been previously described in the mouse (Terada et al., 2007) and rat (Arteel et al., 1995) liver, more prominent hypoxyprobe labeling was present in the central vein regions of the liver of the hypoxic mice and rats (Figs. 1A and B) compared with the normoxic animals (Figs. 1C and D). In addition, the lobular distribution of the hypoxyprobe staining was more widespread in the hypoxic animals (Figs. 1A and B), extending into the midzonal and portal regions compared with the normoxic animals (Figs. 1C and D). The pregabalin-treated mice (Fig. 1E) had a hypoxyprobe labeling pattern similar to that of hypoxic mice. These findings support the hypothesis that pregabalin produces local tissue hypoxia in a species-specific manner.
On day 2 of pregabalin treatment, mice exhibited changes in gene expression in liver consistent with a decreased transcrip-tional response to hypoxia and decreased transcriptional activi-ties of both Hif1α and Epas1 (Hif2α) (Table 2; Supplemental tables 1–3). Rats exhibited evidence of a modulation of genes involved in response to hypoxia (richness of change and the spontaneous chance of a number of gene expression changes) on day 2 (data not shown). In contrast to mice, these changes were mixed in direction and did not consistently support either an increase or a decrease in a general transcriptional response to hypoxia, or either increased or decreased activities of Hif1α and Epas1 (“concordance of change”) in the rat (Table 2). In the spleen and bone marrow from both species, there were no differentially regulated genes and therefore CNM could not be performed.
On day 15 in mouse, but not in rat, a significant number of genes that support a response to hypoxia changed expres-sion between the treated and the control animals in the liver; however, the changes in gene expression did not support a consistent direction for this response (data not shown). This mixed pattern in the mouse liver on day 15 is similar to that observed in rat liver on day 2. In addition, increased Hif1α ac-tivity is supported in rat spleen, as well. A significant number of differentially regulated genes between the treated and con-trol animals supports a modulation of the hypoxic response in spleen. In mouse, there were insufficient gene expression changes in the spleen to power the analysis, confounding the comparison between mouse and rat. In bone marrow from both species, there were no statistically significantly differ-entially regulated genes on day 15 and therefore CNM could not be performed.
Single-Antibody Cell Proliferation Experiments
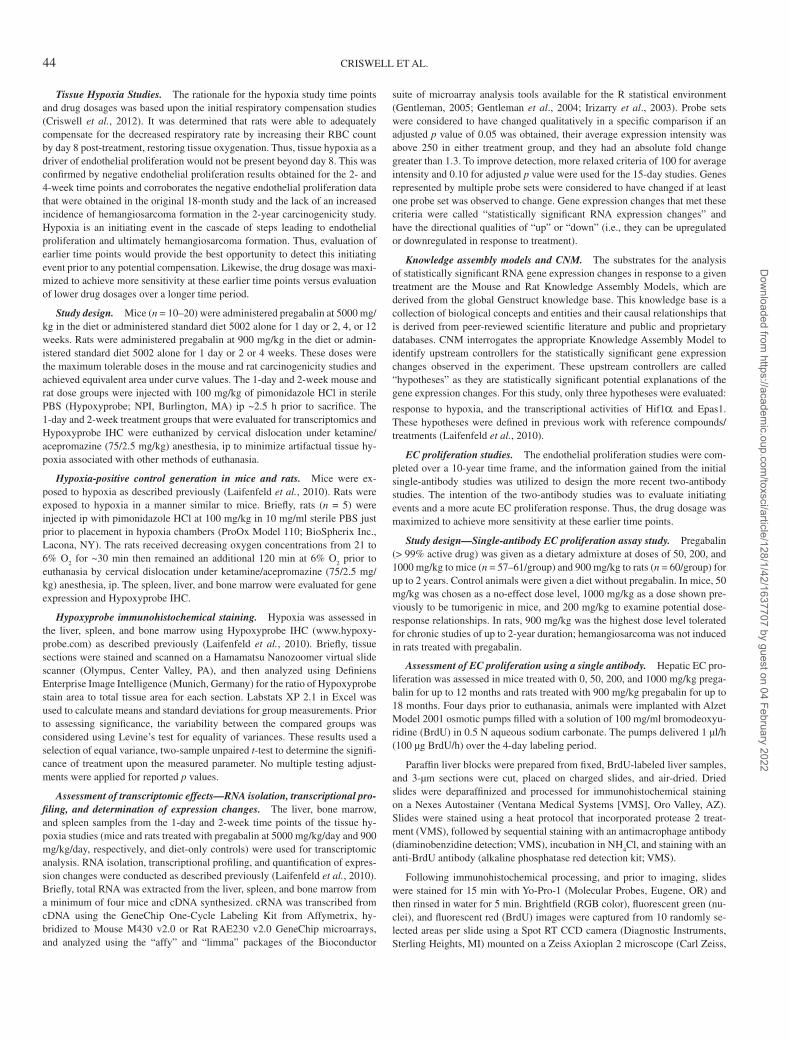
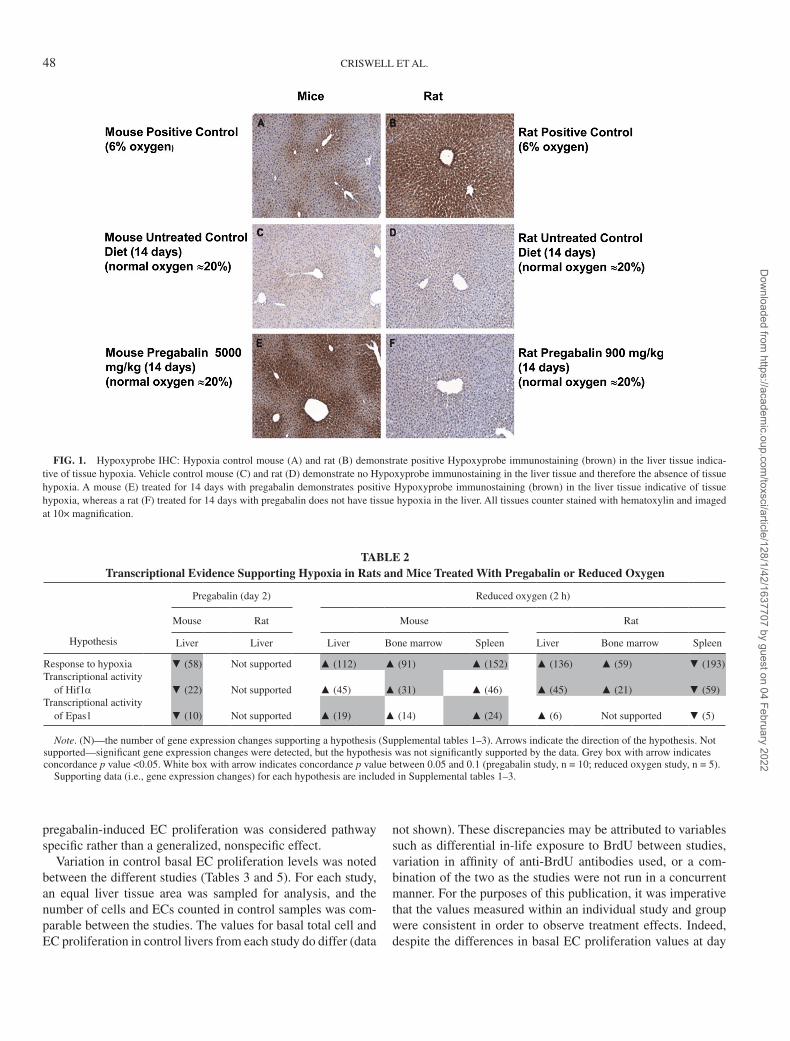
Pregabalin-induced EC hyperplasia. Pregabalin increased the incidence of minimal to mild hepatic sinusoidal EC hyper-plasia at 200 and 1000 mg/kg after 12 months, with more sig-nificant and morphologically aberrant endothelial changes pre-sent after 2 years (Fig. 2A, control mouse liver; Fig. 2B, liver from a mouse treated with 1000 mg/kg pregabalin for 2 years). The presence of increased numbers of both round and flattened nuclei suggests that both ECs and Kupffer cells are increased in pregabalin-treated mice and is consistent with quantitative assessments of EC, Kupffer cell, and hepatocyte proliferation shown below.
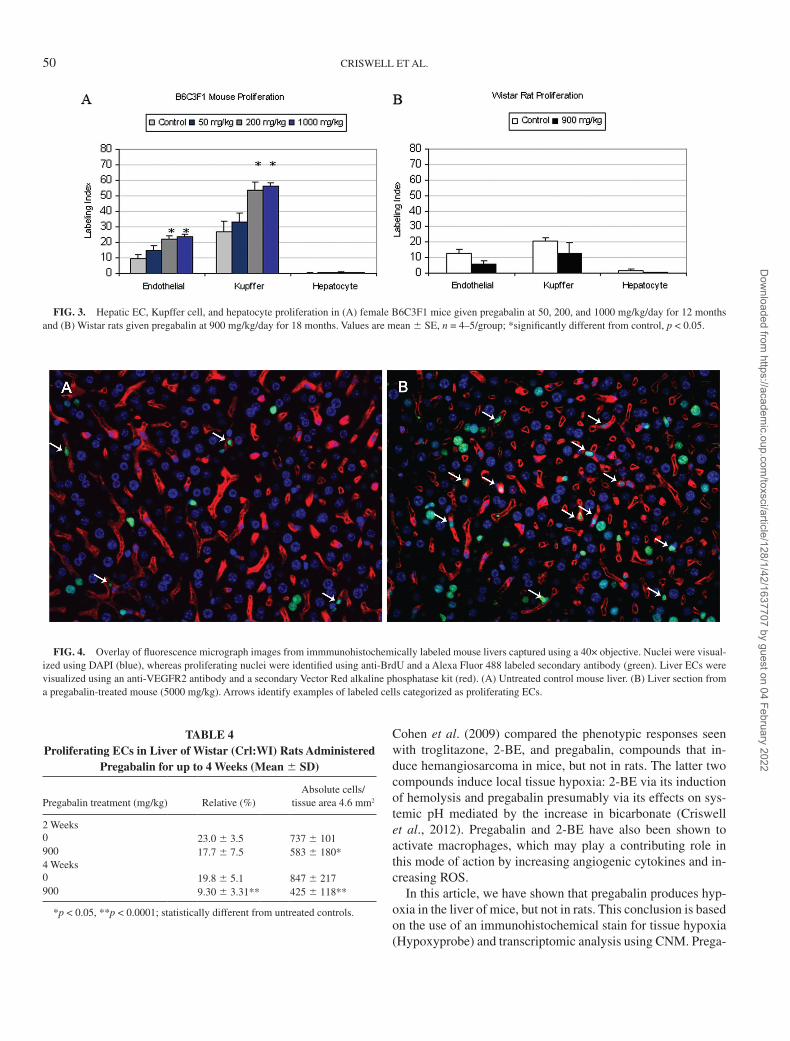
Pregabalin-induced EC proliferation using a single-label technique. Quantitative analysis confirmed the histopathologic observations that pregabalin increased hepatic endothelial and Kupffer cell proliferation in mice after 12 months of treatment at 200 and 1000 mg/kg, whereas there was no effect at 50 mg/kg (Fig. 3A). EC and Kupffer cell labeling was increased ap-proximately twofold compared with levels in untreated con-trol mice. Proliferation indices for these cell types were not statistically different from those of controls when assessed at earlier times of 1, 3, or 6 months (data not shown). Lack of
46 CRISWELL ET AL.
Dow
nloaded from https://academ
ic.oup.com/toxsci/article/128/1/42/1637707 by guest on 04 February 2022
EC-specific markers likely decreased the sensitivity of the pro-liferation assay so that treatment-induced increases were not apparent until age-related decreases in baseline levels of EC and Kupffer cell proliferation had decreased. Baseline levels of BrdU labeling were highest in Kupffer cells, moderate in ECs, and extremely low in hepatocytes (Fig. 3A), consistent with the known control proliferation rates of these cell types. In contrast to the enhanced cell proliferation stimulated by pregabalin in mice, pregabalin did not increase endothelial or Kupffer cell proliferation in rats after 18 months of treatment (Fig. 3B).
Dual-Labeled Antibody Cell Proliferation Experiments
In-life findings. There was no treatment-related mortality or adverse clinical signs observed in either rats or mice. Pregaba-lin-treated rats had decreases in body weight and body weight gain, whereas pregabalin-treated mice had increases in body weight and body weight gain. Treatment-related increases in mean body weight (vs. control) for mice were 2.0% on day 7 and 5.7% on day 14. For rats, treatment-related decreases in mean body weight (vs. control) were 3.5% on day 7 and 8.0% on day 14. Pregabalin-treated rats also had decreased spleen weight and spleen-to-body weight ratios. Pregabalin-treated rats and mice had minimal decreases in mean weekly food con-sumption. In-life data are not shown.
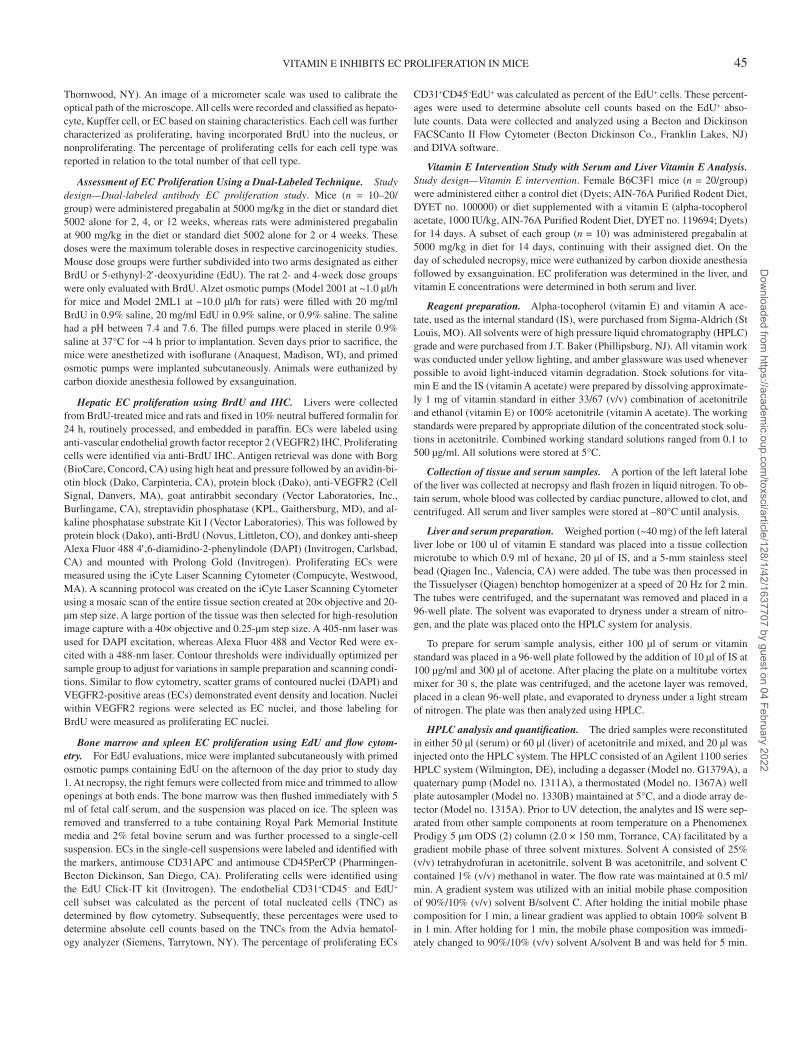
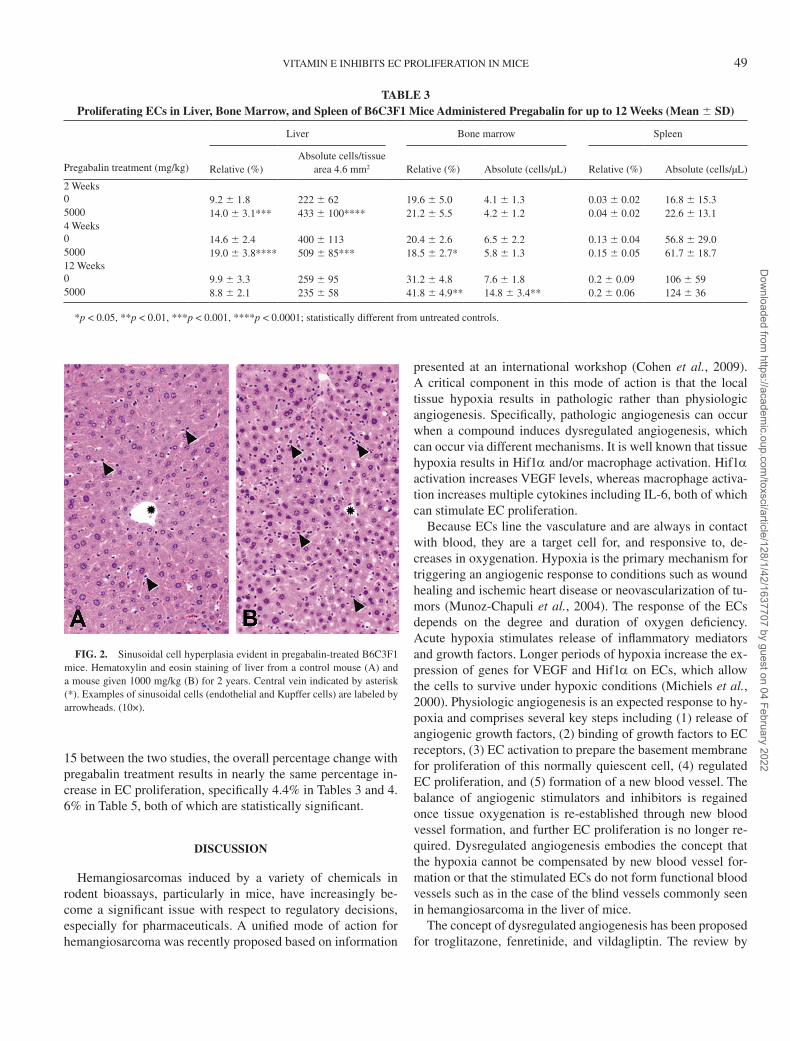
Analysis of EC proliferation. The number of relative and ab-solute proliferating ECs in the liver was significantly increased after 2 and 4 weeks of pregabalin administration (but not at 12 weeks), and increased in the bone marrow at 12 weeks in mice (Fig. 4; Table 3). In the liver at the 2-week time point, signifi-
cant 53 and 95% increases were observed in the relative and ab-solute numbers, respectively, of proliferating ECs, whereas at 4 weeks the cell proliferation was attenuated but still significant-ly elevated (30 and 27%, respectively). In the spleen and bone marrow, there were no changes in absolute proliferating ECs after 2 and 4 weeks of pregabalin administration, and a slight reduction (9%) in the number of relative proliferating ECs in the bone marrow at 4 weeks. After 12 weeks, the numbers of relative and absolute proliferating ECs were increased in the bone marrow (34 and 95% increase relative to controls, re-spectively). Absolute proliferating ECs at 12 weeks were 23% higher in the spleen of pregabalin-treated mice compared with that of controls although this change was not statistically sig-nificant. Total numbers of ECs in the spleen were also increased in these two studies following 2, 4, and 12 weeks of pregabalin administration, whereas total numbers of ECs in the bone mar-row were increased only after 12 weeks. Compared across tis-sues, the relative number of proliferating ECs was much greater in the bone marrow (~20–30%) than in the spleen (0.03–0.2%) (Table 3).
In the livers of pregabalin-treated rats, the absolute number of proliferating ECs decreased by 21% at 2 weeks, and there was a 53 and 50% decrease in the relative and absolute numbers of proliferating ECs by 4 weeks, respectively (Table 4). Due to overlap of cell populations in the flow cytometry data plots, the EC population could not be accurately counted; hence, evalu-ation of EC proliferation in the spleen and bone marrow was not possible.
Vitamin E intervention. Prestudy assessments confirmed that vitamin E levels were approximately twofold and fivefold low-er in mouse serum and liver, respectively, compared with levels in rats (data not shown). This is consistent with previously re-ported values (Siesky et al., 2002). Initial studies demonstrated that mouse serum and liver vitamin E levels could be increased by feeding mice a diet supplemented with 1000 IU/kg vitamin E for 14 days and had no adverse clinical pathology (serum) or histopathology (liver) findings (data not shown).
Pregabalin was well tolerated with increases in body weight and food consumption in animals that received pregabalin sup-plemented with vitamin E. Mean plasma concentrations of pre-gabalin were 87.4 and 56.0 µg/ml in pregabalin/control diet and pregabalin/vitamin E supplemented diet groups, respectively. Vitamin E supplementation increased vitamin E concentra-tions in serum and liver from 2.7- to 4.4-fold of their respective control values (Table 5), levels that are similar to those of rats (Siesky et al., 2002).
Administration of pregabalin for 14 days caused a statistic-ally significant increase of 26 and 23% in the proliferation of relative and absolute liver ECs, respectively. Coadministration of vitamin E inhibited the pregabalin-induced increase of EC proliferation observed in liver on day 15 (Table 5). Because dietary administration of vitamin E alone had no effect on baseline levels of hepatic EC proliferation compared with non-supplemented control diet, the ability of vitamin E to inhibit
TABLE 1 Quantification of Hypoxyprobe Staining in Tissues of Mouse and Rat Following Either 1 or 14 Days of Pregabalin Administration
in Diet and in Tissues of Hypoxia Controls (Mean 6 SD)
Dose (mg/kg) Liver (stain ratio)a
Spleen (stain ratio)a
Bone marrow (stain ratio)a
Mouse—day 20 0.165 6 0.083 0.017 6 0.017 0.044 6 0.0185000 0.126 6 0.065 0.020 6 0.016 0.030 6 0.009*Mouse—day 150 0.450 6 0.122 0.053 6 0.033 0.087 6 0.0345000 0.609 6 0.141* 0.081 6 0.055 0.087 6 0.026Rat—day 20 0.438 6 0.175 0.177 6 0.084 0.515 6 0.184900 0.404 6 0.159 0.197 6 0.126 0.520 6 0.147Rat—day 150 0.519 6 0.329 0.227 6 0.178 0.405 6 0.257900 0.533 6 0.313 0.223 6 0.161 0.363 6 0.208Hypoxia controlsHypoxic mice 0.670 6 0.085 0.304 6 0.071 0.600 6 0.065Hypoxic rats 0.948 6 0.028 0.894 6 0.064 0.701 6 0.095
aStain ratio: Stain area/tissue area measured in pixels and averaged by group.
*p < 0.05; statistically different from untreated controls.
VITAMIN E INHIBITS EC PROLIFERATION IN MICE 47
Dow
nloaded from https://academ
ic.oup.com/toxsci/article/128/1/42/1637707 by guest on 04 February 2022
pregabalin-induced EC proliferation was considered pathway specific rather than a generalized, nonspecific effect.
Variation in control basal EC proliferation levels was noted between the different studies (Tables 3 and 5). For each study, an equal liver tissue area was sampled for analysis, and the number of cells and ECs counted in control samples was com-parable between the studies. The values for basal total cell and EC proliferation in control livers from each study do differ (data
not shown). These discrepancies may be attributed to variables such as differential in-life exposure to BrdU between studies, variation in affinity of anti-BrdU antibodies used, or a com-bination of the two as the studies were not run in a concurrent manner. For the purposes of this publication, it was imperative that the values measured within an individual study and group were consistent in order to observe treatment effects. Indeed, despite the differences in basal EC proliferation values at day
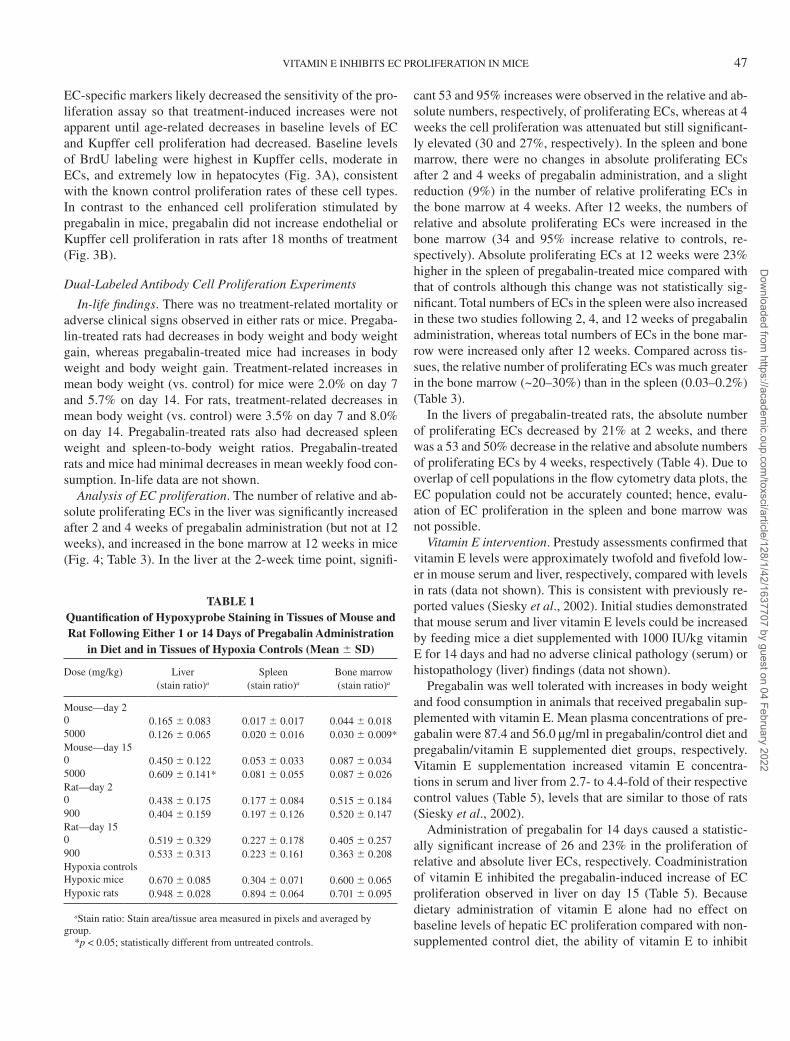
TABLE 2Transcriptional Evidence Supporting Hypoxia in Rats and Mice Treated With Pregabalin or Reduced Oxygen
Hypothesis
Pregabalin (day 2) Reduced oxygen (2 h)
Mouse Rat Mouse Rat
Liver Liver Liver Bone marrow Spleen Liver Bone marrow Spleen
Response to hypoxia ▼ (58) Not supported ▲ (112) ▲ (91) ▲ (152) ▲ (136) ▲ (59) ▼ (193)Transcriptional activity
of Hif1α ▼ (22) Not supported ▲ (45) ▲ (31) ▲ (46) ▲ (45) ▲ (21) ▼ (59)Transcriptional activity
of Epas1 ▼ (10) Not supported ▲ (19) ▲ (14) ▲ (24) ▲ (6) Not supported ▼ (5)
Note. (N)—the number of gene expression changes supporting a hypothesis (Supplemental tables 1–3). Arrows indicate the direction of the hypothesis. Not supported—significant gene expression changes were detected, but the hypothesis was not significantly supported by the data. Grey box with arrow indicates concordance p value <0.05. White box with arrow indicates concordance p value between 0.05 and 0.1 (pregabalin study, n = 10; reduced oxygen study, n = 5).
Supporting data (i.e., gene expression changes) for each hypothesis are included in Supplemental tables 1–3.
FIG. 1. Hypoxyprobe IHC: Hypoxia control mouse (A) and rat (B) demonstrate positive Hypoxyprobe immunostaining (brown) in the liver tissue indica-tive of tissue hypoxia. Vehicle control mouse (C) and rat (D) demonstrate no Hypoxyprobe immunostaining in the liver tissue and therefore the absence of tissue hypoxia. A mouse (E) treated for 14 days with pregabalin demonstrates positive Hypoxyprobe immunostaining (brown) in the liver tissue indicative of tissue hypoxia, whereas a rat (F) treated for 14 days with pregabalin does not have tissue hypoxia in the liver. All tissues counter stained with hematoxylin and imaged at 10× magnification.
48 CRISWELL ET AL.
Dow
nloaded from https://academ
ic.oup.com/toxsci/article/128/1/42/1637707 by guest on 04 February 2022
15 between the two studies, the overall percentage change with pregabalin treatment results in nearly the same percentage in-crease in EC proliferation, specifically 4.4% in Tables 3 and 4. 6% in Table 5, both of which are statistically significant.
DISCUSSION
Hemangiosarcomas induced by a variety of chemicals in rodent bioassays, particularly in mice, have increasingly be-come a significant issue with respect to regulatory decisions, especially for pharmaceuticals. A unified mode of action for hemangiosarcoma was recently proposed based on information
presented at an international workshop (Cohen et al., 2009). A critical component in this mode of action is that the local tissue hypoxia results in pathologic rather than physiologic angiogenesis. Specifically, pathologic angiogenesis can occur when a compound induces dysregulated angiogenesis, which can occur via different mechanisms. It is well known that tissue hypoxia results in Hif1α and/or macrophage activation. Hif1α activation increases VEGF levels, whereas macrophage activa-tion increases multiple cytokines including IL-6, both of which can stimulate EC proliferation.
Because ECs line the vasculature and are always in contact with blood, they are a target cell for, and responsive to, de-creases in oxygenation. Hypoxia is the primary mechanism for triggering an angiogenic response to conditions such as wound healing and ischemic heart disease or neovascularization of tu-mors (Munoz-Chapuli et al., 2004). The response of the ECs depends on the degree and duration of oxygen deficiency. Acute hypoxia stimulates release of inflammatory mediators and growth factors. Longer periods of hypoxia increase the ex-pression of genes for VEGF and Hif1α on ECs, which allow the cells to survive under hypoxic conditions (Michiels et al., 2000). Physiologic angiogenesis is an expected response to hy-poxia and comprises several key steps including (1) release of angiogenic growth factors, (2) binding of growth factors to EC receptors, (3) EC activation to prepare the basement membrane for proliferation of this normally quiescent cell, (4) regulated EC proliferation, and (5) formation of a new blood vessel. The balance of angiogenic stimulators and inhibitors is regained once tissue oxygenation is re-established through new blood vessel formation, and further EC proliferation is no longer re-quired. Dysregulated angiogenesis embodies the concept that the hypoxia cannot be compensated by new blood vessel for-mation or that the stimulated ECs do not form functional blood vessels such as in the case of the blind vessels commonly seen in hemangiosarcoma in the liver of mice.
The concept of dysregulated angiogenesis has been proposed for troglitazone, fenretinide, and vildagliptin. The review by
FIG. 2. Sinusoidal cell hyperplasia evident in pregabalin-treated B6C3F1 mice. Hematoxylin and eosin staining of liver from a control mouse (A) and a mouse given 1000 mg/kg (B) for 2 years. Central vein indicated by asterisk (*). Examples of sinusoidal cells (endothelial and Kupffer cells) are labeled by arrowheads. (10×).
TABLE 3Proliferating ECs in Liver, Bone Marrow, and Spleen of B6C3F1 Mice Administered Pregabalin for up to 12 Weeks (Mean 6 SD)
Pregabalin treatment (mg/kg)
Liver Bone marrow Spleen
Relative (%)Absolute cells/tissue
area 4.6 mm2 Relative (%) Absolute (cells/µL) Relative (%) Absolute (cells/µL)
2 Weeks0 9.2 6 1.8 222 6 62 19.6 6 5.0 4.1 6 1.3 0.03 6 0.02 16.8 6 15.35000 14.0 6 3.1*** 433 6 100**** 21.2 6 5.5 4.2 6 1.2 0.04 6 0.02 22.6 6 13.14 Weeks0 14.6 6 2.4 400 6 113 20.4 6 2.6 6.5 6 2.2 0.13 6 0.04 56.8 6 29.05000 19.0 6 3.8**** 509 6 85*** 18.5 6 2.7* 5.8 6 1.3 0.15 6 0.05 61.7 6 18.712 Weeks0 9.9 6 3.3 259 6 95 31.2 6 4.8 7.6 6 1.8 0.2 6 0.09 106 6 595000 8.8 6 2.1 235 6 58 41.8 6 4.9** 14.8 6 3.4** 0.2 6 0.06 124 6 36
*p < 0.05, **p < 0.01, ***p < 0.001, ****p < 0.0001; statistically different from untreated controls.
VITAMIN E INHIBITS EC PROLIFERATION IN MICE 49
Dow
nloaded from https://academ
ic.oup.com/toxsci/article/128/1/42/1637707 by guest on 04 February 2022
Cohen et al. (2009) compared the phenotypic responses seen with troglitazone, 2-BE, and pregabalin, compounds that in-duce hemangiosarcoma in mice, but not in rats. The latter two compounds induce local tissue hypoxia: 2-BE via its induction of hemolysis and pregabalin presumably via its effects on sys-temic pH mediated by the increase in bicarbonate (Criswell et al., 2012). Pregabalin and 2-BE have also been shown to activate macrophages, which may play a contributing role in this mode of action by increasing angiogenic cytokines and in-creasing ROS.
In this article, we have shown that pregabalin produces hyp-oxia in the liver of mice, but not in rats. This conclusion is based on the use of an immunohistochemical stain for tissue hypoxia (Hypoxyprobe) and transcriptomic analysis using CNM. Prega-
FIG. 3. Hepatic EC, Kupffer cell, and hepatocyte proliferation in (A) female B6C3F1 mice given pregabalin at 50, 200, and 1000 mg/kg/day for 12 months and (B) Wistar rats given pregabalin at 900 mg/kg/day for 18 months. Values are mean 6 SE, n = 4–5/group; *significantly different from control, p < 0.05.
TABLE 4Proliferating ECs in Liver of Wistar (Crl:WI) Rats Administered
Pregabalin for up to 4 Weeks (Mean 6 SD)
Pregabalin treatment (mg/kg) Relative (%)Absolute cells/
tissue area 4.6 mm2
2 Weeks0 23.0 6 3.5 737 6 101900 17.7 6 7.5 583 6 180*4 Weeks0 19.8 6 5.1 847 6 217900 9.30 6 3.31** 425 6 118**
*p < 0.05, **p < 0.0001; statistically different from untreated controls.
FIG. 4. Overlay of fluorescence micrograph images from immmunohistochemically labeled mouse livers captured using a 40× objective. Nuclei were visual-ized using DAPI (blue), whereas proliferating nuclei were identified using anti-BrdU and a Alexa Fluor 488 labeled secondary antibody (green). Liver ECs were visualized using an anti-VEGFR2 antibody and a secondary Vector Red alkaline phosphatase kit (red). (A) Untreated control mouse liver. (B) Liver section from a pregabalin-treated mouse (5000 mg/kg). Arrows identify examples of labeled cells categorized as proliferating ECs.
50 CRISWELL ET AL.
Dow
nloaded from https://academ
ic.oup.com/toxsci/article/128/1/42/1637707 by guest on 04 February 2022

balin’s persistent decrease in respiration rate and weighted mi-nute volume, coupled with an increase in blood pH, was previ-ously hypothesized to induce tissue hypoxia in mice (Criswell et al., 2012). The current study confirms that liver hypoxia is present in mice following pregabalin administration in diet. It was also previously hypothesized that rats adapt and recover from respiratory suppression more effectively than mice be-cause minute volumes return to normal and weighted minute volumes remain unchanged from untreated controls. Current data show that this difference in adaptation is likely reflected in the different transcriptional responses to pregabalin treatment in these species.
Hypoxia was confirmed in mouse liver after 2 weeks of pre-gabalin treatment using Hypoxyprobe. There was no evidence of hypoxia using Hypoxyprobe in the liver, bone marrow, or spleen of rats treated with pregabalin for 24 h or 2 weeks. Tran-scriptomic analysis also provided evidence of hypoxia signal-ing following 24 h of pregabalin treatment in mice and dem-onstrated that rats adapt better to hypoxia than mice. In mouse liver, the decrease in the transcriptional response to hypoxia and the decrease in the Hif1α and Epas1 transcriptional activ-ity on day 2 are consistent with a response in healthy mice to prolonged hypoxia (12–24 h) that leads to Hif1α desensitiza-tion (Ginouves et al., 2008; Stroka et al., 2001). In these stud-ies in healthy mice, Hif1α activity was increased maximally in tissues between 1 and 6 h of reduced O
2, and Hif1α activity
decreased thereafter. The decreased response to hypoxia and decreased Hif1α activity on day 2 in pregabalin-treated mice provide evidence that the mice are responding to changes in oxygen sometime during the first 24 h of exposure. The im-pact on respiration rate (> 40% reductions) and minute volumes (> 35% reductions; Criswell et al., 2012) on day 2 was severe, and it was therefore not surprising that animals could not sus-tain this level of accommodation long term. Following 14 days of treatment with pregabalin in mice, genes involved in the hypoxia response were still differentially regulated in the liver, although, with no consistent direction. Presence of hypoxia in mouse liver on day 15 based on Hypoxyprobe staining may indicate a dysregulated molecular response to persistent liver hypoxia. Chronically sustained levels of hypoxia in pregaba-lin-treated mice is suggested by continued decreases in minute
volume and weighted minute volumes following 22 months of pregabalin in diet (Criswell et al., 2012).
After 1 day of pregabalin treatment in the rat, there were a significant number of genes that changed between the treated and control groups, supporting a response to hypoxia in the liv-er, but these genes did not support a clear increase or decrease. This could reflect a situation where the rat is both responding to and compensating for hypoxia. In fact, on day 2, there was no local tissue hypoxia in the rat liver based on Hypoxyprobe staining, and by day 15, there was no evidence for a hypoxic re-sponse in rat liver based on both CNM and Hypoxyprobe stain-ing. These results suggest that on day 15, pregabalin-treated rats are no longer hypoxic and are more resistant to the respira-tory suppression compared with mice, which is consistent with physiological data showing that rats recover from respiratory suppression by day 15 (Criswell et al., 2012). Based on the totality of the data, pregabalin produces species-specific local-ized tissue hypoxia. Moreover, the species differences noted in this study cannot be explained by exposure, as the level of pre-gabalin in rat plasma was approximately fivefold higher in rats than in mice at the end of this experiment.
Additional work presented in this article included the devel-opment of a direct method to measure EC proliferation. A dual-labeled EC proliferation assay utilizing sinusoidal EC-specific markers and automated analysis including laser scanning cy-tometry and flow cytometry provided a level of sensitivity and accuracy not previously available. Because of this, pregabalin’s effects on EC proliferation were observable and reproducible in short-term studies. In mice, an increase in liver EC proliferation was demonstrated at 2 and 4 weeks of pregabalin treatment and an increase in bone marrow EC proliferation at 3 months. These findings are consistent with those reported with troglitazone, which increased EC proliferation as early as 1 month when a dual-label method was used (Kakiuchi-Kiyota et al., 2010). In-creased EC proliferation in bone marrow could contribute to hemangiosarcoma in distant organs; however, a migration of bone marrow–derived ECs to distant organs has not been evalu-ated. Additional data that demonstrate decreased EC prolifera-tion in rats administered pregabalin using the more sensitive dual-label assay further strengthen the conclusion for a species-specific effect.
TABLE 5Serum and Liver Vitamin E Levels and the Effects on Pregabalin-Induced Liver EC Proliferation Following 2-Week Drug
Administration in Diet (Mean 6 SD)
Pregabalin treatment (mg/kg)
Vitamin E treatment (IU/kg)
Serum vitamin E (µg/ml)
Liver vitamin E (µg/mg tissue)
Proliferating EC relative (%)
Proliferating EC absolute cells/tissue area 4.6 mm2
0 0 5.96 ± 2.11 0.44 ± 0.06 20.1 ± 3.3 589 ± 1115000 0 6.69 ± 0.93 0.48 ± 0.16 24.7 ± 5.13* 745 ± 136*0 1000 19.96 ± 2.86** 1.96 ± 0.76** 20.2 ± 4.4 588 ± 1445000 1000 18.36 ± 5.07** 1.65 ± 0.65** 21.7 ± 4.3 610 ± 146
*p < 0.05, **p < 0.01; statistically greater than untreated controls.
VITAMIN E INHIBITS EC PROLIFERATION IN MICE 51
Dow
nloaded from https://academ
ic.oup.com/toxsci/article/128/1/42/1637707 by guest on 04 February 2022
Based on labeling indices of hepatic ECs measured in control animals in investigational studies of mice and rats, EC turnover is 2–3 times higher in mice than in rats and 10–80 times higher in mice than in humans. The species difference in basal endo-thelial turnover correlates roughly with the species difference in spontaneous hemangiosarcoma incidence, with the highest turnover (mice) resulting in the highest background incidence (Chandra and Frith, 1992a,b; Giknis and Clifford, 2005; Hase-man et al., 1988, 1999; Poteracki and Walsh, 1998; US National Cancer Institute–SEER). The earliest assessments of pregaba-lin’s effects on EC proliferation were conducted when sinus-oidal EC markers were not commercially available. Therefore, ECs were identified morphologically and in conjunction with Kupffer cell labeling to exclude these mononuclear cells from the assessments. Under these conditions, pregabalin treatment increased EC proliferation rates above the elevated background in mice in a dose-dependent manner, whereas EC prolifer-ation rates were unaffected in rats, a species not sensitive to production of hemangiosarcoma by pregabalin. However, this response was seen only at 12 months and not at earlier time
points. Pregabalin also increased the number of Kupffer cells in the livers of treated mice, which is consistent with the accumu-lation of macrophages in bone marrow and spleen of the same animals (Criswell et al., 2012). Increased sensitivity with the dual-label assay described here has allowed confirmation that pregabalin increases EC proliferation in mice within weeks of drug administration in diet. Additionally, the single-label assay demonstrates that this increase in EC proliferation is still ob-served at chronic time points. It is not surprising that increased endothelial proliferation was not detected at the 12-week time point in mice even with the more sensitive and specific dual-antibody method. Waxing and waning of cell proliferation in the target organ/cell are not uncommon events during tumor initiation/promotion. For example, in liver carcinogenesis, pre-cancerous foci proliferate quite rapidly during the first weeks after initiation, and once the population size becomes more sta-tionary, mitoses are less frequent. During the promotion phase, the proliferation rate increases again such that selected cell clones proliferate vigorously and in a synchronous way (Scher-er, 1984). This discontinuous pattern of cell proliferation is also
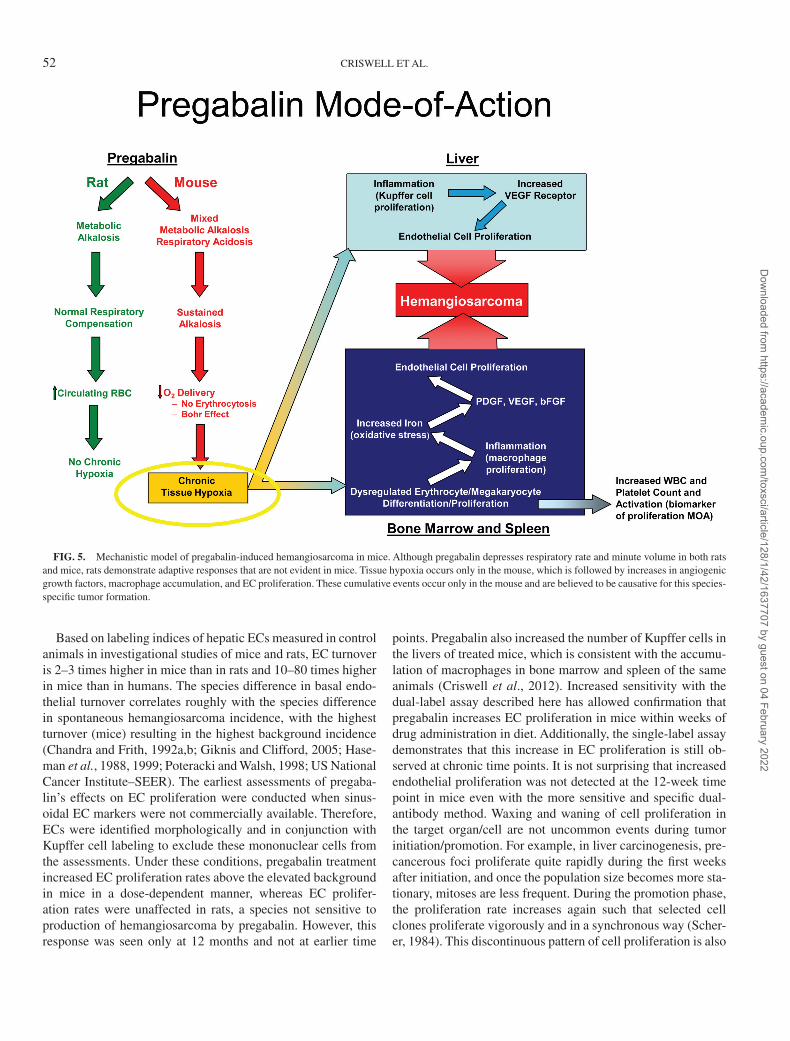
FIG. 5. Mechanistic model of pregabalin-induced hemangiosarcoma in mice. Although pregabalin depresses respiratory rate and minute volume in both rats and mice, rats demonstrate adaptive responses that are not evident in mice. Tissue hypoxia occurs only in the mouse, which is followed by increases in angiogenic growth factors, macrophage accumulation, and EC proliferation. These cumulative events occur only in the mouse and are believed to be causative for this species-specific tumor formation.
52 CRISWELL ET AL.
Dow
nloaded from https://academ
ic.oup.com/toxsci/article/128/1/42/1637707 by guest on 04 February 2022
seen with numerous nongenotoxic agents. Early maximal in-creases in cell proliferation are seen during the first 1–2 weeks following compound exposure, with cell proliferation attenuat-ing to near-control levels after 1–3 months of treatment. (Biegel et al., 1995; Marsman et al., 1988; Obourn et al., 1997).
Data described in the companion article provide a detailed description of key components of a generalized mode of ac-tion for nongenotoxic hemangiosarcoma formation in mice (Criswell et al., 2012). The proposed mode of action for prega-balin’s mouse-specific increase in hemangiosarcomas is shown in Fig. 5. Briefly summarized, pregabalin produced increased serum bicarbonate, increased blood pH, decreased respiratory rate, decreased minute volume, increased venous oxygen sat-uration, and increased platelet count and platelet activation in mice. In mouse liver, pregabalin increased Kupffer cell and EC proliferation and also up-regulated VEGFR2. In bone marrow and spleen, dysregulated erythropoiesis and megakaryopoiesis resulted in increased VEGF and basic fibroblast growth factor and in increased numbers of hemosiderin-laden macrophages and erythrophages. Activated macrophages and iron accumula-
tion are consistent with inflammation and increased oxidative stress. Although effects on bicarbonate, respiration rate, and mi-nute volume were seen in both rats and mice, rats were able to correct minute volumes with time, and all other effects were observed only in mice, demonstrating a species-specific mech-anism.
Fully understanding the mode of action of xenobiotics on nongenotoxic tumorigenesis is complex. Increased proliferation of the target cell type or hyperplasia is an accepted hallmark of nongenotoxic tumorigenesis. Conduct of an intervention study that blocks formation of tumors or increased proliferation of the target cell would provide evidence that further strengthens the proposed mode of action. However, the execution of suc-cessful intervention studies is exceedingly rare and has only been reported with endocrine tumors where singular hormo-nal drivers of organ-specific hyperplasia are well defined. For example, elevated thyroid-stimulating hormone (TSH) induces thyroid tumors, and increased luteinizing hormone (LH) con-centrations result in stimulation of Leydig cells, which also produces an increased incidence of hyperplasia and adeno-
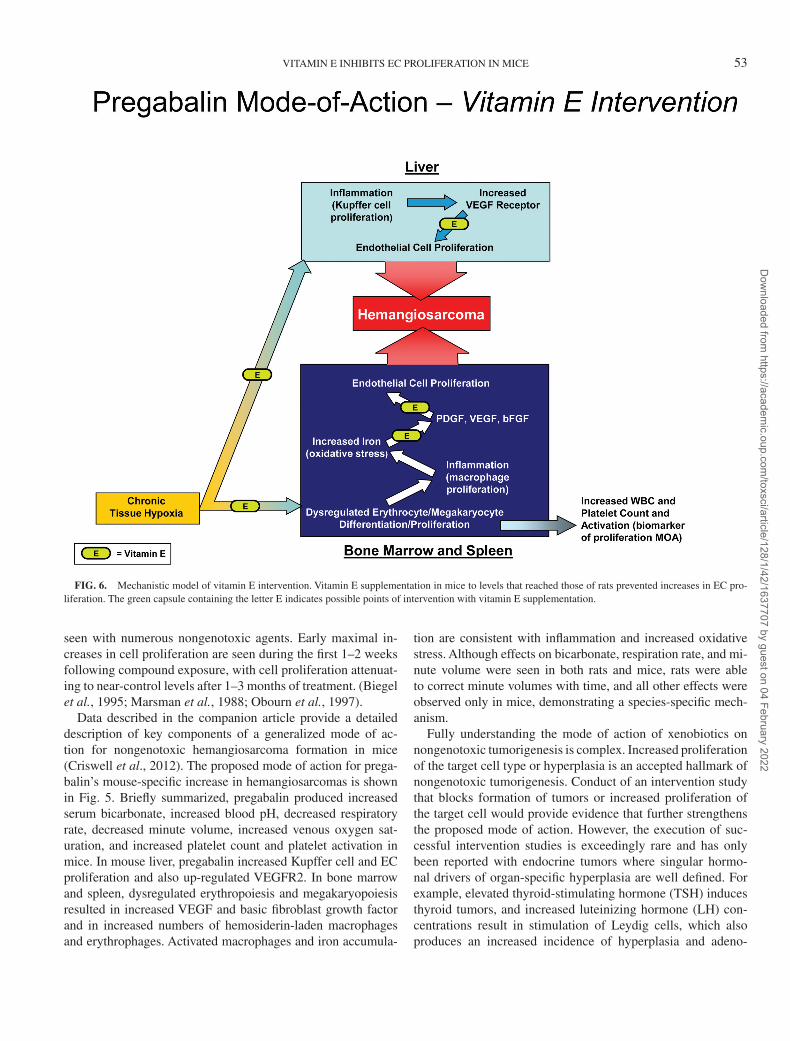
FIG. 6. Mechanistic model of vitamin E intervention. Vitamin E supplementation in mice to levels that reached those of rats prevented increases in EC pro-liferation. The green capsule containing the letter E indicates possible points of intervention with vitamin E supplementation.
VITAMIN E INHIBITS EC PROLIFERATION IN MICE 53
Dow
nloaded from https://academ
ic.oup.com/toxsci/article/128/1/42/1637707 by guest on 04 February 2022

mas in rats. In both cases, rodents have been characterized as containing endocrine tissue that is “highly sensitive” and not characteristic of the response in humans. In the case of Leydig tumors, administration of testosterone prevented the formation of Leydig adenomas; in the case of thyroid tumors, administra-tion of thyroxine prevented the formation of thyroid follicular adenomas. Both examples demonstrated the negative feedback on the pituitary gland, which lowered circulating levels of LH and TSH, respectively, and prevented the induction of tumors by a xenobiotic (Capen, 2001).
Designing an intervention study for the proposed mechanism of action of pregabalin is more difficult because angiogenesis is controlled by greater than 20 angiogenic growth factors and over 300 inhibitors (http://www.angio.org/understanding/fact.php). Therefore, designing a single-agent intervention study for pregabalin such as the work done studying thyroid or tes-tis tumorigenesis is problematic. The proposed mode of action for pregabalin (Fig. 5) shows a process including multiple ef-fects that contribute to tissue hypoxia, the contribution of in-flammatory macrophages, and the elevations of growth factors known to stimulate EC proliferation. Pregabalin produces a mouse-specific increase in blood pH (Criswell et al., 2012). Systemic alkalosis has been associated with a variety of ma-lignant neoplasms and is believed to enhance tumorigenesis. In contrast, systemic acidosis has been correlated with tumor control and regression (reviewed by Harguinday, 1982; Har-guinday and Gragoe, 1992; Harguinday et al., 1995). It has been shown that ammonium chloride administration lowered systemic pH and inhibited the growth of solid tumors and leu-kemia in mice (Anghileri, 1975). Additionally, addition of hy-drochloric acid to feed increased the rate of regression of sub-cutaneously implanted sarcoma 180 in mice (Harguinday et al., 1979, 1995). Effects on EC proliferation in mice and rats ad-ministered feed supplemented with bicarbonate or ammonium chloride were previously evaluated (data not shown). Although animals showed the anticipated increase or decrease in urinary pH following 2 weeks on supplemented diets, both mice and rats compensated for diet supplementation, and there was no ef-fect on systemic blood pH (data not shown). Therefore, dietary modulation of pH was not considered feasible, and alternate intervention methods were considered.
Vitamin E is a fat-soluble antioxidant that has been shown to inhibit angiogenic growth factors (Woodson et al., 2002) and inflammatory cytokines (Huey et al., 2008). These growth factors and cytokines have the ability to stimulate EC prolif-eration and could therefore contribute to hemangiosarcoma formation. Additionally, it has been shown that level of oxida-tive injury and associated cell proliferation in liver is inversely related to vitamin E levels (Siesky et al., 2002). Mice have been reported to have lower serum and liver levels of vitamin E (~2.5-fold; Siesky et al., 2002) than rats, which should make them less able to compensate when exposed to compounds that stimulate angiogenic growth factors and inflammatory cytokines.
Vitamin E also inhibits angiogenesis in vitro and in vivo via multiple mechanisms beyond its antioxidant activity including inhibition of Hif1α stabilization, reduction of Hif1α protein ac-cumulation, and suppression of transcriptional factors, decreas-ing VEGF and VEGFR expression and associated cell signal-ing pathways (Miyazawa et al., 2004; Nakagawa et al., 2004, 2007; Shibata et al., 2008). Supplementation of diet with vita-min E (2000 units/kg diet) has been reported to decrease oxida-tive stress and inhibit hepatic tumor formation in a transgenic mouse model overexpressing TGF-α (Transforming Growth Factor) and c-myc (Factor et al., 2000). Because vitamin E has been shown to modulate several of the key components in the mode of action of pregabalin-induced hemangiosarcoma for-mation (Fig. 6), dietary supplementation with vitamin E was selected as an intervention approach.
Vitamin E supplementation increased the serum and liver concentrations of vitamin E in mice to levels normally ob-served in rats. With vitamin E supplementation for 2 weeks in diet, hepatic EC proliferation in pregabalin-treated mice was not different from values in untreated control mice. Further-more, because administration of vitamin E in diet without pre-gabalin had no effect on decreasing baseline levels of hepatic EC proliferation compared with nonsupplemented control diet, the ability of vitamin E to inhibit pregabalin-induced EC prolif-eration was considered pathway specific and not a generalized, nonspecific effect.
The inhibition of pregabalin-induced increases in EC pro-liferation by vitamin E provides evidence for the proposed mode of action for the pregabalin-induced hemangiosarcomas in mice. Mice may also be more vulnerable to oxidative stress stemming from hypoxic conditions because they have been shown to have lower hepatic levels of vitamin E compared with rats (2.5-fold higher than mice) and humans (100-fold higher than mice) (Cunningham, 2002; Siesky et al., 2002). In addition, depletion of macrophages via clodronate liposomes attenuated 2-BE–induced EC proliferation, supporting the hy-pothesis that Kupffer cells play a key role in modulating he-mangiosarcoma induction by 2-BE (Kamendulis et al., 2010). 2-BE also increased Kupffer cells in a dose-dependent manner similar to pregabalin and also consistent with macrophage in-creases in bone marrow (Criswell et al., 2012). Collectively, there are many similarities in responses between pregabalin and 2-BE, all of which are consistent with the unified mode of action proposed by Cohen et al. (2009), demonstrating the importance of hypoxia, macrophages, and dysregulated angio-genesis or erythropoiesis in production of mouse-specific he-mangiosarcomas by nongenotoxic mechanisms.
CONCLUSION
Previous work has demonstrated that pregabalin increased bicarbonate levels, which leads to an increase in pH and is hy-pothesized by the Bohr effect to inhibit oxygen release from
54 CRISWELL ET AL.
Dow
nloaded from https://academ
ic.oup.com/toxsci/article/128/1/42/1637707 by guest on 04 February 2022

hemoglobin and hence provide conditions that are conducive to local tissue hypoxia in mice (Criswell et al., 2012). This article confirmed that hypoxia was present in mice treated with pregabalin using two methods: IHC and transcriptomic/pathway analysis. In addition, the local tissue hypoxia cor-related with an increased hepatic EC proliferation. Neither of these changes was evident in pregabalin-treated rats dem-onstrating that pregabalin produces local tissue hypoxia and EC proliferation in a species-specific manner. Transcriptional analysis also supports that rats, unlike mice, adapt to pregab-alin-induced hypoxia. In addition, vitamin E supplementation achieving serum and liver levels equivalent to those of rats blocked hepatic EC proliferation in mice, providing confirma-tory evidence for the proposed mode of action and its species-specific response.
SUPPLEMENTARY DATA
Supplementary data are available online at http://toxsci.oxfordjournals.org/.
FUNDING
All studies were funded by Pfizer Drug Safety Research & Development.
REFERENCES
Anghileri, L. J. (1975). Tumour growth inhibition by ammonium chloride-induced acidosis. Int. J. Clin. Pharmacol. Res. 12, 320–326.
Angiogenesis Foundation. April 27, 2012. Available at: http://www.angio.org/understanding/fact.php. Accessed May 19, 2012.
Arteel, G. E., Thurman, R. G., Yate, J. M., and Raleigh, J. A. (1995).Evidence that hypoxia markers detect oxygen gradients in liver: Pimonidazole and ret-rograde perfusion of rat liver. Br. J. Cancer 72, 889–895.
Biegel L. B., Cook, J. C., O’Connor, J. C., Aschiero, M., Arduengo, A. J., III, and Slone, T. W. (1995). Subchronic toxicity study in rats with 1-methyl-3-propylimidazole-2-thione (PTI): Effects on the thyroid. Fundam. Appl. Toxicol. 27, 185–194.
Capen, C. C. (2001). Toxic responses of the endocrine system. In Casarett & Doull’s Toxicology: The Basic Science of Poisons (C. D. Klaassen, Ed.), pp. 711–759. McGraw-Hill Publishing Company, New York, NY.
Chandra, M., and Frith, C. H. (1992a). Spontaneous neoplasms in B6C3F1 mice. Toxicol. Lett. 60, 91–98.
Chandra, M., and Frith, C. H. (1992b). Spontaneous neoplasms in aged CD-1 mice. Toxicol. Lett. 61, 67–74.
Cohen, S. M., Storer, R. D., Criswell, K. A., Doerrer, N. G., Dellarco, V. L., Pegg, D. G., Wojcinski, Z. W., Malarkey, D. E., Jacobs, A. C., Klaunig, J. E., et al. (2009). Hemangiosarcoma in rodents: Mode-of-action evaluation and human relevance. Toxicol. Sci. 111, 4–18.
Corthals, S. M., Kamendulis, L. M., and Klaunig, J. E. (2006). Mechanisms of 2-butoxyethanol-induced hemangiosarcomas. Toxicol. Sci. 92, 378–386.
Criswell, K. A., Wojcinski, Z., Pegg, D., Albassam, M., Duddy, S., Olsen, E., Bailie, M., Foote, S., and Anderson, T. (2012). Key components of the mode-of-action for hemangiosarcoma induction in pregabalin-treated mice: Evidence that increased bicarbonate is the initiating event and dysregulated
erythropoiesis, macrophage activation, and increased angiogenic growth fac-tors occur in mice but not rats. Toxicol. Sci. 128, 22–41.
Cunningham, M. L. (2002). A mouse is not a rat is not a human: Species differ-ences exist. Toxicol. Sci. 70, 157–158.
Dooley, D. J., Taylor, C. P., Donevan, S., and Feltner, D. (2007). Ca2+ channel α2δ ligands: Novel modulators of neurotransmission. Trends in Pharmacol. Sci. 28, 75–82.
Factor, V. M., Laskowska, D., Jensen, M. R., Woitach, J. T., Popescu, N. C., and Thorgeirsson, S. S. (2000). Vitamin E reduces chromosomal damage and inhibits hepatic tumor formation in a transgenic mouse model. Proc. Natl. Acad. Sci. U.S.A. 97, 2196–2201.
Gentleman, R. (2005). Bioinformatics and computational biology solutions us-ing R and Bioconductor. Stat. Biol. Health XIX, 397–420.
Gentleman, R. C., Carey, V. J., Bates, D. M., Bolstad, B., Dettling, M., Du-doit, S., Ellis, B., Gautier, L., Ge, Y., Gentry, J., et al. (2004). Bioconductor: Open software development for computational biology and bioinformatics. Genome Biol. 5, R80.
Giknis, M. L. A., and Clifford, C. B. (2005). Spontaneous neoplastic lesions in the Crl:CD-1(ICR) mouse in control groups from 18 month to 2 year studies. Charles River Laboratories Research Models: On-line Literature. Available at http://criver.com/research_models_and_services/research_models/RM_literature.html. Accessed February 21, 2007.
Ginouves, A., Ilc, K., Macias, N., Pouyssegur, J., and Berra, E., (2008). PHDs overactivation during chronic hypoxia “desensitizes” HIFα and protects cells from necrosis. Proc. Natl. Acad. Sci. U.S.A. 105, 4745–4750.
Harguinday, S. (1982). Hydrogen ion dynamics and cancer: An appraisal. Med. Pediatr. Oncol. 10, 217–236.
Harguinday, S., and Gragoe, E. C., Jr. (1992). The Na+/H+ antiporter in oncol-ogy in the light of the spontaneous regression of cancer and cell metabolism. Med. Hypotheses 39, 229–237.
Harguinday, S., Henderson, E. S., and Naeher, C. (1979). Effects of systemic acidification of mice with sarcoma 180. Cancer Res. 39, 4364–4371.
Harguinday, S., Pedraz, J. L., Canero, R. G., de Diego, J. P., and Gragoe, E. J., Jr. (1995). Hydrogen ion-dependent oncogenesis and parallel new avenues to cancer prevention and treatment using a H+-mediated unifying approach: pH-related and pH-unrelated mechanisms. Crit. Rev. Oncog. 6, 1–33.
Haseman, J. K., Elwell, M. R., and Hailey, J. R. (1999). Neoplastic incidences in B6C3F1 mice: NTP historical data. In Pathology of the Mouse (R. Maran-pot, Ed.), pp. 679–689. Cache River Press, Vienna, IL.
Haseman, J. K., Hailey, J. R., and Morris, R. W. (1988). Spontaneous neoplasm incidence in Fischer 344 rats and B6C3F1 mice in 2-year carcinogenicity studies: A National Toxicology Program update. Toxicol. Pathol. 26, 428–441.
Huey, K. A., Fiscus, G., Richwine, A. F., Johnson, R. W., and Meador, B. M. (2008). In vivo vitamin E administration attenuates interleukin-6 and inter-leukin-1B responses to an acute inflammatory insult in mouse skeletal and cardiac muscle. Exp. Physiol. 93, 1263–1272.
Irizarry, R. A., Collin, B. H., Beazer-Barclay, F., Beazer-Barclay, Y. D., An-tonellis, K. J., Scherf, U., and Speed, T. P. (2003). Exploration, normaliza-tion, and summaries of high density oligonucleotide array probe level data. Biostatistics 4, 249–264.
Kakiuchi-Kiyota, S., Vetro, J. A., Suzuki, S., Varney, M. L., Han, H. Y., Nas-cimento, M., Pennington, K. L., Arnold, L. L., Singh, R. K., and Cohen, S. M. (2010). Effect of the PPARγ agonist troglitazone on endothelial cells in vivo and in vitro: Differences between human and mouse. Toxicol. Appl. Pharmacol. 237, 83–90.
Kamendulis, L. M., Corthals, S. M., and Klaunig, J. E. (2010). Kupffer cells participate in 2-butoxyethanol-induced liver hemangiosarcomas. Toxicol. 270, 131–136.
Klaunig, J. E., and Kamendulis, L. M. (2005). Mode of action of butoxyetha-nol-induced mouse liver hemangiosarcomas and hepatocellular carcinomas. Toxicol. Lett. 156, 107–115.
VITAMIN E INHIBITS EC PROLIFERATION IN MICE 55
Dow
nloaded from https://academ
ic.oup.com/toxsci/article/128/1/42/1637707 by guest on 04 February 2022
Laifenfeld, D., Gilchrist, A., Drubin, D., Jorge, M., Eddy, S. F., Frushour, B. P., Ladd, B., Obert, L. A., Gosink, M. M., Cook, J. C., et al. (2010). The role of hypoxia in 2-butoxyethanol-induced hemangiosarcoma. Toxicol. Sci. 113, 254–266.
Marsman, D. S., Cattley, R. C., Conway, J. G., and Popp, J. A. (1988) Relation-ships of hepatic peroxisome proliferation and replicative DNA synthesis to the hepatocarcinogenicity of the peroxisome proliferators, di(2-ethylhexyl)phthalate and [4-chloro-6(2,3-xylidino)-2pyrimidiny-thio]acetic acid (Wy-14,643) in rats. Cancer Res. 48, 6739–6788.
Michiels, C., Arnould, T., and Remacle, J. (2000). Endothelial cell responses to hypoxia: Initiation of a cascade of cellular interactions. Biochim. Biophys. Acta 1497, 1–10.
Miyazawa, T., Tsuzuki, T., Nakagawa, K., and Iqarashi, M. (2004). Antiangio-genic potency of vitamin E. Ann. N Y Acad. Sci. 1031, 401–404.
Munoz-Chapuli, R., Quesada, A. R., and Medina, M. A. (2004). Angiogenesis and signal transduction in endothelial cells. Cell. Mol. Life Sci. 61, 2224–2243.
Nakagawa, K., Eitsuka, T., Inokuchi, H., and Miyazawa, T. (2004). DNA chip analysis of comprehensive food function: Inhibition of angiogenesis and telomerase activity with unsaturated Vitamin E, tocotrienol. Biofactors 21, 5–10.
Nakagawa, K., Shibata, A., Yamashita, S., Tsuzuki, T., Kariya, J., Oikawa, S., and Miyazawa, T. (2007). In vivo angiogenesis is suppressed by unsaturated Vitamin E, tocotrienol. J. Nutr. 137, 1938–1943.
NTP. (2000). Toxicology and carcinogenesis studies 2-butoxyethanol (CAS NO. 111-76-2) in F344/N rats and B6C3F1 mice (inhalation studies). Natl. Toxicol. Program Tech. Rep. Ser. 484, 1–290.
Nyska, A., Haseman, J. K., Kohen, R., and Maronpot, R. R. (2004). Asso-ciation of liver hemangiosarcoma and secondary iron overload in B6C3F1 mice—The National Toxicology Program experience. Toxicol. Pathol. 32, 222–228.
Obourn, J. D., Frame, S. R., Chiu, T., Solomon, T. E., and Cook, J. C. (1997). Evidence that A8947 enhances pancreas growth via a trypsin inhibitor mech-anism. Toxicol. Appl. Pharmacol. 146, 116–126.
Park, J., Haseman, J. K., and Klaunig, J. E. (2002a). Mechanisms of 2-bu-toxyethanol carcinogenicity: Studies on Syrian hamster embryo (SHE) cell transformation. Toxicol. Sci. 68, 43–50.
Park, J., Kamendulis, L. M., and Klaunig, J. E. (2002b). Effects of 2-butox-yethanol on hepatic oxidative damage. Toxicol. Lett. 126, 19–29.
Pegg, D., Bleavins, M., Herman, J., Wojcinski, Z., Graziano, M., Henck, J., Criswell, K., Anderson, T., and Duddy, S. (2012). Hemangiosarcoma in mice administered pregabalin: Analysis of genotoxicity, tumor incidence and tu-mor genetics. Toxicol. Sci. 128, 9–21.
Poteracki, J., and Walsh, K. M. (1998). Spontaneous neoplasms in control Wistar rats: A comparison of reviews. Toxicol. Sci. 45, 1–8.
Scherer, E. (1984). Neoplastic progression in experimental hepatocarcinogen-esis. Biochim. Biophys. Acta 738, 219–236.
Shibata, A., Nakagawa, K., Sookwong, P., Tsuduki, T., Tomita, S., Shirakawa, H., Komai, M., and Miyazawa, T. (2008). Tocotrienol inhibits secretion of angiogenic factors from human colorectal adenocarcinoma cells by sup-pressing hypoxia-inducible factor1-α. J. Nutr. 138, 2136–2142.
Siesky, A. M., Kamendulis, L. M., and Klaunig, J. E. (2002). Hepatic effects of 2-butoxyethanol in rodents. Toxicol. Sci. 70, 252–260.
Stroka, D. M., Burkhardt, T., Desbaillets, I., Wenger, R. H., Neil, D. A., Bauer, C., Gassmann, M., and Candinas, D. (2001). D. HIF-1 is expressed in nor-moxic tissue and displays an organ-specific regulation under systemic hy-poxia. FASEB J. 15(13), 2445–2453.
Taylor, C. P., Angelotti, T., and Fauman, E. (2006). Pharmacology and mecha-nism of action of pregabalin: The calcium channel α2-δ (alpha2 – delta) sub-unit as a target for antiepilectic drug discovery. Epilepsy Res. 73, 137–150.
Terada, N., Ohno, N., Saitoh, S., and Ohno, S. (2007). Immunohistochemical detection of hypoxia in mouse liver tissues treated with pimonidazole using in vivo cryotechniques. Histochem. Cell Biol. 128, 253–261.
US National Cancer Institute’s Surveillance, Epidemiology, and End Results (SEER) database. Available at: http://seer.cancer.gov/. Accessed February 21, 2007.
Woodson, K., Triantos, S., Hartman, T., Taylor, P. R., Virtamo, J., and Albanes, D. (2002). Long term alpha-tocopherol supplementation is associated with lower serum vascular endothelial growth factors. Anticancer Res. 22, 375–378.
56 CRISWELL ET AL.
Dow
nloaded from https://academ
ic.oup.com/toxsci/article/128/1/42/1637707 by guest on 04 February 2022
Copyright © 2022 FDOKUMEN