EFFECTS OF HYPOXIA ON LOCOMOTOR-RESPIRATORY ...
112
EFFECTS OF HYPOXIA ON LOCOMOTOR-RESPIRATORY COUPLING DURING EXERCISE Timothy J. Fulton Submitted to the faculty of the University Graduate School in partial fulfillment of the requirements for the degree Master of Science in the School of Public Health Indiana University April 2017
-
Upload
khangminh22 -
Category
Documents
-
view
1 -
download
0
Transcript of EFFECTS OF HYPOXIA ON LOCOMOTOR-RESPIRATORY ...
EFFECTS OF HYPOXIA ON LOCOMOTOR-RESPIRATORY
COUPLING DURING EXERCISE
Timothy J. Fulton
Submitted to the faculty of the University Graduate School
in partial fulfillment of the requirements for the degree
Master of Science
in the School of Public Health
Indiana University
April 2017

i
Accepted by the Graduate Faculty, Indiana University,
in partial fulfillment of the requirements for the degree of Master of Science
Master’s Thesis Committee
_____________________________
Robert F. Chapman, PhD
Chairperson
_____________________________
Timothy D. Mickleborough, PhD
_____________________________
Allison H. Gruber, PhD

ii
Copyright © 2017
Timothy J. Fulton
iii
Abstract
To determine if acute exposure to normobaric hypoxia alters locomotor-respiratory
coupling (LRC) patterns typically observed in trained runners, 13 trained male distance
runners performed a running economy (RE) and maximal oxygen uptake (V̇O2max) test in
normoxia (NORM) and hypoxia (HYP) (FIO2 = 15.8%; ~ 2500m / 8000ft) on separate
days. RE and LRC measures were taken during the fourth minute of each submaximal
speed (12.9, 14.3, and 16.1 km hr-1), while ratings of perceived exertion (RPE) and
dyspnea (DYS) were taken during the first 10 seconds of the final minute at each speed,
and again at the conclusion of the maximal test. Stride frequency-to-breathing frequency
quotients were significantly lower at each submaximal speed in HYP (12.9 km hr-1: 2.91
± 0.20 vs. 2.45 ± 0.17, 14.3 km hr-1: 2.53 ± 0.17 vs. 2.21 ± 0.14, 16.1 km hr-1: 2.22 ± 0.14
vs. 1.95 ± 0.09; p < 0.05) due to increases in breathing frequency while maintaining
stride frequency. Compared with NORM, the degree of LRC (range: 36 - 99%) was not
significantly different at any of the three common submaximal speeds with exposure to
HYP. However, the degree of LRC was increased at V̇O2max (43.8 ± 3.4% vs. 57.1 ±
3.8%; p < 0.05). Breathing frequency (breaths min-1) was significantly increased at each
submaximal speed in HYP compared to NORM (12.9 km hr-1: 30.3 ± 1.9 vs. 35.9 ± 2.2;
14.3 km hr-1: 34.8 ± 2.0 vs. 39.8 ± 2.2; 16.1 km hr-1: 40.4 ± 2.4 vs. 45.2 ± 1.9; all speeds p
< 0.05), but was not significantly different at V̇O2max. RE and RPE were not significantly
different at any speed. DYS was only significantly different between NORM and HYP at
16.1 km hr-1 (p < 0.05). In conclusion, trained distance runners are able to maintain LRC
in hypoxia, even when breathing frequency is increased at any submaximal pace. Within
this unique population, years of training may enhance and optimize the ability to make

iv
adjustments to maintain LRC in order to minimize metabolic costs. However, there may
be individual differences to LRC that could affect performance or the response to training
at altitude.

v
TABLE OF CONTENTS
CHAPTER 1 ………………………………………………………………………… 1
INTRODUCTION …………………………………………………………... 1
Statement of the Problem …………………………………………..... 4
Purpose of the Study ………………………………………………… 4
Significance of the Study………………………………………….…. 4
Delimitations…………………………………………………………. 5
Limitations …………………………………………………………... 5
Assumptions ………………………………………………………… 5
Specific Aims and Hypotheses …………………………………….... 6
Definition of Terms …………………………………………………. 6
CHAPTER 2 ................................................................................................................ 8
REVIEW OF LITERATURE………………………………………………... 8
Altitude Training ................................................................................. 9
Mechanics and Control of Ventilation .................................... 9
Ventilation .......................................................................................... 12
Mechanics and Control of Ventilation ................................... 12
Locomotion ........................................................................................ 16
Mechanics of Locomotion ..................................................... 16
Energetic Cost of Locomotion ............................................... 18
Locomotor-Respiratory Coupling ...................................................... 19
Mechanisms of Locomotor-Respiratory Coupling ................ 22

vi
Implications and Perturbations to Locomotor-
Respiratory Coupling............................................................. 23
Conclusion ……………………………...………………………..... 25
CHAPTER 3 ............................................................................................................. 26
EXPERIMENTAL PROCEDURES ............................................................ 26
Subjects ............................................................................................ 26
Study Design .................................................................................... 26
Pulmonary Function ......................................................................... 27
Treadmill Tests ................................................................................ 27
Metabolic/Ventilatory Measures ...................................................... 28
Running Economy ........................................................................... 29
Locomotor-Respiratory Coupling .................................................... 29
Hypoxic Delivery ............................................................................ 31
Treatment of Data ............................................................................ 31
REFERENCES ........................................................................................................ 33
CHAPTER 4 & 5 ..................................................................................................... 41
MANUSCRIPT ........................................................................................... 42
Title Page ......................................................................................... 42
Abstract ........................................................................................... 43
Introduction ..................................................................................... 45
Methods ........................................................................................... 47
Results ............................................................................................. 53
Discussion ....................................................................................... 58

vii
Conclusion ...................................................................................... 61
REFERENCES ............................................................................... 63
APPENDICES ........................................................................................................ 71
A. Variable Names, Raw Data, Tables, and Figures .................................. 71
B. Indiana University Institutional Review Board Approval ..................... 90
C. Informed Consent ................................................................................... 92
D. Modified Physical Activity Readiness Questionnaire ............................ 97
E. Preliminary Survey ................................................................................. 99
F. Curriculum Vitae .................................................................................... 101

1
CHAPTER 1
INTRODUCTION
Endurance athletes commonly use altitude training as a means to improve sea
level performance. A large reason altitude training is utilized is due to beneficial
hematological adaptations such as increased erythropoietin (EPO) production. Increased
EPO production stimulates increases in hemoglobin mass, which results in improved
oxygen carrying capacity of the blood, and can ultimately lead to improved endurance
performance. While it is ideal to have a large initial EPO response, the ability to continue
regular, uninterrupted endurance training during the recommended 3-4 week sojourn to
altitude is also essential. Over this timespan, many training adaptations such as increased
mitochondrial volume, increased free fatty acid substrate utilization, and increased
oxidative enzyme activity can occur, sometimes to greater extent than similar training
periods at sea level. However, even when following altitude training best practice
guidelines, considerable variation in physiological responses to altitude exposure and
subsequent sea level performance exist (Chapman, Stray-Gundersen, & Levine, 1998).
The response to altitude training depends on both physiological acclimatization
and training adaptations, so each also represent possible areas of explanation for
variation. Although a number of factors can affect the ability to complete endurance
exercise training at altitude, one of the most immediate responses to acute altitude
exposure is an increase in ventilation at any submaximal exercising workload. The
ventilatory response to exercise is unique in having both physiological outcomes (e.g.
defending arterial oxyhemoglobin saturation, but with a metabolic cost of increased work

2
of breathing) and psychological outcomes (e.g. dyspnea). In endurance-trained runners
exercising at sea level, a link between the speed of movement across the ground and
ventilatory effort exists. However, due to the increases in ventilation with exposure to
altitude, this link may become disrupted. As a result, ventilatory control during exercise
at altitude can have a strong influence on workload selection, perception of effort, and
ultimately the training response at altitude. One factor involved in ventilatory control is
locomotor-respiratory coupling (LRC).
LRC is a consistent frequency and phase locking between pulmonary respiration
and locomotion, and is believed to aid in decreasing the energetic cost of locomotion.
For example, multiple studies have found that higher degrees of LRC during cycling lead
to decreases in oxygen consumption during submaximal exercise (Garlando, Kohl,
Koller, & Pietsch, 1985; Hoffmann, Torregrosa, & Bardy, 2012; Villard, Casties, &
Mottet, 2005). Additionally, Bernasconi et al. (1993) found that a higher degree of LRC
while running significantly lowered oxygen uptake (i.e. improved running economy
(RE)) when compared to a lower degree of LRC.
Higher degrees of LRC may also be involved in decreasing the amount of
discomfort associated with increases in ventilation during exercise tolerance. Dyspnea,
which is a subjective sensation of breathing discomfort, is known to be a factor limiting
exercise performance (Sheel, 2002). Takano et al. (1997) demonstrated that reduced
dyspnea was associated with higher degrees of LRC. Thus, there may be perceptual
benefits as well as physiological benefits to increasing the degree of LRC. These
perceptual benefits may be especially true for highly trained athletes, who “associate”
during exercise and are very cognizant of changes in their own physiological variables

3
such as breathing frequency or tidal volume (Morgan & Pollock, 1977). While these
energetic and perceptual benefits are advantageous for endurance performance, any
perturbation to the components of LRC could negate these advantages.
One possible perturbation that may affect endurance runners utilizing altitude
training is hypoxia-induced increases in breathing frequency. Currently, evidence of
changes to LRC in hypoxia is inconclusive. Patterson et al. (Paterson, Wood, Marshall,
Morton, & Harrison, 1987) found decreases in the degree of LRC during hypoxic running
when compared to normoxia, while Fabre et al. (2007) and Seebauer et al. (2003) showed
no change to LRC in rowers and cyclists, respectively. Moreover, the consequences of
altering LRC in hypoxia, such as changes to oxygen uptake and perceptions of ventilatory
effort, remain to be elucidated.

4
Statement of the Problem
The effect of hypoxia on LRC in trained runners is unsubstantiated, and the
consequences that alterations to LRC have on running economy and perceptions of
ventilatory effort in hypoxia are unknown.
Purpose of the Study
The purpose of the study was to determine if hypoxia alters LRC patterns
typically observed in trained runners, and investigate the effects these possible LRC
alterations have on RE and perceptions of ventilatory effort.
Significance of the Study
To improve sea level performance, many endurance runners use altitude training
to take advantage of beneficial hematological and/or training adaptations that occur
above and beyond sea-level training. While there are many physiological responses to
altitude exposure, one of the most immediate responses is an increase in ventilation at
any submaximal exercising workload. This increase in ventilation may perturb an
established harmonization of breathing and locomotor rhythms, known as LRC, which
could be detrimental to exercise performance. Specifically, running economy may
become worse and/or perceptions of ventilatory effort may be increased. However, the
effects altitude exposure has on LRC have not been extensively investigated, especially
in trained endurance runners. Therefore, insights into possible consequences are
necessary to aid in training and performance strategies of athletes, and may explain some

5
portion of the variance behind the individual response to altitude training and subsequent
sea level performance.
Delimitations
1. Subjects were trained distance runners.
2. A research-grade treadmill, indirect calorimetry system, and data acquisition software
were used to measure outcome variables.
3. A single blinded, randomized crossover (normoxia and hypoxia) study design was
used.
Limitations
1. Subjects were not a random sample of the entire running population.
2. The sample size of the study was small.
Assumptions
1. Subjects in this study were representative of trained distance runners.
2. Decreased oxygen concentration of inspired gas had effects similar to that of
decreased barometric pressure.
3. The method used to measure exercise ventilation did not significantly alter the
subjects’ normal ventilatory patterns.
4. The method used to measure foot ground contact did not significantly alter the
subjects’ normal locomotor patterns.

6
Specific Aims and Hypotheses
Specific Aim 1:
To test if hypoxia alters LRC patterns typically observed in trained runners.
Research Hypotheses:
The degree of LRC will be reduced in hypoxia compared to normoxia due to increases in
breathing frequency without concomitant increases in stride frequency.
Specific Aim 2:
To identify the relationships between LRC alterations and RE and perceptions of
ventilatory effort.
Research Hypotheses:
1. Running economy will be worse with a decreased degree of LRC.
2. Perceptions of ventilatory effort will increase with a decreased degree of LRC.
Definitions of Terms
Breathing frequency: Number of breaths taken per minute.
Degree of LRC: Percent of breaths that occur within in distinct decile divided by the total
number of breaths.
Entrainment: Frequency and phase locking between two periodic systems.
Locomotor-respiratory coupling (LRC): A stable, consistent frequency and phase locking
between pulmonary respiration and locomotion
Running economy: The energy demand, or oxygen uptake, for a given velocity of
submaximal running.

7
Step: Ground contact of one foot to ground contact of the opposite foot (ipsilateral foot
ground contact to contralateral foot ground contact).
Stride: Ground contact of one foot to the next ground contact of the same foot (ipsilateral
foot ground contact to ipsilateral foot ground contact).
Stride frequency: The number of strides taken over a given period of time (per minute in
this study).
Minute Ventilation (V̇E): The volume of air leaving the lung each minute;
Mathematically, the product of the volume of each breath (tidal volume; VT) and
the frequency of breaths per minute (ƒB).

8
CHAPTER 2
REVIEW OF LITERATURE
The ability to perform, and sustain, endurance exercise relies in part on the
successful coordination of the ventilatory and locomotor systems. This synchronization
is known as locomotor-respiratory coupling (LRC), and is believed to affect the energetic
cost of locomotion and the amount of breathing discomfort (dyspnea) during exercise.
Higher degrees of LRC may result in decreased energetic cost of locomotion and
decreased dyspnea, thus possibly enhancing endurance exercise tolerance and
performance. Consequently, any perturbation to the components of LRC, such as
increased ventilation due to hypoxia, may negatively impact performance. Endurance
athletes who utilize altitude training in order to improve sea level performance may be
affected by these hypoxia-induced increases in ventilation, resulting in a lower degree of
LRC. The alteration to LRC may cause deviations in the energetic cost of running and/or
dyspnea, either of which could negate advantageous training adaptations that occur
during a runners stay at altitude. However, there is limited evidence regarding the effects
of hypoxia on LRC, particularly in trained endurance runners. In order to more
adequately understand how hypoxia and LRC relate to each other, as well as possible
consequences hypoxia may have on LRC, it is pertinent to examine each individually.
Therefore, this review will address the following areas: (1) basics of altitude training, (2)
mechanics and control of ventilation, (3) mechanics and energetics of locomotion, (4)
mechanisms of LRC, and (5) implications and perturbations to LRC.

9
Altitude Training
Living and training at altitude is a common strategy utilized by endurance athletes
for the enhancement of performance at sea level. While the improvements in
performance may be principally due to hematological adaptations that cause increases in
red cell mass and oxygen carrying capacity, the ability to continue endurance specific
training at altitude is imperative in order to obtain non-hematological adaptations. Such
adaptations may include increased oxidative enzyme activity, increased free fatty acid
substrate utilization, and increased mitochondrial volume (Sinex & Chapman, 2015). In
order to take advantage of and maximize any of these mechanisms, athletes must follow
best practice guidelines regarding how high to live, how high to train, how long to stay,
and when to return to sea level competition. Still, even when following practical and
scientific recommendations there appears to be an individual variation in the response to
altitude training, and the possible benefits of this type of training may be outweighed by
negative physiological responses associated with altitude exposure (Chapman, 2013).
Best Practices
Early investigations of altitude training suggested a live high-train high (LHTH)
model in which athletes stayed at a moderate elevation of 1500-3000m continuously
(Wilber, Stray-Gundersen, & Levine, 2007). While this range of elevation may cause
positive hematological responses, it limits the ability of an athlete to train at intensities
necessary to induce adequate oxygen flux for performance improvement. Therefore, a
live high-train low (LHTL) model was developed whereby all daily living activities and
low intensity workouts are at completed at the high altitude, but high intensity workouts

10
(above lactate threshold) are done at a lower altitude. In a pioneering study by Levine
and Stray-Gundersen (1997), runners who utilized the LHTL model saw improved
performance in in a 5,000 meter time trial post altitude training, while runners in the
LHTH model did not. A subsequent study by the same laboratory revealed that in order
to maximize the hematological response as well as gain performance benefits post
altitude training, the optimal elevation to live is between 2,000 and 2,500 meters
(Chapman, Karlsen, et al., 2014). Additionally, utilizing an elevation of 1250 meters
during the “train low” portion of the model for high intensity workouts appears to be low
enough to elicit sufficient oxygen flux necessary for beneficial neuromuscular and
metabolic adaptations.
The length of time to stay at altitude and when to return to sea level completion
are also important factors to consider when attempting to maximize improvements in
performance. The main element involved in the determining the length of stay is the time
course of erythropoiesis. Regardless of the type of hypoxia (natural or simulated), there
are significant increases in red cell mass (4.3%) after three weeks at altitude, with an
additional week of stay (a total of 4 weeks) creating even further increases in the amount
of red cell mass gain (7.1-7.9%). In fact, the latter increase is comparable to increases in
red cell mass with low dose exogenous EPO injection (8.7%). (Wilber et al., 2007)
Therefore, it is strongly recommended to stay at altitude for a minimum of four weeks.
The main reason to partake in altitude training is to improve sea level
performance. As such, correctly timing the return to sea level competition after a stay at
altitude is vital. However, there are few empirical data to show when the best time to
compete may be. Rather, much of what is recommended comes from coaches and/or

11
athletes and is based on anecdotal evidence. These recommendations generally suggest a
period of 12-21 days of sea level only training before competition (Chapman et al.,
2014). A number of factors, including the time course of the decline in hematological
and ventilatory adaptations, are important to consider when determining this ‘window of
opportunity’. While hypoxic exposure causes increases in EPO levels above baseline, it
is possible for EPO levels to fall below baseline upon the return to sea level from altitude.
This fall in EPO can cause hemolysis of mature red blood cells, lowering the oxygen
carrying capacity of the blood (Rice et al., 2001). The exact time course of this
neocytolysis is unknown, but is suggested to occur within the first week back at sea level.
Thus, it may be beneficial for athletes to compete sooner rather than later, before a drop
in RBC mass occurs. Conversely, the increase in V̇E at submaximal exercising workloads
seen in altitude-acclimatized athletes persists during the return to sea level. This increase
in V̇E can cause increases in the oxygen cost and work of breathing, both of which can
hinder performance. In this case, it may be beneficial for athletes to wait to compete until
V̇E returns to pre-altitude training levels. Ultimately, the optimal time for return to
competition may depend on individual responses to altitude deacclimatization.
Taken together, best practice guidelines for the optimal response to altitude
training include utilizing the LHTL model where living altitude is between 2000-2500
meters and training altitude is ≤ 1250 meters, staying at altitude for a minimum of four
weeks, and timing the return to sea level competition based on hematological and
ventilatory deacclimatization responses.

12
Ventilation
Ventilation, the movement of air between the environment and the pulmonary
system via inhalation and exhalation, serves four specific purposes: 1) the exchange of
oxygen, 2) the exchange of carbon dioxide, 3) the control of blood pH, and 4) oral
communication (Brooks, Fahey, White, & others, 1996). Ventilation is tightly regulated
by the pontomedullary region of the central nervous system through the integration of
feed forward (output) and feedback (input) influences (Figure 1).
Figure 1. Basic elements of the respiratory control system (West, 2012).
Mechanics and Control of Ventilation
The pontomedullary region, or “central controller”, sends output to the ventilatory
musculature through the phrenic and intercostal nerves in order to achieve inspiration and
expiration. Inspiration is largely achieved through contraction of the diaphragm, where
increases in the volume of the thorax result in a decrease in intrapulmonary pressure that
draws atmospheric air into the lung. At rest, expiration is passively achieved as the
diaphragm relaxes, and the lung, due to its elastic properties, recoils and returns to

13
preinspiratory volumes. However, during exercise expiration becomes a more active
process as the contractions of the internal intercostals force the ribs down, and the
abdominal muscles force the diaphragm upward into the thorax. This transient decrease
in thorax volume causes increases in intrapulmonary pressure above atmospheric
pressure, driving air out of the lungs.
The increases in muscle involvement during exercise can produce substantial
increases in minute ventilation (V̇E). These increases in bulk airflow are caused by
increases in tidal volume (VT), increases in the frequency of breaths per minute (ƒB), or
by some combination of both (Figure 2). During progressive exercise, the rise in V̇E at
moderate intensities is predominately due to expansions in VT, with only modest
increases in ƒB. The increase in VT is advantageous because it minimizes dead space
ventilation and maximizes effective alveolar ventilation. VT increases also cause
reductions in end expiratory lung volume (EELV) below functional residual capacity
(FRC), which can help minimize the elastic work of breathing (WOB) and allow for the
build up of elastic energy that can be used on the subsequent inspiration. During higher
intensity exercise VT will begin to plateau and further rises in V̇E are due to continual
increases in ƒB. The increases in ƒB are achieved through reductions in both inspiratory
(TI) and expiratory (TE) time, with a greater proportional decrease in TE than TI relative to
total breath time (TTOT).
The increases in V̇E during exercise are accompanied by increases in inspiratory
and expiratory flow rates. If higher flow rates exist, yet airway caliber is unchanged, an
increase in airflow resistance, and ultimately WOB can occur. Fortuitously, both the
extrathoracic and intrathoracic airways can be altered such that resistance is maintained,

14
or even lowered during exercise. The main change in the extrathoracic airways, which
consist of the upper airways (nasal, pharyngeal, and laryngeal airways), is a shift from the
higher resistance nasal pathway to the lower resistance oral pathway. Intrathoracic
airway caliber is controlled in part by smooth muscle, and can be increased
(bronchodilation) during exercise by a reduction in cholinergic tone and/or an increase in
epinephrine binding to B2 receptors.
Figure 2. Ventilatory responses to progressive increases in cycling work rate
(Scheel & Romer, 2012).
The precise adjustments to ventilation during exercise are of crucial importance,
however the current understanding of the control of these adjustments is incomplete.
Nevertheless, feed forward and feedback influences are two general categories largely
agreed upon (Scheel & Romer, 2012). While direct evidence of a feed forward signal in
humans is still not available, the idea of a central controller has been around for over a
century (Krogh & Lindhard, 1913). This supposition is due to the almost immediate
ventilatory responses to exercise that would make an initial non-neural influence

15
unlikely. Indirect evidence for feed forward influence has been observed using curare to
partially blockade the neuromuscular junction in exercising subjects. Both Asmussen et
al. (1965) and Galbo et al. (1987) observed higher ventilation at given oxygen uptakes
during curarization, suggesting that activity in a “central command” center plays a role in
the control of ventilation. Experimental animal studies have shown that ventilatory
responses in both brain-intact and decorticate cats begin to develop prior to the onset of
spontaneous or stimulated locomotion, suggesting that peripheral feedback mechanisms
are not necessarily needed for a response (Eldridge, Millhorn, Killey, & Waldrop, 1985;
Eldridge, Millhorn, & Waldrop, 1981). Taken together, the available evidence points
toward the presence of a feed forward central controller. Still, it is doubtful that this
control exists in complete isolation from any feedback influences.
One likely feedback mechanism adjusting ventilatory responses is linked to
locomotor activity. Both group III and group IV muscle afferents are sensitive to
changes in mechanical and chemical conditions associated with muscle contraction
during exercise, and provide neural input to the central nervous system to mediate
ventilatory responses. To assess these nerve fibers contribution to ventilatory control, a
sophisticated study by Amann et al. (2010) used lumbar intrathecal fentanyl injections to
impair central projection of spinal opioid receptor-sensitive muscle afferents. During
cycling exercise, there was a substantial decrease in ventilation compared to placebo,
caused by reductions in ƒB and in the ventilatory equivalent for CO2. These findings
demonstrate the contribution of muscle afferent feedback to the ventilatory response to
rhythmic exercise. Another feedback influence is the arterial partial pressure of oxygen
and carbon dioxide. Both central and peripheral chemoreceptors sense deviations in the

16
chemical composition of the blood and provide input to the central control, which
generates the appropriate ventilatory response. Figure 3 provides an overview of the
influences to and from the respiratory control center.
Figure 3. Overview of inputs to, and outputs from, the respiratory control center (Carroll
& Agarwal, 2010).
Locomotion
Mechanics of Locomotion
Locomotion is the act of self-powered motion that humans, as well as other
organisms, use to change their location. In terrestrial locomotion the speed at which a
change in location occurs is dependent on two factors: the distance of each step (or stride)
and the number of steps (or strides) taken. The step distance is measured from the
ground contact of one foot (footstrike) to the ground contact of the opposite foot

17
(ipsilateral footstrike to contralateral footstrike). The stride distance is measured from
the ground contact of one foot to the next contact of that same foot (ipsilateral footstrike
to ipsilateral footstrike). Walking and running are the two most common forms of human
locomotion (i.e. gaits), but have dramatically different phases and mechanics (Fig. 4).
During walking the body vaults up and over each stiff leg in an arc, similar to an inverted
pendulum. During running, however, as the foot strikes the ground, mechanical energy is
Figure 4. Relative contributions of phases during walking and running gait cycles
(Stickford & Stickford, 2014).
momentarily stored in the eccentrically contracting muscles. This energy is subsequently
released during the propulsive portion of the stance phase for concentric contraction and
forward propulsion. Thus, running is analogous to bouncing on a pogo stick, and can be
represented as a spring-mass model (Cappellini, Ivanenko, Poppele, & Lacquaniti,
2006;Dalleau, Belli, Bourdin, & Lacour, 1998) (Fig. 5).

18
Figure 5. A representation of walking by “vaulting” and running by “bouncing”.
Adapted from (Cappellini et al., 2006).
Energetic Cost of Locomotion
Humans tend to change gait modes as locomotion speed increase in order to
minimize metabolic energy costs. In other words, a transition in gait mode occurs when
the metabolic energetic cost for walking at a particular speed becomes greater than the
cost of running at that same speed. The metabolic energy demand for any given
submaximal velocity is known as the economy of locomotion. Central to this study is
running economy (RE), which can be defined as the energy demand for a given velocity
of submaximal running, and is determined by measuring steady state oxygen uptake.
A number of physiological and biomechanical factors appear to impact running
economy. Thomas et al. (1999) found that among core temperature, heart rate,
ventilation, and changes in lactate concentration during a simulated 5k race, only
increases in ventilation were significantly correlated with a worse RE (r=0.64, p < 0.05).
Cavanagh and Williams (1981) used multiple regression in an attempt to identify which
biomechanical factors influence RE, concluding that lower vertical ground reaction

19
forces, greater shank, trunk, and plantar flexion angles, and minimal knee velocity all
contribute to better RE. Additionally, increased stiffness of the lower extremity seems to
allow for greater utilization of the stored elastic energy that occurs during the loading
portion of the stance phase, thus lowering oxygen cost and improving RE (Butler,
Crowell, & Davis, 2003). Finally, it has been shown that trained runners self select a
stride length that minimizes oxygen uptake, with either shorter or longer stride lengths
causing increases in oxygen uptake of 2.6 and 3.4 ml·kg-1·min-1, respectively (Hunter &
Smith, 2007).
Locomotor-Respiratory Coupling
While research examining ventilation or locomotion exclusively has provided
insight into the how and why of each, it is critical to recognize that these two systems
function in an integrative fashion during dynamic exercise. Indeed, evidence exists to
show that breathing and limb patterns are not isolated actions, but rather impact each
other in a particular manner. The coordination of these rhythmic actions is known as
entrainment, or locomotor-respiratory coupling (LRC), and has been observed across
many species, including humans. Early observational research by Bannister et al. (1954)
discovered that runners’ stride rate was a multiple of their breathing frequency. Further
support for LRC was given by Bechbache et al. (1977), who had subjects exercise at two
workloads on a cycle ergometer and two speeds on a treadmill (one walking speed and
one running speed). Using a cross-correlation approach, subjects were classified as
having either strong, weak, or no LRC. The percent of subjects that displayed at least
some LRC (i.e. either strong or weak) varied across the different protocols. Interestingly,
20
more subjects entrained during treadmill running than cycling (80% and 20%,
respectively).
However, not all investigations have shown the existence of LRC. While
examining the effects of added dead space on pulmonary ventilation during cycling
exercise, Kelman and Watson (1973) recorded breathing frequencies at constant pedaling
rates. They found no evidence that breathing frequency was related to submultiples of
the pedaling rate, and concluded that the subjects’ breathing patterns were determined
mainly by their respiratory needs. Additionally, Kay et al. (1975) compared ventilatory
factors to limb movements during both cycling and treadmill walking. Neither the stride
rate nor the pedal rate was found to have any influence on respiratory rate or breathing
pattern. It was concluded that the selection of breathing patterns is unrelated to the type
of exercise stimulus, but instead closely geared to meet the body’s metabolic needs.
Ensuing research has continued to both verify and contest the existence of LRC in
humans.
These varied findings are most likely due to differences in a) training status, b)
exercise intensity, and c) exercise mode. Highly trained individuals tend to display a
greater degree of LRC than those who are less trained or not trained at all, and trained
runners also show the ability to couple within the first few strides of a run, whereas less
experienced runners require a longer time before breathing and gait begin to couple.
Bramble and Carrier (1983) noted that a continuum exists for the time to couple, with
time to couple being inversely related to training status. Exercise intensity is also
believed to be an element that contributes to LRC in humans, with a positive relationship
among the degree of LRC and intensity or workload. Bernasconi et al. (1993) observed
21
increases in the degree of LRC in both triathletes and untrained individuals when running
speed was increased from 50% to 80% of anaerobic threshold. Additionally, increasing
cycling rates from 50 rpm to 70 rpm in untrained subjects increased the occurrence of
LRC by 10% (Bechbache & Duffin, 1977). However, not all studies have observed this
intensity dependent influence, as some show no effect of intensity on LRC during cycling
(Jasinskas, Wilson, & Hoare, 1980; Paterson, Wood, Morton, & Henstridge, 1986).
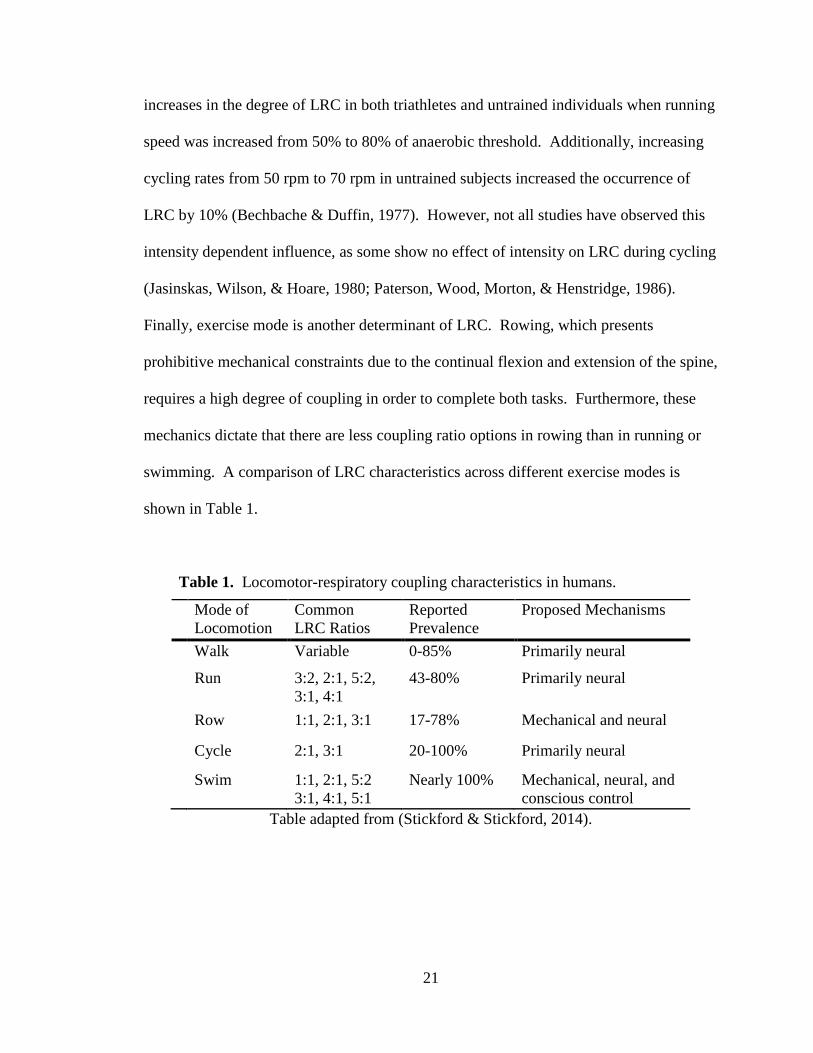
Finally, exercise mode is another determinant of LRC. Rowing, which presents
prohibitive mechanical constraints due to the continual flexion and extension of the spine,
requires a high degree of coupling in order to complete both tasks. Furthermore, these
mechanics dictate that there are less coupling ratio options in rowing than in running or
swimming. A comparison of LRC characteristics across different exercise modes is
shown in Table 1.
Table 1. Locomotor-respiratory coupling characteristics in humans.
Mode of Locomotion
Common LRC Ratios
Reported Prevalence
Proposed Mechanisms
Walk Variable 0-85% Primarily neural
Run 3:2, 2:1, 5:2, 3:1, 4:1
43-80% Primarily neural
Row 1:1, 2:1, 3:1 17-78% Mechanical and neural
Cycle 2:1, 3:1 20-100% Primarily neural
Swim 1:1, 2:1, 5:2 3:1, 4:1, 5:1
Nearly 100% Mechanical, neural, and conscious control
Table adapted from (Stickford & Stickford, 2014).

22
Mechanisms of Locomotor-Respiratory Coupling
The underlying mechanisms of LRC are both complex and poorly understood, yet
two broad areas of explanation exist: 1) biomechanical interactions between locomotion
and ventilation, and 2) neural interactions between the control of locomotion and
ventilation. Biomechanically, the movement of internal organs during locomotion may
physically affect the movement of the diaphragm. Furthermore, the pressure and/or
volume changes within the thoracic cavity as a result of ground contact, and possibly also
from lumbosacral flexion and extension, may affect the time that inspiration and
expiration occur. The mechanical restrictions to ventilation due to locomotion are likely
a combination of both factors. However, research quantifying airflow changes during
running found no appreciable mechanical effect on ventilation (Banzett, Mead, Reid, &
Topulos, 1992). Thus, these factors are believed to have a negligible impact on
ventilation, suggesting that LRC is predominately driven by neural factors.
There is an abrupt increase in ventilation at the onset of exercise, with the amount
of the increase corresponding to the rate of movement. This relationship, as well as the
immediacy with which coupling can occur, imply that central feed forward signals are
responsible for LRC. Indeed, evidence exists for this mechanism, as Eldridge et al
(1985) demonstrated that stimulating the subthalamic locomotor regions in paralyzed
animals still results in increases in ventilation. In addition to the feed forward signal,
peripheral afferent feedback signals from the exercising limbs, chest wall, and
chemoreceptors all contribute to fluctuations in ventilation (Stickford & Stickford, 2014).
In certain animal models when neural feedback from the periphery is blocked, but
afferent feedback from the chest wall is allowed, LRC still occurs (Funk, Steeves, &

23
Milsom, 1992). Taken together, this evidence indicates an integrative response that
incorporates an initial feed forward control of ventilation, with later afferent feedback
providing a fine-tuning response.
Implications and Perturbations to Locomotor-Respiratory Coupling
The possibility exists that LRC is not only beneficial, but also required, for
sustained aerobic activity among endothermic vertebrates (Bramble & Carrier, 1983).
Yet, what exactly that benefit is, and why it might be a requirement, remains
inconclusive. However, evidence suggests that an energetic and/or perceptual advantage
to LRC exists. As demonstrated by numerous studies, LRC during cycling seems to
lower metabolic energy expenditure. Villard et al. (2005) discovered that LRC became
more stable as cycling exercise progressed, and was accompanied by reductions in V̇O2.
Similarly, Garlando et al. (1985) found that greater coupling during cycling was
associated with significantly lower oxygen uptake at a submaximal, 50% workload. One
explanation for these decreases may be due to a more economical respiratory muscle
component of oxygen uptake. Takano et al. found that within certain subjects, LRC
caused decreases in respiratory muscle oxygen uptake (V̇O2RM). Consequently, at
intensities associated with high ventilatory workloads, LRC may aid in decreasing the
oxygen cost of performing such work.
The relationship concerning LRC and energetics among other modes of exercise
is less clear. A study including untrained male rowers did not find any differences in
oxygen uptake using three distinct breathing patterns, however the authors noted that any
physiologic benefits of LRC might require months of training before they appear
24
(Maclennan, Silvestri, Ward, & Mahler, 1994). Likewise, LRC during walking does not
appear to have an impact on oxygen uptake (Alphen & Duffin, 1994; Rabler & Kohl,
1996). Conversely, Bernasconi et al. (1993) observed that better running economies (i.e.
lower oxygen uptake for a given pace) occurred during the highest degrees of LRC.
A further advantage of LRC could be more perceptual than physiological, such as
decreases in breathing discomfort during exercise while coupling. In addition to
decreases in V̇O2RM during increased LRC, these increases also correspond to reductions
in dyspnea (Takano & Deguchi, 1997). These perceptual benefits may be especially
important for highly trained athletes, who “associate” during exercise and are very
cognizant of changes in their own physiological variables such as breathing frequency or
tidal volume (Morgan & Pollock, 1977).
Although there seem to be specific advantages of LRC, it is possible that any type
of perturbation to LRC itself could negate these advantages. One possible disruption to
LRC could be hypoxic induced increases in ventilation, resulting in changes to breathing
frequency. Paterson et al. (1997) tested this hypothesis in both field and laboratory
conditions at varying levels of elevation using a small cohort of five Nepalese porters and
two Caucasian mountaineers. In both conditions, the incidence of LRC decreased
linearly with increasing levels of hypoxia. The authors concluded that at a constant
metabolic rate and stride frequency, the lower degree of LRC resulted primarily from
increases in breathing frequency. However, it was noted that the occurrence of LRC
varied considerably within and between subjects, possibly stemming from Nepalese
porters being unaccustomed to running. Alternatively, Fabre et al. (2007) found no
effects of hypoxia on LRC in rowers. While V̇E and ƒB increased as expected with
25
exposure to hypoxia, the rowers significantly increased their stroke rate, resulting in no
change in the LRC ratio or degree of coupling. This result is most likely due to the
mechanical constraints of rowing that make the maintenance of LRC a paramount task.
Conclusion
Although ventilation and locomotion are two independent, complex processes,
there is strong evidence to suggest that there is a coordinated, and possibly required, link
between the two systems. The underlying mechanisms that cause this coordination are
still relatively unknown, though evidence points to an integrated neural response from
afferent feedback and central command output. Probable benefits of LRC are minimized
energetic cost of locomotion and respiratory muscle work, mechanical assistance to
locomotion and ventilation, and decreased perception of ventilatory effort. However,
continued research is needed to elucidate any effect disruptions such as hypoxia have on
these benefits. If disruptions to LRC are caused by hypoxia, they may have a significant
effect on distance runners who sojourn to altitude in an attempt to take advantage of both
hematological and training adaptations.

26
CHAPTER 3
EXPERIMENTAL PROCEDURES
Subjects. Subjects included trained male runners who were recruited through the
IU-Bloomington campus, the IU cross country/track teams, and the local running
community. Inclusion criteria were a) 18-35 years of age, b) non-smoking, c) V̇O2max ≥
60 ml·kg-1·min-1 {normoxia}, d) normal pulmonary function as defined by the American
Thoracic Society, and e) no injury or illness within three weeks prior to participation in
the study. Subjects were tested at the same time of day for each of the visits, and were
instructed to arrive at the laboratory having fasted for the previous 5 hours, having
abstained from caffeine for the previous 8 hours, and having abstained from alcohol
consumption or strenuous exercise in the previous 24 hours. Subjects provided written
informed consent before testing, and the Institutional Review Board of Indiana University
approved all protocols and procedures used in testing.
Study Design. Qualifying subjects completed a two visit testing protocol, with
visits separated by at least 48 hours and a maximum of 14 days. Each visit consisted of
pulmonary function tests followed by a RE/LRC treadmill test in normoxia or hypoxia
(FIO2 = 15.8%; equivalent to 2500m / 8000ft) followed immediately by a ramp to
volitional exhaustion to obtain maximal oxygen uptake (V̇O2max). The order of the
inspired gas conditions was randomized and counterbalanced, and subjects were blinded
to the inspirate. During RE/LRC tests, ventilation, pulmonary gas exchange, and heart

27
rate were continuously monitored. Ratings of perceived exertion (RPE) and dyspnea
were also collected throughout the treadmill tests.
Pulmonary Function. Resting pulmonary function was assessed using inspired
and expired pneumotachographs (Series 3813/4813, Hans Rudolph, Shawnee, KS) and
done in accordance with standard ATS procedures (American Thoracic Society, 1995).
These tests included the measurement of forced vital capacity (FVC), forced expiratory
volume in one second (FEV1), and peak expiratory flow (PEF). Subjects were
familiarized with the performance of FVC maneuvers, and were provided with verbal and
visual feedback. Subjects performed three to five maximal maneuvers consisting of a
maximal inspiration to total lung capacity (TLC) followed by a maximal expiration to
residual lung volume (RV). Subjects were given verbal encouragement during each
maneuver to ensure they reached residual volume, and were provided feedback afterward
in order to help them grasp the concept of the varying efforts. The same procedure was
performed post-exercise, with the largest FVC and FEV1 chosen as a representation of the
subject’s pulmonary function.
Treadmill Tests. Prior to the start of the treadmill test subjects were fitted to an
oro-nasal rubber facemask (7540, Hans Rudolph, Shawnee, Kansas), and a heart rate
monitor (FT1, Polar Electro Inc., Lake Success, NY) to be worn during exercise.
Additionally, flexible and lightweight plastic event switches were adhered to the heel of
each foot inside the shoe to determine the timing of foot strikes while running. Once
fitted with the necessary equipment, each test will began with five minutes of standing in

28
order to collect resting measures. Subjects then ran for five minutes at each of three
constant submaximal speeds of 12.9, 14.3, and 16.1 km/hr (7:30, 6:45, and 6:00
min/mile) at 0% grade, with four minutes standing rest between speeds. After the fifth
minute of the 16.1 km/hr speed, the incline was raised to 2% for the next two minutes,
and continued to increase 2% every two minutes thereafter until volitional fatigue.
Measurements of RE and LRC were taken during the fourth minute of each speed (3:00-
4:00), while RPE and DYS measures were taken during the first 30 seconds of the final
minute at each speed (4:00-4:30) such that any disruption in stride or breathing patterns
due to the rating task were not included in the LRC analysis. Dyspnea and RPE were
assessed again at the conclusion of the test, followed by completion of an
associate/dissociation questionnaire.
Metabolic/Ventilatory Measures. Metabolic and ventilatory variables were
continuously measured during rest and exercise via open circuit, indirect calorimetry.
Subjects wore a facemask (7450, Hans Rudolph, Shawnee, KS) and breathed through a
low resistance, two-way non-breathing valve (2700, Hans Rudolph, Shawnee, KS) from
which expired gases were collected in a 5-liter mixing chamber. Dried samples from this
mixing chamber, sampled at 300 ml min-1, were used to determine fractional
concentrations of O2 and CO2 by separate O2 and CO2 gas analyzers (S-3A /CD-3A,
Ametek Thermox Instruments, Pittsburgh, PA). Analyzers were calibrated pre-test with
known gas concentrations within the physiological range, and were checked both midway
and post-test to correct for any drift. The inspired pneuomotachograph was used to
measure minute ventilation, and was calibrated pre-test using a 3-liter syringe. Heart rate
29
was measured using a telemetry transmitter (FT7, Polar Electro Inc., Lake Success, NY)
placed across the subject’s chest. Oxyhemoglobin saturation was measured via pulse
oximetry (OxiMax N-600x, Nellcor, Minneapolis, MN). All variables were sampled at
50 Hz using a data acquisition system (DASYLab, National Instruments, Norton, MA),
with values being averaged over each minute of exercise. V̇O2max was determined as the
highest recorded V̇O2 over 60s when the subject met two of the three following criteria:
1) a heart rate ≥ 90% of age predicted maximum (220-age), 2) a respiratory exchange
ratio of ≥ 1.10, and 3) a plateau (≤150 ml increase) in V̇O2 with an increase in workload.
Running Economy. Running economy was determined by measuring oxygen
consumption at three constant submaximal speeds at 0% grade on a motorized treadmill
(Model 18-72, Quinton, Bothell, WA). Treadmill speeds of 12.9, 14.3, and 16.1 km/hr
(7:30, 6:45, and 6:00 min/mile) were verified through the use of a laser tachometer
(Model: DT-2234C, Mastech, San Jose, CA) and compared to RPM vs. speed charts
calculated specifically for the length of the treadmill belt. Running economy was
calculated as a) the steady state V̇O2 (ml kg-1 min-1) during the fourth minute of each
submaximal stage, and b) the slope of the regression line relating steady state V̇O2 (ml
kg-1 min-1) to running speed (m min-1). Steady state was defined as a plateau (≤150 ml
increase) in V̇O2 from the previous minute.
Locomotor-Respiratory Coupling. To determine the timing of foot strikes
throughout the treadmill tests, flexible and lightweight plastic event switches (MA-153,
Motion Lab Systems, Inc., Baton Rouge, LA) were taped inside the shoe to the heel of

30
each foot (approximately 4 cm distally from the proximal end of the calcaneus) or the
forefoot of each foot (approximately at the distal end of the fifth metatarsal), and
connected by a BNC cable to the data acquisition system. The switch was positioned so
that it was located at the point of initial ground contact. The timing of inspirations and
expirations was determined via pneumotachographs that continuously measured flow
rates. The data acquisition system was triggered to start kinematic and ventilatory data
collection simultaneously to allow post-hoc analysis, using only the fourth minute of each
stage (the same minute as RE), and the minute during which V̇O2max was achieved, for
LRC analysis. LRC was determined through two measures, the degree of LRC (i.e. the
percent of breaths that occur at a distinct step-to-breath ratio), and phase coupling (i.e.
the relative coordination of the two rhythms, or at which point one rhythm occurs within
the other).
Methods to determine the above measures followed previously used procedures
(Bernasconi & Kohl, 1993; Berry, Dunn, Pittman, Kerr, & Adair, 1996; Paterson et al.,
1987). An in-house, custom software program was used to determine stride and
breathing frequency over the measurement periods. To determine the LRC ratio (integer
step-to-breath ratio), stride frequency was divided by breathing frequency for each
subject and speed. Limits of ± 0.05 of the stride frequency/breathing frequency quotient
were used as boundaries for determination of the ratio (e.g. a quotient between 1.95 and
2.05 would produce a ratio of 2:1), with additional limitation of neither integer being
greater than 5.
Degree of LRC was determined by first ascertaining the time points of inspiration,
expiration, and foot strike. Each step and stride cycle was divided into ten equal parts,

31
and the decile in which each inspiration or expiration occurs was be recorded.
Subsequently, the number of inspirations or expirations beginning in the same decile of
the step (or stride) cycle was divided by the total number of breaths to allow for
expression of the degree of LRC as a percentage. The highest percentage out of
inspirations, expirations, strides, and steps was used as the degree of LRC for that time
period. When coupling appeared to switch between two distinct deciles (determined as
two, and only two, deciles encompassing more breaths than expected to occur by chance;
binomial probability < 0.05), the percentages were summed.
Hypoxic delivery. Three 1000-liter weather balloons were placed in-line on the
inspired breathing line, distal to the inspired pneomotachograph. The balloons were
filled to capacity prior to subject arrival with a gas composition of 15.8% O2 and balance
N2 using a nitrogen generator (CAT 12, Colorado Altitude Training, Boulder, CO). The
balloons were filled during both test days (NORM and HYP) in order to blind subjects to
the inspirate, with the balloon valves staying closed during NORM tests such that the
subjects breathed only room air, albeit through the same length of tubing. A secondary
O2 gas analyzer was used to determine the fractional O2 concentrations of inspired air in
real time, and this value was used continuously for calculation of oxygen uptake.
Data Analysis. Findings were analyzed using SPSS statistical software (Version
24, IBM, Armonk, NY). Descriptive statistics were used to describe group
characteristics, with values presented as mean ± SE. A priori power analysis (G*Power
3.1, Franz Faul, Germany) showed that a sample size of 16 would show detection of

32
meaningful statistical differences. The data were assessed for normality using the
Shapiro-Wilk test and for sphericity using the Mauchly’s test. A 2 x 4 condition
(inspirate) by speed repeated measures ANOVA, with a priori t tests and a post hoc
Tukey’s HSD for simple main effects, was used to test for differences in ventilatory,
metabolic, footstrike, LRC, RPE, dyspnea, and association/dissociation measures across
speeds and between conditions. The alpha for statistical significance for all comparisons
was set at p < 0.05, with a Bonferroni adjustment made for multiple comparisons.

33
References
Alphen, J. van, & Duffin, J. (1994). Entrained breathing and oxygen consumption during
treadmill walking. Canadian Journal of Applied Physiology, 19(4), 432–440.
Amann, M., Blain, G. M., Proctor, L. T., Sebranek, J. J., Pegelow, D. F., & Dempsey, J.
A. (2010). Group III and IV muscle afferents contribute to ventilatory and
cardiovascular response to rhythmic exercise in humans. Journal of Applied
Physiology, 109(4), 966–976.
American Thoracic Society. (1995). Standardization of spirometry: 1994 Update. ATS
Statement. Am J Respir Crit Care Med, 152, 1107–1136.
Asmussen, E., Johansen, S., Jørgensen, M., & Nielsen, M. (1965). On the nervous factors
controlling respiration and circulation during exercise experiments with
curarization. Acta Physiologica Scandinavica, 63(3), 343–350.
Bannister, R., Cunningham, D., & Douglas, C. (1954). The carbon dioxide stimulus to
breathing in severe exercise. The Journal of Physiology, 125(1), 90–117.
Banzett, R. B., Mead, J., Reid, M. B., & Topulos, G. P. (1992). Locomotion in men has
no appreciable mechanical effect on breathing. Journal of Applied Physiology,
72(5), 1922–1926.
Bechbache, R., & Duffin, J. (1977). The entrainment of breathing frequency by exercise
rhythm. The Journal of Physiology, 272(3), 553–561.
Bernasconi, P., & Kohl, J. (1993). Analysis of co-ordination between breathing and
exercise rhythms in man. The Journal of Physiology, 471(1), 693–706.
Berry, M. J., Dunn, C. J., Pittman, C. L., Kerr, W. C., & Adair, N. E. (1996). Increased
ventilation in runners during running as compared to walking at similar metabolic

34
rates. European Journal of Applied Physiology and Occupational Physiology,
73(3-4), 245–250.
Borg, G. A. (1982). Psychophysical bases of perceived exertion. Med Sci Sports Exerc,
14(5), 377–381.
Bramble, D. M., & Carrier, D. R. (1983). Running and breathing in mammals. Science,
219(4582), 251–256.
Brewer, B. W., Van Raalte, J. L., & Linder, D. (1996). Attentional focus and endurance
performance. Applied Research in Coaching and Athletics Annual, 1–14.
Brooks, G. A., Fahey, T. D., White, T. P., & others. (1996). Exercise physiology: Human
bioenergetics and its applications. Mayfield publishing company.
Butler, R. J., Crowell, H. P., & Davis, I. M. (2003). Lower extremity stiffness:
implications for performance and injury. Clinical Biomechanics, 18(6), 511–517.
Cappellini, G., Ivanenko, Y. P., Poppele, R. E., & Lacquaniti, F. (2006). Motor patterns
in human walking and running. Journal of Neurophysiology, 95(6), 3426–3437.
Carroll, J. L., & Agarwal, A. (2010). Development of ventilatory control in infants.
Paediatric Respiratory Reviews, 11(4), 199–207.
Cavanagh, P. R., & Kram, R. (1989). Stride length in distance running: velocity, body
dimensions, and added mass effects. Medicine and Science in Sports and
Exercise, 21(4), 467–479.
Cavanagh, P. R., & Williams, K. R. (1981). The effect of stride length variation on
oxygen uptake during distance running. Medicine and Science in Sports and
Exercise, 14(1), 30–35.

35
Chapman, R. F. (2013). The individual response to training and competition at altitude.
British Journal of Sports Medicine, 47(Suppl 1), i40–i44.
Chapman, R. F., Karlsen, T., Resaland, G. K., Ge, R.-L., Harber, M. P., Witkowski, S.,
… Levine, B. D. (2014). Defining the “dose” of altitude training: how high to live
for optimal sea level performance enhancement. Journal of Applied Physiology,
116(6), 595–603.
Chapman, R. F., Stickford, A. S. L., Lundby, C., & Levine, B. D. (2014). Timing of
return from altitude training for optimal sea level performance. Journal of Applied
Physiology, 116(7), 837–843.
Chapman, R. F., Stray-Gundersen, J., & Levine, B. D. (1998). Individual variation in
response to altitude training. Journal of Applied Physiology, 85(4), 1448–1456.
Clingman, J. M., & Hilliard, D. V. (1990). Race walkers quicken their pace by tuning in,
not stepping out. The Sport Psychologist, 4(1), 25–32.
Daley, M. A., Bramble, D. M., & Carrier, D. R. (2013). Impact loading and locomotor-
respiratory coordination significantly influence breathing dynamics in running
humans. PloS One, 8(8), e70752.
Dalleau, G., Belli, A., Bourdin, M., & Lacour, J.-R. (1998). The spring-mass model and
the energy cost of treadmill running. European Journal of Applied Physiology and
Occupational Physiology, 77(3), 257–263.
Dill, D., Myhre, G., Phillips, E., & Brown, D. (1966). Work capacity in acute exposures
to altitude. Journal of Applied Physiology, 21(4), 1168–1176.

36
Eldridge, F. L., Millhorn, D. E., Killey, J. P., & Waldrop, T. G. (1985). Stimulation by
central command of locomotion, respiration and circulation during exercise.
Respiration Physiology, 59(3), 313–337.
Eldridge, F. L., Millhorn, D. E., & Waldrop, T. G. (1981). Exercise hyperpnea and
locomotion: parallel activation from the hypothalamus. Science, 211(4484), 844–
846.
Fabre, N., Perrey, S., Passelergue, P., & Rouillon, J.-D. (2007). No influence of hypoxia
on coordination between respiratory and locomotor rhythms during rowing at
moderate intensity. Journal of Sports Science & Medicine, 6(4), 526.
Funk, G. D., Steeves, J. D., & Milsom, W. K. (1992). Coordination of wingbeat and
respiration in birds. II.“ Fictive” flight. Journal of Applied Physiology, 73(3),
1025–1033.
Galbo, H., Kjaer, M., & Secher, N. (1987). Cardiovascular, ventilatory and
catecholamine responses to maximal dynamic exercise in partially curarized man.
The Journal of Physiology, 389(1), 557–568.
Garlando, F., Kohl, J., Koller, E., & Pietsch, P. (1985). Effect of coupling the breathing-
and cycling rhythms on oxygen uptake during bicycle ergometry. European
Journal of Applied Physiology and Occupational Physiology, 54(5), 497–501.
Hankinson, J. L., Odencrantz, J. R., & Fedan, K. B. (1999). Spirometric reference values
from a sample of the general US population. American Journal of Respiratory
and Critical Care Medicine, 159(1), 179–187.
Hoffmann, C. P., Torregrosa, G., & Bardy, B. G. (2012). Sound stabilizes locomotor-
respiratory coupling and reduces energy cost.

37
Hogan, M. C., Cox, R., & Welch, H. G. (1983). Lactate accumulation during incremental
exercise with varied inspired oxygen fractions. Journal of Applied Physiology,
55(4), 1134–1140.
Hughes, R. L., Clode, M., Edwards, R., Goodwin, T. J., & Jones, N. L. (1968). Effect of
inspired O2 on cardiopulmonary and metabolic responses to exercise in man.
Journal of Applied Physiology, 24(3), 336–347.
Hunter, I., & Smith, G. A. (2007). Preferred and optimal stride frequency, stiffness and
economy: changes with fatigue during a 1-h high-intensity run. European Journal
of Applied Physiology, 100(6), 653–661.
Jasinskas, C., Wilson, B., & Hoare, J. (1980). Entrainment of breathing rate to movement
frequency during work at two intensities. Respiration Physiology, 42(3), 199–209.
Kay, J., Petersen, E. S., & Vejby-Christensen, H. (1975). Breathing in man during steady-
state exercise on the bicycle at two pedalling frequencies, and during treadmill
walking. The Journal of Physiology, 251(3), 645–656.
Kelman, G., & Watson, A. (1973). Effect of added dead space on pulmonary ventialtion
during sub-maximal, steady-state exercise. Quarterly Journal of Experimental
Physiology and Cognate Medical Sciences, 58(4), 305–313.
Krogh, A., & Lindhard, J. (1913). The regulation of respiration and circulation during the
initial stages of muscular work. The Journal of Physiology, 47(1-2), 112–136.
Levine, B. D., & Stray-Gundersen, J. (1997). “Living high-training low”: effect of
moderate-altitude acclimatization with low-altitude training on performance.
Journal of Applied Physiology, 83(1), 102–112.

38
Maclennan, S. E., Silvestri, G. A., Ward, J., & Mahler, D. A. (1994). Does entrained
breathing improve the economy of rowing? Medicine and Science in Sports and
Exercise, 26(5), 610–614.
McDermott, W. J., Van Emmerik, R. E., & Hamill, J. (2003). Running training and
adaptive strategies of locomotor-respiratory coordination. European Journal of
Applied Physiology, 89(5), 435–444.
Morgan, W. P., & Pollock, M. L. (1977). Psychologic characterization of the elite
distance runner. Annals of the New York Academy of Sciences, 301(1), 382–403.
Paterson, D. J., Wood, G. A., Morton, A. R., & Henstridge, J. D. (1986). The entrainment
of ventilation frequency to exercise rhythm. European Journal of Applied
Physiology and Occupational Physiology, 55(5), 530–537.
Paterson, D. J., Wood, G., Marshall, R. N., Morton, A. R., & Harrison, A. (1987).
Entrainment of respiratory frequency to exercise rhythm during hypoxia. Journal
of Applied Physiology, 62(5), 1767–1771.
Rabler, B., & Kohl, J. (1996). Analysis of coordination between breathing and walking
rhythms in humans. Respiration Physiology, 106(3), 317–327.
Rice, L., Ruiz, W., Driscoll, T., Whitley, C. E., Tapia, R., Hachey, D. L., … Alfrey, C. P.
(2001). Neocytolysis on descent from altitude: a newly recognized mechanism for
the control of red cell mass. Annals of Internal Medicine, 134(8), 652–656.
Scheel, & Romer. (2012). Ventilation and respiratory mechanics. Comprehensive
Physiology.

39
Seebauer, M., Siller, T., & Kohl, J. (2003). Influence of hypoxia on coordination between
breathing and cycling rhythms in women. European Journal of Applied
Physiology, 89(1), 90–94.
Sheel, A. W. (2002). Respiratory muscle training in healthy individuals. Sports Medicine,
32(9), 567–581.
Sinex, J. A., & Chapman, R. F. (2015). Hypoxic training methods for improving
endurance exercise performance. Journal of Sport and Health Science.
Stickford, A. S., & Stickford, J. L. (2014). Ventilation and Locomotion in Humans:
Mechanisms, Implications, and Perturbations to the Coupling of These Two
Rhythms. Springer Science Reviews, 2(1-2), 95–118.
Stickford, A. S., Stickford, J. L., Tanner, D. A., Stager, J. M., & Chapman, R. F. (2015).
Runners maintain locomotor–respiratory coupling following isocapnic voluntary
hyperpnea to task failure. European Journal of Applied Physiology, 1–11.
Takano, N., & Deguchi, H. (1997). Sensation of breathlessness and respiratory oxygen
cost during cycle exercise with and without conscious entrainment of the
breathing rhythm. European Journal of Applied Physiology and Occupational
Physiology, 76(3), 209–213.
Thomas, D. Q., Fernhall, B., & Granat, H. (1999). Changes in Running Economy During
a 5-km Run in Trained Men and Women Runners. The Journal of Strength &
Conditioning Research, 13(2), 162–167.
Villard, S., Casties, J.-F., & Mottet, D. (2005). Dynamic stability of locomotor
respiratory coupling during cycling in humans. Neuroscience Letters, 383(3),
333–338.

40
West, J. B. (2012). Respiratory physiology: the essentials. Lippincott Williams &
Wilkins.
Wilber, R. L., Stray-Gundersen, J., & Levine, B. D. (2007). Effect of hypoxic“ dose” on
physiological responses and sea-level performance. Medicine and Science in
Sports and Exercise, 39(9), 1590–1599.

41
CHAPTERS 4 & 5
MANUSCRIPT

42
Locomotor-respiratory coupling is maintained in hypoxia in trained distance runners Timothy J. Fulton1, Hunter L. Paris1, Abigail S.L. Stickford2, Allison H. Gruber1, Timothy D. Mickleborough1, and Robert F. Chapman1
1Department of Kinesiology, School of Public Health-Bloomington, Indiana University,
Bloomington, Indiana, USA
2Department of Health and Exercise Science, College of Health Sciences, Appalachian
State University, Boone, NC
Address for correspondence:
Robert F. Chapman, Ph.D., FACSM
Department of Kinesiology, School of Public Health-Bloomington, Indiana University
Suite 112
1025 East Seventh Street
Bloomington, IN 47405, USA
Telephone: 1-812-856-2452
E-mail: [email protected]
Running Title: LRC is maintained in hypoxia

43
Abstract
To determine if acute exposure to normobaric hypoxia alters locomotor-respiratory
coupling (LRC) patterns typically observed in trained runners, 13 trained male distance
runners performed a running economy (RE) and maximal oxygen uptake (V̇O2max) test in
normoxia (NORM) and in hypoxia (HYP) (FIO2 = 15.8%; ~ 2500m / 8000ft) on separate
days. RE and LRC measures were taken during the fourth minute of each submaximal
speed (12.9, 14.3, and 16.1 km hr-1), while ratings of perceived exertion (RPE) and
dyspnea (DYS) were taken during the first 15 seconds of the final minute at each speed,
and again at the conclusion of the maximal test. Stride frequency-to-breathing frequency
quotients were significantly lower at each submaximal speed in HYP (12.9 km hr-1: 2.91
± 0.20 vs. 2.45 ± 0.17, 14.3 km hr-1: 2.53 ± 0.17 vs. 2.21 ± 0.14, 16.1 km hr-1: 2.22 ± 0.14
vs. 1.95 ± 0.09; p < 0.05) due to increases in breathing frequency while maintaining
stride frequency. Compared with NORM, the degree of LRC (range: 36 - 99%) was not
significantly different at any of the three common submaximal speeds with exposure to
HYP. However, the degree of LRC was increased at V̇O2max (43.8 ± 3.4% vs. 57.1 ±
3.8%; p < 0.05). Breathing frequency (breaths min-1) was significantly increased at each
submaximal speed in HYP compared to NORM (12.9 km hr-1: 30.3 ± 1.9 vs. 35.9 ± 2.2;
14.3 km hr-1: 34.8 ± 2.0 vs. 39.8 ± 2.2; 16.1 km hr-1: 40.4 ± 2.4 vs. 45.2 ± 1.9; all speeds p
< 0.05), but was not significantly different at V̇O2max. RE and RPE were not significantly
different at any speed. DYS was only significantly different between NORM and HYP at
16.1 km hr-1 (p < 0.05). In conclusion, trained distance runners are able to maintain LRC
in hypoxia, even when breathing frequency is increased at any submaximal pace. Within
this unique population, years of training may enhance and optimize the ability to make

44
adjustments to maintain LRC in order to minimize metabolic costs. However, there may
be individual differences to LRC that could affect performance or the response to training
at altitude.

45
Introduction
Endurance athletes commonly use altitude training as a means to improve sea
level performance. However, even when following best practice guidelines, considerable
variation in physiological responses to altitude and subsequent performance exists
(Chapman et al., 1998). Because the response to altitude training depends on both
physiological acclimatization and training adaptations, each represent possible areas of
explanation for the variation. Of the number of factors that can affect the ability to
complete endurance exercise training at altitude, one of the most immediate responses to
acute altitude exposure is an increase in ventilation at any submaximal exercising
workload. The ventilatory response to exercise is unique in having both physiological
outcomes (e.g. defending arterial oxyhemoglobin saturation, but with a metabolic cost of
increased work of breathing) and psychological outcomes (e.g. dyspnea). As a result,
ventilatory control during exercise at altitude can have a strong influence on workload
selection, perception of effort, and ultimately the training response at altitude.
Interestingly, one factor involved in ventilatory control is locomotor-respiratory coupling
(LRC). Defined as a stable frequency and phase locking between pulmonary respiration
and locomotion, any deviation to these LRC components could disrupt the athlete’s
training response, and therefore ultimately attenuate performance gains.
Although the reasons for the existence of LRC are not fully understood, it is
believed to aid in decreasing the energetic cost of locomotion. Higher and more stable
degrees of LRC during cycling and running are linked to decreases in oxygen
consumption (Bernasconi & Kohl, 1993; Garlando et al., 1985; Hoffmann et al., 2012;
Villard et al., 2005). Therefore, any perturbation to the components of LRC such as

46
hypoxia-induced increases in breathing frequency could have negative energetic
consequences. Higher degrees of LRC also decrease the perception of ventilatory effort
during exercise (Takano & Deguchi, 1997). Thus, there may be perceptual as well as
physiological benefits to increasing the degree of LRC. This may be especially true for
trained athletes, who “associate” during exercise, and are very cognizant of changes in
their own physiological variables such as breathing frequency or tidal volume (Morgan &
Pollock, 1977).
Environments that alter breathing patterns, such as hypoxia, may influence LRC.
However, evidence of changes to LRC in hypoxia is inconclusive. Patterson et al. (1987)
found decreases in the degree of LRC in runners exercising in hypoxia when compared to
normoxia, while Fabre et al. (Fabre et al., 2007) and Seebauer et al. (Seebauer et al.,
2003) showed no change to LRC in rowers and cyclists, respectively. Moreover, the
consequences of altering LRC in hypoxia, such as changes to running economy (RE) and
perceptions of ventilatory effort, remain to be elucidated. Although some studies have
shown no alterations in RE during acute hypoxic exposure, none have quantified RE and
LRC simultaneously in hypoxia (Dill, Myhre, Phillips, & Brown, 1966; Hogan, Cox, &
Welch, 1983; Hughes, Clode, Edwards, Goodwin, & Jones, 1968).
Therefore, the purpose of this study was to determine if acute exposure to hypoxia
alters LRC patterns typically observed in trained runners, and investigate the effects these
possible LRC alterations have on RE and perceptions of ventilatory effort. Our primary
hypothesis was that when compared to normoxia, hypoxic exercise at common
submaximal speeds would reduce the degree of LRC due to increased breathing
frequency at a stable stride frequency. We also hypothesized that due to reductions in the

47
degree of LRC, subjects would have worse running economy (i.e. increased oxygen
uptake), and increased dyspnea.
Methods
Subjects
Trained male distance runners were recruited for this study. Inclusion criteria
were a) 18-35 years of age, b) non-smoking, c) V̇O2max ≥ 60 ml kg-1 min-1 in normoxia,
and d) normal pulmonary function as defined by the American Thoracic Society
(American Thoracic Society, 1995). Subjects were tested at the same time of day for
each of the visits, and were instructed to arrive at the laboratory having fasted for the
previous 5 hours, having abstained from caffeine for the previous 8 hours, and having
abstained from alcohol consumption or strenuous exercise in the previous 24 hours. All
subjects provided written informed consent to protocols that were approved by the
Institutional Review Board of Indiana University.
Study Design
Qualified subjects completed two visits to the laboratory, with visits separated by
at least 48 hours. Each visit consisted of pulmonary function tests followed by a
treadmill test to determine RE and LRC. The treadmill test occurred in normoxia
(NORM) or hypoxia (HYP; FIO2 = 15.8%; equivalent to ~2400m / 8000ft) and was
followed immediately by a ramp to volitional exhaustion to obtain maximal oxygen
uptake (V̇O2max). The order of the inspired gas conditions was randomized and
counterbalanced, and subjects were blinded to the inspirate.

48
Protocol
Upon arrival subjects completed physical activity readiness and running history
questionnaires followed by anthropometric measurements. Subjects were then
instrumented with event switches that were taped to each foot and connected to flexible,
lightweight extension cables adhered to the lateral side of each leg and hip. Subjects
were subsequently shown and explained the Borg rating of perceived exertion (RPE) and
dyspnea (DYS) scales, and performed pulmonary function tests (PFT). The RE/LRC
treadmill test began with three to five minutes of quiet standing to collect resting
ventilatory and metabolic data. Following rest, subjects ran for five minutes at each of
three constant submaximal speeds of 12.9, 14.3, and 16.1 km hr-1 (7:30, 6:45, and 6:00
min min-1) at 0% grade on a motorized treadmill (Model 18-72, Quinton, Bothell, WA)
with four minutes standing rest between speeds. Treadmill speed was verified through the
use of a laser tachometer (Model: DT-2234C, Mastech, San Jose, CA). After the fifth
minute of running at the 16.1 km hr-1 speed, the incline of the treadmill was raised to 2%
for the next two minutes, and continued to increase 2% every two minutes thereafter until
volitional fatigue. Measurements of RE and LRC were taken during the fourth minute of
each speed (3:00-4:00), while RPE and DYS measures were taken during the first 30
seconds of the final minute at each speed (4:00-4:30) such that any disruption in stride or
breathing patterns due to the rating task were not included in the LRC analysis. DYS and
RPE were assessed again at the conclusion of the test, followed by completion of an
attentional focus questionnaire to determine association (ASSOC) and dissociation

49
(DISSOC) scores (Brewer, Van Raalte, & Linder, 1996). RPE and DYS were assessed
using the original and modified Borg scales, respectively (Borg, 1982).
Pulmonary function
Resting pulmonary function was assessed using inspired and expired
pneumotachographs (Series 3813/4813, Hans Rudolph, Shawnee, KS) and done in
accordance with standard ATS procedures (American Thoracic Society, 1995). Subjects
were familiarized with the performance of forced vital capacity (FVC) maneuvers, and
were provided with verbal and visual feedback. Subjects performed three to five
maximal maneuvers consisting of a maximal inspiration to total lung capacity (TLC)
followed by a maximal expiration to residual lung volume (RV). Subjects were given
verbal encouragement during each maneuver to ensure they reached residual volume.
The same procedure was performed post-exercise, with the largest FVC and FEV1 chosen
as a representation of the subject’s pulmonary function.
Metabolic parameters
Metabolic and ventilatory variables were continuously measured during rest and
exercise via open circuit, indirect calorimetry. Subjects wore a facemask (7450, Hans
Rudolph, Shawnee, KS) and breathed through a low resistance, two-way non-breathing
valve (2700, Hans Rudolph, Shawnee, KS) from which expired gases were collected in a
5-liter mixing chamber. Dried samples from this mixing chamber, sampled at 300 ml
min-1, were used to determine fractional concentrations of O2 and CO2 by separate O2 and
CO2 gas analyzers (S-3A /CD-3A, Ametek Thermox Instruments, Pittsburgh, PA).

50
Analyzers were calibrated pre-test with known gas concentrations within the
physiological range, and were checked both midway and post-test to correct for any drift.
The previously mentioned inspired pneuomotachograph was used to measure minute
ventilation, and was calibrated pre-test using a 3-liter syringe. Heart rate was measured
using a telemetry transmitter (FT7, Polar Electro Inc., Lake Success, NY) placed across
the subject’s chest. Oxyhemoglobin saturation was measured via pulse oximetry
(OxiMax N-600x, Nellcor, Minneapolis, MN). All dependent variables were sampled at
50 Hz using a data acquisition system (DASYLab, National Instruments, Norton, MA),
with values being averaged over each minute of exercise. RE was calculated as a) the
steady state V̇O2 (ml kg-1 min-1) during the fourth minute of each submaximal stage, and
b) the slope of the regression line relating steady state V̇O2 (ml kg-1 min-1) to running
speed (km hr-1). Steady state was defined as a plateau (≤150 ml increase) in V̇O2 from
the previous minute. V̇O2max was determined as the highest recorded V̇O2 over 60s when
the subject met two of the three following criteria: 1) a heart rate ≥ 90% of age predicted
maximum (220-age), 2) a respiratory exchange ratio of ≥ 1.10, and 3) a plateau (≤150 ml
increase) in V̇O2 with an increase in workload.
Locomotor-respiratory coupling
Locomotor-respiratory coupling was determined as described previously in our
laboratory (Stickford et al., 2015). Briefly, to determine the timing of foot strikes during
the treadmill tests, flexible and lightweight plastic event switches (MA-153, Motion Lab
Systems, Inc., Baton Rouge, LA) were taped inside the shoe to either the heel or fifth
metatarsal of each foot depending on the subject’s habitual foot strike pattern (heel:

51
approximately 4 cm distally from the proximal end of the calcaneus; forefoot:
approximately at the distal end of the fifth metatarsal). The switch was positioned so that
it was located at the point of initial ground contact, and was connected to the data
acquisition system by a BNC cable. The timing of inspirations and expirations was
determined via pneumotachographs that continuously measured flow rates. The data
acquisition system was triggered to start kinematic and ventilatory data collection
simultaneously to allow post-hoc analysis, using only the fourth minute of each stage (the
same minute as RE), and the minute during which V̇O2max was achieved for LRC
analysis.
An in-house software program allowed for calculation of the stride (i.e. left-to-left
and right-to-right footstrike), step (i.e. left-to-right and right-to-left footstrike), and
breathing frequencies, as well as time points of footstrike, inspiration, and expiration.
Following an originally described protocol (Bernasconi & Kohl, 1993) that has
previously been utilized in our laboratory (Stickford et al., 2015), each stride and step
cycle was divided into ten equal parts, and the decile in which each inspiration or
expiration occurred was determined. Subsequently, the highest number of inspirations or
expirations beginning in the same decile of the step cycle was divided by the total
number of breaths to allow for expression of the degree of LRC as a percentage. The
highest percentage out of inspirations, expirations, strides, and steps was used as the
degree of LRC for that time period. The percentages were summed when coupling
appeared to switch between two distinct deciles (determined as two, and only two, deciles
encompassing more breaths than expected to occur by chance; binomial probability <
0.05).

52
Hypoxic delivery
Three 1000-liter weather balloons were placed in-line on the inspired breathing
line, distal to the inspired pneomotachograph. The balloons were filled to capacity prior
to subject arrival with a gas composition of 15.8% O2 and balance N2 using a nitrogen
generator (CAT 12, Colorado Altitude Training, Boulder, CO). The balloons were filled
during both test days (NORM and HYP) in order to blind subjects to the inspirate, with
the balloon valves staying closed during NORM tests such that the subjects breathed only
room air, albeit through the same length of tubing. A secondary O2 gas analyzer was
used to determine the fractional O2 concentrations of inspired air in real time, and this
value was used continuously for calculation of oxygen uptake.
Statistical analysis
Findings were analyzed using SPSS statistical software (Version 24, IBM,
Armonk, NY). Descriptive statistics were used to describe group characteristics, with
values presented as mean ± SE. A priori power analysis (G*Power 3.1, Franz Faul,
Germany) showed that a sample size of 16 would show detection of meaningful statistical
differences. The data were assessed for normality using the Shapiro-Wilk test and for
sphericity using Mauchly’s test. A 2 x 4 condition (inspirate) by speed repeated
measures ANOVA with a post hoc Tukey’s HSD for simple main effects was used to test
for differences in ventilatory, metabolic, footstrike, LRC, RPE, and DYS across speeds
and between conditions. Paired t-tests were used to evaluate ASSOC and DISSOC. The
alpha for statistical significance for all comparisons was set at p < 0.05.

53
Results
Subjects
Subject characteristics are displayed in Table 1. Sixteen men volunteered to
participate in the study, however three were unable to meet the V̇O2max criteria or
voluntarily withdrew from the study. Therefore, thirteen trained male distance runners
successfully completed the entire study. All subjects displayed normal pulmonary
function, similar to those predicted by sex, age, race, and height (87% of predicted FVC;
93% of predicted FEV1) (Hankinson, Odencrantz, & Fedan, 1999).
Table 1 Subject characteristics and pulmonary function
Age (year) 23.4 ± 0.9 Mass (kg) 68.7 ± 1.8
Height (cm) 170 ± 0.01
V̇O2max (ml kg-1 min-1) (NORM) 66.8 ± 1.1
V̇O2max (ml kg-1 min-1) (HYP) 59.7 ± 0.8
FVC (L) 4.92 ± 0.07 (87)
FEV1 (L) 4.32 ± 0.07 (93)
FEV1 (% FVC) 88 ± 2
PEF (L s-1) 8.93 ± 0.1 (105) Displayed are mean ± SE (Percent Predicted; based on Hankinson et al. 1999) V̇O2max maximal oxygen uptake, FVC forced vital capacity, FEV1 forced expiratory volume in 1 s, PEF peak expiratory flow
Locomotor Respiratory Coupling
Breathing frequency (breaths min-1) was significantly increased at each
submaximal speed in HYP compared to NORM (12.9 km hr-1: 30.3 ± 1.9 vs. 35.9 ± 2.2;
14.3 km hr-1: 34.8 ± 2.0 vs. 39.8 ± 2.2; 16.1 km hr-1: 40.4 ± 2.4 vs. 45.2 ± 1.9; all speeds p
< 0.05). At V̇O2max the difference in breathing frequency between NORM and HYP was
approaching significance (51.8 ± 1.8 vs. 56.2 ± 1.7; p = 0.07). Stride frequency (strides
min-1) did not differ between NORM and HYP at any speed (12.9 km hr-1: 83.8 ± 1.4 vs.

54
83.9 ± 1.1; 14.3 km hr-1: 84.3 ± 1.4 vs. 84.2 ± 1.1; 16.1 km hr-1: 86.0 ± 1.3 vs. 86.1 ± 1.3;
V̇O2max: 87.2 ± 1.5 vs. 86.6 ± 1.4; p = 0.50 - 0.93). The combination of consistent stride
frequency with elevated breathing frequencies resulted in significantly lower stride
frequency-to-breathing frequency quotients (SF/fb) at the submaximal speeds during HYP
compared to NORM (Table 2). The most common coupling quotient was 2:1 (29%),
followed by 5:3 (19%) and 5:2 (19%).
Table 2 Locomotor-Respiratory Coupling measures during treadmill running
12.9 km hr-1 14.3 km hr-1 16.1 km hr-1 V̇O2max
NORM HYP NORM HYP NORM HYP NORM HYP
SF/fb 2.91 ± 0.20 2.45 ± 0.17* 2.53 ± 0.17 2.21 ± 0.14* 2.22 ± 0.14 1.95 ± 0.09* 1.70 ± 0.06 1.56 ± 0.06 Degree of LRC (%) 63.6 ± 4.6 61.4 ± 4.8 60.2 ± 3.7 55.1 ± 5.3 56.8 ± 3.9 53.9 ± 3.0 43.8 ± 3.4 57.1 ± 3.8*
Displayed are mean ± SE SF stride frequency (strides min-1), fb frequency of breathing (breath min-1), SF/fb stride frequency-to-breathing frequency quotient, Degree of LRC percentage of breaths beginning in the same decile of the step or stride cycle * Significantly different than NORM at the same speed or at volitional exhaustion (p < 0.05)
Across speeds and conditions the average degree of LRC (calculated as the
percentage of inspirations or expirations beginning in the same decile of the step or stride
cycle) was 56.6 ± 15.5 %. All subjects displayed an average degree of LRC greater than
that expected by chance. Compared with NORM, the degree of LRC was not
significantly different at any of the three common submaximal speeds with exposure to
HYP (p = 0.18 - 0.61), however it was significantly increased at V̇O2max. Group data are
presented in Table 2, and individual data in Table 3. The degree of LRC and breathing
frequency were significantly inversely correlated when running at 16.1 km hr-1 in NORM
(r = -0.62), and were approaching significance (p = 0.096) at 16.1 km hr-1 in HYP (r= -
0.48).

55
Table 3 Individual subject stride frequency-to-breathing frequency quotient and degree of locomotor-respiratory coupling
12.9 km hr-1 14.3 km hr-1 16.1 km hr-1 V̇O2max
Subject NORM HYP NORM HYP NORM HYP NORM HYP
1 2.47 (99) 2.07 (74) 2.28 (76) 1.85 (72) 1.86 (73) 1.85 (70) 1.73 (44) 1.70 (50) 2 2.93 (54) 2.81 (28) 2.69 (50) 2.80 (28) 2.57 (51) 2.47 (39) 1.70 (43) 1.81 (33) 3 3.03 (54) 2.16 (63) 2.73 (51) 2.08 (80) 2.29 (58) 1.85 (48) 1.65 (27) 1.53 (61)
4 2.82 (74) 2.15 (80) 2.30 (73) 1.86 (54) 2.01 (60) 1.78 (62) 1.79 (48) 1.63 (82)
5 3.02 (63) 2.33 (56) 2.54 (56) 2.08 (47) 2.15 (45) 1.94 (54) 1.91 (52) 1.89 (67)
6 3.95 (60) 3.82 (60) 3.04 (59) 3.05 (65) 3.03 (75) 2.59 (58) 1.98 (58) 1.82 (70)
7 2.58 (51) 2.50 (52) 2.02 (50) 2.08 (41) 1.76 (44) 1.92 (52) 1.61 (18) 1.53 (52)
8 3.95 (50) 3.04 (62) 3.95 (66) 2.61 (53) 3.11 (72) 2.13 (60) n/a (n/a) 1.23 (45)
9 3.90 (94) 3.12 (96) 3.09 (92) 3.07 (95) 2.64 (80) 2.22 (74) 1.84 (51) 1.43 (56)
10 2.44 (71) 2.46 (47) 2.29 (56) 1.93 (53) 2.25 (40) 1.73 (46) 1.73 (51) 1.56 (67)
11 1.77 (50) 1.56 (76) 1.55(59) 1.47 (55) 1.40 (42) 1.41 (47) 1.18 (34) 1.29 (42)
12 1.94 (47) 1.75 (45) 2.11 (45) 1.92 (28) 2.04 (49) 1.79 (56) 1.63 (44) 1.33 (48) 13 3.00 (60) 2.14 (59) 2.30 (50) 1.88 (45) 1.81 (49) 1.62 (36) 1.70 (55) 1.53 (69)
Displayed are mean ± SE Presented as SF/fb (Degree of LRC as a percent)
Metabolic Variables
All subjects were able to reach a steady state of oxygen uptake (≤150 ml increase
in V̇O2 from the previous minute) within three minutes at each submaximal speed.
Running economy, expressed as steady state oxygen uptake (ml kg-1 min-1) was not
statistically significant between NORM and HYP (Table 4), nor was running economy
expressed as the slope of the regression line relating steady state oxygen uptake (ml kg-1
min-1) to running speed (km min-1). The submaximal running speeds corresponded to
V̇O2 values that were 64, 70, and 79% of V̇O2max in NORM, and 72, 79, and 88% of
V̇O2max in HYP. The degree of LRC and oxygen uptake were not significantly correlated
at any submaximal speed or at V̇O2max in either NORM or HYP, nor were any percent
changes in degree of LRC and oxygen consumption from NORM to HYP.
Ventilatory measures are summarized in Table 4. Minute ventilation was
significantly higher at each common submaximal speed in HYP compared to NORM, but
did not differ at V̇O2max. As tidal volume did not differ between NORM and HYP at any

56
speed, or at V̇O2max, the achievement of increased ventilation was due to increases in
breathing frequency. The ventilatory equivalent for oxygen was significantly greater at
each common speed, and at V̇O2max, in HYP compared to NORM. Oxyhemoglobin
saturation was significantly lower prior to exercise in HYP compared to NORM (92 ±
0.6% vs. 98 ± 0.3%) and significantly lower at V̇O2max in HYP compared to NORM (80 ±
1.2% vs. 91 ± 0.9%)
Table 4 Physiological measures during treadmill running
12.9 km hr-1 14.3 km hr-1 16.1 km hr-1 V̇O2max
NORM HYP NORM HYP NORM HYP NORM HYP
V̇O2 (ml kg-1 min-1) 42.9 ± 1.0 43.0 ± 0.8 46.4 ± 1.0 47.0 ± 0.9 52.5 ± 1.0 52.6 ± 0.9 66.8 ± 1.1 59.7 ± 0.8*
V̇E (L min-1) 71.3 ± 2.3 85.3 ± 3.1* 82.8 ± 2.5 97.3 ± 3.5* 100.6 ± 3.3 119.1 ± 4.4* 157.4 ± 3.7 159.9 ± 4.7
fb (breath min-1) 30.3 ± 1.9 35.9 ± 2.2* 34.8 ± 2.0 39.8 ± 2.2* 40.4 ± 2.4 45.2 ± 1.9* 51.8 ± 1.8 56.2 ± 1.7
TV (L breath-1) 2.44 ± 0.15 2.47± 0.16 2.45 ± 0.13 2.52 ± 0.14 2.56 ± 0.13 2.67 ± 0.12 3.06 ± 0.13 2.88 ± 0.12
HR (beats min-1) 142 ± 4 149 ± 3 155 ± 4 163 ± 3 170 ± 3 176 ± 3 194 ± 2 189 ± 2*
V̇E/ V̇O2 24.2 ± 0.7 29.0 ± 0.8* 26.0 ± 0.7 30.0 ± 0.8* 27.9 ± 0.9 33.0 ± 1.0* 34.3 ± 0.9 39.1 ± 0.9* Displayed are mean ± SE V̇O2 volume of oxygen uptake, V̇E minute ventilation, fb frequency of breathing, TV tidal volume, HR heart rate, V̇E/ V̇O2 ventilatory equivalent for oxygen. NORM, normoxia; HYP, hypoxia (15.8%). * Significantly different than NORM at the same speed or at volitional exhaustion (p < 0.05)
Perceptual Variables
DYS was significantly higher in HYP than in NORM, but only when running at
16.1 km hr-1 (Figure 1A). No significant differences were found for RPE between
conditions (Figure 1B). DYS was significantly correlated to minute ventilation at V̇O2max
in NORM (r = 0.82), and also to the degree of LRC at 12.9 km hr-1 in HYP (r = 0.56).
Subjects’ ASSOC scores (56 ± 2 in NORM and 52 ± 3 in HYP) were significantly higher
than their DISSOC scores (27 ± 1 in NORM and 26 ± 2 in HYP).

57
B.
A.
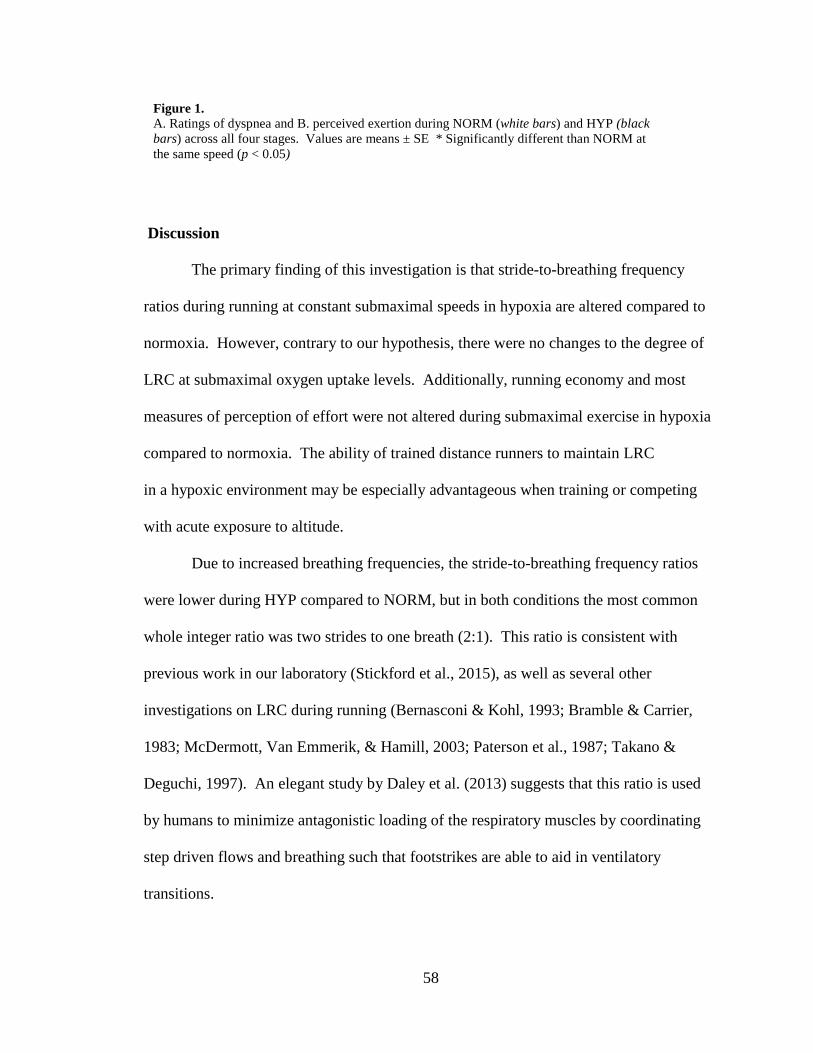
58
Discussion
The primary finding of this investigation is that stride-to-breathing frequency
ratios during running at constant submaximal speeds in hypoxia are altered compared to
normoxia. However, contrary to our hypothesis, there were no changes to the degree of
LRC at submaximal oxygen uptake levels. Additionally, running economy and most
measures of perception of effort were not altered during submaximal exercise in hypoxia
compared to normoxia. The ability of trained distance runners to maintain LRC
in a hypoxic environment may be especially advantageous when training or competing
with acute exposure to altitude.
Due to increased breathing frequencies, the stride-to-breathing frequency ratios
were lower during HYP compared to NORM, but in both conditions the most common
whole integer ratio was two strides to one breath (2:1). This ratio is consistent with
previous work in our laboratory (Stickford et al., 2015), as well as several other
investigations on LRC during running (Bernasconi & Kohl, 1993; Bramble & Carrier,
1983; McDermott, Van Emmerik, & Hamill, 2003; Paterson et al., 1987; Takano &
Deguchi, 1997). An elegant study by Daley et al. (2013) suggests that this ratio is used
by humans to minimize antagonistic loading of the respiratory muscles by coordinating
step driven flows and breathing such that footstrikes are able to aid in ventilatory
transitions.
Figure 1. A. Ratings of dyspnea and B. perceived exertion during NORM (white bars) and HYP (black bars) across all four stages. Values are means ± SE * Significantly different than NORM at the same speed (p < 0.05)

59
Although running in hypoxia did increase breathing frequency in the face of a
stable stride frequency, it did not reduce the degree of LRC, contrary to our initial
hypothesis. Previously, Patterson et al. (1987) did observe decreases in the degree of
LRC during hypoxic running (~65% at 915m, ~62% at 2135m, ~50% at 3200m, ~33% at
4420m, and ~23% at 5030 m), suggesting that hypoxia increases breathing frequency to
such an extent that it causes uncoupling. Perhaps the reason we did not observe a similar
outcome was that our hypoxic stimulus was not strong enough to elicit this response. We
chose to utilize an inspired gas of 15.8% oxygen (equivalent to ~2400m / 8000ft) as this
is most similar to the elevation endurance athletes sojourn to during altitude training
camps. Paterson et al. (1987) tested subjects across a range of elevations, with the most
drastic decreases in the degree of LRC occurring at elevations from 3000-5000+ meters.
The maintenance of the degree of LRC in our study is consistent with the findings
of Fabre et al. (2007) and Seebauer et al. (2003). Fabre et al. (2007) did not observe any
changes in the degree of LRC in rowers while exercising in hypoxia compared to
normoxia. While V̇E and ƒB increased as expected with exposure to hypoxia, the rowers
concomitantly increased their stroke rate, which also resulted in a consistent LRC ratio
(stroke rate-to-breathing frequency). It was suggested that the neuro-mechanical stimuli
linking the specific locomotor aspects of rowing and respiration was “stronger” than the
peripheral chemoreceptor stimuli induced by hypoxia. We believe our results mirror this
conclusion, as the rowers completed the hypoxic tests at an elevation of 2877 meters,
only slightly higher than our inspired gas equivalent. Seebauer et al. found comparable
effects of hypoxia during cycling exercise, where no decrements in the degree of LRC
were observed at any of three separate workloads. In fact, the degree of LRC was

60
increased at a workload of 95% peak oxygen consumption. This finding is parallel to our
results, as we observed a significantly higher degree of LRC at V̇O2max in hypoxia
compared to normoxia. This increase in the degree of LRC, as well as maintenance at
submaximal workloads in hypoxia, may be an additional illustration of the established
ability of trained endurance runners to self-optimize kinematic and physiological
variables (Cavanagh & Kram, 1989; Hunter & Smith, 2007; Stickford et al., 2015).
Subjects in our study exhibited a much higher associative than dissociative focus
during exercise in both normoxia and hypoxia. These results are consistent with the
hypothesis that trained distance runners tend to use associative attentional strategies
during exercise instead of dissociative strategies employed by novice individuals in order
to maximize exercise performance (Brewer et al., 1996; Clingman & Hilliard, 1990;
Morgan & Pollock, 1977). It is plausible that subjects in our study utilized an attentional
strategy to monitor changes in physiological variables such as breathing frequency and
stride frequency in order to maintain the degree of LRC in hypoxia, and therefore
maintain RE. This maintenance of LRC and RE are in agreement with previous work
examining the degree of LRC and oxygen uptake (Alphen & Duffin, 1994; Maclennan et
al., 1994). Although the worsening of RE (increase in oxygen uptake) in parallel with a
decrease in the degree of LRC has been observed by Bernasconi and Kohl (1993), as well
as Garlando et al. (1985), as we did not detect changes to the degree of LRC, we would
not expect economy to differ. The associative strategy used to maintain the degree of
LRC seemed to allow RPE and DYS to remain relatively unchanged as well.
Despite the lack of mean differences, the ability to maintain LRC in hypoxia was
not universally seen across our cohort of well-trained runners. For example, select

61
subjects (e.g. subject 2 in Figure 2A) displayed large decreases in the degree of LRC
from NORM to HYP across stages, while others (e.g. subject 3 in Figure 2A) had a
similar, or even elevated, degree of LRC between conditions. Concurrent with the
decreases in the degree of LRC, subject 2 also had increased oxygen uptake from NORM
to HYP at the first two stages, while subject 3 was able to maintain oxygen uptake
(Figure 2B). While both subjects saw decreases in V̇O2max from NORM to HYP, subject
3, who had a substantial increase in the degree of LRC in hypoxia, had less of a
decrement in V̇O2max than subject 2. The responses of subject 2 suggest that if there are
substantial reductions in the degree of LRC in hypoxia it may (as others have shown)
lead to increases in oxygen uptake, while the responses of subject 3 may be evidence that
the maintenance of the degree of LRC in hypoxia is beneficial for mitigating the decline
in VO2max at altitude. Due to the well-established presence of individual variation in
the response to hypoxia (Chapman et al., 1998), future inquiries into factors limiting
exercise performance at altitude should consider including LRC as a variable of interest.
Conclusion
Trained distance runners are able to maintain LRC in hypoxia, even when breathing
frequency is increased at any submaximal pace. It is possible that within this unique
population, years of training enhance and optimize the ability to make adjustments to
LRC in order to minimize metabolic costs. However, there may be individual differences
to LRC that could affect performance or the response to training at altitude.

62
Figure 2 A. Degree of LRC, B. V̇O2, and C. SF/fb for individual subject #2 (line and filled circle) and subject #3 (dashed line and open circle) across all four stages (N = NORM, H = HYP; 1 = 12.9 km hr-1, 2 = 14.3 km hr-1, 3 = 16.1 km hr-1, 4 = V̇O2max).

63
References
Alphen, J. van, & Duffin, J. (1994). Entrained breathing and oxygen consumption during
treadmill walking. Canadian Journal of Applied Physiology, 19(4), 432–440.
Amann, M., Blain, G. M., Proctor, L. T., Sebranek, J. J., Pegelow, D. F., & Dempsey, J.
A. (2010). Group III and IV muscle afferents contribute to ventilatory and
cardiovascular response to rhythmic exercise in humans. Journal of Applied
Physiology, 109(4), 966–976.
American Thoracic Society. (1995). Standardization of spirometry: 1994 Update. ATS
Statement. Am J Respir Crit Care Med, 152, 1107–1136.
Asmussen, E., Johansen, S., Jørgensen, M., & Nielsen, M. (1965). On the nervous factors
controlling respiration and circulation during exercise experiments with
curarization. Acta Physiologica Scandinavica, 63(3), 343–350.
Bannister, R., Cunningham, D., & Douglas, C. (1954). The carbon dioxide stimulus to
breathing in severe exercise. The Journal of Physiology, 125(1), 90–117.
Banzett, R. B., Mead, J., Reid, M. B., & Topulos, G. P. (1992). Locomotion in men has
no appreciable mechanical effect on breathing. Journal of Applied Physiology,
72(5), 1922–1926.
Bechbache, R., & Duffin, J. (1977). The entrainment of breathing frequency by exercise
rhythm. The Journal of Physiology, 272(3), 553–561.
Bernasconi, P., & Kohl, J. (1993). Analysis of co-ordination between breathing and
exercise rhythms in man. The Journal of Physiology, 471(1), 693–706.

64
Berry, M. J., Dunn, C. J., Pittman, C. L., Kerr, W. C., & Adair, N. E. (1996). Increased
ventilation in runners during running as compared to walking at similar metabolic
rates. European Journal of Applied Physiology and Occupational Physiology,
73(3-4), 245–250.
Borg, G. A. (1982). Psychophysical bases of perceived exertion. Med Sci Sports Exerc,
14(5), 377–381.
Bramble, D. M., & Carrier, D. R. (1983). Running and breathing in mammals. Science,
219(4582), 251–256.
Brewer, B. W., Van Raalte, J. L., & Linder, D. (1996). Attentional focus and endurance
performance. Applied Research in Coaching and Athletics Annual, 1–14.
Brooks, G. A., Fahey, T. D., White, T. P., & others. (1996). Exercise physiology: Human
bioenergetics and its applications. Mayfield publishing company.
Butler, R. J., Crowell, H. P., & Davis, I. M. (2003). Lower extremity stiffness:
implications for performance and injury. Clinical Biomechanics, 18(6), 511–517.
Cappellini, G., Ivanenko, Y. P., Poppele, R. E., & Lacquaniti, F. (2006). Motor patterns
in human walking and running. Journal of Neurophysiology, 95(6), 3426–3437.
Carroll, J. L., & Agarwal, A. (2010). Development of ventilatory control in infants.
Paediatric Respiratory Reviews, 11(4), 199–207.
Cavanagh, P. R., & Kram, R. (1989). Stride length in distance running: velocity, body
dimensions, and added mass effects. Medicine and Science in Sports and
Exercise, 21(4), 467–479.

65
Cavanagh, P. R., & Williams, K. R. (1981). The effect of stride length variation on
oxygen uptake during distance running. Medicine and Science in Sports and
Exercise, 14(1), 30–35.
Chapman, R. F. (2013). The individual response to training and competition at altitude.
British Journal of Sports Medicine, 47(Suppl 1), i40–i44.
Chapman, R. F., Karlsen, T., Resaland, G. K., Ge, R.-L., Harber, M. P., Witkowski, S.,
… Levine, B. D. (2014). Defining the “dose” of altitude training: how high to live
for optimal sea level performance enhancement. Journal of Applied Physiology,
116(6), 595–603.
Chapman, R. F., Stickford, A. S. L., Lundby, C., & Levine, B. D. (2014). Timing of
return from altitude training for optimal sea level performance. Journal of Applied
Physiology, 116(7), 837–843.
Chapman, R. F., Stray-Gundersen, J., & Levine, B. D. (1998). Individual variation in
response to altitude training. Journal of Applied Physiology, 85(4), 1448–1456.
Clingman, J. M., & Hilliard, D. V. (1990). Race walkers quicken their pace by tuning in,
not stepping out. The Sport Psychologist, 4(1), 25–32.
Daley, M. A., Bramble, D. M., & Carrier, D. R. (2013). Impact loading and locomotor-
respiratory coordination significantly influence breathing dynamics in running
humans. PloS One, 8(8), e70752.
Dalleau, G., Belli, A., Bourdin, M., & Lacour, J.-R. (1998). The spring-mass model and
the energy cost of treadmill running. European Journal of Applied Physiology and
Occupational Physiology, 77(3), 257–263.
66
Dill, D., Myhre, G., Phillips, E., & Brown, D. (1966). Work capacity in acute exposures
to altitude. Journal of Applied Physiology, 21(4), 1168–1176.
Eldridge, F. L., Millhorn, D. E., Killey, J. P., & Waldrop, T. G. (1985). Stimulation by
central command of locomotion, respiration and circulation during exercise.
Respiration Physiology, 59(3), 313–337.
Eldridge, F. L., Millhorn, D. E., & Waldrop, T. G. (1981). Exercise hyperpnea and
locomotion: parallel activation from the hypothalamus. Science, 211(4484), 844–
846.
Fabre, N., Perrey, S., Passelergue, P., & Rouillon, J.-D. (2007). No influence of hypoxia
on coordination between respiratory and locomotor rhythms during rowing at
moderate intensity. Journal of Sports Science & Medicine, 6(4), 526.
Funk, G. D., Steeves, J. D., & Milsom, W. K. (1992). Coordination of wingbeat and
respiration in birds. II.“ Fictive” flight. Journal of Applied Physiology, 73(3),
1025–1033.
Galbo, H., Kjaer, M., & Secher, N. (1987). Cardiovascular, ventilatory and
catecholamine responses to maximal dynamic exercise in partially curarized man.
The Journal of Physiology, 389(1), 557–568.
Garlando, F., Kohl, J., Koller, E., & Pietsch, P. (1985). Effect of coupling the breathing-
and cycling rhythms on oxygen uptake during bicycle ergometry. European
Journal of Applied Physiology and Occupational Physiology, 54(5), 497–501.
Hankinson, J. L., Odencrantz, J. R., & Fedan, K. B. (1999). Spirometric reference values
from a sample of the general US population. American Journal of Respiratory
and Critical Care Medicine, 159(1), 179–187.

67
Hoffmann, C. P., Torregrosa, G., & Bardy, B. G. (2012). Sound stabilizes locomotor-
respiratory coupling and reduces energy cost.
Hogan, M. C., Cox, R., & Welch, H. G. (1983). Lactate accumulation during incremental
exercise with varied inspired oxygen fractions. Journal of Applied Physiology,
55(4), 1134–1140.
Hughes, R. L., Clode, M., Edwards, R., Goodwin, T. J., & Jones, N. L. (1968). Effect of
inspired O2 on cardiopulmonary and metabolic responses to exercise in man.
Journal of Applied Physiology, 24(3), 336–347.
Hunter, I., & Smith, G. A. (2007). Preferred and optimal stride frequency, stiffness and
economy: changes with fatigue during a 1-h high-intensity run. European Journal
of Applied Physiology, 100(6), 653–661.
Jasinskas, C., Wilson, B., & Hoare, J. (1980). Entrainment of breathing rate to movement
frequency during work at two intensities. Respiration Physiology, 42(3), 199–209.
Kay, J., Petersen, E. S., & Vejby-Christensen, H. (1975). Breathing in man during steady-
state exercise on the bicycle at two pedalling frequencies, and during treadmill
walking. The Journal of Physiology, 251(3), 645–656.
Kelman, G., & Watson, A. (1973). Effect of added dead space on pulmonary ventialtion
during sub-maximal, steady-state exercise. Quarterly Journal of Experimental
Physiology and Cognate Medical Sciences, 58(4), 305–313.
Krogh, A., & Lindhard, J. (1913). The regulation of respiration and circulation during the
initial stages of muscular work. The Journal of Physiology, 47(1-2), 112–136.

68
Levine, B. D., & Stray-Gundersen, J. (1997). “Living high-training low”: effect of
moderate-altitude acclimatization with low-altitude training on performance.
Journal of Applied Physiology, 83(1), 102–112.
Maclennan, S. E., Silvestri, G. A., Ward, J., & Mahler, D. A. (1994). Does entrained
breathing improve the economy of rowing? Medicine and Science in Sports and
Exercise, 26(5), 610–614.
McDermott, W. J., Van Emmerik, R. E., & Hamill, J. (2003). Running training and
adaptive strategies of locomotor-respiratory coordination. European Journal of
Applied Physiology, 89(5), 435–444.
Morgan, W. P., & Pollock, M. L. (1977). Psychologic characterization of the elite
distance runner. Annals of the New York Academy of Sciences, 301(1), 382–403.
Paterson, D. J., Wood, G. A., Morton, A. R., & Henstridge, J. D. (1986). The entrainment
of ventilation frequency to exercise rhythm. European Journal of Applied
Physiology and Occupational Physiology, 55(5), 530–537.
Paterson, D. J., Wood, G., Marshall, R. N., Morton, A. R., & Harrison, A. (1987).
Entrainment of respiratory frequency to exercise rhythm during hypoxia. Journal
of Applied Physiology, 62(5), 1767–1771.
Rabler, B., & Kohl, J. (1996). Analysis of coordination between breathing and walking
rhythms in humans. Respiration Physiology, 106(3), 317–327.
Rice, L., Ruiz, W., Driscoll, T., Whitley, C. E., Tapia, R., Hachey, D. L., … Alfrey, C. P.
(2001). Neocytolysis on descent from altitude: a newly recognized mechanism for
the control of red cell mass. Annals of Internal Medicine, 134(8), 652–656.

69
Scheel, & Romer. (2012). Ventilation and respiratory mechanics. Comprehensive
Physiology.
Seebauer, M., Siller, T., & Kohl, J. (2003). Influence of hypoxia on coordination between
breathing and cycling rhythms in women. European Journal of Applied
Physiology, 89(1), 90–94.
Sheel, A. W. (2002). Respiratory muscle training in healthy individuals. Sports Medicine,
32(9), 567–581.
Sinex, J. A., & Chapman, R. F. (2015). Hypoxic training methods for improving
endurance exercise performance. Journal of Sport and Health Science.
Stickford, A. S., & Stickford, J. L. (2014). Ventilation and Locomotion in Humans:
Mechanisms, Implications, and Perturbations to the Coupling of These Two
Rhythms. Springer Science Reviews, 2(1-2), 95–118.
Stickford, A. S., Stickford, J. L., Tanner, D. A., Stager, J. M., & Chapman, R. F. (2015).
Runners maintain locomotor–respiratory coupling following isocapnic voluntary
hyperpnea to task failure. European Journal of Applied Physiology, 1–11.
Takano, N., & Deguchi, H. (1997). Sensation of breathlessness and respiratory oxygen
cost during cycle exercise with and without conscious entrainment of the
breathing rhythm. European Journal of Applied Physiology and Occupational
Physiology, 76(3), 209–213.
Thomas, D. Q., Fernhall, B., & Granat, H. (1999). Changes in Running Economy During
a 5-km Run in Trained Men and Women Runners. The Journal of Strength &
Conditioning Research, 13(2), 162–167.

70
Villard, S., Casties, J.-F., & Mottet, D. (2005). Dynamic stability of locomotor
respiratory coupling during cycling in humans. Neuroscience Letters, 383(3),
333–338.
West, J. B. (2012). Respiratory physiology: the essentials. Lippincott Williams &
Wilkins.
Wilber, R. L., Stray-Gundersen, J., & Levine, B. D. (2007). Effect of hypoxic“ dose” on
physiological responses and sea-level performance. Medicine and Science in
Sports and Exercise, 39(9), 1590–1599.

71
APPENDIX A
Variable Names & Raw Data

72
Variable Name Description Subject Subject ID number VO2_N1 VO2 in normoxia at speed 1 VO2_N2 VO2 in normoxia at speed 2 VO2_N3 VO2 in normoxia at speed 3 VO2_NM VO2 max in normoxia VO2_H1 VO2 in hypoxia at speed 1 VO2_H2 VO2 in hypoxia at speed 2 VO2_H3 VO2 in hypoxia at speed 3 VO2_HM VO2 max hypoxia RTO_N1 Stride frequency-to-breathing frequency quotient in normoxia at speed 1 RTO_N2 Stride frequency-to-breathing frequency quotient in normoxia at speed 2 RTO_N3 Stride frequency-to-breathing frequency quotient in normoxia at speed 3 RTO_NM Stride frequency-to-breathing frequency quotient in normoxia at VO2 max RTO_H1 Stride frequency-to-breathing frequency quotient in hypoxia at speed 1 RTO_H2 Stride frequency-to-breathing frequency quotient in hypoxia at speed 2 RTO_H3 Stride frequency-to-breathing frequency quotient in hypoxia at speed 3 RTO_HM Stride frequency-to-breathing frequency quotient in normoxia at VO2 max LRC_N1 Degree of LRC in normoxia at speed 1 LRC_N2 Degree of LRC in normoxia at speed 2 LRC_N3 Degree of LRC in normoxia at speed 3 LRC_NM Degree of LRC in normoxia at VO2 max LRC_H1 Degree of LRC in hypoxia at speed 1 LRC_H2 Degree of LRC in hypoxia at speed 2 LRC_H3 Degree of LRC in hypoxia at speed 3 LRC_HM Degree of LRC in hypoxia at VO2 max VE_N1 Minute ventilation in normoxia at speed 1 VE_N2 Minute ventilation in normoxia at speed 2 VE_N3 Minute ventilation in normoxia at speed 3 VE_NM Minute ventilation in normoxia at VO2 max VE_H1 Minute ventilation in hypoxia at speed 1 VE_H2 Minute ventilation in hypoxia at speed 2 VE_H3 Minute ventilation in hypoxia at speed 3 VE_HM Minute ventilation in hypoxia at VO2 max BF_N1 Breathing frequency in normoxia at speed 1 BF_N2 Breathing frequency in normoxia at speed 2 BF_N3 Breathing frequency in normoxia at speed 3 BF_NM Breathing frequency in normoxia at VO2 max BF_H1 Breathing frequency in hypoxia at speed 1 BF_H2 Breathing frequency in hypoxia at speed 2 BF_H3 Breathing frequency in hypoxia at speed 3 BF_HM Breathing frequency in hypoxia at VO2 max

73
Variable Name Description TV_N1 Tidal Volume in normoxia at speed 1 TV_N2 Tidal Volume in normoxia at speed 2 TV_N3 Tidal Volume in normoxia at speed 3 TV_NM Tidal Volume in normoxia at VO2 max TV_H1 Tidal Volume in hypoxia at speed 1 TV_H2 Tidal Volume in hypoxia at speed 2 TV_H3 Tidal Volume in hypoxia at speed 3 TV_HM Tidal Volume in hypoxia at VO2 max HR_N1 Heart Rate in normoxia at speed 1 HR_N2 Heart Rate in normoxia at speed 2 HR_N3 Heart Rate in normoxia at speed 3 HR_NM Heart Rate in normoxia at VO2 max HR_H1 Heart Rate in hypoxia at speed 1 HR_H2 Heart Rate in hypoxia at speed 2 HR_H3 Heart Rate in hypoxia at speed 3 HR_HM Heart Rate in hypoxia at VO2 max S_NR Arterial Oxygen Saturation in normoxia at rest S_N1 Arterial Oxygen Saturation in normoxia at speed 1 S_N2 Arterial Oxygen Saturation in normoxia at speed 2 S_N3 Arterial Oxygen Saturation in normoxia at speed 3 S_NM Arterial Oxygen Saturation in normoxia at VO2 max S_HR Arterial Oxygen Saturation in hypoxia at rest S_H1 Arterial Oxygen Saturation in hypoxia at speed 1 S_H2 Arterial Oxygen Saturation in hypoxia at speed 2 S_H3 Arterial Oxygen Saturation in hypoxia at speed 3 S_HM Arterial Oxygen Saturation in hypoxia at VO2 max RPE_N1 Rating of Perceived Exertion in normoxia at speed 1 RPE_N2 Rating of Perceived Exertion in normoxia at speed 2 RPE_N3 Rating of Perceived Exertion in normoxia at speed 3 RPE_NM Rating of Perceived Exertion in normoxia at VO2 max RPE_H1 Rating of Perceived Exertion in hypoxia at speed 1 RPE_H2 Rating of Perceived Exertion in hypoxia at speed 2 RPE_H3 Rating of Perceived Exertion in hypoxia at speed 3 RPE_HM Rating of Perceived Exertion in hypoxia at VO2 max DYS_N1 Dyspnea in normoxia at speed 1 DYS_N2 Dyspnea in normoxia at speed 2 DYS_N3 Dyspnea in normoxia at speed 3 DYS_NM Dyspnea in normoxia at VO2 max DYS_H1 Dyspnea in hypoxia at speed 1 DYS_H2 Dyspnea in hypoxia at speed 2 DYS_H3 Dyspnea in hypoxia at speed 3 DYS_HM Dyspnea in hypoxia at VO2 max

74
Variable Name Description ST_N1 Stride frequency in normoxia at speed 1 ST_N2 Stride frequency in normoxia at speed 2 ST_N3 Stride frequency in normoxia at speed 3 ST_NM Stride frequency in normoxia at VO2 max ST_H1 Stride frequency in hypoxia at speed 1 ST_H2 Stride frequency in hypoxia at speed 2 ST_H3 Stride frequency in hypoxia at speed 3 ST_HM Stride frequency in hypoxia at VO2 max SLOPE_N Slope of the running economy regression line in normoxia SLOPE_H Slope of the running economy regression line in normoxia VEO2_N1 Ventilatory equivalent for oxygen in normoxia at speed 1 VEO2_N2 Ventilatory equivalent for oxygen in normoxia at speed 2 VEO2_N3 Ventilatory equivalent for oxygen in normoxia at speed 3 VEO2_NM Ventilatory equivalent for oxygen in normoxia at VO2 max VEO2_H1 Ventilatory equivalent for oxygen in hypoxia at speed 1 VEO2_H2 Ventilatory equivalent for oxygen in hypoxia at speed 2 VEO2_H3 Ventilatory equivalent for oxygen in hypoxia at speed 3 VEO2_HM Ventilatory equivalent for oxygen in hypoxia at VO2 max CH_LRC_N_12 Percent change in the degree of LRC between speed 1 and speed 2 in normoxia CH_LRC_N_23 Percent change in the degree of LRC between speed 2 and speed 3 in normoxia CH_LRC_N_34 Percent change in the degree of LRC between speed 3 and VO2 max in normoxia CH_LRC_H_12 Percent change in the degree of LRC between speed 1 and speed 2 in hypoxia CH_LRC_H_23 Percent change in the degree of LRC between speed 2 and speed 3 in hypoxia CH_LRC_H_34 Percent change in the degree of LRC between speed 3 and VO2 max in normoxia CH_V02_N_12 Percent change in oxygen uptake between speed 1 and speed 2 in normoxia CH_V02_N_23 Percent change in oxygen uptake between speed 2 and speed 3 in normoxia CH_V02_N_34 Percent change in oxygen uptake between speed 3 and VO2 max in normoxia CH_VO2_H_12 Percent change in oxygen uptake between speed 1 and speed 2 in hypoxia CH_VO2_H_23 Percent change in oxygen uptake between speed 2 and speed 3 in hypoxia CH_VO2_H_34 Percent change in oxygen uptake between speed 3 and VO2 max in hypoxia CH_BF_N_12 Percent change in breathing frequency between speed 1 and speed 2 in normoxia CH_BF_N_23 Percent change in breathing frequency between speed 2 and speed 3 in normoxia CH_BF_N_34 Percent change in breathing frequency between speed 3 and VO2 max in normoxia CH_BF_H_12 Percent change in breathing frequency between speed 1 and speed 2 in hypoxia CH_BF_H_23 Percent change in breathing frequency between speed 2 and speed 3 in hypoxia CH_BF_H_34 Percent change in breathing frequency between speed 3 and VO2 max in hypoxia CH_V02_NH_1 Percent change in oxygen uptake between normoxia and hypoxia at speed 1 CH_V02_NH_2 Percent change in oxygen uptake between normoxia and hypoxia at speed 2 CH_V02_NH_3 Percent change in oxygen uptake between normoxia and hypoxia at speed 3 CH_V02_NH_4 Percent change in oxygen uptake between normoxia and hypoxia at VO2 max

75
Variable Name Description CH_LRC_NH_1 Percent change in the degree of LRC between normoxia and hypoxia at speed 1 CH_LRC_NH_2 Percent change in the degree of LRC between normoxia and hypoxia at speed 2 CH_LRC_NH_3 Percent change in the degree of LRC between normoxia and hypoxia at speed 3 CH_LRC_NH_4 Percent change in the degree of LRC between normoxia and hypoxia at VO2 max CH_DYS_NH_1 Percent change in Dyspnea between normoxia and hypoxia at speed 1 CH_DYS_NH_2 Percent change in Dyspnea between normoxia and hypoxia at speed 2 CH_DYS_NH_3 Percent change in Dyspnea between normoxia and hypoxia at speed 3 CH_DYS_NH_4 Percent change in Dyspnea between normoxia and hypoxia at VO2 max CH_VE_NH_1 Percent change in minute ventilation between normoxia and hypoxia at speed 1 CH_VE_NH_2 Percent change in minute ventilation between normoxia and hypoxia at speed 2 CH_VE_NH_3 Percent change in minute ventilation between normoxia and hypoxia at speed 3 CH_VE_NH_4 Percent change in minute ventilation between normoxia and hypoxia at VO2 max CH_BF_NH_1 Percent change in breathing frequency between normoxia and hypoxia at speed 1 CH_BF_NH_2 Percent change in breathing frequency between normoxia and hypoxia at speed 2 CH_BF_NH_3 Percent change in breathing frequency between normoxia and hypoxia at speed 3 CH_BF_NH_4 Percent change in breathing frequency between normoxia and hypoxia at VO2 max RER_N Respiratory exchange ratio in normoxia at VO2 max RER_H Respiratory exchange ratio in hypoxia at VO2 max AGE Age of subject HEIGHT Height of subject MASS Body mass of subject A_N Association score in normoxia D_N Dissociation score in normoxia A_H Association score in normoxia D_H Dissociation score in hypoxia

76
Subject VO2_N1 VO2_N2 VO2_N3 VO2_NM VO2_H1 VO2_H2 VO2_H3 VO2_HM
01 42.10 45.89 52.08 71.92 43.81 49.04 50.95 58.84
02 36.94 40.32 46.99 65.28 39.01 42.15 47.01 53.88
03 38.2 43.85 48.97 64.81 38.74 43.36 49.34 58.03
04 42.94 47.14 53.39 61.13 43.83 49.1 55.24 60.21
05 40.06 42.83 47.35 68.27 41.9 47.45 53.89 64.9
06 43.68 45.75 52.87 68.01 44.7 47.96 53.45 61.09
07 47.09 52.52 58.73 70.8 47.03 48.43 54.99 60.14
08 49.49 51.13 56.59 70.05 49.5 53.35 58.39 59.04
09 42.18 46.21 51.55 71.2 41.57 45.67 51.38 62.56
10 41.36 44.86 52.72 69.14 41.07 45.03 49.88 56.42
11 45.37 48.11 53.45 62.04 43.93 49.25 56.18 63.28
12 40.54 43.58 50.94 61.97 40.41 42.77 50.26 59.72
13 47.65 50.65 56.6 63.54 43.28 47.24 53.47 57.66
Subject RTO_N1 RTO_N2 RTO_N3 RTO_NM RTO_H1 RTO_H2 RTO_H3 RTO_HM
01 2.47 2.28 1.86 1.73 2.07 1.85 1.85 1.7
02 2.93 2.69 2.57 1.7 2.81 2.8 2.47 1.81
03 3.03 2.73 2.29 1.65 2.16 2.08 1.85 1.53
04 2.82 2.3 2.01 1.79 2.15 1.86 1.78 1.63
05 3.02 2.54 2.15 1.91 2.33 2.08 1.94 1.89
06 3.95 3.04 3.03 1.98 3.82 3.05 2.59 1.82
07 2.58 2.02 1.76 1.61 2.5 2.08 1.92 1.53
08 3.95 3.95 3.11 n/a 3.04 2.61 2.13 1.23
09 3.9 3.09 2.64 1.84 3.12 3.07 2.22 1.43
10 2.44 2.29 2.25 1.73 2.46 1.93 1.73 1.56
11 1.77 1.55 1.4 1.18 1.56 1.47 1.41 1.29
12 1.94 2.11 2.04 1.63 1.75 1.92 1.79 1.33
13 3 2.3 1.81 1.7 2.14 1.88 1.62 1.53

77
Subject LRC_N1 LRC_N2 LRC_N3 LRC_NM LRC_H1 LRC_H2 LRC_H3 LRC_HM
01 99 76 73 44 74 72 70 50
02 54 50 51 43 28 28 39 33
03 54 51 58 27 63 80 48 61
04 74 73 60 48 80 54 62 82
05 63 56 45 52 56 47 54 67
06 60 59 75 58 60 65 58 70
07 51 50 44 18 52 41 52 52
08 50 66 72 n/a 62 53 60 45
09 94 92 80 51 96 95 73 56
10 71 56 40 51 47 53 46 67
11 50 59 42 34 76 55 47 42
12 47 45 49 44 45 28 56 48
13 60 50 49 55 59 45 36 69
Subject VE_N1 VE_N2 VE_N3 VE_NM VE_H1 VE_H2 VE_H3 VE_HM
01 77.56 87.9 105.28 163.35 94.78 109.26 128.65 164.59
02 56.56 68.09 84.11 157.59 75.27 81.33 97.12 141.87
03 71.15 80.54 95.54 158.18 77.89 89.85 112.8 153.97
04 82.82 97.78 118.89 158.97 109.39 126.16 153.71 183.77
05 66.64 77.35 88.48 158.46 84.62 100.67 123.53 162.34
06 66.15 76.14 92.91 150.41 75.87 93.51 106.18 158.86
07 76.22 91.72 113.15 156.26 80.71 91.04 112.39 143.69
08 69.79 74.95 93.3 171.83 89.17 97.34 115.84 180.73
09 68.01 82.13 100.6 180.06 86.11 93.24 124.11 182.01
10 63.67 73.54 90.75 141.77 70.47 84.95 103.08 137.28
11 87.8 94.85 122.75 169.55 100.61 115.91 142.85 174.1
12 74.27 83.17 97.73 153.75 86.92 90.73 112.07 160.11
13 65.68 87.63 104.29 126.26 76.86 91.04 115.6 135.39

78
Subject BF_N1 BF_N2 BF_N3 BF_NM BF_H1 BF_H2 BF_H3 BF_HM
01 34 37 46 49 41 46 46 50
02 30 32 35 54 32 32 38 52
03 29 33 39 55 40 42 49 59
04 28 35 41 46 37 43 46 51
05 29 35 40 47 35 40 44 46
06 21 28 29 46 22 28 34 50
07 33 42 50 56 33 40 44 55
08 21 21 27 n/a 28 32 40 69
09 21 27 32 46 26 27 38 59
10 35 38 40 52 36 45 52 57
11 43 49 55 67 49 52 55 60
12 39 35 39 48 46 42 46 60
13 31 40 52 55 42 48 56 62
Subject TV_N1 TV_N2 TV_N3 TV_NM TV_H1 TV_H2 TV_H3 TV_HM
01 2.28 2.38 2.29 3.33 2.31 2.38 2.8 3.29
02 1.89 2.13 2.4 2.92 2.35 2.54 2.56 2.73
03 2.45 2.44 2.45 2.88 1.95 2.14 2.3 2.61
04 2.96 2.79 2.9 3.46 2.96 2.93 3.343 3.6
05 2.3 2.21 2.21 3.37 2.42 2.52 2.81 3.53
06 3.15 2.72 3.2 3.27 3.45 3.34 3.12 3.18
07 2.31 2.18 2.26 2.79 2.45 2.28 2.55 2.61
08 3.32 3.57 3.46 3.18 3.04 2.9 2.62
09 3.24 3.04 3.14 3.91 3.31 3.45 3.27 3.08
10 1.82 1.94 2.27 2.73 1.96 1.89 1.98 2.41
11 2.04 1.94 2.23 2.53 2.05 2.23 2.6 2.9
12 1.9 2.38 2.51 3.2 1.89 2.16 2.44 2.67
13 2.12 2.19 2.01 2.3 1.83 1.9 2.06 2.18

79
Subject HR_N1 HR_N2 HR_N3 HR_NM HR_H1 HR_H2 HR_H3 HR_HM
01 122 140 155 186 140 153 166 177
02 127 138 165 196 155 166 174 193
03 145 157 168 192 150 156 174 187
04 132 158 173 187 145 159 174 181
05 141 148 158 187 147 158 170 183
06 142 155 167 197 130 153 181 200
07 145 157 171 188 153 164 173 181
08 145 154 172 193 153 165 172 182
09 126 137 155 187 142 148 165 180
10 142 150 177 199 152 173 189 198
11 164 176 189 202 167 181 189 198
12 144 156 168 192 152 163 174 193
13 169 188 196 211 159 176 185 201
Subject S_NR S_N1 S_N2 S_N3 S_NM S_HR S_H1 S_H2 S_H3 S_HM
01 99.67 98.33 97.7 95.66 88.57 93.01 84.71 81.23 79.44 72.53
02 98.46 97.94 94.11 91.48 92.37 91.06 85.95 83.46 83.65 84.41
03 96.91 n/a n/a 93.81 91.95 88.74 88.49 88.21 87.07 84.59
04 99.77 100 99.58 96.73 99.77 96.69 92.25 74.4 69.16 75.81
05 97.69 n/a n/a 93.21 89.84 90.96 81.65 84.48 84.71 84.32
06 n/a n/a n/a n/a n/a 94.71 84.89 83.36 81.8 80.08
07 98.08 97.29 98.07 97.03 93.4 92.93 72.91 75.3 80.97 80.01
08 n/a n/a n/a n/a n/a 91 85.99 n/a 74.01 81.19
09 99.9 97.51 97.55 97.37 90.36 94.06 88.34 84.21 81.96 75.5
10 98.63 76.99 95.59 91.96 90.31 91.07 86.72 80.1 78.15 74.61
11 99.12 n/a 92.02 92.84 88.12 93.12 82.11 85.18 84.66 85.74
12 96.54 94.92 95.31 93.72 93.01 89.77 85.81 81.93 81.52 81.79
13 98.56 n/a n/a 89.29 88.78 93.01 87.25 87.73 85.21 80.49

80
Subject RPE_N1 RPE_N2 RPE_N3 RPE_NM RPE_H1 RPE_H2 RPE_H3 RPE_HM
01 11 13 14 19 9 13 15 19
02 7 10 13 17 6 9 12 18
03 7 9 13 19 8 9 11 16
04 8 12 15 18 11 13 16 20
05 6 8 10 19 6 7 11 17
06 9 10 12 19 9 10 12 18
07 9 12 13 17 7 10 13 18
08 11 13 15 18 11 13 14 18
09 8 10 11 20 9 11 13 20
10 8 10 13 17 9 12 14 19
11 8 10 12 18 7 11 14 20
12 10 11 14 16 13 14 16 18
13 6 6 7 17 7 8 10 17
Subject DYS_N1 DYS_N2 DYS_N3 DYS_NM DYS_H1 DYS_H2 DYS_H3 DYS_HM
01 3 4 4 9 2 4 5 10
02 1 2 4 7 1 3 4 8
03 0.5 2 4 9 1 2 5 9
04 3 4 6 9 3 4 8 9
05 0.5 0.5 2 10 0.5 1 2 10
06 2 2 3 8 1 2 3 8
07 0.5 2 4 10 0.5 3 5 10
08 3 4 5 8 2 3 5 9
09 1 2 3 10 2 2 4 10
10 1 2 4 9 1 2 4 9
11 1 2 3 9 2 3 5 9
12 1 3 5 9 2 4 6 10
13 0.5 0.5 1 5 0.5 1 2 7

81
Subject RER_N RER_H
01 1.19 1.24
02 1.18 1.15
03 1.19 1.06
04 1.06 1.08
05 1.11 1.04
06 1.15 1.15
07 1.13 1.14
08 1.22 1.23
09 1.18 1.12
10 1.14 1.08
11 1.11 1.03
12 1.11 1.03
13 1.13 1.11
Subject ST_N1 ST_N2 ST_N3 ST_NM ST_H1 ST_H2 ST_H3 ST_HM
01 84 84.5 85.5 85 85 85 85 85
02 88.0 86.0 90.0 92.0 90.0 89.5 94.0 94.0
03 88.0 90.0 89.5 90.5 86.5 87.5 90.5 90.5
04 79.0 80.5 82.5 82.5 79.5 80.0 82.0 83.0
05 87.5 89.0 86.0 90.0 81.5 83.0 85.5 87.0
06 83.0 85.0 88.0 91.0 84.0 85.5 88.0 91.0
07 85.0 85.0 88.0 90.0 82.5 83.0 84.5 84.0
08 83.0 83.0 84.0 n/a 85.0 83.5 85.0 85.0
09 82.0 83.5 84.5 84.5 81.0 83.0 84.5 84.5
10 85.5 87.0 90.0 90.0 88.5 87.0 90.0 89.0
11 76.0 76.0 77.0 79.0 76.5 76.5 77.5 77.5
12 75.5 74.0 79.5 78.0 80.5 80.5 82.5 80.0
13 93.0 92.0 94.0 93.5 90.0 90.0 90.5 95.0

82
Subject SLOPE_N SLOPE_H
01 3.134 2.177
02 3.167 2.509
03 3.341 3.313
04 3.34 3.558
05 2.289 3.739
06 3.956 3.05
07 3.629 2.541
08 2.257 2.779
09 2.93 3.071
10 3.588 2.75
11 2.546 3.829
12 3.289 3.129
13 2.784 3.197
Subject VEO2_N1 VEO2_N2 VEO2_N3 VEO2_NM VEO2_H1 VEO2_H2 VEO2_H3 VEO2_HM
01 24.07 25.03 26.41 29.68 28.62 29.47 33.40 37.00
02 22.31 24.60 26.08 35.17 28.35 28.35 30.35 38.68
03 26.95 26.57 28.23 35.31 28.83 29.71 32.78 38.04
04 23.53 25.30 27.16 31.72 29.73 30.60 33.14 36.35
05 22.69 24.63 25.49 31.66 28.16 29.58 31.96 34.87
06 21.30 23.41 24.72 31.11 24.19 27.79 28.31 37.06
07 25.41 27.41 30.24 34.64 27.93 30.59 33.26 38.88
08 20.92 21.75 24.46 36.39 26.67 27.01 29.37 45.32
09 22.52 24.82 27.26 35.32 28.93 28.52 33.74 40.64
10 23.92 25.48 26.75 31.86 26.50 29.14 31.92 37.58
11 30.63 31.21 36.35 43.26 37.17 38.20 41.27 44.66
12 25.63 26.70 26.84 34.71 30.04 29.63 31.14 37.44
13 24.57 30.85 32.85 35.43 31.50 34.19 38.35 41.65

83
Subject CH_LRC_N_12 CH_LRC_N_23 CH_LRC_N_34
01 -23.23 -3.95 -39.73
02 -7.41 2.00 -15.69
03 -5.56 13.73 -53.45
04 -1.35 -17.81 -20.00
05 -11.11 -19.64 15.56
06 -1.67 27.12 -22.67
07 -1.96 -12.00 -59.09
08 32.00 9.09
09 -2.13 -13.04 -36.25
10 -21.13 -28.57 27.50
11 18.00 -28.81 -19.05
12 -4.26 8.89 -10.20
13 -16.67 -2.00 12.24
Subject CH_LRC_H_12 CH_LRC_H_23 CH_LRC_H_34
01 -2.70 -2.78 -28.57
02 0.00 39.29 -15.38
03 26.98 -40.00 27.08
04 -32.50 14.81 32.26
05 -16.07 14.89 24.07
06 8.33 -10.77 20.69
07 -21.15 26.83 0.00
08 -14.52 13.21 -25.00
09 -1.04 -23.16 -23.29
10 12.77 -13.21 45.65
11 -27.63 -14.55 -10.64
12 -37.78 100.00 -14.29
13 -23.73 -20.00 91.67

84
Subject CH_V02_N_12 CH_V02_N_23 CH_V02_N_34
01 9.00 13.49 38.10
02 9.15 16.54 38.92
03 14.79 11.68 32.35
04 9.78 13.26 14.50
05 6.91 10.55 44.18
06 4.74 15.56 28.64
07 11.53 11.82 20.55
08 3.31 10.68 23.79
09 9.55 11.56 38.12
10 8.46 17.52 31.15
11 6.04 11.10 16.07
12 7.50 16.89 21.65
13 6.30 11.75 12.26
Subject CH_VO2_H_12 CH_VO2_H_23 CH_VO2_H_34
01 11.94 3.89 15.49
02 8.05 11.53 14.61
03 11.93 13.79 17.61
04 12.02 12.51 9.00
05 13.25 13.57 20.43
06 7.29 11.45 14.29
07 2.98 13.55 9.37
08 7.78 9.45 1.11
09 9.86 12.50 21.76
10 9.64 10.77 13.11
11 12.11 14.07 12.64
12 5.84 17.51 18.82
13 9.15 13.19 7.84

85
Subject CH_BF_N_12 CH_BF_N_23 CH_BF_N_34
01 8.82 24.32 6.52
02 6.67 9.38 54.29
03 13.79 18.18 41.03
04 25.00 17.14 12.20
05 20.69 14.29 17.50
06 33.33 3.57 58.62
07 27.27 19.05 12.00
08 0.00 28.57 -100.00
09 28.57 18.52 43.75
10 8.57 5.26 30.00
11 13.95 12.24 21.82
12 -10.26 11.43 23.08
13 29.03 30.00 5.77
Subject CH_BF_H_12 CH_BF_H_23 CH_BF_H_34
01 12.20 0.00 8.70
02 0.00 18.75 36.84
03 5.00 16.67 20.41
04 16.22 6.98 10.87
05 14.29 10.00 4.55
06 27.27 21.43 47.06
07 21.21 10.00 25.00
08 14.29 25.00 72.50
09 3.85 40.74 55.26
10 25.00 15.56 9.62
11 6.12 5.77 9.09
12 -8.70 9.52 30.43
13 14.29 16.67 10.71
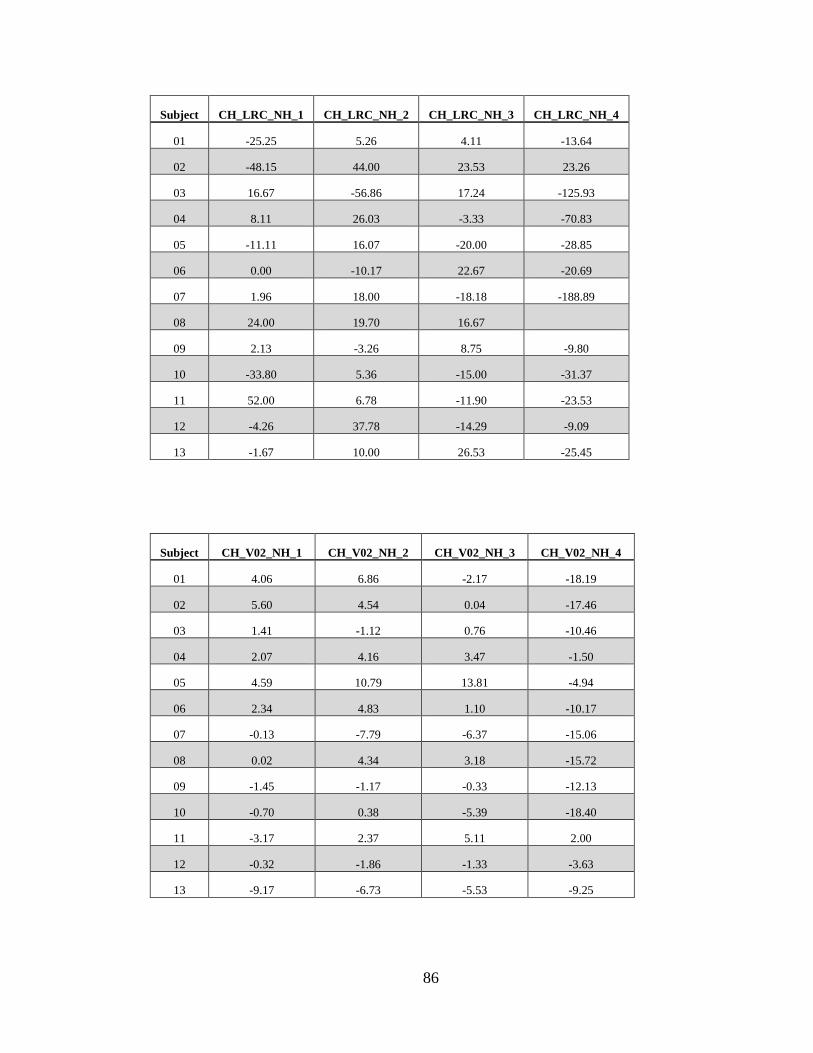
86
Subject CH_LRC_NH_1 CH_LRC_NH_2 CH_LRC_NH_3 CH_LRC_NH_4
01 -25.25 5.26 4.11 -13.64
02 -48.15 44.00 23.53 23.26
03 16.67 -56.86 17.24 -125.93
04 8.11 26.03 -3.33 -70.83
05 -11.11 16.07 -20.00 -28.85
06 0.00 -10.17 22.67 -20.69
07 1.96 18.00 -18.18 -188.89
08 24.00 19.70 16.67
09 2.13 -3.26 8.75 -9.80
10 -33.80 5.36 -15.00 -31.37
11 52.00 6.78 -11.90 -23.53
12 -4.26 37.78 -14.29 -9.09
13 -1.67 10.00 26.53 -25.45
Subject CH_V02_NH_1 CH_V02_NH_2 CH_V02_NH_3 CH_V02_NH_4
01 4.06 6.86 -2.17 -18.19
02 5.60 4.54 0.04 -17.46
03 1.41 -1.12 0.76 -10.46
04 2.07 4.16 3.47 -1.50
05 4.59 10.79 13.81 -4.94
06 2.34 4.83 1.10 -10.17
07 -0.13 -7.79 -6.37 -15.06
08 0.02 4.34 3.18 -15.72
09 -1.45 -1.17 -0.33 -12.13
10 -0.70 0.38 -5.39 -18.40
11 -3.17 2.37 5.11 2.00
12 -0.32 -1.86 -1.33 -3.63
13 -9.17 -6.73 -5.53 -9.25

87
Subject CH_DYS_NH_1 CH_DYS_NH_2 CH_DYS_NH_3 CH_DYS_NH_4
01 -33.33 0.00 25.00 11.11
02 0.00 50.00 0.00 14.29
03 100.00 0.00 25.00 0.00
04 0.00 0.00 33.33 0.00
05 0.00 100.00 0.00 0.00
06 -50.00 0.00 0.00 0.00
07 0.00 50.00 25.00 0.00
08 -33.33 -25.00 0.00 12.50
09 100.00 0.00 33.33 0.00
10 0.00 0.00 0.00 0.00
11 100.00 50.00 66.67 0.00
12 100.00 33.33 20.00 11.11
13 0.00 100.00 100.00 40.00
Subject CH_VE_NH_1 CH_VE_NH_2 CH_VE_NH_3 CH_VE_NH_4
01 22.20 24.30 22.20 0.76
02 33.08 19.44 15.47 -9.98
03 9.47 11.56 18.07 -2.66
04 32.08 29.02 29.29 15.60
05 26.98 30.15 39.61 2.45
06 14.69 22.81 14.28 5.62
07 5.89 -0.74 -0.67 -8.04
08 27.77 29.87 24.16 5.18
09 26.61 13.53 23.37 1.08
10 10.68 15.52 13.59 -3.17
11 14.59 22.20 16.37 2.68
12 17.03 9.09 14.67 4.14
13 17.02 3.89 10.84 7.23

88
Subject CH_BF_NH_1 CH_BF_NH_2 CH_BF_NH_3 CH_BF_NH_4
01 20.6 24.3 0.0 2.0
02 6.7 0.0 8.6 -3.7
03 37.9 27.3 25.6 7.3
04 32.1 22.9 12.2 10.9
05 20.7 14.3 10.0 -2.1
06 4.8 0.0 17.2 8.7
07 0.0 -4.8 -12.0 -1.8
08 33.3 52.4 48.1
09 23.8 0.0 18.8 28.3
10 2.9 18.4 30.0 9.6
11 14.0 6.1 0.0 -10.4
12 17.9 20.0 17.9 25.0
13 35.5 20.0 7.7 12.7
Subject AGE HEIGHT MASS
01 21 1.76 75.6
02 21 1.82 68.07
03 22 1.8 69.12
04 28 1.81 81.98
05 22 1.79 71.73
06 23 1.79 70.16
07 20 1.79 61.45
08 26 1.84 67.41
09 30 1.86 71.59
10 22 1.81 64.35
11 28 1.76 63.17
12 20 1.77 71.6
13 21 1.67 56.37

89
Subject A_N D_N A_H D_H
01 50 21 42 24
02 63 30 55 25
03 66 28 60 25
04 52 31 62 31
05 61 26 60 19
06 39 29 47 22
07 55 32 45 29
08 58 27 45 24
09 67 23 51 26
10 45 23 38 19
11 63 28 71 45
12 47 25 47 20
13 59 31 49 32

90
APPENDIX B
Indiana University Institutional Review Board Approval

91

92
APPENDIX C
Informed Consent

93
IRB study #1510451822
INDIANA UNIVERSITY INFORMED CONSENT STATEMENT FOR
Effects of hypoxia on locomotor-respiratory coupling during exercise
You are invited to participate in a research study that will help determine the effects that hypoxia (low oxygen content of the air) has on running mechanics and running economy. You were selected as a possible subject because of your status as a highly trained distance runner. We ask that you read this form and ask any questions you may have before agreeing to be in the study. Disclaimer: It is possible that after completing the study questionnaires that you will not qualify for the study. The study is being conducted by Robert F. Chapman, Ph.D. (Principal Investigator), and co-investigator Timothy Fulton in the Department of Kinesiology at Indiana University-Bloomington. STUDY PURPOSE The purpose of the proposed study is to investigate the relationship of the rhythmic pairing of breathing and foot strikes while running and the energy cost associated with running, both in normal oxygen and low oxygen environments. NUMBER OF PEOPLE TAKING PART IN THE STUDY:
If you agree to participate, you will be one of approximately 40 subjects who will be participating in this research. PROCEDURES FOR THE STUDY: If you agree to be in the study, the following items are included: An invitation will be extended to visit the Human Performance laboratory on two occasions at a previously agreed-upon time. The visits will last approximately 75 minutes and 45 minutes respectively. The testing session includes completion of two written questionnaires, measures of your height and weight, measure of your body composition (fat and lean mass), resting pulmonary function (breathing) testing, and a running test on a treadmill. Each of these tests is described below. Height and weight measures. Height will be measured by asking you to stand against a wall and a device will be lowered until it touches the top of your head. Weight will be
94
measured by having you sit on a chair, which is placed on a scale. This test will be completed in both visits to the lab. Body composition measures. You will be asked to stand on a scale in bare feet and hold two handles connected to the scale. A small, imperceptible electrical current will pass through your body for about two seconds. The scale will calculate an estimate of the percent of your mass that is lean mass and the percent that is fat mass. This test will be completed only on the first visit to the lab. Resting pulmonary function (breathing tests). You will be asked to sit in a chair and rest comfortably for 10 minutes. You will be asked to put noseclips on your nose and breathe through a plastic mouthpiece. The noseclips are cleaned in detergent and an antibacterial solution after each use, and the plastic mouthpiece is new for each subject. While sitting in the chair, you will be asked to complete various breathing maneuvers which measure the size of your lungs, how fast you can move air in and out of your lungs, and the ability of your lungs to transfer gas to the blood. Running Test. This exercise test will be completed on a treadmill. You will be allowed to warm up on the treadmill for five minutes at any pace you would like to select. A strap will be placed around your chest which will measure your heart rate. Small sensors will be taped to your skin on both heels, using standard athletic tape. Attached to the sensors will be a thin cable that will be taped to your leg and secured to your waist with a Velcro strap. You will be asked to complete the treadmill running while breathing through a face mask which covers your nose and mouth. Air will flow into and out of your lungs as you breathe through the face mask. The face mask and heart rate monitor are cleansed in a detergent and antibacterial solution following each use. You will be asked to run 3 repetitions of 5 minutes each. The paces will be at progressively faster speeds which correspond approximately to marathon pace, 10k pace, and 5k pace. A rest period of 3 minutes will follow the first two 5 minute running stages. At the end of the third stage, you will be asked to continue running at the same pace. The slope of the treadmill will increase slightly every two minutes until you fatigue and need to stop. The goal is for you to run for as long as you can. In most subjects, this occurs after approximately 5-8 minutes of running. This test will be completed on both visits to the lab. In one visit, the air you breathe while running will be normal room air. In the other visit, the air you breathe while running will have a reduced oxygen content, equivalent to an altitude of approximately 2500m or 8000ft. You will not be told which air you are breathing, and the order will be selected at random. RISKS OF TAKING PART IN THE STUDY: While in the study, the risks are: Submaximal and maximal exercise tests of healthy individuals, as described by the American College of Sports Medicine, present little risk to the subject and do not require medical clearance for subjects under the age of 40. Potential risks and/or discomforts can include episodes of temporary light-headedness, chest discomfort, leg cramps, occasional

95
irregular heartbeats, and abnormal blood pressure responses. The risk of heart attack, although minor, (approximately 1 to 2 in 10,000) does exist. One death occurs for roughly every 880,000 man hours of submaximal exercise in apparently healthy individuals. During the test you will be closely monitored for any abnormal changes in heart rate or breathing. You are free to indicate any discomfort and discontinue participation at any time. There are potential risks associated with running on a treadmill, such as falling. All face masks will be cleaned in detergent and antibacterial solution after each use, minimizing the risk of virus transmission between subjects. There is a potential risk of loss of confidentiality. BENEFITS OF TAKING PART IN THE STUDY: The benefits to participation that are reasonable to expect are information regarding your overall level of fitness. Other than this information, you will gain little benefit. All subjects will be provided with feedback concerning their own results and the general findings of the study upon request.
CONFIDENTIALITY
Efforts will be made to keep your personal information confidential. Data will be stored on password protected computers in locked rooms with limited public access. We cannot guarantee absolute confidentiality. Your personal information may be disclosed if required by law. Your identity will be held in confidence in reports in which the study may be published and databases in which results may be stored. Organizations that may inspect and/or copy your research records for quality assurance and data analysis include groups such as the study investigator and his/her research associates, the IU Institutional Review Board or its designees, and (as allowed by law) state or federal agencies, specifically the Office for Human Research Protections (OHRP) who may need to access the collected medical and/or research data. PAYMENT Should you qualify for the study, you will be paid a $50 gift card for completing the first session of testing and completing or attempting to complete the second session of testing. Should you withdraw from the study after completing or attempting to complete the first session of testing, you will be paid a $20 gift card. Payment is made via a gift card, which will be given to you at the end of your final testing session. COMPENSATION FOR INJURY In the event of physical injury resulting from your participation in this research, necessary medical treatment will be provided to you at your own expense. Costs not covered by your health care insurer will be your responsibility. Also, it is your
96
responsibility to determine the extent of your health care coverage. There is no program in place for other monetary compensation for such injuries. However, by signing this form you are not giving up any legal rights or benefits to which you are otherwise entitled. CONTACTS FOR QUESTIONS OR PROBLEMS For questions about the study or a research-related injury, contact the researcher Robert Chapman, Ph.D. at (812) 856-2452 or [email protected]. If you cannot reach the researcher during regular business hours (i.e. 8:00AM-5:00PM), please call the IU Human Subjects Office at (812) 856-4242 or (800) 696-2949. For questions about your rights as a research participant or to discuss problems, complaints or concerns about a research study, or to obtain information, or offer input, contact the IU Human Subjects Office at (812) 856-4242 or (800) 696-2949. VOLUNTARY NATURE OF STUDY Taking part in this study is voluntary. You may choose not to take part or may leave the study at any time. Leaving the study will not result in any penalty or loss of benefits to which you are entitled. Your decision whether or not to participate in this study will not affect your current or future relations with the investigators or Indiana University. Your participation may be terminated by the investigator without regard to your consent in the following circumstances: an abnormal response to exercise testing or an inability to complete the exercise tests. SUBJECT’S CONSENT In consideration of all of the above, I give my consent to participate in this research study. I will be given a copy of this informed consent document to keep for my records. I agree to take part in this study. Subject’s Printed Name:_______________________________________ Subject’s Signature:___________________________________________ Date:________________ (must be dated by the subject) Printed Name of Person Obtaining Consent: Signature of Person Obtaining Consent:____________________________ Date:_______________

97
APPENDIX D
Modified Physical Activity Readiness Questionnaire

98
Modified Physical Activity Readiness Questionnaire (PAR-Q)
Name Date
DOB Age Home Phone Work Phone
Regular exercise is associated with many health benefits, yet any change of activity may increase the risk of injury. Please read each question carefully and answer every question honestly:
Yes No 1. Has your doctor ever said that you have a heart condition and that you should only do physical activity recommended by a doctor?
Yes No 2. Do you feel pain in your chest when you do physical activity?
Yes No 3. In the past month, have you had chest pain when you were not doing physical activity?
Yes No 4. Do you lose your balance because of dizziness or do you ever lose consciousness?
Yes No 5. Do you have a bone or joint problem that could be made worse by a change in your physical activity?
Yes No 6. Is your doctor currently prescribing drugs (for example, water pills) for your blood pressure or heart condition?
Yes No 7. Do you know of any other reason you should not do physical activity?
Yes No 8. Has your doctor ever told you that you have diabetes?
Yes No 9. Has your doctor ever told you that you have high blood pressure?
Yes No 10. Has your doctor ever told you that you have high cholesterol?
Yes No 11. Has your doctor ever told you that you have high blood sugar?
Yes No 12. Do you smoke?
Yes No 13. Are you currently inactive?
Yes No 14. Do you have a father, brother or son with heart disease before the age of 55 years old or a mother, sister or daughter with heart disease before the age of 65 years old?
15. (Researcher will complete) Measure height and weight to determine BMI: Height:________ Weight:________
Participant Signature Date

99
APPRENDIX E
Preliminary Survey
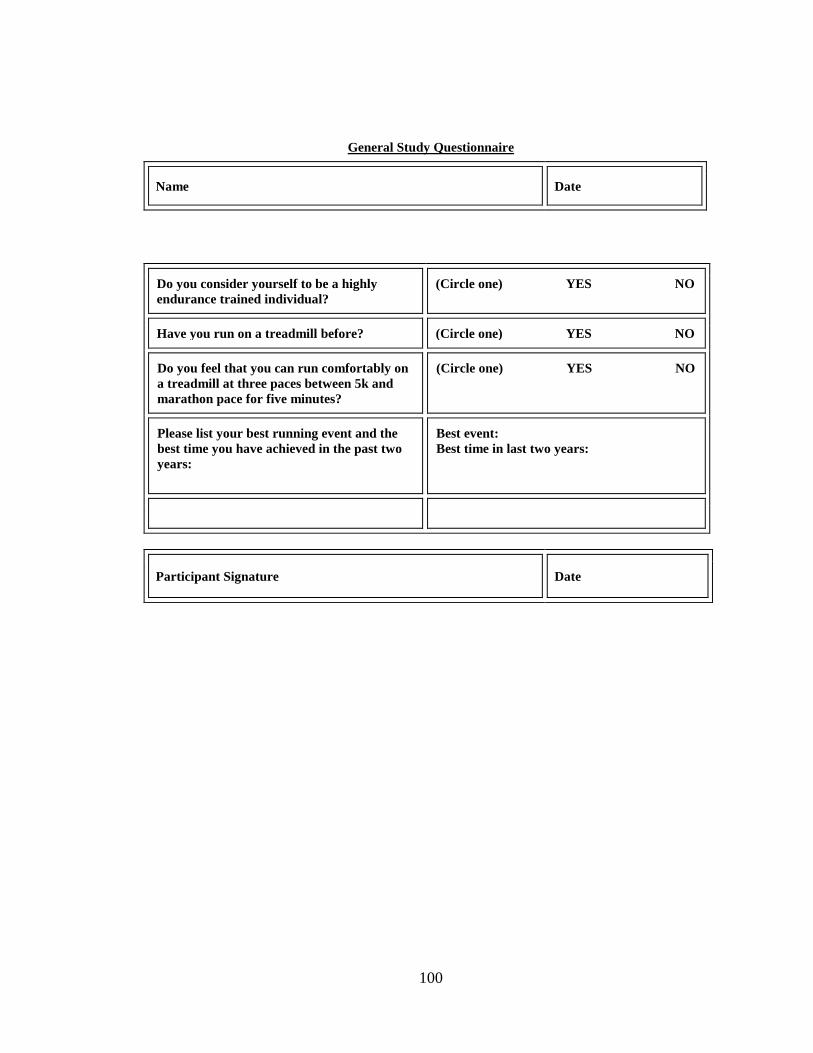
100
General Study Questionnaire
Name Date
Do you consider yourself to be a highly endurance trained individual?
(Circle one) YES NO
Have you run on a treadmill before? (Circle one) YES NO
Do you feel that you can run comfortably on a treadmill at three paces between 5k and marathon pace for five minutes?
(Circle one) YES NO
Please list your best running event and the best time you have achieved in the past two years:
Best event: Best time in last two years:
Participant Signature Date

101
APPRENDIX F
Curriculum Vitae

102
TIMOTHY J. FULTON 1320 South Curry Pike Bloomington, IN 47403 (319) 290-5529 [email protected] EDUCATION Ph.D. Expected 2019 Indiana University School of Public Health Exercise Physiology Minor: Medical Physiology M.S. 2017 Indiana University School of Public Health Exercise Physiology B.A. 2010 University of Northern Iowa College of Business Economics and Finance TEACHING EXPERIENCE Associate Instructor, Medical Sciences Program, IU School of Medicine Aug. 2016 - Present
• PHYS P215 - Basic Human Physiology Laboratory Associate Instructor, Department of Kinesiology, Indiana University Aug. 2015 - Aug. 2016
• SPH K409 - Basic Exercise Physiology Laboratory • SPH I133 - Fitness and Jogging
Adjunct Instructor, Department of Kinesiology, Indiana University Aug. 2014 - Aug. 2015
• SPH I133 - Fitness and Jogging Undergraduate Research Assistant, Motor Behavior Lab, Northern Iowa Aug. 2012 - Dec. 2013
• Oversaw five lab assistants and conducted research involving mobile eye tracking and accelerometery/physical activity levels
Academic Tutor, Department of Athletics, Northern Iowa Jan. 2013 - Dec. 2013
• Tutored student-athletes in exercise physiology, anatomy, biomechanics, and economics courses
Adjunct Faculty, Mathematics, Northeast Iowa Community College Aug. 2010 - Dec. 2010
• MAT 063 - Elementary Algebra • MAT 102 - Intermediate Algebra

103
PUBLICATIONS Fulton TJ, Paris HL, Stickford AS, Gruber AH, Mickleborough TD, Chapman RF. Locomotor-respiratory coupling is maintained in hypoxia in trained distance runners. In preparation. Paris HL, Fulton TJ, Mickleborough TD. Macronutrient oxidation alters operating lung volumes during cycling exercise. In preparation. Fulton TJ, Noble, TJ, and Chapman RF. Does prior Olympic or World Championship experience affect performance at future championships? In preparation. Constantini K, Fulton TJ, Hursh DG, Noble TJ, Paris HLR, Wiggins CC, Chapman RF, Levine BD. Commentary on Viewpoint: Time for a new metric for hypoxic dose? J Appl Physiol. 121: 356-358, 2016. Fulton TJ, Ertz J, Rohler A, Mack MG, Fontana F. Effects of a visual distraction on quiet eye duration and putting performance of collegiate golfers. International Journal of Golf Science. 3: 26-34, 2014. PRESENTATIONS Fulton TJ, Paris HL, Stickford AS, Gruber AH, Mickleborough TD, Chapman RF. “Locomotor-respiratory coupling is maintained in hypoxia in trained distance runners” ACSM Annual Meeting. Denver, May 2017. Paris HL, Murray KO, Fulton TJ, Mickleborough TD. “The repercussion of expectoration: When a carbohydrate rinse becomes detrimental to performance” ACSM Annual Meeting. Denver, May 2017. Fulton TJ and Chapman RF. “Does Prior Olympic or World Championship Experience Affect Performance at Future Championships?” ACSM Annual Meeting. San Diego, May 2015. Fulton TJ, Ertz J, Rohler A, Mack MG, Fontana F “Effects of a visual distraction on quiet eye duration and putting performance in collegiate golfers” NASPSPA Annual Conference, Minneapolis, June 2014 Fulton TJ and Fontana F. “Using Receiver Operating Characteristic Curves and Accelerometry to Establish Step-Count Guidelines for Twelve-Year-Old Children” ACSM Annual Meeting, Indianapolis, May 2013. GRANTS Indiana University Graduate and Professional Student Government Research Grant, March 2017. Effects of hypoxia on physiology and psychology during exercise in women. Unfunded. Indiana University Department of Kinesiology Graduate Student Travel Grant, March 2017. $300. Indiana University School of Public Health Graduate Student Research Grant, November 2015. Effects of hypoxia on locomotor-respiratory coupling during exercise. $1000. Indiana University School of Public Health Graduate Student Travel Grant, May 2015. $400. UNI College of Education Dean’s Undergraduate Research Grant, April 2013. Effects of a visual distraction on quiet eye duration and putting performance in collegiate golfers. $500.

104
FELLOWSHIP Department of Kinesiology Graduate Fellowship, Academic year 2016-2017. Hal Morris Research Fellowship, Academic year 2016-2017. SERVICE School of Public Health Student Ambassador, Indiana University Sep. 2016 - Dec. 2016
• Serve as a link between the school, alumni, donors, and prospective students
• Represent the student body during Office of Development events by engaging and interacting with guests
Undergraduate Curriculum Development, Indiana University May 2016 - Dec. 2016 • Assisted in graduate student led development of a new
undergraduate physiology course: ‘Human Performance & Nutrition’
Jim Holland Summer Enrichment Program, Indiana University Summer 2016 • Led underrepresented high school students through hands-on
laboratory experiences to help broaden their horizons in science
PROFESSIONAL EXPERIENCE Consultant 2015 - Present USA Track & Field, Indianapolis, IN