Extra Virgin Olive Oils Increase Hepatic Fat Accumulation and Hepatic Antioxidant Protein Levels in...
14
Extra Virgin Olive Oils Increase Hepatic Fat Accumulation and Hepatic Antioxidant Protein Levels in APOE -/- Mice Jose Miguel Arbones-Mainar, Karen Ross, ‡ Garry J. Rucklidge, ‡ Martin Reid, ‡ Gary Duncan, ‡ John R. Arthur, ‡ Graham W. Horgan, § Maria A. Navarro, Ricardo Carnicer, Carmen Arnal, Jesus Osada, and Baukje de Roos* ,‡ Department of Biochemistry, Veterinary School, University of Zaragoza, Spain, Division of Vascular Health, Rowett Research Institute, Aberdeen, United Kingdom, and Biomathematics and Statistics Scotland at the Rowett Research Institute, Aberdeen, United Kingdom Received May 28, 2007 We assessed the effects of Picual and Arbequina olive oil, rich and poor in polyphenols, respectively, on plasma lipid and glucose metabolism, hepatic fat content, and the hepatic proteome in female Apoe -/- mice. Both olive oils increased hepatic fat content and adipophilin levels (p< 0.05), though Picual olive oil significantly decreased plasma triglycerides (p < 0.05). Proteomics identified a range of hepatic antioxidant enzymes that were differentially regulated by both olive oils as compared with palm oil. We found a clear association between olive oil consumption and differential regulation of adipophilin and betaine homocysteine methyl transferase as modulators of hepatic triglyceride metabolism. Therefore, our “systems biology” approach revealed hitherto unrecognized insights into the triglyceride-lowering and anti-atherogenic mechanisms of extra virgin olive oils, wherein the up- regulation of a large array of anti-oxidant enzymes may offer sufficient protection against lesion development and diminish oxidative stress levels instigated by hepatic steatosis. Keywords: proteomics • antioxidant enzymes • insulin resistance • adipophilin • betaine homocysteine methyl- transferase Introduction The “Mediterranean Diet” is associated with a lower rate of coronary heart disease (CHD), 1,2 as well as a reduction in all- cause mortality. 3,4 Olive oil is the main source of fat in this type of diet. Low percentages (5-10%) of extra virgin olive oil (EVOO)-enriched diets on a low cholesterol background halted the progression of induced atherosclerosis in rabbits 5 and in female apolipoprotein E knockout (Apoe -/- ) mice, 6 although a higher percentage of dietary EVOO (20%) on a high cholesterol background diet failed to show a difference in atherosclerosis lesion development when compared with a carbohydrate-rich diet. 7 The Mediterranean diet might protect against coronary heart disease by improving the lipoprotein profile. 8 The Mediter- ranean diet may also provide additional benefits by acting on other cardiovascular risk factors, including a lowering of blood pressure, and an improvement in insulin sensitivity both in healthy and in type 2 diabetic patients. 9 The beneficial effects of olive oil on both lipoprotein metabolism and potentially insulin resistance suggest that consumption of olive oil affects hepatic lipid and glucose metabolism. To gain understanding in the mechanisms by which olive oil fatty acids, or its minor antioxidant constituents, may affect hepatic metabolic path- ways, oxidative stress and eventually atherogenesis, we have applied a systems biology approach. The physiological effects of the individual olive oils could be mediated through multiple biochemical and molecular mechanisms, stressing the need to extend the availability of relevant biomarkers to properly assess their effects. The current study was carried out in Apoe -/- mice, a well-characterized and widely used model that spontaneously develops atherosclerosis with features similar to those occurring in humans. 10 Materials and Methods The study protocols were approved by the Ethics Committee for Animal Research of the University of Zaragoza, Spain, and were conducted in conformity with the Public Health Service Policy on Humane Care and Use of Laboratory Animals. All animals received humane care according to the criteria outlined in the “Guide for the Care and Use of Laboratory Animals” published by the NIH in 1985. Animals and Diets. The design of this study has been described before. 11 Briefly, Apoe -/- animals were bred and kept at the Unidad Mixta de Investigacio ´ n, Zaragoza, Spain. Animals were housed in sterile filter-top cages under 12 h light/dark * To whom correspondence should be addressed. Dr. Baukje de Roos, Rowett Research Institute, Division of Vascular Health, Greenburn Road, Bucksburn, Aberdeen AB21 9SB, United Kingdom. Tel. +44 (0)1224 716636; Fax: +44 (0)1224 716629; E-mail, [email protected]. University of Zaragoza. ‡ Division of Vascular Health, Rowett Research Institute. § Biomathematics and Statistics Scotland at the Rowett Research Institute. 10.1021/pr070321a CCC: $37.00 2007 American Chemical Society Journal of Proteome Research 2007, 6, 4041-4054 4041 Published on Web 09/11/2007
-
Upload
independent -
Category
Documents
-
view
2 -
download
0
Transcript of Extra Virgin Olive Oils Increase Hepatic Fat Accumulation and Hepatic Antioxidant Protein Levels in...

Extra Virgin Olive Oils Increase Hepatic Fat Accumulation and
Hepatic Antioxidant Protein Levels in APOE-/- Mice
Jose Miguel Arbones-Mainar,† Karen Ross,‡ Garry J. Rucklidge,‡ Martin Reid,‡ Gary Duncan,‡
John R. Arthur,‡ Graham W. Horgan,§ Maria A. Navarro,† Ricardo Carnicer,† Carmen Arnal,†
Jesus Osada,† and Baukje de Roos*,‡
Department of Biochemistry, Veterinary School, University of Zaragoza, Spain, Division of Vascular Health,Rowett Research Institute, Aberdeen, United Kingdom, and Biomathematics and Statistics Scotland at the
Rowett Research Institute, Aberdeen, United Kingdom
Received May 28, 2007
We assessed the effects of Picual and Arbequina olive oil, rich and poor in polyphenols, respectively,on plasma lipid and glucose metabolism, hepatic fat content, and the hepatic proteome in femaleApoe-/- mice. Both olive oils increased hepatic fat content and adipophilin levels (p < 0.05), thoughPicual olive oil significantly decreased plasma triglycerides (p < 0.05). Proteomics identified a range ofhepatic antioxidant enzymes that were differentially regulated by both olive oils as compared withpalm oil. We found a clear association between olive oil consumption and differential regulation ofadipophilin and betaine homocysteine methyl transferase as modulators of hepatic triglyceridemetabolism. Therefore, our “systems biology” approach revealed hitherto unrecognized insights intothe triglyceride-lowering and anti-atherogenic mechanisms of extra virgin olive oils, wherein the up-regulation of a large array of anti-oxidant enzymes may offer sufficient protection against lesiondevelopment and diminish oxidative stress levels instigated by hepatic steatosis.
Keywords: proteomics • antioxidant enzymes • insulin resistance • adipophilin • betaine homocysteine methyl-transferase
Introduction
The “Mediterranean Diet” is associated with a lower rate ofcoronary heart disease (CHD),1,2 as well as a reduction in all-cause mortality.3,4 Olive oil is the main source of fat in this typeof diet. Low percentages (5-10%) of extra virgin olive oil(EVOO)-enriched diets on a low cholesterol background haltedthe progression of induced atherosclerosis in rabbits5 and infemale apolipoprotein E knockout (Apoe-/-) mice,6 although ahigher percentage of dietary EVOO (20%) on a high cholesterolbackground diet failed to show a difference in atherosclerosislesion development when compared with a carbohydrate-richdiet.7
The Mediterranean diet might protect against coronary heartdisease by improving the lipoprotein profile.8 The Mediter-ranean diet may also provide additional benefits by acting onother cardiovascular risk factors, including a lowering of bloodpressure, and an improvement in insulin sensitivity both inhealthy and in type 2 diabetic patients.9 The beneficial effectsof olive oil on both lipoprotein metabolism and potentiallyinsulin resistance suggest that consumption of olive oil affects
hepatic lipid and glucose metabolism. To gain understandingin the mechanisms by which olive oil fatty acids, or its minorantioxidant constituents, may affect hepatic metabolic path-ways, oxidative stress and eventually atherogenesis, we haveapplied a systems biology approach. The physiological effectsof the individual olive oils could be mediated through multiplebiochemical and molecular mechanisms, stressing the need toextend the availability of relevant biomarkers to properly assesstheir effects. The current study was carried out in Apoe-/- mice,a well-characterized and widely used model that spontaneouslydevelops atherosclerosis with features similar to those occurringin humans.10
Materials and Methods
The study protocols were approved by the Ethics Committeefor Animal Research of the University of Zaragoza, Spain, andwere conducted in conformity with the Public Health ServicePolicy on Humane Care and Use of Laboratory Animals. Allanimals received humane care according to the criteria outlinedin the “Guide for the Care and Use of Laboratory Animals”published by the NIH in 1985.
Animals and Diets. The design of this study has beendescribed before.11 Briefly, Apoe-/- animals were bred and keptat the Unidad Mixta de Investigacion, Zaragoza, Spain. Animalswere housed in sterile filter-top cages under 12 h light/dark
* To whom correspondence should be addressed. Dr. Baukje de Roos,Rowett Research Institute, Division of Vascular Health, Greenburn Road,Bucksburn, Aberdeen AB21 9SB, United Kingdom. Tel. +44 (0)1224 716636;Fax: +44 (0)1224 716629; E-mail, [email protected].
† University of Zaragoza.‡ Division of Vascular Health, Rowett Research Institute.§ Biomathematics and Statistics Scotland at the Rowett Research Institute.
10.1021/pr070321a CCC: $37.00 2007 American Chemical Society Journal of Proteome Research 2007, 6, 4041-4054 4041Published on Web 09/11/2007
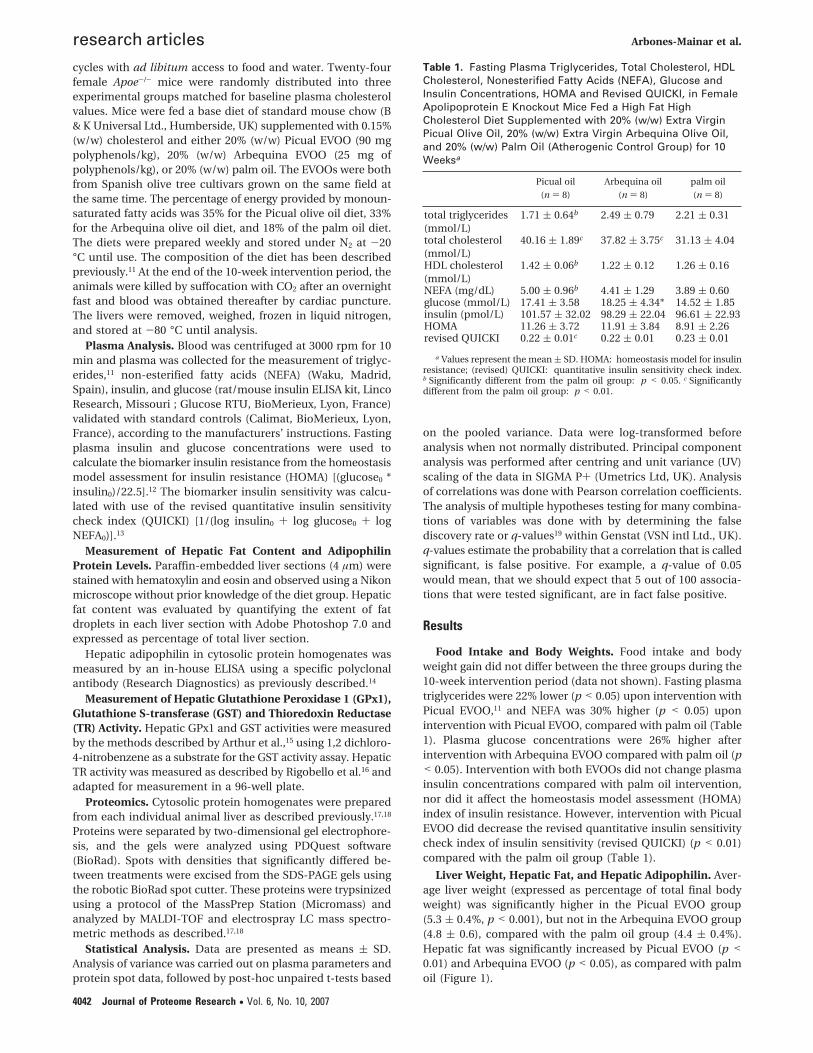
cycles with ad libitum access to food and water. Twenty-fourfemale Apoe-/- mice were randomly distributed into threeexperimental groups matched for baseline plasma cholesterolvalues. Mice were fed a base diet of standard mouse chow (B& K Universal Ltd., Humberside, UK) supplemented with 0.15%(w/w) cholesterol and either 20% (w/w) Picual EVOO (90 mgpolyphenols/kg), 20% (w/w) Arbequina EVOO (25 mg ofpolyphenols/kg), or 20% (w/w) palm oil. The EVOOs were bothfrom Spanish olive tree cultivars grown on the same field atthe same time. The percentage of energy provided by monoun-saturated fatty acids was 35% for the Picual olive oil diet, 33%for the Arbequina olive oil diet, and 18% of the palm oil diet.The diets were prepared weekly and stored under N2 at -20°C until use. The composition of the diet has been describedpreviously.11 At the end of the 10-week intervention period, theanimals were killed by suffocation with CO2 after an overnightfast and blood was obtained thereafter by cardiac puncture.The livers were removed, weighed, frozen in liquid nitrogen,and stored at -80 °C until analysis.
Plasma Analysis. Blood was centrifuged at 3000 rpm for 10min and plasma was collected for the measurement of triglyc-erides,11 non-esterified fatty acids (NEFA) (Waku, Madrid,Spain), insulin, and glucose (rat/mouse insulin ELISA kit, LincoResearch, Missouri ; Glucose RTU, BioMerieux, Lyon, France)validated with standard controls (Calimat, BioMerieux, Lyon,France), according to the manufacturers’ instructions. Fastingplasma insulin and glucose concentrations were used tocalculate the biomarker insulin resistance from the homeostasismodel assessment for insulin resistance (HOMA) [(glucose0 *insulin0)/22.5].12 The biomarker insulin sensitivity was calcu-lated with use of the revised quantitative insulin sensitivitycheck index (QUICKI) [1/(log insulin0 + log glucose0 + logNEFA0)].13
Measurement of Hepatic Fat Content and AdipophilinProtein Levels. Paraffin-embedded liver sections (4 µm) werestained with hematoxylin and eosin and observed using a Nikonmicroscope without prior knowledge of the diet group. Hepaticfat content was evaluated by quantifying the extent of fatdroplets in each liver section with Adobe Photoshop 7.0 andexpressed as percentage of total liver section.
Hepatic adipophilin in cytosolic protein homogenates wasmeasured by an in-house ELISA using a specific polyclonalantibody (Research Diagnostics) as previously described.14
Measurement of Hepatic Glutathione Peroxidase 1 (GPx1),Glutathione S-transferase (GST) and Thioredoxin Reductase(TR) Activity. Hepatic GPx1 and GST activities were measuredby the methods described by Arthur et al.,15 using 1,2 dichloro-4-nitrobenzene as a substrate for the GST activity assay. HepaticTR activity was measured as described by Rigobello et al.16 andadapted for measurement in a 96-well plate.
Proteomics. Cytosolic protein homogenates were preparedfrom each individual animal liver as described previously.17,18
Proteins were separated by two-dimensional gel electrophore-sis, and the gels were analyzed using PDQuest software(BioRad). Spots with densities that significantly differed be-tween treatments were excised from the SDS-PAGE gels usingthe robotic BioRad spot cutter. These proteins were trypsinizedusing a protocol of the MassPrep Station (Micromass) andanalyzed by MALDI-TOF and electrospray LC mass spectro-metric methods as described.17,18
Statistical Analysis. Data are presented as means ( SD.Analysis of variance was carried out on plasma parameters andprotein spot data, followed by post-hoc unpaired t-tests based
on the pooled variance. Data were log-transformed beforeanalysis when not normally distributed. Principal componentanalysis was performed after centring and unit variance (UV)scaling of the data in SIGMA P+ (Umetrics Ltd, UK). Analysisof correlations was done with Pearson correlation coefficients.The analysis of multiple hypotheses testing for many combina-tions of variables was done with by determining the falsediscovery rate or q-values19 within Genstat (VSN intl Ltd., UK).q-values estimate the probability that a correlation that is calledsignificant, is false positive. For example, a q-value of 0.05would mean, that we should expect that 5 out of 100 associa-tions that were tested significant, are in fact false positive.
Results
Food Intake and Body Weights. Food intake and bodyweight gain did not differ between the three groups during the10-week intervention period (data not shown). Fasting plasmatriglycerides were 22% lower (p < 0.05) upon intervention withPicual EVOO,11 and NEFA was 30% higher (p < 0.05) uponintervention with Picual EVOO, compared with palm oil (Table1). Plasma glucose concentrations were 26% higher afterintervention with Arbequina EVOO compared with palm oil (p< 0.05). Intervention with both EVOOs did not change plasmainsulin concentrations compared with palm oil intervention,nor did it affect the homeostasis model assessment (HOMA)index of insulin resistance. However, intervention with PicualEVOO did decrease the revised quantitative insulin sensitivitycheck index of insulin sensitivity (revised QUICKI) (p < 0.01)compared with the palm oil group (Table 1).
Liver Weight, Hepatic Fat, and Hepatic Adipophilin. Aver-age liver weight (expressed as percentage of total final bodyweight) was significantly higher in the Picual EVOO group(5.3 ( 0.4%, p < 0.001), but not in the Arbequina EVOO group(4.8 ( 0.6), compared with the palm oil group (4.4 ( 0.4%).Hepatic fat was significantly increased by Picual EVOO (p <0.01) and Arbequina EVOO (p < 0.05), as compared with palmoil (Figure 1).
Table 1. Fasting Plasma Triglycerides, Total Cholesterol, HDLCholesterol, Nonesterified Fatty Acids (NEFA), Glucose andInsulin Concentrations, HOMA and Revised QUICKI, in FemaleApolipoprotein E Knockout Mice Fed a High Fat HighCholesterol Diet Supplemented with 20% (w/w) Extra VirginPicual Olive Oil, 20% (w/w) Extra Virgin Arbequina Olive Oil,and 20% (w/w) Palm Oil (Atherogenic Control Group) for 10Weeksa
Picual oil
(n ) 8)
Arbequina oil
(n ) 8)
palm oil
(n ) 8)
total triglycerides(mmol/L)
1.71 ( 0.64b 2.49 ( 0.79 2.21 ( 0.31
total cholesterol(mmol/L)
40.16 ( 1.89c 37.82 ( 3.75c 31.13 ( 4.04
HDL cholesterol(mmol/L)
1.42 ( 0.06b 1.22 ( 0.12 1.26 ( 0.16
NEFA (mg/dL) 5.00 ( 0.96b 4.41 ( 1.29 3.89 ( 0.60glucose (mmol/L) 17.41 ( 3.58 18.25 ( 4.34* 14.52 ( 1.85insulin (pmol/L) 101.57 ( 32.02 98.29 ( 22.04 96.61 ( 22.93HOMA 11.26 ( 3.72 11.91 ( 3.84 8.91 ( 2.26revised QUICKI 0.22 ( 0.01c 0.22 ( 0.01 0.23 ( 0.01
a Values represent the mean ( SD. HOMA: homeostasis model for insulinresistance; (revised) QUICKI: quantitative insulin sensitivity check index.b Significantly different from the palm oil group: p < 0.05. c Significantlydifferent from the palm oil group: p < 0.01.
research articles Arbones-Mainar et al.
4042 Journal of Proteome Research • Vol. 6, No. 10, 2007

Hepatic adipophilin protein levels were significantly higherupon intervention with Picual EVOO (p < 0.001) and withArbequina EVOO (p < 0.05), as compared with palm oil (Fig-ure 1).
Hepatic GPx1, GST, and TR Activity. Hepatic GPx1 activitywas significantly lower upon intervention with Picual EVOO(0.33 ( 0.04 U/mg protein, mean ( SD) and Arbequina EVOO(0.33 ( 0.03 U/mg protein) compared with palm oil interven-tion (0.40 ( 0.02) (both p < 0.01). Hepatic GST activity wasnot significantly affected by Picual EVOO (8.70 ( 3.54 µM/gprotein) or Arbequina EVOO (6.37 ( 0.82 µM/g protein) ascompared with palm oil intervention (6.04 µM/g protein). TRactivity was significantly increased by Picual EVOO (1.11 ( 0.23U/mg protein) (p < 0.05), but not by Arbequina EVOO (0.94 (0.24 U/mg protein) as compared with palm oil intervention(0.84 ( 0.22 U/mg protein).
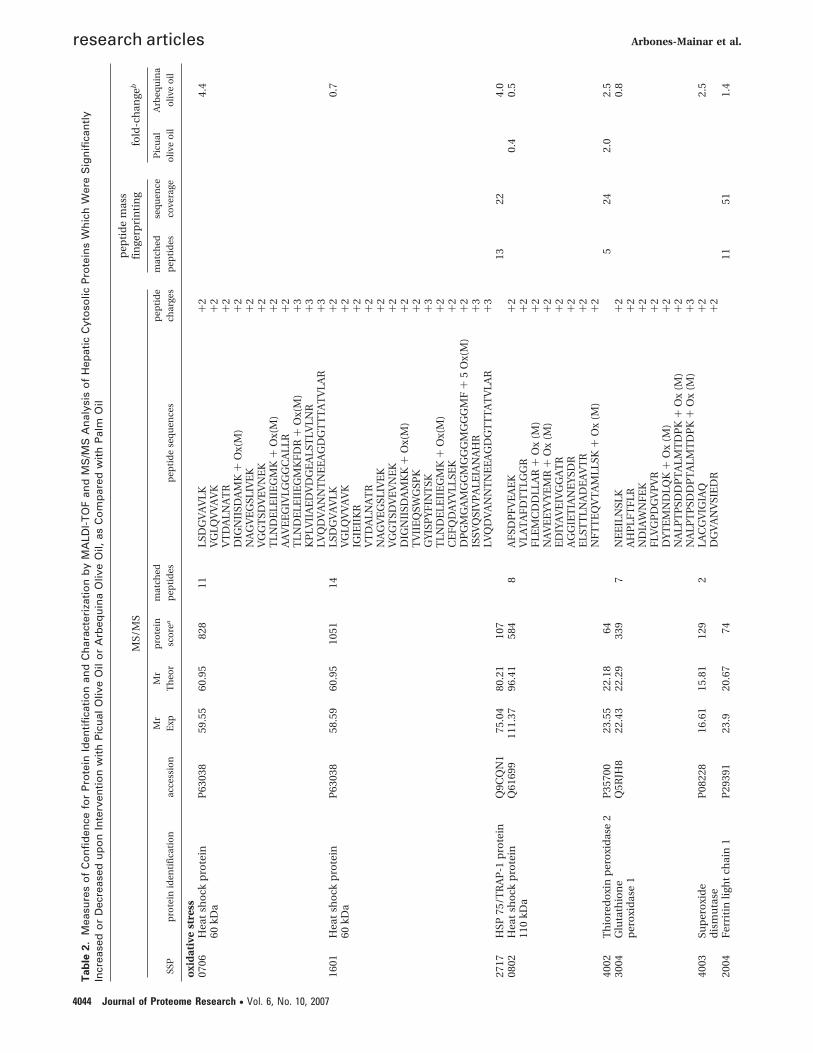
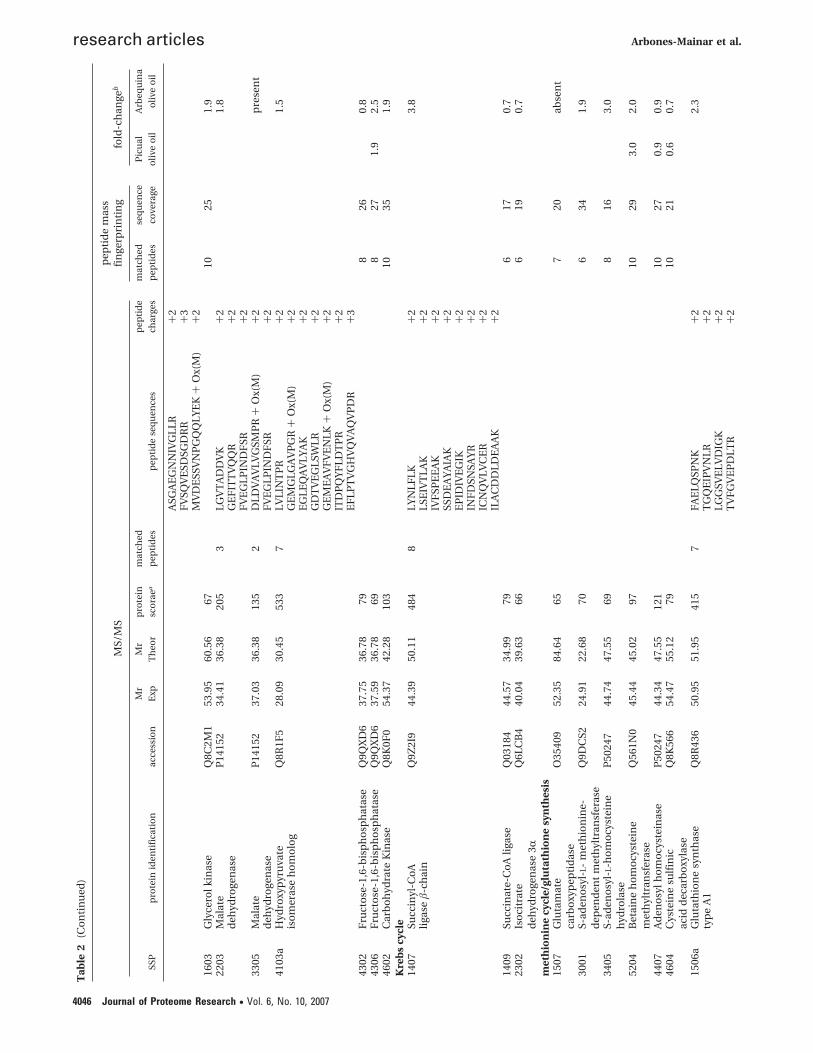
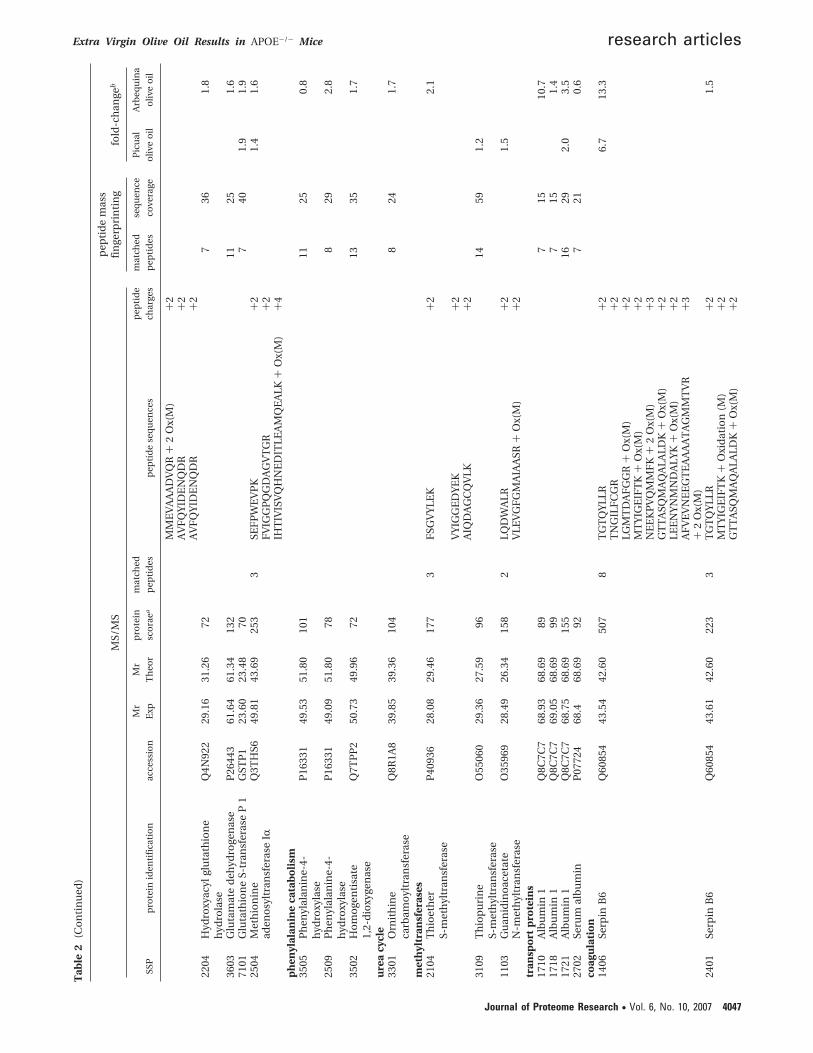
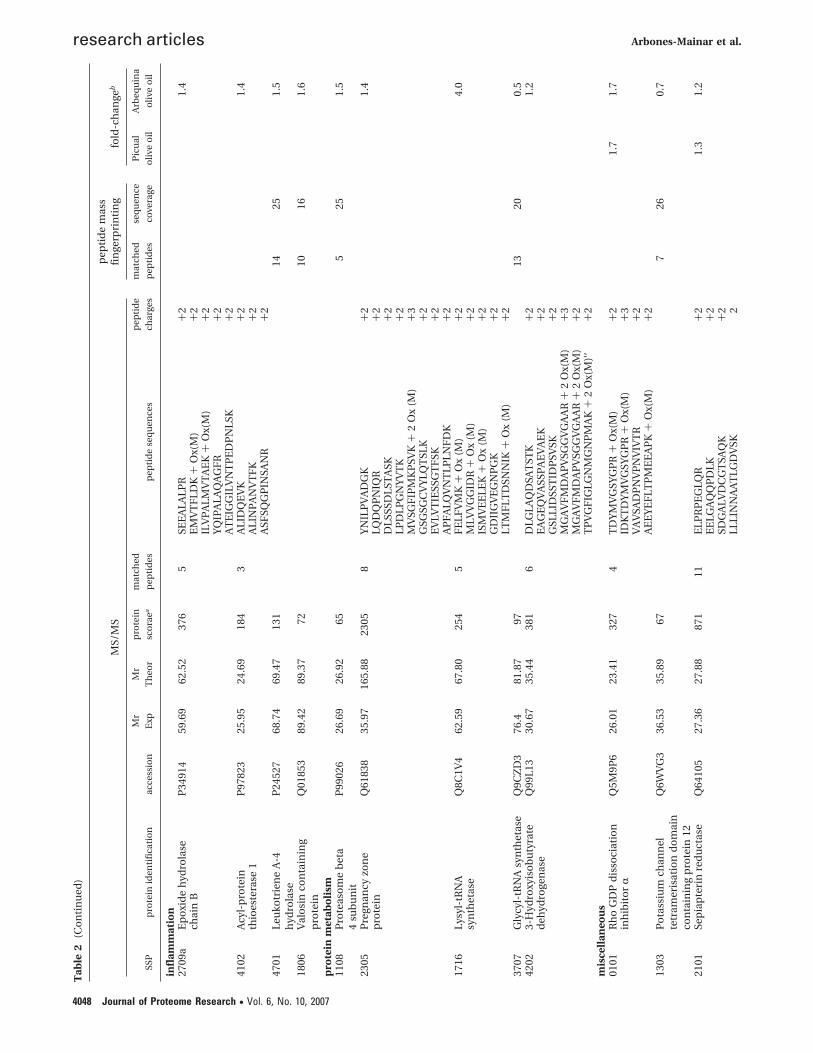
Proteomics. Two-dimensional-gel electrophoresis of indi-vidual liver cytosolic protein fractions revealed 80 cytosolicproteins of which levels were significantly up- or down-regulated by Picual EVOO and Arbequina EVOO, comparedwith palm oil. The proteins identified were categorized accord-ing to their major biochemical functions to facilitate theelucidation of pattern changes between treatments (Table 2).Significant increases were observed in levels of a range of anti-oxidant enzymes, enzymes involved in carbohydrate metabo-lism, and enzymes involved in the methionine cycle or glu-tathione synthesis, mainly upon intervention with ArbequinaEVOO.
Principal Component Analysis. Principal component analy-sis (PCA) is a mathematical procedure that transforms anumber of correlated variables into a smaller number ofuncorrelated variables, which may enable the detection of astructure in relationships between them. PCA of the proteomicsresults as well as physiological outcome parameters allowedus to reduce all initial variables into two principal components.These new uncorrelated factors that were successively extracted
revealed that 32% of all variance in the dataset was accountedfor by the first principal component (PC1), and an additional12% was accounted for by the second principal component(PC2) (Figure 2, upper panel). The largest treatment effect onthe first principal component (i.e., the largest distance betweenthe spots representing the dietary intervention groups on theX-axis) was between the palm oil control group (red spots) andthe Arbequina EVOO intervention group (blue spots). Whenconsidering the second principal component (which representsone or more other, independent variables), the Picual EVOOintervention group initiated a specific treatment effect com-pared with the palm oil control group. The loadings plotrevealed that parameters with the highest loadings (i.e., thelargest distance from the 0,0 point) which explained most ofthe treatment effect of the Picual olive oil (green letters) andArbequina olive oil (blue letters) (Figure 2, lower panel). ForPicual olive oil, the proteins that provided the largest contribu-tion to the dietary treatment effects in the principle compo-nent analysis were mostly related to hepatic steatosis. ForArbequina olive oil, the proteins that provided the largestcontribution to the dietary treatment effects in the principalcomponent analysis were mostly related to oxidative stress,carbohydrate metabolism, and the methionine cycle/glu-tathione synthesis.
Pairwise Correlation Analysis. In addition to PCA, weperformed a pairwise correlation analysis over the differenttreatments, including the physiological data measured inplasma lipid as well as the data on hepatic protein levels. Suchan analysis shows which parameters vary in similar waysthroughout the two EVOO treatments, but also highlights whichof the parameters are differentially affected by the two EVOOcultivars. Figure 3 shows a network of all pairwise interactionsfor each of the EVOO diets with a Pearson correlation coef-ficient > 0.66, p value < 0.0005 and a q-value of 0.0025, usingthe software tool Cytoscape.20
Figure 1. Representative images from a liver from (A) the Picual olive oil group, (B) the Arbequina olive oil group, (C) the palm oilgroup, stained with hematoxylin and eosin (magnification ×100) as well as the morphometric quantification of the liver fat content ineach group (results are expressed as percentage of liver covered by fat in each section) (D) and the amount of hepatic adipophilinprotein (E).
Extra Virgin Olive Oil Results in APOE-/- Mice research articles
Journal of Proteome Research • Vol. 6, No. 10, 2007 4043
Tab
le2.
Mea
sure
so
fC
on
fid
ence
for
Pro
tein
Iden
tifi
cati
on
and
Ch
arac
teri
zati
on
by
MA
LDI-
TO
Fan
dM
S/M
SA
nal
ysis
of
Hep
atic
Cyt
oso
licP
rote
ins
Wh
ich
Wer
eS
ign
ific
antl
yIn
crea
sed
or
Dec
reas
edu
po
nIn
terv
enti
on
wit
hP
icu
alO
live
Oil
or
Arb
equ
ina
Oliv
eO
il,as
Co
mp
ared
wit
hP
alm
Oil
MS/
MS
pep
tid
em
ass
fin
gerp
rin
tin
gfo
ld-c
han
geb
SSP
pro
tein
iden
tifi
cati
on
acce
ssio
n
Mr
Exp
Mr
Th
eor
pro
tein
sco
rea
mat
ched
pep
tid
esp
epti
de
seq
uen
ces
pep
tid
e
char
ges
mat
ched
pep
tid
es
seq
uen
ce
cove
rage
Pic
ual
oliv
eo
il
Arb
equ
ina
oliv
eo
il
oxi
dat
ive
stre
ss07
06H
eat
sho
ckp
rote
inP
6303
859
.55
60.9
582
811
LSD
GV
AV
LK+
24.
460
kDa
VG
LQV
VA
VK
+2
VT
DA
LNA
TR
+2
DIG
NII
SDA
MK
+O
x(M
)+
2N
AG
VE
GSL
IVE
K+
2V
GG
TSD
VE
VN
EK
+2
TLN
DE
LEII
EG
MK
+O
x(M
)+
2A
AV
EE
GIV
LGG
GC
ALL
R+
2T
LND
ELE
IIE
GM
KF
DR
+O
x(M
)+
3K
PLV
IIA
ED
VD
GE
ALS
TLV
LNR
+3
LVQ
DV
AN
NT
NE
EA
GD
GT
TT
AT
VLA
R+
316
01H
eat
sho
ckp
rote
inP
6303
858
.59
60.9
510
5114
LSD
GV
AV
LK+
20.
760
kDa
VG
LQV
VA
VK
+2
IGIE
IIK
R+
2V
TD
ALN
AT
R+
2N
AG
VE
GSL
IVE
K+
2V
GG
TSD
VE
VN
EK
+2
DIG
NII
SDA
MK
K+
Ox(
M)
+2
TV
IIE
QSW
GSP
K+
2G
YIS
PY
FIN
TSK
+3
TLN
DE
LEII
EG
MK
+O
x(M
)+
2C
EF
QD
AY
VLL
SEK
+2
DP
GM
GA
MG
GM
GG
GM
GG
GM
F+
5O
x(M
)+
2IS
SVQ
SIV
PA
LEIA
NA
HR
+3
LVQ
DV
AN
NT
NE
EA
GD
GT
TT
AT
VLA
R+
327
17H
SP75
/TR
AP
-1p
rote
inQ
9CQ
N1
75.0
480
.21
107
1322
4.0
0802
Hea
tsh
ock
pro
tein
Q61
699
111.
3796
.41
584
8A
FSD
PF
VE
AE
K+
20.
40.
511
0kD
aV
LAT
AF
DT
TLG
GR
+2
FLE
MC
DD
LLA
R+
Ox
(M)
+2
NA
VE
EY
VY
EM
R+
Ox
(M)
+2
ED
IYA
VE
IVG
GA
TR
+2
AG
GIE
TIA
NE
YSD
R+
2E
LST
TLN
AD
EA
VT
R+
2N
FT
TE
QV
TA
MLL
SK+
Ox
(M)
+2
4002
Th
iore
do
xin
per
oxi
das
e2
P35
700
23.5
522
.18
645
242.
02.
530
04G
luta
thio
ne
Q5R
JH8
22.4
322
.29
339
7N
EE
ILN
SLK
+2
0.8
per
oxi
das
e1
AH
PLF
TF
LR+
2N
DIA
WN
FE
K+
2F
LVG
PD
GV
PV
R+
2D
YT
EM
ND
LQK
+O
x(M
)+
2N
ALP
TP
SDD
PT
ALM
TD
PK
+O
x(M
)+
2N
ALP
TP
SDD
PT
ALM
TD
PK
+O
x(M
)+
340
03Su
per
oxi
de
P08
228
16.6
115
.81
129
2LA
CG
VIG
IAQ
+2
2.5
dis
mu
tase
DG
VA
NV
SIE
DR
+2
2004
Fer
riti
nlig
ht
chai
n1
P29
391
23.9
20.6
774
1151
1.4
research articles Arbones-Mainar et al.
4044 Journal of Proteome Research • Vol. 6, No. 10, 2007

Tab
le2
(Co
nti
nu
ed)
MS/
MS
pep
tid
em
ass
fin
gerp
rin
tin
gfo
ld-c
han
geb
SSP
pro
tein
iden
tifi
cati
on
acce
ssio
n
Mr
Exp
Mr
Th
eor
pro
tein
sco
raea
mat
ched
pep
tid
esp
epti
de
seq
uen
ces
pep
tid
e
char
ges
mat
ched
pep
tid
es
seq
uen
ce
cove
rage
Pic
ual
oliv
eo
il
Arb
equ
ina
oliv
eo
il
3105
An
tio
xid
ant
pro
tein
Q8K
4K8
26.6
727
.69
171
3E
LSLD
DF
K+
21.
5(p
rdx3
pro
du
ct)
GT
AV
VN
GE
FK
+2
HLS
VN
DLP
VG
R+
236
07T
com
ple
xp
oly
pep
tid
e1
P80
314
55.2
660
.45
668
170.
842
06H
aoo
pro
tein
Q78
JT3
30.8
132
.80
799
420.
90.
735
08a
Ald
ehyd
ed
ehyd
roge
nas
eP
4773
850
.37
56.5
421
43
TIE
EV
VG
R+
22.
1V
VG
NP
FD
SR+
2T
EQ
GP
QV
DE
TQ
FK
+2
3609
Ald
ehyd
ed
ehyd
roge
nas
eQ
9DB
F1
54.9
455
.51
748
210.
622
05A
lph
a-E
TF
Q99
LC5
35.3
035
.01
131
734
1.8
lip
idm
etab
oli
sm11
05A
po
lipo
pro
tein
A-
IQ
0062
325
.85
30.5
934
65
LSP
VA
EE
FR
+2
0.5
DF
AN
VY
VD
AV
K+
2V
QP
YLD
EF
QK
+2
VA
PLG
AE
LQE
SAR
+2
VK
DF
AN
VY
VD
AV
K+
321
08A
po
lipo
pro
tein
A-
Ip
recu
rso
rQ
0062
326
.17
30.5
980
1136
0.5
3003
Fat
tyac
id-b
ind
ing
pro
tein
P55
050
13.8
114
.24
541
LTIT
QD
GN
K+
21.
580
01F
atty
acid
bin
din
gp
rote
inP
5505
014
.29
14.2
478
557
1.7
2705
Car
bo
xyle
ster
ase
1Q
8VC
C2
61.4
62.6
878
1021
4.4
3703
Car
bo
xyle
ster
ase
Q63
880
61.7
361
.51
123
2A
ISQ
SGV
VIS
K+
21.
4V
TQ
PE
VD
TP
LGR
+2
4605
Ace
tylC
oA
acyl
tran
sfer
ase
Q8C
AY
642
.26
44.8
176
929
1.9
2.8
2105
Ph
osp
hat
idyl
cho
line
P53
808
26.3
724
.79
214
4Y
PF
PLS
NR
+2
1.4
tran
sfer
pro
tein
QSL
AIE
SDG
K+
2LL
DQ
PSG
LYE
YK
+2
ESD
EQ
MV
AY
WE
VK
+O
x(M
)+
237
052-
Hyd
roxy
ph
ytan
oyl
-Q
9QX
E0
60.9
963
.66
359
4Q
LLE
QF
DK
+2
0.8
Co
Aly
ase
ALQ
SAD
VIV
LFG
AR
+2
DSF
IVSE
GA
NT
MD
IGR
+O
x(M
)+
2N
QE
AM
GA
FQ
EF
PQ
VE
AC
R+
Ox(
M)
+3
4710
His
tid
ine
amm
on
ia-l
yase
P35
492
76.4
272
.89
835
1222
0.5
glu
cose
met
abo
lism
0303
Gal
acto
kin
ase
Q9R
0N0
39.9
42.1
860
19
ME
ELE
AG
R+
Ox(
M)
+2
1.4
VE
ELL
AE
AR
+2
LAV
LIT
NSN
VR
+2
HSL
GSS
EY
PV
R+
2T
DG
LVSL
LTT
SK+
2SL
ET
SLV
PLS
DP
K+
2SL
ET
SLV
PLS
DP
K+
3A
FM
EE
FG
AE
PE
LAV
SAP
GR
+O
x(M
)+
2V
NLI
GE
HT
DY
NQ
GLV
LPM
ALE
LVT
VM
VG
SPR
+2
Ox(
M)
+4
0610
Glu
coki
nas
eQ
5SV
I651
.851
.89
545
8G
ILLN
WT
K+
24.
94.
7IT
VG
VD
GSV
YK
+2
VG
EG
EA
GQ
WSV
K+
2F
VSQ
VE
SDSG
DR
+2
ASG
AE
GN
NIV
GLL
R+
3
Extra Virgin Olive Oil Results in APOE-/- Mice research articles
Journal of Proteome Research • Vol. 6, No. 10, 2007 4045
Tab
le2
(Co
nti
nu
ed)
MS/
MS
pep
tid
em
ass
fin
gerp
rin
tin
gfo
ld-c
han
geb
SSP
pro
tein
iden
tifi
cati
on
acce
ssio
n
Mr
Exp
Mr
Th
eor
pro
tein
sco
raea
mat
ched
pep
tid
esp
epti
de
seq
uen
ces
pep
tid
e
char
ges
mat
ched
pep
tid
es
seq
uen
ce
cove
rage
Pic
ual
oliv
eo
il
Arb
equ
ina
oliv
eo
il
ASG
AE
GN
NIV
GLL
R+
2F
VSQ
VE
SDSG
DR
R+
3M
VD
ESS
VN
PG
LYE
K+
Ox(
M)
+2
1603
Gly
cero
lkin
ase
Q8C
2M1
53.9
560
.56
6710
251.
922
03M
alat
eP
1415
234
.41
36.3
820
53
LGV
TA
DD
VK
+2
1.8
deh
ydro
gen
ase
GE
FIT
TV
R+
2F
VE
GLP
IND
FSR
+2
3305
Mal
ate
P14
152
37.0
336
.38
135
2D
LDV
AV
LVG
SMP
R+
Ox(
M)
+2
pre
sen
td
ehyd
roge
nas
eF
VE
GLP
IND
FSR
+2
4103
aH
ydro
xyp
yru
vate
Q8R
1F5
28.0
930
.45
533
7LV
LIN
TP
R+
21.
5is
om
eras
eh
om
olo
gG
EM
GLG
AV
PG
R+
Ox(
M)
+2
EG
LEQ
AV
LYA
K+
2G
DT
VE
GLS
WLR
+2
GE
ME
AV
FV
EN
LK+
Ox(
M)
+2
ITD
PQ
YF
LDT
PR
+2
EF
LPT
VG
HV
QV
AQ
VP
DR
+3
4302
Fru
cto
se-1
,6-b
isp
ho
sph
atas
eQ
9QX
D6
37.7
536
.78
798
260.
843
06F
ruct
ose
-1,6
-bis
ph
osp
hat
ase
Q9Q
XD
637
.59
36.7
869
827
1.9
2.5
4602
Car
bo
hyd
rate
Kin
ase
Q8K
0F0
54.3
742
.28
103
1035
1.9
Kre
bs
cycl
e14
07Su
ccin
yl-C
oA
Q9Z
2I9
44.3
950
.11
484
8LY
NLF
LK+
23.
8lig
ase
â-ch
ain
LSE
IVT
LAK
+2
IVF
SPE
EA
K+
2SS
DE
AY
AIA
K+
2E
PID
IVE
GIK
+2
INF
DSN
SAY
R+
2IC
NQ
VLV
CE
R+
2IL
AC
DD
LDE
AA
K+
214
09Su
ccin
ate-
Co
Alig
ase
Q03
184
44.5
734
.99
796
170.
723
02Is
oci
trat
ed
ehyd
roge
nas
e3R
Q6L
CB
440
.04
39.6
366
619
0.7
met
hio
nin
ecy
cle/
glu
tath
ion
esy
nth
esis
1507
Glu
tam
ate
carb
oxy
pep
tid
ase
O35
409
52.3
584
.64
657
20ab
sen
t
3001
S-ad
eno
syl-
L-m
eth
ion
ine-
dep
end
ent
met
hyl
tran
sfer
ase
Q9D
CS2
24.9
122
.68
706
341.
9
3405
S-ad
eno
syl-
L-h
om
ocy
stei
ne
hyd
rola
seP
5024
744
.74
47.5
569
816
3.0
5204
Bet
ain
eh
om
ocy
stei
ne
met
hyl
tran
sfer
ase
Q56
1N0
45.4
445
.02
9710
293.
02.
0
4407
Ad
eno
sylh
om
ocy
stei
nas
eP
5024
744
.34
47.5
512
110
270.
90.
946
04C
yste
ine
sulf
inic
acid
dec
arb
oxy
lase
Q8K
566
54.4
755
.12
7910
210.
60.
7
1506
aG
luta
thio
ne
syn
thas
eQ
8R43
650
.95
51.9
541
57
FA
ELQ
SPN
K+
22.
3ty
pe
A1
TG
QE
IPV
NLR
+2
LGG
SVE
LVD
IGK
+2
TV
FG
VE
PD
LTR
+2
research articles Arbones-Mainar et al.
4046 Journal of Proteome Research • Vol. 6, No. 10, 2007
Tab
le2
(Co
nti
nu
ed)
MS/
MS
pep
tid
em
ass
fin
gerp
rin
tin
gfo
ld-c
han
geb
SSP
pro
tein
iden
tifi
cati
on
acce
ssio
n
Mr
Exp
Mr
Th
eor
pro
tein
sco
raea
mat
ched
pep
tid
esp
epti
de
seq
uen
ces
pep
tid
e
char
ges
mat
ched
pep
tid
es
seq
uen
ce
cove
rage
Pic
ual
oliv
eo
il
Arb
equ
ina
oliv
eo
il
MM
EV
AA
AD
VQ
R+
2O
x(M
)+
2A
VF
QY
IDE
NQ
DR
+2
AV
FQ
YID
EN
QD
R+
222
04H
ydro
xyac
ylgl
uta
thio
ne
hyd
rola
seQ
4N92
229
.16
31.2
672
736
1.8
3603
Glu
tam
ate
deh
ydro
gen
ase
P26
443
61.6
461
.34
132
1125
1.6
7101
Glu
tath
ion
eS-
tran
sfer
ase
P1
GST
P1
23.6
023
.48
707
401.
91.
925
04M
eth
ion
ine
Q3T
HS6
49.8
143
.69
253
3SE
FP
WE
VP
K+
21.
41.
6ad
eno
sylt
ran
sfer
ase
IRF
VIG
GP
QG
DA
GV
TG
R+
2IH
TIV
ISV
QH
NE
DIT
LEA
MQ
EA
LK+
Ox(
M)
+4
ph
enyl
alan
ine
cata
bo
lism
3505
Ph
enyl
alan
ine-
4-h
ydro
xyla
seP
1633
149
.53
51.8
010
111
250.
8
2509
Ph
enyl
alan
ine-
4-h
ydro
xyla
seP
1633
149
.09
51.8
078
829
2.8
3502
Ho
mo
gen
tisa
te1,
2-d
ioxy
gen
ase
Q7T
PP
250
.73
49.9
672
1335
1.7
ure
acy
cle
3301
Orn
ith
ine
carb
amo
yltr
ansf
eras
eQ
8R1A
839
.85
39.3
610
48
241.
7
met
hyl
tran
sfer
ases
2104
Th
ioet
her
S-m
eth
yltr
ansf
eras
eP
4093
628
.08
29.4
617
73
FSG
VY
LEK
+2
2.1
VY
IGG
ED
YE
K+
2A
IQD
AG
CQ
VLK
+2
3109
Th
iop
uri
ne
S-m
eth
yltr
ansf
eras
eO
5506
029
.36
27.5
996
1459
1.2
1103
Gu
anid
ino
acet
ate
O35
969
28.4
926
.34
158
2LQ
DW
ALR
+2
1.5
N-m
eth
yltr
ansf
eras
eV
LEV
GF
GM
AIA
ASR
+O
x(M
)+
2tr
ansp
ort
pro
tein
s17
10A
lbu
min
1Q
8C7C
768
.93
68.6
989
715
10.7
1718
Alb
um
in1
Q8C
7C7
69.0
568
.69
997
151.
417
21A
lbu
min
1Q
8C7C
768
.75
68.6
915
516
292.
03.
527
02Se
rum
alb
um
inP
0772
468
.468
.69
927
210.
6co
agu
lati
on
1406
Serp
inB
6Q
6085
443
.54
42.6
050
78
TG
TQ
YLL
R+
26.
713
.3T
NG
ILF
CG
R+
2LG
MT
DA
FG
GR
+O
x(M
)+
2M
TY
IGE
IFT
K+
Ox(
M)
+2
NE
EK
PV
QM
MF
K+
2O
x(M
)+
3G
TT
ASQ
MA
QA
LALD
K+
Ox(
M)
+2
LEE
NY
NM
ND
ALY
K+
Ox(
M)
+2
AF
VE
VN
EE
GT
EA
AA
AT
AG
MM
TV
R+
3+
2O
x(M
)24
01Se
rpin
B6
Q60
854
43.6
142
.60
223
3T
GT
QY
LLR
+2
1.5
MT
YIG
EIF
TK
+O
xid
atio
n(M
)+
2G
TT
ASQ
MA
QA
LALD
K+
Ox(
M)
+2
Extra Virgin Olive Oil Results in APOE-/- Mice research articles
Journal of Proteome Research • Vol. 6, No. 10, 2007 4047
Tab
le2
(Co
nti
nu
ed)
MS/
MS
pep
tid
em
ass
fin
gerp
rin
tin
gfo
ld-c
han
geb
SSP
pro
tein
iden
tifi
cati
on
acce
ssio
n
Mr
Exp
Mr
Th
eor
pro
tein
sco
raea
mat
ched
pep
tid
esp
epti
de
seq
uen
ces
pep
tid
e
char
ges
mat
ched
pep
tid
es
seq
uen
ce
cove
rage
Pic
ual
oliv
eo
il
Arb
equ
ina
oliv
eo
il
infl
amm
atio
n27
09a
Ep
oxi
de
hyd
rola
seP
3491
459
.69
62.5
237
65
SEE
ALA
LPR
+2
1.4
chai
nB
EM
VT
FLD
K+
Ox(
M)
+2
ILV
PA
LMV
TA
EK
+O
x(M
)+
2Y
QIP
ALA
QA
GF
R+
2A
TE
IGG
ILV
NT
PE
DP
NLS
K+
241
02A
cyl-
pro
tein
P97
823
25.9
524
.69
184
3A
LID
QE
VK
+2
1.4
thio
este
rase
1A
LIN
PA
NV
TF
K+
2A
SFSQ
GP
INSA
NR
+2
4701
Leu
kotr
ien
eA
-4h
ydro
lase
P24
527
68.7
469
.47
131
1425
1.5
1806
Val
osi
nco
nta
inin
gp
rote
inQ
0185
389
.42
89.3
772
1016
1.6
pro
tein
met
abo
lism
1108
Pro
teas
om
eb
eta
4su
bu
nit
P99
026
26.6
926
.92
655
251.
5
2305
Pre
gnan
cyzo
ne
Q61
838
35.9
716
5.88
2305
8Y
NIL
PV
AD
GK
+2
1.4
pro
tein
LQD
QP
NIQ
R+
2D
LSSS
DLS
TA
SK+
2LP
DLP
GN
YV
TK
+2
MV
SGF
IPM
KP
SVK
+2
Ox
(M)
+3
GSG
SGC
VY
LQT
SLK
+2
EV
LVT
IESS
GT
FSK
+2
AP
FA
LQV
NT
LPLN
FD
K+
217
16Ly
syl-
tRN
AQ
8C1V
462
.59
67.8
025
45
FE
LFV
MK
+O
x(M
)+
24.
0sy
nth
etas
eM
LVV
GG
IDR
+O
x(M
)+
2IS
MV
EE
LEK
+O
x(M
)+
2G
DII
GV
EG
NP
GK
+2
LTM
FLT
DSN
NIK
+O
x(M
)+
237
07G
lycy
l-tR
NA
syn
thet
ase
Q9C
ZD
376
.481
.87
9713
200.
542
023-
Hyd
roxy
iso
bu
tyra
teQ
99L1
330
.67
35.4
438
16
DLG
LAQ
DSA
TST
K+
21.
2d
ehyd
roge
nas
eE
AG
EQ
VA
SSP
AE
VA
EK
+2
GSL
LID
SST
IDP
SVSK
+2
MG
AV
FM
DA
PV
SGG
VG
AA
R+
2O
x(M
)+
3M
GA
VF
MD
AP
VSG
GV
GA
AR
+2
Ox(
M)
+2
TP
VG
FIG
LGN
MG
NP
MA
K+
2O
x(M
)′′+
2m
isce
llan
eou
s01
01R
ho
GD
Pd
isso
ciat
ion
Q5M
9P6
26.0
123
.41
327
4T
DY
MV
GSY
GP
R+
Ox(
M)
+2
1.7
1.7
inh
ibit
or
RID
KT
DY
MV
GSY
GP
R+
Ox(
M)
+3
VA
VSA
DP
NV
PN
VIV
TR
+2
AE
EY
EF
LTP
ME
EA
PK
+O
x(M
)+
213
03P
ota
ssiu
mch
ann
elte
tram
eris
atio
nd
om
ain
con
tain
ing
pro
tein
12
Q6W
VG
336
.53
35.8
967
726
0.7
2101
Sep
iap
teri
nre
du
ctas
eQ
6410
527
.36
27.8
887
111
ELP
RP
EG
LQR
+2
1.3
1.2
EE
LGA
PD
LK+
2SD
GA
LVD
CG
TSA
QK
+2
LLLI
NN
AA
TLG
DV
SK2
research articles Arbones-Mainar et al.
4048 Journal of Proteome Research • Vol. 6, No. 10, 2007

Tab
le2
(Co
nti
nu
ed)
MS/
MS
pep
tid
em
ass
fin
gerp
rin
tin
gfo
ld-c
han
geb
SSP
pro
tein
iden
tifi
cati
on
acce
ssio
n
Mr
Exp
Mr
Th
eor
pro
tein
sco
raea
mat
ched
pep
tid
esp
epti
de
seq
uen
ces
pep
tid
e
char
ges
mat
ched
pep
tid
es
seq
uen
ce
cove
rage
Pic
ual
oliv
eo
il
Arb
equ
ina
oliv
eo
il
mis
cella
neo
us
VV
LAA
AD
LGT
EA
GV
QR
+2
QLK
EE
LGA
PD
LK+
3T
VV
NIS
SLC
ALQ
PY
K+
2D
MLY
QV
LAA
EE
PSV
R+
Ox(
M)
+2
ME
AD
GLG
CA
VC
VLT
GA
SR+
2M
EA
DG
LGC
AV
CV
LTG
ASR
+2
VLS
YA
PG
PLD
ND
MQ
QLA
R+
Ox(
M)
+2
2106
Pu
rin
en
ucl
eoti
de
ph
osp
ho
ryla
seP
2349
229
.94
32.2
883
940
1.3
2304
Pyr
ido
xalk
inas
eQ
8K18
337
.235
.01
116
2Y
DY
VLT
GY
TR
+2
0.7
0.7
SFLA
MV
VD
IVR
+O
x(M
)+
223
06D
hd
hp
rote
inQ
8K0E
939
.536
.64
315
6A
IGV
TF
PQ
DK
+2
2.7
FF
PA
ME
ALR
+2
FF
PA
ME
ALR
+O
x(M
)+
2A
YG
SYE
ELA
K+
2E
VLV
QG
TIG
DLR
+2
AE
FG
FD
LSH
IPR
+3
2604
Sele
niu
mb
ind
ing
pro
tein
Q91
X87
52.4
52.5
164
819
2.1
3204
Lact
amas
e,b
eta
2Q
99K
R3
31.8
232
.75
229
4SF
TV
TE
LR+
2p
rese
nt
pre
sen
tIF
YT
TT
PV
K+
2E
EQ
IISL
FR
+2
NIN
ND
TT
YC
IK+
232
06Li
gnin
ase
H2
P14
153
34.0
939
.52
540
8LG
VT
AD
DV
K+
21.
3E
VG
VY
EA
LK+
2E
NF
SCLT
R+
2G
EF
ITT
VQ
QR
+2
DLD
VA
VLV
GSM
PR
+O
x(M
)+
2F
VE
GLP
IND
FSR
+2
ELT
EE
KE
TA
FE
FLS
SA+
2N
VII
WG
NH
SST
QY
PD
VN
HA
K+
332
03Su
lfo
tran
sfer
ase
3A1
O35
403
33.1
635
.18
219
4N
EM
GSF
LR+
Ox(
M)
+2
2.0
2.5
TE
NIE
TID
R+
2D
DD
IFIV
TY
PK
+2
ELS
EE
DV
DA
VV
R+
241
01N
ucl
eosi
de-
dip
ho
sph
ate
kin
ase
Q01
768
17.4
617
.36
704
261.
5
aP
rob
abili
ty-b
ased
Mo
wse
sco
refo
rM
S/M
Sb
ased
iden
tifi
cati
on
s:in
div
idu
alio
ns
sco
res
>35
ind
icat
eid
enti
tyo
rex
ten
sive
ho
mo
logy
(p<
0.05
).P
rob
abili
tyB
ased
Mo
wse
Sco
refo
rp
epti
de
mas
sfi
nge
rpri
nti
ng
bas
edid
enti
fica
tio
ns:
pro
tein
sco
res
grea
ter
than
62ar
eco
nsi
der
edsi
gnif
ican
t(p
<0.
05).
Th
ep
rote
insc
ore
is-
10*L
og(
P),
wh
ere
Pis
the
pro
bab
ility
that
the
ob
serv
edm
atch
isa
ran
do
mev
ent.
bF
old
-ch
ange
inh
epat
icp
rote
inle
vels
(as
asse
ssed
by
pro
teo
mic
s)o
fp
rote
ins
that
wer
esi
gnif
ican
tly
up
-or
do
wn
regu
late
db
yP
icu
alan
d/o
rA
rbeq
uin
ao
live
oil,
asco
mp
ared
wit
hp
alm
oil.
Extra Virgin Olive Oil Results in APOE-/- Mice research articles
Journal of Proteome Research • Vol. 6, No. 10, 2007 4049

Discussion
In this study, both olive oils increased liver size and hepaticfat content, probably through an increased supply of NEFA tothe liver and a decreased output of triglycerides from the liver,and no apparent changes in levels of hepatic â-oxidationenzymes as assessed by proteomics. Proteomics identified arange of antioxidant enzymes that were differentially regulatedby both olive oils as compared with palm oil.
Mediterranean populations who generally consume a diethigh in olive oils that is rich in monounsaturated fatty acids(MUFA) have a low prevalence of CHD and low plasmacholesterol levels.21 The substitution of a high-MUFA diet foran average American diet lowers total and low-density lipo-protein (LDL) cholesterol in humans,22 thereby contributing toa reduction in CHD risk. In contrast, both EVOO diets signifi-cantly increased plasma cholesterol levels in Apoe-/- mice,despite causing a significant decrease in aortic root lesion sizeand a decreased degree of macrophage infiltration in to the
intima.11 An olive oil diet low in cholesterol, compared with acoconut oil diet, had no significant effects on total cholesterolwhereas lesion size was significantly decreased in femaleApoe-/- animals only.6 This corroborates our previous observa-tion that dietary cholesterol suppresses the ability of EVOO toimprove the lipoprotein profile in an animal model that isextremely sensitive to diet-induced hyperlipidemia because ofthe absence of the apolipoprotein E protein.10 However, HDLcholesterol was increased upon consumption of Picual EVOO.11
Increased HDL concentrations are considered anti-atherogenicbecause of their ability to promote the efflux of cholesterol fromcells, but they may also have antioxidant, anti-inflammatory,and anti-thrombotic properties.23 In this study, both EVOOsdid not significantly affect the HDL related proteins paraoxo-nase activity and apoA-I levels, but both EVOOs did induce acholesterol-poor, apoA-IV enriched lipoparticle that had en-hanced arylesterase and antioxidant activities.11 Furthermore,Picual EVOO decreased plasma triglycerides, a finding that has
Figure 2. Scores plot (upper panel) and loadings plot (lower panel) of an unsupervised principal component analyses of hepatic cytosolicproteins of which levels were significantly up-or down regulated upon intervention with Picual olive oil or Arbequina olive oil, ascompared with palm oil. The scores plot reveals the treatment effects between each of EVOO interventions compared with the palmoil intervention (i.e., the largest distance between the spots representing the dietary intervention groups on the X-axis) on the first andsecond principal component. The loadings plot reveals the proteins and physiological outcome parameters that provided the largestpositive and negative contribution to the dietary treatment effects in the principal component analysis. These were for palm oil (inRED): A ) lesion size, B ) GPx1 activity, C ) cysteinic sulfinic acid decarboxylase, D ) succinyl CoA ligase, E ) adenosylhomocysteinase,F ) revised QUICKI, G ) glycyl-tRNA synthetase, H ) HSP110, I ) lactamase beta; for Picual olive oil (in GREEN): A ) adipophilin(Western Blot), B ) adipophilin (ELISA), C ) liver weight, D ) GST activity, E ) 2-hydroxyphytanoyl CoA lyase; for arbequina olive oil(in BLUE): A ) malate dehydrogenase, b ) acyl-protein thioesterase, c ) phosphatidylcholine transfer protein, D ) superoxide dismutase,E ) S-adenosyl-L-methionine dependent methyltransferase, F ) S-adenosyl-L-homocysteine hydrolase, G ) thioether-S-methyltrans-ferase, H ) aldehyde dehydrogenase, I ) glutathione synthase, J ) thioperoxin peroxidase, K ) methionine adenosyltransferase, L )fructose 1,6-bisphosphatase, M ) glutamate carboxypeptidase.
research articles Arbones-Mainar et al.
4050 Journal of Proteome Research • Vol. 6, No. 10, 2007

been observed before.6 The decrease in triglycerides in ourstudy was observed despite a significant increase in plasmaNEFA (Table 1) and a significant increase in hepatic fat content(Figure 1).
This is, to our knowledge, the first study that reports anincrease in hepatic fat accumulation upon consumption ofEVOO in this mouse model of atherosclerosis. It has been foundpreviously that diets rich in olive oil generally cause higher
concentrations of liver total cholesterol compared with dietscontaining either saturated or polyunsaturated fatty acids,which may, however, occur only when large amounts choles-terol are fed in the diets.24,25 Also the amount of dietary fatadministered will be crucial since an amount of 10% (w/w)dietary olive oil prevented the development of fatty livers in aprevious study.26 Liver weight was significantly higher uponconsumption of Picual EVOO, and the hepatic fat content was
Figure 3. Correlation plot indicating all pairwise correlations between plasma lipid and liver protein levels that had a Pearson correlationhigher than 0.66, a p value lower than 0.0005, and a q-value lower than 0.0025, using the software tool Cytoscape as described inMaterials and Methods. The color code indicates the percentage increase or decrease in plasma levels or hepatic protein mass in eachdietary olive oil intervention group as compared to the palm oil control group.
Extra Virgin Olive Oil Results in APOE-/- Mice research articles
Journal of Proteome Research • Vol. 6, No. 10, 2007 4051

significantly increased upon consumption of both Picual andArbequina EVOOs. In addition, there were significant five-and2-fold increases in hepatic adipophilin protein levels uponconsumption of Picual and Arbequina EVOO, respectively(Figure 1). Adipophilin (or adipose differentiation-relatedprotein) is bound to the surface of lipid bodies and lipid bi-layers.27 The proposed function of adipophilin appears morecomplex than merely the packaging of neutral lipids in thecytosol. Adipophilin overexpression in primary liver cellsincreases the size of cytosolic lipid droplets and reduces thesecretion of VLDL, without influencing the rate of â-oxidation,thereby selectively decreasing VLDL assembly.28 On the otherhand, a knockdown of adipophilin decreased the pool ofcytosolic lipid droplets, increased the secretion rate of apoli-poprotein B-48 VLDL1, and increased â-oxidation.28 Also,adipophilin knockout in mice had lower levels of hepatictriglycerides without a change in plasma lipid profile, and theseanimals were protected against the development of a fattyliver.29 Therefore, down-regulation of adipophilin proteincauses a channeling of fatty acids primarily into â-oxidation.Interestingly, we found that plasma triglycerides were lowestand accumulation of hepatic lipid droplets was highest in thePicual EVOO group that had the highest levels of hepaticadipophilin protein, without a noticeable effect on hepaticproteins involved in â-oxidation of fatty acids. Indeed, hepaticadipophilin protein levels and liver weight were two of the mainparameters responsible for the treatment effect of Picual oliveoil in the principal component analysis (Figure 3), and hepaticadipophilin protein levels and plasma triglycerides were in-versely correlated (r ) -0.433, p < 0.05). The two EVOOsproduced differential effects on hepatic adipophilin protein,possibly because of a different dietary oleic acid content or adifference in the amount and types of polyphenols. In one ofour earlier studies, a decrease in hepatic adipophilin proteinwas associated with decreased serum and hepatic triglyceridesand increased â-oxidation of fatty acids upon consumption offish oil.18 Therefore, regulation of adipophilin protein by dietaryfatty acids or other compounds may represent an importantregulatory pathway in hepatic lipid metabolism, albeit thatregulation of adipophilin upon dietary intervention may bespecies dependent.
Abnormalities in lipid storage in hepatic and adipose tissuegives rise to a multitude of undesirable effects includingincreased levels of plasma lipids, including NEFA, and insulinresistance.30 The reason for the increase in plasma NEFA levelsin particularly the Picual olive oil group as compared with thepalm oil group is not clear, but might involve the disturbanceof hormonal regulation of lipolysis in adipose tissue, possiblydue to a decrease in insulin sensitivity.31 Indeed, a significantincrease in plasma NEFA and a decrease in insulin sensitivityoccurred in the Picual EVOO group that had also the highestlevels of hepatic fat and adipophilin protein. In addition, weobserved significant increases in several hepatic enzymesinvolved in the methionine cycle, especially in betaine ho-mocysteine methyl transferase (BHMT), by both EVOOs (Table2). BHMT, which converts homocysteine into methionine usingbetaine as a cofactor (Figure 4), is up-regulated during insulinresistance.32,33 Also, an increase in hepatic BHMT is associatedwith an increase in hepatic very low-density lipoprotein (VLDL)and apolipoprotein B production rate in rats fed a methionine-deficient diet supplemented with betaine34 (Figure 4). Increasedsecretion rates of VLDL1-apolipoprotein B and triglycerides, asassessed by kinetic studies in humans, are a common feature
in insulin resistance. The hepatic VLDL overproduction isbelieved to be driven by the altered free flow of NEFAs,35 butBHMT may well be involved in this process. However, despitean increase in plasma NEFA upon consumption of PicualEVOO, plasma triglycerides were actually lower (Table 1),suggesting that VLDL-apolipoprotein B secretion was also likelyto be lower. This suggests that an overriding mechanism,possibly involving adipophilin, is preventing the hepatic trig-lycerides from being secreted.
EVOOs contains a wide range of important minor antioxidantcompounds, such as polyphenols, that contribute to thestability of the oil and that can have anti-inflammatory andanti-atherosclerotic properties.36,37 Consumption of polyphenolshas been associated with prevention from and/or treatmentof atherosclerosis.38 Our proteomics approach revealed a rangeof antioxidant enzymes, like TR, thioredoxin peroxidase 2,peroxiredoxin 3, superoxide dismutase and GST, whose hepaticprotein levels were 1.5-4-fold higher upon consumption ofboth EVOOs compared with palm oil. In addition, hepatic TRactivity was significantly higher upon consumption of PicualEVOO, confirming the proteomics findings. A similar coordi-nated induction of the antioxidant enzymes has been observedin Apoe-/- mice in the period preceding lesion formation.39
Remarkably, most mRNA levels of these antioxidant enzymesstarted to decline as lesions started to develop. This suggeststhat the arterial wall delays initial lesion formation by stimulat-ing the expression of antioxidant enzymes, but when thisdefense capacity collapses a greatly accelerated developmentof atherosclerosis occurs.39 Therefore, compounds in EVOO(like for example the polyphenols) may well be able to delaythe onset of atherosclerotic lesions by the combat of oxidativestress.
In contrast, protein and activity levels of hepatic GPx1 werelower upon olive oil consumption. In patients with coronaryartery disease, a low level of red-cell GPx1 activity is indepen-dently associated with an increased risk of cardiovascularevents.40 However, it is questionable whether GPx1 plays a keyrole in lesion formation at the site of the aortic root. A specific
Figure 4. Schematic overview of pathways involved in methio-nine and glutathione metabolism, of which some were differen-tially regulated by Picual and Arbequina olive oil intervention,as compared with palm oil intervention.
research articles Arbones-Mainar et al.
4052 Journal of Proteome Research • Vol. 6, No. 10, 2007
deficiency in GPx1 was not accompanied by an increase inmarkers of oxidative damage or increased atherosclerosis.41
Also, GPx1 expression in the aortic arch of Apoe-/- mice, ascompared with wild type mice, decreases rapidly in the periodpreceding lesion development, resulting in hardly any detect-able GPx1 expression in atherosclerotic tissue.39 Moreover, GPx1enzyme activity was absent in human atherosclerotic lesions.42
However, based on previous studies we cannot rule out a rolefor GPx1 in atherogenesis at other sites.41 In our study, thepairwise correlation analysis revealed a clustering of hepaticGPx1 activity with lesion size, hepatic adipophilin levels, liverweight, hepatic fat content and body weight, indicating for thefirst time that their regulatory mechanisms may be related toeach other (Figure 3). GPx1 may indeed play different roles indifferent organs,43 and the lower protein and activity levels ofhepatic GPx1 upon olive oil consumption may simply reflect alower degree of hepatic oxidative stress due to the up-regulationof other antioxidant enzymes.
Proteomics also revealed the up-regulation of glutamatedehydrogenase, glutathione synthase, and hydroxyacyl glu-tathione hydrolase, as well as the down-regulation of cysteine-sulfinic acid decarboxylase, indicating an increased productionof glutathione by predominantly Arbequina EVOO (Table 2 andFigure 4). Other studies in Apoe-/- mice showed that depletionof glutathione via a decreased synthesis precedes lipid peroxi-dation and atherogenesis, and glutathione is severely depletedin the atheroma-prone aortic arch of male compared with wildtype mice after 10 weeks.44 Therefore, glutathione deficiencymight be central to the failure of the intracellular antioxidantdefenses and is causally implicated in the pathogenesis ofatherosclerosis. The apparent increase in glutathione produc-tion and other antioxidant defense mechanisms upon con-sumption of EVOO may thus represent a mechanism by whicholive oil components diminish oxidative stress.
In conclusion, olive oil decreased atherosclerosis in Apoe-/-
mice despite an increase in plasma total cholesterol and thedevelopment of hepatic steatosis. These are conflicting findings,and it would be intriguing if olive oil consumption would affectthe interaction between similar mechanisms in humans, ashepatic lipid loading over a longer time period may havedetrimental effects. A systems biology approach, as presentedhere, is crucial in unraveling the complex interactions betweenpathways that are on one hand involved in the beneficialreduction in plaque formation and on the other hand involvedin the potentially less beneficial development of hepaticsteatosis. We found, for example, a significant up-regulationof a large array of antioxidant enzymes upon consumption ofEVOO that may diminish oxidative stress instigated by hepaticsteatosis and in addition, may slow down the development ofatherosclerosis. Indeed, the accumulation of triglycerides maynot pose a major challenge to the liver, and represent arelatively safe way to store triglycerides, as long as the anti-oxidant capacity is adequate to prevent lipotoxicity.45 Inaddition, our proteomics results revealed, for the first time, thattwo different EVOOs instigated distinct effects on hepatic lipidmetabolism by regulation of hepatic adipophilin. This mech-anism may override any regulation by insulin or BHMT toincrease the production of VLDL apolipoprotein B that isnormally observed upon development of hepatic steatosis andearly symptoms of insulin resistance.
Acknowledgment. This research was supported bygrants FEGA-FEOGA (CAO99-014), CICYT (SAF2004-08173-C03-
02), FISS 01/0202, Redes DGA (A-26), and FISS de investigacioncooperativa C03- 01 and G03-140 and by Fundacion Espanoladel Corazon. B.d.R., K.R., G.R., M.R., G.D., and J.A. are fundedby the Scottish Executive Environment and Rural AffairsDepartment. J.M.A.-M., R.C., and M.A.N. were recipients of CAI-EUROPA, DGA, and FEGA-FEOGA fellowships. We thank Dr.Gerald Lobley for his help with the interpretation of theproteomics data and Dr. Uceda for his analysis of diet com-position. We thank Angel Beltran, Jesus Cazo, Jesus Navarro,Carmen Navarro, and Clara Tapia from Unidad Mixta deInvestigacion for their invaluable help in maintaining animals.
References
(1) Keys, A.; Menotti, A.; Karvonen, M. J.; Aravanis, C.; Blackburn,H.; Buzina, R.; Djordjevic, B. S.; Dontas, A. S.; Fidanza, F.; Keys,M. H. Am. J. Epidemiol. 1986, 124, 903-915.
(2) de Lorgeril, M.; Salen, P.; Martin, J. L.; Monjaud, I.; Delaye, J.;Mamelle, N. Circulation 1999, 99, 779-785.
(3) Trichopoulou, A.; Costacou, T.; Bamia, C.; Trichopoulos, D. N.Engl. J. Med. 2003, 348, 2599-2608.
(4) Knoops, K. T.; de Groot, L. C.; Kromhout, D.; Perrin, A. E.;Moreiras-Varela, O.; Menotti, A.; van Staveren, W. A. JAMA 2004,292, 1433-1439.
(5) Aguilera, C. M.; Ramirez-Tortosa, M. C.; Mesa, M. D.; Ramirez-Tortosa, C. L.; Gil, A. Atherosclerosis 2002, 162, 335-344.
(6) Calleja, L.; Paris, M. A.; Paul, A.; Vilella, E.; Joven, J.; Jimenez, A.;Beltran, G.; Uceda, M.; Maeda, N.; Osada, J. Arterioscler. Thromb.Vasc. Biol. 1999, 19, 2368-2375.
(7) Acin, S.; Navarro, M. A.; Carnicer, R.; Arbones-Mainar, J. M.;Guzman, M. A.; Arnal, C.; Beltran, G.; Uceda, M.; Maeda, N.;Osada, J. Atherosclerosis 2005, 182, 17-28.
(8) Perez-Jimenez, F. Eur. J. Clin. Invest. 2005, 35, 421-424.(9) Ros, E. Am. J. Clin. Nutr. 2003, 78, 617S-625S.
(10) Sarria, A. J.; Surra, J. C.; Acin, S.; Carnicer, R.; Navarro, M. A.;Arbones-Mainar, J. M.; Guillen, N.; Martinez-Gracia, M. V.; Arnal,C.; Osada, J. Front Biosci. 2006, 11, 955-967.
(11) Arbones-Mainar, J. M.; Navarro, M. A.; Carnicer, R.; Guillen, N.;Surra, J. C.; Acin, S.; Guzman, M. A.; Sarria, A. J.; Arnal, C.;Aguilera, M. P.; Jimenez, A.; Beltran, G.; Uceda, M.; Osada, J.Atherosclerosis 2006 doi: 10.1016/j.atherosclerosis.2006. ll.010.
(12) Matthews, D. R.; Hosker, J. P.; Rudenski, A. S.; Naylor, B. A.;Treacher, D. F.; Turner, R. C. Diabetologia 1985, 28, 412-419.
(13) Perseghin, G.; Caumo, A.; Caloni, M.; Testolin, G.; Luzi, L. J. Clin.Endocrinol. Metab. 2001, 86, 4776-4781.
(14) Navarro, M. A.; Carpintero, R.; Acin, S.; Arbones-Mainar, J. M.;Calleja, L.; Carnicer, R.; Surra, J. C.; Guzman-Garcia, M. A.;Gonzalez-Ramon, N.; Iturralde, M.; Lampreave, F.; Pineiro, A.;Osada, J. Cytokine 2005, 31, 52-63.
(15) Arthur, J. R.; Morrice, P. C.; Nicol, F.; Beddows, S. E.; Boyd, R.;Hayes, J. D.; Beckett, G. J. Biochem J. 1987, 248, 539-544.
(16) Rigobello, M. P.; Callegaro, M. T.; Barzon, E.; Benetti, M.; Bindoli,A. Free Radic. Biol. Med. 1998, 24, 370-376.
(17) de Roos, B.; Rucklidge, G.; Reid, M.; Ross, K.; Duncan, G.; Navarro,M. A.; Arbones-Mainar, J. M.; Guzman-Garcia, M. A.; Osada, J.;Browne, J.; Loscher, C. E.; Roche, H. M. FASEB J. 2005, 19, 1746-1748.
(18) de Roos, B.; Duivenvoorden, I.; Rucklidge, G.; Reid, M.; Ross, K.;Lamers, R. J.; Voshol, P. J.; Havekes, L. M.; Teusink, B. 2005, 19,813-815.
(19) Storey, J. D.; Tibshirani, R. Proc. Natl. Acad. Sci. U.S.A 2003, 100,9440-9445.
(20) Shannon, P.; Markiel, A.; Ozier, O.; Baliga, N. S.; Wang, J. T.;Ramage, D.; Amin, N.; Schwikowski, B.; Ideker, T. Genome Res.2003, 13, 2498-2504.
(21) Keys, A. Circulation 1970, 41, I-1-I-211.(22) Kris-Etherton, P. M.; Pearson, T. A.; Wan, Y.; Hargrove, R. L.;
Moriarty, K.; Fishell, V.; Etherton, T. D. Am. J. Clin. Nutr. 1999,70, 1009-1015.
(23) Nicholls, S. J.; Rye, K. A.; Barter, P. J. Curr. Opin. Lipidol. 2005,16, 345-349.
(24) Beynen, A. C. Am. J. Clin. Nutr. 1989, 49, 392-394.(25) Beynen, A. C. Artery 1988, 15, 170-175.(26) Acin, S.; Navarro, M. A.; Perona, J. S.; Surra, J. C.; Guillen, N.;
Arnal, C.; Sarria, A. J.; Arbones-Mainar, J. M.; Carnicer, R.; Ruiz-Gutierrez, V.; Osada, J. Br. J. Nutr. 2006, in press.
Extra Virgin Olive Oil Results in APOE-/- Mice research articles
Journal of Proteome Research • Vol. 6, No. 10, 2007 4053
(27) Murphy, D. J. Prog. Lipid Res. 2001, 40, 325-438.(28) Magnusson, B.; Asp, L.; Bostrom, P.; Ruiz, M.; Stillemark-Billton,
P.; Linden, D.; Boren, J.; Olofsson, S. O. Arterioscler. Thromb. Vasc.Biol. 2006, 26, 1566-1571.
(29) Chang, B. H.; Li, L.; Paul, A.; Taniguchi, S.; Nannegari, V.; Heird,W. C.; Chan, L. Mol. Cell Biol. 2006, 26, 1063-1076.
(30) den Boer, M.; Voshol, P. J.; Kuipers, F.; Havekes, L. M.; Romijn,J. A. Arterioscler. Thromb. Vasc. Biol. 2004, 24, 644-649.
(31) Duncan, R.; Ahmadian, M.; Jaworski, K.; Sarkadi-Nagy, E.; Sul,H. S. Annu. Rev. Nutr. 2007, 27, 79-101.
(32) Ratnam, S.; Wijekoon, E. P.; Hall, B.; Garrow, T. A.; Brosnan, M.E.; Brosnan, J. T. Am. J. Physiol. Endocrinol. Metab 2006, 290,E933-E939.
(33) Wijekoon, E. P.; Hall, B.; Ratnam, S.; Brosnan, M. E.; Zeisel, S.H.; Brosnan, J. T. Diabetes 2005, 54, 3245-3251.
(34) Sparks, J. D.; Collins, H. L.; Chirieac, D. V.; Cianci, J.; Jokinen, J.;Sowden, M. P.; Galloway, C. A.; Sparks, C. E. Biochem. J. 2006,395, 363-371.
(35) Parhofer, K. G.; Barrett, P. H. J. Lipid Res. 2006, 47, 1620-1630.(36) Carluccio, M. A.; Siculella, L.; Ancora, M. A.; Massaro, M.; Scoditti,
E.; Storelli, C.; Visioli, F.; Distante, A.; De Caterina, R. Arterioscler.Thromb. Vasc. Biol. 2003, 23, 622-629.
(37) Gonzalez-Santiago, M.; Martin-Bautista, E.; Carrero, J. J.; Fonolla,J.; Baro, L.; Bartolome, M. V.; Gil-Loyzaga, P.; Lopez-Huertas, E.Atherosclerosis 2006, 188, 35-42.
(38) Kaliora, A. C.; Dedoussis, G. V.; Schmidt, H. Atherosclerosis 2006,187, 1-17.
(39) ’t Hoen, P. A.; Van der Lans, C. A.; Van Eck, M.; Bijsterbosch, M.K.; Van Berkel, T. J.; Twisk, J. Circ. Res. 2003, 93, 262-269.
(40) Blankenberg, S.; Rupprecht, H. J.; Bickel, C.; Torzewski, M.;Hafner, G.; Tiret, L.; Smieja, M.; Cambien, F.; Meyer, J.; Lackner,K. J. N. Engl. J. Med. 2003, 349, 1605-1613.
(41) de Haan, J. B.; Witting, P. K.; Stefanovic, N.; Pete, J.; Daskalakis,M.; Kola, I.; Stocker, R.; Smolich, J. J. J. Lipid Res. 2006, 47, 1157-1167.
(42) Lapenna, D.; de Gioia, S.; Ciofani, G.; Mezzetti, A.; Ucchino, S.;Calafiore, A. M.; Napolitano, A. M.; Di Ilio, C.; Cuccurullo, F.Circulation 1998, 97, 1930-1934.
(43) Arthur, J. R. Cell Mol. Life Sci. 2000, 57, 1825-1835.(44) Biswas, S. K.; Newby, D. E.; Rahman, I.; Megson, I. L. Biochem.
Biophys. Res. Commun. 2005, 338, 1368-1373.(45) Slawik, M.; Vidal-Puig, A. J. Ageing Res. Rev. 2006, 5, 144-164.
PR070321A
research articles Arbones-Mainar et al.
4054 Journal of Proteome Research • Vol. 6, No. 10, 2007