Brain mapping analysis in patients with hepatic encephalopathy
Upload
khangminh22Category
view
1download
0
Universidad del País Vasco/ Euskal Herriko Unibertsitatea
Metabolic implications and characterization of hepatic extracellular vesicles in drug-induced
liver injury
Tesis doctoral para optar al grado de Doctora, presentada por:
Laura Palomo Díaz 2015
Director de Tesis:
Dr. Juan Manuel Falcón Pérez
(c)2015 LAURA PALOMO DIAZ

Esta tesis doctoral ha sido realizada gracias a una beca predoctoral de CIC-bioGUNE
durante el periodo 2010-2014.
El trabajo ha sido financiado por los proyectos PI060621, PS09/00526 y PI12_01604,
cofinanciados por el ISCIII-Subdirección General de Evaluación y Fondo Europeo de
Desarrollo Regional (FEDER), el Departamento de Educación, Política Lingüística y
Cultura del Gobierno Vasco (PI2012-45), el Departamento de Sanidad del Gobierno
Vasco (2012-2015), Subprograma Ramón y Cajal RYC-2007- 00228 y la Fundación
IKERBASQUE. Becas de movilidad financiadas por COST European Actions BM0901
y BM1202.


AGRADECIMIENTOS
En primer lugar y ante todo a mi director de tesis, por brindarme la oportunidad de formar
parte de su pequeño, pero a la vez, gran grupo de investigación y adentrarme en el mundo de
esas pequeñas vesículas que tantos quebraderos de cabeza nos han traído. La verdad que
nunca hubiese imaginado que algo tan pequeño podría llegar a convertirse en algo tan grande
durante estos cuatro años. Darle las gracias por ser un jefe ejemplar, por creer en mí y
apoyarme en todo momento. Darle las gracias también por guiarme siempre en este duro
recorrido y hacerme ver que todo esfuerzo tiene su recompensa. Y por último darle las gracias
por ser un gran jefe pero mejor persona.
A José María Mato, el director de nuestro centro de investigación, por encargarse siempre de
dejar el listón bien alto.
A Ana Zubiaga, mi tutora de tesis, por la atención y amabilidad prestada en todo momento.
A Espe, por ayudarme, por tratar de enseñarme a ser paciente (aún estoy en ello), por sus
buenos consejos, por estar ahí en los momentos difíciles, por su gran apoyo tanto a nivel
profesional como personal y, sobre todo, gracias por darnos a todos una gran lección de
valentía.
A Félix, por poner ese toque de humor que le caracteriza, por darme siempre una solución
alternativa, por encargarse de todas las perfusiones y por esos ratos en cultivos escuchando
“Máxima fm”.
A Justyna, por traer un aire fresco al grupo, por sus ganas de aprender y sobre todo por
contagiarme esa energía que tanto me ha hecho falta en esos últimos meses.
A Dixon, por ser un trabajador nato, por su dedicación, por el excelente trabajo realizado, por
su gran espíritu de sacrificio, por sacarme de más de un apurillo, por todos esos buenos
momentos que hemos compartido. No me cabe la menor duda de que llegarás a ser un gran
enfermero.
A Javi, por aguantarme a mi llegada al labo con mi interminable lista de preguntas en la recta
final de su tesis. Yo no lo hubiera hecho igual de bien.
A Kika, por haberme enseñado tanto en esta carrera de fondo que ya va viendo la luz. Por
aguantar mis chapas y por estar siempre dispuesta a ayudarme con todo.
A Diana, por esa disposición para echar una mano en cualquier momento, por tener siempre
una sonrisa para mí, por haber estado a pie de cañón en estos últimos meses y por todos esos
kit-kat de la planta 0 que tanto me han ayudado.
A Sebastiaan, por brindarme su ayuda y enseñarme las bases de la metabolómica.

A Malu y a todas las personas que forman su gran grupo de investigación. Por todos los
momentos que hemos vivido juntos y porque cada uno de ellos me ha aportado una cosa
diferente que me ha hecho crecer durante estos 4 años.
A Marta txiki, por todos los momentos que hemos vivido juntas durante todo este tiempo. Por
preocuparse y aconsejarme, y sobre todo por aguantar mis chapas en estos últimos meses.
Más que a una compañera, me llevo a una gran amiga.
A Marta Palomo, en este poco tiempo que nos conocemos me ha demostrado que es una gran
persona. Dada su perseverancia y sus ganas de aprender, no me cabe la menor duda de que
llegará lejos.
A Gotxi, por contagiarme esa alegría que la caracteriza y por preocuparse y ayudarme
siempre.
A Lucia, mi compi de pasillo o de bench o como lo queráis llamar, por tener la habilidad de
sacarme una sonrisa siempre.
A Vir, que decir de la gran Vir, la salvadora de todos y cada uno de nosotros. Gracias por
poner siempre un toque de humor a todo.
A Sara, que aunque ya no está en el labo la seguimos recordando. Una trabajadora nata sin
duda.
A Nieves, por sus consejos y por animarme cuando lo he necesitado.
A David y Sandra del servicio de microscopia electrónica, por su colaboración.
A todos los chicos de administración. Pero sobre todo a Bego, Mada y Loli por ayudarme
con todos los trámites y papeleos. Perdón por volveros un poco locas en alguna ocasión.
A Urra y Ana por darme más de una lección en cuestiones de limpieza, por preocuparse y por
hacerme compañía cuando no quedaba nadie más en el labo.
A Nuria, nuestra chica del autoclave, por esos favorcillos cuando no he llegado a tiempo y por
los ánimos y apoyo recibido.
A todos mis amigos, por estar ahí siempre, apoyándome y dándome fuerzas en los momentos
más difíciles.
A mi hermana, por lo bien que me ha cuidado siempre y por haber estado a mi lado en todo
momento.
A mis padres, por creer en mí y darme fuerzas para seguir adelante. Por esforzarse cada día
para ofrecerme lo mejor. Por enseñarme todo lo que hoy soy y hacerme crecer como persona.
Sin vosotros nada de esto hubiese sido posible.
A todos, gracias.

INDEX
XIX
INDEX
1. ABBREVIATIONS ............................................................................................. 28
2. RESUMEN/SUMMARY .................................................................................... 33
3. INTRODUCTION ............................................................................................... 36
3.1. LIVER AND DRUG INDUCED LIVER INJURY .................................... 36
3.2. EXTRACELLULAR VESICLES (EVs) ..................................................... 38
3.4. HEPATIC EVs IN DRUG INDUCED LIVER INJURY .......................... 45
3.4.1. CARBOXYLESTERASE (CES) ............................................................ 46
3.4.2. METHIONINE ADENOSYL-TRANSFERASE (MAT) ....................... 47
3.4.3. CATECHOL-O-METHYL TRANSFERASE (COMT) ......................... 48
3.4.4. METABOLOMIC PROFILING OF HEPATIC EVS ............................. 51
4. HYPOTHESIS AND OBJECTIVES .................................................................. 54
5. EXPERIMENTAL PROCEDURES ................................................................... 56
5.1. REAGENTS AND CELL CULTURE ........................................................ 56
5.2. ANIMAL EXPERIMENTATION .............................................................. 56
5.3. CELL VIABILITY ANALYSIS ................................................................. 57
5.4. IMMUNOFLUORESCENCE STAINING ................................................. 57
5.5. WESTERN BLOT ANALYSIS .................................................................. 58
5.6. CRYO- ELECTRON MICROSCOPY (Cryo-EM) ..................................... 58
5.7. RAMAN TWEEZERS MICROSPECTROSCOPY (RTM)........................ 58
5.8. RNA ISOLATION AND QUANTITATIVE REAL-TIME PCR (qPCR) .. 59
5.9. RAT LIVER EXTRACT PREPARATION ................................................ 61
5.10. RAT MICROSOMES PREPARATION ..................................................... 61
5.11. PRODUCTION AND ISOLATION OF EVs SECRETED BY PRIMARY
HEPATOCYTES ....................................................................................... 61
5.12. PRODUCTION AND ISOLATION OF EVs SECRETED BY MLP-29
MURINE CELL LINE ............................................................................... 63
5.13. FRACTIONATION OF EVs ONA CONTINUOUS SUCROSE DENSITY
GRADIENT ............................................................................................... 63
5.14. NANOPARTICLES TRACKING ANALYSIS (NTA) .............................. 64
5.15. DETERMINATION OF CES ACTIVITY BY USING A FLUOROMETRIC
ASSAY....................................................................................................... 64
5.16. MEASUREMENTS OF MAT AND COMT ACTIVITIES BY UPLC-MS64
INDEX
XX
5.16.1. INCUBATION CONDITIONS............................................................. 64
5.16.2. SOLID-PHASE EXTRACTION (SPE) ................................................ 66
5.16.3. CALIBRATION CURVE AND QUALITY CONTROLS ................... 68
5.16.4. LIQUID CHROMATOGRAPHY AND MASS SPECTROMETRY
(UPLC- MS) CONDITIONS................................................................. 69
5.16.5. ANALYTICAL METHOD ................................................................... 70
5.16.6. DATA ANALYSIS OF UPLC-MS RESULTS PROVIDED BY MAT
AND COMT ACTIVITY ASSAYS...................................................... 71
5.17. METABOLIC PROFILING OF HEPATIC EVs BY UPLC-MS
METABOLOMICS .................................................................................... 72
5.17.1. SELECTION OF METABOLITES EXTRACTION METHOD.......... 72
5.17.2. BIPHASIC METABOLIC EXTRACTION OF CELLS AND EVs ..... 72
5.17.3. ULTRA PERFORMANCE LIQUID CHROMATOGRAPHY – MASS
SPECTROMETRY CONDITIONS ...................................................... 73
5.17.4. DATA PROCESSING, MULTIVARIATE ANALYSIS AND
METABOLITE IDENTIFICATION ................................................. 74
6. RESULTS AND DISCUSSION ......................................................................... 76
6.1.1. CELL VIABILITY ................................................................................. 76
6.1.2. CELL MORPHOLOGY ......................................................................... 77
6.1.3. WESTERN BLOT ANALYSIS ............................................................. 81
6.2. EVs SECRETED BY PRIMARY RAT HEPATOCYTES IN MODELS OF
DILI ............................................................................................................ 83
6.2.1. EVs SIZE, MORPHOLOGY AND CONCENTRATION ANALYSIS 83
6.2.2. WESTERN BLOT ANALYSIS ............................................................. 86
6.2.3. EVs OVERALL COMPOSITION ANALYSIS .................................... 86
6.2.4. EVs RNA CONTENT ANALYSIS ....................................................... 90
6.2.5. CES ACTIVITY ANALYSIS ................................................................ 91
6.2.5.1. Esterase Activity analysis ................................................................. 92
6.2.5.2. Continuous density gradient analysis ............................................... 92
6.2.6. MAT ACTIVITY ANALYSIS ............................................................... 94
6.2.6.1. Analytical method development ....................................................... 94
6.2.6.1.1. Optimization of the incubation condition for the enzymatic reaction
to assay MAT activity ............................................................. 94
6.2.6.1.2. Ultra performance Liquid Chromatography-Mass Spectrometry
optimization ............................................................................... 98
INDEX
XXI
6.2.6.1.3. Solid-Phase Extraction (SPE) method development................ 100
6.2.6.2. Analytical method optimization ..................................................... 104
6.2.6.2.1. Specificity of the enzymatic assay ........................................... 104
6.2.6.2.2. Linearity of Calibration Curves and Lower Limits of Quantification
(LLOQ) .................................................................................... 104
6.2.6.2.3. Precision and Accuracy of the enzymatic assay ...................... 105
6.2.7. COMT ACTIVITY ANALYTICAL METHOD................................... 105
6.2.7.1. Analytical method development ..................................................... 105
6.2.7.1.1. Optimization of the incubation condition for the enzymatic reaction
to assay COMT activity .......................................................... 105
6.2.7.1.2. Ultra Performance Liquid Chromatography-Mass Spectrometry
optimization ............................................................................. 106
6.2.7.1.3. Solid-Phase Extraction (SPE) Method development ............... 108
6.2.7.2. Analytical Method optimization ..................................................... 109
6.2.7.2.1. Specificity of the enzymatic assay ............................................ 109
6.2.7.2.2. Linearity of Calibration Curves and Lower Limits of Quantification
(LLOQ) .................................................................................... 111
6.2.7.2.3. Precision and Accuracy of the enzymatic assay ...................... 111
6.2.8. MAT ENZYMATIC ACTIVITY ANALYSIS IN HEPATIC EVs ...... 113
6.2.9. COMT ENZYMATIC ACTIVITY ANALYSIS IN HEPATIC EVs ... 118
6.3. METABOLIC PROFILING OF HEPATIC EVs ...................................... 124
6.3.1. METABOLITES EXTRACTION METHOD SELECTION ................ 124
6.3.2. ULTRA PERFORMANCE LIQUID CHROMATOGRAPHY – MASS
SPECTROMETRY ANALYSIS ......................................................... 127
6.3.3. DATA PROCESSING .......................................................................... 128
6.3.4. MULTIVARIATE DATA ANALYSIS: PRINCIPAL COMPONENT
ANALYSIS (PCA) .............................................................................. 129
6.3.5. EVs METABOLIC PROFILING, METABOLIC SIGNAL SELECTION
AND METABOLITE IDENTIFICATION ......................................... 131
7. GENERAL DISCUSSION ............................................................................... 143
8. CONCLUSIONS .............................................................................................. 150
9. BIBLIOGRAPHY ............................................................................................ 152
10. SUPPORT ......................................................................................................... 170


LIST OF FIGURES AND TABLES
XXIII
LIST OF FIGURES AND TABLES
FIGURES
Figure 1. Schematic representation of different type of extracellular vesicle
(EVs)……………………………………………………………….....
39
Figure 2. Biogenesis of EVs…………………………………………………….
40
Figure 3. Overall composition of EVs………………………………………….
42
Figure 4. Schematic view of Methionine cycle metabolism……………………
48
Figure 5. The basic function of Catechol‐ O‐Methyltransferase……………..... .
49
Figure 6. Cathechol-O-Methyltransferase catalyses methylation of Dopamine
and Norepinephrine..............................................................................
51
Figure 7. Experimental design to perform the study of the enzymatic
activities................................................................................................
65
Figure 8. Preparation of standard and test samples for evaluation of solid
phase extraction method recovery……………………………………
68
Figure 9. Cellular viability analysis of rat hepatocytes exposed to liver-
damaging drugs……………………………………………………….
76
Figure 10. Reproducibility analysis of cellular viability in independent rat
hepatocytes preparations …………………………………………...
77
Figure 11. Confocal analysis of primary rat hepatocytes in DILI conditions….
78
Figure 12. Western-blot analysis of primary rat hepatocytes and their
corresponding secreted EVs …………………………………….....
82
Figure 13. Ultrastructural characterization of EVs in DILI models…………....
84
Figure 14. Total number of particles secreted in DILI models………………....
85
Figure 15. Total protein amount of EVs secreted in DILI models………….…..
85
Figure 16. Raman tweezers microspectroscopy technique applied to study EVs
global composition in DILI models.................................................
87
Figure 17. Average Raman spectra interpretation for rat hepatocytes derived
EVs………………………………………………………………….
88
Figure 18. Analysis of overall composition of hepatocytes-secreted EVs in
DILI models..........................................................................................
89
Figure 19. RNA cargo of hepatic EVs in DILI models………………………...
91

LIST OF FIGURES AND TABLES
XXIV
Figure 20. Carboxylesterase activity in EVs from DILI models…….................
92
Figure 21. Density fractionation and CES activity analysis of hepatic EVs in
DILI models.......................................................................................
93
Figure 22. Optimization of pH for MAT enzymatic activity...............................
95
Figure 23. Optimization of temperature reaction for MAT activity....................
96
Figure 24. Optimization of divalent (Mg2+
) and monovalent (K+) cations
content in the reaction.........................................................................
96
Figure 25. Optimization of L-methionine concentration for MAT activity.......
97
Figure 26. Optimization of ATP concentration for MAT activity......................
97
Figure 27. Optimization of incubation reaction time for MAT activity..............
98
Figure 28. Representatives chromatograms and mass spectra obtained from rat
liver extract spiked with SAMe and SAH……………………….…
100
Figure 29. Phenilboric acid (PBA) based solid phase extraction mechanism….
101
Figure 30. UPLC-MS analysis of matrix effect for SAMe, SAH and MTA…...
102
Figure 31. SPE process efficiency for SAMe, SAH and MTA….......................
103
Figure 32. Recovery analysis for SAMe, SAH and MTA in the PBA-SPE
method……………………………………………………………...
104
Figure 33. Representative chromatograms and mass spectra obtained from rat
liver extract spiked with Dopamine and 3-
Methoxytyramine…………………………………………………...
107
Figure 34. Representative chromatograms and mass spectra obtained from rat
liver extract spiked with Norepinephrine and
Normetanephrine……………………………………………………
107
Figure 35. Oasis WCX retention mechanism for strong bases…………………
108
Figure 36. Chromatograms obtained for 3-Methoxytyramine (m/z 151.075, tr
1.15)………………………………………………………………...
110
Figure 37. Superimposed chromatogram obtained for Normetanephrine (m/z
166.086, tr 1.30)………………………………………………….....
110
Figure 38. Western-blot analysis of samples employed for measuring MAT
and COMT enzymatic activity……………………………………...
112

LIST OF FIGURES AND TABLES
XXV
Figure 39. Chromatograms of SAMe and SAH generated by MAT enzymatic
activity in liver extract………………………………………………
114
Figure 40. MAT activity in microsomes prepared from untreated and drug-
treated primary hepatocytes………………………………………...
115
Figure 41. MAT activity in EVs secreted by primary hepatocytes……………..
116
Figure 42. Chromatograms of the products NMN or 3-MT of COMT activity in
liver extract……………………………………………………........
119
Figure 43. COMT enzymatic activity in microsomes from untreated and DCF-
treated hepatocytes………………………………………………....
120
Figure 44. COMT enzymatic activity in hepatic microsomes and EVs............
121
Figure 45. COMT enzymatic activity in hepatic EVs…………….....................
122
Figure 46. COMT enzymatic activity in hepatic EVs incubating different
amounts of protein……………………………………………….....
123
Figure 47. Principal Component Analysis (PCA) of the metabolic profiles
obtained using different extraction methods ………………………
126
Figure 48. Representative base peak chromatograms of UPLC-MS analysis of
MLP29 cells and corresponding secreted EVs..................................
129
Figure 49. Principal component analysis (PCA) of UPLC-MS data obtained
from MLP29 cells and their corresponding secreted
EVs………………………………………………………………....
131
Figure 50. Metabolic background introduced by tissue culture media in EVs
analysis……………………………………………………………..
131
Figure 51. Scatter plots of polar and apolar dataset, run in ESI+ .and ESI-
mode for MLP-29 cells and secreted EVs………………………….
138
Figure 52. Example of the identification of a metabolite enriched in EVs in the
aqueous phase…………………………………………………..…..
140
Figure 53. Example of the identification of a metabolite enriched in EVs in the
organic phase……………………………………………………….
141
Figure 54. Overview of the main results obtained in this doctoral thesis……… 148

LIST OF FIGURES AND TABLES
XXVI
TABLES
Table 1. Main features of cell-derived EVs…………………………………........
41
Table 2. List of primers used for DNA amplification..............................................
60
Table 3. MAT activity derived metabolites structure and properties.....................
99
Table 4. COMT activity derived metabolites structure and properties....................
106
Table 5. MAT activity in liver extract, microsomes and EVs from primary
hepatocytes................................................................................................
113
Table 6. COMT activity in liver extract, microsomes and EVs from primary
hepatocytes.................................................................................................
118
Table 7. Number of metabolic signals in C18 and amide columns using different
Metabolic extraction methods.....................................................................
127
Table 8. Metabolic signals detected by UPLC-MS in MLP29 cells and their
Secreted EVs...............................................................................................
128
Table 9. The metabolome of EVs secreted by MLP-29 hepatic cell line…….........
133
Table 10. Hepatic EVs metabolome characterization…………………………..….
136
Table 11. Metabolites implied in different pathways are contained in hepatic
EVs……………………………………………………………………...
137
Table 12. Metabolic signals enriched in hepatic EVs secreted by MLP-29 cell
line……………………………………………………………................
139


ABBREVIATIONS
28
1. ABBREVIATIONS
ALT Alanine transaminase
3-MT 3-methoxytyramine
ACN Acetonitrile
AHCY AdoHcy hydrolase
Alb Albumin
ALF Acute liver failure
AMP Adenosin monophosphate
Asgr Asialoglycoprotein receptor
ALT Alanine Aminotransferase
APAP Acetaminophen
AST Aspartate Aminotransferase
BSA Bovine serum albumin
Cd63 Cluster of Differentiation 63
Cd81 Cluster of Differentiation 81
cDNA Copy Deoxyribonucleic acid
CES Carboxylesterases
Ces1d Carboxylesterase 1d
COMT Cathecol-O-Methyl transferase
Cox IV Citochrome c Oxidase IV
CPT-11 7-ethyl-10-[4-(1-piperidino)-1-piperidino]-carbonyloxy camptothecin
Cryo-EM Cryo-Electron Microscopy
CV Coefficient of variation
DA Dopamine
DAPI 4',6-diamidino-2-phenylindole
DCF Diclofenac
DHA Docosahexanoic acid
DILI Drug-induced liver injury
ABBREVIATIONS
29
DMEM
DNA
Dulbecco’s modified eagle medium
Deoxyribonucleic acid
DPBS Dulbecco’s modified phosphate-buffered saline
DTT Dithiothreitol
EDC Enhanced Duty Cycle
EMRT Exact mass-retention time pair
ESI- Electrospray ionization mode negative
ESI+ Electrospray ionization mode positive
EVs Extracellular Vesicles
FABP Fatty acid binding protein
FDA Food and Drug Administration
GalN Galactosamine
GGT Gamma-glutamyl transferase
GNMT Glycine N-Methyltranferase
GNBL1 Beta polypeptide 2-like 1
Grp 78 Glucose-regulated protein 78
GSH Glutathione
GSSG Glutathione Disulfide
GST Glutathione S-transferase
HCC Hepatocellular carcinoma
HCV Hepatitis C virus
Hcy Homocysteine
HIV-1 Human immunodeficiency virus-1
Hsp 70 Heat Shock Protein 70
Hsp 90 Heat Shock Protein 90
HEPES 4-(2-hydroxyethyl)-1-piperazineethanesulfonic acid
HILIC Hydrophilic Interaction Chromatography
HMDB Human Metabolome Database
HRP Horse radish peroxidase
ILVs Intraluminal vesicles

ABBREVIATIONS
30
LC-MS/MS Liquid chromatography-tandem mass spectrometry
We
LIMP II
Lysosomal integral membrane protein type 2
LLOD Lower Limit of Detection
LLOQ Lower Limit of Quantification
L-NMMA NG-monomethyl-L-arginine
MAT Methyl-AdenosylTransferase
MAT1A Methyl-AdenosylTransferase 1A
MB-COMT Membrane-bound Cathecol-O-Methyl transferase
MeOH Methanol
METLIN Metabolite Link
miRNA Micro ribonucleic acid
MLP-29 Mouse Liver Progenitor -29
MP Microparticles
mRNA Messenger ribonucleic acid
MT Methyltransferases
MTA 5´-methylthioadenosine
MV Microvesicles
MVBs Multivesicular bodies
NAPQI N-acetylp-benzoquinoneimine
NE Norepinephrine
NMN Normetanephrine
NO Nitric oxide
NSAID Nonsteroidal Antiinflammatory Drug
NTA Nanoparticles Tracking Analysis
P450 Cytochromes P450
PBA Phenylboronic acid
PIP2 Phosphatidylinositol-(4,5)-bisphosphate
PC Principal component
PCA Principal components analysis

ABBREVIATIONS
31
PE Phosphatidylethanolamine
PPT Protein precipitation
PUFA Polyunsaturated fatty acid
PVDF Polyvinylidene difluoride
QC Quality Control
qPCR Quantitative polymerase chain reaction
RBP4 Retinol binding protein 4
RNA Ribonucleic acid
RP-LC/MS Reversed-phase liquid chromatography-Mass spectrometry
RTM Raman tweezers microspectroscopy
SAA Salvianoic acid A
SAMe S-adenosylmethionine
SAH S-adenosylhomocysteine
S-COMT Soluble Cathecol-O-Methyl transferase
SN-38 7-ethyl-10-hydroxycamptothecin
SPE Solid-Phase Extraction
ToF Time of Flight
UGT UDP-glucuronosyltransferase
UPLC-MS Ultra Performance Liquid Chromatography- Mass Spectrometry


RESUMEN/SUMMARY
33
2. RESUMEN/SUMMARY
RESUMEN
El daño hepático inducido por drogas (DILI) es un grave problema en las sociedades
desarrolladas, siendo el responsable de más del 50% de los casos de fallo hepático agudo. Un
área de gran interés, tanto en el diagnóstico clínico como en la industria farmacéutica, es la
búsqueda de marcadores no invasivos, tanto para el diagnóstico de esta patología, como para
dilucidar el mecanismo molecular que se encuentra tras ella. En este sentido, el
descubrimiento de vesículas extracelulares (EVs) secretadas por células, ha proporcionado un
nuevo componente celular con la posibilidad de ser un agente activo en diferentes procesos
tanto fisiológicos como patológicos. Estas vesículas han sido detectadas tanto en muestras de
sangre como de orina, proporcionando una nueva plataforma para la identificación de
marcadores no invasivos de enfermedades de diversa índole. Estas vesículas son secretadas
por la mayoría de tipos celulares, incluyendo el hepatocito. Sin embargo, a pesar de la intensa
investigación llevada a cabo en estas vesículas, actualmente poco se conoce acerca de su
papel fisiológico y de su implicación en el desarrollo de enfermedades.
Los hepatocitos secretan EVs que contienen enzimas implicadas en el metabolismo de drogas,
sugiriendo una posible implicación de estas vesículas en el desarrollo de DILI. En este
sentido, en esta tesis doctoral se ha caracterizado la secreción de EVs hepáticas en diferentes
modelos de DILI in vitro mediante el uso de técnicas tanto bioquímicas como moleculares.
Los resultados obtenidos muestran que el contenido de las EVs hepáticas es sensible a los
diferentes modelos de DILI empleados, lo que podría ser de utilidad para fines diagnósticos.
Además, las EVs hepáticas contienen diversas enzimas activas relacionadas con DILI
incluyendo: la carboxylesterasa (CES), methionine adenosyl transferasa (MAT) y catechol O-
methyltransferasa (COMT). En base a la caracterización mediante UPLC-MS del metaboloma
asociado a EVs hepáticas, se han detectado diversas rutas celulares así como funciones
susceptibles de ser modificadas mediante estas vesículas. Un ejemplo de ello son el ciclo de la
metionina, el metabolismo enérgético, la síntesis de purinas y ADN o el control de la presión
sanguínea local.
En conclusión, los resultados obtenidos apoyan que las EVs hepáticas podrían estar
implicadas tanto en DILI como en la respuesta a otro tipo de daño hepático. Asimismo,
también se presentan varias enzimas y moléculas como candidatos a marcadores de baja
invasividad para la detección de DILI.

RESUMEN/SUMMARY
34
SUMMARY
Drug induced liver injury (DILI) is a serious worldwide health problem that accounts for
more than 50% of acute liver failure. A great interest in clinical diagnosis and pharmaceutical
industry is to find non-invasive markers for this pathology and also to elucidate the molecular
mechanisms behind it. The discovery of cell-secreted extracellular vesicles (EVs) has
provided a new cellular component with the ability to influence different biological and
pathological processes. These EVs have been detected in blood and urine samples providing a
new platform to identify non-invasive markers for different diseases. These vesicles are
secreted by most cell types of the body including hepatocytes but despite the intense research
on EVs, there is currently not too much knowledge neither on their physiological role or their
implication in the development of diseases.
Hepatic EVs contain enzymes involved in drug metabolism, suggesting a possible role of
these EVs in DILI. In this regard, in this doctoral thesis it has been characterized the secretion
of hepatic EVs in different DILI in vitro models using molecular and biochemical approaches.
The results showed that the molecular cargo of hepatic EVs is sensitive to DILI condition
what could be useful for diagnosis purposes. In addition, hepatic EVs displayed several
enzymatic activities that have been related with DILI including carboxylesterase (CES),
methionine adenosyl transferase (MAT) and catechol O-methyltransferase (COMT).
Furthermore, by using UPLC-MS based metabolomics to characterize the metabolome
associated to hepatic EVs, a number of cellular pathways and functions susceptible to be
modified by these vesicles were unravelled including methionine cycle metabolism, purine
and DNA (Deoxyribonucleic acid) synthesis, energetic metabolism and local blood pressure.
In conclusion, our data support that hepatic EVs could play a role in DILI as well as in the
response to other liver stresses, and also provide a number of molecules and activities as low-
invasive candidate biomarkers for drug-induced liver injury.


INTRODUCTION
36
3. INTRODUCTION
3.1. LIVER AND DRUG INDUCED LIVER INJURY
The liver is a multifunctional organ essential for the life. It is involved in an elevated number
of metabolic pathways [1] such as glucose, proteins and fat metabolism. Particularly, the liver
plays a prominent role in regulating blood glucose levels, storing the glucose as a glycogen
reservoir or releasing it in the bloodstream as necessary under hormonal control [2]. As for
protein metabolism, this organ not only synthesizes non-essential amino acid by means of
transaminases, but also the most plasma proteins including albumin and coagulation factors.
Conversely, it also breaks down proteins and removes the resulting toxic ammonium ion by
converting it into urea [3]. In addition to this, the liver metabolizes fats or synthesizes
triglycerides from excess carbohydrates and proteins and synthesizes cholesterol from fatty
acids [4]. This organ also produces bile, which takes part in fat digestion along with the
lipases to breakdown the ingested fat. Finally, the liver also acts as vitamin and mineral
storage and is the main organ involved in xenobiotics metabolism [5].
To accomplish all these tasks, the liver employs not just hepatocytes, but also other non-
parenchymal immune and non-immune cells. Liver tissue macrophages (Kupffer cells),
natural killer cells, T cells and B cells are members of the hepatic immune system [6]. These
cell populations regulate the immune system in liver and are important mediators in
inflammation [7]. Among non-immune cells, the hepatic stellate cells, also known as Ito cells,
are involved in angiogenesis and fibrosis processes [8]. However, the parenchyma of liver
consists mostly of hepatocytes, which are the main cell type in the liver (~80%). Hepatocytes
are polarized cells with multiple and complex functions. Among them, hepatocytes play an
important role in detoxification, production and clearance of blood components.
The liver is prone to xenobiotic-induced injury because of its central role in xenobiotic
metabolism, its portal location within the circulation, and its anatomic and physiologic
structure [5][9]. In this regard, drug-induced liver injury (DILI) remains a major cause of
worldwide mortality, according to the United States Acute Liver Failure Study Group [10].
DILI is a clinically important etiology of hepatic disease that, if not recognized, can lead to
hepatic severe failure. Indeed, it accounts for more than 50% of acute liver failure. DILI can
affect both parenchymal and nonparenchymal cells of the liver, leading to a wide variety of
pathological conditions, including acute and chronic hepatocellular hepatitis,
fibrosis/cirrhosis, cholestasis, steatosis, as well as sinusoidal and hepatic artery/vein damage
[11]. Between these pathologies, the predominant forms of DILI include acute hepatitis (liver
inflammation of abrupt onset), cholestasis (interruption in the excretion of bile), and a mixed
pattern [12].
Although the exact mechanism of DILI remains unknown, it appears to involve 2 pathways;
direct hepatotoxicity and adverse immune reactions (innate and adaptative immunity), being
direct hepatotoxicity the most common pathway [13]. Direct hepatotoxicity is often caused by
the direct action of a drug, or more often a reactive metabolite of the drug against different

INTRODUCTION
37
components of the hepatocytes causing a malfunctioning of them. In most instances, DILI is
initiated by the bioactivation of drugs to chemically reactive metabolites, which have the
ability to interact with cellular macromolecules such as proteins, lipids, and nucleic acids,
leading to protein dysfunction, lipid peroxidation, DNA damage, and oxidative stress. These
reactive metabolites may induce disruption of ionic gradients and intracellular calcium stores,
resulting in mitochondrial dysfunction and loss of energy production. This impairment of
cellular function can culminate in cell death and possible liver failure [13]. In adverse immune
reactions, hepatocyte damage triggers the activation of other cells, which can initiate an innate
and/or an adaptive immune response. The innate immune system provides an inflammatory
reaction that is first line of defense against microbial infection, but it is not sufficient in
eliminating all the components of infectious organisms. In this regard, cells of the innate
immune system play an integral role in the initiation of adaptive immunity by presenting
antigens and are crucial in determining the subsequent T cell or antibody-mediated immune
response. Collectively, the innate and adaptive immune cells contribute to the unique immune
responses of the liver, such as removal of pathogenic microorganisms or clearance of
particles and soluble molecules from circulation [14].
The idiosyncratic nature and poor prognosis of DILI, makes it a major safety issue during
drug development, as well as the most common cause for the withdrawal of drugs from the
pharmaceutical market. Indeed, because of the significant patient morbidity and mortality
associated with DILI [15], the U.S. Food and Drug Administration (FDA) has removed
several drugs from the market, representing a serious clinical and financial problem [16]. The
cost of introducing a new drug to the market (estimated at hundreds of millions of dollars)
generates a high socio-economical pressure to understand the underlined mechanisms and to
generate new tools and approaches for the identification of sensitive biomarkers for
hepatotoxicity. In this regard, the clinical diagnosis and prediction of DILI remain a major
challenge due to various confounding factors which include preexisting liver disease, multiple
drug usage by patients, and most important, lack of reliable screening methods and diagnostic
standards [13]. Currently, besides liver biopsy, the activity of a series of hepatic enzymes and
proteins released into the blood by damaged liver cells are the most useful tools available in
detecting liver damage in a non-invasive manner. Hepatic screening test measuring bilirubin
(total and unconjugated), alkaline phosphatase, aspartate aminotransferase (AST), alanine
aminotransferase (ALT), albumin, gamma-glutamyl transferase (GGT), prothrombin time and
glutathione-S-transferase are routinely used in both preclinical and human clinical drug
studies [17]. As a general rule, ALT levels greater than 3 times the upper limits of normal
have been identified as a marker for liver injury. This observation is currently employed by
the FDA in the evaluation of hepatotoxicity for newly developed drugs [15]. Nevertheless,
none of them is sensitive or specific enough to be consider as specific marker for detecting
DILI [17][18]. Therefore, the development of novel diagnostic biomarkers with greater
sensitivity and specificity is needed for the development of improved preclinical screens and
the design of more effective clinical trials to evaluate potential hepatotoxic effects of new
drugs before its release into the pharmaceutical market.

INTRODUCTION
38
Over 1000 drugs and herbal products have been implicated in the development of DILI and
the list continue to grow [19]. In the present doctoral thesis, different liver injury models are
studied in order to find new and specific biomarkers for DILI. Such models are based on
galactosamine (GalN), acetaminophen (APAP) and diclofenac (DCF), three compounds that
cause liver damage by different mechanisms. GalN is a well characterized hepatotoxin that
causes acute liver injury similar to human viral hepatitis via depletion of uridine nucleotides,
which subsequently diminishes synthesis of RNA (Ribonucleic acid) and proteins [20][21].
Although this compound also inhibits the energy metabolism of hepatocytes [22]. Model of
GalN hepatotoxicity is frequently used in animal experiments in vivo [20]. Similarly, APAP is
a classically used drug to study the mechanisms of hepatotoxicity [13]. This drug is an over-
the-counter analgesic that is safe at therapeutic doses but at overdose can produce
centrilobular hepatic necrosis, which may lead to acute liver failure. According to the United
States Acute Liver Failure Study Group, hepatotoxicity caused by overdose of APAP
accounts for 39% of acute liver failure. APAP is metabolized to its toxic metabolite, N-
acetylp-benzoquinoneimine (NAPQI) [23], which during APAP overdose leads to the
disruption of calcium homeostasis, mitochondrial dysfunction, oxidative stress and may
eventually culminate in cellular damage and death [24][25]. Finally, the nonsteroidal
antiinflammatory drug (NSAID) DCF is a model of idiosyncratic hepatotoxicity. It causes
rare but significant cases of serious hepatotoxicity, typically with a delayed onset (1–3
months) [26]. Like other NSAIDs, DCF acts by inhibiting cellular cyclooxygenases (Cox-1
and Cox-2), which results in a decreased production of pro-inflammatory prostaglandin,
prostacyclin and thromboxane products, important mediators of inflammation and pain. This
drug is one of the most frequently used over-the-counter antiinflamatory worldwide. More
than a hundred instances of clinically apparent liver injury due to DCF have been reported in
the literature. Indeed, DCF ranks in the top 10 causes of drug induced liver injury. In
overdose, it causes oxidative stress and mitochondrial injury with a pattern predominantly
hepatocellular [27].
3.2. EXTRACELLULAR VESICLES (EVs)
A molecular biomarker is any biological molecule or pattern (proteins, metabolites, RNAs,
gene expression profiles, etc.) that functions as a measurable indicator of the presence of a
disease including its stage, progression and localization. As a consequence, a variety of
strategies have been adopted for their discovery such as metabolomics, proteomics or
transcriptional profiling. A key interest in clinical diagnosis and pharmaceutical industry is to
have a repertoire of low-invasive biomarkers to be able to predict the degree of injury caused
by a pathological condition or a drug. In this regard, the study of cell-secreted EVs as a
platform to identify new disease biomarkers [28] has evolved rapidly in the recent years.
The discovery of EVs dates back to 1940, when preliminary studies were performed,
addressing the “biological significance of the thromboplastic protein of blood” [29]. More
than 20 years later, in 1967, this subcellular fraction was identified by electron microscopy

INTRODUCTION
39
and was shown to consist of small vesicles originating from platelets and termed “platelet
dust” [30]. One decade later, fetal bovine serum was also shown to contain “numerous
microvesicles” and they were presented as the breakdown products of normal cell components
[31]. Meanwhile, within a completely different line of research, EVs were identified as being
released from reticulocytes during their maturation into erythrocytes, whereby the transferrin
receptor as a constituent component of those EVs becomes downregulated in the mature
erythrocytes [32].
Since then, EVs are known to be released from most cell types including mast cells, dendritic
cells, B lymphocyte cell lines, astrocytes, platelets, hepatocytes, neurons, endothelial cells,
and epithelial cells [33]. Furthermore, EVs have been isolated from diverse body fluids,
including semen [34][35], blood [36], urine [37], saliva [38], breast milk [39], amniotic fluid
[40], ascites fluid [41], cerebrospinal fluid [42] and bile [43].
There is accumulating evidence that vesicles released from cells are heterogeneous in terms of
biogenesis, secretion process and size [44]. In this regard, three main groups have been
identified (Figure 1): endosome-derived vesicles named exosomes, plasma membrane-
shedding vesicles called ectosomes or microvesicles (MVs), and apoptotic bodies [1].
Figure 1. Schematic representation of the different type of extracellular vesicles (EVs). Major populations
include exosomes, microvesicles and apoptotic bodies. Adapted from György et al. 2011[45].
Regarding cell-derived vesicles formation, at present, the detailed underlying mechanisms
remain unclear [33]. However, there is enough evidence supporting the endocytic origin of
some of these vesicles [46][47][48]. The release of this type of EVs is a process that appears
INTRODUCTION
40
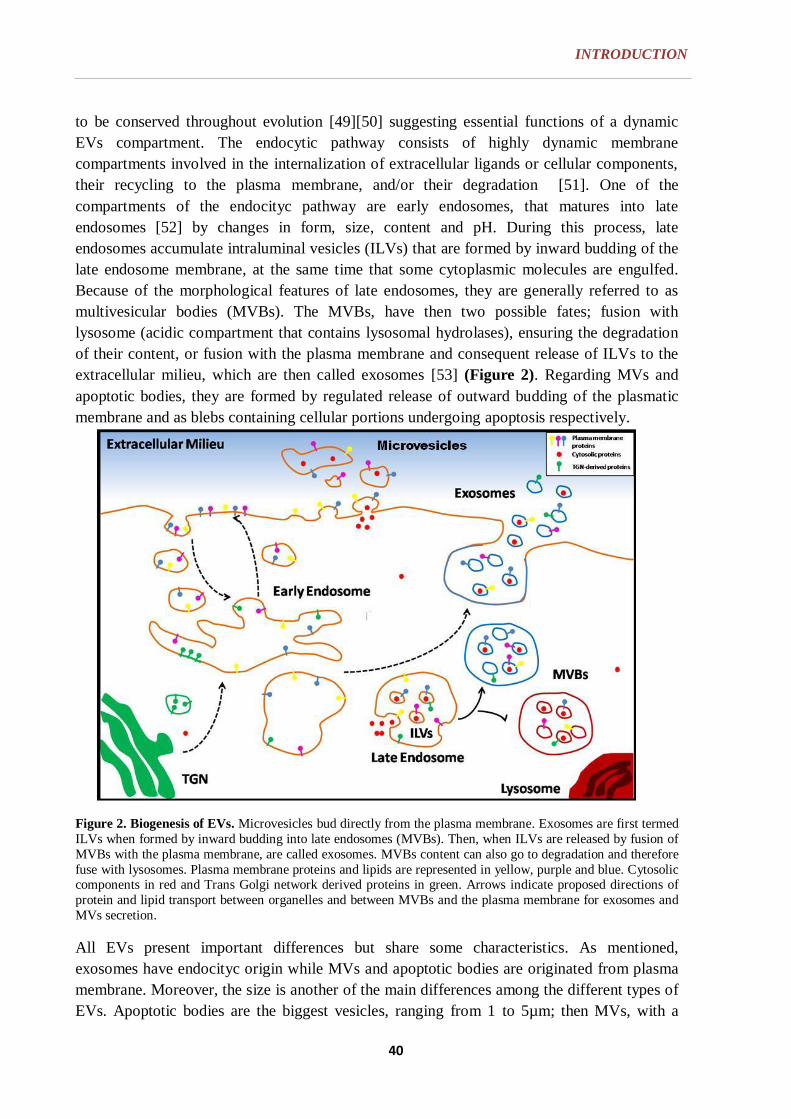
to be conserved throughout evolution [49][50] suggesting essential functions of a dynamic
EVs compartment. The endocytic pathway consists of highly dynamic membrane
compartments involved in the internalization of extracellular ligands or cellular components,
their recycling to the plasma membrane, and/or their degradation [51]. One of the
compartments of the endocityc pathway are early endosomes, that matures into late
endosomes [52] by changes in form, size, content and pH. During this process, late
endosomes accumulate intraluminal vesicles (ILVs) that are formed by inward budding of the
late endosome membrane, at the same time that some cytoplasmic molecules are engulfed.
Because of the morphological features of late endosomes, they are generally referred to as
multivesicular bodies (MVBs). The MVBs, have then two possible fates; fusion with
lysosome (acidic compartment that contains lysosomal hydrolases), ensuring the degradation
of their content, or fusion with the plasma membrane and consequent release of ILVs to the
extracellular milieu, which are then called exosomes [53] (Figure 2). Regarding MVs and
apoptotic bodies, they are formed by regulated release of outward budding of the plasmatic
membrane and as blebs containing cellular portions undergoing apoptosis respectively.
Figure 2. Biogenesis of EVs. Microvesicles bud directly from the plasma membrane. Exosomes are first termed
ILVs when formed by inward budding into late endosomes (MVBs). Then, when ILVs are released by fusion of
MVBs with the plasma membrane, are called exosomes. MVBs content can also go to degradation and therefore
fuse with lysosomes. Plasma membrane proteins and lipids are represented in yellow, purple and blue. Cytosolic components in red and Trans Golgi network derived proteins in green. Arrows indicate proposed directions of
protein and lipid transport between organelles and between MVBs and the plasma membrane for exosomes and
MVs secretion.
All EVs present important differences but share some characteristics. As mentioned,
exosomes have endocityc origin while MVs and apoptotic bodies are originated from plasma
membrane. Moreover, the size is another of the main differences among the different types of
EVs. Apoptotic bodies are the biggest vesicles, ranging from 1 to 5µm; then MVs, with a

INTRODUCTION
41
diameter size that ranges from 100 to 1000 nm and finally the exosomes, ranging between 50
and 150 nm. However, all EVs contain proteins, lipids and nucleic acids and also share some
markers such as Annexin V, Cd81 or CD9 in the case of exosomes and MVs [45]. Table 1
summarized the major key features of the different EVs.
Table 1. Main features of cell-derived EVs
There are several isolation methods described for EVs. The conventional procedure to isolate
exosomes and MVs involves mainly differential ultracentrifugation [60]. Briefly, the culture
media is collected and filtered through 0.22 microns-pore filters, followed by subsequent
ultracentrifugations at 10,000 x g (30 min) and 100,000 x g (60 min). The resulting pellet is
enriched in EVs. An extra purification step involving a continuous density gradient has also
been indicated to ensure obtaining exosomes-enriched preparations. The density at which
exosomes float has been determined to range from 1.13 to 1.21 g/ml. In addition, in the last
years, different commercial precipitating agents (e.g. Exoquick) have been developed in order
to isolate EVs using methods more suitable for clinical practise. However, it is important to
bear in mind that the EVs isolated using these precipitating methods are contaminated with
non-vesicular material [54].
Most studies reported so far regarding biochemical composition of EVs, involve analysis of
mixed populations of vesicles obtained by differential ultracentrifugation. Thus, the actual
constitution of each subtype of EVs remains unknown. As a whole, EVs harbor a wide variety
of proteins, phospholipids, lipids, mRNAs and microRNAs. Figure 3 shows the overall
composition of EVs. Nevertheless, their specific composition depends on the cell type of

INTRODUCTION
42
origin and the state of them, which is revealed by proteomic analysis in large scale of EVs
from various cell types [33].
Figure 3. Overall composition of EVs (Adapted from Colombo and Raposo. 2014) Schematic representation of
the composition (families of proteins, lipids, and nucleic acids) and membrane orientation of EVs. Examples of
tetraspanins commonly found in EVs include CD63, CD81, and CD9. Note that each listed component may in
fact be present in some subtypes of EVs and not in others. For instance, histones and proteasome and ribosome
components are probably secreted in large plasma membrane–derived EVs rather than exosomes. Abbreviations: ARF, ADP ribosylation factor; ESCRT, endosomal sorting complex required for transport; LAMP, lysosome-
associated membrane protein; MHC, major histocompatibility complex; MFGE8, milk fat globule–epidermal
growth factor-factor VIII; RAB, Ras-related proteins in brain; TfR, transferrin receptor.
Proteomic analysis shows a large overlap of protein expression between exosomes and MVs.
As a consequence of their origin, EVs from different cell types contain endosome-associated
proteins (e.g., Rab GTPase, SNAREs, Annexins and Flotillin), some of which are involved in
MVB biogenesis (e.g., Alix and Tsg101 [55]). Membrane proteins that are known to cluster
into microdomains at the plasma membrane or at endosomes often are also enriched on EVs.
These include tetraspanins, a family of more than 30 proteins that are composed of four
transmembrane domains [56]. Some of the tetraspanins contained in EVs are Cd63, Cd81,

INTRODUCTION
43
Cd82, Cd53, and Cd37. EVs are also enriched in proteins that associate with lipid rafts,
including glycosylphosphatidylinositol- anchored proteins and Flotillin [49].
After the demonstration that EVs cargo included both mRNA and miRNA of various sizes
and that EVs associated mRNAs could be translated into proteins by target cells [57][58],
numerous groups have analyzed the presence of genetic material in EVs. Recently, it has been
demonstrated that, in addition to mRNA and miRNA, EVs also contain a large variety of
other small noncoding RNA species, including RNA transcripts overlapping with protein
coding regions, repeat sequences, structural RNAs, tRNA fragments, vault RNA, Y RNA, and
small interfering RNAs [59][60].
Fewer studies have analyzed the lipid and metabolites composition of EVs [61]. When
comparing secreted vesicles with the total cell membranes, most of these studies observed
enrichment of sphingomyelin, cholesterol, phosphatidylserine (PS), phosphatidylcholine,
phosphatidylethanolamine and generally of saturated fatty acids [49]. These fatty acids
together with the high concentration of cholesterol, may account for lateral segregation of
these lipids into ILVs during their formation at MVBs. In this line, EVs are also enriched in
proteins associated with lipid rafts, including glycosylphosphatidylinositol- anchored proteins
and flotillin [62] [63].
The overall composition of EVs described above is representative of vesicles mixed
populations. The databases ExoCarta [64], Vesiclepedia [65] and EVSpedia [66] catalog
proteins, lipids, and RNA that have been identified in EVs from different sources.
Regarding EVs functions, they were first described to work as a cellular mechanism to
remove unwanted plasma membrane proteins during the maturation process of reticulocytes.
Ten years later, EVs were shown to bear MHC molecules and participate of immune
reactions. Since then, several functions in cell-to-cell communication processes have been
attributed to EVs such as a vehicle to exchange genetic material (mRNA and miRNA)
between cells or as a shuttle for infectious agents (HIV, prions) to escape immune
surveillance [57][67].
Many other functions have been assigned to EVs such as immune suppression, antigen-
presenting, signaling molecules carriers, inflammation control, tumor growth (i.e. metastasis
and angiogenesis), cell adhesion, coagulation, vascular repair, waste management and
protection against stress among others [68].
3.3. HEPATIC EVs
Despite the increasing interest in EVs, at present there are few studies focusing on hepatic
EVs. They were first described and characterized in 2008 by Conde-Vancell et al [69] in non-
tumoral hepatocytes. In the study, it was reported a proteomic analysis of hepatic EVs where
the vesicles content reflected the cell type of origin [69]. The proteomics analysis identified
multiple proteins known to be involved in the endosomal pathway, such as annexins, small

INTRODUCTION
44
GTP-binding proteins and several cytoskeletal (actin, tubulin), cytoskeletal binding-proteins
(moesin, cofilin-1) and motor proteins (myosins). Another significant group consisted of
secreted proteins, such as coagulation-related proteins, serum albumin and apolipoproteins
that are released to the blood stream mainly by the liver. Conversely, numerous cytosolic
proteins, presumably trapped during EVs biogenesis, were also identified. Besides these,
many other proteins were also detected, such as cytochromes and UDP-
glucuronosyltransferases that are involved in detoxification processes of both exogenous and
endogenous compounds.
Regarding nucleic acid content, 1300 transcripts were detected associated to EVs released by
rat hepatocytes [70]. From them, 223 transcripts were found associated mainly with
hepatocyte functions. Remarkably, some of those RNAs are enriched in the EVs in
comparison with the intracellular transcriptome suggesting that RNA cargo is selectively
incorporated [26].
Several physiological roles for hepatic EVs have been suggested:
Intercellular communication: Recently, the role of secreted EVs in the exchange of
proteins, nucleic acids and lipids has awakened considerable interest in the field of
intercellular signaling [6]. Indeed, several reports [71][72] have identified and
characterized the role of EVs in intercellular communications. As mentioned before,
EVs can transfer different types of molecules (e.g. proteins, lipids, mRNAs or even if
viruses) to target cells, inducing a change in composition or behavior of target cells
[70]. Remarkably, circulating liver-specific mRNA associated with EVs has been
described in the bloodstream [73]. In general, the role of bloodstream mRNAs is still
unclear. Since the first descriptions of mRNA associated to EVs, functional transfer of
EV-associated RNA to the acceptor cells has been shown [57].
EV pathway for virus propagation: Hepatitis C virus (HCV) is a major cause of
chronic liver disease. HCV can entry into the cell and be delivered into early
endosomes [74]. Indeed, in HCV-infected patients, viral RNA is associated with EVs
in plasma [75].
EVs in regeneration and differentiation: Liver is involved in detoxification of
xenobiotics and noxious endobiotics, and therefore, continuously exposed to injuries.
According to this, tissue regeneration is an important defensive mechanism
maintaining the viability of this organ. Several studies support the possible role of
hepatic EVs in liver regeneration [76][77][78].
EVs in bile duct proliferation: Biliary EVs secreted by cholangiocytes take part in a
pathway associated with the inhibition of cholangiocyte proliferation [79].
EVs in liver inflammation: Non-alcoholic fatty liver disease is emerging as a major
global liver disorder. It encompasses a spectrum of diseases from simple steatosis to
hepatocellular carcinoma. But, the role of EVs in inflammation is ambiguous because
EVs can elicit either inflammation [80] or immunosuppressive effects [81][82].
EVs´ miRNA and cancer: Tumoral cells undergo deregulation of miRNA expression
and are known to release miRNAs associated with EVs [83]. An exhaustive catalogue

INTRODUCTION
45
of miRNAs present in EVs released by hepatic cancer cells has pointed towards TAK1
protein as one of the central targets of tumour-derived EV miRNA [84], which is an
essential inhibitor of hepatocarcinogenesis.
To elucidate whether one or several of these possibilities are achieved by hepatic EVs, further
investigation and better knowledge of the cargo and activities that are present in EVs is
needed.
3.4. HEPATIC EVs IN DRUG INDUCED LIVER INJURY
Liver is the major body reservoir for enzymes involved in the metabolism of endogenous and
xenobiotic compounds. In this regard, there are several works that have revealed the presence
of different xenobiotic metabolizing enzymes in hepatic EVs [85][86]. Thus, several members
of Cytochromes P450 (P450s), UDP-glucuronosyltransferases (UGTs), and Glutathione S-
transferases (GSTs) proteins families [87], all of them important enzymes involved in
xenobiotic metabolism, were detected in EVs secreted by hepatocytes.
Cytochromes P450s are monooxygenases that catalyze phase I reactions. They constitute the
largest family of xenobiotic compound metabolizing enzymes. It metabolizes a wide variety
of xenobiotics to pharmacologically inactive metabolites (approximately 75% of all clinically
relevant drugs), and occasionally, to toxicologically active metabolites [35]. Impairment of
cytochrome P450 activity, which may be either genetic or environmental, may lead to toxicity
caused by the parent compound itself, affecting the susceptibility to hepatic injury. P450
enzymes may also convert the drug to a chemically reactive metabolite, which, if not
detoxified, may lead to various forms of hepatic and extrahepatic toxicity, including cellular
necrosis, hypersensitivity, teratogenicity, and carcinogenicity.
UGTs catalyze phase II glucuronidation reactions and metabolize a wide range of drugs as
well as other xenobiotics, including environmental and dietary xenobiotics [88]. In addition,
the other major contributor to drug metabolism, the GSTs family, also catalyzes Phase II
reactions. The general action of GST enzymes is the addition of glutathione (GSH) to a wide
variety of endogenous and exogenous substrates [89]. GSTs are commonly responsible for the
metabolism of oxidation products such as epoxides derived from the metabolism of P450s on
polycyclic aromatic hydrocarbons. The addition of GSH moieties to these metabolically
reactive epoxides turns them up into inactive forms that are readily excretable from the body
[90]. Interestingly, the mediated conjugation of GSH to xenobiotic compounds by GSTs has
also been observed to yield metabolites that are cytotoxic and if not detoxified, may lead to
various forms of hepatic and extrahepatic toxicity, including cellular necrosis,
hypersensitivity, teratogenicity, and carcinogenicity [91].
These drug-metabolizing enzymes, apart from metabolizing drugs to their corresponding
inactive forms, may also cause a toxicological effect provoking direct hepatotoxicity by
reacting with different molecules and altering their normal functions. For instance, it is

INTRODUCTION
46
reported that P450 and UGT families are target proteins of autoantibodies in several hepatic
and extrahepatic autoimmune diseases, causing immune-mediated liver injury [92]. All these
data support a role of hepatic EVs in establishment and propagation of DILI.
EVs act as vectors since they transport and protect not only proteins but also phospholipids,
microRNAs and messenger RNAs (mRNAs) as biological messages [33]. In particular,
hepatocyte-derived EVs contain liver specific mRNAs that are found in the bloodstream [93].
Importantly, amplification and quantification of these nucleic acids in blood samples have
proved to be more sensitive than traditional transaminase activity quantification for detecting
liver damage [73]. In this regard, it has been reported the possible role of hepatic RNA-
containing EVs as a suitable non-invasive biomarker for liver toxicity [94]. Using in vitro and
in vivo liver disease models based on GalN, APAP and DFC it was found that the expression
of various RNAs enriched in the corresponding EVs was altered.
By examining the levels of albumin and beta polypeptide 2-like 1 (Gnb21) transcripts it was
possible to distinguish between the three treatments. Therefore, liver damaging drugs are able
to modify RNA content of these vesicles. Overall, these results suggest that the RNAs
contained in hepatic EVs are a suitable biological source for non-invasive biomarker
discovery of liver toxicity and for discrimination between different liver injuries.
In addition, the comprehensive proteomic analysis performed in hepatocyte-derived EVs,
revealed the presence of other relevant metabolic enzymes [69][95], such as Carboxylesterase
1d (Ces1d), Methyl-adenosyltransferase (MAT) and Cathecol-O-methyl transferase (COMT)
that could also play a role in the development of DILI.
3.4.1. CARBOXYLESTERASE (CES)
There are different types of chemical reactions used to metabolize drugs, being the hydrolysis
reactions the most common. In this sense, there is an immense variety of hydrolases, being
CES one of the most significant related with xenobiotic metabolisms playing an important
role in detoxification processes [87].
CES proteins belong to Phase I group of drug metabolizing enzymes. These enzymes
efficiently catalyze the hydrolysis of a variety of ester- and amide-bonds containing chemicals
and drugs to their respective free acids. They are involved in detoxification and metabolic
activation of various drugs, environmental toxicants and carcinogens. CES also catalyze the
hydrolysis of endogenous compounds such as short and long chain acyl-glycerols, long-chain
acyl-carnitine and long-chain acyl-CoA esters [96].
CES comprise a multi-gene family whose gene products are localized in the endoplasmatic
reticulum of many mammal tissues including liver, small intestine, lung, testis and
macrophages [97]. Experimentally, microsomes purification from CES expressing cells is the
best source of this type of enzymes [96].

INTRODUCTION
47
Mammalian CES are members of an α,β-hydrolase-fold family and they can be classified into
five major groups denominated CES1-CES5 according to the homology of the amino acid
sequence. There are some differences between these groups in terms of substrate specificity,
tissue distribution, immunological properties and gene regulation [96], [98].
CES1, CES2 and CES3 are the three major carboxylesterases detected in human liver [99].
Ces1d isoform, which is homologous to human CES1 [69], is the most abundant in EVs
secreted by rat hepatocytes. In this regard, one of the objectives in this doctoral thesis is to
demonstrate that this enzyme is active in hepatocytes-secreted EVs.
3.4.2. METHIONINE ADENOSYL-TRANSFERASE (MAT)
MAT is the only enzyme responsible for the biosynthesis of S-adenosylmethionine (SAMe),
the principal biological methyl donor, precursor of polyamines and in the liver, precursor of
glutathione [100], that has a relevant role in controlling oxidative stress.
The unique chemical structure of SAMe confers it the ability to participate in multiple
biological reactions, being methylation, transsulfuration and aminopropylation the three major
ones [101] (Figure 4). In methylation reactions, the methyl group is transferred to a large
variety of substrates, such as DNA, RNA, proteins, phosphatidylethanolamine (PE), glycine
and guanidinoacetate. These transmethylation reactions are catalyzed by specific
methyltransferases (MTs) and over 200 proteins in the human genome have been identified as
known or putative SAMe-dependent MTs [102]. During transmethylation, the methyl group
of SAMe is transferred to the acceptor substrates and S-adenosylhomocysteine (SAH) is
generated. SAH is then hydrolyzed to homocysteine (Hcy) and adenosine in a reversible
reaction. In transsulfuration reactions, the sulfur atom of SAMe undergoes a series of
reactions and is converted to cysteine and GSH, one of the main anti-oxidant molecules in
cells. SAMe can also take part in radical reactions via its adenosine group and generate the 5´-
deoxyadenosyl radical, which is a powerful oxidizing agent (Figure 4). On the other hand,
aminopropylation is involved in the synthesis of polyamines, necessary for cell proliferation
among other functions. Through this pathway, SAMe is decarboxylated and its aminopropyl
group is transferred, first to putrescine to form spermidine and 5´-methylthioadenosine
(MTA) and then to spermidine to form spermine and a second molecule of MTA. The two
molecules of MTA generated during this process exert an inhibitory effect on polyamine
synthesis and consequently, on methionine synthesis as well [103]. The MTA molecules are
then eliminated in order to restore the methionine levels of the cell (Figure 4).
An integrated view of SAMe metabolism combine methylation, transsulfuration and
amynopropilation pathways. Importantly, these reactions can affect a wide spectrum of
biological processes ranging from metal detoxification and catecholamine metabolism to
membrane fluidity, gene expression, cell growth, differentiation, and apoptosis [104].

INTRODUCTION
48
Figure 4. Schematic view of Methionine cycle metabolism. Methionine adenosyltransferase is involved in
methionine cycle. SAMe participates in multiple biological processes, including methylation, transsulfuration and amynopropylation pathways. During methylation, MAT converts methionine to SAMe using ATP as co-
substrate. When the methyl group of SAMe is transferred to the acceptor substrates, S-adenosylhomocysteine
(SAH) is generated, which is then hydrolyzed to form homocysteine (Hcy). Moreover, when SAMe is
decarboxylated to transfer its aminopropyl group for polyamines synthesis, 5´-methylthioadenosine (MTA) is
generated as a by-product.
Although all mammalian cells synthesize SAMe, the liver is where the bulk of SAMe is
generated, as it is the organ where about 50% of all dietary methionine is metabolized and
where up to 85% of all transmethylation reactions take place [105][106]. Thus, SAMe
regulation is very important for liver homeostasis. Abnormal MAT activity is linked to many
diseases outside and inside the liver. Indeed a failure in SAMe regulation can lead to fatty
liver disease, cirrhosis or hepatocellular carcinoma (HCC) among others [100].
3.4.3. CATECHOL-O-METHYL TRANSFERASE (COMT)
COMT is a enzyme that catalyzes the transfer of a methyl group from SAMe to one of the
hydroxyl groups of a catecholamine (Figure 5) [107], [108]. By means of this reaction, the
general function of COMT is the elimination of biologically active or toxic hydroxylated
metabolites and catechols. In this line, COMT acts as an enzymatic detoxicating barrier
between the blood and other tissues shielding against the detrimental effects of xenobiotics
[109].
Catecholic compounds belong to a heterogenous group of reactive molecules that participate
in chemical and biological reactions such as redox cycling, production of reactive oxygen
species (ROS) or DNA and protein damage [110]. In mammals, catechols can occur as
cathecol drugs (some dietary and medicinal products), metabolites in the degradation of
cathecolestrogens or other endogenous compounds, such as cathecholamine neurotransmitters
or regulators of endothelial permeability. So, catechol-metabolizing system has a potential
pathophysiological and pathogenic significance in estrogen-induced hormonal cancers, in the

INTRODUCTION
49
development of degenerative brain disorders as Parkinson’s disease or depression, as well as
in the development of cardiovascular diseases [111].
Figure 5. The basic function of Catechol‐O‐Methyltransferase. Enzymatic O‐methylation of the catechol
substrate to 3‐Methoxy (major route) or 4‐Methoxy (minor route) products in the presence of Mg2+ and SAMe
[109].
Among cathecolestrogens, 17-beta estradiol and salvianolic acid A (SAA) are found. 17-beta
estradiol [112] is an essential estrogen hormone for sexual and reproductive development,
mainly in females, although it also has important effects in many other tissues including liver.
In this regard, it can lead to cholestasis by inducing a reversible inhibition of bile flow.
Therefore, 17-beta estradiol is a toxicologically active metabolite that requires to be removed
by COMT [113]. Concerning SAA, COMT is also responsible for methylated transformation
of this phenolic acid metabolically unstable. Interestingly, metabolites derived from O-
methylation of SAA display high antioxidant potency against liver lipid peroxidation [114].
Moreover, considerable evidence has also demonstrated the potent protective effects of SAA
against ischemia-induced injury [115][116].
Among cathecholamine neurotransmitters, dopamine (DA) and norepinephrine (NE), also
called noradrenaline are found. DA and NE neurotransmitters play essential roles in
controlling several forebrain functions. Consequently, perturbations of these neurotransmitters
may contribute to the pathophysiology of neuropsychiatric disorders. [117]. According to this,
the role of NE and DA neurotransmitters in the mechanism of action of antidepressant drugs
as well as of drugs for Parkinson’s disease prompted extensive studies.
In Parkinson’s disease, dopaminergic neurons in the brain are gradually destroyed, leading to
a DA deficiency and to the onset of symptoms of Parkinson’s disease [118]. To overcome
this, an option is to administrate DA precursors such as Levodopa (L-DOPA), the most
effective medication in Parkinson’s disease [119]. However, L-DOPA is removed by COMT.
Thus, in the late 1980s, potent and selective COMT inhibitors were introduced [120]. In this
way, when L-DOPA is administered together with COMT inhibitors, the peripheral
metabolism of L-DOPA diminishes, increasing its bioavailability [121]. Tolcapone, for

INTRODUCTION
50
instance, is a selective COMT inhibitor that extends the duration of action of L-DOPA. But it
has been observed to cause hepatotoxicity such as cholestatic injury which is reflected by an
abnormal increased level of liver transaminases. Moreover, Tolcapone also caused
hepatocellular injury since the mitochondrial ATP/ADP ratio is also decreased [122].
With reference to NE neurotransmitter, it produces wide-ranging effects on many areas of the
body and is often referred to as a 'fight or flight' chemical, as it is responsible for the body's
reaction to stressful situations. It triggers the release of glucose into the blood stream and
increases blood pressure, heart rate, mental alertness and respiratory rate. Depression, anxiety,
arterial hypotension, heart rate issues, and many other illnesses can be attributed, at least
partially, to NE deregulation. In this regard, arterial hypotension occurs frequently in patients
with acute liver failure (ALF). Treatment with NE and DA in patients with ALF is widely
used as a vasopressor medication [123]. Moreover, NE concentrations in plasma are elevated
in patients with cirrhosis [124].
Although COMT can be found in many tissues, the liver is the most important site for the
metabolism of circulating catechols containing molecules [107]. Indeed, the liver exhibits
clearly the highest COMT activity and protein levels followed by kidney, intestinal tract, heart
and brain [125]. Consistent with this, COMT has been recently reported as a biomarker of
liver injury. In the early stages, even before the current standard liver biomarker, alanine
transaminase (ALT ) and histopathology indicate liver injury, COMT levels change
significantly in both liver tissue and plasma [126].
Given the importance of the processes in which COMT is involved, the interest in this
enzyme has considerably increased. Thus, more reliable, sensitive and rapid analytical COMT
assays are needed, for example, to test in vitro efficacy of new COMT inhibitor candidates, to
the determination of the structure-activity relationship of COMT or to measure COMT
activity in various human disorders including schizophrenia, kidney disease, hypertension,
Parkinson´s disease, and estrogen-induced cancers [107], [127]. According to COMT
inhibitors, their efficacy is commonly determined in clinical studies and therefore, good
sensitivity analytical method is required. To do that, there is a great variation in analytical
methods for COMT activity measurement. Yet, High Performance Liquid Chromatography
(HPLC) methods and radiochemical assays are the most commonly used methods[108],
[128]–[132].
In this doctoral thesis a novel method has been developed for the determination of COMT
activity by UPLC-MS, using two different endogenous substrates (DA and NE) (Figure 6).

INTRODUCTION
51
Figure 6. Cathechol-O-Methyltransferase catalyses methylation of Dopamine and Norepinephrine. (A)
The methyl group of SAMe is transferred to Dopamine forming 3-methoxytyramine (B) or to Norepinephrine
forming Normetanephrine in a reaction catalyzed by COMT.
Overall, the alteration in protein expression of the studied enzymes [95] together with their
presence in hepatic EVs, were the main reasons to study in detail their activity in diverse in
vitro drug induce liver injury models.
3.4.4. METABOLOMIC PROFILING OF HEPATIC EVS
Over the last decades there has been an important revolution in biomedical science with the
search for single genes, transcripts, proteins or metabolites being substituted by the coverage
of the entire genome, transcriptome, proteome and metabolome. Genomics, trancriptomics
and metabolomics are considered important tools for interpreting and understanding the
complex biological processes given their capability to measure changes in multiple entities
simultaneously, providing an overview of different physiological or pathological conditions
[133].
From these “omics” technologies, metabolomics is the most recently developed and involves
the measurement of hundreds to thousands of small molecules called metabolites (<2000 Da).
These metabolites include molecules from different chemical nature, such as carbohydrates,
vitamins, lipids and amino or fatty acids [134]. Metabolomics allows the qualitative and
quantitative measurement of the metabolic response of a biological system to physiological or
pathological stimuli.
Metabolomics can be divided into two different types, targeted (metabolic target analysis) and
untargeted (metabolic profiling) [135][136]. The use of targeted approaches in research is

INTRODUCTION
52
quite old, and appeared long before the emergence of the “metabolomics” terminology [135].
This analysis includes the identification and quantification of a small set of metabolites using
the most suitable analytical techniques for those compounds to avoid interferences [137]. The
chemical identities of the metabolites to be assayed are known before data acquisition
commences and this is a significant advantage with regards to metabolic profiling. In this
regard, in this doctoral thesis, targeted metabolomics has been applied to the study of COMT
and MAT enzymatic reactions.
In contrast, in metabolic profiling, the aim is to provide a holistic picture of the system. From
the metabolite it is infered the protein involved in the regulation of that metabolite, and
therefore the transcript and the gene. A large number of metabolites can be quantified [138]
from cells, tissues or biofluids to generate metabolic profiles [139]. Then, the biological
relevance of these metabolic profiles can be evaluated via pathway analysis. The combination
of metabolomics and software specialized in visualizing cellular pathways, offer a tool to
identify and integrate the different metabolic pathways that are affected by a determined
stimuli [140]. Interestingly, comparisons of such profiles from different genotypes are being
used to identify specific metabolic changes leading to the understanding of physiology,
toxicology and disease progression. Overall, both, targeted and untargeted metabolomics,
reveal the expected behavior of known metabolites, but only untargeted metabolomics allows
also the detection of synergic effects between variables which cannot be observed at an
individual level [141].
The metabolome is highly dynamic, so it reflects the actual biological state given the rapid
metabolic response to microenvironment changes [142]. This is particularly important for the
assessment of rapid and progressive diseases. In this regard, application of metabolomics is
growing rapidly covering a wide range of applications [143][135] including: disease
diagnosis, drug discovery and development, pharmacometabolomics and personalized
medicine, nutrigenomics, metabolic engineering/biotechnology and toxicology [137]. The
basis of all these applications has a common aspect; alterations in metabolism due to a
functional response of a given condition, results in an alteration in the metabolic profile,
leading a characteristic patterns, which could give new insights into the underlying biological
state [135].
In summary, metabolomics can help to elucidate different metabolic profiles that will
ultimately give information about different pathways in which a specific phenotype or
biological system is implicated. Moreover, UPLC-MS based metabolomics is a powerful tool
for biomarker discovery in hepatic EVs that, at the end, could allow the development of novel
diagnostic methods and therapies.


HYPOTHESIS AND OBJECTIVES
54
4. HYPOTHESIS AND OBJECTIVES
It is reported that hepatic EVs contain relevant enzymes involved in drug metabolism such as
CES, cytochromes P450 or UGTs. Interestingly, some of these enzymes not only can
contribute to drug metabolism but also in DILI development. Furthermore, these families of
proteins are target of autoantibodies in several autoimmune diseases, causing immune-
mediated liver injury. Based on these data, the possible role of hepatic EVs in DILI is
hypothesized. Basing on this hypothesis, hepatic EVs could constitute a powerful tool for
DILI biomarker discovery. In this regard, the first objective of this study is to characterize the
secretion of hepatic EVs in different DILI in vitro models. At the same time, their putative
role as liver injury indicators is also evaluated. With this aim, different molecular approaches
were employed such as immunostaining, Western Blot Analysis, Cryo-Electron Microscopy
(Cryo-EM), particle tracking analysis (NTA) or Raman tweezers microspectroscopy (RTM).
It is known that there are several drug metabolizing enzymes contained in hepatic EVs but,
are they active? To address this question, the second objective of this study is to analyze by
UPLC-MS technology specific enzymatic reactions. With this aim, an UPLC-MS based
enzymatic activity determination and quantification method was developed for each of the
studied enzymatic reactions. Moreover, these methods could be used to prevent DILI in a
personalized manner by measuring these enzymatic activities in circulating hepatic EVs. In
this way, an individual hepatic response could be estimated in order to determine drug optimal
dosis.
Finally, the third objective of this study is to elucidate/characterize the metabolic profile of
MLP-29 murine cell line derived EVs through UPLC-MS-based metabolomics in order to
identify pathways and functions where these vesicles are involved. Moreover, metabolomics
as a tool for biomarker discovery on hepatic EVs is evaluated since alterations in metabolism
(metabolites downregulation or upregulation) due to a functional response of a given
condition such a drug overdose, results in an alteration in the metabolic profile, leading a
characteristic pattern that could give new insights into the underlying biological state. In this
regard, the screening of biomarkers candidates contained in hepatic EVs would enable the
simultaneous profile of a large number of metabolic signatures in a given condition.
In summary, the main objectives of this thesis are:
1. To characterize the secretion of hepatic EVs in different DILI in vitro models and
evaluate their role as putative low-invasive liver injury indicators.
2. To demonstrate through UPLC-MS that hepatic EVs carry active enzymes.
3. To characterize the metabolic profile of EVs-derived from MLP-29 murine hepatic
cell line by using UPLC-MS based metabolomics in order to investigate the
pathways in which these vesicles are involved and evaluate metabolomics as a tool
for biomarker discovery in hepatic EVs.


EXPERIMENTAL PROCEDURES
56
5. EXPERIMENTAL PROCEDURES
5.1. REAGENTS AND CELL CULTURE
All chemical reagents were HPLC grade and suppliers are indicated in the specific description
of each procedure.
Next are listed antibodies employed in this doctoral thesis:
Mouse monoclonal antibodies were purchased from the indicated vendors: anti-Rab8
(clone 4/Rab 4), anti-Hsp90 (clone 68), anti-flotillin-1 (clone 18), anti-CD63 (clone
H5C6) and anti-BiP/Grp78 from BD Biosciences; anti-TSG101 (4A10) from Santa Cruz
Biotech and anti-CD81 (Eat2) from AbD Serotec.
Rabbit polyclonal antibodies were acquired from the indicated vendors: anti-LIMP II
(ab16522) and Cyp 2d1 (ab22590) from Abcam; anti-COX IV (3E11) from cell signaling
and anti- MAT1A was developed in-house.
Goat polyclonal antibodies were acquired from the indicated vendors: anti-CES (M-14)
from Santa Cruz Biotech and anti-COMT (ab51984) from Abcam.
Horseradish peroxidase (HRP)-conjugated secondary antibodies anti-mouse, rabbit, goat,
were purchased from GE Healthcare.
Cy3-conjugated secondary antibodies anti-mouse (715-165-150) and anti-goat (705-165-
147) were purchased from Jackson Immuno Reseach.
Alexa 488-conjugated secondary antibodies anti-mouse (A21202) and anti-rabbit
(A21206) were purchased from Molecular Probes.
Fluorescein isothiocyanate (FITC)-conjugated Phalloidin (P5282) employed to bind F-
actin was purchased from Sigma-Aldrich.
Cell tissue cultures employed in this work were primary rat hepatocytes and MLP29 liver-
derived murine cell line. Primary hepatocytes were obtained by perfusion of rat liver (see
procedure below). MLP29 was provided by Dr. E. Medico [144]. Suppliers of cell culture
reagents are indicated in the specific description of the procedures.
5.2. ANIMAL EXPERIMENTATION
Fourteen weeks old male Wistar rats (body weight 300-400 g), were maintained in an
environmentally controlled room at 22°C on 12 h light/dark cycle and provided with standard
diet (Rodent Maintenance Diet, Harlan Teklad Global Diet 2014) and water ad libitum. All
surgery required for primary hepatocytes preparation was performed under anaesthetic gas
Isoflurane (IsoFLO, Abbott Laboratories), and all efforts were made to minimize suffering.

EXPERIMENTAL PROCEDURES
57
For in vivo model of liver damage in RNA assay/analysis, rats received an intraperitoneal
injection of 1 g/kg/5 ml of D(+)-galactosamine hydrochloride (GalN, Sigma-Aldrich). A
control group of animals received the same volume of saline solution. Blood samples from
each animal were drawn 18 h after the injection, and the sera were transferred to fresh
Eppendorf tubes and stored at -80°C.
All animal experimentation was conducted in accordance with the Spanish Guide for the Care
and Use of Laboratory Animals, and with International Animal Care and Use Committee
Standards. All procedures were approved by the CIC bioGUNE ethical review committee
(Permit Number: P-CBG-CBBA-3610) accredited by AAALAC organizations.
5.3. CELL VIABILITY ANALYSIS
Cell viability was measured with a benchtop automated cell counter (CountessTM
, Life
technologies) that performs cell count and viability (live, dead, and total cells) measurements
using trypan blue staining. Briefly, cell sample was mixed 1:1 with trypan blue. A fraction of
10 μL of the sample mixture was then loaded into a Countess™ cell counting chamber slide.
The camera of the equipment acquires cell images from the sample on the slide and the image
analysis software automatically analyzes acquired cell images, and measures cell count and
viability based on trypan blue exclusion method. The measurement provides live and dead
cell concentration (per mL), total cell concentration (per mL) and viability (% of live cells).
5.4. IMMUNOFLUORESCENCE STAINING
Primary rat hepatocytes were seed to 50–80% confluence on glass coverslips and after
incubation at 37ºC for a period of time under indicated conditions, cells were fixed for 10 min
with 2% formaldehyde in Dulbecco‟s modified phosphate-buffered saline (DPBS, Gibco) and
then washed with DPBS. Successive incubations with primary and fluorophore-conjugated-
secondary antibodies diluted in a PBS solution containing 0.1% BSA and 0.1% saponine were
carried out for 30 min. After each incubation period, unbound antibodies were removed by
washing the coverlips in PBS. Finally, the coverslips were mounted onto glass slides on
Fluoromont G (Southern Biotechnology Associates, Birmingham, AL) containing 0.7 g/ml
4',6-diamidino-2-phenylindole (DAPI) to stain DNA (nucleus). All procedure was carried out
at room temperature. All immunostainings were analyzed in a Leica Confocal microscope
(Leica) and images were taken using a Leica confocal software.
5.5. WESTERN BLOT ANALYSIS
Cell pellets of 1 × 10⁶ cells were lysed during 15 min on ice in the presence of 150 μl of lysis
buffer (1% Triton X-100, 300 mM NaCl, 50 mM Tris-HCl, pH 7.4) before centrifugation at

EXPERIMENTAL PROCEDURES
58
14,000 × g for 5 min for clarification of the sample. The supernatant was transferred to a fresh
eppendorf tube. The protein concentration of the preparations was determined by means of a
Bradford protein assay (Bio-RadLaboratories, Inc) using bovine serum albumin (BSA) as
standard [145]. NuPAGE® LDS Sample Buffer (Life Technologies, Inc) was added to the
protein extract and incubated for 5 min at 37, 65 and 95ºC in order to prepare protein samples
for denaturing gel electrophoresis. After cooling and clarification by centrifugation, samples
were loaded and separated on 4-12% pre-casted polyacrylamide gel electrophoresis
(NuPAGE® Bis-Tris gel, Life Technologies, Inc). Once the electrophoresis was finished,
proteins were transferred to Polyvinylidene difluoride (PVDF) membrane and blocked for 1 h
(5% non-fat dry milk and 0.2% Tween-20 in DPBS). PVDF membranes were incubated 1 h
with primary antibody followed by DPBS washes and subsequently 30 min incubation with
horseradish peroxidase (HRP)-conjugated secondary antibody. Chemioluminiscence detection
of bands was performed using ECL Plus chemiluminiscent substrate (GE Healthcare,
Buckinghamshire, UK). All proteins were detected under non-reducing conditions.
Protein concentration was determined by Bradford assay (Cat. Num. 5000006, Bio-Rad
Laboratories, Inc) using bovine serum albumin as standard.
5.6. CRYO- ELECTRON MICROSCOPY (Cryo-EM)
For Cryo-EM, EVs preparations were directly adsorbed onto glow-discharged holey carbon
grids (QUANTIFOIL, Germany). Grids were blotted at 95% humidity and rapidly plunged
into liquid ethane with the aid of VITROBOT (Maastricht Instruments BV, The Netherlands).
Vitrified samples were imaged at liquid nitrogen temperature using a JEM-2200FS/CR
transmission cryo-electron microscope (JEOL, Japan) equipped with a field emission gun and
operated at an acceleration voltage of 200 kV. In cryo-EM sessions, digital images were taken
using low-dose technique by means of an ULTRASCAN 4000SP (4096 × 4096) cooled slow-
scan CCD camera (GATAN). An in-column energy filter (Omega Filter) was used to improve
the signal-to-noise ratio of these images by zero-loss filtering.
5.7. RAMAN TWEEZERS MICROSPECTROSCOPY (RTM)
These experiments were carried out at Pierre et Marie Curie University in Paris (France) in
collaboration with Sergei G. Kruglik and his group.
Raman spectra were recorded using a nearinfrared (NIR) Raman tweezers setup. In the setup,
laser excitation light at 780 nm is provided by continuous-wave Ti:Sapphire laser (Spectra
Physics, model 3900S) pumped by argon-ion laser (Spectra Physics Stabilite 2017). The
focal waist of intense laser radiation has an average power of 100 mW. The same objective is
used to collect the Raman signal in a backscattering geometry and to deliver it onto the
spectrograph (Acton SpectraPro 2500i).

EXPERIMENTAL PROCEDURES
59
Raman light is focused onto the spectrograph‟s entrance slit (semi-confocal configuration, slit
width 30-40 µm) by an achromatic lens with f=75 mm. The Raman signal is separated from
laser stray light by 2 Semrock RazorEdge long-pass filters (grade „„U‟‟). One filter, with
λlaser=780 nm, is placed normally to the optical beam just before the focusing lens; another
one, with λlaser= 830 nm, is used as a dichroic beam splitter at an angle of incidence 458: it
reflects laser light at 780 nm and transmits all the wavelengths longer 785 nm. Spectral
resolution in all Raman experiments was about 5 cm-1. A frequency calibration was
performed using Raman lines of toluene with 92 cm-1
absolute accuracy and relative
frequency position accuracy better than 91 cm-1
. Raman spectra were acquired using WinSpec
software; further data treatment was performed using Igor Pro for Windows software.
Raman spectra were acquired every 3 seconds during a sequence of 20 consecutive
measurements: this constitutes one „„experimental set‟‟. Measurements were kept going until
the event of optical trapping of at least several vesicles in the focus of the microscope
objective (so-called „„vesicle set‟‟). After this event, a few more experimental sets are
sequentially acquired for a better signal averaging. The transition from one vesicle set to
another is accomplished by blocking the laser beam for 10 seconds, the trapped particles in
the measurable volume being then exchanged by Brownian motion. The process of data
treatment consists of the following successive steps:
a) All of the recorded raw Raman spectra are visually inspected and properly selected,
to eliminate the spectra without (or with very minor) vesicles contribution, with high
background and poor quality.
b) The selected raw Raman spectra are averaged and normalized on the water-bending
band around1, 640 cm_1
.
c) The contribution from PBS is subtracted.
d) The resulting spectra are smoothed by 2 adjacent pixels, to minimize the etaloning
effect in back illuminated NIR-CCD detector.
5.8. RNA ISOLATION AND QUANTITATIVE REAL-TIME PCR (qPCR)
Selected RNAs found in EVs [70] were analyzed by quantitative polymerase chain reaction
(qPCR) in EVs of untreated or drug-treated cells. With this purpose, EVs were isolated from
tissue culture media using Exoquick as described in 5.11. Afterwards, RNA was isolated from
Exoquick-precipitated material using RNeasy Mini Kit columns (Quiagen, Inc) following the
manufacturer´s indications. RNA was eluted in 30 µl of RNase free water. The tube
containing eluted RNA, was subsequently centrifuged at 13000 rpm during 15 seconds. RNA
concentration was measured by means of Nanodrop spectrophotometer (Thermo scientific,
Inc). Subsequently, cDNA was synthesized from 10 µl of eluted RNA using the Quanta
cDNA SuperMix (Quanta bioscience, Inc). Briefly, reaction reagents (qScript cDNA
SuperMix 5X, RNA template and RNase/DNase-free water) are combined and placed into 0.2
mL microtube. After mixing by vortex, the sample was centrifuged briefly to collect

EXPERIMENTAL PROCEDURES
60
components at the bottom of the reaction tube. Then, it was subsequently incubated during 5,
30 and 5 min at 25 ºC, 42ºC and 85ºC respectively and holded at 4ºC. Samples were stored at
-20ºC if not use immediately. 1/5th to 1/10th of the cDNA synthesized was employed for
PCR amplification using Taq polymerase (Biotools B&M Labs) according to the
manufacturer‟s protocol and an iCycler thermocycler (Bio-Rad Laboratories Inc).
Next, for relative quantification of genes, qPCR was performed in duplicates using SYBR
Green PCR Master Mix (Bio-Rad Laboratories Inc) in an iCycler thermocycler. First, reaction
master mix for all qPCR reactions was prepared which contains; SYBR Green Master Mix,
forward and reverse primers and nuclease-free water. Then, equal aliquots of the master mix
were dispensed into each PCR tube. cDNA templates were then added to the qPCR tubes
which already contain reaction set up and mixed. Then, formed air bubbles were removed
from the reaction mixture and the thermal cycling protocol was programmed in iCycler
thermocycler according to manufacturer´s protocol. qPCR tubes were loaded and the qPCR
run.
Primers used for cDNA amplification were designed using Primer3 [146] and the selected
sequences are listed in the Table 2.
Table 2. List of primers used for DNA amplification
The efficiency of each set of primers was determined by serial dilution of the template cDNA.
The theoretical value obtained with the iCycler software was 100±5% (Efficiency (%) = 100X
[10(-1/slope) –1]; Bio-Rad Laboratories Inc).
Fold changes respect to untreated cells were calculated using the formula 2-Ct, where Ct =
Ct treated - Ct untreated.
5.9. RAT LIVER EXTRACT PREPARATION
Liver extract preparation was carried out following protocol described in Van-Liempd et al
2013 [147]. Liver tissue aliquots of approximately 50 mg from WT rat were lysed with a
Precellys®24 tissue homogenizer (Thermo Fisher Scientific Inc. MA, USA) using 500mg of
soft tissue homogenizing beads (CK14,Thermo scientific) in standard 2mL tubes
(Precellys,Thermo scientific). Each sample was lysed in 2 x 20 second cycles at 6000 rpm in
500 µL of 50 mM HEPES/150 mM KCl pH 8 in case of measurement of MAT activity, and
50 mM sodium phosphate buffer pH 7.4 in the case of measurement of COMT activity. All
EXPERIMENTAL PROCEDURES
61
the buffers contained 10% Glycerol. Subsequently, 400-450 µL of the resulting homogenate
was transferred to a fresh Eppendorf®
tube and centrifuged at 15,000 × g during 15 min at
4°C. Supernatant was transferred to a fresh tube and place at -80 °C for 20 min. The chilled
supernatant was stored at LN2 if not used immediately.
Protein concentration was determined by Bradford assay, using bovine serum albumin as
standard.
5.10. RAT MICROSOMES PREPARATION
For microsomes preparation, fresh or cultured rat hepatocytes were collected and centrifuged
at 800 rpm 5 min at 4°C. The obtained pellet was resuspended in 50 mM HEPES/150 mM
KCl pH 8 in the case of measurement for MAT activity and in 100 mM Tris-HCl buffer pH
7.4 in the case of measurement for COMT activity. All the buffers contained 10% Glycerol.
The suspension was transferred to a standard 2mL tube containing 500 mg of soft tissue
homogenizing beads. The solution was lysed with a Precellys®24 tissue homogenizer in 2 x
20 second cycles at 6000 rpm. The resulting homogenate (400-450µL aprox) was transferred
to Eppendorf®
tubes and centrifuged at 15,000 × g during 15 min at 4°C. Supernatant was
then ultracentrifuged at 100,000 x g during 60 min at 4°C. Resulting microsomal pellet was
solubilized in the corresponding buffer for measurements of each enzyme (MAT and COMT)
and stored at LN2 if not used immediately.
Protein concentration was determined by Bradford assay, using bovine serum albumin as
standard.
5.11. PRODUCTION AND ISOLATION OF EVs SECRETED BY PRIMARY
HEPATOCYTES
Rat hepatocytes (purity >95%) obtained from livers of 14 week old healthy Wistar male rats
were purified by two-step collagenase perfusion technique which involves sequential
perfusion of the liver with ethylenediaminetetraacetic acid (Sigma-Aldrich, St. Louis, MO,
USA) and collagenaseType I (Worthington Biochemical Corp, Lakewood, NJ) [148]. Rat
hepatocyte suspension was centrifuged at 400 rpm 3 min and plated in 24 collagen-coated
dishes (150 mm) with collagen type I from rat tail (BD Biosciences, San Jose, CA) at 20
million cells per dish. Cells were cultured in complete Dulbecco‟s modified eagle medium
(DMEM, Gibco, Life technologies, Heidelberg, Germany) supplemented with 10% (v/v) fetal
bovine serum (Gibco), streptomycin (0.1 mg/L, Lonza, Walkersville, MD, USA), penicillin
(100 u/mL, Lonza) and amphotericin-B (0,25 µg/mL, Lonza) for 4 h at 37°C and 5% CO2.
Then, cells were washed twice with DPBS and incubated for 36h in complete DMEM
containing 25 mM HEPES and previously depleted from contaminating vesicles by overnight
centrifugation at 100,000 × g, 4°C. For drug treatments the 24 collagen-coated dishes were
divided in 4 groups (6 dishes each group) and incubated individually with no additives,

EXPERIMENTAL PROCEDURES
62
diclofenac Sodium (400 µM, Sigma-Aldrich), acetaminophen (10mM, Sigma-Aldrich), or D-
galactosamine (10mM, Sigma-Aldrich). After 36h incubation, media was collected and EVs
isolated. In all cases, the 36 h-conditioned medium was centrifuged at 500 × g during 10 min
and the resultant supernatant was filtrated through a 0.22 μm pore size filter system (Corning,
NY USA) to remove large debris while keeping small membranes (under 220 μm) for further
purification by ultracentrifugation. This step ensures a high enrichment of the preparation on
small EVs. Filtrated supernatant was transferred to 50 mL centrifuge polycarbonate tubes
(Beckman Coulter Inc, Brea, California) and ultracentrifuged 30 min at 10,000 × g 4°C to
remove remaining cell debris. The resultant supernatant was transferred to a fresh tube and
centrifuged at 100,000 × g 4°C during 75 min to pellet EVs. To eliminate contaminating
proteins, the supernatant was completely removed, pellets resuspended in 1 mL of DPBS and
pooled in a single centrifuge tube. More DPBS is added to fill 50 mL and ultracentrifuged at
100,000 × g 4°C during 75 min. Supernatants were removed and pelleted EVs resuspended in
50 mM sodium phosphate buffer pH 7.4 in the case of measurements of COMT activity, in 50
mM HEPES/150 mM KCl pH 8 in the case of measurements of MAT or PBS for any other
use. In the case of EVs destined to enzymatic measurements buffers contained 10% glycerol.
Finally, EVs suspensions were split in aliquots to avoid repeated cycles of freezing and
thawing. If not used immediately aliquots were frozen at -80ºC or liquid nitrogen in the case
of preparations destined to enzymatic measurements.
For the analysis of RNAs present in hepatic EVs, the vesicles were isolated using Exoquick
(SBI System Biosciences). After the filtration (0.22 μm) step of the conditioned media, 1 mL
aliquots were collected and centrifuge at 3,000 × g for 30 min. Supernatant was then
transferred to a sterile tube and Exoquick reagent was mixed 1:1 with the media.
Subsequently, the mixture solution was incubated at 4°C overnight and centrifuged at 1,500 x
g for 30 min. After centrifugation, supernatant was aspirated and residual ExoQuick solution
spined down by centrifugation at 1500 × g for 5 min. Finally, the pellets containing EVs were
resuspended in 1/10 of original volume using PBS.
5.12. PRODUCTION AND ISOLATION OF EVs SECRETED BY MLP-29
MURINE CELL LINE
MLP-29 cells were seeded at 15-30 million cells per dish into 150 mm dishes. Cells were
cultured with complete DMEM [10% (v/v) Fetal Bovine Serum, Streptomycin (0.1 mg/L),
Penicillin (100 u/mL) and Amphotericin-B (0,25 µg/mL)] for 24 h at 37°C and 5% CO2. Cells
were then washed twice with DPBS and incubated in complete DMEM medium containing 25
mM HEPES previously depleted from contaminating vesicles by overnight centrifugation at
100,000 × g, 4°C. After 72h incubation, media was collected, and EVs isolated by differential
ultracentrifugation as described previously for primary hepatocytes [149]. EVs were
suspended in DPBS to between 1/700th and 1/2,000th the original volume of media,
aliquoted, and stored at -80°C if not used immediately.
EXPERIMENTAL PROCEDURES
63
As controls for the experiments destined to the metabolic profiling of hepatic EVs, the same
number of dishes of 150 mm of diameter without cells but containing the same medium
(complete DMEM-25mM HEPES exosome-depleted) were incubated in same conditions
(incubation time, CO2 and 37ºC) than the dishes containing cells. After the incubation period,
the media was collected and processed as previously described for the EVs preparation
containing cells.
5.13. FRACTIONATION OF EVs ONA CONTINUOUS SUCROSE DENSITY
GRADIENT
For some experiments, EVs were obtained from rat hepatocytes treated with hepatotoxic
drugs (10mM APAP, 10mM GalN and 400µM DCF) and fractionated in a sucrose density
gradient [149]. Briefly, in a tube suitable for ultracentrifugation (Beckman centrifuge tube
tube, Cat. No. 344059, SW40 Ti rotor), 6 ml of 0.25 M sucrose solution (20mM HEPES, 0.25
M protease-free sucrose, pH 7.4) were poured on top of 6 ml of a 2 M sucrose solution
(20mM HEPES, 2 M protease-free sucrose, pH 7.4). Subsequently, a continuous 0.25-2 M
sucrose gradient was slowly performed by means of a gradient maker device (Gradient
Master, Biocomp Instruments, Inc). Once the gradient was pre-formed, EVs prepared by
differential ultracentrifugation (see section 5.11) was poured carefully on top of the gradient
and ultracentrifuged overnight (16 h) at 210,000 × g, 4°C, in a SW40 Ti swinging bucket
rotor. Then 1 mL fractions were collected from top to bottom by using autodensity-flow
gradient fractionator (Labconco, Kansas City, MO, USA). Subsequently, each fraction was
diluted in 2 mL of 20 mM HEPES (pH 7.4), placed into a polycarbonate thick wall tube (Cat
No 362305, Beckman Counter) and ultracentrifuged during 1 h at 110 000 × g, 4°C, in a
TLA-110 rotor. Finally, supernatants were aspirated and the pellets were resuspended in 25
μL of PBS and frozen at −80°C if not use immediately. Additionally, 10 μL of each fraction
were used for measurement of the refractive index by means of a refractometer (Abbe 2WAJ,
PCE Americas, Inc) to obtain the density value.
5.14. NANOPARTICLES TRACKING ANALYSIS (NTA)
Size distribution and concentration within EVs preparations were analyzed using a NanoSight
LM10 system (NanoSight, Amesbury, U.K.), which is equipped with a fast video capture and
particle-tracking software. In this system, vesicles are visualized by light scattering using a
light microscope NTA software tracks the brownian motion of individual vesicles and
calculates their size and total concentration.
NTA postacquisition settings were kept constant for all samples, and each video was analyzed
to give the median vesicle size, and an estimate of the concentration [150].

EXPERIMENTAL PROCEDURES
64
5.15. DETERMINATION OF CES ACTIVITY BY USING A FLUOTOMETRIC
ASSAY
Fluorometric assay was performed using the protocol followed by Stacey L et al, 2006 [151].
Fluorescein formation was measured using a spectrofluorometer (SPECTRAmax Gemini
plate reader; Molecular Devices Corp, Sunnyvale, CA) at excitation and emission set at 490
and 520 nM, respectively. Experiment was conducted in 96-well flat bottom plates in a final
volume of 200 µl, containing 198 µl of potassium phosphate buffer (0.1 M, pH 7.4) and 1 µl
of EVs sample. The plates were preincubated at 37°C in a fluorometer for 3 min. Reaction
was initiated by adding 1 µl of the fluorogenic substrate (fluorescein diacetate) at a final
concentration of 100 µM . The reaction product (fluorescein) was measured for 10 min at 60
second intervals.
5.16. MEASUREMENTS OF MAT AND COMT ACTIVITIES BY UPLC-MS
5.16.1. INCUBATION CONDITIONS
Previous to COMT and MAT enzymatic activity evaluation, incubation conditions of the
enzymatic reaction had to be optimised. This involves the use of cofactors as well as the
adjustment of different parameters such as pH, temperature or incubation time of the reaction
mixture. It also has to be taken into consideration other factors such as the stability of the
compounds that take part in the reaction.
The enzymatic reactions were studied in samples from different origin (Figure 7): Frozen rat
liver extract, microsomes coming from non-cultured rat hepatocytes (Microsomes t0),
microsomes coming from untreated rat hepatocytes cultured for 36 h (Microsomes t36) and rat
hepatocytes cultured for 36 h treated with 400 µM diclofenac in the case of COMT activity
and also treated with 10 mM acetaminophen and 10 mM galactosamine in the case of MAT
activity.

EXPERIMENTAL PROCEDURES
65
Figure 7. Experimental design to perform the stydy of the enzymatic activities. This figure shown liver
extract, microsomes and EVs obtention procedures carried out to study the enzymatic activities carboxylesterase
(CES), methyl-adenosyl-transferase (MAT) of cathecol-O-methyl transferase (COMT).
Incubation conditions for MAT activity
Enzymatic assays after optimization was carried out in a final volume of 250 µL of 50 mM
HEPES/ 150 mM KCl pH 8 incubation buffer containing; enzyme provider (liver extract,
microsomes or EVs), 5 mM L-Methionine, 10 mM MgCl2, 5 mM DTT, 5 mM ATP and
protease inhibitor. The reaction mixture was incubated for 2 h in a water bath at 37°C.
Standard stock solutions of L-Methionine (10 mM), ATP (25 mM), protease inhibitor
(1x10000) and Dithiothreitol (DTT, 1M) were prepared in incubation buffer and MgCl2 (1000
mM) in water.
Controls-. Not incubated samples were prepared in parallel
Incubation conditions for COMT activity
Enzymatic assay after optimization was carried out in final volume of 300 µL of 50 mM
sodium phosphate buffer pH 7.4, 2 mM MgCl2 and 200 μM SAMe (Abbott S.r.l, Campoverde,
Italy) without or with 2 mM DA (Sigma-Aldrich) or 0.1 mM NE (Sigma-Aldrich). Reaction

EXPERIMENTAL PROCEDURES
66
mixture was incubated for 1 h at 37°C in a water bath. Standard stock solutions of DA and NE
(10 mM) were prepared in incubation buffer and MgCl2 (1000 mM) in water.
Controls-. Three different types of controls were run with each experiment: (a) DA (2 mM) or
NE (0.1 mM) in 50 mM sodium phosphate buffer pH 7.4, (b) Rat liver extract/ Microsomes/
EVs incubated in 50 mM sodium phosphate buffer pH 7.4,and (c) Rat liver extract/
Microsomes/ EVs incubated with DA (2 mM) or NE (0.1 mM) in absence of SAMe and
MgCl2.
COMT and MAT enzymatic reactions were then stopped by the addition of 1 mL of MeCN/
Water (75/25; v/v%). Then, samples were vortex-mixed for 30 min (4°C) and centrifuged at
15,000 × g for 30 min (4°C) to precipitate the proteins. Subsequently, the supernatant (1.1
mL) was reduced to dryness with a speedvac (miVac concentrator, Genevac SP Scientific,
USA) and samples reconstituted in 1 mL of ammonium phosphate 10 mM in the case of
COMT activity, and in 1 mL of ammonium sulphate 0.01M in the case of MAT activity.
Finally they were transferred to solid-phase extraction (SPE) cartridges to clean the samples
before injected in the UPLC-MS system. Given the different chemical nature of the analyzed
compounds, different SPE method was employed for each activity assay. As described below,
a SPE Oasis weak cation exchange (WCX) cartridges in the case of COMT activity and Bond
Elute cartridges containing 100 mg of Phenylboronic acid (PBA) in the case of MAT activity
were employed.
5.16.2. SOLID-PHASE EXTRACTION (SPE)
SPE was used to process the samples prior to UPLC–MS analysis. The presence of
interferences in the original sample matrix can result in instrument downtime due to a buildup
of contamination with each injection [152]. In addition, when a saline solution is injected, the
formation of the analyte ion could be suppressed by interferences in the sample matrix and the
signal strength could be greatly diminished. If the interferences are removed as part of the
sample preparation, then the analytes of interest could be analyzed with a more robust
method. In this regard, protein precipitation is the most widely employed preparation
technique in enzymatic assays, coupled to UPLC-MS. However, it was not enough since
deposit of salts were found in the ion source and cone of the mass spectrometer that was
translated in decreased sensitivity. Therefore, it was necessary to perform an “extra-clean”
step of the samples prior to their injection into UPLC-MS system using SPE in addition to
PPT method.
SPE is a sample preparation technology that uses solid particles and chromatographic packing
material contained in a cartridge to chromatographically separate the different components of
a sample [152]. The first step to develop a SPE method is based on the analytes chemical
characteristics. Then, chromatography and SPE strategy can be chosen.

EXPERIMENTAL PROCEDURES
67
The general SPE procedure has to provide sample extracts not only free of interfering matrix
components but also concentrated enough for analytes detection. The protocol consisted of 5-
step including conditioning, equilibration, sample loading, washing and eluting the compound
of interest [153]. A vacuum manifold system (20 pos, 13x75 mm tubes, Waters Corp.,
Manchester, UK) was used to house the cartridges.
Analyte Recovery-. The recovery (or extraction efficiency of SPE method) was determined by
measuring the response of blank matrix (rat liver extract) spiking analytes before SPE (pre-
spiked samples) (Figure 8B) and after SPE (post-spiked samples) (Figure 8C). Non-spiked
samples were also prepared (rat liver extract in buffer). The recovery was calculated as
follows:
%R Recovery (%) = ratRRat liver extract spiked with the analyte of interest before SPE (Pre-spiked sample)
Rat liver extract spiked before UPLC-MS (Post-spiked sample)
The recovery value must be > 50% to be in acceptable range for routine UPLC-MS analysis
[154].
Bond Elut cartridges containing 100 mg phenylboronic acid (PBA) bonded silica from
Agilent Technologies (Santa Clara, CA, USA) and Oasis WCX Solid-Phase Extraction from
Waters Corporation (Milford, USA) was used for MAT and COMT enzymatic assays
respectively.
After incubation period, resulting supernatants were reduced to dryness with a speedvac and
reconstituted in appropriate solution depending on the SPE procedure employed for each
enzymatic assay. Samples were then transferred to the corresponding SPE cartridges and run
through them. The cartridges were then subsequently washed and analytes eluted and
evaporated using a speedvac centrifuge. Finally, residues were reconstituted in mobile phase
and transferred to an autosampler vial for injection in the UPLC-MS system. A total volume
of 2 µL was injected into the UPLC-MS system.

EXPERIMENTAL PROCEDURES
68
Figure 8. Preparation of standard and test samples for evaluation of Solid phase extraction method
recovery. (A) Analytes in solution (B) Analytes spiked in matrix before SPE and (C) Analytes spiked in matrix
after SPE
5.16.3. CALIBRATION CURVE AND QUALITY CONTROLS
For quantification of products related with the enzymatic reactions, a matrix-spiked
calibration curves were obtained for each assay.
In the case of MAT enzymatic assay, standard stock solutions of the enzymatic components,
10 mM SAMe (Abbort S.r.l, Campoverde, Italy) and 10 mM SAH (Abbort S.r.l, Campoverde,
Italy), were prepared in formic acid 0.1 % and 10 mM MTA (Sigma-Aldrich; St. Louis, MO,
USA) in MeCN/Water/Formic Acid (75/23.8/1.2; v/v/v%). Working solutions were prepared
by appropriate dilution in mobile phase (Acetonitrile (ACN)/ Water/ Formic acid
(60/39.9/0.1; v/v/v %)). For the calibration curve different concentrations of these compounds
were used: 0.005, 0.01, 0.05, 0.1, 0.25, 0.5, 1, 2.5, 5, 10, 25 and 100 µM. Three non-spiked
samples were used to calculate a baseline signal for the analytes. For quality controls (QCs)
two concentrations were used, 1 and 10 µM. Calibration samples (non-spiked and spiked
samples) were individually prepared in 50 mM HEPES/150 mM KCl buffer pH 8 containing
5 mM ATP, 5 mM Met, 5 mM MgCl2, protease inhibitor and 0.25 mg of protein (rat liver
extract). After adding 1 mL of MeCN/Water/Formic Acid (75/23.8/1.2; v/v/v%) to stop the
reaction, samples were vortex-mixed for 30 min (4°C) and centrifuged at 15,000 × g for 30
min (4°C) to precipitate the protein. To evaporate the organic solvent, the supernatant (1.1
Matrix

EXPERIMENTAL PROCEDURES
69
mL) was reduced to dryness with a speedvac centrifuge. Then, the residues were reconstituted
in 1 ml of (NH4)2SO4 0.01 M at pH 7.5 and transferred to SPE-PBA cartridges.
In the case of COMT enzymatic assay, standard stock solutions of the enzymatic products
(10 mM 3-MT and 10 mM NMN) were prepared in Acetonitrile (MeCN)/ Water/ Formic acid
(60/39.9/0.1; v/v/v %). For the calibration curve different concentrations were used: 0.005,
0.01, 0.05, 0.1, 0.25, 0.5, 1, 2.5, 5, 10 and 25 µM. Two non-spiked samples were used to
calculate a baseline signal for the analytes. For Quality Controls (QCs), two concentrations
were used, 1 and 10 µM. Calibration samples (non-spiked and spiked samples) were prepared
individually in 300 µL 50 mM sodium phosphate buffer pH 7.4 containing 0.25 mg of protein
(from rat liver extract) and 2 mM MgCl2. Subsequently, 1 mL of MeCN/Water (75/25; v/v%)
was added to the mixture reaction and then vortex-mixed for 30 min (4°C) and centrifuged at
15,000 × g for 30 min (4°C) to precipitate the protein. To evaporate the organic solvent, the
supernatant (1.1 mL) was reduced to dryness with a Speedvac centrifuge). Then, the residues
were reconstituted in 1 mL of 1% ammonium phosphate 10 mM (aprox. pH 7.4) and
transferred to SPE cartridges.
5.16.4. LIQUID CHROMATOGRAPHY AND MASS SPECTROMETRY (UPLC-
MS) CONDITIONS
UPLC conditions
The substrates and products of the reactions were measured and chromatographically
separated with an ACQUITY UPLC system (Waters Corp, Milford, USA). The system was
equipped with two binary solvent pumps, a cooled autosampler (4°C) with a 10 μL injection
loop and a column oven (40°C). An Acquity UPLC BEH AMIDE column, 1.7 µm (Waters
Corp.) was used for separation of the analytes. Samples were injected (Vload 2 μL; partial loop
fill mode) from deactivated total vials (Waters Corp.). A gradient was used to separate the
analytes; solvent A consisted of 99.5% water, 0.5% formic acid and 20 mM ammonium
formate while solvent B consisted of 29.5% water, 70% MeCN, 0.5% formic acid and 1 mM
ammonium formate. The gradient was as follows: from 5% A to 50% A in 2.4 min in curved
gradient #8, from 50% A to 99.9% A in 0.2 min, constant at 99.9% A for 1.6 min, back to
05% A in 0.3 min and constant at 5% A for 0.5 min. The flow rate was 0.25 mL/min.
MS conditions
A SYNAPT HDMS G2 Time of Flight (ToF) mass spectrometer (Waters Corp.) was used for
the detection of the analytes. The ToF was operated in positive electrospray ionization mode
(ESI+). The following source parameters were used for the analysis: capillary voltage 25 V,
sample cone voltage 25 V, extraction cone voltage 5 V, desolvation temperature 450°C,
source temperature 120°C, cone gas flow 5 L/h and desolvation gas flow 600 L/h. Ion optics
were tuned to a resolution of 22.000 (FWHM) for m/z 556. In order to guarantee mass
accuracy, leucine-enkefaline solution (2 μg/mL in MeCN/Water (50/50; v/v %) and 0.1%

EXPERIMENTAL PROCEDURES
70
formic acid) was infused into the source via a second ESI probe at 10 µL/min and used as a
lock mass. Every 30s a lock mass was recorded for 0.5 s. Analyte spectra were automatically
corrected for fluctuations in the lock mass.
Initially, to develop the UPLC-MS method ToF (in the MS), it was operated in Full Scan
Mode (50-1200 Da) with a 0.2 s scan time. Then, in order to reach an optimized lower Limit
of Detection (LLOD) for 3-MT/NMN and SAH/MTA in the case of COMT and MAT
enzymatic activities respectively, the ToF was operated in Enhanced Duty Cycle (EDC)
mode. In EDC mode, the expulsion of ion bunches from the transfer T-WaveTM
collision cell
and the pusher of the ToF analyzer were synchronized so that the duty cycle is optimal for a
given m/z. 3-MT, NMN, SAH and MTA were measured in a scan function optimized for m/z
151, m/z 166, m/z 385 and m/z 298 respectively. The scan rate for these scan functions was
0.2 s.
5.16.5. ANALYTICAL METHOD
After sample cleaning and prior to data analysis, several parameters of the method were
determined to establish the sensitivity and specificity of the developed enzymatic activities.
Specificity
This parameter measures the ability of the method to detect potential interferences and
differentiate and quantitate the analyte in the presence of other endogenous constituents in the
sample. If any inspecificity is present, it will interfere in the detection and quantification of
the analyte of interest.
The specificity of the method was determined by the retention time, accurate mass (3 decimal
places) and isotope patterns of the analytes. The latter two are indicative of the elemental
composition of the analyte. Theoretical values for both, accurate mass and isotope pattern,
were calculated with MassLynx software. In order to obtain the proper retention times, blank
matrix was spiked with analytes. The retention times of those intensities that increased in the
mass window of the theoretical mass were taken as the retention times of the analytes. After
comparing theoretical masses and measured masses, the mass error was around 1 mDa that
provides the necessary specificity.
Linearity of calibration curves and Lower Limit of Quantification (LLOQ)
As the majority of instrumental methods of analysis, chromatography is not an absolute, but
a relative technique. The response for a sample component must be compared with the
response of a suitable reference (for example with a substance that closely resembles the
sample) and with a known amount of the analyte. Usually, the comparison is based on a
calibration curve extending over a concentration range corresponding to the variation of the
analyte content in the samples. Once the calibration curve has been constructed, the
concentration of an unknown sample can easily be extrapolated [155].

EXPERIMENTAL PROCEDURES
71
To calculate the absolute amount of formed product, the average of the baseline signals was
subtracted from the signals of the serially diluted calibration samples. The calibration curve
was obtained over the concentration of a variable range specific of each enzyme.
Power-fit function was used to determine the relation between the signal (peak area) and
sample concentration. [signal] = a*[concentration]^b) where a and b are determined by linear
regression of the log-transformed values of the concentrations and their associated signals. It
gives the least deviation from the theoretical values, especially at low concentrations. Once
the sample concentrations were calculated they were converted to amount of product (nmol)
obtained per mg of protein employed in 1 h incubation.
The sensitivity expressed as LLOQ was defined as the lowest quantifiable concentration on
the calibration curve with an acceptable accuracy ( ±15%) and a precision below 15% [156].
The deviation from theoretical curve concentration for the LLOQ level should not be more
than 20%.
Precision and Accuracy
These parameters are indispensable criteria in the assessment of an analytical method.
Monitoring QC during sample analysis is essential to ensure the validity of reported results.
The accuracy and precision of the method were assessed by determining QC samples at two
concentration levels.
Precision was assessed by the relative standard deviation of the analytes (%CV) for either
high or low QC samples;
%CV=100*SD/average
Accuracy was calculated by determining the %deviation of the theoretical values at the QC
levels:
%dev=100*((calculated concentration)-(theoretical concentration))/(theoretical
concentration))
5.16.6. DATA ANALYSIS OF UPLC-MS RESULTS PROVIDED BY MAT AND
COMT ACTIVITY ASSAYS
After samples injection in UPLC-MS system, MAT and COMT activities were determined as
follows.
Extracted ion traces were obtained for 3-MT (m/z 151.0759), NMN (m/z 166.0868), SAH (m/z
385.1294) and MTA (m/z 298.0974) with a 20 mDa window and subsequently smoothed (2
points, 2 iterations) and integrated with QuanLynx software (Waters Corp.).
Then, to calculate the absolute amount of the products, the average of the baseline signals was
subtracted from the signals of the serially diluted calibration samples. Subsequently, Power-fit
function ([Signal] = a x [concentration]b) where a and b are the fitted constants) was used to

EXPERIMENTAL PROCEDURES
72
determine the relation between the signal (peak area) and sample concentration. Once the
sample concentrations were calculated they were converted to amount (nmol) of product
formed per mg of protein employed in 1 h incubation. The amount of products detected in the
controls was subtracted from the total amount of product obtained in incubated samples.
5.17. METABOLIC PROFILING OF HEPATIC EVs BY UPLC-MS
METABOLOMICS
5.17.1. SELECTION OF METABOLITES EXTRACTION METHOD
Due to the limiting amount of EVs samples, the experiments to select an optimal metabolites
extraction method were performed only with cell extracts. Three extraction methods were
tested. Each pellet of cells was suspended in a final volume of 500 µl of a variable solvent
that depends on the selected extraction method:
- 500 µl MeOH/H2O (50% v/v)
- 250 µl MeOH/H2O (50% v/v) + 250 µl Chloroform (“Biphasic method”)
- 500 µl Isopropanol
Twelve cell pellets were mixed and split again into three groups (4 aliquots x 3 extraction
methods). Mixtures were vortex for 10 seconds and subsequently sonicated during 15 min on
ice. The resulting homogenate was then agitated at 1400 rpm for 30 min, 4°C and
subsequently centrifuged at 13,000 rpm for 15 min, 4°C. After centrifugation, 400 µl of the
supernatant was collected and placed at -80 °C for 20 min. In the case of
MeOH/H2O/Chroroform (50:50:50, v/v/v) extraction method, two phases were formed (of
200 µl each) which were collected to independent Eppendorf tubes and placed at -80 °C for
20 min. Organic solvent was then evaporated by centrifugation in a speedvac 2 h at 4ºC.
Finally, the obtained pellet was solubilized in 200 µl of mobile phase (ACN)/ Water/ Formic
acid (60/39.9/0.1; v/v/v %)). A total volume of 2 µl was injected into the UPLC-MS system.
5.17.2. BIPHASIC METABOLIC EXTRACTION OF CELLS AND EVs
Five preparations of 100 µl each containing EVs (140 µg) were prepared from MLP29 cells
and used to obtain the metabolome of hepatic EVs. In parallel, three cells suspension of 100
µl each of them, containing 1 million of cells were employed for the characterization of the
metabolic profile of the cells.
In addition, control samples obtained from tissue culture media incubated in the absence of
cells under same conditions and subjected to same EV isolation procedure, were employed to
remove contaminant metabolic signals rising for the media [157].
The extraction method employed for metabolites extraction was MeOH/H2O/Chloroform
(50:50:50, v/v/v) as indicated above. Briefly, 400 µl of MeOH/H2O (50:50) was added to each

EXPERIMENTAL PROCEDURES
73
aliquot to reach a final volume of 500 µl. Then, 500 µL of Chloroform was added and the
resultant mixture was vortex for 10 seconds and sonicated during 15 min on ice. The resulting
homogenate was then agitated at 1,400 rpm for 30 min, 4°C and subsequently centrifuged at
13,000 rpm for 15 min at 4°C. After centrifugation, supernatant was collected and the two
layers formed (aqueous and organic layer) were collected in independent Eppendorf tubes and
placed at -80 °C for 20 min. Organic solvent was then evaporated by centrifugation under
vacuum conditions by 2 h at 4ºC. Finally, the obtained pellet was suspended in 100 µl of
mobile phase (ACN/ Water/ Formic acid (60/39.9/0.1; v/v/v %)) and injected into the UPLC-
MS system.
5.17.3. ULTRA PERFORMANCE LIQUID CHROMATOGRAPHY – MASS
SPECTROMETRY CONDITIONS
UPLC conditions
Extracted metabolites were measured with a UPLC system (Acquity, Waters, Manchester)
coupled to a Time of Flight mass spectrometer (ToF- MS, SYNAPT G2, Waters Corp.). Two
different types of chromatography were used to separate different classes of metabolites.
First the samples were injected on an AMIDE column in order to separate polar metabolites
and subsequently on a C18 to separate apolar metabolites. A 2.1 mm x 100 mm, 1.7 µm BEH
AMIDE column (Waters), thermostated at 40 °C, was used to separate the analytes. Solvent A
(aqueous phase) consisted of 99.5% water, 0.5% formic acid and 20 mM ammonium formate
while solvent B (organic phase) consisted of 99% acetonitrile, 0.5% water and 0.5% formic
acid. The gradient was as follows: from 0.1% A to 50% A in 8 min in convex gradient ( #8),
from 50 %A to 99.9 %A in a linear gradient (#6) of 0.2 min, constant at 99 %A for 1.20 min
and back to 0.1 %A in 0.2 min to equilibrate. The flow rate was 250 µL/min and the injection
volume was 5 µL.
The samples were also separated on a 1 mm x 100 mm, 1.7 µm BEH C18 UPLC column,
thermostated at 40 °C. Solvent A (aqueous phase) consisted of 99.9% water, 0.1% formic acid
while solvent B (organic phase) consisted of 99.8 % ACN, 0.1% water and 0.1% formic acid.
The gradient was as follows: from 95 %A to 1 %A in 8 min in a linear gradient (#6), constant
at 1 %A for 1.4 min and back to 95 %A in 0.2 min to equilibrate. The flow rate was 140 µL/
min and the injection volume was 5 µL.
Injection sequences consisted of test mixes, extraction controls, initialization runs,
randomized sample sequences and QCs. First, the UPLC and MS performance was evaluated
by injecting a test mix of known composition. Then, the extraction control samples were
injected. Next, the column was equilibrated by injecting liver extract samples. After
equilibration, the randomized sample sets were injected. After each 5 samples a QC sample
was injected in order to check the stability of the system.

EXPERIMENTAL PROCEDURES
74
MS conditions
The mass spectrometer was operated in both ESI+ and ESI- modes with capillary voltages of
respectively 250 V and 500 V for both types of chromatography. Thus, two consecutive runs
(positive and negative polarity) had to be performed on both columns (amide and C18). The
settings described next, were the same for all polarities and chromatographies. The extraction
cone voltage was 5 V and sampling cone voltage was 25 V. Source temperature was 120 ºC
while capillary temperature was 450 ºC. Two scan functions were used; one for low collision
energy (4 V) and one for high collision energy (30 V). Samples were measured in full scan
mode from 50 to 1,200 Da. Polar and apolar sets were first measured in ESI+ mode and
subsequently in ESI- mode.
5.17.4. DATA PROCESSING, MULTIVARIATE ANALYSIS AND METABOLITE
IDENTIFICATION
All data was processed using the MarkerLynx application manager for MassLynx 4.1
software (Waters Corp., Milford, USA), which is a post-adquisition processing package that
can be applied to MS data files. A list of chromatographic peak areas for the metabolites
detected in each sample injection was generated. Both polarities and chromatographies were
separately analyzed. The UPLC-MS data were peak-detected and noise reduced such that only
true analytical peaks were further processed by the software. A list of intensities
(chromatographic peak areas) of the peaks detected was then generated, using the RT-mz
(retention time and m/z) data pairs as identifiers in a mass window of 0.02 Da and a RT
window of 0.05 min.
After data processing, the RT-mz signals were subjected to Principal components analysis
(PCA) to determine metabolic profile differences between cells and EVs. In the PCA, the first
two principal components (t[1] and t[2]) are plotted, representing the most important
metabolic variation in the samples captured by the analysis. The final dataset was mean
centered and log-transformed during multivariate data analysis. Selected peaks were
tentatively identified by using the corresponding exact molecular mass and MS data for
searching in the databases Metlin (https://metlin.scripps.edu/index.php) and HMDB
(http://www.hmdb.ca).


RESULTS AND DISCUSSION
76
6. RESULTS AND DISCUSSION
6.1 RAT HEPATOCYTES IN MODELS OF DILI
Different hepatotoxic agents are frequently used as model substances to induce liver injury in
animals. Nevertheless, due to scientific, ethical and also economical reasons, there is a high
tendency to replace animal models by appropriate alternative methods. Isolated primary
hepatocytes fulfill these requirements and they could be useful in vitro DILI model [158].
This model allows evaluating the injury induced by different hepatotoxicants, such as
acetaminophen (APAP), galactosamine (GalN) or diclofenac (DCF) using different molecular
and biochemical approaches [20]. Hepatocytes cultured on collagen-coated dishes de-
differentiate within 72h period [159][160]. Taking this into consideration, the incubation
period of the primary hepatocytes was established in 36 h in order to have enough hepatic
secreted EVs for their detection and analysis. Based on published works, the concentrations of
drugs employed in this study were 10mM for APAP and GalN [161] [21] and 400µM in the
case of DCF [162]. Using these conditions, several cellular parameters were evaluated.
6.1.1. CELL VIABILITY
Cell viability after treatment with APAP, GalN and DCF hepatotoxicants was determined by
trypan-blue exclusion method. Then, the obtained values were normalized to the control
(untreated), that corresponds with 100% of viability. A slightly decrease in the cell viability in
all treatments was observed. After treatments, cell viability ranged from 84 to 95% (Figure
9), being this effect consistent in the 10 independent experiments examined (Figure 10). This
small reduction in the viability, indicates that no dramatic cell death was observed under
conditions used for this study.
Figure 9. Cellular viability analysis of rat hepatocytes exposed to liver-damaging drugs. Cell viability of
primary rat hepatocyte was evaluated by trypan-blue exclusion method after cultured during 36h in the presence
of APAP (10 mM), GalN (10 mM) or DCF (400µM). Error bars represent standard error (n = 10), ** denotes
p<0.01 with respect to the control.

RESULTS AND DISCUSSION
77
Figure 10. Reproducibility analysis of cellular viability in independent rat hepatocytes preparations. .
Primary rat hepatocytes (RH) were incubated during 36 hours in the presence of the hepatotoxic compounds and
cell viability was determined by trypan-blue exclusion method. Note the reproducibility in terms of cell viability
among all preparations.
6.1.2. CELL MORPHOLOGY
In agreement with the low effect on cell viability under assayed conditions, the number of
attached cells remains very similar in all APAP, GalN and DCF treatments as can be observed
in the inmunofluorecence analysis (Figure 11). The effect of the different treatments on the
hepatocyte morphology was studied by examining sub-cellular localization of different
proteins by confocal microscopy (Figure 11).
To evaluate the effect on the morphology of the cells it was firstly studied the cytoskeleton by
staining F-actin with fluorescently labelled phalloidin. As it can be observed, there were no
significant morphological alterations in cells treated with the different hepatotoxicants
compared to untreated hepatocytes. In particular, a slightly increase in the fluorescence
intensity was observed in DCF-treated hepatocytes, indicating changes in the amount of F-
actin (Figure 11, Panel A).
It was also evaluated the effect on the intracellular distribution of enzymes that have been
described to be present in hepatic EVs [69], such as Ces1d, P450 2d1, MAT and COMT. In
the case of the drug-metabolizing enzyme Ces1d, there was no significant alteration neither in
their abundance or intracellular cytosolic localization (Figure 11, Panel B).
Which regards to cytochrome P450 2d1 (rat ortholog of human P450 2D6), which takes part
in the metabolism of APAP [163], GalN [95] and DCF [164], the cellular staining was mostly
associated to plasma membrane. In this case, as occur with Ces1d, there was no significant
alteration neither in localization or intracellular abundance after treatment with the
hepatotoxicants (Figure 11, Panel C).

RESULTS AND DISCUSSION
78
COMT, which is involved in the elimination of biologically active or toxic catechols and
some other hydroxylated metabolites, presents a marked membrane distribution in both,
untreated and treated hepatocytes. In this case, an increase in the intracellular content of this
enzyme was observed in APAP and GalN-treated hepatocytes respect to the control (Figure
11, Panel D).
Finally, MAT enzyme is involved in the regulation of the central metabolite S-
adenosylmethionine (SAMe). Its distribution was mostly cytoplasmic although a marked
membrane localization in APAP-treated hepatocytes was clearly observed (Figure 11, Panel
E).
Next, the effect of the different treatments on intracellular localization of proteins that are
considered markers of EVs such as Cd81 and LIMP II proteins was evaluated. In the case of
Cd81, untreated cells showed both, plasma membrane and intracellular vesicular localization.
However, in cells treated with APAP and GalN, Cd81 was localized mostly in the plasma
membrane losing its intracellular vesicular pattern (Figure 11, Panel F). On the other hand,
LIMP II was preferentially localized in intracellular vesicles in all the cases, although the
distribution of the vesicles was more perinuclear in untreated cells than in the treated
hepatocytes. In this case, it was also possible to appreciate that the abundance of the protein in
APAP and GalN-treated hepatocytes was reduced compared to untreated or DCF-treated cells
(Figure 11, Panel G).
All these results show that liver-damaging compounds have different effects on the abundance
and/or in the intracellular distribution of different proteins. This indicates that different
responses are carried out in hepatocytes depending on the induced liver damage.
Panel A: F-Actin
Figure 11. Confocal analysis of primary rat hepatocytes in DILI conditions. Untreated- or cells-treated with
the hepatotoxins during 36 hours were formaldehyde-fixed and processed to analyze indicate markers. The
images were captured by confocal microscopy under similar conditions. Scale bar: 40µm.
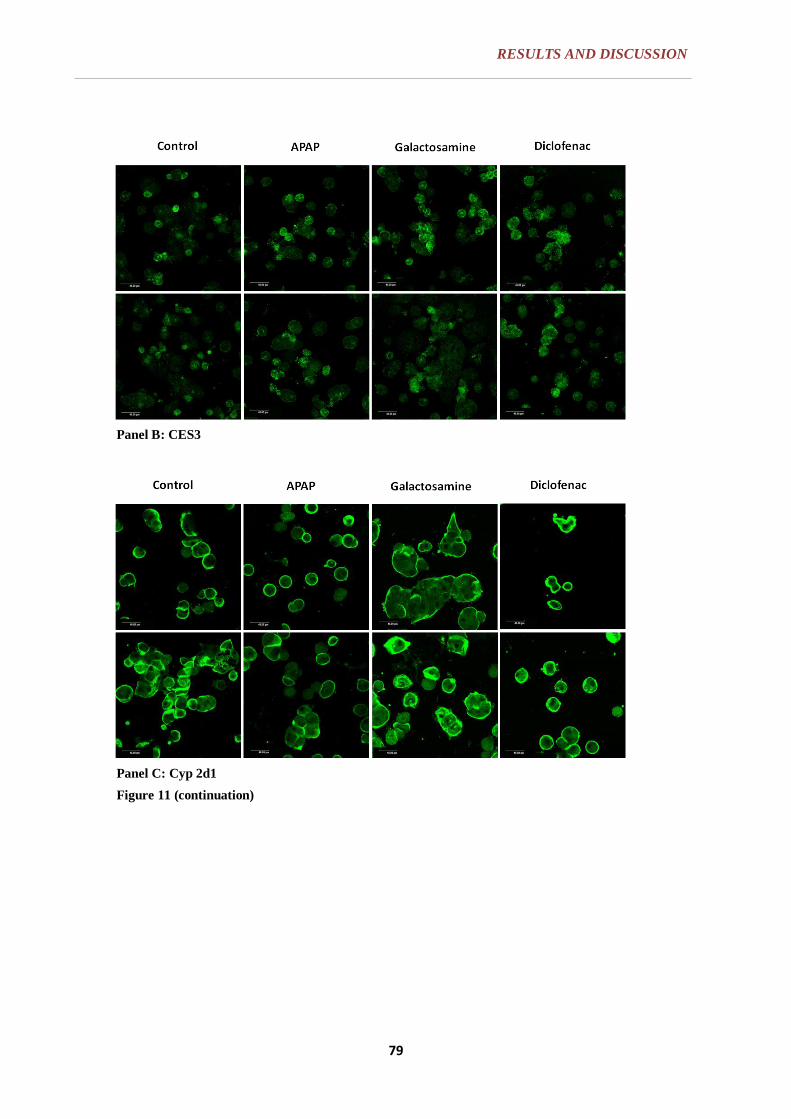
RESULTS AND DISCUSSION
79
Panel B: CES3
Panel C: Cyp 2d1
Figure 11 (continuation)

RESULTS AND DISCUSSION
80
Panel D: COMT
Panel E: MAT1A
Figure 11 (continuation)

RESULTS AND DISCUSSION
81
Panel F: Cd81
Panel G: LIMP II
Figure 11 (continuation)
6.1.3. WESTERN BLOT ANALYSIS
The effect of the APAP, GalN and DCF drugs on the intracellular content of hepatocytes was
also evaluated by Western-blotting, focusing the study on protein markers of EVs (LIMP II,
Hsp70, Hsp90, Rab8, Flotillin-1 and Cd63) and on an intracellular compartment as the
mitochondria (Cox IV). Several enzymes that were previously detected in hepatocyte-derived
EVs (Ces1d, MAT, COMT) were also analyzed [69].
Consistent with the results obtained in the confocal microscopy analysis, similar differences
were found in the behaviour of the proteins analyzed by Western-blotting, suggesting again
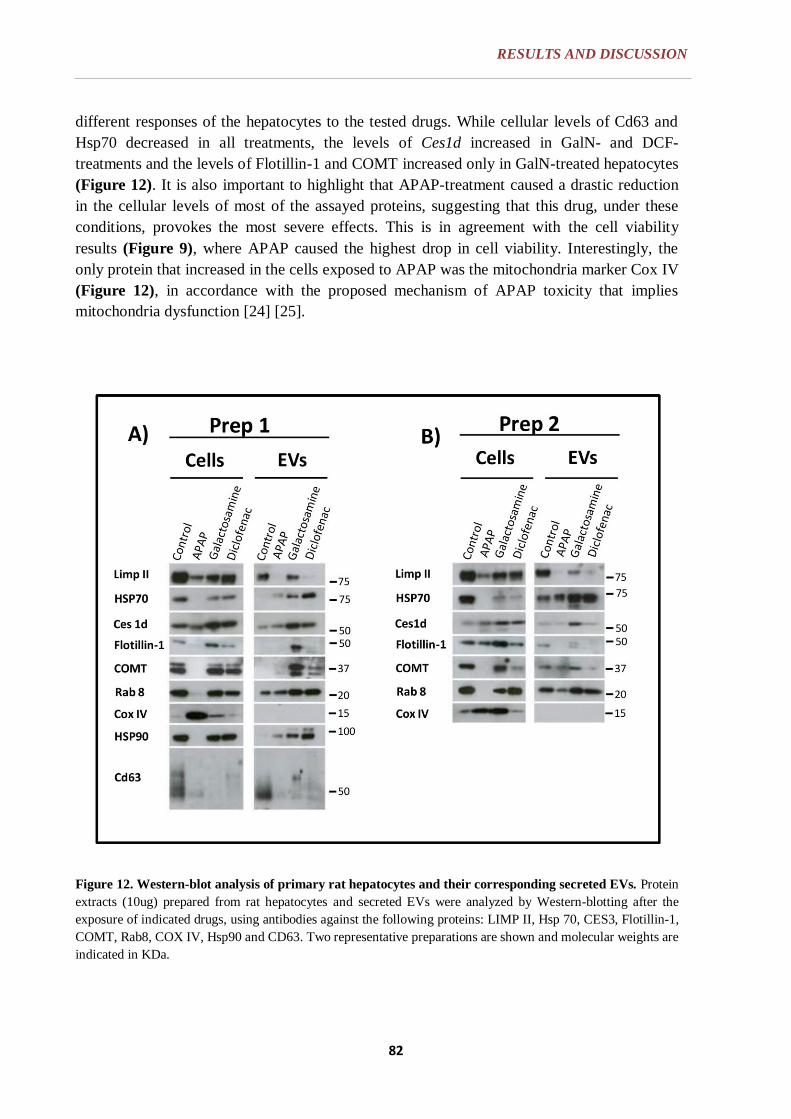
RESULTS AND DISCUSSION
82
different responses of the hepatocytes to the tested drugs. While cellular levels of Cd63 and
Hsp70 decreased in all treatments, the levels of Ces1d increased in GalN- and DCF-
treatments and the levels of Flotillin-1 and COMT increased only in GalN-treated hepatocytes
(Figure 12). It is also important to highlight that APAP-treatment caused a drastic reduction
in the cellular levels of most of the assayed proteins, suggesting that this drug, under these
conditions, provokes the most severe effects. This is in agreement with the cell viability
results (Figure 9), where APAP caused the highest drop in cell viability. Interestingly, the
only protein that increased in the cells exposed to APAP was the mitochondria marker Cox IV
(Figure 12), in accordance with the proposed mechanism of APAP toxicity that implies
mitochondria dysfunction [24] [25].
Figure 12. Western-blot analysis of primary rat hepatocytes and their corresponding secreted EVs. Protein
extracts (10ug) prepared from rat hepatocytes and secreted EVs were analyzed by Western-blotting after the
exposure of indicated drugs, using antibodies against the following proteins: LIMP II, Hsp 70, CES3, Flotillin-1,
COMT, Rab8, COX IV, Hsp90 and CD63. Two representative preparations are shown and molecular weights are
indicated in KDa.
RESULTS AND DISCUSSION
83
6.2. EVs SECRETED BY PRIMARY RAT HEPATOCYTES IN MODELS OF DILI
MOLECULAR CHARACTERIZATION
EVs derived of rat hepatocytes after exposure to APAP, GalN and DCF hepatotoxic drugs
were isolated by differential ultracentrifugation and analyzed by NTA, Cryo-EM, Western-
blotting and RTM. The use of these complementary techniques allows a rapid characterization
of EVs using small amount of material. NTA is valuable for studying the size distribution and
concentration, Cryo-EM for morphological characterization (vesicle heterogeneity) [165],
while Western-blotting and RTM provides information about the protein and global chemical
composition, respectively [166].
6.2.1. EVs SIZE, MORPHOLOGY AND CONCENTRATION ANALYSIS
Nanoparticle Tracking Analysis (NTA) is a simple and rapid method to determine
nanoparticles size distribution and concentration [150].
The NTA analysis of EVs from untreated hepatocytes showed two main vesicles populations
with 70% of the vesicles ranged on average size of 110 and 180 nm. Regarding EVs released
by hepatocytes after exposure to different hepatotoxic drugs, a modification in the size
distribution of the vesicles could be observed. In the case of GalN and DCF treatments, 50%
of the vesicles maintain these two main vesicle populations, although they are not so
pronounced as in untreated cells. Nevertheless, in the case of APAP treatment there is a clear
main population on average size of 130 nm consisting of 50% of vesicles (Figure 13B). This
result indicates that under these experimental conditions, the hepatotoxins provoke changes in
the populations of secreted-vesicles.
In all treatments, Cryo-EM images revealed a membrane vesicles limited by a lipid bilayer
(Figure 13A). In the case of DCF-treated hepatocytes, in addition to rounded vesicles, there
was amorphous non-vesicular material in the EVs purifications in comparison with the rest of
the conditions (Fig. 13A, DCF-treatment). It is important to highlight the high heterogeneity
of vesicles observed in all the preparations in terms of size and shape. Also in many cases it
was possible to observe vesicles inside the vesicles (Fig. 13A, APAP and GalN-treatment).
In summary, these analyses together revealed heterogeneous EVs populations in terms of size
and morphology and suggest that the hepatotoxic treatments alter the size distribution of EVs.

RESULTS AND DISCUSSION
84
Figure 13. Ultrastructural characterization of EVs in DILI models. Comparison of cryo-electron
microscopy and Nanosight Tracking Analysis of hepatic EVs after treatment with different hepatotoxic drugs.
(A) EVs were analyzed by Cryo-EM. Images show electron micrographs of membrane vesicles of different sizes
and morphology. Scale bar: 100 nm. (B) NTA analysis showing vesicles size distribution (n=10).
NTA also allows the quantification of the number of vesicles present in the preparations. As
can be observed in the Figure 14, the amount of secreted vesicles increased significantly in
treated hepatocytes; 4.5, 3.8 and 3.5 fold in APAP-, GalN- and DCF-treated hepatocytes
respectively compared to the level of secretion observed in untreated cells.

RESULTS AND DISCUSSION
85
Figure 14. Total number of particles secreted in DILI models. The total number of secreted vesicles
contained in each rat hepatocytes preparation after EVs isolation was estimated by means of Nanosight Tracking
analysis. The mean number of secreted vesicles from untreated, APAP, GalN and DCF-treated hepatocytes was
2.19·1010, 9.79·1010, 8.41·1010 and 7.68·1010 vesicles respectively. Error bars represent SE (n = 10), * denotes
p<0.01.
The total number of secreted vesicles estimated by NTA was then compared with the total
protein amount of EVs estimated by means of Bradford assay. As shown in Figure 15, the
total protein amount of hepatic EVs obtained after each treatment correlates with the number
of secreted vesicles (see Figure 14). APAP was the treatment with highest values for number
of secreted vesicles and amount of protein, followed by DCF, GalN and control in decreasing
order.
Figure 15. Total protein amount of EVs secreted in DILI models. The total protein amount contained in EVs
preparation was determined by means of Bradford assay. The mean protein amount of hepatic EVs control and
after treatment with APAP, GalN and DCF was 150, 550, 451 and 450µg respectively. Error bars represent SE
(n = 10), * denotes p<0.01.

RESULTS AND DISCUSSION
86
In order to estimate the purity of each preparation of vesicles, it was used the method
described by Webber J and Clayton A, 2013 [167]. In this study is hypothesized that vesicle
preparations that are more pure exhibit a relatively high ratio of particles to protein
(NTA/Bradford). Thus, the presence of contaminating proteins in the samples would decrease
this ratio. The ratio (NTA/Bradford) of EVs isolated from untreated and treated hepatocytes
were 0.22 and 0.03 respectively. Thus, the ratio is more than 7-fold higher in EVs control than
in EVs coming from treated cells. This result suggests that although there is an effect in the
number of secreted vesicles under DILI conditions, there is even a higher effect in the release
of protein aggregates.
6.2.2. WESTERN BLOT ANALYSIS
Until now, several proteins have been identified as EVs markers, including Cd63, Hsp70,
Hsp90, Rab8, Flotillin-1 and LIMP II among others. In this work, the expression of these
proteins was analyzed by Western blot in both untreated and treated hepatocytes as well as in
their derived EVs (Figure 12).
In the case of Hsp70 and Hsp 90, there is a decreased expression of these proteins in the
treated cells that is accompanied by an increase in the corresponding EVs. Regarding Rab 8,
there is a significant protein expression decrease in APAP-treatment in both cells and EVs. In
contrast, for GalN- and DCF-treatments, there is an increase in the levels of this protein in
EVs.
In the case of Flotillin-1, its expression is significantly reduced in both, cells and EVs in
APAP- and DCF-treatments. In contrast, in the case of GalN-treatment such expression is
increased. Which regards Cd63, there is a significant decrease in protein expression in treated
hepatocytes for both, cells and EVs. LIMP II protein expression levels decreased notably in
EVs in APAP- and DCF-treatments and, at less extent, in GalN-treatment.
In the case of Ces1d, there are increased protein expression levels in GalN- and DCF-treated
hepatocytes derived EVs. Finally, COMT protein expression levels were clearly increased in
EVs from GalN-treated hepatocytes.
In summary, the different levels of proteins observed in the different treatments suggest that
different regulation processes are carried out in response to APAP, GalN and DCF induced
liver damage.
6.2.3. EVs OVERALL COMPOSITION ANALYSIS
Once analyzed vesicles size, amount and morphology, it was wanted to fulfill hepatic EVs
characterization analyzing their general composition.

RESULTS AND DISCUSSION
87
Western blotting, as seen previously, allows analyzing the expression of determined proteins
but it does not give information about the overall composition including proteins, lipids and
nucleic acids. Yet, this analysis is possible using RTM [166]. Thus, changes in EVs global
chemical composition in our DILI models were analyzed by RTM technology in collaboration
with Sergei G. Kruglik and his group in Pierre et Marie Curie University in Paris (France).
RTM is the technique of choice for global chemical study in a time scale of few seconds of
trapped EVs. It monitors variations in vesicular composition. In this case, EVs preparations
were analyzed in duplicate. As can be observed in Figure 16, there is not significant shift
variation when comparing each point of the curve of the duplicates, indicating the high
reproducibility of the technique.
Figure 16. Raman tweezers microspectroscopy technique applied to study EVs global composition in DILI models. Raman spectrum represents the average signal corresponding to the total number of vesicles
trapped in the focus of the microscope. All spectra were corrected for the PBS contribution. Shift is given in
terms of spectral resolution (cm-1).

RESULTS AND DISCUSSION
88
Figure 17 shows the proposed interpretation of Raman spectrum originated from the EVs
released by untreated rat hepatocytes. It appears that vesicles composition is heterogeneous,
with different proportions of the chemical compounds. The main Raman signatures of lipids,
proteins and nucleic acids are identified (arrows).
Figure 17. Average Raman spectra interpretation for rat hepatocytes derived EVs. Position, frequencies
and bands interpretation for the major spectral differences are indicated by arrows. Raman spectrum represents
the average signal corresponding to the total number of the vesicles trapped (n=2) Background was subtracted
from both spectra to facilitate the comparison. Shift is given in terms of spectral resolution (cm-1).
In Figure 18, the Raman spectrum corresponding to each treatment is represented. On these
data, it is possible to characterize differences in composition between treatments. The higher
RTM shift differences (black line), the bigger the alteration in EVs composition. In this
regard, APAP-treated hepatocytes derived EVs have the major change in composition relative
to untreated cells, showing more prominent lipids signatures than the control. Moreover, the
amino acid tryptophan has also higher contribution in APAP-treatment (Figure 18A).
Interestingly, in the Western blot analysis, APAP has a detrimental effect in the expression of
the majority of the analyzed proteins (see Figure 12). On the other hand, in GalN- and DCF-
treated hepatocytes derived EVs there is a decrease in general lipid contribution with respect
to the control, although at less extent compared to APAP-treatment. Finally, regarding nucleic
acid composition, there are not significant changes in the treatments with respect to control.

RESULTS AND DISCUSSION
89
Figure 18. Analsyis of overall composition of hepatocytes-secreted EVs in DILI models. Comparison of
the similarity/ variability of RAMAN spectra between untreated and treated hepatocytes is shown. (A) Control
vs APAP, (B) control vs DCF and (C) control vs GalN is compared. Shift or composition differences between different treatments is given in terms of spectral resolution (cm-1). Raman spectrum represents the average
signal corresponding to the total number of the vesicles trapped. All spectra were corrected for the PBS
contribution.
These results also suggest that different regulatory processes are carried out in response to
APAP, GalN and DCF induced damage. Indeed, the general composition, amount and cargo
of EVs has been observed to vary according to induced liver damage reflecting in this way the
physiological condition of the liver [33]. In this regard, APAP is the treatment with the
highest number of secreted vesicles, the most detrimental effect in the expression of most of
the analyzed proteins and also with the highest alteration in overall composition, suggesting a
severe liver damage.
Overall, it seems plausible to discriminate between different DILI treatments basing on EVs
general composition analysis, strongly supporting the application of EVs as a source of non-
invasive DILI biomarkers.
Finally, it is important to remark that the approach of a rapid characterization of EVs could be
proposed by the joint use of the three complementary methods, NTA, Cryo-EM and RTM,
with easy sample preparation and without the use of any added label.

RESULTS AND DISCUSSION
90
6.2.4. EVs RNA CONTENT ANALYSIS
Since the demonstration that EVs cargo apart from protein and lipids also contain nucleic
acids including both, DNA and RNA, numerous groups have analyzed the presence of genetic
material in EVs. In this regard, it has been showed that EVs released by rat hepatocytes also
carry RNA [70]. Remarkably, some of those RNAs were enriched in EVs respect to
intracellular content. In particular, Albumin (Alb), retinol binding protein 4 (RBP4) and beta
polypeptide 2-like 1 (GNB2L1) gene transcripts were analyzed due to their relevance in the
biological context of the liver function. Briefly, albumin is synthesized in the liver and
secreted into the serum in order to mobilize different molecules. GNB2L1 acts as an anchor or
adaptor protein providing a platform for protein-protein interactions involved in cell-signaling
pathways [168]. Finally, vitamin A (retinol) is absorbed in the small intestine, stored in liver,
and secreted into circulation bound to RBP4 [169].
With the aim of characterizing the effects of hepatotoxic drugs in the RNA cargo of hepatic
EVs, EVs derived from hepatocytes exposed to GalN, APAP or DCF were isolated and RNA
contained in them was extracted for further analysis.
As it is shown in Figure 19A, remarkable differences between the RNA cargos of EVs
released after the different liver-damaging treatments were found. All the treatments clearly
increased the levels of analyzed RNAs (Alb, GNB2Ll and RBP4) secreted to the culture
media. In fact, the amounts of Alb transcript increased from 2 to more than 15-fold in
comparison with untreated hepatocytes. In the same way, the levels of transcripts coding for
GNB2Ll and RBP4 proteins only increased significantly after GalN and DCF treatments,
being more pronounced in the case of DCF. In particular, the levels of GNB2Ll increased 5-
and 20-fold after GalN and DCF treatments respectively, whereas APAP treatment had no
effect on the expression levels of this transcript. Overall, the levels of the three transcripts
increased with GalN and DCF treatments, whereas when treating with APAP only the levels
of albumin transcript is increased.
These results were further validated in the in vivo model. For this purpose, EVs from serum of
rats treated with GalN (controls treated with saline solution) were purified using Exoquick
reagent. As shown in Figure 19B, the amplification of RNAs associated with EVs, such as
Alb, GNB2Ll and RBP4 was observed in GalN-injured animals, which was in agreement with
the in vitro results.

RESULTS AND DISCUSSION
91
Figure 19. RNA cargo of hepatic EVs in DILI models. (A) qPCR analysis of three RNA transcripts
(Albumine (Alb), Retinol binding protein 4 (Rbp4) and beta polypeptide 2-like 1 (Gnb2l)) released by hepatic
EVs after exposure to indicated drugs is shown (error bars represent SD of 3 independent experiments (n = 2), *
denotes p<0.05 with respect to the control (B) qPCR analysis of RNA cargo of EVs isolated from serum of
untreated (U) rats and rats treated (T) with galactosamine (inducing acute liver injury).
Overall, in vitro and in vivo evidences suggest that DILI, in addition to modifying protein
content, it also modifies the RNA content of hepatocytes-secreted EVs. Therefore, these
results suggest that RNA cargo of hepatocyte-derived EVs, such as albumin, Gnb2l or Rbp4,
could serve as a suitable non-invasive candidate marker for liver toxicity.
FUNCTIONAL CHARACTERIZATION (ENZYMATIC ACTIVITY ANALYSIS)
In the previous section, focused on the molecular characterization of the hepatocytes-derived
EVs, it was showed the presence of many metabolic enzymes including Ces1d, MAT and
COMT that play important role in endogenous and xenobiotics metabolism. However, the
presence of the protein does not mean that is active. Thus, the next objective was to
demonstrate that these enzymes were active in hepatocytes-derived EVs. To determine the
activity of Ces1d, a fluorometric assay was used. However, to determine MAT and COMT
activities, it was required to develop in-house methods.
6.2.5. CES ACTIVITY ANALYSIS
Firstly, it was tested if carboxylesterase (Ces1d) activity is present in hepatic EVs. To
measure this activity, a fluorometric assay was performed using the protocol followed by
Stacey L et al, 2006 [151]. EVs preparations were incubated at 37ºC in the presence of
fluorescein diacetate and the formation of fluorescein by the action of Ces1d was measured in
a fluorometer. As carboxylesterase activity was detected in control EVs, then, it was
determined if DILI affected it in accordance to the Western blot results (see Figure 12).
A) B)

RESULTS AND DISCUSSION
92
6.2.5.1. Esterase Activity analysis
Figure 20 shows the esterase activity detected in two independent preparations of EVs
secreted by rat hepatocytes. In both preparations, EVs isolated from untreated hepatocytes
showed esterase activity almost 2 times higher than the mock (absence of EVs). In addition,
both independent preparations of EVs follow a similar trend.
When analyzed the effect of DILI in EVs associated carboxilesterase activity, the lowest
activity was detected in EVs coming from untreated hepatocytes, while in EVs from
hepatocytes exposed to liver damaging drugs was increased 2, 3 and 5-fold in APAP, DCF
and GalN-treatments respectively compared to control (Figure 20). These results strongly
suggest that hepatic EVs carry active enzymes. Moreover, esterase activity is discriminative
between different hepatotoxic treatments.
Figure 20. Carboxylesterase activity in EVs from DILI models. CES activity contained in EVs is
increased after the exposure of indicated drugs. The activity is expressed in relative fluorescent unit
per minute (RFU/min) and expressed as fold change respect to the control. Results from two
independent preparations are shown.
6.2.5.2. Continuous density gradient analysis
In order to ensure that detected carboxilesterase activity comes from hepatic EVs, an extra
purification step involving a continuous sucrose density gradient was performed to obtain
highly pure EVs preparation. This step eliminates additional contaminants, such as proteins
non specifically associated with EVs and large protein aggregates that could also be
precipitated by ultracentrifugation but do not float on a density gradient [149]. To do that,
equal amount (Bradford quantified) of EVs obtained from the control and the DILI models
were subfractioned in sucrose density gradient. Then, all the fractions were analyzed by
Western blotting and also assayed for CES activity. In all the cases, the carboxilesterase
activity appears enriched in a fraction having a density of 1.21 g/ml (F9) (Figure 21B). This
0
1
2
3
4
5
6
7
8
Control APAP Galactosamine Diclofenac
RFU
/min
(Fo
ld c
han
ge re
spec
t to
co
ntr
ol)
Treatments
Prep 1
Prep 2

RESULTS AND DISCUSSION
93
was in complete agreement with the detection of the protein in the same fraction of the
gradients by Western-blotting (Figure 21A). The activity was 2 and 5-fold higher in APAP
and GalN-treatments with respect to control.
Figure 21. Density fractionation and CES activity analysis of hepatic EVs in DILI models. (A) Fractions
obtained from sucrose density gradient were analyzed by Western-blotting. 5 µl of EVs sample were loaded in
the input (13µg Control, 22.9µg APAP and 26.65µg in GalN) and 10µg of each fraction. The most abundant
band was found in the fraction corresponding to EVs density. Treated EVs show more diversity, with vesicle
populations fractionating at different densities than untreated. (B) EVs were sub-fractioned in a continuous
sucrose density gradient and the esterase activity determined in each fraction. Esterase activity is expressed in
relative fluorescent unit per minute (RFU/min), given in fold change respect to fraction 1 (F1).
It is important to highlight that the density of the EVs where Ces1d was localized was not
significantly modified by DILI treatments, indicating that not dramatic changes in global
composition of the vesicles were provoked.
In summary, these results correlate throughout the different assays. Both, protein expression
levels (Western blotting) and enzymatic activity (Esterase activity measurement) increase
with APAP, DCF and GalN-treatments in increasing order with respects to control.
Therefore, CES activity varies depending on the induced liver damage, being able to
discriminate between different liver injuries.
ANALYTICAL METHOD DEVELOPMENT OF MAT AND COMT ACTIVITIES
It is known the presence of COMT and MAT1A enzymes in hepatic EVs showed by
proteomics and Western-blotting [69], but nothing about their activities in this localization
has been reported so far. In order to address this question properly, a method to measure the
activity of each of these enzymes using UPLC-MS technology was developed, which

RESULTS AND DISCUSSION
94
provides high specificity and sensitivity. Following section, describes the optimization of
several parameters of the procedure that were required before the analysis of hepatic EVs.
6.2.6. MAT ACTIVITY ANALYSIS
6.2.6.1. Analytical method development
6.2.6.1.1. Optimization of the incubation condition for the enzymatic reaction to assay
MAT activity
Although several studies have reported kinetic data of MAT activity in liver, the enzymatic
reaction conditions are not well established yet. Initially, MAT activity was studied in rat liver
extract following the protocol reported by Kim et al. 2008. Under these conditions, not
reproducible results were obtained, being necessary to optimize several parameters of the
enzymatic reaction including pH, ATP, salts, methionine and incubation time.
During the optimization process, the standard conditions of the assay were performed in a
final volume of 250 μl containing 100 mM Tris-HCl buffer pH 8.7: enzyme provider (250µg
of rat liver extract), 5 mM ATP, 5 mM L-methionine, 150 mM KCl, 10 mM MgCl2, protease
inhibitor (1 x 1,000) and 5 mM DTT. A reducing agent (DTT) is necessary since the oxidation
of the enzyme produces an internal disulfide that could cause the inhibition of the enzyme
[170]. The parameters to be optimized were modified as indicated for the specific
experiments.
pH optimization
To determine optimal pH, Tris-HCl buffer 100 mM ranging from pH 7.4 to 9.2 was assayed
under standard conditions (mentioned above) (Figure 22). Under these conditions, the
enzyme reached its major activity at pHs between 8.0 and 9.2 and shown optimal activity at
pH 8.7 (Figure 22A), which was in agreement with the value reported by Suma et al. 1986.
The activity of the enzyme decreased above pH 9.2, suggesting that highly alkaline conditions
may have a detrimental effect on enzyme and compounds stability. During the incubation
period, the amount of consumed methionine was also measured (Figure 22B) at pH 8.7. In
this way, reaction specificity was also confirmed.

RESULTS AND DISCUSSION
95
Figure 22. Optimization of pH for MAT enzymatic activity.(A) The enzymatic assay was performed at 37°C
in 100mM Tris-HCl buffer at different pHs (7.4, 8.0, 8.7 and 9.2) and time points (0, 30, 60, 90 and 120min). (B)
The amount of consumed L-Methionine during the reaction was measured at pH 8.7 and different time points (0,
30, 60, 90 and 120min). The reaction mixture contained the following components in a final volume of 250 μl:
250 μg of protein (rat liver extract), 5 mM ATP, 0.1 mM methionine, MgCl2 5 mM, KCl 50 mM, 5 mM DTT
and protease inhibitor (1x1,000). MAT activity is expressed as Σ products (SAMe and SAH) in nmol/0.25mg
protein.
Optimization of temperature of incubation for the reaction
Once fixed the pH, the optimal temperature of the enzymatic activity was determined under
standard assay conditions, incubating the reaction mixture at increasing temperatures ranging
from 27°C to 52°C. The highest MAT activity at pH 8.7, was obtained at 37°C (Figure 23A).
Rat liver basal temperature is 39.3°C [171], which is found in the range of MAT enzymatic
activity optimum temperature (37°C-42°C). MAT denaturation studies on recombinant rat
liver MAT activity, showed its irreversibility at temperatures between 47–51°C [172], which
is in agreement with obtained results. In addition, SAMe is thermolabile, which could be
translated in a partial decay of SAMe during prolonged incubation periods at high
temperatures. In this regard, SAMe would be cleaved into MTA and homoserine by a
nucleophilic attack of the carboxylate group which, at the end, would complicate the
analytical study of SAMe [173]. During the incubation period, the amount of consumed
methionine was also measured at 37°C (Figure 23B). In this way, reaction specificity could
also be confirmed.

RESULTS AND DISCUSSION
96
Figure 23. Optimization of temperature reaction for MAT activity. (A) The enzymatic assay was performed
at 37°C in 100mM Tris-HCl buffer at pH 8.7 at different temperatures (27, 32, 27, 42, 47 and 52°C) and
timepoints (0, 30 and 60 min). (B) The amount of consumed L-Methionine during the reaction was measured
(nmol/0.25mg prot) at 37°C and different timepoints (0, 30 and 60 min) The reaction mixture was incubated under standard assay conditions; 250 μg of protein (rat liver extract), 5 mM ATP, 0.1 mM methionine, MgCl2 5
mM, 50 mMKCl, 5 mM DTT and protease inhibitor. MAT activity is expressed as Σ products (SAMe and SAH)
in nmol/0.25mg protein.
Optimization of divalent (Mg2+
) and monovalent (K+) cations content in the reaction.
MAT activity requires both Mg2+
and K+
cations for maximal activity [101], [174] given that
the mechanism of hydrolysis of the ATP requires these cations. When these cations are in
high concentrations, MAT activity could be inhibited due to the effect of high ionic strength
[175]. The Figure 24 shows the effect of combined concentrations of Mg2+
and K+ cations in
MAT activity. The optimal salts concentrations were established at 10 mM MgCl2 and 150
mM KCl.
Figure 24. Optimization of divalent (Mg2+
) and monovalent (K+) cations content in the reaction. Effect of
Mg2+ and K+ on enzyme activity of MAT was evaluated in Tris-HCl buffer (100 mM, pH 8.7) at 37°C for 60
min. The reaction mixture was incubated under standard assay conditions (250 μg of protein from rat liver
extract, 5 mM ATP, 0.1 mM methionine, 5 mM DTT and protease inhibitor), using different concentrations of
MgCl2 (5, 10 and 20 mM) and KCl (150 and 250 mM) in a final volume of 250µl. MAT activity is expressed as
Σ products (SAMe and SAH) in nmol/0.25mg protein/1h.

RESULTS AND DISCUSSION
97
Optimization of L-methionine concentration in the reaction assay
Optimal L-methionine concentration for MAT enzymatic activity was determined under
standard assay conditions, incubating L-methionine at increasing concentrations ranging from
0.1 to 10 mM. As can be observed in the Figure 25, the highest MAT activity efficiency was
reached when incubating rat liver extract with 5 mM L-methionine.
Figure 25. Optimization of L-methionine concentration for MAT activity. The enzymatic assay was
performed in Tris-HCl buffer (100 mM, pH 8.7) at 37°C for 60 min. The reaction mixture was incubated under
standard assay conditions; 250 μg of rat liver extract, 5 mM ATP, 10 mM MgCl2, 150 mM KCl, 5 mM DTT and
protease inhibitor in a final volume of 250 µl, using different concentrations of L-methionine (from 0.1 to 10
mM.). MAT activity is expressed as Σ products (SAMe and SAH) in nmol/0.25mg protein/1h.
Optimization of ATP concentration
Optimal ATP concentration for MAT enzymatic activity was determined under standard assay
conditions (fixing L-methionine at 5mM), in increasing concentrations that ranging from 0.1
to 10 mM. The highest MAT activity efficiency was reached when incubating rat liver extract
with 5 mM ATP (Figure 26).
Figure 26. Optimization of ATP concentration for MAT activity. The enzymatic assay was performed in
Tris-HCl buffer (100 mM, pH 8.7) at 37°C for 60 min. The reaction mixture was incubated under standard assay
conditions 250 μg of rat liver extract, 10 mM MgCl2, 150 mM KCl, 5 mM DTT, 5mM L-Methionine and
protease inhibitor in a final volume of 250 µl using different ATP concentrations (from 0.1 to 10 mM.). MAT
activity is expressed as Σ products (SAMe and SAH) in nmol/0.25mg protein/1h.

RESULTS AND DISCUSSION
98
Optimization of reaction incubation time
The incubation time was also evaluated from 0 to 3 hours; aliquots were collected every 30
min. As can be observed in the Figure 27, during the whole tested time the reaction didn´t
reached a maximum for MAT activity even after 3 hours incubation. Given that incubation
times longer than two hours are not recommended because of SAMe instability in long
incubation periods, 2-hours period was chosen as optimal to evaluated the MAT activity.
Figure 27. Optimization of incubation reaction time for MAT activity. The enzymatic assay was performed
in Tris-HCl buffer (100 mM, pH 8.7) at 45°C. The reaction mixture was incubated under standard assay
conditions;250 μg of rat liver extract, 10mM MgCl2, 150 mM KCl, 5 mM DTT, 5mM ATP, 5mM L-Methionine
and protease inhibitor (1x1,000) in a final volume of 250µl. Different incubation periods were assayed (30, 60,
90, 120, 150 and 180min). MAT activity is expressed as Σ products (SAMe and SAH) in nmol/0.25mg protein.
As results of the optimization process, different parameters of the enzymatic reaction were
adjusted in order to obtain the optimal enzymatic activity efficiency. The established
conditions were 2-hours of incubation at 37ºC in a final volume of 250 µL containing
100mM Tris-HCl buffer pH 8.7, 5 mM ATP, 5 mM L-methionine, 150 mM KCl, 10 mM
MgCl2, protease inhibitor and 5 mM DTT.
6.2.6.1.2. Ultra performance Liquid Chromatography-Mass Spectrometry optimization
Once the samples were incubated in the reaction mixture, it was necessary to optimize next
steps prior to data process; UPLC-MS conditions, SPE and analytical method.
Hydrophilic Interaction Chromatography (HILIC) was used to quantify SAMe and SAH.
HILIC is an alternative to reserved-phase chromatography (or hidrophobic chromatography)
and uses hidrophilic stationary phase for applications involving polar compounds such as
these [176]. HILIC can offer a tenfold increase in sensitivity over reversed-phase
chromatography when used with electrospray-ionization mass spectrometry detection mode

RESULTS AND DISCUSSION
99
[177]. In addition, HILIC is ideal for very polar compounds that are difficult to retain in
reversed-phase chromatography. The main products that take part in the reaction, SAMe and
SAH, were scanned in ESI+ mode and analyzed in matrix solution (in this case, rat liver
extract). As can be observed in the Figure 28, both compounds appear completely separated
in the chromatogram. The spectra of SAMe and SAH were dominated by protonated
molecules [M+H]+ and no significant adducts or fragments ions were observed. SAMe was
detected at a m/z of 399.145 and a retention time of 2.99 min, and SAH at a m/z of 385.129
and a retention time of 2.35 min (Table 3).
Table 3. MAT activity derived metabolites structure and properties. In this table is shown SAMe and SAH
m/z ratio, the retention time in matrix (rat liver extract) and molecular formula and structure of each compound.

RESULTS AND DISCUSSION
100
Figure 28. Representative chromatograms (top) and mass spectra (bottom) obtained from rat liver extract
spiked with SAMe (A) and SAH (B)
6.2.6.1.3. Solid-Phase Extraction (SPE) method development
In order to clean the samples before injecting them in the mass spectrometry, SPE was
optimized to remove mostly the elevated levels of salts required to perform the enzymatic
reaction. This step is required since high concentration of salts could interfere in analytes
ionization and detection, in addition to shorten the lifespan of the column.
SPE method selection
Different protocols were combined to optimize the SPE for SAMe, SAH and MTA (see
references Delabar et al.1999 [178], Gellekink et al. 2005 [179], Cataldi et al. 2009 [179]),
trying different cartridge conditioning and sample pre-treatments. SPE methods based on non-
polar (Van der Waals forces), polar or ionic interactions are relatively non-specific. In
contrast, covalent bond, is based on a specific union between a functional group of the analyte
with the cartridge sorbent surface, which results in an increased specificity of the extraction
method. In this regard, extraction of SAMe, SAH and MTA was performed using Bond Elute
cartridges containing 100 mg phenilboric acid (PBA) bonded silica [180][181]. The choice of
the PBA cartridge was based on the affinity of boronate for the cis-hydroxyl group of a ribose
moiety, which is present in SAMe, SAH and MTA.
The mechanism of boronate binding is illustrated in Figure 29. The immobilized PBA is first
equilibrated with an alkaline solution to obtain the reactive boronate form, RB(OH)3- (Figure
29A). The sample is then applied and the covalent bond will be specifically formed with those
compounds containing cis-hydroxyl group (Figure 29B). Once the compounds of interest are
retained (SAMe, SAH and MTA in this case), contaminants will be selectively washed from
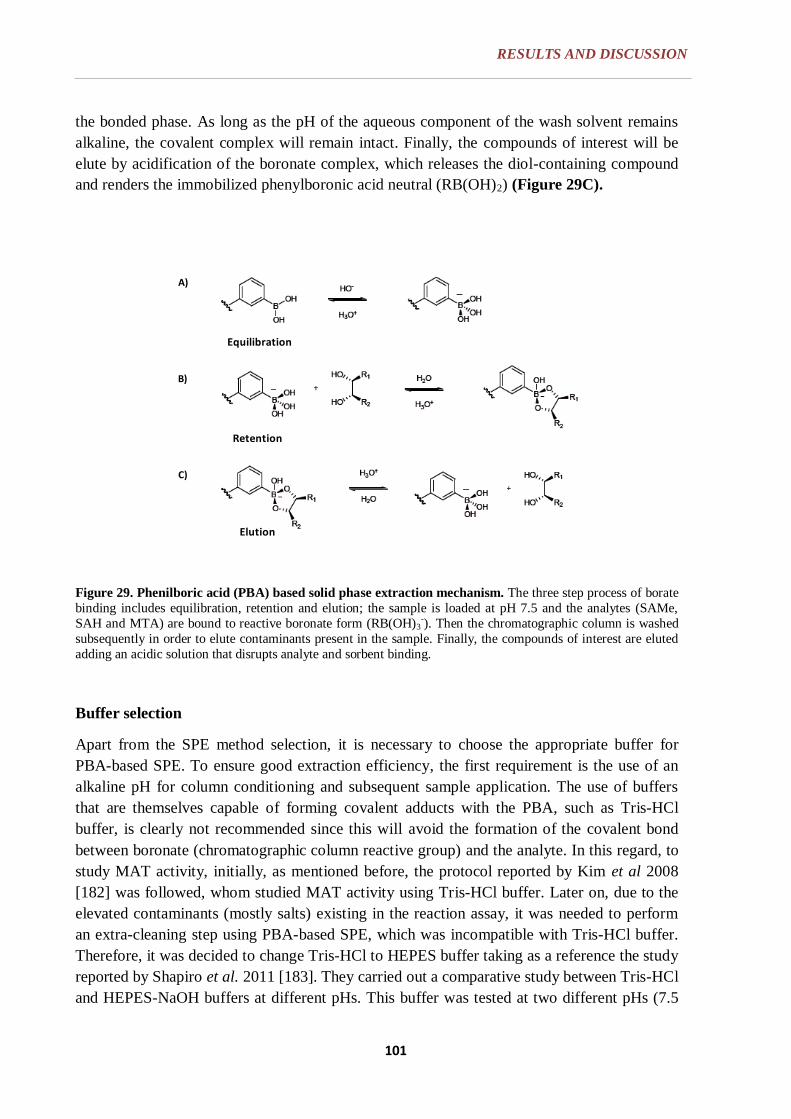
RESULTS AND DISCUSSION
101
the bonded phase. As long as the pH of the aqueous component of the wash solvent remains
alkaline, the covalent complex will remain intact. Finally, the compounds of interest will be
elute by acidification of the boronate complex, which releases the diol-containing compound
and renders the immobilized phenylboronic acid neutral (RB(OH)2) (Figure 29C).
Figure 29. Phenilboric acid (PBA) based solid phase extraction mechanism. The three step process of borate
binding includes equilibration, retention and elution; the sample is loaded at pH 7.5 and the analytes (SAMe,
SAH and MTA) are bound to reactive boronate form (RB(OH)3-). Then the chromatographic column is washed
subsequently in order to elute contaminants present in the sample. Finally, the compounds of interest are eluted
adding an acidic solution that disrupts analyte and sorbent binding.
Buffer selection
Apart from the SPE method selection, it is necessary to choose the appropriate buffer for
PBA-based SPE. To ensure good extraction efficiency, the first requirement is the use of an
alkaline pH for column conditioning and subsequent sample application. The use of buffers
that are themselves capable of forming covalent adducts with the PBA, such as Tris-HCl
buffer, is clearly not recommended since this will avoid the formation of the covalent bond
between boronate (chromatographic column reactive group) and the analyte. In this regard, to
study MAT activity, initially, as mentioned before, the protocol reported by Kim et al 2008
[182] was followed, whom studied MAT activity using Tris-HCl buffer. Later on, due to the
elevated contaminants (mostly salts) existing in the reaction assay, it was needed to perform
an extra-cleaning step using PBA-based SPE, which was incompatible with Tris-HCl buffer.
Therefore, it was decided to change Tris-HCl to HEPES buffer taking as a reference the study
reported by Shapiro et al. 2011 [183]. They carried out a comparative study between Tris-HCl
and HEPES-NaOH buffers at different pHs. This buffer was tested at two different pHs (7.5
A)
B)
C)
Equilibration
Retention
Elution

RESULTS AND DISCUSSION
102
and 9.5). To choose the optimal pH, matrix effect, process efficiency and recovery was
evaluated (see Figure 8). The matrix effect is an important issue to be addressed in method
development, validation, and routine use of UPLC-MS. It is the alteration of ionization
efficiency by the presence of coeluting substances in the sample of interest, having deleterious
impact on method accuracy and sensitivity [184][185]. The presence of ion suppression was
determined from the ratio C/A (The compound of interest added to the matrix after
extraction/The same amount of compound injected directly in mobile phase). The data for the
compound in mobile phase (A) provide a relative 100% response value whereas the data for
the same amount of compound added to extracted samples (C) show the effect of sample
matrix on MS response (ion suppression) [186]. In the Figure 30 is shown the matrix effect
for SAMe, SAH and MTA at different pHs (7.5 and 9.5). The negative values indicate ion
suppression. For SAMe, there is not matrix effect at pH 7.5 (0.82 %) whereas at pH 9.5
increased notably (-8.77%) (Figure 30). Regarding SAH, there is ion suppression at both
pHs, being higher at pH 9.5 (-5.92 at pH 7.5 and -10.48 at pH 9.5). Finally, the matrix effect
on MTA is almost the same at both pHs (-36.96 and -36.36 for pH 7.5 and 9.5 respectively).
Overall, there is not an important ion suppression for SAMe and SAH.
Figure 30. UPLC-MS analysis of matrix effects for SAMe, SAH and MTA. Matrix effect for SAMe, SAH
and MTA at pH 7.5 and pH 9.5 are shown. The negative % values indicate ion suppression.
The efficacy of the SPE method was determined from the ratio of test solutions B/A, being B
the mass spectrometric signal obtained before SPE extraction and A, the same amount of
compound injected directly in mobile phase (see Figure 8). This parameter (process
efficiency) shows the loss of signal (if present) attributable to the extraction process expressed
in percentage (%) [186]. For SAMe, SPE efficiency was slightly higher at pH 7.5 (58.34%)
than at pH 9.5 (53.97%). In the case of SAH, it was notably higher at pH 7.5 (53.95) than at
pH 9.5 (36.75%). Finally, in the case of MTA, SPE efficiency was practically the same at
both pHs (28.64% at pH 7.5 and 28.09% at pH 9.5) (Figure 31).

RESULTS AND DISCUSSION
103
Figure 31. SPE process efficiency for for SAMe, SAH and MTA. Solid-phase extraction (SPE) efficiency for
SAMe, SAH and MTA is shown. The efficiencies obtained for SAMe, SAH and MTA were in decreasing order.
Recovery Analysis
With respect to recoveries, they were determined from the ratio of test solutions B/C, being B
the signal obtained when the compound of interest is added to the matrix before extraction,
and C the signal obtained when same amount of compound is added to the matrix after the
extraction procedure (see Figure 8).
%R Recovery (%) = Rat liver extract spiked with SAMe/SAH/MTA before SPE (Pre-spiked sample)
Rat liver extract spiked before UPLC-MS (Post-spiked sample)
The recovery of SAMe and SAH determined at 5 μM was 58%. This value was in the
acceptable range for UPLC-MS analysis [187]. Nevertheless, the recovery obtained for MTA
was 45%, under acceptable range. Low recovery efficiency together with the high matrix
effect obtained in MTA make this method to be restricted to SAMe and SAH analysis.
Indeed, the majority of the reported studies evaluate MAT activity quantifying simultaneously
SAMe and SAH.
The recovery for SAMe was very similar at pH 7.5 (57.86%) and at pH 9.5 (59.16%) (Figure
32). Which regards to SAH, the recovery increases notably at pH 7.5 (57.35%), being under
acceptable range at pH 9.5 (41.03%).Therefore, without taking MTA into consideration, the
PBA-based SPE with the highest recoveries and lowest matrix effect were obtained at pH 7.5.

RESULTS AND DISCUSSION
104
Figure 32. Recovery analysis for SAMe, SAH and MTA in the PBA-SPE method. Obtained recoveries for
SAMe, SAH and MTA are shown. Except for MTA, obtained recoveries were in acceptable range of analysis.
Overall, prior to UPLC-MS analysis, an extra-cleaning step (PBA-SPE) was applied to
already incubated samples.
6.2.6.2. Analytical method optimization
In order to quantify the amount of the product formed in the enzymatic reaction, it was
required to consider the following parameters to obtain sensitive and specific determination of
the enzymatic activity.
6.2.6.2.1. Specificity of the enzymatic assay
It is reported that SAMe is stable at acid pH. Therefore, it was injected into UPLC-MS system
in acidic conditions [188].
Moreover, SAMe is formed from the union of methionine and ATP. Thus, the new SAMe
formed after incubation can only come from enzymatic reaction.
6.2.6.2.2. Linearity of Calibration Curves and Lower Limits of Quantification
(LLOQ)
To calculate the absolute amount of obtained products (SAMe and SAH), the average of
baseline signals were subtracted from the signals of the serially diluted calibration samples.
The calibration curve was obtained over the concentration range of 0.025-100 µM for SAMe
and 0.025-25 µM for SAH.
Power fit equation was employed to determine the relation between the signal (peak area) and
sample concentration:

RESULTS AND DISCUSSION
105
SAMe: [Signal] = 987.73 x [concentration]1,0962
(R2 > 0.99)
SAH: [Signal] = 1776.6 x [concentration]1,0774
(R2 > 0.99)
Once the sample concentrations were calculated, they were converted to amount (nmol) of
product formed (Σ products: SAMe and SAH) per mg of protein in 1 h incubation. The
amount of SAMe and SAH detected in the controls (not incubated) was considered
background and subtracted from the samples. The activity of MAT was estimated by
quantifying jointly SAMe and SAH production. The present UPLC–MS method offered a
LLOQ of 0.025 μM for SAMe and SAH.
6.2.6.2.3. Precision and Accuracy of the enzymatic assay
Accuracy and precision were deemed to be acceptable (<15%) for SAMe, SAH and MTA.
6.2.7. COMT ACTIVITY ANALYTICAL METHOD
6.2.7.1. Analytical method development
6.2.7.1.1. Optimization of the incubation condition for the enzymatic reaction to assay
COMT activity
Similar to MAT activity, an optimization of different parameters was required before COMT
[189], [190] enzymatic activity evaluation. Incubation conditions of the enzymatic reaction
had to be optimised in order to obtain the optimal enzymatic activity efficiency. This involves
the use of cofactors as well as different parameters adjustments such as pH. Moreover, the
stability of the compounds that take part in the reaction has to be taken also into
consideration.
In COMT enzymatic reaction Mg2+
ions are required since they are coordinated to three
amino acid residues (Asp, Asn and Glu) in the catalytic site of COMT [191]. Therefore, Mg2+
ions are routinely added to reaction mixture (2 mM MgCl2).
COMT assays are normally performed under physiological conditions (pH around 7.4 and
temperature 37°C). The enzyme has two-isoforms one associated to membrane (MB-COMT)
and other soluble (S-COMT). For the measurement of MB-COMT and S-COMT activity,
different approaches have been performed. These include the separation of the two isoforms
by differential ultracentrifugation and the use of two different substrates such as Dopamine
(DA) or Norepinephrine (NE) at different concentrations and pHs (7.4 for MB-COMT and 7.8
for S-COMT) [128] (Data not shown).
In order to simplify the assay and try to detect COMT activity in EVs, this study was focused
on MB-COMT activity, which has higher affinity (but lower O-methylation capacity) for the
catecholamines (DA and NE) than S-COMT [191].

RESULTS AND DISCUSSION
106
6.2.7.1.2. Ultra Performance Liquid Chromatography-Mass Spectrometry optimization
Once the samples were incubated in the reaction mixture, it was necessary to optimize next
steps prior to data process; UPLC-MS conditions, SPE and analytical method. As same as in
the case of MAT, with COMT, HILIC was also used to analyze DA/3-MT and NE/NMN. In
this regard, HILIC column conditions were optimized in order to achieve the best
chromatographic separation of the compounds of interest. Considering the strong relation
between chromatographic conditions and mobile phase, different concentrations of
ammonium formate were tested to see their effect on the analytes retention (Data not shown).
In the absence of ammonium formate, the peak shapes were broad and irregular. Regular peak
shape and identical retention time were achieved for each analyte when the salt concentration
reached 20 mM. The pH of the buffer may also have significant influence on the analytes
chromatographic behavior. 0.5% formic acid was used to separate the analytes. In these
conditions, analytes of interest were positively charge and completely separated (Table 4).
Table 4. COMT activity derived metabolites structure and properties. In this table is shown m/z ratio,
retention time in matrix (rat liver extract) and molecular formula and structure of dopamine (DA), 3-
Methoxytyramine (3-MT), norepinephrine (NE) and normetanephrine (NMN).
Once the analytes were properly separated, the corresponding chromatograms and mass
spectra were obtained. The Figure 33 and Figure 34 show the mass spectra and the
chromatograms of DA/3-MT and NE/NMN, respectively. In the spectra of DA and 3-MT, a
loss of one molecule of ammonia was observed, forming the predominant ion [M+H-NH3]+,

RESULTS AND DISCUSSION
107
whereas in the case of NE and NMN, a loss of one molecule of water was observed, forming
the predominant ion [M+H-H2O]+ represented as base peak in the spectra [190], [192].
Figure 33. Representative chromatograms (up) and mass spectra (down) obtained from rat liver extract
spiked with Dopamine (A) and 3-Methoxytyramine (B)
Figure 34. Representative chromatograms (up) and mass spectra (down) obtained from rat liver extract
spiked with Norepinephrine (A) and Normetanephrine (B).
In all cases, after UPLC-MS optimization process, good chromatographic separation of the
analytes was achieved as well as excellent mass spectrometric response.

RESULTS AND DISCUSSION
108
6.2.7.1.3. Solid-Phase Extraction (SPE) Method development
SPE method selection
In this case, given the nature of the products of the COMT activity reaction, it was chosen ion
exchange SPE to clean the samples before UPLC-MS analysis. Thus, cationic compounds
were isolated by using WCX bonded silica cartridges. The retention mechanism is a mix of
ion exchange and reversed phase, which improves retention of basic analytes, having especial
selectivity and sensitivity for strong bases. The retention is based mainly on the electrostatic
attraction of the charged functional group on the compound to the charged group that is
bonded to the silica surface [193] (Figure 35).
Figure 35. Oasis WCX retention mechanism for strong bases. The retention is based mainly on the
electrostatic attraction of the charged functional group on the compound to the charged group that is bonded to
the silica surface.
The WCX SPE material contains an aliphatic carboxylic acid group that is bonded to the silica
surface. The carboxylic acid group is a weak anion and will isolate cations, as 3-MT and
NMN, when both are charged. A solution having a pH that neutralizes either, the compound’s
functional group (3-MT or NMN) and the functional group on the sorbent surface, is used to
elute the compounds of interest. Highly selective retention enables much stronger washes,
resulting in very clear extracts. When one of these functional groups is neutralized, the
electrostatic force that binds the two together is disrupted and the compound is eluted. An
acidic solution was used to elute the analytes of interest. At low pH, the sorbent is un-ionized,
which shuts off the ion-exchange mechanism [152].

RESULTS AND DISCUSSION
109
Recovery Analysis
With respect to recoveries, they were determined from the ratio of test solutions B/C, being B
the compound of interest added to the matrix before extraction and C the same amount of
compound added to the matrix after the extraction (see Figure 8).
The Recovery was calculated as follows:
%R Recovery (%) = Rat liver extract spiked with 3-MT/NMN before SPE (Pre-spiked sample)
Rat liver extract spiked before UPLC-MS (Post-spiked sample)
The recoveries determined at 2.5μM were 82% (for 3-MT) and 75% (for NMN). These
recoveries were in the acceptable range for routine UPLC-MS analysis [187].
6.2.7.2. Analytical Method optimization
In order to quantify the amount of the product formed in the enzymatic reaction, it was
required to consider the following parameters to obtain sensitive and specific determination of
the enzymatic activity.
6.2.7.2.1. Specificity of the enzymatic assay
To evaluate the specificity and selectivity of the method, different controls were carried out as
follows. In the case of 3-MT, rat liver extract was incubated in buffer (Figure 36A) where no
product was detected indicating that no endogenous compound was present in the sample. Rat
liver extract was also incubated with DA in absence of SAMe and MgCl2 cofactors which are
necessary for the reaction to happen. In this case, 3-MT was detected, indicating DA
degradation during the incubation period (Figure 36B). In order to calculate the amount of 3-
MT obtained during the reaction, the amount of 3-MT detected in this control was subtracted
from the total amount of product obtained. Finally 3-MT was incubated in buffer (Figure
36C).

RESULTS AND DISCUSSION
110
Figure 36. Chromatograms obtained for 3-Methoxytyramine (m/z 151.075, tr 1.15) derived from: (A) Rat
liver extract incubated in 50mM sodium phosphate buffer without adding DA, (B) rat liver extract incubated with Dopamine in absence of SAMe and MgCl2, (C) 3-Methoxytyramine in 50mM sodium phosphate buffer.
Regarding NMN, the same controls as in the case of 3-MT, were performed. No endogenous
product (Figure 37, blue) either NE degradation was detected (Figure 37, red). Thus, no
subtractions were needed from the controls. Rat liver spiked with NMN is also shown (Figure
37, green).
Figure 37. Superimposed chromatogram obtained for Normetanephrine (m/z 166.086, tr 1.30) derived
from: Rat liver extract incubated in 50mM sodium phosphate buffer (blue), rat liver extract incubated with
Norepinephrine in absence of SAMe and MgCl2 (red) and rat liver extract spiked with Normetanephrine (green).
Note that the product NMN is detected only in the condition where the compound is spiked into the sample indicating that no endogenous and no degradation of the substrate is observed under assay conditions.

RESULTS AND DISCUSSION
111
6.2.7.2.2. Linearity of Calibration Curves and Lower Limits of Quantification (LLOQ)
To calculate the absolute amount of 3-MT generated by COMT activity, the average of the
two baseline signals was subtracted from the signals of the serially diluted calibration
samples. In the case of NMN, this subtraction was not necessary since not endogenous
product either NE degradation was detected. The calibration curves were obtained over the
concentration ranges of 0.01-25 µM (for 3-MT) and 0.005-25 µM (for NMN).
Power fitting equation was used to determine the relation between the signal (peak area) and
sample concentration:
3- MT: [Signal] = 10411 x [concentration]0,9238
(R2 > 0.99)
NMN: [Signal] = 1177 x [concentration]0,8336
(R2 > 0.99)
Once the sample concentrations were calculated, they were converted to amount (nmol) of 3-
MT or NMN produced per mg of protein obtained in 1 h.
The developed UPLC-MS methods developed offered a LLOQ of 0.01 μM for 3-MT and
0.005 μM for NMN.
6.2.7.2.3. Precision and Accuracy of the enzymatic assay
Precision and accuracy were deemed to be acceptable (<15%).
Overall, after this comprehensive optimization of the parameters for incubation conditions,
SPE and UPLC-MS analysis, sensitive and specific methods were successfully established for
measuring COMT and MAT enzymatic activities. The final conditions established for the
determination of the activities were:
For MAT activity: Enzymatic assays after optimization was carried out in a final volume of
250 µL of 50 mM HEPES/ 150mM KCl pH 8 incubation buffer containing; enzyme provider
(liver extract, microsomes or EVs), 5 mM L-Methionine, 10 mM MgCl2, 5 mM DTT, 5mM
ATP and protease inhibitor. The reaction mixture was incubated for 2 hours in a water bath at
37°C. After incubation, samples were transferred to PBA bonded silica cartridges to clean
them. Finally, samples were injected into UPLC-MS system; products of the reactions were
chromatographically separated with an Acquity UPLC BEH AMIDE column and detected
with a SYNAPT HDMS G2 Time of Flight (ToF) mass spectrometer operated in ESI+.
For COMT activity: Enzymatic assay after optimization was carried out in final volume of
300 µL of 50 mM sodium phosphate buffer pH 7.4 incubation buffer containing: enzyme
provider (liver extract, microsomes or EVs), 2 mM MgCl2, 200 μM SAMe and 2 mM DA or
0.1 mM NE. The reaction mixture was incubated for 1 hour in a water bath at 37°C. After
incubation, samples were transferred to WCX bonded silica cartridges to clean them. Finally,
samples were injected into UPLC-MS system; products of the reactions were
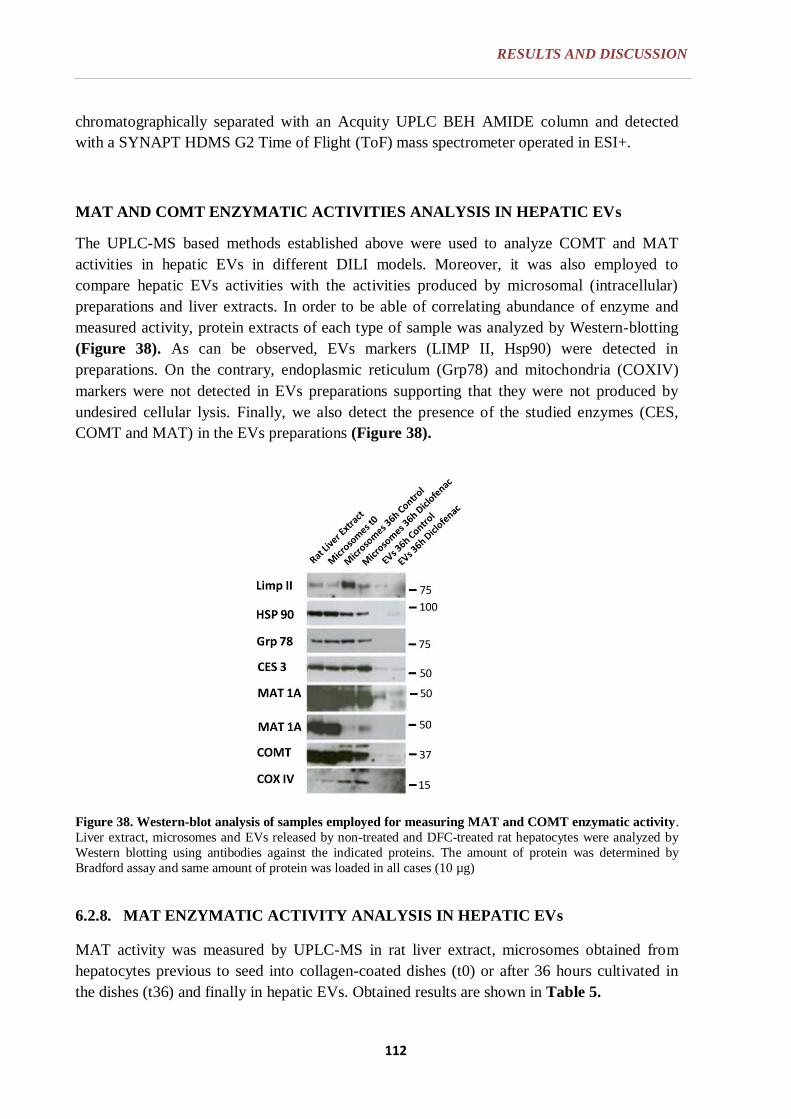
RESULTS AND DISCUSSION
112
chromatographically separated with an Acquity UPLC BEH AMIDE column and detected
with a SYNAPT HDMS G2 Time of Flight (ToF) mass spectrometer operated in ESI+.
MAT AND COMT ENZYMATIC ACTIVITIES ANALYSIS IN HEPATIC EVs
The UPLC-MS based methods established above were used to analyze COMT and MAT
activities in hepatic EVs in different DILI models. Moreover, it was also employed to
compare hepatic EVs activities with the activities produced by microsomal (intracellular)
preparations and liver extracts. In order to be able of correlating abundance of enzyme and
measured activity, protein extracts of each type of sample was analyzed by Western-blotting
(Figure 38). As can be observed, EVs markers (LIMP II, Hsp90) were detected in
preparations. On the contrary, endoplasmic reticulum (Grp78) and mitochondria (COXIV)
markers were not detected in EVs preparations supporting that they were not produced by
undesired cellular lysis. Finally, we also detect the presence of the studied enzymes (CES,
COMT and MAT) in the EVs preparations (Figure 38).
Figure 38. Western-blot analysis of samples employed for measuring MAT and COMT enzymatic activity.
Liver extract, microsomes and EVs released by non-treated and DFC-treated rat hepatocytes were analyzed by
Western blotting using antibodies against the indicated proteins. The amount of protein was determined by
Bradford assay and same amount of protein was loaded in all cases (10 µg)
6.2.8. MAT ENZYMATIC ACTIVITY ANALYSIS IN HEPATIC EVs
MAT activity was measured by UPLC-MS in rat liver extract, microsomes obtained from
hepatocytes previous to seed into collagen-coated dishes (t0) or after 36 hours cultivated in
the dishes (t36) and finally in hepatic EVs. Obtained results are shown in Table 5.
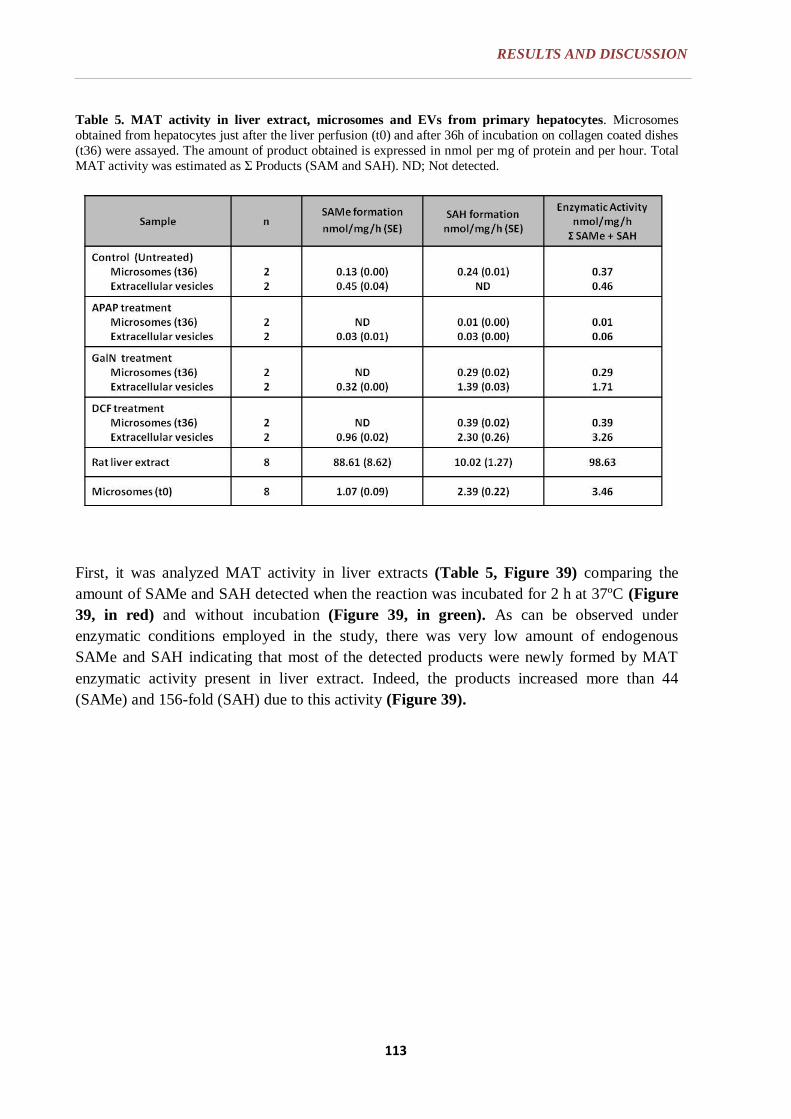
RESULTS AND DISCUSSION
113
Table 5. MAT activity in liver extract, microsomes and EVs from primary hepatocytes. Microsomes
obtained from hepatocytes just after the liver perfusion (t0) and after 36h of incubation on collagen coated dishes
(t36) were assayed. The amount of product obtained is expressed in nmol per mg of protein and per hour. Total
MAT activity was estimated as Σ Products (SAM and SAH). ND; Not detected.
First, it was analyzed MAT activity in liver extracts (Table 5, Figure 39) comparing the
amount of SAMe and SAH detected when the reaction was incubated for 2 h at 37ºC (Figure
39, in red) and without incubation (Figure 39, in green). As can be observed under
enzymatic conditions employed in the study, there was very low amount of endogenous
SAMe and SAH indicating that most of the detected products were newly formed by MAT
enzymatic activity present in liver extract. Indeed, the products increased more than 44
(SAMe) and 156-fold (SAH) due to this activity (Figure 39).

RESULTS AND DISCUSSION
114
Figure 39. Chromatograms of SAMe and SAH generated by MAT enzymatic activity in liver extract. (A) SAMe coming from enzymatic reaction (87.78 µM, in red) and endogenous SAMe (2.85 µM, in green). (B)
SAH coming from enzymatic reaction (12.51µM, in red) and endogenous SAH (0.08 µM, in green). The
concentrations of SAMe and SAH were determined based on calibration curve.
MAT activity was also detected in microsomes prepared from hepatocytes (Figure 40, Table
5). The comparison of liver extract and microsomes t0, revealed that MAT activity decreased
notably in the later, however, protein expression levels remain very similar (Figure 38). This
result suggests that during perfusion of the liver there is some inactivation of MAT activity by
an unknown mechanism at this time. Furthermore, there was also a decrease in MAT activity in
microsomes prepared from hepatocytes cultivated for 36 hours in comparison with MAT
activity detected in microsomes prepared from hepatocytes just obtained after perfusion,
microsomes t0 (Table 5). This activity decrease correlates with a decrease in protein expression
level observed by Western (see Figure 38).

RESULTS AND DISCUSSION
115
Figure 40. MAT activity in microsomes prepared from untreated and drug-treated primary hepatocytes.
Superimposed chromatograms showing the amount of products obtained (SAMe in the top and SAH in the bottom) with (in red) or without incubation (in green) in microsomes prepared from: (A) untreated hepatocytes
(signal corresponding to 0.01 µM for SAMe and 0.02 µM for SAH), (B) APAP-treated hepatocytes (signals under
limit of quantitation for both products), (C) GalN-treated hepatocytes (signal under limit of quantitation for
SAMe, and corresponding to 0.164 µM for SAH) and (D) DCF-treated hepatocytes (signal under limit of
quantitation for SAMe and corresponding to 0.308 µM for SAH).

RESULTS AND DISCUSSION
116
In the case of EVs, MAT activity was clearly detected in EVs preparations obtained from
DCF and GalN-treated hepatocytes, whereas a minimal activity was quantified in the case of
untreated and APAP-treated hepatocytes (Figure 41, Table 5). In order to confirm if the
amount of detected products came from the enzymatic reaction or were already present in the
EVs preparation (endogenous), chromatograms after samples incubation (Figure 41, in red)
or without incubating (Figure 41, green) were obtained. As can be observed in the case of
EVs secreted by DCF and GalN-treated hepatocytes, the product is newly formed by the
enzymatic reaction (Figure 41C and Figure 41D). In the case of DCF, the products SAMe
and SAH increases 28 and 30-fold, respectively. In the case of GalN treatment, the products
SAMe and SAH increases 67 and 17-fold, respectively (Table 5). In the EVs obtained from
untreated hepatocytes (Figure 41A) it was also possible to determine MAT activity although
barely quantified (0.45 nmol/mg/h) due mostly to the low yield of EVs production in
untreated conditions. EVs secreted by APAP-treated hepatocytes also showed low MAT
activity (0.06 nmol/mg/h) (Figure 41B, Table 5). However, in this case, the amount of EVs
employed to test the enzymatic assay was not a limitation. Thus, the result suggests that
APAP treatment reduce MAT activity in hepatocyte-secreted EVs in agreement with previous
reports showing a decrease in intracellular MAT activity caused by APAP overdose [194].
Figure 41. SAMe and SAH formed in EVs released by rat hepatocytes treated with different liver-
damaging drugs. Superimposed chromatograms showing SAMe (top) and SAH (bottom) formed (in red) in
EVs released by: (A) Non-treated hepatocytes (SAMe 0.039µM, SAH ND), (B) Acetaminophen-treated
hepatocytes (SAMe 0.032µM, SAH 0.030µM), (C) Galactosamine-treated hepatocytes (SAMe 0.203µM, SAH
0.87µM) and (D) Diclofenac -treated hepatocytes (SAMe 0.770µM, SAH 1.84µM). Not incubated samples were used as endogenous controls (in green): (A) Non-treated hepatocytes (SAMe ND, SAH 0.06µM), (B)
Acetaminophen-treated hepatocytes (SAMe 0.005µM, SAH 0.05µM), (C) Galactosamine-treated hepatocytes
(SAMe 0.003µM, SAH 0.05µM) and (D) Diclofenac -treated hepatocytes (SAMe 0.027µM, SAH 0.06µM). Not
incubated samples were used as endogenous control.

RESULTS AND DISCUSSION
117
Figure 41 (continuation)
In summary, MAT activity was measured by UPLC-MS in rat liver extract, microsomes t0,
microsomes t36 and hepatic EVs. As expected by the amount of protein observed in the
Western-blot analysis (Figure 38), the highest activities were obtained in liver extract and
microsomes t0 (Table 5). MAT activity was significantly reduced in hepatocytes after 36h
incubation in all the cases (microsomes t36, Table 5) suggesting that during the culture the
hepatocytes get out of this enzymatic activity. Remarkably, MAT enzymatic activity was
detected in hepatic EVs from untreated and drug-treated hepatocytes (Table 5) being
significantly higher in GalN and DCF treatments. The comparison between enzymatic activity
in microsomes t36 and EVs in the different treatments aroses different response to the
treatments. Thus, in untreated conditions the activity was quite similar in microsomes
(intracellular) and EVs whereas in GalN and DCF conditions MAT activity was much higher
in EVs. Finally the activity obtained in APAP conditions was not significant neither in EVs
nor in microsomes t36. These results indicated that intracellular retention or secretion of MAT
activity is regulated depending on the mechanism of damage.
In conclusion, these results showed that MAT enzyme associated to hepatic EVs is active and
this could have important implications in methionine metabolism.

RESULTS AND DISCUSSION
118
6.2.9. COMT ENZYMATIC ACTIVITY ANALYSIS IN HEPATIC EVs
COMT activity was measured by UPLC-MS in rat liver extract, microsomes obtained from
hepatocytes previous to seed into collagen-coated dishes (t0) or after 36 hours cultivated in
the dishes (t36) and finally in hepatic EVs. Obtained results are shown in Table 6.
Table 6. COMT enzymatic activity in rat liver extract, microsomes and EVs. Amount of products obtained
(3-MT and NMN) per mg of incubated protein in 1 hour incubation. ND; Not detected.
COMT activity was measured by UPLC-MS in rat liver extract, microsomes t0, microsomes
t36 and hepatic EVs. COMT activity was clearly detected in liver extract (Figure 42, in red).
As can be observed, the activity was abrogated by the lack of two cofactors in the reaction,
SAMe and MgCl2 (Figure 42, green line) further supporting that detected activity was
specific of COMT enzyme.

RESULTS AND DISCUSSION
119
Figure 42. Chromatograms of the products, NMN or 3-MT of COMT activity in liver extract. Liver
extract were incubated with (in red) or without (in green) SAMe and MgCl2. (A) NMN product was detected
with a signal corresponding to 13.03 µM in the mixture reaction containing all components, and to 0.01 µM in
the mixture reaction lacking SAMe and MgCl2. (B) 3-MT product was detected with a signal corresponding to
16.02 µM in the mixture reaction containing all components, and to 0.01 µM in the mixture reaction lacking
SAMe and MgCl2.
Hepatic microsomes also showed detectable levels of COMT activity. Significant differences
were observed between microsomes prepared from untreated and treated hepatocytes (Figure
43, Table 6) showing lower activity in microsomes from DCF conditions. These results were
in concordance with the immunostaining (see Figure 11) that showed a decrease in COMT
protein expression in DCF-treated hepatocytes with respect to untreated cells indicating that
hepatic COMT activity is altered in DILI. Furthermore, there was significant difference in
COMT activity between microsomes t0 and microsomes t36 (Figure 44, Table 6). In this
regard, a comparison of the activity measured in microsomes t0 and microsomes t36 showed a
clear COMT activity decrease within time for both products NMN (Figure 44A) and 3-MT
(Figure 44B). This result also correlates with a decrease in COMT protein expression
observed by Western blotting (see Figure 38).

RESULTS AND DISCUSSION
120
Figure 43. COMT enzymatic activity in hepatic microsomes from untreated and DCF-treated hepatocytes.
(A) Superimposed chromatograms showing the amount of 3-MT formed in microsomes. Amount of 3-MT
obtained in the presence of Microsomes Control t36 (the observed signal correspond to 2.81µM, green) and in
the presence of Microsomes Diclofenac t36 (1.60µM, red). The amount of 3-MT resulting from dopamine
degradation was under LLOQ (slightly visible at the bottom of the chromatogram). (B) Superimposed
chromatograms showing the amount of NMN formed in microsomes: Microsomes Control t36 (3.07µM,
green) and Microsomes Diclofenac t36 (1.42µM, red). The amount of obtained product coming from
Norepinephrine (substrate) degradation was under LLOQ (At the bottom of the chromatogram).

RESULTS AND DISCUSSION
121
Figure 44. COMT enzymatic activity in hepatic microsomes and EVs (A) Superimposed chromatograms
showing the amount of 3-MT formed in: Microsomes t0 (9.41µM, red), Microsomes Control t36 (2.81 µM,
green), Microsomes Diclofenac t36 (1.60 µM, yellow) and EVs Diclofenac (0.03 µM, blue). (B) Superimposed
chromatograms showing the amount of NMN formed in: Microsomes t0 (13.30 µM, red), Microsomes
Control t36 (3.07 µM, green), Microsomes Diclofenac t36 (1.42µM, yellow) and EVs Diclofenac (0.07 µM,
blue).
Remarkably, hepatic EVs also showed COMT enzymatic activity. On this regard, as can be
observed in the Figure 45, specific activity in EVs secreted from untreated hepatocytes using
DA (Figure 45A) and NE (Figure 45B) as substrates was detected although it was quite low
(0.27 and 0.05 nmol/mg/h respectively) (Table 6). Conversely to microsomes, in the case of
EVs, the activity was higher in EVs secreted by DCF-treated hepatocytes compared to EVs
secreted by untreated cells (Table 6).

RESULTS AND DISCUSSION
122
Figure 45. COMT enzymatic activity in hepatic EVs. (A) Superimposed chromatograms showing the
amount of 3-MT formed in EVs released by non-treated rat hepatocytes cultured for 36h. Incubating: 30µg
of EVs in the reaction mixture (0.02 µM, green) or 30µg of EVs in buffer (Not detectable, blue). (B)
Superimposed chromatograms showing the amount of NMN formed in EVs released by non-treated rat
hepatocytes cultured for 36h. Incubating: 30µg of EVs in the reaction mixture (0.0031, green) or 30 µg of EVs
in buffer (Not detectable, blue).
As showed in Figure 46, there was dose-dependence COMT activity for both compounds DA
(Figure 46A) and NE (Figure 46B). Thus, when the amount of protein employed in the
reaction was doubled from 50 to 100 µg, 5.6 (3-MT) and 6.6 (NMN) fold more products were
obtained from DA and NE, respectively.

RESULTS AND DISCUSSION
123
Figure 46. COMT enzymatic activity in hepatic EVs incubating different amounts of protein. (A)
Superimposed chromatograms showing the amount of 3-MT formed in EVs secreted by primary
hepatocytes cultured for 36h in the presence of DCF. Each peak represent different incubation reactions as
follows: 100 µg (in red) or 50 µg (in green) of EVs in the reaction mixture, 50 µg of EVs with DA in absence
of SAM and MgCl2 (3-MT resulting from dopamine chemical degradation, under LLOQ, yellow) and 50 µg of
EVs in buffer (endogenous 3-MT, under LLOQ, blue). (B) Superimposed chromatograms showing the
amount of NMN formed in EVs secreted by rat hepatocytes cultured for 36h in the presence of DCF. Each
peak represent different incubation reaction as follows, incubating: 100 µg (in red) or 50 µg (in green) of EVs in
the reaction mixture, 50 µg of EVs with NE in absence of SAM and MgCl2 (NE degradation, in yellow) and 50
µg of EVs in buffer (Endogenous NMN, under LLOQ, blue)
In summary, in all cases, COMT activity was detected (Table 6). These results support the
presence of active COMT enzyme in hepatic EVs, increasing its activity in DILI conditions.
Overall, employing fluorometric assay or UPLC-MS based metabolomics, significant changes
in the activities of the studied enzymes, CES, MAT and COMT contained in hepatic EVs in
DILI models were detected. These results also support the development of diagnosis methods
based on these activities for DILI detection in a low-invasive manner.

RESULTS AND DISCUSSION
124
6.3. METABOLIC PROFILING OF HEPATIC EVs
As shown in the previous sections, hepatic EVs are complex in composition containing
several active metabolic enzymes supporting an important role in metabolism regulation in
the extracellular space. Following this aim of elucidating the function of these hepatic EVs,
UPLC-MS metabolomics was applied. It constitutes a powerful unbiased tool to identify
metabolites associated with a determined biological system. The detection of these
metabolites would identify additional metabolic pathways and functions where hepatic EVs
could play a physiological role.
Metabolomics experiments must be carefully designed to ensure the reproducibility of the
results. Thus, they must combine the appropriate use of analytical tools to allow the maximum
coverage of the metabolome. In addition, due to the high heterogeneity of the metabolites
(chemical structure, physicochemical properties and concentration), the process always has a
certain degree of bias which is dependent on the metabolite selection and will occur from the
metabolite extraction until its detection [136][195]. Thus, metabolomic approaches must
apply adequate sample collection, handling, extraction, preparation and storage procedures to
reduce these effects [196]. In the same way, the application of adequate tools to acquire, store,
normalize, analyze and evaluate the data will be necessary in order to draw accurate
conclusions. Recent advances in both, analytical and computational approaches, as well as the
optimization of sample preparation protocols, have led to a wide coverage of the metabolome
[137]. Since there are not studies reported on metabolomics applied to EVs, it was necessary
to establish the conditions to apply this technology. Thus, for this section, we chose hepatic
EVs released by MLP-29 murine cell line was choosen since they offer more flexibility and
homogeneity that primary culture of hepatocytes. The metabolic profile of EVs secreted by
this cell line is described using UPLC-MS based metabolomics in order to elucidate pathways
and functions where these vesicles could be involved. Moreover, in this doctoral thesis it was
also carried out a systematic characterization of metabolic signals detected and in some cases
enriched in EVs when compared to the cellular content.
6.3.1. METABOLITES EXTRACTION METHOD SELECTION
Successful metabolome research requires effective metabolic extraction. Extraction is the
process by which compounds, in this case metabolites, are selectively separated from other
compounds, often undesired, such as proteins in this study [197].
For metabolic studies, it is important to perform an appropriate extraction method selection to
choose that one that will extract the maximum number of metabolites in their original state.
Given the metabolome complexity (metabolites of different chemical nature), there is not one
unique extraction procedure for metabolome analysis that will cover all metabolites so
different extraction protocols must be tested. In metabolome studies, metabolites are usually
extracted with organic solvents, being frequent the use of more than one solvent in the
extraction procedure [198]. In this study, due to the limiting amount of EVs sample,

RESULTS AND DISCUSSION
125
extraction method evaluation was only performed in cells. The following metabolites
extraction protocols were tested for UPLC-MS based untargeted metabolic analysis:
- MeOH/Water (50:50, v/v): Methanol and water are miscible within each other and able to
dissolve polar compounds. Methanol is usually used as aqueous phase co-solvent to
enhance solubility of less polar metabolites.
- MeOH/Water/Chloroform (25:25:50, v/v/v): Aqueous phase (methanol/water) is often
paired with organic phase (chloroform) which are immiscible between them, forming a
two phase system that allows the separation of polar (in the aqueous phase) and non-polar
(in the organic phase) metabolites for subsequent chromatographic separation and
analysis.
- Isopropanol: Same as Methanol, Isopropanol is also used as aqueous phase co-solvent to
improve the solubility of less polar metabolites.
After cell lysis by sonication, the three extraction methods listed above were tested in
triplicate. After metabolic extraction, the solvents were removed by centrifugation under
vacuum condition and then solubilized in mobile phase and injected into UPLC-MS system to
obtain the metabolic profile of each method.
In the Figure 47 is shown the multivariate analysis (PCA) of the metabolic profiles
corresponding to the different extraction methods analyzed in a C18 chromatographic column.
A clear group clustering is observed due to the different metabolic profiles obtained for each
extraction method. There are three clusters clearly separated: one related to metabolites
extracted with Methanol/Water and Isopropanol methods. Both are very close in the PCA,
given that they extract metabolites with very similar chemical nature (polar metabolites).
Regarding MeOH/Water/Chloroform extraction method, two differentiated clusters are
shown: one group correspond to the metabolites extracted in the organic phase (chloroform)
and the other to metabolites extracted in the aqueous phase (MeOH/Water). Thus, apolar and
polar metabolites are separated respectively.

RESULTS AND DISCUSSION
126
Figure 47. Principal Component Analysis (PCA) of the metabolic profiles obtained using different
extraction methods. Three extraction methods were tested each of them in triplicated.: Methanol/Water (red),
Isopropanol (IPA, black) and Methanol/Water/Chloroform (organic phase in blue and aqueous phase in green).
Quality controls are also included (QCs, yellow). t[1] denotes sample type and t[2]) intraclass variation.
Once metabolites were extracted, they were chromatographically separated using two
different retention columns in order to cover the maximum number of metabolites: C18
enables the chromatographic separation of both polar and non-polar compounds and amide
retains very polar compounds. In the Table 7 is shown the number of metabolic signals
detected using the different extraction methods combined with C18 or amide chromatographic
columns. As can be deduced by the sum of the number of metabolites extracted in the aqueous
phase (2459 signals in the amide column) and in the organic phase (1569 signals in the C18
column), Methanol/Water/Chloroform was clearly the most efficient extraction method.

RESULTS AND DISCUSSION
127
Table 7. Number of metabolic signals in C18 and amide columns using different metabolites extraction
methods. Note: methanol/Water/Chloroform extraction method obtains the highest number of extracted
metabolites.
In conclusion, MeOH/Water/Chloroform showed to be the most effective extraction method,
for both polar and non-polar compounds providing the highest number of metabolic signals.
6.3.2. ULTRA PERFORMANCE LIQUID CHROMATOGRAPHY – MASS
SPECTROMETRY ANALYSIS
Because the metabolome is highly complex there is not a single detection/separation
technique that covers the entire metabolome. The combined application of several different
techniques is needed in order to enable a broad coverage of the metabolome (polar and non-
polar metabolites). In this regard, in this study two separated chromatographic techniques
coupled with MS were used to perform optimal metabolic separation. First, reversed-phase
liquid chromatography-MS (RP-UPLC/MS) was employed using C18 column that results in
the separation and detection of both polar and non-polar compounds [199]. As the capability
of RP columns to retain ionic or highly-polar compounds is limited [200][201], an amide
column was also used in the study which enables the chromatographic separation of very
polar compounds.
The conditions of each chromatographic technique are detailed in section 5.17.3 of
“Experimental procedures”.
6.3.3. DATA PROCESSING
In contrast to targeted approaches (such as used in the previous section regarding enzymatic
assays), untargeted UPLC-MS-based metabolomics provides an enormous volume of data that
cannot be manually analyzed, and is complicated even more due to experimental drifts in the
instrumentation [135], [200]. Thus, before data analysis, MS spectra must be corrected for all

RESULTS AND DISCUSSION
128
variation caused by experimental variables adjusting different parameters. This is a critical
part in data mining as it can drastically interfere with the next step, multivariate data analysis
[202]. To overcome these issues, specific software that offers the possibility to adjust all these
parameters are employed.
After metabolites extraction and injection in the UPLC-MS system, the generated data was
processed using MassLynx 4.1 software that is a post-acquisition processing package that can
be applied to MS data files. Both chromatographies (C18 and amide) and their corresponding
mass spectrometry polarities (ESI+ and ESI- modes) were analyzed separately. The
UPLC/MS data were peak-detected and noise reduced such that only true analytical peaks
were further processed by the software. By doing this process, the metabolic background
introduced during isolation and extraction processes were removed from the data in order to
identify the metabolome truly associated with the samples of interest. A list of intensities
(chromatographic peak areas) of the peaks detected was then generated, using the Rt-m/z
(retention time and m/z) data pairs as identifiers (in a mass window of 0.02 Da and a RT
window of 0.05 min).
In the Table 8 is shown the total number of detected signals (cells and EVs) and also those
ones present in EVs.
Table 8. Metabolic signals detected by UPLC-MS in MLP29 cells and their secreted EVs. Detected signals
using two chromatographic columns (Amide and C18) and running the samples in positive and negative
ion mode. Total number of detected signals (cells and EVs) as well as those ones present in EVs are indicated.
6.3.4. MULTIVARIATE DATA ANALYSIS: PRINCIPAL COMPONENT
ANALYSIS (PCA)
The UPLC-MS data obtained by peak extraction and background reduction using MassLynx
is now suitable for mathematical and statistical analyses in order to identify significant
difference between sample groups. In this regard, multivariate data analysis is a statistical
approach that facilitates the identification of differences or similarities between groups
comparing the samples by statistical methods [203]. Its principal objective is to reduce the
dimensionality of the complex data set to enable easy visualization of any metabolic

RESULTS AND DISCUSSION
129
clustering of the different groups of samples [137], in this case cells and EVs. This is
achieved by PCA where the discrimination between samples is done based on their metabolic
profiling without prior knowledge of sample classes. Basically, the data matrix is reduced to a
series of principal components (PCs), each a linear combination of the original Rt-m/z pair
peak areas [204].
After data processing, base peak chromatograms extracted in the organic (apolar dataset) and
aqueous (polar dataset) phase, in ESI+ and ESI- mode, were obtained. In the Figure 48 is
observed the different chromatographic profiles obtained for cells and EVs, suggesting a
variable metabolic content. In base peak chromatograms, is clearly observed the enrichment
of some metabolic signals in EVs (in green) with respect to cells (in red) given the clear
differences in peaks intensities between two sample groups.
Figure 48. Representative base peak chromatograms of UPLC-MS analysis of MLP29 cells and
corresponding secreted EVs. Base peak chromatograms of MLP29 cell line (in red) and secreted EVs (in
green), extracted in organic (C18 column) (A) and aqueous (amide column) (B) phase and run in ESI+ (top) and
ESI- (bottom) mode.
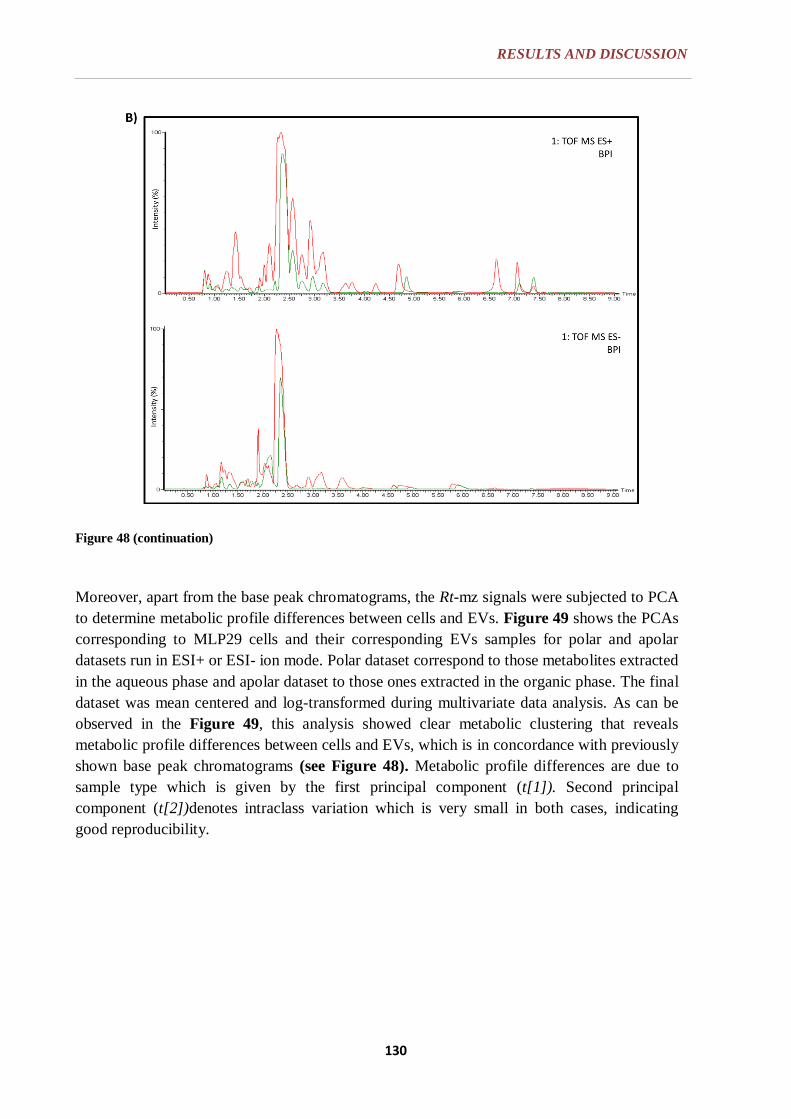
RESULTS AND DISCUSSION
130
Figure 48 (continuation)
Moreover, apart from the base peak chromatograms, the Rt-mz signals were subjected to PCA
to determine metabolic profile differences between cells and EVs. Figure 49 shows the PCAs
corresponding to MLP29 cells and their corresponding EVs samples for polar and apolar
datasets run in ESI+ or ESI- ion mode. Polar dataset correspond to those metabolites extracted
in the aqueous phase and apolar dataset to those ones extracted in the organic phase. The final
dataset was mean centered and log-transformed during multivariate data analysis. As can be
observed in the Figure 49, this analysis showed clear metabolic clustering that reveals
metabolic profile differences between cells and EVs, which is in concordance with previously
shown base peak chromatograms (see Figure 48). Metabolic profile differences are due to
sample type which is given by the first principal component (t[1]). Second principal
component (t[2])denotes intraclass variation which is very small in both cases, indicating
good reproducibility.

RESULTS AND DISCUSSION
131
Figure 49. Principal component analysis of UPLC-MS data obtained from MLP29 cells and their
corresponding secreted EVs. PCA of polar (A) and apolar (B) datasets run in positive (left) and negative
(right) ion mode reveals metabolic profile differences between cells and EVs. The first two principal
components ( t[1] and t[2]), represent the most important metabolic variation in the samples captured by the
analysis. t[1] denotes the contribution of a particular marker to the group differences and t[2] intraclass
variation. A clear metabolic clustering between cells and EVs is shown which is translated in significant
metabolic profile differences. Note that Quality Controls (QCs) are not in the center because they were made
only with cells.
6.3.5. EVs METABOLIC PROFILING, METABOLIC SIGNAL SELECTION AND
METABOLITE IDENTIFICATION
After multivariate analysis, next step was to detect on one side metabolic signals that are
present in hepatic EVs (metabolome of EVs) and on the other side to detect metabolic signals
that could be enriched in hepatic EVs. For this second aim, scatter plots representation
obtained from the PCAs, what allows distinguishing the signals that discriminate the two
sample groups, were used as a statistical tool. Finally, once obtained the list of metabolic
signals forming EVs metabolome or the signals enriched in them, some metabolic signals
were pre-selected for further identification. This latter step implicates elemental composition
calculation together with database search (METLIN/HMDB) [205].
A robust metabolic profile (metabolome) of hepatic EVs was established among all the
metabolic signals detected after noise reduction and removing the metabolic signals coming
from tissue culture media [157] (Figure 50). The applied selection criteria was as follows: all
the metabolic signals must be present in all analyzed EVs samples (n=5) and their coefficient

RESULTS AND DISCUSSION
132
of variation (CV) must be < 20%. Overall, the number of metabolic signals detected in the
EVs samples in amide (ESI+), C18 (ESI+) and C18 (ESI-) were 3166, 3006 and 1077,
respectively. By applying the selection criteria, the number of metabolic signals was reduced
to 224 (amide ESI+), 81 (C18 ESI+) and 37 (C18 ESI-) (Table 9). The metabolic signals
extracted in aqueous phase analysed in negative ion mode were not considered given that CV
was higher than 20% in all the cases. It is important to highlight that a metabolite can
originate multiple metabolic signals. Thus, the number of metabolites represented in this
metabolome (formed by 342 metabolic signals) is overestimated, until further identification of
the signals is achieved.
Figure 50. Metabolic background introduced by tissue culture media in EVs analysis. Metabolites were
extracted using Chloroform:methanol from the pellet obtained by applying the conventional ultracentrifugation-
based exosomal purification procedure to 300 ml of EVs-depleted complete media incubated at 37°C during 72h
in absence of cells. Extracted metabolites were analyzed by UPLC-MS using a C18 chromatographic column.
Retention time of the metabolites along with their peak intensities are indicated in the plots. Note the elevated
number of metabolites of different chemical nature that are isolated using the EVs purification procedure and
that need to be removed in order to determine the metabolome that is truly associated to EVs.

RESULTS AND DISCUSSION
133
Table 9. The metabolome of EVs secreted by MLP-29 hepatic cell line. In this table are listed all the metabolic
signals present in EVs once subtracted background noise and contaminants coming from culture media. The signals
are ordered in increasing retention time (RT) and with their respective m/z value. All these metabolic signals are
present in all EVs samples (n=5) and have a coefficient of variation (CV) < 20%.
Amide_ESI + Amide_ESI + Amide_ESI + C18_ESI + C18_ESI -0.88_425.1392 1.45_451.2660 3.02_303.1779 0.58_277.1069 0.49_446.9074
0.92_468.3084 1.45_564.2747 3.03_184.0735 1.76_300.2040 0.49_604.8720
0.92_494.3240 1.46_129.0687 3.06_261.1634 2.09_282.1929 2.88_187.0975
0.92_892.4553 1.47_229.1190 3.08_416.2979 4.32_540.3351 5.04_239.1296
0.93_592.3338 1.47_291.0705 3.08_521.3194 4.56_522.3237 5.24_692.3842
0.93_756.3907 1.49_307.0444 3.09_129.1029 5.10_355.1115 5.26_497.2933
0.94_245.1860 1.50_158.8439 3.10_374.2144 5.25_383.3315 5.68_194.0823
0.94_279.1714 1.53_112.0533 3.10_408.2523 5.72_367.2471 5.82_450.2620
0.94_710.8664 1.55_248.0905 3.12_213.0988 5.84_266.6424 5.84_194.0827
0.96_232.1548 1.61_1089.4787 3.12_261.0898 5.94_367.2467 5.98_297.1534
1.00_516.3019 1.62_1173.4403 3.12_275.1724 6.27_267.6490 6.07_194.0821
1.01_297.1547 1.62_294.8445 3.12_290.1465 6.29_107.0724 6.16_194.0822
1.01_472.2759 1.63_248.0904 3.12_333.1873 6.31_308.2814 6.24_452.3133
1.02_275.1113 1.67_448.7408 3.14_257.1245 6.37_504.3079 6.25_443.3486
1.03_184.9807 1.67_532.7013 3.24_289.1622 6.40_246.6258 6.40_452.2785
1.07_202.1086 1.67_700.6267 3.31_168.0771 6.40_454.2933 6.40_520.2650
1.10_215.1396 1.67_702.6244 3.32_303.1777 6.40_476.2757 6.42_421.2803
1.15_335.1061 1.67_786.5878 3.33_584.3580 6.41_494.2903 6.44_1035.6603
1.16_296.1582 1.68_196.8574 3.37_116.0712 6.42_434.3391 6.44_608.3187
1.17_430.2658 1.81_122.0719 3.37_133.0977 6.42_949.6222 6.60_478.2935
1.17_452.2474 1.82_163.0982 3.45_239.1065 6.43_400.3432 6.60_546.2791
1.17_468.2076 1.87_214.0070 3.50_517.2859 6.44_1003.1501 6.63_634.3339
1.18_352.1838 1.88_606.7881 3.59_348.0712 6.44_1011.1448 6.65_526.3508
1.19_261.1452 2.18_275.1356 3.61_215.6495 6.44_1013.6511 6.66_301.1664
1.20_357.2134 2.19_102.0563 3.63_118.0871 6.44_276.6343 6.66_522.2827
1.22_326.1701 2.19_120.0664 3.75_211.0852 6.44_297.1491 6.83_466.2954
1.22_375.2245 2.19_402.2457 3.78_118.0871 6.44_478.3301 6.86_554.3457
1.22_397.2044 2.20_242.6425 3.84_402.2824 6.44_515.3137 7.08_480.3436
1.22_495.2536 2.21_175.1197 3.85_206.1030 6.44_524.2980 7.09_480.3101
1.23_213.1242 2.21_188.1762 3.97_304.0168 6.44_534.2951 7.25_480.3087
1.23_438.2318 2.21_364.2079 4.20_328.2844 6.46_425.3750 7.25_548.2962
1.24_260.1598 2.22_249.1087 4.22_484.1184 6.48_447.3563 7.29_585.3521
1.24_282.1434 2.23_361.2188 4.26_164.9290 6.53_373.2964 7.32_325.1839
1.25_423.2210 2.25_257.1246 4.28_399.1450 6.60_259.6340 7.34_449.3109
1.25_509.2688 2.25_375.2341 4.28_452.2429 6.60_462.2966 8.16_367.2638
1.26_253.1196 2.25_427.1763 4.33_328.2851 6.60_480.3083 8.45_311.2009
1.26_312.1541 2.25_502.8259 4.34_282.2795 6.63_280.6563 8.52_381.1748
Metabolic signals present in hepatic EVs

RESULTS AND DISCUSSION
134
Table 9. (continuation)
(Continuation) Metabolic signals present in hepatic EVs
Amide_ESI + Amide_ESI + Amide_ESI + C18_ESI +1.26_339.1639 2.26_476.2730 4.36_164.9309 6.63_541.3288
1.26_353.1790 2.26_562.7655 4.63_427.0952 6.64_438.2985
1.26_566.2939 2.28_414.7210 4.64_449.0773 6.65_504.3418
1.27_575.1305 2.29_742.4016 4.65_471.0594 6.66_422.3388
1.27_813.4551 2.30_374.2385 4.66_635.1414 6.67_496.3399
1.29_219.1347 2.30_806.4510 4.67_613.1603 6.78_466.3310
1.29_325.0545 2.45_360.2243 4.67_657.1240 6.80_464.3138
1.29_401.2400 2.48_484.2550 4.81_112.1125 7.08_436.3549
1.30_303.0718 2.49_473.2830 4.81_129.1391 7.08_482.3234
1.30_480.2475 2.50_189.1352 4.81_146.1658 7.09_315.1755
1.30_854.3631 2.50_317.1933 4.90_110.0095 7.11_546.3527
1.30_945.0115 2.55_400.0519 4.90_151.0358 7.23_395.2773
1.31_407.2643 2.55_502.8258 4.90_223.9896 7.25_260.6406
1.31_458.2610 2.55_520.0116 5.15_146.1657 7.25_464.3138
1.32_629.3980 2.56_515.2131 5.20_129.1392 7.25_482.3245
1.34_247.1316 2.63_375.1982 5.39_146.1658 7.25_504.3092
1.35_260.1612 2.64_189.1352 5.75_146.1659 7.25_963.6367
1.35_387.2244 2.66_612.3472 5.90_146.1658 7.27_1027.6648
1.36_612.3358 2.69_124.0866 6.03_146.1658 7.27_517.3721
1.38_137.0463 2.69_868.9383 6.14_146.1661 7.29_1069.7114
1.39_444.3186 2.70_893.4486 6.25_146.1658 7.29_552.3305
1.40_783.4347 2.71_375.1980 6.40_146.1656 7.29_805.0245
1.41_254.1602 2.72_822.4104 6.47_308.2186 7.29_808.0329
1.41_805.4183 2.74_326.0147 6.56_146.1657 7.30_151.0978
1.42_310.1404 2.75_228.0372 6.58_614.3002 7.31_562.3252
1.42_470.2612 2.75_367.1396 6.70_146.1659 7.35_149.0248
1.42_854.4720 2.75_382.8651 6.83_350.2666 7.37_508.3400
1.43_276.1453 2.75_86.0972 6.84_343.1451 7.39_379.2854
1.43_325.1482 2.76_402.6980 6.88_393.5685 7.40_294.6718
1.43_332.1219 2.78_347.2019 6.88_589.8485 7.43_429.2607
1.43_369.1733 2.83_232.1406 6.94_350.2670 7.48_526.3136
1.43_493.2381 2.83_238.0463 7.08_305.1487 7.49_468.3449
1.44_123.0450 2.83_427.1939 7.09_301.1138 7.52_510.3920
1.44_147.0447 2.86_130.1591 7.09_303.1108 7.54_470.3501
1.44_430.3012 2.88_222.6569 7.19_625.2798 7.56_508.3758
1.44_862.4368 2.90_429.2453 7.20_466.2747 7.60_695.4128
1.44_876.4544 2.93_157.1091 7.74_203.2236 8.14_413.3239
1.45_282.2791 2.96_413.2181 7.84_203.2233 8.14_552.4017
1.45_359.2653 2.99_257.1781 8.14_574.3864
8.21_303.2906
8.21_325.2716
8.21_369.2985
8.21_480.4254
8.21_578.4174
RESULTS AND DISCUSSION
135
Once selected metabolic signals belonging to hepatic EVs metabolome, some of them that
belong to the analysis done in aqueous phase (amide) started to be identified by elemental
composition calculation and database search. Table 10 summarizes some of the origins of the
metabolic signal together with their corresponding implications. Roughly, the characterization
of EVs metabolome reveals a very diverse metabolic content that covers a wide range of
functions and implications in different pathways. Among others, it has been detected
polypeptides involved in nitric oxide cycle, tissue regeneration or redox reactions. Amino
acids and related compounds involved in methionine cycle. Lipids involved in lipid
metabolism, biological membrane integrity, antigen presentation or signal transduction.
Nucleotides involved in DNA/RNA or glycogen metabolism. Polyamines involved in DNA
stabilization and proliferation (Table 10).
In addition to this general characterization of EVs metabolome, in this part of the work a
targeted metabolomics approach was also employed to look for metabolites that were
routinely analyzed in the metabolomics platform of CIC-bioGUNE corresponding to the
methionine cycle [147]. As can be observed in the Table 11, it was possible to detect
significant levels of SAMe, SAH, MTA, Spermine, Spermidine and GSSG. The detection of
these metabolites in hepatic EV indicates that these EVs could have a role in the methionine
metabolism in the extracellular environment. This is also supported by the detection of MAT
activity in hepatic EVs showed in the previous section of enzymatic activities. Another
metabolite present in hepatic EVs was the oxidized form of glutathione (GSSG). Interestingly,
while GSSG was clearly present in all EVs samples, reduced form (GSH) was not detected in
any of the sample, suggesting that EVs could provide a selective transport of GSSG outside
the cell.

RESULTS AND DISCUSSION
136
Table 10. Hepatic EVs metabolome characterization. Metabolic signals extracted in the aqueous phase started
to be characterized. In this table are summarized some of these metabolic signals origins together with their
corresponding implications. Abbreviations: IDs; Identifications, PUFAs; Poliunsalturated Fatty Acid.
Origin Implications Possibles IDs
Polypeptides (Di-, Tri-, Tetra-peptides) Protein catabolism Aspartyl-Arginine
Nitric Oxyde cycle L-NMMA (NG-monomethyl-L-arginine )
Urea cycle Ornithine
Collagen synthesis (Regeneration) L-Proline
4-Amino-2-methylenebutanoic acid
Redox reactions (Prevent damage caused by ROS ) GSH (Glutatione)/ GSSG (Gluthathione disulfide)
Cysteineglutathione disulfide
Amino Acids and related compounds Methylation (Methionine cycle) Methionine
S-adenosyl methionine (SAMe)
S-adenosyl homocysteine (SAH)
Lipids
Short chain lipids Steroids degradation 2-Oxo-4E-hexenoic acid
7-beta-D-Glucopyranosyloxybutylidenephthalide
Phospholipids Lipids metabolism Glycerylphosphorylethanolamine
Phosphocholine
sn-glycero-3-phosphoethanolamine
Biological membranes integrity, Antigen presentation Phosphatidylcholine (O-12:0/O-1:0) (PC)
Phosphatidylethanolamine(O-16:0/0:0) (PE)
Protein targeting PIP2(20:1(11Z)/18:1(9Z))
Glycosphingolipids Signal transduction Gangliosides
Muscle and nerve cell membrane integrity Cerebrosides
PUFAs Membrane structure and function Docosahexaenoyl Acid (DHA)
Fatty acids oxidation 5,8-tetradecadienoic acid
Palmitoyl-L-carnitine
Nucleotides DNA/ RNA metabolism, glycogen metabolism Adenosine monophosphate (AMP)
Deoxyguanosine 5'-monophosphate (dGMP)
7-alpha-D-Ribosyladenine 5'-phosphate
Aromatic compounds Purine metabolism Tetrahydroxypteridine (Pteridine)
Xanthine-8-carboxylate
Folic acid metabolism Tetrahydrofolate
Polyamines DNA stabilization, cell division, cell differentiation N8-Acetylspermidine
N1-Acetylspermidine
Spermine
Dicarboxylic acids Polyamines and poliesters synthesis Undecanedioic acid
Krebs cycle intermediary Disodium succinate
Steroid Hormones Androgenic activity Testosterone sulfate
Salts Chemical synthesis Zinc acetate
Metabolic signals

RESULTS AND DISCUSSION
137
Table 11. Metabolites implied in different pathways are contained in hepatic EVs. The intensity of detected
compounds is indicated. All of them were detected in cells (data not shown) and EVs except GSH which was
only detected in cells. Both, cells and EVs, n=5. Abbreviations: SAMe; S-Adenosyl Methionine, SAH; S-
Adenosyl Homocysteine, MTA; 5'-methylthioadenosine, GSH; Glutathione, GSSG; Glutathione disulfide,
N.D; Not detected. Controls: EVs isolation, Metabolites derived from the culture media; Extraction, Metabolites
derived from the extraction procedure.
A second aim in the UPLC-MS metabolomics analysis of hepatic EVs, was to detect
metabolic signals that are enriched in EVs having into account the abundance of this
metabolic signal in the cells. With this aim, the scatter plots of extracted metabolic signals
were obtained from the PCAs. In the Figure 51 are represented the scatter plots
corresponding to polar and apolar datasets run in positive and negative ion mode. Each dot
represents an individual EMRT (exact mass-retention time pair). Above the straight line that
crosses the intercept, are plotted those metabolic signals detected preferentially in EVs,
whereas the metabolic signals enriched in cells are represented behind the line. The signals
located in the intercept are supposed to be present in both sample groups at similar levels.
EVs samples (n=5) and their coefficient of variation (CV) must be < 20% (Table 12).
SAMe SAH MTA Spermine Spermidine GSH GSSG
Controls EVs isolation N.D N.D N.D 677,167 138,066 N.D N.D
Extraction N.D N.D N.D N.D N.D N.D N.D
Samples EVs_1 316,213 13,102 47,784 5286,412 11065,136 N.D 339,27
EVs_2 237,822 7,612 51,379 3916,716 9433,967 N.D 302,309
EVs_3 267,865 9,378 57,418 5083,345 9673,424 N.D 320,599
EVs_4 311,038 13,55 48,913 5787,432 10134,849 N.D 359,135
EVs_5 391,789 5,856 53,814 5369,561 11116,04 N.D 378,672
Metabolites

RESULTS AND DISCUSSION
138
Figure 51. Scatter plots of polar (A) and apolar (B) dataset, run in ESI+ (top) and ESI- (bottom) mode
for MLP-29 cells and secreted EVs. Each dot represents a single data point. The x axis represents the number
of metabolic signals and y axis denotes the confidence of a signal contribution to the group differences. Above
the straight line that crosses the intercept, are plotted those metabolic signals corresponding to EVs, whereas the metabolic signals related to cells are those represented behind the line. The signals situated in the intercept are
supposed to be present in both sample groups. The cut-off (red line) delimits the metabolites that are considered
to be present in one of the two sample groups. The closer the data points come to 0, the higher the similarity
between the two sample group and vice versa.
Thus, in order to obtain metabolic signals enriched in hepatic EVs a cut-off (red line) in the
scatter plot was arbitrary established in order to delimit the metabolic signals considered to be
enriched in one of the two sample groups (Figure 51). The metabolic signals enriched in EVs
(above de cut-off) were selected and listed in the Table 12 indicating their Rt_m/z value.

RESULTS AND DISCUSSION
139
Table 12. Metabolic signals enriched in hepatic EVs secreted by MLP-29 cell line. Metabolic signals are ordered in increasing retention time (RT) which their respective m/z value. The ion mode is also specified. Its
color represent a unique metabolite which different structural conformation

RESULTS AND DISCUSSION
140
Some of the metabolic signals enriched in EVs were pre-selected for further identification.
Thus, those signals that showed a clear difference in peak intensity (peak area) between cells
and EVs were selected. With this aim, the extracted ion chromatogram (XIC) and trendplot
were obtained for the EVs-enriched metabolic signals. XIC represents the selected peak after
each extraction from the entire chromatogram and the trendplot displays a plot of intensities
of the selected metabolite throughout the replicates (n=5) and sample types. Two
representative examples of EV-enriched metabolic signals are showed in Figures 52 and
Figure 53. In the chromatogram (A) is clearly observed how, in both cases, the intensity of
the peak is much higher in EVs (in green) than in cells (in red). Moreover, this intensity
remains more or less similar across all samples (n=5) as revealed by the trendplot (B),
supporting the reproducibility of the analysis.
Figure 52. Example of the identification of a metabolite enriched in EVs in the aqueous phase. (A) Extracted Ion Chromatogram: y axys denotes the intensity of the peak in percentage. X axys indicate the
retention time of the metabolite. The peak that corresponds to EVs is represented in green and cells in red. (B)
Trendplot: y axys denotes the intensity of the peak in percentage and X axys analyzed sample in the trendplot.
Samples 7-11 correspond to EVs and 17-21 to cells. (C) Possible identifications of the metabolite after a
database search.

RESULTS AND DISCUSSION
141
For organic phase some polipeptides and abundant lipids were detected. In Figure 54 are
shown some examples of metabolites enriched in EVs extracted in organic phase.
Figure 53. Example of the identification of a metabolite enriched in EVs in the organic phase. (A)
Extracted Ion Chromatogram: y axys denotes the intensity of the peak in percentage. X axys indicate the
retention time of the metabolite. The peak that corresponds to EVs is represented in green and cells in red. (B)
Trendplot: y axys denotes the intensity of the peak in percentage and X axys analyzed sample in the trendplot.
Samples 10-14 correspond to EVs and 20-24 to cells. (C) Possible identifications of the metabolite after a
database search.
In summary, metabolomics applied to the functional study of hepatic EVs offer a powerful
tool to identify the different pathways in which hepatic EVs are implied. Moreover, several
potential metabolic signatures discovered through untargeted metabolomics have been
reported over the past year in several diseases. Therefore, the recognition of the potential of
EVs as a source of biomarkers discovery could open novel perspectives in the prediction,
diagnosis, prognosis, and therapy of hepatic diseases and liver injury.


GENERAL DISCUSSION
143
7. GENERAL DISCUSSION
This work is focused on the study of the functional role that hepatic EVs could play in the
endogenous and xenobiotics metabolism in the organism. The results obtained by using
different cellular models of DILI in combination with cellular and biochemical techniques as
well as UPLC-MS-based metabolomics technology have provided strong indications that
hepatic EVs carry active enzymes and metabolites that can influence significantly the
extracellular environment. In addition, the study has also provided several molecules and
enzymatic activities that could be useful to develop low-invasive diagnosis methods for DILI.
A key interest in clinical diagnosis and pharmaceutical industry is to have a repertoire of non-
invasive biomarkers to be able to predict the degree of liver injury caused by a pathological
condition or a drug. The first part of this thesis shows that compounds and drugs-causing
acute liver injury, such as GalN, APAP and DCF, modified the intracellular distribution and
in some cases the abundance of RNAs, proteins and metabolic enzymes that can be detected
in hepatic EVs. In addition, modified-molecules play important role in different cellular
pathways, supporting that modified-EVs would impact biological processes by several
mechanisms. Thus, a chaperone protein induced under stress conditions [206] as Hsp70 is
increased in hepatic-EVs secreted in GalN and DCF treatments, which is, at the same time,
accompanied with a decrease in cells. This suggests a selective transport of this protein
outside the cell under acute liver injury, maybe to avoid the damage of extracellular proteins.
On the other side, the expression of Rab8 protein was significantly reduced by the APAP
treatment in both, cells and EVs, whereas in GalN and DCF treatments the protein is
increased in the secreted EVs. This result points that the cellular response to GalN and DCF
could implicate vesicular trafficking that depends on Rab 8 protein. This differential impact of
the drugs on the intracellular trafficking is also supported by the alteration in the levels of
LIMP II, that plays a role in the regulation of endosome and lysosome biogenesis [207].
Another protein affected by the drugs is the tetraspanin Cd63, an endosomal and exosomal
marker implicated in immune response [80]. These results, apart from supporting the effect of
the drugs on intracellular trafficking also implicates the secreted EVs in the regulation of the
immune response under DILI conditions.
The protein levels and also the activity in hepatic EVs of metabolic enzymes such as CES,
COMT and MAT are differentially altered in DILI cellular models. This supports the
existence of different mechanisms of action ejected by the cells to overcome a toxic challenge
and importantly, supports hepatic EVs as the vehicles to perform a response to overcome the
damage. In this context, COMT enzyme expression levels decreased significantly in EVs in
APAP and DCF treatments, subsequently affecting the catechols methylation carried out by
COMT activity. In this regard, it is reported that the inactivation of catecholamines by COMT
in the brain have an effect on blood pressure regulation [208]. The data provided in this
doctoral thesis indicates that modifications in the EVs-associated COMT-activity could
regulate blood pressure in the liver under DILI conditions. In agreement with this hypothesis,
it has been shown that the methylation ability of catecholamines by COMT is attenuated in
liver and kidney of spontaneously hypertensive rats [128]. Yet, not only the protein cargo is
affected by DILI conditions, also the RNA cargo of EVs was differentially altered under DILI

GENERAL DISCUSSION
144
conditions tested in this study. This effect on the RNA suggests that EVs carry the
information to respond to a determined stress in a time depending manner. Thus, a first quick
wave of response mediated by direct protein interaction and enzymatic activities, and then a
time-delay response ejected by the regulation of the translation of determined RNAs in the
recipient cells. Thus, the mixture composition of the vesicles highlights the complex
mechanisms implicated in the DILI. It is also important to highlight that all DILI models used
in this study increased significantly the amount of EVs secreted by the hepatocytes. Together,
all these data strongly support that hepatocytes under liver-damaging conditions employ the
secretion of EVs to respond to liver insults loading them with specific cargos depending on
the mechanism of action required to overcome the challenge.
Furthermore, the data also supports the study of EVs under controlled conditions as an
approach to identify low-invasive candidate markers for early detection of disease conditions.
The use of EVs as a source to identify DILI biomarkers has several advantages [209]. First, it
may be possible to identify highly specific DILI biomarkers in circulating EVs. This is
important as currently used DILI biomarkers lack organ specificity [210]. Second, EVs
components are protected from degradation [49] and thus have a longer survival time,
providing a wider time window for injury detection. Third, efforts to directly use serum and
plasma to discover new DILI biomarkers are often hindered by highly abundant blood
constituents. The true signal may escape detection among those very strong and irrelevant
background signals. Using isolated EVs may avoid this problem. Finally, one additional
benefit of using EVs in DILI is that not only changes in their sizes, but also patterns of their
association with specific molecules maybe is indicative of the etiology of liver injury [211].
Over the past years, several potential metabolic signatures discovered through untargeted
metabolomics have been reported in several diseases such as hepatocarcinoma in patients with
cirrhosis [212], Parkinson’s disease diagnosis and progression [213], depression
,schizophrenia, diabetes and also cardiovascular and coronary artery disease [137]. The
recognition of the potential of EVs will open novel perspectives in the prediction, diagnosis,
prognosis, and therapy of hepatic diseases and liver injury in general.
In addition to the molecular characterization of EVs, a second aim of the work was the study
of the role that these vesicles could play in the development and progression of DILI. The
proteomics analysis of hepatocyte-derived EVs revealed the presence of metabolic enzymes
involved in the central regulation of hepatocyte metabolism (MAT enzyme) as well as
specifically in the xenobiotics and endogenous compounds metabolism (CES, COMT
enzymes). In this work, alterations on the protein level of these enzymes were found under
tested DILI models. Furthermore, these three enzymes activities were detected in hepatic EVs
extending the intracellular effects described for them in relation with DILI to the extracellular
space.
CES activity efficiently catalyzes the hydrolysis of a variety of ester- and amide-bonds
contained in chemicals and drugs to their respective free acids. In this way, CES activity is
involved in detoxification of various drugs, environmental toxicants and carcinogens. Apart
from metabolizing drugs to their corresponding inactive form, it also is responsible of other

GENERAL DISCUSSION
145
drugs metabolic activation that may cause a toxicological effect through direct hepatotoxicity
allowing, in this way, the development of DILI. A clear example is 7-ethyl-10-[4-(1-
piperidino)-1-piperidino] carbonyloxy-camptothecin (CPT-11) which is a drug currently used
for the treatment of different types of cancers such as colon or rectum [214]. CPT-11 requires
the CES activity mediated biotransformation to convert to its active metabolite 7-ethyl-10
hydroxycamptothecin (SN-38), which is approximately 100-1000 fold more cytotoxic than
the parent drug [215].
MAT enzyme is responsible for the biosynthesis of SAMe, the principal biological donor of
methyl groups [100] and a master regulator of hepatocyte metabolism [216]. Abnormal
activity of this enzyme is linked to many diseases outside (e.g. depression and osteoarthritis
[216]) and inside (e.g. steatohepatitis, cirrhosis, HCC [100]) the liver. With regards its
possible implication in DILI, it has been observed an increase in MAT1A protein expression
levels, one of the subunits forming the enzyme, in EVs released by primary cultures of rat
hepatocytes exposed to GalN and in serum-isolated EVs from GalN treated rats [95]. In this
sense, ethionine is an amino acid structurally related to methionine with an ethyl group
instead of a methyl group [217] and it is also a substrate for MAT. In vivo, ethionine causes
hepatic SAMe and ATP depletion leading to DILI [218]. Indeed, this toxin induces steatosis,
impaired methylation reactions and hepatic glucose and glycogen depletion among others
[219]. Another example that connects MAT with DILI is cycloleucine, an inhibitor of MAT
activity [217]. This non metabolizable analog of methionine, induces SAMe and GSH
depletion and potentiates drug-induced cytochrome P-450 2E1 (CYP2E1)-mediated
cytotoxicity in hepatocytes [220].
In the case of COMT activity, its general function is the elimination of biologically active or
toxic catechols and some other hydroxylated metabolites. COMT protein has been recently
reported as a biomarker of liver injury in APAP induced toxicity model. Indeed, in the early
stages, even before the current standard liver biomarker ALT and histopathology indicated
liver injury, COMT protein levels changed significantly in both liver tissue and plasma [126].
Moreover, COMT has several substrates related to DILI. 17-beta estradiol is a cathecol drug
converted to its toxically active form by the activity of the COMT enzyme [112][113]. Is an
essential estrogen hormone for females that has important effects in the liver. For example, it
can lead to cholestasis by inducing a reversible inhibition of bile flow. Another cathecholic
drug is Salvianoic acid A (SAA). COMT is responsible of methylated transformation of this
phenolic acid metabolically unstable. Metabolites derived from O-methylation of SAA,
display high antioxidant potency against liver lipid peroxidation [114]. Moreover,
considerable evidence has also demonstrated the potent protective effects of SAA against
ischemia-induced injury [115][116].
As conclusion of this part of the work, the presence of these activities in hepatic EVs suggest
a possible contribution of these secreted vesicles to the metabolism of drugs what should be
taken into consideration in further studies to avoid undesired secondary effects.
In the case of MAT and COMT activities, it was necessary to develop in-house methods using
UPLC-MS technology. As a result, sensitive and specific methods for determination of MAT

GENERAL DISCUSSION
146
and COMT activities were developed, being now available for the scientific community for
future laboratory and clinical research.
Finally, it is important to remark that these EVs-associated activities are differentially
expressed depending on the treatment, offering a way to discriminate among different type of
liver injuries. In this regard, the introduction of novel detection methods that enable the
identification of EV signatures in patients with liver injury and also in-depth characterization
of EVs derived from liver would help to identify DILI low-invasive markers and novel
therapeutics targets.
The characterization of EVs metabolome was further achieved to unravel metabolic pathways
and functions that hepatic EVs could be performing in the organism. Our study reveals a very
diverse metabolic content that covers a wide range of putative functions and suggest the
implication of hepatic EVs in different cellular pathways. In this regard, an elevated number
of metabolic signals were clearly associated to these vesicles and comparing with chemical
standards, some of them were identified. The presence of several intermediaries of methionine
cycle including SAMe, SAH and MTA was confirmed in hepatic EVs. The presence of these
metabolites joined to the fact that hepatic EVs also carry MAT enzymatic activity strongly
suggest that hepatic EVs could have an important role in the methionine cycle regulation in
the extracellular environment or in adjacent or far-away-localized recipient cells. The
polyamines, spermine and spermidine, were also detected in hepatic EVs, supporting the
hypothesis of these vesicles as vehicles sending metabolic signals influencing DNA synthesis
and stabilization, gene expression regulation or cell proliferation among others functions that
are controlled by these metabolites [221]. In this sense, it has been reported that EVs released
by adult stem cells residing in the liver have the capacity to repair damage tissue by inducing
liver regeneration [222]. Moreover, it is known that polyamines are also involved in
carcinogenesis, prompting intensive research into polyamine metabolism as a target in cancer
therapy. Furthermore, the implication of hepatic EVs in polyamine metabolism it is also
supported by the fact that SAMe takes part also in the polyamine biosynthesis [100]. Another
metabolite detected in hepatic EVs is the oxidized form of glutathione (GSSG). Interestingly,
while GSSG was clearly detected, the reduced form GSH was not, suggesting that hepatic
EVs could constitute a selective transport of GSSG outside the cell. GSH is an important
antioxidant that prevents damage caused by reactive oxygen species such as free radicals or
peroxides. In redox reactions, GSH is converted to GSSG. An increased GSSG-to-GSH ratio
is considered indicative of oxidative stress [223]. Hence, the elevated presence of GSSG in
EVs could be considered an indication of oxidative stress in the cell from where it came from.
Moreover, SAMe is an important precursor of GSH since SAMe is the precursor of SAH,
which is then hydrolysed to homocysteine which finally forms GSH in the transsulfuration
pathway. Here again, it is observed certain correlation between the metabolites contained in
hepatic EVs, suggesting an organized functionality inside the EVs.
In conclusion, several metabolites detected in these vesicles, indicate the implication of
hepatic EVs in methylation, polyamine and DNA synthesis (amynopropylation) and oxidative
stress (transsulfuration) response.

GENERAL DISCUSSION
147
Other metabolic signals from the hepatic EV metabolome were tentatively identified using
mass accuracy and database search. Among this group of metabolites, tetrahydroxypteridine
and tetrahydrofolate were detected, both implicated in the synthesis of purines and DNA. The
presence of these two metabolites along with the polyamines above mentioned, indicate that
one of the mechanism of action of hepatic EVs could implicate the regulation of these
processes. In agreement with this, it has been also reported that EVs derived from endometrial
epithelial cells have a potential role in purine metabolism [224]. Another metabolic signals
tentatively identified was adenosine monophosphate (AMP), that has an important role in
glycogen metabolism in the liver, suggesting that hepatic EVs could be implicated in
regulation of the energetic metabolism. NG-monomethyl-L-arginine (L-NMMA), an inhibitor
of nitric oxide synthase, was also among the possible metabolites contained in hepatic EVs,
suggesting a possible role of these vesicles in controlling the vasodilatation and
vasoconstriction of blood vessels. This effect could be connected with the COMT enzymatic
activity found in hepatic EVs.
Another group of metabolic signals of hepatic EVs with tentative IDs belong to the lipids. In
agreement with the membrane-base of these vesicles, two structural membrane lipids such as
phosphatidylcholine and phosphatidylethanolamine were in this group. Lipids involved in the
sorting of molecules into vesicles including docosahexaenoic acid (DHA) and
phosphatidylinositol-(4,5)-bisphosphate (PIP2) phospholipids were also in the lipid group
[225] [226], indicating that they could be involved in sorting to hepatic EVs. An intermediary
of the unsaturated fatty acid oxidation, 5,8-tetradecadienoic acid [140], was also identified as
a possible metabolite contained in hepatic EVs, as well as the glyceryl
phosphorylethanolamine, which is a membrane breakdown product that acts as a growth
stimulating factor for hepatocytes [227].
In conclusion, all these data clearly support the complexity of the cellular processes in which
hepatic vesicles could be involved, being required additional experimentation to elucidate in
more detail. In the Figure 54 is represented a schematic view of the main results obtained in
this doctoral thesis.

GENERAL DISCUSSION
148
Figure 54. Overview of the main results obtained in this doctoral thesis. In normal (green) conditions
hepatocytes release EVs (black dots) containing RNAs, proteins, enzymes and metabolites into the extracellular
environment. These vesicles can be captured by neighbor or distant cells modifying their metabolism.
Hepatocytes-secreted EVs could also modify the metabolism in the intercellular space as well as in body fluids.
Under DILI (red) conditions hepatocytes secrete more EVs to the extracellular environment and bloodstream
increasing the risk of damage. The composition of these vesicles varies depending on the induced liver damage
being possible to discriminate between different injuries (Hsp70 and Rab 8 proteins expression increases in DILI
conditions whereas Cd63 and Limp II decrease). Moreover, the activity of some of the enzymes contained in
hepatic EVs such as CES, COMT and MAT, increases in liver damaging conditions. Indeed, the activity varies
depending on the induced damage. The implication of these enzymes in DILI suggests that hepatic EVs could be
involved in the development of DILI. Furthermore, hepatic EVs metabolome contains metabolites that take part
in important cellular pathways such as methionine metabolism (SAMe and SAH), redox reactions (GSSG) or
purine and DNA biosynthesis (spermine and spermidine).


CONCLUSIONS
150
8. CONCLUSIONS
1. GalN, DCF and APAP have different effects on hepatocytes indicating that different
responses are carried out in hepatocytes depending on the induced liver damage.
2. APAP affects more severely to the hepatocytes than GalN and DFC under tested
conditions.
3. Hepatocytes secreted more EVs under DILI conditions.
4. Composition of EVs is altered by DILI conditions and different drugs affect
differentially to the composition of the EVs.
5. Hepatic EVs display CES, MAT and COMT activities and the activities vary depending
on treatments with DCF, GalN or APAP.
6. Hepatic EVs are a suitable biological source to identify markers for detecting and
classifying DILI.
7. The implication of CES, MAT and COMT activities in DILI suggests that hepatic EVs
could be involved in the development of DILI.
8. UPLC-MS based metabolomics is a good technology to characterize MAT and COMT
activities in EVs, and to identify the metabolites that are associated with hepatic EVs.
9. The metabolome of hepatic EVs is constituted by more than 340 metabolic signals.
10. Hepatic EVs carry a complex mix of metabolites belonging to different cellular
pathways including methionine metabolism, redox metabolism, purine and DNA
biosynthesis.

BIBLIOGRAPHY
152
9. BIBLIOGRAPHY
[1] “Falcon-Perez JM, Lu SC, Mato JM. Sub-proteome approach to the knowledge of
liver. Proteomics Clin Appl. 2010; 4, 407–415.”
[2] “Klover PJ, Mooney RA. Hepatocytes: critical for glucose homeostasis. Int J
Biochem Cell Biol. 2004; 36(5), 753-8.”
[3] “Charlton MR. Protein metabolism and liver disease. Baillieres Clin Endocrinol
Metab.1996; 10(4), 617-35.”
[4] “Nguyen P, Leray V, Diez M, Serisier S, Le Bloc‟h J, Siliart B, Dumon H. Liver
lipid metabolism. J Anim Physiol Anim Nutr (Berl). 2008; 92(3), 272-83.”
[5] “Sturgill MG, Lambert GH. Xenobiotic-induced hepatotoxicity: mechanisms of liver
injury and methods of monitoring hepatic function.Clinical Chemistry. 1997; 43(8),
1512–1526.”
[6] “Royo F, Falcon-Perez JM. Liver extracellular vesicles in health and Disease.
Journal of extracellular vesicles. 2012.”
[7] “Seki E, Brenner DA. Toll-like receptors and adaptor molecules in liver disease:
update. Hepatology. 2008; 48(1), 322-35.”
[8] “Moreira RK. Hepatic stellate cells and liver fibrosis. Arch Pathol Lab Med.
2007;131(11), 1728-34.”
[9] “Jones AL. Anatomy of the normal liver. In: Zakin D, Boyer TD, eds. Hepatology: a
textbook of liver disease, 3rd ed. Philadelphia: WB Saunders. 1996; 3-32.”
[10] “Ostapowicz G, Fontana RJ, Schiodt FV. Results of a prospective study of acute
liver failure at 17 tertiary care centers in the United States. Ann Intern Med. 2002;
137, 947-954.”
[11] “Larrey D . Drug-induced liver diseases. J Hepatol. 2000; 32, 77 - 88.”
[12] “Gunawan B , Kaplowitz N . Clinical perspectives on xenobiotic induced
hepatotoxicity. Drug Metab Rev. 2004; 36, 301 - 312.”
[13] “Holt MP, Ju C. Mechanisms of Drug-Induced Liver Injury. The AAPS Journal.
2006; 8 (1), 48-54.”
[14] “Li Z, Diehl AM. Innate immunity in the liver. Curr Opin Gastroenterol. 2003; 19,
565 - 571 .”
[15] “Zimmerman HJ . Drug-induced liver disease. In: Zimmerman HJ , ed.
Hepatotoxicity: The Adverse Effects of Drugs and Other Chemicals on the Liver.
2nd ed. Philadelphia, PA : Lippincott Williams & Wilkins. 1999; 427- 456.”
[16] “Kaplowitz N. Drug-induced liver disorders: Implications for drug development and
regulation. Drug Safety. 2001; 24, 483–490.”

BIBLIOGRAPHY
153
[17] “Ozer J, Ratner M, Shaw M, Bailey W, Schomaker S. The current state of serum
biomarkers of hepatotoxicity. Toxicology. 2008; 245, 194–205.”
[18] “Muller PY, Dieterle F. Tissue-specific, non-invasive toxicity biomarkers:
Translation from preclinical safety assessment to clinical safety monitoring. Expert
Opinion on Drug Metabolism.2009; 5, 1023–1038.”
[19] “Chang CY, Schiano TD. Review article: drug hepatotoxicity. Aliment Pharmacol
Ther. 2007; 25(10), 1135-51.”
[20] “Kucera O, Lotková H, Kanďár R, Héžová R, Mužáková V, Červinková Z. The
model of d-galactosamine-induced injury of rat hepatocytes in primary culture. Acta
Médica (Hradec Kralove) 2006; 49(1), 59–65.”
[21] “Keppler D, Lesch R, Reutter W, Decker K. Experimental hepatitis induced by D-
galactosamine. Exp Mol Pathol. 1968; 9, 279–90.”
[22] “Mangeney-Andreani M, Sire O, Montagne-Clavel J, Nordmann R, Nordmann J:
Inhibitory effect of D-galactosamine administration on fatty oxidation in rat
hepatocytes. FEBS Lett. 1982; 145, 267-270.”
[23] “Mitchell JR, Jollow DJ, Potter WZ, Davis DC, Gillette JR, Brodie BB.
Acetaminophen-induced hepatic necrosis. I. Role of drug metabolism. J Pharmacol
Exp Ther. 1973; 187(1), 185-94.”
[24] “Donnelly PJ, Walker RM, Racz WJ. Inhibition of mitochondrial respiration in vivo
is an early event in acetaminophen-induced hepatotoxicity. Arch Toxicol. 1994;
68(2), 110-8.”
[25] “Meyers LL, Beierschmitt WP, Khairallah EA, Cohen SD. Acetaminophen-induced
inhibition of hepatic mitochondrial respiration in mice. Toxicol Appl Pharmacol.
1988; 93(3), 378-87.”
[26] “Boelsterli UA. Diclofenac-induced liver injury: a paradigm of idiosyncratic drug
toxicity. Toxicology and Applied Pharmacology; 2003, 192, 307–322.”
[27] “Livertox. Clinical and research information on drug induced liver injury. National
library of medicine.”
[28] “Duijvesz D, Luider T, Bangma CH, Jenster G . Exosomes as biomarker treasure
chests for prostate cancer. Eur Urol . 2011; 59, 823–831.”
[29] “Chargaff E, West R. The biological significance of the thromboplastic protein of
blood. J Biol Chem. 1946; 166(1), 189-97.”
[30] “Wolf P. The nature and significance of platelet products in human plasma. Br J
Haematol. 1967;13(3), 269-88.”
[31] “Dalton AJ. Microvesicles and vesicles of multivesicular bodies versus „virus-like‟
particles. J Natl Cancer Inst. 1975; 54(5), 1137-48.”

BIBLIOGRAPHY
154
[32] “Johnstone RM, Adam M, Hammond JR, Orr L, Turbide C. Vesicle formation during
reticulocyte maturation. Association of plasma membrane activities with released
vesicles (exosomes). J Biol Chem. 1987; 262(19), 9412-20.”
[33] “Müller G. Microvesicles/exosomes as potential novel biomarkers of metabolic
diseases. Diabetes, Metabolic Syndrome and Obesity: Targets and Therapy. 2012;
5, 247–282.”
[34] “Ronquist G, Brody I. The prostasome: its secretion and function in man. Biochim
Biophys Acta. 1985; 822(2), 203-18.”
[35] “Park BK, Pirmohamed M, Kitteringham NR.The role of cytochrome P450 enzymes
in hepatic and extrahepatic human drug toxicity. Pharmacol Ther. 1995; 68(3):385-
424.”
[36] “Caby MP, Lankar D, Vincendeau-Scherrer C, Raposo G, Bonnerot C. Exosomal-
like vesicles are present in human blood plasma. Int Immunol. 2005;17(7), 879-87.”
[37] “Huebner AR, Somparn P, Benjachat T, Leelahavanichkul A, Avihingsanon Y,
Fenton RA, Pisitkun T. Exosomes in urine biomarker discovery. Adv Exp Med Biol.
2015; 845, 43-58.”
[38] “Ogawa Y, Miura Y, Harazono A, Kanai-Azuma M, Akimoto Y, Kawakami H,
Yamaguchi T, Toda T, Endo T, Tsubuki M, Yanoshita R. Proteomic analysis of two
types of exosomes in human whole saliva. Biol Pharm Bull. 2011;34(1), 13-23.”
[39] “Admyre C, Johansson SM, Qazi KR, Filén JJ, Lahesmaa R, Norman M, Neve EP,
Scheynius A, Gabrielsson S. Exosomes with immune modulatory features are present
in human breast milk. J Immunol. 2007;179(3), 1969-78.”
[40] “Asea A, Jean-Pierre C, Kaur P, Rao P, Linhares IM, Skupski D, Witkin SS. Heat
shock protein-containing exosomes in mid-trimester amniotic fluids. J Reprod
Immunol. 2008; 79(1), 12-7.”
[41] “Andre F, Escudier B, Angevin E, Tursz T, Zitvogel L. Exosomes for cancer
immunotherapy. Ann Oncol. 2004; 15(4), 141-144.”
[42] “Vella LJ, Sharples RA, Nisbet RM, Cappai R, Hill AF. The role of exosomes in the
processing of proteins associated with neurodegenerative diseases. Eur Biophys J.
2008; 37(3), 323-32.”
[43] “Masyuk AI, Huang BQ, Ward CJ, Gradilone SA, Banales JM, Masyuk TV, Radtke
B, Splinter PL, LaRusso NF. Biliary exosomes influence cholangiocyte regulatory
mechanisms and proliferation through interaction with primary cilia. Am J Physiol
Gastrointest Liver Physiol. 2010; 299(4).”
[44] “Akers JC, Gonda D, Kim R, Carter BS, Chen CC. Biogenesis of extracellular
vesicles (EV): exosomes, microvesicles, retrovirus-like vesicles, and apoptotic
bodies. J Neurooncol. 2013; 113(1), 1-11.”

BIBLIOGRAPHY
155
[45] “Gyorgy B, SzaboTG, Pasztoi M, Zsuzsanna P, Misjak P, Aradi B, Laszlo V ,
Pallinger E, Pap E, Kittel AG, Nagy G, Falus A, Buzas E.Membrane vesicles,
current state-of-the-art: emerging role of extracellular vesicles. Cell Mol Life Sci.
2011; 68, 2667–2688.”
[46] “Harding C, Heuser J, Stahl P. Receptor-mediated endocytosis of transferrin and
recycling of the transferrin receptor in rat reticulocytes. J Cell Biol 1983;97(2):329-
339.”
[47] “Raposo G, Nijman HW, Stoorvogel W et al. B lymphocytes secrete antigen-
presenting vesicles. J Exp Med 1996;183(3):1161-1172.”
[48] “Pan BT, Teng K, Wu C, Adam M, Johnstone RM. Electron microscopic evidence
for externalization of the transferrin receptor in vesicular form in sheep reticulocytes.
J Cell Biol 1985;101(3):942-948.”
[49] “Raposo G, Stoorvogel W. Extracellular vesicles: exosomes, microvesicles, and
friends. J Cell Biol. 2013; 200(4), 373-83.”
[50] “Kowal J, Tkach M and Thery C. Biogenesis and secretion of exosomes. Current
Opinion in Cell Biology 2014; 29; 116–125.”
[51] “Klumperman J, Raposo G. The complex ultrastructure of the endolysosomal system.
Cold Spring Harb Perspect Biol. 2014; 6(10).”
[52] “Stoorvogel, Oorschot V and Geuze HJ. A Novel Class of Clathrin-coated
Vesicles Budding from Endosomes. The Journal of Cell Biology. 1996; 132 (1 &
2), 21-33.”
[53] “Stoorvogel W, Kleijmeer MJ, Geuze HJ, Raposo G. The biogenesis and functions of
exosomes. Traffic. 2002; 3(5), 321-330.”
[54] “Colombo M, Raposo G, Thery C. Biogenesis, Secretion, and Intercellular
Interactions of Exosomes and Other Extracellular Vesicles. Annu. Rev. Cell Dev.
Biol. 2014; 30, 255–89.”
[55] “Nan Niel GI, Porto-Carreiro S, Raposo G. Exosomes: a common pathway for a
specialized function. J Biochem. 2006; 140, 13–21.”
[56] “Hemler, M.E. Tetraspanin proteins mediate cellular penetration, invasion, and
fusion events and define a novel type of membrane microdomain. Annu. Rev. Cell
Dev Biol. 2003; 19, 397–422.”
[57] “Valadi H, Ekström K, Bossios A, Sjöstrand M, Lee JJ, Lötvall JO. Exosome-
mediated transfer of mRNAs and microRNAs is a novel mechanism of genetic
exchange between cells. Cell Biol. 2007; 9(6), 654-9.”
[58] “Ratajczak J, Wysoczynski M, Hayek F, Janowska-Wieczorek A, Ratajczak MZ.
Membrane-derived microvesicles: important and underappreciated mediators of cell-
to-cell communication. Leukemia. 2006; 20(9), 1487-95.”

BIBLIOGRAPHY
156
[59] “Bellingham SA, Coleman BM, Hill AF. Small RNA deep sequencing reveals a
distinct miRNA signature released in exosomes from prion-infected neuronal cells.
Nucleic Acids Res. 2012; 40, 10937–10949.”
[60] “Nolte-‟t Hoen EN, Buermans HP, Waasdorp M, Stoorvogel W, Wauben MH, Hoen
PA. Deep sequencing of RNA from immune cell-derived vesicles uncovers the
selective incorporation of small non-coding RNA biotypes with potential regulatory
functions. Nucleic Acids Res. 2012; 40, 9272–9285.”
[61] “Llorente A, Skotland T, Sylvänne T, Kauhanen D, Róg d T, Orłowski A,
Vattulainen I, Ekroos K, Sandvig K. Molecular lipidomics of exosomes released by
PC-3 prostate cancer cells. Biochimica et Biophysica Acta 1831. 2013; 1302–1309.”
[62] “Thery C, Regnault A, Garin J, Wolfers J, Zitvogel L, Ricciardi-Castagnoli P,
Raposo G, Amigorena S. Molecular characterization of dendritic cell-derived
exosomes. Selective accumulation of the heat shock protein hsc73. J Cell Biol. 1999;
147(3), 599-610.”
[63] “Wubbolts R, Leckie RS, Veenhuizen PT, Schwarzmann G, Möbius W,
Hoernschemeyer J, Slot JW, Geuze HJ, Stoorvogel W. Proteomic and biochemical
analyses of human B cell-derived exosomes. Potential implications for their function
and multivesicular body formation. J Biol Chem. 2003; 278, 10963-72.”
[64] “Simpson RJ, Kalra H, Mathivanan S. ExoCarta as a resource for exosomal
Research. Journal of Extracellular Vesicle. 2012; 1, 18374.”
[65] “Kalra H, Simpson RJ, Ji H, Aikawa E, Altevogt P, Askenase P, Bond VC, Borras
FE, Breakefield X, Budnik V, Buzas E, Camussi G, Clayton A, E Cocucci E,
Falcon-Perez JM, Gabrielsson S, Gho YS, Gupta D, Harsha HC, Hendrix A, Hill AF,
Inal JM, Jenster G, Krämer-Albers EM, Kiang Lim S, Llorente A, Lötvall J, Marcilla
A, Mincheva-Nilsson L, Nazarenko I, Nieuwland R, Nolte-‟t Hoen E, Pandey A,
Patel T, Piper MG, Pluchino S, Keshava Prasad TS, e Rajendran L, Raposo G, l
Record M, Reid GE, Sánchez-Madrid F, Schiffelers RM, Siljander P, Stensballe A,
Stoorvogel W, Taylor D, Thery C, Valadi H, . M. van Balkom BW, Vazquez J, Vidal
M, Wauben M, Yañez-Mo M, Zoeller M, Mathivanan S. Vesiclepedia: A
Compendium for Extracellular Vesicles with Continuous Community Annotation.
PLOS Biology. 2012; 10(12), e1001450.” .
[66] “Kim DK, Lee J, Kim SR, Choi DS, Yoon YJ, Kim JH, Go G, Nhung D, Hong K,
Jang SC, Kim SH, Park KS, Kim OY, Park HT, Seo JH, Aikawa E, Baj-
Krzyworzeka M, van Balkom BW, Belting M, Blanc L, Bond V, Bongiovanni A,
Borràs FE, Buée L, Buzás EI, Cheng L, Clayton A, Cocucci E, Dela Cruz CS,
Desiderio DM, Di Vizio D, Ekström K, Falcon-Perez JM, Gardiner C, Giebel B,
Greening DW, Gross JC, Gupta D, Hendrix A, Hill AF, Hill MM, Nolte-‟t Hoen E,
Hwang do W, Inal J, Jagannadham MV, Jayachandran M, Jee YK, Jørgensen M,
Kim KP, Kim YK, Kislinger T, Lässer C, Lee DS, Lee H, van Leeuwen J, Lener T,
Liu ML, Lötvall J, Marcilla A, Mathivanan S, Möller A, Morhayim J, Mullier F,
Nazarenko I, Nieuwland R, Nunes DN, Pang K, Park J, Patel T, Pocsfalvi G, Del
Portillo H, Putz U, Ramirez MI, Rodrigues ML, Roh TY, Royo F, Sahoo S,
Schiffelers R, Sharma S, Siljander P, Simpson RJ, Soekmadji C, Stahl P, Stensballe

BIBLIOGRAPHY
157
A, Stępień E, Tahara H, Trummer A, Valadi H, Vella LJ, Wai SN, Witwer K, Yáñez-
Mó M, Youn H, Zeidler R, Gho YS. EVpedia: a community web portal for
extracellular vesicles research. Bioinformatics. 2015; 31(6), 933-939.”
[67] “Fevrier B, Vilette D, Archer F et al. Cells release prions in association with
exosomes. Proc Natl Acad Sci USA. 2004; 101(26), 9683-9688.”
[68] “Van der Pol E,. Böing AN, Harrison P, Sturk A, Nieuwland R. Classification,
Functions, and Clinical Relevance of Extracellular Vesicles. Pharmacological
reviews. 2012; 64(3), 677-700.”
[69] “Conde-Vancells J, Rodriguez-Suarez E, Embade N, Gil D, Matthiesen R, Valle M,
Elortza F, Lu SC, Mato JM, Falcon-Perez JM. Characterization and comprehensive
proteome profiling of exosomes secreted by hepatocytes. J Proteome Res. 2008 Dec;
7(12): 5157-66.”
[70] “Royo F, Schlangen K, PalomoL, Gonzalez E, Conde-Vancells J, Berisa A, Aransay
AM, Falcon-Perez JM. Transcriptome of Extracellular Vesicles Released by
Hepatocytes. Plos ones. 2013; 8(7).”
[71] “Cocucci E, Racchetti G, Meldolesi J. Shedding microvesicles: artefacts no more.”
[72] “Simons M, Raposo G. Exosomes _ vesicular carriers for intercellular
communication. Curr Opin Cell Biol. 2009; 21, 575-81.”
[73] “Wetmore BA, Brees DJ, Singh R, Watkins PB, Andersen ME, Loy J, et al.
Quantitative analyses and transcriptomic profiling of circulating messenger RNAs as
biomarkers of rat liver injury. Hepatology. 2010; 51, 2127-39.”
[74] “Burlone ME, Budkowska A. Hepatitis C virus cell entry: role of lipoproteins and
cellular receptors. J Gen Virol. 2009; 90, 1055_70.”
[75] “Masciopinto F, Giovani C, Campagnoli S, Galli-Stampino L, Colombatto P,
Brunetto M, et al. Association of hepatitis C virus envelope proteins with exosomes.
Eur J Immunol. 2004; 34, 2834-42.”
[76] “Herrera MB, Fonsato V, Gatti S, Deregibus MC, Sordi A, Cantarella D, et al.
Human liver stem cell-derived microvesicles accelerate hepatic regeneration in
hepatectomized rats. J Cell Mol Med. 2010; 14, 1605-18.”
[77] “Deregibus MC, Cantaluppi V, Calogero R, Lo Iacono M, Tetta C, Biancone L, et al.
Endothelial progenitor cell derived microvesicles activate an angiogenic program in
endothelial cells by a horizontal transfer of mRNA. Blood. 2007; 110, 2440-8.”
[78] “Ratajczak J, Miekus K, Kucia M, Zhang J, Reca R, Dvorak P, Ratajczak MZ.
Embryonic stem cell-derived microvesicles reprogram hematopoietic progenitors:
evidence for horizontal transfer of mRNA and protein delivery. Leukemia. 2006;
20(5), 847-56.”
BIBLIOGRAPHY
158
[79] “Lee SO, Masyuk T, Splinter P, Banales JM, Masyuk A, Stroope A, et al.
MicroRNA15a modulates expression of the cell-cycle regulator Cdc25A and affects
hepatic cystogenesis in a rat model of polycystic kidney disease. J Clin Invest. 2008;
118, 3714-24.”
[80] “Thery C, Zitvogel L, Amigorena S. Exosomes: composition, biogenesis and
function. Nat Rev Immunol. 2002; 2, 569-79.”
[81] “Thery C, Duban L, Segura E, Veron P, Lantz O, Amigorena S. Indirect activation of
naive CD4_ T cells by dendritic cellderived exosomes. Nat Immunol. 2002; 3,
1156_6.”
[82] “Sadallah S, Eken C, Schifferli JA. Ectosomes as modulators of inflammation and
immunity. Clin Exp Immunol. 2011; 163, 26-32.”
[83] “Croce CM. Causes and consequences of microRNA dysregulation in cancer. Nat
Rev Genet. 2009; 10, 704-14.”
[84] “Kogure T, Lin WL, Yan IK, Braconi C, Patel T. Intercellular nanovesicle-mediated
microRNA transfer: a mechanism of environmental modulation of hepatocellular
cancer cell growth. Hepatology. 2011; 54, 1237-48.”
[85] “Jin M, Drwal G, Bourgeois T, Saltz J, Wu HM. Distinct proteome features of
plasma microparticles. Proteomics. 2005; 5(7), 1940–1952.”
[86] “Looze C, Yui D, Leung L, et al. Proteomic profiling of human plasma exosomes
identifies PPARgamma as an exosome-associated protein. Biochem Biophys Res
Commun. 2009; 378(3), 433–438.”
[87] “Conde-Vancells J, Gonzalez E, Lu S, Mato JM, Falcon-Perez JM. Overview of
Extracellular Microvesicles in Drug Metabolism. Expert Opin Drug Metab
Toxicol. 2010 May; 6(5): 543–554.”
[88] “Nagar S, Remmel RP. Uridine diphosphoglucuronosyltransferase pharmacogenetics
and cancer. Oncogene. 2006; 25, 1659–1672.”
[89] “Strange RC, Spiteri MA, Ramachandran S, Fryer AA. Glutathione-S-transferase
family of enzymes. Mutat Res. 2001; 482(1-2), 21-6.”
[90] “Pushparajah DS, Umachandran M, Plant KE, Plant N, Ioannides C. Up-regulation
of the glutathione S-transferase system in human liver by polycyclic aromatic
hydrocarbons; comparison with rat liver and lung. Mutagenesis. 2008; 23(4), 299-
308.”
[91] “Monks TJ, Anders MW, Dekant W, Stevens JL, Lau SS, van Bladeren PJ.
Glutathione conjugate mediated toxicities. Toxicol Appl Pharmacol. 1990; 106(1), 1-
19.”
[92] “Obermayer-Straub P, Strassburg CP, Manns MP. Target proteins in human
autoimmunity: cytochromes P450 and UDP- glucuronosyltransferases. Can J
Gastroenterol. 2000; 14(5), 429-39.”

BIBLIOGRAPHY
159
[93] “Evans MJ, von Hahn T, Tscherne DM, Syder AJ, Panis M, Wolk B, et al. Claudin-1
is a hepatitis C virus co-receptor required for a late step in entry. Nature. 2007; 446,
801-5.”
[94] “Royo F, Schlangen K, Palomo L, Gonzalez E, Conde-Vancells J, et al. (2013)
Transcriptome of Extracellular Vesicles Released by Hepatocytes. PLoS ONE. 2013;
8(7).”
[95] “Rodríguez-Suárez E, Gonzalez E, Hughes C, Conde-Vancells J, Rudella A, Royo
F, Palomo L, Elortza F, Lu SC, Mato JM, Vissers JPC, Falcón-Pérez JM.
Quantitative proteomic analysis of hepatocyte-secreted extracellular vesicles reveals
candidate markers for liver toxicity. Journal of proteomics. 2014; 103, 227-240.”
[96] “Hosokawa M. Structure and catalytic properties of Carbolxylesterases isoenzymes
involved in metabolic activation of prodrugs. Molecules. 2008 Feb; 13: 412-431.”
[97] “Ross M, Borazjani A. Enzimatyc activity of human Carboxylesterases. Current
Protocols in toxicology. 2007 Aug; 4.24.1-4.24.14.”
[98] “Holmes RS, Wright MW, Laulederkind SJF, Cox LA, Hosokawa M, Imai T,
Ishibashi S, Lehner R, Miyazaki M, Perkins EJ, Potter, PM. Recommended
nomenclature for five mammalian carboxylesterase gene families: human, mouse,
and rat genes and proteins. Mamm Genome. 2010; 21: 427-441.”
[99] “Sanghani SP, Sanghani PC, Schiel MA, Bosron WF. Human carboxylesterases: an
update on CES1, CES2 and CES3. Protein Pept Lett. 2009;16(10), 1207-14.”
[100] “Mato JM, Martínez-Chantar ML; Lu SC. S-adenosylmethionine metabolism and
liver disease. Ann Hepatol. 2013 ; 12(2), 183–189.”
[101] “Mato JM, Alvarez L, Ortiz P, M. Pajares A. S-adenosylmethionine synthesis:
molecular mechanisms and clinical implications. Pharmacol Ther. 1997; 73(3),265–
280.”
[102] “Petrossian TC, Clarke SG. Uncovering the human methyltransferasome. Mol Cell
Proteomics. 2011; 10:M110.000976.”
[103] “Mato JM, Corrales FJ, Lu SC, Avila MA. S-Adenosylmethionine: a control switch
that regulates liver function. FASEB J. 2002; 16,15-26.”
[104] “Mudd SH, Poole JR. Labile methyl balances for normal humans on various dietary
regimens. Metabolism. 1975; 24, 721–35.”
[105] “S. H. Mudd and J. R. Poole. Labile methyl balances for normal humans on various
dietary regimens. Metabolism. 1975; 24(6), 721–735.”
[106] “J. D. Finkelstein. Methionine metabolism in mammals. J. Nutr. Biochem. 1990;
1(5), 228–237.”
[107] “Männistö PT, Kaakkola S. Catechol-O-methyltransferase (COMT): Biochemistry,
Molecular Biology, Pharmacology, and Clinical Efficacy of the New Selective
COMT Inhibitors. Pharmacological Reviews. 1999; 51, 593-628.”

BIBLIOGRAPHY
160
[108] “Pihlavisto P, Reenilä I. Review. Separation for catechol O-methyltransferase
activity assay: physiological and pathophysiological relevance. Journal of
Chromatography B. 2002; 781, 359–372.”
[109] “Pekka T. Männistö. Catechol‐O‐Methyltransferase. Encyclopedia of Molecular
Pharmacology. 2008; 335-339.”
[110] “Schweigert N, Zehnder A and Eggen R. Chemical properties of catechols and their
molecular modes of toxic action in cells, from microorganisms to mammals.
Environmental Microbiology. 2001; 3(2), 81-91.”
[111] “Zhu BT. Catechol-O-Methyltransferase (COMT)-mediated methylation metabolism
of endogenous bioactive catechols and modulation by endobiotics and xenobiotics:
importance in pathophysiology and pathogenesis. Curr Drug Metab. 2002; (3), 321-
49.”
[112] “Butterworth M, Lau SS, Monks TJ. 17 beta-estradiol metabolism by hamster
hepatic microsomes: comparison of catechol estrogen O-methylation with catechol
estrogen oxidation and glutathione conjugation. Chem Res Toxicol. 1996; 9(4), 793-
9.”
[113] “Meyers M, Slikker W, Pascoe G, Vore M. Characterization of cholestasis induced
by estradiol-17 beta-D-glucuronide in the rat. J Pharmacol Exp Ther. 1980; 214(1),
87-93.”
[114] “Xu H, Li Y, Che X, Tian H, Fan H, Liu K. Metabolism of Salvianolic Acid A and
Antioxidant Activities of Its Methylated Metabolites. Drug Metab Dispo. 2014; 42,
274–281.”
[115] “Pan HJ, Li DY, Fang F, Chen D, Qi LL, Zhang RQ, Xu TD, Sun H. Salvianolic acid
A demonstrates cardioprotective effects in rat hearts and cardiomyocytes after
ischemia/ reperfusion injury. J Cardiovasc Pharmacol. 2011; 58, 535–542.”
[116] “Fan HY, Yang L, Fu FH, Xu H, Meng QG, Zhu HB, Teng LR, Yang MY, Zhang
LM, and Zhang ZL, et al. (2012) Cardioprotective effects of salvianolic acid a on
myocardial ischemia-reperfusion injury in vivo and in vitro. Evid Based Complement
Alternat Med. 2012; 12.” .
[117] “Mansari M, Guiard B, Chernoloz O, Ghanbari R, Katz N, Blie P. Relevance of
Norepinephrine-Dopamine Interactions in theTreatment of Major Depressive
Disorder. CNS Neuroscience & Therapeutics. 2010 (16).”
[118] “Orth M, Schapira AHV. Mitochondrial involvement in Parkinson‟s Disease. 2002;
Neurochem Int, 40, 533-541.”
[119] “Männistö PT, Ulmanen I, Lundström K, Taskinen J, Tenhunen J, Tilgmann C,
Kaakkola S. Characteristics of catechol O-methyl-transferase (COMT) and properties
of selective COMT inhibitors. Prog Drug Res. 1992; 39, 291-350.”
[120] “Poewe W. The role of COMT inhibition in the treatment of Parkinson‟s disease.
Neurology. 2004; 62, 31–38.”

BIBLIOGRAPHY
161
[121] “Teräväinen H, Rinne U, Gordin A. Catechol-O-methyltransferase inhibitors in
Parkinson‟s disease. Handbook of Parkinson‟s Disease, Fifth Edition. 2001; 311-
325.”
[122] “Benabou R, Waters C. Hepatotoxic profile of catechol-O-methyltransferase
inhibitors in Parkinson‟s disease. Expert Opin Drug Saf. 2003; 2(3), 263-7.”
[123] “Clemmesen JO, Galatius S, Skak C, Dalgaard P, Larsen FS, Ott P. The effect of
increasing blood pressure with dopamine on systemic, splanchnic, and lower
extremity hemodynamics in patients with acute liver failure. Scand J Gastroenterol.
1999; 34(9), 921-7.”
[124] “Kathleen M. Nicholls, Michael D. Shapiro, Vicki J. Van Putten, Rudiger Kluge,
Hsiao-Min Chung, Daniel G. Bichet, and Robert W. Schrier. Elevated Plasma
Norepinephrine Concentrations in Decompensated Cirrhosis. Association with
Increased Secretion Rates, Normal Clearance Rates, and Suppressibility by Central
Blood Volume Expansion. Circulation Research. 1985; 56 (3), 457-461.”
[125] “Myöhänen TT, Schendzielorz N, Männistö PT. Distribution of cathecol-O-
methyltransferase (COMT) proteins and enzymatic acticities in wild-type and soluble
COMT deficient mice. Journal of neurochemistry. 2010; 113, 1632-1643.”
[126] “Hu Z, Lausted C, Yoo H, Yan X, Brightman A, Chen J, Wang W, Bu X, Hood L.
Quantitative liver-specific protein fingerprint in blood: a signature for hepatotoxicity.
Theranostics. 2014; 4, 215-228.”
[127] “Tunbridge EM, Harrison PJ, Weinberger DR. Catechol-O-methyltransferase,
cognition, and psychosis: Val1 58 Met and beyond. Biological Psychiatry. 2006; 60,
141-151.”
[128] “Tsunoda M, Takezawa K, Masuda M, Imai K. Rat liver and kidney catechol-O
methyltransferase activity measured by high-performance liquid chromatography
with fluorescence detection. Biomedical Chromatography. 2002; 16, 536-41.”
[129] “Aoyama N, Tsunoda M, Imai K. Improved assay for catechol-O-methyltransferase
activity utilizing norepinephrine as an enzymatic substrate and reversed-phase high-
performance liquid chromatography with fluorescence detection. Journal of
Chromatography A 2005; 1074, 47-51.”
[130] “Masuda M, Tsunoda M, Imai K. Low Catechol-O-methyltransferase Activity in the
Brain and Blood Pressure Regulation. Biol Pharm Bull. 2005; 29(2), 202-205.”
[131] “Hirano Y, Tsunoda M, Shimosawa T, Fujita T, Funatsu T. Measurement of
catechol-O-methyltransferase activity in the brain of Dahl salt-sensitive rats.
Biological and Pharmaceutical Bulletin. 2007; 30, 2178-2180.”
[132] “Reenilä I, Rauhala P. Simultaneous analysis of catechol-O-methyl transferase
activity, S- adenosylhomocysteine and adenosine. Biomedical Chromatography.
2010; 24, 294-300.”
[133] “Cijiang He J, Chuang PY, Ma‟ayan A and Iyengar R.Systems biology of kidney
diseases. Kidney Int. 201; 81(1), 22–39.”

BIBLIOGRAPHY
162
[134] “Boccard J, Veuthey JL and Rudaz S. Knowledge discovery in metabolomics: An
overview of MS data handling. JSS. 2010; 33, 290–304.”
[135] “Patti GJ, Yanes O and Siuzdak G. Metabolomics: the apogee of the omic triology.
Nat Rev Mol Cell Biol. 2013; 4, 263–269.”
[136] “Griffiths WJ, Koal T, Wang Y, Kohl M, Enot DP, Deigner HP. Targeted
metabolomics for biomarker discovery. Angew Chem Int Ed Engl. 2010; 49(32),
5426-45.”
[137] “Monteiro MS, Carvalho M, Bastos ML and Guedes de Pinho P. Metabolomics
Analysis for Biomarker Discovery: Advances and Challenges. Current Medicinal
Chemistr. 2013; 20, 257-271.”
[138] “Dunn WB, Erban A, Weber RJM, Creek DJ, Brown M, Breitling R, Hankemeier
T, Goodacre R, Neumann S, Kopka J and Viant MR. Mass appeal: metabolite
identification in mass spectrometry-focused untargeted metabolomics.
Metabolomics. 2012; 9, S44–S66.”
[139] “Nicholson JK, Lindon JC, Holmes E. Metabonomics: understanding the metabolic
responses of living systems to pathophysiological stimuli via multivariate statistical
analysis of biological NMR spectroscopic data. Xenobiotica. 1999; 29(11), 1181-
1189.”
[140] “Reddy JK, Rao MS. Lipid Metabolism and Liver Inflammation. II. Fatty liver
disease and fatty acid oxidation. Am J Physiol Gastrointest Liver Physiol. 2006; 290,
G852–G858.”
[141] “Commisso M, Strazzer P, Toffali K, Stocchero M, and Guzzo F. Untargeted
metabolomics: an emerging approach to determine the composition of herbal
products. CSBJ.2013; 4 (5).”
[142] “Oldiges M, Lütz S, Pflug S, Schroer K, Stein N, Wiendahl C. Metabolomics:
current state and evolving methodologies and tools. Appl Microbiol Biotechnol.
2007; 76(3), 495-511.”
[143] “Roessner U and Bowne J. What is metabolomics all about?. BioTechniques.2009;
46, 363-365.”
[144] “Medico E, Mongiovi AM, Huff J, Jelinek MA, Follenzi A, Gaudino G, Parsons JT,
Comoglio PM. The tyrosine kinase receptors Ron and Sea control „scattering‟ and
morphogenesis of liver progenitor cells in vitro. Mol Biol Cell. 1996; 7(4), 495–
504.”
[145] “Bradford M M. A rapid and sensitive method for the quantitation of microgram
quantities of protein utilizing the principle of protein-dye binding. Analytical
Biochemistry 1976; 72, 248–254.”
[146] “Rozen S, Skaletsky H. Primer3 on the WWW for general users and for biologist
programmers. Methods Mol Biol. 2000; 132, 365-386.”

BIBLIOGRAPHY
163
[147] “S van Liempd, Cabreda D, Mato JM, Falcon-Pérez JM. A fast method for the
quantification of key metabolites of the methionine pathway in liver tissue by high-
resolution mass spectrometry and hydrophilic interaction ultra-performance liquid
chromatography. Anal Bioanal Chem. 2013; 405, 5301-5310.”
[148] “Leffert H.L, Koch K.S, Moran T, Williams M. Liver cells. MethodsEnzymol. 1979;
58:536–544.” .
[149] “Thery C, Amigorena S, Raposo G, Clayton A. Isolation and characterization of
exosomes from cell culture supernatants and biological fluids. Curr Protoc Cell Biol.
2006; 3 (3.22).”
[150] “Dragovic RA, Gardiner C, Brooks AS, Tannetta DS, Ferguson DJ, et al. Sizing and
phenotyping of cellular vesicles using Nanoparticle Tracking Analysis.
Nanomedicine. 2011; 7, 780-788.”
[151] “Stacey L, Cao H, Lu P, Gibson CR. Effect of cytochromes p450 chemical
inhibitors and monoclonal antibodies on human liver microsomal esterase activity.
DMD. 2006; 34 (8), 1361-1366.”
[152] “Arsenault JC. Beginner‟s Guide to SPE [Solid-Phase Extraction]. 2012. Waters
Corporation.”
[153] “Lucci P, Pacetti D, Frega N, Núñez O. Current Trends in Sample Treatment
Techniques for Environmental and Food Analysis. Chromatography - The Most
Versatile Method of Chemical Analysis. 2012; Chapter 5, 127-164.”
[154] “Method validation and quality control procedures for pesticide residues analysis in
food and feed. 2012. Document N°SANCO/12495/2011.”
[155] “Galan L. Linear calibration curve. Chromedia Analytical Science. 2015.”
[156] “FDA. Bioanalytical Method Validation. 2001.”
[157] “Palomo L, Casal E, Royo F, Cabrera D, Van-Liempd S, Falcon-Perez JM.
Considerations for applying metabolomics to the analysis of extracellular vesicles.
Frontiers in Immunology.Inflammation. 2014; 5, 651.”
[158] “Godoy P et al. Recent advances in 2D and 3D in vitro systems using primary
hepatocytes, alternative hepatocyte sources and non-parenchymal liver cells and their
use in investigating mechanisms of hepatotoxicity, cell signaling and ADME. Archiv
Toxicol. 2013; 87,1315–1530.”
[159] “Tuschl G, Mueller SO. Effects of cell culture conditions on primary rat hepatocytes-
cell morphology and differential gene expression. Toxicology. 2006; 218, 205-215.”
[160] “Godoy P, Hengstler JG, Ilkavets I, Meyer C, Bachmann A, Múller A, Tuschl G,
Mueller SO, Dooley S. Extracellular Matrix Modulates Sensitivity of Hepatocytes to
Fibroblastoid Dedifferentiation and Transforming Growth Factor –Induced
Apoptosis. Hepatology. 2009; 49(6), 2031-2043.”

BIBLIOGRAPHY
164
[161] “Toyoda Y, Tamai M, Kashikura K, Kobayashi S, Fujiyama Y, Soga T, Tagawa Y.
Acetaminophen-Induced Hepatotoxicity in a Liver Tissue Model Consisting of
Primary Hepatocytes Assembling around an Endothelial Cell Network. Drug
metabolism and disposition. 2011; 40(1), 169-177.”
[162] “Bort R, Ponsoda X, Jover R, Gómez-lechón MJ, Castell JV. Diclofenac Toxicity to
Hepatocytes: A Role for Drug Metabolism in Cell Toxicity. The Journal of
Pharmacology and Experimental Therapeutics. 1998; 288 (1), 65-72.”
[163] “Patten CJ, Thomas PE, Guy RL, Lee M, Gonzalez FJ, Guengerich FP, Yang CS.
Cytochrome P450 enzymes involved in acetaminophen activation by rat and human
liver microsomes and their kinetics. Chem Res Toxicol. 1993; 6(4), 511-8.”
[164] “Tang W, Stearns RA, Bandiera SM, Zhang Y, Raab C, Braun MP, Dean DC, Pang
J, Leung KH, Doss GA, Strauss JR, Kwei GY, Rushmore TH, Chiu SH, Baillie TA.
Studies on Cytochrome P-450-mediated bioactivation of diclofenac in rats and in
human hepatocytes: identification of glutathione conjugated metabolites. Drug
metabolism and disposition. 1999; 27(3), 365-372.”
[165] “Milne JLS, Borgnia MJ, Bartesaghi A, Tran EH, Earl LA, Schauder DM, Lengyel
J, Pierson J, Patwardhan A, Subramaniam S. Cryo-electron microscopy: A primer for
the non-microscopist. FEBS J. 2013 ; 280 (1), 28–45.”
[166] “Tatischeff I, Larquet E, Falcon-Perez JM, Turpin PY, Kruglik SG. Fast
characterisation of cell-derived extracellular vesicles by nanoparticles tracking
analysis, cryo-electron microscopy, and Raman tweezers microspectroscopy. Journal
of Extracellular Vesicles. 2012; 1, 19179.”
[167] “Webber J, Clayton A. How pure are your vesicles? Journal of Extracellular Vesicles
2013; 2, 19861.”
[168] “Atlas of Genetics and Cytogenetics in Oncology and Haematology. GNB2L1.”
[169] “Alapatt P, Guo F, Komanetsky SM, Wang S, Cai J, Sargsyan A, Rodríguez Díaz E,
Bacon BT, Aryal P, Graham TE. Liver retinol transporter and receptor for serum
Retinol-binding Protein (RBP4). The Journal of Biological Chemistry. 2013; 288(2),
1250-1265.”
[170] “Pajares M.A., Durane C., Corraslesn F., Pliego M.M., Mato J.M. Modulation of Rat
Liver S-Adenosylmethionine Synthetase Activity by Glutathione. The Journal of
Biological Chemistry. 1992; 267, 17598–17605.”
[171] “Grayson J mendel D. The distribution and regulation of temperature in the rat. J.
physiol. 1956; 133, 334-346.”
[172] “Iloro I., Chehin R., Goni F. M., Pajares M. A., Arrondo J. L. Methionine
adenosyltransferase alpha-helix structure unfolds at lower temperatures than beta-
sheet: a 2D-IR study. Biophysical Journal 2004; 86, 3951–3958.”
[173] “Porcelli M, Cacciapuoti G, Carteni-FarinaM, Gambacorta A. S-
Adenosylmethionine synthetase in the thermophilic archaebacterium Sulfolobus
BIBLIOGRAPHY
165
solfataricus. Purification and characterization of two isoforms. Eur. J. Biochem.
1988; 177, 273-280.”
[174] “Markham GD, Pajares MA.Structure-function relationships in methionine
Adenosyltransferases. Cell Mol Life Sci. 2009; 66(4), 636–648.”
[175] “Geller A.M., Kotb M.Y., Jernigan H.M. Jr, Kredich N.M. Purification and
properties of rat lens methionine adenosyltransferase. Experimental Eye Research
1986; 43: 997-1008.”
[176] “Olsen Ba. Hydrophilic interaction chromatography using amino and silica columns
for the determination of polar pharmaceuticals and impurities. J chromatograf A.
2001; 913(1-2), 113-22.”
[177] “Eric S. Hydrophilic Interaction Chromatography Using Silica Columns for the
Retention of Polar Analytes and Enhanced ESI-MS Sensitivity. LCGC magazine.
2004; 22(10).”
[178] “Cataldi1 T, Bianco G, Abate S, Mattia D. Analysis of S-adenosylmethionine and
related sulfur metabolites in bacterial isolates of Pseudomonas aeruginosa (BAA-47)
by liquid chromatography/ electrospray ionization coupled to a hybrid linear
quadrupole ion trap and Fourier transform ion cyclotron resonance mass
spectrometry. Rapid Commun. Mass Spectrom. 2009; 23, 3465–3477.”
[179] “Gellekink H, Oppenraaij-Emmerzaal D, van Rooij A, Struys E, Heijer M, Blom HJ.
Stable-Isotope Dilution Liquid Chromatography–Electrospray Injection Tandem
Mass Spectrometry Method for Fast, Selective Measurement of S-
Adenosylmethionine and S-Adenosylhomocysteine in Plasma. Clinical Chemistry.
2005; 51(8), 1487–1492.”
[180] “Wilson I.D., Martin P. Solid-Phase Extraction mediated by covalent bonding:
applications of immobilized phenylboronic acid in: Solid-Phase Extraction:
Principles, Techniques, and Applications. Edited by Nigel J.K. Simpson. 2000.”
[181] “Agilent Bond Elut Plexa and Polymeric SPE Selection Guide (Agilent
Technologies).”
[182] “Kim S.J., Know D.Y., Choi K.H., Choi D.W., Kim Y.C. Impaired Metabolomics of
Sulfur Containing Substances in Rats Acutely Treated with Carbon Tetrachloride.
Toxicology Research 2008; 24, 281–287.”
[183] “Shapiro A.B., Gao N., Thresher J., Walkup G.K., Whiteaker J. A High-Throughput
Absorbance-Based Assay for Methionine Produced by Methionine Aminopeptidase
Using S-Adenosyl-L-Methionine Synthetase. Journal of Biomolecular Screening
2011; 16, 494–505.”
[184] “Taylor PJ. Matrix effects: the Achilles heel of quantitative high-performance liquid
chromatography-electrospray-tandem mass spectrometry. Clin Biochem. 2005;
38(4), 328-34.”

BIBLIOGRAPHY
166
[185] “Trufelli H, Palma P, Famiglini G, Cappiello A. An overview of matrix effects in
liquid chromatography-mass spectrometry. Mass Spectrom Rev. 2011; 30(3), 491-
509.”
[186] “Annesley TM.Ion Suppression in Mass Spectrometry. Clinical Chemistry. 2003;
49(7), 1041–1044.”
[187] “Method validation and quality control procedures for pesticide residues analysis in
food and feed. 2012. Document N°SANCO/12495/2011.”
[188] “Krijt J, Dutá A, Kozich V. Determination of S-Adenosylmethionine and S-
Adenosylhomocysteine by LC–MS/MS and evaluation of their stability in mice
tissues. Journal of Chromatography B. 2009; 877, 2061–2066.”
[189] “Bonifacio 2003_Purification of mb bound COMT.pdf.”
[190] “Peaston R.T., Graham K.S., Chambers E., van der Molen J.C., Ball S. Performance
of plasma free metanephrines measured by liquid chromatography-tandem mass
spectrometry in the diagnosis of pheochromocytoma. Clinica Chimica Acta. 2010;
411, 546-52.”
[191] “Pekka T, Annisto O, Seppo Kaakkola. Catechol-O-methyltransferase (COMT):
Biochemistry,Molecular Biology, Pharmacology, and Clinical Efficacy of the New
Selective COMT Inhibitors. Pharmacological reviews. 1999; 51(4).”
[192] “Zhang X, Rauch A, Lee H, Xiao H, Rainer G, Logothetis NK. Capillary hydrophilic
interaction chromatography/mass spectrometry for simultaneous determination of
multiple neurotransmitters in primate cerebral cortex. Rapid Communication in Mass
Spectrometry. 2007; 21, 3621-3628.”
[193] “Oasis WCX SPE Products for Strongly Basic Compounds. Waters Corporation.
2005.”
[194] “Brown JM, Ball JG, Hogsett A, Williams T, Valentovic M. Temporal Study of
Acetaminophen (APAP) and S-Adenosyl-Lmethionine (SAMe) Effects on
Subcellular Hepatic SAMe Levels and Methionine Adenosyltransferase (MAT)
Expression and Activity. Toxicol Appl Pharmacol. 2010; 247(1), 1–9.”
[195] “Edelstein CL. Biomarkers in kidney disease. Elsevier. 2011.”
[196] “Weckwerth, W. Metabolomics in systems biology. Annu Rev Plant Biol. 2003; 54,
669-89.”
[197] “Sana T and Fischer S. Maximizing metabolite extraction for cohomprensive
metabolomics studies of erytrocytes. Agilent technologies. 2007.”
[198] “Silas G, Villas-Boas, Mas S, Akesson M, Smedsgaard J and Nielsen J. Mass
spectrometry in metabolome analysis. Mass Spectrometry reviews. 2005; 24, 613-
646.”
[199] “Guzzetta A. Reverse Phase HPLC Basics for LC-MS.Tutorial. 2001.” .
BIBLIOGRAPHY
167
[200] “Wang J, Byun J,Pennathur S. Analytical Approaches to Metabolomics and
Applications to Systems Biology. Semin Nephrol. 2010; 30(5), 500–511.”
[201] “Yanes O, Tautenhahn R, Patti GJ, Siuzdak G. Expanding Coverage of the
Metabolome for Global Metabolite Profiling. Anal Chem.2011; 83(6), 2152–2161.”
[202] “Rasmusse LG, Savorani F, Larsen TM, Dragsted LO, Astrup A, Engelsen SB.
Standardization of factors that influence human urine metabolomics.Metabolomics.
2011; 7, 71–83.”
[203] “MarkerLynx XS Training. Waters Corporation.”
[204] “Gonzalez E, Van liempd S, Conde-Vancells J, Gutierrez-de Juan V, Perez-
Cormenzana M, Mayo R, Berisa A, Alonso C, Marquez CA, Barr J, Lu SC, Mato JM
and Falcon-Perez JM. Serum UPLC-MS/MS metabolic profiling in an experimental
model for acute-liver injury reveals potential biomarkers for hepatotoxicity.
Metabolomics. 2012; 8(6), 997–1011.”
[205] “MS:Elemental composition calculations and their interpretations. Mass
Spectrometry- Essays and Tutorials. 2006.”
[206] “Blake MJ, Udelsmant R, Feulner GJ, Norton DD, Holbrook N. Stress-induced heat
shock protein 70 expression in adrenal cortex: An adrenocorticotropic hormone-
sensitive, age-dependent response. Proc Nati Acad Sci. 1991; 88, 9873-9877.”
[207] “Zhao Y, Ren J, Padilla-Parra S, Fry EE, Stuart D. Lysosome sorting of b-
glucocerebrosidase by LIMP-2 is targeted by the mannose 6-phosphate receptor.
Nature Communications. 2014; 14(5).”
[208] “Masuda M, Tsunoda M, Imai K. Low Catechol-O-methyltransferase Activity in the
Brain and Blood Pressure Regulation. Biol Pharm Bull. 2006; 29(2,) 202-205.”
[209] “Yang X, Weng Z, Mendrick DL, Shi Q. Circulating extracellular vesicles as a
potential source of new biomarkers of drug-induced liver injury. Toxicology Letters.
2014; 225(3).”
[210] “FDA, 2009. Guidance for Industry: Drug-Induced Liver Injury: Premarketing
ClinicalEvaluation. 2013.”
[211] “Bala, S., Petrasek, J., Mundkur, S., Catalano, D., Levin, I., Ward, J., Alao, H.,
Kodys, K.,Szabo, G., 2012. Circulating microRNAs in exosomes indicate hepatocyte
injury and inflammation in alcoholic, drug-induced, and inflammatory liver diseases.
Hepatology. 2012; 56 (5), 1946–1957.”
[212] “RessomHW, Xiao JF, Tuli L, Varghese RS, Zhou B, Tsai TH, Nezami Ranjbar M,
Zhao Y, Wang J, Di Poto C, Cheema AK, Tadesse MG, Goldman R, Shetty K.
Utilization of Metabolomics to Identify Serum Biomarkers for Hepatocellular
Carcinoma in Patients with Liver Cirrhosis. Anal Chim Acta. 2012; 743C, 90–100.”
[213] “Bogdanov M, Matson WR, Wang L, Matson T, Saunders-Pullman R, Bressman SS,
Beal MF. Metabolomic profiling to develop blood biomarkers for Parkinson‟s
disease. Brain. 2008; 131, 389-396.”

BIBLIOGRAPHY
168
[214] “Potmesil M. Camptothecins: from bench research to hospital wards. Cancer
Research. 1994; 54: 1431–1439.”
[215] “Mathijssen RH, Van Alphen RJ, Verweij J, Loos WJ, Nooter K, Stoter G,
Sparreboom A. Clinical pharmacokinetics and metabolism of irinotecan (CPT-11).
Clin Cancer Res. 2001 Aug; 7: 2182-2194.”
[216] “Lu S.C., Mato J.M. S-adenosylmethionine in liver health, injury and cancer.
Physiological Reviews 2012; 92, 1515–1542.”
[217] “Lombardini JB, Chou TC, Talalay P. Regulatory properties of adenosine
triphosphate- L-methionine S-adenosyltransferase of rat liver. Biochem. 1973; 135,
43–57.”
[218] “Mato JM, Lu SC. Role of S-Adenosyl-L-Methionine in Liver Health and Injury.
Hepatology. 2007; 45(5), 1306-1312.”
[219] “Skordi E, Claus SP, Martin FP, Cloarec O, Lindberg J, Schuppe-Kolstinen I,
Holmes E, Nicholson JK. Analysis of time-related metabolic fluctuations induced by
ethionine in the rat. J Proteome Res. 2007; 6, 4572–4581.”
[220] “Zhuge J, Cederbaum AI. Depletion of S-adenosyl-L-methionine with cycloleucine
potentiates cytochrome P450 2E1 toxicity in primary rat hepatocytes. Arch Biochem
Biophys. 2007; 486, 177–185.”
[221] “Ramani D, De Bandt JP, Cynober L. Aliphatic polyamines in physiology and
diseases. Clin Nutr. 2014; 33(1), 14-22.”
[222] “Tetta C, Bruno S, Fonsato V, Deregibus CM, Camussi G. The role of microvesicles
in tissue repair. Organogenesis. 2011; 7(2), 105-115.”
[223] “Volodymyr I. Lushchak. Glutathione Homeostasis and Functions: Potential Targets
for Medical Interventions. Journal of Amino Acids.2011; 2012, 736837-26.”
[224] “Hunt Ng Y, Rome S, Jalabert A, Forterre A, Singh H, Hincks CL, Salamonsen LA.
Endometrial Exosomes/Microvesicles in the Uterine Microenvironment: A New
Paradigm for Embryo-Endometrial Cross Talk at Implantation. Plos One. 2013;
8(3).”
[225] “Shen B, Wu N, Yang JM, Gould S. Protein targeting to exosomes/microvesicles by
plasma membrane anchors. The Journal of Biological Chemistry. 2011; 286, 14383-
14395.”
[226] “Stillwell W. The role of polyunsaturated lipids in membrane raft function.
Scandinavian Journal of Food and Nutrition. 2006; 50 (S2), 107-113.”
[227] “Human Metabolome Database: Glycerylphosphorylethanolamine (HMDB00114).”


SUPPORT
170
10. SUPPORT
This work was supported by:
- Grants PI060621, PS09/00526 and PI12_01604, cofinanced by the ISCIII
Subdirección General de Evaluación and Fondo Europeo de Desarrollo Regional
(FEDER).
- Travel grants of European COST Actions BM0901 and BM1202 financed by
European Science Foundation (ESF).
- Departamento de Educación Política Lingüística y Cultura del Gobierno Vasco
(PI2012-45).
- Departamento de Sanidad del Gobierno Vasco (2012-2015)
- Subprograma Ramón y Cajal RYC2007-00228
- Predoctoral grant from the CIC bioGUNE.


Copyright © 2022 FDOKUMEN