The Impact of Bank and Stock Market Developments on ...
21
The Impact of Bank and Stock Market Developments on Economic Growth in Zimbabwe: 1988 To 2012 Phineas G. Kadenge and Felex Tafirei 1 Abstract The paper examines the short and long run impact of bank and stock market developments on growth in Zimbabwe using annual data from 1988-2012, inclusive. The study uses a financially- augmented production growth function and applies the Auto Regressive Distributed Lag (ARDL) approach and the error correction mechanism to simultaneously examine the short and long run relationships. Bank and stock market developments indices are used to measure developments in the banking sector and the stock market. The results indicate the existence of a steady long run relationship between growth, bank and stock market developments. Banks are found to have a greater impact on economic growth than stock markets. Evidence of supply- leading hypothesis is found. The results suggest that economic growth is better promoted through a financially-based economic system than a stock market based one. Key Words: Zimbabwe, financial development, bank developments, economic growth, stock market developments JEL Classification Codes: E44, F43, O11, O16, O43 1 Department of Economics, University of Zimbabwe and Bindura University of Science Education, Zimbabwe respectively * Corresponding Author: [email protected] BOJE: Botswana Journal of Economics 74
-
Upload
khangminh22 -
Category
Documents
-
view
1 -
download
0
Transcript of The Impact of Bank and Stock Market Developments on ...

The Impact of Bank and Stock Market Developments on Economic Growth in Zimbabwe: 1988 To 2012
Phineas G. Kadenge and Felex Tafirei1
Abstract
The paper examines the short and long run impact of bank and stock market developments on growth in Zimbabwe using annual data from 1988-2012, inclusive. The study uses a financially-augmented production growth function and applies the Auto Regressive Distributed Lag (ARDL) approach and the error correction mechanism to simultaneously examine the short and long run relationships. Bank and stock market developments indices are used to measure developments in the banking sector and the stock market. The results indicate the existence of a steady long run relationship between growth, bank and stock market developments. Banks are found to have a greater impact on economic growth than stock markets. Evidence of supply-leading hypothesis is found. The results suggest that economic growth is better promoted through a financially-based economic system than a stock market based one.
Key Words: Zimbabwe, financial development, bank developments, economic growth, stock market developments
JEL Classification Codes: E44, F43, O11, O16, O43
1 Department of Economics, University of Zimbabwe and Bindura University of Science Education, Zimbabwe respectively * Corresponding Author: [email protected]
BOJE: Botswana Journal of Economics 74

1. INTRODUCTION
Finance-growth proponents like Greenwood and Jovanovic (1990) and King and Levine (1993a, 1993b) argue that well developed financial and equity markets enhance economic growth and development through their effects on capital accumulation, technical progress and productivity. In developing countries where financial markets are repressed, economic growth is retarded due to deep rooted inefficiencies in credit and equity markets (Shaw, 1973). Liberalisation of financial and equity markets is thus expected to lead to financial and equity market developments that will eventually accelerate growth than if the financial and equity markets were to remain repressed. However, according to Lucas (1988) proponents of finance-driven growth seem to overstress the role that finance plays in promoting economic growth at the expense of other more important growth enhancing factors.
Empirical evidence from Zimbabwe as well as from developed and other developing countries is not conclusive as to the role that banks and stock markets play in promoting economic growth. Besides, prior studies2 on finance and growth in Zimbabwe do not simultaneously examine bank and stock market developments and growth in a unified framework yet both banks and stock markets are channels through which physical capital can be accumulated. By using fewer financial variables and studying the effects of bank and stock market developments separately these prior studies might have failed to capture not only some of the developments that have occurred in the financial market but also the effects that financial market developments might have had on economic growth in Zimbabwe. This paper attempts to fill this gap by examining simultaneously the contribution of bank and stock market developments to both the short and long run economic growth in Zimbabwe.
An Autoregressive Distributed Lag Model (ARDL) was used to estimate the relationship between growth and bank and stock market developments in Zimbabwe. Annual time series data for the sample period 1988-2012 was used in the analysis. The main source of data was the World Bank complemented by the Reserve Bank of Zimbabwe (RBZ) and the Zimbabwe Statistical Agency (ZimStat).
The rest of the paper is organised as follows: Section 2 gives an overview of Zimbabwe’s macroeconomic performance and the bank and stock market developments over the period under study. Section 3 contains an analysis of related theoretical and empirical literature on finance and growth. Section 4 presents the methodology used in the study. In section 5, the results are analysed and presented and the final section concludes the study and gives some policy recommendations.
2. AN OVERVIEW OF ZIMBABWE’S MACROECONOMIC PERFORMANCE, BANK AND STOCK MARKET DEVELOPMENTS
2.1 ZIMBABWE’S MACROECONOMIC PERFORMANCE (1988-2012)
Zimbabwe’s macroeconomic performance, as measured by real gross domestic product (GDP) during the period 1988-2012, was not impressive. The average real growth rate over this period was nearly 0.32% annually. Domestically the performance of the economy was 2 Ndlovu (2013), Zivengwa et al. (2011) and Jecheche (2010)
75 BOJE: Botswana Journal of Economics

negatively affected by droughts, the poor policy environment, unstable political climate, the hyperinflationary situation and instability in the financial sector. The performance of the economy was also affected by external factors that included the global oil crisis of the 1980s, the global recession of the 1990s and the 2008-2012 international financial crisis. The major result was largely weak and persistently negative growth for the ten year period 1999-2008 (Reserve Bank of Zimbabwe, 2012). Figure 1.1 below shows real GDP growth rate for Zimbabwe from 1988-2012.
Figure 1.1: Zimbabwe: Annual Real GDP Growth Rate, 1988-2012
Source: Authors’ computations based on World Bank Data, 2013
As shown in Figure1.1 above Zimbabwe experienced weak but positive growth rates averaging 3.9% per annum between 1988 and 1998 (period 1 in Figure 1.1). Growth during this period was largely influenced by drought in 1992, low investment and low industrial output due to foreign currency shortages (Reserve Bank of Zimbabwe, 2010).Between 1999 and 2008 the Zimbabwean economy was characterised by a sustained decline in real GDP averaging -6.5% per annum reaching a low of -17.67% in 2008 at the height of the hyperinflationary period. This period, now referred to as the ‘lost decade’ (period 2 in Figure 1.1) was characterised by four major droughts (Martens, 2012), the banking crisis of 2003-2004 and hyperinflation that reached a peak of 231 million percent by end of June 2008 (ZimStat, 2012). However, following dollarization in 2009, growth averaged 7.5% in the 4 year period from 2009 to 2012 (World Bank, 2013).
2.2 BANK DEVELOPMENTS IN ZIMBABWE (1988-2012)
At independence, the government inherited a largely oligopolistic and stagnant banking sector which was repressed as elsewhere in Africa. However, the financial reforms undertaken in 1991 led to significant changes in the architecture of the financial sector. From a sector dominated by only four foreign banks in 1980 and no indigenous banks, 17 out of a total of 24 banking institutions (71%) were locally owned by December 2012.
Cumulatively, indigenous banks held about US$3 billion (70%) in total deposits while foreign owned institutions held US$1.3 billion (30%) of total deposits as at end of 2012. Deregulation of the financial market also led to an increase in total advances to the private sector and a significant shift in loan allocations among sectors even though they remained largely short term in nature (Reserve Bank of Zimbabwe, 2013).
82
2. An overview of Zimbabwe’s macroeconomic performance, bank and stock market developments
2.1 Zimbabwe’s macroeconomic performance (1988-2012)
Zimbabwe’s macroeconomic performance, as measured by real gross domestic product (GDP) during the period 1988-2012, was not impressive. The average real growth rate over this period was nearly 0.32% annually. Domestically the performance of the economy was negatively affected by droughts, the poor policy environment, unstable political climate, the hyperinflationary situation and instability in the financial sector. The performance of the economy was also affected by external factors that included the global oil crisis of the 1980s, the global recession of the 1990s and the 2008-2012 international financial crisis. The major result was largely weak and persistently negative growth for the ten year period 1999-2008 (Reserve Bank of Zimbabwe, 2012). Figure 1.1 below shows real GDP growth rate for Zimbabwe from 1988-2012.
Source: Authors’ computations based on World Bank Data, 2013
As shown in Figure1.1 above Zimbabwe experienced weak but positive growth rates averaging 3.9% per annum between 1988 and 1998 (period 1 in Figure 1.1). Growth during this period was largely influenced by drought in 1992, low investment and low industrial output due to foreign currency shortages (Reserve Bank of Zimbabwe, 2010).
Between 1999 and 2008 the Zimbabwean economy was characterised by a sustained decline in real GDP averaging -6.5% per annum reaching a low of -17.67% in 2008 at the height of the hyperinflationary period. This period, now referred to as the ‘lost decade’ (period 2 in Figure 1.1) was characterised by four major droughts (Martens, 2012), the banking crisis of 2003-2004 and hyperinflation that reached a peak of 231 million percent by end of June 2008 (ZimStat, 2012). However, following dollarization in 2009, growth averaged 7.5% in the 4 year period from 2009 to 2012 (World Bank, 2013).
-20%
-15%
-10%
-5%
0%
5%
10%
15%
88 90 92 94 96 98 00 02 04 06 08 10 12
Period 3(Recovery) Period 2
(The Lost Decade)
Period 1 (Busts & Booms)
Figure 1.1: Zimbabwe: Annual Real GDP Growth Rate, 1988-2012
Annual Real GDP Growth
BOJE: Botswana Journal of Economics 76

In the mid-1990s up to 2008 the financial sector was in a crisis largely caused by the hyperinflationary situation, the international liquidity crunch and low domestic saving, volatile deposits and unsound banking practices. The instability in the financial sector culminated in the banking crisis of 2003-2004 during which thirteen indigenous banks were liquidated to protect the depositors (Reserve Bank of Zimbabwe, 2012). It is important to note that over the same period real GDP growth rate averaged -6.5% annually (World Bank, 2013).
However, following dollarization of the economy in early 2009, the hyperinflationary situation ended and the financial sector stabilised. From 2009 to 2012 the financial services sector was the fastest growing sector in the economy with an average growth rate of 13% per annum. At the same time annual GDP growth rate averaged 7.5% between 2009 and 2012 largely due to renewed confidence in the financial sector, political stability and improved fiscal discipline (Reserve Bank of Zimbabwe, 2013).
2.3 STOCK MARKET DEVELOPMENTS IN ZIMBABWE (1988-2012)
The Zimbabwe Stock Exchange (ZSE) which was formed in 1896 was opened to foreign players in May 1993 in line with the Economic Structural Adjustment Programme (ESAP). This increased trading activity on the exchange, number of counters, market capitalisation and integration with the world financial markets. As stock market activity increases economic growth is expected to rise as the stock market helps attract investment necessary for growth to occur.
Millions of shares worth billions of dollars are traded annually on the ZSE. In 1997, the value of shares traded on the stock exchange more than doubled to around US$26.5 billion making the ZSE one of the star emerging market performers. The ZSE’s mean capitalisation for the 25 year period was 78.1% of GDP (World Bank, 2013).
During 1998, the ZSE turnover and value of shares sold declined by 60% and 88%, respectively. However, market capitalisation continued to increase. The high market capitalisation that the ZSE continued to experience up to 2008 might have reflected speculative tendencies as it was not matched by trading. The poor economic performance, rapid deindustrialisation and inconsistent policy issues especially with regards to indigenisation led to even more speculative activities on the ZSE. The result was the suspension of trading on the ZSE in late 2008. Trading only resumed in early 2009 following dollarization of the economy. However, trading has remained very thin.
In light of the bank and stock market developments described above and the general poor macroeconomic performance of the economy since 1988, one cannot help but ask what effect these developments have had on economic growth in Zimbabwe. Is there any relationship between bank and stock market developments and growth or the pattern that seems to be there is some mere coincidence? Assuming that there is some relationship, does causality run from growth to financial development or growth follows financial development? Finally which part of the financial sector promoted growth more than the other, banks or stock markets?
77 BOJE: Botswana Journal of Economics

3. LITERATURE REVIEW
Various theories have been put forward as to how governments may increase economic growth but none have generated greater interest and attracted controversy in recent years than the role that financial development can play in promoting the growth and development of a country. The empirical evidence gathered, both in developed and developing countries, has generated more questions than answers. This section reviews the theoretical as well as the empirical literature on finance and growth.
In the traditional neoclassical Solow-Swan (1956) growth model the output of an economy grows in response to larger inputs of physical capital and labour. Non-economic variables such as human capital and finance are excluded in this model. The model assumes that as capital stock increases, growth of the economy slows down since capital is subject to diminishing returns. This implies that, because of diminishing returns, at some point the amount of new capital produced would just be enough to make up for capital consumption. When this point is reached the economy will cease to grow or the economy will converge to a constant steady state rate of growth. In the long run, the economy will only grow if there is technological progress. The model, however, treats technology as exogenous.
On the other hand, Romer (1986) treats technology as an endogenous growth variable. According to this theory there are a number of endogenous variables that drive technological progress and hence, spur economic growth. This is the basis of finance-growth theory. Financial variables enter the growth equations through their effects on capital accumulation, technological progress and productivity growth. The financial variables are thus endogenous to growth (King and Levine, 1993a, 1993b). Growth in this case can be modeled as where Y is output, A is total factor productivity (TFP), K is capital, L is labour, H is human capital and FMD is financial market development. The variable A is a function of FMD.
According to Patrick (1966) causality between financial development and economic growth can either be supply-leading or demand-following. The supply-leading hypothesis postulates that financial development has a positive impact on growth and causality runs from financial development to growth while the demand-following hypothesis postulates that causality runs from growth to financial development.
McKinnon’s Outside-Money Model and Shaw’s Inside-Money Model support Patrick’s supply-leading argument. McKinnon (1973) argues that financial markets in developing countries are underdeveloped and external financing is very limited. Entrepreneurs, therefore, have to rely on self-financing. This requires that potential investors must first accumulate huge savings to allow them to undertake lumpy investment expenditures. On the other hand, Shaw (1973) in his Inside-Money Model argues that investors need not necessarily save before they can invest but can borrow from financial institutions (debt intermediation view). Financial institutions offer high interest rates to attract savings. As saving increases, the supply of credit rises allowing financial institutions to promote investment and hence growth through lending and borrowing. The demand-following hypothesis postulates that causality in the finance growth-nexus runs from growth to finance. According to Patrick (1966), as the economy grows and becomes sophisticated, the demand for financial services to support economic activities also rises. This view is also supported by Gurley and Shaw (1967), and Beck and Levine (2004), among others.
BOJE: Botswana Journal of Economics 78

King and Levine (1993b) carried out a cross-section analysis of 80 countries for the period 1960-1989. Their results indicate that economic growth was strongly predicted by the level of financial development. This study is supported by Levine (1997) who concludes that where countries have large and efficient financial systems, growth occurs at a faster rate than in countries where financial systems are inefficient. Allen and Ndikumana (2000) also found financial development and economic growth to be positively correlated in the case of Southern Africa. Levine (1991) argues that liquid stock markets reduce liquidity risks making investors more willing to commit their funds to high return capital investments. Stock markets also allow investors to diversify their portfolios and thus reduce idiosyncratic productivity risks thus raising investment as well. This position is supported by Saint-Paul (1992) but Obstfeld (1994) and Bhidhe (1993) warn about the possible negative effects that stock markets might have of depressing saving rates and slowing down economic growth.
Rioja and Valev (2011) studied stock markets, banks and the sources of economic growth using a large cross country panel of low and high income countries over the period 1980-2009. They found banks to have a sizable positive effect on capital accumulation in low income countries. Stock markets were found not to have contributed anything towards capital accumulation or productivity growth in these countries. In high income countries, however, stock markets were found to play a significant role in affecting both productivity and capital growth with banks affecting capital accumulation only.
Choe and Moosa (1999) found financial intermediaries more important than capital markets in promoting growth in Korea for the period 1970-1992. Similarly, Demetriades and Luintel (2001) using time series data to study bank and stock market developments in five developed countries, concluded that while developments in both the banking sector and stock markets foster economic growth, the influence of bank developments was much more pronounced than stock market developments. On the other hand Guryay et al. (2007) found out that for Northern Cyprus, financial development does not cause economic growth and causality runs from economic growth to the development of financial markets.
Kargbo and Adamu (2009) studied financial development and economic growth in Sierra Leone from 1970-2008. A financial sector development index was used to measure developments in the sector. The researchers found that real GDP, financial development, investment and real deposit rate are uniquely co-integrated. Khan et al. (2005) used an ARDL approach to study the relationship between financial development and economic growth in Pakistan from 1971-2004. The study found that the relationship between financial depth, real deposit rate and economic growth was only significant in the long run and not in the short run. Hondroyiannis et al. (2005) assessed empirically the relationship between bank system development and the stock market and economic growth in Greece for the period 1986-1999. They found a bi-directional causality between finance and growth in the long run. The contribution of stock market finance on growth was found to be substantially smaller compared to that of bank financing.
Hamdi et al. (2013) examined the causality between financial development, investment and economic growth in Tunisia for the period 1961-2010. They used a multivariate framework based on Vector Error Correction Model and cointegration techniques. Their short run
79 BOJE: Botswana Journal of Economics

estimates revealed that finance does not lead to economic growth while the long run results showed the opposite conclusion. They also found out that investment was the main engine for economic growth both in the short and long run.
Zivengwa et al. (2011) studied stock market development in Zimbabwe for the period 1980-2008 and found a uni-directional relationship running from stock market development to economic growth. Jecheche (2010) found similar results when he looked at the banking sector while Ndlovu (2013) found evidence of demand-following in Zimbabwe. These results are conflicting indicating the need for further research in the area.
The reviewed theoretical literature is robust in explaining the relationship between financial development and economic growth. However, a distinct consideration given to low income countries on one hand and high income countries on the other seems to suggest that the theoretical literature is overgeneralised in relation to the effect of financial development on growth across countries. As reviewed in the empirical literature, there is some evidence of financial development positively affecting economic growth (King and Levine, 1993b, Allen and Ndikumana, 2000). Contrary to these findings other studies like Guryay et al. (2007) found that financial development does not cause economic growth. The empirical literature suggests that stock markets play an insignificant role in promoting capital accumulation and productivity in low income countries. Further to this, banks have been found to contribute more to economic growth than stock markets. Heterogeneity in the empirical evidence may be a result of different time periods, estimation methods, measures of financial and stock market developments and growth considered as well as the type of study (cross sectional, time series or panel time series). This study attempts to provide more evidence of the bank and stock market developments on economic growth relationship in Zimbabwe by considering a different time period, estimating method and using bank and stock market development indices simultaneously.
4. METHODOLOGY AND DATA ISSUES
Several econometric methodologies have been used by researchers to test the relationship between financial development and economic growth. The Ordinary Least Squares (OLS) method has been the most widely used method although it has been found to have some limitations when studying long run relationships between economic variables. Other methodologies like the Johansen technique require that the economic variables under study be of the same order of integration. The ARDL technique, on the other hand, can be conducted even if the series are integrated of order zero (I (0)), integrated of order one (I (1)) or mutually integrated (Pesaran and Pesaran, 1997). However, the ARDL technique collapses if any variable is integrated of an order higher than 1.The approach has also been found to yield better results in small samples than other cointegration techniques (Narayan, 2004). The ARDL approach also eliminates the problem of serial correlation and endogeneity if appropriate lags are used (Jalil and Ma, 2008). The ARDL method is also able to estimate simultaneously the long run and short run parameters of the model. Simultaneously estimating the long run and short run relationships also corrects for the problem of variable omission and autocorrelation (Khan et al. 2005).
The use of the neoclassical production function to model growth relationships is common in economics having been used by Kohpaiboon (2003), Herzer et al. (2006) and Sultan (2012)
BOJE: Botswana Journal of Economics 80
and many other researchers. Following Sultan (2012) the neoclassical aggregate production function can be expressed as:
87
4. Methodology and Data Issues
Several econometric methodologies have been used by researchers to test the relationship between financial development and economic growth. The Ordinary Least Squares (OLS) method has been the most widely used method although it has been found to have some limitations when studying long run relationships between economic variables. Other methodologies like the Johansen technique require that the economic variables under study be of the same order of integration. The ARDL technique, on the other hand, can be conducted even if the series are integrated of order zero (I (0)), integrated of order one (I (1)) or mutually integrated (Pesaran and Pesaran, 1997). However, the ARDL technique collapses if any variable is integrated of an order higher than 1.The approach has also been found to yield better results in small samples than other cointegration techniques (Narayan, 2004). The ARDL approach also eliminates the problem of serial correlation and endogeneity if appropriate lags are used (Jalil and Ma, 2008). The ARDL method is also able to estimate simultaneously the long run and short run parameters of the model. Simultaneously estimating the long run and short run relationships also corrects for the problem of variable omission and autocorrelation (Khan et al. 2005).
The use of the neoclassical production function to model growth relationships is common in economics having been used by Kohpaiboon (2003), Herzer et al. (2006) and Sultan (2012) and many other researchers. Following Sultan (2012) the neoclassical aggregate production function can be expressed as: GDP! = f A! ,K!, L! (1) 𝑤𝑤ℎ𝑒𝑒𝑒𝑒𝑒𝑒 GDPt is real GDP in time period t, A, K and L are as defined before. Financial development is expected to contribute to output growth through its effects on TFP. Thus in this case TFP is a function of developments in the banking sector captured by the bank sector development index (BDI) and also a function of developments in the stock market sector captured by the stock market development index (SMDI) respectively. This can be expressed as: 𝐴𝐴! = f BDI!, SMDI! (2)
Substituting equation (2) into equation (1) we have: GDP! = f(BDI! , SMDI! ,K! , L!) (3) In its intensity form equation 3 can be written as:
gdp! = f(bdi! , smdi! , k! ) (4) where gdp! =
!"#!!! , bdi! =
!"#!!! , smdi! =
!"#!!!
and k! =!!!!
respectively. Assuming a Cobb-Douglas production function, equation 4 can be explicitly expressed as
321 βββtttt ksmdibdigdp = (5)
which can be log transformed into an explicit estimable function of the form ttttt ksmdibdigdp εββββ ++++= lnlnlnln 3210 (6)
where β!is a constant and β!, β! and β! are the elasticity coefficients of real GDP per capita with respect to bank and stock market developments and the stock of capital respectively and 𝜀𝜀! is the error term.
........................................................................................................ (1)
........................................................................................................... (2)
................................................................................................. (3)
............................................................................................. (4)
..................................................................................................................... (5)
....................................................................... (6)
88
The choice of the ARDL model was based on the assumption that there was a unique relationship between bank, stock market developments and economic growth. Following Pesaran et al. (2001) the conditional ARDL-error correction model is thus specified as:
(7) where the other variables are as defined before; ∆ is the difference operator, δ! is
the drift and 𝜑𝜑!, 𝜑𝜑! , 𝜑𝜑! 𝑎𝑎𝑎𝑎𝑎𝑎 𝜑𝜑!are the long run multipliers respectively. The coefficients 𝛼𝛼! measure the short run effects. The long run coefficients are expected to have a positive sign each.The coefficients show how strongly the regressors influence economic growth respectively. High coefficients signal an important influence that the regressors have on the regressand.
The ARDL estimation involves testing the null hypothesis of no cointegration relationship against the alternative hypothesis of the existence of a cointegration relationship. The null and alternate hypotheses were therefore stated as:
𝐻𝐻!: 𝜑𝜑! = 𝜑𝜑! = 𝜑𝜑! = 𝜑𝜑! = 0 (8) 𝐻𝐻!: 𝜑𝜑! ≠ 𝜑𝜑! ≠ 𝜑𝜑! ≠ 𝜑𝜑! ≠ 0 (9)
The F test is used to establish whether a cointegration relationship among variables exists or not. After calculating the F test, it is compared with the critical values tabulated by Narayan (2004) for small samples. The lower critical bound assumes that all variables are I (0) and upper bound assumes that all the variables are I (1). If F-test statistic calculated is greater than the upper bound critical value then we reject the null hypothesis of whether variables are I (0) or I (1). If F-test statistic calculated is less than the lower bound critical value, at the specific level of significance, the null hypothesis cannot be rejected. If F-test falls between the upper and lower bounds the result is inconclusive and the decision is made based on the significance of the error correction term.
Finally the short run relationships are captured through error correction. The error correction representation of the series was specified as follows:
t
p
itit
r
iit
p
i
q
iititt
ecmk
smdibdigdpgdp
εξα
αααδ
++Δ+
Δ+Δ+Δ+=Δ
∑
∑∑ ∑
=−−
=−
= =−−
014
03
1 0210
)(ln
)()()ln()ln(
(10)
where ξ is the speed of adjustment parameter and ecm is the error correction term. The coefficient of the lagged error correction term (ξ) is expected to be negative and statistically significant to further confirm the existence of a cointegration relationship.
Annual time series data over the sample period 1988-2012 was used to estimate the relationship. Economic growth is the dependent variable proxied by annual real GDP per capita. The choice of this proxy is consistent with other empirical studies. Domestic credit provided by the banking
∑
∑∑ ∑
=−−−−−
=−
= =−−
+++++Δ+
Δ+Δ+Δ+=Δ
p
itttttit
r
iit
p
i
q
iititt
ksmdibdigdpk
smdibdigdpgdp
0141312114
03
1 0210
lnln)(ln
)()()ln()ln(
εϕϕϕϕα
αααδ ....................................... (7)
.......................................................................................................... (8)
.......................................................................................................... (9)
81 BOJE: Botswana Journal of Economics
sector refers to net credit advances to all economic sectors on a gross basis (excluding credit to the central government). Following Naceur and Ghazouani (2007) and Levine and Zervos (1996) an annual BDI was constructed by subtracting the domestic credit sample mean from the annual value of domestic credit and dividing by the sample mean. The index takes integer values with positive and higher values indicating positive developments in the banking sector. The study expects a positive relationship between BDI and growth. Market capitalisation and stock traded value as ratios of GDP were used to come up with a stock market development index. A simple index of stock market development (SMDI) was constructed by subtracting the mean of each series from each series value and dividing by the mean series. The final index was obtained by averaging the means-removed values of the two stock market series. The index takes integer values with large and positive values indicating better stock market development. A positive relationship between SMDI and growth was thus expected. The functional computation of BDI and SMDI is as follows:
88
The choice of the ARDL model was based on the assumption that there was a unique relationship between bank, stock market developments and economic growth. Following Pesaran et al. (2001) the conditional ARDL-error correction model is thus specified as:
(7) where the other variables are as defined before; ∆ is the difference operator, δ! is
the drift and 𝜑𝜑!, 𝜑𝜑! , 𝜑𝜑! 𝑎𝑎𝑎𝑎𝑎𝑎 𝜑𝜑!are the long run multipliers respectively. The coefficients 𝛼𝛼! measure the short run effects. The long run coefficients are expected to have a positive sign each.The coefficients show how strongly the regressors influence economic growth respectively. High coefficients signal an important influence that the regressors have on the regressand.
The ARDL estimation involves testing the null hypothesis of no cointegration relationship against the alternative hypothesis of the existence of a cointegration relationship. The null and alternate hypotheses were therefore stated as:
𝐻𝐻!: 𝜑𝜑! = 𝜑𝜑! = 𝜑𝜑! = 𝜑𝜑! = 0 (8) 𝐻𝐻!: 𝜑𝜑! ≠ 𝜑𝜑! ≠ 𝜑𝜑! ≠ 𝜑𝜑! ≠ 0 (9)
The F test is used to establish whether a cointegration relationship among variables exists or not. After calculating the F test, it is compared with the critical values tabulated by Narayan (2004) for small samples. The lower critical bound assumes that all variables are I (0) and upper bound assumes that all the variables are I (1). If F-test statistic calculated is greater than the upper bound critical value then we reject the null hypothesis of whether variables are I (0) or I (1). If F-test statistic calculated is less than the lower bound critical value, at the specific level of significance, the null hypothesis cannot be rejected. If F-test falls between the upper and lower bounds the result is inconclusive and the decision is made based on the significance of the error correction term.
Finally the short run relationships are captured through error correction. The error correction representation of the series was specified as follows:
t
p
itit
r
iit
p
i
q
iititt
ecmk
smdibdigdpgdp
εξα
αααδ
++Δ+
Δ+Δ+Δ+=Δ
∑
∑∑ ∑
=−−
=−
= =−−
014
03
1 0210
)(ln
)()()ln()ln(
(10)
where ξ is the speed of adjustment parameter and ecm is the error correction term. The coefficient of the lagged error correction term (ξ) is expected to be negative and statistically significant to further confirm the existence of a cointegration relationship.
Annual time series data over the sample period 1988-2012 was used to estimate the relationship. Economic growth is the dependent variable proxied by annual real GDP per capita. The choice of this proxy is consistent with other empirical studies. Domestic credit provided by the banking
∑
∑∑ ∑
=−−−−−
=−
= =−−
+++++Δ+
Δ+Δ+Δ+=Δ
p
itttttit
r
iit
p
i
q
iititt
ksmdibdigdpk
smdibdigdpgdp
0141312114
03
1 0210
lnln)(ln
)()()ln()ln(
εϕϕϕϕα
αααδ
....................................................................................................... (10)
89
sector was used to construct the bank development index (BDI). Domestic credit provided by the banking sector refers to net credit advances to all economic sectors on a gross basis (excluding credit to the central government). Following Naceur and Ghazouani (2007) and Levine and Zervos (1996) an annual BDI was constructed by subtracting the domestic credit sample mean from the annual value of domestic credit and dividing by the sample mean. The index takes integer values with positive and higher values indicating positive developments in the banking sector. The study expects a positive relationship between BDI and growth.
Market capitalisation and stock traded value as ratios of GDP were used to come up with a stock market development index. A simple index of stock market development (SMDI) was constructed by subtracting the mean of each series from each series value and dividing by the mean series. The final index was obtained by averaging the means-removed values of the two stock market series. The index takes integer values with large and positive values indicating better stock market development. A positive relationship between SMDI and growth was thus expected. The functional computation of BDI and SMDI is as follows:
xxxBDI t /)( −= (11)
⎥⎦
⎤⎢⎣
⎡ −+
−=
zzz
yyySMDI tt
21 (12)
where tx is the annual value of domestic credit, x is the mean value of the domestic credit for the sample period, ty is the annual ratio of market capitalisation to GDP, y is the mean ratio of market capitalisation value to GDP for the sample period, tz is the annual ratio of stock traded
value to GDP and z is the mean ratio of stock traded value to GDP for the sample period.Given equations (11) and (12), log transformation was done after adding a constant of ρ and λ to BDI and SMDI respectively such that the log transformed variables were restricted to be greater or equal to zero.
Gross capital formation (as a % of GDP) was used to measure the increase in capital stock and is one of the major determinants of economic growth according to Keynesian growth theory. It was used as a control variable. The study expects a positive relationship between investment and economic growth.
Data was mainly obtained from the World Bank and complemented by data from the Reserve Bank of Zimbabwe and ZimStat. The lack of monthly or quarterly data led to the use of annual data from 1988 as this was the year in which the World Bank started measuring stock exchange data for Zimbabwe.
......................................................................................................................... (11)
......................................................................................................... (12)
89
sector was used to construct the bank development index (BDI). Domestic credit provided by the banking sector refers to net credit advances to all economic sectors on a gross basis (excluding credit to the central government). Following Naceur and Ghazouani (2007) and Levine and Zervos (1996) an annual BDI was constructed by subtracting the domestic credit sample mean from the annual value of domestic credit and dividing by the sample mean. The index takes integer values with positive and higher values indicating positive developments in the banking sector. The study expects a positive relationship between BDI and growth.
Market capitalisation and stock traded value as ratios of GDP were used to come up with a stock market development index. A simple index of stock market development (SMDI) was constructed by subtracting the mean of each series from each series value and dividing by the mean series. The final index was obtained by averaging the means-removed values of the two stock market series. The index takes integer values with large and positive values indicating better stock market development. A positive relationship between SMDI and growth was thus expected. The functional computation of BDI and SMDI is as follows:
xxxBDI t /)( −= (11)
⎥⎦
⎤⎢⎣
⎡ −+
−=
zzz
yyySMDI tt
21 (12)
where tx is the annual value of domestic credit, x is the mean value of the domestic credit for the sample period, ty is the annual ratio of market capitalisation to GDP, y is the mean ratio of market capitalisation value to GDP for the sample period, tz is the annual ratio of stock traded
value to GDP and z is the mean ratio of stock traded value to GDP for the sample period.Given equations (11) and (12), log transformation was done after adding a constant of ρ and λ to BDI and SMDI respectively such that the log transformed variables were restricted to be greater or equal to zero.
Gross capital formation (as a % of GDP) was used to measure the increase in capital stock and is one of the major determinants of economic growth according to Keynesian growth theory. It was used as a control variable. The study expects a positive relationship between investment and economic growth.
Data was mainly obtained from the World Bank and complemented by data from the Reserve Bank of Zimbabwe and ZimStat. The lack of monthly or quarterly data led to the use of annual data from 1988 as this was the year in which the World Bank started measuring stock exchange data for Zimbabwe.
BOJE: Botswana Journal of Economics 82
Gross capital formation (as a % of GDP) was used to measure the increase in capital stock and is one of the major determinants of economic growth according to Keynesian growth theory. It was used as a control variable. The study expects a positive relationship between investment and economic growth.
Data was mainly obtained from the World Bank and complemented by data from the Reserve Bank of Zimbabwe and ZimStat. The lack of monthly or quarterly data led to the use of annual data from 1988 as this was the year in which the World Bank started measuring stock exchange data for Zimbabwe.
5. PRESENTATION AND ANALYSIS OF RESULTS
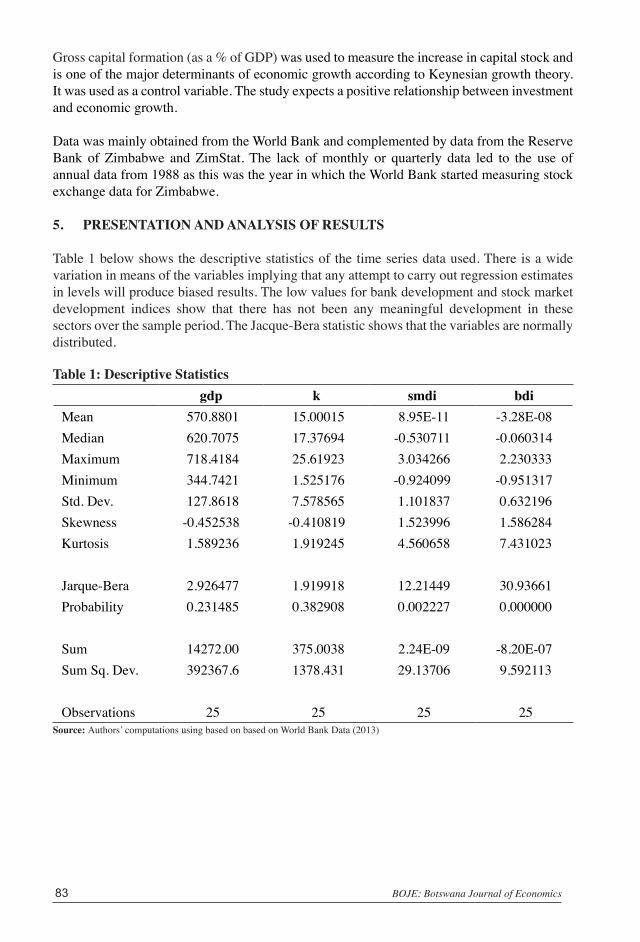
Table 1 below shows the descriptive statistics of the time series data used. There is a wide variation in means of the variables implying that any attempt to carry out regression estimates in levels will produce biased results. The low values for bank development and stock market development indices show that there has not been any meaningful development in these sectors over the sample period. The Jacque-Bera statistic shows that the variables are normally distributed.
Table 1: Descriptive Statisticsgdp k smdi bdi
Mean 570.8801 15.00015 8.95E-11 -3.28E-08 Median 620.7075 17.37694 -0.530711 -0.060314 Maximum 718.4184 25.61923 3.034266 2.230333 Minimum 344.7421 1.525176 -0.924099 -0.951317 Std. Dev. 127.8618 7.578565 1.101837 0.632196 Skewness -0.452538 -0.410819 1.523996 1.586284 Kurtosis 1.589236 1.919245 4.560658 7.431023
Jarque-Bera 2.926477 1.919918 12.21449 30.93661 Probability 0.231485 0.382908 0.002227 0.000000
Sum 14272.00 375.0038 2.24E-09 -8.20E-07 Sum Sq. Dev. 392367.6 1378.431 29.13706 9.592113
Observations 25 25 25 25Source: Authors’ computations using based on based on World Bank Data (2013)
83 BOJE: Botswana Journal of Economics

Table 2 below shows the estimated correlation matrix.Table 2: Correlation MatrixVariable gdp k smdi bdi
gdp 1.0000 k 0.2934 1.0000
smdi -0.4180 -0.4059 1.0000bdi 0.4125 -0.2651 0.4248 1.0000
Source: Authors’ computations using Eviews 7
The results in Table 2 above show that capital stock and bank development index are positively related to real GDP per capita whilst stock market development index and real GDP per capita are negatively related. There is also a negative correlation between bank and stock market development indices and capital stock.
Table 3 below reports the ADF and the PP unit root test results.Table 3 ADF and PP Unit Root Test ResultsVariable Augmented Dickey Fuller (ADF) Test Phillips–Peron (PP) Test
Log Level First Difference
Order of Integration
Log Level First Difference
Order of Integration
lngdp -1.0798 -3.4088*** I(1) -0.9654 -3.4088*** I(1)lnk -0.3508 -4.7754*** I(1) -0.3509 -4.7775*** I(1)lnbdi -3.0068*** I(0) -2.9763*** I(0)lnsmdi -3.0047*** I(0) -2.9015*** I(0)
Source: Authors’ computations using Eviews 7
Notes: The ADF and PP tests are based on McKinnon critical values and the lag length on SBC criterion. *** shows rejection of the null hypothesis at 1%.
As shown in Table 3 above both the ADF and the PP unit root test results show that bank and stock market development indices were stationary in levels and therefore I (0). On the other hand, real GDP per capita and capital stock became stationary when first differenced implying that they were I(1). Since the order of integration was mixed the ARDL model became the most appropriate estimating technique.
Having made sure that no series was integrated of an order higher than one the ARDL model for the Zimbabwe growth function was estimated and the results are reported in Table 4.
BOJE: Botswana Journal of Economics 84

Table 4: Autoregressive Distributed Lag Estimates ARDL (1,0,2,2) selected based on Schwarz Bayesian Criterion Dependent variable is lngdp, 23 observations used for estimation from 1990 to 2012
Regressor Coefficient Standard Error T-Ratio Problngdp(-1) 0.6331 0.1076 5.8842 0.000lnk 0.0614 0.0209 2.9331 0.011lnsmdi 0.0022 0.0221 0.1001 0.922lnsmdi(-1) -0.0346 0.0170 -2.0408 0.061lnsmdi(-2) -0.0563 0.0171 -3.2865 0.005lnbdi 0.0246 0.0349 0.7066 0.491lnbdi(-1) 0.0179 0.0280 0.6402 0.532lnbdi(-2) 0.0697 0.0325 2.1454 0.050c 2.1466 0.6707 3.2004 0.006R-Squared 0.9767 R-Bar-Squared 0.9633 S.E. of Regression 0.0477 F-Stat. F(8,14) 73.2646[0.000] Mean of Dependent Variable 6.3072 S.D. of Dependent Variable 0.2492 Residual Sum of Squares 0.0319 Equation Log-likelihood 43.0511Akaike Info. Criterion 34.0511 Schwarz Bayesian Criterion 28.9414 DW-statistic 1.6972 Durbin’s h-statistic 0.8477 [0.397]
Source: Authors’ computations using Microfit 5.0
As reported in Table 4, with an adjusted R2 of 0.96 the model is of good fit as 96% of the variations in real GDP per capita are explained by the independent variables. The DW-statistic is also around 2 and the F-statistic is significant showing that some coefficients for explanatory variables in the model are different from zero. The diagnostic tests are reported in Table 5 below. The results show that the model passed all the tests meaning that there was no problem of serial correlation, the model was correctly specified, the disturbances were normally distributed and that there was no problem of heteroscedasticity.
Table 5: Diagnostic TestsTest Statistics LM Version F Version A:Serial Correlation CHSQ(1) = 0.6637 [0.415] F(1,13) = 0.3863 [0.545]
B:Functional Form CHSQ(1) = 1.0569 [0.304] F(1,13) = 0.6262 [0.443]
C:Normality CHSQ(2) = 0.5943 [0.743] Not applicable
D:Heteroscedasticity CHSQ(1) = 2.2183 [0.136] F(1,21) = 2.2416 [0.149]Source: Authors’ computations using Microfit 5.0Notes: A: Lagrange multiplier test of residual serial correlation B: Ramsey’s RESET test using the square of the fitted values C: Based on a test of skewness and kurtosis of residuals D: Based on the regression of squared residuals on squared fitted values
85 BOJE: Botswana Journal of Economics
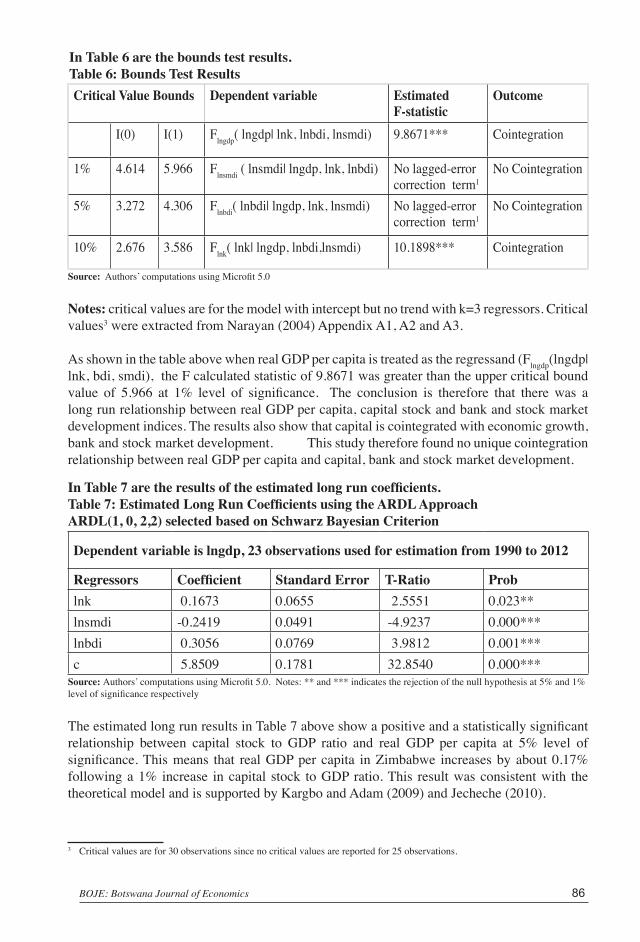
In Table 6 are the bounds test results.Table 6: Bounds Test ResultsCritical Value Bounds Dependent variable Estimated
F-statisticOutcome
I(0) I(1) Flngdp( lngdp| lnk, lnbdi, lnsmdi) 9.8671*** Cointegration
1% 4.614 5.966 Flnsmdi ( lnsmdi| lngdp, lnk, lnbdi) No lagged-error correction term1
No Cointegration
5% 3.272 4.306 Flnbdi( lnbdi| lngdp, lnk, lnsmdi) No lagged-error correction term1
No Cointegration
10% 2.676 3.586 Flnk( lnk| lngdp, lnbdi,lnsmdi) 10.1898*** Cointegration
Source: Authors’ computations using Microfit 5.0
Notes: critical values are for the model with intercept but no trend with k=3 regressors. Critical values3 were extracted from Narayan (2004) Appendix A1, A2 and A3.
As shown in the table above when real GDP per capita is treated as the regressand (Flngdp(lngdp| lnk, bdi, smdi), the F calculated statistic of 9.8671 was greater than the upper critical bound value of 5.966 at 1% level of significance. The conclusion is therefore that there was a long run relationship between real GDP per capita, capital stock and bank and stock market development indices. The results also show that capital is cointegrated with economic growth, bank and stock market development. This study therefore found no unique cointegration relationship between real GDP per capita and capital, bank and stock market development.
In Table 7 are the results of the estimated long run coefficients.Table 7: Estimated Long Run Coefficients using the ARDL Approach ARDL(1, 0, 2,2) selected based on Schwarz Bayesian Criterion
Dependent variable is lngdp, 23 observations used for estimation from 1990 to 2012
Regressors Coefficient Standard Error T-Ratio Problnk 0.1673 0.0655 2.5551 0.023**lnsmdi -0.2419 0.0491 -4.9237 0.000***lnbdi 0.3056 0.0769 3.9812 0.001***c 5.8509 0.1781 32.8540 0.000***
Source: Authors’ computations using Microfit 5.0. Notes: ** and *** indicates the rejection of the null hypothesis at 5% and 1% level of significance respectively
The estimated long run results in Table 7 above show a positive and a statistically significant relationship between capital stock to GDP ratio and real GDP per capita at 5% level of significance. This means that real GDP per capita in Zimbabwe increases by about 0.17% following a 1% increase in capital stock to GDP ratio. This result was consistent with the theoretical model and is supported by Kargbo and Adam (2009) and Jecheche (2010).
3 Critical values are for 30 observations since no critical values are reported for 25 observations.
BOJE: Botswana Journal of Economics 86

The results also show a positive and highly significant relationship between bank development index and real GDP per capita with a 1% increase in the bank development index leading to a 0.31 % increase in real GDP per capita. The coefficient of the bank development index is the highest showing that the banking sector is the major driver of growth in Zimbabwe. This result was consistent with the theoretical model and is supported by Rioja and Valev (2011) who found that the financial sector had a substantial role to play in promoting economic growth in low income countries between 1980-2009.
An inverse relationship between stock market development index and real GDP per capita was found with a 1% increase in the stock market development index leading to a decline in real GDP per capita of about 0.24% per annum. This result was not consistent with the theoretical model. However, the result is supported by Rioja and Valev (2011) who found stock markets not to have contributed anything towards capital accumulation or productivity growth in low income countries for the period 1980-2009. Obstefeld (1994) and Bhide (1993) also warn about the possible negative effects that developments in the stock market might have on economic growth.
This weak association between the stock market and economic growth may be reflective of the strict exchange control regulations imposed to prevent possible capital outflows following the introduction of the Fast Track Land Reform Programme. The Indigenisation and Economic Empowerment Policy also had widespread restrictions with respect to ownership of capital resources (Indigenisation and Economic Empowerment Act, 2007). The hyperinflationary situation also led to negative real return on capital investments. These developments led to very high market capitalisation to GDP ratio not supported by trading. Thus investment on ZSE became speculative in nature hence suspension of trading in late 2008.
The short run dynamics were captured through error correction. The error correction results are reported in Table 8.
87 BOJE: Botswana Journal of Economics

Table 8: Error Correction Representation for the Selected ARDL Model ARDL(1,0,2,2) selected based on Schwarz Bayesian Criterion
Dependent variable is dlngdp, 23 observations used for estimation from 1990 to 2012
Regressors Coefficient Standard Error
T-Ratio Prob
dlnk 0.0614 0.0209 2.9331 0.010***
dlnsmdi 0.0022 0.0221 0.10007 0.922
dlnsmdi1 0.0563 0.0171 3.2865 0.005***
dlnbdi 0.0246 0.0349 0.70663 0.490
dlnbdi1 -0.0697 0.0325 -2.1454 0.048**
ecm(-1) -0.3669 0.1076 -3.4098 0.004***
ecm = lngdp -.16733*lnk + .24187*lnsmdi -.30598*lnbdi -5.8509*cR-Squared 0.7589 R-Bar-Squared 0.6211S.E. of Regression 0.0477F-Stat. F(6,16) 7.3428[0.001]Mean of Dependent Variable -0.0180 S.D. of Dependent Variable 0.0775Residual Sum of Squares 0.0319 Equation Log-likelihood 43.0511Akaike Info. Criterion 34.0511 Schwarz Bayesian Criterion 28.9414DW-statistic 1.6972
Source: Authors’ computations using Microfit 5.0
Notes: *, ** and *** show significance at 10%, 5% and 1% level of significance respectively. In [ ] are p-values.
The error correction term (-0.37) was negative and statistically significant at 1% level. This also confirmed the existence of a long run relationship between real GDP per capita and its regressors. In this case approximately 37% of the disequilibria caused by shocks in the previous year got corrected in the current year. This was a moderate speed of adjustment. The high R2 and the F statistic which were significant at 1% show that the short run model was of good fit.
Results in Table 8 also show that capital’s contribution to real GDP per capita was still positive as it was in the long run. However, its contribution to short run real GDP per capita was now less but significant at 1% level up from 5% level in the long run. Bank development index which was positive and significant at 1% in the long run has its two year lag negative and significant in the short run. This means that bank developments contributed more to growth in the long run than in the short run. This result is supported by Hamdi et al. (2013) who found that for the period 1961-2010 finance did not lead to growth in Tunisia in the short run but in the long run. Khan et al. (2005) also found the relationship between finance and growth significant in the long run and not the short run in the case of Pakistan from 1971-2004.
The short run negative contribution of banks to growth may have been largely due to the hyperinflation which wiped out domestic savings leading to widespread disintermediation as people moved to the parallel market for financial services. However stock market development
BOJE: Botswana Journal of Economics 88

index which was negative and significant at 1% in the long run had its second lag positive and significant at 1%. In short, banks contributed more to growth in the long run than stock markets while stock markets contributed more in the short run than banks. These results are supported by Hondroyiannis et al. (2005).
The ECM model was tested for stability using the CUSUM and CUSUMSQ techniques. Since the coefficients of the estimated model fell within the critical bounds at 5% level of significance this meant that the model was stable over the sample period. This is shown in figure 1.2.
Figure 1.2: Stability Test; CUSUM and CUSUMSQ Plots
Source: Authors’ computations using Microfit 5.0
To confirm the goodness of fit of the model Figure 1.3 shows a residual graph for the actual and fitted observations.
Figure 1.3: Plot of Actual and Fitted Values of lngdp
Source: Authors’ computations using Microfit 5.0
The residuals graph shows that the fitted observations are very close to the actual observed values and they move together.
96
significant at 1%. In short, banks contributed more to growth in the long run than stock markets while stock markets contributed more in the short run than banks. These results are supported by Hondroyiannis et al. (2005).
The ECM model was tested for stability using the CUSUM and CUSUMSQ techniques. Since the coefficients of the estimated model fell within the critical bounds at 5% level of significance this meant that the model was stable over the sample period. This is shown in figure 1.2.
Figure 1.2: Stability Test; CUSUM and CUSUMSQ Plots
Source: Authors’ computations using Microfit 5.0
To confirm the goodness of fit of the model Figure 1.3 shows a residual graph for the actual and fitted observations.
Figure 1.3: Plot of Actual and Fitted Values of lngdp
Source: Authors’ computations using Microfit 5.0
-20
-10
0
10
20
1990 1996 2002 2008 2012
The straight lines represent critical bounds at 5% significance level
Plot of Cumulative Sum of Recursive Residuals
-0.5
0.0
0.5
1.0
1.5
1990 1996 2002 2008 2012
The straight lines represent critical bounds at 5% significance level
Plot of Cumulative Sum of Squares of Recursive Residuals
5.6
5.8
6.0
6.2
6.4
1990 1996 2002 2008 2012
lngdp Fitted
89 BOJE: Botswana Journal of Economics

Weak erogeneity was tested using Granger causality test and the results are reported in Table 9. Table 9: Granger Causality Test Results
Short run (Weak Exogeneity) TestDependent Variable
d(lnk) d(lngdp) d(lnsmdi) d(lnbdi)d(lnk) - 0.8884
(0.4296)0.35828 (0.7040)
0.7040 (0.7026)
d(lngdp) 0.4000 (0.6765)
- 1.23393 (0.3159)
1.50206 (0.2508)
d(lnsmdi) 5.81615 (0.0119)*** 4.3736
(0.0294)**- 0.3485
(0.7107)
d(lnbdi) 2.88039 (0.0837)*
0.13890 (0.8713)
0.3768 (0.6916)
-
Source: Authors’ computations using Microfit 5.0
The results show that capital, BDI and SMDI are weakly exogenous. In the long run, as shown in Table 10, causality is unidirectional and runs from capital, and bank and stock market developments to economic growth lending support to the supply leading hypothesis also found by Zivengwa et al. (2011). The result is in contrast to the study by Guryay et al. (2007) who found that in Northern Cyprus causality runs from economic growth to the development of financial markets.
Table 10: Pairwise Granger Causality TestsNull Hypothesis: Obs F-Statistic Prob. lnk does not Granger Cause lngdp 23 4.53604 0.0254lngdp does not Granger Cause lnk 0.55900 0.5814lndc does not Granger Cause lngdp 23 5.89526 0.0107lngdp does not Granger Cause lndc 1.67093 0.2160lnsmdi does not Granger Cause lngdp 23 2.69544 0.0946lngdp does not Granger Cause lnsmdi 0.81868 0.4568
Source: Authors’ computations using Eviews 7.0
SUMMARY OF RESULTS
The results show that bank developments contributed more to economic growth than stock markets in the long run. However, in the short run banks are found to have a negative impact on growth while stock markets have a positive impact. These results are supported by Choe and Moosa (1999), Demetriades and Luintel (2000) and Hondroyiannis et al. (2005) who found out that the influence of financial development on economic growth was much more pronounced than that of stock market developments. Since the lagged error term is negative and significant it implies that there exists a long run relationship between real GDP per capita and capital, bank and stock market development.
BOJE: Botswana Journal of Economics 90

In Zimbabwe, strict controls on capital movements, speculative investment due to the hyperinflationary situation, low incomes and lack of knowledge by the population on how stock markets operate may have resulted in low investments through the stock markets. This leaves banks as the only organised financial markets through which financial resources from the resource poor communities are raised as banks run deposit accounts for as low as $1. Moreover, banks have a wider infrastructure across the whole country and thus have a very wide base from which they can mobilise funds for investment purposes. However, the contribution by banks to growth was heavily limited by widespread disintermediation that occurred during the hyperinflationary period which substantially reduced domestic savings and also the collapse of indigenous banks as people lost confidence in the financial system. In the long run as the negative effects are corrected, banks were found to contribute positively to economic growth.
In Zimbabwe, low incomes and lack of knowledge by the population on how stock markets operate may result in low investments through the stock markets. This leaves banks as the only organised financial markets through which financial resources from the resource poor communities are raised as banks run deposit accounts for as low as $1. Moreover, banks have a wider infrastructure across the whole country and thus have a very wide base from which they can mobilise funds for investment purposes.
6. CONCLUSIONS AND POLICY RECOMMENDATIONS
There is a steady long run relationship between bank and stock market developments and growth in Zimbabwe. The positive developments in the banking sector significantly influence economic growth in the long run despite a negative and statistically significant second lag impact in the short run. The impact of stock market development on growth has been found to be negative and statistically significant in the long run whilst it is significantly positive in the short run. The study further concludes that there is a unidirectional impact running from capital, bank and stock market developments to economic growth. Capital stock was also found to have a positive and significant contribution to both long run and short run economic growth with weak and relatively strong linkages to bank and stock market developments.
The major policy implications are that there is need for both short and long run economic policies that will promote the well-functioning of the financial system and equity markets so that more financial resources are mobilised to boost economic growth in the country. The positive impact of bank developments on economic growth is evidence of supply-leading hypothesis and an indication of the important role that financial institutions can play in the economy. There is therefore, need to create modern financial institutions and improve access to credit, financial intermediation and inclusion.
Zimbabwe has a large unbanked informal economy as well as rural sector. More than US$3 billion dollars was said to be circulating outside the formal financial system (Reserve Bank of Zimbabwe, 2013).Thus it is critical for government to formulate policies that will help the financial system harness these huge resources and channel them towards productive use. Government must restore confidence in the financial sector that was lost during the decade that followed the introduction of the Fast Track Land Reform Programme; a number of banks
91 BOJE: Botswana Journal of Economics

failed and those that remained experienced difficulties in meeting their depositors’ cash requirements. The government must capitalise the central bank so that it plays its role as the lender of last resort and strengthen corporate governance measures to help prevent bank failures and reduce the incidence of non-performing loans.
The negative contribution of the stock market to economic growth may have been due to deindustrialization precipitated by the Fast Track Land Reform Programme, the hyperinflationary environment and the Indigenisation and Economic Empowerment Policy. This led firms to operate with reduced capacity in the face of weakening domestic demand and increased competition from imports.
The negative contribution of the stock market to economic growth may have been due to deindustrialisation with firms operating with reduced capacity in the face of weakening domestic demand and increased competition from imports. General lack of investor confidence and speculation may also impact negatively on economic growth. If the stock market is an important channel through which long term capital can be raised as proposed in the literature, the government must relax the listing rules on the local bourse and promote fair, efficient and effective trading. The regulatory environment should also be enabling but stringent enough to curb speculation. Sound macroeconomic policies will help attract investors to the local bourse and a stable environment will see industrial capacity going up. Dual listing must also be promoted to increase integration with the world financial market. Currently there is only one stock exchange. There is thus need to open up an exchange for the small investor and other secondary exchanges like the market for derivatives.
The impact of capital investment was found to be positive and significant both in the short and long run. This calls for policies that will further increase productive investment and attract foreign investors in the country as this would greatly increase economic growth.
More importantly banks were found to positively contribute more to economic growth in the long run than stock markets. The main policy implication is that growth is better promoted through a financially-based system rather than through stock exchange promotion. This however does not mean that government must turn a blind eye on the stock exchange as the negative effects must be contained. The negative contribution is only an indication of the need to put in place measures that will force companies to seek expansion through organic growth as this will promote economic development. Widespread mergers and takeovers in industry do not promote growth. No doubt there is need to reduce share turnover, improve corporate control and governance and the regulatory environment for a more organised trading environment on the stock exchange.
Given a choice, the results seem to suggest that a bank-based system for Zimbabwe is the first channel of choice for the promotion of economic growth. However, with the rapid expansion of stock exchanges in developing countries, one would expect them to play a more leading role in promoting economic growth as they grow and mature. Finally a stable enabling macroeconomic environment is critical for finance-led growth in Zimbabwe.
BOJE: Botswana Journal of Economics 92

REFERENCES
Allen, D. S. and L. Ndikumana, 2000. Financial Intermediation and Economic Growth in Southern Africa. Journal of African Economies,Vol. 9 (2):132-160.
Beck, T. and R. Levine, 2004. Stock Markets, Banks, and Growth: Panel Evidence. Journal of Banking and Finance,Vol. 28(3): 423-442.
Bhide, A. 1993.The Hidden Costs of Stock Market Liquidity. Journal of Financial Economics, Vol. 34: 31-51.
Choe, C. and I. A. Moosa, 1999.The Financial System and Economic Growth: The Korean Experience.World Development, Vol. 27(6): 1069-1082.
Demetriades, P. O. and K. B. Luintel, 2001. Financial Restraints in the South Korean miracle. Journal of Development Economics, Elsevier, Vol. 64(2): 459-479.
Government of Zimbabwe. Indigenisation and Economic Empowerment Act: 14/2007. Greenwood, J. and B. Jovanovic, 1990. Financial Development, Growth and the
Distribution of Income.Journal of Political Economy, Vol. 98: 1076-1107.Gurley, J. and E. Shaw, 1967. Financial Structure and Economic Development. Economic
Development and Cultural Change, Vol. 15 (2): 333-346.Guryay, E., O.V. Safakli and B. Tuzel, 2007. Financial Development and Economic
Growth: Evidence from Northern Cyprus. International Research Journal of Finance and Economics.Issue 8: ISSN 1450-2887.
Hamdi, H., A. Hakimi and R. Sbia, 2013.Multivariate Granger Causality Between Financial Development, Investment and Economic Growth: Evidence from Tunisa.Journal of Quantitative Economics, Vol. 11(1 & 2).
Herzer, D., F. D. Nowak-Lehmann and B. Siliverstovs. 2006. Export-led Growth in Chile: Assessing the role of Export Composition in Productivity Growth, The Developing Economies, Vol. 44(3).
Hondroyiannis, G., S. Lolos and E. Papapetrou, 2005. Financial Markets and Economic Growth in Greece, 1986-1999. Journal of International Financial Markets, Institutions and Money, Vol.15 (2):173-188.
Jalil, A., and Y. Ma, 2008. Financial Development and Economic Growth: Time Series Evidence from Pakistan and China. Journal of Economic Cooperation, Vol. 29(2): 29-67.
Jecheche, P. 2010. An Empirical Investigation of the Financial Development - Economic Growth Nexus: The Case of Zimbabwe (1990 – 2008). Journal of Comprehensive Research.
Kargbo, S. M. and P. Adamu. 2009. Financial Development and Economic Growth in Sierra Leone. West African Journal of Monetary and Economic Integration, Vol 9(2):30–67.
Khan, M. A., A. Qayyum and A. S. Saeed. 2005. Financial Development and EconomicGrowth: the Case of Pakistan. The Pakistan Development Review 44, Vol.4(2): 819-837.King, R.G. and R. Levine. 1993a. Finance and Growth: Schumpeter Might Be Right.Quarterly Journal of Economics, Vol. 108(3): 717-737.King, R. G. and R. Levine. 1993b. Finance, Entrepreneurship, and Growth: Theory and
Evidence. Journal of Monetary Economics, Vol.32: 513-42.Kohpaiboon, A. 2003. Foreign Trade Regime and FDI-Growth Nexus: A case study of
Thailand. The Journal of Development Studies, Vol.40 (2):55–69.Levine, R.1997. Financial Development and Economic Growth: Views and Agenda.
Journal of Economic Literature, Vol. (XXXV): 688-726. Levine, R. 1991. Stock markets, Growth and Tax Policy. Journal of Finance, Vol.46
(4):1445-65Levine, R. and S. Zervos 1996. Stock Market Development and Long-run Growth. Policy
Research Working Paper 1582, World Bank Economic Review, Vol.10: 323-339.
93 BOJE: Botswana Journal of Economics

Lucas, R. E. 1988. On the Mechanics of Economic Development. Journal of Monetary Economics, Vol. 22(1): 3-42.
Martens, J. 2012. How Zimbabwe Lost its Food Sovereignty and Security. Sustainable Development, Rosa Luxemberg Stiftung, Southern Africa.www.rosalux.co.za. Date accessed 20/03/2014.
McKinnon, R. I. 1973. Money and Capital in Economic Development. Washington, DC: Brookings Institution.
Naceur, S. B. and S. Ghazouani. 2007. Stock Markets, Banks and Economic Growth: Empirical Evidence from the MENA Region. Research in International Business and Finance,Vol. 21:297-315.
Narayan, P. K. 2004. Reformulating Critical Values for Bounds F-Statistics Approach to Cointegration: an Application to the Tourism Demand Model for Fiji. Discussion Papers, Department of Economics: 1441-5429, No. 02/04, Monash University, Australia.arrow.monash.edu.au/hdl/1959.1/2167. Date accessed 20 April 2014.
Ndlovu, G. 2013. Financial Sector Development and Economic Growth: Evidence from Zimbabwe. International Journal of Economics and Financial Issues Vol. 3( 2): 435-446.
Obstfeld, M. 1994. Risk-Taking, Global Diversification, and Growth. American Economic Review, December 1994, Vol.84 (5): 1310-1329.
Patrick, H. 1966. Financial Development and Economic Growth. Economic Development and Cultural Change, Vol. (XIV): 451-65.
Pesaran, M. H. and B. Pesaran.1997. Working with Microfit 4.0: Interactive Econometric Analysis, Oxford: Oxford University Press.
Pesaran, H., Y, Shin and R. Smith. 2001. Bounds Testing Approaches to The Analysis of Level Relationships. Journal of Applied Econometrics, Vol. 16(3): 289-326.
Reserve Bank of Zimbabwe Monetary Policies, 2010, 2012 and 2013.www.rbz.co.zw/pdfs. Date accessed 25 January 2014.
Rioja, F. and N. Valev. 2011. Stock Markets, Banks and the Sources of Economic Growth in Low and High Income Countries. Journal of Economics and finance: 1-9.
Romer, P. M. 1986. Increasing Returns and Long run Growth. Journal of Political Economy, Vol. 94: 1002-1037.
Saint-Paul, G. 1992. Technological Choice, Financial Markets and Economic Development. European Economic Review, Vol. 364: 763-81.
Schumpeter, J. A. 1911. The Theory of Economic Development. Harvard University Press.Shaw E. S. 1973. Financial Deepening in Economic Development. New York, Oxford
University Press, London and New York.Solow, R. M. 1956. A Contribution to the Theory of Economic Growth. Quarterly Journal
of Economics Vol 70 (1): 65-94.Sultan, R. 2012. An Econometric Study of Economic Growth, Energy and Exports
in Mauritius: Implications for Trade and Climate Policy. International Journal of Energy Economics and Policy, Vol.2 (4): 225-237.
Swan, T.W. 1956. Economic Growth and Capital Accumulation. Economic Record, Vol 32(23): 34-61.
World Bank. 2013. World Development Indicators Database, The World Bank, Washington, DC.data.worldbank.org/data-catalog/world-development-indicators. Date accessed 27 January 2014.
ZimStat. 2012. Compendium of Statistics. www.zimstat.co.zw/dmdocuments/Compendium. Date accessed 25 January 2014.
Zivengwa, T., J. Mashika, F. Bokosi, and T. Makova. 2011. Stock Market Development and Economic Growth in Zimbabwe. International Journal of Economics and Finance Vol. 3(5): 140-150.
BOJE: Botswana Journal of Economics 94