Sensitivity on Stock Return in Nepalese Stock Market Niyam Raj Shrestha Page65-76
12
Sensitivity on Stock Return in Nepalese Stock Market Niyam Raj Shrestha Abstract: This study examines the investors’ behaviours on stock return. This study investigates the investors’ use of CAPM assumption which relates to homogeneous expectation concerned with the investor’s perception and human behaviour, and also affects investments in security market. The survey-based study concludes that Nepalese investors prefer a long position strategy and consider that price of the share is the deciding factor in security trading. Similarly, the study shows that a firm size effect exists in stock returns in Nepal. I. INTRODUCTION Common stock return is the greater concern in the financial market. It plays a greater role to recognize factors that power the investment returns. The purpose of capital market is to transfer funds between lenders (savers) and borrowers (producers) efficiently (Copeland, Weston, & Shastri, 2009). Firms and individual investors may have access to productive investment opportunities with anticipated rates of return that exceed the market-determined borrowing rate, but not enough funds to take advantages of all these opportunities. Nepalese capital market reflects some abnormal characteristics that differentiate it with that of the market of developed countries. Nepalese capital market is identified as having limited size in terms of amount and number of securities-trading, few number of market participants, lack of professionalism, and preliminary stage of market growth. To evaluate the stock return from market, no investors can gain the abnormal return if the market is efficient (Fama, 1998). The market efficiency requires that security prices instantaneously and fully reflect all available relevant information (Copeland, Weston & Shastri, 2009). Information and reaction of security prices are of particular interest to corporate officers who report the performance of their firm to the public to the accounting profession, which audits these reports. A number of studies on secondary data have documented that the relationship between firm specific fundamentals and stock returns. Banz (1981) examined size effect, Mr. Shrestha is Faculty Member of Tribhuvan University, Public Youth Campus. Email: [email protected]
Transcript of Sensitivity on Stock Return in Nepalese Stock Market Niyam Raj Shrestha Page65-76

Sensitivity on Stock Return in Nepalese Stock Market
Niyam Raj Shrestha
Abstract: This study examines the investors’ behaviours on stock return. This study investigates the investors’ use of CAPM assumption which relates to homogeneous expectation concerned with the investor’s perception and human behaviour, and also affects investments in security market. The survey-based study concludes that Nepalese investors prefer a long position strategy and consider that price of the share is the deciding factor in security trading. Similarly, the study shows that a firm size effect exists in stock returns in Nepal.
I. INTRODUCTION
Common stock return is the greater concern in the financial market. It plays a greater role to recognize factors that power the investment returns. The purpose of capital market is to transfer funds between lenders (savers) and borrowers (producers) efficiently (Copeland, Weston, & Shastri, 2009). Firms and individual investors may have access to productive investment opportunities with anticipated rates of return that exceed the market-determined borrowing rate, but not enough funds to take advantages of all these opportunities. Nepalese capital market reflects some abnormal characteristics that differentiate it with that of the market of developed countries. Nepalese capital market is identified as having limited size in terms of amount and number of securities-trading, few number of market participants, lack of professionalism, and preliminary stage of market growth. To evaluate the stock return from market, no investors can gain the abnormal return if the market is efficient (Fama, 1998). The market efficiency requires that security prices instantaneously and fully reflect all available relevant information (Copeland, Weston & Shastri, 2009). Information and reaction of security prices are of particular interest to corporate officers who report the performance of their firm to the public to the accounting profession, which audits these reports.
A number of studies on secondary data have documented that the relationship between firm specific fundamentals and stock returns. Banz (1981) examined size effect,
Mr. Shrestha is Faculty Member of Tribhuvan University, Public Youth Campus.Email: [email protected]
66 PYC Nepal Journal of Management, August 2012, Vol. V, No. 1
Bhandari (1988) with leverage effect, Stattman (1980) the book equity to market equity ratio effect, Basu (1983) the earning yield effect, Fama and French (1992) and Pradhan (1993) to examined the combined effect of beta, size, leverage, BE/ME and EP in the cross-section of average stock returns of company. However, the empirical evidences tested over the time provide no consistent results in explaining stock returns. Thus, this study assumes basically the investors perception towards the stock returns of Nepalese stock market. This study is interested in understanding how the individual’s decision-making process, given the receipt of information, is reflected in the market prices of assets. This is not easy because it is impossible to observe the quantity and quality of information or the timing of its receipt in the real world. There is disagreement between theorists about what information will be used by investors. For example, Forsythe, Palfrey and Plott (1982) have identified four different hypotheses. Each hypothesis has assumed that investors have known with certainty what their own payoffs will be across time, but they also have known that different individuals may pay different prices because of differing preferences.
According to CAPM assumption, all investors are rational mean-variance optimizers, meaning that they all use the Markowitz portfolio selection model (Reilly & Brown, 2006). Similarly, investors analyze securities in the same way and share the same economic view of the world and they use the same assumption that is referred to homogeneous expectation or beliefs. These beliefs are concerned with the investor’s perception and human behaviour which also affect investment in security market. Addressing this issue can be fulfilled if we analyze the rational behaviour of individuals when information is useful in the sense that having it will improve one’s decisions regarding stock return. This study also incorporates the following specific objectives.
To analyze the investors’ buying and selling preferences.
To assess the investors perception on risk and return relationship and market efficiency.
To examine the investors attitudes towards the factors affecting stock returns in Nepal.
The following (second) section describes the review related to this study, while the Third Section is related with the Data and Research Methodology. Section IV describes the data analysis and presentation. The study makes closing remarks in Chapter V.
II. REVIEW OF LITERATURE
Selden (1912) studied the psychology of the stock market based on the book upon the belief that the movements of prices on the exchanges were dependent to a very considerable degree on the mental attitude of the investing and trading public. De Bondt and Thaler (1985) advocated behavioural finance. They discovered that people systematically overreacting to unexpected and dramatic news events results in substantial weak-form inefficiencies in the stock market. This was both surprising and profound. Mental accounting is the set of cognitive operations used by individuals and households to organize, evaluate and keep track of financial activities. Thaler (1985) developed

67Sensitivity on Stock Return in Nepalese Stock Market
a new model of consumer behaviour involving mental accounting. In the accounting literature, Basu (1997) found the evidence for the conservatism principle, and interprets as earnings reacting `bad news’ more quickly than `good news’.
Bikhchandani, Hirshleifer and Welch (1998) argued that the theory of observational learning, and particularly of informational cascades, can help explain phenomena such as stock market crashes. Motivated by a variety of psychological evidence, Barberis, Shleifer and Vishny (1998) presented a model of investor sentiment that displays under reaction of stock prices to news such as earnings announcements and overreaction of stock prices to a series of good or bad news. Fama (1998) defended the efficient market hypothesis that famously depend in the interest, and claims that apparent overreaction of stock prices to information is about as common as under reaction. This argument is unconvincing, because under- and overreactions appear to occur under different circumstances and/or at different time intervals. Odean (1998) tested and found evidence for the disposition effect, the tendency of investors to sell winning investments too soon and hold losing investments for too long. Kent, Hirshleifer and Subrahmanyam (1998) proposed a theory of security markets based on investor overconfidence (about the precision of private information) and biased self-attribution (which causes changes in investors’ confidence as a function of their investment outcomes) which leads to market under- and overreactions.
Camerer and Lovallo (1999) found experimentally that overconfidence and optimism lead to excessive business entry. Wermers (1999) studied herding by mutual fund managers and found the highest levels in trades of small stocks and in trading by growth-oriented funds. Thaler (1999) summarized the literature on mental accounting and concluded that mental accounting influences choice, that is, it matters. There is a commonly observed but unexpected negative correlation between perceived risk and perceived benefit. Finucane, et al. (2000) concluded that this was due to the affect heuristic-- people tend to derive both risk and benefit evaluations from a common source. Hong, Lim and Stein (2000) proposed that firm-specific information, especially negative information, discuses only gradually across the investing public, and this is responsible for momentum in stock returns. Rabin and Thaler (2001) considered risk aversion and pronounce the expected utility hypothesis dead. Psychological research had established that men are more prone to overconfidence than women (especially in male-dominated areas such as finance), whilst theoretical models predict that overconfident investors trade excessively. Grinblatt and Keloharju (2001) identified the determinants of buying and selling activity and evidence that past returns, reference price effects, tax-loss selling and the fact that investors are reluctant to realize losses are all determinants of trading. More recent developments in decision making under risk have improved upon cumulative prospect theory, such as the transfer of attention exchange model (Birnbaum, 2008).
Shrestha (1992) found that the company growth and dividend payout do not match in many financial institutions. Companies paid very less ratio of dividend than their earnings-growth. The study stated that there must have proper linkage between the board’s policy and expectation of shareholders. Pradhan and Ang (1994) concluded that managers of the Nepalese enterprises have appeared that working capital management

68 PYC Nepal Journal of Management, August 2012, Vol. V, No. 1
is the most important finance function among the several finance functions. Shrestha (1995) stated that the negative impacts on market price of shares are due to artificially risen high market price of share and higher market capitalization value. Pradhan and Upadhyaya (2004) stated that Nepalese investors are not indifferent towards makings or non-makings of information public. Pradhan and Adhikari (2006) established that managers from Nepalese enterprises felt that the major motive for paying cash dividend is to convey information to shareholders that company is doing good. Managers believed that shareholders are not indifferent towards dividends and retained earnings. The main purpose of paying stock dividend by enterprises was revealed to be the cash conservation. Dangol (2009) found a majority of respondents having strong belief on impact of new information of price movement of the Nepalese stock market based on the flow of new information. The study concluded that this indicated the Nepalese stock market was sensitive to new public information. Shrestha (2011) found that majority of investors preferred the common stock of financial company. The study found that majority of the investors indicated that secondary market is not accessible to all the investors and they take suggestions from their relatives and friends in investment decisions on common stocks. Similarly, the study found that majority of security business persons felt that the main determinant of stock trading price is the company performance.
The discussion of review of literatures reveals that study of the behavioural finance in stock market has occupied greater interest in finance research. The studies in different periods of time pointed out the behavioural aspect of investors are important to include in the cross-sectional study of stock return. The study showed that there was no persistence of investor sensitivity in the Nepalese stock market and stock-price movements. Such empirical evidences are also important in context of small and developing capital markets like Nepal. Therefore, the study on the investor’s sensitivity on stock return in Nepalese stock market is volatile, and the effect of investor’s behaviour on the stock market is yet to be discovered.
III. RESEARCH METHODOLOGY AND DATA
This study has adopted a descriptive research design, which is generally used to assess the opinions, behaviours or characteristics of a given population and to describe the situation and event occurring at present. It is a process of accumulating facts. This study has employed primary source of data. The overall attitude of investors, security businesspersons and investors towards the stock market, factors affecting stock return and stock price is examined by utilizing the primary source of data. A questionnaire survey on perception towards stock returns of the practitioners, investors, security persons, security analysts and executives of the business organizations has been used to collect primary data.
Altogether 56 out of the 100 questionnaires distributed have been received making the 56 percent response rate. The set of questionnaires contained 14 questions of mixed type options such as personal information, closed-end multiple choice, five point Likert-scale items, and open-ended options.

69
IV. LIMITATIONS OF THE STUDY
A bias of the responses has not been tested. Similarly, the questionnaire has not been pretested. A limited number of respondents from a large population has been selected in this study. These can limit the results of the current study.
V. ANALYSIS OF DATA AND PRESENTATION
Respondent Profile
Table 1 presents the general information of the respondents evaluated in four major parameters such as gender, academic qualifications, work experience and their occupations.
Table 1: Percentage of Respondents by Gender, Academic Qualifications, Occupations and Work Experiences
Parameter Details No. of Respondents Percentage
Gender Male 44 78.57 Female 12 21.43 Total 56 100 Qualification Up to Intermediate 5 8.93 Bachelor Level 35 62.50 Post Graduate and Above 16 28.57 Total 56 100Occupation Service 23 41.07 Security Business Person 4 7.14 Investor 19 33.93 Educationist 10 17.86 Total 56 100Work Experience Less than 5 years 45 80.36 5 to 10 years 3 5.36 10 to 15 years 2 3.57 More than 15 years 6 10.71 Total 56 100
Source: Survey, 2011
Occupation-wise analysis revealed that investors working in different organizations (41 percent) dominate the educationist investors, and security business persons. Similarly graduate level and professionally educated respondents dominate the sample (62.50 percent). As is evident from the table 1, a majority of respondents are male (78.57 percent) and females consist of only 21.43 percent. It is further observed that experience investors (less than 5 years) constituted a bigger (80.36 percent) group of the sample.
Preferences Towards Types of Market
The preference towards types of market while trading of the common stocks is also important to determine the security prices. Generally when individuals participate in the
Sensitivity on Stock Return in Nepalese Stock Market

70 PYC Nepal Journal of Management, August 2012, Vol. V, No. 1
secondary market to trade their security, it leads the market to equilibrium. This also helps the market to become liquid. To obtain the respondents’ perception about their preference towards the market for buying and selling shares, all the respondents were asked which market is preferred by the investors to buy and sell shares. The results of respondents are presented in the table 3.
Table 3: Frequency Table of Market Preferred by the Investors to Buy Shares
Market for buying shares No. of Respondents Percentage
Primary Market 17 30.36Secondary Market 35 62.50Both Primary and Secondary 4 7.14Total 56 100Source: Survey 2011
The above result shows that majority of respondents (63 percent) have preferred to buy and sell the shares in the secondary market. Only 30 percent of respondents preferred the primary market to buy and share their share. Very few (7 percent) preferred the both of the market to buy and sell their stock for trading. In recent year, the stability of the stock market has shown the investor interest in the secondary market. It shows that the investment in secondary market has more liquidity preference of their investments. It also revealed that the primary market is less preferred by the respondents. It confirms that the investors have become active rather than passive. Because the secondary market is more reliable for the active investors, and the investors can easily trade their securities in the secondary market to achieve the capital gains and to beat the market.
Investor Preferences Towards Risk and Reflection on Information of Market in Returns of Common Stock
This study attempts to find whether the investors have information regarding the share market. The study also attempts to find that there any seasonal effect in stock returns which leads the volume of the transaction of common stocks. The results are summarized in number of respondents and in percentage. The final results of these questions are presented in table 4.
Table 4: Responses on the Preference Towards Risk and Information of Share Market in Stock Return
StatementsYes No Do not know Total
Freq. % Freq. % Freq. % Freq. %Do you think that Nepalese investors analyze the investment risk before investing in shares?
17 30.36 31 55.36 8 14.28 56 100
Do you think that all Nepalese investors have access to the information about the share market?
8 14.28 38 67.86 10 17.86 56 100
Source: Survey 2011

71
Table 4 summarizes the responses that majority (55.36%) of the respondents do not analyze the investment risk before investing shares. Only 30.36 percent respondents analyze the investment risk before investing in common stocks. Very few (14.28%) respondent do not know the risk of investment. It reveals that majority of respondents do not analyze the investment risk before investment. Table 4 also concludes that majority of respondents (67.86%) do not have access to the information about the share market and only 14.28 percent of respondents have the access to the information about the share market. It reveals that respondents invest in the common shares without getting the information about the market.
Important Motivational Factors for Investment in Shares and Priority to Invest in Share Market
As it is evident from the table 5, Nepalese investors are basically preferred to capital gain from the shares of those companies. The expectation of bonus share is second preferred. Cash dividend is also to be considered as a motivational factor for investment in shares.
Table 5: Mean and Ranks of Responses on Motivational Factor to Invest in SharesThe ranks (1=Most important factors and 5 least important factor) of priority for each category of investors shown in respective rows.
Motivation FactorRank wise Number of Responses
Mean Std. Deviation
Overall Rank1 2 3 4 5
Expectation of increase in market price 38 8 5 2 3 1.64 1.14 1Expectation of bonus share 2 24 17 11 2 2.77 0.93 2Expectation of Cash dividend 7 9 22 13 5 3.00 1.13 3Feeling less risk 7 9 10 20 10 3.30 1.29 4
No other investment opportunity 3 5 1 11 36 4.29 1.20 5
Source: Self Calculation based on Survey 2011
Source of Information to Make Investment Decision in Shares
Investors take the information about the share and market from different sources. The study has attempted to find that how the respondents get the information regarding share market to invest in common stock. The result is presented in table 6.
Table 6: Motivation Factor to Buy Companies StocksThe frequency column shows that no. of respondent uses the market to buy shares and percent column shows
its percentage.
Motivation Factors No. of Respondents Percentage
Analyze the stock market information 16 28.57Follow friends’ suggestions 24 42.86Follow news and market information 13 23.21Follow security analyst’s suggestions 3 5.36
Total 56 100
Source: Survey 2011
Sensitivity on Stock Return in Nepalese Stock Market
72 PYC Nepal Journal of Management, August 2012, Vol. V, No. 1
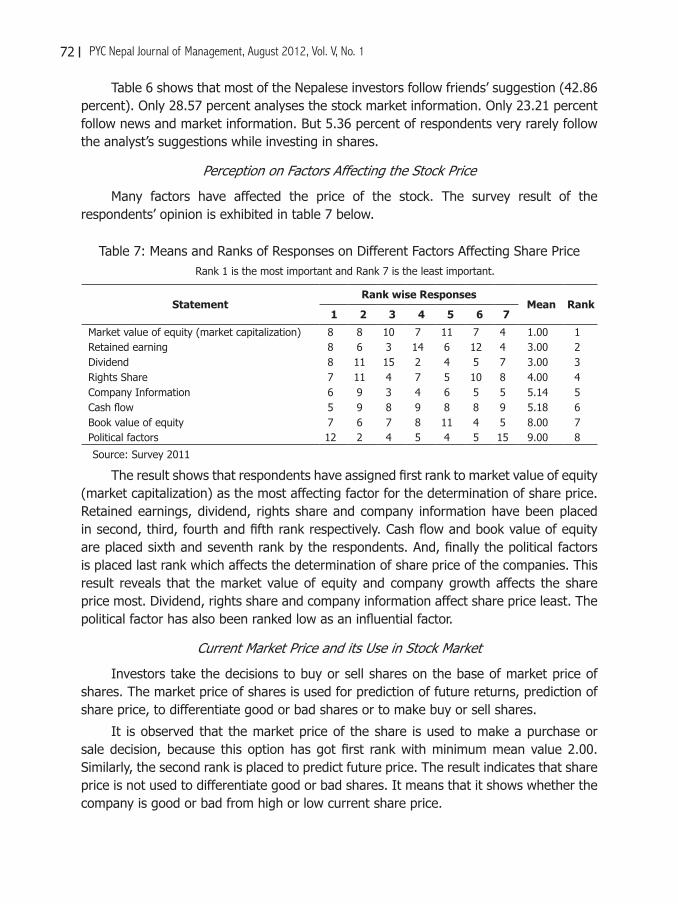
Table 6 shows that most of the Nepalese investors follow friends’ suggestion (42.86 percent). Only 28.57 percent analyses the stock market information. Only 23.21 percent follow news and market information. But 5.36 percent of respondents very rarely follow the analyst’s suggestions while investing in shares.
Perception on Factors Affecting the Stock Price
Many factors have affected the price of the stock. The survey result of the respondents’ opinion is exhibited in table 7 below.
Table 7: Means and Ranks of Responses on Different Factors Affecting Share PriceRank 1 is the most important and Rank 7 is the least important.
StatementRank wise Responses
Mean Rank1 2 3 4 5 6 7
Market value of equity (market capitalization) 8 8 10 7 11 7 4 1.00 1Retained earning 8 6 3 14 6 12 4 3.00 2Dividend 8 11 15 2 4 5 7 3.00 3Rights Share 7 11 4 7 5 10 8 4.00 4Company Information 6 9 3 4 6 5 5 5.14 5Cash flow 5 9 8 9 8 8 9 5.18 6Book value of equity 7 6 7 8 11 4 5 8.00 7Political factors 12 2 4 5 4 5 15 9.00 8
Source: Survey 2011
The result shows that respondents have assigned first rank to market value of equity (market capitalization) as the most affecting factor for the determination of share price. Retained earnings, dividend, rights share and company information have been placed in second, third, fourth and fifth rank respectively. Cash flow and book value of equity are placed sixth and seventh rank by the respondents. And, finally the political factors is placed last rank which affects the determination of share price of the companies. This result reveals that the market value of equity and company growth affects the share price most. Dividend, rights share and company information affect share price least. The political factor has also been ranked low as an influential factor.
Current Market Price and its Use in Stock Market
Investors take the decisions to buy or sell shares on the base of market price of shares. The market price of shares is used for prediction of future returns, prediction of share price, to differentiate good or bad shares or to make buy or sell shares.
It is observed that the market price of the share is used to make a purchase or sale decision, because this option has got first rank with minimum mean value 2.00. Similarly, the second rank is placed to predict future price. The result indicates that share price is not used to differentiate good or bad shares. It means that it shows whether the company is good or bad from high or low current share price.

73
Table 8: Means and Ranks of Responses on Use of Share Price in Stock Market
Rank 1 is the most important and Rank 4 is the least important.
StatementRank wise Responses
Mean Rank1 2 3 4
To make buy or sell decision 28 10 8 10 2.00 1To predict future price 8 22 13 13 2.55 2To predict future average return 8 13 28 7 2.61 3To differentiate good or bad shares 12 11 7 26 2.84 4
Source: Survey 2011
Increase of Share Price and Investors Reactions
Investors take actions when market price of share increases. The study result is exhibited in the table 9.
Table 9: Frequency Table of Market Preferred by the Investors to Buy or Sell the Shares
Statement No. of Respondents Percentage
Sell the stocks 32 57.14Buy the shares 8 14.29Verify the information and analyze the situation 9 16.07Consult the specialists 7 12.50Total 56 100.00
Source: Survey 2011
The above result in table 9 shows that majority of respondents (57.14 percent) sell the stock when the price of the share increases. It reveals that most of the investors of Nepal preferred taking the profit or capital gain from their investment in the stock. Only 8 percent of the respondents buy the shares if the share price increases. It shows that investors of Nepal preferred taking the long position strategy to take profit from the investment. Nine percent of respondent showed that they verify the information and analyze the situation. And only seven percent of the respondents preferred consulting the specialists when the price of share increases. It concludes that large numbers of respondents preferred selling the stock when the share price increases and there is very less practice of consulting the specialist and large number of investors do not verify the information and analyze the situation.
Decrease of Share Price and Investors Reactions
Investor’s responses actions when market price of share decreases. The study result of this survey question is exhibited in the table 10.
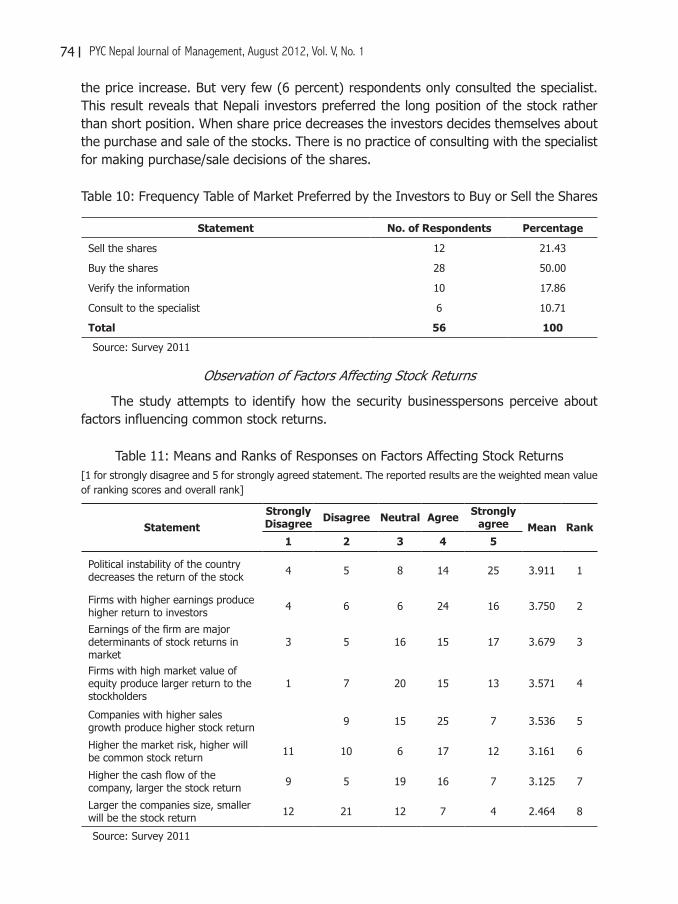
The table 10 result confirms that the majority of the respondents buy the share when the stock price decreases. The fifty percent of respondents decided to buy the stocks if the price decreased. Only 21.43 percent respondents preferred buying the share when the share price increases. And 10 percent respondents verified the information of
Sensitivity on Stock Return in Nepalese Stock Market
74 PYC Nepal Journal of Management, August 2012, Vol. V, No. 1
the price increase. But very few (6 percent) respondents only consulted the specialist. This result reveals that Nepali investors preferred the long position of the stock rather than short position. When share price decreases the investors decides themselves about the purchase and sale of the stocks. There is no practice of consulting with the specialist for making purchase/sale decisions of the shares.
Table 10: Frequency Table of Market Preferred by the Investors to Buy or Sell the Shares
Statement No. of Respondents Percentage
Sell the shares 12 21.43
Buy the shares 28 50.00
Verify the information 10 17.86
Consult to the specialist 6 10.71
Total 56 100
Source: Survey 2011
Observation of Factors Affecting Stock Returns
The study attempts to identify how the security businesspersons perceive about factors influencing common stock returns.
Table 11: Means and Ranks of Responses on Factors Affecting Stock Returns[1 for strongly disagree and 5 for strongly agreed statement. The reported results are the weighted mean value of ranking scores and overall rank]
StatementStrongly Disagree Disagree Neutral Agree Strongly
agree Mean Rank1 2 3 4 5
Political instability of the country decreases the return of the stock 4 5 8 14 25 3.911 1
Firms with higher earnings produce higher return to investors 4 6 6 24 16 3.750 2
Earnings of the firm are major determinants of stock returns in market
3 5 16 15 17 3.679 3
Firms with high market value of equity produce larger return to the stockholders
1 7 20 15 13 3.571 4
Companies with higher sales growth produce higher stock return 9 15 25 7 3.536 5
Higher the market risk, higher will be common stock return 11 10 6 17 12 3.161 6
Higher the cash flow of the company, larger the stock return 9 5 19 16 7 3.125 7
Larger the companies size, smaller will be the stock return 12 21 12 7 4 2.464 8
Source: Survey 2011
75
The table 11 indicated that political instability most influenced the return of Nepalese stock. Earnings of the firm with mean value of 3.750 has come to the second rank. The third rank is given to “earnings of the firm are major determinants of stock returns in market.” Likewise, last rank is ‘larger the companies size, smaller will be the stock return.’ It reveals that the respondents think that the larger company will provide the larger return. The respondents strongly disagreed with the statement ‘higher the size higher will be the lower the stock return’. Market risk has been placed in the sixth rank; however, CAPM give explanation that stock return variation is calculated by market risk.
VI. SUMMARY AND CONCLUSION
Based on a survey, this study has analyzed the investors’ behaviours on stock return. This study has found that majority of Nepalese investors preferred buying shares if the market price fell down, and they will sell the stock if the share price increases. It reveals that Nepali investors preferred a long position strategy rather than short position strategy. This study has concluded that earning of the firm and political instability affect the stock price in context of Nepal according to primary data survey. Similarly, secondary market is the most desirable market to invest in the common stocks. Investors preferred taking an active strategy in common stock investment. The survey result reveals that investors do not analyze the risk while investing in common stocks. Increase in market price of the shares motivates the investors to invest in stocks. It confirms that respondents expect capital gain on their investment, and take long position investment strategy. Investors follow friends’ suggestions to take investment (buy and sell) decisions. The survey result concludes that market price of share is the most deciding factor in the securities trading. Nepalese investors do not have the habit of taking experts’ suggestion but they expect profit from the investment in shares. Finally, respondents believe that size effect is the major firm’s variable that affects stock returns.
REFERENCES
Banz, R. W. (1981). The relationship return and market value of common stock. Journal of Financial Economics, 9 (1), 3-18.
Barberis, N., Shleifer, A. & Vishny, R. (1998). A model of investor sentiment. The Journal of Financial Economics, 49 (3), 307-343.
Basu, S. (1983). The relationship between earning yield, market value and return for NYSE common stocks. Journal of Financial Economics, 12 (1), 129-156.
Basu, S. (1997). The conservatism principle and the asymmetric timelines of earnings. The Journal of Accounting and Economics, 24 (1), 3-37.
Bhandari, L. C. (1988). Debt/equity ratio and expected common stock returns: Empirical evidence. The Journal of Finance, 43 (2), 507-528.
Bikhchandani, S., Hirshleifer, D., & Welch, I. (1998). Learning from the behaviour of others: Conformity, fads and informational cascades. The Journal of Economic Perspectives, 12 (3), 151-170.
Birnbaum, M. H. (2008). New Paradoxes of Risky Decision Making. Psychological Review, 115 (2), 463-501.Camerer, C, & Lovallo, D. (1999). Overconfidence and excess entry: An experimental approach. The
American Economic Review, 89 (1), 306-318.
Sensitivity on Stock Return in Nepalese Stock Market

76 PYC Nepal Journal of Management, August 2012, Vol. V, No. 1
Copeland, T. E., Weston, J. F., & Shastri, K. (2009). Financial Theory and Corporate Policy. Delhi: Dorling Kindersley Pvt. Ltd. (Pearson Education).
Dangol, J. (2009). A Survey of Stock Market Reaction to Public Information. PYC Nepal Journal of Management, 2(1), 85-103.
De Bondt, W. F., & Thaler, R. (1985). Does the Stock Markt Overreact? The Journal of Finance, 40(3), 793-805.
Fama, E. F. (1998). Market Efficiency, Long-Term Returns, and Behavioural Finance. Journal of Financial Economics, 49(3), 283-306.
Fama, E. F. & French, K. R. (1992). The cross-section of expected stock returns. The Journal of Finance, 47(2), 427-465.
Finucane, M. L., et al. (2000). The Act Heuristic in Judgments of Risks and Benets. Journal of Behavioural Decision Making, 13(1), 1-17.
Forsythe, R. Palfrey, T. R & Plott, C. R. (1982). Asset valuation in an experimental market. Econometrica, 50(3), 537-568.
Grinblatt, M. & Keloharju, M. (2001). What Makes Investors Trade? The Journal of Finance, 56(2), 589-616.
Hong, H., Terence L. & Stein, J. C., (2000). Bad news travels slowly: Size, analyst coverage, and the profitability of momentum strategies. The Journal of Finance, 55(1), 265–295.
Kent, D., Hirshleifer, D. & Subrahmanyam, A. (1998). Investor psychology and security market under- and over reactions. The Journal of Finance, 53(6), 1839-1885.
Odean, T. (1998). Are investors reluctant to realize their losses? The Journal of Finance, 53(5), 1775-1798.
Pradhan, R. S & Ang, J. S. (1994). Financial management practices in Nepal. Studies in the Financial Markets of the Pacific Basin, 11(B), 139-163.
Pradhan, R. S. & Adhikari, N. R. (2006). A survey of dividend policy and practices of Nepalese enterprises.Pradhan, R. S. (1993). Stock market behaviour in a small capital market: A case of Nepal. The
Nepalese Management Review,...(...), 20-32.Pradhan, R. S., & Upadhyaya, B. D. (2004). The Efficient Market Hypothesis and the Behaviour of
Share Price in Nepal. The Nepalese Management Review, XII(1), 1-27.Rabin, M. & Thaler R. H. (2001). Anomalies: Risk Aversion. The Journal of Economic Perspectives,
15(1), 219-232.Reilly, F. K. & Brown, K. C. (2006). Investment Analysis and Portfolio Management. New Delhi:
Cengage Learning India Private Limited.Selden, G. C. (1912). Psychology of the Stock Market: Human Impulses Lead To Speculative
Disasters. New York: Ticker Publishing.Shrestha, M. K. (1992). Shareholders’ democracy and annual general meeting feedback. Kathmandu:
Portfolio Analysis Nepal Publication.Shrestha, M. K. (1995). Finance Companies in Nepal. Kathmandu: Investment Management
Training and Research Centre (IMTREC).Shrestha, P. M. (2011). The relationship between company attributes and common stock returns:
The Nepalese evidence (Unpublished M. Phil dissertation). Tribhuvan University, Kathmandu.Stattman, D. (1980). Book values and stock returns. The Chicago MBA: Journal of Selected Papers, 4, 25-45.Thaler, R. H. (1985). Mental Accounting and Consumer Choice. Marketing Science, 4(3), 199-214.Thaler, R. H. (1999). Mental accounting matters. Journal of Behavioural Decision Making, 12(3), 183-206.Wermers, R. (1999). Mutual fund herding and the impact on stock prices. The Journal of Finance,
54(2), 581-622.