REGIONALIZATION OF NEPALESE RIVER BASINS FOR FLOOD FREQUENCY ANALYSIS
10
NRCS Curve Number based Hydrologic Regionalization of Nepalese River Basins for Flood Frequency Analysis Binaya Kumar MISHRA*, Kaoru TAKARA and Yasuto TACHIKAWA* *Graduate school of Urban and Environment Engineering, Kyoto University Synopsis Regional flood frequency analysis is considered effective method for estimating such extreme flood. This study deals hydrologic regionalization of Nepalese territory. Multivariate techniques such as cluster analysis are generally used to identify objectively hydrological regions. However, major difficulty is allocating suitable weight to different attributes in cluster analysis. The problem of allocating suitable weight to different attributes was replaced by employing NRCS runoff curve number (CN). On superimposition of monsoon rainfall pattern over regions proposed with CN values led to five hydrologic regions. L-moment based regional hydrologic homogeneity test led finalization of hydrological homogeneous regions. Keywords: curve number; flood frequency; homogeneity test; L-moment 1. Introduction Estimation of extreme flood for different return periods is required in design and planning of various water related structures. This extreme flood is popularly known as design flood. Design flood estimation methods can be broadly classified into two groups: streamflow-based methods and rainfall-based methods. This study is related to streamflow-based methods which base their analysis purely on stream-gauging data. The most common streamflow-based methods are the flood frequency analysis and regional flood frequency analysis. Flood frequency analysis is applicable to locations which possess long records of observed flood data. However, the gauged locations rarely coincide with the locations at which water-related structures are going to be constructed. In such situation, regional hydrological characteristics need to be used in estimation of design flood. Regional flood frequency analysis is such method which makes the use of regional hydrological characteristics for estimating design flood. Regional flood frequency analysis is an important method for estimating flood peaks within specified probabilities of exceedance at ungauged sites or enhancing estimation at gauged sites where historical records are short. Among various methods (Cunnane, 1998) of regional flood frequency analysis, index flood method is the most popular. The index flood procedure includes three major steps: hydrologic homogeneous regionalization, selection of regional distribution function and estimation of index flood (scale factor). This study deals with the first step i.e. hydrologic homogeneous regionalization. Regionalization refers grouping of territory/basins having similar flood generating mechanisms. A more specific definition of a homogeneous region is that which consists sites having identical frequency distribution apart from a site-specific scale factor. Regionalization is required to affect the spatial transfer of hydrologic information. There are no specific guidelines for identifying homogeneous regions. This is due to the complexity - 93 - 京都大学防災研究所年報 第51号 B 平成 20 年 6 月 Annuals of Disas. Prev. Res. Inst., Kyoto Univ., No. 51 B, 2008
Transcript of REGIONALIZATION OF NEPALESE RIVER BASINS FOR FLOOD FREQUENCY ANALYSIS

NRCS Curve Number based Hydrologic Regionalization of Nepalese River Basins for Flood Frequency Analysis
Binaya Kumar MISHRA*, Kaoru TAKARA and Yasuto TACHIKAWA*
*Graduate school of Urban and Environment Engineering, Kyoto University
Synopsis Regional flood frequency analysis is considered effective method for estimating such
extreme flood. This study deals hydrologic regionalization of Nepalese territory. Multivariate techniques such as cluster analysis are generally used to identify objectively hydrological regions. However, major difficulty is allocating suitable weight to different attributes in cluster analysis. The problem of allocating suitable weight to different attributes was replaced by employing NRCS runoff curve number (CN). On superimposition of monsoon rainfall pattern over regions proposed with CN values led to five hydrologic regions. L-moment based regional hydrologic homogeneity test led finalization of hydrological homogeneous regions.
Keywords: curve number; flood frequency; homogeneity test; L-moment
1. Introduction
Estimation of extreme flood for different return periods is required in design and planning of various water related structures. This extreme flood is popularly known as design flood. Design flood estimation methods can be broadly classified into two groups: streamflow-based methods and rainfall-based methods. This study is related to streamflow-based methods which base their analysis purely on stream-gauging data. The most common streamflow-based methods are the flood frequency analysis and regional flood frequency analysis. Flood frequency analysis is applicable to locations which possess long records of observed flood data. However, the gauged locations rarely coincide with the locations at which water-related structures are going to be constructed. In such situation, regional hydrological characteristics need to be used in estimation of design flood. Regional flood frequency analysis is such method which makes the use of regional hydrological characteristics for estimating
design flood. Regional flood frequency analysis is an important method for estimating flood peaks within specified probabilities of exceedance at ungauged sites or enhancing estimation at gauged sites where historical records are short.
Among various methods (Cunnane, 1998) of regional flood frequency analysis, index flood method is the most popular. The index flood procedure includes three major steps: hydrologic homogeneous regionalization, selection of regional distribution function and estimation of index flood (scale factor). This study deals with the first step i.e. hydrologic homogeneous regionalization. Regionalization refers grouping of territory/basins having similar flood generating mechanisms. A more specific definition of a homogeneous region is that which consists sites having identical frequency distribution apart from a site-specific scale factor. Regionalization is required to affect the spatial transfer of hydrologic information.
There are no specific guidelines for identifying homogeneous regions. This is due to the complexity
- 93 -
京都大学防災研究所年報 第51号 B 平成 20 年 6 月
Annuals of Disas. Prev. Res. Inst., Kyoto Univ., No. 51 B, 2008

in understanding precisely the factors that have effect on the generation of floods. Several attempts have been made by different authors to identify hydrological homogeneous regions in different parts of the world. Earlier research work used subjective consideration on the attributes like location, topography of the basin in forming hydrologic homogeneous regions. More recent works used multivariate technique such as cluster analysis to identify objectively hydrologic homogeneous regions. The cluster analysis is based either on physiographic characteristics or on flood data characteristics or on combination of both. Burn and Goel (2000) used three physiographic characteristics: catchment area, length of the main stream and slope of the main stream in central Indian River basins. Regionalization using basin characteristics such as catchment area, rainfall and soil type was suggested as an attractive approach of regionalization by Wiltshire (1985). Mosley (1981) used clustering of flood statistics: specific flood (peak discharge generated by unit drainage area) and coefficient of variance (Cv) for delimitation of New Zealand river basins. Burn (1997) used seasonality statistic (average date of flood events) to avoid the dual use (region forming and homogeneity test) of statistics derived from flood magnitudes.
Research on regionalization of Nepalese rivers is extremely limited. MacDonald and Partners (1990) have divided Nepalese territory into 7 regions using information for low flow estimation. Sharma and Adhikari (2004) has developed relationships for estimating extreme (minimum and maximum) and long-term (average) flows using regression technique by considering the whole Nepalese territory as one homogeneous region. No other study is found on hydrologic regionalization of Nepalese rivers for design flood estimation except similar previous work of Mishra et al. (2008). In the previous regionalization work, the authors used specific flood, date of flood events and centroid lat-long of river basins as clustering attributes.
There are number of problems associated with regionalization in general, and with cluster analysis in particular (Nathan and McMohan, 1990). The first problem, common to all regionalization techniques, is related to the selection of clustering attributes. Hydrologic regionalization using flood statistics
attributes is simpler than the regionalization using physiographic/climatic attributes. However, with the use of flood statistics, hydrologic regionalization is not possible for the territory having sparse river gauging networks or ungauged basins. In addition, the integrity of homogeneity test is compromised (Hosking and Wallis, 1997) since the same flood statistics are used to propose the regions and to subsequently evaluate the homogeneity. Therefore, delineation of hydrologic homogeneous regions using physio-climatic attributes is more appropriate. Another major difficulty is being different measuring units of clustering attributes. For example, the attribute like soil type is expressed in term of infiltration rate (mm/h) whereas another attribute like catchment area is expressed in km2. Another problem is measuring scale (e.g., mm/hr or cm/hr for infiltration rate) of clustering attributes. These different units and scale of measurement make complexity in allocating suitable weight to different attributes.
A new approach of regionalization is presented here which addresses problems associated with different measuring unit of clustering attribute, different scale of measuring unit and hence, allocating suitable weight to different clustering attributes. Soil type, land cover, land slope and rainfall pattern are considered major physio-climatic attributes which govern flood generation. Effect of soil type, land slope and land cover information can be taken into account by using NRCS runoff curve number (CN) since the CN is function of soil type, land use, land slope and others (Ritzema, 1994).
The present work identifies hydrologic homogeneous regions inside Nepalese territory. The work started with the estimation of runoff curve number for different combinations of soil type, land cover and land slope ranges. In next step, area-weighted CN was computed for spatially well-representing sample basins. These sample basins have drainage area smaller than 250 km2 and generated from GTOPO30 digital elevation model (DEM). Hydrological regions were proposed by superimposing digitized monsoon rainfall map over NRCS-CN integrated basins map. Validation of proposed regions was made using the L-moment based regional homogeneity test. Theoretical background on NRCS runoff curve number and
- 94 -

regional homogeneity test has been discussed in section 2 and 3 respectively. The following section deals with study area, data analysis and results of region forming process. The methodology on proposing hydrologic homogeneous regions and their results/validation are discussed under region forming process and results/discussion sections respectively. The final section summarizes the important research conclusions. 2. NRCS runoff curve number
The runoff curve number (CN) is an index developed by USDA Natural Resource Conservation Service (NRCS) to represent the potential for storm water runoff within a drainage area. USDA developed runoff curve number from field experiments of runoff in small catchments for the combinations of different hydrological soil group, land cover and soil moisture. Further research in different part of the world suggested some adjustments in CN for different range of land slope. The curve number varies from 0 to 100; lower numbers indicate low runoff potential while larger numbers indicate increasing runoff potential. The CN is widely used for estimating direct runoff from a rainfall event. The runoff equation is;
)1()( 2
SIPIPQa
a
+−−
=
where Q is direct runoff (mm), P is rainfall (mm), S is potential maximum retention (mm), and Ia is initial abstraction (mm). Ia is usually taken 20% of S. The runoff curve number, CN, is then related to S as:
)2(25425400
SCN
+=
For NRCS runoff curve number estimation, the
available soil data needs to be expressed into hydrological soil group. There are four hydrologic soil groups: A, B, C and D. These soil groups are defined as below; A: Soils having high infiltration rates, even when thoroughly wetted and consisting soil with excessively-drained coarse textures.
B: Soils having moderate infiltration rates when thoroughly wetted and consisting soil with moderately-drained coarse textures. C: Soils having slow infiltration rates when thoroughly wetted and consisting chiefly of soils with fine texture. D: Soils having very slow infiltration rates when thoroughly wetted and consisting soils with clay layer near the surface or shallow soils over nearly impervious material.
The land cover categories like woodland, forest, cropland, urban area etc. need to be defined in estimation of CN. Land cover represents the surface conditions in a drainage basin and is related to the degree of cover. These land covers are further classified e.g., woodlands are classified as poor when heavily grazed or regularly burnt; as fair when grazed but not burnt; and as good when protected from grazing.
Soil moisture condition in the drainage basin before runoff occurs is another important factor influencing the CN value. In CN estimation, the soil moisture condition is classified in three antecedent moisture condition (AMC) classes. These classes, based on the 5-day antecedent rainfall (i.e. the accumulated total rainfall preceding the runoff under consideration), are as follows: AMC I: The soils in the drainage basin are practically dry (i.e. the soil moisture content is at wilting point) i.e. 5-day antecedent rainfall is less than 23 mm. AMC II: The soils in the basin have average condition i.e. 5-day antecedent rainfall varies from 23 to 40 mm. AMC III: The soils in the drainage basins are practically saturated from antecedent rainfalls i.e. the 5-day antecedent rainfall is more than 40 mm.
To determine the appropriate CN value, a table, popularly called as look-up table, needs to be supplied. The look-up table possesses the value of CN for different combination of land use, land slope, land treatment practice, impervious percentage and hydrological soil group. Initially the look-up table is provided for average moisture condition (AMC II).. Then, if necessary, these CN values are modified based on 5-day antecedent rainfall data. 3. Regional homogeneity test
- 95 -

Regional hydrologic homogeneity test is required
for each proposed hydrologic regions. The L-moment based regional homogeneity test (Hosking and Wallis, 1997) needs computation of L-moment ratios: L-coefficient of variance (LCv), L-skewness (LCs) and L-kurtosis (LCk) at each station for the available sample. Visually, regional homogeneity can be identified from the plot of sample LCv, LCs and LCk on L-moment ratio diagram (Rao and Hamed, 1997). If the plotted points are closer, the region can be expected as hydrological homogeneous. Numerically, there are two ways to check regional homogeneity. The first one is discordancy measure, intended to identify those sites that are unusual with the group as a whole. The discordancy measure estimates how far a given site is from the centre of the group. If ui=[t(i) t3
(i) t4(i)]T is L-moment ratios
vector for the site i and superscript T as transpose of the vector, then discordancy (Di) can be expressed as Eq. (3).
)3()()(31 1
−−
−
−−= uuAuuD iT
ii
where ū and A for N gauge locations in a region are defined as;
)4(11∑=
−
=N
iiu
Nu
)5())(( Ti
N
ii uuuuA
−−
−−= ∑
A site i is declared to be discordant if Di is large.
Critical value of Di is 3 for the region having 15 or more nos. of gauged sites. For the region with smaller nos. of gauge sites, critical value of Di varies with nos. of gauge sites in the region.
The second regional homogeneity test is heterogeneity measure, intended to estimate the degree of heterogeneity in a group of sites and to assess whether they might be reasonably treated as homogeneous. This test compares the variability of L-moment ratios for the catchments in a region with the expected variability obtained from simulation.
The heterogeneity measure is expressed as:
)6()(
v
vVHσμ−
=
where V is the weighted variance of the LCv or LCs
or LCk for the region, µv is mean and σv standard deviation of V obtained from simulation. Heterogeneity measure H1, H2 and H3 indicates variability in LCv, LCs and LCk respectively. Heterogeneity measure H1 is suggested as the most reliable parameter for testing regional homogeneity. A region is considered homogeneous if H<1, possibly heterogeneous if 1 < H < 2, and definitely heterogeneous if H > 2.
4. Study area
This study is intended to form hydrologic regions
inside the Nepalese territory for carrying regional flood frequency analysis. Nepal, roughly a rectangle in shape with an area of 147,181 square kilometer, is situated between China in north and India in remaining three sides. It has a length of 885 km east–west and width of 145–248 km north–south. Within this relatively small latitudinal extent, altitude rises from 60 m in south to the 8848 m (Mount Everest, the world’s highest peak) in North. Physiographically, the country is divided into five regions (Fig.1): Terai (Plain), Siwalik Hills, Middle Mountains, High Mountains and High Himalayas.
Fig. 1 Physiographic regions of Nepal
The average annual precipitation is around 1600
mm of which almost 80% or more occurs during the period of June-September. All the river systems of Nepal are tributaries to the Ganges river draining ultimately to the Bay of Bengal. The major
- 96 -
tributaries generally flow towards south direction. 5. Data and preliminary analysis
The physiographic/climatic attributes: soil type, land cover, land slope and monsoon rainfall pattern have been considered in proposing hydrologic regions. Effect of soil type, land slope and land cover has been dealt using NRCS runoff curve number. Area-weighted runoff curve number value was calculated for each spatially representing sample basins. These sample basins with maximum drainage area of 250 Km2 were generated from digital elevation model (DEM). Using ArcGIS, the digitized monsoon rainfall map was superimposed over map of sample basins associated with area-weighted runoff curve number to propose hydrologic regions. Once the regions were proposed, each region was required hydrologic homogeneity check for validation. Annual instantaneous flood data of 49 river basins had been used in regional homogeneity test. These 49 test basins were selected such that their drainage boundary remained within a particular proposed region. Except 3 stations in south-west Nepal, all the remaining stations have observed flood length of more than 10 years. 5.1 Soil type
Global soil data at cell resolution of 5 arc-min (approx. 10 km) has been prepared by FAO and can be freely downloaded through internet. This digital soil map is available in shape file format with geographic coordinate system. Digital soil data of the study area was extracted from the downloaded large data set. Textural classification associated with soil data was considered important here since it can be easily converted into hydrological soil group which is required in CN estimation. Textural classes reflect the relative proportions of clay (fraction less than 0.002mm), silt (0.002 - 0.05mm) and sand (0.05 - 2mm) in the soil. Based on their proportion, hydrological soil group map of Nepal (Fig.2) was prepared.
5.2 Land cover
The University of Maryland, Department of Geography generated global land cover classification collection in 1998. The university made fourteen land
cover categories from the analysis of AVHRR satellites imagery acquired between 1981 and 1994. This land cover data can be freely downloaded at various resolutions through internet. Land cover data of the study area at resolution of 1km was made available from the internet site maintained by Global Land Cover Facility (GLCF). Digital land cover map (Fig.3) required for CN estimation purpose was prepared after simple modification in original classification.
Fig. 2 Hydrological soil groups of Nepal
Fig. 3 Land cover map of Nepal
5.3 Rainfall distribution
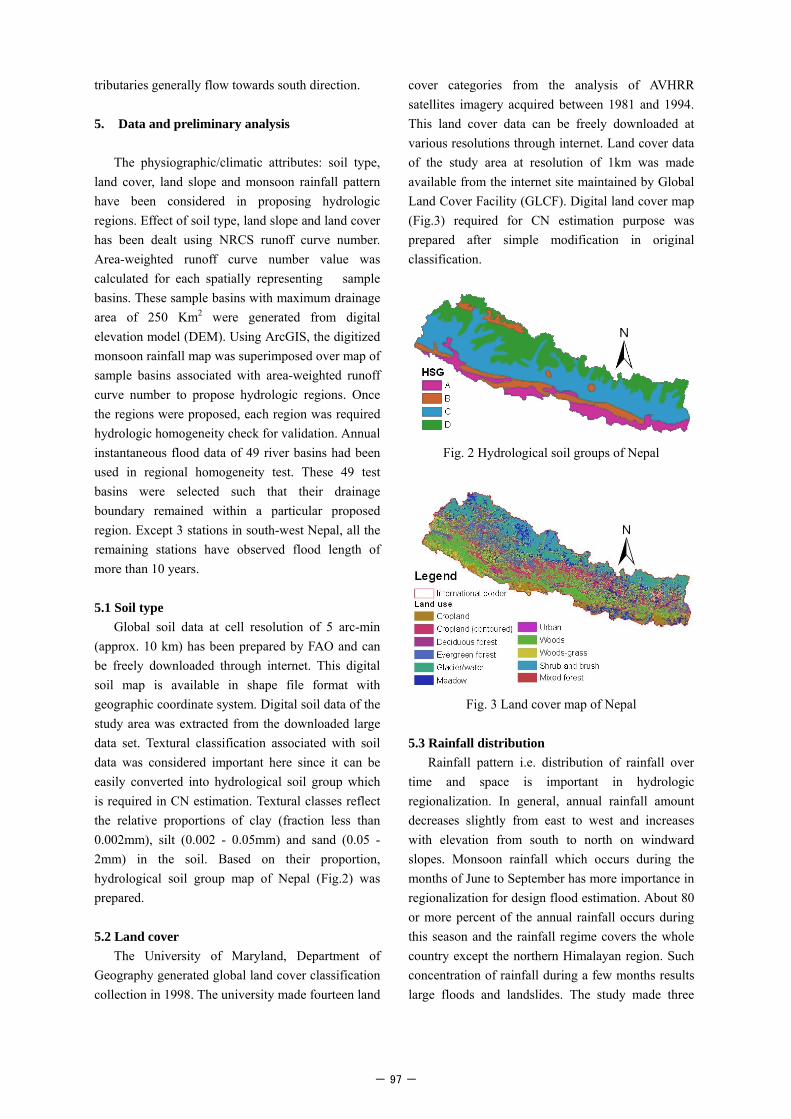
Rainfall pattern i.e. distribution of rainfall over time and space is important in hydrologic regionalization. In general, annual rainfall amount decreases slightly from east to west and increases with elevation from south to north on windward slopes. Monsoon rainfall which occurs during the months of June to September has more importance in regionalization for design flood estimation. About 80 or more percent of the annual rainfall occurs during this season and the rainfall regime covers the whole country except the northern Himalayan region. Such concentration of rainfall during a few months results large floods and landslides. The study made three
- 97 -

classes of monsoon rainfall pattern from mean monsoon precipitation map available at http://www.fao.org/ag/agL/swlwpnr/reports/y_sa/z_np/npmp134.htm . These classes (Fig.4) were defined for rainfall value less than 1000 mm, 1000 to 1500 mm and more than 1500 mm.
Regional hydrologic test need to be performed on each of the proposed hydrologic region. It needs adequate number of gauge station with long record length of flood data. Department of Hydrology and Meteorology (DHM), Nepal is one and only government organization responsible for collecting and distributing flood data in Nepal. Regularly observed instantaneous annual maximum stream flow data were collected for 49 stream gauging stations in Nepal. Selection of these stream gauging stations were based on basins’ boundary position and record length of observed data. Boundaries of all these stations are restricted inside a proposed hydrologic region. Most of these stations are situated in middle mountain region. Out of these 49 considered river basins, 46 have observed length of more than 10 years. Because of inadequate gauging stations in lower region, 3 stations were selected though their record length is smaller.
Fig. 4 Monsoon rainfall map of Nepal
Data analysis was started by visual inspection of the collected data. These data were obtained from the 1998, 2003 and 2004’s DHM publications. In addition, some recent flood data were collected in digital format from the authority of DHM, Nepal. In case of overlapping mismatched data, the latest publication was considered as correct flood data. The flood data series being homogeneous and stationary are the basic assumptions in flood frequency analysis. Test of homogeneity and stationary for the flood data series was performed as discussed by Mann and Whitney (1947). All the data series were found homogeneous and stationary at 5% significance level. Presence of outliers in the data causes difficulties when fitting a distribution to the data. The G-B test (Grubbs and Beck, 1972, Rao and Hamed, 2000) was used to detect outlier. Approximate relationship proposed at 10% significance level by Pilon et al. (1985) was used in calculating G-B statistic. The study found 1 no. of outliers at 14 stations (station indices: 267, 404.6, 438, 439.8, 445.3, 465, 530, 570, 589, 602, 620, 627.5, 650 & 660), 2 nos. at station index 447.9 and 3 nos. at station index 241.
Fig. 5 GTOPO30 digital elevation model of Nepal 5.4 Digital elevation model
Digital elevation model (DEM) of the study area (Fig. 5) was clipped from large GTOPO30 DEM of Asia. This can be freely downloaded from the internet site maintained by global data centre of NASA. This 30 arc-sec (approx. 1 km) resolution DEM was used to generate spatially representing sample basins and stream network with the help of Arc GIS. The stream network derived from this DEM was compared with the stream network available in various reports available at internet and found acceptably okay. Also, the areas of river basins for the gauged outlets generated from DEM were compared with the areas made available by DHM, Nepal for further validation of downloaded DEM. Thereafter, 650 nos. of sample river basins representing all part of Nepalese territory was generated for hydrologic regionalization. 5.5 Flood data
6. Region forming process
The regionalization starts with development of NRCS runoff curve number map for the derived
- 98 -
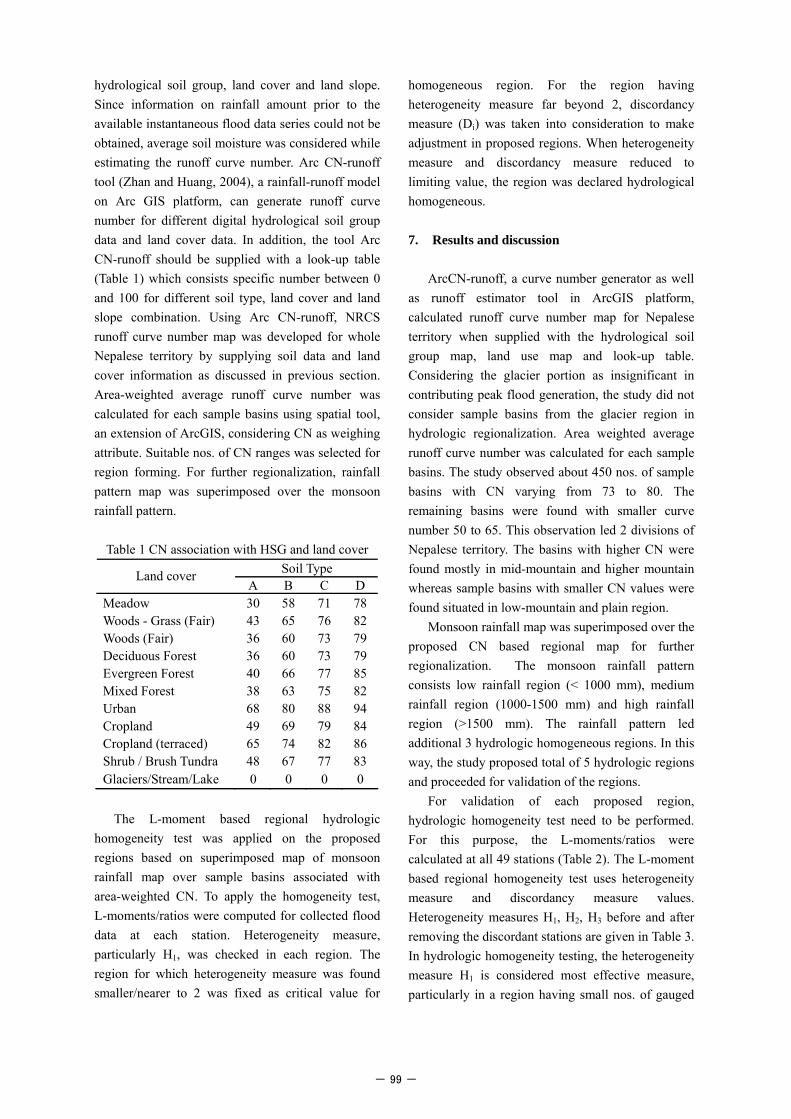
hydrological soil group, land cover and land slope. Since information on rainfall amount prior to the available instantaneous flood data series could not be obtained, average soil moisture was considered while estimating the runoff curve number. Arc CN-runoff tool (Zhan and Huang, 2004), a rainfall-runoff model on Arc GIS platform, can generate runoff curve number for different digital hydrological soil group data and land cover data. In addition, the tool Arc CN-runoff should be supplied with a look-up table (Table 1) which consists specific number between 0 and 100 for different soil type, land cover and land slope combination. Using Arc CN-runoff, NRCS runoff curve number map was developed for whole Nepalese territory by supplying soil data and land cover information as discussed in previous section. Area-weighted average runoff curve number was calculated for each sample basins using spatial tool, an extension of ArcGIS, considering CN as weighing attribute. Suitable nos. of CN ranges was selected for region forming. For further regionalization, rainfall pattern map was superimposed over the monsoon rainfall pattern.
Table 1 CN association with HSG and land cover
Soil Type Land cover A B C D
Meadow 30 58 71 78 Woods - Grass (Fair) 43 65 76 82 Woods (Fair) 36 60 73 79 Deciduous Forest 36 60 73 79 Evergreen Forest 40 66 77 85 Mixed Forest 38 63 75 82 Urban 68 80 88 94 Cropland 49 69 79 84 Cropland (terraced) 65 74 82 86 Shrub / Brush Tundra 48 67 77 83 Glaciers/Stream/Lake 0 0 0 0
The L-moment based regional hydrologic
homogeneity test was applied on the proposed regions based on superimposed map of monsoon rainfall map over sample basins associated with area-weighted CN. To apply the homogeneity test, L-moments/ratios were computed for collected flood data at each station. Heterogeneity measure, particularly H1, was checked in each region. The region for which heterogeneity measure was found smaller/nearer to 2 was fixed as critical value for
homogeneous region. For the region having heterogeneity measure far beyond 2, discordancy measure (Di) was taken into consideration to make adjustment in proposed regions. When heterogeneity measure and discordancy measure reduced to limiting value, the region was declared hydrological homogeneous. 7. Results and discussion
ArcCN-runoff, a curve number generator as well as runoff estimator tool in ArcGIS platform, calculated runoff curve number map for Nepalese territory when supplied with the hydrological soil group map, land use map and look-up table. Considering the glacier portion as insignificant in contributing peak flood generation, the study did not consider sample basins from the glacier region in hydrologic regionalization. Area weighted average runoff curve number was calculated for each sample basins. The study observed about 450 nos. of sample basins with CN varying from 73 to 80. The remaining basins were found with smaller curve number 50 to 65. This observation led 2 divisions of Nepalese territory. The basins with higher CN were found mostly in mid-mountain and higher mountain whereas sample basins with smaller CN values were found situated in low-mountain and plain region.
Monsoon rainfall map was superimposed over the proposed CN based regional map for further regionalization. The monsoon rainfall pattern consists low rainfall region (< 1000 mm), medium rainfall region (1000-1500 mm) and high rainfall region (>1500 mm). The rainfall pattern led additional 3 hydrologic homogeneous regions. In this way, the study proposed total of 5 hydrologic regions and proceeded for validation of the regions.
For validation of each proposed region, hydrologic homogeneity test need to be performed. For this purpose, the L-moments/ratios were calculated at all 49 stations (Table 2). The L-moment based regional homogeneity test uses heterogeneity measure and discordancy measure values. Heterogeneity measures H1, H2, H3 before and after removing the discordant stations are given in Table 3. In hydrologic homogeneity testing, the heterogeneity measure H1 is considered most effective measure, particularly in a region having small nos. of gauged
- 99 -

sites. A value of H1= 8.9 was found when considered whole Nepalese territory. This value is far beyond the acceptable limit indicating hydrological non-homogeneity of Nepal when considered whole territory as one region. The situation improved not much even after removing discordant sites. This motivated numerically to go for regionalization. The regions 2, 3 and 5 were found with acceptable value of heterogeneity measure and with no discordant sites. The value of H
1 was found as 5.72 and 4.77 for regions 1 and 4 respectively before removing the discordant sites. When discordant sites were removed, the heterogeneity measure reduced near acceptable limit for region 1 and region 4. Fig.6 shows the finally identified 5 nos. of hydrologic homogeneous regions.
Fig. 6 Hydrological homogeneous regions of Nepal
Table 2 L-moments/ratios of 49 Nepalese river basins
L-coefficient of Station Index
Record length (year)
Mean flood (m3/s)
L-variance (m3/s) variance skewness Kurtosis
120 29 239.52 47.03 0.20 0.27 0.25 170 22 186.63 64.43 0.35 0.34 0.17 208 14 450.21 92.11 0.20 -0.03 0.23 220 15 290.00 53.72 0.19 0.03 0.09 240 34 2322.65 318.25 0.14 0.15 0.23 241 28 349.30 102.83 0.29 0.30 0.23 251 12 691.67 166.31 0.24 0.25 0.14 267 22 898.14 187.68 0.21 0.24 0.19
269.5 13 1914.23 553.93 0.29 -0.22 0.05 270 32 2950.31 662.14 0.22 0.19 0.12 403 29 143.23 26.58 0.19 0.04 0.08
404.6 21 546.76 135.92 0.25 0.11 0.19 281 6 15.06 5.75 0.38 0.41 0.33 390 12 508.04 236.11 0.46 0.27 0.11 296 5 397.90 98.99 0.25 -0.26 0.15 363 6 45.67 11.41 0.25 0.26 0.22 330 31 647.48 162.00 0.25 0.13 0.10
409.5 27 95.71 22.23 0.23 0.30 0.18 414.1 12 120.00 57.07 0.48 0.30 0.16 416.2 23 217.52 64.21 0.30 0.09 0.00 417 20 983.25 219.89 0.22 0.32 0.26 428 22 163.68 44.23 0.27 0.40 0.20 430 20 443.65 151.59 0.34 0.34 0.08 438 17 632.94 163.29 0.26 0.34 0.20
439.3 12 67.36 17.93 0.27 0.21 0.33 439.7 14 1475.21 253.20 0.17 0.24 0.21 439.8 11 1467.27 227.29 0.15 0.24 0.24 445.3 15 336.87 93.32 0.28 0.28 0.20 446.8 22 181.33 55.52 0.31 0.38 0.31 447.9 20 125.92 30.35 0.24 0.19 0.18 448 27 581.89 150.64 0.26 0.29 0.24 460 31 560.00 164.38 0.29 0.11 0.02 465 31 648.65 223.07 0.34 0.28 0.10 470 31 358.71 112.70 0.31 0.20 0.26 530 28 64.89 25.35 0.39 0.46 0.27
- 100 -

550.05 12 452.83 142.43 0.31 0.18 0.17 570 14 207.01 73.64 0.36 0.22 0.21 589 15 4193.33 1118.09 0.27 0.29 0.14 620 37 669.62 221.77 0.33 0.22 0.15
627.5 12 88.42 45.94 0.52 0.74 0.60 602 27 256.52 78.75 0.31 0.31 0.18 650 15 1413.47 383.46 0.27 0.13 0.07 660 35 377.14 54.49 0.14 0.18 0.25 670 26 2300.77 557.55 0.24 0.33 0.23 690 37 3011.62 679.70 0.23 0.23 0.18 728 18 618.31 386.62 0.63 0.60 0.39 730 31 40.20 10.90 0.27 0.14 0.12 738 11 444.82 194.45 0.44 0.44 0.28 795 24 3520.08 1003.16 0.28 0.14 0.11
Table 3 Regional heterogeneity measures for Nepalese river basins All Discordant sites removed Region % area Nos. of gauged sites ( NS) H1 H2 H3 NS H1 H2 H3
All 100 49 8.9 2.53 -0.45 44 6.36 1 -1.67 1 16.24 9 5.72 1.41 -0.44 7 1.13 -0.07 0.108 2 14.67 2 -0.41 -0.7 -0.62 2 -0.41 -0.7 -0.62 3 33.20 10 1.96 1.1 0.09 10 1.96 1.1 0.09 4 24.63 26 4.77 1.22 -0.14 24 2.09 0.08 -0.96 5 11.26 2 -1.08 0.69 0.01 2 -1.08 0.69 0.01
8. Summary and Conclusions
Difficulties associated with mostly used regionalization technique i.e. clustering technique were discussed. Use of runoff curve number (CN) was proposed to address difficulties like attributes’ measuring units/scale and suitable weight in cluster analysis. To estimate the runoff curve number, land cover map prepared from AVHRR satellite imagery and soil data prepared by FAO were brought in use. Hydrologic regions were proposed by superimposing monsoon rainfall map over runoff curve number map. The L-moment based regional hydrologic homogeneity test led some adjustment in proposed regions and finally 5 hydrologic regions were identified inside the Nepalese territory.
The main objective to delineate hydrological homogeneous regions for flood frequency analysis was achieved despite the complexity in understanding precisely the factors that have effect on generation of floods. Heterogeneity measures for each region were found within or near critical values. This led to conclude the runoff curve number as effective parameter in hydrologic regionalization. Large heterogeneity measure while
considering all 49 gauging sites in one region concludes that whole Nepalese territory can not be considered as one hydrologically homogeneous region. Therefore, the present regionalization work will be able to predict design flood better as compared to the previous method developed in Nepal which considered whole Nepal as one hydrologic region. In the next stage, the authors will estimate regional distribution function and index flood for each delineated region to accomplish the regional flood frequency analysis. To justify this new approach of hydrologic regionalization, the approach will be applied in country/territory other than Nepal.
References
Burn, D.H. (1997): Catchment similarity for
regional flood frequency analysis using seasonality measures, Journal of Hydrology, Vol. 202, pp. 212-230.
Burn, D.H. and Goel, N.K. (2000): The formation of groups for regional flood frequency analysis, Hydrological Sciences Journal, Vol. 45, No. 1, pp. 97-112.
Cunnane, C. (1998): Methods and merits of
- 101 -

regional flood frequency analysis, Journal of Hydrology, Vol. 100, pp. 269-290.
Grubbs, F. and Beck, G. (1972): Extension of sample sizes and percentage points for significance tests of outlying observations, Technometrics, Vol. 14, No. 4, pp. 847-854.
Hosking, J.R.M. and Wallis, J.R. (1997): Regional Frequency Analysis: An approach based on L-moments, Cambridge University Press, Cambridge, UK.
Mann, H.B. and Whitney, D.R. (1947): On a test of whether one of two random variables is stochastically larger than the other, The annuals of mathematical statistics, Vol. 18, pp. 50-60.
McDonald, M. and Partners Ltd (1990): Hydrology and Agro-metrology Manual, M3, Design Manuals for Irrigation Projects in Nepal.
Mishra, B.K., Takara, K. and Tachikawa, Y (2008): Regionalization of Nepalese river basins for flood frequency analysis, Annual Journal of Hydraulic Engineering, JSCE, Vo. 52, pp. 91-96.
Mosley, M.P. (1981): Delimitation of New Zealand Hydrologic Regions, Journal of Hydrology, Vol. 49, pp. 173-192.
Nathan, R.J. and McMohan, T.A. (1990): Identification of homogeneous regions for the purpose of regionalization, Journal of Hydrology, Vol. 121, pp.217-238.
Rao, A.R. and Hamed, K.H. (1997): Regional frequency analysis of Wabash river flood data by L-moments, Journal of hydrologic engineering, Vol. 2, No. 4, pp 169-179.
Rao, A. R. and Hamed, K.H. (2000): Flood Frequency Analysis, CRC Press LLC, Florida.
Ritzema, H.P. (Editor-in-chief) (1994): Drainage principles and applications, International Institute for Land Reclamation and Improvement, Wageningen, The Netherlands.
Sharma, K.P. and Adhikari, N.R. (2004): Hydrological Estimations in Nepal, Kathmandu, Nepal.
Wiltshire, S.E. (1985): Grouping basins for regional flood frequency analysis, Hydrological Sciences Journal, Vol. 30, No. 1, pp. 151-159.
Zhan, X. and Huang, M. (2004): ArcCN-Runoff; an ArcGIS tool for generating Curve number and runoff maps, Environmental Modelling and Software, Vol. 19, No. 10, pp. 875-879.
NRCSカーブナンバーをもとにした洪水頻度解析のための
ネパール河川流域の水文学的な地域分割
Binaya Kumar MISHRA*・宝 馨・立川康人*
* 京都大学大学院工学研究科都市環境工学専攻
要 旨
洪水流量の地域頻度解析は異なる再現期間の極値洪水を推定する上で有用と考えられる。本研究では,ネパー
ルの水文学的な地域分割化を対象とした。地域分割を客観的に実施するためにはクラスター分析などの他変数解析
法が通常用いられるが,この手法の主な困難さは,変数間の適切な重みをどのように設定するかにある。そこで,
本研究ではこの問題を避けるために,NRCSのカーブナンバー法を用いた。モンスーン時の降水パターンとカーブ
ナンバーの値を重ねることによって,5つの水文学的な領域を設定した。次に,Lmoment法を用いて地域的な水文
学的空間均一性を確認し,最終的に水文学的な地域分割を実現した。
キーワード: カーブナンバー,洪水頻度解析,均一性テスト,L-moment
- 102 -