
From the BSU to the BSEC: Evaluating Interwar Geopolitical Fantasies
Hitilerin oJEconornic Research 43~2, 1991,0307-3378 $2.00
TRADE POLICY AND THE REGIONALIZATION OF IMPORTS IN
INTERWAR BRITAIN*
Michael Kitson and Solornos Solomou
INTRODUCTION
Britain’s trading performance exhibited major changes during the interwar period that were contemporaneous with major shifts in both domestic trade policy and international trading conditions (Kitson and Solomou ( 1990a)). In particular sterling was devalued in 193 1, the same year as the imposition of the Abnormal Importations Act and in 1932 the tariff legis- lation was consolidated in the Import Duties Act. Moreover the UK pursued discriminatory trade policies after 1932 (Rooth (1986)): trading agreements with Australia, Canada, India, New Zealand and South Africa were signed at Ottawa in 1932 and between 1933 and 1935 bilateral trading agreements were signed with Argentina, Denmark, Norway, Sweden, Finland, Estonia, Latvia, Lithuania and Poland. The purpose of this paper is to evaluate to what extent these discriminatory policies altered the regionalization pattern of UK imports in the 1930s relative to the 1920s.
The diverse national experiences of the interwar years allows us to classify British trading partners into five major groupings. The first is the Empire and Commonwealth countries who were given preferential treat- ment under the tariff legislation and followed Britain’s exchange rate policy within the sterling area. The second is the Gold Bloc which was faced with the combined competitive disadvantage of both the tariff and devaluation for most of the 1930s. Thirdly there is the group of non- British countries who followed Britain in devaluing early but who were adversely affected by British tariffs. Fourthly there is a group of non- British countries who were given preferential treatment under specific bilateral trading agreements. Finally there is the rest of the world group con- sisting of the remainder of Britain’s trading partners. This classification
*This research has been funded by the Economic and Social Research Council (Grant R000231387). The authors would like to thank participants at the ESRC Quantitative Economic History Group Conference held in Hull, September 1989, and two anonymous referees for comments on an earlier version of this paper.
151
152 BULLETIN OF ECONOMIC RESEARCH
allows us to shed more light on the impact of discriminatory tariff policies and Imperial Preference on the pattern of trade.
Protection and Imperial Preference are assumed to have led to the regionalization of British trade into two major blocs - Empire and foreign (Glickman (1947); MacDougall and Hutt (1954)). Despite this widely held view there has been little quantitative work to evaluate this proposition. Capie (1983) has criticized the work of Glickman and MacDougall and Hutt for neglecting the trend towards increased trade with the Empire since 1870 but himself neglects the evidence that the rate of increase of the share of the Empire was much faster in the 1930s than for any period since the 1870s. However, it is not clear to what extent this rapid tendency towards the regionalization of British trade can be attributed to discrimi- natory policies and Imperial Preference.
This paper is organized into three parts. Section 1 describes the main characteristics of the trade policy changes during the period. Section 2 analyses the geographical distribution of imports. Finally Section 3 extends the analysis by evaluating the differential impact of the trade policies on the pattern of imports by commodity.
1. POLICY INSTRUMENTS
In September 1931 Britain left the gold standard causing an effective devaluation of sterling. Despite initial erratic movements the Bank of England and more particularly the Treasury pursued a policy of managing the exchange rate (Dimsdale (1981), p. 329). The devaluation of sterling against the dollar, however, only persisted through 1932-33 as there was an effective devaluation of the dollar during 1933. However, sterling remained competitive against the principal European currencies particu- larly those remaining within the gold bloc.'
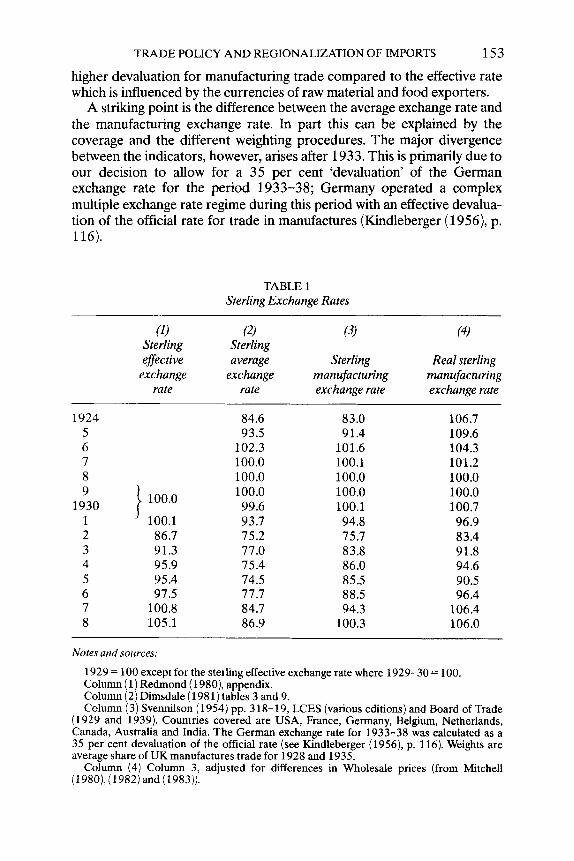
Table 1 shows a number of different indicators of exchange rate behaviour for the period 1924-38. The appropriateness of each depends on which component of trade is being examined. The sterling effective exchange rate was constructed by Redmond (1 980) using shares in bilateral trade as weights. It indicates an average sterling devaluation of approximately 5 per cent in the period 1932-37 compared with the 1929-30 level. The average exchange rate and the manufacturing exchange rate show a greater devaluation, 22.6 per cent and 14.4 per cent respectively, compared with 1929. As both these indicators are based on manufacturing trade they are influenced more by the European currencies which were comparatively overvalued against sterling. Thus they indicate a
I The Gold Bloc consisted of Belgium, France, Netherland, Switzerland, Italy and Poland.
TRADE POLICY AND REGIONALIZATION OF IMPORTS 153
higher devaluation for manufacturing trade compared to the effective rate which is influenced by the currencies of raw material and food exporters.
A striking point is the difference between the average exchange rate and the manufacturing exchange rate. In part this can be explained by the coverage and the different weighting procedures. The major divergence between the indicators, however, arises after 1933. This is primarily due to our decision to allow for a 35 per cent ‘devaluation’ of the German exchange rate for the period 1933-38; Germany operated a complex multiple exchange rate regime during this period with an effective devalua- tion of the official rate for trade in manufactures (Kindleberger (1956), p. 116).
TABLE 1 Sterling Exchange Rates
(1) (4 Sterling Sterling effective average
exchange exchange rate rate
(3) (4)
Sterling Real sterling manufacturing manufacturing exchange rate exchange rate
1924 5 6 7 8 1 100.0 1930 1 I 100.1 2 86.7 3 91.3 4 95.9 5 95.4 6 97.5 7 100.8 8 105.1
84.6 93.5
102.3 100.0 100.0 100.0 99.6 93.7 75.2 77.0 75.4 74.5 77.7 84.7 86.9
83.0 91.4
101.6 100.1 100.0 100.0 100.1 94.8 75.7 83.8 86.0 85.5 88.5 94.3
100.3
106.7 109.6 104.3 101.2 100.0 100.0 100.7 96.9 83.4 91.8 94.6 90.5 96.4
106.4 106.0
Notes and sources:
1929 = 100 except for the sterling effective exchange rate where 1929-30 = 100. Column (1) Redmond (1980), appendix. Column (2) Dimsdale (1 981) tables 3 and 9. Column (3) Svennilson ( 1954) pp. 3 18- 19, LCES (various editions) and Board of Trade
(1929 and 1939). Countries covered are USA, France, Germany, Belgium, Netherlands, Canada, Australia and India. The German exchange rate for 1933-38 was calculated as a 35 per cent devaluation of the official rate (see Kindleberger (1956), p. 116). Weights are average share of UK manufactures trade for 1928 and 1935.
Column (4) Column 3, adjusted for differences in Wholesale prices (from Mitchell (1 980), (1 982) and ( 1983)).
154 BULLETIN OF ECONOMIC RESEARCH
In order to consider the effect of exchange rate changes on competitive- ness it is necessary to consider changes in domestic and world prices. Column 4 in Table 1 presents one such indicator, the real manufacturing exchange rate which is the manufacturing index adjusted for changes in wholesale prices. This indicator shows that following the return to the gold standard in 1925 there was an effective depreciation of the real exchange rate due to the relative decline in UK prices. Following the suspension of the gold standard the real exchange rate depreciated by some 16 per cent in 1932 but by 1937 this improvement in competitiveness was eroded. The average real depreciation for manufactures was only 6 per cent for the period 1932-37 compared with the 1929 level. The relative rise in UK prices in this period served substantially to diminish the impact of exchange rate changes on competitiveness.
The other major change in trade policy was the substantial extension of the protection of manufactures. Prior to 1931 protection had been limited to the narrow range of manufactured goods covered by the McKenna duties introduced in 1915 and the Safeguarding of Industry Act of 1921. Following the financial crisis in September 193 1 the short-term pressures for protectionism increased and this led to the emergency Abnormal Importations Act of November 1931, which was subsequently replaced by the Import Duties Act of February 1932. This provided a base rate on newly protected manufactured imports of 10 per cent, which could be raised on the recommendation of the newly established Import Duties Advisory Committee. The Committee soon recommended that most rates should be raised to 20 per cent and for a more limited category of commodities (which included many steel and chemical products) it should be 33i per cent. These rates were further increased as a result of subse- quent recommendations in 1933 and 1934.
Calculation of the incidence of the tariff depends on the volume of manufacturing imports charged duty at each rate. By using a base year which is prior to the introduction of the tariff it is possible to calculate the rate of duty that would have been levied on the pre-protection volume of imports. This method thus takes into account those imports that were dis- couraged by the tariff as well as those that were imported with the duty paid. The average rates of duty estimated using this approach are presented in Table 2.
One effect of increasing the level of protection was similarly to increase the level of Imperial Preference. The UK had first given preference to its colonies through the Finance Act of 1919, preferences which were later extended in 1925. The major shift in Imperial Preference, however, followed the extension of protection in 1932. The government wished not only to expand the domestic economy but also to increase Empire trade. Thus full use was,made of the new legislation to increase Imperial Prefer- ence. The Empire countries were exempt from the emergency tariff legs- lation of 1931 and temporarily exempt from the 1932 Import Duties Act
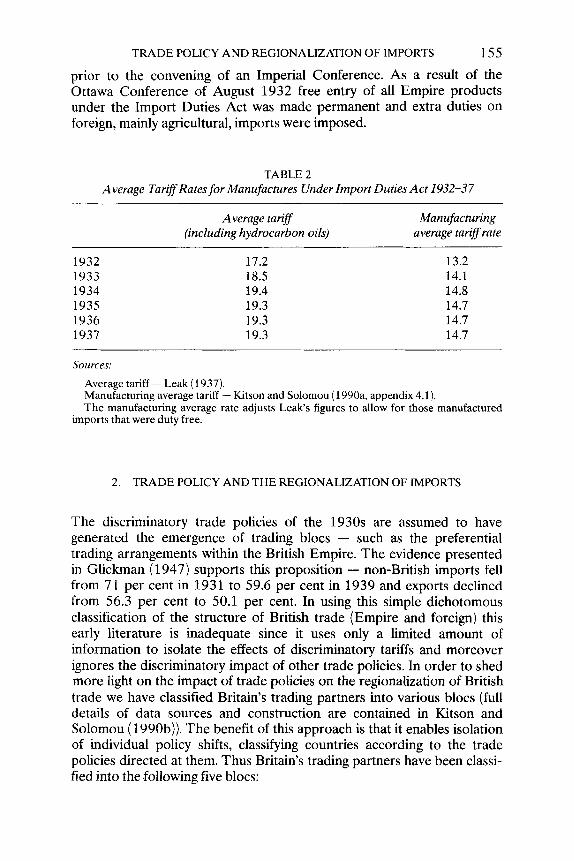
TRADE POLICY AND REGIONALIZATION OF IMPORTS 155 prior to the convening of an Imperial Conference. As a result of the Ottawa Conference of August 1932 free entry of all Empire products under the Import Duties Act was made permanent and extra duties on foreign, mainly agricultural, imports were imposed.
TABLE 2 Average Tariff Rates for Manufactures Under Import Duties Act 1932-37
Average tariff Manufacturing (including hydrocarbon oils) average tariff rate
1932 1933 1934 1935 1936 1937
17.2 18.5 19.4 19.3 19.3 19.3
13.2 14.1 14.8 14.7 14.7 14.7
Sources:
Average tariff - Leak (1937). Manufacturing average tariff - Kitson and Solomou (1990~1, appendix 4.1). The manufacturing average rate adjusts Leaks figures to allow for those manufactured
imports that were duty free.
2. TRADE POLICY AND THE REGIONALIZATION OF IMPORTS
The discriminatory trade policies of the 1930s are assumed to have generated the emergence of trading blocs - such as the preferential trading arrangements within the British Empire. The evidence presented in Glickman ( 1947) supports this proposition - non-British imports fell from 71 per cent in 1931 to 59.6 per cent in 1939 and exports declined from 56.3 per cent to 50.1 per cent. In using this simple dichotomous classification of the structure of British trade (Empire and foreign) this early literature is inadequate since it uses only a limited amount of information to isolate the effects of discriminatory tariffs and moreover ignores the discriminatory impact of other trade policies. In order to shed more light on the impact of trade policies on the regionalization of British trade we have classified Britain’s trading partners into various blocs (full details of data sources and construction are contained in Kitson and Solomou (1990b)). The benefit of this approach is that it enables isolation of individual policy shifts, classifying countries according to the trade policies directed at them. Thus Britain’s trading partners have been classi- fied into the following five blocs:
156 BULLETIN OF ECONOMIC RESEARCH
(i) The British countries, who were favoured by Imperial Preference and devalued early with Britain$
(ii) The Gold Bloc economies who were faced with tariffs and a competi- tive devaluation disadvantage;
(iii) The major ‘core’ industrial competitors (Germany and America) who were mainly affected by the General tariff since they devalued early in the 1930s (America) or practised a dual exchange rate regime (Germany);
(iv) The non-British countries who negotiated favourable trade agree- ments and devalued early;3 and
(v) The rest of the world group, which is taken to include all countries not belonging to one of the above blocs:
This broad classification has a number of advantages over a simple dichotomous classification. Firstly by allowing us to divide foreign countries into exchange rate zones we can isolate a further important determinant of Britain’s trading patterns. If tariffs and devaluation were both important influences on British trade we should observe a clear rank- ing in the changes in the shares of imports from the different blocs. Secondly, the classification of countries into trade agreement countries and others allows us to distinguish whether trade agreements stimulated trade both with the Empire and non-Empire countries participating in these arrangements. Finally the category of the rest of the world is important in that it consists of many countries at a similar stage of develop- ment to the Empire countries. Thus it may be possible to isolate the influ- ence of the pattern of world development on British trading patterns.
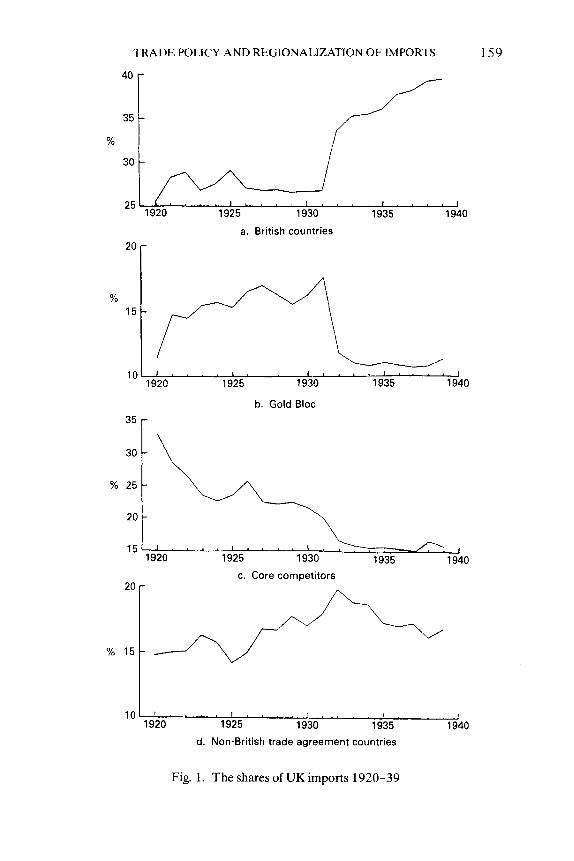
Figure 1 shows the share of total imports from all five bloc^'.^ In order to evaluate the effects of the policy regime changes of 1931-32 we have
2The main trading nations in this group were Australia, New Zealand, Canada, India, Ceylon and South Africa.
3These treaties were signed between 1933 and1935 by Argentina, Denmark, Norway, Sweden, Finland and Poland.
The major trading countries in this group were Spain, Czechoslovakia, China, Japan, Egypt, Brazil, Uruguay and Russia.
’A similar exercise was undertaken for export shares. The share of British countries did rise in the 1930s relative to the 1920s but it would be incorrect to attribute all of the observed rise to Imperial Preference. Some of the gain of British countries was the result of factors not related to lmperial Preference. For example, British countries and Germany and America saw a rise in export shares in the 1930s relative to the 1920s. In contrast the Gold Bloc economies saw a fall in export shares. Moreover, the biggest losses in the Foreign countries category is observed in the rest of the world group. The decline in export shares to this type of economy can be viewed as the result of the import substitution policies being pursued by these countries - stimulating their exports and reducing their imports - and not the result of Imperial Preference. Thus, only a proportion of the rising export share to British countries can be attributed to the effect of Imperial Preference.
It should be noted that an evaluation of export shares is limited by the lack of information on foreign incomes and foreign trade policies which will influence the destination of UK exports. This is not a problem with the import data as it overcomes income and relative price effects by evaluating changes in the share of UK imports.

TRADE POLICY AND REGIONALIZATION OF IMPORTS 157 estimated OLS regression trends for import shares for the three periods, 1920-31,1924-31 and 1931-37. To describe the observed changes after the policy shifts in 1931 we concentrate on the inter-period difference between 1924-31 and 1931-37.6 Although the period 1920-3 1 provides more data for the earlier period the trend estimates may be biased by major trade adjustments following the end of the First World War. Further- more the period from 1924 best captures the period of exchange rate stability following the general restoration of the Gold Standard, moreover, for most of the blocs the choice of earlier period does not significantly affect the results. As can be seen from Table 3 the trend in the share of British countries increased by 1.53 percentage points per m u m between 1931 and 1937 while it fell by 0.23 percentage points per annum during 1924-3 1. Thus, allowing for the falling initial trend, the inter-period com- parisons show that the share of imports from British countries rose by 1.76 percentage points per annum during 1931-37. The share of the Gold Bloc fell by 0.8 1 percentage points per annum. The share of the core competi- tors also fell in the 1931-37 period; however, the underlying trend was negative throughout 1924-31 implying a deterioration of only 0.1 5 percentage points per year during the inter-period comparisons of 1924-31 and 1931-37. The non-British trade agreement countries saw an inter-period trend fall of 0.78 percentage points per annum, a magnitude comparable to the Gold Bloc economies. The rest of the world saw an improvement in trend of 0.26 percentage points per year.
Thus, although the relationship presented in Table 3 does not show a perfect ranking between changes in policy instruments and changes in import shares there exists a reasonable fit for much of the world economy. For example the share changes of British countries, the Gold Bloc and core competitors are consistent with the presence of tariff, devaluation and Imperial Preference effects. However, there are important anomalies that should guide us away from drawing simplistic inferences. The rest of the world group improved its share in British imports despite the adverse effect of the tariff (although a comparison with the period 1920-31 shows a very small fall in share), and the trade agreement countries showed a deterioration comparable to the Gold Bloc economies despite their more favourable competitive position. Such diverse behaviour implies that it is incorrect to argue that the gain of British countries was all due to Imperial Preference.’ Not only was there a rising trend for the share of imports from British countries between 1870 and 1937 (Capie (1983)) but the experi- ence of the rest of the world group shows that some of the gain in the share of British countries may be due to similar factors that are giving rise to an
‘ Given that the trend estimates are simply used to describe the data we have assumed a one tailed 95 per cent confidence test on the significance of the trend coefficient. Where the t-test is not significant we have assumed that the coefficient for the trend is equal to zero in the inter-period trend comparisons. ’ This is the implication of Glickman’s study of Imperial Preference (Glickman (1947)).

TA
BL
E 3
O
rdin
ary L
east
Squ
ares
Tre
nds i
n th
e Sh
ares
of U
K T
otal
Impo
rts,
Cur
rent
Pri
ces (
t-st
atis
tics i
n pa
rent
hesi
s)
Ann
ual %
chan
ge
fc)
(4
(e)
Inte
r-pe
riod
In
ter-
peri
od
tren
d tr
end
Tren
d coe
ffic
ient
Tr
end c
oeff
icie
nt
Tren
d co
effic
ient
di
ffer
ence
s di
ffer
ence
s Tr
adin
g blo
c fo
r 19
20-3
1 fo
r 192
4-31
fo
r 193
1 -37
c-
a
c-b
Brit
ish
coun
trie
s
Gol
d B
loc
- 0
.07
- (0
.79)
- 0
.23
1.53
+
1.53
+
1.76
-(
2.23
)*
(3.8
6)*
-
0.34
0.
17
-0.8
1 (4
.10)
* (1
.63)
- (2
.20)
*
V
1.15
-0
.81
5 m
Cor
e co
mpe
titor
s - 0
.83
- 0
.47
- 0
.62
+ 0.2
1
-0.1
5 - (4
.95)
* -(
2.36
)*
- (2
.96)
* F %
N
on B
ritis
h tr
ade
0.28
0.
45
- 0.
33
- 0.
6 1
-0.7
8 ag
reem
ent c
ount
ries
(4
.19)
* (3
.69)
* -(
2.15
)*
Res
t of
the
wor
ld
0.34
0.
1 1
0.26
- 0.
08
+ 0.2
6 (3
.28)
* (0
.82)
(2
.55)
*
*Sig
nific
ant a
t 95
per c
ent c
onfi
denc
e le
vel (
one-
taile
d te
st).
TRADE POLICY AND REGIONALIZATION OF IMPORTS 159
40
35
%
30
25
20
% 15
10
1920 1925 1930 1935 1940
a. British countries
1920 1925 1930 1935 1940
b. Gold Bloc
35 r
30 -
% 2 5 -
20 -
J 1920 1925 1930 1935 1940
c. Core competitors
Fig. 1. The shares of UK imports 1920-39
160 BULLETIN OF ECONOMIC RESEARCH
1 0 L ' " ' ' I " " 1 ' " " 1 1920 1925 1930 1935 1940
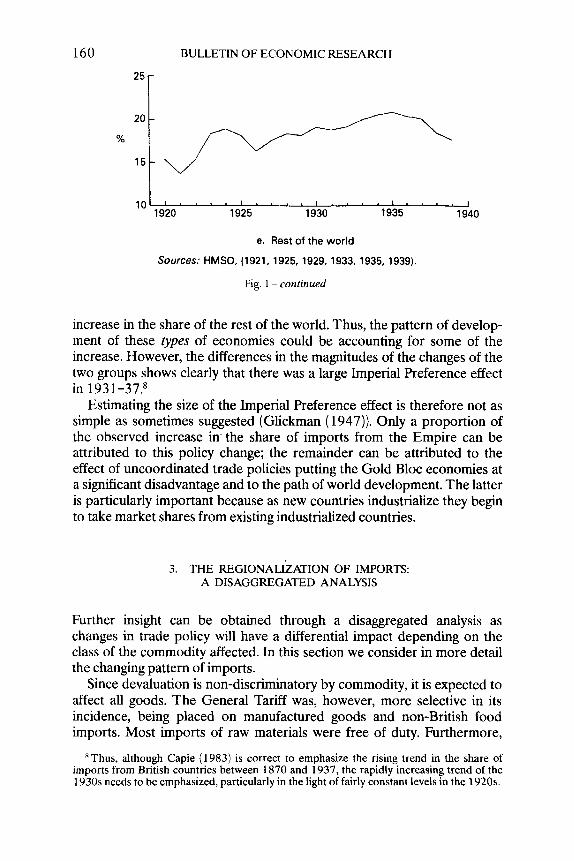
e. Rest of the world
Sources: HMSO, (1921, 1925, 1929, 1933, 1935, 1939).
Fig. 1 - continued
increase in the share of the rest of the world. Thus, the pattern of develop- ment of these types of economies could be accounting for some of the increase. However, the differences in the magnitudes of the changes of the two groups shows clearly that there was a large Imperial Preference effect in 1931-37.*
Estimating the size of the Imperial Preference effect is therefore not as simple as sometimes suggested (Glickman (1947)). Only a proportion of the observed increase in- the share of imports from the Empire can be attributed to this policy change; the remainder can be attributed to the effect of uncoordinated trade policies putting the Gold Bloc economies at a significant disadvantage and to the path of world development. The latter is particularly important because as new countries industrialize they begin to take market shares from existing industrialized countries.
3. THE REGIONALI~ATION OF IMPORTS: A DISAGGREGATED ANALYSIS
Further insight can be obtained through a disaggregated analysis as changes in trade policy will have a differential impact depending on the class of the commodity affected. In this section we consider in more detail the changing pattern of imports.
Since devaluation is non-discriminatory by commodity, it is expected to affect all goods. The General Tariff was, however, more selective in its incidence, being placed on manufactured goods and non-British food imports. Most imports of raw materials were free of duty. Furthermore,
Thus, although Capie ( 1 983) is correct to emphasize the rising trend in the share of imports from British countries between 1870 and 1937, the rapidly increasing trend of the 1930s needs to be emphasized, particularly in the light of fairly constant levels in the 1920s.
TRADE POLICY AND REGIONALIZATION OF IMPORTS 16 1 -
:; _ _ _ - - - , I , I
1 . , - I.
I -. - .... * - ~
- I . . . , . . ........ . . , . : - - j _ . . . . 4. - . .. , . . ,---' .... - . . .
I I I . . I . . , . l . . . . I . . . .
50
45
Categories 40 1 and 2
% 35 30
25
20
25
15 20 Category % 1
10
5
Categories 1 and 2
%
Categories 1 and 2
%
11 r
,. I .
-4
40
35
30 Category 2 25 %
5'i9;o' ' ' ' 1925 ' ' ' ' ' 1930 ' ' ' ' ' 1935 ' ' ' ' 1 9 4 b ~ ~ b. Gold Bloc
3 5 r 45 1 35 45
- 40 30 - '
' :c. _... : 2 5 - \-- . L S * * ,,
20
10
- - _. . . . .
Category 3 %
35 -
q. , , .
I - . .. ,, \
, . -
. , ' . 1
. . ., . 30
, . _ _ - - - _ _ 15 l-.. - ,>--LA -
-
25 5 L i 9 z o ' ' ' ' 1925 ' ' ' ' ' 1930 ' ' ' ' 1935 ' ' ' 1940
c. Core competitors
30 -
25 Category 3
20 35
30
- % - -
15
10
- -
-
25 5 L i 9 z o ' ' ' ' 1925 ' ' ' ' ' 1930 ' ' ' ' ' 1935 ' ' ' ' 1940
c. Core competitors
30 10 - - - 9 25 -
Categories
- 6 . .__. . . . --.. ';- -1 .:--. -.... ..-.
5 .....
10 " " ' " " ~ ~ " ' ' ' ' ' ' '
1920 1925 1930 1935 1940
d. Non-British trade agreement countries
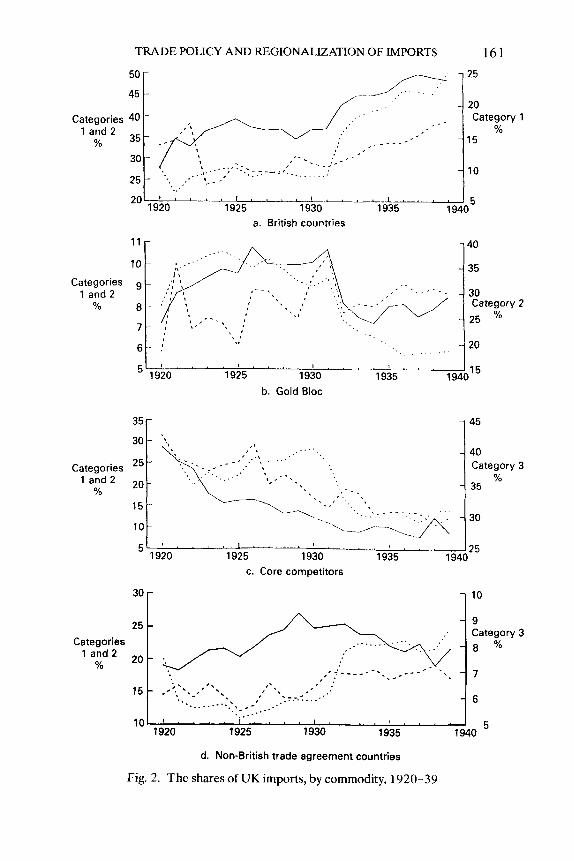
Fig. 2. The shares of UK imports, by commodity, 1920-39

162 BULLETIN OF ECONOMIC RESEARCH
35 r 30
Categories
% 1 a n d 2 25-
20
1 25 .. . . . , . .
. . .. ' - 2 0 , - -_
- - - . : , . ---. - - _ . . I
., I --, I .
, ' . _ _ I
- , I , I , I
-: . Category 3 %
- -
e. Rest of the world
Key
- Category 1 - Food, drink and tobacco
_ - _ _ Category 2 - Raw materials
_ _ _ _ Category 3 - Manufactures
Sources: HMSO, (1921, 1925, 1929,1933,1935, 1939)
Fig. 2 - continued
given the high degree of import substitution that is possible in manufactur- ing, we would expect that the shares of manufacturing imports would be most sensitive to trade policy changes. The diverse categories of trading blocs thus increases the number of useful comparisons significantly.
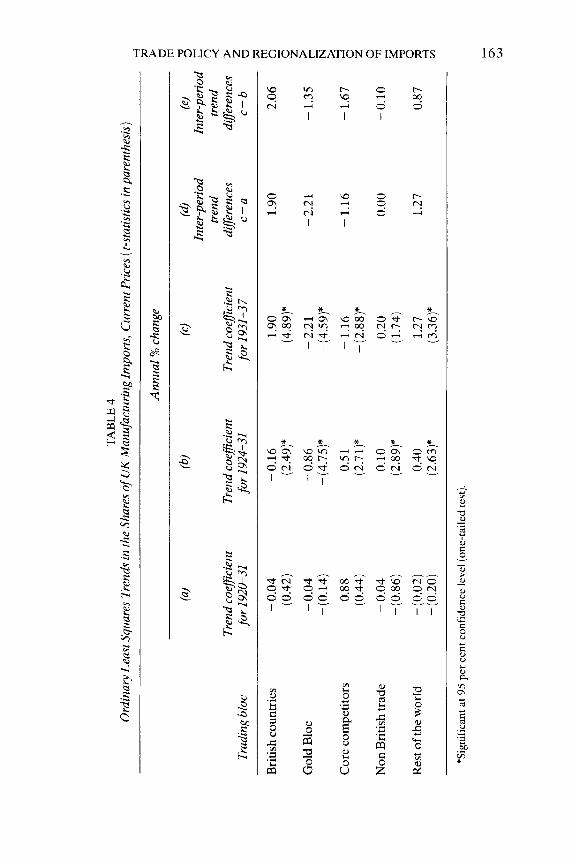
The behaviour of the shares of manufacturing imports (see Figure 2) is the most important indicator of the effect of tariffs given the relatively high price elasticity of demand for manufactures and the high degree of import substitution that is possible. Table 4 shows that the British countries' inter- period trends grew by 2.1 percentage points per annum during 1931-37 relative to 1924-31. The Gold Bloc and core competitors saw trend changes of - 1.35 and - 1.67 per cent per annum, respectively. The non- British trade agreement countries managed to sustain their shares, improv- ing their position relative to the Gold Bloc and the core competitors. The rest of the worid group gained significantly in manufactures, improving an already rising trend between 1924 and 1931 by nearly one percentage point per annum.
The pattern of manufacturing import shares observed in Table 4 presents a fairly consistent picture for distinguishing the impact of the tariff, as against devaluation. For example, the Gold Bloc economies in fact were not as adversely affected as the core competitors: despite their
"Table 4 shows that during 1931-37 the decline of the share of the Gold Bloc countries was greater than the core competitors. However, it would be misleading only to look at the 1930s since the underlying trends of the 1920s were so different.
TRADE POLICY AND REGIONALIZATION OF IMPORTS
w m
N 3 9 c ?
I
0 "
3 c I R c !
I
t. \ s z 4 0 I I
164 BULLETIN OF ECONOMIC RESEARCH
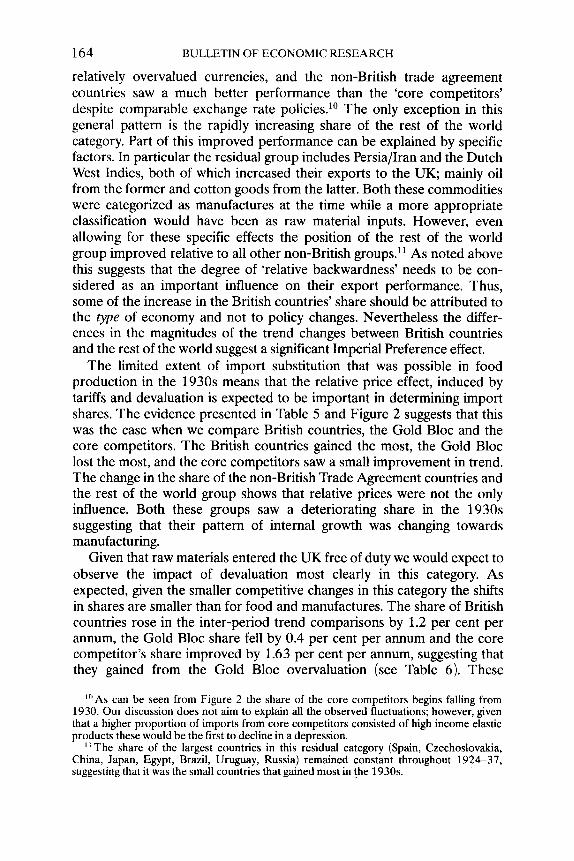
relatively overvalued currencies, and the non-British trade agreement countries saw a much better performance than the 'core competitors' despite comparable exchange rate policies.1° The only exception in this general pattern is the rapidly increasing share of the rest of the world category. Part of this improved performance can be explained by specific factors. In particular the residual group includes Persia/Iran and the Dutch West Indies, both of which increased their exports to the UK; mainly oil from the former and cotton goods from the latter. Both these commodities were categorized as manufactures at the time while a more appropriate classification would have been as raw material inputs. However, even allowing for these specific effects the position of the rest of the world group improved relative to all other non-British groups." As noted above this suggests that the degree of 'relative backwardness' needs to be con- sidered as an important influence on their export performance. Thus, some of the increase in the British countries' share should be attributed to the type of economy and not to policy changes. Nevertheless the differ- ences in the magnitudes of the trend changes between British countries and the rest of the world suggest a significant Imperial Preference effect.
The limited extent of import substitution that was possible in food production in the 1930s means that the relative price effect, induced by tariffs and devaluation is expected to be important in determining import shares. The evidence presented in Table 5 and Figure 2 suggests that this was the case when we compare British countries, the Gold Bloc and the core competitors. The British countries gained the most, the Gold Bloc lost the most, and the core competitors saw a small improvement in trend. The change in the share of the non-British Trade Agreement countries and the rest of the world group shows that relative prices were not the only influence. Both these groups saw a deteriorating share in the 1930s suggesting that their pattern of internal growth was changing towards manufacturing.
Given that raw materials entered the UK free of duty we would expect to observe the impact of devaluation most clearly in this category. As expected, given the smaller competitive changes in this category the shifts in shares are smaller than for food and manufactures. The share of British countries rose in the inter-period trend comparisons by 1.2 per cent per annum, the Gold Bloc share fell by 0.4 per cent per annum and the core competitor's share improved by 1.63 per cent per annum, suggesting that they gained from the Gold Bloc overvaluation (see Table 6). These
"'As can be seen from Figure 2 the share of the core competitors begins falling from 1930. Our discussion does not aim to explain all the observed fluctuations; however, given that a higher proportion of imports from core competitors consisted of high income elastic products these would be the first to decline in a depression.
"The share of the largest countries in this residual category (Spain, Czechoslovakia, China, Japan, Egypt, Brazil, Uruguay, Russia) remained constant throughout 1924-37, suggesting that it was the small countries that gained most in the 1930s.

TA
BL
E 5
Ord
inar
y Lea
st S
quar
es T
rend
s in
the S
hare
s of
UK
Foo
d Im
port
s, C
urre
nt P
rice
s ( t-
stat
istic
s in
pare
nthe
sis)
1 %
fa)
(b)
(4
(4
(4
8 A
nnua
l % ch
ange
Inte
r-pe
riod
In
ter-
peri
od
tren
d tr
end
Tren
d coe
ffic
ient
Tr
end
coef
ficie
nt
Tren
d co
effic
ient
di
ffer
ence
s dg
eren
ces
$ Tr
adin
g blo
c fo
r 192
0-31
fo
r 192
4-31
fo
r 193
1-37
c-
a
c-b
U
Brit
ish
coun
tries
0.
47
- 0
.31
1.74
+
1.27
+1
.74
2 G (2
.10)
* -(
1.76
) (6
.15)
* 9 > E 2
- (7
.48)
* - (5
.92)
* - (2
.05)
* z
Gol
d B
loc
0.22
0.
08
- 0.
32
- 0
.22
0.00
Cor
e co
mpe
titor
s - 1
.44
- 0
.73
- 0.
32
+ 1.
12
+0.4
1 o
(4.5
4)*
(1.2
5)
-(1.
67)
Q
Non
Brit
ish
trad
e 0.
70
agre
emen
t cou
ntrie
s (7
.58)
*
Res
t of t
he w
orld
0.
15
( 1.4
0)
?I 52 8
0.75
- 0.
67
- 1
.37
- 1
.42
(3.7
5)*
-(4.
65)*
0.31
-
0.45
- 0.
45
-0.7
6 (2
.46)
* -
(4.2
0)*
GI
*Sig
nific
ant a
t 95
per c
ent c
onfi
denc
e le
vel (
one t
aile
d te
st).

TA
BL
E 6
O
rdin
ary L
east
Squ
ares
Tre
nds i
n th
e Sha
res
of U
K R
aw M
ater
ial I
mpo
rts,
Cur
rent
Pri
ces (
t-st
atis
tics i
n par
enth
esis
)
Ann
ual X ch
ange
(c)
(4
(4
Inte
r-pe
riod
In
ter-
peri
od
tren
d tr
end
Tren
d co
efic
ient
Tr
end
coef
ficie
nt
Tren
d co
e@ci
ent
diffe
renc
es
diffe
renc
es
Trad
ing
bloc
fo
r 192
0-31
fo
r 192
4-31
fo
r 193
1-37
c-
a c-
b
Bri
tish c
ount
ries
- 0
.48
0.41
1.
20
+ 1.
20
+ 1.2
0 -(
1.45
) ( 1
.62)
(9
.61)
*
Gol
d B
loc
Cor
e co
mpe
titor
s
w
0.20
0.
40
- 0.
73
0.00
-0
.40
5 ie
(1.8
4)
(2.6
2)*
- (0
.40)
c)
- (4
.64)
* -(
3.83
)*
-(1.
60)
F - 1
.12
- 1.
63
- 0
.66
+ 1.
12
+1.
63
x Q N
on B
ritis
h tr
ade
0.1
1
0.55
- 0
.02
0.00
-
0.55
ag
reem
ent c
ount
ries
(0.7
9)
(2.3
3)*
- (0
.23)
Res
t of t
he w
orld
1.
35
0.27
- 0
.32
- 1
.35
0.00
(3
.55)
* (0
.72)
-(
1.25
)
*Sig
nific
ant a
t 95
per c
ent c
onfi
denc
e le
vel (
one-
taile
d te
st).

TRADE POLICY AND REGIONALIZATLON OF IMPORlS 167
patterns are consistent with a devaluation effect. The deterioration in the performance of the non-British trade agreement group, even relative to the Gold Bloc, may be due to the increasing internal demands for raw materi- als.12 Similarly the rest of the world group made little gain in raw material shares because of the demands of domestic import substitution,13 a point that is more prominent if comparison is made with the period 1920-3 1.
CONCLUSIONS
The 1930s saw significant changes in the regionalization of British imports. A comparison of import shares of various trading blocs indicates that the policies of protectionism, Imperial Preference and devaluation had significant and distinguishable effects. A study of manufacturing import shares suggests that the impact of the General Tariff is more discernible than the effects of devaluation. Of course, it would be wrong to attribute all the changes in manufacturing import shares to specific policies. The behaviour of the share of the rest of the world group shows that the stage of development of economies was also having an important effect. Although we have focused on manufacturing imports the results for food and raw materials are also informative. As expected, the impact of devaluation is clearest in raw material imports but the changes in shares were smaller than those observed for manufacturing and food. In any case the results for food and raw materials should be seen as tentative. Imports of these commodities are less likely to respond to policy changes; domestic import substitution is limited by resource availability and trade substitu- tion between trading groups is likely to be similarly constrained. Further- more the internal demand for such commodities, particularly raw materials, will be influenced by the stage of economic growth of particular blocs.
Department of Applied Economics and Faculty of Economics, University of Cambridge.
Invited paper, final version received
August 1990
REFERENCES
Board of Trade (annual), Journal. Capie, F. (1983). Depression and Protectionism: Britain Between the Wars,
London, George Allen and Unwin.
' ? Many of these economies were performing well in the recovery of the 1930s. '"Countries like Japan and Brazil were undergoing a period of trend accelerated
economic growth from the 1930s.

168 BULLETIN OF ECONOMIC RESEARCH
Dimsdale, N. H. (1981). ‘British Monetary Policy and the Exchange Rate 1920-38’, in Eltis, W. and Sinclair, P. (eds.), The Money Supply and the Exchange Rate, Oxford, Oxford University Press.
Feinstein, C. H . (1972). National Income, Expenditure and Output of the United Kingdom, 1855-1%5, Cambridge, Cambridge University Press.
Glickman, D. L. (1947). ‘The British Imperial Preference System’, Quarterly Journal of Economics, Vol. 6 1.
HMSO (1921, 1925, 1929, 1933, 1935, 1939). Annual Statement of Trade of the United Kingdom.
Kindleberger, C. P. (1956). The Terms of Trade: A European Case Study, New York, MIT.
Kitson, M. and Solomou, S. (1990a). Protectionism and Economic Revival: The British Interwar Economy, Cambridge, Cambridge University Press.
Kitson, M. and Solomou, S. (1990b). ‘The Interwar Trade.Dataset: A Guide to the Statistics, Sources and Definitions’, Department of Applied Economics, Cambridge (available from the ESRC data archive).
Leak, H. (1937). ‘Some Results of the Import Duties Act’, Journal of the Royal Statistical Society, Vol. C, Part 1V.
London and Cambridge Economic Service (monthly). BuZletin. MacDougall, D. and Hutt, R. (1954). ‘Imperial Preference: A Quantitative
Mitchell, B. R. (1980). European Historical Statistics 1750-1970, London, ’ Macmillan.
Mitchell, B. R. ( 1982). International Historical Statistics: Africa and Asia, London, Macmillan.
Mitchell, B. R. ( 1983). International Historical Statistics: The Americas and Australasia, London, Macmillan.
Redmond, J. (1980). ‘An Indicator of the Effective Exchange Rate of the Pound in the Nineteen-thirties’, Economic History Review, Vol. 33.
Rooth, T. J. T. ( 1986). ‘Tariffs and Trade Bargaining: Anglo-Scandinavian Economic Relations in the 1930s’, Scandinavian Economic History Review, Vol. 34.
Svennilson, I . (1954). Growth and Stagnation in the European Economy, Geneva, Economic Commission for Europe.
Analysis’, Economic Journal, Vol. 64.
Copyright © 2022 FDOKUMEN