
Standard, reputation and trade : evidence from US horticultural imports refusals
43
LICOS Discussion Paper Series Discussion Paper 281/2011 Standard, Reputation and Trade: Evidence from US horticultural imports refusals Marie-Agnès Jouanjean Katholieke Universiteit Leuven LICOS Centre for Institutions and Economic Performance Waaistraat 6 – mailbox 3511 3000 Leuven BELGIUM TEL:+32-(0)16 32 65 98 FAX:+32-(0)16 32 65 99 http://www.econ.kuleuven.be/licos
Transcript of Standard, reputation and trade : evidence from US horticultural imports refusals

LICOS Discussion Paper Series
Discussion Paper 281/2011
Standard, Reputation and Trade:
Evidence from US horticultural imports refusals
Marie-Agnès Jouanjean
Katholieke Universiteit Leuven LICOS Centre for Institutions and Economic Performance Waaistraat 6 – mailbox 3511 3000 Leuven BELGIUM TEL:+32-(0)16 32 65 98 FAX:+32-(0)16 32 65 99 http://www.econ.kuleuven.be/licos

1
Standards, Reputation and Trade:
Evidence from US horticultural import refusals
Marie-Agnès JOUANJEAN1
LICOS Centre for Institutions and Economic Performance – K.U.Leuven &
GEM Groupe d’Economie Mondiale – Sciences Po
This version: March 2011
Abstract
This paper investigates the impact of food safety standards promulgated by governments or imposed by buyers from the private sector on the capacity of developing countries to access developed countries’ markets for high value agricultural and food products. I offer an analysis that disentangles productivity-sorting from quality-sorting in fresh fruits and vegetables exports. My theoretical model and empirical analysis confirms the importance of taking into consideration importers' preference for quality as well as exporters' capacity to produce quality products when analyzing average export unit prices of fresh fruits and vegetables. Thanks to a new database on U.S import refusals, my empirical analysis shows that a shock to reputation seems to have a downgrading effect, reducing the capacity of countries to export quality products.
JEL: F13 – O13 – Q17
Keywords: SPS – Agricultural Trade – Quality-sorting – Reputation
1My sincere thanks to Ben Shepherd for his ground breaking comments. I am grateful to Thierry Mayer and Marc Melitz for their guidance and advice. Comments are welcomed and can be addressed to: [email protected]

2
1 Introduction
In the debate over trade liberalization and development, part of the discussions about the
access of developing countries agricultural products to developed countries markets switched
from tariff issues to the effective capacity of developing countries to export their products.
Living aside the debate over such export strategy for food scarce countries, Non Tariff
Barriers (NTBs) and in particular Sanitary and Phytosanitary (SPS) measures are today
recognized as an important impediment to such trade. However, there is a pending question
regarding impact of food safety standards promulgated by governments or imposed by buyers
from the private sector. Their effects on the capacity for developing countries to access
developed countries’ markets for high value agricultural and food products is a vivid research
theme that up-till-now provided mixed results. While some advocates that food safety
standards undeniably hamper exporting abilities, others present evidence that they can also
stimulate and enable competitiveness (Jaffee and Hanson, 2005).
There has been since the 80s an increasing interest in the promotion in developing
countries for the production of Non-Traditional Agricultural Exports2. On the one hand,
governments and international development agencies thought they would be a good
alternative in the context of the deterioration of conditions in international markets for
traditional exports. On the other hand, the increasing demand for year round access to
horticultural products in developed countries provided good grounds for supporting the
development of such new market opportunities. But in conjunction with the increase of fresh
fruits and vegetables (hereafter FF&V) imports from developing countries, the last two
decades have witnessed and enhanced awareness of food safety issues in developed countries.
While the latter have in reaction implemented a growing set of new regulations, the former
had to align their production processes in order to secure their exports. Traditional trade
2 In opposition to traditional agricultural export crops like coffee or bananas.
3
barriers such as tariffs are less instigated to deal with this specific issue and so non-tariff
measures flourished with the aim, conceptually at least, to satisfy a certain level of quality
and safety of agricultural products.
The increased use of Sanitary and Phyto-sanitary (SPS) measures toward agricultural
products has been largely documented by the literature, and their impacts can be split in two
different types of outcomes that are after all two sides of the same coin. First, so as to survive
international competition, firms from developing countries must evolve and take full account
of new regulations on food safety implemented in developed countries.3 In particular, the
demand for quality from consumers in developed countries is exerting increased pressure on
producers from developing countries to transform their processes in order to be eligible to
export. Eligibility is generally acquired through a certification procedure sanctioning the
implementation of defined quality standards. Secondly, if a given producer qualifies for these
standards, we can expect that there is a reputation effect that robustly ties the trade
relationship over time. One of the central concerns in the literature is about the capacity of
developing countries and in particular of smallholders to develop and sustain their exports to
developed countries in such context of increasingly stringent food safety standards and the
ever more frequent requirement for certification. However, standards should not necessarily
be viewed as an impediment to trade and development for producers in developing countries.
Some even argue that food safety standards can serve as a “catalyst for realizing pro-poor
export-led growth in developing countries” (Maertens and Swinnen, 2006).
Many studies analyse the effect of new SPS measures on predicted trade flows with an
ex-ante approach (Otsuki et al 2001). Even though the conclusions of such ex-ante
approaches could be nuanced in many ways, they nonetheless highlight the potential trade
exclusion effect of those measures. Yet, too few studies adopt an ex-post analysis posture.
3 We make use of both terms producer and firm and use them as identical terms.

4
Such an approach was at the time rendered impossible because of the lack of data on the
implementation of SPS measures in world trade..4
In Europe, following various food scares and related events, public as well as private
standards have been strengthened through new regulations along with the development of
private certifications and codes of practice that are usually far more burdensome than public
regulations. Private standards are still very much heterogeneous around the world and
particularly in the two biggest destinations of developing countries’ FF&V exports, namely
the US and the EU. In this line, Jaffee and Masakure (2005) emphasize this heterogeneity
between and within EU countries, along various distribution channels and market segments,
according to consumer preferences but also to patterns of fresh product purchases and
distribution. Supermarket chains in the UK generally require high standards and food safety
compliance – in particular when considering the growing importance of pre-packs and other
high care products – but other FF&V segments are governed by very different standards.
Jaffee and Masakure (2005) take the examples of ethnic but also food services and restaurant
supply chains for which the predominant consideration remains price and continuity. As for
the US, even though supermarket chains tend to follow the same path as EU retailers, the
supply of FF&V in bulk through brokers is still widely used (Hanson and Blandon, 2009).
Moreover, there is no sign of a convergence process among supermarket chains as there has
been in the EU with the EurepGAP followed by the GLOBALGAP certification process.
Both heterogeneity and volatility of US supermarkets’ codes of practice is one other intricacy
for developing country suppliers to develop and access what is referred to as “High Care”
markets to the US.
4 Disdier et al. (2007) were able to conduct a study on the effect of Non Tariff Measures (NTBs) relying on WTO members’ notifications of SPS and Technical Barriers to Trade (TBTs). However, it has frequently been underlined that WTO members only have the obligation to notify changes to SPS measures since 1995. Thus WTO notifications are a good tool in order to consider changes in exporting countries SPS environment, but they can not be used as a strict proxy for an actual barrier level. Studies pinpoint the high level of aggregation of such a database and above all the lack of information concerning many important bilateral restrictions.

5
The increasing role of private standards in the EU, and to another extent in the US, along
with the evolution of consumer demand, the reduction in transport costs and the subsequent
increase in competition have triggered the development of new strategies among suppliers in
developing countries. The case of Kenyan FF&V exporters is a very famous example of this
adaptation to new market conditions (Jaffee and Masakure 2005). In the late 80’s, only 10%
of the Kenyan French bean production was sold directly to supermarket chains in Europe.
The rest was sold in bulk through wholesale markets or distributors. With the increase in
competition in the European market because of the diversification of supplying origins and
the subsequent downward pressure on wholesale prices, sales of loose products became
marginally profitable. This has created an incentive for the pursuit of product innovation and
quality. During the 90’s, even though export quantities did not increase much, export value
grew along with the proportion of pre-packed products directly exported to supermarkets.
This export strategy intensified during the following decade with the development and
diversification of such pre-packs including semi-processed “high-care” products such as
mixed salads, and assortments of cut vegetables produced under highly severe hygienic
conditions. According to Jaffee and Masakure (2005), this shift of strategy toward value-
added processing and packaging allowed for a three-fold increase of Kenya’s export value,
from 1000 US$ per ton in the early 1990s to 3000 US$ per ton. Even though trade in bulk
still represents an important component of Kenyan exports in order to cover their costs, this
shift provides further evidence of the need to satisfy consumers’ need for increased value-
added agricultural products and their willingness to pay a premium. Peru is another well
known example. Even though the country benefits form favourable conditions for the
production of winter vegetables for export to high income countries, high transport costs
prevented any price competition with other suppliers. Thus they adopted a high quality
strategy that not only allowed them to become competitive in such markets but also generated

6
increased “client loyalty”. Such strategy reduced the risk of trade disruptions due to erratic
and irregular quality. In other words, this trend created good reputation.
These observations support the hypotheses of this paper that not only quality but also
reputation is a determinant of the pattern of FF&V exports. Quality, captured in this paper by
prices, has two dimensions. Firstly, I assume two levels of quality, roughly relying on this
differentiation between bulk exports – for which a buyer/consumer’s prime concern will be
set on prices – and high care products – for which a buyer’s prime concern will be set on
safety, reliability and value-added attributes. Secondly, I introduce a reputation parameter
that will impact the whole country’s export sector, whether firms export in bulk or high care
products. This echoes the notion of reputation highlighted by the case of Peru.
One crucial aspect of the paper is thus to provide grounds for the fact that agricultural
products are much like industrial products in the way that consumers are looking for quality
and safety and that producers must adapt to these needs. It also inquires whether preferences
for quality on the one side and reputation effects on the other are upholding the capacity of
producers of agricultural products in developing countries to export to developed countries.
As such, this paper is a contribution to the recent literature on the relationship between
quality and trade. Therefore, this paper will address the question of the sensitivity of FF&V
exports to both quality and reputation shocks. Its novelty lies in emphasizing the need to
consider the reputation effect of producing quality. This notion is discussed in the next
section. In the third section I empirically investigate a simple productivity sorting model of
FF&V exports. The fourth section develops a new framework that endogenizes quality and
allows for both quality sorting and productivity sorting of exports in the same export market.
The corollary is that it allows for firms to produce according to either productivity sorting or
quality sorting. This framework integrates heterogeneity in the capacity exporting countries
to produce quality and in consumers’ preference for quality and moreover introduces the
existence of a reputation effect. Section five looks at the empirical analysis of that model by
7
making use of a new dataset on import refusals. Section six sets out conclusions and potential
policy implications.
2 Alerts and the notion of reputation
Experience of Guatemala and the Dominican Republic
Usually, as little as 1% of food import shipments are inspected by the Food and Drug
Administration (FDA) at the port of entry (Buzby et al. ,2008). But if a product or an
exporter (country or firms) repeatedly violates US regulations or poses risks in terms of SPS
issues, the FDA will raise the level of surveillance, creating an “Alert” and implementing an
“Automatic Detention” (AD) or a “Detention Without Physical Evidence” (DWPE) system.
As a consequence, products for which an alert is implemented are subject to scrutiny at the
border. This system of AD and DWPE has first been implemented in the late 80s. This period
witnessed simultaneously an increase in imports of horticultural products in the US market
and rising food safety concerns on the part of US consumers and authorities. Thus, aside from
detentions due to different pest outbreaks, the increasing attentiveness to food safety and in
particular to pesticide residues led to the implementation of AD and alerts for various
countries and products for which many violations had been observed.
In the case of an alert, the surveillance of products is increased by compulsory detention
and the burden of proof that the shipment is compliant is transferred to the exporter. This has
created delays in the US market and new risks for the importer distribution chain. Under
DWPE, exporters that are able to send products complying with the US legislation five times
in a row (re)gain access without automatic detention. However, exporters continue to be
submitted to a higher level of potential controls. This sequence of controls illustrates the
importance of earnestness in order to ensure a continuous capacity to export over time. As
Baylis et al. (2009) point out; the limited resources of the FDA can lead inspections to be
path dependant, by continuously focusing on products and/or producers that encountered

8
problems in the past. Thus, it seems fair to say that a newcomer in the exporter community
faces lower probability of refusals. Along this line, Buzby et al (2008), confirmed the
existence a strong correlation between refusals and FDA alerts. FDA inspections and as a
consequence refusals are clearly biased against exporters or countries holding a record of risk
of their food exports
Different case-studies in Central America have emphasized the immediate effects of such
regulations on trade flows and the risk of market disruption of which Guatemala and the
Dominican Republic are two famous examples. The introduction of NTAXs – non-traditional
agricultural export crop5 – in the Dominican Republic and Guatemala brought new
production technologies and new demands of aesthetic and grade qualities that resulted in an
intensive use of chemical inputs. At first, these aesthetic requirements, as a “Search” attribute
of quality, did not present specific information asymmetry issues. A survey among
participants in the US snow pea market indeed emphasized that Guatemalan smallholder
production, compared to large estate production in Mexico or in California, was much better
matched with the demand from US consumers (Julian, 2003). Along with the increased
awareness of food safety issues in the US from the end of the 80s, the massive use of
pesticides resulted in frequent shipment detention and refusals by US customs authorities
(FDA). The intensification of production and the overuse of pesticides also led to
phytosanitary crises causing temporary export bans6. During the same decade, the
Dominican Republic was among the first providers to the US market for some FF&V like
snow peas, eggplant or cantaloupe. But in 1987/1988, the FDA issued a countrywide alert for
pesticide residues. As the Dominican Republic was struggling with these new issues,
Guatemala was entering the NTAXs sector and rapidly replaced the Dominican Republic as
the leading provider for some of those FF&V. However, Guatemala rapidly met the same fate
5 In opposition to traditional agricultural export crops like coffee or bananas. 6 This was the case for Guatemalan snow peas in 1995

9
as the Dominican Republic, and was submitted to a countrywide alert in 1992. According to
Thrupp (1995), in the early 90s, 27.3 % of NTAXs shipments sampled from Guatemala were
detained. Between 1990 and 1994, 3,081 detentions of Guatemala's exports due to pesticide
residues resulted in a loss of a total of $17,686,000. This situation and the inability to address
SPS concerns have been highly detrimental to Guatemala’s relative competitive position in
the field of NTAXs.7 The sector was only in its infancy and some productions could not
recover from such a shock. Yet, although the Guatemalan raspberry export market had been
completely disrupted following a cyclospora outbreak crisis, the snow peas chain survived the
pesticides and pest outbreak crises, and in 2002 it regained its 1991 pre-crisis export volume.
Both Guatemala and the Dominican Republic are still today under countrywide alerts with
DWPE for some of their most successful non-traditional agricultural export crops. While
Guatemala is the main provider of snow peas to the US market, all these issues have
decreased Guatemalan competitiveness in the US market compared to its two biggest rivals,
Mexico and more recently Peru. Producers in both countries sell their production directly to
the food distribution chain whereas 80% of Guatemalan snow peas are sold through brokers
for half price (Hanson and Blandon, 2007). Between 2000 and 2006, average export unit
prices were 0.50 US$/kg to 0.70 US$/kg for Guatemala, compared to 1.20$/kg to 1.90$/kg
for Mexico and Peru.8
The notion of reputation and its measurement
The evolution from bulk FF&V trade to trade in high care products sold directly to
supermarkets changed the relationship between exporters and importers. Studies on food
scares and crises clearly highlighted an impact of such events on the whole sector. For
example, Jaud et al (2009) link food scares and supplier concentration in the EU market.
7 Guatemalan imports of fresh berries were also banned for the 1998 season and restored entry in 1999 because of suspicion of cyclospora outbreak (bacteria). 8 NBER trade database, Authors’ own calculation

10
Using a new database quite similar in structure to the one used here for the US, they show
that EU agro-food imports are vulnerable to food alerts in the EU market and that those
imports are more concentrated on a few suppliers for what they define as risky products.
However, it would be expected that high care products would reduce the risks of trade
disruption due to quality, food safety or disease issues. But what would happen if the
reputation parameter is not firm-specific but relates to the history of food scares between two
trading countries? The definition of reputation that is used in this paper draws from Tirole
(1996) who defines a collective reputation as an aggregate of individual reputations. Thereby,
the consumer uses the past behaviour of the member’s group to predict the individual firm's
future behaviour. As such, reputation is assumed to impact export value in various ways.
First, there is path dependency between the potential history of food safety crises related to
one country’s exports and import refusals. Second, even though over time one firm could
have built a relationship of trust with a buyer, it is the collective reputation of the exporting
country’s firms in one sector that will influence consumers’ rating of the product.
Alerts are known to be highly correlated with the probability of a shipment being
detained and to import refusals in the US. Remarkably, customs authorities do not recognize
private certifications, thus the probability for one exporter to be detained by customs
authorities – all things being equal – is the same whether the firm exports high-care products
or not. This higher probability that shipments will be controlled and detained will have an
impact on the reliability of exporters and thus on their reputation.
In order to test the effect of reputation, this paper makes use of a new FF&V refusal
dataset built upon information provided by the FDA. Our hypothesis is that the existence of
an import alert due to a history of food crises affecting a product from a given country will
have a reputation effect on every exporter from that country for that specific product.

11
3 Disentangling the drivers of trade in horticultural products
New trade models of firm heterogeneity confirm the importance of differences of
productivities among producers. Across-firm productivity levels explain a significant
proportion of the variance of trade flows (Melitz, 2003). However, Schott (2004), in a study
of US import data, highlighted the inconsistency of new trade theory models considering an
inverse relationship between price and producer productivity. His study presents a strong
relationship between GDP per capita and average export unit value within products at the
HS10 level. Hummels and Klenow (2005) confirm this prediction and show that richer
countries export more units at higher prices to a given market. These results are consistent
with the observation that higher income countries produce products of higher quality. Both
papers underline the importance of other source country characteristics and correlate such an
increase in unit value with the exporter’s relative endowment of physical and human capital.
Focusing on the demand side, Hallack (2006) finds that richer countries tend to benefit from
higher demand for imports from countries producing high quality goods.
In order to explain these observations, studies following the Melitz (2003) benchmark
model offer specific deviations and include a quality factor of trade. Johnson (2009), Baldwin
& Harrigan (2009) and Crozet, Head & Mayer (2009) test a quality-sorting hypothesis on
various sectors and confirm the inconsistency of price behaviour with the benchmark models
in particular sectors. These papers theoretically and empirically demonstrate the importance
of taking quality into consideration when explaining bilateral trade flows, although most of
them did not provide clear-cut disentangled impacts between quality-sorting on the one hand
and productivity-sorting on the other.
It is usually assumed that agricultural trade, presented as commodity trade, tends to
follow productivity sorting patterns (Johnson, 2009). In other words, we should observe an
inverse relationship between price and distance between trade partners. My hypothesis in this

12
paper is that it is not necessarily the case when it comes to horticultural products. In order to
demonstrate this, I first test in this section the usual productivity sorting model.
Following heterogeneous firms trade models based on Melitz (2003), cut-off conditions
on the incentive to export set a productivity threshold above which only the most productive
producers should be able to export to distant markets. In this framework, f.o.b export prices
are inversely related to distance and to the difficulty to enter one’s market. This impediment
is generally revealed by fixed costs. The Melitz model and its extension by Helpman et al
(2007) is now widely accepted. A technical appendix describes the main features of this
model. In what follows, I will test the workhorse model based on Melitz (2003) and its
application to average f.o.b. export prices in FF&V exports. The model introduces fixed and
variable export costs in a framework of asymmetric countries and firm heterogeneity with
firm productivity following a Pareto distribution.
Average fob price in the productivity sorting setting
As usual, I consider a world of C countries indexed by i, varying in size and location, in
which consumers maximize a CES utility across a continuum of varieties over the set V
available in country i. I assume the budget constraint of country i with the income Yi equals
its expenditure and define Pi as the CES price index in country i.
As usual in the literature, the supply-side is characterized by a Dixit-Stiglitz framework of
monopolistic competition. A single firm produces each variety and there is free entry into the
industry. Firms are heterogeneous in their productivity in the sense that marginal cost varies
across firms using the same technology. Firms’ productivity is distributed Pareto, with the
distribution function g over ,0 and a continuous cumulative distribution G .
Firms from country i will incur fixed costs ijf of selling to a market j.
The country specific factor cost is denoted by iw and /1c is the firm’s specific factor
requirement, or the inverse of its productivity, needed to produce one unit of the variety v. If

13
a firm from country i seeks to sell its products to consumers in country j, those consumers
will bear an additional transport cost ij defined in a Samuelson’s iceberg costs fashion.
The empirical setting of the model is set forth in equation (1) where expected f.o.b price of
exports ijp
from country i to country j depends positively on export market size and
negatively on fixed and variable costs. The expected average price of exports from i to j, can
now be expressed in log-linear form as:
ijijjjiij fypwp lnln1111ln1lnln (1)
where lowercase variables represent the natural logarithms of their respective uppercase
variables. As in Helpman et al. (2008) and Johnson (2009), I parameterize the bilateral fixed
and variable costs as follows. I assume that ij (variable trade costs) is stochastic due to i.i.d.
un-measured trade friction iju1 which is country-pair specific. As an analogy to their
definition, I define ijuijij eD 1 where ijD1 represents bilateral symmetric distance between i
and j with 2,0 uij Nu . Thus I have that ijijij ud 11ln . Fixed trade costs, are
classically set as ijijjiij uDf 22ln . This data is defined in dyadic form by
interacting indicators for the exporting and importing country. I assume that fixed trade costs
rely on i and j respectively the exporter and importer fixed effects. ijD2 is a set of
overlapping data that I assume will decrease the fixed cost of exporting from country i to
country j (common language, sharing a frontier; a free trade agreement, etc.), and iju2 stands
for the unobserved variations in trade costs. In what follows I simplify the number of
variables through the linear combination ijijij uu 21 of unobserved variations in fixed
and variable costs of trade that I assume to be normally distributed, with 2 the variance of
the composite error. To be thorough, all variables of the model ought to be divided by the
variance of this normal distribution. However, I do not compute this calculation in this paper;

14
I focus on the signs of the right and left hand side. Substituting those parameters back into the
log-linear expression (1) of the expected f.o.b. price on the export market yields the following
expression:
ijijijjiij Ddp 210ln (2)
Where 1ln0 is the constant, iii w 11ln and
jjjj yp 1111 are respectively exporter and importer fixed effects.
Our panel econometric test introduces a time dimension. Some variables, such as income,
will become time-dependant. Hence, some variables can be transformed as
jjj p 11 . The log-linearized expected average price equation becomes:
ijtijtijjtjiijt Ddyp 210 11ln (3)
Data and Empirical results
In order to test the productivity-sorting hypothesis, I make use of CEPII BACI trade data on
FF&V at the HS 6-digit level for the 1998-2007 period. It reconciles bilateral trade flows
reported by exporter (f.o.b) and importer (c.i.f) in the UN-COMTRADE trade database. This
dataset not only includes trade in quantity but also its equivalent trade value. With this, I
compute the average unit f.o.b. trade value. This calculation and the comparison are made
easier since I only consider FF&V trade, which are systematically reported in kilograms.
BACI is the only database providing consistent unit-values at the world and product level, so
it is particularly well suited to analyzing international trade prices (Gaulier and Zignago,
2009)9 .I have a balanced dataset covering 10 years, 221 countries and 102 FF&V products.
The classic variables of distance and GDP were respectively retrieved from the CEPII
database and from WDI’s World Bank online website.
9 As in Baldwin & Harrigan (2009), I remove traded quantities inferior to 500 kg because analysis of the data provide evidence that low trade levels usually present very high unit prices. These values are expected to bias considerably our results. The test gathers observed positive trade values since I are only interested in unit prices.

15
I first implement a “Gravity as usual” specification in order to check for the relevance
of applying a gravity model to the FF&V sector. Table 1 provides results from this empirical
investigation. It provides results that follow what is expected from a classic gravity
specification on export values of agricultural products. Particularly, both importer and
exporter GDPs are positively related to export values. Their respective point estimates are
close to what the literature usually provides (Disdier et al. 2007 and Grant & Lambert 2008).
However, it should be highlighted that the elasticity associated with the importer’s GDP is
more than four times higher than the elasticity on the exporter’s GDP. As is common in the
literature, I also test the model by replacing GDP with GDP per capita of both the exporting
and the importing countries. Results are of the same order of magnitude as those obtained
when computing GDPs.10
In a second stage, I test whether the productivity setting provides an explanation for
the observed average unit export f.o.b price. Results of this test on prices are presented in
Table 3. They display a positive relationship between average unit f.o.b export prices and
distance when a negative relationship is expected in a productivity-sorting framework. This
result supports the rejection of the hypothesis of homogenous quality among firms within the
FF&V sector. Thus a comprehensive heterogeneous firm trade model should also include
space for a heterogeneous quality sorting setting. Such expectations have already been
highlighted by various papers using quality-sorting models. However, earlier studies did not
focus specifically on the FF&V sector. Indeed, non-manufactured sectors are usually left out
of such tests on the assumption that they are commodity products. One of the novelties of
this paper is to provide proof that agricultural products are much like industrial products
when it comes to sorting out quality and productivity influences in both consumption and
production patterns. As with the “Gravity as usual” setting, I test the same specification
replacing importer GDP by GDP per capita. I observe the same kind of results as in the first
10 Table 3 is presenting the correlation between GDP and GDP per capita for exporting and importing countries.

16
tests on export values. Replacing GDP with GDP per capita slightly increases the elasticities
but does not change the results. Since distance is positively related to average unit price, it is
not surprising that sharing a frontier has a negative impact. Sharing a common language is
also negatively related to average unit prices, but having a history of colonial ties has a
positive impact on prices.
4 Quality and reputation matters
In this section of the paper, I adopt the Melitz (2003) framework, augmented by Eaton,
Kortun and Kramarz (2008), Baldwin and Harrigan (2009), Johnson (2009), and Crozet,
Head and Mayer (2009), in order to build a quality sorting model based on firm heterogeneity
with firm productivity following a Pareto distribution.
This paper is considered as innovative with respect to the existing literature for introducing
two key features. First, it allows for the possibility that firms produce according to either
productivity sorting or quality sorting. Second, consumers from different countries have
heterogeneous preferences for quality. Within a CES framework, I adopt a similar method to
Johnson (2009), Baldwin and Harrigan (2009) and Crozet et al (2009), adding a quality
parameter that allows for consumers to maximize their utility according to a quality-adjusted
price.
Productivity vs. Quality sorting models
Many papers have developed quality adjusted models in order to explain the empirical
evidence of increasing prices with distance between any two trading partners. Therefore,
most of these models switch from a productivity-sorting to a quality-sorting setting, by
hypothesizing that producing quality is costly. In such models, heterogeneity in productivity
is therefore replaced by heterogeneity in quality. Indeed, the objective of these models is to
introduce quality heterogeneity between firms without multiplying sources of heterogeneity

17
in order to keep the model tractable. Thus, one of the difficulties raised by quality-sorting
models is to define a relationship between firm productivity and quality without loosing the
possibility of comparison with the original Melitz productivity sorting-model. Hence, those
models generally relate quality and productivity through a power function of the type
cq with q the quality parameter, c firms’ factor requirement and 1 . Kugler and
Verhoogen (2008) studying unit values of inputs of Colombian manufacturing plants provide
direct empirical support for such a relationship between quality and cost showing that higher
cost inputs are systematically associated with higher quality outputs. The general setting then
usually defines a quality-adjusted price qpp ~ and a quality adjusted demand xqx ~ .
With this, the difficulty lies in the definition and proper setting of the power parameter .
The model developed in this section will not depart from these hypotheses. However, I
innovate by endogenizing this power parameter, making this relationship idiosyncratic to the
dyadic relationship between the exporting and importing country.
According to the usual definition of the quality parameter, quality depends directly on
the level of productivity of the firm and of the power parameter. The consequence will be
first that depending on the value of the power parameter, all exporting firms from one country
i will either export under productivity-sorting or quality-sorting. Baldwin & Harrigan (2009)
define this power parameter as the elasticity connecting quality and factor requirements.
Thus, setting 0 reduces the model to the standard Melitz (2003) productivity-sorting
model (described in the technical appendix). And, if 10 , the quality-adjusted price
increases with cost and thus unit price. It is only when 1 that the quality-adjusted price
will be negatively related to unit price, meaning that the more factor requirement is needed to
produce one unit of product, the higher the quality and the lower the quality adjusted price.
The relationship is integrated in the consumer quality adjusted demand. Based on a firm’s
factor requirement, consumers will regard some varieties as superior to others in terms of
quality if and only if 1 . In such a setting, quality-sorting models fully reverse the

18
relationship between variable costs and prices: the more difficult the access to one country’s
market, the higher both quality and average export prices are. Therefore, firms are sorted
according to quality with the higher firm’s factor requirement representing the higher quality.
As in Baldwin and Harrigan (2009), in quality-sorting settings, firm heterogeneity is
distributed Pareto over factor requirements instead of productivity. Even though this
complete inversion of the relationship fits much better with the average observed export
prices, I argue that it still does not allow for considering the full reality of some sectors such
as the FF&V export sector.
For this reason, Johnson (2009) builds a framework allowing for close identification
of the sign of the correlation between quality-adjusted price and unit price among various
sectors. He is therefore able to identify if these exporting sectors follow a productivity-sorting
or a quality-sorting setting. Borrowing from John Sutton’s terminology, Johnson (2009)
proposes to link firms’ factor requirements to their capability defined by the ratio of quality to
costs. This capability can be compared to a quality adjusted factor requirement. Firm
heterogeneity does not rely on their factor requirement, but on their capacity to transform
variable costs into quality. Thus firm’s quality is a constant elasticity function of their
capability. His methodology makes it possible to identify empirically if the power parameter
governing the relationship between quality and capability is 1 or 1 . As I have
already defined, those two solutions respectively relate to the solutions where export prices
are increasing or decreasing in the threshold, indicating if exports are following productivity
or quality sorting. His results are of tremendous interest for various reasons: he builds and
test a theoretical framework that clearly supports the rejection of the homogeneous quality
formulation of the heterogeneous firms models, but also, he clearly states the existence of
both productivity and quality sorting throughout the various sectors he is studying.
Unfortunately, his results are not of any support concerning the sector of FF&V since
Johnson (2009) discarded non-manufacturing trade of his sample “on the ground that

19
monopolistic competition models ought to be best suited to understand trade in differentiated
manufactures”.
In the model I suggest an in-between solution that would better fit the FF&V sector
and would allow highlighting the effect of reputation on exports of FF&V. Instead of a
continuous relationship between quality and productivity, I consider the existence of one
level of quality. The model will introduce a quality threshold, idiosyncratic to the dyad,
defined over the lower productivity level necessary to profitably export quality products. In
other words, it relates to the level of productivity from which it becomes profitable for one
exporter of country i to export quality products to country j according to consumers of
country j’s preference for quality. I also endogenize the power parameter relating quality to
productivity i , making it idiosyncratic to the exporting country. This parameter characterizes
the capacity i1 of the exporting country to produce quality. As a consequence, the level of
productivity necessary to make quality profitable in one export market will depend on the
exporter’s capacity to produce quality. Indeed, it will be much easier to produce quality
FF&V fulfilling the basic quality requirements in France than in Guatemala. Also, the
endogenization of the quality parameter to the importing country will enable products from
the same sector within one exporting country to be exported under various “sorting” regimes
according to the country of destination. Thus, I expect more quality products to be exported
to high income countries when “productivity” products will better fit exports toward
developing countries.
For example, in the FF&V sector, I could differentiate what I call productivity and
quality products according to the type of market chain through which those products enter the
importing country. Productivity products relate to commodities, sold to intermediaries. The
objective is to sell a high quantity of products and more productive firms are more profitable.
Quality products relate to products for which the information on quality is made available
through signals like certification.

20
Thus I consider in this model that firms are heterogeneous in their level of productivity that
will then define, according to the targeted market, if it is profitable to export either
productivity or quality products. I assume here that each firm with a level of productivity
higher than the quality threshold will automatically switch to quality products.
The setting: disentangling productivity and quality sorting
The consumer’s problem
As in the benchmark productivity model (see technical appendix), I consider a world of C
countries indexed by i, varying in size and location, in which consumers maximize a CES
utility function across a continuum of varieties over the set of Vi varieties available in
country i. I assume consumers will be able to recognize “quality” from “productivity”
products. Heterogeneity among consumers of various countries will rely on the intensity of
consumers’ preference for quality. I define q i the quality parameter specific to consumers in
country i. Like in Eaton, Kortum and Kramarz (2008), I introduce the term i v
representing an endogenous shock to the quality parameter specific to variety v in country i.
This parameter will represent the reputation parameter. For “productivity” products, the
quality term becomes 1vqv ii .
The consumer maximizes utility according to a quality-adjusted demand
vxvqvvx iiii ~ .
11~
Viv
ii dvvxU (4)
The parameter is the elasticity of substitution across products and as usual, it is the same
across countries.11 Given the budget constraint in country i and assuming country i’s income
11 Melitz and Ottavianio (2008) relaxed this hypothesis by developing a model in which each firm faces a linear demand. This model allows for mark-up variations across firms and destination markets. Their conclusions will be discussed further in this paper.

21
being equal to its expenditure iii LwY , with L i the consumers’ supply of labour to firms and
wi their wage, the consumption is given by:
˜ x i v ˜ p i v ˜ P i 1Yi (5)
where ˜ p i v pi v i v qi
is the quality-adjusted price and
1
1
1~~iVv ii dvvpP the price
index. This allows us to define a physical demand quite similar to Johnson (2009) with:
iiiiii YPvpqvvx 11 ~ (6)
The producer’s problem
As usual in the literature, I assume quality products to be costlier and that the cost of
producing quality is a power function of a firm’s factor requirement. As in the benchmark
model, I thus define c the factor requirement necessary to produce one unit of productivity
products and cq the physical factor requirement necessary to produce one unit of quality
product withcq c 1i . The parameter i defined over ,0 is idiosyncratic to country i and
relates to the capacity i1 to produce quality. Firms maximize their profits at mill prices.
Whether they produce productivity or quality products, the mill price is respectively
cwvp ii 1 and icwvp ii
11 . Following the benchmark setting,
firm productivity c/1 is distributed Pareto over ,0 . The cumulative distribution
function G describes the distribution of productivity. Thus the capacity of a given firm to
produce quality will depend of the interaction of three parameters:
‐ The firm’s productivity: the higher a firm’s productivity, the more likely it will produce a
quality product.
‐ The country’s capacity to produce quality: the higher this capacity denoted by 1 i , the
lower the additional costs of producing quality will be.
22
‐ The intensity of consumers’ preference for quality. The more one country’s consumers
find utility in consuming quality products, the more firms will be prompt to switch to a
quality strategy.
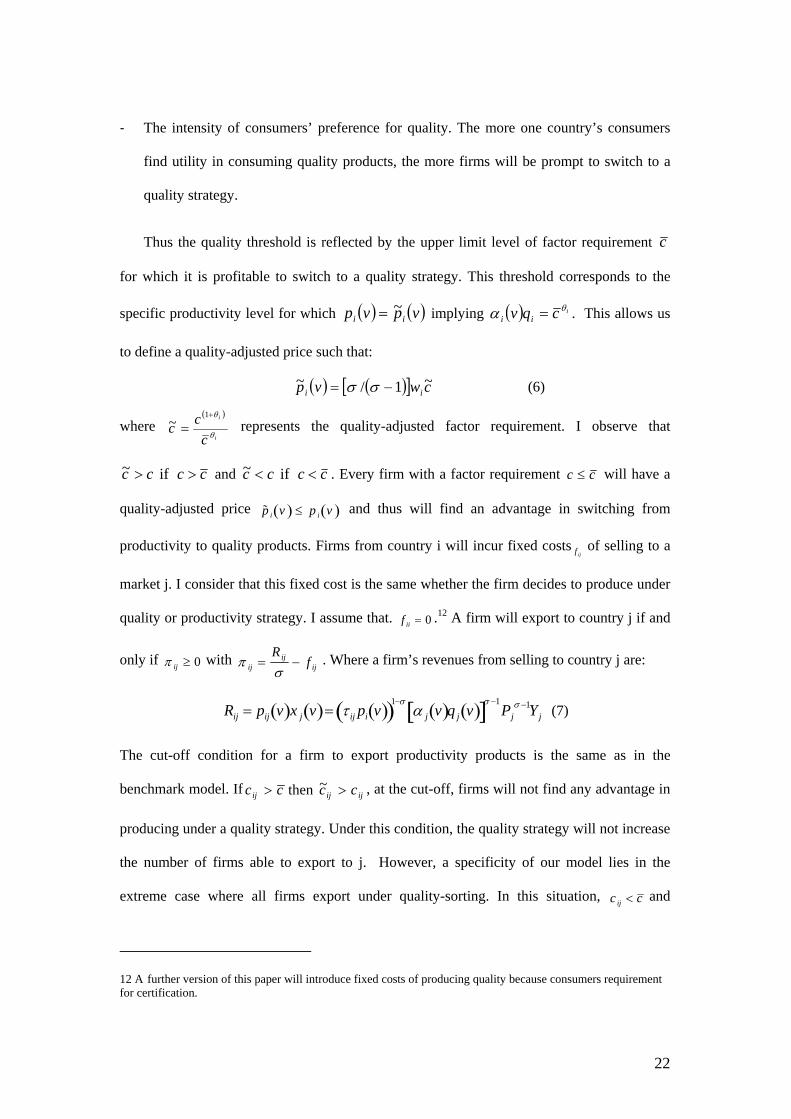
Thus the quality threshold is reflected by the upper limit level of factor requirement c
for which it is profitable to switch to a quality strategy. This threshold corresponds to the
specific productivity level for which vpvp ii~ implying icqv ii
. This allows us
to define a quality-adjusted price such that:
cwvp ii~1/~ (6)
where
i
i
c
cc
1
~ represents the quality-adjusted factor requirement. I observe that
cccc if ~ and cccc if ~ . Every firm with a factor requirement c c will have a
quality-adjusted price ˜ p i v p i v and thus will find an advantage in switching from
productivity to quality products. Firms from country i will incur fixed costs f ij of selling to a
market j. I consider that this fixed cost is the same whether the firm decides to produce under
quality or productivity strategy. I assume that. f ii 0 .12 A firm will export to country j if and
only if ij 0 with ij Rij
f ij
. Where a firm’s revenues from selling to country j are:
Rij pij v x j v ij pi v 1 j v q j v 1Pj
1Yj (7)
The cut-off condition for a firm to export productivity products is the same as in the
benchmark model. If ijijij cccc ~ then , at the cut-off, firms will not find any advantage in
producing under a quality strategy. Under this condition, the quality strategy will not increase
the number of firms able to export to j. However, a specificity of our model lies in the
extreme case where all firms export under quality-sorting. In this situation, c ij c and
12 A further version of this paper will introduce fixed costs of producing quality because consumers requirement for certification.

23
˜ c ij cij . Therefore, around the cut-off, some firms that would not have been able to export to
j under productivity-sorting will however be able to export under quality-sorting. In other
words, the possibility to switch to quality production will enable firms with a factor
requirement c such that ijijij ccccc ~~ to export to j. For convenience, I focus on a
benchmark case for which ccij implying that both productivity and quality products will
be exported. Other cases are extreme situations. In our benchmark situation – all other things
being equal – the number of exporting firms to one country will be constant and will only be
dependant of the entry threshold. The average f.o.b. price of one country i exporting to one
importing market depends on the proportion of the number of productivity vs. quality firms
exporting to this market. The expected price conditional on exporting from country i to
country j is defined as:
ijiijij VpE 10 with ijqijpij VVV (8)
As in Helpman et al (2008), ijpV and ijqV are two monotonic functions of the proportion of
exporters respectively exporting under productivity or quality strategy to country j, )(cG
ijpV
1
1 G ˜ c ij c
c
c ij dG (c ) for c ij c c
0 Otherwise
(9)
ijqV
Otherwise 0
for )(1
10
1 ccccdGccG ij
c
ij
i
As already mentioned, I do not consider extreme cases for which there is only productivity or
quality sorting on the importing market, implying a change in the number of exporting firms
to market j. Nevertheless, we can verify that our benchmark situation lies between those two
extremes, within a framework of a constant number of exporting firms. The two extreme

24
values of this benchmark situation for ijV are: max,ijpV for which all firms with a factor
requirement c c ij export under productivity sorting and max,ijqV for which all firms export
under quality sorting.
Vijp,max 1
1G cij c dG c
0
cij
1cij
and
Vijq,max 1
1G cij c i 1 dG c
cL
cij
i 1cij i 1
We verify that V ijp , max V ij V ijq , max.
The assumption in this paper is that the proportion of firms producing quality
products will vary positively with the capacity of the exporting country and with the
preference for quality of the importing country and negatively with a shock to consumers’
demand for quality. Thus, the level of the expected price will be a function of the quality
thresholdc ijqi 1
i . According to (9), in the benchmark scenario, the value of ijV is the
following:
Vij Vijp Vijq 1
1G cij cdG c
c ij
cij 1
1G c ij c i 1 dG c
0
c ij
Developing this equation gives us the following value of Vij , defined over the productivity
cut-off condition and the quality threshold:
1
11
11
ic
c
ccV
iij
ijij
(10)
with the Pareto distribution parameter

25
Empirical procedure
According to the definition of the expected average price, it is not possible to directly log-
linearize the equation because of the introduction of the quality threshold. Thus it is not
possible to obtain an estimation procedure that will allow estimating the elasticities of the
parameters. However, I clearly identified the parameters influencing the average f.o.b price
and the interest here is to identify the sign of these parameters. In order to derive a reduced
form of the average price equation, I define ijV , the expected factor requirement of exporting
firms as:
ijjiijijijij qchcchV ,,,, (11)
The cut-off condition ijc is defined over the same parameters as in the benchmark model.
The results will now also depend on the quality threshold. I have assumed that this threshold
would increase with the preference for quality of the importing country and with the capacity
of the exporting country and decrease with a shock to the preference for quality idiosyncratic
to the dyad. This allows us to define the following estimation equation:
ijjiijijjjoij qffypp ,,lnlnln 4321 (12)
Moreover, I define ieY ipci
,11,
1
and jeYq jpcj
,22,
where ipcY , and jpcY , represent
respectively the exporting and importing country GDP per capita with the unobserved quality
parameters represented by 21 ,0
iN and 2
2 ,0j
N . Thus I have
iipci
y ,1,1
1ln
and jjpcyq ,2,2ln
The shock to consumers’ preference will be defined as a function of the relative number of
custom refusals, highly correlated with import alerts. Thus I define ijeSijij,33
with
23 3
,0 N.
26
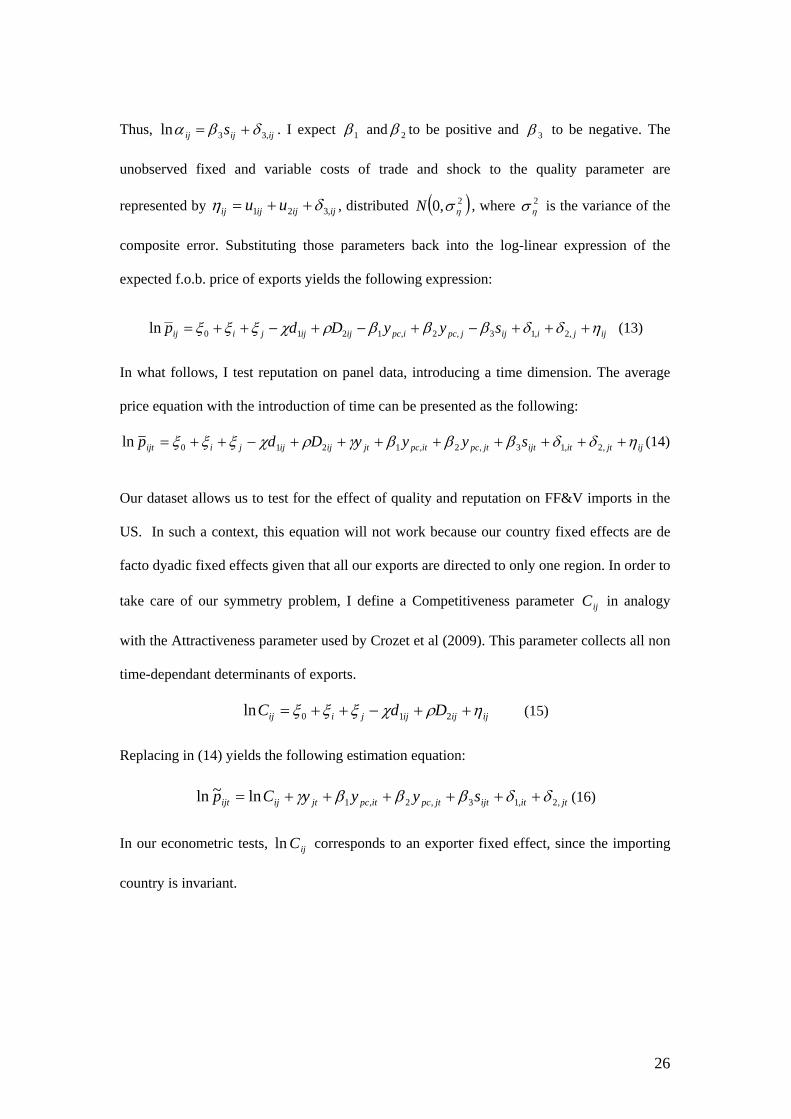
Thus, ijijij s ,33ln . I expect 1 and 2 to be positive and 3 to be negative. The
unobserved fixed and variable costs of trade and shock to the quality parameter are
represented by ijijijij uu ,321 , distributed 2,0 N , where 2 is the variance of the
composite error. Substituting those parameters back into the log-linear expression of the
expected f.o.b. price of exports yields the following expression:
ijjiijjpcipcijijjiij syyDdp ,2,13,2,1210ln (13)
In what follows, I test reputation on panel data, introducing a time dimension. The average
price equation with the introduction of time can be presented as the following:
ijjtitijtjtpcitpcjtijijjiijt syyyDdp ,2,13,2,1210ln (14)
Our dataset allows us to test for the effect of quality and reputation on FF&V imports in the
US. In such a context, this equation will not work because our country fixed effects are de
facto dyadic fixed effects given that all our exports are directed to only one region. In order to
take care of our symmetry problem, I define a Competitiveness parameter ijC in analogy
with the Attractiveness parameter used by Crozet et al (2009). This parameter collects all non
time-dependant determinants of exports.
ijijijjiij DdC 210ln (15)
Replacing in (14) yields the following estimation equation:
jtitijtjtpcitpcjtijijt syyyCp ,2,13,2,1ln~ln (16)
In our econometric tests, ijCln corresponds to an exporter fixed effect, since the importing
country is invariant.

27
Accounting for the export price of horticultural products
I use the same data as in our first productivity-sorting test to which I add various data in
order to take into consideration the exporting country’s capacity to produce quality, the
intensity of consumers’ preference for quality in the importing country and the reputation
parameter. In this specification, GDP per capita is a proxy for the first two parameters. I
gathered GDP per capita data from the WDI.
For the reputation parameter I use data compiled from FDA data on customs import
refusals. As already discussed, refusals stand as a reasonable proxy for product reputation on
the US market. The FDA uses its own product codification, thus refusals data had to be
recoded in HS 6-digits. In order to test the reputation effect, I have a balanced data set
covering 11 years, 102 products and 141 FF&V exporting countries to the US. Also, one
might suspect that refusals are related to GDP per capita. I tested and verified this with a
simple correlation. Table 4 shows the very small relation between refusals and GDP per
capita. This confirms the relevance of refusals as a good proxy for reputation.
Evidence on the importance of quality
I first test the empirical setting (14) on the same database that I used in the productivity-
sorting test. I am not able to test the reputation effect on this database, but this benchmark
will allow us to compare the quality and capacity parameters of this multiple importer
database to the specific test on the US market. As already mentioned, this setting is a
reduced forms thus I focus my attention on coefficient variations and signs rather than the
size of the coefficient itself
As expected, both GDPs per capita are positively related to average export f.o.b. unit
prices as well as distance. As in the gravity as usual and productivity-sorting test, there is a
large difference between the importer and exporter GDP per capita coefficients. But more
surprising is the negative coefficient for importer GDP. Such results have already been

28
highlighted by Melitz and Ottaviano (2008) and Baldwin and Harrigan (2009). The former
highlight that the size of the market – for which GDP is usually used as a proxy – affects the
toughness of competition to which firms will respond through a variation in their mark-ups
and thus will affect the selection of producers and exporters into that market. This implies
that aggregate productivity and average mark-ups respond to the size of the market and that
mark-ups are decreasing in the number of competitors and with the export threshold of the
market of destination. One other explanation is given by Baldwin and Harrigan (2009) with
their “Quality Heterogeneity Firms and Trade” model. They consider that as export market
size increases, more low quality firms will find it profitable to enter. Those low quality firms
(here firms producing productivity products) will have a lower mill price. As a consequence,
average f.o.b. price in larger markets will be lower. Both assumptions can well explain those
results.
These observations and our results are comforting regarding the ability of the model
developed here to disentangle the effect of quality and productivity on the observed average
export prices. On the one hand, I observe the effect of the market size that tends to decrease
the average export price either through more competition or on the contrary allowing for
lower quality products to enter the market. On the other, high-income markets have a high
preference for quality, enabling exporting firms to profitably switch to quality products.
Reputation impact: Evidence from the US horticultural imports.
In a second stage, I test the reputation effect on the US market. As a proxy for reputation, I
first created a dummy variable equal to one if there has been at least one refusal for each
exporter/product/year. As expected, average f.o.b unit prices are positively related with
exporters’ GDP per capita and negatively related to the existence of at least one refusal. This
confirms our hypothesis on the effect of reputation on the capacity to export quality.
Moreover, between specification (1) and (2), I observe that the introduction of the reputation

29
parameter slightly increases the positive effect of the exporter GDP per capita on unit prices,
thus further highlighting the impact of the capacity of the exporter to produce quality on this
average unit export price. We could expect refusals to have a lagged influence on prices.
Thus I tested the same equation introducing one to three years lagged refusal dummies. It also
suppresses the impact of the co-temporality of the data and thus possible endogeneity issues. I
observe that, apart from the one year lag, the refusal dummy coefficient is each time
increasing.
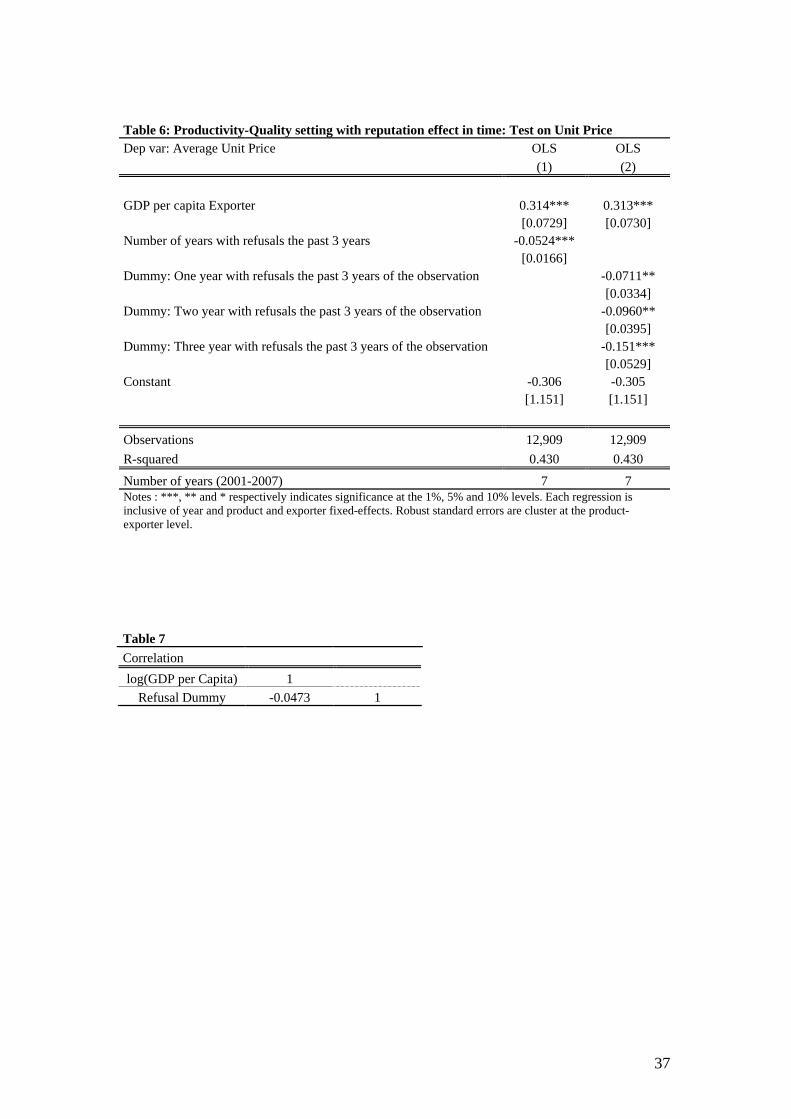
As an illustration of the importance of the earnestness highlighted in this paper, I
build a set of new variables based on past refusals. The first represents the sum of years
presenting at least one refusal in the three years prior to the observation. In a second stage I
built another set of dummies representing the three possible values of the last variable For
example: for an observation in 2006, there has been at least one refusal in 2005 and in 2003,
meaning that the dummies “one year” and “three years” will be equal to zero and the dummy
“two year” will be equal to one. Table 6 presents the results of the same econometric
specification using those variables for the reputation effect. The results clearly highlight the
impact of the recurrence of refusals: the more history of refusals, the higher the negative
impact on average export prices.
In order to verify the reliability of the test on a refusal dummy, I first tested the
empirical setting using the log of the number of refusals, replacing zeros in refusals by 0,001.
Second, we could also have questioned the causality between refusals and export quantities.
Indeed, we could consider a relationship between the probability of being inspected and the
volumes exported. Thus I also test the empirical setting using a weighted number of refusals,
considering an average shipment to be equal to one tone of products. This last setting has to
be taken with caution because or risks of endogeneity due to the calculation used to obtain the
average export price. Both results are presented in table 6. They confirm the results of the

30
specifications using refusal dummies. These results confirm our intuition of the importance of
quality but also of reputation in the analysis of FF&V trade flows.
5 Conclusion
Following previous work on the role of productivity in explaining how producers of industrial
goods react to exposure to international trade, this paper provides evidence that
heterogeneous productivity-levels is also a determinant of the capacity to export horticultural
products. The paper goes a step further by showing that quality also provides a way for
developing countries to create the conditions for increased and more profitable market access.
Accordingly, a negative shock on the reputation of a producer conveys a downgrading effect,
reducing the ability for countries to export quality products.
On a policy-oriented level, the significance of producing quality gives further credential and
support to the current agenda of aid for trade in agriculture. Particularly, the agenda calls for
innovative initiatives in order to support producer in complying with such standards (for
example through the implementation of public/private partnerships). In some areas of
Madagascar or countries of Central America, the strong involvement of the private sector in
securing a safe and stable supply of FF&V has been decisive in the development of the sector
and allowed for a sensible improvement of producers conditions. In Guatemala, the
Guatemalan Exporters Association in cooperation with various domestic and international
public institutions greatly facilitated both the development and the sustainability of
Guatemalan’s high quality exports through capacity building, knowledge transfer and
international visibility of the sector. However, generalization and one-size-fits all is in this
matter a risky temptation as each country and producers’ specificities should always be taken
into consideration.

31
7 References
Baldwin, R.E., T. Ito, (2008), Quality competition versus price competition goods: an empirical classification, working paper, NBER
Baldwin, R., J. Harrigan, 2009, Zeros, Quality and Space: Trade theory and trade evidence,
NBER Working Paper. Baylis, K., A. Martens, L. Nogueira, 2009, What drives food import refusals?, 2009 AAEA
annual meeting , Milwaukee Buzby J. C., L. J. Unnevehr, D. Roberts, 2008, Food Safety and Imports : An Analysis of
FDA Food-Related Import Refusal, Economic Research Service, Economic Information Bulletin Number 39.
Crozet, M., Head, K., Mayer, T., Jul. 2009. Quality sorting and trade: Firm-level evidence for
french wine. Working Papers 53883, American Association of Wine Economists. Diop, N., S. Jaffee, , 2005. Global trade and competition in fresh and processed fruits and
vegetables. In: Aksoy, M.A., Beghin, J. (Eds.), Global Agricultural Trade and Developing Countries. Oxford University Press.
Diop, N. and S.M. Jaffee, 2005. Fruits and Vegetables: Global Trade and Competition in
Fresh and Processed Product Markets. In: Aksoy, M.A and Beghin, J.C. (ed.) Global Agricultural Trade and Developing Countries. World Bank, pp. 237-257.
Disdier A.-C., Fontagne, L., Mimouni, M., 2007. The impact of regulations on agricultural
trade: Evidence from SPS and TBT agreements. Working Papers 2007- 04, CEPII research center.
Eaton, J., Kortum, S., Kramarz, F., 2004. Dissecting trade: Firms, industries, and export
destinations. American Economic Review 94 (2), 150–154. Gaulier et Zignago (2009) "BACI: International Trade Database at the Product-level The
1994-2007 Version" Hallak, J. C., 2006, “Product Quality and the Direction of Trade”, Journal of International Economics 68, 1, 238-265 Helpman, E. , M. Melitz, Y. Rubinstein, 2008, "Estimating Trade Flows: Trading Partners
and Trading Volumes", Quarterly Journal of Economics, 123(2), 441-487. Henson S., J. Blandon, 2007, “The Impact of Food Safety Standards on an Export-Oriented
Supply Chain: Case of the Horticultural Sector in Guatemala”, International Food Economy Research Group (InFERG) University of Guelph.
Henson, S, S. Jaffee, 2008, Understanding Developing Country Strategic Responses to the
Enhancement of Food Safety Standards, The World Economy, 31-4, 548-568.

32
Jaffee, Steven and Henson, Spencer}, Standards and agro-food exports from developing countries: rebalancing the debate},2004,The World Bank},Policy Research Working Paper Series},
Jaffee, Steven, and al. (2005), “Food Safety and Agricultural Health Standards: Challenges
and Opportunities for Developing Country Exports,” Report no.31207, Poverty Reduction & Economic Management Trade Unit and Agriculture and Rural Development Department, World Bank.
Jaffee, Steven, and S. Henson (2004), “Standards and Agro-Food Exports from Developing
Countries: Rebalancing the Debate,” World Bank Policy Research Paper No. 3348. World Bank.
Jaffee, Steven (2003), “From Challenge to Opportunity: Transforming Kenya’sFresh
Vegetable Trade in the Context of Emerging Food Safety and OtherStandards in Europe,” Agriculture and Rural Development Discussion Paper 1,World Bank.
Johnson, R., 2009. Trade and prices with heterogeneous firms. Tech. rep., Working paper -
Princeton University and UC Berkeley. Julian, J., 2003, Assessment of the impact of Import detentions on the Competitiveness of
Guatemalan Snow Peas in US markets, PhD Thesis, Purdue University. Lambert, D. M., 08 2008. Do regional trade agreements increase members' agricultural trade?
American Journal of Agricultural Economics 90 (3), 765{782. Maertens M., J. F.M. Swinnen, 2006, Standards as Barriers and Catalysts for Trade and
Poverty Reduction. Melitz, M. , 2003, “The impact of trade on intra industry reallocations and aggregate industry
productivity”, Econometrica 71, 6, 1695-1725 (November). Melitz, M., G.I. Ottaviano, 2007, “Market size, Trade and Productivity”, review of Economic
Studies, 75, 295-316. Otsuki, T., J. S. Wilson, M. Sewadeh, 2001, Saving two in a billion: quantifying the trade
effect of European food safety standards on African exports, Food Policy 26, 5, 495-514. Schott, Peter K., 2004, “Across-product versus within-product specialization in international
trade”, Quarterly Journal of Economics 119, 2, 647-678 (May). Spencer Henson and Steven Jaffee}, 2008 Understanding Developing Country Strategic
Responses to the Enhancement of Food Safety Standards},The World Economy}, Thrupp, L. A., 1995, Bittersweet harvests for Global Supermarkets: Challenges in latin
America’s Agricultural Export Boom, World Resources Institute. Tirole, Jean A Theory of Collective Reputations (with Applications to the Persistence of
Corruption and to Firm Quality)},Review of Economic Studies},1996, Vol 63}, Num 1},

33
7 Tables
Table 1: Gravity as usual
Dep var: log(Export Value) OLS OLS
(1) (2)
GDP Importer 0.379*** [0.0207] GDP Exporter 0.0964*** [0.0267] GDP per capita - Importer 0.445*** [0.0213] GDP per Capita - Exporter 0.0994*** [0.0267] Distance -0.510*** -0.510*** [0.0158] [0.0158] Contiguity 0.426*** 0.427*** [0.0293] [0.0293] Common Language 0.165*** 0.165*** [0.0261] [0.0261] Colony 0.0747** 0.0747** [0.0314] [0.0314] Constant -6.148 0.0578 [544.5]
Observations 651,274 651,274
R-squared 0.248 0.249
Notes : ***, ** and * respectively indicates significance at the 1%, 5% and 10% levels. Each regression is inclusive of year , product, exporter and importer fixed-effects. Robust standard errors are clustered at the product-exporter level.
Table 2 Correlation Importer
log(GDP) 1
log(GDP per Capita) 0.5739 1
Correlation Exporter
log(GDP) 1
log(GDP per Capita) 0.6056 1

34
Table 3: Productivity sorting setting: Test on Unit Price
Dep var: Average Unit Price OLS OLS
(1) (2)
GDP Importer 0.187*** [0.0151] GDP per capita Importer 0.238*** [0.0153] Distance 0.101*** 0.101*** [0.00597] [0.00597] Contiguity -0.114*** -0.113*** [0.0122] [0.0122] Common Language -0.0253** -0.0254** [0.0110] [0.0110] Colony 0.162*** 0.162*** [0.0134] [0.0134] Constant -5.428 -2.379 [450.2] [788.9] Observations 648,423 648,423
R-squared 0.298 0.298
Notes : ***, ** and * respectively indicates significance at the 1%, 5% and 10% levels. Each regression is inclusive of year , product, exporter a,d importer fixed-effects. Robust standard errors are clustered at the product-exporter level.

35
Table 4: Productivity-Quality setting: Test on Unit Price (no reputation effect)
Dep var: Average Unit Price OLS
(1)
GDP Importer -0.801*** [0.0607] GDP per capita Importer 0.983*** [0.0617] GDP per capita Exporter 0.273*** [0.0340] Distance 0.1000*** [0.00600] Contiguity -0.113*** [0.0123] Common Language -0.0269** [0.0110] Colony 0.162*** [0.0135] Constant 3.476***
[0.906]
Observations 645,001
R-squared 0,3
Notes : ***, ** and * respectively indicates significance at the 1%, 5% and 10% levels. Each regression is inclusive of year , product, exporter and importer fixed-effects. Robust standard errors are clustered at the product-exporter level.

36
Table 5: Productivity-Quality setting with reputation effect: Test on Unit Price
Dep var: Average Unit Price
OLS OLS OLS OLS OLS OLS OLS OLS
(1) (2) (3) (4) (5) (6) -7 -8
0.311*** 0.312*** 0.313*** 0.314*** 0.311*** 0.313*** 0.315*** 0.314*** GDP per cap Exporter
[0.0729] [0.0729] [0.0730] [0.0730] [0.0729] [0.0730] [0.0730] [0.0730]
-0.0828*** -0.0688*** -0.0532** -0.0460* Refusal Dummy
[0.0303] [0.0255] [0.0246] [0.0242]
-0.0638** -0.0380 -0.0164 -0.00869 Refusal Dummy 1 year lag [0.0309] [0.0261] [0.0251] [0.0248]
-0.0975*** -0.0735*** -0.0612** Refusal Dummy 2 years lag [0.0307] [0.0272] [0.0262]
-0.104*** -0.0633*** Refusal Dummy 3 years lag [0.0302] [0.0231]
-0.257 -0.282 -0.280 -0.295 -0.276 -0.292 -0.308 -0.310 Constant
[1.161] [1.155] [1.157] [1.154] [1.156] [1.154] [1.151] [1.150]
Observations 12,909 12,909 12,909 12,909 12,909 12,909 12,909 12,909
R-squared 0.429 0.429 0.429 0.430 0.430 0.430 0.430 0.430
Number of years (2001-2007)
7 7 7 7 7 7 7 7
Notes : ***, ** and * respectively indicates significance at the 1%, 5% and 10% levels. Each regression is inclusive of year and product and exporter fixed-effects. Robust standard errors are cluster at the product-exporter level.
37
Table 6: Productivity-Quality setting with reputation effect in time: Test on Unit Price Dep var: Average Unit Price OLS OLS
(1) (2)
GDP per capita Exporter 0.314*** 0.313*** [0.0729] [0.0730] Number of years with refusals the past 3 years -0.0524*** [0.0166] Dummy: One year with refusals the past 3 years of the observation -0.0711** [0.0334] Dummy: Two year with refusals the past 3 years of the observation -0.0960** [0.0395] Dummy: Three year with refusals the past 3 years of the observation -0.151*** [0.0529] Constant -0.306 -0.305 [1.151] [1.151]
Observations 12,909 12,909
R-squared 0.430 0.430
Number of years (2001-2007) 7 7 Notes : ***, ** and * respectively indicates significance at the 1%, 5% and 10% levels. Each regression is inclusive of year and product and exporter fixed-effects. Robust standard errors are cluster at the product-exporter level.
Table 7 Correlation
log(GDP per Capita) 1
Refusal Dummy -0.0473 1

38
Table 8: Productivity-Quality setting with reputation effect: Test on Unit Price Dep var: Average Unit Price OLS OLS
(1) (2)
GDP per capita Exporter 0.241*** 0.241*** [0.0536] [0.0536] Number of refusals -0.00138*** [0.000532] Weighted number of refusals -0.00118* [0.000609] Constant -3.819*** -3.806*** [0.589] [0.589]
Observations 17,813 17,813
R-squared 0.415 0.415 Notes : ***, ** and * respectively indicates significance at the 1%, 5% and 10% levels. Each regression is inclusive of year and product and exporter fixed-effects. Robust standard errors are cluster at the product-exporter level.

39
8 Technical appendix
The benchmark model (Melitz 2003))
The consumer problem
I consider a world of C countries indexed by i, varying in size and location, in which
consumers maximize a CES utility across a continuum of varieties over the set V available in
country i.
11
1
11
Viv
ii dvvxU (1)
I assume the budget constraint of country i with the income Yi equals its expenditure and
define Pi as the CES price index in country i.
dvvxvpY i
Vv
ii
i
and
1
1
1
iVv
ii dvvpP
After maximization of the consumers’ utility, the demand function for the variety v takes the
following form:
i
i
ii Y
P
vpvx
1
(2)
The producer problem
As usual in the literature, the supply-side is characterized by a Dixit-Stiglitz framework of
monopolistic competition. A single firm produces each variety and there is free entry into the
industry. Firms are heterogeneous in their productivity in the sense that marginal cost varies
across firms using the same technology. Firms’ productivity is distributed Pareto, with the
distribution function g over ,0 and a continuous cumulative distribution G .
Operating profits of a country i’s firm producing variety v and selling to a country j is
classically expressed as:

40
ijij
ij fvR
v
)(
(3)
Assuming a continuum of firms and a reasonable number of them allows for the
disappearance of strategic interactions. Thus, when maximizing their profits, firms will
charge a mill price with a constant mark-up over marginal costs:
cwvp ii 1
(4)
The country specific factor cost is denoted by wi and /1c is the firm’s specific factor
requirement, or the inverse of its productivity, needed to produce one unit of the variety v. If
a firm from country i seeks to sell its products to consumers in country j, those consumers
will bear an additional transport cost ij defined in a Samuelson’s iceberg costs fashion:
pi v 1
ijwic
It is thus straightforward that the exporting firm’s revenues are:
j
j
iijij Y
P
cwvR
1
11
1
)( (5)
A firms from country i will decide to export to country j only if 0)( aij . Thus condition
for one firms of country i to export to one country j is
ijij f
vR
, implying the following
cut-off condition:
1
1
1
1
11
j
ij
j
iijij Y
f
P
w (6)
Firms from country i will only be able to export to country j if their productivity is at least
ij 1 cij

41
Aggregation
As a result of (6) 0ijR if and only if ijcc . If c0 cij only a subset ijN , hence
representing ijN varieties, of the iN producing firms in country i will be able to export to
country j. The productivity of those ijN exporting firms is defined over ,ij . Thus I can
define the conditional distribution of g on ,ij as:
g 1G ij
if ij
0 otherwise
Expected average export unit f.o.b. price
Trade data only provide with information on the average unit export f.o.b. price of products at
the HS 6-digit level. Therefore we are looking for an expression of the expected f.o.b prices
for all varieties exported by country i to country j. According to the f.o.b pricing rule
ii
wvp
1 , thus the expected average f.o.b price depends on the expected productivity
level E conditional on firms being able to export to country i.
ijij
ij
ij
E
dgG
Eij
10
1
10 *
(7)
With the Pareto distribution parameter and ij the cut-off condition defined in (6).
Accordingly the expected average f.o.b. price ijp~ of products exported from country i to
country j is given by:
h

42
010
ij
iijijij
wppE
with 1
Using (7) this becomes
ijij
jjiijij
f
YPwpE
1
1
1
1
10
(8)