The Horticultural Society of India (Regd.) - krishi icar
196
Volume 75, No. 2 June, 2018
-
Upload
khangminh22 -
Category
Documents
-
view
0 -
download
0
Transcript of The Horticultural Society of India (Regd.) - krishi icar

Volume 75, No. 2June, 2018

The Horticultural Society of India (Regd.)[Founded in January 1942]
The main object of the Society is to cultivate and promote research, education and development of Horticulture and allied branches of science.
Executive Council for 2018Office Bearers
President : Dr K.L. Chadha, New DelhiImmediate Past President : Dr S.N. Rao, Hyderabad
Senior Vice-President : Dr Kirti Singh, Jaunpur
Vice-PresidentsDr M.L. Chadha, Hisar Dr S.P. Ghosh, New Delhi Dr Nazeer Ahmad, Srinagar
Secretary : Dr S.K. Singh, New Delhi Joint Secretary : Dr Jai Prakash, New Delhi Editor-in-Chief : Dr Pritam Kalia, New Delhi Editors : Dr V.B. Patel, New Delhi Dr T.K. Behera, New Delhi Treasurer : Dr K.P. Singh, New Delhi
Executive CouncillorsDr Y.R. Chanana, LudhianaDr B.C. Deka, MeghalayaDr M.S. Dhaliwal, LudhianaDr W.S. Dhillon, New DelhiDr M.R. Dinesh, BengaluruDr T. Janakiram, New Delhi
International Advisory Board
Editorial Board
The Indian Journal of Horticulture is the official publication of the Horticultural Society of India. The journal is published every quarter, i.e., during March, June, September and December. The journal publishes original research papers on all horticultural crops. The subscription rates are follows:
Category Soft copy (`) Hard copy (`) Overseas (US $)Patron 1,00,000 —Corporate membership 5,00,000 —Life membership 7,500 10,000 —Annual membership 1,500 2,000 US$ 100 (Soft copy)Annual subscription 10,000 15,000 US$ 450 (add US$ 40 for postage and handling)
Membership / subscription may be sent to the Secretary / Treasurer, F1, National Society’s Block, National Agricultural Science Centre Complex, Todapur, Pusa Campus, New Delhi - 110 012, India through bank demand draft drawn in favour of Horticultural Society of India payable at New Delhi. Syndicate Bank, NASC Complex, Pusa Campus, New Delhi 110012, A/c No.: 91532010004372, IFSC Code : SYNB0009153
The article for publication may please be sent in duplicate to the Editor, Horticultural Society of India to its Secretariat address: F1, National Society’s Block, National Agricultural Science Centre Complex, Todapur, Pusa Campus, New Delhi 110 012, India. Old address: C/o Division of Fruits and Horticultural Technology, Indian Agricultural Research Institute, New Delhi 110 012, India. Any other correspondence about the Horticultural Society of India and its activities may be sent on the above address.
Tel. No. 91(011) 25842127; E-mail: [email protected]; Website: www.hsi1942.in
Online version available at: www.indianjournals.com
Dr K.K. Jindal, Himachal PradeshDr S.K. Malhotra, New DelhiDr R.K. Pal, SolapurDr S. Rajan, LucknowDr P.L. Saroj, BikanerDr R.R. Sharma, New Delhi
Dr Balraj Singh, JodhpurDr Bijender Singh, VaranasiDr Brahma Singh, New DelhiDr Desh Beer Singh, SrinagarDr K.P. Singh, New DelhiDr D.P. Waskar, Parbhani
Dr B.S. Ahloowalia, AustriaDr Maurizio Lambardi, ItalyDr R.E. Litz, USA
Dr S. Kanlayanarat, ThailandDr K.V. Raman, USADr Md. Abdur Rahim, Bangladesh
Dr A.K. Yadava, USADr Zora Singh, AustraliaDr David M. Spooner, USA
Dr K. Nirmal Babu, KozhikodeDr M.I.S. Gill, LudhianaDr B.V.C. Mahajan, LudhianaDr R.L. Misra, New Delhi
Dr D.P. Waskar, Parbhani Dr Vishal Nath, MuzaffarpurDr Subhash Chander, New DelhiDr (Ms.) Indu Sawant, Pune
Dr R.R. Sharma, New DelhiDr Major Singh, PuneDr Brahma Singh, New DelhiDr P.M. Haldankar, Dapoli

165
Indian J. Hort. 75(2), June 2018: 165-171
INTRODUCTIONPapaya (Carica papaya L.) is considered as one
of the important fruit crops for the growers of the tropical and sub-tropical agro-climatic regions across the globe. Papaya varieties are typically classified as either dioecious or gynodioecious based on the type of flowers borne by the plant. Papaya is the only species in the genus Carica, with 21 species of Vasconcellea recently excluded from the genus Carica (Badillo, 1); Ming et al. (7); Scheldeman et al. (9)).
The relatively small genome of this species shows peculiarities in major gene group’s involved in cell size and lignification, carbohydrate economy, photoperiodic responses, and secondary metabolites, which place the papaya in an intermediate position between herbs and tree. Reproductive precocity, high photosynthetic rate of short lived leaves, quick growth, high flowering fruiting, production of many seeds and low construction cost of the hollow stems petioles, and fruit characterize this successful fruit crops in the tropics. High phenotypic plasticity allows these plants to establish in diverse agro-ecosystems. Papaya germplasm show moderate to high phenotypic variation for the morphological traits such as leaf
shape and size, types of inflorescences and flowers, fruit shape and size, and reaction to pest and diseases. The morphology of papaya inflorescences and flower varies with sex of the plant. Only a few studies have focused upon characterizing the genetic and morphological diversity of papaya growing within natural areas (Chan, 3). Within population, genetic diversity tends to be reduced relative to wild populations (Kim et al., 5).
There are several reasons why a desirable genotype of papaya plant needs to be identified prior to hybridization. The availability of genetic diversity is the pre-requisite for the success of any crop improvement programme. These naturally occurring populations may serve as a reservoir of genetic and morphological diversity for cultivated papaya; therefore, we planned to characterize these populations for assessing extent of morphological and genetic diversity. A significant amount of morphological diversity was observed throughout the country, especially for reproductive characters. The aim of study is to provide information about genetic diversity on phenotypic and genotypic level among the available inbred lines and few commercial varieties and hybrids available in the country. The information gained would be useful in the breeding programs aimed at the development of superior dioecious lines of the papaya. Keeping
Genetic diversity in qualitative and quantitative traits of papayaKaluram, Jai Prakash*, S. K. Singh, A. K. Goswami, Preeti Singh, Zakir Hussain** and
A. K. Singh***
Division of Fruits and Horticultural Technology, ICAR-Indian Agricultural Research Institute, New Delhi 110 012
ABSTRACTThe present study was conducted for the diversity analysis of 11 dioecious genotypes of papaya based on
various morphological traits. A significant range of variation was noticed for stem colour, which varied from green to greenish light grey in majority of the studied population. The genotype P-9-15-5 was observed with an extreme variation in stem colour i.e., purple pink. For stem pigmentation a predominantly indiscriminate pattern was recorded in most of the genotypes whereas two genotypes namely, P-15-1 and P-9-15-5 were distinct with purple colour pigmentation on the stem of the female and male plants. Leaf petiole colour was primarily light green to green in most of the genotypes, whereas in case of genotype P-9-25, P-14-9 and P-15-2, it was noticed green with shades of purple. Petiole sinus shape varied from slightly open to strongly closed. The wild relative of papaya genotype V. cauliflora was distinct with other genotype with open shape of petiole sinus shape. The mature leaf teeth shape for all the genotypes of papaya was of two types i.e., straight and convex type. Genotype V. cauliflora, RCTP-I, Pusa Dwarf, Pusa Nanha, P-15-1, P-14-6, and P-9-15-5 were with straight mature leaf teeth shape whereas convex leaf teeth shape was recorded in P-9-25, P-14-9 and P-15-2. Inflorescence stalk colour varied from light green to green for all the studied genotypes. Flower colour varied from cream, yellowish white to white in colour in both female and male sexes of the plants. The wild relative, mountain papaya (V. cundinamarcensis) was most distinct genotype among the dioecious population studied. In UPGMA dendrogram based on quantitative traits of dioecious papaya revealed wide distinctness between V. cauliflora and V. cundinamarcensis.Key words: Carica papaya, wild relative, genotype, hybrid, UPGMA.
*Corresponding author's E-mail: [email protected]**Division of Vegetable Science, ICAR-IARI***ICAR-NBPGR, New Delhi
DOI : 10.5958/0974-0112.2018.00031.2

166
Indian Journal of Horticulture, June 2018
in view of the above the present study has been undertaken with an objective to characterize the dioecious papaya genotypes on morphological and reproductive traits.
MATERIALS AND METHODSThe experiment was carried out at the
Experimental Orchard of the Division of Fruits and Horticultural Technology, ICAR-IARI, New Delhi. Total of 11 dioecious genotypes, RCTP-1, Pusa Nanha, Pusa Dwarf, Vasconcellea. cauliflora, Vasconcellea cundinamarcensis, P-15-1, P-9-25, P-14-6, P-14-9, P-9-15-3 and P-15-2 were selected as treatment with 4 replication for the study. The 6 week old seedlings were planted with a spacing of 1.5 m × 1.5 m in the net house and observations were recorded on the traits given in Table 1. Morphological traits were considered from the papaya descriptors of IBPGR (4).
Morphological data from each genotype were compiled and divided into quantitative and qualitative traits. Qualitative character were tabulated and presented as such for characterization. Quantitative traits were subjected to analysis in Power Core 3.0 software. Data from female, hermaphrodite and male plants were grouped according to dioecious and gynodioecious genotype to assess the vegetative traits, while the nine female reproductive traits were assessed independently of the three male reproductive traits. The results from the discriminant analysis and the cluster analysis were compared to assess overall trends.
RESULTS AND DISCUSSIONDiversity among the genetic resources is
the base for any genetic improvement in crop plants. Genotypic diversity is worthless unless it is promptly conserved and efficiently utilized in crop improvement programme. The efficient exploitation and conservation depends on the information available about plant genetic diversity (Bekele et al., 2). In the present investigation, the characterization and genetic diversity of papaya genotypes developed and collected from across the country was evaluated using morphological traits.
The commercial papaya genotypes exhibits moderate to high phenotypic divergence for the morphological parameters namely leaf shape, leaf length, leaf width, type of inflorescence and flowers, fruit shape, fruit length, fruit diameter. The most diverse and economically desirable phenotypic traits of papaya genotypes are related to flower and fruit characteristics. The morphology of papaya inflorescence and flower varies with sex of plant. A significant range of variation was noticed for morphological qualitative traits of the 11 dioecious genotypes of papaya (Table 2). Stem colour varied from greenish light grey to grey among the studied population whereas it was purple pink colour in case of genotype P-9-15-5. A predominantly indiscriminate pattern was recorded for stem pigmentation in most of the genotypes whereas two genotypes namely P-15-1 and P-9-15-5 were distinct with purple colour pigmentation on the stem of the female and male
Table 1. List of the qualitative and quantitative morphological traits of the papaya.
Vegetative ReproductiveFemale Male Hermaphrodite
Stem coloura
Stem pigmentationa
Mature petiole Length (Female)b
Length of mature petiole (Hermaphrodite)b
Length of mature petiole (Male)b
Length of mature leaf (Female)b
Length of mature leaf (Hermaphrodite)b
Length of mature leaf (Male)b
Width of mature leaf (Female)b
Width of mature leaf (Hermaphrodite)b
Width of mature leaf (Male)b
Leaf shapea
Leaf petiole coloura
Petiole sinus shapea
Mature leaf teeth shapea
Sex forma Inflorescence stalk coloura
Flower coloura
Flower sizea
Inflorescence sizea
Fruit diameterb
Length of fruitb
Fruit shapea
Fruit skin coloura
Fruit central cavity shapea
Fruit central cavity indexb
Fruit weightFruit stalk end shapea
Seed coloura
Seed surface lustrea
Flower sizea
Inflorescence sizea
C o l o u r c o r o l l a lobesa
Colour of corolla tubea
Flower coloura
Flower sizea
Inflorescence sizea
Fruit diameterb
Length of fruitb
Fruit shapea
Fruit skin coloura
Fruit central cavity shapea
Fruit central cavity indexb
Fruit weightb
Fruit stalk end shapea
Seed coloura
Seed shapea
Note :a =qualitative traits, b= quantitative traits

167
Genetic Diversity in Qualitative and Quantitative Traits of Papaya
Tabl
e 2.
Mor
phol
ogic
al q
ualit
ativ
e tra
its o
f di
oeci
ous
geno
type
s of
pap
aya
at v
eget
ativ
e an
d re
prod
uctiv
e st
age.
Gen
otyp
es/
Qua
litativ
e tra
its a V
.clf
RC
TP-I
Pus
a D
war
fP
usa
Nan
hab V
. cd
mP
-15-
1P
-9-2
5P
-14-
6P
-14-
9P-
9-15
-5P
-15-
2
Ste
m c
olou
rG
reen
Gre
en
ish
grey
Gre
en
and
light
gre
yG
reen
an
d lig
ht g
rey
Ligh
t gr
eyG
reen
ish
grey
Ligh
t gr
eyG
rey
Gre
enP
urp
le
pink
Gre
en
Ste
m
pigm
enta
tion
Gre
enIn
disc
rimat
eIn
disc
rimna
teIn
disc
rimna
teIn
disc
rimna
teP
urpl
eIn
disc
rimna
teIn
disc
rimat
eIn
disc
rimat
eP
urpl
eIn
disc
rimna
te
Leaf
sha
pe1
101
13
164
102
32
Leaf
pe
tiol
e co
lour
Ligh
t gr
een
Ligh
t gre
enG
reen
pur
ple
Ligh
t gr
een
Ligh
t G
reen
Ligh
t gr
een
Gre
en
with
sh
ades
of
pu
rple
Ligh
t gre
enG
reen
with
sh
ades
of
pu
rple
Ligh
t gr
een
Gre
en
w
ith
purp
le s
hade
Pet
iole
si
nus
shap
eO
pen
Stro
ngly
cl
osed
Stro
ngly
cl
osed
Stro
ngly
cl
osed
Stro
ngly
cl
osed
Slig
htly
op
enS
trong
ly
clos
edS
trong
ly
clos
edS
light
ly
clos
edS
light
ly
open
Slig
htly
clo
sed
Ma
ture
le
af
teet
h sh
ape
Stra
ight
Stra
ight
Stra
ight
Stra
ight
Slig
htly
cl
osed
Stra
ight
Con
vex
Stra
ight
Con
vex
Stra
ight
Con
vex
Inflo
resc
ence
st
alk
colo
urLi
ght
gree
nG
reen
Gre
enLi
ght
gree
nLi
ght
gree
nG
reen
Gre
enG
reen
Gre
enG
reen
Gre
en
Flow
er
colo
ur
(fem
ale)
Whi
teC
ream
Yello
wis
h w
hite
Yello
wis
h w
hite
Cre
amC
ream
Whi
te y
ello
wC
ream
Cre
amC
ream
Yello
wis
h w
hite
Co
lou
r o
f co
rolla
lo
bes
mal
e
Whi
teC
ream
Whi
te y
ello
wC
ream
Whi
tish
Cre
amW
hite
yel
low
Cre
amW
hite
ye
llow
Cre
amC
ream
Co
lou
r o
f co
rolla
tu
bes
mal
e
Whi
teG
reen
ish
yello
wG
reen
ish
yello
wYe
llow
ish
whi
teC
ream
Gre
enis
h ye
llow
Gre
enis
h ye
llow
Gre
enG
reen
ish
yello
wG
reen
ish
yello
wG
reen
ish
yello
w
Flo
we
r si
ze
mal
eS
mal
lS
mal
lS
mal
lS
mal
lS
mal
lS
mal
lS
mal
lM
ediu
mM
ediu
mS
mal
lM
ediu
m
Flo
we
r si
ze
(fem
ale)
Med
ium
Med
ium
Med
ium
Med
ium
Sm
all
Med
ium
Larg
eLa
rge
Larg
eM
ediu
mM
ediu
m
a V.c
lf =V
. cau
liflor
a, b V
. cdm
=V.
cun
dina
mar
cens
is

168
Indian Journal of Horticulture, June 2018
plants. Total six type of leaf shape was observed for the 11 dioecious genotypes. Among the six types, type 1 leaf shape was frequently noticed followed by type 10 and 2 in the dioecious population. A light green colour of leaf petiole was primarily observed for most of the genotypes whereas it was noticed green with shades of purple in case of genotypes P-9-25, P-14-9 and P-15-2. Petiole sinus shape also varied from slightly opens to strongly close. However, most of the papaya genotypes were recorded with strongly closed petiole sinus shape whereas genotype V. cauliflora was recorded with open shape of petiole sinus. The mature leaf teeth shape was of straight and convex type in the studied dioecious genotypes. Genotypes V. cauliflora, RCTP-I, Pusa Dwarf, Pusa Nanha, P-15-1, P-14-6, and P-9-15-5 were observed with straight mature leaf teeth shape whereas convex leaf teeth shape was recorded in P-9-25, P-14-9 and P-15-2 genotypes. Inflorescence stalk colour varied from light green to green among all studied dioecious genotypes. Flower colour variation was also observed among the studied genotype which varied from cream, yellowish white to white in colour in both female and male sexes of the plants. There was not much influence of the type of sex on flower colour of the plants. Colour of corolla lobes of male flowers varied from white to greenish yellow and in case of corolla tubes of male flowers the variation in colour ranged from white to greenish yellow. Flower size was also recorded in a scale of large, medium and small in both female and male plants. The flower size was mostly medium sized in female plants of most of the genotypes, whereas the genotypes such as P-9-25, P-14-6 and P-9-15-5 were observed with large size of flowers. The smallest female flower size was recorded in V. cundinamarcensis followed by V. cauliflora, whereas the genotypes P-9-25, P-14-6 and P-14-9 was noticed with large female flowers. The significant amount of variation observed was based type of sex on inflorescence size of the dioecious genotypes. Data presented in Table 3 revealed that the inflorescence in male plant was large across the genotype whereas it was of small size in female plants. A significant variation was observed in case of fruit shape of female plants of the 11 dioecious genotypes of papaya. It was predominantly oblong shape in most of the genotype whereas elliptic fruit shape was observed in Pusa Dwarf, P-14-6 and P-15-2. There was not much distinction noticed among fruit skin colour in female fruits across the dioecious genotypes. The yellow colour was predominant at the ripening stage in most of the genotype. Fruit central cavity also varied from round, angular to slightly star shaped among the female fruits of dioecious genotypes. The angular shape
was observed in RCTP-1, Pusa Dwarf, P-9-25 and P-9-15-5 papaya genotypes. The genotypes such as, P-15-1, P-14-9 and P-15-2 was observed with slightly star shaped fruit central cavity. Fruit stalk end shape was predominantly flattened in majority of studied dioecious female genotypes followed by depressed stalk end in RCTP-1, Pusa Dwarf, P-14-6 and P-9-15-5 genotypes. Sudha et al. (10) reported widest morphological diversity in terms of fruit weight, fruit length, fruit girth among genotypes collected from different parts of South and Little Andaman Islands. The seed colour variation was also recorded across the population, it varied from black, brownish black to grey in colour but the variation was largely dependent on the type of genotype plants. There was narrow variation among the genotypes for seed surface luster and seed shape. The seed surface was predominantly dull in most of the genotypes. Seed shape greatly varied in two wild genotypes V. cundinamarcensis and V. cauliflora and in one commercial genotype i.e., Pusa Dwarf, in a range of spherical and completely distinct from other genotypes of the population. Similar physical characteristics of the papaya seeds were also reported by Mengarda et al. (6).
Paired dissimilarity matrix presented in Table 4 shows wide range of dissimilarity ranging from 1.7 to 8.8 among the 11 dioecious genotype of papaya based on the 12 morphological quantitative distances. The largest distinction (8.8) was observed between genotype P-14-9 and V. cundinamarcensis followed by (7.7) P-15-2 and V. cundinamarcensis based on Euclidean distance. The similar distinctness was also observed between P-9-15-5 and Vasconcellea cundinamarcensis (7.6), V. cundinamarcensis and V. cauliflora (7.5), P-9-25 and P-14-9 (7.5) and Pusa Dwarf and V. cundinamarcensis (7.4). However, maximum closeness (1.2) was observed between Pusa Nanha and P-14-6 followed by Pusa Nanha and P-15-2 (1.6); Pusa Nanha and P-15-1 (1.7); Pusa Nanha and Pusa Dwarf (1.7).
Data illustrated in Fig. 1 indicate a wide range of variation among the dioecious genotype of papaya. The clustering was carried out based on Euclidean coefficient in a range of 2.16 to 7.39. Total 3 clusters were observed among the 11 studied dioecious papaya genotypes. The two wild species of papaya namely V. cundinamarcensis and V. cauliflora were observed in same cluster no. ‘I’. The closeness were recorded in RCTP-I and P-9-15-5 followed by Pusa Nanha and P-14-6 based on morphological quantitative traits. The analysis of the dendrogram on dioecious genotypes indicates a significant influence of type of sex on the quantitative traits.
The principle component based analysis was carried out of morphological quantitative traits of

169
Genetic Diversity in Qualitative and Quantitative Traits of PapayaTa
ble
3. M
orph
olog
ical
qua
litat
ive
char
acte
rs o
f di
oeci
ous
geno
type
s of
pap
aya.
Gen
otyp
es /
Q
ualit
ativ
e tra
its
a V.c
lfR
CTP
-IPu
sa D
war
fP
usa
Nan
hab V
. cd
mP
-15-
1P
-9-2
5P
-14-
6P
-14-
9P
-9-1
5-5
P-1
5-2
Inflo
resc
ence
si
ze
(mal
e)M
ediu
mLa
rge
Larg
eLa
rge
Med
ium
Med
ium
Larg
eLa
rge
Med
ium
Larg
eLa
rge
Inflo
resc
ence
si
ze
(fem
ale)
Sm
all
Med
ium
Sm
all
Sm
all
Sm
all
Med
ium
Med
ium
Med
ium
Larg
eM
ediu
mLa
rge
Frui
t sha
pe (f
emal
e)O
blon
gO
blon
gE
llipt
icO
val
Pea
r sh
aped
Hig
h ro
und
Rou
ndE
llipt
icO
blon
gO
blon
gE
llipt
ic
Fru
it sk
in
colo
ur
(fem
ale)
Yello
wYe
llow
Yello
wis
hG
reen
ish
yello
wYe
llow
Yello
wLi
ght
yello
wYe
llow
Yello
wYe
llow
Gre
enis
h Ye
llow
Frui
t ce
ntra
l ca
vity
sh
ape
(fem
ale)
Ro
un
d
to
angu
lar
Ang
ular
Ang
ular
Rou
ndR
ound
Slig
htly
sta
r sh
aped
Ang
ular
Rou
ndS
light
ly s
tar
shap
edA
ngul
arSl
ight
ly s
tar
shap
edF
ruit
st
alk
end
shap
e (fe
mal
e)Fl
atte
ned
Dep
ress
edD
epre
ssed
Flat
tene
dFl
atte
ned
Flat
tene
dFl
atte
ned
Dep
ress
edFl
atte
ned
Dep
ress
edFl
atte
ned
Seed
col
our (
fem
ale)
Gre
yB
row
nish
bl
ack
Gre
yB
lack
Bro
wn
Bro
wn
ish
blac
kG
rey
Bla
ckG
rey
Bro
wni
sh
blac
kG
rey
See
d su
rface
lust
er
(fem
ale)
Inte
rmed
iate
Dul
lG
loss
yIn
term
edia
teD
ull
Glo
ssy
Dul
lD
ull
Dul
lD
ull
Dul
l
Seed
sha
pe (f
emal
e)S
pher
ical
Ovo
idS
pher
ical
Ovo
idS
pher
ical
Ovo
idO
void
Ovo
idO
void
Ovo
idR
ound
a V.c
lf =V
. cau
liflor
a, b V
. cdm
=V.
cun
dina
mar
cens
is
Tabl
e 4.
Pai
red
diss
imila
rity
mat
rix b
ased
on
Euc
lidea
n di
stan
ce o
f 12
qua
ntita
tive
traits
of
11 d
ioec
ious
pap
aya
geno
type
s.
Gen
otyp
ea V
.clf.
RC
TP-I
Pus
a D
war
fP
usa
Nan
hab V
.cdm
.P
-15-
1P
-9-2
5P
-14-
6P
-14-
9P
-9-1
5-5
P-1
5-2
a V.c
lf.0
RC
TP-I
4.6
0P
usa
Dw
arf
2.9
2.9
0P
usa
Nan
ha3.
51.
81.
70
b V.c
dm.
7.5
7.6
7.4
6.8
0P
-15-
13.
92.
42.
51.
76.
30
P-9
-25
6.6
4.9
5.2
4.6
4.8
40
P-1
4-6
3.7
2.2
2.5
1.2
6.4
2.3
50
P-1
4-9
3.6
4.2
3.2
3.2
8.8
4.6
7.5
3.1
0P
-9-1
5-5
4.5
3.5
2.9
1.8
7.6
2.4
4.9
2.2
4.1
0P
-15-
23.
82.
72.
41.
67.
73
5.9
1.8
2.2
2.7
0a V
.clf
=V. c
aulifl
ora,
b V. c
dm =
V. c
undi
nam
arce
nsis

170
Indian Journal of Horticulture, June 2018
papaya. The range of component 1 was -0.8 to 0.7 based on Euclidean distance. The values presented in Table 5 indicate that P-14-9, RCTP-I, P-15-5, P-15-2 and Pusa Dwarf are the larger contributor of the variation based on morphological quantitative traits whereas V. cundinamarcensis is among the lower contributor for the variation in component “I’. However, genotype P-15-1 was among the lower contributor across the four components. Data presented in Table 5 further revealed in component 2 that V. cauliflora is a largest contributor of the variation with a value of 0.8 but same genotype contribution value was 0 in component 3. In component 4 the variation level was reduced compare to component 1, 2 and 3 across the 11 dioecious genotypes. The Principle component analysis of dioecuious genotypes of papaya gives a description when a lot of traits were accounted concurrently expressing a significant variation in the morphological qualitative and quantitative parameter and other important economical traits. However, cluster analysis of dioecious genotypes indicated a clear and informative unveil of the relative positions of the inbred lines and varieties. The similar findings have been published earlier in case of papaya (Ocampo et al., 8).
Many genotypes of papaya both inbred lines and varieties were grown and possess significantly higher divergence in both qualitative and quantitative traits morphological and traits of gynodioecious and dioecious genotype and it can be utilized further
in the selection, conservation and development of improved varieties of papaya. A significant level of variation was observed on qualitative traits of papaya particularly with two wild species V. cauliflora and V. cundinamarcensis. Carica papaya, highland papayas are generally smaller and have distinct texture, taste and aroma (Scheldeman et al., 9). The wild species of papaya V. cauliflora and V. cundinamarcensis required special attention of researches particularly breeders to exploit the genetic resistance source inongoing and future breeding programs of papaya.
Fig. 1. Dendrogram showing clustering of 11 dioecious genotypes on quantitative traits.
Table 5. Principle component based analysis of 11 quantitative traits of dioecious papaya genotypes.
Genotype C1 C2 C3 C4V. cauliflora 0.1 0.8 0 0.3RCTP-I 0.5 -0.2 0.3 0.1Pusa Dwarf 0.3 0.4 -0.2 -0.2Pusa_Nanha 0.2 -0.1 0 -0.1V. cundinamarcensis -2 -0.2 0 0.2P-15-1 0 0.1 0.3 -0.3P-9-25 -0.8 0.1 -0.1 -0.3P-14-6 0.1 -0.3 0 0.1P-14-9 0.7 -0.2 -0.3 0.1P-9-15-5 0.5 -0.2 0.3 0.1P-15-2 0.5 -0.3 -0.2 -0.1

171
Genetic Diversity in Qualitative and Quantitative Traits of Papaya
A significant amount of morphological diversity was observed among the studied genotypes of papaya, especially for stem and petiole colour, petiole length, flower size, fruit length and diameter, fruit central cavity index and seed surface luster. The wild relative mountain papaya (V. cundinamarcensis) was most distinct genotype among the dioecious population.
REFERENCES 1. Badillo, V.M. 2000. Carica L. vs. Vasconcella St.
Hil. (Caricaceae) con la rehabilitación de este último. Ernstia, 10: 74-79.
2. Bekele, Y.D. 2005. Estimation of the level of genetic variation among currently grown C. arabica genotypes in Ethiopia. PhD thesis. University of the Free State, Bloemfontein, South Africa.
3. Chan, Y.K. 2009. Breeding papaya (Carica papaya L.). In: Jain SM (ed.), Priyadarshan PM (ed.). Breeding Plantation Tree Crops: Tropical Species. Springer Science + Business Media, pp. 121-159.
4. IBPGR. 1988. Descriptors for papaya. International Board for Plant Genetic Resources, Rome, Italy. 33 p.
5. Kim, M.S., Moore, P.H., Fitch, M.M.M., Steiger, D.L., Manshardt, R.M., Paull, R.E., Drew, R.A., Seioka, T. and Ming, R. 2002. Genetic diversity of Carica papaya L. as revealed by AFLP markers. Genome, 45: 503-12
6. Mengarda, Liana Hilda Golin, José Carlos Lopes, Rafael Fonseca Zanotti1, Rodrigo
Sobreira Alexandre. 2015. Diversity analysis of papaya (Carica papaya L.) genotypes related to seed quality. Australian J. Crop Science. 9: 223-31.
7. Ming, R., Van, D.B., Moore, P.H., Zee, F.T., Kynd, T., Scheldeman, X., Sekioka, T., Gheysen, G. 2005. Molecular diversity of Carica papaya and related species. In: Sharma AK, Sharma A (eds) Plant genome: biodiversity and evolution, vol 1B: Phanerograms. Science Publishers, Enfield. pp. 229-254.
8. Ocampo, J., d’Eeckenbrugge, G. C., Bruyère, S., de Bellaire, L. D. L., & Ollitrault, P. 2006. Organization of morphological and genetic diversity of Caribbean and Venezuelan papaya germplasm. Fruits, 61: 25-37.
9. Scheldeman, X., Willemen, L., Coppens d’Eeckenbrugge, G., Romeijn-Peeters, E., Restrepo MT, Romero Motoche J, Jiménez D., Lobo M, Medina CI, Reyes C., Rodríguez D, Ocampo, J.A., Van Damme P, Goetgebeur, P. 2007. Distribution, diversity and environmental adaptation of highland papayas (Vasconcellea spp.) in tropical and subtropical America. Biodiv. and Conser. 16: 1867-84.
10. Sudha, R., Singh, D. R., Sankaran, M., Singh, S., Damodaran, V., & Simachalam, P. 2013. Genetic diversity analysis of papaya (Carica papaya L.) genotypes in Andaman Islands using morphological and molecular markers. African J. Agric. 8: 5187-92.
Received : June, 2017; Revised : April, 2018; Accepted : May, 2018

172
Indian J. Hort. 75(2), June 2018: 172-176
INTRODUCTIONWalnuts are members of the family Juglandaceae
and genus Juglans L. containing about 60 species, 21 of which are placed in the genus Juglans. Walnut is a monoecious species that is pollinated by the wind (Westwood, 13). The most commonly grown tree for nuts is the English or Persian Walnut, (Juglans regia L.) as it is rich source of energy, protein, fibre, minerals, anti-oxidants and vitamins which are essential for optimum health. This alpha-linolenic acid has substantial cardio protective effects as it surges the ratio of high-density lipoprotein cholesterol to total cholesterol, thereby, plummeting the inflammation and mending arterial function. It is grown mainly in Jammu & Kashmir, Himachal Pradesh, Uttarakhand and Arunachal Pradesh. However Jammu & Kashmir is the major walnut producing state contributing 80.58% of total area and 91.16% total production of the country. The most important walnut growing districts in Kashmir are Anantnag, Pulwama, Kupwara, Budgam, Baramulla and Srinagar, while in Jammu region Doda, Kistwar, Poonch, Udhampur are major region whereas minor plantation also exist in Rajouri and Kathua. Walnut germplasm has been extensively used in the selection studies for producing the superior walnut
clones (Botu et al., 2) .A wide range of variability exists in walnut in India for all important economic characters suggesting substantial scope for improvement. Varietal identification has attained critical importance in view of the intellectual property rights (IPR) regime enforced in the country as per trade related aspects of intellectual property rights (TRIPS) agreements under WTO to protect plant breeders and farmer’s rights. The UPOV convention provides DUS testing of crop varieties, and has been adopted worldwide. The testing for distinctness, uniformity and stability (DUS) is the basis for grant of protection of new plant varieties under the protection of plant varieties and Farmer’s Right Act. 2001 in India. The act has provision to compare the candidate variety with the genotypes of common knowledge on a set of relevant characteristics prescribed in the Draft National Test Guidelines for DUS testing of walnut. Therefore, the present study was undertaken with the objective to characterize 27 walnut genotypes on the basis of morphological characters to validate the distinctness of the walnut germplasm. This investigation may also be helpful to the researchers with respect to improvement of walnut genotypes for particular traits in the targeted regions.
MATERIALS AND METHODSTo investigate the morphological diversity a total of 27
walnut genotypes viz., CITH-W-1, CITH-W-2, CITH-W-3,
Morphological characterization of walnut genotypes of diverse originJ.I. Mir*, N. Ahmed**, D.B. Singh, Megna Rashid, S.R. Singh***, O.C. Sharma, S. Lal
and Anil SharmaICAR-Central Institute of Temperate Horticulture, Old Air Field, P.O., Rangreth, Srinagar 190 007, Jammu & Kashmir
ABSTRACT Walnut (Juglans regia L.) is a major nut crop of temperate region and the existing germplasm available
in the country is of seedling origin, thus, contributing towards the large variability in this crop. Therefore, a research study was carried out ICAR-CITH, Srinagar to characterized and decipher the genetic variability among 27 genotypes of Indian walnut (Juglans regia L.) based on morphological characters, viz., growth habit, bearing habit, foliage, fruit and kernel characteristics for further improvement, conservation and utilization. The Erect growth habit was noticed in genotype, viz., CITH-W-12, while semi erect growth habit was noticed in majority of the genotypes. Three types of leaf shapes were recorded i,e narrow elliptic, elliptic, and broad elliptic and based on leaf characteristics all the genotypes could also be categorized viz. pubescence as glabrous, slightly pubescent and pubescent. The genotype was categorized into early, mid and late group based on their fruit maturity duration. High variability was also recorded for fruit shape viz, round, cordate, ovate, long trapezoid, and elliptic. The current findings clearly characterized each genotype and can be identified or grouped individually based on this descriptor. Present study provides the detailed morphological descriptor of walnut which can be utilised for DUS testing of walnut, varietal identification, characterization, registration, documentation etc. The database generated may be useful for comparison against the candidate varieties developed in futureKey words: Juglans regia, DUS descriptor, Kernel, Nut.
*Corresponding author’s E-mail: [email protected]**Sher-e-Kashmir University of Agricultural Sciences and Technology, Srinagar***ICAR-Central Institute of Subtropical, Horticulture, Lucknow
DOI : 10.5958/0974-0112.2018.00032.4
173
Morphological Characterization of Walnut Genotypes
CITH-W-4, CITH-W-5, CITH-W-6, CITH-W-7, CITH-W-8, CITH-W-9, CITH-W-10, CITH-W-11, CITH-W-12, CITH-W-13, CITH-W-14, CITH-W-15, CITH-W-16, CITH-W-17, CITH-W-18, CITH-W-19, CITH-W-20, Opex Caulchry, Sulaiman, Hamdan, Nugget, Franquette, Tutle, and Cheinova were evaluated at field gene bank of ICAR-Central Institute of Temperate Horticulture, Srinagar (J&K), India in a randomized block design with three replications (Gomez and Gomez, 6). The spacing adopted was 6 m × 6 m. The genotypes were evaluated for 29 characters at specific stage of crop growth when characteristics had full expression. To establish distinctiveness among cultivars, the descriptors of essential characters (Table 1 and Fig. 1) were used in sequential manner as per the National Guidelines for the Conduct of Test for Distinctiveness, Uniformity and Stability on walnut (UPOV, 12) Accordingly, for the assessment of distinctiveness and stability, observation were made on 6 plants or 18 parts taken from each of 6 plants with the exception of the observations on nut and kernel which were made on 20 nuts. All observations on the tree and the branches were made during dormancy. Observations on the mature fruit/nut were recorded when fruit was ready for harvesting and packaging tissue was turning brown. Observations on the leaf were made on fully developed leaves of the middle third of current season’s shoot.
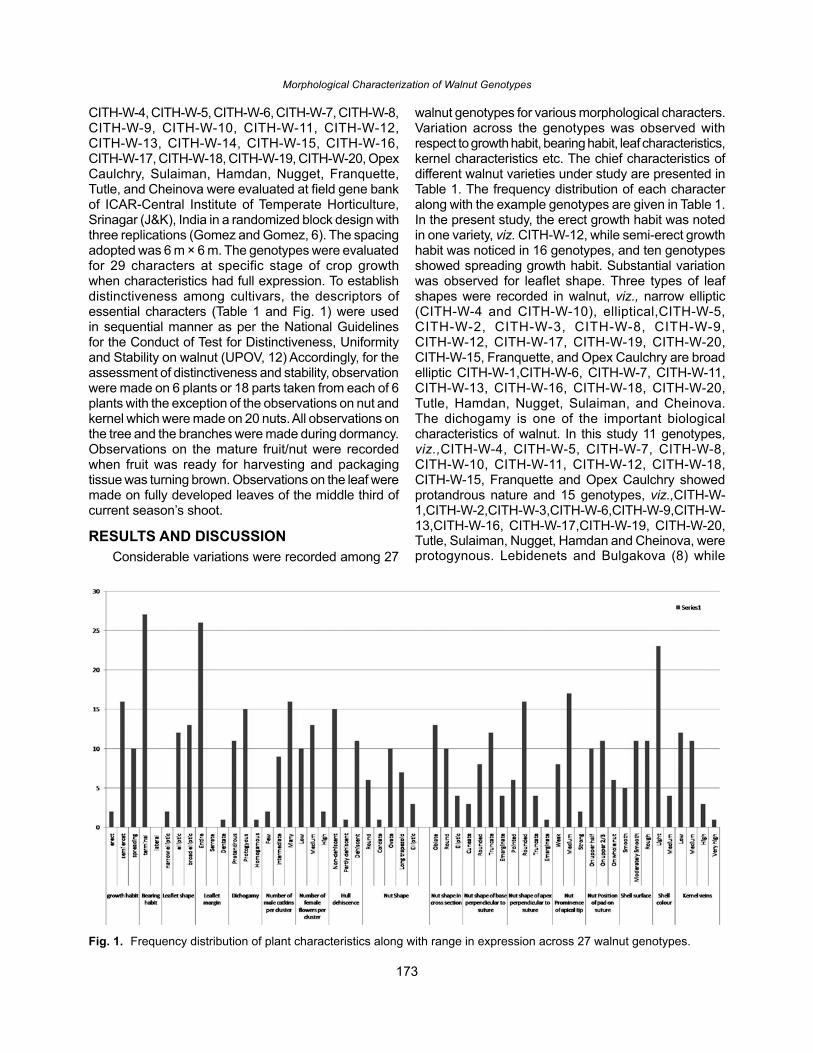
RESULTS AND DISCUSSIONConsiderable variations were recorded among 27
walnut genotypes for various morphological characters. Variation across the genotypes was observed with respect to growth habit, bearing habit, leaf characteristics, kernel characteristics etc. The chief characteristics of different walnut varieties under study are presented in Table 1. The frequency distribution of each character along with the example genotypes are given in Table 1. In the present study, the erect growth habit was noted in one variety, viz. CITH-W-12, while semi-erect growth habit was noticed in 16 genotypes, and ten genotypes showed spreading growth habit. Substantial variation was observed for leaflet shape. Three types of leaf shapes were recorded in walnut, viz., narrow elliptic (CITH-W-4 and CITH-W-10), elliptical,CITH-W-5, CITH-W-2, CITH-W-3, CITH-W-8, CITH-W-9, CITH-W-12, CITH-W-17, CITH-W-19, CITH-W-20, CITH-W-15, Franquette, and Opex Caulchry are broad elliptic CITH-W-1,CITH-W-6, CITH-W-7, CITH-W-11, CITH-W-13, CITH-W-16, CITH-W-18, CITH-W-20, Tutle, Hamdan, Nugget, Sulaiman, and Cheinova. The dichogamy is one of the important biological characteristics of walnut. In this study 11 genotypes, viz.,CITH-W-4, CITH-W-5, CITH-W-7, CITH-W-8, CITH-W-10, CITH-W-11, CITH-W-12, CITH-W-18, CITH-W-15, Franquette and Opex Caulchry showed protandrous nature and 15 genotypes, viz.,CITH-W-1,CITH-W-2,CITH-W-3,CITH-W-6,CITH-W-9,CITH-W-13,CITH-W-16, CITH-W-17,CITH-W-19, CITH-W-20, Tutle, Sulaiman, Nugget, Hamdan and Cheinova, were protogynous. Lebidenets and Bulgakova (8) while
Fig. 1. Frequency distribution of plant characteristics along with range in expression across 27 walnut genotypes.

174
Indian Journal of Horticulture, June 2018Ta
ble
1: C
hara
cter
izat
ion
of w
alnu
t ge
noty
pes
base
d on
DU
S d
escr
ipto
r.
Cha
ract
er
Gen
otyp
e
Tree vigour (TV)
Growth habit (GH)
Density of branches (DB)
Bearing habit (B H)
Leaf let length (LL)
Leaflet shape (LS)
Leaflet margin (LM)
Leaflet colour (LC)
Rachis colour (RC)
Leaflet rachis persistence (LRP)
Shoot pubescence (SP)
Shoot colour (SC)
Dichogamy (D)
No. of male catkins per cluster (NMC)
No. of female catkins per cluster (NFC)
Stigma colour (SC)
Hull dehiscence (HD)
Nut shape (NS)
Shape in cross section (SCS)
Shape of base perpendicular (SB)
Nut diameter (ND)
Nut Length (NC)
Nut Weight (NW)
Shell surface (SS)
Shell colour (SC)
Shell seal (SS)
Shell thickness (ST)
Kernel weight (KW)
Kernel colour (KC)
CIT
H-W
-17
57
17
33
73
72
55
75
37
63
57
77
33
51
71
CIT
H-W
-25
55
13
23
73
53
55
75
37
47
57
75
73
52
72
CIT
H-W
-33
75
13
23
73
71
55
55
37
47
35
57
73
92
72
CIT
H-W
-45
77
17
23
55
33
53
75
37
63
37
77
73
72
72
CIT
H-W
-57
75
13
23
53
73
55
75
37
45
57
77
33
72
71
CIT
H-W
-65
55
17
33
53
33
55
75
37
45
77
77
73
52
72
CIT
H-W
-75
55
15
23
55
21
53
73
37
87
17
77
75
72
74
CIT
H-W
-85
55
13
13
55
73
53
75
37
63
17
77
73
52
72
CIT
H-W
-9
55
71
52
37
37
15
57
53
71
35
77
75
35
27
2C
ITH
-W-1
05
57
13
13
73
52
53
55
37
63
37
77
53
52
72
CIT
H-W
-11
55
71
73
37
37
15
37
73
71
33
55
55
35
25
1C
ITH
-W-1
25
35
13
23
77
72
53
55
37
55
75
55
53
72
54
CIT
H-W
-13
57
71
73
37
37
25
57
37
76
55
75
73
37
25
2C
ITH
-W-1
45
77
17
33
73
72
55
73
37
63
37
57
33
72
52
CIT
H-W
-15
55
71
73
33
37
15
37
33
76
55
75
75
37
27
1C
ITH
-W-1
65
77
17
33
73
71
55
57
37
45
55
57
53
72
72
CIT
H-W
-17
57
71
73
37
37
15
55
77
78
35
55
77
37
27
4C
ITH
-W-1
87
57
15
23
73
53
53
55
77
13
57
77
73
52
72
CIT
H-W
-19
57
71
72
37
35
15
55
35
73
33
77
77
37
55
2C
ITH
-W-2
05
57
17
33
73
52
55
53
37
43
77
77
53
32
52
Ope
x C
aulc
hry
37
11
22
37
73
35
37
53
71
55
53
55
72
32
Sul
aim
an5
57
17
33
73
52
55
73
37
15
55
55
75
51
51
Ham
dan
77
71
73
35
35
25
53
33
74
77
57
53
33
15
1N
ugge
t7
55
17
33
53
52
55
75
37
33
75
53
53
92
32
Fran
quet
te5
55
13
27
57
72
53
55
37
83
33
33
55
91
32
Tutle
35
13
33
73
31
55
75
77
13
33
33
55
71
77
Che
inov
a5
55
15
33
77
71
55
73
37
47
15
73
55
72
52

175
Morphological Characterization of Walnut Genotypes
TV:
Low
(3)
, In
term
edia
te (
5),
Hig
h (7
)G
H: E
rect
(3),
Sem
i ere
ct (5
), Sp
read
ing
(7)
DB
: Spa
rse
(3),
Inte
rmed
iate
(5),
Den
se (7
)B
H:
Term
inal
(1)
, La
tera
l ( 9
)LL
G:
Sho
rt (3
), M
ediu
m (
5),
Long
(7)
, LS
: N
arro
w e
llipt
ic (
1),
Elli
ptic
(2)
, B
road
el
liptic
(3)
LM:
Ent
ire (
3),
Ser
rate
(5)
LC: L
ight
gre
en (3
), G
reen
(5),
Dar
k gr
een
(7),
Pur
plis
h (9
)R
C:
Gre
en (
3),
Yello
w (
5),
Red
(7)
LRP:
Few
(3)
, In
term
edia
te (
5),
Man
y (7
)SP
: G
labr
ous
(1),
Slig
htly
pub
esce
nt (
2),
Pub
esce
nt (
3),
SC: G
reen
(3)
, Bro
wn
(5),
Dar
k B
row
n (7
)
D:
Pro
tand
rous
(3
),
Pro
togy
nous
(5
), H
omog
amou
s (7
),N
MC
: Few
(3)
, Int
erm
edia
te (
5), M
any
(7)
NFC
: Lo
w (
3),
Med
ium
(5)
, H
igh
(7),
SC:
Gre
en (
3),
Yello
w (
5),
Red
(7)
HD
: N
on–d
ehis
cent
(3)
, P
artly
deh
isce
nt
(5),
Deh
isce
nt (
7)N
S:
Rou
nd
(1),
trian
gula
r (2
), co
rdat
e (3
), O
vate
(4)
, S
hort
trape
zoid
(5)
, Lo
ng
trape
zoid
(6)
, B
road
Elli
ptic
(7)
ND
: S
mal
l (3)
, M
ediu
m (
5),
Larg
e (7
)N
L: S
mal
l (3)
, M
ediu
m (
5),
Larg
e (7
)
NW
: Li
ght
(3),
Med
ium
(5)
, H
eavy
(7)
SS:
Sm
ooth
(3)
, M
oder
atel
y (5
), S
moo
th
Rou
gh (
7)SC
: Ve
ry li
ght
(1),
Ligh
t (3
), M
ediu
m (
5),
Dar
k (7
)SS
: Wea
k (3
), In
term
edia
te (5
), S
trong
(7),
very
stro
ng (
9)ST
: Th
in (
1),
Med
ium
(2)
, Th
ick
(3)
KW
: Li
ght.
(3),
Med
ium
(5)
, H
eavy
(7)
KC
: E
xtra
lig
ht (
1),
Ligh
t (2
), A
mbe
r (4
), D
ark
Am
ber
(7)
SCS:
Obl
ate
(3),
Rou
nd (
5),
Elli
ptic
(7)
SBP:
Cun
eate
(1)
, R
ound
ed (
3),
Trun
cate
(5
), em
argi
nate
d (7
)
studying the floral biology of 83 walnut genotypes reported that majority of the population (67.06%) was protogynous in nature while as (Yadrow and Zinin, 14) reported that higher proportion (60%) of walnut genotypes were protoandrous in nature. In our study 40.70% genotypes showed protoandry and 55.5% genotypes were protogynous. Nut shape was found to be one of the key characters which categorize the walnut genotypes into five groups. The nut shape showed great diversity within the population. Nut shape range from round (Sulaiman, Opex Caulchry, Tutle,CITH-W-9, CITH-W-11,CITH-W-18), cordate (Nugget), ovate (Cheinova, Hamdan, CITH-W-2, CITH-W-3, CITH-W-5, CITH-W-6, CITH-W-12, CITH-W-16, CITH-W-19, CITH-W-20), long trapezoid (CITH-W-1,CITH-W-4, CITH-W-8, CITH-W-10, CITH-W-13, CITH-W-14, CITH-W-15) and elliptic (Franquette, CITH-W-7,CITH-W-17). Eskandari et al. (5) also selected some genotypes according to yield and nut characteristics from natural populations in different provinces. High variability in nut traits has been reported in walnut trees in different countries. In many countries, selection of walnut was carried out by method of simple selection out of natural seedling populations with high quality walnuts. A great range of variability was observed for various nut and kernel characters on 23 bearing seedling trees in Ladakh region of India by Sharma et al. (11). Nut shape in cross section and nut shape of base perpendicular to suture also varied among different walnut genotypes (Fig. 1). Thirteen genotypes viz., Franquette, Nugget, CITH-W-1, CITH-W-4, CITH-W-8, CITH-W-9, CITH-W-10, CITH-W-11, CITH-W-14, CITH-W-17, CITH-W-18, CITH-W-19, and CITH-W-20 had oblate nut shape in cross section while ten genotypes viz Sulaiman, Opex Caulchry, Tutle, CITH-W-2, CITH-W-5, CITH-W-6, CITH-W-12, CITH-W-13, CITH-W-15 and CITH-W-16 had round shape and four genotypes viz Cheinova, Hamdan, CITH-W-3 and CITH-W-7 have elliptic nut shape in cross section, Nut shape of base perpendicular to suture also showed variation across the genotypes, maximum number of genotypes were having truncate shape of base perpendicular to suture. Other nut characters like nut shape of apex perpendicular to suture, nut prominence of apical tip, nut position pad on suture also varied among different walnut genotypes. Shell character like shell colour and shell surface were also different across walnut genotypes. Maximum genotypes Hamdan, Nugget, Tutle, Sulaiman, CITH-W-1, CITH-W-2, CITH-W-3, CITH-W-4, CITH-W-5, CITH-W-6, CITH-W-8, CITH-W-9, CITH-W-10, CITH-W-11, CITH-W-12, CITH-W-13, CITH-W-14, CITH-W-15, CITH-W-16, CITH-W-17, CITH-W-18, CITH-W-19 and CITH-W-20 had light shell colour. Shell surface also varied from smooth, moderately smooth to rough. Hamdan, CITH-W-1, CITH-W-13, CITH-W-14 and CITH-W-5 have smooth shell surface

176
Indian Journal of Horticulture, June 2018
while as Nugget, Cheinova, Opex Caulchry, Tutle, CITH-W-10, CITH-W- 11, CITH-W-12, CITH-W-15, CITH-W-16 and CITH-W-20 have moderately smooth shell surface and genotypes like Sulaiman, CITH-W-2, CITH-W-3, CITH-W-4, CITH-W-6, CITH-W-7, CITH-W-8, CITH-W-9, CITH-W-7, CITH-W-18 and CITH-W-19, have rough shell surface. Twelve genotypes (Tutle, Opex Caulchry, CITH-W-1, CITH-W-2, CITH-W-3, CITH-W-10, CITH-W-11, CITH-W-12, CITH-W-15, CITH-W-17, CITH-W-18, and CITH-W-20) had low kernel veins, while Sulaiman have very high kernel veins. Enormous variability has been reported in nut traits e.g., nut sizes (small to very large), shape, shell thickness (very thin to very thick), the degree of shell seal, the colour of kernels, taste and appearance of kernels. High variability in nut traits e.g. nut sizes, shape, shell thickness, kernel percent, colour of kernels and taste of kernels, has been reported in walnut trees in different regions (Casal et al,. 4 and Khan et al., 7) .The variability found in the present study is in agreement with that reported for the Eurasian walnut distribution range from Iran (Atefi, 1) and India (Sharma and Sharma, 10). The descriptor will benefit the users of plant genetic resources working with walnut and in general will make access to diversity of the walnut crop by the researchers or users of genetic resources (Biodiversity International. 3). Development of morphological descriptor in walnut for DUS testing will be useful for varietal identification, registration, characterization, documentation etc. The detailed descriptor will be useful for creating plant genetic resource database (Singh et al., 9).
ACKNOWLEDGEMENTSThe author thanks the Protection of Plant Varieties
and Farmers Rights Authority, (PPV&FRA), New Delhi, GoI for providing financial support in this study. The authors are also thankful to the Director, ICAR-Central Institute of Temperate Horticulture, Srinagar (J&K) for providing facilities.
REFERENCES1. Atefi, J. 2001. Evaluation of walnut genotype in
Iran. Acta Hort. 311: 25-33.
2. Botu, M., Tudor, M.I., Botu, C. S. and Papachatzis, A. 2010. Evaluation of walnut cultivars in the conditions of the Oltenia’s hill area regarding functioning potential. Analele Universitatii din Craiova, Biologie, Horticultura, Tehnologia prelucrarii produselor agricole, Ingineri amediului 15: 94-103.
3. Biodiversity International. 2007. Guidelines for the development of crop descriptor lists. Biodiversity Technical Bulletin Series. Biodiversity International, Rome, Italy, XII 72 p.
4. Casal, A., Diaz, R. and Fernández- López, J. 2005. Genetic variation of different Juglans species in Galicia (Spain). Acta Hort. 705: 123-29.
5. Eskandari, S.D., Hassani, and Abdi, A. 2005. Investigation on genetic diversity of Persian walnut and evaluation of promising genotypes. Acta Hort. 705: 159-63.
6. Gomez, K.A. and Gomez, A.A. 1984. Statistical Procedures for Agricultural Research (2nd Edn.), John Wiley and sons Inc., New York, 680 p.
7. Khan, W. M., Khan, I.A., Ahmad, H., Ali, H., Ghafoor, S., Afzal, M., Khan, F.A., Shah, M. and Afridi, S.G. 2010. Estimation of genetic diversity in walnut. Pak. J. Bot. 42(3): 1791-1796.
8. Lebidenets, L.N. and Bulgakova, L.V. 1978. Bearing in walnut trees with different dicogamy. Hort. Ab. 48: (10): 785.
9. Singh, P., Santhy, V., Vijayakumari, P. R. and Deshmukh, R.K. 2005. Guidelines for DUS Testing in cotton. In: Training Manual on DUS Test in Cotton with reference to PPV&FR legislation, 2001, pp 61-4, Rathinavel, K. Maniekam and Sabesh, M. (Eds.). Project Coordinator(Cotton Improvement) and Head, All India Coordinated Cotton Improvement Project and Central Institute foe Cotton, Research Regional Station, Coimbatore.
10. Sharma, O.C. and Sharma, S.D. 2001. Genetic divergence in seedling trees of Persian walnut (Juglans regia L.) for various nut and kernel characters in Himachal Pradesh. Sci. Hortic. 88: 163-17.
11. Sharma, O., Liaqat, A.C. Ghanai, N.A. and Sandeep, K. 2010. Variability and nut characteristics of seedling walnuts (Juglans regia L.) growing in Ladakh Region of India. Res. J. Agri. Sci. 1: 219-23.
12. UPOV 1999. Guidelines for the Conduct of Tests for Distinctness, Uniformity and Stability in Walnut. TG/125/16, GENEVA, Switzerland.
13. Westwood, M.N. 1993. Temperate Zone Pomology: Physiology and Culture (3rd Edn.), Portland, Oregon, Timber Press. 553 p.
14. Yadrow, A.A. and Zinin, G.V. 1985. Dichogamy and fruit production. Pl. Br. Ab. 55: 792
Received : June, 2017; Revised : February, 2018; Accepted : May, 2018

177
DOI : 10.5958/0974-0112.2018.00033.6
Indian J. Hort. 75(2), June 2018: 177-184
INTRODUCTIONZiziphus nummularia (Burm.f) Wight & Arn.
commonly called “jharberi” (synonyms: jjadiaber, birar, kokni-ber, bhor, zariab) is a multipurpose, under-exploited, wild fruit tree species. It is distributed from Iran to India generally at altitudes up to 600m. In India, it is well distributed in dry and hot climate prevailing in arid and semi-arid regions of western plains, central India and extending to southern peninsular region. It is a bushy shrub, thorny, about 1.8-2.4 m height, leaves on short petiole, flowers 10-20 in auxiliary bundles, drupe globose of 8.3 mm diameter, red, glabrous (Pandey et al., 7). It grows in the wild and valued for edible fruits, leaves as fodder, branches for fencing, wood as fuel, for construction and furniture, as folk medicine and role in soil conservation. Z. nummularia can tolerate various stresses like drought, salinity and temperature (Pareek, 8). It provides sustenance for the desert living animals and human population at the time of scarcity or during off-season. This species is very important in providing nutrition to desert dwellers during crop failure or famine. Therefore, Z. nummularia has vital role in the sustainability of desert ecosystem. The natural variations in Z. nummularia due to cross pollination, heterozygosity, and difference in ploidy level provide us opportunities for selection of better genotypes for various uses (Vashishtha, 14). To select these
variations and promote sustainable conservation of this species, understanding its genetic diversity is far most important. Diversity among Z. nummularia genotypes at molecular level has not been studied so far. Z. nummularia is growing well even in the hot arid regions receiving average annual rainfall even lesser than 100mm and with extremes of temperature range between -2ºC and 50ºC (Awasthi and More, 2). Therefore, it is essential to collect and conserve the natural variations that are available in this species to exploit them for sustainable usage. Keeping these in view, the present study aimed (i) to explore the genetic variations of Z. nummularia at morphological and molecular level and (ii) to estimate gene flow among the different populations of Z. nummularia which are important for improvement and understanding of their evolution in the arid ecosystem.
MATERIALS AND METHODSSurveys were conducted in the hyper-arid
(Jaisalmer) (aridity index <0.03), arid (Bikaner) (aridity index 0.03-0.2) and semi-arid (Godhra) (aridity index 0.2-0.5) regions of India (Table 1 & 2) during November 2011. Matured red fruits of Z. nummularia were collected from 125 trees from each region which consists of five locations. Twenty five trees were selected from each location and their fruits were collected which represent a location. The seeds were extracted and seedlings were established (Pareek, 8) in the field gene bank of ICAR-CIAH. Data were
Existence of genetically diverse ecotypes of Ziziphus nummularia: a wild species of ber from western India
Palaiyur N Sivalingam*, Karun Gurjar, Dhurendra Singh, Sarita Chauhan and Chander BhanICAR-Central Institute for Arid Horticulture, Bikaner 334 006, Rajasthan
ABSTRACTZiziphus nummularia, a multipurpose under-exploited, wild fruit tree of the arid region, tolerates various
abiotic stresses. To improve the genetic resource of Z. nummularia and its sustainable usage, conservation and evaluation of this species is essential. Populations of Z. nummularia from hyper-arid (Jaisalmer), arid (Bikaner), and semi-arid (Godhra) regions of western India were collected and established in the field gene bank at ICAR-CIAH as baseline approach for conservation. Larger leaf, fruit and seed size, lesser number of leaf hairs were observed in Z. nummularia population from semi-arid in comparison to arid and hyper-arid regions. Genomic DNA of these populations was tested with 80 RAPD and 18 ISSR primers. Out of these primers, 26 RAPD and 14 ISSR primers were polymorphic. Phylogenetic analysis showed that populations of Z. nummularia from hyper-arid, arid and semi-arid region formed different clusters. The estimated gene flow value (0.697), diversity among populations (0.418), and Fst value (0.419) demonstrated that Z. nummularia has high genetic diversity within the population with limited gene flow between populations suggesting that different ecotypes of Z. nummularia exist in the arid and semi-arid regions. Key words: Jharberi, arid, abiotic stress, DNA markers, phylogenetic analysis.
*Correspondence author's Email: [email protected]

178
Indian Journal of Horticulture, June 2018
recorded on trees of Z. nummularia during survey on mother trees and five year old trees in the field gene bank. Morphological characters (Table 3) such as tree shape, leaf size and shape, number of hairs on adaxial and abaxial surface (6.28 mm2) counted microscopically, thorn length, fruit size and shape, number of seeds per stone and seed viability were recorded on these three populations.
Genomic DNA was extracted from 100 mg of young emerging leaves of Z. nummularia in the field gene bank from each sample separately by CTAB method (Doyle & Doyle, 4) without liquid nitrogen (Sharma et al., 10). Eighty random decamer primers belonging to the series of OPBE, OPBA, OPA & OPN (Operon Technologies, USA) were used. PCR protocol for RAPD and ISSR primers as described by Khan et al. (5) was followed. All the amplified bands were counted manually along with their size. The presence of band was scored as ‘1’ and absence as ‘0’. A pair-wise matrix of genetic distances between genotypes was determined using Jaccard similarity coefficient and a phylogenetic tree based on UPGMA
was constructed using NTSYSpc-2.02e version 2.0.1.5 software (Applied Biostatistics Inc, NY, USA). Estimation of genetic variation on different parameters was carried out by using the POPGENE software version 1.32 (Yeh et al., 16) Gene flow (Nm) was estimated using the formula Nm=0.5(1-Gst)/Gst.
RESULTS AND DISCUSSIONIt was demonstrated for the first time that
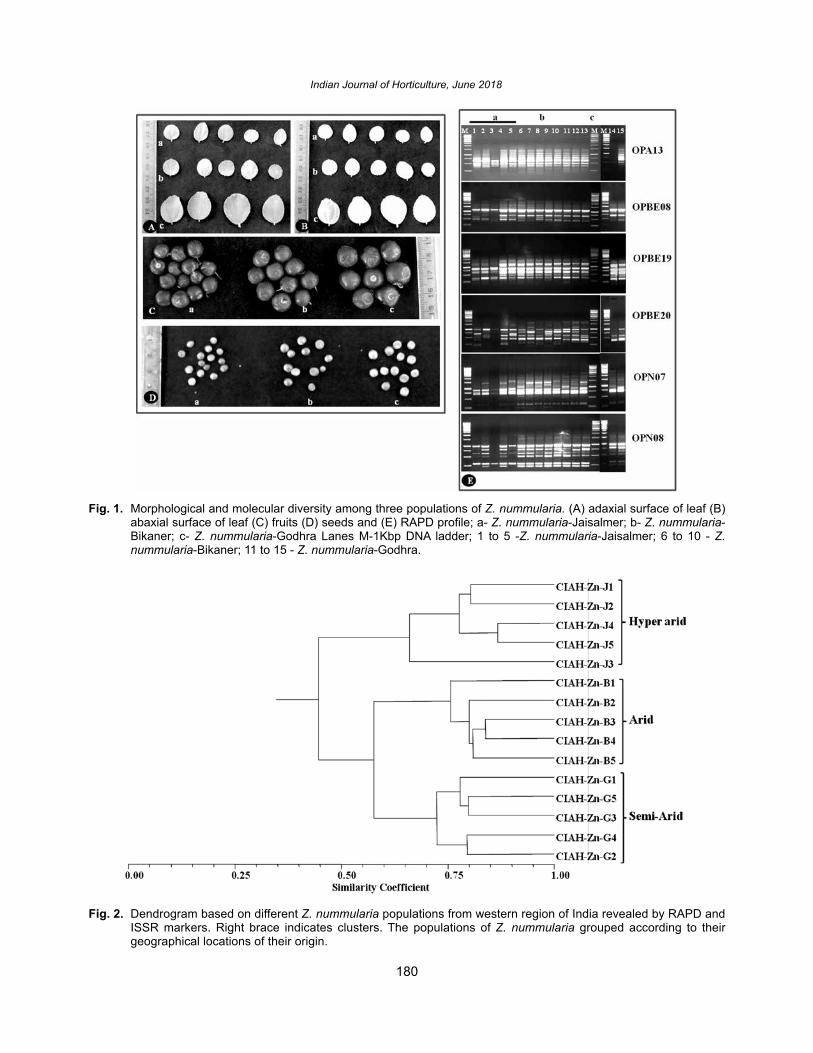
populations of Z. nummularia in India are genetically more diverse and formed different ecotypes (Fig. 3) according to the region with higher adaptability to various abiotic stresses mainly drought coupled with high temperature. Among three populations, Z. nummularia from Jaisalmer is hardy to various abiotic stresses and are well distributed in the hyper arid region where annual rainfall is as little as 80 mm and aridity index is lower than 0.03(Sharma and Tiwari, 12). It could be due to its deep rooting behaviour, leaf rolling upon stress, withholding water for longer duration, greater membrane stability, lesser stomatal conductance coupled with increase in
Table 1. Places of sample collection and weather data.
Collection of sample (Place/ State)
Latitude and longitude
Range of average annual rainfall
(mm)
RH range(%)
Average maximum
temperature (ºC)
Average minimum
temperature (ºC)Jaisalmer/ Rajasthan 26º55’N & 70º54’E 110-209 26-84 23.8-43.5 4.1-26.7Bikianer/ Rajasthan 28º01’N & 73º22’E 260-440 34-86 22.0-43.2 6.1-29.6Godhra/ Gujarat 22º77’N & 73º60’E 839-1179 42-86 26.0-39.4 9.6-34.4
Table 2. Origin of Z. nummularia samples.
S. No.
Species/ cultivar Sample ID Collection of sample (Place or Village/ District/ State)
1 Ziziphus nummularia CIAH-Zn-J1 Dholiya/ Jaisalmer/ Rajasthan2 Z. nummularia CIAH-Zn-J2 Chandan/ Jaisalmer/ Rajasthan3 Z. nummularia CIAH-Zn-J3 Ramgarh/ Jaisalmer/ Rajasthan4 Z. nummularia CIAH-Zn-J4 Tanot/ Jaisalmer/ Rajasthan5 Z. nummularia CIAH-Zn-J5 Devikot/ Jaisalmer/ Rajasthan6 Z. nummularia CIAH-Zn-B1 Deshnok/ Bikaner/ Rajasthan7 Z. nummularia CIAH-Zn-B2 Nokha/ Bikaner/ Rajasthan8 Z. nummularia CIAH-Zn-B3 Raisar/ Bikaner/ Rajasthan9 Z. nummularia CIAH-Zn-B4 Nal/ Bikaner/ Rajasthan10 Z. nummularia CIAH-Zn-B5 Beechwal/ Bikaner/ Rajasthan11 Z. nummularia CIAH-Zn-G1 Vejalpur/ Godhra/ Gujarat12 Z. nummularia CIAH-Zn-G2 Pavagarh/ Godhra/ Gujarat13 Z. nummularia CIAH-Zn-G3 Shehera/ Godhra/ Gujarat14 Z. nummularia CIAH-Zn-G4 Kalol/ Godhra l/ Gujarat15 Z. nummularia CIAH-Zn-G5 Tuwa/ Godhra/ Gujarat
CIAH - Central Institute for Arid Horticulture

179
Genetically Diverse Ecotypes of Ziziphus Nummularia
reducing sugars, proline and catalase during drought period than other two populations (Sivalingam et al., 13). Populations from Jaisalmer also showed higher regeneration capacity upon receiving water immediately after long dry spell. Comparison of three populations of Ziziphus nummularia indicated that the significant difference on morphological parameters was observed among these populations (Fig. 1 & Table 3). Z. nummularia from Jaisalmer and Bikaner regions were bushier in nature, has increased pubescence on leaf surfaces, smaller fruits and stone contained predominantly one seed compared to Z. nummularia from Godhra which had mostly two seeds per stone and were comparatively bigger in size. However, much difference was not observed for viability of seeds among three populations (88 to 93%). The leaf size of Godhra population was bigger and round in shape than other two populations. No variation was observed in nature of thorns among the three populations. All populations had two thorns; one long and straight and another short and curved. However, the length of straight thorns was longer (14 mm) in populations from Jaisalmer and Bikaner than Godhra (11 mm). Morphological features of Jaisalmer populations such as small leaf and fruit, increased pubescence on both surfaces of leaf and bushy nature of tree could be the mechanisms of its adaptation and survival in the hyper arid ecosystems. The populations of Z. nummularia have been conserved in field gene bank to protect it from threat and identify genetic changes that have occurred during evolution. Out of 80 RAPD primers, twenty six were found polymorphic among three populations. Totally 232 loci were amplified by these RAPD primers and 206
were found to be polymorphic. The polymorphism detected by these primers ranged between 33.3 % and 100 % with average polymorphism of 86.97 % and polymorphic information content (PIC) of 0.42. Primers such as OPBE08, OPBE20, OPA05, OPA17, OPA19, OPA20, OPN05, OPN07, OPN09 scored a PIC of near maximum value (0.5). Out of 18 ISSR primers, 14 were polymorphic (69.07 %) and the range of polymorphism was between 25 % and 100 %. The average PIC was found to be 0.4. The details of the size of the bands, number of loci scored and polymorphic loci and PIC of individual primers are given in Table 4 and Fig. 1. Comparison between populations of Z. nummularia from Jaisalmer and Bikaner had maximum average Jaccard’s similarity co-efficient of 0.74 followed by Bikaner and Godhra (0.69), and the least was between Jaisalmer and Godhra (0.65). Cluster analysis revealed that all three populations formed separate clusters (Figs. 2 & 3). The range of observed and effective number of alleles in the populations of Z. nummularia was 1.436-1.598 and 1.322-1.369, respectively. The genetic variation of Z. nummularia within subpopulations (58.1%) and among subpopulations (41.9%) is an indicator of the existence of wide genetic variation in Z. nummularia in the western parts of India. The estimated Nei’s gene diversity (h) and Shannon’s Information index (I) range was 0.178-0.216 with an overall diversity of 0.334 and 0.258- 0.323 with an average value of 0.495, respectively. These data revealed that the population from the Jaisalmer region had higher genetic variation compared to populations of Bikaner and Godhra. Estimated percentage of polymorphic loci was in the range of 43.57-59.75 with relatively
Table 3. Morphological differences among three populations of Z. nummularia occurring in western India.
Character Z. nummularia-Jaisalmer Z. nummularia-Bikaner Z. nummularia-GodhraSpreading nature of tree Mostly bushy Mostly bushy Bushy Leaf shape and size (Length cm × Width cm)*
Mostly round to elliptical (1.45 ± 0.16 × 1.17 ± 0.14)
Mostly round to elliptical (1.45 ± 0.11 × 1.29 ± 0.17)
Mostly round (2.3 ± 0.19 × 2.0 ± 0.23)
Number of leaf hairs in abaxial surface (6.28 mm2)*
7898.4 ± 631.91 7523.8 ± 591.48 4198.7 ± 461.53
Number of leaf hairs in adaxial surface (6.28 mm2)*
210 ± 14.47 205.6 ± 25.54 63.6 ± 6.60
Length of straight thorn (mm)* 14.3 ± 1.10 14 ± 1.54 11.1 ± 0.94Fruit shape and diameter (cm)*
Round, 0.93 ± 0.08 Round, 1.09 ± 0.07 Round, 1.30 ± 0.07
Stone shape and number of seeds per stone
Round and contains mostly 1 seed (range 84.0-90.6%)
Round and contains 1-2 seeds. (one seed-range
61.7 to 72.2%)
Round and contains 2 seeds
Seed viability (%)* 93.3 ± 1.0 88.7 ± 1.0 92.7 ± 1.2‘*’ - Value ± standard deviation
180
Indian Journal of Horticulture, June 2018
Fig. 1. Morphological and molecular diversity among three populations of Z. nummularia. (A) adaxial surface of leaf (B) abaxial surface of leaf (C) fruits (D) seeds and (E) RAPD profile; a- Z. nummularia-Jaisalmer; b- Z. nummularia- Bikaner; c- Z. nummularia-Godhra Lanes M-1Kbp DNA ladder; 1 to 5 -Z. nummularia-Jaisalmer; 6 to 10 - Z. nummularia-Bikaner; 11 to 15 - Z. nummularia-Godhra.
Fig. 2. Dendrogram based on different Z. nummularia populations from western region of India revealed by RAPD and ISSR markers. Right brace indicates clusters. The populations of Z. nummularia grouped according to their geographical locations of their origin.

181
Genetically Diverse Ecotypes of Ziziphus Nummularia
Table 4. Details of RAPD and ISSR primers used in this study and their polymorphism.
S. No. Primer name
Sequence (5’ to 3’)
Band size range (bp)
Loci scored
No. of polymorphic loci
% Polymorphism
PIC
RAPD1 OPBE04 CCCAAGCGAA 250-1300 11 11 100.00 0.482 OPBE08 GGGAAGCGTC 400-1100 8 7 87.50 0.493 OPBE11 GTCCTGCTGT 300-2000 10 9 90.00 0.474 OPBE12 GGTTGTTCCC 300-1400 7 7 100.00 0.485 OPBE16 CTCCACGACT 300-1350 8 8 100.00 0.356 OPBE17 GGGAAAAGCC 500-1200 4 2 50.00 0.287 OPBE19 AGGCCAACAG 300-1300 6 3 50.00 0.228 OPBE20 CAAAGGCGTG 200-1700 11 10 90.91 0.499 OPA02 TGCCGAGCTG 300-1200 6 2 33.33 0.1610 OPA04 AATCGGGCTG 150-2100 9 6 66.67 0.3311 OPA05 AGGGGTCTTG 250-2100 16 16 100.00 0.4912 OPA06 GGTCCCTGAC 450-900 5 5 100.00 0.4813 OPA08 GTGACGTAGG 100-2000 12 11 91.67 0.4714 OPA11 CAATCGCCGT 100-1300 10 9 90.00 0.4815 OPA13 CAGCACCCAC 200-2000 12 11 91.67 0.3116 OPA16 AGCCAGCGAA 200-1600 11 9 81.82 0.4417 OPA17 GACCGCTTGT 300-1500 10 10 100.00 0.4918 OPA19 CAAACGTCGG 100-1300 7 6 85.71 0.4919 OPA20 GTTGCGATCC 200-1500 6 6 100.00 0.4920 OPN04 GACCGACCCA 750-1300 7 7 100.00 0.3121 OPN05 ACTGAACGCC 300-1600 8 8 100.00 0.4922 OPN06 GAGACGCACA 100-1500 11 9 81.82 0.4723 OPN07 CAGCCCAGAG 250-2500 13 12 92.31 0.4924 OPN08 ACCTCAGCTC 200-1500 9 7 77.78 0.3525 OPN09 TGCCGGCTTG 250-1400 7 7 100.00 0.4926 OPN10 ACAACTGGGG 100-1800 8 8 100.00 0.43
Average = 8.92 7.92 86.97 0.42ISSRPrimer namea
UBCb code
Sequence (5`–3`) Band size range (bp)
Loci scored
No. of polymorphic loci
% Polymorphism
PIC
P2 809 AGAGAGAGAGAGAGAGG 500-2000 7 4 57.14 0.41P3 814 CTCTCTCTCTCTCTCTA 400-850 4 3 75.00 0.42P4 825 ACACACACACACACACT 750-1700 7 4 57.14 0.47P5 829 TGTGTGTGTGTGTGTGC 400-1600 8 5 62.50 0.35P6 240 GAGAGAGAGAGAGAGACTT 800-1500 4 1 25.00 0.30P8 848 CACACACACACACACAAGG 1400-1700 3 3 100.00 0.44P9 850 GTGTGTGTGTGTGTGTCTC 900-3000 4 3 75.00 0.40P10 854 TCTCTCTCTCTCTCTCAGG 600-1500 4 4 100.00 0.42P11 855 ACACACACACACACACCTT 800-2000 5 2 40.00 0.40P12 856 ACACACACACACACACCTA 700-2000 7 4 57.14 0.40P13 876 GATAGATAGACAGACA 200 1 1 100.00 0.32P14 880 GGAGAGGAGAGGAGA 750-1500 3 3 100.00 0.44P15 889 AGTCGTAGTACACACACACACAC 300-2100 8 5 62.50 0.42P16 890 ACGACTACGGTGTGTGTTTGTGT 500-3000 9 5 55.56 0.41
Average = 5.28 3.36 69.07 0.40a -Primer name used in this study; b- University of British Columbia. PIC- Polymorphic Information Content.

182
Indian Journal of Horticulture, June 2018
high mean value of 91.29. The diversity among the populations (0.418), gene flow value (0.697) and Fst value (0.419) indicated the existence of a large genetic heterogeneity within a population and lesser gene flow between populations of Z. nummularia (Table 5). This genetic variation and large population of this species increases its adaptive response to local selection (Aitken & Whitlock, 1). The genetic diversity reflected in the populations of Jaisalmer at DNA level may be due to possible heterozygosity of genome and also plasticity of these genomes to adapt to the extreme environmental conditions of the arid region (Sharma et al., 11). It is possible that the evolution of Ziziphus or ziziphoid group is reasonably older (~ 95 million years ago) (Richardson et al., 9) than the expansion of arid environment in the western region of India, now called the Thar Desert. The aridification in this region might be recent i.e., ~0.6-
1.6 million years ago. Before aridification, conditions might have been akin to semi-aridity. Z. nummularia could have been well distributed in present day Thar Desert as one of the semi-arid plants. During aridification, Z. nummularia plants possessing allelic or gene frequencies tolerant to aridification may have been selected under intense natural selection pressure (Aitken & Whitlock, 1). Over time, due to natural selection, all three types could have diverged from common population adapting to particular ecosystem; thereby, forming a different ecotype or ecoclines of Z. nummularia (Fig. 2) (Kremer et al., 6). The reduced gene flow in Z. nummularia may be due to elimination of alleles entering into locally adapted new population by selection. Stronger the selection, the more rapidly immigrant alleles of lower fitness will be eliminated from the population; thereby, reducing effective migration rates and increasing the time to
Fig. 3. Different ecotypes of Z. nummularia in the western region of India which is enlarged from map of India shown in dark circle with name of the states with border. Photographs showing morphology of leaf and seeds of three populations have shown with the respective population of Z. nummularia. Dark colour arrow lines indicate the region of sample collection. J- Average Jaccord’s similarity co-efficient between populations.

183
Genetically Diverse Ecotypes of Ziziphus Nummularia
coalescence (Charlesworth et al., 3). Population of Z. nummularia occurring in the semi-arid region may be a natural group. However, Z. nummularia populations prevailing in the arid region or Thar Desert are not part of a natural group and have adapted to arid environment with highest relative fitness (Wright & Gaut, 15).
These genotypes of Z. nummularia in the arid ecosystem must be conserved for its improvement by (i) Isolation of novel genes particularly involved in abiotic stresses; (ii) Enhancing local adaptation of semi-arid genotypes by assisted gene flow in accordance with climate change; and (iii) Identification and isolation of candidate genomic region /candidate loci as influenced by selection pressure will be useful in increasing adaptation to the extreme environments of these species.
ACKNOWLEDGEMENTSAuthors wish to thank Director, ICAR-CIAH for giving
critical comments and providing necessary facilities to carry out research, Dr. S. Anandhan (Senior Scientist, DOGR, Pune) and Dr. Vishwanathan Satheesh (NRCPB, New Delhi) for their critical comments and encouragement, reviewers of this manuscript for their critical suggestions for improvement and World Bank funded National Agricultural Innovation Project (NAIP), ICAR for financial assistance under the sub-project “Bioprospecting of genes and allele mining for abiotic stress tolerance (C30033)”.
REFERENCES1. Aitken, S.N. and Whitlock, M.C. 2013. Assisted
gene flow to facilitate local adaptation to climate change. Annu. Rev. Ecol. Evol. Syst. 44: 367-88.
2. Awasthi, O.P. and More, T.A. 2009. Genetic diversity and status of Ziziphus in India. Acta. Hort. 840: 33-40.
3. Charlesworth, B., Nordborg, M. and Charlesworth, D. 1997. The effects of local selection, balanced polymorphism and background selection on equilibrium patterns of genetic diversity in subdivided inbreeding and out crossing populations. Genet. Res. 70: 155-74.
4. Doyle, J.J. and Doyle, J.L. 1990. Isolation of plant DNA from fresh tissue. Focus, 12: 13-15.
5. Khan, H., Sivalingam, P.N., Chauhan, S., Awasthi, O.P. and More, T.A. 2013. Improved crossing technique and identification of true F1 hybrids of Ziziphus mauritiana Lam. by molecular markers. Sci. Hortic. 150: 164-71.Ta
ble
5. G
enet
ic d
iver
sity
sta
tic a
nd d
iffer
entia
tion
para
met
ers
for
thre
e po
pula
tions
of
Z. n
umm
ular
ia r
evea
led
by R
AP
D a
nd I
SS
R.
Pop
ulat
ion
Ss
Na
± S
DN
e ±
SD
h ±
SD
I ±
SD
Pp
(%)
Np
Gst
Nm
Ht
Hs
Jais
alm
er5
1.59
8 ±
0.49
1 1.
369
± 0.
374
0.21
6 ±
0.19
9 0.
323
± 0.
285
59.7
514
4
Bik
aner
51.
436
± 0.
497
1.32
2 ±
0.41
0 0.
178
± 0.
215
0.25
8 ±
0.30
6 43
.57
105
God
hra
51.
444
± 0.
498
1.35
0 ±
0.43
0 0.
189
± 0.
223
0.27
1 ±
0.31
544
.40
107
15-
-0.
334
± 0.
158
0.49
5 ±
0.21
091
.29
220
0.41
80.
697
0.33
4 ±
0.02
50.
194
± 0.
018
Ss
= S
ampl
e si
ze; h
= N
ei’s
(197
3) g
ene
dive
rsity
; I =
Sha
nnon
’s In
form
atio
n in
dex
(Lew
ontin
, 197
2); N
a =
Obs
erve
d nu
mbe
r of a
llele
s; N
e =
Effe
ctiv
e nu
mbe
r of a
llele
s (K
imur
a an
d C
row
, 196
4); P
p =
Per
cent
age
of p
olym
orph
ic lo
ci; N
p =
Num
ber o
f pol
ymor
phic
loci
; Gst
= D
iver
sity
am
ong
popu
latio
ns; N
m =
gen
e flo
w 0
.5 (1
- G
st)/G
st; H
t = o
vera
ll ge
netic
D
iver
sity
; Hs
= av
erag
e su
bpop
ulat
ion
gene
tic d
iver
sity
; SD
= S
tand
ard
devi
atio
n

184
Indian Journal of Horticulture, June 2018
6. Kremer, A., Potts, B.D. and Delzon, S. 2014. Genetic divergence in forest trees: understanding the consequences of climate change. Funct. Ecol. 28: 22-36.
7. Pandey, A., Singh, R., Radhamani, J. and Bhandari, D.C. 2010. Exploring the potential of Ziziphus nummularia (Burm f) Wight et Arn from drier regions of India. Genet. Resour. Crop Ev. 57: 929-36.
8. Pareek, O.P. 2001. Ber. International Centre for Underutilized Crops Southampton UK, p. 290.
9. Richardson, J.E., Fay, M.F., Cronk, Q.C.B. Bowman, D. and Chase, M.W. 2000. A phylogenetic analysis of rhamnaceae using RBCL and TRNL-F plastid DNA sequences. Am. J. Bot. 87: 1309-24.
10. Sharma, R., Mahla, H.K., Mohapatra, T., Bhargava, S.C. and Sharma, M.M. 2003. Isolating plant genomic DNA without liquid nitrogen. Plant. Mol. Biol. Rep. 21: 43-50.
11. Sharma, S.K., Kumar, S., Rawat, D., Kumaria, S., Kumar, A. and Rao, S.R. 2011. Genetic diversity
and gene flow estimation in Prosopis cineraria (L.) Druce: A key stone tree species of Indian Thar Desert. Biochem. Sys. Ecol. 39: 9-13.
12. Sharma, A.K. and Tiwari, J.C. 2005. Arid zone forestry with special reference to Indian hot arid zone. In: Vol-II, Forests and Forest Plants. Encyclopaedia of life support systems (EOLSS). EOLSS publishers, Oxford, UK.
13. Sivalingam, P.N., Singh, D., Bhargava, R. and Sharma, S.K. 2014. CIAHZN-J- A low moisture-stress tolerant Ziziphus nummularia from Jaisalmer. ICAR News 20: 10.
14. Vashishtha, B.B. 2001. Ber varieties a monograph, Agrobios (India), Jodhpur.
15. Wright, S.I. and Gaut, B.S. 2005. Molecular population genetics and the search for adaptive evolution in plants. Mol. Biol. Evol. 22: 506-19.
16. Yeh, F.C., Young, R.C. and Boyle, T. 1999. Microsoft Window-based Freeware for Population Genetic Analysis (POPGENE Ver 1.32) ftp://ftpmicrosoftcom/softlib/mslfiles/hpglexe
Received : April, 2017; Revised : March, 2018; Accepted : May, 2018
185
Indian J. Hort. 75(2), June 2018: 185-190
INTRODUCTIONPassion fruit (Passiflora edulis Sims.), which is
considered as a minor fruit in India, bears a delicious fruit which occurs in purple (Passiflora edulis Sims.) and yellow (Passiflora edulis f. flavicarpa) fruited forms (Joy, 8). It belongs to the family Passifloraceae and is believed to have originated in the Amazon region of Brazil. The fruit is grown mostly in tropical and sub-tropical parts of the world from South America to Australia, Asia and Africa. It was introduced to India during twentieth century in the Nilgiris, Coorg and Malabar areas of southern India. Passion fruit is a perennial, woody vine which produces round or ovoid fruits having a tough, smooth, waxy dark purple/yellow coloured rind with faint, fine white specks. It contains yellowish to orange coloured pulpy juice with large number of small, hard, dark brown to black pitted seeds. It is not used for table purpose because of its high acidity, low juice content and large number of seeds. The juice is delicious with good flavour, intense aroma and sweet-acid taste and is well known for its excellent blending quality. The juice contains very good proportion of acids, sugars, vitamin-A, fibre, phenolic compounds, ascorbic acid (Ramaiya et al., 13) and minerals such as sodium, magnesium, sulphur, chlorides, etc. (Rao et al., 15). Yellow type fruits are generally larger than purple type with yellow
mottled spots and turns golden yellow during ripening whereas purple type attains deep purple colour. The juice of yellow type is more acidic and its recovery is comparatively less (25-30%) than the purple type (35-38%) (Rao et al., 15).
With increase in purchasing power coupled with enhanced health consciousness, demand for nutritive food items has been on the rise in recent years. Consequently, owing to the high nutritional and medicinal properties along with the exotic flavour, demand for passion fruit and its processed products has been growing over the years. Even though the high acidity of passion fruit limits its utilisation for table purpose, its intense flavour offers ample scope for processing into numerous value added products like fruit beverages, concentrate, etc. By far the greatest benefit of passion fruit to humankind is its fruit and the delicious juice made from it. Passion fruit juice is highly acidic due to predominance of citric and malic acid. The strong and intense flavour of passion fruit offers ample scope for processing it into a refreshing fruit nectar (Kishore et al., 10). The bioactive compounds in passion fruit, particularly the antioxidants are believed to possess free radical scavenging property and are therefore, considered to be a natural remedy against oxidative stress induced degenerative diseases. Some phenolic compounds identified in Passiflora species showed therapeutic
Quality characteristics and antioxidant activity of passion fruit (Passiflora edulis Sims.) accessions
S.M. Charan, Saji Gomez*, K.B. Sheela, P. Meagle Joseph and C.V. SruthiDepartment of Post Harvest Technology, College of Horticulture, Vellanikkara, Kerala Agricultural University,
Thrissur 680 656, Kerala
ABSTRACTPassion fruit accessions (yellow and purple types) from various locations in Kerala along with Kaveri, the
only released variety of passion fruit in India were collected and characterized based on physico-morphological, nutritive and biochemical parameters. Considerable variation in physical composition, fruit length, fruit diameter, fruit girth, rind thickness and fruit weight was observed among the accessions. Juice recovery ranged from 23.93 to 44.46%in purple types while it was in the range of 15.27 to 40.04% in yellow types. Yellowish orange was the commonly observed colour of the juice in majority of the accessions, followed by light yellow and deep yellow. Nutritional and biochemical characteristics also varied significantly among the different accessions. Purple types had comparatively higher TSS (15.2 to 17.73 °Brix), reducing sugars (2.88 to 8.06%), total sugars (6.31 to 13.04%) and vitamin C (18.62 to 30.50 mg 100gˉ1) whereas, titratable acidity (3.19 to 4.86%), non reducing sugars (2.63 to 5.27%), total carotenoids (1.19 to 2.81 mg 100gˉ1), total phenols (18.66 to 27.33 mg 100gˉ1) and total flavanoids (7.33 to 18.00 mg 100gˉ1) were higher in yellow types. Antioxidant activity was comparatively higher in yellow types. Key words: Physico-morphological characters, Nutritional attributes, Biochemical characteristics.
*Corresponding author’s E-mail: [email protected]
DOI : 10.5958/0974-0112.2018.00034.8

186
Indian Journal of Horticulture, June 2018
effects like immunomodulation, anticarcinogenic and antioxidant activities (da Silva et al., 5).
Therefore, a comprehensive study was undertaken to assess the quality characteristics of passion fruit accessions found across Kerala, in terms of horticultural traits, biochemical and nutritional attributes. The study would further help in the identification of promising types which could result in their large scale multiplication, cultivation and subsequent utilization in processing industries.
MATERIALS AND METHODSThe present investigation was carried out with
accessions of passion fruit collected from different parts of Kerala. These accessions were compared with Kaveri, the only variety of passion fruit released in India. The investigation was carried out in the Department of Post Harvest Technology, College of Horticulture (KAU), Vellanikkara, Thrissur during 2014-2016.
Passion fruit accessions (yellow and purple types) were collected from various locations in Kerala. Kaveri, the only variety of passion fruit released in India by the Central Horticultural Experiment Station (CHES), Chettalli, a sub-station of the Indian Institute of Horticulture Research (IIHR), Bengaluru, which is a purple fruited type was used as check variety (Table 1).These accessions were characterized based on physico-morphological and biochemical parameters, of which special emphasis was given to determine the antioxidant activity. Fruit length, fruit diameter and rind thickness of ten fruits of each accession was measured by using vernier calliper and the average of these values was expressed in centimetre. Similarly, fruit girth was taken with the help of a thread and accordingly, the girth was determined
on a scale in centimetre. Fruit size was expressed by the method suggested by Ramaiya et al. (13). Rind colour was expressed as yellow or purple based on the external colour of the fruit. Fruit weight of ten fruits was taken by using a weighing balance and the average values were expressed in gram. Colour of the juice was determined by visual observation and was expressed as described by Patel et al. (11). For juice percentage, juice extracted from each fruit of a single accession was weighed separately and the average was calculated by the formula, Juice (%) = [Weight of juice (g)/Weight of fruit (g)] × 100. For physical composition, weight of each physical component of fruits of a single accession was taken separately and its proportion to the total weight of the fruit was expressed by the formula, Physical composition (%) = [Weight of physical component (g)/Weight of fruit (g)] × 100.
Biochemical parameters like titratable acidity, ascorbic acid, total carotenoids and total phenols were estimated as per the procedure suggested by AOAC (1) whereas reducing sugars, non-reducing sugars and total sugars were determined as per the method suggested by Ranganna (14). Total flavanoids were estimated as per the procedure suggested by Chang et al. (4). Total soluble solids (TSS) were determined by using hand refractometer. Antioxidant activity was determined by the method suggested by Braca et al. (3) wherein, 2, 2-Diphenyl-1-picrylhydrazyl (DPPH) was used as the free radical compound.
RESULTS AND DISCUSSIONWide variation in physico-morphological
(Table 2) and biochemical attributes (Table 3) was found in passion fruit accessions collected from various locations spread across Kerala and Karnataka.
Fruit length of passion fruit accessions varied significantly and ranged from 5.33 to 6.63 cm and 5.70 to 6.96 cm in yellow and purple types, respectively. Similar range in fruit length of passion fruit was reported by Joy (8) and Ramaiya et al. (13). Fruit diameter also varied significantly and ranged from 5.70 to 6.36 cm in yellow types whereas it was in the range of 5.63 to 7.10 cm in the purple ones. These findings are in accordance with those reported by Ramaiya et al. (13) and Patel et al. (11). Considerable variation in fruit girth was observed among accessions. It varied from 18.30 to 21.16 cm and 19.20 to 22.83 cm in yellow and purple types, respectively. Fruit size to a very great extent is dependent on genetic, environmental and cultural factors. Significant variation in rind thickness was seen among the accessions. It varied from 0.46 to 0.70 cm in yellow and 0.46 to 0.96 cm in purple types. In the present study, the maximum rind thickness of
Table 1. Passion fruit accessions from various locations in Kerala and Karnataka.
Accessions Type LocationAcc. 1 Yellow Ambalavayal, Wayanad, KeralaAcc. 2 PurpleAcc. 3 Yellow Vellanikkara, Thrissur, KeralaAcc. 4 Yellow Mannuthy, Thrissur, KeralaAcc. 5 Purple Thiruvalla, Pathanamthitta, KeralaAcc. 6 YellowAcc. 7 Yellow Athirampuzha, Kottayam, KeralaAcc. 8 Yellow Pineapple Research Station (PRS),
Vazhakulam, Ernakulam, KeralaAcc. 9 PurpleAcc. 10 (Kaveri)
Purple CHES, Chettalli, Kodagu, Karnataka

187
Quality Characteristics and Antioxidant Activity of Passion Fruit
Table 2. Physico-morphological characteristics of passion fruit accessions.
Accessions Fruit size(appearance)
Fruit girth (cm)
Rind thickness
(cm)
Fruit weight
(g)
Physical components
(%)
Colour of rind Colour of juice
Fruit length (cm)
Fruit diameter
(cm) Juice Rind Seed
Acc. 1 (Y) 6.63 6.36 20.00 0.70 97.96 40.04 45.37 14.74 Yellow with white specks Yellowish orangeAcc. 2 (P) 6.40 6.76 21.10 0.96 86.17 28.78 56.39 14.84 Deep purple with white
specksDeep yellow
Acc. 3 (Y) 5.66 6.26 21.16 0.60 65.98 28.94 57.54 13.50 Yellow with white specks Light yellowAcc. 4 (Y) 6.00 6.16 20.20 0.70 84.08 30.74 58.49 10.75 Yellow with white specks Light yellowish
orangeAcc. 5 (P) 6.86 6.43 21.06 0.46 98.26 46.46 37.78 15.73 Purple with white specks Yellowish orangeAcc. 6 (Y) 5.66 5.86 18.66 0.66 79.64 31.26 53.20 15.52 Yellow with white specks Yellowish orange
Acc. 7 (Y) 5.33 5.70 18.30 0.46 62.73 15.27 78.12 6.58 Light yellow with white specks
Light yellow
Acc. 8 (Y) 6.23 6.10 19.30 0.50 87.15 36.60 51.91 11.47 Yellow with white specks Deep yellowAcc. 9 (P) 6.96 7.10 22.83 0.70 82.66 27.17 62.96 9.84 Light purple with white
specksYellowish orange
Acc. 10 (P) 5.70 5.63 19.20 0.63 55.83 23.93 57.58 18.47 Deep purple with white specks
Light yellow
CD 0.05 0.38 0.39 1.38 0.16 15.14 7.57 9.45 2.74 - -Y: Yellow type; P: Purple type
Table 3. Biochemical characteristics of passion fruit accessions.
Accessions TSS (°Brix)
Titratable acidity
(%)
Reducing sugars
(%)
Non-reducing
sugars (%)
Total sugars
(%)
Vitamin C (mg 100gˉ1)
Total carotenoids (mg 100gˉ1)
Total phenols
(mg 100gˉ1)
Total flavanoids
(mg 100gˉ1)Acc. 1 (Y) 16.00 4.22 3.45 5.27 8.71 22.16 1.61 20.66 11.33Acc. 2 (P) 16.43 3.17 8.06 4.98 13.04 18.62 2.43 22.66 13.33Acc. 3 (Y) 13.33 3.92 5.36 4.48 9.85 21.09 1.19 19.33 18.00Acc. 4 (Y) 12.66 3.64 4.92 4.27 9.20 23.05 1.53 18.66 7.33Acc. 5 (P) 17.73 3.66 4.86 1.44 6.31 30.50 1.51 17.33 12.00Acc. 6 (Y) 13.33 4.86 2.34 2.63 4.98 16.98 1.47 27.33 17.33Acc. 7 (Y) 14.60 3.19 6.41 4.38 10.80 19.60 2.46 22.66 14.66Acc. 8 (Y) 14.93 3.64 6.03 4.11 10.14 20.90 2.81 24.00 7.33Acc. 9 (P) 17.13 2.87 2.88 3.91 6.80 20.90 1.07 24.00 6.33Acc. 10 (P) 15.20 3.15 6.68 4.16 10.84 21.08 1.98 24.66 9.00SE ± 0.48 0.19 0.32 0.41 0.56 1.22 0.25 1.49 1.96CD 0.05 1.44 0.57 0.99 1.21 1.67 3.64 0.77 4.42 5.82
Y: Yellow type; P: Purple type
0.96 cm reported in Acc. 2 (yellow) is in contrast with those reported by da Silva et al. (7), wherein a range of 0.56 to 0.58 cm in rind thickness was observed. Rind thickness of the check variety was only 0.63 cm.
Santos et al. (16) also reported a lower range of 0.32 to 0.35 cm rind thickness in yellow type passion fruit. Rind thickness contributes to fruit weight as rind is the major physical component in passion fruit. Fruit

188
Indian Journal of Horticulture, June 2018
weight varied significantly from 62.73 to 97.96 g in yellow and from 55.83 to 98.26 g in purple types. Fruit weight contributes to marketability. The check variety Kaveri recorded the lowest fruit weight (55.83 g).The findings are in conformity with those reported by Arjona et al. (2) and Ramaiya et al. (13). Juice percentage of accessions varied significantly from 15.27 to 40.04% in yellow and from 23.93 to 46.46% in purple types. The check variety had the lowest juice percentage among purple accessions. These findings are in agreement with those reported by da Silva et al. (7) and Arjona et al. (2). Accessions with high juice content can be utilised in processing industries. Significant variation in rind percentage was also observed among accessions which ranged from 45.37 to 78.12% in yellow, whereas it was from 37.78 to 62.96% in purple types. The finding is in consonance with the one reported by Arjona et al. (2). Seed percentage also varied significantly which ranged from 6.58 to 15.52% in yellow type and from 9.84 to 18.47% in purple ones. Similar range in percentage of rind and seed was reported by da Silva et al. (7).
Colour of rind and juice are presented in Table 2. Rind colour in Acc. 1, 3, 4, 6, and 8 were yellow with white specks whereas in accession 7, it was light yellow with white specks. The rind colour in Acc. 5 was purple with white specks. Colour of the rind in Acc. 9 was light purple with white specks while it was deep purple with white specks in Acc. 2 and 10. Patel et al. (11) observed deep purple colour in Megha Purple and Nagaland Purple, yellow colour in Kerala Yellow, RCPS-1 and Panama Yellow, deep yellow colour in Passiflora alata types of passion fruit. Yellowish orange was the commonly observed juice colour in majority of the accessions, followed by light yellow and deep yellow. However, juice colour of yellow fruited accessions varied from light yellow to deep yellow while in purple types, the commonly observed juice colour was yellowish orange. Patel et al. (11) observed the colour of juice in passion fruit cultivars as yellowish orange in Megha Purple and Nagaland Purple, orange in Kerala Yellow, RCPS-1 and Panama Yellow, deep orange in Passiflora alata types of passion fruit.
Considerable variation in biochemical attributes, including antioxidant activity was found among the accessions (Table 3). TSS of passion fruit accessions ranged from 12.66 to 16.00 Brix in yellow and 15.20 to 17.73 Brix in purple types, respectively, whereas, the TSS of check variety Kaveri is 15.20 Brix. The desirable level of TSS in passion fruit is in the range of 15 to 16 Brix. The level of photosynthate accumulation is the cumulative effect of genotypic and growing conditions. These results are in conformity with those
reported by Ramaiya et al. (13) and Patel et al. (11). Titratable acidity of yellow types was in the range of 3.19 to 4.86% while that of purple ones was from 2.87 to 3.66%. This is in contrast with the findings of Silva et al. (17) who reported that the titratable acidity in yellow passion fruit was in the range of 4.99 to 5.53% while Ramaiya et al. (13) reported a titratable acidity of 3.03% in yellow and 1.80% in purple types of passion fruit. The variation in titratable acidity when compared to the earlier findings might be due to the influence of the environmental and cultural factors during the fruit growth and developmental phases. The reducing sugars which are mainly responsible for sweetness were predominant in accessions with purple type fruits. Considerable variation in sugar content was observed among accessions in which the reducing sugar content ranged from 2.34 to 6.41% in yellow and 2.88 to 8.06% in purple types, respectively. The non reducing sugar content was in the range of 2.63 to 5.27% in yellow and 1.44 to 4.98% in purple types respectively. Total sugar content in yellow types was in the range of 4.98 to 10.80%, while in purple ones it ranged from 6.31 to 13.04%. These findings are in accordance with those reported by Patel et al. (11). Passion fruit is a good source of ascorbic acid and its content ranged from 16.98 to 23.05 mg 100gˉ1 in yellow and 18.62 to 30.50 mg 100gˉ1 in purple types, respectively and the ascorbic acid content of Kaveri variety is 21.08 mg 100gˉ1. The findings are in conformity with those reported by Patel et al. (11) and Joy (8). The accumulation of total carotenoids in fruits is variable according to stage of maturity and systems of cultivation (Pertuzatti et al., 12). In the present study, total carotenoids varied significantly among the accessions and it ranged from 1.19 to 2.81 mg 100gˉ1 in yellow and 1.07 to 2.43 mg 100gˉ1 in purple types, respectively, while the carotenoid content in Kaveri variety is 1.98 mg 100gˉ1. Similar findings were also reported by Pertuzatti et al. (12) and Kathiravan et al. (9) in yellow passion fruit. Considerable variation in total phenols was observed among passion fruit accessions. Total phenol content varied significantly from 18.66 to 27.33 mg 100gˉ1 in yellow types and 17.33 to 24.66 mg 100gˉ1 in purple types respectively, while it was 24.66 mg 100gˉ1in the check variety Kaveri. These findings are in accordance with those reported by Ramaiya et al. (13); the total phenols in fresh passion fruit juice is dependent mainly on species/cultivars and level of ripeness. Significant variation in total flavanoids was observed among passion fruit accessions and it ranged from 7.33 to 17.33 mg 100gˉ1 in yellow types and from 6.33 to 13.33 mg 100gˉ1 in purple ones respectively. Wide variation in antioxidant activity was observed among passion fruit accessions (Fig. 1) in which the inhibitory

189
Quality Characteristics and Antioxidant Activity of Passion Fruit
concentration of passion fruit juice extract ranged from 7.36 to 22.66 mg mlˉ1 in yellow and 12.43 to 15.66 mg mlˉ1 in purple types, respectively, while the antioxidant activity of the check variety Kaveri is 15.66 mg mlˉ1. Maximum antioxidant activity in yellow types may be due to higher concentration of total phenols and total flavanoids as compared to purple ones. According to da Silva et al. (6) the antioxidant activity of passion fruit is due to the presence of polyphenols which are involved in neutralizing the oxidants. Ramaiya et al. (13) reported that the total antioxidant activity ranged from 409.13 to 1964.90 μmol Trolox litreˉ1 in seven different passion fruit cultivars and the strongest antioxidant activity of 547 ± 3.08 μmol Trolox litreˉ1 and 524 ± 1.96 μmol Trolox litreˉ1 was observed in vine ripened purple and yellow passion fruit cultivars respectively.
Based on the findings of the study, it could be said that purple types had comparatively higher TSS, reducing sugars, total sugars and vitamin C whereas, titratable acidity, non-reducing sugars, total carotenoids, total phenols, total flavanoids and antioxidant activity were higher in yellow types. Also, purple types in general have better flavour properties owing to lower levels of acidity and higher TSS. Acc. 5 is ideal for processing purposes due to its high juice recovery, followed by Acc. 1. Acc. 6 can also be popularised for its nutritional properties on account of higher levels of polyphenols, flavanoids and maximum inhibition of DPPH radical scavenging activity.
REFERENCES1. AOAC, 1998. Official method of analysis of
AOAC International (16th Ed.). Association of Official Agricultural Chemists, Washington, DC p 899.
2. Arjona, H.E., Matta, F.B. and Garner, J.O. 1991. Growth and composition of passion fruit (Passiflora edulis) and maypop (P. incarnata). Hortic. Sci. 26: 921-23.
3. Braca, A., De Tommasi, N., Di Bari, L., Pizza, C., Politi, M. and Morelli, I. 2001. Antioxidant principles from Bauhinia tarapotensis. J. Nat. Products, 64: 892-95.
4. Chang, C., Yang, M., Wen, H. and Chern, J. 2002.Estimation of total flavanoid content in propolis by two complementary colorimetric methods. J. Food Drug Anal. 10: 178-82.
5. da-Silva, J.K., Cazarin, C.B.B., Batista, A.G. and Marostica, M. 2014. Effects of passion fruit (Passiflora edulis) by-product intake in antioxidant status of Wistar rats tissues. Food Sci. Technol.59: 1213-19.
6. da-Silva, J.K., Cazarin, C.B.B., Colomeu, T.C., Batista, A.G., Meletti, L.M.M., Paschoal, J.A.R., Junior, S.B., Furlan, M.F., Reyes, F.G.R., Augusto, F., Junior, M.R.M. and Zollner, R.L. 2012. Antioxidant activity of aqueous extract of
Fig. 1: Antioxidant activity of passion fruit accessions.
Y: Yellow type; P: Purple type

190
Indian Journal of Horticulture, June 2018
passion fruit (Passiflora edulis) leaves: In vitro and in vivo study. Food Res. Int. 53: 882-90.
7. da-Silva, M.A.P., Placido, G.R., Caliari, M., Carvalho, B.S., da Silva, R.M., Cagnin, C., de Lima, M.S., do Carmo, R.M. and da Silva, R.C.F. 2015. Physical and chemical characteristics and instrumental colour parameters of passion fruit (Passiflora edulis Sims). African J. Agric. Res. 10: 1119-26.
8. Joy, P.P. 2010. Passion fruit (Passiflora edulis Sims): Passifloraceae. KAU Pineapple Research Station, Vazhakulam - 686670, Muvattupuzha, Ernakulam, Kerala.
9. Kathiravan, T., Nadanasabapathi, S. and Kumar, R. 2013. Optimization of pulsed electric field processing conditions for passion fruit juice (Passiflora edulis) using response surface methodology. Int. J. Adv. Res. 1: 399-411.
10. Kishore, K., Pathak, K. A., Shukla, R., and Bharali, R. 2010. Effect of storage temperature on physico-chemical and sensory attributes of purple passion fruit (Passiflora edulis Sims). J. Food Sci. Technol. 48: 484-88.
11. Patel, R.K., Singh, A., Prakash, J., Nath, A. and Deka, B.C. 2014. Physico-biochemical changes during fruit growth, development and maturity in passion fruit genotypes. Indian J. Hort. 71: 486-93.
12. Pertuzatti, P.B., Sganzerla, M., Jacques, A.C., Barcia, M.T. and Zambiazi, R.C. 2015. Carotenoids, tocopherols and ascorbic acid
content in yellow passion fruit (Passiflora edulis) grown under different cultivation systems. Food Sci. Technol. 64: 259-63.
13. Ramaiya, S.D., Bujang, J.S., Zakaria, M.H., Kinga, W.S. and Sahrira, M.A.S. 2012. Sugars, ascorbic acid, total phenolic content and total antioxidant activity in passion fruit (Passiflora) cultivars. J. Sci. Food Agric. 93: 1198-1205.
14. Ranganna, S. 1997. Handbook of Analysis and Quality Control for Fruit and Vegetable Products (2nd Ed). Tata McGraw Hill Publishing Company Limited, New Delhi. 1112 p.
15. Rao, T.M., Tripathi, P.C., Karunakaran, G., Sakthivel, T., Sankar, V. and Kumar, R.S. 2014. Passion fruit cultivation in India. Technical bulletin No. 3, Central Horticultural Experiment Station (CHES), ICAR - Indian Institute of Horticulture Research (IIHR), Chettalli- 571248, Kodagu, Karnataka, India, 17 p.
16. Santos, C.E.M.D.O.S., Bruckner, C.H., Cruz, C.D., Siquerira, D.L.D.E. and Pimentel, L.D. 2009. Passion fruit physical traits in function of the genotypes and fruit weight. Rev. Bras. Frutic. 31: 1102-19.
17. Silva, T.V., Resende, E.D., Viana, A.P., Rosa, R.C.C., Pereira, S.M., Carlos, L.A. and Vitorazi, L. 2005. Influence of the ripening stages on quality of the yellow passion fruit juice. Rev. Bras. Frutic. 27: 472-75.
Received : October, 2016; Revised : March, 2018; Accepted : April, 2018
191
DOI : 10.5958/0974-0112.2018.00035.X
Indian J. Hort. 75(2), June 2018: 191-196
INTRODUCTIONGrowth control is required for young fruit trees to
hasten flowering and bearing trees prevent crowding and excessive shadings. Frequently, management mistakes or abnormal weather conditions disrupt this delicate balance, resulting in excessive vegetative growth. However, an appropriate balance between vegetative growth and crop load is essential. If not appropriately controlled, this excessive growth negatively influences flower bud formation and fruit set, by causing shading or the early competition for stored resources. Various non-chemical ways to control vegetative growth have been practiced, including use of dwarfing rootstocks, pruning and limb spreading. Although dwarfing rootstocks have been successfully used to control vegetative growth, however, rootstock cannot be a sole solution because unanticipated events such as lack of crop resulting from frost or excessive thinning and biennial bearing tendencies may tip the balance in favour of vegetative growth. These situations require additional forms of growth control.
Although many growth retardants are used in fruit crops for overcoming these problems like adenile benzyl amine is used to reduce the physiological loss in weight, GA12 aldehyde is used to reduce
the acidity in fruits (Wani et al., 16), chloroqemutat causes reduction in shoot length and ethephon that requires high dose for shoot reduction but sometimes it leads to substantial thinning. However, it has been reported that application of prohexadione calcium and paclobutrazol can significantly reduce these problems when applied at appropriate time and in proper quantity (Rademacher and Kober, 11). Prohexadione calcium (Rademacher et al., 12) and paclobutrazol (Arzani and Roosta, 2) both are novel plant growth regulators that emerged as important management tools that an orchardist has available to manage tree canopy volume. One of the major advantages of these growth regulators is that these do not leave any harmful residues on plants because of their less biological activation life when applied on the plant. Now-a-days prohexadione calcium and paclobutrazol produces shortest shoot length and did not have any negative effect on return bloom and yield (Costa et al., 6). To inhibits the shoots growth or to control the excessive vegetative growth which is the main character of the pear fruit plant and to enhance the fruit set, fruit size and ultimately yield, the present study was conducted with two growth retardants (prohexadione calcium and paclobutrazol) on the Clapp’s Favourite pear to standardize the optimum dose for regulating the growth of the plant.
Response of prohexadione calcium and paclobutrazol on growth and physio-chemical characteristics of pear cv. Clapp’s Favorite
Manmohan Lal, M.M. Mir, Umar Iqbal and Amit Kumar*
Division of Fruit Science, SKUAST-Kashmir, Shalimar Campus, Srinagar 190 025, Jammu & Kashmir
ABSTRACTThe present investigation was conducted to study the response of growth retardants on pear cv. Clapp’s
Favorite during the year 2015-2016. The experiment was laid out with thirteen treatments replicated thrice on 12 year-old-trees with uniform vigour and health under uniform cultural practices. The treatment comprises of single spray and double spray of growth retardants (prohexadione calcium @ 100, 200 and 300 ppm and paclobutrazol @ 100, 200 and 300 ppm). The first spray of growth retardants was applied at petal fall stage and second spray was four weeks after first spray. The plants sprayed twice with prohexadione calcium @ 200 ppm (T9S2) recorded minimum annual shoot extension growth (16.92 cm), internodal length (1.82 cm) and leaf area (22.20 cm2) along with increase in fruit set (18.34 %) and minimum fruit drop (32.45 %). Increased fruit yield (51.24 kg), yield efficiency (4.08) and following year return bloom (24.04 %) was noticed in T9S2 treatment. Prohexadione calcium sprayed twice @ 200 ppm (T9S2) also increased fruit weight (82.85 g), TSS (13.21 %) and total sugars (10.23 %) closely followed by the double spray of prohexadione calcium @ 300 ppm sprayed twice which was also effective in enhancing the fruit firmness (6.15 kg/cm2) followed by treatment T12S2 i.e. paclobutrazol @ 200 ppm double spray (6.07 kg/cm2). Double spray of prohexadione calcium @ 200 ppm was effective in reducing the vegetative characters and increasing yield and fruit quality characters.Keywords: Pyrus communis, growth retardants, quality, return bloom.
*Corresponding author's E-mail: [email protected]

192
Indian Journal of Horticulture, June 2018
MATERIALS AND METHODSThe experiment was carried out at farmer’s field
during 2015-2016 near SKUAST-Kashmir, Shalimar, Srinagar (J&K). The experimental orchard was situated at an altitude of 1685 m amsl which lying between 34º75’N latitude and 74º50’E longitude. The study was conducted on twelve year old pear trees cv. ‘Clapp’s Favourite’ grown on seedling rootstock. The orchard was having proper drainage and soil was moderately deep, showing good fertility status. Most of the precipitation received from October to April and rest is erratically distributed. Winters are severe extending from December to March and the temperature often goes below freezing point during this period. The plants having similar vigour and size were selected, marked and maintained under uniform cultural practices and trained as modified leader system at a spacing of 5 × 5 metre.
The experiment was laid out in a randomized block design with three trees representing a treatment. Thirty nine healthy trees grouped into three replications and thirteen treatments including a control (water spray) were marked as per the treatments. Two growth retardants (prohexadione calcium and paclobutrazol) with three concentrations of each (100, 200, 300 ppm) were sprayed (details given in Table 1). The first spray of these growth retardants was given at petal fall stage and second at four weeks after first spray.
Observations were recorded on various vegetative characters. Four branches per plant were randomly selected in four directions and marked/tagged and annual shoot extension growth (cm) and internodal length (cm) was worked out with the help of measuring tape. Leaf area (cm2) was calculated with help of automatic leaf area meter (221 Systronics). Yield per plant (kg) was calculated by weighing whole fruits from a single plant. Yield efficiency (kg/cm2) was calculated as per standard method. On the selected branches total number of flowers was counted initially and number of fruitlets at pea stage and per cent fruit
set was calculated. Fruit drop (%) was calculated with the help of formula:
Fruit drop (%) =
No. of fruitlets at peanut stage – No. of fruits at harvest
= 100No. of fruitlets at peanut stage
Fruit retention (%) was calculated by dividing number of fruits at harvest with number of fruitlets at peanut stage multiply by 100. Return bloom (%) was calculated in the following year by counting the number of flowers in the following season with respect to the previous season and expressed in per cent.
Ten fruits were randomly taken for all the physio-chemical characters. Fruit weight (g) was determined with the help of digital weighing balance, however fruit length and diameter were determined using a digital Vernier caliper. L/D ratio of fruit was calculated by dividing the fruit length with fruit diameter. Fruit flesh firmness was determined with the help of a digital Effegi pressure tester plunger and expressed in kg/cm2. Total soluble solids were determined by using digital hand refractometer whereas acidity was measured in terms of malic acid. Total sugar was determined as per the standard procedures (AOAC, 1). The fruit juice was measured by pressing out juice from a known pulp weight with the help of laboratory model basket. Data collected on various parameters were statistically analyzed as per the procedure given by Snedecor and Cochran (14).
RESULTS AND DISCUSSIONThe effect of growth retardants on the vegetative
growth and yield parameters on the Clapp’s Favourite pear are given in Table 2. Vegetative growth is the parameter most obviously affected by Prohexadione-Ca and paclobutrazol applications. The inhibitory effect of the Pro-Ca formation of growth active gibberellin leads to reduction of shoot growth. The effect of Prohexadione-Ca and paclobutrazol dosage on all the shoot extension growth, intermodal length, leaf area, fruit yield and yield efficiency were statistically
Table 1. Treatment details:
Treatments Chemicals concentrations Treatments Chemicals concentrationsT1 S0 Water spray
Single spray (S1) Double spray (S2)T2 S1 Prohexadione Ca 100 ppm T8 S2 Prohexadione Ca 100 ppmT3 S1 Prohexadione Ca 200 ppm T9 S2 Prohexadione Ca 200 ppmT4 S1 Prohexadione Ca 300 ppm T10 S2 Prohexadione Ca 300 ppmT5 S1 Paclobutrazol 100 ppm T11 S2 Paclobutrazol 100 ppmT6 S1 Paclobutrazol 200 ppm T12 S2 Paclobutrazol 200 ppmT7 S1 Paclobutrazol 300 ppm T13 S2 Paclobutrazol 300 ppm

193
Response of Retardants on Growth and Physio-Chemical Characteristics of Pear
significant (P<0.05). Minimum average annual shoot extension growth (16.92) was obtained in the treatment prohexadione calcium @ 200 ppm sprayed twice (T9S2) which was statistically at par with treatment T10S2 (17.01 cm) i.e. prohexadione calcium @ 300 ppm sprayed twice and treatment T12S2 (17.09 cm) i.e. paclobutrazol @ 200 ppm sprayed twice (17.09 cm) whereas maximum shoot extension growth (21.44 cm) was recorded under control (T1S0). Minimum internodal length (1.82 cm) was recorded in treatment T9S2 i.e. prohexadione calcium @ 200 ppm sprayed twice which was statistically at par with treatment of paclobutrazol @ 200 ppm sprayed twice (T12S2), prohexadione calcium @ 300 ppm sprayed twice (T10S2) and paclobutrazol @ 300 ppm sprayed twice (T13S2) and paclobutrazol @ 100 ppm sprayed twice recorded 1.84 cm, 1.85 cm and 1.88 cm, respectively. Reduction in vegetative growth is attributed to the reason that prohexadione calcium inhibits biosynthesis of active gibberellic acid isomers in plant tissues (Pasa et al., 10). Prohexadione calcium reduces the shoot elongation in fruit trees due to inhibition in the biosynthesis of gibberellic acid as it stops the formation of GA1 (active form) from GA20 (Basak and Rademacher, 3). Double spray of prohexadione calcium applied @ 200 ppm registered minimum leaf area (22.20 cm2) closely followed and statistically at par with other double spray of Pro-Ca and Paclabutrazol concentrations except double spray of both the growth retardants @ 100 ppm whereas maximum leaf area (24.63 cm2) was measured in control (T1S0). Cares et al., (5) observed that prohexadione calcium is a plant
bio regulator that inhibits gibberellic acid biosynthesis and hence causes reduction in annual extension growth and leaf area of sweet cherry cv. Lappins and Sweet heart.
Fruit yield and yield efficiency had also influenced by the prohexadione calcium and paclobutrazol application. Prohexadione calcium 200 ppm sprayed twice (T9S2) had scored highest values for fruit yield (52.24 kg) and yield efficiency (4.28 kg/cm2) which were statistically superior among all the treatments, however, minimum values were registered under control for fruit yield (33.59 kg) and yield efficiency (3.23 kg/cm2). The increase in yield may be attributed to the reason that prohexadione calcium inhibits gibberellic acid biosynthesis, which changes the source sink relationship by recollecting the carbohydrates source toward fruits, however yield efficiency is the ratio of fruit yield and trunk cross sectional area, decrease in cross sectional area with the use of prohexadione calcium resulted in increase in yield efficiency (Costa et al., 6).
Data presented in Fig. 1 depicts that all the fruiting characters and return bloom was significantly affected by the application of Pro-Ca and paclobutrazol chemicals. Maximum fruit set (18.34 %) was recorded when prohexadione calcium was sprayed twice @ 200 ppm which was statistically higher among all the treatments however minimum fruit set was recorded under control (T1S0). The increase in fruit set was attributed to the fact that prohexadione calcium primarily inhibits the excessive vegetative growth in fruit trees and thus reduces abortion of fruitlets, thereby increases fruit set (Rademacher and Kober, 11).
Table 2. Effect of prohexadione calcium and paclobutrazol on vegetative and yield characters of Clapp’s Favourite pear.
Treatments Annual shoot extension (cm)
Internodal length (cm)
Leaf area (cm2)
Fruit yield (kg/tree)
Yield efficiency (kg/cm2)
T1S0 21.44 4.39 24.63 33.59 3.23T2S1 18.43 2.42 23.44 35.30 3.32T3S1 17.54 2.20 23.04 39.50 3.53T4S1 17.63 2.25 23.10 38.50 3.51T5S1 18.47 2.42 23.44 34.77 3.24T6S1 17.64 2.21 23.08 38.93 3.52T7S1 17.88 2.28 23.10 37.60 3.33T8S2 17.89 2.10 23.00 42.73 3.71T9S2 16.92 1.82 22.20 52.24 4.28T10S2 17.01 1.85 22.40 50.57 3.73T11S2 17.89 2.16 23.03 42.67 3.68T12S2 17.09 1.84 22.75 51.12 4.05T13S2 17.17 1.88 22.88 50.54 3.72CD0.05 0.17 0.26 0.80 0.66 0.18

194
Indian Journal of Horticulture, June 2018
Minimum fruit drop (32.45 %) and maximum fruit retention (67.49 %) was noticed in the treatment T9S2 i.e. prohexadione calcium @ 200 ppm sprayed twice which were statistically and significantly superior over other treatments. Similar results with respect to fruit drop was earlier reported by Vercammen and Gomand, (15) in ‘Conference’ pear, however Shehaj et al. (13) reported conformity results for fruit retention in pear cv. ‘Passe Crassane’. Pro-ca inhibits the vegetative growth in fruit plants and also inhibits the ethylene biosynthesis in fruits that also inhibits rapid fruit drop and thus it increases the fruit retention in fruits plants (Rademacher and Kober, 11).
Return bloom was observed in the following year on the marked branches and it was noticed that the double spray of Pro-Ca @ 200 ppm had maximum return bloom (24.04 %) which was statistically at par with the treatment T12S2 (23.92 %) i.e. twice spray of paclobutrazol @ 200 ppm and T10S2 (23.59 %) i.e. twice spray of Pro-Ca @ 300 ppm, however minimum return bloom (14.46 %) was recorded under control (T1S0). Reduction in vegetative growth due to spray of Pro-ca results in the conserve higher amounts of assimilates in the fruit plants and these assimilates increases return bloom in the following year as there is more reproductive bud formation takes place (Bill, 4).
All the physio-chemical characters were significantly influenced by the application of prohexadione calcium and paclobutrazol (Table 3) except acidity which showed non-significant results. Prohexadione calcium @ 200 ppm sprayed twice (T9S2) had recorded maximum fruit weight (82.85 g) which was significantly superior over other treatments, whereas, minimum fruit weight (68.96 g) was recorded in control (T1S0). Earlier Costa et al., (6) also reported higher fruit weight in ‘Abbate Fetel’ pear while applying the Pro-Ca four times @ 100 ppm. Maximum fruit length (6.81 cm) and fruit diameter (6.44 cm) was registered in the treatment T12S2 i.e. paclabutrazol @ 200 ppm sprayed twice which was statistically at par with the double spray of Pro-Ca @ 200 ppm (6.73 cm and 6.34 cm) and Pro-Ca @ 300 ppm (6.66 cm and 6.36 cm), however minimum values for fruit length (4.67 cm) and fruit diameter (4.47 cm) was registered in the treatment T1S0 (control). Meintejes et al., (8) in ‘Rosemarie’, ‘Flamingo’, ‘Early Bon Chretien’, ‘Packham’s Triumph’ and ‘Forelle’ pear also reported similar results with respect to fruit size after application of Pro-Ca. Treatment T9S2 (Pro-Ca @ 200 ppm) and T12S2 (paclobutrazol @ 200 ppm) recorded maximum (1.06) value for L/D ratio whereas minimum (0.86) value was recorded in T2S1, T8S2 and T11S2. Maximum fruit firmness (6.15 kg/cm2) was recorded
Fig. 1. Effect of prohexadione calcium and paclobutrazol on fruit set, drop, retention and return bloom of ‘Clapp’s Favourite’ pear.

195
Response of Retardants on Growth and Physio-Chemical Characteristics of Pear
in treatment T10S2 i.e. prohexadione calcium @ 300 ppm sprayed twice which was statistically at par with T12S2 i.e. paclobutrazol @ 200 ppm sprayed twice (6.07 kg/cm2), however, minimum fruit firmness (4.73 kg/cm2) was recorded in control (T1S0). The linear increase in fruit firmness was also reported Guak (7) in apple cv. ‘Golden Delicious’. Prohexadione calcium reduces competition between shoot growth and fruit development and hence, increases the amount of mineral nutrition including calcium moves towards fruit and increases fruit firmness (Bill, 4).
Treatment T9S2 i.e. prohexadione calcium sprayed twice @ 200 ppm scored maximum TSS (13.21%) and total sugars (10.23%) which was statistically at par with treatment T10S2 i.e. Pro-Ca sprayed twice @ 300 ppm (13.06% and 10.11%) and treatment T12S2 i.e. paclobutrazol sprayed twice @ 200 ppm (12.92% and 9.89%) whereas minimum TSS (9.72%) and total sugars (8.35%) was recorded in control (T1S0). Minimum acidity (0.43%) was recorded in prohexadione calcium @ 200 ppm sprayed twice and maximum acidity (0.52%) was recorded in control, however the results for the acidity were non-significant. The reason attributed to this is that prohexadione calcium inhibits gibberellic acid biosynthesis that resulted in reduction of vegetative growth and consequently facilitates more assimilates towards fruit like carbohydrates, cellulose and sugars (Guak, 7). Prohexadione calcium @ 200 ppm sprayed twice (T9S2) recorded highest TSS/acid ratio value (30.17) which was statistically at par with treatment T10S2 i.e. prohexadione calcium
@ 300 ppm sprayed twice (29.81) and treatment T12S2 i.e. paclobutrazol @ 200 ppm sprayed twice (29.48) whereas, minimum TSS/acid ratio (18.96) was recorded in control. Maximum fruit juice (50.91%) was recorded in treatment T12S2 (paclobutrazol @ 200 ppm sprayed twice) which was statistically at par with treatment T9S2 i.e. Pro-Ca @ 200 ppm sprayed twice (50.69%) and treatment T10S2 i.e. Pro-Ca @ 300 ppm sprayed twice (50.07 %), whereas minimum fruit juice (31.35 %) was recorded in control. Increase in TSS, total sugar, fruit juice and decrease in acidity content of pear fruit is that due to less competition between shoot growth and fruit development, more photosynthetic assimilates moves towards fruits as a result increases sucrose and cellulose levels in fruits that further resulted in increase of TSS/acid ratio in fruits (Ouzounidou et al., 9).
Foliar application of prohexadione calcium 200 ppm sprayed twice at complete petal fall and second at four weeks after first spray resulted in minimum vegetative growth which increased fruit yield and quality and return bloom as the assimilates used in vegetative growth were translocated towards fruits as a result of which fruit yield, fruit quality and return bloom were improved.
REFERENCES1. AOAC, 2012. Official and Tentative Methods of
Analysis (15th Edn.), Benajmin Franklin Station, Assoc. of the Official Analytical Chemists, Washington, DC, USA.
Table 3. Effect of prohexadione calcium and paclobutrazol on fruit physio-chemical characters of Clapp’s Favourite pear.
Treatments Fruit weight
(g)
Fruit length (cm)
Fruit diameter
(cm)
L/D Ratio
Fruit firmness (kg/cm2)
Total soluble
solids (%)
Total sugars
(%)
Acidity (%)
TSS/Acid ratio
Fruit juice (ml)
T1S0 68.96 4.67 4.47 1.04 4.73 9.72 8.35 0.52 18.96 31.35T2S1 73.28 4.91 5.72 0.86 4.97 11.12 8.62 0.48 23.13 40.43T3S1 77.66 5.83 5.90 0.98 5.63 12.14 8.98 0.47 25.84 44.92T4S1 76.47 5.67 5.89 0.96 5.78 11.80 8.89 0.47 25.01 43.84T5S1 72.60 4.89 5.25 0.93 4.59 11.01 8.52 0.51 22.37 39.55T6S1 76.64 5.42 5.58 0.97 5.73 12.00 8.99 0.45 26.67 44.50T7S1 75.08 5.38 5.37 1.01 5.55 11.71 8.99 0.47 24.92 43.51T8S2 78.14 5.09 5.97 0.86 5.33 11.91 9.13 0.47 25.37 44.37T9S2 82.85 6.73 6.34 1.06 5.93 13.21 10.23 0.43 30.17 50.69T10S2 81.85 6.66 6.36 1.05 6.15 13.06 10.11 0.44 29.81 50.07T11S2 77.58 5.05 5.85 0.86 5.33 11.73 9.01 0.49 23.98 42.73T12S2 82.13 6.81 6.44 1.06 6.07 12.92 9.89 0.44 29.48 50.91T13S2 80.79 6.42 6.26 1.03 5.96 12.74 9.67 0.46 27.73 49.55CD0.05 0.54 0.19 0.16 0.04 0.09 0.34 0.35 NS 1.65 1.32

196
Indian Journal of Horticulture, June 2018
2. Arzani, K. and Roosta, H.R. 2004. Effects of paclobutrazol on vegetative and reproductive growth and leaf mineral content of mature apricot (Prunus armeniaca L.) trees. J. Agri. Sci. Tech. 6: 43-55.
3. Basak, A. and Rademacher, W. 2000. Growth regulation of pome and stone fruit trees by use of prohexadione calcium. Acta Hort. 514: 41-50.
4. Bill, M. 2012. Advancing harvest maturity and improving storability of ‘Triumph’ persimmons. M.Sc. Thesis, Stellenbosch University. 119 p.
5. Cares, J., Sagredo, K.X., Cooper, T. and Retamales, J. 2014. Effect of prohexadione calcium on vegetative and reproductive development in sweet cherry trees. Acta Hort. 1058: 357-63.
6. Costa, G., Andreotti, C., Bucchi, F., Sabatini, E., Bazzi, C., Malaguti, S. and Rademacher, W. 2001. Prohexadione calcium: growth regulation and reduced fire blight incidence in pear. HortSci. 36: 931-33.
7. Guak, S. 2013. Effects of Prohexadione-calcium, ethephon, and water stress on growth and productivity of Golden Delicious/M9 apple. Korean J. Hort. Sci. Tech. 31: 38-49.
8. Meinejes, J.J., Stassen, P.J.C. and Theron, K.I. 2004. The effect of different rates of prohexadione-calcium and girdling on shoot growth and fruit quality when applied to different pear cultivars. Sci. Hort. 106: 515-29.
9. Ouzounidou, G., Ilia, L., Giannakoula, A. and Papadopoulou, P. 2010. Comparative study on the effects of various plant growth regulators on growth, quality and physiology of Capsicum annuum L. Pakistan J. Botany 42: 805-14.
10. Pasa, M.S., Einhorn, T.C. and Turner, J. 2014. ‘D’Anjou’ pear shoot growth and return bloom, but not fruit size, are reduced by prohexadione-calcium. HortSci. 49: 180-87.
11. Rademacher, W. and Kober, R. 2003. Efficient use of prohexadione calcium in Pome fruits. Euro. J. Hort. Sci. 68: 101-107.
12. Rademacher, W, Spinelli, F. and Costa, C. 2006. Prohexadione- ca: modes of action of a multifunctional plant bioregulator for fruit trees. Acta Hort. 727: 97-106.
13. Shehaj, M., Rama, P., Veizi, A., Prejsi, E. & Vrapi, H. 2015. The use of prohexadione-calcium on control of the alternate fruit production of pear cv. Passe Crassane. Int. Refd. J. Engineering Sci. 4: 30-32.
14. Snedecor, G.W. and Cochran, W.G. 1994. Statistical Methods (5th Edn.), Iowa State University Press, Ames, Iowa, USA.
15. Vercammen, J. and Gomand, A. 2008. Fruit set of ‘Conference’: a small dose of gibberellins or Regalis. Acta Hort. 800: 131-38.
16. Wani, A.M., Peer, F.A. and Lone, I.A. 2007. Effect of paclobutrazol on growth, picking maturity and storage behaviour of Red Delicious apples. The Asian J. Hort. 2: 171-75.
Received : July, 2017; Revised : January, 2018; Accepted : April, 2018

197
DOI : 10.5958/0974-0112.2018.00036.1
Indian J. Hort. 75(2), June 2018: 197-201
INTRODUCTIONAlmond (Prunus dulcis) is one of the important
nut crops of temperate region of India, mainly grown in Kashmir valley. In India, it is grown over an area of 12,000 hectares with an annual production of 7,000 tonnes (NHB, 12). The kernels are concentrated sources of energy with a significant share of fat, protein, and fibre. Commercial almond production in India is low considering the demand and economical potential. Irrigation and fertilizers are the most important inputs which directly affect the plant growth, fruit yield and quality. Application of fertilizers through drip irrigation is the most effective way for supplying nutrients to the plant and increases fertilizer use efficiency. In general, most of the farmers apply the fertilizers in single soil application during dormant season and no fertilizer is applied during vegetative, flowering, and fruit growth stages, thus the effectiveness of the applied fertilizers is reduced considerably. Drip irrigation plays a major role in productivity enhancement in almond (Khan et al.6). Reddy et al. (15) obtained significantly higher yield, fruit size, weight and fertilizer use efficiency in banana with fertigation compared to soil application in banana. Application of nutrients through fertigation improves yield and quality in fruit crops as reported by Chauhan and Chandel (4) in kiwifruit, Ahmad et al. (1) in cherry, Raina et al. (13) in apricot, Banyal et al. (2) in peaches, Rao and Subramanyam (14)
in pomegranate, Kumar and Pandey (7) in banana, Singh et al. (18) in apple and Shirgure et al. (17) in Nagpur mandarin.
Under drip irrigation, only a portion of soil volume around each plant is wetted and thus traditional methods of fertilizers application are less effective. The limited root zone and reduced amount of mineralization in restricted wetted zone are the main reason for the reduced nutrient availability to the plants (Magen, 9). One of the major advantages of fertigation is that it permits timely application of nutrients directly to root zone, reduces leaching losses, and increases the fertilizers use efficiency (Rolston et al. 16). The nutrient requirement of almond crop through fertigation as per the crop growth stage for better crop production. The systematic information is not available in almond especially water and nutrient management. Therefore, the present investigation was aimed to increase production and potential of almond by nitrogen and potassium fertigation in north western Himalayan region of India.
MATERIALS AND METHODSA field experiment was conducted at ICAR-
Central Institute of Temperate Horticulture (ICAR), Srinagar, Jammu and Kashmir, during 2011-12 to 2013-14 for consecutive three years. The research farm at Srinagar located at a latitude of 34º05’N and longitude of 74º50’E with an altitude of 1640 m above MSL. The soils of this experimental field are silty loam (39.60% sand, 24.0% silt, and 36.40%
Effect of fertigation on growth, yield and quality of almond under Kashmir conditions
Dinesh Kumar* and D.B. SinghICAR- Central Institute of Temperate Horticulture, Srinagar 190 025, Jammu & Kashmir
ABSTRACTAn experiment was conducted for three consecutive years during 2011-12 to 2013-14 with an objective to
improve growth, yield and quality of almond by fertigation. There were seven fertigation treatments laid out in randomised block design with three replications. The results revealed maximum plant height (3.67 m), TCSA of main trunk (101.22 cm2), primary, secondary and tertiary branches (20.51 cm2, 6.66 cm2 and 1.97 cm2 ), canopy volume (8.21m3), and nut yield (4.94 kg/tree and 5.48 t/ha), leaf nitrogen and potassium content (2.39 % N and 1.41%K) with 75% RDF through fertigation (split application of N : K in the ratio of 2/3N : 1/3K at nut set to nut development and 1/3N : 2/3K at kernel filling to maturation stage(T-4). The highest fruit number (2208/tree), however, was recorded with 100% RDF through fertigation (T2). The maximum nut weight and size (2.29 g and 36.51 × 21.45 mm), kernel weight and size (1.48 g and 24.71 × 14.59 mm) were recorded with 50% RDF through fertigation (T5) treatment of almond variety Waris under Kashmir valley condition.Key words : Prunus dulcis, temperature, stone fruit, soluble fertilizers.
*Corresponding authors’ Present address: ICAR- Central Institute for Subtropical Horticulture, Lucknow, Email: [email protected]

198
Indian Journal of Horticulture, June 2018
clay) with medium to low soil fertility status. The experimental farm falls under temperate region having cold conditions from November to February and three year mean maximum and minimum temperature of Srinagar climate indicated that the maximum is 310C in August and the minimum is 2.20C in December. The average annual precipitation was 650 mm distributed erratically throughout the year during the course of investigation.
The almond grafted on seedling rootstocks were planted in prefilled pits of 90 cm × 90 cm × 90 cm dimension during November,2002 at 3m × 3m spacing. The recommended dose of fertilizers were applied as per the package of practices for the region. The full quantity of phosphorus in plant basin has been applied 15 days before flowering in almond. The nitrogen and potassium doses were applied through fertigation as per treatment. There were seven treatments- T1-100% Recommended Dose of Fertilizers(Soil application), T2-100% RDF through fertigation, T3-75% RDF through fertigation, T4-75% RDF through fertigation (split application of N : K in the ratio of 2/3N : 1/3K at nut set to nut development and 1/3N : 2/3K at kernel filling to maturation stage), T5-50% RDF through fertigation,T6-50% RDF through fertigation (split application of N : Kin the ratio of 2/3N : 1/3K at nut set to nut development and 1/3N : 2/3K at kernel filling to maturation stage) and T7-Control (without fertilizer). The experiment was laid out in randomized block design with four replications and two plants were taken in each replication.
Water soluble fertilizers like urea as a source of nitrogen and muriate of potash as potassium were injected through drip irrigation system at weekly intervals as per crop nutrient requirement in almond. The concentration of nutrient solution passing through irrigation water was around 1.0–1.5 percent. A separate laterals line (16 mm) was laid for each treatment and four emitters of 4 litre per hour capacity with pressure compensated connected with 12 mm lateral were placed equidistance in east-west north-south direction at 50% distance of canopy radius. The diameter of lateral pipe was 16 mm connected with sub main pipe. The irrigation was applied throughout the growing season (till initiation of leaf fall) based on pan evaporation (80%) with the following formula:Water requirement (litre/plant/day)= (DE × CF × AA × PC) / IE
Where DE is daily pan evaporation from class-A pan (mm); CF is crop factor; AA is area allotted to each plant (m2); PC is percentage of canopy (leaf coverage in relation to area allowed to plant); and IE is irrigation efficiency (0.9). The other cultural practices including weed, pest, and diseases management
were followed uniformly as per recommended package of practices.
The observations on canopy volume (CV) were estimated for each individual tree using a geometrical model referred to as the “contour method” CV = [(1/4)πabh)/(m(x) + m(y) + 1)]. The dimensions a and b were measured the width of tree at the base of the canopy perpendicular and parallel to the tree row orientation, respectively. The height of the canopy (h) was measured from the lowest branch to the apex. The functions m(x) and m(y) were derived to accommodate the contour of the tree (Wright et al.20). CV measurements were made after harvest in October 2011,2012 and 2013. Tree trunk girth was recorded before the execution and at the end of experiment during the year of study. A ring was made with red paint at a height of 15cm above the ground level in each selected tree to record the trunk girth from the same point each year. The trunk cross-sectional area (TCSA) of tree was calculated by using formula TCSA = Girth2/4π. Fruit was harvested at maturity, hulled, and dried and nut weight in gram and yield per tree was recorded in kilogram. The nut and kernel size was determined by observing the length and diameter was measured by Vernier calipers and expressed in millimeter.
Leaf samples were collected for leaf nutrient analysis as per procedure out lined by Chapman (3). For macronutrient except N estimation, well-ground leaf tissue was digested in diacid mixture containing HNO3 and HCIO4 in 9:4 ratio for P, K by using ammonium molybdate: ammonium meta vanadate using double beam UV-Visspectro photometer (ECIL India) and the potassium was determined by using flame photometer (Jackson,5). For leaf N estimation, a known weight of samples was digested with H2SO4 using 10:1K2SO4 and CuSO4 as digestion mixture and digested at 3900C until clear digestion was obtained. Digested samples were subjected to distillation with 40% NaOH and liberated ammonia was collected H3BO3using mixed indicator. Finally liberated ammonia was titrated against 0.1N H2SO4 and N content in the leaves was expressed in percentage. The data were analyzed statistically as per Steel and Torrie (19) for interpretation of results and drawing conclusions.
RESULTS AND DISCUSSIONVegetative growth such as plant height, cross
sectional area of main trunk, primary, secondary and tertiary branches and canopy volume as influenced by fertigation technique in almond (Table 1). Maximum plant height (3.67 m), cross sectional area of main trunk (101.22 cm2), primary (20.51

199
Effect of Fertigation on Growth, Yield and Quality of Almond
Table 1. Vegetative growth as influenced by fertigation in almond cv. Waris.
Treatment Plant height(m)
Cross Sectional Area (cm2) Canopy volume (m3)Main trunk Primary branch Secondary branch Tertiary branch
T1 3.50 91.95 19.64 6.25 1.76 7.29T2 3.67 101.22 20.51 6.66 1.97 8.21T3 3.35 96.49 18.08 5.89 1.77 6.41T4 3.59 99.82 20.35 6.61 1.85 7.87T5 3.30 85.43 13.7 4.61 1.63 6.28T6 3.45 87.78 14.21 5.18 1.67 6.36T7 3.21 80.96 12.18 3.53 1.51 5.12CD at 5% 0.31 8.87 2.75 1.51 NS 1.05
Table 2. Nut number, weight and yield as influenced by fertigation in almond.
Treatment Nut number
Nut wt (g)
Nut yield (kg/tree)
Yield (t/ha)
T1 1491 2.11 3.15 3.50T2 2208 2.07 4.57 5.07T3 1787 2.09 3.73 4.14T4 2180 2.27 4.94 5.48T5 1219 2.29 2.79 3.09T6 1424 2.22 3.16 3.51T7 904 2.03 1.84 2.04CD at 5% 297 0.22 0.82 0.73
cm2), secondary (6.66 cm2), tertiary branches (1.97 cm2) and canopy volume (8.21 m3) were recorded in 100 % recommended dose of fertilizer (RDF) through fertigation and at par with T4 treatment. It is 12.53 % plant height, 20.02% cross sectional area of main trunk, 40.61% primary, 46.99% secondary and 23.35% tertiary branches and 37.64% canopy volume higher over control treatment. The higher vegetative growth was recorded in T2 treatment might be due to optimum availability of applied nutrients as well as their effective utilization by the plants. Results are inconformity with the findings of Rao and Subramanyam (14) while working on pomegranate, the vegetative growth was positively related to the amount of nitrogen applied through drip/fertigation. Similar results obtained by Ahmad et al. (1) while working in sweet cherry.
A perusal of data presented in Table 2 clearly indicated that nut number, weight and yield as influenced by fertigation techniques in almond. The pooled data of three years showed maximum nut number (2208 /tree) was recorded in 100% RDF through fertigation closely followed by T4 (2180 /tree) and minimum (904/tree) was in control treatment. The higher nut number with T2 treatment might be due to the fact that the application RDF through fertigation improve the nut retention in almond. Whereas, highest nut weight (2.29 g) was recorded in T5 treatment (50% RDF through fertigation) which is at par with T4 and T6 treatment. The nut number is negatively correlated with nut weight. The improvement in nut weight in T5 treatment might be due to more nutrient diverted for development of limited number of fruit available on the tree. The highest nut yield (4.94 kg/tree and 5.48 t/ha) was recorded in T4 treatment closely followed by T2 treatment (4.57 kg/tree and 5.07 t/ha) and significantly superior over other treatments. The higher fruit yield obtained in T4 treatment might be due to efficient utilization of nutrients as per the
growth stages and reduction in nutrient leaching that resulted in better yield. Similar results were reported by Ahmad et al. (1) and Kumar and Ahmed, (8) while working on cherry and almond crop.
Data presented in Table 3 indicated that nut size, kernel weight and size and shell weight as influenced by fertigation techniques in almond (Table 3). Maximum nut dimension (36.25 × 21.33 mm), and kernel weight and dimension (1.45 g and 24.62 × 14.54 mm) were recorded with T5 treatment followed by T4 treatment (36.25 × 21.33 mm nut dimension; 1.45 g kernel weight and 24.62 × 14.54 mm kernel dimension) and minimum was in control (25.45 × 16.23 mm nut dimension; 1.05 g kernel weight and 18.56 × 11.23 mm kernel dimension), respectively. As per the nut quality, lighter the shell weight better the quality. Non significant variations were obtained in respect to shell weight among the fertigation treatment. The maximum nut size and kernel weight and size were recorded in T5 treatment might be due to more nutrient diverted for the development of limited fruits on the tree. Similar findings reported by Kumar and Ahmed, (8).

200
Indian Journal of Horticulture, June 2018
Table 3. Nut characters as influenced by fertigation in almond cv. Waris.
Treatment Kernel wt (g) Nut size (mm) Kernel wt (g) Kernel size (mm) Shell wt (g)T1 1.35 35.21 x 21.25 1.35 24.17 x 14.15 0.76T2 1.30 33.15 x 20.12 1.30 23.21 x 13.22 0.77T3 1.32 33.50 x 20.31 1.32 23.45 x 13.35 0.77T4 1.45 36.25 x 21.33 1.45 24.62 x 14.54 0.82T5 1.48 36.51 x 21.56 1.48 24.71 x 14.59 0.81T6 1.35 34.25 x 20.45 1.35 23.89 x 13.56 0.87T7 1.05 25.45 x 16.23 1.05 18.56 x 11.23 0.98CD at 5% 0.12 NS 0.12 NS NS
Fig. 1. Leaf NPK as influenced by fertigation in almond.
Leaf nitrogen, phosphorus and potassium content as influenced by fertigation techniques in almond (Fig. 1). Maximum leaf nitrogen (2.39 %) and potassium (1.41%) were recorded with T4 treatment closely followed by T2 treatment (2.36 % N and 1.38%K) and T3 (2.34%N and 1.35%K) treatment, respectively. It is 37.65% N and 25.53%K ; 36.86%N and 23.91%K; 36.33%N and 22.22%K higher and significantly superior over control treatment. The leaf phosphorus content were non significant among the fertigation treatments. The higher nitrogen and potassium content in leaf in T4 might have accounted for higher uptake of these nutrients. Similar increase in leaf nutrient content has been reported by Murthy et al.(10) and Neilsen et al. (11).
The present study could be concluded that the application of 75% RDF through fertigation (applied N:K in the ratio of 2/3N:1/3K at nut set to nut development and 1/3N:2/3K at kernel filling to maturation stage) increases nut yield in almond by enhancing fertilizer use efficiency besides saving of input cost under Kashmir valley conditions.
REFERENCES1. Ahmad, M.F., Samanta, A. and Jabeen, A. 2010.
Response of sweet cherry (Prunus avium) to fertigation of nitrogen, phosphorus and potassium under Kerawa land of Kashmir valley. Indian J. Agri. Sci. 80: 512-16.
2. Banyal, S.K., Sharma, D. and Jarial, K. 2015. Effect of nitrogen fertigation on yield and fruit quality of low chilling peaches under subtropical conditions of Himachal Pradesh. Indian J. Hort. 72: 457-60.
3. Chapman, H.D. 1964. Suggested foliar sampling and handling techniques for better determining the nutrient status of field and horticultural and plantation crops. Indian J. Hort. 21: 77-119.
4. Chauhan, N. and Chandel, J.S. 2008. Effect of fertigation on growth, yield, fruit quality and fertilizer-use efficiency of kiwifruit (Actinidia deliciosa). Indian J. Agri. Sci. 78: 389-95.

201
Effect of Fertigation on Growth, Yield and Quality of Almond
5. Jackon, M. L. 1973. Soil Chemical Analysis, Prentice Hall, New Delhi, India.
6. Khan, I. A., Wani, M. S., Mir, M. A., Ahmed, N., Mushtaq, K. and Hassan, G. I. 2012. Response of almond (Prunus dulcis) to different drip irrigation levels vis-`a-vis various phonological stages on flowering and yield of almond cv. Shalimar. Indian J. Agri. Sci. 82: 624-28.
7. Kumar, D. and Pandey, V. 2008. Effect of NPK fertigation on growth, yield and quality of banana “Rasthali” (AAB-Pathkapoora) in coastal agro-climatic conditions of eastern India. Indian J. Agri. Sci. 78: 798-800.
8. Kumar, D. and Ahmed, N. 2014. Response of nitrogen and potassium fertigation to ‘Waris’ almond (Prunus dulcis) under Northwestern Himalayan Region of India. The Sci. World J., Vol 2014, article ID 141328, 6 pages http/dx.doi. org/10.1155 /2014/141328.
9. Magen, H. 1995. Fertigation-An overview of some practical aspects. Fertilizer News, 42: 97–100.
10. Murthy, P. V., Khan, M. M., Nachegowda, V. and Umamahes. W. P. 2001. Effect of fertigation on leaf area and leaf petiole nutrient on tents in Bangalore Blue grapes, Current Research, Uni. Agri. Sci., Bangalore, 30: 14–16.
11. Neilsen, G. H., Neilsen, D., Herbert, L. C. and Hogue, E. J. 2004. Response of apple to fertigation of N and K under conditions susceptible to the development of K deficiency. J. American Soc. Hort. Sci. 129: 26–31.
12. NHB. 2016-17. Indian Horticulture Data Base, National Horticulture Board, Ministry of Agriculture, Govt. of India, Gurgoan, Haryana, India.
13. Raina, J.N., Thakur, B. C., Suman, S. and Spehia, R. S. 2005. Effect of fetrigation through
drip irrigation system on nitrogen dynamics, growth, yield and quality of apricot. Acta Hort. 696: 227–29.
14. Rao, K. D. and Subramanyam, K. 2009. Effect of nitrogen fertigation on growth and yield of pomegranate var. Mridula under low rain fall zone. Agri. Sci. Digest, 29: 1-3.
15. Reddy, B.M.C., Srinivas, K., Padma, P. and Raghupathi, H.B. 2002. Response of Robusta banana to N and K fertigation, Indian J. Hort. 59: 342–48.
16. Rolston, D. E., Miller, R. J. and Schulbauch, H. 1986. Management principles fertilization, in Trickle Irrigation for Crop Production, Design, Operation and Management, F. S. Nakayama and D. A. Bucks, Eds., p. 317, Elsevier Science, Amsterdam, The Netherlands.
17. Shirgure, P. S., Srivastava, A. K. and Singh, S. 2001. Growth, yield and quality of Nagpur mandarin (Citrus reticulata Blanco) in relation to irrigation and fertigation. Indian J. Agri. Sci. 71: 547–50.
18. Singh, B. P., Dimri, D. C. and Singh, S. C. 2007. Efficacy of NPK management through fertigation on growth characteristics of apple (Malus domestica Bork) plant. Pantnagar J. Res. 5: 50–53.
19. Steel, R. G. T. and Torrie, J. H. 1986. Principles and Procedures of Statistics. McGraw-Hill, Singapore.
20. Wright, H., Nichols, D. and Embree, C. 2006. Evaluating the account ability of trunk size and canopy volume models for determining apple tree production potential across diverse management regimes. Acta Hort. 707: 237–43.
Received : July, 2016; Revised : March, 2018; Accepted : April, 2018

202
INTRODUCTIONPlum is an important stone fruit crop of temperate
region, stands next to peach in economic importance and is used both as fresh and in preserved form. Among different species of plum, Prunus salicina is more vigorous, productive, precocious in bearing and disease resistant than the Prunus domestica. Area under plum cultivation in Jammu and Kashmir is 4038 hectares with an annual production of 10112 MT (Anonymous, 2). In Jammu and Kashmir, still Santa Rosa is a leading commercial cultivar of Japanese plum known for its fair quality, aroma and characteristic flavor. Nutrients are essential for high productivity and good quality of different fruit crops. Supplying of the nutrients to the fruit plants from different fertilizers in a balanced form is critical for achieving consistent production and high quality fruits.
Nitrogen is usually applied annually to fruit crops and for which various sources are available such as nitrate, ammonium or in combination of both whereas the calcium nitrate or urea is commonly used nitrogen fertilizer for fruit crops. Boron is an essential trace element required for abundant yield and high quality fruit. High amount of boron in plum tree must be
applied during flowering because boron plays an important role in pollen production its germination, pollen tube growth and cell division (Wang et al., 14). But boron fertilization in fruit trees and especially in plum trees is seldom applied in Kashmir.
Proper fertilization depends on analytical results instead of routine application of fertilizers every year irrespectively of the plants need from which money can be saved and the quality of the fruit will improve. Chemical analysis of soil and leaf samples provide details that helps us to choose the most appropriate fertilizers to be used. Data from analysis of soil is not used for the same purposes as that from leaf analysis. Soil analysis is best used before planting. However, in planted blocks soil analysis still gives useful background information, especially if salt problems or problems associated with low or high pH are suspected. After establishment of orchard leaf analysis gives better guide to the fruit nutrient status than soil. Leaf analysis after 120 days after full bloom can be very useful tool for plum nutritional diagnosis (Singh-Sidhu and Kaundal, 13). Determination of nutritional needs for efficient production of high quality fruits of plum is an important aspect of nutrient management for the orchardist. The present study was conducted to determine the effect of nitrogenous
Nutritional status of Santa Rosa Japanese plum as affected by nitrogen and boron under rainfed conditions of Kashmir
Gowhar A. Dar, Amit Kumar*, F.A. Misgar and Kounser JaveedDivision of Fruit Science, SKUAST-Kashmir, Shalimar, Srinagar 190 025, Jammu & Kashmir
ABSTRACTPresent experiment was carried out in a seven year old private plum orchard near SKUAST-Kashmir,
Shalimar Campus, Srinagar during 2012 and 2013, to examine the response to nitrogenous fertilizer and boron on nutritional status of soil, leaf and fruit of plum cv. Santa Rosa. Urea @ 500 g (N1), CaNO3 @ 1450 g (N2), N1 + 50 g boron (N3) and N2 + 50 g boron (N4) were applied at T1 = Full dose in spring, T2 = Full dose after harvest and T3 = 3/4 dose in spring and 1/4 dose after harvest. Observations were recorded on nutritional status of soil, leaf and fruit. N1T1 treatment combination scored maximum values for nitrogen (359.79 %), potassium (326.27 %), iron (53.33 ppm), copper (1.79 ppm), zinc (1.64 ppm) and manganese (41.50 ppm) while N2T2 and N2T1 treatment recorded maximum values for phosphorous (21.28 %) and calcium (37.37 %), respectively. Maximum nitrogen (2.57 %), magnesium (0.50 %), Iron (260.39 ppm) and copper (8.95 ppm) content was recorded in leaves of N1T1 treatment however, N2T2 treatment recorded maximum phosphorus (0.27 %). Potassium (3.26 %), zinc (33.61 ppm) and manganese (73.18 ppm) scored higher values in N2T1 treatment combination. Macro nutrient content in fruits viz. nitrogen (1.38 %), phosphorous (1.38 %) and potassium (2.37 %) was maximum in N1T1, while maximum calcium (0.92 %) in N2T1 and magnesium (0.36 %) in N3T1. Similarly, maximum micro-nutrient contents in fruit viz. zinc (18.82 ppm), manganese (47.16 ppm), copper (9.32 ppm) and iron (9.20 ppm) were recorded under the treatment combinations of N2T1. Both sources of nitrogen and boron can be considered as best fertilizer in plum orchards for improving the mineral nutrient status of leaf, fruit and soil. Key words: Prunus salicina, micronutrient, fertilizers.
*Corresponding author's email: [email protected]
DOI : 10.5958/0974-0112.2018.00037.3
Indian J. Hort. 75(2), June 2018: 202-208

203
Nutritional Status of Japanese Plum Under Rainfed Conditions of Kashmir
and boron fertilizers, their dose and timing on the soil, leaf and fruits of Santa Rosa plum under rainfed conditions of Kashmir valley.
MATERIALS AND METHODSExperimental site and soil health
The experiment was carried out at farmer’s field for two successive seasons 2012 and 2013 near SKUAST-Kashmir, Shalimar, Srinagar (J & K). The experimental orchard was situated at an altitude of 1685 m amsl which lying between 34o75’ N latitude and 74o50’ E longitude. Most of the precipitation received from October to April and rest is erratically distributed. The total rainfall and evapotranspiration during the experimentation period was 251.4 mm & 449.4 mm and 4.01 mm & 7.23 mm during 2012 and 2013, respectively. Winters are severe extending from December to March and the temperature often goes below freezing point (- 4.57oC) during this period. The analysis of soil indicated that the soil of the experimental site was clay-loam having pH (6.52), organic carbon (1.32 %), electrical conductivity (0.20 dSm-1), available N, P, K Ca, Mg, B, Fe, Zn, Cu, Mn was 110 ppm, 10.40 ppm, 120.50 ppm, 23.5 ppm, 17.0 ppm, 1.97 ppm, 42 ppm, 1.15 ppm, 1.65 ppm, 35.65 ppm, respectively. Material involved
The study was carried out on seven years old plum trees cv. Santa Rosa under rainfed conditions grown on private plum orchard. Thirty six healthy trees of Santa Rosa plum were selected on the basis of uniform size, age and vigour. The selected plants were labeled and grouped into three replications and twelve treatments combinations. Trees were kept under a rigid schedule of uniform cultural operation including irrigation, fertilization, insect-pests and disease control during the entire period of investigation. The following treatment combinations were madeSource of fertilizers
Time of fertilizer applicationT1 T2 T3
N1 N1T1 N1T2 N1T3
N2 N2T1 N2T2 N2T3
N3 N3T1 N3T2 N3T3
N4 N4T1 N4T2 N4T3
The fertilizers were applied from various sources of fertilizers viz., N1 = Urea (500 g), N2 = Calcium nitrate (1450 g), N3 = Urea (500 g) + 50 g Boron, N4 = Calcium nitrate (1450 g) + 50 g Boron and at different times viz. T1 = Full dose in spring, T2 = Full dose after harvest, T3 = ¾ dose in spring and ¼ dose after harvest.
Observations recordedObservations were recorded on nutritional status
of soil, leaf and fruit. Soil nutrient status
Composite soil samples from 0-15 cm and 15-30 cm depth were collected during the month of June, mixed and dried in shade, grounded, sieved through 2 mm plastic sieve and stored in cloth bags (Ali and Narayan, 1). Nitrogen (kg/ha) was estimated by Alkaline Potassium Permanganate Method. Phosphorus (kg/ha) was determined by Stannous Chloride reduced Ammonium Molybdate Method using Olsen’s Extractant and determined on UV-Spectrophotometer Model GS5701V at 660 nm wave length (Estefan et al., 4). Potassium (kg/ha), exchangeable calcium (ppm) and magnesium (ppm) were extracted with neutral normal ammonium acetate procedure and potassium was estimated on Flame Photometer (Estefan et al., 4) while calcium, magnesium, iron, zinc, copper and manganese were determined on Atomic Absorption Spectrophotometer and expressed in ppm (Ali and Narayan, 1).Leaf and fruit nutrient status
For mineral nutrition analysis, both leaf (collected on 15 July) and mature fruits were first washed with tap water followed by labolene wash and finally with distilled water and dried on newspapers for overnight and then transferred to oven for drying at (60oC). Then the samples were crushed in stainless steel blender and stored in polythene bags for analysis. Nitrogen was estimated by Micro-Kjeldhal method (Estefan et al., 4) and was calculated in per cent.
N (%) =
Titration recording of sample × Titration recording of blank × Normality of HCl × 14
× 100Sample weight × 1000
Phosphorous was determined by Vanado-Molybdo phosphoric yellow colour method and the colour intensity was measured at 440 nm in double beam ultra visible spectrophotometer. Potassium was estimated by flame photometer method using flame photometer 130 (systronics). Ca, Mg and other micronutrients were analyzed with the help of atomic absorption spectrophotometer (Estefan et al., 4). Statistical analysis
The data generated from these investigations were appropriately computed, tabulated and pooled data of two years were analyzed by applying Randomized Block Design Factorial (RBD). The level of significance was tested for different variable at 5 per cent (Gomez and Gomez, 7). Data were analysed using analysis of variance OPSTAT, HAU, Hisar, Haryana (India).

204
Indian Journal of Horticulture, June 2018
RESULTS AND DISCUSSIONData presented in Table 1-2 reveals that soil
nutrient contents were markedly influenced by various treatments. The highest (359.79 %) and lowest (340.00 %) values for soil nitrogen content was recorded under the treatment combinations of N1T1 (full dose of urea in spring) and N4T3 (¾ dose of Calcium nitrate + 50 g borax in spring and ¼ dose after harvest), respectively (Table 1). Urea + lime significantly increased the available nitrogen content in the soil, while calcium ammonium nitrate resulted in the lower concentration of available nitrogen in the soil, which may probably be due to the NH4
+ fixation capacities in the soil. Calcium ammonium nitrate also increases the exchangeable calcium content in the soil which may be responsible for low levels of nitrogen retention in the soil (Pooja, 10).
Full dose of calcium nitrate when applied after harvest (N2T2) registered maximum (21.28 %) and N3T3 (¾ dose of Urea + 50 g borax in spring and ¼ dose after harvest) registered minimum (18.07 %) values for soil phosphorous content (Table 1). Maximum (326.27 %) soil potassium content was obtained when full dose of Urea was applied in spring (N1T1), whereas minimum (306.23 %) soil potassium content was registered in N4T3 (¾ dose of Calcium nitrate + 50 g borax in spring and ¼ dose after harvest) treatment combination. Prasad et al., (11) reported that calcium nitrate significantly increased soil potassium content in pear, respectively. Soil calcium content was recorded maximum (37.37 %) in N2T1 treatment combination and minimum (18.54 %) was obtained in N3T2. Soil calcium content was significantly influenced by various sources of nitrogenous fertilizer and recorded maximum calcium
Table 1. Effect of nitrogenous fertilization and boron on soil nutrient content (N, P, K and Ca) of Santa Rosa.
Source of fertilizer
Time of fertilizer applicationNitrogen (%) Phosphorous (%) Potassium (%) Calcium (%)
T1 T2 T3 T1 T2 T3 T1 T2 T3 T1 T2 T3
N1 359.79 352.65 344.16 19.32 18.95 18.61 326.27 316.57 316.41 23.54 20.88 21.24N2 353.61 347.98 342.97 21.28 21.53 21.17 312.89 310.39 308.22 37.37 36.03 34.88N3 356.58 350.68 343.00 19.07 18.49 18.07 323.40 317.24 312.89 20.71 18.54 20.38N4 349.49 343.00 340.00 19.33 18.47 18.78 310.74 307.57 306.23 30.55 28.54 27.38CD (0.05)
N 0.66 0.32 0.98 0.62T 1.63 0.78 2.41 0.15N × T 2.31 0.11 3.40 0.21
N1 = Urea, N2 = Calcium nitrate, N3 = Urea + 50 g Boron, N4 = Calcium nitrate + 50 g BoronT1 = Full dose in spring, T2 = Full dose after harvest, T3 = 3/4 dose in spring and 1/4 dose after harvest
Table 2. Effect of nitrogenous fertilization and boron on soil nutrient content (Zn, Fe, Cu and Mn) of plum Santa Rosa.
Source of fertilizer
Time of fertilizer applicationIron (ppm) Copper (ppm) Zinc (ppm) Manganese (ppm)
T1 T2 T3 T1 T2 T3 T1 T2 T3 T1 T2 T3
N1 53.33 50.93 49.88 1.79 1.78 1.78 1.64 1.60 1.59 41.50 38.58 37.77N2 52.61 49.10 48.10 1.69 1.68 1.67 1.58 1.56 1.53 40.27 39.13 37.00N3 51.81 49.24 48.83 1.78 1.64 1.65 1.63 1.57 1.54 40.41 38.06 36.80N4 51.48 48.29 47.82 1.68 1.67 1.67 1.52 1.55 1.53 38.57 37.00 36.10CD(0.05)
N 0.70 0.98 0.10 0.54T 1.71 0.84 0.26 1.33N × T 2.42 46.06 0.36 1.88
N1 = Urea, N2 = Calcium nitrate, N3 = Urea + 50 g Boron, N4 = Calcium nitrate + 50 g BoronT1 = Full dose in spring, T2 = Full dose after harvest, T3 = 3/4 dose in spring and 1/4 dose after harvest

205
Nutritional Status of Japanese Plum Under Rainfed Conditions of Kashmir
content in soil under the treatment of calcium nitrate (Prasad et al., 11).
Maximum iron (53.33 ppm) and copper (1.79 ppm) content in soil was registered in treatment combinations of N1T1 (full dose of Urea in spring) (Table 2). Minimum value (47.82 ppm) for soil iron content was recorded in N4T3 treatment combination whereas minimum (1.64 ppm) soil copper content was recorded in N3T2. Increasing level of nitrogen application, increased available N, P, Fe, Zn, Cu and exchangeable Mg and Ca content in Santa Rosa plum orchards (Raese and Drake 12). Treatment combination of N1T1 registered maximum values for zinc (1.64 ppm) and manganese (41.50 ppm) content in soil, however, minimum values for zinc (1.52 ppm) and manganese (36.10 ppm) content in soil were recorded in N4T3 treatment. Increasing level of nitrogen application also increased available
micronutrients especially Zn and Mn contents in plum orchard (Singh-Sidhu and Kaundal, 13).
Pooled data of two years presented in Table 3-4 reveals that status of macro nutrient in leaf showed markedly influence under various treatments. The maximum leaf nitrogen content (2.57 %) was recorded in N1T1 (urea 500 g full dose in spring) however, treatment N4T3 registered minimum values for leaf nitrogen content (2.30 %) (Table 3). Since nitrogen is a dominating nutritional factor in the growth and development of the plants as it affects vegetative growth, flowering, fruit set, yield and particularly leaf nutrient status (Chatzitheodorou et al. 3) so the higher level of nitrogen in leaves as a result of urea sprays may be attributed to the fact that on hydrolysis urea release NH4
+ for nitrogen uptake by the plants.Maximum values for leaf phosphorus (0.27 %)
were recorded in N2T2 (full dose of calcium nitrate
Table 3. Effect of nitrogenous fertilization and boron on leaf nutrient content (N, P, K nd Mg) of plum Santa Rosa.
Source of fertilizer
Time of fertilizer applicationNitrogen (%) Phosphorous (%) Potassium (%) Magnesium (%)
T1 T2 T3 T1 T2 T3 T1 T2 T3 T1 T2 T3
N1 2.57 2.53 2.54 0.25 0.25 0.25 3.11 3.10 3.10 0.50 0.48 0.48N2 2.42 2.43 2.39 0.25 0.27 0.26 3.26 3.23 3.24 0.39 0.37 0.35N3 2.56 2.50 2.50 0.22 0.19 0.21 3.07 3.08 3.06 0.43 0.37 0.34N4 2.35 2.37 2.30 0.21 0.22 0.21 3.13 3.11 3.13 0.37 0.33 0.31CD (0.05)
N NS 0.79 0.10 0.21T NS 0.19 0.25 0.18N × T 6.91 0.27 0.35 NS
N1 = Urea, N2 = Calcium nitrate, N3 = Urea + 50 g Boron, N4 = Calcium nitrate + 50 g BoronT1 = Full dose in spring, T2 = Full dose after harvest, T3 = 3/4 dose in spring and 1/4 dose after harvest
Table 4. Effect of nitrogenous fertilization and boron on leaf nutrient content (Zn, Fe, Cu and Mn) of plum Santa Rosa.
Source of fertilizer
Time of fertilizer applicationZinc (ppm) Iron (ppm) Copper (ppm) Manganese (ppm)
T1 T2 T3 T1 T2 T3 T1 T2 T3 T1 T2 T3
N1 30.03 29.83 29.44 260.39 232.07 250.39 8.95 8.01 7.89 53.44 51.13 51.77N2 33.61 33.54 32.52 252.06 250.12 248.22 8.10 7.45 7.74 73.18 71.26 70.01N3 28.37 29.49 26.26 241.52 242.70 242.34 7.17 7.81 7.10 50.70 49.99 50.17N4 31.01 30.85 28.45 236.65 237.25 233.20 7.44 7.09 7.44 64.68 61.85 60.89CD (0.05)
N 0.84 NS 0.55 1.13T 2.06 19.96 0.47 2.77N × T 2.91 28.23 1.82 3.92
N1 = Urea, N2 = Calcium nitrate, N3 = Urea + 50 g Boron, N4 = Calcium nitrate + 50 g BoronT1 = Full dose in spring, T2 = Full dose after harvest, T3 = 3/4 dose in spring and 1/4 dose after harvest

206
Indian Journal of Horticulture, June 2018
after harvest), however, minimum (0.19 %) values were obtained under the treatment combination of N3T2 (full dose of urea + 50 g boron after harvest). Maximum (3.26 %) leaf potassium content was recorded under the fertilizer application of calcium nitrate 1450 g full dose in spring (N2T1) and minimum (3.06 %) was registered when Urea + 50 g borax was applied ¾ dose in spring and ¼ dose after harvest (N3T3) (Table 3). The lowest level of P and K in leaves could be attributed to the increased doses of nitrogen through urea and calcium nitrate. Phosphorus and potassium content of leaves decreased with increased dose of nitrogen application (Pooja, 10). However, factors responsible for a decrease in leaf phosphorus may be due to growth dilution of phosphorus (Goff, 6).
Two year pooled data showed that N1T1 (full dose of urea in spring) treatment combination registered maximum (0.50 %) magnesium content in leaves whereas minimum value (0.31 %) was obtained in N4T3 treatment combination (Table 3). This may be attributed to the fact that nitrogen is considered balance wheel for other nutrients and vegetative growth enhances with Ca(NO3)2, therefore, it increases uptake of other nutrients through transpiration pull. Leaf magnesium content increased with the Urea + lime @ 600 g N/tree in respect of plum cv. Santa Rosa (Pooja, 10) and Ganai (5) also found that leaf Ca, N, Mg and B were enhanced under CaCl2 treatments in apple.
Zinc, iron, copper and manganese content were markedly influenced by various treatments during the studies (Table 4). The maximum (33.61 ppm) and minimum (26.26 ppm) leaf zinc was recorded under the treatment combination of N2T1 (full dose of calcium nitrate in spring) and N3T3 (¾ dose of Urea + 50 g borax in spring and ¼ dose after harvest).
Maximum iron (260.39 ppm) and copper (8.95 ppm) content in leaves was recorded in the treatment combination of N1T1 where full dose of urea was applied in spring. Minimum values for iron content in leaves (233.20 ppm) was obtained in N4T3 (¾ dose of Calcium nitrate + 50 g borax in spring and ¼ dose after harvest) whereas, leaf copper was observed minimum (7.09 ppm) in N4T2 (full dose of Calcium nitrate + 50 g borax) treatment combination. Increased nitrogenous fertilizer application increased the uptake of copper and iron (Pooja, 10). Leaf manganese content with a maximum values (73.18 ppm) was registered in the treatment combination of N2T1 i.e. full dose of Calcium nitrate in spring while minimum (49.99 ppm) leaf manganese content was recorded when full dose of Urea + 50 g borax was applied after harvest (N3T2) (Table 4). Pooja (10) in Santa Rosa plum reported similar results.
Pooled data of two years showed significant results as influenced by various treatments with respect to nutrient contents of fruits (Table 5-6). Maximum nitrogen (1.38 %) was observed in treatment combination of N1T1 (full dose of urea in spring), whereas, minimum nitrogen (1.08 %) content of fruits was registered in N4T3 (¾ dose of Calcium nitrate + 50 g borax in spring and ¼ dose after harvest) (Table 5). The concentration of fruit nitrogen tends to be higher after application of nitrogenous fertilizers. Increasing nitrogen rates, increased the nitrogen composition in fruit peel and cortex from trees (Irshaad, 8). Treatment combination of N1T1 (full dose of urea in spring) registered maximum phosphorous (0.31 %) content in fruits, however, minimum phosphorous (0.16 %) was recorded in N1T3 treatment combination (Table 2). Ganai (5) also recorded a significant increase in phosphorous content under CaCl2 treatment however, phosphorous
Table 5. Effect of nitrogenous fertilization & boron on fruit nutrient content (N, P, K, Mg and Ca) of plum Santa Rosa.
Source of fertilizer
Time of fertilizer applicationNitrogen (%) Phosphorous (%) Potassium (%) Magnesium (%) Calcium (%)
T1 T2 T3 T1 T2 T3 T1 T2 T3 T1 T2 T3 T1 T2 T3
N1 1.38 1.35 1.31 0.31 0.19 0.16 2.37 2.33 2.31 0.26 0.24 0.20 0.82 0.82 0.78N2 1.19 1.17 1.15 0.29 0.29 0.28 1.96 1.95 1.86 0.31 0.28 0.25 0.92 0.86 0.85N3 1.25 1.29 1.27 0.30 0.28 0.22 2.26 2.16 2.08 0.36 0.33 0.31 0.78 0.78 0.76N4 1.14 1.09 1.08 0.28 0.25 0.25 1.76 1.66 1.53 0.29 0.24 0.22 0.85 0.82 0.80CD (0.05)
N 0.77 0.13 0.10 0.67 0.12T 0.18 0.34 0.25 0.16 0.31N × T 0.26 0.48 0.36 0.23 0.44
N1 = Urea, N2 = Calcium nitrate, N3 = Urea + 50 g Boron, N4 = Calcium nitrate + 50 g BoronT1 = Full dose in spring, T2 = Full dose after harvest, T3 = 3/4 dose in spring and 1/4 dose after harvest

207
Nutritional Status of Japanese Plum Under Rainfed Conditions of Kashmir
content remained unaltered under different calcium treatments.
Fruit potassium content with maximum (2.37 %) and minimum (1.53 %) value was recorded in treatment combinations of N1T1 (full dose of Urea in spring) and N4T3 (¾ dose of Calcium nitrate + 50 g borax in spring and ¼ dose after harvest) (Table 5). Potassium was the most accumulated nutrient in fruits, followed by phosphorous and magnesium, regardless of the cultivar. Most potassium accumulation in apple and plum fruits (Nachtigall and Dechen, 9) may be due to the fact the potassium content is almost balanced in fruit due to the reason that K is not retrieved efficiently from the leaves to the fruits. Maximum (0.92 %) and minimum (0.76 %) fruit calcium was recorded with full dose of calcium nitrate in spring (N2T1) and ¾ dose of Urea + 50 g borax in spring and ¼ dose after harvest (N3T3). Foliar application of calcium both in summer and in autumn resulted in increased calcium concentration in fruit (Wojcik et al. 15). Treatment combination of N3T1 (full dose of Urea + 50 g borax) and N1T3 (¾ dose of Urea in spring and ¼ dose after harvest) recorded maximum (0.36 %) and minimum (0.20 %) values for magnesium content in fruits, respectively. Increasing nitrogen rates increased magnesium composition in fruit peel and cortex from trees on Granny Smith apple, however, leaf and fruit nitrogen and fruit magnesium concentrations were lowest for trees with the low nitrogen fertilizer rate and highest nitrogen and magnesium concentrations for trees with the lowest fruit quality from the higher nitrogen rates (Raese and Drake, 12).
Treatment combinations of N2T1 (full dose of calcium nitrate in spring) and N1T3 (¾ dose of Urea in spring and ¼ dose after harvest) observed
maximum (18.82 ppm) and minimum (14.95 ppm) values for zinc contents in fruits (Table 6). Zinc levels in fruit peel and cortex were highest in fruit from trees receiving the low rates of nitrogen (Raese and Drake, 12). Since nitrogen is considered balance wheel for other nutrients and vegetative growth enhances with calcium nitrate therefore it increases uptake of other nutrients through transpiration pull however, a non-significant effect on leaf and fruit zinc content were also reported (Ganai, 5 and Irshaad, 8).
Maximum iron (47.16 ppm) and copper (9.32 ppm) content was observed in N2T1 (full dose in calcium nitrate in spring) treatment. Minimum fruit iron (24.34 ppm) content was registered in N3T2 (full dose urea + 50 g borax) treatment, however, minimum fruit copper (6.08 ppm) content was obtained in N3T3 (¾ dose of Urea + 50 g borax in spring and ¼ dose after harvest). Fruit manganese content was maximum (9.20 ppm) and minimum (6.06 ppm) registered by the treatment combinations of N2T1 (full dose in calcium nitrate in spring) and N3T3 (¾ dose of Urea + 50 g borax in spring and ¼ dose after harvest) (Table 6). Since the mineral content of leaves had a close association with mineral content of fruits as such higher concentration of Cu, Fe and Mn correspond with those of mineral content in fruits which acts as a sink for various elements. However, Ganai (5) observed a non-significant effect of calcium treatments on leaf and fruit Cu, Fe and Mn content.
Current research indicates that mineral nutrient content in leaf, fruit and soil were increased by the application of various nitrogenous and boron fertilizers which could move towards sink for enhancing the growth, yield and quality of the fruits.
Table 6. Effect of nitrogenous fertilization and boron on fruit nutrient content (Zn, Fe, Cu and Mn) of plum Santa Rosa.
Source of fertilizer
Time of fertilizer applicationZinc (ppm) Iron (ppm) Copper (ppm) Manganese (ppm)
T1 T2 T3 T1 T2 T3 T1 T2 T3 T1 T2 T3
N1 18.31 16.64 14.95 31.25 31.06 30.87 7.29 7.21 7.14 7.15 7.13 7.10N2 18.82 18.15 17.82 47.16 46.18 46.50 9.32 9.25 9.17 9.20 9.14 9.15N3 17.31 15.64 15.15 26.54 24.34 26.15 6.15 6.14 6.08 6.12 6.09 6.06N4 18.13 17.96 16.98 36.71 36.17 34.12 8.28 8.27 8.20 8.14 8.17 8.13CD (0.05)
N 0.36 NS 0.83 0.84T 0.88 1.96 0.20 0.20N × T 1.25 2.77 0.28 0.29
N1 = Urea, N2 = Calcium nitrate, N3 = Urea + 50 g Boron, N4 = Calcium nitrate + 50 g BoronT1 = Full dose in spring, T2 = Full dose after harvest, T3 = 3/4 dose in spring and 1/4 dose after harvest

208
Indian Journal of Horticulture, June 2018
REFERENCES1. Ali, T. and Narayan, S. 2009. Manual of Soil, Plant
and Water Analysis. Daya Publishing House, New Delhi, 196 p.
2. Anonymous, 2017. Area and Production of fruit crops 2016-17. Directorate of Horticulture, Kashmir (J & K Government), pp. 1-2.
3. Chatzitheodorou, I.T., Sotiropoulos, T.E. and Mouhtaridou, G.I. 2004. Effect of nitrogen, phosphorous, potassium fertilization and manure on fruit yield and fruit quality of the peach cultivar ‘Spring Time’ and ‘Red Heaven’. Agro. Res. 2: 135-43.
4. Estefan, G., Sommer, R. and Ryan, J. 2013. Methods of Soil, Plant, and Water Analysis: A manual for the West Asia and North Africa region. ICARDA, Beirut, Lebanon 244 p.
5. Ganai, N.A. 2006. Effect of preharvest calcium and boron application on the quality and yield of apple (Malus × domestica Borkh.) cv. ‘Red Delicious’ under the temperate conditions of Kashmir. Ph.D. Thesis submitted to SKUAST-Kashmir, Shalimar.
6. Goff, J.P. 2009. Phosphorous deficiency. In: Food Animal Practice. Anderson, D.E. and Rings, D.M. (Eds.). 5th edition. Elservier Inc. pp. 135-37.
7. Gomez, K.A. and Gomez, A.A. 1984. Statistical Procedure for Agricultural Research. John Willey and sons, New York.
8. Irshaad, G.H. 2012. Studies on mineral nutrients dynamics and harvest time in Sweet Cherry
(Prunus cerasus). Ph.D. Thesis, submitted to SKUAST-Kashmir, Shalimar
9. Nachtigall, G.R. and Dechen, A.R. 2006. Seasonality of nutrients in leaves and fruits of apple trees. Sci. Agric. 63: 493-501.
10. Pooja, S. 2011. Comparative studies on effects of nitrogenous fertilizers on growth, yield and quality in plum cv. Santa Rosa. Phd thesis submitted to Dr YSP UHF, Nauni-Solan (HP).
11. Prasad, B., Dimri, D.C. and Bora, L. 2015. Effect of pre-harvest foliar spray of calcium and potassium on fruit quality of Pear cv. Pathernakh. Scientific Res. Essays, 10: 376-80.
12. Raese, J. and Drake, S.R. 2008. Nitrogen fertilization and elemental composition affects fruit quality of ‘Fuji’ apples. J. Plant Nutri. 20: 1797-809.
13. Singh-Sidhu, L. and Kaundal, G.S. 2005. Effect of planting density on fruit yield, foliar nutrient content and root distribution of plum (Prunus salicina Lindl.) cv. Satluj Purple. Acta Hort. 696: 299-302.
14. Wang, Q., Lu, L., Wu, X., Li, Y. and Lin, J. 2003. Boron influences pollen germination and pollen tube growth in Picea meyeri. Tree Physio. 23: 345-51.
15. Wojcik, P., Gubbuk, H., Akgl, H., Gunes, E., Ucgun, K., Koal, H., and Kkyumuk, C. 2010. Effect of autumn calcium spray at a high rate on ‘Granny Smith’ apple quality and storability. J. Plant Nutri. 33: 46-56.
Received : November, 2017; Revised : February, 2018; Accepted : May, 2018

209
Indian J. Hort. 75(2), June 2018: 209-217
INTRODUCTIONIn India, major mandarin-growing states are
Punjab, Madhya Pradesh, Maharashtra, Rajasthan, Assam, Karnataka and Meghalaya and specific cultivars of mandarins are cultivated in different regions. Nagpur mandarin (Citrus reticulata Blanco), one of the premier commercial citrus cultivars, is widely grown (0.31m ha) along the foot hills of Satpura hill range under hot sub-humid tropical climate in Central India with a production of 2.91 m MT and productivity of 10 MT ha-1.
Soil-water-deficit stress mediated flowering response in Nagpur mandarin is by and large the key factor in the success of orange farming (Jagdish Prasad, 3) and soil properties like presence of free lime, excessive salt, defective drainage, presence of hard pan in the sub-surface, soil texture, mineral composition of soil, cation exchange capacity and soil fertility (Srivastava et al., 14) and water holding capacity, drainage rate, rooting depth, and fertility have been identified as major causes of spatial yield variability (Mann et al., 7; Likhar and Jagdish Prasad, 5 and 6). Site-specific soil management can improve profitability and environmental protection of citrus orchards having large spatial variation in soil and tree characteristics. Knowledge of spatial variation in soil properties is important in precision farming and environmental modeling (Santra et al., 11). Srivastava et al. (15) highlighted the importance of spatial variability in soil fertility in identifying nutrient
constraints vis-à-vis productivity zones to rationalize nutrient use and optimize productivity.
The application of parametric statistics is inadequate for analysis of spatially dependant variables because they assume that measured observations are independent in -spite of their distribution in space. Geo-statistics provide a tool for improving the sampling design by utilizing the spatial dependence of soil properties within a sampling region and useful to understand the spatial interrelationship of soil data which reduces error, biasness and increase the accuracy of data for interpolation (Oliver, 10). Therefore, the present study was undertaken to map the spatial variability in soil properties for site-specific nutrient management of Nagpur mandarin in Katol tehsil of Nagpur district, Maharashtra using geospatial techniques.
MATERIALS AND METHODSA contiguous intensively cultivated Nagpur
mandarin area was identified using Cartosat-1-sharpened IRS-P6 (Indian Remote Sensing) satellite data followed by ground truth. The area (280 ha) is located in Katol tehsil (78o 33’ to 78o 34’E; 21o 14’ to 21o 15’N) of Nagpur district, Maharashtra (Fig. 1) at an elevation ranging from 480 to 500 m above mean sea level (MSL). The climate of the area is sub-tropical dry sub-humid with mean annual temperature of 33.5ºC and mean annual precipitation of 1050 mm. The area qualifies for ‘ustic’ and ‘hyperthermic’ soil moisture and temperature regimes, respectively. Soybean (Glycine max), wheat (Triticum aestivum)
Mapping of spatial variability in soil properties for site-specific nutrient management of Nagpur Mandarin in Central India
S.S. Sawant, M.S.S. Nagaraju*, Rajeev Srivastava, Jagdish Prasad, R.A. Nasre and D.S. Mohekar
ICAR-National Bureau of Soil Survey and Land Use Planning, Amravati Road, Nagpur 440 033, Maharashtra
ABSTRACTThe paper discusses the mapping of spatial variability in soil properties of Nagpur Mandrin growing
areas in central India for site-specific nutrient management. Contiguous area of Nagpur mandarin orchards was identified using Cartosat-1-sharpened IRS-P6 LISS-IV data followed by ground truth. Soil samples were collected from 0-20 and 20-40 cm in a grid design (200 × 200 m) using Global Positioning System and analyzed for particle-size, bulk density, moisture retention at -33 kPa, and -1500 kPa, pH, organic carbon, calcium carbonate, available N, P and K and micronutrient cations. The GIS aided kriged thematic maps showed spatial variation in soil properties and soil fertility parameters. The cadastral maps overlaid on kriged thematic soil maps precisely indicated the areas having soil related constraints for site-specific nutrient management to improve the productivity of Nagpur mandarin in central India.Key words: Citrus, soil constraints, kriging, geostatistics, GIS, GPS.
*Corresponding author’s E-mail: [email protected]
DOI : 10.5958/0974-0112.2018.00038.5

210
Indian Journal of Horticulture, June 2018
and gram (Cicer arietinum) are grown as an inter-crop in orchards upto five years of its planting.
Survey of India toposheets on 1:50000 scale, IRS-P6 LISS-IV data of 7th November, 2008 and 8th January, 2010 (5.8 m resolution) were geo-referenced using WGS 84 zone 44 N datum, Universal Transverse Mercator (UTM) projection and ground control points (GCPs). The ortho-rectified Cartosat-1 data was fused with IRS-P6 LISS-IV data. The cadastral map of the village was scanned using HP Designjet 4500 at 300 dpi. The rasterized cadastral map was co-registered using ortho- rectified Cartosat-1-sharpened IRS-P6 LISS-IV data as a reference. After geo-referencing, the rasterized cadastral map was screen digitized, corrected for digitization errors and validated using ArcGIS to prepare polyline map of the village.
In the present study, a grid size of 200 × 200 m (Fig. 2) was marked on geo-referenced cadastral map (1:5000 scale) of the village. A total of 138 soil samples from 69 grid locations were collected from a depth of 0-20 cm and 20-40 cm wherein maximum concentration of feeder roots occur. The collected soil samples were properly processed and analyzed for particle- size, bulk density, moisture retention at -33 kPa, -1500 kPa, pH, organic carbon, calcium carbonate and available N, P, K, Fe, Mn, Cu, Zn following the standard procedures (Black et al., 1; Jackson, 2). The flow chart of the methodology is presented in Fig. 3.
The datasets containing measured soil variables were analyzed using classical statistical method to obtain minimum, maximum, mean, standard deviation (SD), coefficient of variation (CV), skewness, kurtosis using SPSS version 11.5 software. The data was normalized before interpolation to generate surface maps of soil properties. In the study, logarithmic transformations available in Geostatistical Analyst of ArcGIS software (version 10.1) were applied to normalize the data wherever the data sets of
Fig. 1. Location of study area with Cartosat-1-sharpened IRS-P6 LISS-IV data showing the contiguous areas of citrus orchards.
Fig. 2. Experimental design for soil sampling.
Fig. 3. Flow chart of the methodology.

211
Mapping of Spatial Variability in Soil Properties for Site-Specific Nutrient Management
soil properties were non-normal. Surface maps of basic soil properties were prepared using semi-variogram parameters through ordinary kriging in geostatistical analyst of ArcGIS software and digital cadastral boundaries were superimposed during map composition.
RESULTS AND DISCUSSIONThe descriptive statistics of soil physical properties
at 0-20 and 20-40 cm depth are presented in table 1. The mean for sand, silt and clay content (0-20 cm) were 17.8, 32.5 and 49.7 per cent with a range of 4.8-59.9, 15.4 to 43.7 and 17.9 to 68.0 per cent, respectively. Sand had the largest variation (CV = 0.70) followed by clay (CV = 0.24) and silt (CV = 0.15). The average bulk density was 1.76 Mg m-3 with a range of 1.33 to 2.07 Mg m-3 and it was found to be least variable (CV = 0.08). At 20-40 cm depth, the mean value for sand, silt and clay content were 16.4, 31.6 and 52.0 per cent with a range of 3.8 to 57.0, 14.9 to 44.5 and 15.3 to 71.5 per cent, respectively. Sand had the largest variation (CV = 0.74) followed by clay (CV = 0.23) and silt (CV = 0.16). Average bulk density was 1.80 Mg m-3 with a range of 1.59 to 1.98 Mg m-3 and it was found to be the least variable (CV = 0.04). Soil moisture retention at -33 kPa and -1500 kPa varied from 19.5 to 49.5 and 9.3 to 33.3 per cent with mean value of 35.8 and 25.1 per cent, respectively. The moisture retention at -33 kPa and -1500 kPa were moderately variable with a CV of 0.15 and 0.19, respectively, whereas, moisture retention
at -33 kPa and -1500 kPa at 20-40 cm depth, varied from 20.0 to 51.3 and 13.3 to 39.5 per cent with mean value of 35.6 and 25.8 per cent, respectively. The moisture retention at -33 kPa and -1500 kPa were found be moderately variable with CV of 0.15 and 0.17, respectively.
The descriptive statistics of soil chemical and fertility parameters are presented in table 2. The soil pH ranged from 7.3 to 8.9 at both the depths. Organic carbon had variation of 0.44 to 1.01 per cent (mean of 0.87%). Calcium carbonate ranged from 0.23 to 19.2 per cent (mean 6.09 %). The calcium carbonate was found to be highly variable (CV = 0.66) followed by organic carbon (CV = 0.17) while, pH was found least variable (CV = 0.04). Organic carbon varied from 0.37 to 0.99 per cent (mean 0.73 %) at the depth of 20-40 cm. Calcium carbonate ranged from 0.70 to 22.1 per cent with a mean value of 6.58 per cent and was found to be highly variable (CV = 0.60) followed by organic carbon (CV = 0.21). The available N, P and K varied from 165.1 to 351.8, 0.2 to 70.3 and 44.8 to 492.8 kg ha-1 with mean value of 219.6 kg ha-1, 12.4 kg ha-1 and 219 kg ha-1, respectively. The available Fe, Mn, Cu, and Zn ranged from 7.7 to 63.5, 3.5 to 60.0, 1.0 to 7.4 and 0.14 to 1.5 Mg kg-1 with mean values of 29.0, 27.3, 3.7 and 0.5 mg kg-1, respectively. The available P was found to be highly variable (CV = 0.98) followed by available K (CV = 0.53). Available N was found to be moderately variable (CV = 0.15). The micronutrient cations were highly variable with CV ranging from 0.31-0.55. Data
Table 1. Descriptive statistics of soil physical and hydraulic properties.
Soil Property Minimum Maximum Mean SD CV Skewness KurtosisSoil physical properties (0-20 cm depth)Sand (%) 4.8 59.9 17.8 12.45 0.70 1.56 2.10Silt (%) 15.4 43.7 32.5 4.74 0.15 -0.9 2.36Clay (%) 17.9 68.0 49.7 12.27 0.24 -1.13 0.37Bulk density (Mg m-3) 1.33 2.07 1.76 0.14 0.08 -0.65 0.90Soil physical properties (20-40 cm depth)Sand (%) 3.8 57.0 16.4 12.15 0.74 1.64 2.28Silt (%) 14.9 44.5 31.6 5.17 0.16 -0.43 1.82Clay (%) 15.3 71.5 52.0 11.83 0.23 -1.31 1.31Bulk density (Mg m-3) 1.59 1.98 1.80 0.08 0.04 -0.08 0.51Soil hydraulic properties (0-20 cm depth)Moisture retention (-33 kPa) (%) 19.5 49.5 35.8 5.35 0.15 -0.57 0.89Moisture retention (-1500 kPa) (%) 9.3 33.3 25.1 4.70 0.19 -1.02 1.31Soil hydraulic properties (20-40 cm depth)Moisture retention (-33 kPa) (%) 20.0 51.3 35.6 5.50 0.15 -0.65 1.80Moisture retention (-1500 kPa) (%) 13.3 39.5 25.8 4.52 0.17 -0.44 1.38

212
Indian Journal of Horticulture, June 2018
Table 2. Descriptive soil chemical properties and soil fertility parameters.
Soil Property Minimum Maximum Mean SD CV Skewness KurtosisChemical properties (0-20 cm depth)pH 7.3 8.9 8.3 0.35 0.04 -0.98 0.86Organic carbon (%) 0.44 1.01 0.87 0.15 0.17 -1.44 0.91CaCO3 (%) 0.23 19.2 6.09 4.04 0.66 1.01 0.75Chemical properties (20-40 cm depth)pH 7.3 8.9 8.4 0.31 0.04 -1.20 2.29Organic carbon (%) 0.37 0.99 0.73 0.16 0.21 -0.54 -0.50CaCO3 (%) 0.70 22.10 6.58 3.88 0.60 1.20 2.56Fertility parameters (0-20 cm depth)Available N (kg ha-1) 165.1 351.8 219.6 33.08 0.15 1.25 3.08Available P (kg ha-1) 0.2 70.3 12.4 12.15 0.98 2.42 8.13Available K (kg ha-1) 44.8 492.8 219 115.7 0.53 0.49 -0.50Available Fe (mg kg-1) 7.7 63.5 29.0 12.89 0.44 0.66 -0.15Available Mn (mg kg-1) 3.5 60.0 27.3 13.45 0.49 0.63 -0.29Available Cu (mg kg-1) 1.0 7.4 3.7 1.14 0.31 0.87 1.30Available Zn (mg kg-1) 0.14 1.50 0.5 0.29 0.55 1.40 1.97Fertility parameters (20-40 cm depth)Available N (kg ha-1) 140.7 271.2 202.8 30.57 0.15 0.45 -0.31Available P (kg ha-1) 0.2 25.1 6.5 5.82 0.89 0.46 1.87Available K (kg ha-1) 33.6 280.0 119.6 68.50 0.57 0.74 -0.50Available Fe (mg kg-1) 6.0 53.0 28.4 11.60 0.41 0.35 -0.71Available Mn (mg kg-1) 4.0 66.0 24.8 12.14 0.49 1.12 1.74Available Cu (mg kg-1) 1.2 6.8 3.4 1.07 0.32 1.07 1.63Available Zn (mg kg-1) 0.04 2.6 0.7 0.48 0.74 1.93 4.79
pertaining to available N, P and K showed variation of 140.7 to 271.2, 0.2 to 25.1 and 33.6 to 280.0 kg ha-1 (0-20 cm) with mean value of 202.8 kg ha-1, 6.5 kg ha-1 and 119.6 kg ha-1, respectively. The DTPA-extractable Fe, Mn, Cu, and Zn varied from 6.0 to 53.0, 4.0 to 66.0, 1.2 to 6.8 and 0.04 to 2.6 mg kg-1 with mean values of 28.4, 24.8, 3.4 and 0.7 Mg kg-1, respectively. Available P was found to be highly variable (CV = 0.89) followed by available K (CV = 0.57) but available N was least variable (CV = 0.15). The micronutrient cations were highly variable with CV ranging from 0.32-0.74.
Kriged spatial maps of sand, silt and clay are presented in Fig. 4. The spatial distribution of sand had a variation of 9-32 per cent at 0-20 cm depth and 7- 31 per cent at 20-40 cm depth; silt varied from 29-40 per cent at 0-20 cm depth and 29-41 per cent at 20-40 cm depth and clay showed variation of 20-64 per cent at 0-20 cm depth and 19-72 per cent at 20-40 cm depth. The higher sand content was observed in southern, eastern and western parts compared to northern part of the area. Concomitantly, higher clay
content was observed in central and northern parts of the area. Kriged spatial maps of bulk density, soil moisture retention at -33 kPa and soil moisture retention at -1500 are presented in Fig. 5. Spatial map of bulk density at 0-20 cm depth shows that the bulk density varied from 1.66-1.88 Mg m-3 at 0-20 cm and 1.75-1.86 Mg m-3 at 20-40 cm depth. The higher bulk density was observed in eastern part compared to other parts of area at 0-20 cm depth, whereas, higher bulk density was observed in eastern and western parts of area at 20-40 cm depth. Spatial map of soil moisture retention at -33 kPa revealed its variation soil moisture retention varied from 26.9-40.4 per cent at 0-20 cm depth and 24.4-39.4 at 20-40 cm depth. The higher soil moisture retention at -33 kPa was observed in northern and central parts (0-20 cm) and eastern and north-eastern parts of the area at 20-40 cm depth. The moisture held at -1500 kPa varied from 18.9-29.8 per cent (0-20 cm) and 20.2-28.2 at 20-40 cm depth. The higher soil moisture retention at -1500 kPa was observed in northern and central parts (0-20 cm) and central part of the area at 20-40

213
Mapping of Spatial Variability in Soil Properties for Site-Specific Nutrient Management
Fig. 4. Kriged maps of soil physical properties.
Fig. 5. Kriged maps of soil hydraulic properties.

214
Indian Journal of Horticulture, June 2018
cm depth. There was high spatial correlation between soil moisture retention at -33 kPa and -1500 kPa and clay content. Areas with higher soil moisture retention at -33 kPa and -1500 kPa corresponded with higher clay content. Srivastava et al. (16) and Jagdish-Prasad et al. (4) reported significant and positive correlation between clay and soil moisture retention at-33 kPa and -1500 kPa.
Kriged maps showed that soil pH varied from 7.94 to 8.76 (0-20 cm) and 8.19 to 8.72 at 20-40 cm depth (Fig. 6). The organic carbon content varied from 0.87-0.97 per cent at 0-20 cm and 0.58-0.83 at 20-40 cm whereas CaCO3 ranged from 2.6-11.1 at 0-20 cm and 3.0-11.0 per cent at 20-40 cm depth. Kriged maps of available N, P and K (Fig. 7) showed that available N varied from 189-241 kg ha-1 (0-20 cm) and 171-251 kg ha-1 at 20-40 cm depth; available P from 2-17 kg ha-1 (0-20 cm) and 3.5-12.7 kg ha-1
(20-40 cm) and available K from 70-370 kg ha-1 (0-20 cm) to 39.0-280.0 kg ha-1 (20-40 cm). Kriged maps of available Fe, Mn, Cu and Zn indicated that available Fe varied from 21-32 mg kg-1 (0-20 cm) to 15.5-37.6 mg kg-1 (20-40 cm); available Mn from 11-48 mg kg-1
(0-20 cm) and 9-32 mg kg-1 (20-40 cm); available Cu from 2.9-4.8 mg kg-1 (0-20 cm) to 2.5-3.7 mg kg-1
(20-40 cm) and available Zn from 0.21-0.73 mg kg-1
(0-20 cm) and 0-2.1mg kg-1 at 20-40 cm depth (Fig. 8). The clay content showed variation from 17.9 to
68.0 per cent (0-20 cm) and 15.3 to 71.5 per cent (20-40 cm). The clay content was below 70 per cent (0-20 cm) and 1.7 ha (0.6 %) of area at 20-40 cm had clay >70 per cent (Table 3) which may limit the orange productivity. Srivastava and Singh (13) reported significant negative correlation of clay with yield (r = -0.626) in Nagpur mandarin-growing soils of Nagpur district. Most of the deep black soils
Fig. 6. Kriged maps of soil chemical properties.
Table 3. Soil physical and chemical constraints limiting Nagpur mandarin productivity.
S. No. Soil Property 0-20 cm depth 20-40 cm depthArea (ha) Per cent Area (ha) Per cent
1 Clay > 70% Nil Nil 1.7 0.602 pH > 8.5 64.6 23.0 35.7 12.73 CaCO3 > 10% 2.9 1.0 2.3 0.8

215
Mapping of Spatial Variability in Soil Properties for Site-Specific Nutrient Management
Fig. 7. Kriged maps of available N, P and K.
Fig. 8. Kriged maps of available Fe, Mn, Cu and Zn.
pose problem of drainage due to high smectitic clay. Adequate surface and sub-surface drainage need to be provided for better aeration in the root zone. About 5.8 per cent of the samples in the area has
a soil depth <40 cm. Orange plants have relatively shallow root system and most of their roots remain in the top 60-100 cm and 80 per cent of feeder roots trail in top 15-20 cm of soil depth. Marathe et al.

216
Indian Journal of Horticulture, June 2018
(8) reported lower canopy volume and fruit yield of Nagpur mandarin in relation to shallow soil depth and clay content.
The data on soil pH (Table 3) indicated that 64.6 ha (23.0 %) at 0-20 cm depth and 35.7 ha (12.7 %) at 20-40 cm depth had pH >8.5 and hence, not suitable for orange cultivation (Naidu et al., 9). Srivastava and Kohli (12) reported that in an Inceptisols with a pH of 8.2 was found to be favourable for better quality of citrus fruits and a soil with a pH of 7.7 (0-15 cm) and a pH of 7.9 at a depth of 15-30 cm was found optimum (Srivastava and Singh, 13). The data on CaCO3 (Table 3) showed that 2.9 ha (1.0 per cent) at 0-20 cm and 2.3 ha (0.8 per cent) at 20-40 cm had CaCO3 content >10 per cent. According to the soil-site suitability criteria for citrus (Naidu et al., 9), non-calcareous soils are highly suitable, soils with CaCO3 up to 5 per cent are moderately suitable, 5-10 per cent are marginally suitable whereas, CaCO3 with >10 per cent are not suitable. However, Srivastava and Kohli, (12) reported that 10 per cent free CaCO3 was favourable for better quality of citrus fruits. Jagdish-Prasad et al., (4) reported that free CaCO3 and powdery lime and massive structure in the soils limited the water and nutrient absorption and consequently the productivity was very poor.
Kriged map of available N was reclassified into very low (<140 kg ha-1), low (140-280 kg ha-1) and medium (280-420 kg ha-1). The data (Table 4) indicated that available N was low in the entire area. Kriged map of available P was reclassified into very low (<7 kg ha-1), low (7-14 kg ha-1) and medium (14-
21 kg ha-1), moderate (21-28 kg ha-1), high (28-35 kg ha-1) and very high (>35 kg ha-1) categories. The data showed that available P was very low, low and medium covering 126.4 ha, 152.9 ha and 1.1 ha at 0-20 cm depth, respectively and very low and low categories covering 219.7 ha and 60.7 ha at 20-40 cm depth, respectively. Kriged map of available K was reclassified into low (120-180 kg ha-1), medium (180-240 kg ha-1), moderate (240-300 kg ha-1), high (300-360 kg ha-1) and very high (>360 kg ha-1) categories which pinpointed that available K was low, medium, moderate and high at 0-20 cm depth covering 57.2, 24.2, 15.5 and 3.2 per cent area, respectively and low and medium categories cover 252.7 ha and 27.7 ha at 20-40 cm, respectively. Kriged map of available Fe was reclassified into marginal (5-7.5 mg kg-1), adequate (7.5-10.0 mg kg-1) and high (>10 mg kg-1). The data (Table 4) showed that DTPA-Fe was high in the area whereas the reclassified kriged maps of DTPA-Mn and DTPA-Cu showed adequate availability of Mn (> 10 mg kg-1) and Cu (>2 mg kg-1) in the area. The reclassified kriged map of DTPA-Zn revealed that available Zn was low (<0.5 mg kg-1) and marginal (0.5-0.75 mg kg-1) at 0-20 cm covering 195.1 ha (69.6 %) and 85.3 ha (30.4 %), respectively and low, marginal and adequate (0.75-1.50 mg kg-1) at 20-40 cm depth covering 105.3 ha (37.6 %), 103 ha (36.8 %) and 72.1 ha (25.6 %), respectively. Integrated nutrient management in the areas deficient in nutrients needs to be adopted to improve the productivity.
The kriged maps, generated in GIS framework, precisely demarcated the variation in soil properties
Table 4. Status of available macro and micro nutrients and their extent.
S. No.
Soil Nutrient Class Range 0-20 cm depth 20-40 cm depthArea Per cent Area Per cent
1 Available N (kg ha-1) Low 140-280 280.4 100 280.4 1002 Available P (kg ha-1) Very Low <7 126.4 45.1 219.7 78.3
Low 7-14 152.9 54.5 60.7 21.7Medium 14-21 1.1 0.4 Nil Nil
3 Available K (kg ha-1) Low 120-180 160.4 57.2 252.7 90.1
Medium 180-240 67.7 24.2 27.7 9.9Moderate 240-300 43.5 15.5 Nil NilHigh 300-360 8.8 3.2 Nil Nil
4 Available Fe (mg kg-1) High >10 280.4 100 280.4 1005 Available Mn (mg kg-1) Adequate >10 280.4 100 280.4 1006 Available Cu (mg kg-1) High >10 280.4 100 280.4 1007 Available Zn (mg kg-1) Low <0.5 195.1 69.6 105.3 37.6
Marginal 0.5-0.75 85.3 30.4 103.0 36.8Adequate 0.75-1.50 Nil Nil 72.1 25.6

217
Mapping of Spatial Variability in Soil Properties for Site-Specific Nutrient Management
including soil fertility parameters. The superimposition of cadastral boundaries on kriged soil maps helped in precise identification of fields with soil physical, hydraulic, chemical properties, and soil fertility constraints for site-specific nutrient management to improve the productivity of Nagpur mandarin orchards of Central India.
REFERENCES1. Black, C.A., Evans, D.D White, J.L. Ensmingel,
L.E. and Clark, F.E. (eds).1965. Methods of soil analysis, Part I. American Soc. of Agron., No. 9, Madison, WI.
2. Jackson, M.L. 1967. Soil Chemical Analysis. Prentice Hall, New Delhi.
3. Jagdish Prasad (1996) Managing Nagpur Mandarin in shallow soils. Indian Hortic. 41: 25-26.
4. Jagdish Prasad, Nagaraju, M.S.S., Srivastava, R., Ray, S.K., & Chandran. P. 2001. Characteristics and classification of some orange growing soils in Nagpur district of Maharashtra. J. Indian Soc. Soil Sci. 49: 735-39.
5. Likhar Chetna, K. and Jagdish Prasad (2011a) Characteristics and classification of orange-growing soils developed from different parent materials in Nagpur district, Maharashtra. J. Indian Soc. Soil Sci. 59: 209-17.
6. Likhar Chetna, K. and Jagdish Prasad (2011b) Productivity and suitability assessment of orange (Citrus reticulata)-growing soils in Nagpur. Indian J. Agric. Sci. 81: 500-505.
7. Mann, K.K., Schumann, A.W., Obreza, T.A., Harris, W.G. and Shukla, S. 2010. Spatial variability of soil physical properties affecting Florida citrus production. Soil Sci. 175: 87-499.
8. Marathe, R.A., Mohanty, S. and Singh, S. 2003. Soil characterization in relation to growth and yield of Nagpur Mandarin. J. Indian Soc. Soil Sci. 51: 70-73.
9. Naidu, L.G.K., Ramamurthy, V. Challa, O., Hegde, R. and Krishnan, P. 2006. Soil site suitability criteria for major crops. NBSS & LUP Publication. No. 129.
10. Oliver, M.A. 1987. Geostatistics and its application to soil science. Soil Use and Managt. 3: 8-20.
11. Santra, P., Chopra, U.K. and Chakraborty, D.2008. Spatial variability of soil properties and its application in predicting surface map of hydraulic parameters in an agricultural farm. Curr. Sci. 95: 937-45.
12. Srivastava, A.K. and Kohli, R.R. 1997. Soil suitability criteria for citrus: an appraisal. Agri. Rev. 18: 134-46.
13. Srivastava, A.K. and Singh, S. 2002. Soil analysis based diagnostic norms for Indian citrus cultivar. Comm. Soil Pl. Anal. 33: 1689-1706.
14. Srivastava, A.K., Singh, S, and Shrigure, P.S. 1999. Citrus soils, their nature and properties. J. of Intensive Agric. 37: 28-31.
15. Srivastava, A.K., Singh, S., Das, S.N. and Harmandeep, S. 2010. Delineation of productivity zones in mandarin orchards using DRIS and GIS. Better Crops –South Asia, 92: 9-13.
16. Srivastava, R., Gaikwad S.T. and Jagat Ram. 1998. Water retention characteristics of some swell-shrink soils of Chandrapur district of Maharashtra. Agropedology, 8: 15-18
Received : November, 2016; Revised : February, 2018; Accepted : April, 2018
218
Indian J. Hort. 75(2), June 2018: 218-225
INTRODUCTION Chill i or Hot pepper is one of the most
economically important vegetable crops that belongs to the genus Capsicum, family-Solanaceae. Globally it is cultivated on an area of approximately 1.5 million hectares with a total production of about 7 million tons (Geetha and Selvarani, 4). The genus Capsicum had originated from tropical and humid zone of Central and Southern America. China and India account for about half of the World production of fresh pepper and chillies. Moscone et al. (10) had reported the existence of 31 Capsicum species, five of which are domesticated: Capsicum annuum, Capsicum frutescens, Capsicum chinense, Capsicum baccatum and Capsicum pubescens. In addition, considerable variation has also been observed within each Capsicum species with respect to several traits, including colour, shape and size of seeds, flowers and fruits, resistance to biotic and abiotic stresses as well as level of pungency. A thorough understanding about the extent of genetic diversity available in the germplasm collection of a particular crop is very important for strategic germplasm collection, maintenance, conservation and utilization. Several taxonomic studies have been conducted in the past on characterization of genetic resources of capsicum using morphological, biochemical and hybridization techniques (Barboza and Bianchetti, 2) however, the application of molecular markers provided useful
insights on discrimination of the species within the existing complexes (Nicolai et al., 12). The genetic relationships existing in a collection of 24 pepper genotypes collected from various sources was assessed to find reliable molecular markers for breeding programs. SSR markers were chosen for this purpose keeping in mind their advantageous features such as co-dominance, abundance, multiple allelic and hyper variable nature (Powell et al., 15). Moreover, in order to give additional information on the genotypes under study for transfer of useful alleles from different backgrounds; genotypes with useful attributes such as resistance to chilli leaf curl disease, bacterial leaf spot resistance as well as different levels of pungency and different fruiting habits were included in the study.
MATERIALS AND METHODSPlant Material
The germplasm used in this study consisted of 24 genotypes representing 19 genotypes from Capsicum annuum, three from other cultivated spp viz. C. frutescens, C. baccatum, C. chinense and one genotypes from wild relatives C. chacoense. The details regarding different genotypes are mentioned in Table 1. Young, healthy and uninfected leaves from each genotype were collected and brought to the laboratory in liquid nitrogen (-1960C) where they were kept in deep freezers at -800C till further use.
Characterization of cultivated and wild species of Capsicum using microsatellite markers
Arpita Srivastava, Manisha Mangal*, Gokul Gosavi and Pritam KaliaDivision of Vegetable Science, ICAR-Indian Agricultural Research Institute, New Delhi - 110 012
ABSTRACTDiversity of twenty four genotypes of hot pepper representing cultivated species Capsicum annuum, C.
frutescens, C. baccatum and C. chinense as well as a wild species C. chacoense was analyzed in the present study using 99 microsatellite loci distributed uniformly throughout the genome. The 85 polymorphic loci, out of 99 simple sequence repeat (SSR) loci used, amplified a total of 192 alleles among the 24 genotypes with one to five allele per loci. The average number of alleles per loci was found to be 2.25. The highest polymorphism information content (PIC value) was observed to be 0.729 for the marker located on linkage group 6. Principal component analysis provided useful information regarding genetic relationship among genotypes as it distributed all the genotypes studied into three major groups each including different species. All the C. annuum genotypes were grouped together while other cultivated species formed a separate group. The C. chacoenese was the only wild species studied which, although, fell within the first group but was placed separately from C. annuum. Besides, all the Chilli leaf curl resistant genotypes were grouped together.Keywords: Chilli, genetic diversity, hot pepper, DNA markers, simple sequence repeats
*Corresponding author's E-mail: [email protected]
DOI : 10.5958/0974-0112.2018.00039.7

219
Molecular Characterization of Cultivated and Wild Species of Capsicum
DNA extraction Genomic DNA was extracted from young leaf
tissue following the C-TAB procedure of Murray and Thompson, 11). DNA quality and quantity were assessed on a 1% (w/v) agarose gel stained with ethidium bromide and also by using a NanoDrop ND-1000 spectrophotometer Selection of the primer
99 SSR markers were selected from already published sequences of Yi et al. (20) and were custom synthesized (SBS Genetech Co.Ltd., Beijing, China). The markers were selected in such a way so that all the chromosomes were represented. The details of the primers are mentioned in Table 2. Polymerase Chain Reaction
All the SSR markers were amplified by PCR in 15 µL volumes with 50 ng genomic DNA, 1.0 U Taq DNA polymerase (Hi media Laboratories, Mumbai,
India), 1.0 µM of each primer, 0.6 uL of 10 mM dNTP mix (Hi media Laboratories, Mumbai, India ) and 1.5 uL of 10 × PCR buffer having 17.5 mM Mg Cl2 (Hi media Laboratories, Mumbai, India). All the primers were amplified using touchdown PCR in an Eppendorf Mastercycler. Amplification conditions used were, one cycle of 94°C for 3 min; 10 cycles of 94°C for 0.5 min, 65–55°C decreasing by 1°C per cycle for 1 min, and 72°C for 1 min; 30 cycles of 94°C for 0.5 min, 55°C for 1 min, and 72°C for 1 min; and a final cycle of 72°C for 5 min.
Amplified products were resolved on 3.0% agarose gels with Tris/Acetate /EDTA (TAE) stained with ethidium bromide, at a constant voltage of 60 V for 3 h using a horizontal gel electrophoresis system (BioRad, USA) and visualized and photographed under UV light in a gel documentation unit (Alpha imager, Cell bioscinces, Santa Clara, CA).
Table 1. Characteristics features of different capsicum genotypes used in the study.
Name of the genotype Characteristic featuresWBC-sel-5 (C. annuum) Resistance to Leaf curl, fruiting -cluster erect DLS-sel-10 (C. annuum) Resistance to Leaf curl, fruiting -cluster erect DKC-8 (C. annuum) Resistance to Leaf curl, fruiting -cluster erect CJL-S-1 (C. annuum) Resistance to Leaf curl, fruiting -cluster erect Tiwari (C. annuum) Tolerance to Leaf curl, fruiting -single erect DCL-2 (C. annuum) Resistance to Leaf curl, fruiting -cluster erect Phule Mukta (C. annuum) Susceptible to Leaf curl, fruiting –single pendent, 8-10 cm fruit LCA-334 (C. annuum) Susceptible to Leaf curl, fruiting –single pendent, national checkKashi Anmol (C. annuum) Susceptible to Leaf curl, fruiting –single pendent, national check GVC-111 (C. annuum) Susceptible to Leaf curl, fruiting –single pendent, 10-12 cm fruitAnugraha (C. annuum) Susceptible to Leaf curl, Bacterial wilt resistant, fruiting –single semi erect, early
fruiting (one month) Vellayani Attulya (C. annuum) Susceptible to Leaf curl, fruiting –single pendent, high fruit weight LCA-333 (C. annuum) Susceptible to Leaf curl, fruiting –single pendent Punjab Guchhedar (C. annuum) Susceptible to Leaf curl, fruiting –Cluster erect, High capsaicin DSL-352 (C. annuum) Susceptible to Leaf curl, fruiting –single pendent, flood tolerant DSL-524 (C. annuum) Susceptible to Leaf curl, fruiting –single pendent, drought tolerant Uttakal Yellow (C. annuum) Susceptible to Leaf curl, fruiting –single erect, High capsanthin Phule jyoti (C. annuum) Susceptible to Leaf curl, fruiting –cluster pendent, tolerant PC-2062 (C. annuum) Susceptible to Leaf curl, fruiting –single pendent, bushyVellayani Sambridhi (C. frutescens) Susceptible to Leaf curl, fruiting –single erect, high pungencyEC783777 (C. frutescens) Susceptible to Leaf curl, fruiting –single pendent
C. baccatum (PBC-80) Susceptible to Leaf curl, fruiting –single pendent, anthracnose resistance C. chinense Susceptible to Leaf curl, fruiting –single pendent, TMV,CMV resistance C. chacoense Susceptible to Leaf curl, fruiting –single pendent, Bacterial leaf spot resistance

220
Indian Journal of Horticulture, June 2018
Table 2. Allelic variations in 85 Microsatellite loci used for characterization of 24 hot pepper genotypes.
S. No.
Marker name
LG Polymor-phism status
Expected Product size (bp)
No of alleles in total 24
genotypes
No of alleles in 20 C. annuum genotypes
Observed Product size PIC in total 24
genotypes
PIC inC.annuum genotypes
1. HpmsE034 1 P 202 2 2 200, 210 0.413 0.1882. HpmsE035 1 PWOC 226 2 1 225, 235 0.219 03. HpmsE036 1 P 261 4 2 260, 270, 290, 300 0.608 0.4994. HpmsE104 1 M 212 1 1 210 0 05. HpmsE137 1 PWOC 189 3 1 160, 180, 200 0.244 06. HpmsE019 1 P 232 5 3 180, 190, 210, 220, 250 0.671 0.5087. HpmsE021 1 PWOC 250 3 1 250, 260, 270 0.156 08. HpmsE022 1 M 206 1 1 200 0 09. HpmsE027 1 P 230 3 3 230, 250, 270 0.611 0.58810. HpmsE121 1 M 198 1 1 200 0 011. HpmsE047 2 P 260 2 2 240, 260 0.148 0.1812. HpmsE118 2 PWOC 193 2 1 190, 200 0.278 013. HpmsE135 2 PWOC 209 2 1 200,210 0.153 014. HpmsE144 2 PWOC 236 2 1 320, 340 0.0798 015. HpmsE148 2 P 205 2 2 200, 210 0.33 0.18816. HpmsE001 2 P 207 3 3 200, 210, 220 0.538 0.34917. HpmsE008 3 P 230 3 2 230, 240, 250 0.497 0.48818. HpmsE010 3 P 198 2 2 180, 200 0.486 0.49919. HpmsE050 3 PWOC 247 2 1 250, 270 0.153 020. HpmsE073 3 P 220 4 2 220, 240, 260, 270 0.625 0.48721. HpmsE126 3 PWOC 192 3 1 190, 210, 230 0.571 022. HpmsE060 3 PWOC 206 4 1 200, 220, 230, 240 0.358 023. HpmsE006 4 P 243 2 2 200, 240 0.486 0.48724. HpmsE055 4 PWOC 275 3 1 250, 275, 300 0.226 025. HpmsE071 4 P 188 3 2 220, 230, 250 0.631 0.47526. HpmsE081 4 P 185 2 2 180, 200 0.413 0.38827. HpmsE099 4 M 163 1 1 165 0 028. HpmsE140 4 M 225 1 1 300 0 029. HpmsE015 5 M 146 1 1 140 0 030. HpmsE116 5 P 189 4 4 175, 180, 190, 200 0.663 0.68131. HpmsE129 5 PWOC 233 2 1 230, 250 0.278 032. HpmsE011 6 M 151 1 1 150 0 033. HpmsE014 6 P 106 5 3 80,100, 110, 120, 130 0.729 0.66034. HpmsE072 6 P 199 4 3 160, 180, 190, 210 0.726 0.66035. HpmsE078 6 PWOC 203 3 1 150, 170, 200 0.363 036. HpmsE088 6 P 199 3 3 200, 210, 230 0.628 0.64237. HpmsE076 6 M 239 1 1 240 0 038. HpmsE052 7 M 221 1 1 220 0 039. HpmsE068 7 PWOC 232 2 1 230, 240 0.083 040. HpmsE103 7 P 177 2 2 150, 170 0.340 0.332

221
Molecular Characterization of Cultivated and Wild Species of Capsicum
S. No.
Marker name
LG Polymor-phism status
Expected Product size (bp)
No of alleles in total 24
genotypes
No of alleles in 20 C. annuum genotypes
Observed Product size PIC in total 24
genotypes
PIC inC.annuum genotypes
41. HpmsE114 7 P 190 3 2 185, 190, 200 0.559 0.48742. HpmsE020 7 P 200 2 2 190, 200 0.444 0.33243. HpmsE082 9 P 232 2 2 220, 230 0.278 0.09944. HpmsE084 9 PWOC 220 2 1 210, 220 0.0798 045. HpmsE102 9 P 163 3 2 160, 170, 180 0.531 0.49946. HpmsE013 10 P 256 2 2 240, 250 0.365 0.1847. HpmsE031 10 P 167 2 2 170, 180 0.486 0.49948. HpmsE065 10 M 199 1 1 200 0 049. HpmsE096 10 M 237 1 1 240 0 050. HpmsE059 10 P 235 2 2 220, 240 0.423 0.43251. HpmsE012 11 P 208 2 2 200, 215 0.413 0.38852. HpmsE046 11 P 277 4 3 240, 250, 260, 270 0.649 0.63353. HpmsE124 11 P 227 4 3 200, 220, 230, 240 0.674 0.54954. HpmsE132 11 P 197 2 2 185, 195 0.469 0.43255. HpmsE023 11 P 206 3 3 200, 210, 220 0.626 0.60956. HpmsE054 12 M 219 1 1 220 0 057. HpmsE064 12 P 221 2 2 170, 190 0.499 0.49858. HpmsE108 12 M 200 1 1 200 0 059. HpmsE075 12 P 205 3 3 200, 210, 230 0.628 0.63260. HpmsE110 A M 191 1 1 190 0 061. HpmsE040 B M 245 1 1 240 0 062. HpmsE086 B M 221 1 1 220 0 063. HpmsE067 C M 212 1 1 210 0 064. HpmsE087 C M 247 1 1 245 0 065. HpmsE002 U P 177 3 2 170, 180, 210 0.510 0.40166. HpmsE028 U PWOC 231 3 1 220, 230, 240 0.366 067. HpmsE017 U P 199 3 3 190, 200, 250 0.390 0.38068. HpmsE018 U P 267 2 2 240, 250 0.255 0.25569. HpmsE032 U PWOC 231 2 1 200, 230, 0.087 070. HpmsE058 U M 202 1 1 200 0 071. HpmsE091 A M 194 1 1 194 0 072. HpmsE093 C M 207 1 1 200 0 073. HpmsE097 U M 250 1 1 250 0 074. HpmsE130 U P 221 4 4 170, 180, 200, 210 0.678 0.56875. HpmsE133 U P 205 3 3 200, 210, 220 0.608 0.51976. HpmsE145 U P 222 4 3 170, 190, 220, 240 0.507 0.43477. HpmsE147 U PWOC 178 2 1 180, 190 0.0798 078. HpmsE063 1 P 209 2 2 180, 200 0.332 0.39179. HpmsE077 1 P 235 2 2 200, 220 0.498 0.580. HpmsE083 1 P 209 4 3 190, 210, 220, 230 0.684 0.614

222
Indian Journal of Horticulture, June 2018
Data AnalysisThe amplified products were scored for each
accession based on presence and absence of band using binary code 1 and 0 for the presence and absence of band, respectively. Molecular size (bp) of amplified DNA fragment was determined by comparison with 50 bp ladder (BR biochem, bioscience, life sciences) using image acquisition analysis software of alpha imager gel documentation system. The binary matrix was used to estimate Jaccard’s genetic similarity coefficients for SSRs. Principal Coordinate Analysis was performed using NTSYS-pc 2.02 analytical package after calculating eigen values. (Rohlf, 17).
For single-locus evaluations of the SSR data, all DNA fragments were scored as allele sizes at each locus. The polymorphic information content (PIC) of each marker locus, which combines the number of alleles and their frequency distribution within a population and serves as a measure of allele diversity at a locus, was evaluated by applying the following equation, as suggested by Anderson (1): PIC = 1-∑ Pi
2
i=1
Where Pi is the frequency of the i-th allele among a total of n alleles (Liu, 9).
RESULTS AND DISCUSSION Knowledge of population diversity in a crop is the
first step towards effective utilization of the genetic variability available to breeders. Furthermore, it is essential to have an unequivocal identification method to verify the material obtained. The traditional methods are now being complemented by molecular techniques, enabling breeders to make better decisions when choosing the germplasm used in breeding programs (Cubero, 3). Molecular markers can be regarded as efficient and accurate tools for identification and assessment of genetic variation in a rapid and thorough manner. In fact they provide us
advanced and, possibly, the most effective means for understanding the basis of genetic diversity.
The information on the nature and degree of genetic divergence is essential for the breeder to choose the right type of parents for purposeful hybridization in heterosis breeding (Patel et al., 14; Farhad et al., 5). In order to benefit transgressive segregation, the knowledge of genetic distance between parents is necessary. Present study was aimed at understanding genetic diversity and clustering pattern of chilli genotypes grown in India using SSR markers so as to get an idea about the suitability of genotypes for future chilli hybridization programme.
A total of 99 SSR markers uniformly distributed throughout pepper genome were used for diversity analysis of the 24 chilli genotypes. These microsatellite loci were selected in such a way that at least four markers were selected from each linkage group. Out of 99 microsatellite markers, 14 did not amplify in any of the genotype studied and 24 markers were found to be monomorphic (denoted by letter M in Table 2) across all the genotypes selected and hence were unable to differentiate between these genotypes. Out of the remaining 61 polymorphic markers, 18 markers did not show polymorphism in the C. annuum genotypes but were polymorphic in other cultivated genotypes (denoted by PWOC in Table 2) viz., C. frutescens, C. baccatum and C. chinense as well as a wild species C. chacoense (Fig. 1a). Forty three out of total microsatellite loci (denoted by letter P in Table 2) studied were found to be highly polymorphic across all the genotypes (Fig. 1 b,c).
The 85 polymorphic SSRs loci amplified a total of 192 alleles across the twenty four genotypes studied (Table 2) and the number of alleles per loci ranged from one to five with an average allele frequency of 2.25 per loci. Maximum five alleles were observed for the marker HpmsE014 located on linkage group 6. Furthermore, when just the C. annuum genotypes
S. No.
Marker name
LG Polymor-phism status
Expected Product size (bp)
No of alleles in total 24
genotypes
No of alleles in 20 C. annuum genotypes
Observed Product size PIC in total 24
genotypes
PIC inC.annuum genotypes
81. HpmsE100 1 P 220 4 2 200, 210, 220, 230 0.370 0.09982. HpmsE112 1 M 206 1 1 200 0 083. HpmsE115 1 M 216 1 1 210 0 084. HpmsE131 1 PWOC 246 2 1 250, 260 0.236 085. HpmsE003 2 P 164 2 2 150, 160 0.287 0.277
192 1460.302541 0.22368

223
Molecular Characterization of Cultivated and Wild Species of Capsicum
were considered, it was found that allele number ranged from one to four. Maximum of four alleles were observed in the C. annuum genotypes for markers HpmsE116 (located on linkage group 5) and HpmsE130 (location unassigned). A total of 146 alleles were amplified in the nineteen C. annuum genotypes (Table 2) with an average allele frequency of 1.72. In earlier works 3.5 alleles per locus has been reported in pepper (Hanáček et al., 7), however this value is bound to change with the diversity in germplasm and number of loci studied.
The highest value of PIC was observed to be 0.729 across all the 24 genotypes and 0.660 among the 19 C. annuum genotypes for marker HpmsE014 located on linkage group 6 (Table 2). Marker HpmsE072 located on the same linkage group had the same PIC value (0.660) among the C.annuum genotypes but when the whole set of 24 genotypes was considered, it had a slightly lower (0.726) PIC value.
Fig. 2 represents the 3D Principal coordinate analysis plot of the 24 genotype of chilli based on 85 SSR markers using NTSYS pc 2.02 software package (Rohlf, 17). In this plot, twenty four genotypes under study have been separated in such a way that all the C annuum genotypes are clustered together in one major group (group I) while the genotypes belonging to C. frutescens, C. baccatum, C. chinense formed a separate group (group II). The wild genotype C. chacoense which is known to be bacterial leaf spot resistant was found to fall in group I alongwith C. annuum genotypes, however, it was an outlier within group I. This result is also in line with the results obtained by Ince et al. (8) and Rai et al. (16). Several studies have reported that genetic diversity between commonly grown improved C. annuum genotypes is less than the diversity between semi-wild and landrace genotypes (Oyama et al. 13). This is expected, as during and after domestication nearly all domesticated crop species have gone through a
Fig. 1. Polymorphism observed in 24 Capsicum genotypes using different SSR markers of Hpms series. A: Polymorphism observed only in other cultivated and wild spp. with primer Hpms E129 ; B&C: Polymorphism observed in all the genotypes.

224
Indian Journal of Horticulture, June 2018
decline in genetic diversity (Gepts, 6). The frequent use of selected elite breeding lines in commercial breeding worldwide has further narrowed genetic diversity in many crop plant species. The magnitude of the observed genetic bottleneck, however, depends on the type of marker (molecular or phenotypic) used to measure genetic diversity (Rai et al., 16). The 3D PCA plot generated using similarity coefficient of twenty four capsicum genotypes provided useful information regarding genetic relationship among the genotypes as all the genotypes viz. WBC-Sel-5, DLS Sel-10, DKC-8, CJL-S-1, Tiwari, DCL-2, which have been shown resistant to chilli leaf curl disease in our earlier studies (Srivastava et al., 18, 19) were grouped together within group I. Similarly DSL-352 and DSL 524 which are two different selections from the cross between same parents were found to lie together. The two C. frutescens genotypes viz. Vellayani Sambridhi and EC 783777 also clustered together under group II. However the PCA plot did not show any specific pattern of scattering or clustering among the genotypes on the basis of fruiting habits, as different genotypes with different fruiting habits (cluster erect, cluster pendent, single pendent, single semi erect and single erect) were found to be distributed randomly across all the groups. This appears to be in agreement with the earlier reports of Rai et al. (16). The present study has provided useful insight on mapping of gene for resistance to chilli leaf curl disease, as all the resistant genotypes clustered together in same cluster within group I which emphasizes the utility of markers used in the present study for this purpose.
REFERENCES1. Anderson, J., Churcill, G., Autrique, J. Tanksley,
S. and Sorrels, M. 1992. Optimizing parental selection for genetic linkage maps. Genome, 36: 181-86.
2. Barboza, G.E. and Bianchetti, L.D.B. 2005. Three new species of Capsicum (Solanaceae) and a key to the wild species from Brazil. Syst. Bot. 30: 863-71.
3. Cubero, J.I. 2003. Introducción a la mejora genética vegetal. Ediciones Mundi-Prensa. Madrid. 567 p. ISBN 84-8476-099-5.
4. Geetha R. and Selvarani, K. 2017. A study of chilli production and export from India. IJARIIE- 3: 205-10.
5. Farhad, M., Hasanuzzaman, M., Biswas, B.K., Arifuzzaman, M. and Islam M.M. 2010. Genetic divergence in chilli. Bangladesh Res. Pub. J. 3: 1045-51.
6. Gepts, P. 2004. Crop domestication as a long-term selection experiment. Plant Breed. Rev. 24: 1-44.
7. Hanáček, P., Vyhnánek, T., Rohrer, M., Cieslarovám, J. and Stavělíková, H. 2009. DNA polymorphism in genetic resources of red pepper using microsatellite markers. HortSci. 36: 127-32.
8. Ince, A.G., Karaca, M. and Onus, A.N. 2009. Development and utilization of diagnostic DAMD-PCR markers for Capsicum accessions. Genet. Resour. Crop Evol. 56: 211-21.
9. Liu, B.H. 1998. Statistical genomics: linkage, mapping and QTL analysis. CRC Press, Boca Raton.
10. Moscone, E.A., Scaldaferro, M.A., Grabiele, M., Cecchini, N.M., Sanchez Garcıa, Y., Jarret, R., Davina, J.R., Ducasse, D.A., Barboza, G.E. and Ehrendorfer, F. 2007. The evolution of chili peppers (Capsicum-Solanaceae): a cytogenetic perspective. Acta Hort. 745: 137-70.
11. Murray, M.G. and Thompson, W.F. 1980. Rapid isolation of high molecular weight plant DNA. Nucleic Acids Res. 10: 4321-5.
12. Nicolai, M., Cantet, M., Lefebvre, V., Sage-Palloix, AM. And Palloix, A. 2013. Genotyping a large collection of pepper (Capsicum spp.) with SSR loci brings new evidence for the wild origin of cultivated C. annuum and the structuring of
Fig. 2. 3D PCA plot of the 24 genotype of chilli based on 85 SSR markers.

225
Molecular Characterization of Cultivated and Wild Species of Capsicum
genetic diversity by human selection of cultivar types. Genet. Resour. Crop Evol. 60: 2375-90.
13. Oyama, K., Verdugo, S.H., Sanchez, C., Rodrıguez, A.G., Pena, P.S., Tiznado, J.A.G. and Casas, A. 2006. Genetic structure of wild and domesticated populations of Capsicum annuum (Solanaceae) from northwestern Mexico analyzed by RAPDs. Genet. Resour. Crop Evol. 53: 553-62.
14. Patel, M.L., Reddi, M.V., Rona, B.S. and Reddy, B.J. 1989. Genetic divergence in safflower (Carthamus tinctorius L.) Indian J Genet. 49: 113-18.
15. Powell, W., Morgante, M., Andre, C., Hanafey, M., Vogel, J., Tingey, S. and Rafalski, A. 1996. The utility of RFLP, RAPD, AFLP and SSR (microsatellite) markers for germplasm analysis. Mol. Breed. 2: 225-38.
16. Rai, V.P., Kumar, R., Kumar, S., Rai, A., Kumar, S., Singh, M., Singh, S.P., Rai, A.B. and Paliwal, R.. 2013. Genetic diversity in Capsicum germplasm
based on microsatellite and random amplified microsatellite polymorphism markers. Physiol. Mol. Biol. Plants, 19: 575-86.
17. Rohlf, F.J. 1988. NTSYS-PC Numerical Taxonomy and Multivariate Analysis System. Exeter Publishing, New York.
18. Srivastava, A. Mangal, M., Saritha, R.K. and Kalia, P. 2017. Screening of chilli pepper (Capsicum spp.) lines for resistance to the begomoviruses causing chilli leaf curl disease in India. Crop Protec. 100:177-85.
19. Srivastava, A. Mangal, M., Saritha, R.K., Jat, S.L., Gosavy, G.U. and Kalia, P. 2015. Natural Epiphytotic Screening of Chilli Germplasm lines against leaf curl virus complex. Int. J. Trop. Agric. 33: 3581-86.
20. Yi, G., Lee, J.M., Lee, S., Choi, D., Kim, B.D. 2006. Exploitation of pepper EST-SSRs and an SSR-based linkage map. Theor. Appl. Genet. 114: 113-30.
Received : March, 2017; Revised : April, 2018; Accepted : May, 2018

226
DOI : 10.5958/0974-0112.2018.00040.3
Indian J. Hort. 75(2), June 2018: 226-236
INTRODUCTIONBulb onion (Aliium cepa L.) is an economically
important vegetable crop having world annual production of 88.54 million tonnes. China, India, USA, Russia, Turkey and Iran are the top five onion producing countries in the world. Per capita consumption of onion varies greatly among countries and the trend towards increase in consumption is increasing globally. Besides, onion consumption has been associated with reduced incidence of cardiovascular diseases and some cancer types which is attributed to its demonstrated biological properties such as antiplatelet, antioxidant, anti-inflammatory, anti-tumor and hypolipidemic activities.
Evaluating the genetic diversity is a pre-requisite for parental selection for an effective breeding programme. However, the genetic diversity in local bulb onion is persistently eroding due to intensive agriculture and cultivar uniformity. Genetic variability in onion is continuously created due to its allogamous reproductive behaviour. Modern varieties of international seed companies particularly F1 hybrids having narrow genetic base are replacing existing cultivated onion varieties. Consequently, existing cultivated varieties having prospectively important adaptive genes are in peril to vanish. Therefore, it is important to evaluate and characterize the existing old varieties and landraces. Research on
Indian onion diversity has been reported by various authors (Solanki et al., 15) but most of the studies are focused on local commercial varieties or germplasm. Besides, the number of genotypes used for diversity analysis are very low and can be as low as 10-12. Use of less number of genotypes are not ideal for diversity assessment which leads to the unavailability of diverse potential genotypes for hybridization and leads to research gap in onion improvement.
Breeding of short day onion varieties with high yield potential, good storage quality and resistance to various biotic and abiotic stress is of prime importance under Indian conditions. Hence, the main aim of our study was to characterize the genotypes based on morphological and biochemical traits, study the correlation of traits within themselves and estimate the extent of genetic diversity of onion genotypes. Identification of traits associated with characterizing genotypes would be useful for diversified onion breeding program. Besides, identification of diverse parents with desirable traits would form the basis for onion heterosis breeding programme. In our studies, we have used for the first time, hybrids and exotic lines from USA and Japan, which are sold in the local market and are grown by the local farmers.
MATERIALS AND METHODSThe experiment was carried out in the Division of
Vegetable Science, ICAR-IARI, New Delhi. Delhi is
Characterization and association of phenotypic and biochemical traits in onion under short day tropical conditions
Ravindra Dangi, Anil Khar*, Sabina Islam and Amrender Kumar**
Division of Vegetable Science, ICAR-Indian Agricultural Research Institute, New Delhi 110 012
ABSTRACTThe aim of the present study was to characterize 58 onion genotypes based on morphological and biochemical
traits. Genotypes comprised of landraces, open-pollinated varieties, hybrids and breeding materials. Thirteen quantitative, nine qualitative and four biochemical traits were analyzed. Significant variability was observed in the evaluated morphological and biochemical traits. Pusa White Flat (PWF) was highest yielder and maximum TSS was recorded in 106BS2 (15.30 ± 3.03°B). Arka Kalyan had highest dry matter (15.70 ± 0.57%), Red Creole3 had highest pyruvic acid (6.32 ± 0.17 µmol/ ml) and total phenolic content was recorded highest (36.96 ± 2.00 mg/g FW) in Juni. Genotypes with waxy leaves and firm skin were also identified. Significant correlations between marketable yield and morphological traits were observed. Highly significant correlation between TSS and dry matter (r = 0.45), pyruvic acid and dry matter (r = 0.35) and significant and negative correlation between TSS and TPC (total phenolic content) (r = -0.32) was observed. The finding of this study were important to assess the genetic diversity of indigenous and exotic material and also to know about the correlation of desired traits which will be helpful in devising efficient strategies for trait introgression, breeding new germplasm resources and selecting diverse parents for heterosis breeding programme in short day tropical onion. Key words : Allium cepa, onion diversity, correlation, pyruvic acid, total phenols.
*Corresponding author’s E-mail : [email protected]**Agricultural Knowledge Management Unit, ICAR-IARI

227
Characterization and Association of Phenotypic and Biochemical Traits in Onion
classified as sub-tropical, semi-arid with cold winter and hot dry summer and falls under 28° 38’ 41.2800’’ N and 77° 13’ 0.1956’’ E with an elevation of 222 m height above mean sea level. A total of 58 genotypes comprising of 35 open pollinated varieties (OPVs), 13 hybrids, 4 landraces (LR) and 6 breeding lines (BL) were planted in randomized block design with three replications. In each replication, 60 plants of each genotype were planted in three rows with a spacing of 10 cm (plant to plant) and 15 cm (row to row). Thirteen quantitative and nine qualitative traits were recorded according to the guidelines of PPVFRA. Recommended cultural practices were followed for raising the crop. Biochemical analysis was carried out for total soluble solids (˚B), dry matter (%), pyruvic acid (µmol/ml) of bulbs and total phenolic content (mg/g FW). Total soluble solids (TSS) of onion were ascertained by using a hand refractometer model-PAL-3 (ATAGO, Japan) and expressed in °B. Dry matter (DM) of the onion bulbs was determined according to Nieuwhof et al. (10) with a couple of modifications. Pyruvic acid (PA) was assessed according to Anthon and Barrett (1). Total phenolic content (TPC) of onion leaves was assessed by Folin Ciocalteu Reagent method (Singleton and Rossi, 14) and expressed in ‘mg gallic acid equivalent (GAE)/g of fresh weight’. Data obtained from the experiments was subjected to analysis of variance with the use of
Proc GLM procedure. Pearson’s correlation analysis was done by using PROC CORR. In addition, for individual basic statistics PROC UNIVARIATE was used. All the analysis was done using SAS, version 9.3 (SAS Institute, Cary, NC, USA).
RESULTS AND DISCUSSIONSignificant variability (p<0.0001) was observed
among all the genotypes for all the morphological and biochemical traits studied (Table 1). Observation on different morphological traits (Table 2) analyzed suggested that maximum plant height was recorded in Hisar-3 (61.40 ± 0.87 cm) and minimum in Red Creole1 (38.60 ± 1.31 cm). Significant differences for plant height have also been observed by Solanki et al. (15). Highest number of leaves were recorded in Early Grano (10.87 ± 0.76) and least in Red Creole1 (5.87 ± 0.23). Largest leaf length was observed in Hisar-3 (48.07 ± 1.30 cm) and the smallest in Red Creole1 (28.60 ± 1.00 cm). Likewise, widest leaf width was observed in N-2-4-1 (1.18 ± 0.06 cm) and narrowest in Superex (0.62 ± 0.02 cm). Pusa Red (15.93 ± 0.50 cm) recorded longest pseudostem and Juni (8.33 ± 0.50 cm) recorded shortest. Similarly, the widest pseudostem was recorded in Bhima Shweta (1.72 ± 0.04 cm) and narrower pseudostem in Superex (0.78 ± 0.01cm). Studies on bulb and yield related traits (Table 3) showed that Sukhsagar1 (4.52
Table 1. General statistics of the variables recorded in onion genotypes.
Variable N Mean Std Dev Sum Minimum MaximumPH (cm) 58 52.31 5.20 3034.00 38.60 61.40NOL 58 8.43 0.99 489.19 5.87 10.87LL (cm) 58 38.63 4.22 2241.00 28.60 48.07LW (cm) 58 0.91 0.12 52.59 0.62 1.18PsL (cm) 58 11.65 1.72 675.80 8.33 15.93PsW (cm) 58 1.27 0.23 73.65 0.78 1.72P (cm) 58 3.79 0.33 219.97 2.91 4.52E (cm) 58 4.97 0.33 288.42 4.32 6.00N (cm) 58 0.78 0.14 45.18 0.48 1.15TSS (°B) 58 11.52 1.35 668.39 7.03 15.30ABW (kg) 58 50.26 10.09 2915.00 25.85 75.99FW (kg) 58 0.55 0.23 31.65 0.22 1.47MY (t/ ha) 58 20.74 8.15 1203.00 5.71 46.74GY (t/ ha) 58 25.34 8.02 1469.00 8.29 48.96DM (%) 58 11.44 1.88 663.62 4.08 15.70PA (µmol/ ml) 58 3.84 0.72 222.88 2.57 6.32TPC (mg/ g FW) 58 25.46 4.17 1477.00 16.97 36.96
PH = Plant height; NOL = No of leaves, LL = Leaf length; LW = Leaf width; PsL = Pseudostem length; PsW = Pseudostem width; P = Polar diameter; E = Equatorial diameter; N = Neck thickness; TSS = Total soluble solids; ABW = Av bulb wt; FW = Foliage wt; MY = Marketable yield; GY = Gross yield; DM = Dry matter; PA = Pyruvic acid; TPC = Total phenolic content

228
Indian Journal of Horticulture, June 2018
Table 2. Characterization of onion accessions based on morphological traits.
Genotype Status PH (cm) NOL (cm) LL (cm) LW (cm) PsL (cm) PsW (cm)F1 Hybrid-1 Hybrid 48.60 ± 0.60 8.87 ± 0.42 34.07 ± 1.90 0.87 ± 0.02 10.05 ± 1.14 1.16 ± 0.05F1 Hybrid-2 Hybrid 53.60 ± 1.83 9.60 ± 0.20 40.73 ± 1.51 0.96 ± 0.01 11.20 ± 0.20 1.37 ± 0.04XP-Red Hybrid 49.87 ± 1.15 8.67 ± 0.61 38.80 ± 0.92 1.01 ± 0.03 9.60 ± 0.20 1.24 ± 0.02Arka Kalyan OPV 47.13 ± 0.23 8.40 ± 0.40 35.13 ± 1.21 0.92 ± 0.02 10.20 ± 0.20 1.31 ± 0.06Prema 178 OPV 48.80 ± 0.40 8.73 ± 0.70 35.67 ± 0.81 0.90 ± 0.06 10.93 ± 0.23 1.08 ± 0.05Red Creole1 OPV 38.60 ± 1.31 5.87 ± 0 .23 28.60 ± 1.00 0.88 ± 0.02 9.00 ± 0.35 0.93 ± 0.03Black Crown OPV 43.13 ± 0.23 7.60 ± 0.40 32.00 ± 1.10 0.87 ± 0.06 10.93 ± 0.42 1.00 ± 0.03Indam 4 Hybrid 47.13 ± 0.99 8.67 ± 0.42 34.07 ± 0.76 0.88 ± 0.05 11.13 ± 0.12 1.18 ± 0.04KSP1191 Hybrid 50.27 ± 0.42 9.93 ± 0.81 36.27 ± 0.83 0.98 ± 0.08 11.53 ± 0.23 1.27 ± 0.06Phursungi Local Landrace 55.00 ± 1.78 8.73 ± 0.64 37.13 ± 0.46 1.01 ± 0.06 15.47 ± 0.81 1.18 ± 0.07Hisar-3 OPV 61.40 + 0.87 8.60 ± 0.35 48.07 ± 1.30 1.11 ± 0.06 12.07 ± 0.12 1.60 ± 0.04KRR OPV 55.47 ± 0.64 8.53 ± 0.31 41.80 ± 0.20 0.98 ± 0.04 11.87 ± 0.31 1.23 ± 0.07Bhima Kiran OPV 53.73 ± 2.52 7.53 ± 0.31 39.07 ± 1.30 0.83 ± 0.06 12.13 ± 0.42 1.14 ± 0.03BSS-262 Hybrid 47.07 ± 2.19 8.47 ± 0.23 34.13 ± 2.76 0.73 ± 0.04 9.87 ± 0.50 1.05 ± 0.06NP-4 Hybrid 46.00 ± 0.53 8.13 ± 0.12 34.33 ± 0.83 0.86 ± 0.05 10.27 ± 0.58 1.09 ± 0.03Punjab Naroha OPV 57.93 ± 1.10 9.40 ± 0.35 41.00 ± 1.22 1.01 ± 0.04 14.20 ± 0.20 1.42 ± 0.02Hisar-2 OPV 57.47 ± 0.95 10.53 ± 0.23 43.73 ± 1.03 1.06 ± 0.03 10.40 ± 0.35 1.53 ± 0.02Bhima Shweta OPV 61.33 ± 0.81 10.33 ± 0.31 45.53 ± 0.61 1.00 ± 0.03 14.20 ± 0.53 1.72 ± 0.04PWR OPV 54.67 ± 1.30 8.80 ± 0.35 40.07 ± 1.50 0.98 ± 0.01 13.00 ± 0.20 1.42 ± 0.02PWF OPV 54.73± 0.64 9.00 ± 0.20 42.73 ± 1.01 0.93 ± 0.01 10.40 ± 0.40 1.39 ± 0.03Udaipur Local OPV 49.73 ± 0.83 8.13 ± 0.42 37.47 ± 0.61 0.99 ± 0.05 11.33 ± 0.31 1.30 ± 0.08Red Creole2 OPV 51.07 ± 0.64 7.27 ± 0.31 37.20 ± 0.53 0.85 ± 0.03 11.53 ± 0.42 1.02 ± 0.01Red Creole3 OPV 53.40 ± 0.80 7.47 ± 0.58 40.67 ± 0.64 0.83 ± 0.01 11.00 ± 0.40 1.11 ± 0.03Pusa Red OPV 60.40 ± 1.06 9.00 ± 0.20 45.73 ± 2.14 0.92 ± 0.03 15.93 ± 0.50 1.49 ± 0.12AFW OPV 60.67 ± 0.31 9.60 ± 0.20 44.47 ± 0.31 1.00 ± 0.01 13.87 ± 0.31 1.53 ± 0.01Sukhsagar1 Landrace 57.13 ± 1.53 8.13 ± 0.31 41.33 ± 0.58 1.11 ± 0.06 13.40 ± 0.35 1.38 ± 0.02Sel. 325 BL 60.00 ± 0.87 9.53 ± 0.42 44.20 ± 1.91 1.12 ± 0.04 15.13 ± 0.50 1.58 ± 0.11Bhima Shakti OPV 58.20 ± 1.20 8.60 ± 0.35 43.13 ± 1.33 1.16 ± 0.05 13.80 ± 0.35 1.62 ± 0.11Lucifer Hybrid 47.00 ± 1.00 7.60 ± 0.40 35.73 ± 1.30 0.73 ± 0.07 9.67 ± 0.64 0.95 ± 0.03106BS3 BL 58.87 ± 0.46 8.93 ± 0.31 43.07 ± 1.10 0.97 ± 0.02 14.47 ± 1.40 1.56 ± 0.12Superex Hybrid 44.40 ± 0.53 7.33 ± 0.12 31.87 ± 0.50 0.62 ± 0.02 9.67 ± 0.31 0.78 ± 0.01Pioneer Hybrid 54.13 ± 1.70 8.53 ± 0.50 39.47 ± 2.14 0.95 ± 0.03 11.80 ± 0.20 1.16 ± 0.07BSS258 Hybrid 49.13 ± 0.42 8.80 ± 0.35 37.87 ± 1.33 0.89 ± 0.02 10.07 ± 0.31 1.01 ± 0.06N-2-4-1 OPV 56.27 ± 0.23 9.53 ± 0.31 41.87 ± 0.95 1.18 ± 0.06 12.60 ± 0.20 1.57 ± 0.05PRO-6 OPV 50.67 ± 1.21 8.67 ± 0.12 38.13 ± 1.27 0.80 ± 0.03 10.60 ± 0.87 1.29 ± 0.02Early Grano OPV 57.33 ± 1.53 10.87 ± 0.76 41.73 ± 0.90 0.85 ± 0.04 13.13 ± 0.61 1.55 ± 0.10Bhima Shubhra OPV 56.60 ± 1.25 8.33 ± 0.12 41.73 ± 1.70 0.83 ± 0.04 12.27 ± 0.42 1.30 ± 0.02Sel.126 OPV 57.27 ± 0.76 8.60 ± 0.35 42.67 ± 1.17 0.95 ± 0.02 13.60 ± 0.20 1.39 ± 0.00Yellow Grano OPV 50.40 ± 1.20 7.67 ± 0.31 38.00 ± 0.60 0.88 ± 0.04 10.27 ± 0.12 0.98 ± 0.02Pusa Riddhi OPV 57.40 ± 1.15 8.67 ± 0.42 42.93 ± 2.40 1.06 ± 0.02 11.47 ± 0.42 1.39 ± 0.01Juni Hybrid 46.60 ± 0.80 6.27 ± 0.31 35.93 ± 0.70 0.71 ± 0.04 8.33 ± 0.50 0.87 ± 0.02AKON555 Landrace 58.73 ± 1.50 9.47 ± 0.12 44.87 ± 1.29 1.02 ± 0.02 11.53 ± 0.90 1.66 ± 0.06KSP1121 Hybrid 48.93 ± 1.03 8.00 ± 0.00 34.60 ± 1.00 0.79 ± 0.02 11.60 ± 0.20 1.19 ± 0.02GWO-1 OPV 53.27 ± 0.58 7.93 ± 0.23 38.27 ± 1.63 0.91 ± 0.04 12.53 ± 0.31 1.40 ± 0.10

229
Characterization and Association of Phenotypic and Biochemical Traits in Onion
± 0.17 cm) recorded maximum and Red Creole2 (2.91 ± 0.09 cm) minimum polar diameter. AKON555 (6.00 ± 0.35 cm) recorded maximum whereas106BS10 (4.32 ± 0.48 cm) recorded minimum equatorial diameter. Thickest neck was observed in 106BS2 (1.15 ± 0.20 cm) and thinnest in Superex (0.48 ± 0.17
cm). Variations in leaf length, leaf width, pseudostem length has also been observed in Tunisian (Azoom et al., 2) and Indian onion (Solanki et al., 15). Highest average bulb weight was observed in PWF (75.99 ± 8.60 g) and lowest in Red Creole2 (25.85 ± 4.44 g). Mallor et al. (7) reported a bulb weight range of 19.1
Genotype Status PH (cm) NOL (cm) LL (cm) LW (cm) PsL (cm) PsW (cm)JNDWO85 OPV 56.87 ± 3.21 9.00 ± 0.72 40.87 ± 2.66 0.89 ± 0.04 13.47 ± 0.23 1.39 ± 0.17Arka Kirthiman Hybrid 51.20 ± 1.40 7.40 ± 0.20 38.40 ± 2.71 0.81 ± 0.02 12.67 ± 0.64 0.98 ± 0.02Pusa Madhavi OPV 56.67 ± 3.16 9.33 ± 0.31 42.47 ± 1.22 1.07 ± 0.05 12.80 ± 1.06 1.66 ± 0.12L28 OPV 55.13 ± 1.29 9.60 ± 0.20 40.73 ± 1.85 0.91 ± 0.03 13.60 ± 0.40 1.41 ± 0.06ALR OPV 51.73 ± 0.99 7.60 ± 0.53 40.20 ± 2.91 0.85 ± 0.03 11.47 ± 0.61 1.12 ± 0.03ADR OPV 51.27 ± 1.60 7.20 ± 0.87 38.13 ± 1.81 0.85 ± 0.07 11.07 ± 0.31 1.04 ± 0.03L782 OPV 48.73 ± 2.00 8.27 ± 0.42 35.73 ± 1.10 0.87 ± 0.05 11.20 ± 0.20 1.15 ± 0.03Black Gold OPV 47.27 ± 1.50 7.60 ± 0.42 33.53 ± 1.63 0.83 ± 0.05 11.27 ±0.42 1.06 ± 0.03106BS2 BL 50.93 ± 1.10 8.73 ± 0.31 38.13 ± 1.01 0.86 ± 0.03 11.07 ± 0.42 1.49 ± 0.05106BS10 BL 48.87 ± 1.30 8.27 ± 0.31 34.20 ± 1.00 0.83 ± 0.02 9.87 ± 1.01 1.35 ± 0.03Krishna OPV 46.87 ± 0.42 7.20 ± 0.20 33.33 ± 0.42 0.70 ± 0.06 10.73 ± 0.76 1.24 ± 0.04VL Pyaz OPV 45.47 ± 1.97 7.00 ± 0.20 32.87 ± 0.64 0.75 ± 0.02 8.93 ± 0.70 1.12 ± 0.02383BS10 BL 47.47 ± 0.70 7.07 ± 0.50 31.67 ± 2.25 0.67 ± 0.06 10.40 ± 0.72 1.02 ± 0.10Sukhsagar2 Landrace 45.87 ± 2.25 7.60 ± 0.69 34.40 ± 0.92 0.81 ± 0.05 9.20 ± 1.40 1.16 ± 0.13Mean 52.30 8.43±0.99 38.63 0.90 11.65 1.26SEm 0.682 0.130 0.554 0.015 0.226 0.029CV (%) 9.93 11.76 10.93 13.39 14.77 17.72
OPV = Open pollinated variety; BL = Breeding linePH = Plant height; NOL = No of leaves; LL = Leaf length; LW = Leaf width; PsL = Pseudostem length; PsW = Pseudostem width
Table 3. Characterization of onion accessions based on bulb and yield related traits.
Genotype P (cm) E (cm) N (cm) ABW (g) FW (kg) MY (t/ ha) GY (t/ ha)F1 Hybrid-1 3.61 ± 0.10 5.23 ± 0.48 0.67 ± 0.14 48.35 ± 6.43 0.65 ± 0.08 20.15 ± 3.81 25.40 ± 3.95F1 Hybrid-2 3.64 ± 0.21 5.10 ± 0.26 0.72 ± 0.02 49.85 ± 8.63 0.49 ± 0.15 23.63 ± 4.11 26.67 ± 2.78XP-Red 3.82 ± 0.25 5.05 ± 0.30 0.78 ± 0.10 55.97 ± 5.31 0.58 ± 0.09 29.63 ± 6.11 32.30 ± 7.33Arka Kalyan 3.68 ± 0.14 4.92 ± 0.23 0.75 ± 0.15 53.39 ± 6.08 0.41 ± 0.08 23.26 ± 2.38 30.44 ± 3.86Prema 178 3.30 ± 0.28 5.03 ± 0.12 0.63 ± 0.12 46.13 ± 2.07 0.52 ± 0.16 20.07 ± 2.06 23.59 ± 1.70Red Creole1 3.54 ± 0.34 5.05 ± 0.57 0.59 ± 0.10 39.28 ± 6.74 0.22 ± 0.05 13.78 ± 4.37 17.56 ± 4.06Black Crown 3.46 ± 0.30 5.09 ± 0.33 0.76 ± 0.18 41.93 ± 4.45 0.57 ± 0.06 17.48 ± 3.69 21.26 ± 2.23Indam 4 3.47 ± 0.08 4.70 ± 0.15 0.74 ± 0.04 39.66 ± 3.97 0.43 ± 0.06 17.85 ± 0.84 21.11 ± 1.18KSP1191 3.61 ± 0.19 4.87 ± 0.09 0.81 ± 0.08 44.79 ± 3.79 0.51 ± 0.08 22.89 ± 1.94 25.78 ± 1.76Phursungi Local 3.67 ± 0.27 5.02 ± 0.18 0.75 ± 0.15 53.06 ± 6.84 0.43 ± 0.08 25.70 ± 5.68 28.96 ± 4.56Hisar-3 3.61 ± 0.19 5.03 ± 0.09 0.76 ± 0.04 62.43 ± 4.87 0.71 ± 0.28 29.93 ± 4.85 33.70 ± 5.15KRR 3.57 ± 0.23 5.22 ± 0.21 1.02 ± 0.03 48.58 ± 4.45 0.35 ± 0.04 19.41 ± 1.85 24.07 ± 1.30Bhima Kiran 3.70 ± 0.22 4.99 ± 0.17 0.78 ± 0.01 45.62 ± 3.77 0.45 ± 0.09 22.37 ± 6.11 25.26 ± 5.33BSS-262 3.64 ± 0.44 4.73 ± 0.27 0.49 ± 0.13 34.34 ± 2.05 0.41 ± 0 .15 10.74 ± 3.80 15.33 ± 5.05NP-4 3.53 ± 0.28 4.89 ± 0.23 0.86 ± 0.08 41.78 ± 3.56 0.32 ± 0.08 15.63 ± 4.03 19.78 ± 4.44Punjab Naroha 3.72 ± 0.30 5.08 ± 0.16 0.83 ± 0.15 57.96 ± 4.56 0.61 ± 0.11 19.56 ± 2.04 29.19 ± 3.24Hisar-2 3.73 ± 0.17 5.57 ± 0.25 0.82 ± 0.07 59.95 ± 6.03 0.82 ± 0.16 17.70 ± 5.21 27.78 ± 7.64

230
Indian Journal of Horticulture, June 2018
Genotype P (cm) E (cm) N (cm) ABW (g) FW (kg) MY (t/ ha) GY (t/ ha)Bhima Shweta 4.39 ± 0.18 5.27 ± 0.19 0.82 ± 0.13 61.26 ± 2.55 0.47 ± 0.09 27.41 ± 0.56 31.93 ± 0.71PWR 4.25 ± 0.26 5.47 ± 0.21 0.87 ± 0.13 55.64 ± 9.48 0.63 ± 0.17 29.70 ± 9.62 33.11 ± 9.37PWF 4.23 ± 0.52 5.92 ± 0.71 0.77 ± 0.24 75.99 ± 8.60 0.69 ± 0.14 46.74 ± 8.08 48.96 ± 7.32Udaipur Local 3.69 ± 0.13 5.08 ± 0.09 0.83 ± 0.13 56.09 ± 3.45 0.41 ± 0.10 28.15 ± 2.02 30.89 ± 2.56Red Creole2 2.91 ± 0.09 4.37 ± 0.38 0.51 ± 0.15 25.85 ± 4.44 0.41 ± 0.03 10.26 ± 3.64 13.48 ± 3.16Red Creole3 3.31 ± 0.01 4.52 ± 0.13 0.85 ± 0.03 32.47 ± 1.80 0.43 ± 0.31 8.52 ± 1.45 13.33 ± 0.22Pusa Red 3.66 ± 0.06 5.27 ± 0.16 0.93 ± 0.14 57.10 ± 5.03 0.79 ± 0.28 28.00 ± 4.70 31.78 ± 4.26AFW 3.53 ± 0.23 5.13 ± 0.19 0.84 ± 0.08 60.67 ± 7.59 0.58 ± 0.10 30.81 ± 1.64 34.74 ± 3.80Sukhsagar1 4.52 ± 0.17 4.92 ± 0.13 0.68 ± 0.12 57.78 ± 0.83 0.36 ± 0.10 19.19 ± 8.74 21.41 ± 9.50Sel. 325 3.85 ± 0.14 4.90 ± 0.21 0.83 ± 0.12 66.13 ± 6.29 0.79 ± 0.31 27.26 ± 3.83 33.33 ± 4.08Bhima Shakti 3.94 ± 0.20 5.18 ± 0.07 0.82 ± 0.14 55.63 ± 4.56 0.56 ± 0.23 30.07 ± 2.58 31.63 ± 1.92Lucifer 3.48 ± 0.23 5.24 ± 0.25 0.71 ± 0.03 43.65 ± 3.28 0.39 ± 0.12 17.63 ± 4.58 21.70 ± 2.48106BS3 4.47 ± 0.09 5.05 ± 0.27 1.04 ± 0.04 60.05 ± 5.43 0.73 ± 0.17 30.22 ± 6.05 35.48 ± 6.28Superex 4.10 ± 0.50 5.26 ± 0.20 0.48 ± 0.17 65.26 ± 7.12 0.23 ± 0.03 32.89 ± 10.34 36.89 ± 9.89Pioneer 4.03 ± 0.13 4.68 ± 0.30 0.66 ± 0.24 40.84 ± 2.19 0.30± 0.07 13.85 ± 3.25 17.04 ± 2.53BSS258 3.48 ± 0.40 4.81 ± 0.12 0.50 ± 0.06 42.61 ± 1.86 1.47 ± 0.16 18.96 ± 6.23 21.48 ± 5.21N-2-4-1 3.94 ± 0.07 5.13 ± 0.25 0.77 ± 0.05 61.54 ± 1.72 0.61 ± 0.25 29.11 ± 3.53 34.81 ± 4.10PRO-6 3.96 ± 0.34 5.11 ± 0.09 0.75 ± 0.10 57.75 ± 8.16 0.51 ± 0.09 25.04 ± 6.49 32.00 ± 4.67Early Grano 3.81 ± 0.35 4.49 ± 0.04 0.68 ± 0.07 40.94 ± 3.61 0.41 ± 0.16 8.81 ± 1.61 17.70 ± 1.68Bhima Shubhra 4.05 ± 0.17 5.10 ± 0.29 0.92 ± 0.26 60.27 ± 2.11 0.53 ± 0.13 27.19 ± 3.59 33.78 ± 2.91Sel.126 4.08 ± 0.37 5.12 ± 0.42 0.83 ± 0.06 54.06 ± 2.07 0.49 ± 0.05 20.59 ± 7.40 27.93 ± 5.65Yellow Grano 4.51 ± 0.42 4.88 ± 0.25 0.66 ± 0.05 55.71 ± 9.23 0.41 ± 0.12 21.70 ± 4.78 28.30 ± 4.90Pusa Riddhi 3.93 ± 0.18 4.99 ± 0.02 0.85 ± 0.14 54.90 ± 1.35 0.79 ± 0.16 21.56 ± 6.09 28.22 ± 3.15Juni 3.58 ± 0.23 4.57 ± 0.29 0.74 ± 0.04 38.67 ± 6.11 0.33 ± 0.07 13.93 ± 4.71 17.63 ± 4.33AKON555 3.84 ± 0.33 6.00 ± 0.35 0.98 ± 0.34 70.87 ± 1.15 1.37 ± 0.27 32.00 ± 1.90 37.78 ± 4.46KSP1121 3.97 ± 0.27 5.09 ± 0.22 0.71 ± 0.19 54.44 ± 6.06 0.57 ± 0.14 25.41 ± 3.98 29.70 ± 3.68GWO-1 3.70 ± 0.05 5.04 ± 0.16 0.82 ± 0.05 48.63 ± 9.45 0.46 ± 0.13 26.15 ± 7.90 29.41 ± 7.83JNDWO85 3.79 ± 0.36 4.70 ± 0.32 0.75 ± 0.08 48.19 ± 6.08 0.57 ± 0.38 19.78 ± 3.27 23.78 ± 4.59Arka Kirthiman 3.99 ± 0.14 4.34 ± 0.27 0.64 ± 0.16 39.19 ± 9.37 0.41 ± 0.19 11.78 ± 5.61 17.41 ± 5.95Pusa Madhavi 4.33 ± 0.17 5.08 ± 0.33 0.88 ± 0.31 64.34 ± 5.87 0.67 ± 0.17 25.85 ± 8.53 32.07 ± 7.81L28 3.72 ± 0.37 4.82 ± 0.47 0.80 ± 0.19 45.23 ± 5.77 0.64 ± 0.16 16.89 ± 6.22 21.11 ± 5.39ALR 4.04 ± 0.11 5.11 ± 0.47 0.91 ± 0.06 52.74 ± 3.39 0.59 ± 0.34 23.85 ± 5.75 28.22 ± 6.19ADR 3.47 ± 0.14 4.96 ± 0.47 0.61 ± 0.22 44.66 ± 8.48 0.32 ± 0.03 18.07 ± 5.56 20.52 ± 3.76L782 3.82 ± 0.56 4.66 ± 0.30 0.87 ± 0.19 51.71 ± 4.78 0.59 ± 0.22 23.19 ± 6.93 27.26 ± 7.25Black Gold 3.34 ± 0.45 4.59 ± 0.66 0.63 ± 0.07 36.01 ± 7.71 0.37 ± 0.13 8.74 ± 7.33 12.37 ± 6.37106BS2 4.09 ± 0.34 4.99 ± 0.27 1.15 ± 0.20 44.11 ± 6.35 0.70 ± 0.05 11.48 ± 3.99 17.48 ± 2.69106BS10 4.01 ± 0.30 4.32 ± 0.48 1.10 ± 0.15 43.06 ± 8.35 1.02 ± 0.29 6.22 ± 6.74 16.52 ± 7.92Krishna 3.39 ± 0.20 4.85 ± 0.29 0.82 ± 0.06 40.61 ± 4.60 0.43 ± 0.23 10.89 ± 2.70 15.22 ± 2.92VL Pyaz 3.37 ± 0.19 4.96 ± 0.54 0.76 ± 0.22 44.37 ± 6.50 0.28 ± 0.18 5.71 ± 2.06 8.29 ± 2.81383BS10 4.19 ± 0.31 4.44 ± 0.17 0.96 ± 0.31 43.07 ± 6.02 0.49 ± 0.04 7.04 ± 3.68 12.37 ± 3.15Sukhsagar2 3.91 ± 0.24 4.44 ± 0.22 0.69 ± 0.03 39.98 ± 4.32 0.37 ± 0.08 12.22 ± 2.69 14.11 ± 1.28Mean 3.79 4.97 0.77 50.26 0.54 20.73 25.33SEm 0.043 0.043 0.018 1.324 0.030 1.069 1.053CV (%) 8.17 6.68 17.88 20.06 42.31 39.28 31.65
P = Polar diameter; E = Equatorial diameter; N = Neck thickness; ABW = Av bulb wt; FW = Foliage wt; MY = Marketable yield; GY = Gross yield

231
Characterization and Association of Phenotypic and Biochemical Traits in Onion
g to 588.3 g. It is worth to be noted that short day varieties have an average bulb weight of less than 100 g since they mature in 120-150 days whereas long day varieties take more than 240 days to mature. PWF (46.74 ± 8.08 t/ha) was the high marketable yielder while VL Pyaz (5.71 ± 2.06 t/ha) was the least yielder. Significant differences in onion yield were noted in studies reported from India (Solanki et al., 15), Spain (Mallor et al., 7) and Tunisia (Azoom et al., 2). High coefficient of variation was observed in gross yield and marketable yield which implies a wider variability in onion genotypes assessed. Due to the continuous onion cultivation by the farmers for the last 5000 years and its adaptation, onion, which is predominantly a long day type, got converted into short day type onion for cultivation in India. It may be said that short day onions show greater genetic diversity because they have been maintained as landraces and open pollinated cultivars over a wide geographic area. Based on microsatellite analysis, it has been observed that short day onions form a separate group from long day onion and it was hypothesized that Indian region may have potential to provide novel germplasm resources.
Total soluble solids in all genotypes varied significantly with an overall mean of 11.52°B (Table 4). Maximum TSS was recorded in 106BS2 (15.30 ± 3.03°B) and minimum in Superex (7.03 ± 0.25°B). Soluble solid content (SSC) or TSS is one of the important quality factor that determines storage
life, pungency and firmness (Sinclair et al., 13). The reported TSS values were greater than reported: 8.63-11.83 (Solanki et al., 15), 5.8-12.8 (Mallor et al., 7), 6.8-12.3 (Vagen and Slimestad, 16), 11.3-13.3 (Dhumal et al., 3), 5.67-10.98 (Sharma et al., 12), and less than 7.2-15.8 reported by Jaime et al. (5). Genotypes also depicted significant variation in the bulb dry matter content and the highest percentage of dry matter was noticed in Arka Kalyan (15.70 ± 0.57%) and lowest in Superex (4.08 ± 0.57%). Sharma et al. (12) also reported dry weight in 18 Korean cultivars ranging from 5.67-10.98%. The amount of pyruvic acid yielded enzymatically upon homogenization is an appropriate measure of the action of alliinase on the flavour precursors and has been proven to be associated with perceived onion pungency (Anthon and Barrett, 1). In addition, pyruvic acid (PA) content also plays a significant role in storage of onion and is associated with dormancy breakage. Pyruvic acid (PA) content of the bulbs varied from 2.57 µmol/ ml to 6.32 µmol/ ml with a mean of 3.48 µmol/ ml. Pyruvic acid was highest in Red Creole3 (6.32 ± 0.17 µmol/ ml) and minimum in Superex (2.57 ± 0.06 µmol/ ml). On the basis of guidelines used by sweet onion industry, onions have been classified as low pungency/sweet (0-3 µmol/ g FW), medium pungency (3-7 µmol/ g FW) and high pungency (above 7 µmol/ g FW) (Dhumal et al., 3). Based on this criterion, all the genotypes were categorized under low and medium pungency
Table 4. Characterization of onion accessions based on biochemical traits.
Genotype TSS (°B) DM (%) PA (µmol/ ml) TPC (mg/ g FW)F1 Hybrid-1 11.73 ± 0.25 13.34 ± 0.68 5.05 ± 0.06 22.75± 0.73F1 Hybrid-2 11.73 ± 0.67 12.00 ± 1.59 3.90 ± 0.04 31.51 ± 2.68XP-Red 9.01 ± 0.61 10.01 ± 0.34 4.77 ± 0.08 35.78 ± 0.50Arka Kalyan 11.70 ± 1.06 15.70 ± 0.57 3.71 ± 0.01 19.66 ± 2.81Prema 178 12.13 ± 0.40 12.26 ± 0.61 3.76 ± 0.01 21.67 ± 2.85Red Creole1 9.07 ± 1.59 11.70 ± 2.51 3.70 ± 0.04 30.83 ± 0.62Black Crown 13.90 ± 3.21 13.68 ±0.28 3.86 ± 0.05 24.76 ± 0.99Indam 4 11.27 ± 0.83 11.96 ± 0.44 4.52 ± 0.47 19.43 ± 1.31KSP1191 10.93 ± 1.01 12.91 ± 0.19 4.85 ± 0.07 22.80 ± 1.53Phursungi Local 14.00 ± 3.70 12.18 ± 0.67 3.73 ± 0.07 19.25 ± 2.28Hisar-3 11.70 ± 0.17 14.10 ± 0.99 3.83 ± 0.05 28.39 ± 0.73KRR 11.89 ± 0.18 14.84 ± 0.55 3.90 ± 0.04 17.84 ± 2.39Bhima Kiran 11.23 ± 0.50 13.05 ± 0.86 3.52 ± 0.01 16.97 ± 1.02BSS-262 10.87 ± 0.35 11.55 ± 0.96 3.97 ± 0.02 20.10 ± 0.90NP-4 11.17 ± 0.42 12.03 ± 0.15 3.68 ± 0.02 23.81 ± 0.90Punjab Naroha 11.13 ± 0.91 13.39 ± 1.02 5.03 ± 0.11 23.56 ± 0.99Hisar-2 11.67 ± 0.29 12.20 ± 0.61 5.06 ± 0.02 27.17 ± 0.90

232
Indian Journal of Horticulture, June 2018
Genotype TSS (°B) DM (%) PA (µmol/ ml) TPC (mg/ g FW)Bhima Shweta 12.20 ± 0.26 12.34 ± 1.03 3.43 ± 0.07 31.39 ± 0.10PWR 11.53 ± 0.29 11.02 ± 1.81 3.40 ± 0.02 30.53 ± 0.94PWF 12.00 ± 0.72 10.27 ± 0.56 3.47 ± 0.07 23.42 ± 0.93Udaipur Local 11.83 ± 0.15 11.28 ± 1.32 3.89 ± 0.08 25.56 ± 2.44Red Creole 2 12.37 ± 1.16 13.68 ± 0.28 3.98 ± 0.68 29.94 ± 0.64Red Creole 3 11.23 ± 0.42 11.19 ± 1.71 6.32 ± 0.17 31.12 ± 0.42Pusa Red 10.97 ± 0.76 12.03 ± 0.82 3.78 ± 0.07 28.16 ± 2.82AFW 11.47 ± 0.38 14.50 ± 0.59 5.05 ± 0.02 24.55 ± 2.85Sukhsagar1 10.33 ± 0.85 10.17 ± 0.55 2.77 ± 0.08 25.76 ± 0.54Sel. 325 12.19 ± 1.31 10.98 ± 0.07 3.39 ± 0.08 23.74 ± 1.42Bhima Shakti 12.04 ± 0.37 11.33 ± 1.67 3.13 ± 0.10 22.73 ± 1.22Lucifer 11.47 ± 0.32 9.99 ± 0.02 2.84 ± 0.06 26.34 ± 1.31106BS3 12.17 ± 1.43 10.89 ±0.29 3.93 ± 0.04 33.20 ± 0.84Superex 7.03 ± 0.25 4.08±0.57 2.57 ± 0.06 27.86 ± 0.57Pioneer 9.20 ± 2.00 13.31 ± 0.32 2.98 ± 0.03 27.82 ± 2.53BSS258 11.47± 0.40 9.65 ± 0.75 3.17 ± 0.09 24.21 ± 0.66N-2-4-1 11.00 ± 0.44 11.72 ± 0.42 3.74 ± 0.10 28.42 ± 0.44PRO-6 11.73 ± 0.23 13.37 ± 1.34 3.41 ± 0.04 22.17 ± 1.04Early Grano 11.57 ± 0.21 11.17 ± 0.87 3.22 ± 0.02 21.22 ± 0.50Bhima Shubhra 13.77 ± 3.79 10.64 ± 0.20 3.44 ± 0.11 23.96 ± 1.29Sel.126 13.07 ± 1.31 12.22 ± 0.52 3.43 ± 0.17 26.27 ± 0.62Yellow Grano 8.22 ± 1.61 6.24 ± 0.45 3.25 ± 0.10 27.73 ± 0.24Pusa Riddhi 11.43 ± 0.81 10.45 ± 0.27 4.89 ± 0.03 24.07 ± 0.98Juni 10.75 ± 0.70 9.81 ± 0.82 3.75 ± 0.02 36.96 ± 2.00AKON555 11.50 ± 0.17 11.08 ± 0.77 2.89 ± 0.05 20.73 ± 0.82KSP1121 11.43 ± 0.64 10.43 ± 0.86 3.51 ± 0.01 23.45 ± 1.27GWO-1 11.43 ± 0.35 12.04 ± 0.68 4.73 ± 0.01 25.40 ± 2.17JNDWO85 11.67 ± 0.12 11.37 ± 1.28 3.66 ± 0.03 26.88 ± 1.11Arka Kirthiman 13.73 ± 1.78 12.54 ± 0.76 3.40 ± 0.01 22.42 ± 1.45Pusa Madhavi 10.77 ± 0.61 12.39 ± 0.27 4.85 ± 0.10 26.63 ± 1.32L28 11.80 ± 0.52 10.28 ± 0.93 3.88 ± 0.03 21.68 ± 0.44ALR 11.33 ± 0.21 11.52 ± 0.65 3.59 ± 0.02 27.91 ± 1.02ADR 9.90 ± 0.89 9.66 ± 0.08 3.36 ± 0.03 24.89 ± 1.20L782 13.47 ± 3.50 12.10 ± 0.45 4.77 ± 0.02 27.18 ± 1.80Black Gold 12.10 ± 0.26 9.74 ± 0.16 3.79 ± 0.03 24.82 ± 1.82106BS2 15.30 ± 3.03 11.48 ± 1.26 3.94 ± 0.02 23.17 ± 1.21106BS10 11.37 ± 0.67 10.47 ± 1.58 4.88 ± 0.03 26.02 ± 0.30Krishna 11.60 ± 0.17 9.61 ± 1.21 3.24 ± 0.02 23.90 ± 1.57VL Pyaz 11.23 ± 0.29 10.71 ± 1.43 3.14 ± 0.01 30.04 ± 0.47383BS10 12.53 ± 0.91 9.53 ± 1.74 3.81 ± 0.04 21.00 ± 0.92Sukhsagar2 11.06 ± 0.23 9.44 ± 1.96 3.37 ± 0.01 27.11 ± 0.70Mean 11.52 11.44 3.84 25.45 SEm 0.176 0.246 0.094 0.547 CV (%) 11.68 16.4 18.7 16.37
TSS = Total Soluble Solids; DM = Dry matter; PA = Pyruvic acid; TPC = Total phenolic content
233
Characterization and Association of Phenotypic and Biochemical Traits in Onion
with majority under medium pungency. Popularity for low pungency onion has increased (Dhumal et al., 3) which makes it necessary to breed for low pungency onions for export market. In India, medium to high pungency onions are preferred for curry preparation. Mallor et al. (7) reported a highly pungent line, BGHZ-1354 having a pungency value of 18.1 µmol/ g FW which is higher than any of the genotype reported in our studies. McCallum et al. (8) reported average concentration of 4.66 µmol/ml in mild pungent and 8.89 µmol/ml in pungent onion. According to this criterion, 91% of the genotypes studied can be considered as mild onions that is more than percent (15%) reported by Mallor et al. (7). The mean CV of the pungency (18.7%) was less than 50% which has been reported by Mallor et al. (7) but equal to 21.3% CV reported by Yoo et al. (17). Phenolic components serve as antioxidant, anti-mutagenic, and are scavenging agents on free radicals, thereby, preventing pathologies such as cancer and cardiovascular heart disease (Sharma et al., 12). Besides, the health enhancing properties of phenolic compounds, its role in systemic acquired resistance (SAR) and use as biochemical markers for fungal and bacterial resistance in onion and other plant species is well known. The total phenolic content (TPC) of the leaves ranged from 16.97 mg/ g FW to 36.96 mg/ g FW with an average total phenolic content of 25.46 mg/ g FW. These results are in agreement with the findings of Sharma et al. (12) where significant variation for total phenolic contents was observed.
Onion genotypes were characterized for nine quality traits i.e., waxiness (WX), general bulb shape (BS), basic colour of dry skin (BC), adherence of skin (AS), firmness of flesh (FM), colour of epidermis of fleshy scale (CE), position of root disc (PA), predominant number of axes (PNA) and bulb cross section (BCS). Waxiness was noticed only in 22.4% genotypes and 77.6% were non-waxy. Similarly, 39.6%, 37.9%, 19.0%, and only 3.4% genotypes, respectively had flat globe, globe, oval, and flat types of bulb shape. Most of the genotypes were pink coloured (27.6%) followed by dark red (25.9%), white (20.7%), light red (19.0%), brown (5.2%), and yellow (1.7%). Maximum number of genotypes had medium (89.6%) adherence of skin followed by weak (6.9%), and strong (3.4%). 87.9% genotypes were found with strong bulb firmness and only 12.1% had medium firmness. Likewise, genotypes with white (19.0%), yellowish (6.9%) and purplish (74.1%) type of epidermis were also recorded. Majority of the genotypes (67.2%) were noticed to have surface type position of root disc and 32.7%
genotypes depicted exerted type of root disc. Single axis bulbs were maximum and were recorded in 58.6 % genotypes whereas 41.4% genotypes were observed to have multiple axis. 94.8% genotypes were categorized as having symmetrical bulbs and only 5.2% were categorized with asymmetrical bulbs. Single centeredness, a desirable trait in onion improvement is also a trait that is associated with bulb firmness and better storability. Considerable variability in foliage traits, bulb traits, adherence of skin and predominant number of axis has been reported by Solanki et al. (15).
Correlation coefficient studies give reliable evidence on nature, magnitude, and direction of selection when assorting a novel plant type. Plant height was very highly and significantly correlated with the number of leaves, leaf length, leaves width, pseudostem length, pseudostem width, average bulb weight and gross yield with the positive direction (Fig. 1). Solanki et al. (15) also noticed similar association with number of leaves. Bulb polar diameter correlated very highly significantly with average bulb weight and gross yield in positive direction. Surprisingly, polar diameter also correlated significantly but negatively with bulb dry matter. Average bulb weight, gross yield and marketable yield correlated positively and very highly significantly with equatorial diameter. Foliage weight demonstrated positive and very highly significantly correlation with number of leaves and pseudostem width. Gross yield of the onion positively and very highly significantly correlated with plant height and other morphological traits, average bulb weight, and marketable yield. Marketable yield expressed correlation positively and very highly significantly with plant height, leaf length, leaf width, pseudostem width, equatorial diameter, average bulb weight, and gross yield of onion. Likewise, correlation with gross and marketable yield was also reported by Solanki et al. (15).
Total soluble solids correlated positively and very highly significantly with dry matter of the bulb but negatively and significantly with total phenolic content. Significant and positive genetic and phenotypic correlations have been observed between soluble solids content (SSC), dry matter (DM %), pungency and onion-induced in vitro antiplatelet activity (OIAA) (Galmarini et al., 4). Similarly, SSC is highly correlated with dry matter content (Nieuwhof et al., 10; Sinclair et al., 13). Unambiguously, dry matter content of the bulb correlated positively and very highly significantly with total soluble solids. Similarly, dry matter content correlated with leaf width, pseudostem width, and pyruvic acid content. However, dry matter also showed

234
Indian Journal of Horticulture, June 2018
Fig. 1. Pearson’s correlation coefficient analysis among various morphological and biochemical traits of onion (a) All correlation values (b) significant correlations.
(b)
(a)
235
Characterization and Association of Phenotypic and Biochemical Traits in Onion
significant correlation with polar diameter of the bulb but in negative direction. McCollum (9) reported a negative genetic correlation between SSC and bulb size. Pyruvic acid content showed highly significant correlation only with the bulb dry matter. Total phenolic content of the leaves correlated significantly but negatively with total soluble solids. Pyruvate concentrations correlated positively with perceived onion pungencies (Schwimmer and Guadagni, 11), as well as with total solids and soluble solids content (SSC) (Galmarini et al., 4; McCallum et al., 8; Lin et al., 6). Soluble solids content was strongly correlated with onion dry weight: r = 0.95 (Vågen and Slimestad, 16), r = 0.94 (McCallum et al., 8) and r = 0.98 (Jaime et al., 5). The correlation between dry weight content and pyruvate content was found to be quite low (r=0.38) (Vågen and Slimestad, 16). Other authors have also found medium correlation (r from 0.42 to 0.57) (Schwimmer and Guadagni, 11; Lin et al., 6; Galmarini et al., 4). In contrast, Yoo et al. (17) indicated that there was no consistent trend between these traits in four different clones grown at Welsaco. The relationship found in this study may be explained because the compounds responsible for onion pungency also contribute to total dissolved solids. Therefore, in agreement with Lin et al. (6), part of the positive correlation between SSC and pungency is due to the partial identity of the traits.
Present studies showed the existence of considerable genetic variability among all the morphological, biochemical and qualitative traits. It was observed that higher values for most of the traits were recorded in open pollinated varieties than in hybrids which can be explained by the fact that most of the hybrids were exotic in nature and will take time to adapt to our local conditions. A systematic breeding effort at local level is needed to breed high yield hybrids. Significant correlations (p<0.001) between gross yield and most of the morphological traits were observed which will aid in selecting germplasm based on the identified traits. Highly significant correlation between TSS and dry matter, pyruvic acid and dry matter and significant and negative correlation between TSS and TPC were observed. TSS< dry matter, pyruvic acid and phenols are the traits which are of paramount important for breeding onion having high processing ability, storage and resistance to insect pests and diseases. Similarly, recorded genotypes with waxiness can be used for breeding of disease and insect resistant material. These results obtained will augment in identifying key genotypes for introgression of important traits, breeding new germplasm resources and also selecting diverse parents for heterosis breeding programme in short day tropical onion.
REFERENCES1. Anthon, G.E. and Barrett, D.M. 2003. Modified
method for the determination of pyruvic acid with dinitrophenylhydrazine in the assessment of onion pungency. J. Sci. Food Agr. 83: 1210-13.
2. Azoom, A.A.A., Zhani, K. and Hannachi, C. 2014. Performance of eight varieties of onion. Not. Sci. Biol. 6: 220-24.
3. Dhumal, D., Datir, S. and Pandey, R. 2007. Assessment of bulb pungency level in different Indian cultivars of onion (Allium cepa L.). Food Chem. 100: 1328-30.
4. Galmarini, C.R., Goldman, I.L. and Havey, M.J. 2001. Genetic analyses of correlated solids, flavor, and health-enhancing traits in onion (Allium cepa L.). Mol. Genet. Genomics, 265: 543-51.
5. Jaime, L., Martínez, F., Martín-Cabrejas, M.A., Molla, E., López-Andréu, F.J., Waldron, K.W. and Esteban, R.M. 2001. Study of total fructan and fructooligosaccharide content in different onion tissues. J. Sci. Food Agric. 81: 177-82.
6. Lin, M.W., Watson, J.F. and Baggett, J.R. 1995. Inheritance of soluble solids and pyruvic acid content of bulb onions. J. American Soc. Hortic. Sci. 120: 119-22.
7. Mallor Giménez, C., Carravedo Fantova, M., Estopañán Muñoz, G. and Mallor Giménez, F. 2011. Characterization of genetic resources of onion (Allium cepa L.) from the Spanish secondary centre of diversity. Span. J. Agric. Res. 9: 144-55.
8. McCallum, J.A., Grant, D.G., McCartney, E.P., Scheffer, J., Shaw, M.L. and Butler, R.C. 2001. Genotypic and environmental variation in bulb composition of New Zealand adapted onion (Allium cepa) germplasm. New Zealand J. Crop Horti. Sci. 29: 149-58.
9. McCollum, G.D. 1968. Heritability and genetic correlation of soluble solids, bulb size and shape in white sweet Spanish onion. Canadian J. Genet. Cytol. 10: 508-14.
10. Nieuwhof, M., De Bruyn, J. W. and Garretsen, F. 1973. Methods to determine solidity and dry matter content of onions (Allium cepa L.). Euphytica, 22: 39-47.

236
Indian Journal of Horticulture, June 2018
11. Schwimmer, S. and Guadagni, D.G. 1962. Relation between olfactory threshold concentration and pyruvic acid content of onion juice. J. Food Sci. 27: 94-97.
12. Sharma, K., Assefa, A.D., Kim, S., Ko, E.Y., Lee, E.T. and Park, S.W. 2013. Evaluation of total phenolics, flavonoids and antioxidant activity of 18 Korean onion cultivars: a comparative study. J. Sci. Food Agric. 94: 1521-29.
13. Sinclair, P.J., Blakeney, A.B. and Barlow, E.W.R. 1995. Relationships between bulb dry matter content, soluble solids concentration and non-structural carbohydrate composition in the onion (Allium cepa). J. Sci. Food Agric. 69: 203-09.
14. Singleton, V.L. and Rossi, J.A. 1965. Colorimetry of total phenolics with phosphomolybdic-
phosphotungstic acid reagents. American J. Enol. Vitic. 16: 144-58.
15. Solanki, P., Jain. P.K., Prajapati, S., Raghuwanshi, N., Khandait, R.N. and Patel, S. 2015. Genetic analysis and character association in different genotypes of onion (Allium cepa L.). Int. J. Agric. Environ. Biotechnol. 8: 783-93.
16. Vågen, I.M. and Slimestad, R. 2008. Amount of characteristic compounds in 15 cultivars of onion (Allium cepa L.) in controlled field trials. J. Sci. Food Agric. 88: 404-11.
17. Yoo, K.S., Pike, L., Crosby, K., Jones, R. and Leskovar, D. 2006. Differences in onion pungency due to cultivars, growth environment, and bulb sizes. Sci. Horti. 110: 144-49.
Received : November, 2017; Revised : May, 2018; Accepted : May, 2018

237
Indian J. Hort. 75(2), June 2018: 237-244
INTRODUCTION Eggplant (Solanum melongena.L) is an important
vegetable crop of significant economic importance and its fruits are consumed worldwide. It is believed to have originated in warmer region of India and China .The demand for this vegetable has increased owing to its use in diverse culinary preparations. The F1 hybrids have been preferred well than the varieties because they exhibit heterosis for various agronomic traits including resistance to pests and disease. European catalogue of registered varieties have >75% of eggplant varieties of F1 hybrids and the well developed vegetable industry of Japan , Netherland, the USA and Canada have > 90% varieties of hybrid origin .In eggplant, commercial hybrids are produced by hand emasculation and pollination which results in higher seed cost. One of the strategy to reduce seed cost is to use male sterile lines as female parent which require only pollination thereby avoiding emasculation. A functional cytoplasmic male sterility (CMS) has been reported in eggplant. Here, fresh or stored pollen can be used for hybrid seed production. Pollen grain which carries male genetic material plays important role in compatible pollination and fruit set. The germination rate of pollen grains and rate of pollen tube growth determines the pollen vigor.
In vitro pollen germination is the most widely used technique for testing the viability of pollen grains in breeding programs. This valuable tool also
addresses basic questions in sexual reproduction such as pollen preservation, pollen selection, pollen transformation, etc. The media used for in vitro pollen germination of different species range from simple sucrose/boric acid media to complex media containing polyethylene glycol), EACA and various amino acids etc Brewbaker and Kwack (1) have developed a pollen germination medium which was found suitable for more than 86 plant species.
Earlier attempts to germinate eggplant pollen in nutrient medium were not successful. The highest in vitro pollen germination of 10.8 % and 66 % in vivo pollen germination was reported by Franca et al. (2). Standardization of in vitro pollen germination was earlier attempted by Khan and Perveen (8) and Guler et al. (5). However, the pollen germination achieved by them was less than 50 per cent and it was also mentioned that even the germinated pollen burst. These reports clearly indicated that there is no reliable in vitro pollen germination protocol to test the viability of eggplant available. The requirements for pollen germination under in vitro condition would reveal information about the different constituents, temperature etc. which in turn may reflect the nutrient status of the stigmatic surface of respective species. With this rationale, this study was conducted to standardize in vitro pollen germination medium for Solanum melongena and its wild species (S. torvum, S. khasianum, S. trilobatum and S. surretance). These wild species are important source for shoot borer resistance. Having this rationale, both staining and in vitro pollen germination for eggplant and its wild species have been standardized.
Development of pollen germination medium to test pollen viability of eggplant and its wild species
P. Jayaprakash*, Sheeba D, Vikas, V.K., Sivasamy. M, and T. Sabesan**
ICAR-Indian Agricultural Research Institute, Regional Station, Wellington 643 231, Tamil Nadu
ABSTRACTIn this study, we report in vitro pollen germination medium (PGM) for the egg plant and four of its wild
species belonging to tertiary gene pool viz., Solanum torvum, S. khasianum, S. trilobatum and S. surrettence. The medium developed by Brewbaker and Kwack has been modified and improved with addition of poly ethylene glycol, ɛ-amino caproic acid etc which supported over 78 % pollen germination and pollen tube growth of these species. The complete pollen germination medium for eggplant consists of 20 % maltose + 250 mg l-1
Boric acid + 300 mg l-1 Calcium nitrate + 15% PEG 4000 + 750 mg l-1 EACA + 0.5-1% agar at 25 ºC température for 3h of incubation. During the study, pollen sterility of 8-12% was observed at flowering period invariably in all Solanum species.Key words: Brinjal, S. melongena, wild species, in vitro pollen germination.
*Corresponding author's E-mail: [email protected]**Department of Genetics and Plant Breeding, Faculty of Agriculture, Annamalai University, Annamalai Nagar 608 002, Tamil Nadu
DOI : 10.5958/0974-0112.2018.00041.5

238
Indian Journal of Horticulture, June 2018
MATERIALS AND METHODSThe study was conducted at Indian Agricultural
Research Institute (IARI) Regional Station, Wellington, Tamil Nadu, India during 2012-2016. Seeds of Annamalai variety eggplant was collected from Annamalai University, were grown at temperature range of 15 to 25ºC and pollen was collected from freshly opened flowers.
The eggplant pollen viability is tested by Fluorochromatic Reaction (FCR) .The fluorescein diacetate (FDA) (2mg/ml) dissolved in acetone solution was used. Using above pollen extracting method, pollen grains were mounted on FDA solution. The bright green or yellowish green fluorescence pollen grains are viable and non viable grains fail to fluoresce brightly. Pollen viability was tested at weekly interval during flowering period. Pollen grains were collected from freshly opened flower in the morning at 9.00AM. Since the eggplant pollens are sticky, it is treated with few drops of hexane solution and allowed for drying on slide. This dried pollen is handled carefully using needle and gently tapped on the medium for their germination studies. To standardize pollen germination medium, different kinds of media were prepared with different compositions including diverse level of maltose, polyethylene glycol (PEG) 4000, boric acid, calcium nitrate, EACA etc. These experiments were performed in complete randomized design with five replications.
In vitro pollen germination medium(PGM)was prepared following Brewbaker and Kwack (1). In this study, maltose was used as osmoticum instead of sucrose. In a preliminary investigation, media having BK salts at different concentrations of maltose (18, 19, 20, 21 and 22%) and/or polyethylene glycol 4000 (13, 14, 15, 16 and 17%) were screened and the medium with appropriate constituents for perfect osmoticum. Medium was made in Falcon tube consists 20% maltose, 15% of PEG 4000, 50 to 150 mgl−1 of Boric acid and 350 to 450 mgl−1 of Calcium nitrate. After confirming the exact osmoticum (20%) and PEG 4000 (15%) concentration, the combined effect of boric acid (50, 75, 100, 125 and 150 mgl-1) and calcium nitrate (200, 300, 400, 500 and 600 mgl-1) at different concentration were studied. The medium selected from the above was modified with EACA (200, 225, 250, 275 and 300 mgl−1) and tryptone (30,40,50,60,70 mgl−1) to fine tune pollen tube growth. The medium was placed on the petriplate using PGM droplet technique (Jayaprakash et al., 7)
Effect of pH (4, 4.5, 5, 5.5, 6, 6.5, 7 and 7.5) and temperature (21,22, 23, 24,25.26,27,28,29 and 30ºC) on eggplant pollen germination was also tested. The pH of the PGM was adjusted using 1N of HCL and
0.1 N of NaOH and measured using digital pH meter. The temperature was varied in BOD incubator to see its effect upon pollen germination. Stigma position variability was observed within each inflorescence. Four types of stigma arrangement explained by Pradeepa (12) were tested for germination percentage. Flower with stigma below, flower with stigma on the same level, flower with stigma above and flower with stigma much below anther tip were studied. Pollen was extracted from each flower type and pollen germination was calculated.
Fresh pollen grains from eggplant were shed on selected final medium to study its morphology. Eggplant pollens were shed on the medium and kept for incubation. After three and half hours, slide were viewed for germination percentage and fixed using acetic alcohol fixative (glacial acetic acid: ethanol, 1:3 v/v) and viewed under SEM(FEI-Quanta 250). Fixed pollens were mounted on one side of the double sided adhesive carbon conducting tape, and then mounted on the 8mm diameter aluminum stub and viewed (Shyla and Natarajan, 13). Sample surface were observed at different magnification and the images were recorded. SEM operated at an accelerating voltage of 5KV.
Slides were examined with Olympus India fluorescence microscope. Germinated pollen was counted using random field in order to avoid duplication. A total of 200-250 pollens were scored from 5-6 microscopic fields. The average pollen tube length was measured from samples of at least 50-60 pollen grains for each treatment. The pollen having pollen tube length more than its diameter is scored as germinated. The pollen tube length was measured using an ocular micrometer calibrated with stage micrometer 0.01mm.
RESULTS AND DISCUSSIONCurrently, the demand for eggplant (Solanum
melongena L.) in the world has increased and it has some properties that reduce the level of cholesterol. In past, people maintained varieties of their region and nowadays the hybrids of eggplant were preferred than open-pollinated cultivars because of its yield and diseases resistance. Furthermore, the production of hybrid seeds is facilitated by the size of the flower in this species (França et al., 2). The eggplant is important vegetable in India and the demand for this vegetable has increased owing to its diverse use. This vegetable comes in different shape, color and size which can be used in various of culinary preparations. Even in varieties, low fruit set was observed (62%) (Suganiya et al., 14). It is imperative that the quality of pollen determines the fruit set percentage in hybrid eggplant seed production.

239
Development of Pollen Germination Medium to Test Pollen Viability of Eggplant
Though the fruit set reflects the quality of pollen used, there are many quick and easy techniques to assess the viability of pollen reported . FDA flurochrome clearly differentiated the viable and non-viable pollen. The viable pollen fluoresces in dark green colour whereas the non-viable pollens were shriveled and did not stain (Fig. 1). It was invariably observed that sterility of 8-12% was seen during crop season over years. Among the various staining techniques, the FDA staining was found to be the reliable indicator of pollen viability The in vitro pollen germination was considered as the best technique to assess pollen viability of any species .
Sucrose (10-30%) in the initial medium gave inconsistent results with less than 10% pollen germination and bursting (data not shown) and the medium was subsequently substituted with maltose. Based on pollen bursting, initially a medium with 20 % maltose +100 mg l −1 boric acid + 14 % PEG 4000+ 300 mgl −1 calcium nitrate + 100 mgl −1 magnesium sulfate + 200 mgl −1 potassium nitrate was selected. Among different maltose concentrations (18, 19,….22 per cent) tried, pollen germination was highest at 20% maltose with 47.56% pollen germination with 670 µm after 12h (Fig. 2a). There was reduction in pollen germination upto 22% in maltose concentration just above or below 20 per cent. Hence, in further treatments 20% maltose was maintained.
Addition of PEG 4000 reduced the pollen busting and stabilized eggplant pollen germination. Among the PEG 4000 concentration(13,14,15, 16 and 17%) tested, pollen germination was maximum(66.9%) at 15% concentration with mean pollen tube length (PTL) of 794 µm followed by 14% PEG with pollen germination of 62.5% and 600 µm PTL (Fig. 2a).
To culture pollen, different media ranging from simple sucrose media to complex ones containing PEG, amino acids, vitamins etc have been reported (Jayaprakash et al, 7).
In eggplant, Guler et al. (4) used agarified medium containing 12% sucrose, 300 ppm H3BO3 and 300 ppm calcium nitrate and reported high amount of bursting. Khan and Perveen (8) tested the viability of stored pollen in Brewbaker and Kwack (1) medium and concluded that pollen stored at -20 to-30 ºC showed better germination than fresh or pollen stored at 4 oC. In both the reports, there has been no clear cut mention on pollen germination rate, pollen tube length, pollen and pollen tube bursting etc. Later, França et al (2) cultured eggplant pollen in Brewbaker and Kwack medium and observed a maximum of 10.8% pollen germination at 7.5gl-1 sucrose concentration. They emphasized the necessity for more studies concerning the development of a more suitable culture medium to test the viability of in vitro eggplant pollen grains. Also stated that, Brewbaker and Kwack medium might be suited for
Fig. 1. Eggplant pollen : FDA staining showing viable pollen stained darkly (Arrows indicate sterile pollen).
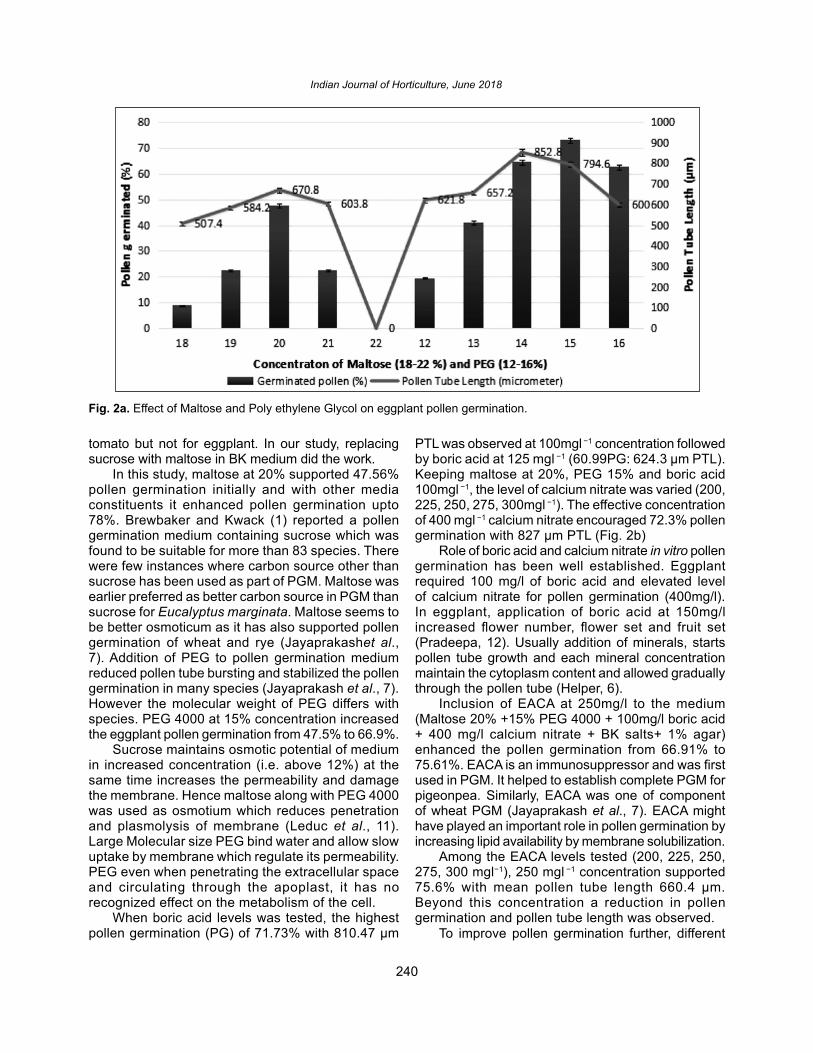
240
Indian Journal of Horticulture, June 2018
tomato but not for eggplant. In our study, replacing sucrose with maltose in BK medium did the work.
In this study, maltose at 20% supported 47.56% pollen germination initially and with other media constituents it enhanced pollen germination upto 78%. Brewbaker and Kwack (1) reported a pollen germination medium containing sucrose which was found to be suitable for more than 83 species. There were few instances where carbon source other than sucrose has been used as part of PGM. Maltose was earlier preferred as better carbon source in PGM than sucrose for Eucalyptus marginata. Maltose seems to be better osmoticum as it has also supported pollen germination of wheat and rye (Jayaprakashet al., 7). Addition of PEG to pollen germination medium reduced pollen tube bursting and stabilized the pollen germination in many species (Jayaprakash et al., 7). However the molecular weight of PEG differs with species. PEG 4000 at 15% concentration increased the eggplant pollen germination from 47.5% to 66.9%.
Sucrose maintains osmotic potential of medium in increased concentration (i.e. above 12%) at the same time increases the permeability and damage the membrane. Hence maltose along with PEG 4000 was used as osmotium which reduces penetration and plasmolysis of membrane (Leduc et al., 11). Large Molecular size PEG bind water and allow slow uptake by membrane which regulate its permeability.PEG even when penetrating the extracellular space and circulating through the apoplast, it has no recognized effect on the metabolism of the cell.
When boric acid levels was tested, the highest pollen germination (PG) of 71.73% with 810.47 µm
PTL was observed at 100mgl −1 concentration followed by boric acid at 125 mgl −1 (60.99PG: 624.3 µm PTL). Keeping maltose at 20%, PEG 15% and boric acid 100mgl −1, the level of calcium nitrate was varied (200, 225, 250, 275, 300mgl −1). The effective concentration of 400 mgl −1 calcium nitrate encouraged 72.3% pollen germination with 827 µm PTL (Fig. 2b)
Role of boric acid and calcium nitrate in vitro pollen germination has been well established. Eggplant required 100 mg/l of boric acid and elevated level of calcium nitrate for pollen germination (400mg/l). In eggplant, application of boric acid at 150mg/l increased flower number, flower set and fruit set (Pradeepa, 12). Usually addition of minerals, starts pollen tube growth and each mineral concentration maintain the cytoplasm content and allowed gradually through the pollen tube (Helper, 6).
Inclusion of EACA at 250mg/l to the medium (Maltose 20% +15% PEG 4000 + 100mg/l boric acid + 400 mg/l calcium nitrate + BK salts+ 1% agar) enhanced the pollen germination from 66.91% to 75.61%. EACA is an immunosuppressor and was first used in PGM. It helped to establish complete PGM for pigeonpea. Similarly, EACA was one of component of wheat PGM (Jayaprakash et al., 7). EACA might have played an important role in pollen germination by increasing lipid availability by membrane solubilization.
Among the EACA levels tested (200, 225, 250, 275, 300 mgl−1), 250 mgl −1 concentration supported 75.6% with mean pollen tube length 660.4 µm. Beyond this concentration a reduction in pollen germination and pollen tube length was observed.
To improve pollen germination further, different
Fig. 2a. Effect of Maltose and Poly ethylene Glycol on eggplant pollen germination.

241
Development of Pollen Germination Medium to Test Pollen Viability of Eggplant
level of tryptone (30,40,50…70mgl −1) was added to the medium consisting of maltose at 20%, PEG 15% and boric acid 100 mgl −1,BK salts, 400 mgl −1calcium nitrate and 250 mgl −1 EACA. Tryptone concentration of 50 mgl −1 showed maximum pollen germination (78.1%) with 602.1 µm pollen tube length (Fig. 2c). Pollen germination in final medium with smooth pollen tube was shown in Fig. 3a & b.
Addition of organic nitrogen source (peptone) in pollen germination medium showed increased pollen germination in wheat. In eggplant PGM, tryptone in lower concentration (50 mg l-1) showed little increase in pollen germination. Along with EACA, tryptone enhanced the pollen germination. So, the selected medium (Maltose 20% +15% PEG 4000 + 100mg/l boric acid + 400 mg/l calcium nitrate + EACA 250mg/l
+ T50 mg/l + 1% agar) was assumed to give same compatibility between the pollen grains and specialized sporophytic surface of stigma. Similarly, PGM has been standardized for four wild Solanaum species viz..Solanum torvum, S. khasianum, S. trilobatum and S. surrettence.
Among temperature tested (21, 22, 23, 24, 25, 26, 27, 28, 29, 30ºC), maximum pollen germination of 76.56% with 624.67 µm pollen tube length was observed at 25ºC. Temperatures either above or below 25ºC reduced both the pollen germination and rate of pollen tube growth. Similarly, maximum pollen germination of 75.47% with 586.98 µm mean pollen tube length was observed.
All medium are incubated at 25ºC and pH 6 throughout the pollen germination studies. Initially,
Fig. 2b. Effect of boric acid and calcium nitrate on in vitro pollen germination of eggplant.
Fig. 2c. Effect of ɛ-amino carproic acid and Tryptone on pollen germination in vitro.

242
Indian Journal of Horticulture, June 2018
Fig. 3. Photomicrograph showing the pollen germination and smooth intact pollen tube growth of variety eggplant pollen in medium (Maltose 20% +15% PEG 4000 + 100mg/l boric acid + 400 mg/l calcium nitrate + EACA 250mg/l + T50 mg/l + 1% agar) (A&B) shows the smooth pollen tubes and ungerminated pollen (Arrows indicate sterile pollen sterile pollen).
basal medium showed pollen germination after 12 hrs, where as the timing was reduced to 8hrs for germination when boric acids and calcium nitrate were added. Addition of EACA the pollen fastens pollen germination after 3 and half hours itself. So this addition greatly helped in fast recording of germination percentage. Here the pollen showed maximum germination but tube length got reduced to 660.4 and 602.1 um. Since eggplant pollen tube can grow very long, it the medium constituent does not give correct nutrition, less pollen grain were germinated with long tube length. Hence, after calcium nitrate 72.3% with 827.6 um tube length of uneven pollen germination was seen. But after EACA and tryptone addition, evenly germinated pollens with maximum percentage and reduced pollen tube length recorded. This reveals this final medium gives nearly the same nutrition as in vivo. Henceforth, E250 and T50 medium were finally selected.
In the beginning, the initial basal medium showed pollen germination after 12 hrs, where as the timing was reduced to 8 hrs for germination by the addition of minerals like boric acids and calcium nitrate. It was surprising that by addition of EACA pollen starts germination after 3 and half hrs. So this addition greatly helped in fastening of germination percentage. Pollen showed maximum germination at the cost of pollen tube length from 660.4 to 602.1 µm. Since eggplant pollen tube can grow very long, the medium constituent does not give correct nutrition, less pollen grain were germinated with long tube length. Hence after calcium nitrate 72.3 % with 827.6 um tube length of uneven pollen germination was seen. But after EACA and tryptone addition, evenly germinated pollens with maximum percentage and
reduced pollen tube length recorded. This reveals this final medium gives nearly the same nutrition as in vivo. Henceforth, EACA 250 and T50 medium were finally selected.
In some vegetables the observed pollen in vitro germination rates were reported to be less than 90 percent, for example, Gomes et al. (4) observed 49.8% germination in onion pollen grains, Franzon et al. (3) 79.7% in beans etc. In eggplant, the observed fruit set was 62%, (Suganya et al., 14) while the in vivo pollen germination was 66% (Franca et al., 2) which indicate that there is above 30 percent sterility/non-viable pollen. In both staining and in vitro pollen germination studies sterile/ non-viable pollen count 10-12% has been observed. Considering the above pollen sterility, the medium reported here may be concluded as complete PGM for testing the viability of eggplant pollen.
Basically four forms of eggplant flowers based on stigma position in relation to anthers are usually seen. The pollen extracted from each flower was germinated in the PGM reported here.Stigma position in relation to anthers in flower
Pollen germination (%)
1. Flower with stigma below anthers
78.1
2. Flower with stigma on the same level of anthers
50-60
3. Flower with stigma above the anthers
20-40 with pollen bursting
4. Flower with stigma much below anthers
0-10

243
Development of Pollen Germination Medium to Test Pollen Viability of Eggplant
So, flowers with stigma below anther tip were selected throughout the experiments since it has shown highest pollen germination than the rest. Scanning electron microscopy of pollen grains of selected eggplant variety showed average equatorial axis of 28.28 µm (27-29 µm) and polar axis of 38.24 µm (37-39 µm) (Fig. 4a & b). In final medium germinated pollen tube diameter showed 7.23 µm – 7.21 µm initially and as tube growth progressed, diameter decreased to 6.89 µm (Fig. 4c & d). Since eggplant pollen tube grows long the exact end of tube couldn’t be located properly. Fig. 4e & f showed mat growth of eggplant pollen grains.
SEM studies helps to resolve many structural based questions. Koti et al. (9) studied SEM pattern of soybean pollen after UV- B radiation which showed no apertures on pollen grains. Earlier studies showed pollen morphology of three Solanaceae family from Saudi Arabia using SEM and explained eggplant pollen grains are generally radially symmetrical, isopolar, tricolporates, zonoaperatures, prolate and with non perforatetectum. Lashin (10) reported detailed studies of six Solanum varieties pollen morphology using SEM. Pollen tube structure on selected medium was studied using this technique showed medium nearly consists of all nutrition for intact tube growth and long growth.
The composition of improved Brewbaker and Kwack medium suited for pollen germination of each wild solanum is presented in Table 1. Sucrose (10%) was found to be the appropriate sugar which supported pollen germination of these species. Some solanum species required EACA in PGM where as other solanums germinated without it. All the observation on pollen germination and pollen tube growth were taken 3h after incubation except S.khasianum which germinated quickly (1h)
Again, in all the wild species during pollen germination we observed sterility upto 10.12%. The pollen germination results of eggplant were compared with wild Solanum(Table 1). As compared to domesticated species, the wild Solanum required minimum nutrition for pollen germination in vitro.
There exists lot of variability in the whole gene pool of Solanum. The PGMs reported here may be used in variety of ways (1) the variability in each species may be explored (2) help in undertaking pollen selection experiments (3) help in attempting in vitro pollination/ fertilization (4) intra specific variability based on pollen germination medium will be useful for the selection of appropriate accession for hybridization.
Fig. 4: Pollen morphology of eggplant (a) pollen grains showing prolate-spheroidal and trizonocolporate, x500 (b) Polar view showing large mesocolpium, x3000 (c & d) Germinated pollen in final medium, x2500 & x2000 (e & f) Mat growth of eggplant pollen with long tube length, x500 & x6000.

244
Indian Journal of Horticulture, June 2018
Table 1. Composition of pollen germination medium and other conditions for eggplant and its wild species.
Parameter S. melongena S. torvum S. khasianum S. surettense S. trilobatumSucrose (%) - 10 10 10 10Maltose (%) 20 - - - -Boricacid (mg l-1) 250 200 300 200 200Calcium nitrate (mg l-1) 300 300 300 100 100PEG 4000 (%) 15 15 - - -EACA (mg l-1) 750 200 - - -Temperature (oC) 25 24 25 24 25Period of incubation (hours) 3h 3h 1h 3h 3hMaximum per cent germination achieved 78.1 % 76.53% 78.63% 77.58% 76.25%
*100 mgl-1 Potassium nitrate + 200 mgl-1 Magnesium sulphate + 1% Agar are comman for PGM.
CONCLUSIONThe complete pollen germination medium for
eggplant consists of 20 % maltose + 250 mg l-1 Boric acid + 300 mg l-1 Calcium nitrate + 15% PEG 4000 + 750 mg l-1 EACA + 0.5-1% agar which supports > 78% pollen germination at 25 ºC température after 3h of incubation
REFERENCES1. Brewbaker, J.L. and Kwack, B.H. 1963. The
essential role of calcium ion in pollen germination and pollen tube growth. American J. Bot. 50: 859-65
2. Franca, L.V., Nascimento, W.M., Carmona, R. and Freitas, R.A. 2009. Viability of eggplant pollen. Crop Breed. Appl. Biotech. 9: 320-27.
3. Franzon, R.C., Corrêa, E.R. and Raseira, M.C.B. 2005. In vitro pollen germination of feijoa (Acca sellowiana (Berg) Burret). Crop Breed. Appl. Biot. 5: 229-33.
4. Gomes, P.R., Raseira, M.C.B., Baudet, L.L. and Peske, S.T. 2003. Armazenamento do grão de pólen de cebola (Allium cepa L.). Revista Brasileira de Sementes, 25: 14-17.
5. Guler, H.Y., Abak, K. and Eti, S. 1995. Method, Medium and incubation time suitable for in vitro pollen germination of eggplant (Solanum melongena.L). Acta Hort. 412: 99-105.
6. Hepler, P.K. 2005. Calcium: A central regulator of plant growth and development. Plant Cell. 17: 2142-55.
7. Jayaprakash, P., Annapoorani, S., Vikas, V.K., Sivasamy, M., Kumar1, J., Saravannan, K., Punniakotti, E. and Sheeba, D. 2015. An improved
in vitro germination medium for recalcitrant bread wheat pollen (Triticum aestivumL.).Indian J. Genet. 75: 446-52.
8. Khan, S.A. and Perveen, A. 2006. Germination capacity of stored pollen of Solanum melongena L., (Solanaceae) and their maintenance. Pak. J. Bot. 38: 917-20.
9. Koti Sailaja, Reddy, K. Raja, Reddy, V. R., Kakani, V. G. and Zhao, D. 2015. Interactive effects of carbon dioxide, temperature, and ultraviolet-B radiation on soybean (Glycine max L.) flower and pollen morphology, pollen production, germination, and tube lengths. J. Exp. Bot. 56: 725-36.
10. Lashin, G.M.A. 2012. ultrastructure and pollen morphology significance of some species of Solanum (Solanaceae). Egyptian J. Bot. 141-56.
11. Leduc, N., Monnier, M. and Douglas, G.C. 1990. Germination of trinucleatted pollen: formulation of a new medium for Capsella bursa-pastoris. Plant Reprod. 3: 228-35.
12. Pradeepa, G.L. 2002. Fruit set in relation to floral morphology of eggplant (Solanum melongena L.). Tropical Agric. Res. and Exten. 5: 12-16.
13. Shyla, K.K. and Natarajan, N. 2014. Customizing Zinc oxide, silver, titanium dioxide nanoparticles for enhancing groundnut seed quality. Indian J. Sci. Tech. 7: 1376-81.
14. Suganiya, S., Kumuthini, A. and Harris, D. 2015. Effect of Boron on flower and fruit set and yield of ratoon Eggplant crop. International J. Sci. Res. and Innov. Tech. 2: 135-41.
Received : July, 2017; Revised : April, 2018; Accepted : May, 2018

245
Indian J. Hort. 75(2), June 2018: 245-251
INTRODUCTIONBitter gourd (Momordica charantia L.) is an
important cucurbitaceous fruit vegetable crop rich in nutritional and medicinal value. In spite of its importance, bitter gourd area and production are low in India (Area-93,000 ha, Production-1046 TMT; NHB 2015-16) mainly because, large area of cultivation is under open pollinated varieties due to non availability of hybrid seed at an affordable cost. To increase the production and productivity of bitter gourd, more area has to be covered under hybrids, which calls for localization of seed production area and standardization of hybrid seed production technology. Although, the crop can be successfully grown in both rainy and spring-summer season, seed production during rainy season is affected by high incidence of fruit fly which not only affects seed yield but also quality. Spring-summer season has shorter duration of pollination and crop encounters high temperature during pollination, which affects the seed setting, yield and quality. So, the knowledge of pollen viability and stigma receptivity is very important in hybrid seed production particularly in crops like bitter gourd where pistillate flower remains viable only for one day. This will enable the seed producers to know when to pollinate and for how long pollination can be continued. Bitter gourd hybrid seed production is mainly undertaken in Southern India and hybrid seed is transported to North India where the major area of cultivation under the crop is there. Thus diversification of seed production area will ensure
timely availability of hybrid seed at an affordable cost and there is also a need to identify optimum season for hybrid seed production of bitter gourd under North Indian conditions. Hence, keeping the importance of these points in the mind, crop growth, duration of pollination, fruit setting, seed yield and quality was studied in the female parental lines of Pusa Hybrid-1 and Pusa Hybrid-2 for assessing the feasibility of hybrid seed production of bitter gourd under North Indian conditions.
MATERIALS AND METHODSField studies were conducted at Indian Agricultural
Research Institute (IARI), New Delhi, India (Lat. 28o 38’23” N; Long. 77o 09’27” E; Elevation 228.61m) for two seasons spring-summer (November-May) and rainy season (July-November) of 2012 to determine the effect of season on hybrid seed production of bitter gourd. The experiment was carried out with the parental lines of two bitter gourd hybrids; Pusa Hybrid-1 and Pusa Hybrid-2. The field experimental design was randomized block design (RBD) with three replications. The seeds were scarified, soaked overnight and treated with bavistin (0.1%) followed by sowing in plug trays. Twenty five day old seedlings (2-4 leaf stage) were transplanted in spring-summer and rainy season. Soil was ploughed twice and harrowed once before transplanting. Seedlings were transplanted on both the edges of raised flat bed (1.5 m width) at a spacing of 90 cm (between plants). The irrigation was given as per the requirement of the crop. Manual weeding was done 3-4 times to keep the field free from weeds.
Comparative evaluation of hybrid seed production of bitter gourd in rainy and spring-summer season
Nagamani Sandra*, Sudipta Basu and T.K. Behera**
Division of Seed Science and Technology, ICAR-Indian Agricultural Research Institute, New Delhi 110 012
ABSTRACTA study was conducted with the parental lines of two popular bitter gourd hybrids; Pusa Hybrid-1 and Pusa
Hybrid-2 to assess the effect of season on pollination behaviour, fruit setting, fruit yield and seed quality with respect to hybrid seed production. The hybrid seed production was carried out by hand pollination for four weeks in spring summer and rainy season. The results showed high pollen viability (R: 97.63-100%, S-S: 90-95%) and stigma receptivity in both the seasons however higher fruit yield, fruit traits (weight, length, width) were achieved in rainy season whereas the fruit setting percentage (80-90%) and seed quality were superior in the spring-summer season. Among the weeks of pollination compared, first and second weeks of pollination i.e. last week of April to first week of May in spring summer, third and fourth week of September in rainy season were found to be better for hybrid seed production than later weeks of pollination in both the seasons.Key words: Momordica charantia, pollen viability, fruit setting, seed yield, seed quality.
*Corresponding author's E-mail: [email protected]**Division of Vegetable Science, ICAR-IARI
DOI : 10.5958/0974-0112.2018.00042.7

246
Indian Journal of Horticulture, June 2018
Pollen viability was studied by acetocarmine staining. Four male buds were collected from three plants of male parent between 9-10 am. Using dissecting forceps, scalpel and a needle, anthers were opened to allow extraction and subsequent transfer of pollen dust on to a microscopic glass slide in a drop of acetocarmine stain. Cover slips were gently placed on to slides and slides were then observed under a light microscope. Observations were recorded under three randomly selected microscopic fields and pollen viability was expressed in percentage (McKellar et al., 11).
To standardize the time of pollination for hybrid seed production, unopened female flower buds of seed parent which will be opening next day morning are covered with butter paper bag having five to six tiny holes to facilitate the ventilation and to avoid the build-up of high temperature inside the butter paper bag. Male buds in the pollen parent were also covered with non-absorbent cotton in the previous evening between 4.00 to 5.00 pm. Next day morning, the male buds were collected and their pollen was dusted on the stigma of female flowers followed by tagging and covering with butter paper bag. The pollination was performed with five timings, viz. 7.00 am, 9.00 am, 11.00 am, 1.00 pm and 3.00 pm with 2 replications regularly up to 40 days after initiation of flowering with 3 days interval. Five plants from each replication were selected at random and tagged for recording observations on fruit setting, yield and quality parameters. Based on these observations, pollination time between 7.00 to 9.00 am was chosen to ascertain stigma receptivity as described above. For stigma receptivity studies, the crossing was carried out three times in a week for the period of four weeks from 10 days after opening of first female flower i.e. between 26th April to 22nd May in spring-summer and 17th Sept to 14th October in rainy season. The buds and flowers that appeared subsequently after the completion of crossing programme were manually removed to facilitate better development of the crossed fruits and to avoid the selfed seeds in the hybrid. Stigma receptivity was estimated based on setting percentage by counting number of fruit set seven days after hand pollination. Fruit setting was expressed in percentage.
To study the crop growth, vine length (cm) was measured using a flexible tape from the base to tip of the plant at 15 days interval from 15 days after transplanting up to end of the flowering in a vine. The total number of female and male flowers borne in a vine was visually counted from the beginning of first male and female flower opening till end of the flowering period in both the seasons and used to calculate sex ratio. Calculation was done according to the following formula; Sex ratio= Number of female / Number of male flowers (Marie and Mohamed,
10). The observations on fruit setting percentage, fruit length, weight and width, number and weight of filled seeds per fruit were recorded. The length of the fruit was measured using centimetre ruler while their width was assessed by using a vernier caliper at successive harvesting intervals. Seed quality was assessed by seed germination test according to ISTA recommendations (ISTA, 7) and other quality parameters like root length (cm), shoot length (cm), seedling dry weight were also recorded and utilized for vigour index calculation. Seedling vigour index I and II were calculated as per Abdul Baki and Anderson, (1) formula as follows; Seedling vigour index I = Seed germination % × (Root length + Shoot length)Seedling vigour index II = Seed germination % × Seedling dry weight
Percentage data such as pollen viability, stigma receptivity and fruit set were transformed via arcsine before analysis (Gomez and Gomez, 6). The data was analyzed statistically for testing heterogeneity of means, adopting two and three factorial analysis with OPSTAT package developed by CCS Haryana Agricultural University, Hisar, India (http://www.hau.ernet.in/opstat.html). Mean value separations were performed using a least significant difference (LSD) test at a 5% significance level (P ≤ 0.05).
RESULTS AND DISCUSSIONHybrid seed production of bitter gourd involves
hand pollination and final seed yield depends on all the crop growth stages, thus determination of optimum season and time is important for minimizing labour cost. During hybrid seed production of bitter gourd, environmental conditions viz., temperature, relative humidity and photoperiod plays an important role in all the crop growth stages especially the early vegetative growth (vine length). The results of the present study showed that season had a significant effect on the vine length. The vine length in both the parental lines was longer during rainy season (222 cm female parent; 223.5 cm male parent) as compared to spring-summer season (156.2 cm female parent; 159 cm male parent) and increase in vine length was significantly higher in first two fortnight of crop growth (96.4 cm, 30-60 DAT) as compared with later stages (44 cm, 60-90 DAT) (Fig 1a). Longer vine length in rainy season was due to longer crop duration (133 days) with moderate temperature (16.2-31.4oC) and RH (61.0-90.5%) during crop growth which is the optimum temperature for photosynthesis of bitter gourd (23 to 34oC) as compared to the spring summer season (temperature: 17.8-35.5oC, RH: 31.5-63.5%) (Table 1) (Bairwa et al., 3).
Fruit and seed yield mainly depends on the number of pistillate flowers borne per vine. In bitter gourd,

247
Hybrid Seed Production of Bitter Gourd in Rainy and Spring-Summer Season
average ratio of staminate to pistillate flowers varies from 50:1 (Rasco and Castillo, 12) to 9:1 (Dey et al., 4). In the present study, number of female flowers per vine was more (11.00) with higher sex ratio (F: M) (6.96-8.62) in rainy as compared to spring-summer season respectively (10.00; 6.06-6.49) (Fig.1b and 1c). This higher female sex expression may be due to low temperature, short photoperiod and high moisture availability which are conditions that encourage the build up of carbohydrates. These environmental factors also influence the levels of endogenous hormones (especially ethylene, auxin and gibberellic acid, chemical composition), which in turn influence sex expression by suppressing the staminate flowers and promoting more number of pistillate flowers (Robinson
and Walters, 14; Agbaje et al., 2; Sandra et al., 15). In our present study higher number of female flowers in rainy season might be due to high rainfall and low temperatures during the August and September months which are in contrary to the results of Agbaje et al., (2) who reported more number of female flowers in the early season (May to August) than late season (August to November) in pumpkin (Cucurbita pepo).
Pollen viability studies in male parents of Pusa Hybrid-1 and Pusa Hybrid-2 showed high viability throughout the pollination period (90.0-100%) in both the seasons. However, pollen viability was higher in rainy season (97.0 to 100%) compared to spring-summer season (90-94%), but there was no significant difference in pollen viability between the
Table 1. Meteorological data during crop growth in spring-summer and rainy season
Date/Season Temperature (0C) RH (%) Rainfall (mm)Period of pollination Max. Min. Mean Max. Min. Mean TotalSpring-Summer23-29th April (1W)* 40.4 22.4 31.4 58 27 42.5 0.030th April-6th May (2W)* 38.9 25.0 31.9 60 36 48.0 8.87-13th May (3W)* 38.8 24.0 31.4 57 36 46.5 0.014-20th May (4W)* 43.8 27.0 35.4 42 25 33.5 0.0Rainy17-23rd September (1W)** 28.8 22.9 25.9 97 82 89.5 141.824-30th September (2W)** 31.6 21.7 26.7 93 59 76.0 0.01-7th October (3W)** 33.3 20.7 27.0 96 55 75.5 0.08-14th October (4W)** 33.5 19.6 26.6 82 46 64.0 0.0
*Week of pollination during spring summer season**Week of pollination during rainy season
Fig. 1. Effect of season on vine length (a) number of female flowers (b) and sex ratio (c) in parental lines of bitter gourd hybrids.

248
Indian Journal of Horticulture, June 2018
parents (Table 2). The results revealed that pollen viability was not a constraint in hybrid seed production of bitter gourd.
Studies on standardization of time of pollination showed a significant difference in fruit setting percentage, seed yield and quality parameters for various pollination timings (7.00 am, 9.00 am, 11.00 am, 1.00 pm and 3pm). These all parameters were significantly higher in 7.00 am to 9.00 am pollination compared to other pollination timings (Table 3). The higher fruit setting percentage might be due to availability of viable pollen which resulted in better fertilization and high stigma receptivity during early part of the day and pollination periods. The plants
will be more active physiologically at this stage. So, this 7.00 am to 9.00 am pollination was chosen for stigma receptivity studies.
To ascertain the receptivity of stigma, fruit setting percentage was taken as an index. Maximum fruit setting percentage was observed in first and second weeks of pollination and thereafter it decreased (Table 4). The fruit set values of the flowers pollinated on third and fourth week of pollination found non-significant. Between the seasons fruit setting percentage was higher in spring summer season (89.37 and 80.12) compared to rainy season (73.75 and 78.75) (Table 4). The high fruit setting in the beginning of pollination period could be attributed to adequate availability of
Table 2. Effect of season on pollen viability in male parental lines of bitter gourd hybrids Pusa Hybrid-1 and Pusa Hybrid-2.
Parental l ines/character
Pollen viability (%)Spring-Summer Rainy
1W 2W 3W 4W Mean 1W 2W 3W 4W MeanMale parent of PH-1
91.34 (72.84)
92.15 (73.68)
90.46 (72.05)
90.21(71.76)
91.04 97.63(81.33)
99.00(85.46)
99.08(86.84)
99.33(86.73)
98.76
Male parent of PH-2
93.67(75.46)
92.49(74.00)
91.64(73.15)
90.87(72.44)
92.16 98.33(82.66)
98.83(85.06)
98.50(83.15)
99.16(85.77)
98.70
C.D. (0.05): 0.108; SE(m): 0.036Values in parenthesis are arc sine converted values.
Table 3: Effect of time of pollination on fruit setting, fruit yield, seed yield and seed quality in the female parental lines of bitter gourd hybrids Pusa Hybrid-1 and Pusa Hybrid-2.
Time of pollination
Fruit Setting
%
Fruit weight
(g)
Fruit length (cm)
Fruit width (cm)
Number of filled seeds
Weight of filled
seeds (g)
Germination (%)
Seedling length(cm)
Seedling dry weight
(g)
Seedling vigour index I
Seedling vigour
index IIFemale parent of PH-17.00 am 81.00 137.80 15.11 4.65 24.50 3.60 70.20 22.58 0.18 1577.14 12.679.00 am 78.00 140.20 15.72 4.90 22.80 3.38 72.10 22.86 0.18 1655.27 13.3211.00 am 78.00 140.50 14.89 4.85 21.50 3.74 66.50 22.81 0.18 1476.90 11.991.00 pm 55.00 118.08 14.31 4.13 17.50 2.76 61.10 19.62 0.17 1175.94 10.733.00 pm 48.00 91.50 13.31 3.95 16.60 2.18 60.40 17.59 0.17 1078.74 10.34Mean 68.00 125.61 13.97 4.49 20.58 2.99 66.26 21.17 0.17 1392.79 11.81Female parent of PH-27.00 am 86.00 147.80 14.52 5.88 25.70 3.79 67.30 21.46 0.17 1452.22 11.799.00 am 98.00 157.50 14.23 5.89 23.70 3.64 67.00 23.26 0.18 1514.60 10.9211.00 am 92.00 157.00 13.03 6.27 22.70 3.55 62.90 22.89 0.17 1372.55 11.071.00 pm 62.00 122.00 13.06 5.30 17.30 2.59 57.40 20.97 0.16 1120.52 9.643.00 pm 38.00 113.90 10.48 5.38 17.50 1.44 57.60 18.04 0.16 981.65 9.28Mean 75.20 139.64 12.22 5.70 21.39 3.00 62.44 21.32 0.17 1288.30 10.54C.D. (0.05) 2.92 2.17 1.154 0.142 1.502 0.031 2.53 2.15 NS 3.56 NSSE(m) 1.157 1.052 0.151 0.012 0.12 0.007 0.81 1.06 0.32 1.21 0.49

249
Hybrid Seed Production of Bitter Gourd in Rainy and Spring-Summer Season
pollen grains, congenial weather conditions, high vigour of the crop and better fruit bearing potential of a vine. Low fruit setting percentage in later weeks of pollination might be due to prevailing higher temperatures during spring summer and very low temperatures in rainy period during crop growth period. Similar results were reported in tomato (Lycopersicon esculentum), brinjal (Solanum melongena) and bitter gourd (Momordica charantia) (Rahman et al., 13).
Fruit traits i.e. fruit weight, length were higher during first two weeks of pollination as compared to later weeks of pollination in both the parents (Table 4). Between the two seasons, these parameters were higher in rainy season (133.39-145.82 gm, 14.2- 16.2 cm) compared to spring-summer season (53.03-65.71 gm, 12.7-13.5 cm) but fruit width was found to be non significant between two seasons. This may be attributed to longer crop duration (4.5 m), moderate temperature (16.2-26.60C) and RH (61.0-89.5%) which favoured better source sink relation leading to better translocation of photosynthetates to the developing fruits as compared to spring-summer season (3.5 m, temperature:30.5-35.50C and RH: 32.5-48.5%). The results are in accordance with Sundriyal et al. (17) in bitter gourd, and Ganar et al. (5) in ash gourd in brinjal.
Marked difference in seed yield and its attributes like seed weight per fruit, number of seeds per fruit were recorded. These were found higher in spring-summer season compared to rainy season (Table 5). In the present study maximum seed yield might be due to large sized fruits, higher fruit weight, longer duration for fruit development after pollination leading to better filling (Rainy: 40-50 days and spring summer season: 30-35 days). Reduced seed weight in later weeks of pollination specifically in rainy season was due to cool and very low temperatures which were lower than the optimum resulted in impaired biomass accumulation. These results are in conformity with findings of Stephenson et al. (16) in Cucurbita pepo, Venangamudi and Palaniswamy (18), Sundriyal et al. (17) in bitter gourd, and Kortse et al. (9) in Citrullus lanatus.
Higher seed quality parameters like germination percentage and seedling vigour index were recorded in spring-summer season (92.90-94.04%, 3613.8-3788.3) compared to rainy season (63.80-68.37%, 1361.91-1480.5) in both the parental lines (Table 6). Similarly, first two weeks pollination achieved seeds with higher germination as compared following weeks of pollination. Some reports showed that temperature
Table 4. Effect of seasons on fruit setting, fruit weight, length and width in female parental lines of bitter gourd hybrids Pusa Hybrid-1 and Pusa Hybrid-2.
Parental lines Spring-Summer RainyFruit setting percentage
1W 2W 3W 4W Mean 1W 2W 3W 4W MeanFemale of PH-1 97.50 95.00 82.50 82.50 89.37 84.00 85.00 70.00 56.00 73.75Female of PH-2 93.00 85.50 85.00 77.50 80.12 86.00 83.00 77.00 69.00 78.75C.D. (0.05): 3.796; SE(m): 1.259
Fruit weight (g)/plant1W 2W 3W 4W Mean 1W 2W 3W 4W Mean
Female of PH-1 72.85 67.85 65.00 57.14 65.71 146.70 146.30 125.20 115.38 133.39Female of PH-2 61.42 52.85 51.42 46.42 53.03 152.50 147.80 154.00 129.00 145.82C.D. (0.05): 3.170; SE(m): 1.052
Fruit length (cm)/plant1W 2W 3W 4W Mean 1W 2W 3W 4W Mean
Female of PH-1 15.71 13.62 13.33 11.40 13.5 19.92 17.90 15.92 11.40 16.2Female of PH-2 14.81 13.51 11.71 10.93 12.7 17.34 15.63 12.30 11.85 14.2C.D. (0.05): 0.154; SE(m): 0.051
Fruit width (cm)/plant1W 2W 3W 4W Mean 1W 2W 3W 4W Mean
Female of PH-1 5.01 4.87 4.25 4.31 4.61 6.10 5.50 4.90 4.17 5.16Female of PH-2 4.32 4.41 3.85 3.91 4.12 6.97 7.45 5.72 5.28 6.36C.D.(0.05): 0.024; SE(m): 0.007
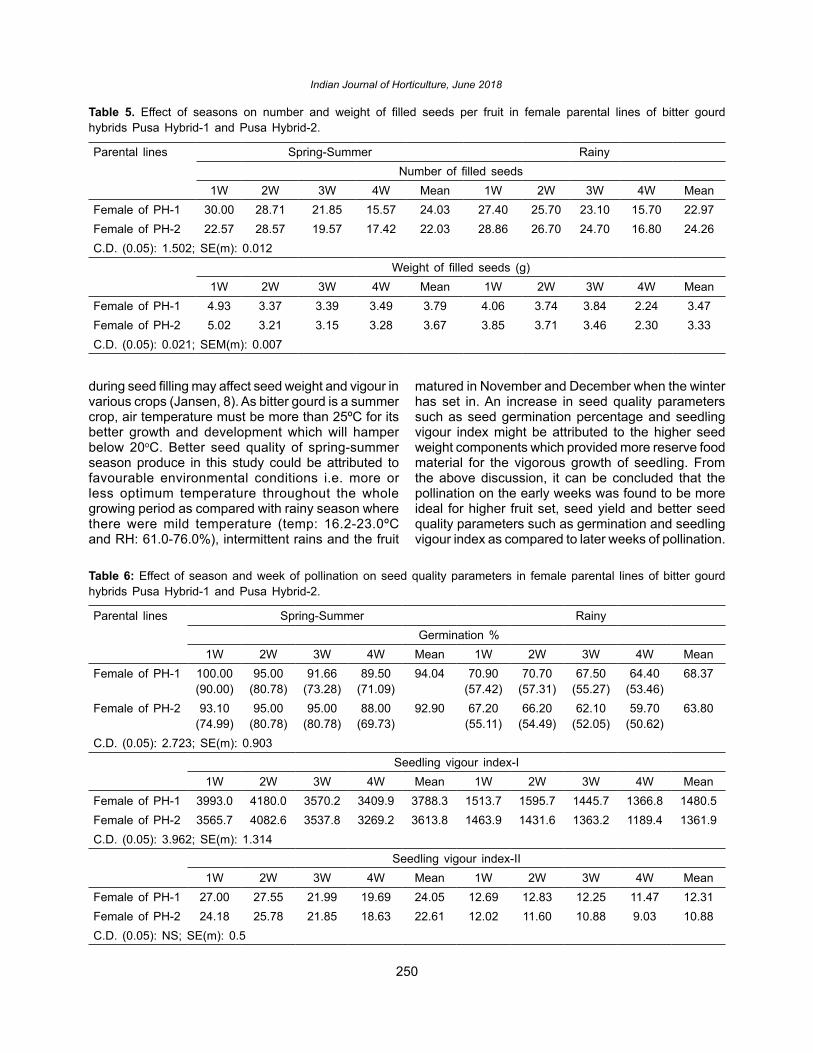
250
Indian Journal of Horticulture, June 2018
during seed filling may affect seed weight and vigour in various crops (Jansen, 8). As bitter gourd is a summer crop, air temperature must be more than 25ºC for its better growth and development which will hamper below 20oC. Better seed quality of spring-summer season produce in this study could be attributed to favourable environmental conditions i.e. more or less optimum temperature throughout the whole growing period as compared with rainy season where there were mild temperature (temp: 16.2-23.0ºC and RH: 61.0-76.0%), intermittent rains and the fruit
matured in November and December when the winter has set in. An increase in seed quality parameters such as seed germination percentage and seedling vigour index might be attributed to the higher seed weight components which provided more reserve food material for the vigorous growth of seedling. From the above discussion, it can be concluded that the pollination on the early weeks was found to be more ideal for higher fruit set, seed yield and better seed quality parameters such as germination and seedling vigour index as compared to later weeks of pollination.
Table 5. Effect of seasons on number and weight of filled seeds per fruit in female parental lines of bitter gourd hybrids Pusa Hybrid-1 and Pusa Hybrid-2.
Parental lines Spring-Summer RainyNumber of filled seeds
1W 2W 3W 4W Mean 1W 2W 3W 4W MeanFemale of PH-1 30.00 28.71 21.85 15.57 24.03 27.40 25.70 23.10 15.70 22.97Female of PH-2 22.57 28.57 19.57 17.42 22.03 28.86 26.70 24.70 16.80 24.26C.D. (0.05): 1.502; SE(m): 0.012
Weight of filled seeds (g)1W 2W 3W 4W Mean 1W 2W 3W 4W Mean
Female of PH-1 4.93 3.37 3.39 3.49 3.79 4.06 3.74 3.84 2.24 3.47Female of PH-2 5.02 3.21 3.15 3.28 3.67 3.85 3.71 3.46 2.30 3.33C.D. (0.05): 0.021; SEM(m): 0.007
Table 6: Effect of season and week of pollination on seed quality parameters in female parental lines of bitter gourd hybrids Pusa Hybrid-1 and Pusa Hybrid-2.
Parental lines Spring-Summer Rainy Germination %
1W 2W 3W 4W Mean 1W 2W 3W 4W MeanFemale of PH-1 100.00
(90.00)95.00
(80.78)91.66
(73.28)89.50
(71.09)94.04 70.90
(57.42)70.70
(57.31)67.50
(55.27)64.40
(53.46)68.37
Female of PH-2 93.10(74.99)
95.00(80.78)
95.00(80.78)
88.00(69.73)
92.90 67.20(55.11)
66.20(54.49)
62.10(52.05)
59.70(50.62)
63.80
C.D. (0.05): 2.723; SE(m): 0.903Seedling vigour index-I
1W 2W 3W 4W Mean 1W 2W 3W 4W MeanFemale of PH-1 3993.0 4180.0 3570.2 3409.9 3788.3 1513.7 1595.7 1445.7 1366.8 1480.5Female of PH-2 3565.7 4082.6 3537.8 3269.2 3613.8 1463.9 1431.6 1363.2 1189.4 1361.9C.D. (0.05): 3.962; SE(m): 1.314
Seedling vigour index-II1W 2W 3W 4W Mean 1W 2W 3W 4W Mean
Female of PH-1 27.00 27.55 21.99 19.69 24.05 12.69 12.83 12.25 11.47 12.31Female of PH-2 24.18 25.78 21.85 18.63 22.61 12.02 11.60 10.88 9.03 10.88C.D. (0.05): NS; SE(m): 0.5

251
Hybrid Seed Production of Bitter Gourd in Rainy and Spring-Summer Season
From the results of the present study, it is evident that duration of pollination had a significant effect with respect to setting percentage, fruit and seed yield and quality attributes. Under North Indian conditions, best time of pollination for achieving higher fruit setting, seed yield and quality are first two weeks i.e. 26th April to 6th May during spring-summer and 17th September to 30th September in rainy season. In conclusion, rainy season growing delays the maximum maturation stage of bitter gourd seeds in turn seed quality. However highest quality of seed can be obtained in spring-summer growing season. Although seed production is feasible in both spring-summer and rainy season, the time of occurrence of maximum fruit setting and seed quality, affecting seedling growth in this work may depend on the environmental conditions.
REFERENCES1. Abdul-Baki, A.A. and Anderson, J.D. 1973. Vigour
determination in soybean by multiple criteria. Crop Sci. 10: 31-34.
2. Agbaje, G.O., Oloyede, F.M. and Obisesan I.O. 2012. Effects of NPK fertilizer and season on the flowering and sex expression of pumpkin (Cucurbita pepo Linn.). Int. J. Agri. Sci. 2: 291-95.
3. Bairwa, L.N., Khandelwal, S.K. and Harish Verma. 2013. Effect of zinc on growth, seed yield and nutrient content of bottle gourd seeds (Lagenaria siceraria (Mol.) Standl.). Progressive Horti. 45: 18-221.
4. Dey, S.S., Behera, T.K., Anandpal and Munshi, A.D. 2005. Correlation and path coefficient analysis in bitter gourd (Momordica charantia L.). Veg. Sci. 32: 173-76.
5. Ganar, H.D., Kant, K., Dadlani, M., Sirohi, P.S. and Tomar, B.S. 2004. Effect of after ripening and seasons on seed quality of ash gourd (Benincasa hispida). Seed Res. 32: 145-48.
6. Gomez, K.A. and Gomez, A.A. 1983. Statistical procedures for agricultural research. An International Rice Research Institute book. A Wiley interscience publication.
7. ISTA. 2008. International rules for seed testing, Publ. the International Seed Testing Association 8303 Barsserssorf, CH-Switzerland.
8. Jansen, P.I. 1995. Seed production quality in Trifolium balansae and T. resupinatum: The effect of temperature. Seed Sci. Techn. 23: 341-52.
9. Kortse, P.A., Oladiran, J.A. and Msaakpa, T.S.
2012. Effects of season and fruit size on the quality of ‘Egusi Melon’ (Citrullus lanatus (Thunb) Matsum and Nakai) seed. ARPN J. Agri. Biolog. Sci. 7: 110-16.
10. Marie, I.A. and Mohammed, H.G. 2010. Effect of foliar application of potassium and IAA on growth and yield of two cultivars of squash (Cucurbita pepo L.). J. Tikrit Univ. Agri. Sci. 10: 229-42.
11. McKellar, M.A. and Quesenberry, K.H. 1992. Chromosome pairing and pollen viability in Desmodium ovalifolium Wall × Desmodium heterocarpon (L.) DC hybrids. Aust. J. Bot. 40: 243-47.
12. Rasco, A.A. and Castillo, P.S. 1990. Flowering patterns and vine pruning effects in bitter gourd (Momordica charantia L.) varieties ‘Sta.Rita’ and ‘Makiling’. Philippine Agri. 73: 3-4.
13. Rahman, M.S., Islam, M.N., Shaheb, M.R., Sarker, P.C., Nessa, A. and Sarker, M.H. 2014. Influence of sowing date on quality seed production of bitter gourd. Intnl. J. Sust. Crop Prod. 9: 17-21.
14. Robinson, R.W. and Decker-Walters, D.S. 1997. Cucurbits. N.Y.: CAB International.
15. Sandra, N., Sudipta, B., Sukhbir, S., Lal, S.K., Behera, T.K., Chakrabarty, S.K. and Talukdar, A. 2015. Effect of plant growth regulators on sex expression, fruit setting, seed yield and quality in the parental lines for hybrid seed production in bitter gourd (Momordica charantia). Indian J. Agri. Sci. 85: 1185-191.
16. Stephenson, A.G., Devlin, B. and Horton, J. B. 1988. The effects of seed number and prior fruit dominance on the pattern of fruit production in Cucurbita pepo (Zucchini squash). Ann. Bot. 62: 622-53.
17. Sundriyal, P., Singh, D.K. and Gupta, A.K. 2005. Study of time interval response on fruit setting by hand pollination at different time interval in bitter gourd (Momordica charantia). In: National Seminar on Cucurbits, 22-23 Sept., GBPUAT, Pantnagar. pp. 76-77.
18. Vanangamudi, K. and Palaniswamy, V. 1989. Effect of fruit grading on seed quality characteristics in bitter gourd. Vegetable Sci. 16: 96-98.
Received : July, 2017; Revised : April, 2018; Accepted : May, 2018

252
Indian J. Hort. 75(2), June 2018: 252-258
INTRODUCTION Protected cultivation is an important agricultural
sector showing constant growth and rapid expansion worldwide (Orgaz et al., 13). There is a great interest in reconciling maximum yields (Castilla et al., 2) with optimization of resource use efficiency through careful monitoring of environmental parameters and the improvement of cultivation techniques in this sector. Fertigation has emerged as an excellent method to improve the sustainability of greenhouse production by enabling better control over water and nutrient supply to the plants. So, drip irrigation under greenhouse cultivation is concentrated to supply irrigation water and fertilizers to rhizosphere through various phases of nutrient demand of a crop. (Mostafa et al., 12).
Cucumber (Cucumis sativus L.) is one of the potential greenhouse vegetables and truly a versatile crop because of wide range of uses from salads to pickles and digestive aids to beauty products. Greenhouse cucumbers have a high nutrient requirement and the correct quantity of fertilizers application not only increases the yield but also improve the quality. Application of major nutrients in proper ratio and required quantity can help growers to get the maximum out of these inputs (Kavitha et al.,
11). Manipulation of plant architecture through training with appropriate spatial arrangements has also been revealed as a key management factor for getting maximum yield from greenhouse crops (Cebula, 3). Therefore, keeping in view all the perspectives of protected cultivation, fertigation and training system, the present investigation was framed to study the performance of greenhouse cucumber in varying levels of fertilizer and training systems.
MATERIALS AND METHODSDinamik, a greenhouse cucumber cultivar of
Yuksel Tohumculuk Limited, Turkey was used in the experiment. The experiment was conducted at Regional Horticultural Research Station, Navsari Agricultural University, Navsari (Gujarat), India during 2013, 2014 and 2015, which is situated at latitude 20º
57ˋN and longitude 72º 54ˋE with an altitude of 12 m above the mean sea level. The location is characterized by humid climate with high annual rainfall of more than 1600 mm mostly concentrated during monsoon.
The growing media used for the experiment proportionally composed of 70% red soil: 20% FYM: 10% rice husk, which was subjected to sterilization with formaldehyde (1: 10) prior to planting. The physico-chemical analysis of growing media as well as water quality is given in Table 1.
Influence of fertigation and training systems on yield and other horticultural traits in greenhouse cucumber
Sanjeev Kumar*, N.B. Patel and S.N. SaravaiyaDepartment of Vegetable Science, ASPEE College of Horticulture and Forestry, Navsari Agricultural University,
Navsari 396 450, Gujarat
ABSTRACTAppropriation of major nutrients in proper ratio and systems of plant manipulation are important factors
deciding the yield of greenhouse cucumber. So, a study involving 4 levels of fertilizers and 3 of training systems in factorial arrangements was conducted during 2013-2015 to optimize nutrient dose and training system in greenhouse cucumber. Greenhouse cucumber responded significantly to higher level of fertigation and displayed not only earliest flowering resultantly early picking but showed excellent vegetative growth as well. Greenhouse cucumber plants trained to single stem system also exhibited good performance in terms of plant height and leaf area. The higher level of fertigation also produced fruits with good amount of fibre content and had significant effect on various yield components like fruit length and diameter. The sensory scoring of such fruits on acceptability by heterogeneous panel of evaluators demonstrated its importance for prompt applicability under field. A significant effect on number of fruits per plant as governed interactively by fertigation and training system contributed to greenhouse cucumber yield. The plants administered with higher level of fertigation and trained to single stem system exhibited higher yield per unit area resulting in good net returns of Rs. 83724 within three months of crop duration. Furthermore, higher economic gain could be realized by availing 65% and 75% subsidy being offered by the government on the basis of socio-economic status of the farmers. Key words: Cucumis sativus, fertilizers, umbrella system, V system, economics.
*Corresponding author’s E-mail: [email protected]
DOI : 10.5958/0974-0112.2018.00043.9

253
Influence of Fertigation and Training Systems in Greenhouse Cucumber
The whole experiment was arranged over 12 treatments consisting of 4 levels of fertilizers [F1-60:50:50 kg/ha (RDF through conventional method), F2-50% RDF (Fertigation), F3-100% RDF (Fertigation), F4-150% RDF (Fertigation)] and 3 training systems having system specific spacing as illustrated by Premalatha et al. (15) [P1-‘Umbrella’ (60 × 60 cm), P2-‘V’ (60 × 60 cm), P3-‘Single Stem’ (60 × 45 cm)] and laid out in randomized block design under factorial arrangements. In case of conventional method of fertilizer application, full dose of phosphorous and potassium and half dose of nitrogen were applied before seed sowing and remaining half of N in two splits at 30 and 60 days after sowing (DAS). The remaining fertigation treatments were applied with the following distribution pattern as per ratio of nutrients (Table 2).
Vermicompost (4 t/ha), Trichoderma viride (5 kg/ha), Pseudomonas fluorescens (5 l/ha) and Grade-5 micro-nutrients (50 kg/ha) were applied commonly to all the treatments at the time of sowing.Methodology adopted in training systems:1. Umbrella System (P1): Pinching of apical buds of
plants at the height of approximately 180 cm near to the overhead wire (45 to 50 DAS).
2. ‘V’ System (P2): Pinching of apical buds of plants at the height of 45-60 cm (10 to 15 DAS) and retaining two strong suckers/ side shoots just below pinching point.
3. Single stem system (P3): Training of main stem along the supporting string by pruning all the side shoots.All the laterals arising from the axials of leaves
commonly known as suckers were removed from the plants after attaining 8-10 cm of length in all the three systems.
The data on various parameters viz., days to first flowering, days to first picking, plant height, leaf area, fruit length, fruit diameter, average fruit weight, number of fruits per plant, yield, shelf life and crude fibre were recorded and the mean values were subjected to statistical analysis as per Panse and Sukhatme (14). The data on sensory characters like fruit colour, texture and flavour were recorded on the basis of 9 point Hedonic scale and accordingly, the overall acceptability was worked out.
The produce of three seasons was marketed at Shree Navsari Jalalpore Taluka Horticulture Cooperative Society Ltd., Navsari, Gujarat and average selling rate was worked out accordingly. To work out and simplify calculations, the data generated through accounting method were subjected to analysis as suggested by Gittinger (8). The actual values on fixed investment were subjected to amortized accounting by adopting certain assumptions (Table 3).
The component of protected cultivation is being strengthened under Mission for Integrated Development of Horticulture by Government of India
Table 2. Distribution pattern of nutrients applied through fertigation.
Crop Duration Distribution pattern /ratio of fertilizers
Remarks
N P KFirst Growth Period (Up to 30 days) 2 3 1 – Fertigation should start at the appearance of 2nd
true leaf stage.– Fertigation should be carried out twice a week.
Second Growth Period (30-60 days) 1 2 3Third Growth Period (30-60 days) 1 2 3
Table 3. Assumptions for the calculation of fixed component of cost.
S. No. Particulars Useful life (yrs) Remarks 1. Polyhouse Structure 10 *Conditional life of red soil has been considered equivalent
to that of structure’s life assuming that sufficient organic matter will be incorporated into it over the period of time.
2. Red soil* 103. Rice husk 34. Plant support system 5
Table 1. Physico-chemical properties of growing media and water.
Parameter Value Parameter Value Parameter Value Parameter ValueECsoil (dS/m) 1.43 ECWater (dS/m) 0.70 Organic Carbon (%) 0.61 Available P (kg) 39.87pHsoil 6.40 pH Water 7.30 Available N (kg) 435.73 Available K (kg) 317.32

254
Indian Journal of Horticulture, June 2018
by imparting 50% subsidy to the farmers. Incentives in terms of subsidy to the tune of 65 and 75% are further disseminated by Government of Gujarat State (India) to encourage the farmers for adopting protected cultivation by adding its share of 15 and 25% in Union Government subsidy depending upon socio-economic status of the farmers.
Therefore an attempt has also been made to work out comparative trend of economic returns for cucumber cultivation under NVPH in each case (without subsidy (Actual), with 65 and 75% subsidy). The labour wages were established as per the notification of Assistant Labour Commission and Minimum Wages Act, Gandhinagar, Government of Gujarat State for respective years of experimentation (Anonymous, 1). As far as calculation of variable components is concerned, the prevailing market value at that point of time was accounted into analysis.
RESULTS AND DISCUSSIONThe data pertaining to pooled analysis of growth,
reproductive and quality parameters are presented in Table 4 and it is clearly evident from the results that differences due to individual effect of fertilizers and training systems were significant for most of the parameters. However, interaction effect due to different levels of fertilizers and training systems was observed to non-significant. It is revealed from the study that F4 took significantly minimum number of days to first flowering, which was also reflected for earliness in picking by the same level of fertilizer. The plants trained to P3 training system were earliest in flowering taking 28.08 days, which was at par with P1, while P1 recorded
early pickings with at par performance with P3. A significant response of greenhouse cucumber to earliness in terms of flowering and picking under higher level of fertigation signifies higher requirement of nutrients at different phases of the crop growth for various metabolic activities. Fertigation not only stimulates photosynthesis but also various metabolic intermediates synthesis leading to earliness in reproductive activities (Goh and Haynes, 9).
Cucumber plants fertigated with F4 level of fertilizers showed significant maximum plant height as well as leaf area at all the intervals of crop growth. In case of training systems, plants trained to P1 system recorded significantly maximum plant height. However, progressive gain in plant height at 60 and 90 DAS was significantly highest in the plants trained to P3 training system. P3 also expressed maximum leaf area at 30 as well as 60 DAS, which was at par with the plants trained to P1 training system. This contributes to an improved availability of moisture, nutrients, and uniform distribution of fertigated nutrients in the crop root zone throughout the growth stages leading to better uptake of nutrients. The enhancing effects of NPK on vegetative growth might be attributed to their vital contribution in several metabolic process in plants related to growth. These results are in accordance with those obtained by Choudhari and More, 4; Jilani et al., 10; Mostafa et al., 12.
Plants administered with F4 level of fertigation recorded significantly maximum fruit length (16.10 cm) and diameter (4.15 cm). However, average fruit weight remained unaffected by any of the level of fertilizers. Training systems didn’t show any significant differences for these fruit characters.
Table 4. Effect of various levels of fertilizer and training system on growth, reproductive and quality parameters of greenhouse cucumber (Pooled mean).
Treatment Days to first
flowering
Days to first picking
Plant height (cm) 30
DAS
Plant height (cm) 60
DAS
Plant height (cm) 90
DAS
Leaf area (cm2)
30 DAS
Leaf area (cm2)
60 DAS
Fruit length (cm)
Fruit diameter
(cm)
Shelf life
(days)
Crude fibre
(g/100 g)
Overall acceptability(Fruit colour,
texture, flavour)
F1 28.85 39.30 119.94 202.13 277.10 263.52 407.23 14.69 3.86 5.41 1.21 6.04F2 30.71 41.59 104.77 188.50 259.07 215.81 338.71 15.04 3.75 4.70 1.20 5.48F3 28.26 39.22 131.01 210.23 294.89 274.11 435.78 15.39 3.91 6.03 1.51 6.94F4 26.74 37.00 146.78 245.17 326.34 340.46 542.68 16.10 4.15 7.78 1.65 7.70
C.D. 0.051.34 1.48 4.22 7.64 12.39 7.00 12.61 0.55 0.15 0.45 0.12 0.31
P1 28.11 38.64 132.17 208.64 263.47 278.58 439.72 15.14 3.92 5.81 1.42 6.51P2 29.72 40.47 116.65 203.38 287.36 258.40 403.34 15.31 3.89 5.97 1.36 6.44P3 28.08 38.72 128.06 222.51 317.23 283.44 450.24 15.47 3.95 6.17 1.40 6.67
C.D. 0.051.16 1.30 3.74 6.67 11.12 6.70 11.08 NS NS NS 0.04 NS

255
Influence of Fertigation and Training Systems in Greenhouse Cucumber
Among various levels of fertilizers, F4 excelled all other levels for shelf life (7.78 days), crude fibre (1.65%) and overall acceptability (7.70). The quality parameters like shelf life and overall acceptability remained unaffected by any of the training system. However, plants trained to P1 system showed maximum content of crude fibre (1.42%), which was at par with P3 system. The optimal presence of fibre content in cucumber reflects the digestibility and the fibre content of more than 1.5% is highly desirable. The presence of high score for various sensory aspects under higher level of fertigation was also supported by earlier researchers Thompson et al. (16) who have also demonstrated close relationship between results of instrumental measurements and sensory evaluation by human thereby showing equal importance of sensory evaluation for prompt applicability.
The data presented in Table 5 reveal significant differences due to individual as well as interaction effect of different levels of fertilizers and training systems. Treatment combination F4P2 recorded significantly maximum number of fruits per plant. Similarly significantly higher yield per plant was also recorded by F4P2 combination. However, plants administered to F4 level of fertigation in combination with P3 (Single Stem System) recorded higher yield per 1000 square meter, which was at par with treatment combination F4P2 attributable to more number of plants per unit area. The higher number of fruits per plant as shown by F4P2 could be reflected by the positive effect of fertilizer application (El Sanafawi et al., 6) and decapitation of apical bud at early stage of growth on yield of cucumber (Premalatha et al., 15). However, maximum fruit yield of 11.09 tonnes per 1000m2 was recorded by the treatment
Table 5. Effect of various levels of fertilizer and training system on number of fruits and yield in greenhouse cucumber (Pooled mean).
Treatment Number of fruits per plant Yield per plant (kg) Yield per 1000 m2 (t)P1 P2 P3 Mean P1 P2 P3 Mean P1 P2 P3 Mean
F1 16.74 19.35 15.02 17.04 1.83 2.36 1.89 2.03 3.88 4.99 5.37 4.75F2 14.42 15.94 12.58 14.31 1.68 1.93 1.5 1.70 3.57 4.13 4.22 3.97F3 23.43 25.12 19.16 22.57 2.89 3.14 2.43 2.82 6.14 6.63 6.89 6.55F4 29.19 40.24 30.13 33.19 3.60 5.10 3.93 4.21 7.60 10.80 11.09 9.83Mean 20.95 25.16 19.23 2.50 3.13 2.44 5.30 6.64 6.89
CD0.05 CD0.05 CD0.05
F 1.27 0.15 0.32P 1.14 0.13 0.29F × P 2.10 0.25 0.53
[All other interactions (F × Y, P × Y and F × P × Y) were found to be non-significant]
combination F4P3 having statistically similar results with F4P2 because of accommodation of more number of plants in single stem system (P3). It was obvious that increased yield potential was achieved at the expense of number of fruits per plant and number of plants per unit area, which was supported by Choudhari and More, 4; Jilani et al., 10. Eifediyi and Remison (5) also indicated a significant increase in number of fruits per plant and total yield per hectare with increased levels of NPK fertilizers.
The economic analysis presented in Table 6. shows that it was only the cost of structure, which made huge difference in economic gain for greenhouse cucumber as protected cultivation is highly capital intensive farming requiring substantial investment during the initial period of establishment. However, with the involvement of Government in boosting this technology financially, the initial capital investment came down to Rs. 8999 and 6428 only with 65 and 75% subsidy, respectively. The data revealed highest net profit of Rs. 83724.00 in greenhouse cucumber fertigated with F4 level of fertilizer and trained to P3 training system. Moreover, farmers availing 65% or 75% subsidy could realize more returns to the tune of Rs. 100437.00 or Rs. 103008.00, respectively. Engindeniz and Gul (7) were also of the view that that production as well as market risks affects profitability and economic feasibility of vegetables grown under protected structure. Therefore, it is undoubtedly evident that provisions made by the Government in this direction have truly lowered down the financial burden from the shoulders of farmers.
It is therefore concluded from the study that greenhouse cucumber growers could get higher yield and better net returns through fertigation

256
Indian Journal of Horticulture, June 2018Ta
ble
6. E
cono
mic
ana
lysi
s of
var
ious
tre
atm
ents
for
gre
enho
use
cucu
mbe
r cu
ltiva
tion
unde
r 10
00 m
2 ar
ea o
f na
tura
lly v
entil
ated
pol
yhou
se.
S.
No.
Com
pone
nts
Trea
tmen
tsF 1
P1
F 1P2
F 1P3
F 2P1
F 2P2
F 2P3
F 3P1
F 3P2
F 3P3
F 4P1
F 4P2
F 4P3
A. A
MO
RTI
ZED
FIX
ED
CO
ST:
Pol
yhou
se (
Act
ual)
2571
325
713
2571
325
713
2571
325
713
2571
325
713
2571
325
713
2571
325
713
Pol
yhou
se (
65%
Sub
sidy
)89
9989
9989
9989
9989
9989
9989
9989
9989
9989
9989
9989
99P
olyh
ouse
(75
% s
ubsi
dy)
6428
6428
6428
6428
6428
6428
6428
6428
6428
6428
6428
6428
Red
Soi
l19
8019
8019
8019
8019
8019
8019
8019
8019
8019
8019
8019
80R
ice
Hus
k36
736
736
736
736
736
736
736
736
736
736
736
7P
lant
sup
port
syst
em55
055
055
055
055
055
055
055
055
055
055
055
0To
tal (
A)
Act
ual
2860
928
609
2860
928
609
2860
928
609
2860
928
609
2860
928
609
2860
928
609
Tota
l (A
) (6
5% S
ubsi
dy)
1189
611
896
1189
611
896
1189
611
896
1189
611
896
1189
611
896
1189
611
896
Tota
l (A
) (7
5% S
ubsi
dy)
9325
9325
9325
9325
9325
9325
9325
9325
9325
9325
9325
9325
B.
VAR
IAB
LE C
OS
T:La
bour
1875
022
500
1500
018
750
2250
015
000
1875
022
500
1500
018
750
2250
015
000
Pes
ticid
es86
786
786
786
786
786
786
786
786
786
786
786
7Fe
rtiliz
er18
0618
0618
0615
2415
2415
2430
4830
4830
4845
7145
7145
71P
acki
ng80
410
3411
1373
885
491
612
6713
7414
2415
7422
3622
96S
eed
cost
1026
710
267
1353
310
267
1026
713
533
1026
710
267
1353
310
267
1026
713
533
Req
uire
men
t of
For
mal
dehy
de34
0034
0034
0034
0034
0034
0034
0034
0034
0034
0034
0034
00A
pplic
atio
n of
for
mal
dehy
e14
0014
0014
0014
0014
0014
0014
0014
0014
0014
0014
0014
00Tr
icho
derm
a vi
ridi
5050
5050
5050
5050
5050
5050
Pse
udom
onas
inflo
resc
ens
5050
5050
5050
5050
5050
5050
Mic
ro-n
utrie
nts
908
908
908
908
908
908
908
908
908
908
908
908
Bed
pre
para
tion
1800
1800
1800
1800
1800
1800
1800
1800
1800
1800
1800
1800
Mis
cella
neou
s45
0045
0045
0045
0045
0045
0045
0045
0045
0045
0045
0045
00To
tal (
B)
4460
248
582
4442
744
254
4812
043
948
4630
650
163
4598
048
137
5254
948
375
Tota
l cos
t (A
+B)
Act
ual
7321
177
191
7303
672
863
7672
972
557
7491
578
772
7458
976
746
8115
976
985
Tota
l cos
t (A
+B)
(65%
Sub
sidy
)56
498
6047
856
323
5615
060
016
5584
458
202
6205
957
876
6003
364
445
6027
2To
tal c
ost
(A+B
) (7
5% S
ubsi
dy)
5392
757
907
5375
253
578
5744
453
272
5563
159
488
5530
557
462
6187
457
700
Yiel
d (t)
3.88
4.99
5.37
3.56
4.12
4.42
6.11
6.63
6.88
7.60
10.8
011
.08
Sal
e ra
te (
Rs.
/kg)
1515
1515
1515
1515
1515
1515

257
Influence of Fertigation and Training Systems in Greenhouse Cucumber
S.
No.
Com
pone
nts
Trea
tmen
tsF 1
P1
F 1P2
F 1P3
F 2P1
F 2P2
F 2P3
F 3P1
F 3P2
F 3P3
F 4P1
F 4P2
F 4P3
Gro
ss R
ealiz
atio
n (R
s.)
5630
872
371
7788
151
668
5975
664
090
8865
996
151
9971
211
0232
1565
5216
0708
Net
Rea
lizat
ion
(Rs.
) (A
ctua
l)-1
6903
-482
048
45-2
1194
-169
73-8
467
1374
417
379
2512
233
486
7539
383
724
Net
Rea
lizat
ion
(Rs.
) (6
5% S
ubsi
dy)
-190
1189
321
558
-448
1-2
5982
4630
457
3409
241
835
5019
992
106
1004
37N
et R
ealiz
atio
n (R
s.)
(75%
Sub
sidy
)23
8214
464
2412
9-1
910
2312
1081
833
028
3666
344
407
5277
094
677
1030
08B
enefi
t-cos
t-rat
io (
Act
ual)
-0.2
3-0
.06
0.07
-0.2
9-0
.22
-0.1
20.
180.
220.
340.
440.
931.
09B
enefi
t-cos
t-rat
io (
65%
Sub
sidy
)0.
000.
200.
38-0
.08
0.00
0.15
0.52
0.55
0.72
0.84
1.43
1.67
Ben
efit-c
ost-r
atio
(75
% S
ubsi
dy)
0.04
0.25
0.45
-0.0
40.
040.
200.
590.
620.
800.
921.
531.
79
@ 9.0: 7.5: 7.5 kg NPK per 1000 m2 (As per the Fertigation Schedule: Table 2) and training plants to single stem system along with application of vermicompost (0.4 t), Trichoderma viride (0.5 kg), Pseudomonas fluorescens (0.5 l), and micro-nutrients- Grade-5 (0.5 kg) at the time of sowing. Net returns from greenhouse cucumber could further be enhanced by the growers availing subsidies on fixed component of greenhouse house cultivation i.e. structure cost.
ACKNOWLEDGEMENTWe are grateful for the financial support being
provided by Government of Gujarat, India.
REFERENCES 1. Anonymous, 2015. www.gujaratindia.com
(Retrieved on July 08, 2018).
2. Castilla, N., Hernandez, J. and Abou-Hadid, A.F. 2004. Strategic crop and greenhouse management in mild winter climate areas. Acta Hort. 633: 183-96.
3. Cebula, S. 1995. Optimization of plant and shoot spacing in greenhouse production of sweet pepper. Acta Hort. 412: 321-29.
4. Choudhari, S.M. and More, T.A. 2002. Fertigation, fertilizer and spacing requirement of tropical gynoecious cucumber hybrids. Acta Hort. 61: 588.
5. Eifediyi, E.K. and Remison, S.U. 2010. Growth and yield of cucumber (Cucumis sativum L.) as influenced by farm yard manure and inorganic fertilizer. J. Pl. Breed. Crop Sci. 2: 216-20.
6. El Sanafawi, M.E., Salama, G.M. and El Kafarawy, A.A. 2006. Effect of different level of compost on yield, micro organisms and quality of cucumber grown under plastic house conditions. Egypt J. Agric. Res. 84: 30.
7. Engindeniz, S. and Gul, A. 2009. Economic analysis of soilless and soil-based greenhouse cucumber production in Turkey. Scientia Agricola. 66: 606-14.
8. Gittinger, J.P. 1982. Economic analysis of agricultural project. The John Hopkins University Press, Baltimore, USA, 201 p.
9. Goh, K.M. and Haynes, R.J. 1986. Nitrogen and agronomic practice. In: Mineral N in the plant soil system (Haynes RJ. (ed.)). Academic Press Inc., Orlando, Harcourt, UK, pp. 379-42.

258
Indian Journal of Horticulture, June 2018
10. Jilani, M.S., Bakar, A., Waseem, K. and Kiran, M. 2009. Effect of different levels of NPK on the growth and yield of cucumber (Cucumis sativus) under the plastic tunnel. J. Agri. Social Sci. 5: 99-101.
11. Kavitha, M.S., Natarajan, S., Sasikala and Tamilselvi, C. 2007. Influence of shade and fertigation on growth, yield and economics of tomato (Lycopersicon esculentum Mill.). Int. J. Agri. 3: 99-101.
12. Mostafa, N.F., Zohair, M.M. and Hassan, A.S. 2014. Effect of NPK fertigation rate and starter fertilizer on the growth and yield of cucumber grown in greenhouse. J. Agri. Sci. 6: 81-92.
13. Orgaz, F., Fernandez, M.D., Bonachela, S., Gallardo, M. and Fereres, E. 2005. Evapotranspiration of horticultural crops in an
unheated plastic greenhouse. Agric. Water Manag. 72: 81-96.
14. Panse, V.G. and Sukhatme, P.V. 1985. Statistical Methods for Agricultural Workers. Indian Council of Agricultural Research, New Delhi, India, pp. 152-61.
15. Premalatha, M.G.S., Wahundeniya, K.B., Weerakkody, W.A.P. and Wicramathunga, C.K. 2006. Plant training and spatial arrangement for yield improvements in greenhouse cucumber (Cucumis sativus L.) varieties. Tropical Agric. Res. 18: 346-57.
16. Thompson, R.L., Flemming, H.P., Hamann, D.D. and Monroe, RJ. 1982. Method of determination of firmness in cucumber slices. J. Tex. Stud. 13: 311-24
Received : October, 2016; Revised : April, 2018; Accepted : May, 2018

259
Indian J. Hort. 75(2), June 2018: 259-264
INTRODUCTIONCucumber (Cucumis sativus L.) belonging to
a cucurbitaceae family, is one of the most popular vegetable crops grown extensively throughout the world (Soleimani et al., 11). Cucumber grows best in the temperature range of 22-27°C (Singh et al., 8). In India, protective cultivation of vegetable crops in the hilly regions of the country also offers a great scope for use of low cost naturally-ventilated greenhouses because of mild climate (Mishra et al., 3). Worldwide, the area under protective cultivation has increased significantly during last few couple of decades (Singh et al., 10).
At the early growth stages, the water requirement of cucumber is low with a limited capacity of water uptake by roots (Zotarelli et al., 12). There are several growth parameters such as leaf area and leaf area index which significantly affect the water and nutrient requirement of cucumber in relation to progress of growing season (Singh et al., 9). Therefore, judicious use of the available water through more efficient methods of water application becomes necessary for higher yield and water use efficiency. Fertigation allows an accurate and uniform application of nutrients directly to the active root system (Rouphael et al., 4).
However, the production potential of cucumber has been perilously affected by numerous factors viz. greenhouse microclimatic parameters (temperature, relative humidity, solar radiation, vapour pressure deficit (VPD), carbon-dioxide and transpiration), growing media and soil borne diseases (Singh et al., 5; Singh et al., 6). VPD, which is linearly related to transpiration even for values >3.0 kPa (Singh et al., 8), is one of the key parameters which significantly affect the crop water requirement through its effect of crop evapo-transpiration and absolute air humidity (Singh et al., 6; Singh et al., 7; Singh et al., 8). The soil borne diseases have also significantly limited the protected cultivation of cucumber in soil (Hussain et al., 2). Thus, for improved crop productivity and quality of the produce, the cucumber cultivation in an appropriate soilless growing media subjected to favorable microclimatic conditions under a protected structure is strongly recommended (Singh et al., 8).
A soilless media provides a better growing environment compared to soil (Singh et al., 5) with more efficient use of water and nutrients (Singh et al., 10) offering a better control on plant nutrition and diseases. According to one study, the highest and lowest yields of cucumber were obtained under cocopeat and perlite-cocopeat respectively (Alifar et al., 1). A study was thus, undertaken to determine the effect of deficient nutrient supply to soilless cucumbers under partially controlled environment.
Performance of soilless cucumbers under partially controlled greenhouse environment in relation to deficit fertigation
M.C. Singh*, K.G. Singh and J.P. SinghDepartment of Soil and Water Engineering, Punjab Agricultural University, Ludhiana 141 004, Punjab
ABSTRACTAn experimental trial was carried out in a split plot design in three replicates to identify the effect of deficit
nutrient supply to soilless cucumbers under partially controlled greenhouse environment. The main plots included three levels of fertigation viz. F1=100%, F2=85% and F3=70%. The subplots included three cucumber cultivars viz. V1 (Kafka), V2 (Multistar) and V3 (PBRK-4). A total 256.1 mm of water was applied throughout the season. A significant decrease in mean yield was noticed with a decrease in fertigation level from 100% to 70%. Yield was also affected by cultivars, where the mean yield under V2 was statistically higher from that under V3. Among interaction, the yield under F1V2 was significantly higher from that under F3V3. The water and nutrient use efficiencies were also statistically in agreement with yield. The nutrient use efficiency of macro and micronutrients were in orders of S>P>Mg>N>Ca>K and Cu≥Mo>Zn>B>Mn>Fe respectively. The effect of deficit nutrient supply was undoubtedly reflected in the yield with a significant decline from highest to lowest fertigation level. Likewise, the yield was significantly affetcted by the greenhouse microclimate which was partilly under control. Thus, for obtaining higher fruit yield, there is a need to raise the fertigation level within optimal range or maintain optimal microclimatic conditions or the both. Key words: Cucumis sativus, protected environment, nutrient
*Corresponding author's E-mail: [email protected] / [email protected]
DOI : 10.5958/0974-0112.2018.00044.0

260
Indian Journal of Horticulture, June 2018
METHODS AND MATERIALSResearch trial was conducted inside a naturally
ventilated greenhouse located at research farm of department of Soil and Water Engineering, Punjab Agricultural University (PAU). PAU is situated between latitude 30° 56´ N and longitude 75° 52´ E with an altitude of 247 m above mean sea level. The district falls in central part of Indian Punjab and is bounded between latitude 30°33´´ to 31°01´´ N and longitude 75°25´´ to 76°27´´ E having geographical area of 3767 km2. The greenhouse under experimentation having cover thickness and floor area of 200 µm 560 m2 respectively was oriented in north-south direction. The entire surface area of the greenhouse floor was covered with weed mat for avoidance of weed emergence. Plastic troughs were laid on the beds above weed mat. The spacing trays were then laid on the troughs, above which the coco-peat slabs were placed.
The nursery of cucumbers was raised in coco-peat media on 6th September, 2016 under a poly net house. The main experimental trial was laid in a split plot design in three replicates with fertigation levels viz. F1 = 100 %, F2 = 85 % and F3 = 70 % in main plots and cultivars viz. V1 (Kafka), V2 (Multistar) and V3 (PBRK-4) in subplots. The slabs were saturated for at least 24 hour before transplanting and a total 648 ready cucumber plants were transplanted at 3-4 leaf stage keeping a plant density of 3 plants m-2. The plants were trained vertically by means of nylon string attached to the roller hooks. Cucumbers were fertigated with
nutrient solution for a predetermined time on daily basis as per the schedule throughout the growth period through a semi-automated fertigation system (Fig. 1).
The complete fertigation system included tanks, electric motors, pressure gauges, filters, timers, inverter and pressure compensating emitters (Fig. 1). Three fertigation tanks for three different levels of fertigation, each having a capacity ≥1000 liter were used. The nutrient solution was maintained in the tanks during the entire crop growth season. The fertigation system was run using a 1 hp (0.75 kW) electric motor. An inverter was also provided for running the fertigation system in the absence of electricity. From safety point of view, the system was operated at pressure ≤1.5 kg cm-2. Nutrient solution was passed through filters before its delivery to plants for each supply. The system also included timers for atomization of fertigation. The time to operate fertigation system was set in the timers for a pre-determined time. The timers allowed the application of water and nutrient i.e. nutrient solution for a pre-determined time and automatic closing after the completion of pre-set time.
The emitters were calibrated for their proper working in terms of their discharge rate under variable operating pressure. To ensure that same quantity of nutrient solution is received by each plant, the uniformity coefficient of application of nutrient solution was checked at a regular interval during the entire crop growth period. The uniformity coefficient was calculated using the following equation.
Fig. 1. Schematic of experimental trial along with fertigation system.

261
Performance of Soilless Cucumbers Under Partially Controlled Greenhouse Environment
Uniformity coefficient, Uceff = ( Ʃ │q – q│ ) × 100n × qWhere, q = Individual emitter discharge (liter hr-1)q = Mean emitter discharge (liter hr-1)Ʃ (q – q) = Deviation of emitter discharge from mean value n = Number of emitters
Having known, the discharge rate of individual emitter, volume (V13) of nutrient solution applied to cucumber in a given time (t) was calculated using the relationship.V13 = n × q × tWhere, n = Total number of drippers operatingq = Dripper discharge (liter hr-1)t = Time to irrigate or fertigate (hr)
For safe drainage of the leachate coming out of the slabs, a slope of 1% in North-South direction was given to the greenhouse floor from north to south direction to allow a free gravity flow. Two cuts, each at an angle of 45° on two opposite faces of coco-peat slabs along length nearly at bottom, were given for safe drainage. The leachate reaching to the end of trough was expelled through an underground pipeline system and collected in a tank outside greenhouse.
Macronutrients (N, P, K, Ca, Mg and S) and micronutrients (Fe, Zn, Mn, Cu, B and Mo) were used for preparation of nutrient solution. The three basic elements viz. carbon (C), hydrogen (H) and oxygen
(O), which are essentially required by the plants, are obtained from water or air. Calcium free fertilizers were dissolved in container-1, while phosphate and sulphate free fertilizers were dissolved in container-2. Phosphoric acid (86 %) was contained in container-3. Thereafter, nutrient solution was prepared in the following manner.Tank A (100%) = Water (1000 L) + Container-1 + Container-2 + Container-3Tank B (85%) = Water (1000 L) + Container-1 + Container-2 + Container-3Tank C (70%) = Water (1000 L) + Container-1 + Container-2 + Container-3
The measurement pH and electrical conductivity (EC) of nutrient solution was done using a digital waterproof tester (HI 98130). The EC of coco-peat media was determined using a different digital waterproof tester a product of HANNA instruments. The pH and EC values of the nutrient solution were kept in the ranges 6.0-6.40 and 2.5-3.0 dSm-1. Phosphoric acid (86 %) was used to adjust pH (lowering) of nutrient solution.
RESULTS AND DISCUSSIONThe microc l imat ic parameters v iz . a i r
temperature, relative humidity, radiation and plant root zone temperature during crop growth period are depicted in Fig. 2. The greenhouse microclimate was partially controlled having optimum day air temperature 20-30 °C between 10:30 a.m. to 17:30
Fig. 2. Variation of a) air temperature, b) relative humidity, c) radiation and d) plant root zone temperature.
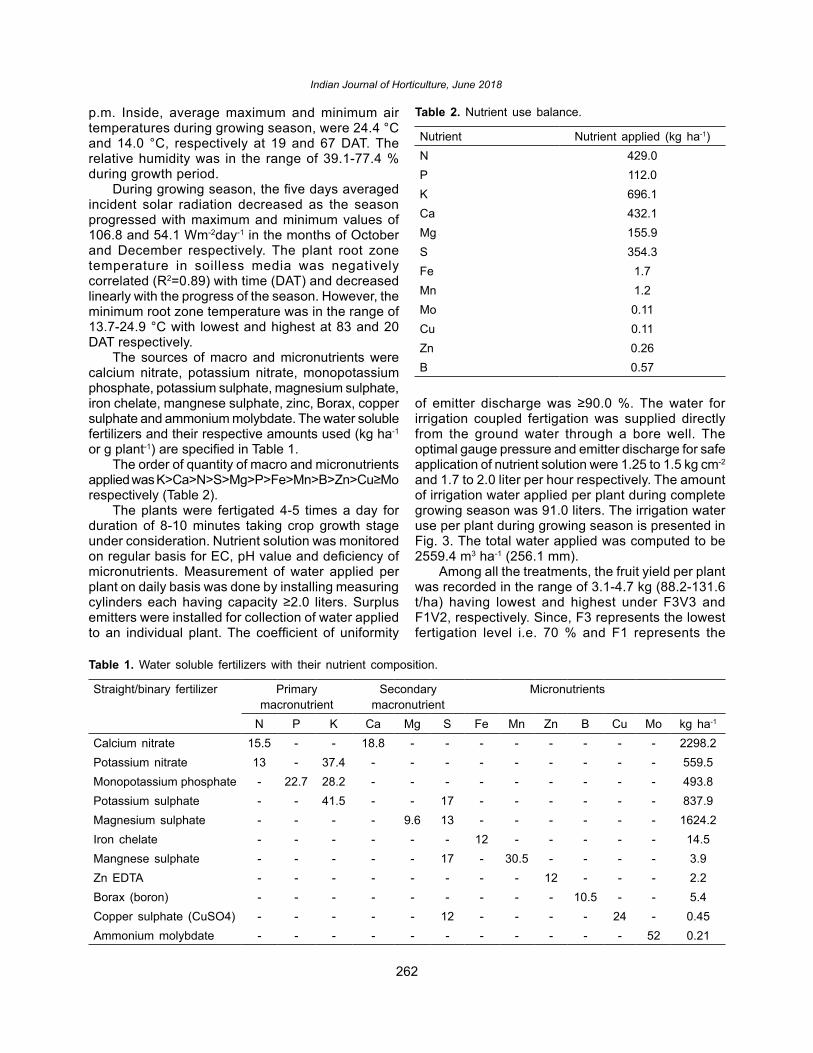
262
Indian Journal of Horticulture, June 2018
p.m. Inside, average maximum and minimum air temperatures during growing season, were 24.4 °C and 14.0 °C, respectively at 19 and 67 DAT. The relative humidity was in the range of 39.1-77.4 % during growth period.
During growing season, the five days averaged incident solar radiation decreased as the season progressed with maximum and minimum values of 106.8 and 54.1 Wm-2day-1 in the months of October and December respectively. The plant root zone temperature in soilless media was negatively correlated (R2=0.89) with time (DAT) and decreased linearly with the progress of the season. However, the minimum root zone temperature was in the range of 13.7-24.9 °C with lowest and highest at 83 and 20 DAT respectively.
The sources of macro and micronutrients were calcium nitrate, potassium nitrate, monopotassium phosphate, potassium sulphate, magnesium sulphate, iron chelate, mangnese sulphate, zinc, Borax, copper sulphate and ammonium molybdate. The water soluble fertilizers and their respective amounts used (kg ha-1 or g plant-1) are specified in Table 1.
The order of quantity of macro and micronutrients applied was K>Ca>N>S>Mg>P>Fe>Mn>B>Zn>Cu≥Mo respectively (Table 2).
The plants were fertigated 4-5 times a day for duration of 8-10 minutes taking crop growth stage under consideration. Nutrient solution was monitored on regular basis for EC, pH value and deficiency of micronutrients. Measurement of water applied per plant on daily basis was done by installing measuring cylinders each having capacity ≥2.0 liters. Surplus emitters were installed for collection of water applied to an individual plant. The coefficient of uniformity
of emitter discharge was ≥90.0 %. The water for irrigation coupled fertigation was supplied directly from the ground water through a bore well. The optimal gauge pressure and emitter discharge for safe application of nutrient solution were 1.25 to 1.5 kg cm-2 and 1.7 to 2.0 liter per hour respectively. The amount of irrigation water applied per plant during complete growing season was 91.0 liters. The irrigation water use per plant during growing season is presented in Fig. 3. The total water applied was computed to be 2559.4 m3 ha-1 (256.1 mm).
Among all the treatments, the fruit yield per plant was recorded in the range of 3.1-4.7 kg (88.2-131.6 t/ha) having lowest and highest under F3V3 and F1V2, respectively. Since, F3 represents the lowest fertigation level i.e. 70 % and F1 represents the
Table 2. Nutrient use balance.
Nutrient Nutrient applied (kg ha-1)N 429.0P 112.0K 696.1Ca 432.1Mg 155.9S 354.3Fe 1.7Mn 1.2Mo 0.11Cu 0.11Zn 0.26B 0.57
Table 1. Water soluble fertilizers with their nutrient composition.
Straight/binary fertilizer Primary macronutrient
Secondary macronutrient
Micronutrients
N P K Ca Mg S Fe Mn Zn B Cu Mo kg ha-1
Calcium nitrate 15.5 - - 18.8 - - - - - - - - 2298.2Potassium nitrate 13 - 37.4 - - - - - - - - - 559.5Monopotassium phosphate - 22.7 28.2 - - - - - - - - - 493.8Potassium sulphate - - 41.5 - - 17 - - - - - - 837.9Magnesium sulphate - - - - 9.6 13 - - - - - - 1624.2Iron chelate - - - - - - 12 - - - - - 14.5Mangnese sulphate - - - - - 17 - 30.5 - - - - 3.9Zn EDTA - - - - - - - - 12 - - - 2.2Borax (boron) - - - - - - - - - 10.5 - - 5.4Copper sulphate (CuSO4) - - - - - 12 - - - - 24 - 0.45Ammonium molybdate - - - - - - - - - - - 52 0.21

263
Performance of Soilless Cucumbers Under Partially Controlled Greenhouse Environment
highest level of fertigation i.e. 100 %, the effect of fertigation was, therefore, obvious along with the effect of cultivars. The interaction F1V2 was observed to be the best treatment. This implies that with reduction in fertigation level, yield was significantly reduced along with reduced water supply. Furthermore, for obtaining higher yield, level of fertigation can be raised even beyond 100 % i.e. F1 which was not in this case. Fig. 4 indicates the relative yield of cucumbers as affected by fertigation and cultivars.
Relative yield = Yi (kg / plant)
Ymax (kg / plant)Where, Yi = Yield of individual plant (kg plant-1)Ymax = Maximum yield (kg plant-1)
The Fig. 4 depicts the reduction in mean yield with decreasing fertigation level as well as effect of cultivars on yield. A significant reduction in mean yield was noticed with a decrease in fertigation level from 100 % to 85%, 100 % to 70% and 85 % to 70 % respectively. Yield was also affected by cultivars, where the mean yield under V2 statistically higher from that under V3. However, among interaction, the yield under F1V2 was significantly higher from that under F3V3. The correlation coefficient (R2), coefficient of variation (CV) and root mean square error (RMSE) were obtained to be 0.74, 6.7 % and 0.26 kg/plant respectively. Likewise, the yield was also significantly affected by the greenhouse microclimate which was partilly under control. Thus, for obtaining higher fruit yield, there is a need to raise the fertigation level beyond 100% or maintaining optimal microclimatic conditions or both.
The mean consumptive use efficiency
=
d
cucu W
WE e. i.
was 40.0 %. Where, Wcu and Wd are the crop water uptake and drainage water respectively. The Irrigation water use efficiency (IWUE) under F1V2 (51.4 kg m-3) was statistically higher from that under F3V3 (34.5 kg m-3) at 5 % level of significance. Similarly, crop water use efficiency (CWUE) under
F1V2 (179.9 kg m-3) was statistically higher from that under 120.6 kg m-3 under F3V3. WUE which is an indicator of crop yield in relation to water use was also statistically in agreement with yield. Moreover, the nutrient use efficiency (NUE) under V2 was statistically higher from that under V3 for each level of fertigation. However, among fertigation levels, NUE under F3 was statistically higher from that under F1 for each cultivar. This implied that the NUE was certainly affected both by cultivars and fertigation level and increased statistically with decrease in fertigation level. The nutrient use efficiency macro and micronutrients were in orders of S>P>Mg>N>Ca>K and Cu≥Mo>Zn>B>Mn>Fe respectively.
A significant decrease in mean yield was noticed with a decrease in fertigation level from 100 % to 85%, 100 % to 70% and 85 % to 70 % respectively. The highest (4.7 kg plant-1) and lowest (3.1 kg plant-1) fruit yield was recorded under treatments F3V3 and F1V2 respectively. Yield was also affected by cultivars, where the mean yield under V2 was statistically higher from that under V3. However, among interaction, the yield under F1V2 was significantly higher from that under F3V3. The effect of deficit nutrient supply was undoubtedly reflected in the yield with a significant decline from highest to lowest fertigation level. The yield was also significantly affected by the greenhouse microclimate which was partially under control. Thus, for obtaining higher fruit yield, there is a need to raise the fertigation level within the optimal range or maintaining optimal microclimatic conditions or the both.
ACKNOWLEDGEMENTThe authors wish to acknowledge financial
support from funding agency (ICAR, New Delhi, India) under All India Coordinated Research Project on Plasticulture Engineering and Technology.
Fig. 3. Plant water use.Fig. 4. Relative yield of cucumber under the effect of
fertigation and cultivars.

264
Indian Journal of Horticulture, June 2018
REFERENCES1. Alifar, N., Ghehsareh, A.M. and Honarjoo, N.
2010. The Effect of growth media on cucumber yield and its uptake of some nutrient elements in soilless culture. J. Sci Technol. 1: 19-25.
2. Hussain, A., Iqbal, K., Aziem, S., Mahato, P. and Negi, A.K. 2014. A Review on the science of growing crop without soil (soilless culture) a novel alternative for growing crops. Intl. J. Agric. Crop Sci. 7: 833-42.
3. Mishra, G.P., Singh, N., Kumar, H. and Singh, S.B. 2010. Protected cultivation for food and nutritional security at Ladakh. Defence Sci. J. 61:219-25.
4. Rouphael, Y., Cardarelli, M., Rea, E. and Colla, G. 2008. The influence of irrigation system and nutrient solution concentration on potted geranium production under various conditions of radiation and temperature. Scientia Hort. 118: 328-37.
5. Singh, M.C., Kachwaya, D.S. and Kalsi, K. 2018b. Soilless cucumber cultivation under protective structures in relation to irrigation coupled fertigation management, economic viability and potential benefits-A review. Int. J. Curr. Microbiol. App. Sci., 7: 2451-68.
6. Singh, M.C., Singh, J.P., Pandey, S.K., Mahay, D. and Srivastava, V. 2017a. Factors affecting the performance of greenhouse cucumber cultivation-a review. Int. J. Curr. Microbiol. App. Sci. 6: 2304-23.
7. Singh, M.C., Singh, J.P., Pandey, S.K., Nikhil, G.C., Sharma, P., Shrivastav, V. and Sharma, P. 2018a. A Review of Three Commonly Used Techniques of Controlling Greenhouse Microclimate. Int. J. Curr. Microbiol. App. Sci. 7: 3491-505.
8. Singh, M.C., Singh, J.P. and Singh, K.G. 2017b. Optimal operating microclimatic conditions for drip fertigated cucumbers in soilless media under a naturally ventilated greenhouse. Indian J. Ecol. 44: 821-26.
9. Singh, M.C., Singh, K.G. and Singh, J.P. 2018c. Indirect method for measurement of leaf area and leaf area index of soilless cucumber crop. Adv. Plants Agric. Res. 8: 188-91.
10. Singh, M.C., Yousuf, A. and Singh, J.P. 2016. Greenhouse microclimate modeling under cropped conditions-A review. Res. Environ. Life Sci. 9: 1552-57.
11. Soleimani, A., Ahmadikhah, A. and Soleimani, S. 2009. Performance of different greenhouse cucumber cultivars (Cucumis sativus L.) in southern Iran. African J. Biotechnol. 8: 4077-83.
12. Zotarelli, L., Dukes, M.D., Scholberg, J.M.S., Munoz-Carpena, R. and Icerman, J. 2009. Tomato nitrogen accumulation and fertilizer use efficiency on a sandy soil, as affected by nitrogen rate and irrigation scheduling. Agric. Water Manage. 96: 1247-58.
Received : March, 2017; Revised : May, 2018; Accepted : May, 2018

265
Indian J. Hort. 75(2), June 2018: 265-272
INTRODUCTIONTrichomes are specialized epidermal cells present
on plant surface, giving rise to bristle like outgrowths. These structures impart plants their characteristic pubescent or hairy texture, an insect non-preference (=antixenosis) trait. Non-preference refers to various physical features of host-plant which make them undesirable or unattractive either for oviposition or feeding by phytophagous insects. Trichomes may also complement the chemical defense of a plant by possessing glands which exude terpenes, phenolics, and alkaloids etc. that serve as insect olfactory or gustatory repellents. In the sense, these trichomes are involved in direct plant defense against insect attack, either by physical-hindrance, entrapment or by secreting toxic or behavior modifying chemicals (Duffey, 7; Wagner, 20), forming an essential integral component of host-plant resistance viz., antixenosis. Thus, the trichome type and density of host-pants may explain the specific host-pant associations, adaptations and herbivory patterns of phytophagous insects. Further, the variations in the trichome features serve as leads to study evolutionary trends, to evaluate existing systematic classifications and may provide supplementary evidence in tackling taxonomic problems (Anjana et al., 3).
The family Solanaceae exhibits a remarkable diversity in the tr ichome type/ density and
trichome dependent herbivore defense which have been extensively studied particularly in tomato, Lycopersicon esculentum L. (Luckwill, 13), Datura wrightii Regel(van Dam et al.,19), tobacco, Nicotiana tabacum L. (Akers et al., 1), wild potato, Solanum berthaultii Hawkes, cultivated potato, S. tuberosum (Yencho et al., 21). However, similar studies in the sister species S. melongena (common or cultivated brinjal/ eggplant) and its wild relatives are limited. In the present study, attempts were made to understand the morphological structure, distribution and chemical composition of trichomes in different wild relatives of eggplant viz., S. gilo, S. indicum, S. torvum, S. viarum, S. mammosum, S. macrocarpon compared to cultivated S. melongena (cv. Arka keshav).
MATERIALS AND METHODSThe wild species of eggplants viz., Solanum
gilo (scarlet eggplant), S. indicum (Poison Berry), S. mammosum (Cow’s udder), S. viarum (Sodom apple), S. torvum (Turkey berry), S. macrocarpon (African eggplant) were compared to cultivated eggplant, S. melongena cv. Arka keshav. All the test plants were field-grown at the experimental fields of Indian institute of Horticultural Research, Hessaraghatta, Bengaluru, India (12o 58’ N; 77o 35’E). To confirm the trichome diversity within the common eggplant, S. melongena, a total of 188 accessions were observed (List enclosed as appendix I). For each test plant, three fully developed leaves were collected randomly, kept in polythene covers and brought to the laboratory for further studies. A Cork borer (0.5 cm diameter)
Morphological diversity of trichomes and phytochemicals in wild and cultivated eggplant species
P.D. Kamala Jayanthi*, M.A. Ravindra, Vivek Kempraj, T.K. Roy**, K.S. Shivashankara** and T.H. Singh***
Division of Entomology and Nematology, Hesseraghatta Lake PO, Bengaluru 560 089, Karnataka
ABSTRACTAn attempt was made to understand the diversity of trichomes both at morphological and chemical levels
in wild (Solanum viarum, S. mammosum, S. indicum, S. gilo, S. torvum) and cultivated eggplant (S. melongena) species. Cultivated and wild eggplant species have morphologically and chemically diverse trichomes. The presence of specific type of trichomes, their densities and chemical composition varied across species. The wild species viz., S. viarum and S. mammosum have seven (Type II to VIII) morphologically distinguishable types of trichomes including two types of glandular trichomes (Type VI, VII) as against uniform occurrence of branched stellate trichomes (Type VIII) alone in cultivated species. Differences among the phytochemicals viz., phenols and flavonoid levels were also observed across the eggplant species and type of trichomes. Key words: Brinjal, wild species, glandular trichemes, phenols, flavonoids.
*Corresponding author’s E-mail: [email protected]**Division of Plant Physiology and Biochemistry, Hesseraghatta Lake PO, Bengaluru ***Division of Vegetable Crops, Indian Institute of Horticultural Research, Hesseraghatta Lake PO, Bengaluru
DOI : 10.5958/0974-0112.2018.00045.2

266
Indian Journal of Horticulture, June 2018
was used to punch a disc of leaf and three such leaf discs were taken randomly from each leaf for trichome studies. Observations were made on the presence/ absence of different types of trichomes/ spines, their colour and density on both adaxial (=upper) and abaxial (=lower) surfaces separately using stereomicroscope. Different types of trichomes were identified as per standard procedures (Simmons and Gurr, 16).
Each individual trichome types from each species were excised for chemical analysis. Mixed-type trichome samples were isolated by scraping frozen leaf tissue in liquid nitrogen. The stellar trichomes were isolated by rubbing the leaf surface using needle/baby brush. The glandular heads from type VI and VII trichomes were collected using a modified procedure (Gang et al., 8).
Fresh leaves from all the species of eggplants were subjected to SEM analyses to better understand the morphological structure of different types of trichomes. Small pieces of leaves were fixed in formaldehyde + acetic acid +alcohol (FAA) for 24h, dehydrated in an ethanol series, critical point dried, mounted on stubs with self-adhesive double sided carbon discs and sputter coated with gold. Observations and digital photographs were taken with (Quanta FEI-Netherland) scanning electron microscope at 15 kV.
Different types of trichomes isolated as described above from all eggplant species were further analyzed to estimate the respective chemical constituents. A sample of 2000 trichomes picked into 1ml of 80% methanol and the glandular trichomes were isolated according to Gang et al., (8).
Total phenols present in the methanol extract were estimated by the Folin-ciocalteu method (Singleton and Rossi, 17). Methanol extract was mixed with FCR reagent, and the subsequent intensity of color development with 20% sodium carbonate reagent was read by measuring the absorbance at 700 nm using a spectrophotometer (Beckman DU64, Beckman Instruments International, SA, Switzerland). Results were expressed as milligrams of gallic acid equivalents.
Total flavonoid extract was determined as per standard procedures (Chun et al., 6). Methanol extract (1 mL) was mixed with 0.3 mL of 5% NaNO2 followed by 0.3 mL of 10% AlCl3. After 1 min, 2 mL of 1M NaOH was added and diluted to 10 mL with double distilled water and mixed thoroughly. The absorbance of the pink color was measured spectrophotometrically at 510 nm and expressed as catechin equivalents.
RESULTS AND DISCUSSIONA total of seven types of different glandular and
non-glandular trichomes (Type II- Type VIII) were
found on the leaves of S. viarum and S. mammosum. However, Type VIII (arboriform or dendritic or stellar type branched) trichomes were present only on abaxial surface in both the species (Fig. 1). In S. macrocarpon, the leaves showed no trichomes or only a few trichomes of Type VI dispersed sparsely depending on the age of the leaf and ecotype. Whereas in all other species viz., S. gilo, S. torvum, S. indicum, S. melongena only branched stellar type trichomes (Type VIII) were prevalent (Table 1). In the S. melongena accessions, variations were observed with in the stellar type branched trichomes for both colour (either purple or whitish green or mixed) and number of branches (varying from 2-9) (Fig. 2). In S. viarum, S. mammosum and S. indicum spines were noticed on both adaxial and abaxial surfaces. The long spines were found interspersed with short spines with approximate length of 0.8–3.1 cm. In S. viarum, the numbers of spines were 32 and 88 respectively on adaxial and abaxial surfaces. In S. mammosum,
Fig. 1. Variation in leaf trichomes of different eggplant species, S. viarum leaf covered with multiple trichome types, II to VIII. (A), S. mammosum leaf trichomes (type II-VII) (B), S. melongena cv. Arka keshav leaf trichomes (type VIII) (C).
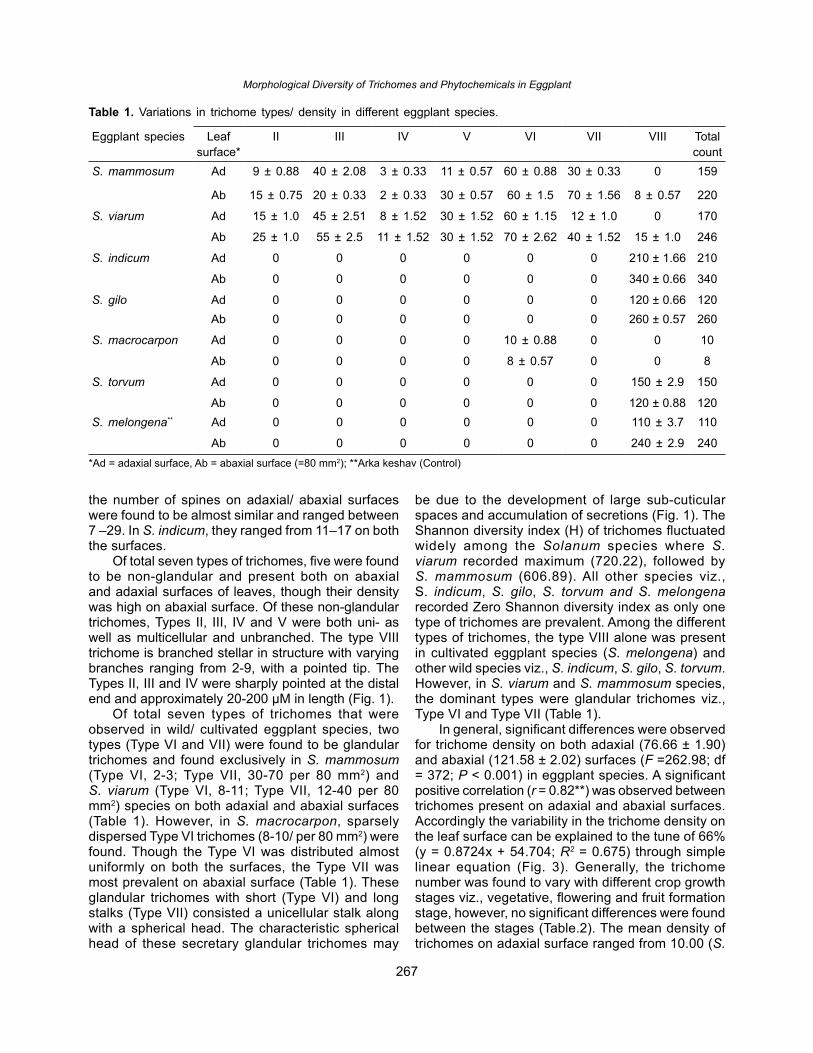
267
Morphological Diversity of Trichomes and Phytochemicals in Eggplant
Table 1. Variations in trichome types/ density in different eggplant species.
Eggplant species Leaf surface*
II III IV V VI VII VIII Total count
S. mammosum Ad 9 ± 0.88 40 ± 2.08 3 ± 0.33 11 ± 0.57 60 ± 0.88 30 ± 0.33 0 159
Ab 15 ± 0.75 20 ± 0.33 2 ± 0.33 30 ± 0.57 60 ± 1.5 70 ± 1.56 8 ± 0.57 220
S. viarum Ad 15 ± 1.0 45 ± 2.51 8 ± 1.52 30 ± 1.52 60 ± 1.15 12 ± 1.0 0 170
Ab 25 ± 1.0 55 ± 2.5 11 ± 1.52 30 ± 1.52 70 ± 2.62 40 ± 1.52 15 ± 1.0 246
S. indicum Ad 0 0 0 0 0 0 210 ± 1.66 210
Ab 0 0 0 0 0 0 340 ± 0.66 340
S. gilo Ad 0 0 0 0 0 0 120 ± 0.66 120Ab 0 0 0 0 0 0 260 ± 0.57 260
S. macrocarpon Ad 0 0 0 0 10 ± 0.88 0 0 10
Ab 0 0 0 0 8 ± 0.57 0 0 8
S. torvum Ad 0 0 0 0 0 0 150 ± 2.9 150
Ab 0 0 0 0 0 0 120 ± 0.88 120S. melongena** Ad 0 0 0 0 0 0 110 ± 3.7 110
Ab 0 0 0 0 0 0 240 ± 2.9 240*Ad = adaxial surface, Ab = abaxial surface (=80 mm2); **Arka keshav (Control)
the number of spines on adaxial/ abaxial surfaces were found to be almost similar and ranged between 7 –29. In S. indicum, they ranged from 11–17 on both the surfaces.
Of total seven types of trichomes, five were found to be non-glandular and present both on abaxial and adaxial surfaces of leaves, though their density was high on abaxial surface. Of these non-glandular trichomes, Types II, III, IV and V were both uni- as well as multicellular and unbranched. The type VIII trichome is branched stellar in structure with varying branches ranging from 2-9, with a pointed tip. The Types II, III and IV were sharply pointed at the distal end and approximately 20-200 µM in length (Fig. 1).
Of total seven types of trichomes that were observed in wild/ cultivated eggplant species, two types (Type VI and VII) were found to be glandular trichomes and found exclusively in S. mammosum (Type VI, 2-3; Type VII, 30-70 per 80 mm2) and S. viarum (Type VI, 8-11; Type VII, 12-40 per 80 mm2) species on both adaxial and abaxial surfaces (Table 1). However, in S. macrocarpon, sparsely dispersed Type VI trichomes (8-10/ per 80 mm2) were found. Though the Type VI was distributed almost uniformly on both the surfaces, the Type VII was most prevalent on abaxial surface (Table 1). These glandular trichomes with short (Type VI) and long stalks (Type VII) consisted a unicellular stalk along with a spherical head. The characteristic spherical head of these secretary glandular trichomes may
be due to the development of large sub-cuticular spaces and accumulation of secretions (Fig. 1). The Shannon diversity index (H) of trichomes fluctuated widely among the Solanum species where S. viarum recorded maximum (720.22), followed by S. mammosum (606.89). All other species viz., S. indicum, S. gilo, S. torvum and S. melongena recorded Zero Shannon diversity index as only one type of trichomes are prevalent. Among the different types of trichomes, the type VIII alone was present in cultivated eggplant species (S. melongena) and other wild species viz., S. indicum, S. gilo, S. torvum. However, in S. viarum and S. mammosum species, the dominant types were glandular trichomes viz., Type VI and Type VII (Table 1).
In general, significant differences were observed for trichome density on both adaxial (76.66 ± 1.90) and abaxial (121.58 ± 2.02) surfaces (F =262.98; df = 372; P < 0.001) in eggplant species. A significant positive correlation (r = 0.82**) was observed between trichomes present on adaxial and abaxial surfaces. Accordingly the variability in the trichome density on the leaf surface can be explained to the tune of 66% (y = 0.8724x + 54.704; R2 = 0.675) through simple linear equation (Fig. 3). Generally, the trichome number was found to vary with different crop growth stages viz., vegetative, flowering and fruit formation stage, however, no significant differences were found between the stages (Table.2). The mean density of trichomes on adaxial surface ranged from 10.00 (S.

268
Indian Journal of Horticulture, June 2018
Fig. 2. SEM images of the non glandular stellar (Type VIII) trichomes with varying number of branches in wild and cultivated eggplant species.
macrocarpon) to 210.0 (S. indicum) and on abaxial surfaced ranged from 8.00 (S. macrocarpon) to 340.00 (S. indicum) (Table 2).
The total phenol content of different eggplant species revealed that S. viarum trichomes contained significantly highest content of phenols (2839±1.85 µg) followed by S. mammosum ( 1771 ± 0.88 µg) and S. gilo (1010 ±1.20 µg). The other species of eggplant, S. torvum (710±3.18 µg), S .indicum (700±1.85 µg), S. melongena (cv. Arka keshav) recorded comparatively lower phenol contents (700±3.71 µg). In S. viarum, among the different trichome types, Type
VIII contributed highest amount of phenol content (1200±1.56 µg) followed by Type VII (1087±2.08 µg), Type VI (300 ±2.89 µg) and Type II (252±2.08 µg). In S. mammosum, Type VIII contributed highest amount of phenols (1000±1.52 µg) followed by Type II (335±1.66 µg), Type VI (238±1.20 µg) and Type VII (198±1.56 µg) (Fig.4A).
Conversely, among the eggplant species, significantly the highest flavonoid content was recorded in S. mammosum (1433±1.4 µg) followed by S. viarum (990±1.52 µg) and S. indicum (600±1.4µg). The cultivated species, S. melongena (cv. Arka Keshav)

269
Morphological Diversity of Trichomes and Phytochemicals in Eggplant
Fig. 3. Relationship between trichome density on abaxial and adaxial surface.
Table 2. Trichome density at different stages of plant growth in eggplant species.
Density of trichomes (80 mm2)Eggplant species
Before flowering After flowering After fruitingAdaxial Abaxial Adaxial Abaxial Adaxial Abaxial
S. melongena* 157.10 ± 35.10 317.60 ± 9.40 75.30 ± 9.90 292.10 ± 8.20 263.30 ± 5.07 392.70 ± 3.60S. mammosum 85.10 ± 7.60 167.70 ± 17.48 147.70 ± 31.90 267.30 ± 20.61 369.60 ± 17.50 392.01 ± 28.91S. viarum 113.30 ± 4.80 177.70 ± 13.40 383.10 ± 3.80 406.30 ± 3.38 377.01 ± 34.02 412.10 ± 4.85S. gilo 25.70 ± 3.39 296.60 ± 3.33 29.40 ± 3.10 289.60 ± 8.82 28.30 ± 1.93 340.10 ± 4.85S. indicum 168.30 ± 8.20 336.30 ± 1.20 109.40 ± 5.02 352.60 ± 9.85 97.20 ± 31.70 399.3 ± 5.07S. macrocarpon 31.70 ± 2.50 22.10 ± 5.00 17.50 ± 7.60 3.70 ± 1.30 30.10 ± 15.07 10.1 ± 1.02
*Arka keshav (Control)
recorded the lowest flavonoid content (300±4.2µg). In S. mammosum, the trichome Types VIII, II, VI and VII contributed towards total flavonoid content in the descending order viz., 858±3.79, 311±1.76, 141±0.88, 123 ± 0.88 µg/ml respectively. Whereas, in S. viarum, the trichome Type VIII contributed to maximum amount of flavonoids (450±1.45 µg) followed by Types VI (200±1.20 µg), II (190±2.08 µg) and VII (150±2.08 µg) (Fig.4B). The chemical analysis of trichomes among the eggplant species clearly showed that variations do exist in both phenols as well as flavonoid contents. Further, variations were also evident among the different types of trichomes.
Plant structural traits, such as spinescence, pubescence, trichomes etc play a role in protecting plants from herbivore attack thereby serving as anti-herbivore defense (Hanley et al., 11). Among several plant structural traits, trichomes contribute to plant
resistance against herbivory by physical as well as chemical deterrents particularly in Family, Solanaceae (Tian et al., 18). Plant glandular trichomes in particular have been studied widely for their metabolic diversity as targets for breeding or engineering of resistance to herbivores particularly in Solanaceous plants like tomato (Glas et al., 9). Nevertheless, the studies explaining the trichome based differences in both wild as well as cultivated eggplant species, a member of Solanaceae are rather limited in spite of their observed differential susceptibility to herbivores like leaf hopper, Amrasca biguttula Ishida (Homoptera: Cicadellidae), eggplant shoot and fruit borer, Leucinodes orbonalis Guenee (Lepidoptera: Pyralidae) and several experiments involving wild species of Solanum viz., S. macrocarpon, S. viarum etc to obtain shoot and fruit borer resistance have been carried out (Gowda et al.,10; Anis et al., 2;

270
Indian Journal of Horticulture, June 2018
Fig. 4. Estimation of total phenols and flavonoids in trichomes of wild/ cultivated eggplant species. Total phenols (A), Total flavonoids (B).
Behera and Singh, 4; Praneetha, 14; Pugalendhi et al., 15).
In this present study, we aim to outline the comparative differences of the morphological structure, distribution and chemical composition of trichomes in both wild as well as cultivated eggplant species. The results revealed the underlying differences not only in trichome types, but also the density as well as their chemical composition in wild eggplant species viz., S. viarum, S. mammosum to cultivated eggplant species, S. melongena. Clear differences were observed among the species for trichome density as well as type of trichomes on both abaxial and adaxial surfaces of leaf (80 mm2). A total of seven types of glandular and
non-glandular trichomes were observed in wild as well as cultivated Solanum species (Fig. 1). Of different types of trichomes, stellar trichomes (Type VIII) were found to be abundant in S. melongena, S. indicum S. gilo and S. torvum. Whereas, in S. mammosum and S. viarum, besides stellar trichomes, the other Types II to VII were also present exhibiting a tremendous diversity in both glandular and non-glandular trichomes. With regard to trichome diversity, the cultivated eggplant species viz., S. melongena along with other species like S. indicum, S. gilo and S. torvum did not exhibit any trichome diversity and almost homogeneous with Type VIII stellar trichomes and S. macrocarpon was almost found to be glabrous. Conversely, a study on
(A)
(B)

271
Morphological Diversity of Trichomes and Phytochemicals in Eggplant
trichome characteristics of eleven species belonging to the genus Solanum reported a wide range of variation with many of the members exhibiting up to 5 – 6 different types of trichomes, with maximum trichome type diversity in S. torvum, S. nigrum, S. melongena, S. indicum, S. pubescence and S. macranthum (Anjana et al., 3).
Phenols and flavonoids are the major secondary metabolites present in plants protecting the tissues from insect attacks contributing towards antifeedant activity against larvae. Estimation of total phenols and flavonoid contents in trichomes showed that these are higher in wild eggplant species than cultivated. Among the different phytochemicals, the phenols exhibited significant negative correction with eggplant shoot and fruit borer, L. orbonalis (Chandrashekhar et al., 5). In the present study, the differences were observed for types of trichomes, their densities and chemical composition across eggplant species. Similar studies on other Solanaceous members’ viz., tomato showed that cultivated tomato and its wild relatives have morphologically and chemically diverse trichomes (Kim et al., 12). Several previous studies clearly showed the role of glandular trichomes as an apparent first line defense at the surface of the plant (Wanger, 20). Thus, the detailed studies to understand the precise chemical characterization of each trichome type and exact role of glandular/ non-glandular trichomes (physical as well as chemical hindrance) in bringing down the reported herbivore incidence in wild/ cultivated eggplant species are being envisaged.
ACKNOWLEDGEMENTSAuthors thank ICAR, New Delhi for financial
support through National Fellow project and Director, IIHR for providing research facilities to carry out the work.
REFERENCES 1. Akers, P.C., Weybrew, J.A. and Long, R.C. 1978.
Ultra structure of glandular trichomes of leaves of Nicotiana tabacum L., cv Xanthi. American J. Bot. 65: 282-92.
2. Anis, M., Baksh, S. and Iqbal, M. 1994. Cytogenetic studies on the F1 hybrid Solanum incanum × S. melongena var. American Wonder. Cytologia, 59: 433-36.
3. Anjana, V.N., Kumari, N.O. and Mathew, P.M. 2008. Intra-specific variations of trichomes in the genus Solanum L. In: Biodiversity conservation, Binoj Kumar, MS, Gopalakrishnan, PK (ed.) pp. 109-14.
4. Behera, T.K. and Singh, N. 2002. Interspecific hybridization in eggplant for resistance to shoot and fruit borer. Capsicum & Eggplant Newslet. 21: 102-05.
5. Chandrashekhar, C.H., Malik, V.S. and Singh, R. 2008. Morphological and biochemical factors of resistance in eggplants against Leucinodes orbonalis (Lepidoptera: Pyralididae). Ento. Gen. 31: 337-45.
6. Chun, O.K., Kim, D.O., Moon, H.Y., Kang, H.G. and Lee, C.Y. 2003. Contribution of individual polyphenolics to total antioxidant capacity of plums. J. Agr. Food Chem. 51: 7240-45.
7. Duffey, S.S. 1986. Plant glandular trichomes: their partial role in defence against insects. In: Insects and the plant surface, Juniper, BE, Southwood, TRE. (ed.), London. pp. 151-72.
8. Gang, D.R., Wang, J., Dudareva, N., Nam, K.H., Simon, J., Lewinsohn, E. and Pichersky, E. 2001. An investigation of the storage and biosynthesis of phenylpropenes in sweet basil (Ocimum basilicum L.). Plant Physiol. 125: 539-55.
9. Glas, J.J., Schimmel, B.C.J., Alba, J.M., Escobar-Bravo, R., Schuurink, R.C. and Kant, M.R. 2012. Plant glandular trichomes as targets for breeding or engineering of resistance to herbivores. Int. J. Mol. Sci. 13: 17077-103.
10. Gowda, P.H.R., Shivashankar, K.T. and Joshi, S. 1990. Interspecific hybridization between Solanum melongena and Solanum macrocarpon. Study of the F1 hybrid plants. Euphytica, 48: 59-61.
11. Hanley, M.E., Lamont, B.B., Fairbanks, M.M. and Rafferty, C.M. 2007. Plant structural traits and their role in anti-herbivore defence. Perspect. Plant Ecol. 8: 157-78.
12. Kim, J., Kiyoon, K., Eliana, Gonzales-Vigil, Feng, S., Daniel, J.A., Cornelius, S.B. and Robert, L.L. 2012. Striking natural diversity in glandular trichome acylsugar composition is shaped by variation at the Acyltransferase2 locus in the wild tomato Solanum habrochaites. Plant Physiol. 160: 1854-70.
13. Luckwill, L.C. 1943. The genus Lycopersicon: An historical, biological and taxanomic survey of the wild and cultivated tomatoes. Aberdeen University press, UK.
272
Indian Journal of Horticulture, June 2018
14. Praneetha, S. 2002. Breeding for shoot and fruit borer (Leucinodes orbonalis G.) resistance in brinjal (Solanum melongena L.). Ph.D. thesis, Tamil Nadu Agricultural University, Coimbatore.
15. Pugalendhi, L., Veeraragavathatham, D., Natarjan, S. and Praneetha, S. 2010. Utilizing wild relative (Solanum viarum) as resistant source to shoot and fruit borer in brinjal (Solanum melongena Linn.). EJPB 4: 643-48.
16. Simmons, T.A. and Geoff, M.G. 2005. Trichomes of Lycopersicon species and their hybrids: effects on pests and natural enemies. Agr. forest. Ento. 7: 265-76.
17. Singleton, V.L. and Rossi, J.A. 1965. A colorimetry of total phenolics with phosphomolybdic-phosphotungstic acid reagents. American J. Enol. Vitic. 16: 144-58.
18. Tian, D., Tooker, J., Peiffer, M., Chung, S.H. and Felton, G.W. 2012. Role of trichomes in defense
against herbivores: comparison of herbivore response to woolly and hairless trichome mutants in tomato (Solanum lycopersicum). Planta, 236: 1053-66.
19. Van Dam, N.M., Hare, J.D. and Elle, E. 1999. Inheritance and distribution of trichome phenotypes in Datura wrightii. J Hered. 90: 220-27.
20. Wagner, G.J. 1991. Secreting glandular trichomes: more than just hairs. Plant Physiol. 96: 675-79.
21. Yencho, G.C. and Tingey, W.M. 1994. Glandular trichomes of Solanum berthaultii alter host preference of the Colorado potato Beetle, Leptinotarsa decemlineata. Ento. Exp. Appl. 70: 217-25.
Received : November, 2015; Revised : February, 2018; Accepted : April, 2018

273
DOI : 10.5958/0974-0112.2018.00046.4
Indian J. Hort. 75(2), June 2018: 273-278
INTRODUCTIONMarigold (Tagetes spp.) is an Asteraceous plant
and is native to Mexico. It is of the farmer’s first choices for commercial cultivation on account of its easy cultivation, short duration, vast adaptability, wide spectrum of shape, size and good keeping quality. Apart from this, marigold is also highly popular in pharmaceutical and poultry industries. Conventionally, marigold is propagated by seeds, though vegetative propagation through herbaceous shoot-tip cuttings is also being successfully employed in maintaining GMS lines and ornamentally high valued petaloid male sterile varieties for commercial cultivation. However, vegetative propagation is highly season dependent, slow in multiplication and may spread phyllody like diseases rapidly. Plant tissue culture has the potential for rapid multiplication of a large number of disease-free, true-to-the type and quality plants in the shortest possible time and can be employed as an alternative tool. But, the high phenol exudation from explants in the initial culture establishment stage and high plant mortality in hardening stage are the
most limiting factors in developing the commercial scale marigold micropropagation (Kumar, 4). The quinines produced due to the oxidation of phenols, inhibit the enzyme activity leading to the death of explants due to auto-toxicity. In other crops, some of the strategies like treating the explant with anti-oxidants, change of sucrose levels, use of liquid rather than agar solidified medium, use of activated charcoal or polyvinylpyrrolidone, dark incubation and frequent culture transfer helps in reducing the media staining and improved explant survival (Preece and Compton, 11). Earlier, few workers reported the in vitro propagation of marigold (Misra and Datta, 7; Kumar et al., 5; Gupta et al., 1 and Majumder et al., 6). But it is noteworthy to point out that, there are no reports available on mitigating phenol exudation, efficient root induction in liquid medium and hardening strategies in Tagetes spp. Keeping the above problems in view in the present investigation some new techniques were employed to improve the in vitro multiplication of African and French marigold genotypes.
MATERIALS AND METHODSThe present studies were carried out at the
Central Tissue Culture Laboratory, ICAR-National
Circumventing phenolic exudation and poor survival in micropropagation of marigold
K. Ravindra Kumar*,**, Kanwar Pal Singh, D.V.S. Raju***, Prabhat Kumar, Sapna Panwar and Reeta Bhatia
Division of Floriculture and Landscaping, ICAR-Indian Agricultural Research Institute, New Delhi 110 012
ABSTRACTMarigold is one of the popular ornamental crops grown mostly for loose flower production and garden
display. It is usually propagated through seeds, but some germplasm including male sterile lines (petaloid and gynomonoecious forms) can only be maintained through vegetative means of propagation. Year round production and maintenance of true-breeding lines can be possible by employing efficient tissue culture techniques. However, exudation of phenols from explants and poor ex vitro survival of marigold plants are the major hindrances. Therefore, the present investigation was carried out with an objective to standardize the protocol for controlling phenolic exudation from nodal explants and also enhancing the ex vitro survival of four marigold genotypes viz., Pusa Arpita, Pusa Basanti Gainda, Siracole Orange and Siracole Yellow. The exudation of phenolic compounds from nodal explants was significantly controlled by incorporating 125 mgl-1 ascorbic acid into the culture induction medium supplemented with BAP (2.0 mgl-1) + NAA (0.1 mgl-1) in all the genotypes. Marigold micro-shoots cultured on ½ MS liquid rooting medium supplemented with 0.5 mgl-1 IBA showed highest rooting percentage (99.00%) which was followed by ½ MS + 0.5 mgl-1 NAA (98.75%). Early root induction (5.88 days), longest roots (2.78 cm), moderately high number of roots (47.56) per shoot and highest ex vitro survival (98.75%) were observed with ½ MS + 0.5 mgl-1 NAA. Among the different hardening strategies employed, lowest mortality (11.55%), maximum plant height (15.15 cm) and leaf number (20.95) were noted in plants that were hardened in disposable polypropylene glasses. Key words: Tagetes spp., phenol, liquid culture, rooting, hardening.
*Corresponding author's E-mail: [email protected]**Dr. Y.S.R. Horticultural University, Horticultural Research Station-Kovvur, West Godavari district, Andhra Pradesh***ICAR-Directorate of Floriculture Research, Pune, Maharashtra

274
Indian Journal of Horticulture, June 2018
Research Centre on Plant Biotechnology, New Delhi during 2014-2017. Nodal segments having dormant buds were chosen as explants and collected from three African marigold cultivars, viz., Pusa Basanti Gainda (PBG), Siracole Orange (SO) and Siracole Yellow (SY) and one French marigold cv. Pusa Arpita (PA). The explants were collected in early hours from the actively growing mother plants before the commencement of reproductive phase. Explants were washed with Teepol®(0.1%) solution for 5 minutes followed by washing under running tap water for 10 minutes to remove the residue of the detergent. The explants were pre-treated with Bavistin (0.2%) + Ridomil (0.2%) + 8-hydroxy quinoline citrate (200 mgl-1) on a horizontal shaker (100 rpm) for 60 minutes followed by surface sterilization using HgCl2 (0.1%) for 4 minutes under laminar air-hood. The sterilised explants were thoroughly washed with sterile double distilled water for 3 to 4 times to remove the chemical residues. The pre-treatment and surface sterilization treatments were employed as per the previously standardized protocols. After that, the nodal segments were cultured on modified MS medium supplemented with 2.0 mgl-1 BAP + 0.05 mgl-1 NAA, 3% sucrose and six different concentrations of ascorbic acid (0, 25, 50, 75, 100 and 125 mgl-1) were used. Sprouted axillary buds were transferred to MS media devoid of growth regulators for further maintenance. Based on visual observation, the extent of media discolouration was assessed. Data was recorded as per the rating scale 1 to 5 (1 implies no discoloration, 5 implies extreme discoloration) given by Ziv and Halevy (14) and interpreted the results.
To enhance the quality and for more number of functional roots, an experiment was carry out by placing the micro-shoots in liquid half strength MS media supplemented with 60 g/l sucrose and four different auxin concentrations i.e., IBA (0.5 and 1.0 mgl-1) and NAA (0.5 and 1.0 mgl-1) to adjudge the best rooting media. The pH of the medium was adjusted to 5.8 before autoclaving at 121 ºC for 20 minutes at 15 lbs/inch2 pressure. The cultures were maintained at 24 ± 2°C under fluorescent white light (47 mol/m2/s) at a photoperiod of 16/8 hours light and dark cycles. For hardening of rooted plantlets, four types of strategies were tested, i.e., glass jars with polypropylene caps, plastic pot (4.5’) with polythene cover, earthen pots (4.5’) with polythene cover and disposable transparent polypropylene glasses with same covering. The plants were gradually hardened by loosening of caps and puncturing of polythene covers and plastic glasses.
Fifteen explants were inoculated per treatment and each treatment was replicated five times. The data was statistically analysed employing completely randomised design. The percentage data were subjected to analysis of variance.
RESULTS AND DISCUSSIONIn this study, explants cultured on MS medium
supplemented with various concentrations of ascorbic acid significantly reduced the phenolic exudation and enhanced the survival as compared with control (Fig. 1). Among the different treatments tested, complete elimination of browning (1.01) was observed when the medium was supplemented with 125 mgl-1
Fig. 1. Effect of ascorbic acid on controlling the phenolic exudation and lethal browning in marigold genotypes

275
Circumventing Phenolic Exudation in Marigold
ascorbic acid (Fig. 3b) followed by 100 mgl-1 (1.15), whereas maximum (4.03) phenol exudation was recorded in control (Fig. 3a). Among the genotypes, lowest browning (2.13) of explants was recorded in SY followed by SO (2.15) and PBG (2.19) and were significantly superior to PA (2.68). It is also clearly evident from the data that French genotype (PA) showed maximum phenolic exudation and browning as compared to African genotypes (PBG, SO and SY). These results corroborate with the investigations carried out by Singh et al. (12) in pomegranate, Kariyana and Nisyawati (3); Ngomuo et al. (10) in Musa spp., Ndakidemi et al. (9) in Brahylaena huillensis. All the studies reported the excessive phenolic compound exudation from wounded explant. Browning in plants occurs mainly due to oxidation of phenolic compounds by phenol oxidase. Welsh et al., (13) suggested the use of media supplements like ascorbic acid to limit the production of these lethal substances. The ascorbic acid protects the plant tissues from oxidative injury by scavenging oxygen radicals produced when the explant tissue is wounded.
Poor ex vitro survival of marigold tissue culture plants is a major hindrance for its micropropagation. The poor survival might be attributed to poor quality roots and excessive root damage while transferring from solid rooting medium to hardening. To avoid the root damage and for maximum quality root induction, in this study, shoots were supported by filter paper bridges and cultured on ½ MS liquid medium supplemented with two auxins (NAA and IBA). Highest per cent rooting in all the four genotypes was observed in medium supplemented with either 0.5 mgl-1 IBA or NAA (Table 1). The per cent rooting was decreased with increased auxin levels in the medium. Misra and Datta (7) reported the rooting of marigold shoots in medium devoid of growth regulators. However, such poor quality roots did not help the establishment of plants in soil. Maximum number of roots per shoot (54.19) was noted in the treatment supplemented with 1.0 mgl-1 IBA followed by medium supplemented with 0.5 mgl-1 NAA (47.56), which were significant with each other (Table 1). Among the four genotypes maximum number of roots (71.25) was produced by Pusa Basanti Gainda (Fig. 4) followed by Pusa Arpita (50.13). These results were similar to Gupta et al. (1) where they reported best rooting on 6 µM IBA.
Perusal of data from Table 1 reveals significant differences among the treatments and in between the genotypes for length of longest root. Among the different treatments, longest root (2.78 cm) was observed in the media supplemented with 0.5 mgl-1 NAA followed by 0.5 mgl-1 IBA (1.98 cm). Among Ta
ble
1. E
ffect
of
diffe
rent
aux
ins
on r
ootin
g, n
umbe
r of
roo
ts p
er m
icro
-sho
ot a
nd le
ngth
of
long
est
root
in li
quid
hal
f M
S m
ediu
m in
mar
igol
d ge
noty
pes.
Trea
tmen
tsR
ootin
g (%
)M
ean
Num
ber
of r
oots
per
mic
ro-s
hoot
Mea
nLe
ngth
of
long
est
root
(cm
)M
ean
PAP
BG
SO
SY
PAP
BG
SO
SY
PAP
BG
SO
SY
½
MS
+
IBA
(0.5
mgl
-1)
98.0
0 (6
2.46
)*99
.00
(85.
72)
100.
00
(88.
15)
99.0
0 (8
8.15
)99
.00
(81.
12)
35.2
559
.00
41.7
523
.00
39.7
51.
082.
882.
101.
881.
98
½
MS
+
IBA
(1.0
mgl
-1)
98.0
0 (8
0.86
)96
.00
(79.
63)
92.0
0 (7
7.45
)90
.00
(71.
62)
94.0
0 (7
7.40
)51
.00
80.2
554
.00
31.5
054
.19
2.20
3.48
1.40
1.45
2.13
½ M
S +
NA
A (0
.5 m
gl-1)
99.0
0 (8
2.07
)10
0.00
(8
8.15
)98
.00
(85.
72)
98.0
0 (8
3.29
)98
.75
(84.
81)
55.7
580
.75
35.0
018
.75
47.5
61.
305.
282.
302.
252.
78
½ M
S +
NA
A (1
.0 m
gl-1)
95.0
0 (7
8.42
)97
.00
(80.
86)
96.0
0 (7
9.63
)92
.00
(75.
98)
95.0
0 (7
8.73
)58
.50
6524
.75
15.0
040
.81
2.25
3.78
1.38
1.63
2.26
Mea
n97
.50
(75.
95)
98.0
0 (8
3.59
)96
.50
(82.
74)
94.7
5 (7
9.76
)50
.13
71.2
538
.88
22.0
61.
713.
851.
791.
80
SE
m±
CD
(p=
0.05
)S
Em
±C
D (
p=0.
05)
SE
m±
CD
(p=
0.05
)Tr
eatm
ent
(T)
2.90
58.
424
0.85
22.
423
0.07
20.
204
Gen
otyp
e (G
)2.
905
8.42
40.
852
2.42
30.
072
0.20
4T
× G
5.80
916
.846
1.70
44.
850
0.14
30.
407
*Fig
ures
giv
en in
par
enth
eses
are
ang
ular
tran
sfor
med
val
ues
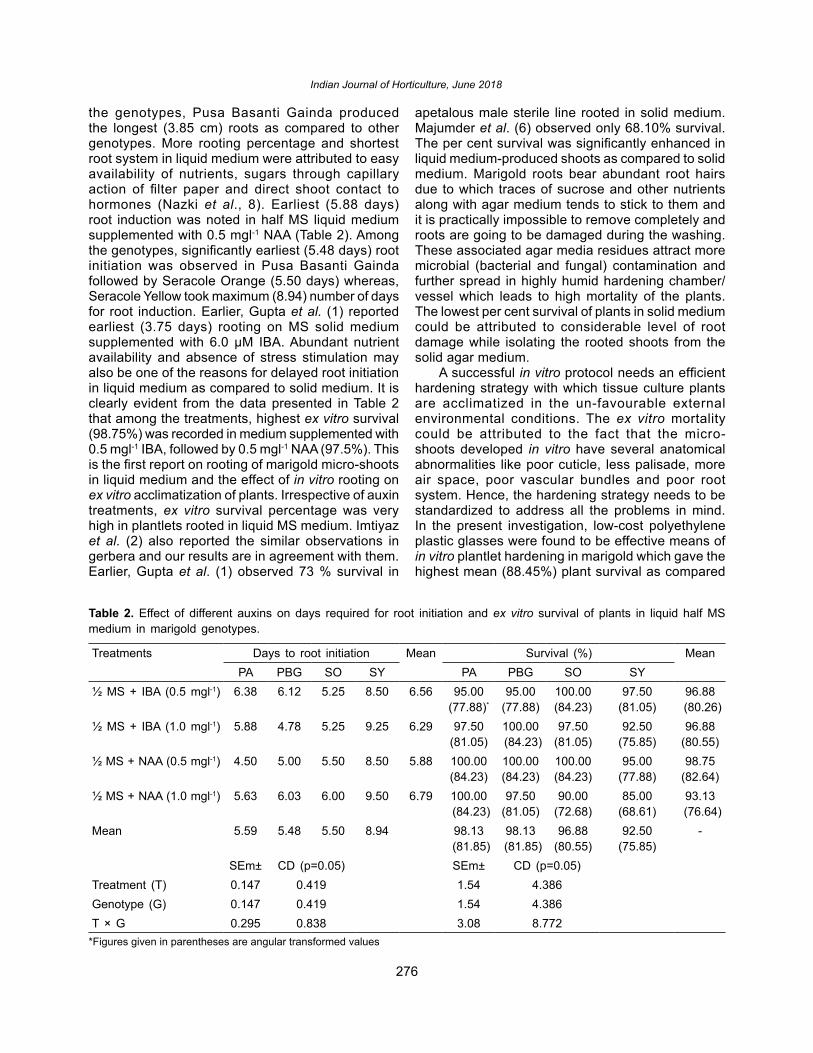
276
Indian Journal of Horticulture, June 2018
the genotypes, Pusa Basanti Gainda produced the longest (3.85 cm) roots as compared to other genotypes. More rooting percentage and shortest root system in liquid medium were attributed to easy availability of nutrients, sugars through capillary action of filter paper and direct shoot contact to hormones (Nazki et al., 8). Earliest (5.88 days) root induction was noted in half MS liquid medium supplemented with 0.5 mgl-1 NAA (Table 2). Among the genotypes, significantly earliest (5.48 days) root initiation was observed in Pusa Basanti Gainda followed by Seracole Orange (5.50 days) whereas, Seracole Yellow took maximum (8.94) number of days for root induction. Earlier, Gupta et al. (1) reported earliest (3.75 days) rooting on MS solid medium supplemented with 6.0 µM IBA. Abundant nutrient availability and absence of stress stimulation may also be one of the reasons for delayed root initiation in liquid medium as compared to solid medium. It is clearly evident from the data presented in Table 2 that among the treatments, highest ex vitro survival (98.75%) was recorded in medium supplemented with 0.5 mgl-1 IBA, followed by 0.5 mgl-1 NAA (97.5%). This is the first report on rooting of marigold micro-shoots in liquid medium and the effect of in vitro rooting on ex vitro acclimatization of plants. Irrespective of auxin treatments, ex vitro survival percentage was very high in plantlets rooted in liquid MS medium. Imtiyaz et al. (2) also reported the similar observations in gerbera and our results are in agreement with them. Earlier, Gupta et al. (1) observed 73 % survival in
apetalous male sterile line rooted in solid medium. Majumder et al. (6) observed only 68.10% survival. The per cent survival was significantly enhanced in liquid medium-produced shoots as compared to solid medium. Marigold roots bear abundant root hairs due to which traces of sucrose and other nutrients along with agar medium tends to stick to them and it is practically impossible to remove completely and roots are going to be damaged during the washing. These associated agar media residues attract more microbial (bacterial and fungal) contamination and further spread in highly humid hardening chamber/vessel which leads to high mortality of the plants. The lowest per cent survival of plants in solid medium could be attributed to considerable level of root damage while isolating the rooted shoots from the solid agar medium.
A successful in vitro protocol needs an efficient hardening strategy with which tissue culture plants are acclimatized in the un-favourable external environmental conditions. The ex vitro mortality could be attributed to the fact that the micro-shoots developed in vitro have several anatomical abnormalities like poor cuticle, less palisade, more air space, poor vascular bundles and poor root system. Hence, the hardening strategy needs to be standardized to address all the problems in mind. In the present investigation, low-cost polyethylene plastic glasses were found to be effective means of in vitro plantlet hardening in marigold which gave the highest mean (88.45%) plant survival as compared
Table 2. Effect of different auxins on days required for root initiation and ex vitro survival of plants in liquid half MS medium in marigold genotypes.
Treatments Days to root initiation Mean Survival (%) MeanPA PBG SO SY PA PBG SO SY
½ MS + IBA (0.5 mgl-1) 6.38 6.12 5.25 8.50 6.56 95.00(77.88)*
95.00(77.88)
100.00 (84.23)
97.50 (81.05)
96.88 (80.26)
½ MS + IBA (1.0 mgl-1) 5.88 4.78 5.25 9.25 6.29 97.50 (81.05)
100.00 (84.23)
97.50 (81.05)
92.50 (75.85)
96.88 (80.55)
½ MS + NAA (0.5 mgl-1) 4.50 5.00 5.50 8.50 5.88 100.00 (84.23)
100.00(84.23)
100.00 (84.23)
95.00 (77.88)
98.75 (82.64)
½ MS + NAA (1.0 mgl-1) 5.63 6.03 6.00 9.50 6.79 100.00 (84.23)
97.50(81.05)
90.00 (72.68)
85.00 (68.61)
93.13 (76.64)
Mean 5.59 5.48 5.50 8.94 98.13 (81.85)
98.13 (81.85)
96.88(80.55)
92.50 (75.85)
-
SEm± CD (p=0.05) SEm± CD (p=0.05)Treatment (T) 0.147 0.419 1.54 4.386Genotype (G) 0.147 0.419 1.54 4.386T × G 0.295 0.838 3.08 8.772
*Figures given in parentheses are angular transformed values

277
Circumventing Phenolic Exudation in Marigold
Fig. 2. Effect of various hardening strategies on acclimatization of in vitro raised plantlets in marigold genotypes.
Fig. 3. Culture initiation stage (a) Phenol exudation and lethal browning of marigold nodal segment in control, (b) Pusa Basanti Gainda nodal explant cultured on MS medium supplemented with 125 mg/l ascorbic acid.
Fig. 4. Rooting of Pusa Basanti Gainda micro-shoots in liquid ½ MS medium supported with filter paper bridges and rooting of micro-shoots on various treatment combinations.
Fig. 5. Hardened plants in disposable plastic glasses
to other three hardening strategies (Fig. 2). This high success in plastic glass could be attributed to optimum moisture retention, constant maintenance of relative humidity and maximum transparency to
light compared to other strategies (Fig. 5). Higher mortality of plants was observed in earthen pots and glass jars. The poor plant survival in earthen pots could be attributed to the constant loss of moisture from the pots which lead to plant desiccation. Poor survival was also recorded in glass jars. This might be due to excess water and salt accumulation in glass jar over the time and have no chance to drain out excess moisture from these jars unlike polypropylene glasses, where holes can be made at the bottom of the glass. These findings confirmed the results reported by Imtiyaz et al. (2) and Nazki et al. (8) in gerbera. The plants hardened in disposable plastic glasses put forth maximum (15.15 cm) plant height and maximum (20.95) number of leaves as compared to other hardening strategies. The standardized in vitro protocols of above African and French marigold genotypes can be used for commercial multiplication and year round maintenance of breeding lines.
278
Indian Journal of Horticulture, June 2018
ACKNOWLEDGEMENTSThe first author gratefully acknowledges the
financial assistance provided by the Post Graduate School, IARI, New Delhi. Thanks are due to the Vice Chancellor, Dr Y.S.R. Horticultural University, Venkataramannagudem, West Godavari, Andhra Pradesh for granting study leave to the first author.
REFERENCES1. Gupta, Y. C., Vaidya, P., Dhiman, S. R. and
Sharma, P. 2013. In vitro propagation and maintenance of genetic male sterility in marigold. Prog. Hort. 45: 152-59.
2. Imtiyaz., Nazki, T., Nelofar., Rather, Z. A. and Qadri, Z. A. 2015. Standardization of rapid axillary shoot multiplication through in vitro shoot tip culture in gerbera. Indian J. Hort. 72: 523-27.
3. Kariyana, K. and Nisyawati. 2013. Effect of ascorbic acid, activated carbon and light duration on plant browning of banana cultivar barangan (Musa acuminate L.) in in vitro culture. Int. J. Recent Res. Appl. Stud. 16: 118-23.
4. Kumar, A. 2002. In vitro production of male sterile lines of African marigold (Tagetes erecta L.) for F1 hybrid seed production. Ph.D. thesis, P.G.School, Indian Agricultural Research Institute, New Delhi.
5. Kumar, A., Raghava, S.P.S., Singh, S.K. and Misra, R.L. 2007. Factors affecting in vitro culture initiation and shoot multiplication in male sterile African marigold (Tagetes erecta L.) lines. Indian J. Hort. 64: 67-72.
6. Majumder, J., Kanwar, P.S., Singh, S.K., Prasad, K.V. and Verma, M. 2014. In vitro morphogenesis in marigold using shoot tip as explant. Indian J. Hort. 71: 82-6.
7. Misra, P. and Datta, S. K. 2001. Direct differentiation of shoot buds in leaf segments of white marigold (Tagetes erecta L.). In Vitro Cell Dev. Biol. 37: 466-70.
8. Nazki. T., Imtiyaz., Siddique, M.A.A., Rather, Z.A., Mir,M.A. and Bhat, M.A. 2015. An improvised low cost hardening protocol for in vitro raised plantlets of Gerbera jamesonii. Indian J.Agric. Sci. 85: 43-60.
9. Ndakidemi, C.F., Mneney, E. and Ndakidemi, P. A. 2014. Effects of ascorbic acid in controlling lethal browning in in vitro culture of Brahylaena huillensis using nodal segments. American J. Plant Sci. 5: 187-91.
10. Ngomuo, M., Mneney, E. and Ndakidemi, P. 2014. Control of lethal browning by using ascorbic acid on shoot tip cultures of a local Musa spp. (banana) cv. Mzuzu in Tanzania. African J. Biotech. 13: 1721-25.
11. Preece, J.E. and Compton, M.E. 1991. Problems with explant exudation in micropropagation. In: High-tech and micropropagation-1. Biotechnology in Agriculture and Forestry, vol.17. Bajaj, Y.P.S. (eds.), pp. 168-89.
12. Singh, N.V., Singh, S.K. and Patel,V. 2011. In vitro culture establishment studies on pomegranate. Indian J. Hort. 68: 307-11.
13. Welsh, K., Sink, K. C. and Davidson, H. 1979. “Progress on in vitro Propagation of Red Maple,” Combined Proc.-Int. Plant Propagators’ Society, 29: 382-86.
14. Ziv. M. and Halevy, A.H. 1983. Control of oxidative browning and in vitro propagation of Sterlitzia reginae. HortSci. 18: 434-36.
Received : July, 2017; Revised : January, 2018; Accepted : May, 2018
279
DOI : 10.5958/0974-0112.2018.00047.6
Indian J. Hort. 75(2), June 2018: 279-282
INTRODUCTION Coconut is grown in more than 93 countries of
the world in an area of 12.29 million ha with a total production in terms of copra equivalent of 11.04 million MT. Indonesia (25.63%), Philippines (23.91%), India (19.20%) are the major coconut producing countries of the world. India occupies a predominant position in respect of production of coconut in the world, cultivated in 1.97 million ha in 19 states and 3 Union Territories producing 20,439 million nuts with an average productivity of 10,345 nuts per ha as per Coconut Development Board (CDB) statistics for the year 2014-15.
The local coconut industry has been reeling from unstable market situation characterized by low copra prices in the international market. In the hope of helping the coconut farmers, a technology was developed to maximize land use and generate additional income (Margate and Magat, 8). The growth habit and canopy configuration of coconut palms strongly support different coconut based cropping systems. Coconut intercropping system ensures maximum resource capture and use, leading to higher yield per unit area of soil, water and light. The beneficial interactions of inter/mixed cropping of coconut with different crops in improving soil nutrient status of the system has been reported by Maheswarappa et al., (5). Coconut is usually planted with a spacing of 7.5 m × 7.5 m offering ample scope for intercropping with suitable
perennial, biennial and seasonal crops including medicinal and aromatic plants leading to considerable increase in the production and productivity per unit area, cropping intensity by more efficient utilization of sunlight, soil, water and labour (Nath et al., 10). Earlier research efforts have revealed that tuber crops, fruit crops, rhizomes, pulses and vegetables can be grown well under coconut garden. In the present scenario of fluctuation in coconut price and high production cost, the pure crop of coconut is no more economical. Hence, intercropping in coconut garden becomes indispensable for augmenting the income of the coconut farmers. Government of India has identified floriculture as a sunrise industry and accorded it 100% export oriented status. Owing to steady increase in demand of flowers, floriculture has become one of the important commercial trades in Agriculture. Hence, commercial floriculture has emerged as hi-tech activity-taking place under controlled climatic conditions inside greenhouse, and is being viewed as a high growth Industry. Coconut based intercropping with flower crops requires short period of planting time, smaller area (unutilised spaces between coconut), provides additional income to coconut farmers. Hence a study was conducted to evaluate the impact of intercropping flower crops in coconut on productivity per unit area and economics of the system.
MATERIALS AND METHODSField experiment was conducted for three
consecutive years from 2013 to 2015 under AICRP
Productivity and economic advantages of flower crops in coconut based intercropping system
S. Rani*, D. Rajakumar**, N. Shoba and H.P. Maheswarappa***
Coconut Research Station (AICRP on Palms), Aliyarnagar, Coimbatore 642 104, Tamil Nadu
ABSTRACTAn experiment was conducted to study the performance of flower crops as intercrop in coconut, during the
year 2013 to 2015 at Coconut Research Station, TNAU, Aliyarnagar. The five flower crops viz., Chrysanthemum (Dendranthema grandiflora), Celosia (Celosia sp.), Marigold (Tagetes erecta), Zinnia (Zinnia sp.) and Gomphrena (Gompherena globosa) were planted in the coconut garden to identify the most suitable flower crops for growing as intercrop in adult coconut garden and to evaluate the economic viability of the cropping system. Results showed that in a Coconut + Marigold (Tagetes erecta) intercropping system, an average flower yield of 6,053 kg ha-1 was recorded from marigold with a net income of Rs. 2,54,983 /ha and B:C ratio of 1.87 followed by Coconut + Gomphrena (Gomphrena globosa) with a net income of Rs. 2,40,458/ha and B:C ratio of 1.85. Based on economics, it is recommended that Marigold and Gomphrena were the remunerative flower crops in a 24 year old coconut gardens as intercrops without reduction in nut yield.Key words: Cocos nucifera, marigold, gomphrena, nut yield, economics.
*Corresponding author's E-mail: [email protected]**Department of Farm Management, TNAU, Coimbatore***Project Coordinator, AICRP on Palms, ICAR-CPCRI, Kasaragod

280
Indian Journal of Horticulture, June 2018
(Palms) at Coconut Research Station, TNAU, Aliyarnagar to find out the most suitable flower crops for growing as intercrops in a 24 years old coconut garden and to evaluate the economic viability of the intercrop. The research station is situated at 10.49° N latitude and 77° E longitude with an altitude of 20 m above the mean sea level. Initial soil analysis indicated that the soil was low in available nitrogen (120 kg ha-1), medium in P2O5 (19 kg ha-1) and high in K2O (522 kg ha-1). The soil was sandy loam, non-calcarious, non-saline and neutral in pH. The experiment on intercropping of flower crops in coconut garden was laid out in RBD with four replications. The experiment consisted of five treatments viz.,: T1: Coconut + Gomphrena (Gompherena globosa), T2: Coconut + Chrysanthemum (Dendranthema grandiflora), T3: Coconut + Marigold (Tagetes erecta), T4: Coconut + Celosia (Celosia sp.), T5: Coconut + Zinnia (Zinnia sp.) and T6: Coconut - monocrop (control). Five flower crops were planted during July-August, 2013 in a coconut garden of 24 year old hybrid (VHC-2) planted at a spacing of 7.5 m × 7.5 m. Flower crops Gomphrena, Chrysanthemum, Marigold, Celosia and Zinnia were annual in nature. The intercrops were grown in a plot size of 225 m2 accommodating four palms within each system. All through the experimental period, vermicompost and FYM were applied as organic manure basally and inorganic fertilizers were applied as top dressing in split doses. The recommended package of practices was followed as per the regular schedule. Benefit Cost ratio was computed as the present value of benefits divided by the present value of costs by using the following formula:
( )( )( )( )∑
∑=
=
=
=
+
+= Tt
tt
t
Tt
tt
t
r
Costr
Benefit
BCR
1
1
1
1
Where, Bt is the benefit in time, t and Ct is the cost in time t, r is the discount rate.
Nut equivalent yield of intercropping systems as well as economics was worked out based on prevailing market price on input and output (Ghosh and Bandopadhyay, 3, Thiruvarassan et al., 12).
Nut equivalent yield (NEY) =Yield of intercrop × Market pricePrevailing market price of a nut
RESULTS AND DISCUSSIONMaximum number of flowers per plant (16.6
flowers /plant) and the highest flower weight (9.1 g) recorded in Gomphrena and Marigold respectively (Table 1). The highest flower yield of 6053 kg/ha recorded in Marigold and was followed by Gomphrena (5206 kg/ha), Chrysanthemum (4502 kg/ha) and Celosia (4067 kg/ha). The lowest flower yield of 3509 kg/ha recorded in zinnia.
Annual leaf production, total inflorescence and nut yield per palm did not differ significantly among the coconut based flower intercropping system. However, increases of about 2 to 8 percentage was observed with intercropped palms over the monoculture (Table 2). It is likely, that part of the fertilizers applied to the intercrops which would have been otherwise lost through run-off or by other means, had been absorbed by the coconut palms, thereby there was improvement in the yield. Moreover, weed management and cultivation intended mainly for the intercrops to improve soil aeration and make the nutrients more available to the plants also benefited the main crop. Similar results were reported earlier by Margate and Magat (8) in coconut based multiple cropping systems. Mohandas (9) reported that intercropping herbal plants in coconut enhanced the mean annual nut yield to the tune of 18 per cent (145 nuts/ palm /year) over that of pure coconut (123 nuts / palm / year). Korikanthimath (4) also opined that increased nut yield in the coconut based system was due to additional input the coconut had received in terms of irrigation, fertilizerand weed control, etc. The congenial microclimate due to intercropping associated with increased microbial activities, improvement in soil fertility might have favoured the growth and yield of coconut. The improvement in nut yield of the main crop by intercropping was also reported by many workers (Maheswarappa et al., 6, Nath et al., 11 and Basavaraju et al., 1).
Coconut with Marigold (Tagetes erecta) recorded an average flower yield of 6,053 kg/ha with a net income of Rs. 2,78,350/ha and B:C ratio of 1.87 followed by Coconut + Gomphrena (Gomphrena globosa) with a net income of Rs. 2,30,975/ha and B:C ratio of 1.85 (Table 3). The lowest net income (Rs. 113750/ha) and B:C (1.77) ratio were obtained with coconut alone as a monocrop. Das (2) and Maheswarappa et al., (6) have demonstrated the much higher employment potential of coconut based
Table 1. Growth and yield parameters of flower crops when grown as intercrops in coconut garden
Treatments Flowers per
plant
Flower weight
(g)
Flower yield
(kg/ha)T1 - (Coconut + Gomphrena) 16.6 0.7 5206T2 - (Coconut + Chrysanthemum) 4.5 3.1 4502T3 - (Coconut + Marigold) 3.5 7.1 6053T4 - (Coconut + Celosia) 5.5 5.5 4067T5 - (Coconut + Zinnia) 6.1 4.0 3509T6 - (Coconut -- -- --

281
Productivity and Economic Advantages of Flower Crops in Coconut Based Intercropping System
multistoried and mixed farming systems and more profitable to integrate a number of subsidiary crops and animal components with coconut rather than raising it as a monocrop. Mahmud and Akuba (7) concluded that “intercrops had no bad effect on coconut production and in certain cases they tend to increase the production of coconut and give an additional income to farmers”. Intercropping system under coconut is more profitable than mono cropping which promises to the farmers a lot besides generating additional employment opportunity. Nut equivalent yield for an intercrop was maximum in case of Marigold (15,133) followed by Gomphrena (13,015) and Chrysanthemum (11,255) intercropping system. Similarly, the highest nut equivalent yield (26,718) in coconut + blackpepper + pineapple cropping system was reported by Ghosh and Bandopadhyay (3) followed by coconut + blackpepper + banana.
Based on the performance and economics of the commercial flower crops, Marigold and Gomphrena can be grown as remunerative flower crops in adult coconut gardens as intercrops without reduction in nut yield. The income generated by the intercropping system with Marigold (59.13 %) and Gomphrena (50.75%) was more than the double the netincome
compared coconut monoculture. The coconut crop benefited from the additional fertilizers applied for the intercrops, in addition to spinoffs’ from weed management and cultivation, thereby increasing yield.
REFERENCES1. Basavaraju, T.B., Nanjappa, H.V., Umesha,
K., Vasundhara, M. and Arulraj, S. 2011. Intercropping of medicinal and aromatic plants in coconut gardens. J. Plantation Crops, 39: 299-304.
2. Das, P.K. 1991. Economic viability of coconut based farming systems in India. J. Plantation Crops, 19: 191-201.
3. Ghosh, D.K. and Bandopadhyay, A. 2011. Productivity and profitability of coconut based cropping systems with fruits and black pepper in West Bengal. J. Crop and Weed, 7: 134-37.
4. Korikanthimath, V.S. 2005. Systems approach in coconut for higher productivity and profitability. Technical Bulletin No. 6, ICAR Research Complex for Goa.
Table 2. Growth yield parameters of coconut.
Treatments Annual leaf production
(Nos.)
Functional leaves(Nos.)
Total Inflorescence
(Nos.)
Pre- treatment yield (Nut/Palm/Year)
Mean Nut yield (Nut/Palm/Year)
(2012-15)T1 - (Coconut + Gomphrena) 13.0 35.2 10.0 122 144 T2 - (Coconut + Chrysanthemum) 12.6 35.6 10.2 124 143T3 - (Coconut + Marigold) 12.5 32.2 10.5 132 138T4 - (Coconut + Celosia) 13.3 34.9 10.6 125 136T5 - (Coconut + Zinnia) 12.8 35.7 10.9 133 135T5 - (Coconut) 13.1 34.9 10.4 130 133SEd± 0.53 1.74 0.48 6.9 17.3CD(P=0.05) NS NS NS 14.6 NS
Table 3. Economics and nut equivalent yield of flower crops in coconut garden.
Treatments Flower yield (kg/
ha)
Nut yield (Nuts/palm/
year)
Nut equivalent
yield
Gross income (Rs./ha)
Net income (Rs./ha)
B:C ratio
T1 - (Coconut + Gomphrena) 5206 144 13015 382125 230975 1.85T2 - (Coconut + Chrysanthemum) 4502 143 11255 334875 182125 1.80T3 - (Coconut + Marigold) 6053 138 15133 435800 278350 1.87T4 - (Coconut + Celosia) 4067 136 10168 359400 214550 1.83T5 - (Coconut + Zinnia) 3509 135 8773 327710 222160 1.84T6 - (Coconut) -- 133 -- 227500 113750 1.77

282
Indian Journal of Horticulture, June 2018
5. Maheswarappa, H.P., Anithakumari, P., Kamalakshiamma, P.G., and Shanavas, M. 2005. Influence of integrated nutrient management and high density multispecies cropping system on soil properties, plant nutrition and yield in root (wilt) affected coconut palms. CORD, 21: 18-19.
6. Maheswarappa, H.P., Anithakumari, P. and Sairam, C.V. 2003. High density multi species cropping system for root (wilt) affected coconut gardens – Its impact on productivity and economic viability. J. Plantation Crops, 31: 23-27.
7. Mahmud, Z. and Akuba, R.H. 1989. Coconut intercropping in Indonesia. Indus. Crops Res. J. 2: 40-54.
8. Margate, R.S. and Magat, S.S. 1983. Coconut - Based Multi-storey Cropping. Philippines J. Crop Sci. 8: 81-86.
9. Mohandas, S. 2011. Prospects of intercropping medicinal and aromatic plants in coconut garden. Madras Agric. J. 98: 1-3.
10. Nath, J.C., Deka, K.K. Saud, B.K. and Maheswarappa, H.P. 2015. Intercropping of medicinal and aromatic crops in adult coconut garden under Brahmaputra valley region of Assam. J. Plantation Crops, 43: 17-22.
11. Nath, J.C., Saud, B.K., Chowdhury, D., Deka, K.K. and Sarma, U.J. 2008. Coconut based high density multispecies cropping system in Assam. J. Plantation Crops, 36: 98-102.
12. Thiruvarassan, S., Maheswarappa, H.P and Subramani, T. 2014. Evaluation of coconut based multispecies cropping systems for east coast region of Tamil Nadu. J. Andaman Sci. Assoc. 19: 59-64.
Received : March, 2017; Revised : May, 2018; Accepted : May, 2018

283
DOI : 10.5958/0974-0112.2018.00048.8
Indian J. Hort. 75(2), June 2018: 283-288
INTRODUCTIONMango (Mangifera indica L.) is one of the most
important fruit of Asia and currently ranks fifth in total production among the major fruit crops (Hymavathi and Khader, 6). There is great variation in β-carotene content in mango (800 µg/100 g in Mulgoa to 1,300 µg/100 g in Alphonso) depending on the cultivar, climatic conditions, ripening stages and storage conditions. With the increasing demand for β-carotene as pro-vitamin A and antioxidant in human health, development of more and more β-carotene rich food is essential (Klaui and Bauernfeind, 10). Some of the mango cultivars like ‘Langra’ ‘Banganpalli’ and ‘Chausa’ lack intense colour and are not suitable for processing unless blended with cultivars having more colour (β-carotene) such as ‘Dashehari’ or ‘Bombai Green’.
Drying is one of the most economical methods for preservation of fruit pulp for longer time. But, sugar-rich foods such as fruit pulp and juices are difficult to dry as they contain low molecular weight components like fructose, glucose, sucrose, citric acid etc. Ingredients such as maltodextin and food-grade anti-caking agents like tricalcium phosphate are generally added to prepare fruit powders (Jaya and Das, 8). Knowledge of water activity aw and optimum concentration of anti-caking agent is one
of the useful measurements to decide the stability of foods, and selection of storage conditions for new products. Free flowing difficulty and caking problems in powders are generally occurs due to absorption of moisture by the food product from its surrounding atmosphere. These changes can be controlled after providing adequate packaging and accurate equilibrium moisture contents at various relative humidity and temperatures. The present paper deals with optimization of anti-caking agent concentration, adsorption, packaging and storage requirement of β-carotene rich mango powder.
MATERIALS AND METHODSThe fruits of mango cv. Langra were procured
from the local market of Delhi and the carrot roots (var. Nantes) were procured from the demonstration plot of the Division of Vegetable Science, ICAR-IARI, New Delhi. The fully ripe mango fruits and sound carrot roots were selected and washed with water thoroughly to remove adhering dirt and dust and then dried under the fan. The mango fruits were peeled and sliced manually by using a stainless steel knife. The slices were then fed into a pulping machine to make mango pulp. Carrot roots were scraped and sliced longitudinally and core was removed. The carrot slices were heated with the addition of 20-25% water until soft and then blended by using a mini blender for obtaining fine carrot pulp. The pulp of both mango
Effect of pre-treatment and packaging on quality of β-carotene rich mango powder
V.R. Sagar*
Division of Food Science & Postharvest Technology, ICAR-Indian Agricultural Research Institute, New Delhi 110 012
ABSTRACTPre standardized mango & carrot (80:20) blended pulp was treated with different proportion of maltodextrin
MD (drying aid) and tri-calcium phosphate, TCP (anti-caking agent) along with control and dried in a mechanical drier into thin layer at 58±2ºC for 12 h, to obtain a moisture content of 4-5 percent. The dehydrated material was grounded in a laboratory powder mill and sieve with 30 mesh sieve. The powder was packed in 200 gauge HDPE and 400 gauge LDPE pouches with two made of pack AP&NP and was stored at low temperature (70C) and ambient condition (18-35oC) up to 6 months for storage study. The powder was evaluated for its quality characteristics in respect of acidity, sugars, antioxidant, phenol, ascorbic acid, non-enzymatic browning (NEB) before packaging and during storage. To reduce powder stickiness and caking requires amount of MD and TCP were optimized on the powder properties. The amount of MD (0.25 kg per kg dry mango solids) and TCP (0.15 kg per kg dry mango solids) with the values of degree of caking (19.25%) and stickiness point temperature (45.34oC) were found to be optimum for reducing the powder stickiness, caking and nutritional parameters. The adsorption isotherm of powder was found to be type-II sigmoid and 200 g HDPE as packaging material followed by storage at low temperature were selected as best process.Key words: Magnifera indica, carrot, total carotenoids, phenols, sensory score.
*E-mail: [email protected]

284
Indian Journal of Horticulture, June 2018
and carrot was heated at 85ºC for 10 min. to sterilize separately and then filled in pre-sterilized bottles for further use in the experiment.
With dominant f lavor & taste of mango pre standardized blend of mango and carrot (80:20) was treated with Tricalcium phosphate (TP) and Maltodextin (MD) for reducing level of stickiness, caking and hygroscopicity from different concentrations of TP and MD. The treated material was subjected for drying in a cabinet dryer, (Kilburn Make Model-0248) at temperature of 60 ± 2oC, up to 4-5% of moisture content and the dried material was scraped and ground into powders with the help of mixer grinder (Sumit, New Delhi). Then, powder was subjected for physical properties and powder quality assessment.
Since the dry product was found difficult to grind, it was kept in an environment condition for 30-45 minutes to equilibrium moisture and then ground in a laboratory powder mill (3375-E10 Model -4) and sieved with 30 mesh sieve. The powder was packed in the packaging material of 200 gauge high density polyethylene (HDPE) and 400 gauge low density polyethylene (LDPE) pouches (8 × 6 cm size) of each packaging material with two mode of packing such as Air Pack (AP) and Nitrogen Pack (NP) and stored at room temperature (RT) (18 -35oC,50-60% RH), and low temperature (LT) (7oC,85% RH) (Ranganna, 14). The product was withdrawn for analysis at 0,2, 4 and 6 months interval during the storage study.
Moisture content was determined by drying a known weight of the sample in an oven at 60±2 ºC to a constant weight. The results were expressed as percent moisture content (Ranganna, 14). Reducing and total sugars were determined by using Shaffer-Somogyi micromethod (Ranganna,14). Titratable acidity was estimated by titrating a known aliquot of the sample against the standard sodium hydroxide solution using phenolphthalein as an indicator (Ranganna, 14). Ascorbic acid was measured by titrating the samples against 2,6-dichlorophenolindophenol dye and non-enzymatic browning was measured in terms of optical density at 420 nm of an aliquot of 60% alcoholic extract (Ranganna,14). Total phenols were determined by Folin-Ciocalteu method (AOAC, 2). Total antioxidant power was determined by using FRAP method (Benzie and Stain, 3). Sensory evaluation: Sensory evaluation of powder was done by Hedonic procedure (Amerine et al., 1).
Known weight (5 g powder) was placed in oven at 102±20C for one h. Then sample was removed, cooled at room temperature, weighed and transferred into a sieve of 500 µm size. The sieve was then shacked for 5 min in a shaking apparatus. The weight of the
powder remaining on sieve was weighed. Degree of caking DC (%) was calculated by using the equation as DC = c/d × 100. Where, d(g) is amount of the powder used sieving and c(g) is amount of powder left on the sieve after sieving.
Five g of powder having the known amount of moisture content was taken into a test tube of the apparatus developed by the present authors after slightly modification in the apparatus developed (Jaya and Das, 8) for the measurement of sticky point temperature Ts (oC). Statistical analysis of variance technique of β-carotene rich mango powder was done as suggested by Panse and Sukhatme (Panse and Sukhatme, 13). Means and standards error were calculated and analysis of variance on the data were performed. The experiment was conducted two times with three replicated for each treatment. The powder prepared by treating with combination of 1.5% TP and 2.5% MD was found to be the best and used for adsorption isotherms. Procedure was followed for adsorption isotherms of β-carotene rich mango powder at 20, 30, and 40 °C (Iglesias and Chirife, 7). Approximately two grams β-carotene rich mango powder was filled in sterilized glass weighing bottles and were placed in six separate vacuum desiccators containing saturated salt solutions (LiCl, MgCl2, Mg(NO3), NaCl, KCl and KNO3) for maintaining RH levels from 10 to 95% (Greenspan,
5). The air inside of the desiccators was sucked partially to maintain a partial vacuum with the help of a vacuum pump. All six desiccators were kept in an incubator thermostatically controlled at 20°C and the gain or loss in weights of all the samples in each desiccators were taken at two days interval until the sample attained equilibrium moisture content (EMC). The attainment of EMC was ascertained when three consecutive weight measurements showed a constant weight. The same experiment was conducted for sorption process at 30 and 40ºC by changing the temperature of the incubator
RESULTS AND DISCUSSIONEffect of TP & MD on nutritional quality of powder
is given in Table 1. The nutritional value of the powder in respect of acidity, ascorbic acid, reducing and total sugars, carotenoids, β-carotene, total phenols, total antioxidant power (HAP/ HPAP) decreased significantly with increase in percentage of MD in the powder. This may be due to substitution of massive amount of mango and carrot pulp by an inert substance (MD). However, NEB of powder in above treatments was much lower as compared to control. This might be due to weaker chemical kinetics for non-enzymatic browning reactions, between sugars, acids, ascorbic acid, β-carotene, amino acids etc. and

285
Effect of Pre-treatment and Packaging on Quality of Mango Powder
contact ability between them which have reduced the oxygen due to interference of MD and cause the low NEB in the powder.
The critical points for HG and DC decreased nearly 50 % along with relatively high values of Ts of the powder treated with 1.5 % TP + 2.5 % MD and 1.5 % TP + 2.5 % MD as compared to control. This might be due to positive effects of TP and MD on the physical properties of the powder. As TP acts as anti caking agent and MD as anti stickiness agent, therefore, both combinations might have lead to above result (Jaya et al, 9). However, a small decreasing trend for HG and DC was observed with increasing the amount of MD in the powder prepared by treating of 1.5 % TP + 10 % MD, 1.5 % TP + 15 % MD, 1.5 % TP + 20 % MD. This might be due to more amounts of single sugars, acids which contributed mainly hygroscopicity, caking of the powder substituted by MD. Similar observation have been reported in vacuum dried mango powder(Jaya et. al., 9). Overall sensory score of powder was significantly higher in the powder treated with 1.5 % TP + 2.5 % MD and 1.5 % TP + 2.5 % MD as compared to control and other treatments. This may be due to an appropriately mutual compensated balance between content of carotenoids/β-carotene and value of NEB which might have contributed better appearance of the powder.
Optimum RH 38.5% with 5.30% moisture were found to be the best for packaging of the β-carotene rich mango powder. The isotherms constructed using the data showed that all the samples followed the sigmoid shapes which are described as type II isotherms (Labuza et. al., 11). Food moisture isotherms and the equations that describe this relationship in equipment design for drying, packing and storage prediction of shelf life and determination of critical moisture and aw, for acceptability of products that deteriorate mainly by moisture gain (Palou and Argaiz, 12). Similar result has been reported on storage stability of vacuum dehydrated ripe mango mix powder (Hymavathi, and Khader, 6). At higher levels of RH, the product had a tendency to absorb moisture and with additional moisture pick up, the product became browning and caking formation
Effect of packaging and storage on quality characteristics of β-carotene rich mango powder is given in Table 2. Moisture content increased with increase in storage period. Increase in moisture during storage periods is attributed to slight pickup of moisture by the powder. Analogous observations have been reported by (Sharma et al., 16) in Hill lemon juice powder. Packaging, storage period and temperature affected the moisture content significantly. Moisture content was less in the powder
Table 1. Effect of tricalcium phosphate (TP) and maltodextrin (MD) on chemical composition of β- carotene rich mango powder (DW basis).
Chemical parameter Treatment CD0.05
Control 1.5% TP
5% MD
1.5% TP2.5% MD
1.5% TP5% MD
1.5% TP10% MD
1.5% TP15% MD
1.5% TP20% MD
Moisture (%) 4.53a 4.43a 5.88b 4.67a 4.74a 5.64b 5.66b 5.69b 0.35Acidity (%) 1.35g 1.20f 1.18ef 1.14de 0.99cd 0.81b 0.69a 0.65a 0.05Ascorbic acid (mg/100 g) 83.74f 76.67e 76.08e 76.60e 67.37d 56.80c 50.01b 43.55a 4.4Reducing sugars (%) 16.51e 15.35d 15.52d 14.66b 15.04cd 14.60bc 14.00b 12.35a 0.52Total sugars (%) 75.40f 71.52e 59.18d 60.35d 48.81cd 47.39c 38.77b 29.70a 2.67Total carotenoids (mg/100 g) 105.60g 98.38f 83.89d 88.80e 81.27d 62.47c 42.03b 35.99a 3.20β-carotene (mg/100 g) 48.99g 45.49f 39.28e 41.46e 37.01de 32.05c 26.18b 19.58a 2.76NEB Index 0.095g 0.079f 0.058e 0.056d 0.055cd 0.052b 0.057ed 0.041a 0.002Total phenols (mg/100 g) 63.33f 53.32e 50.12e 52.26e 44.08d 36.76c 28.87b 11.33a 3.31HAP (µmol Fe2+/100 g) 22.84f 21.03e 18.79de 18.99de 17.42c 16.22c 14.07b 12.17a 1.56HPAP (µmol Fe2+/100 g) 98.14d 76.42c 61.30bc 73.02c 76.42c 48.99b 35.30ab 25.84a 16.58Hg (%) 26.19 19.12 18.86 13.36 11.61 11.05 9.39 7.96 2.116Dc (%) 32.05 21.12 23.68 19.25 17.71 15.15 14.09 13.64 3.109Ts(oC) 39.32 40.80 39.78 45.34 46.05 46.79 46.18 46.37 1.568Overall acceptability 6.53 6.72 6.94 7.39 7.28 6.78 6.56 6.39 NS
Mean values (n=3) in rows with different characters are significantly different (p = 0.05); HG = Hygroscopicity, DC = Degree of caking, Ts = Sticky point temp.

286
Indian Journal of Horticulture, June 2018
packed in 400 g low density polyethylene (LDPE) pouches with nitrogen flushed and stored at low temperature. This must be due to more resistance of LDPE film to water vapour and replacement of O2 by nitrogen gas as compared to the high density polyethylene film pouches stored at room temperature. Similar observations have been reported by (Sharma et al., 16) in Hill lemon juice
powder. Titratable acidity shown an increase trend during storage. This might be due to release of acid groups of amino acids due to disappearance of basic amino groups during Maillard reaction. The increase in acidity was less in the powder packed in 400g LDPE pouches with nitrogen gas and stored at low temperature. This might have due to stable in moisture at low temperature and weaker chemical
Table 2. Effect of packaging and storage of quality characteristics of value added β-carotene -rich mango powder during storage (DWB).
Parameter Storage period
Initial value
Storage temp. CD0.05
Packaging and storage temperature Mode of
pack CD0.05
Packaging CD0.05200 g HDPE 400 g LDPE
AP NP AP LPRT LT RT LT RT LT RT LT
Moisture (%) 2 3.86 0.029 5.02 4.60 5.23 4.59 4.90 4.36 4.99 4.46 NS 0.0414 5.51 4.87 5.35 4.84 5.17 4.70 5.43 4.766 6.14 5.33 6.14 5.31 6.09 5.27 6.07 5.22
Acidity (%) 2 1.14 0,013 1.13 1.12 1.13 1.18 1.13 1.18 1.11 1.19 0.013 NS4 1.16 1.19 1.13 1.17 1.16 1.17 1.15 1.166 1.32 1.39 1.30 1.41 1.31 1.38 1.28 1.42
Ascorbic acid (mg/100g)
2 69.53 2.01 48.05 57.59 50.95 56.52 49.47 57.99 50.82 55.41 NS NS4 25.42 39.87 25.10 37.87 27.71 41.48 25.88 37.786 16.41 34.99 16.10 34.96 18.77 37.50 16.34 35.17
Reducing sugar (%)
2 12.42 0.55 13.12 12.64 12.65 13.19 13.07 12.33 12.24 11.89 NS NS4 13.96 15.75 12.84 15.63 13.41 14.69 12.74 15.196 15.84 20.03 13.91 19.26 14.74 18.14 14.20 19.66
Total sugars (%)
2 56.73 0.54 51.81 52.00 52.86 52.41 42.87 52.44 52.44 50.38 NS 0.764 47.70 48.03 47.04 47.68 46.38 48.80 47.06 46.996 44.46 46.80 43.81 45.62 42.53 47.80 44.41 46.21
Total phenol (mg/ 100 g)
2 53.14 0.76 49.31 52.56 48.85 53.57 48.66 53.41 49.45 54.73 NS NS4 35.74 39.03 36.85 41.52 36.05 40.33 36.57 41.406 33.22 37.30 34.85 40.27 33.83 38.98 34.46 39.31
Total carotenoids (mg/100 g)
2 76.49 1.77 66.75 73.01 67.55 73.13 69.91 71.33 69.70 74.28 NS NS4 55.19 65.98 48.14 66.05 57.78 64.48 67.64 67.166 46.27 63.43 45.83 64.10 47.35 64.11 47.28 64.58
ß-carotene (mg/100 g)
2 53.14 1.14 45.26 49.50 34.36 49.62 47.43 48.36 47.25 50.34 NS NS4 33.87 40.54 26.83 40.59 35.52 39.58 35.57 41.196 26.94 38.06 16,50 30.09 27.61 39.09 27.57 39.37
Total antioxidant (mg/100 g)
2 19.45 0.27 16.36 17.38 15.50 17.98 16.52 17.70 16.76 18.26 NS NS4 15.51 17.04 15.42 18.02 16,38 17.65 15.22 17.216 14.12 15.36 14.54 15.77 14.23 15.80 14.73 16.16
NEB OD (at 420 nm)
2 0.064 0.005 0.073 0.069 0.079 0.070 0.072 0.067 0.072 0.069 NS NS4 0.124 0.093 0.135 0.095 0.120 0.091 0.118 0.0936 0.164 0.111 0.180 0.100 0.154 0.110 0.152 0.108

287
Effect of Pre-treatment and Packaging on Quality of Mango Powder
kinetics for Maillard’s reactions in powder packed 400g LDPE and stored at low temperature.
Ascorbic acid content of β-carotene rich mango powder was significantly decreased with increase in storage periods and temperature. This might be due to attributed to higher rate of oxidation of ascorbic acid (Geetha et al., 4). The loss of ascorbic acid content was less in the powder packed in 400g LDPE pouches as compared to 200g HDPE pouches with air pack. This might be due to the less oxidation of ascorbic acid by trapped oxygen in packaging pouches which results in the formation of less de-hydro ascorbic acid. Reducing and total sugars decreased with increase in storage periods. This might be due to invention of non reducing sugar into reducing sugar. Similar observations has been made by (Sharma et al., 16) who had reported a loss of 0.63% dwb in total sugars after 6 months of storage in Hill lemon juice powder. High total carotenoids were observed in the samples packed in 400 g LDPE pouches flushed with nitrogen gas and stored at low temperature. This might be due to lesser losses in total carotenoids by the oxidation of carotenoids stored at low temperature. Less pick up the moisture (stability of water activity), low level of moisture at low temperature might have reduced the oxidations of carotenoids during storage.
Samples packed in 400g LDPE film pouches with nitrogen gas showed a lower decline in β-carotene as compared to HDPE film pouches due to less permeability to oxygen and light. Similar trend has been noticed by (Sagar and Khurdiya, 15). The non-enzymatic browning in β-carotene rich mango powder was higher in the samples packed in 200g HDPE pouches packed with air pack and stored at room temperature than stored at low temperature. This might have stronger enzymatic browning reactions in these samples under such above conditions as compared to the LDPE pouches and stored at low temperature. Total phenols content of the value added β-carotene rich mango powder decreased with increase of storage periods. This might have degradation of some unstable phenolic compounds due to the oxidation by oxygen during storage (Spanos et. al., 17). Hydrophilic antioxidant power (HAP) of value added β-carotene rich mango powder decreased significantly with increase of storage. This might have due to loss of ascorbic acid and total phenols during storage, which might be mainly responsible for HAP contribution in the powder.
The sensory quality of the powder was considerably affected by storage period and temperatures. The overall sensory scores of the products showed a decreasing trend with an advancement of storage period irrespective of storage temperature or
packaging materials. Overall organoleptic score was higher in the products packed in 400g LDPE pouches packed flushed with N2 gas. This can be attributed due to various factors such as less permeability of this film, moisture content, NEB and high β-carotene content which might have affected the texture and colour of the stored product.
REFERENCES 1. Amerine, M.A., Pangborn, R.M. and Roesseler,
E.B. 1965. Principles of Sensory Evaluation of Food, Academic Press, London, p.
2. AOAC. 1994. Official Methods of Analysis, Official Analytical Chemists, Washington D.C.
3. Benzie, I.F.F. and Stain, J.J. 1996. The ferric reducing ability of plasma (FRAP) as a measure of “Antioxidant power”: The FRAP assay. Anal. Biochem. 339: 70-76.
4. Geetha, P., Thirumaran, A.S. and Easwaran, S. 2005.High moisture shelf stable fruit slices by hurdle technology. Indian Fd. Packer. 59: 64-67.
5. Greenspan, L. 1977. Humidity fixed points of binary saturated aqueous solutions. J. Res. Natl. Bureau Standards (US), Series A, Physics and Chem. 81A: 89-96.
6. Hymavathi, T.V. and Khader, A. 2004. Storage stability of the vacuum dehydrated ripe mango-mix powders. J. Food Sci. Tech. Mysore, 41: 521-24.
7. Iglesias H.A. and Chirife, J. 1982. Handbook of Food Isotherms: Water Sorption Parameters for Food and Food Components, Academic Press, New York.
8. Jaya, S. and Das, H. 2004. Effect of maltodextrin, glycerol monostearate and tricalcium phosphate on vacuum dried mango powder properties. J. Food Engg. 63: 125-34.
9. Jaya, S., Das, H. and Mani, S. 2006. Optimization of maltodextrin and tricalcium phosphate for producing vacuum dried mango powder. Int. J. Fd. Properties, 9: 13-24.
10. Klaui, H. and Bauernfeind, J.C. 1981. Carotenoids as food colour. In: Carotenoids as Colorants and Vitamin A Precursors, Bauernfeind, J.C. (Ed.), Academic Press, Gainesville, FL, USA, pp. 48-317.
11. Labuza, T.P. 1984. Moisture Sorption. Practical Aspects of Isotherm Measurements and Use, AOAC, Minnoseta, pp. 8-21.
288
Indian Journal of Horticulture, June 2018
12. Palou, E.L.M. and Argaiz, A.1997. Effect of temperature on the moisture sorption isotherms of some cookies and snacks. J. Fd. Engg. 31: 85-94.
13. Panse, V.G. and Sukhatme, P.V. 1989. Statistical Methods for Agricultural Workers, Publication and Information Division, ICAR, New Delhi.
14. Ranganna, S. 2002. Handbook of Analysis & Quality Control for Fruit & Vegetable Products (2nd Edn.), Tata McGraw Hill Co., New Delhi.
15. Sagar, V.R. and Khurdiya, D.S. 1996. Studies on dehydration of Dashehari mango slices. J. Fd. Sci. Technol. 33: 527-29.
16. Sharma, S.K., Sharma, P.C. and Kaushal, B.B.L. 2004. Storage studies of foam mat dried hill lemon (Citrus Pseudolimon Tan.) juice powder. J. Fd. Sci. Technol. 41: 9-13.
17. Spanos, G.A., Wrolstadt, R.E. and Heatherbell, D.A.1990. Influence of processing and storage on the phenolic composition of apple juice. J. Agric. Food Chem. 38: 1572-79.
Received : April, 2017; Revised : May, 2018; Accepted : May, 2018;

289
DOI : 10.5958/0974-0112.2018.00049.X
Indian J. Hort. 75(2), June 2018: 289-294
INTRODUCTIONAloe vera (L.) is one of the oldest known medicinal
plants gifted by nature and is often called as miracle plant or natural healer. Its health benefits have been attributed to the polysaccharides contained in the mucilageous gel of leaves (Ahlawat and Khatkar, 1; Sharma et al., 14). Various authors have suggested use of A. vera in food products such as beverages, energy drinks, jams, candies, wine and dairy products (Ahlawat and Khatkar, 1; Sharma et al., 14; Boghani et al., 6). However, the bitter taste of A. vera juice has been reported to adversely affects the palatability of certain products especially beverages (Sharma et al., 14). To overcome this problem, blending seems to be one of the best alternatives as blending of two or more fruit juices/pulps to prepare most acceptable beverages with additional health benefits has also been reported earlier (Sasikumar et al., 12). Among many fruits, aonla is highly nutritious and important dietary source of vitamin C, minerals and amino acid and is well known for its nutraceutical and pharmacological properties (Jain and Khurdiya, 9). Thus, blending of A. vera juice with fruit juices like
aonla juice could lead to the production of delicious beverage with improved organoleptic and nutritive value especially vitamin C content.
On the other hand, fruit based beverages (squash) contain large amount of sugars and provide excess amount of calories to the consumers which is partially responsible for various diseases like hypertension, cardiovascular diseases, increased incidence of diabetes mellitus and obesity (Barwal et al., 3). Therefore, the possibility of replacing such bulk calorie sweeteners with high intensity non-nutritive sweeteners could be explored for the development of reduced/ low calorie functional beverages. Stevioside is a natural high intensity sweetener obtained from stevia, a natural sweet herb and potentially used in various dietetic foods especially for diabetics (Kumar et al., 10; Sharma and Tandon, 13). Keeping these facts in view, the present investigation was undertaken to develop and evaluate A vera- aonla blended vitamin C enriched low calorie functional squash using stevioside for the benefit of consumers.
MATERIALS AND METHODSFreshly harvested A vera leaves were washed
thoroughly with water containing KMS @ 500 ppm and gel was extracted using cold extraction method. For
Development and evaluation of vitamin C enriched low calorie Aloe vera- aonla blended functional squash using stevioside
Rakesh Sharma*, Ranjana Sharma** and Abhishek ThakurDepartment of Food Science and Technology, Dr YS Parmar University of Horticulture and Forestry, Nauni,
Solan 173 230, Himachal Pradesh
ABSTRACTExperiment was conducted to develop vitamin C enriched, low calorie Aloe vera based functional squash
by blending with aonla juice in different proportions and replacing sugar sweetness with stevioside. The products were also evaluated for their physico-chemical, nutritional and sensory quality attributes during storage. Among different combinations, the ratio of 65:35 (Aloe vera: aonla juice) with 30% juice part and 40o B TSS had recorded highest sensory score for taste and overall acceptability. The same treatment also had good amount of ascorbic acid (78.65 mg/100g) and phenolics (37.15mg/100g) compared to control sample (100% A vera). Further, the optimized formulation was used for the development of low/reduced calorie squash using stevioside. Sensory analysis of low calorie beverages indicated highest acceptability for the treatment LT8 (30 sugar:70 non nutritive sweetener) prepared by 70% non-nutritive sweeteners (NS) sweetness level consisting of 90% stevioside and 10% sorbitol sweetness proportion. The developed product was found to have strong antimicrobial activity (28.50 mm inhibition zone) against E. coli as well as high antioxidant potential (66.90%). The calculated energy value of the developed product was recorded to be 53.65 Kcal/100g which was significantly low compared to the control sample (165 Kcal/100g). The developed beverages were successfully stored at ambient temperature for a period of 6 months without significant changes in chemical and sensorial quality profile. Overall, it was concluded that the developed products had better taste, palatability, nutritive value and storage stability beside reduced calorie value, hence can benefit the health conscious people.Key words: Medicinal plant, ascorbic acid, functional beverages, non-nutritive sweeteners, sensory analysis.
*Corresponding author’s E-mail: [email protected] **Department of Basic Sciences (Microbiology), Dr YS Parmar UHF, Solan

290
Indian Journal of Horticulture, June 2018
extraction of juice, gel was passed through grinder, homogenized and treated with 0.5% pectinase at 40-50ºC for 30 min. followed by filtration and pH adjustment (3.5) by adding citric acid (Sharma et al., 14). The juice was then pasteurized and stored for further studies. The aonla juice was extracted through hydraulic press after grating the de-stoned fruits. The juice was preserved by heat processing in glass bottle and kept under refrigerated conditions for further studies. Different combinations of A. vera juice (AVJ) and aonla juice (AJ) were tried for optimization of a suitable combination for the preparation of palatable Aloe-aonla squash as per following treatments: T1 (Al100:An0) = AVJ 100% ; T2 (Al90:An10) = AVJ 90% + AJ 10%; T3 (Al85:An15)= AVJ 85% + AJ 15%; T4 (Al80:An20)= AVJ 80% + AJ 20%; T5 (Al75:An25)= AVJ 75% + AJ 25%; T6 (Al70:An30) = AVJ 70% + AJ 30%; T7 (Al65:An35)= AVJ 65% + AJ 35%; T8 (Al60:An40) = AVJ 60% + AJ 40%;T9 (Al55:An45)= AVJ 55% + AJ 45%;T10 (Al50:An50)= AVJ 50% + AJ 50%. The beverages were prepared as per standard method and specifications of FSSA-2006 using 30% fruit part (blended), maintaining TSS and acidity between 40-41oB and 1.2-1.3 per cent, respectively in all the treatments. Best combination/ blend was selected on the basis of sensory evaluation.
Further, the low calorie Aloe vera- aonla squash was prepared by replacing sugar sweetness (S) with equi-sweetness of stevioside (St) and sorbitol (So) at different proportions as per the method given by Sharma and Tandon (13). Various treatments were, LT1= 100%S; LT2= 90%S+10%NS (90st:10So); LT3= 80%S+20%NS (90st:10So); LT4= 70%S+30%NS (90st:10So); LT5= 60%S+40%NS (90st:10So); LT6= 50%S+50%NS (90st:10So); LT7= 40%S+60%NS (90st:10So); LT8= 30%S+70%NS (90st:10So); LT9= 20%S+80%NS (90st:10So); LT10= 100% St.
All the beverages were evaluated for their physico-chemical characteristics viz. TSS, titratable acidity, pH, sugars, total phenols and ascorbic acid as per standard methods for a period of 6 months at different intervals of 0, 3 and 6 months (Ranganna, 11). Energy value was calculated by taking into account the amount of sugars, proteins and fats content present in the squash (Sharma and Tandon, 13). Sensory evaluation of the products was conducted by a panel of 15 semi-trained judges using 9- point hedonic scale system for different parameters like appearance/body, flavor, taste and overall acceptability (Ranganna, 11). The antimicrobial activity of the developed beverages against E. coli was measured by well diffusion method (Aneja, 2) and was expressed in terms of mean diameter of the zones of inhibition measured. Antioxidant activity (Free radical scavenging activity) was measured as per the method of Brand -Williams
et al. (7), where DPPH (2, 2 diphenyl-1-picrylhydrazyl) was used as a source of free radical.
All the analytical parameters were recorded in triplicates and the mean values of each parameter were described. The data of quantitative estimation of biochemical characteristics were assessed by factorial CRD whereas the data pertaining to sensory evaluation were analyzed by RBD (Cochran and Cox, 8).
RESULTS AND DISCUSSIONIn the present investigation, while optimizing
suitable blend of Aloe vera and aonla juice, the colour score of the beverages was found to range between 7.2 to 7.5, which increased gradually with increase in aonla juice incorporation (Fig. 1). It was observed that the beverages having higher levels (up to 85%) of A vera juice obtained higher body scores (7.5), while further increase in A vera juice content reduced the body score gradually to minimum (7.0). The taste profile among different beverages ranged between 6.75 and 8.0 with maximum score recorded in treatment T7 (AVJ 65% + AJ 35%) whereas minimum in control sample (100% AVJ). The beverages having higher A vera juice concentration resulted in drastic reduction of taste score which might be due to bitter taste of Aloe vera juice. The highest overall acceptability score (7.75) was recorded in T7 followed by T8 which remained statically significant (p<0.05) with rest of the samples (Fig. 1). The possible reason for this may be improvement in mouth feel of product by blending with aonla juice. Various authors have reported improvement in sensory quality of beverages prepared by blending different fruit juices (Sasikumar et al., 12; Sharma and Tandon, 13; Bhardwaj and Pandey, 5). Therefore, based on sensory evaluation, the squash (T7) prepared by using 65% Aloe vera juice + 35% aonla juice with 30% blended juice and 40o B TSS, was adjudged the best by the panelists. Further,
Fig. 1. Sensory evaluation of different A. vera-aonla blended functional squash.

291
Vitamin C Enriched Low Calorie Aloe Vera- Aonla Blended Functional Squash
a comparison of data presented in Table 1 revealed that addition of aonla juice had also improved the nutritional quality of the squash as evident from its higher ascorbic acid (78.65 mg/100g) and total phenolic contents (37.15 mg/100g) compared to standard Aloe vera squash (32.25 mg/100g and 15.80 mg/100g), respectively. Similarly, Jain and Khurdiya (9) reported vitamin C enrichment of fruit juice based RTS beverage through blending with Indian gooseberry juice. The blended squash was also found to have higher antioxidant potential (66.90 % free radical scavenging activity) and strong antimicrobial activity against human pathogen E coli (28.50 mm inhibition zone). Improvement in nutritional quality attributes of beverages prepared by blending different fruit juices/pupls has been reported earlier (Bhardwaj and Pandey, 5; Sharma and Thakur, 15). Hence, the treatment T7 was selected for further preparation of low calorie A vera - aonla blended beverage by replacing sucrose sweetness with the sweetness of stevioside.
The chemical changes in physico-chemical characteristics of low calorie Aloe vera- aonla squash during storage are presented in Table 2. Perusal of data shows that total soluble solids (TSS) among different treatments decreased continuously as the per cent share of stevioside sweetness increased. It might be due to the reason that stevioside do not add to the TSS (Sharma and Tandon, 13). On the preparation day, maximum TSS (40.05ºB) was recorded in LT2 (90%S+10%NS) and minimum (7.50ºB) in LT10 (100% St) which increased to 41.15ºB and 9.00ºB, respectively after 6 months of storage
Table 1. Physico-chemical, nutritional and sensory characteristics of standard Aloe vera and Aloe vera-aonla blended squash.
Parameters Aloe vera (100%) sqaush*
Aloe vera –aonla (65:35)
blended squash*TSS (oB) 40.0 ± 0.20 40.0 ± 0.50Acidity (%, CA) 1.28 ± 0.05 1.20 ± 0.07pH 2.30 ± 0.04 2.50 ± 0.02Reducing sugars 20.50 ± 0.90 25.85 ± 1.02Total sugars 36.12 ± 1.35 38.75 ± 1.15Ascorbic acid 32.25 ± 2.63 78.65 ± 2.85Total phenols 15.80 ± 2.08 37.15 ± 1.75Antioxidant activity (%) 38.80 ± 0.95 66.90 ± 0.88Antimicrobial activity (zone of inhibition, mm)
26.0 ± 1.05 28.50 ± 1.12
* Mean ± SD with each value a average of 3 determinations; SD = Standard Deviation Ta
ble
2. C
hang
es in
TS
S, t
itrat
able
aci
dity
, asc
orbi
c ac
id, r
educ
ing
suga
rs, a
nd to
tal p
heno
ls o
f Alo
e ve
ra: a
onla
ble
nded
low
cal
orie
squ
ash
durin
g st
orag
e.
Sto
rage
per
iod
(mon
ths)
/tre
atm
ents
TSS
(ºB
)Ti
trata
ble
acid
ity (
%)
Asc
orbi
c ac
id (
mg/
100
g)R
educ
ing
suga
rs (
%)
Tota
l phe
nols
(m
g/10
0 g)
0 3
6 M
ean
0 3
6 M
ean
0 3
6 M
ean
0 3
6 M
ean
0 3
6 M
ean
LT1
40.0
041
.00
42.0
041
.00
1.20
1.20
1.22
1.21
78.6
575
.51
72.8
475
.67
25.8
526
.91
27.2
526
.67
34.0
030
.80
26.1
530
.31
LT2
40.0
540
.66
41.1
540
.62
1.20
1.20
1.22
1.21
80.0
076
.82
73.0
876
.63
24.7
525
.35
26.0
825
.39
34.1
531
.50
26.2
530
.63
LT3
39.3
540
.50
41.1
040
.31
1.22
1.23
1.24
1.23
85.2
082
.50
78.3
282
.00
23.2
524
.08
24.8
524
.06
35.5
031
.85
26.6
031
.31
LT4
35.1
536
.00
36.6
035
.91
1.20
1.21
1.24
1.22
76.5
674
.05
70.8
573
.82
20.3
521
.16
21.8
021
.10
36.0
032
.75
27.8
532
.20
LT5
33.0
233
.80
34.2
033
.67
1.22
1.22
1.24
1.22
81.5
079
.10
76.8
679
.15
15.2
016
.32
17.5
016
.34
38.3
034
.25
28.5
033
.68
LT6
28.6
529
.15
29.8
029
.20
1.21
1.22
1.23
1.22
78.6
076
.41
72.1
575
.72
12.0
013
.65
14.3
613
.34
38.8
534
.00
28.5
033
.78
LT7
24.2
525
.05
25.7
025
.00
1.20
1.20
1.22
1.21
80.5
077
.25
72.0
076
.58
10.7
512
.18
13.0
211
.98
39.6
234
.00
28.5
034
.04
LT8
19.0
020
.50
21.0
020
.16
1.22
1.22
1.24
1.22
80.6
576
.76
70.5
075
.97
7.10
7.86
8.94
7.97
39.7
534
.36
30.0
034
.70
LT9
13.4
014
.25
15.0
514
.23
1.22
1.23
1.25
1.23
80.5
078
.50
71.2
576
.75
5.28
6.00
6.78
6.02
40.0
535
.05
30.1
035
.06
LT10
7.50
8.26
9.00
8.25
1.20
1.22
1.25
1.22
80.5
076
.50
70.0
575
.68
3.10
4.02
4.85
3.99
41.0
035
.50
32.3
036
.26
Mea
n28
.03
28.9
129
.56
28.8
31.
201.
211.
231.
2280
.26
77.3
472
.79
76.7
914
.76
15.7
516
.54
15.6
837
.72
33.4
028
.47
33.2
0C
D0.
05Tr
eatm
ent
(T)
: 0.
25S
tora
ge (
S)
: N
ST
× S
: N
S
CD
0.05
Trea
tmen
t (T
) :
NS
Sto
rage
(S
) :
NS
T ×
S :
NS
CD
0.05
Trea
tmen
t (T
) :
NS
Sto
rage
(S
) :
0.62
T ×
S :
NS
CD
0.05
Trea
tmen
t (T
) :
1.62
Sto
rage
(S
) :
NS
T ×
S :
NS
CD
0.05
Trea
tmen
t (T
) :
NS
Sto
rage
(S
) :
0.12
T ×
S :
NS

292
Indian Journal of Horticulture, June 2018
period. The increase in TSS during storage was found to be non-significant however; slight increase might be due to solubilization of pulp constituents into simple sugars (Boghani et al., 6; Barwal et al., 3). A slight increase in acidity was observed during storage which might be due to release of acids from juice by autolysis (Sasikumar et al., 12). The mean value of ascorbic acid content among different treatments decreased from an initial value of 80.26 mg/100g to 72.79 mg/100 g after 3 and 6 months of storage, respectively. Significant decrease in ascorbic acid during storage may be attributed to its degradation into dehydro-ascorbic acid, furfural and hydroxy furfural at ambient conditions (Barwal et al., 4). Perusal of data presented in Table 2 revealed that with the increase in proportion of stevioside, corresponding decrease in sugar contents was registered. It might be attributed to the fact that stevioside is carbohydrate free, so does not contribute to reducing sugars during analysis (Kumar et al., 10). On the preparation day, highest reducing sugars (25.85%) were recorded in LT1 and lowest (3.10%) in LT10. The increase in reducing sugars during storage might be due to hydrolysis of polysaccharides to reducing sugars in the presence of citric acid (Sharma and Thakur, 15). The phenolic contents in different beverages varied insignificantly between 30.31 mg/100g to 36.26 mg/100g (Table 2). Whereas, during storage it decreased from an initial mean value of 37.72 mg/100g to 28.47 mg/100g after
6 months. The decrease in total phenolic contents during storage might be due to their involvement in the formation of polymeric compounds by complexing with protein and their subsequent precipitations (Sharma and Thakur, 15; Barwal et al., 4).
Among different treatments, the sensory appearance score ranged between 7.20 to 7.50 (Table 3). It was observed that at higher concentrations of stevioside (>70%), the appearance score decreased. However, addition of sorbitol @10% has improved the overall appearance/ body of the beverages as it is an excellent bulking or bodying agent and has good heat stability (Barwal et al., 3). Significantly higher mean scores for taste (7.93) and overall acceptability (7.60) were recorded in treatment LT8 (30% sucrose+70% non-nutritive sweetener), whereas minimum was recorded in LT10 (100% stevioside). It might be attributed to the bitter after taste of stevioside which becomes more evident at higher concentrations. Our findings are in line with the observations of Sharma and Tandon (13) in low calorie bitter gourd spiced squash. Slight decrease in taste and overall acceptability scores during storage could be possibly due to the loss of volatile aromatic substance in storage at ambient conditions (Sharma and Thakur, 15). However, interaction between treatment and storage intervals was found non-significant. The results pertaining to energy value of different low calorie A vera- aonla blended beverage are presented in Fig. 2. The
Table 3. Changes in sensory appearance, taste and overall acceptability of Aloe vera: aonla blended low calorie squash during storage.
Storage period (months)/ treatments
Appearance Taste Overall Acceptability0 3 6 Mean 0 3 6 Mean 0 3 6 Mean
LT1 7.25 7.25 7.20 7.23 7.75 7.68 7.50 7.64 7.50 7.25 7.10 7.28LT2 7.20 7.20 7.10 7.17 7.25 7.00 6.90 7.05 7.20 7.00 6.80 7.00LT3 7.22 7.20 7.00 7.14 7.50 7.30 7.20 7.33 7.50 7.30 7.00 7.27LT4 7.35 7.30 7.15 7.27 7.75 7.65 7.50 7.63 7.60 7.50 7.10 7.40LT5 7.40 7.30 7.20 7.30 7.65 7.60 7.50 7.58 7.70 7.50 7.20 7.47LT6 7.45 7.45 7.20 7.37 7.85 7.75 7.60 7.73 7.80 7.50 7.20 7.50LT7 7.50 7.50 7.30 7.43 8.00 7.80 7.60 7.80 7.75 7.50 7.20 7.48LT8 7.50 7.45 7.30 7.42 8.20 8.00 7.60 7.93 8.00 7.60 7.20 7.60LT9 7.30 7.30 7.10 7.23 7.00 6.80 6.50 6.77 7.00 6.60 6.20 6.60LT10 7.20 7.00 7.00 7.07 6.50 6.30 6.05 6.28 6.50 6.20 6.00 6.23Mean 7.34 7.30 7.16 7.26 7.55 6.99 7.20 7.38 7.46 7.20 6.90 7.18
CD0.05Treatment (T) : 0.04
Storage (S) : NST × S : NS
CD0.05Treatment (T) : 0.08
Storage (S) : NST × S : NS
CD0.05Treatment (T) : 0.11Storage (S) : 0.04
T × S : NS

293
Vitamin C Enriched Low Calorie Aloe Vera- Aonla Blended Functional Squash
highest calculated energy value (165.0 Kcal/100g) was obtained by the control treatment LT1 (100% sucrose), whereas the lowest was recorded in LT10 (100% stevioside sweetened). It can be seen that with the increase in per cent share of stevioside, the calorie/energy value of beverages decreased which might be due to the fact that stevioside is zero energy high intensity sweetener (Kumar et al., 10). The best rated treatment (LT8= 30% sucrose : 70% NS) had 53.65 Kcal/100g energy value and the developmental effort has successfully reduced the energy value up to 56% per serving when 70% sugar was substituted with the sweetness of stevioside and sorbitol. Sharma and Tandon (13) had also attained 60% reduction in calorie value per serving at 75% sweetness level of stevioside without compromising sensory quality in bitter gourd spiced squash.
Conclusively, the results of present investigation provide an effective way of delivering health benefits of Aloe vera and aonla to the consumers in the form of a beverage having good palatability, nutritive value besides reduced calorie value.
REFERENCES1. Ahlawat, K.S. and Khatkar, B.S. 2011.
Processing, food applications and safety of Aloe vera products: A review. J. Food Sci. Technol. 48: 525-33.
2. Aneja, K.R. 2003. Experiments in Microbiology, Plant pathology and Biotechnology, 4th edn, New Age International Limited Publishers, New Delhi, 607 p.
3. Barwal, V.S., Sharma, R. and Kaushal, B.B.L. 2002. Use of sorbitol for the preparation of low calorie seasoned squash. J. Food Sci. Technol. 39: 413-17.
4. Barwal, V.S., Sharma, R. and Singh, T.K. 2005. Development and evaluation of dieteic bitter gourd ready-to-serve drink. J. Food Sci. Technol. 42: 202-05.
5. Bhardwaj, R.L. and Pandey, S. 2011. Juice blends – A way of utilization of under-utilized fruits, vegetables, and spices: A review. Critical Rev. Food Sci. Nutri. 51: 563-70.
6. Boghani, A.H., Raheem, A. and Hashmi, S.I. 2012. Development and storage studies of blended papaya-Aloe vera ready- to- serve (RTS) beverage. J. Food Process. Technol. 3: 185-87.
7. Brand-Williams, W., Cuvelier, M. And Berset, C. 1995. Use of free radical method to evaluate antioxidant activity, Lebensm-Wiss-u-Technol. 28: 25-30.
8. Cochran, W.G. and Cox, G.M. 1967. Experimental Design. John Wiley and Sons, New York, USA, pp. 171-2017.
9. Jain, S.K. and Khurdiya, D.S. 2004. Vitamin C enrichment of fruit juice based ready-to-serve beverages through blending of Indian gooseberry (Emblica officinalis Gaertn.) juice. Plant Foods Human Nutri. 59: 63-66.
10. Kumar, S., Jha, Y.K. and Singh, P. 2007. Stevia a natural potential source of sugar replacer. Bev. Food World, 34: 70-71.
11. Ranganna, S. 1997. Handbook of Analysis and Quality Control for Fruit and Vegetable Products, 2nd edn, Tata McGraw Hill Publishing Company, New Delhi, 1152 p.
Fig. 2. Calculated energy value of different A vera- aonla blended low calorie functional squash.
Ene
rgy
valu
e (K
cal/1
00 g
)

294
Indian Journal of Horticulture, June 2018
12. Sasikumar, R., Ray, R.C., Paul, P.K. and Suresh, C.P. 2013. Development and storage studies of therapeutic ready- to- serve (RTS) made from blend of Aloe vera, aonla and ginger juice. J. Food Process. Technol. 4: 232-34.
13. Sharma, R. and Tandon, D. 2015. Development and evaluation of antioxidant rich low calorie functional bitter gourd (Momordica charantia L.). Inter. J. Farm Sci. 5: 68-77.
14. Sharma, R., Tandon, D., Joshi, V.K. and Attri, S. 2015. Development and evaluation of different beverages from Aloe vera (L.) Burm.f. for their nutritional, functional and sensory qualities. Indian J. Natural Prod. Resources, 6: 278-82.
15. Sharma, R. and Thakur, A. 2017. Effect of blending on sensory quality, functional properties and storage stability of bitter gourd- aonla blended squash. J. Hill Agric. 8: 234-39.
Received : February, 2017; Revised : April, 2018; Accepted : May, 2018

295
DOI : 10.5958/0974-0112.2018.00050.6
Indian J. Hort. 75(2), June 2018: 295-305
INTRODUCTIONArecanut (Areca catechu L.), a tropical crop,
is popularly known as betel nut, as its common usage in the country is for mastication with betel leaves. Arecanut is cultivated in different climatic and soil conditions, particularly in India, Bangladesh, Sri Lanka, Malaysia, Indonesia, Philippines and Myanmar (Jose and Jayasekhar., 8). Arecanut production in India is the largest in the world, as per FAO statistics for 2013, accounting for 49.74% of its world output and is exported to many countries. At present, India has attained self-sufficiency with regard to arecanut production. Arecanut provides income and livelihood security to more than three crore people in India (Kammardi., 9). Major portion of the arecanut production is exported to countries like Singapore, Kenya, Saudi Arabia and United Kingdom in various forms. The annual compound growth rate of consumption (5%) is more than that of production (4.2%) hinting at the demand – supply gap. India exported 1750 tonnes of arecanut and its products to more than 40 countries during 2009-10 also imported 40,000 tonnes of arecanut valuing ̀ 100 crores at `25,000 per ton (2009-10) (Kammardi., 9). Within India, as of 2013-14, Karnataka produces
62.69% of the crop followed by Kerala (13.77) and Assam; all three states together account for 88.59% of its production. The other major states where arecanut is also grown are Meghalaya, West Bengal, Mizoram, Tamil Nadu and Tripura. From an area of 0.70 lakh hectares Assam produces 0.68 lakh tonnes (Anonymous, 1) arecanut.
Arecanut is an important commercial plantation crops in the state of Assam. It also called as “Betel nut” or “Supari”. Arecanut kernel obtained from the fruit is chewed both as raw nut and in processed form. Fully ripe arecanut is generally used by the consumers of Assam, Kerala and Northern parts of West Bengal. The processed green arecanut in different forms is favoured in Rajasthan, Karnataka and Tamil Nadu.
Processing of arecanut in Assam is a traditional occupation. Grading is not usually done by growers, the wholesalers, however, grade the produce but not on any scientific basis. Grading is done on the basis of size, colour and quality of fruit (Bhalerao and Singh, 2). The important factors affecting the quality of arecanut are colour, tenderness, gleam, shape, weight etc (Kolur et al., 10). Danti and Suresha (5) recently proposed a technique for classification of arecanut based on texture features. Investment requirement or establishment of arecanut processing at farm level stood `59,481 of which 66% was the cost of building
Value addition and economics of Arecanut processing plant – A study from North-Eastern India
G. Mula*, S.C. Sarker and A. SarkarUttar Banga Krishi Viswavidyalaya, Cooch Behar 736165, West Bengal
ABSTRACTThe study analyzes the economic aspects of value addition of green arecanut harvests based on primary
data collected from 28 processing plants of Dhubri and Goalpara districts of Assam. Both PRA and Survey methods were adopted to collect information. The study reveals that most of the processing plants were run by the owners of the land either as sole processor or in partnership. About 60.71% of plants remain under single ownership. The processing activity is done in two phases viz., early season from Mid-November to Mid-April for the preparation of Tipni, Rota and Sagar grades by using half matured or premature nuts and late season starting from Mid-April to Mid-June to produce Maza, Fali and Mala grades by using fully ripen nuts. The net profit earned from per qunital (output) processing of Tipni with fumigation is `5043.16 followed by Tipni without fumigation (`3826.28) with a benefit-cost ratio of 1.34:1 and 1.24:1, respectively while the net return per quintal fetched from preparation of Maza is `1750 followed by Mala (`1050.00) and Fali (`772.50) with the B/C ratio of 1.64:1, 1.31:1 and 1.24:1, respectively. The average net return of a standard processing plant with an average capacity of business with 575 qtls is ̀ 3,16,999.91 of which 62.40% contribution comes from early season processing and rest 37.60% from late season processing activity. Average annual employment generation of such plant found 778.5 mandays of which 36.87% is female. For establishing the said plant initial average fixed investment is `67,885.00. The processing of arecanut may be regarded as an income and employment generating enterprise that provides synergy between farm and non-farm sector of rural livelihood domain.Key words: Areca catechu, processing grades, tipni, maza, employment generation.
Corresponding author's Email: [email protected]

296
Indian Journal of Horticulture, June 2018
construction (Chinnappa, 4). One of the common indicators of economic analysis suggested by Gittinger (7) and was applied by Das (6), Bhalerao and Singh (3) and others to test the economic worthiness of the investment in arecanut is the Benefit-Cost Ratio (BCR). Arecanut processing is an important operation to make it available to the consumers in various processed forms. Therefore, it is important task to know the different processing stages and the cost involved in each stage. In Assam the main processed products of arecanut are Maza, Fali, Mala, Tipni, Rota and Sagar. The total cost of value addition of one qtl of green arecanut in cooperative unit was `15,217 and in private units it was `15,290 and net profit earned by processing unit from marketing of one qtl finished product was `4783 in co-operative unit and `4218 for private unit (Kolur et al., 10).
Processing units of arecanut generated employment facilities in the rural areas particularly for employment in female and minor labours (age below 18 years) during their leisure time. On an average, each acre of arecanut employs around 250 human labour days for cultivation and another 200 human days for processing annually (Mallikarjunaiah and Prakash., 11). The problems associated with the arecanut processing are numerous, like non-availability of the required quality of the green arecanut, low returns from different processing grade, improper marketing facilities, lack of availability of institutional finance etc. The present study has explored the cross section of different processing units according to their volume of business, investment required in general, the cost and return aspects of different grades of processed output in particular. The employment generation opportunity of the said enterprise has also been analyzed duly.
MATERIALS AND METHODSThe investigation is based on primary data
collected from 28 processing plants from Dhubri and Goalpara districts Assam. Both Participatory Rural Appraisal (PRA) and Survey methods were followed to collect information on different aspects of processing plants.
Out of 28 processing plants surveyed from two developmental blocks, are distributed over 8 clusters where each cluster possesses 2 to 5 plants (Table 1). The inter unit distance within the same cluster is 0.50 km where cluster to cluster distance ranges from 10 – 50 km. The clusters are developed within contiguous villages having due favour of raw material, labour supply and market access. Though the representation of study area is obtained from two developmental blocks, little difference is found with regard to structure, distribution and operation of plants. Hence, the present study area was taken
under unique domain devoiding any stratification. However, the selection of blocks was done based on due concentration of business activities to get adequate information on processing.
A structured survey schedule was used for collecting different information from the respondents. Simple tabular method is used for interpreting the results. The primary data is related to Financial Year 2015 – 2016. The data were analyzed with the help of simple statistical tools like average, percentage, benefit-cost ratio etc. Annualized depreciation of implements, machinery and farm buildings are estimated by the Straight Line Method appended below
Annualized depreciation = (Purchase value – Junk Value at the Life end)/ Economic life in years
RESULTS AND DISCUSSIONThe duration of processing season (November to
Mid-June) and the market arrival of green arecanut along with percentile distribution is presented in Table 2. The activity starts from month of November only and continues upto Mid-June depending upon availability of arecanuts. The less hardened nut gives better quality processed product but the quantity yield needs to be sacrificed. The over hardened nut gives more quantity yield but need to compromise with quality grade. The volume of business reaches highest in the month of February and March (37.89%) and declines in the month of April (8.79%) and May to Mid-June (7.69%). The reason is that, month of February and March are the peak harvesting season of premature green arecanut used for production of Tipni, Rota and Sagar grades. During April to Mid-June, availability of the fully ripen nuts is maximum, used for preparation of Maza, Fali and Mala grades
Table 1. Distribution of Arecanut processing plants in the study areas.
Name of the blocks
Name of the business cluster (GPs)
No. of processing plants
Agamoni Agamoni 4 Baterhat 4 Halakura 2 Shernagar 3 Sub-total 13
Bilasipara Bilasipara 5 Baghmari 4 Gopigaon 4 Hatipota 2 Sub-total 15 Total 28

297
Value Addition and Economics of Arecanut Processing Plant
which are normally processed through traditional method. The average volume of business is slightly higher in Bilasipara block compared to Agomoni block.
Table 3 represents the classification of arecanut processing plants in the study areas on the basis of number of oven possessed by plant owner. The capacity of processing unit is measured by number of oven it possess locally known as ‘chulli’, made of clay soil and iron rod. The volume of business operated by the processing units depend not only on the availability of green arecanut but also the number of oven operated by processing unit for boiling of green arecanut. The boiling activity is usually under taken twice in a week matching with the availability and the supply of nut and it continued for the whole day. One oven can boil upto 4.8 qtl of green nut in a day. The single oven plants are generally managed under individual capacity with low business strength. The number of oven may be taken as an indicator of plant size. We can say that unit with less than 3 chulli indicating small size, while those having 3-6
and more than 6 numbers of chulli, may be called medium and large unit respectively. The result shows that out of 28 processing plants in the study area 60.71%, 28.57% and 10.71% of the owners of the processing plants come under small, medium and large groups respectively. It is observed that large plants are available only in Bilasipara block proclaiming commercial gesture of the area. The reason may be that of adequate local supply of green arecanut to the processing plants, supplemented by adequacy of local labour.
The ownership pattern of processing units in the said study is delineated in Table 4. Plants or units are operative both under single proprietorship and multimember partnership. From the analysis of the ownership it has been found that 60.71% of processing plants run under single ownership, 21.43% under 2–3 member partnership and 17.86% under more than 3 member partnership. One of the primary impediments of establishing processing plant is possession of an open yard required for sun drying
Table 2. Distribution of market arrival of green arecanut for sample processing unit in a season.
Sl. No.
Months Agomoni Block Bilasipara Block OverallAmount (Qtl) % share Amount (Qtl) % share Amount (Qtl) % share
1 November 355 14.36 365 14.40 720 14.382 December 368 14.88 392 15.47 760 15.183 January 395 15.97 410 16.18 805 16.084 February 480 19.41 485 19.14 965 19.275 March 470 19.01 462 18.23 932 18.616 April 215 8.69 225 8.88 440 8.797 May to June 190 7.68 195 7.70 385 7.69Total 2473 100.00 2534 100.00 5007 100.00
Table 3. Classification of Arecanut processing plants, according to number of oven (locally called as Unan or Chulli) in the study areas.
Name of the blocks
Name of the business cluster (GPs)
No. of processing plants
No. of Chulli (Oven)< 3 3 – 6 > 6
Agamoni Agamoni 4 3 1 –Baterhat 4 2 2 –Halakura 1 1 – –Shernagar 4 3 1 –
Bilasipara Bilasipara 5 3 2 -Baghmari 4 1 2 1Gopigaon 4 2 1 1Hatipota 2 1 - 1
Total 28 (100) 17 (60.71) 8 (28.57) 3 (10.71)*Figures in the parentheses indicate percentage of respective totals.
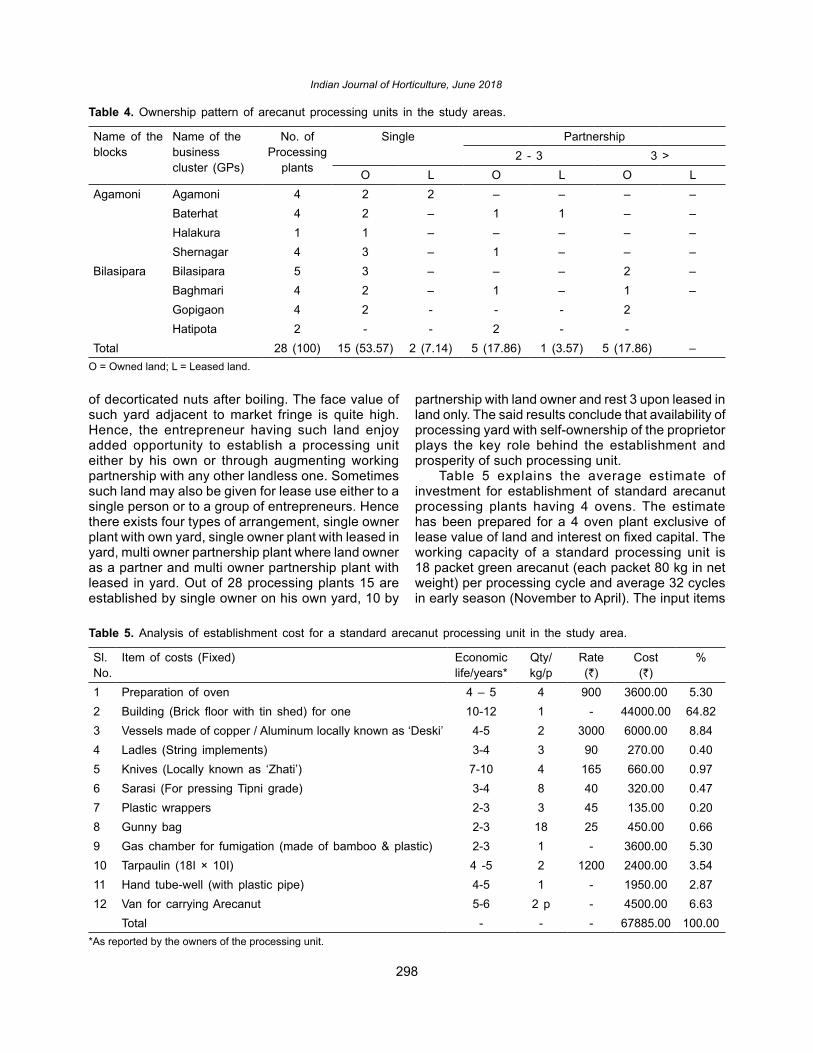
298
Indian Journal of Horticulture, June 2018
of decorticated nuts after boiling. The face value of such yard adjacent to market fringe is quite high. Hence, the entrepreneur having such land enjoy added opportunity to establish a processing unit either by his own or through augmenting working partnership with any other landless one. Sometimes such land may also be given for lease use either to a single person or to a group of entrepreneurs. Hence there exists four types of arrangement, single owner plant with own yard, single owner plant with leased in yard, multi owner partnership plant where land owner as a partner and multi owner partnership plant with leased in yard. Out of 28 processing plants 15 are established by single owner on his own yard, 10 by
partnership with land owner and rest 3 upon leased in land only. The said results conclude that availability of processing yard with self-ownership of the proprietor plays the key role behind the establishment and prosperity of such processing unit.
Table 5 explains the average estimate of investment for establishment of standard arecanut processing plants having 4 ovens. The estimate has been prepared for a 4 oven plant exclusive of lease value of land and interest on fixed capital. The working capacity of a standard processing unit is 18 packet green arecanut (each packet 80 kg in net weight) per processing cycle and average 32 cycles in early season (November to April). The input items
Table 4. Ownership pattern of arecanut processing units in the study areas.
Name of the blocks
Name of the business cluster (GPs)
No. of Processing
plants
Single Partnership2 - 3 3 >
O L O L O LAgamoni Agamoni 4 2 2 – – – –
Baterhat 4 2 – 1 1 – –Halakura 1 1 – – – – –Shernagar 4 3 – 1 – – –
Bilasipara Bilasipara 5 3 – – – 2 –Baghmari 4 2 – 1 – 1 –Gopigaon 4 2 - - - 2Hatipota 2 - - 2 - -
Total 28 (100) 15 (53.57) 2 (7.14) 5 (17.86) 1 (3.57) 5 (17.86) –O = Owned land; L = Leased land.
Table 5. Analysis of establishment cost for a standard arecanut processing unit in the study area.
Sl. No.
Item of costs (Fixed) Economic life/years*
Qty/ kg/p
Rate (`)
Cost (`)
%
1 Preparation of oven 4 – 5 4 900 3600.00 5.302 Building (Brick floor with tin shed) for one 10-12 1 - 44000.00 64.823 Vessels made of copper / Aluminum locally known as ‘Deski’ 4-5 2 3000 6000.00 8.844 Ladles (String implements) 3-4 3 90 270.00 0.405 Knives (Locally known as ‘Zhati’) 7-10 4 165 660.00 0.976 Sarasi (For pressing Tipni grade) 3-4 8 40 320.00 0.477 Plastic wrappers 2-3 3 45 135.00 0.208 Gunny bag 2-3 18 25 450.00 0.669 Gas chamber for fumigation (made of bamboo & plastic) 2-3 1 - 3600.00 5.3010 Tarpaulin (18I × 10I) 4 -5 2 1200 2400.00 3.5411 Hand tube-well (with plastic pipe) 4-5 1 - 1950.00 2.8712 Van for carrying Arecanut 5-6 2 p - 4500.00 6.63
Total - - - 67885.00 100.00*As reported by the owners of the processing unit.
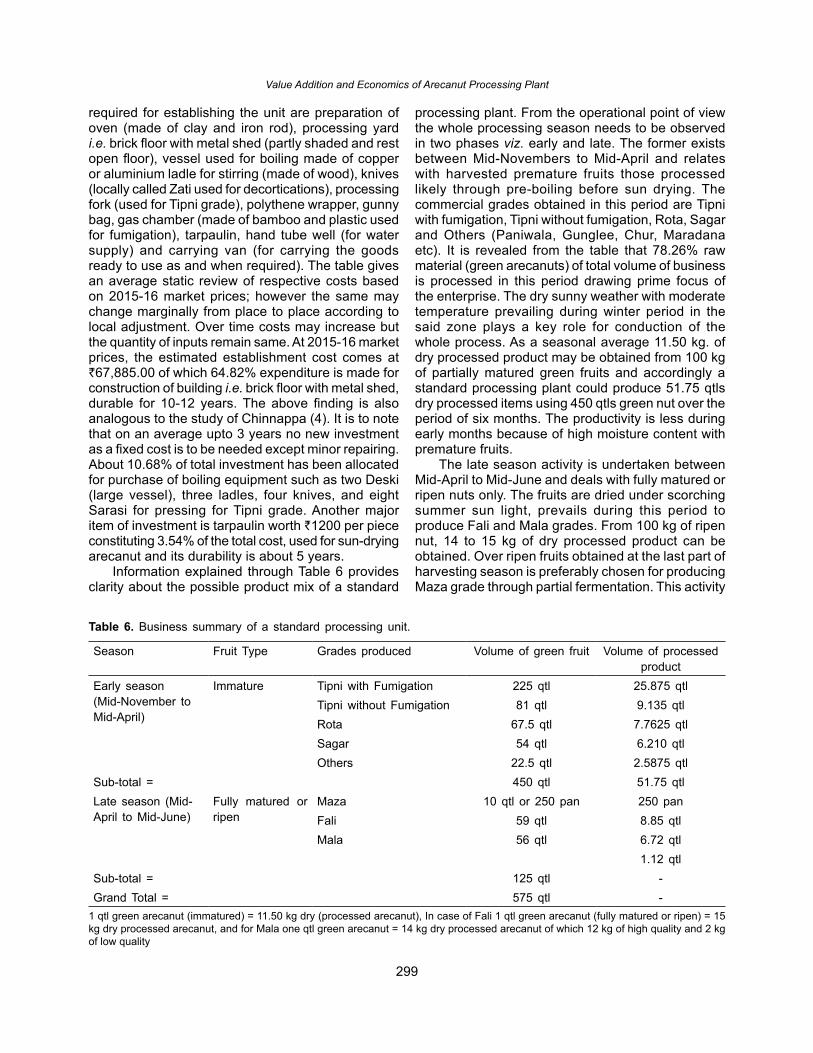
299
Value Addition and Economics of Arecanut Processing Plant
required for establishing the unit are preparation of oven (made of clay and iron rod), processing yard i.e. brick floor with metal shed (partly shaded and rest open floor), vessel used for boiling made of copper or aluminium ladle for stirring (made of wood), knives (locally called Zati used for decortications), processing fork (used for Tipni grade), polythene wrapper, gunny bag, gas chamber (made of bamboo and plastic used for fumigation), tarpaulin, hand tube well (for water supply) and carrying van (for carrying the goods ready to use as and when required). The table gives an average static review of respective costs based on 2015-16 market prices; however the same may change marginally from place to place according to local adjustment. Over time costs may increase but the quantity of inputs remain same. At 2015-16 market prices, the estimated establishment cost comes at `67,885.00 of which 64.82% expenditure is made for construction of building i.e. brick floor with metal shed, durable for 10-12 years. The above finding is also analogous to the study of Chinnappa (4). It is to note that on an average upto 3 years no new investment as a fixed cost is to be needed except minor repairing. About 10.68% of total investment has been allocated for purchase of boiling equipment such as two Deski (large vessel), three ladles, four knives, and eight Sarasi for pressing for Tipni grade. Another major item of investment is tarpaulin worth `1200 per piece constituting 3.54% of the total cost, used for sun-drying arecanut and its durability is about 5 years.
Information explained through Table 6 provides clarity about the possible product mix of a standard
processing plant. From the operational point of view the whole processing season needs to be observed in two phases viz. early and late. The former exists between Mid-Novembers to Mid-April and relates with harvested premature fruits those processed likely through pre-boiling before sun drying. The commercial grades obtained in this period are Tipni with fumigation, Tipni without fumigation, Rota, Sagar and Others (Paniwala, Gunglee, Chur, Maradana etc). It is revealed from the table that 78.26% raw material (green arecanuts) of total volume of business is processed in this period drawing prime focus of the enterprise. The dry sunny weather with moderate temperature prevailing during winter period in the said zone plays a key role for conduction of the whole process. As a seasonal average 11.50 kg. of dry processed product may be obtained from 100 kg of partially matured green fruits and accordingly a standard processing plant could produce 51.75 qtls dry processed items using 450 qtls green nut over the period of six months. The productivity is less during early months because of high moisture content with premature fruits.
The late season activity is undertaken between Mid-April to Mid-June and deals with fully matured or ripen nuts only. The fruits are dried under scorching summer sun light, prevails during this period to produce Fali and Mala grades. From 100 kg of ripen nut, 14 to 15 kg of dry processed product can be obtained. Over ripen fruits obtained at the last part of harvesting season is preferably chosen for producing Maza grade through partial fermentation. This activity
Table 6. Business summary of a standard processing unit.
Season Fruit Type Grades produced Volume of green fruit Volume of processed product
Early season (Mid-November to Mid-April)
Immature Tipni with Fumigation 225 qtl 25.875 qtlTipni without Fumigation 81 qtl 9.135 qtlRota 67.5 qtl 7.7625 qtlSagar 54 qtl 6.210 qtl Others 22.5 qtl 2.5875 qtl
Sub-total = 450 qtl 51.75 qtlLate season (Mid-April to Mid-June)
Fully matured or ripen
Maza 10 qtl or 250 pan 250 panFali 59 qtl 8.85 qtlMala 56 qtl 6.72 qtl
1.12 qtlSub-total = 125 qtl -Grand Total = 575 qtl -
1 qtl green arecanut (immatured) = 11.50 kg dry (processed arecanut), In case of Fali 1 qtl green arecanut (fully matured or ripen) = 15 kg dry processed arecanut, and for Mala one qtl green arecanut = 14 kg dry processed arecanut of which 12 kg of high quality and 2 kg of low quality
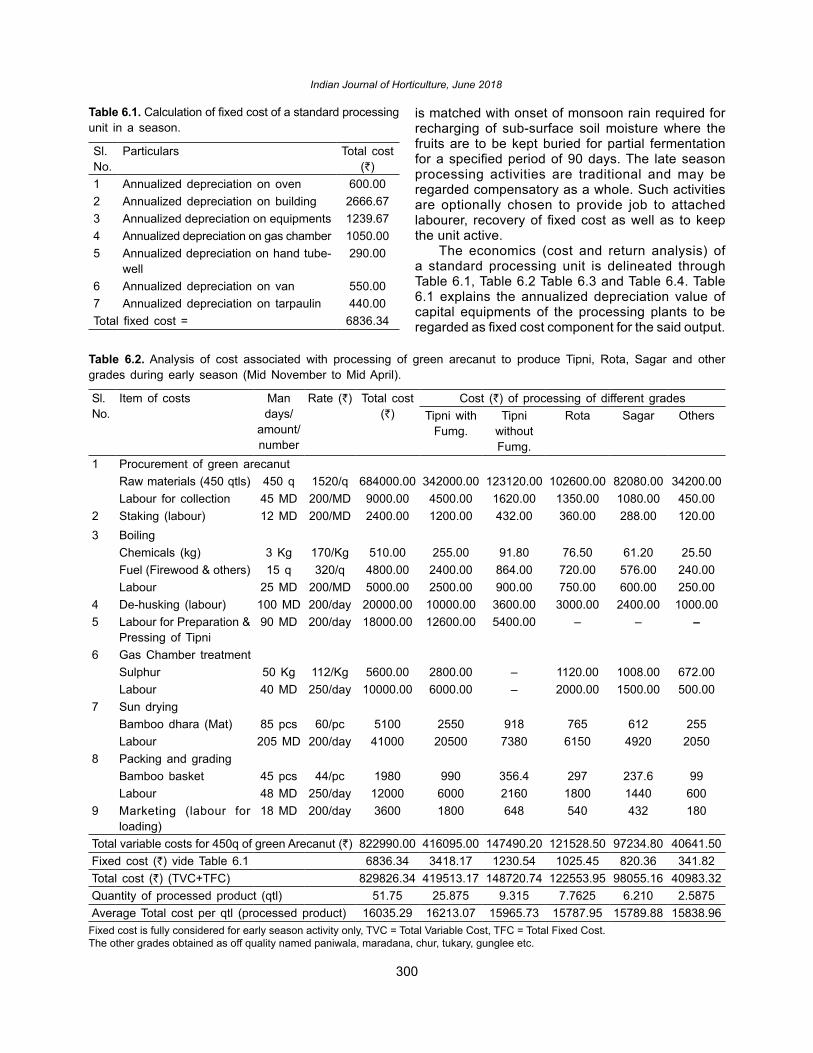
300
Indian Journal of Horticulture, June 2018
Table 6.1. Calculation of fixed cost of a standard processing unit in a season.
Sl. No.
Particulars Total cost (`)
1 Annualized depreciation on oven 600.002 Annualized depreciation on building 2666.673 Annualized depreciation on equipments 1239.674 Annualized depreciation on gas chamber 1050.005 Annualized depreciation on hand tube-
well290.00
6 Annualized depreciation on van 550.007 Annualized depreciation on tarpaulin 440.00Total fixed cost = 6836.34
Table 6.2. Analysis of cost associated with processing of green arecanut to produce Tipni, Rota, Sagar and other grades during early season (Mid November to Mid April).
Sl. No.
Item of costs Man days/
amount/number
Rate (`) Total cost (`)
Cost (`) of processing of different gradesTipni with
Fumg.Tipni
without Fumg.
Rota Sagar Others
1 Procurement of green arecanutRaw materials (450 qtls) 450 q 1520/q 684000.00 342000.00 123120.00 102600.00 82080.00 34200.00Labour for collection 45 MD 200/MD 9000.00 4500.00 1620.00 1350.00 1080.00 450.00
2 Staking (labour) 12 MD 200/MD 2400.00 1200.00 432.00 360.00 288.00 120.003 Boiling
Chemicals (kg) 3 Kg 170/Kg 510.00 255.00 91.80 76.50 61.20 25.50Fuel (Firewood & others) 15 q 320/q 4800.00 2400.00 864.00 720.00 576.00 240.00Labour 25 MD 200/MD 5000.00 2500.00 900.00 750.00 600.00 250.00
4 De-husking (labour) 100 MD 200/day 20000.00 10000.00 3600.00 3000.00 2400.00 1000.005 Labour for Preparation &
Pressing of Tipni 90 MD 200/day 18000.00 12600.00 5400.00 – – –
6 Gas Chamber treatmentSulphur 50 Kg 112/Kg 5600.00 2800.00 – 1120.00 1008.00 672.00Labour 40 MD 250/day 10000.00 6000.00 – 2000.00 1500.00 500.00
7 Sun dryingBamboo dhara (Mat) 85 pcs 60/pc 5100 2550 918 765 612 255Labour 205 MD 200/day 41000 20500 7380 6150 4920 2050
8 Packing and gradingBamboo basket 45 pcs 44/pc 1980 990 356.4 297 237.6 99Labour 48 MD 250/day 12000 6000 2160 1800 1440 600
9 Marketing (labour for loading)
18 MD 200/day 3600 1800 648 540 432 180
Total variable costs for 450q of green Arecanut (`) 822990.00 416095.00 147490.20 121528.50 97234.80 40641.50Fixed cost (`) vide Table 6.1 6836.34 3418.17 1230.54 1025.45 820.36 341.82Total cost (`) (TVC+TFC) 829826.34 419513.17 148720.74 122553.95 98055.16 40983.32Quantity of processed product (qtl) 51.75 25.875 9.315 7.7625 6.210 2.5875Average Total cost per qtl (processed product) 16035.29 16213.07 15965.73 15787.95 15789.88 15838.96
Fixed cost is fully considered for early season activity only, TVC = Total Variable Cost, TFC = Total Fixed Cost.The other grades obtained as off quality named paniwala, maradana, chur, tukary, gunglee etc.
is matched with onset of monsoon rain required for recharging of sub-surface soil moisture where the fruits are to be kept buried for partial fermentation for a specified period of 90 days. The late season processing activities are traditional and may be regarded compensatory as a whole. Such activities are optionally chosen to provide job to attached labourer, recovery of fixed cost as well as to keep the unit active.
The economics (cost and return analysis) of a standard processing unit is delineated through Table 6.1, Table 6.2 Table 6.3 and Table 6.4. Table 6.1 explains the annualized depreciation value of capital equipments of the processing plants to be regarded as fixed cost component for the said output.

301
Value Addition and Economics of Arecanut Processing Plant
Table 6.3. Analysis of variable cost to associated with processing of ripen arecanut to produce Maza, Fali and Mala grade in 2nd phase of the season (Mid-April to Mid-June).
Item of costs Maza Fali MalaQty/MD
Rate(`)
Cost(`)
Qty/MD Rate (`)
Cost (`)
Qty/MD Rate(`)
Cost(`)
ProcurementGreen Arecanut 200 pan 105/pan 21000.00 20 pan 105/pan 2100.00 20 pan 105/pan 2100.00b. Labour for collection 0.80 MD 200/day 160.00 0.08 MD 200/day 16.00 0.08 MD 200/day 16.00For Fermentation of mazaLabour for digging of hole 1 MD 200/day 200.00 – – – - - -b. Plastic for covering 0.5 kg 160/kg 80.00 – – – - - -c. Turmeric dust for colour 0.5 kg 120/kg 60.00 – – – - - -d. De-holing 0.5 MD 200/day 100.0 – – – - - -Framing of garland of fruit 20 pan 4.50/
pan90.00
SundryingLabour – – – 0.8 MD 200/day 160.00 0.8 MD 200/day 160.00Bamboo dhara for drying (mat) – – – 2 piece 60/p* 120.00 2 nos 60/p* 120.00De-husking (labour) – – – 0.4 MD 200/day 80.00 0.4 MD 200/day 80.00Packing Gunny bag 5 Nos. 48/bag 240.00 2 nos. 48/bag 96.00 2 nos. 48/bag 96.00Labour requirement 0.8 MD 200/MD 160.00 0.05 MD 200/MD 10.00 0.05 MD 200/MD 10.00Total cost (TC) – – 22000.00 – – 2672.00 - - 2582.00TC/q, (TC/pan for Maza) – – 110.00 – – 3340.00 - - 3227.50
*The average volume of business of sampling processing unit for the grades of Maza, Fali and Mala = 125 qtl in a season1 pan = 80 nos. of maza arecanut, 1 qtl. raw arecanut = 25 Pan
It is pertinent to note that all such capital inputs are basically used during early activities of the season and thus said cost component be accounted with for the preparation of processed products viz. Tipni, Rota, Sagar etc grades only. The processed products (grades) obtained during late phase of the production season hardly demand any use benefit out of such capital inputs.
The Table 6.2 explores the activity wise variable cost requirement to run a processing unit from Mid-October to Mid-April to produce 51.75 qtls of dry (processed) arecanut from 450 qtls of green immature fruit. There are nine different activities related with processing viz. procurement of green nut, staking, boiling, de-husking, pressing for preparation of Tipni grades, gas treatment, sun-drying, packing cum sorting and finally marketing. From the study, it is revealed that the apportioning of business (450 qtls) in a season amongst the above grades accounts as 50% for Tipni with fumigation, 18% for Tipni without fumigation, 15% for Rota, 12% for Sagar and the rest 5% for other grades. Here other grade includes
Paniwala, Maradana, Chur, Tukari, Gunglee etc. It is to be noted here that other grades viz. Paniwala and Gunglee are produced in option only and also based on specific demand come from the consumers while Maradona, Chur and Tukari are basically by-products of the processing operations. The preparation of Tipni grades starts from Mid-November and is continued upto Mid–February in Assam because production of this grade needed immature nut (30% to 45% mature) while the preparation of Rota needs half matured nuts and its period of operations is March to Mid-April. For Sagar and Chur grade, the period of operation generally starts from Mid-November and continued to Mid-April because these two grades are also produced from immature arecanut.
It is observed from the Table 6.2 that the major operational costs are the cost of raw material and labour cost accounting around 83.11% and 12.52% respectively. The overall average variable cost for processing of one qtl green arecanut to processed items for preparation of Tipni, Rota, Sagar and other grades stands `15,903.19 which is about 99.18% of

302
Indian Journal of Horticulture, June 2018
Tabl
e 6.
4. R
etur
n an
alys
is o
f a
stan
dard
pro
cess
ing
unit
of a
reca
nut
in a
sea
son.
Gra
des
Qua
ntity
Mar
ket
pric
eR
etur
n (`
)G
ross
ret
urn
(`)
Tota
l cos
t (`
)B
:C
ratio
Net
ret
urn
(`)
Net
re
turn
(`
/q)
Mai
n pr
oduc
t (q
tl)
By-
prod
uct
(bag
)
Mai
n pr
oduc
t (`
/qtl)
By-
prod
uct
(`/b
ag)
Mai
n pr
oduc
tB
y-pr
oduc
t
Tipn
i with
Fum
g.25
.875
7821
000
8554
3375
.00
6630
.00
5500
05.0
041
9513
.17
1.31
1304
91.8
350
43.1
6Ti
pni w
ithou
t Fum
g.9.
315
3219
500
8518
1642
.50
2720
.00
1843
62.5
014
8720
.74
1.24
3564
1.76
3826
.28
Rot
a7.
7625
2918
000
8513
9725
.00
2465
.00
1421
90.0
012
2553
.95
1.16
1963
6.05
2529
.60
Sag
ar6.
210
2317
000
8510
5570
.00
1955
.00
1075
25.0
098
055.
161.
1094
69.8
415
24.9
3O
ther
s2.
5875
1016
500
8542
693.
7585
0.00
4354
3.75
4098
3.32
1.06
2560
.43
989.
54S
ub-T
otal
--
--
1013
006.
25(9
8.58
)14
620.
00(1
.42)
1027
626.
25(1
00.0
0)82
9826
.34
1.24
1977
99.9
1-
Maz
a25
0 pa
n =
10 q
tl-
180
/pan
-45
000.
00-
4500
0.00
2750
0.00
1.64
1750
0.00
1750
.00
Fali
8.85
236
2700
085
2389
50.0
020
060.
0025
9010
.00
1970
60.0
01.
3161
950.
0010
50.0
0M
ala
6.72
(hi
gh
qual
ity)
224
2650
085
1780
80.0
019
040.
0022
4000
.00
1807
40.0
01.
2443
260.
0077
2.50
1.12
(lo
w
qual
ity)
2400
026
880.
00
Sub
-Tot
al-
--
-48
8910
.00
(92.
59)
3910
0.00
(7.4
1)52
8010
.00
(100
.00)
4053
00.0
01.
3012
2710
.00
-
Gra
nd T
otal
--
--
1501
916.
25
(96.
77)
5372
0.00
(3.2
3)15
5212
6.25
(100
.00)
1235
126.
341.
2631
6999
.91
-
*Fig
ures
in th
e pa
rent
hese
s in
dica
te p
erce
ntag
e of
resp
ectiv
e to
tals
.

303
Value Addition and Economics of Arecanut Processing Plant
total cost. The result is also analogous to the study of Kolur et al (10) for the above grades. The average fixed cost per qtl for processing of the above individual grades slightly differs as all activities are not required for such specific grades.
From the assessment of variable cost (Table 6.3) for the preparation of Maza, Fali and Mala in second phase or late season, it is observed that there are six different types of activities viz., procurement, fermentation, framing of garland, sundrying, de-husking and packing. But all the activities are not required to produce above said grades. The activities like fermentation and framing of garland are exclusively needed for Maza and Mala preparation respectively while sun-drying activity is not required for Maza preparation. The average volume of business for the said above grades in a season is 125 qtls, out of which 8.00% goes for the preparation of Maza grade, 47.20% for Fali grades and 44.8% for Mala grade. The productions of different grades partially vary with respect to the demand for same well as supply of the raw material as mentioned earlier. The above grades are produced in non-chemical way and production continues between Mid-April to Mid-June. The average cost of preparing one unit (80 nos) of Maza is `110.00 while for Fali and Mala grades, the average cost of preparation per qtl are ̀ 3340.00 and `3227.00, respectively.
The return analysis of a standard processing plant is evaluated and presented through Table 6.4. The said analysis is done in two section based on two phases of seasonal processing activity viz. early season processing by using green or immature nuts to produce Tipni, Rota, Sagar and other grades and late season processing by using fully matured or ripen nut for preparation of Maza, Fali and Mala grades. The return analysis reveals that the gross return constitutes two parts – major contribution from marketing of main product i.e. processed product and a very negligible income from the selling of by-product i.e. the husk of arecanut fruits). The overall contribution to gross return from selling of main processed grades accounts 96.77% and rest 3.23% from selling of by product. In early season activity the gross return subsequently net return per qtl of dry processed nuts are the highest for Tipni with fumigation grade (`5,50,005.00 and `5043.16, respectively) with benefit-cost ratio of 1.31:1 followed by Tipni without fumigation grade (`1,84,362.50 and ̀ 3826.28 respectively) with benefit-cost ratio of 1.31:1 and Rota (`1,42,190.00 and `1524.93.00, respectively). The above findings are also comparable to the study of Kolur et al (10). In late season processing activity the gross return and net return per qtl are highest for Maza grade (`45,000.00 and ̀ 1750.00, respectively)
with benefit cost ratio of 1.64:1 followed by Fali (`2,59,010.00 and `1750.00, respectively) and Mala (`2,24,000.00 and `7,72,500.00, respectively). It is important to note that although the net return per qtl is higher for Tipni grades but the benefit-cost ratio is highest for Maza grade preparation. This may be due to the fact that processing cost of later is negligible. One of the major findings is that the total net income of the entrepreneur from the early season processing activity is `1,97,799.91 with an average benefit–cost ratio of 1.24:1 and from late season activity it is `1,22,710.00 with benefit-cost ratio of 1.30:1. Accordingly, an entrepreneur can earn a net income to the tune of `3,16,999.91 over the whole season for the total volume of business of 575 qtls of green arecanut.
The employment opportunity of arecanut processing unit has been explained in Table 7. There is an operational sequence of the process and for each step some sorts of specialization is also required. The sequence is composed of a set of activities namely, collection of green fruit, staking in peal, boiling of green fruit, decortications of boiled green fruit (de-husking), preparation of low height bamboo roof for sun-drying of green nut, pressing of half dried nut for Tipni grade, fumigation of dried nut, packaging of products and also disposal for the market. Most of the activities are performed by hired casual labour with ongoing market wage rate. For decortications of boiled green fruit and pressing of half dried nut for ‘Tipni’ grade, local female labour and their grown up minors (age below 18 years) are generally engaged on contract basis. For decortications job, the unit is one basket full fruit containing around 15 kg of green fruit and a standard skilled women labour can decorticate 30 – 35 basket in a day. The minor can also decorticate 17 – 20 baskets in a day along with their elders. The quantitative requirement of labour input for running a four oven processing unit having a standard operational turnover of average 575 qtl green fruit for average nine months processing season has been delineated in the said table. From the given data it is observed that the unit can generate 778.50 mandays over the season of which 41.10% goes for sun-drying, 20.53% for dehusking of fruits, 11.56% for pressing for ‘Tipni’ and 7.39% for collection of green arecanut 9.57 packaging, grading and marketing and rest 9.89% for boiling of green fruits, fumigation staking purpose. On the basis of different grades of processed nuts out of total employment (mandays) generation 74.89% contributed from preparation of Tipni, Rota, Sagar and other grades, 12.64% from Fali grade preparation, 11.94% from Mala grade and 0.51% coming from Maza processing. Regarding gender distribution of labour, 49.84% for

304
Indian Journal of Horticulture, June 2018
male (man), 36.87% for female and 13.29% goes for grown up minor. Males are engaged in collection of green fruits, staking, preparation of bamboo roof and marketing while female and minor reserve their dominance upon dehusking and preparation for ‘Tipni’. Other works are shared by male and female in complementary mode. The remarkable observation of the said information states that the given enterprise provides a holistic support to the job starved society of the area to sustain upon family income rather than individual.
CONCLUSION The emergence of agribusiness of arecanut
processing is backed by the availability of green nut produced in homestead orchards in Assam. The seasonal processing activities continue from November to June with a peak concentration during February and March. The size of business of a processing plant is directly related with number of oven it possesses. More than 60% of processing plants have only less than 3 oven in the study area and about two third of plants are on single ownership and the rest are under partnership. The estimated costing of establishment of a standard processing unit having four ovens is `67,885.00 at 2015-16 prices. The entire processing activity is done in two phases- one in early season (Mid-November to Mid-
Table 7. Employment generation in a standard processing unit in a season.
Sl. No.
Name of the activities Employment (no. of mandays) for processing of different grades
Division of labour
TRSO* (450q)
Maza Fali(59q)
Mala (56q)
Total labour (MD)
Male Female Minor
1 Collection of raw materials 45 1 5.9 5.6 57.5 [7.39] 57.5 - -2 Staking 12 - - - 12 [1.54] 12 - -3 Boiling 25 25 [3.21] 9 16 -4 De-husking 100 - 29.5 28 157.5 [20.23] - 96 1235 Preparation and pressing of Tipni 90 - - - 90 [11.56] - 48 846 Gas chamber treatment 40 - - - 40 [5.14] 40 - -7 Sun drying 205 59 56 320 [41.10] 216 104 -8 Digging of hole & de-holing - 2 - - 2 [0.26] 2 - -9 Packaging & grading 48 1 4 3.5 56.5 [7.26] 33.5 23 -10 Marketing 18 - - - 18 [2.31] 18 - -Total Labour (Mandays) 583
(74.89)4
(0.51)98.4
(12.64)93.10
(11.94)778.50
[100.00]388
(49.84)287
(36.87)207
(13.29*)*Figures in the parentheses indicate percentage of respective totals.Figures in the third bracket indicate percentage of respective totals.*Average volume of business 575 qtls per unit processing plant per annumTRSO* = Tipnis, Rota, Sagar & Others grades, MD = Mandays, *The percentage of minor labour is calculated in respect of work efficiency as 1 male labour = 1 female labour = 2 minor labour (age below 18 years)
April) by using premature nut to produce Tipni, Rota and Sagar grades and another in late season (Mid-April to Mid-June) to produce Maza, Fali and Mala by using fully ripen arecanuts. It is studied that the volume of business of a standard processing unit in early season are 450 qtls and in late season it is 125 qtls and on an average, one qtl of premature nut gives 11.5 kg dry processed products of different grades but it is 14 kg to 15 kg for ripen arecanut (for Fali and Mala grades). The major operational costs are the cost of raw material and labour cost accounting 83.11% and 12.52%, respectively. Although the average total cost (`16,035.29) for preparation of Tipni, Rota, Sagar and other grades is more or less same but net return per qtl from marketing of above grades is different viz. `5043.16 for Tipni with fumigation, `3826.28 for Tipni without fumigation, `2529.60 for Rota, `1524.93 for Sagar grade and for other grades it is `989.54. In late season, out of three grade of processed nut (Maza, Fali and Mala), the highest business of volume contributed from Mala grade followed by Fali but the net profit per qtl stands `1750 for Mala and `1050.00 for Fali with a benefit-cost ratio 1.64:1 and 1.31, respectively. An entrepreneur can earn a net income to the tune of `3,16,999.91 with overall B:C of 1.26:1 in a whole season of which 62.40% is contributed from early season processing activity with B:C of 1.30:1 and

305
Value Addition and Economics of Arecanut Processing Plant
rest from late season processing activity with B:C of 1.30.:1. The study reveals that a standard processing plant can generate 778.5 mandays for various activities of which 49.84%, 36.87% and 13.29% done by male, female and minors respectively. An analytical review of the study indicates that agribusiness through processing of green arecanut opens up a vista of forward linkage opportunity both in employment and income, ensuring complementary synergy between farm and non-farm sector of rural livelihood domain.Notes1. Maza: The matured ripen arecanuts are put
into a soil chamber (underground pit / hole). Plastic or bamboo mat locally called dhara are wrapped around the pit so that the soil cannot come in direct touch with nuts and then covered with polythene for retting for minimum of 90 days to make the arecanut soft and also to create a smell. After 90 days the partly fermented arecanuts are recovered and named as Maza supari and packed for marketing without decortication.
2. Fali: The matured fully ripen arecanut is just cut into two pieces in length and sun dried. After drying husking is done for packing.
3. Mala: The fully ripen arecanuts is stitched with plastic twine and then sundried for a period of 90 days. The husking is done thereafter.
4. Tipni: First, green arecanut along with husk is boiled for half an hour. After subsequent dehusking the nuts to be boiled for another half an hour. Now, the boiled arecanut is to be sundried for 4-5 days. In between the soft arecanut is pressed to give button like shape called Tipni.
5. Rota: Single boiled nuts are dehusked and dried gradually to turn into deep red colour (Red Rota). In second method, green arecanut fruits are partially boiled for half an hour then dehusked and put into 2nd boiling with one chemical, locally called ‘hydro’ for another half an hour. The product colour will be white while dried and is called White Rota
6. Chur: Broken, off size, small particles of dried nuts obtained at the time of processing Tipni.
7. Maradana: During the preparation of Tipni, some low grade off quality products of light black colour is obtained due to processing failure and is called Maradana.
REFERENCES 1. Anonymous. 2009. Indian Horticulture Data
Base, NHB, Gurugram, Haryana, India.
2. Bhalerao, M.M. and Singh, R.K. 1982. A study of marketing of Arecanut in Jalpaiguri district of West Bengal. In: Arecanut Research and Development, Ed: Sharma, Bhat and Radhakrishnan. Central Plantation Crops Research Institute, Kasaragod. pp. 205-206.
3. Bhalerao, M. M. and Singh, R .K. 1985. Profitability of Arecanut cultivation in Jalpaiguri Area of West Bengal - A Sample Study, In: Arecanut Research and Development, Kshama Bhat and C.P. Radhakrishnan Nair (eds.), CPCRI, Kasaragod, pp. 217-19.
4. Chinnappa, B. 2000. Economics of farm level processing of Arecanut. Agric. Mktg. 43: 17-19.
5. Danti, A. and Suresha, M. 2012. Texture Based Decision Tree Classification for Arecanut. International CUBE conference on IT-Engineering-Management-Telecom. pp. 113-117. Anonymous, 2009, Indian Horticulture Data Base.
6. Das, P. K. 1985. Cost of Production and Cost-Benefit Analysis of Smallholder Plantation Crops. Technical Bulletin No. 12, CPCRI, Kasaragod, 1985, pp. 1-8.
7. Gittinger, J. P. 1984. Economic Analysis of Agricultural Projects, EDI Series in Economic Development, World Bank. pp. 299-363.
8. Jose, C. T. and Jayasekhar 2008. Growth trends in area, production and productivity of Arecanut in India. Agric. Situation in India, 65: 135-40.
9. Kammardi, T. N. P. 2012. Arecanut economy at the cross roads - Report of Special Scheme on Cost of Cultivation of Arecanut in Karnataka (GOI), Department of Agricultural Economics, University of Agricultural Sciences, GKVK, Bengaluru.
10. Kolur, A. S., Murthy, C., Mahajanashetti, S. B. and Venugopal, C. K. 2012. Value addition and marketing efficiency in Arecanut processing units. Karnataka J. Agric. Sci. 25: 77-81.
11. Mallikarjunaiah, K. G. and Prakash, T. N. 1988. Processing and Marketing of Arecanut in Shimoga District. Research Report submitted to Director of Research, University of Agricultural Sciences, Bangalore.
Received : September, 2017; Revised : February, 2018; Accepted : May, 2018
306
DOI : 10.5958/0974-0112.2018.00051.8
Indian J. Hort. 75(2), June 2018: 306-313
INTRODUCTION Button mushroom (Agaricus bisporus) is the most
common edible mushroom in the world due to having good taste and high nutritional value (Khan et al., 8). The main limiting factor in the industrial development of mushroom is its short shelf life, which is due to the lack of thick cuticle protecting the product against physical and microbial injuries, water loss and high rate of metabolism (Donglu et al., 4; Lagnika et al., 11). For this reason, mushroom is more susceptible to spoilage, enzymatic browning and eventually aging. Extening postharvest life by preventing the enzymatic browning and controlling bacterial agents can be helpful for mushroom industry (Lagnika et al., 11). To this end, various methods have been reported to be applied to maintain the storage quality of mushroom, such as; the use of packaging with nano films (Donglu et al., 4), sodium metabisulfite (Brennan et al., 3), organic acids (Brennan et al., 3), ultrasound waves and high pressure of argon (Lagnika et al., 11). All of the mentioned methods, in addition to increasing the shelf life of the mushroom, have some disanvantages, such as nutritional value diminution, texture changes, discoloration, contamination by pathogen microorganisms, elimination of flavor and aroma, high energy consumption, and not being
usable at industrial scale. Therefore, searching for alternative methods is of high importance (Rico et al., 14).
Hydrogen peroxide (H2O2) is known as a chemical compound used against the microorganisms existed on the outer surfaces of fruits and vegetables. By producing reactive oxygen species such as hydroxyl radicals, H2O2 shows a good antimicrobial effect. The remains of this compound are degradedin to water and oxygen by catalase enzyme, and its use in the disinfection of food materials is recognized to be safe (Kniel et al., 9). In edible mushroom, washing with H2O2 before packaging has been reported to be an effective pre-treatments in reducing microbial load, maintaining proper color and increasing the shelflife (Andrawis and Kahn, 1; Brennan et al., 3). In addition to the whole mushroom, the positive effect of H2O2 treatment on the reduction of bacterial populations and consequently the prevention of browning in fresh cut sliced mushroom was also observed (Bernnan et al., 3).
Nanocomposite materials that are developed for use in food packaging industry include a polymer with an additive nano particle that changes the physical properties of the polymer (Douglas et al., 5). The nano particles used in advanced nanopolymers (nanocomposites) cause an increase in flexibility,
Effect of different packaging films and pre washing on the shelf life of button mushrooms
Narges Hassani and Orang Khademi*
Department of Horticulture, Faculty of Agriculture, Shahed University, Tehran, Iran
ABSTRACT Button mushroom quickly loses its quality after harvest. Weight loss, enzymatic browning and microbial
contamination are the main factors limiting the shelf life of edible mushroom. In this study, the effects of pre-washing with 1% H2O2, pre-washing with distilled water, and no washing, as well as the effects of packaging by using nanosilica-polyethylene, conventional polyethylene and cellophane films on the maintenance of postharvest quality of button mushrooms were investigated. After being washed, the mushrooms were packaged by using these films, stored at 4 °C, and then studied at 7and 14 day after storage. The results showed that mushrooms packaged in nanosilica-polyethylene film compared to the two other packaging films had lower values of browning (23 and 16% less than cellophane and conventional polyethylene, respectively) and weight loss (66% less than cellophane and 48% less than conventional polyethylene), as well as higher value of L* (6.5 and 5% more than cellophane and conventional polyethylene, respectively) and phenol content (10 and 7.5% more than cellophane and conventional polyethylene, respectively). In addition, pre-washing with H2O2 before packaging was more effective treatment in preserving the quality and color of the mushroom compared to washing with distilled water and no washing treatments, due to the reduction of microbial load. Therefore, the combination of washing with H2O2 and packaging in nanosilica-polyethylene film can be effective treatment in increasing the shelllife of the mushrooms.Keywords: Agaricus bisporus, bacterium, nano packaging, enzymatic browning, weight loss.
*Corresponding author's Email: [email protected]

307
Effect of Packaging Films and Pre washing on Button Mushrooms
increase in the prevention of gas entry and exit, and increase in moisture and thermal stability of the polymers. These nanoparticles make the plastic cover light, firm and heat-resistant, and are an obstacle to the movement of gases. Douglas et al. (5) reported that the silica nanoparticle-rich plastic bag is lighter and stronger than other similar products, and exhibits high resistance to heat. These plastics can prevent the drying of materials and protect them against humidity and oxygen. The positive effect of nano packaging on the increase of storage life and improvement of jujube quality was reported by Li et al. (12). Therefore, films containing nanoparticles, due to changing physical properties, can be very useful in increasing the shelf life of edible mushroom. Donglu et al. (4) showed that use of nanocomposite packages containing nano-Ag and nano-TiO2 reduced the aging development in edible mushroom by decreasing respiration rate.
In this study, the effect of polyethylene film containing silica nano particles on the preservation of postharvest quality of edible mushroom in comparison with polyethylene film without nanoparticles and cellophane (as a common film for packaging of edible mushroom) was investigated. In addition, the effect of washing with H2O2 before packaging compared with no washing and washing with water was studied.
MATERIALS AND METHODSButton mushroom samples with closed cap and
uniform diameter of 40 ml were provided from the commercially mushroom production unit in Mallard of Karaj and transferred quickly to the postharvest laboratory. The TSS value of mushrooms at harvest time was 5.58% and the firmness was 1.95 kg/cm2.
Uniform and without defect mushrooms were selected and divided into three groups, each containing 126 mushrooms. The first group was treated with distilled water and the second group was treated with 1% H2O2 solution for 10 min, and they were then dried in the laboratory for one hour. The third group was not washed as a control. Then the mushrooms of each group were divided into three subgroups, each containing 42 mushrooms. 42 mushrooms of each subgroup were randomly distributed in six polyethylene containers special for mushroom, each containing 7 mushrooms. The first, second and third subgroups were packaged with cellophane film, nanosilica-polyethylene (NS-PE) and common polyethylene (PE), respectively. NS-PE film, which was prepared using a silicon nano-emulsion solution, was provided from Aitak Nano BisPar Corporation.
Packaged mushrooms were stored at 4 °C and relative humidity ≥ 80%, and three packages of each
packaging film, as three replicates, were removed from the storage and evaluated at 7- and 14-day periods. The rate of browning, L* value, total phenol content, weight loss percentage, bacterial colony formation unit (CFU), firmness, and soluble solids content were measured in the present experiment. The severity of mushrooms browning was assessed visually on the surface of mushroom at five levels ranging from 0 (no browning) to 5 (maximum browning), and the browning index was calculated according to formula of:Browning Index = ∑ [(Browning level) × (number of mushroom at each browning level)] / (5 × total number of mushroom in the packaging).
The color parameter of L* was determined using a colorimeter (TEST-300, Taiwan) at three points of each mushroom. Total phenol content of mushrooms was measured by Follin-Ciocaltaeu method. To do so, 1g of mushroom tissue was homogenized with 10 ml of 80% methanol using a mortar for 5 min. The obtained homogenate was centrifuged at 10000 rpm at 4°C for 10 min, and then 7 ml distilled water for each 1 ml of the extract was added in a test tube, followed by adding 1 ml of Folin-Denis reagent for color development. After 5 min, 1 ml saturated sodium carbonate solution was added and the absorbance was measured at 760 nm within 1 hours by using spectrophotometer. The amount of phenol content was estimated against standard tannic acid, expressed as mg of tannic acid equivalent per 100g of the fresh weight sample.
Weight loss (%) during the storage was calculated by weighing the mushrooms before and after the storage by using the formula of [(weight of fruits before the storage – weight of fruits after the storage)/weight of fruits before storage] ×100.
In order to determine the CFU, 20 g of mushroom was homogenized in 200 ml sterilized distilled water by a blender device (Midea BL-F016ABS model) at 600 w power and high speed for 2 min. Consecutive concentrations (10-1 - 10-5) were prepared by mixing one ml of the extract with 9 ml of sterile distilled water. Then, one drop of each concentration was distributed homogeneously in petri dishes containing nutrient agar medium (2.8%). The petridishes were kept in incubator at 27°C for 27 hours, and finally the number of colonies per petri dishes was counted and reported as log10CFU.
Mushroom firmness was determined using a hand penetrometer (model VBR80) equipped with a 4-mm tip at 2 equatorial points, and the results were expressed as Newton (N). Total Soluble Solid (TSS) of the mushroom juice was determined by a hand refractometer (RF40).
A randomized design with three replicates per treatment was used in this experiment. To determine

308
Indian Journal of Horticulture, June 2018
the effects of pre-washing treatment, packaging film and storage time on each dependent variable, a three-way analysis of variance was carried out using SAS software (version 9.2). Mean values of the treatments were compared by using Least Significant Difference test (LSD, P=0.05).
RESULTS AND DISCUSSIONThe ANOVA results related to treatments of pre
washing, packaging film, time of storage factors and their interaction on button mushrooms were shown in Table 1. The mushrooms packaged with NS-PE film had significantly lower rate of browning (0.47) compared to the mushrooms packaged with PE and cellophane films (0.56 and 0.62, respectively), while there was no significant difference in the intensity of browning between the mushrooms packaged with PE and cellophane (Fig. 1). On the other hand, at both 7- and 14-day storage times, the lowest rate of browning (0.37) was observed in the samples washed with H2O2 before packaging. During the 7-day storage time, samples of water pre washing had higher rate of browning than non-washed samples, while at 14-day
storage time, no significant difference was observed between the two treatments (Fig. 2).
L* value of mushroom samples showed significant decrease at 14-day storage time compared to the 7-day. Moreover, samples washed by H2O2 had higher value of L* (78.23) than those washed with water as well as non-washed samples (with L* values of 71.2 and 69.87, respectively), while there was no significant difference between samples of water washing treatment and non-washed samples. The highest value of L* (75.81) was observed in NS-PE packaging film. There was also no significant difference between PE packaging film and cellophane (with values of 72.48 and 71.02, respectively) in terms of L* (Fig. 3).
One of the main factors reducing the postharvest quality of button mushroom is rapid browning and discoloration. Browning of button mushroom occurs as a result of tyrosinase activity, an enzyme from polyphenol oxidase family, and the attack of Pesudomonas tolasii bacterium (Brennan et al. 3; Munsch et al., 13). As a result of increase in time and the aging of mushroom, as well as the
Table 1. Statistical analysis of parameters studied: time of storage (T), washing treatment (WT) and packaging film type (PFT) and their interaction for mushroom through analysis of variance.
T WT PFT T×WT T×PFT WT×PFT T×WT×PFTBrowning index ** ** ** ** ns ns nsL* ** ** * ns ns ns nsWeight loss * ** ** ns ns ** **Log CFU ** ** ns ** ** * **Phenol ** ** * ns ns ns nsFirmness * ** ns ** ns ns nsTSS * ** ns ns ns ns ns
Fig. 1. Effect of different packaging films on brwoning index of button mushroom. Means with the same letter are not significantly different at 5% level of the LSD test.
Fig. 2. Effect of prewashing treatemnts on brwoning index of button mushroom during storage at 4°C. Means with the same letter are not significantly different at 5% level of the LSD test.

309
Effect of Packaging Films and Pre washing on Button Mushrooms
Fig. 3. Effect of storage times (3 A), prewashing treatments (3 B) and different packaging films (3 C) on L* value of button mushroom. Means with the same letter are not significantly different at 5% level of the LSD test.
intensification of the enzyme activity and the attack of microbial agents, color of the mushroom gradually gets darker and more brownish (Brennan et al., 3). In this study, the results of browning and L* (whiteness) indices showed that H2O2 washing and NS-PE packaging film treatment was effective in maintaining the optimum color of button mushroom at 14-day storage time. H2O2 exhibits high antimicrobial effect by producing reactive oxygen species, such as hydroxyl radicals (Kniel et al., 9). Besides having anti-
bacterial properties, H2O2 also prevents enzymatic browning by inhibiting the tyrosinase enzyme activity, thereby increasing the shelf life of button mushroom (Andrawis and Kahn, 1). The effect of this treatment on the preservation of white color of edible mushroom has also been shown in other studies (Brennan et al., 3; Lagnika et al., 11).
The NS-PE package can be considered as a modified atmosphere packaging, which creates a favorable gas mixture around the product due to having relative impermeability to atmospheric gases and respiration of the product (Farber et al., 6). According to the experiments, it was found that the NS-PE film permeability rates to water vapor, carbon dioxide and oxygen were 0.3g/m2.24h, 20 ml/m2.24h, and 37 ml/m2.24h, respectively, and the amount of distilled water movement in this film was also 0.4365 mg/dm2, which was 14.29% lower than conventional polyethylene bags. These properties of NS-PE create a MAP that greatly reduces respiration rate and ethylene production (Li et al., 12). When the amount of oxygen reduces, respiration rate of the mushroom and aging process are controlled, as well as the enzymatic browning is reduced since the enzymatic browning process is dependent on the concentration of oxygen (Rico et al., 14).
At 7-day storage time, no significant difference was found between different treatments in terms of weight loss percentage, though the lowest rate of weight loss was observed in mushrooms packaged with NS-PE film which were washed with H2O2 and water (with less than 1% weight loss). Weight loss percentage of all the samples increased significantlywhen duration of the experiment increased. At 14-day storage time, the samples packaged with NS-PE film had lower weight loss percentage (less than 2%) compared to the samples packaged with PE (more than 3%) and cellophane (more than 4%). At this study time, samples packed with cellophane film had the highest weight loss precentage, and no significant difference was found in the samples of this packaging among the three washing treatments. However, in PE film, the mushrooms washed with H2O2 and water had lower weight loss percentage than non-washed samples (Fig. 4). In general, NS-PE packaging had the greatest effect on the reduction of weight loss precentage of mushrooms in the present expriment.
One of the most important attributes used to determine the quality and shelf life of fruits and vegetables is the amount of weight loss during the storage, occurring due to water loss and respiration process. Extra weight loss causes the crop to spoil and shrink in terms of appearance (Jiang et al., 7). The results of this study showed that packaging with NS-PE film had higher potential for better
Fig. 3 A
Fig. 3 B
Fig. 3 C

310
Indian Journal of Horticulture, June 2018
maintenance of the initial weight of edible mushroom compared to polyethylene and cellophane films. Due to better control of the entry and exit of gases and thus creation of MAP conditions, the NS-PE film led to the reduction in the rate of respiration and exit of water vapor from the surroundings of mushrooms, thus reducing the mushrooms weight loss. In general, button mushroom has high respiration rate, and the film used for their packaging should maintain the oxygen around them at optimum level to prevent the creation of anaerobic respiration conditions (Koushki et al., 10). Cellophane and polyethylene films have greater penetration and permeability to water vapor and oxygen, and faster exit of water vapor and high respiration rate accelerate weight loss in these films.
On the other hand, aging process in mushrooms is accompanied by continuous increase in oxidation, which leads to the accumulation of ROS and oxidative damage (Rogiers et al., 15). The accumulation of ROS in the cell causes damage to the structure and function of membrane, and membrane damage, in turn, causes postharvest problems, such as weight loss, tissue softening, pathogens attack, and mushroom browning. Packaging with Nano-silica stimulates the activity of antioxidant enzymes by releasing Si, thus preventing the accumulation of ROS and damage to the membrane, and increasing the preservation of mushroom quality (Donglu et al., 4).
The results showed that at 7-day storage time and in all the three types of NS-PE, PE and cellophane films, the H2O2-washed samples had lower CFU (3.92 log CFU/gr FW) than those water-washed and non-washed samples (5.2 and 5.1 log CFU/gr FW respectively). However, there was no significant difference between water washing and no washing in the three types of packages in terms of the CFU. The lowest number of bacteria was found in the treatment
of cellophane film and H2O2 washing (3.2 log CFU/gr FW), and the number of bacteria in NS-PE packaging film and H2O2 washing (4.1 log CFU/gr FW) was lower than PE packing film and H2O2 washing (4.5 log CFU/gr FW). At 14-day storage time, there were no significant differences among the treatments in terms of CFU. Generally, H2O2 treatment had the greatest effect on the reduction of bacterial population in button mushroom in the current experiment (Fig. 5). Mushrooms after harvest show high susceptibility to spoilage (Wang et al., 16). H2O2 exhibits high antimicrobial effect by producing reactive oxygen species, such as hydroxyl radicals (Kniel et al., 9).
The results of total phenol content were similar to those of L* value, so that total phenol content during the 7-day storage time was significantly higher than that observed during the 14-day. Furthermore, H2O2-washed samples (with value of 83.87 mg/kg FW) had higher total phenol content compared to the samples washed with water and non-washed samples (with values of 78.22 and 78.89 mg/kg FW, respectively). There was no significant difference in terms of total phenol content between water-washed samples and non-washed samples. Total phenol content in the samples packaged with NS-PE film (with value of 84.8 mg/kg FW) was significantly higher than total phenol content in samples packaged with cellophane and PE films (with values of 77.1 and 79 mg/kg FW, respectively). No significant difference was observed between the samples of two cellophane and PE films regarding total phenol content (Fig. 6). Therefore, NS-PE packaging and H2O2 washing resulted in better preservation of total phenol content than other treatments.
Polyphenols have a high nutritional value for consumers, and their preservation in mushrooms is of high importance. Polyphenols are the substrate of
Fig. 5. CFU values of button mushroom prewashed by water and H2O2 and then packaged in different types of packaging films during 4°C storage. Means with the same letter are not significantly different at 5% level of the LSD test.
Fig. 4. Weight loss values of button mushroom prewashed with water and H2O2 and then packaged in different types of pakaging films during 4°C storage. Means with the same letter are not significantly different at 5% level of the LSD test.

311
Effect of Packaging Films and Pre washing on Button Mushrooms
Fig. 7. Effect of prewashing treatments on the firmness of button mushroom during storage at 4°C. Means with the same letter are not significantly different at 5% level of the LSD test.
Fig. 6. Effect of storage times (6 A), prewashing treatments (6 B) and different packaging films (6 C) on total phenol content of button mushroom. Means with the same letter are not significantly different at 5% level of the LSD test.
polyphenol oxidase enzyme and hence, the process of enzymatic browning in mushroom is associated with a reduction in phenolic compounds (Lagnika et al., 11). In the present experiment, the H2O2-washed samples packaged with NS-PE film had a higher phenol content, which was better preserved due to
lower rate of browning of the phenolic compounds, while in other mushrooms with higher browning rate, the amount of phenol were lower.
Firmness of mushrooms was not affected by the type of film, but the treatment of washing before packaging had a significant effect on it. At the time of 7-day study, the highest rate of firmness was observed in the samples washed with H2O2 (14.5 N), while no significant difference was found between washed and non-washed samples regarding firmness. When the time of evaluation increased from 7 to 14 days, firmness of the samples decreased, though at 14-day examination, no significant difference was observed between any of the washing treatments in terms of this parameter (Fig. 7).
During the postharvest period, mushroom softening occurred due to the degradation of cell wall polysaccharide by microbial enzymes (Khan et al., 8). In this study H2O2 preserved fruit firmness better than other pre washing treatments due to antimicrobial effects. The TSS in mushrooms decreased significantly when the time of evaluation increased. The TSS in non-washed mushrooms (4.2%) was significantly higher than that of mushrooms washed with water (3.66%) or H2O2 (3.82%), while no significant difference was observed between mushrooms washed with water or H2O2 in terms of TSS (Fig. 8).
The amount of TSS decreased over the time of the experiment, due to being consumed during the respiration process (Ayala-Zavala et al., 2), but, on the other hand, TSS in non-washed samples, compared to those washed with water and H2O2, was higher. The study showed that, in general, the weight loss was higher in non-washed samples than in washed ones; therefore the concentration of cell sap in these samples was concentrated, thus increasing the amount of TSS (Khan et al., 8).
Fig. 6 A
Fig. 6 B
Fig. 6 C

312
Indian Journal of Horticulture, June 2018
CONCLUSIONIn conclusion, based on the decrease in browning
rate, higher value of L*, preservation of total phenol content, and control of weight loss percentage, use of Nano silica polyethylene- film was useful in the packaging of edible mushroom. However, if mushrooms are washed with 1% H2O2 before packaging, the quality of mushrooms will be better preserved because of the reduced microbial load. Therefore, the combination of washing with H2O2before packaging and packaging with Nano silica polyethylene film is very effective in maintaining postharvest quality of button mushroom.
REFERENCES1. Andrawis, A. and Kahn, V. 1985. Inactivation of
mushroom tyrosinase by hydrogen peroxide. Phytochem. 24: 397-405.
2. Ayala-Zavala, J.F. Wang, S.Y. Wang, C.Y. and González-Aguilar, G.A. 2007. High oxygen treatment increases antioxidant capacity and postharvest life of strawberry fruit. Food Technol. Biotech. 45: 166.
3. Brennan, M. LePort, G. Pulvirenti, A. and Gormley, R. 1999. The effect of sodium metabisulphite on the whiteness and keeping quality of sliced mushrooms. LWT-Food Sci. Technol. 32: 460-63.
4. Donglu, F. Wenjian, Y. Kimatu, B.M. Xinxin, A. Qiuhui, H. and Liyan, Z. 2016. Effect of nanocomposite packaging on postharvest quality and reactive oxygen species metabolism of mushrooms (Flammulina velutipes). Postharvest Biol. Technol. 119: 49-57.
5. Douglas, K.R. Robinson, G. and Salejova, Z. 2010. Nanotechnology for bio degradable and edible food packaging. Observatory NANO., Working Paper Version.
6. Farber, J. Harris, L. Parish, M. Beuchat, L. Suslow, T. Gorney, J. and Busta, F. 2003. Microbiological safety of controlled and modified atmosphere packaging of fresh and fresh-cut produce. Compr. Rev. Food Sci. Food Saf. 2: 142-60.
7. Jiang, T. Feng, L. and Li, J. 2012. Changes in microbial and postharvest quality of shiitake mushroom (Lentinus edodes) treated with chitosan–glucose complex coating under cold storage. Food Chem. 131: 780-86.
8. Khan, Z.U. Aisikaer, G. Khan, R.U. Bu, J. Jiang, Z. Ni, Z. and Ying, T. 2014. Effects of composite chemical pretreatment on maintaining quality in button mushrooms (Agaricus bisporus) during postharvest storage. Postharvest Biol. Technol. 95: 36-41.
9. Kniel, K.E. Sumner, S.S. Lindsay, D.S. Hackney, C.R. Pierson, M.D. Zajac, A.M. and Fayer, R. 2003. Effect of organic acids and hydrogen peroxide on Cryptosporidium parvum viability in fruit juices. J. Food Protec. 66: 1650-57.
10. Koushki, M. Abras, S.K. Mohammadi, M. Hadian, Z. Poorfallah, N.B. Sharayei, P. and Mortazavian, A.M. 2011. Physicochemical properties of mushrooms as affected by modified atmosphere packaging and CaCl2 dipping. African J Agric. Res. 6: 5414-21.
11. Lagnika, C. Zhang, M. and Mothibe, K.J. 2013. Effects of ultrasound and high pressureargon on physico-chemical properties of white mushrooms (Agaricus bisporus) during
Fig. 8. Effect of storage times (8 A) and prewashing treatments (8 B) on total souble solids content of button mushroom. Means with the same letter are not significantly different at 5% level of the LSD test.
Fig. 8 A
Fig. 8 B
313
Effect of Packaging Films and Pre washing on Button Mushrooms
postharvest storage. Postharvest Biol. Technol. 82: 87-94.
12. Li, H., Li, F. Wang, L. Sheng, J. Xin, Z. Zhao, L. Hu, Q. 2009. Effect of nano-packing on preservation quality of Chinese jujube (Ziziphus jujuba Mill. var. inermis (Bunge) Rehd). Food Chem. 114: 547-52.
13. Munsch, P. Johnstone, K. and Alatossava, T. 2002. Evidence for genotypic differences between the two siderovars of Pseudomonas tolaasii, cause of brown blotch disease of the cultivated mushroom Agaricus bisporus. Microbiol. Res. 157: 93-102.
14. Rico, D. Martin-Diana, A.B. Barat, J. and Barry-Ryan, C. 2007. Extending and measuring the quality of fresh-cut fruit and vegetables: a review. Trends Food Sci. Technol. 18: 373-86.
15. Rogier, S.Y. Kumar, G.M. and Knowles, N.R. 1998. Maturation and ripening of fruit of Amelanchier alnifolia Nutt. are accompanied by increasing oxidative stress. Ann. Bot. 81: 203-11.
16. Wang, Z. Chen, L. Yang, H. and Wang, A. 2015. Effect of exogenous glycine betaine on qualities of button mushrooms (Agaricus bisporus) during postharvest storage. Eur. Food Res. Technol. 240: 41-48.
Received : November, 2017; Revised : April, 2018; Accepted : May, 2018

314
Indian J. Hort. 75(2), June 2018: 314-318
INTRODUCTIONOnion is an important vegetable crop extensively
grown in many parts of the world for fresh market use and for processing (Baninasab and Rahemi, 2). In India, onion is grown under three crop seasons i.e kharif, late kharif and rabi. Main crop is harvested in rabi (60%) and 20% each in kharif and late kharif . Kharif onion is available in the market from October to December, late kharif onion is available from January to March. From April to May rabi onion is available. Stored onion of rabi is used for domestic as well as export market during June to October. So, the storage of rabi onion is indispensible for regular supply. Onions are less perishable than many other vegetables, however losses are inevitable during storage. It has been estimated that 40 to 50% of the production never reaches to the consumers due to postharvest losses. The postharvest losses mainly consist of physiological weight loss, sprouting and decay. Onion cultivars differs in their ability to storage and this variation in the storage duration is either due to pre- and post harvest environmental conditions or due to the cultivar (Kopsell and Randle, 10). Onions are stored mostly in shelters at ambient conditions. Some of the bulb characteristics like dry matter, total soluble solids, pungency and dry scale number are associated with the storage life of onion (Ko et al., 9). The growth rate of the sprout inside the bulb varies according to cultivar and storage temperature (Chope et al., 5). By following proper pre-and post
harvest management practices, storage losses can be reduced. Even after following the proper management practices, if the variety has the character of low storage life, all the practices will be futile to reduce the losses. Selection of variety that has longer storage life is one of the best practices for reducing storage losses. After choosing the variety, all the management practices will only complement in reducing the storage losses. It is imperative to choose a variety having the good storage to augment the storage life with minimum losses. Hence, the present experiment was conducted to study the storage losses in different varieties of onion and identifying the varieties having good storage life.
MATERIALS AND METHODSSeven onion varieties (Bhima Kiran, B. Raj,
B. Red, B. Shakti, B. Shubra, B. Shweta and B. Super) were grown during rabi season of 2013-14 and 2014-15 under similar condition with the recommended practices. After harvesting, produce was cured for three days in field and a week under shade. Onion in plastic crates with two replicates (10 kg per each replication) was stored at ambient temperature in modified bottom and top ventilated storage structure (mean monthly temperature and relative humidity during the storage period is given in Table 1). Observations on weight loss, number of rotted bulbs and number of sprouted bulbs were recorded after 2 and 4 months of storage. Percent total weight loss, sprouting and rotting was calculated using the formulae given below. In the second year
Post-harvest losses in different varieties of onionKalyani Gorrepati*, A.A. Murkute, Yogesh Bhagat and Jai GopalDirectorate of Onion and Garlic Research, Rajgurunagar 410505, Maharashtra
ABSTRACTOnion varieties (Bhima Kiran, Bhima Raj, Bhima Red, Bhima Shakti, Bhima Shubra, Bhima Shweta and
Bhima Super) were evaluated for storage losses during rabi season of 2013-14 and 2014-15. All the varieties were grown under similar conditions and stored at ambient conditions in a modified bottom and top ventilated storage structure. Total losses were found significantly less in B. Kiran (26.66%) and B. Shakti (35.87%) after four months of storage, whereas no significant difference was observed among these two varieties. In the year 2014-15, the bulbs were analyzed for rate of respiration and total phenol content. No significant difference was observed in rate of respiration at the beginning of storage. Total phenol content was significantly high in B. Raj (186.33 mg GAE/100g) followed by B. Kiran (138.64 mg GAE/100g), B. Shakti (137.09 mg GAE/100g), B. Shweta (114.29 mg GAE/100g) and B. Shubra (112.04 mg GAE/100g). Significantly low phenol content was observed in B. Red (35.16mg GAE/100 g). During storage, rate of respiration and total phenol content increased up to 60 days of storage and then decreased up to 90 days.Key words: Allium cepa, storage, sprouting, rotting, weight loss.
*Corresponding author’s E-mail: [email protected]
DOI : 10.5958/0974-0112.2018.00052.X

315
Post-Harvest Losses in Onion
(2014-15), apart from the observations on weight loss, number of rotted bulbs and number of sprouted bulbs; rate of respiration and total phenol content were also estimated at 0, 30, 60 and 90 days after storage (DAS). Data was analyzed using SAS. Square root transformation of data on storage losses was done.1. Weight loss (%) = (Initial weight ˗ Final weight) ×
100/Initial weight2. Sprouting (%) = (Number of bulbs sprouted till the
date of recording × 100)/ Initial number of bulbs stored
3. Rotting (%) = (Number of bulbs rotted till the date of recording × 100)/ Initial number of bulbs stored
Rate of Respiration The rate of respiration was measured using
head space gas analysis technique with the help of CO2/O2 analyzer (Model: Checkmate 9900 O2/CO2, PBI Dansensor, Denmark) and expressed as ml CO2 kg-1 h-1. Randomly selected bulbs of onion were trapped in airtight container having twist-top lid fitted with a subaseal septum at the center of the lid. The containers were kept under the same condition
for 4 h for accumulation of respiratory gases at the headspace. After specified time the head space gas was sucked to the sensor of the analyzer through the hypodermic hollow needle and the displayed value of evolution rate of CO2 concentration (%) was recorded. Rate of respiration was calculated on the basis of rate of evolution of CO2 from the sample per unit weight per unit time. Total Phenol content
Five onions were taken at random and crushed to paste after peeling. From the homogenized paste, 2 g sample was taken for the analysis of total phenol content. Total Phenol content of the samples was analysed using the Folin-Ciocalteau (FC) reagent by following the method of Singleton and Rossi (14). Results were expressed as mg gallic acid equivalents (GAE)/100 g of sample.
RESULTS AND DISCUSSIONTotal weight loss, rotting and sprouting
Variety and storage time had significant effect on weight loss, sprouting and rotting. After two months of storage, B. Kiran and B. Shakti had showed lowest sprouting and rotting compared to other varieties. There was no significant difference between B. Kiran and B. Shakti for percent rotting and sprouting. The differences among other varieties were also not significant for sprouting and rotting (Table 2). Total weight loss was significantly less in B. Kiran (8.79%) followed by B. Shakti (11.90%). Significantly high total weight loss was observed in B. Shweta (28.03%) and B. Red (24.85%). Total weight loss was significantly less in B. Kiran (26.66%) and B. Shakti (35.87%) compared to other varieties (82-95%) after storage of four months (Table 3). No significant
Table 1. Mean monthly temperature and relative humidity during the storage period.
Storage Month
Temperature (ºC) Relative Humidity (%)2014 2015 2014 2015
Max Min Max Min Max Min Max MinMay 38 20 39 20 70 44 82 35June 35 22 32 20 89 70 89 66July 30 39 30 20 86 73 87 73August 29 20 28 19 90 76 92 75
Table 2. Storage losses in different varieties of onion after 60 days of storage.
Variety Rotted bulbs (%) Sprouted bulbs (%) Total weight loss (%)Mean values
Transformed mean values
Mean values
Transformed mean values
Mean values
Transformed mean values
Bhima Super 34.58 5.79 26.98 4.76 20.88 4.67Bhima Red 24.07 4.97 35.44 5.79 24.85 4.99Bhima Raj 22.98 4.69 28.92 4.83 19.33 4.46Bhima Shweta 22.54 4.78 23.75 4.86 28.03 5.20Bhima Shubra 29.24 5.50 26.17 4.15 20.34 4.53Bhima Kiran 3.70 2.07 0.40 1.16 8.79 3.11Bhima Shakti 3.49 2.07 1.67 1.57 11.90 3.57CD(5%) - 1.57 - 1.63 - 0.92SE(d) - 0.72 - 0.75 - 0.42SE(m) - 0.51 - 0.53 - 0.30

316
Indian Journal of Horticulture, June 2018
difference was observed for total weight loss among B. Super, B. Raj, B. Red, B. Shweta and B. Shubra. Sprouting was significantly higher in B. Super (50.64%). Similarly, rotting was significantly higher in B. Raj (53.03%) followed by B. Shubra (50.60%) and B. Red (43.36%). Baninasab and Rahemi (2) also reported a difference in the cultivars for weight loss, sprouting and decay. Ko et al. (9) reported mean storage losses of 21% to 99% in twelve short-day onion cultivars stored for 3 months under ambient conditions over 3 years. Physiological weight loss at the end of the 6 months of storage in all the cultivars tested was ranged 35-90% (Abbey et al. 1). Some of the bulb characteristics are related to the storage of onion. Cultivars with higher total soluble solids (TSS) and dry matter (DM) had better storability and were less susceptible to storage diseases (Ko et al. 9). Martínez et al. (11) also reported a positive correlation between storage quality and dry matter content. Fenwick and Hanley (6) found that different bulb skin colour contain different amounts of phenolic substances and flavonols, some of which inhibited fungal disease development. This might be the reason for changes in the rotting. Rate of respiration
At the beginning of storage, no significant difference was observed in respiration rate for all the varieties. It was ranged from 5.84 to 10.72 ml CO2/kg/h. However, at 30 days of storage respiration rate was significantly higher in B. Red than all other varieties which were at par. On 90 days of storage rate of respiration was significantly low in B. Kiran (11.24 ml CO2/kg/h) and B. Shakti (12.33 ml CO2/kg/h) and the highest respiration rate was observed in B. Red (19.22 ml CO2/kg/h). The rate of respiration in the
varieties during storage showed an increasing and then decreasing trend. In general, the respiration rate increased up to 60 days of storage and decreased at 90 days (Fig. 1). Sixty days storage was the trigger point for rotting and sprouting also. The increase in respiration rate of onions might be the consequence of physiological changes including break of dormancy and sprouting (Salama and Hicks, 12). Kiviranta et al. (8) reported an increase in respiration rate of onions during storage for 24 weeks at 20°C. Benkeblia et al. (4) also reported an increase in respiration rate when the bulbs sprouted.Total Phenol content
Before the storage, the total phenol content was significantly high in B. Raj (186.33 mg GAE/100g) followed by B. Kiran (138.64 mg GAE/100g), B. Shakti (137.09 mg GAE/100g), B. Shweta (114.29 mg GAE/100g) and B. Shubra (112.04 mg GAE/100g) where as phenol content was significantly low in B. Red (35.16)(Table 3).Yang et al. (15) reported a 6-fold difference in the onion varieties when compared to the variety with the lowest phenolic content. The phenolic contents of onions were reported to vary widely in different cultivars of onions, ranging from 41.74 to 146.90 mg GAE/100 g (Kaur et al.7). B. Kiran and B. Shakti, which showed highest total phenol content followed by B. Raj has also showed less sprouting during storage. In the present study, though the phenol content was more in B. Raj, the higher rate of sprouting was observed in B. Raj than B. Kiran and B. Shakti.
During storage, the phenol content increased up to 60 days and then started decreasing in almost all the varieties (Fig. 2). Benkeblia and Shiomi (3) reported a slight increase in the total phenolics
Table 3. Storage losses in different varieties of onion after 120 days.
Variety Rotted bulbs (%) Sprouted bulbs (%) Total weight loss (%)Mean values
Transformed mean values
Mean values
Transformed mean values
Mean values Transformed mean values
Bhima Super 36.31 5.99 50.64 7.11 82.08 9.10Bhima Red 43.36 6.57 46.04 6.69 94.79 9.79Bhima Raj 53.03 7.24 43.15 6.44 91.48 9.61Bhima Shweta 35.70 5.84 27.73 5.19 93.99 9.75Bhima Shubra 50.60 7.08 39.85 5.59 86.38 9.31Bhima Kiran 14.20 3.50 5.88 2.50 26.66 5.24Bhima Shakti 20.07 4.19 9.46 3.00 35.87 5.94CD(5%) - 1.60 - 1.96 - 0.81SE(d) - 0.74 - 0.90 - 0.37SE(m) - 0.52 - 0.64 - 0.26

317
Post-Harvest Losses in Onion
Fig. 1. Rate of respiration during storage of onion.
DAS: Days after storage
Fig. 2. Total phenol content during storage of onion.
DAS: Days after storage
during the 5 week of storage and a decrease after 7 weeks of storage, when internal sprouting began. During storage, the total phenolic content increased regularly until the 8th week and later started decreasing. Benkeblia and Shiomi (3) observed that, the total phenolic content of inner buds for control sample (stored at 18°C) increased during 5th week of storage and then decreased progressively during last 3 weeks of storage. During the eight months of post-storage of onions under ambient conditions, continuous evolution of total phenolics was recorded and reduction after the 8th week was due to the complete decay of the onion and at this stage the only option was to discard it as waste (Sharma et al., 13).
CONCLUSIONB. Kiran and B. Shakti had good storage compared
to other five onion varieties tested. These varieties may be considered for long term storage of onion and also to minimize the post harvest losses. The differences in the biochemical characteristics that are contributing to the longer storage of these varieties compared to the other should be studied. These varieties can also be explored in the breeding programme for production of high yielding varieties with good storability.
REFERENCES1. Abbey, L., Danquah, O.A., Kanton, R.A.L. and
Olympio, N.S. 2000. Characteristics and storage
318
Indian Journal of Horticulture, June 2018
performance of eight onion cultivars. Ghana J. Sci. 40: 9-13.
2. Baninasab, B. and Rahemi, M. 2006. The effect of high temperature on sprouting and weight loss of two onion cultivars. Am. J. Plant Physiol. 1: 199-204.
3. Benkeblia, N. and N. Shiomi. 2004. Chilling effect on soluble sugars, respiration rate, total phenolics, peroxidase activity and dormancy of onion bulbs. Sci. Agric. 61: 281-85.
4. Benkeblia, N., Varoquaux, P., Shiomi, N., Sakai, H. 2002. Storage technology of onion bulbs C.V. Rouge Amposta: effects of irradiation, maleic hydrazide and carbamate isopropyl, N- phenyl (CIP) on respiration rate and carbohydrates. Int. J. Food Sci. Tech. 37: 169-75.
5. Chope, G.A., Terry, L.A. and White, P.J. 2006. Effect of controlled atmosphere storage on abscisic acid concentration and other biochemical attributes of onion bulbs. Postharvest Bio. Technol. 39: 233-42.
6. Fenwick G.R. and Hanley A.B. (1990) Chemical composition. In Alliums and Allied Crops (eds H. Rabinowitch & J. Brewster) Vol. III, pp. 18–31. CRC Press, Boca Raton, FL , USA.
7. Kaur, C., Joshi, S. and Kapoor, H. C. 2009. Antioxidants in onion (Allium cepa L.) cultivars grown in India. J. Food Biochem. 33: 184-200.
8. Kiviranta, J., Huovinen, K. and P. Hiltunen. 1988. Variation of phenolic substances in onion. Acta Pharm. Fenn. 91: 67-72.
9. Ko, S.S., Chang, W.N., Wang, J.F., Cherng, S.J. and Shanmugasundaram, S. 2002. Storage Variability among Short-day Onion Cultivars under High Temperature and High Relative Humidity, and its Relationship with Disease Incidence and Bulb Characteristics. J. American Soc. Horti. Sci. 127: 848-54.
10. Kopsell, D.E. and Randle W.M. (1997). Onion cultivars differ in pungency and bulb quality changes during storage. HortSci. 32: 1260-63.
11. Martinez, A.R., Fernandez-Paz, J. and Andres-Ares, J.L. 2005. Evaluation of local onion lines from northwest Spain. Spanish J. Agric. Res. 3: 90-97.
12. Salama, A.M. and Hicks, J.R (1987). Respiration rate and fresh weight of onion bulbs as affected by storage temperature, humidity and maleic hydrazide. Trop. Sci. 27: 233-38.
13. Sharma, K., Assefa, A.D., Kim, S., Ko, E.Y. and Park, S.W. 2014. Change in chemical composition of onion (Allium cepa L. cv. Sunpower) during post-storage under ambient conditions. New Zeal. J. Crop Hort. 42: 87-98.
14. Singleton, V.L. and Rossi, J.A. 1965. Colorimetry of total phenolics with phosphomolybdic phosphotungstic acid reagents. American J. Enol. Vitic. 16: 144-58.
15. Yang, J., Meyers, K.J., van der Heide J. and Liu, R.H. 2004. Varietal differences in phenolic content and antioxidant and antiproliferative activities of onions. J. Agric. Food Chem. 52: 6787-93.
Received : July, 2016; Revised : April, 2018; Accepted : May, 2018

319
DOI : 10.5958/0974-0112.2018.00054.3
Indian J. Hort. 75(2), June 2018: 319-325
INTRODUCTIONApple (Malus × domestica Borkh.) belongs to
family Rosaceae, is one of the important fruit crops of temperate regions. The postharvest losses in the terms of quality and quantity occur at various stages of fruit handling right from harvesting, till the fruits reach the consumers (Issar et al., 5). In Uttarakhand, the apple fruits are harvested from July to September depending upon maturity of cultivars and microclimatic conditions of the region. The optimum fruit quality and storage behaviour depend upon the stage at which fruits are harvested. Physico-chemical changes during storage of fruits are used as important criteria for determining the optimum storage period which are essential to work out the transportation mode from one place of production to distant markets. Thus, there is need to assess the storage potential of commercial cultivars for their better shelf-life. However, post harvest behaviour of apple vary, depending on various factors viz., cultivar, rootstock, soil, agro-climatic conditions, growth and development pattern including flowering, fruiting, maturity, chemical composition of fruits as well as storage conditions. Although, some information on apple maturity and storage of fresh fruits has been reported by Pandey et al. (9), Issar et al. (5), Sharma et al. (13) and Sharma et al. (12) and but no systematic information is available on apple cultivars belonging to Delicious group, spur type and colour strains. Keeping these facts in view, the present investigation was undertaken to assess the
storability of different cultivars of apple at ambient conditions, which may be useful to orchardists, traders, processors and exporters.
MATERIALS AND METHODSThe present investigation was undertaken during
two successive years, 2015 and 2016 at ICAR-Central Institute of Temperate Horticulture, Regional Station, Mukteshwar, situated at 2,200 m above mean sea level in Nainital district of Uttarakhand. Ten apple cultivars belonging to Delicious group, spur type and colour strains viz. Golden Delicious, Skyline Supreme, Red Chief, Bright-N-Early, Top Red, Starkrimson, Red Spur, Oregon Spur, Rich-A-Red and Red Delicious were selected for the study and harvested at commercially mature stage (Das et al., 3). After harvesting, fruits were washed, air dried, packed in brown paper bags in three replicates consisting of 50 fruits per replication in each cultivar and stored under ambient storage conditions for 49 days. Observations on physico-chemical parameters of fruits were recorded at weekly intervals. Physical attributes like physiological loss in weight (%), fruit decay (%) and fruit firmness (lb/in2) were recorded during storage. The physiological loss in weight was measured by subtracting the initial weight from final weight and expressed as percentage. Similarly, fruit decay was determined by counting the rotten fruits, divided by total fruits and expressed as percentage. The fruit firmness was measured with the help of a penetrometer (Model FT-327, Italy) using 8 mm stainless steel probe and results were expressed as lb/in2. The chemical characteristics of the fruits viz.
Storage behaviour of apple cultivars under ambient conditionsArun Kishor*, Raj Narayan, Manoj Brijwal, Brij Lal Attri, Anil Kumar and Sovan Debnath
ICAR-CITH., Regional Station, Nainital, Mukteshwar 263 138, Uttarakhand
ABSTRACTAn experiment was conducted at ICAR-CITH, Regional Station, Mukteshwar, Nainital, Uttarakhand in ten
apple cultivars to assess the physico-chemical changes and shelf-life at ambient storage conditions for 49 days. The physiological loss in weight, TSS, reducing sugars, total sugars, non-reducing sugars and fruit decay percentage increased, while fruit firmness, titratable acidity, ascorbic acid content and organoleptic score decreased during storage in all cultivars. Cultivar Skyline Supreme exhibited lowest physiological loss in weight (7.77%), highest TSS (14.93 °B) and organoleptic score (7.19) than other apple cultivars. However, the cv. Red Chief exhibited highest ascorbic acid (12.32 mg/100 g), reducing sugars (8.89%) and total sugars (10.59%) and the cv. Bright-N-Early exhibited highest fruit firmness (8.18 lb/in2) and lowest fruit decay (5.05%) than other apple cultivars. Conclusively, Skyline Supreme, Red Chief and Bright-N-Early have better shelf-life than other apple cultivars under ambient storage conditions.Key words: Malus domestica, shelf-life, physicochemical changes, fruit quality.
*Corresponding author’s E-mail: [email protected]

320
Indian Journal of Horticulture, June 2018
TSS, titratable acidity, ascorbic acid, reducing sugars, total sugars and non-reducing sugars were recorded by using the methods described by Ranganna (11). The overall organoleptic score of the fruits was done by a panel of five judges on the basis of external appearance of fruit, texture, taste and flavour, making use of a 9-point Hedonic scale (Amerine et al., 1). Data were recorded and statistically analysed following factorial complete randomized design (Panse and Shukhatme, 10).
RESULTS AND DISCUSSIONThe physiological loss in weight (% PLW) recorded
at different intervals differs significantly among the different apple cultivars (Table 1). The PLW increased gradually in all the cultivars with the advancement of
storage period. It is evident that lowest mean PLW exhibited by cv. Skyline Supreme (7.77%) followed by Starkrimson (8.76%) and Oregon Spur (9.06%), while highest in cv. Top Red (14.57%) followed by Red Delicious (13.56%) and Golden Delicious (13.29%) during storage. The critical observation showed that the rate of loss in weight was much faster in cv. Top Red, which attained highest level of 24.82% on 49th day of storage. Increasing loss in weight on prolonging storage period might be attributed to rapid loss of moisture through evapo-transpiration and respiration (Maini et al., 7). The variation in loss in weight among cultivars may also be attributed to genetical, textural and skin characteristics (Singh et al., 15). Pandey et al. (9) have also reported increase in PLW in apple following storage either at room
Table 1. Changes in PLW and fruit decay during storage in apple cultivars at ambient conditions (pooled mean).
Cultivars Storage period (days)0 7 14 21 28 35 42 49 Mean
Physiological loss in weight (%)Golden Delicious 0.00 2.55 6.48 10.58 13.43 16.22 20.25 23.50 13.29Skyline Supreme 0.00 1.45 3.12 4.92 7.45 10.06 12.23 15.14 7.77Red Chief 0.00 2.04 6.28 8.57 11.56 14.81 18.18 23.34 12.11Bright-N-Early 0.00 1.71 4.47 7.08 9.95 12.21 14.87 18.48 9.82Top Red 0.00 3.29 8.61 12.16 14.65 17.37 21.08 24.82 14.57Starkrimson 0.00 1.37 3.95 6.00 8.34 10.94 13.42 17.33 8.76Red Spur 0.00 1.94 5.36 7.54 11.52 13.78 15.93 20.94 11.00Oregon Spur 0.00 2.04 4.23 5.94 7.96 10.82 13.46 18.96 9.06Rich-A-Red 0.00 2.00 6.29 8.24 11.30 13.69 17.07 20.61 11.31Red Delicious 0.00 3.52 7.29 9.77 13.02 15.80 20.99 24.57 13.56Mean 0.00 2.19 5.61 8.08 10.92 13.57 16.75 20.77
Storage period (S) Cultivar (C) S×CC.D. 0.05 0.99 1.10 NS
Fruit decay (%)Golden Delicious 0.00 0.00 0.00 10.00 13.70 43.77 59.12 76.33 28.99Skyline Supreme 0.00 0.00 0.00 13.33 32.23 36.76 46.59 56.71 26.52Red Chief 0.00 0.00 0.00 0.00 3.40 9.90 20.11 23.00 8.06Bright-N-Early 0.00 0.00 0.00 0.00 3.45 5.21 8.45 18.24 5.05Top Red 0.00 0.00 0.00 3.25 13.34 24.54 32.70 55.81 18.52Starkrimson 0.00 0.00 0.00 0.00 3.35 9.90 16.41 40.00 9.95Red Spur 0.00 0.00 0.00 3.35 9.90 14.72 25.11 50.00 14.73Oregon Spur 0.00 0.00 0.00 0.00 0.00 16.67 20.00 36.67 10.48Rich-A-Red 0.00 0.00 0.00 3.36 7.18 17.35 19.56 26.69 10.59Red Delicious 0.00 0.00 0.00 3.18 13.27 37.14 46.09 71.00 24.38Mean 0.00 0.00 0.00 3.65 9.98 21.60 29.41 45.44
Storage period (S) Cultivar (C) S×CC.D. 0.05 0.29 0.33 0.93

321
Apple Storage Under Ambient Conditions
temperature or in cold storage. In general, fruit decay percentage increased consistently on prolonging the storage period (Table 1). Lowest mean fruit decay (%) was observed in cv. Bright-N-Early (5.05%) followed by Red Chief (8.06%) and Starkrimson (9.95%), while the highest was observed in Golden Delicious (28.99%) followed by Skyline Supreme (26.52%) and Red Delicious (24.38%) during storage. The occurrence of fruit decay was faster in Skyline Supreme (13.33%) and Golden Delicious (10.00%) after 21st day and increased consistently up to 49th day of storage. However, rapid rise in fruit decay was observed in Golden Delicious (76.33%) on 49th day of storage. Fruits in open may have higher chances of microbial infection than those in containers; hence they decayed at a higher rate (Maini et al., 7).
Pandey et al. (9) have also reported increase in decay following storage of apples at ambient conditions.
Fruit firmness, in general, followed a declining trend commensurated with advancement in storage period (Table 2). The highest mean fruit firmness was found in Bright-N-Early (8.18 lb/in2) followed by Red Chief (7.98 lb/in2) and Red Delicious (7.88 lb/in2), while lowest in cv. Rich-A-Red (6.36 lb/in2) followed by Skyline Supreme (6.50 lb/in2) and Oregon Spur (6.76 lb/in2) during storage. Softening of fruits is caused either by breakdown of insoluble protopectins into soluble pectin or by hydrolysis of starch. The gradual decreasing trend in all the physical parameters was very much pronounced up to 7-14 days and thereafter it was gradually slow in all the cultivars during storage. This might be
Table 2. Effect of storage on fruit firmness and TSS in apple cultivars at ambient conditions (pooled mean).
Cultivars Storage period (days)0 7 14 21 28 35 42 49 Mean
Fruit firmness (lb/in2)Golden Delicious 10.59 9.41 8.82 7.95 7.60 7.40 6.90 6.30 7.77Skyline Supreme 9.15 8.53 7.37 6.80 6.60 5.70 5.50 5.00 6.50Red Chief 11.69 10.77 9.90 7.70 7.40 7.00 6.70 6.40 7.98Bright-N-Early 10.40 9.80 9.34 8.92 8.40 7.70 7.20 5.90 8.18Top Red 11.06 10.37 8.90 7.63 6.63 5.83 5.23 4.40 7.00Starkrimson 9.79 8.79 8.30 8.03 6.90 6.30 5.80 5.50 7.09Red Spur 10.03 9.47 8.87 7.73 6.73 6.30 5.90 5.60 7.23Oregon Spur 9.57 8.70 8.23 7.80 7.00 6.40 4.90 4.30 6.76Rich-A-Red 9.80 8.47 8.07 7.40 6.20 5.10 4.80 4.50 6.36Red Delicious 10.50 9.50 8.97 8.40 8.00 7.50 7.30 5.50 7.88Mean 10.26 9.38 8.68 7.84 7.15 6.52 6.02 5.34
Storage period (S) Cultivar (C) S×CC.D. 0.05 0.31 0.34 0.98
TSS (°B)Golden Delicious 11.90 12.30 13.80 14.00 14.40 14.57 15.00 14.53 13.81Skyline Supreme 13.80 14.00 14.80 15.40 15.93 15.00 15.40 15.10 14.93Red Chief 10.26 11.20 11.60 12.90 13.43 14.60 12.60 11.90 12.31Bright-N-Early 10.11 11.00 11.90 12.80 13.00 13.40 13.00 12.90 12.26Top Red 11.26 12.25 13.60 14.10 14.60 16.40 15.20 13.30 13.83Starkrimson 11.29 12.00 13.00 14.00 15.00 13.80 13.70 13.50 13.28Red Spur 13.50 14.00 14.40 14.90 16.00 14.80 14.20 14.20 14.50Oregon Spur 13.00 13.34 13.70 14.50 15.10 14.00 12.80 12.20 13.58Rich-A-Red 11.00 11.59 12.00 12.90 13.50 14.80 10.20 11.00 12.12Red Delicious 12.00 12.25 13.40 14.60 15.20 15.90 12.90 12.50 13.42Mean 11.81 12.39 13.22 14.01 14.62 14.73 13.50 13.11
Storage period (S) Cultivar (C) S×CC.D. 0.05 0.16 0.18 0.51
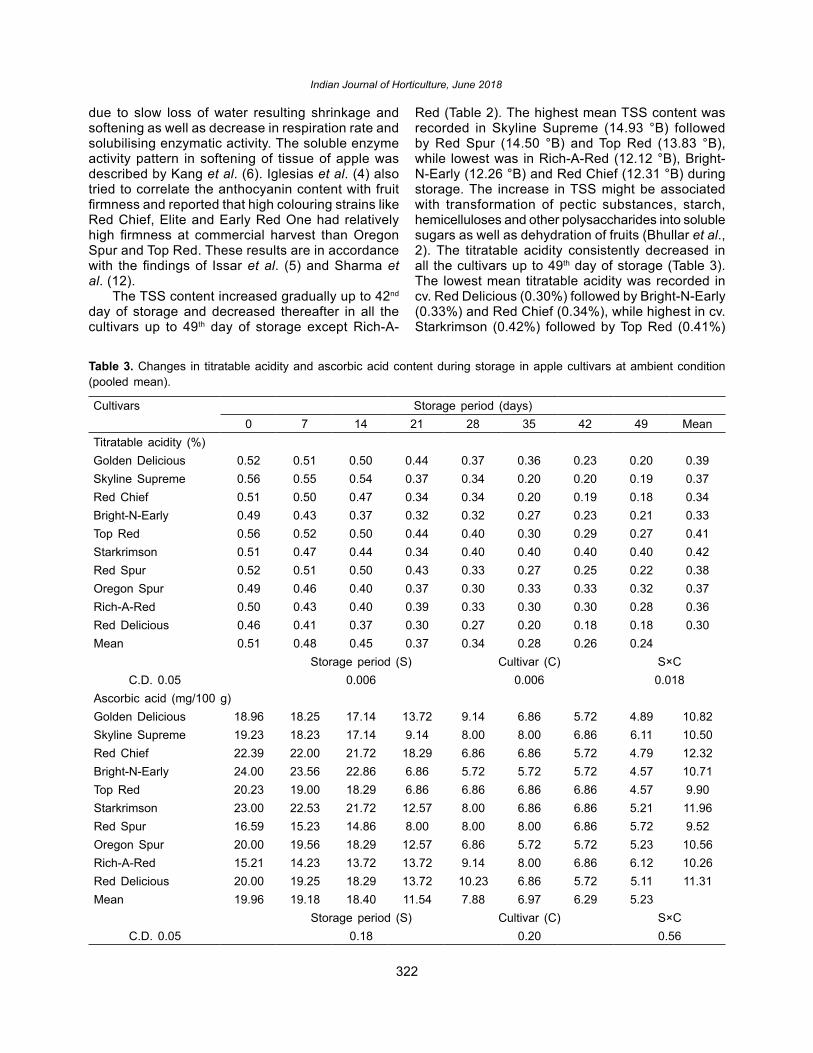
322
Indian Journal of Horticulture, June 2018
due to slow loss of water resulting shrinkage and softening as well as decrease in respiration rate and solubilising enzymatic activity. The soluble enzyme activity pattern in softening of tissue of apple was described by Kang et al. (6). Iglesias et al. (4) also tried to correlate the anthocyanin content with fruit firmness and reported that high colouring strains like Red Chief, Elite and Early Red One had relatively high firmness at commercial harvest than Oregon Spur and Top Red. These results are in accordance with the findings of Issar et al. (5) and Sharma et al. (12).
The TSS content increased gradually up to 42nd day of storage and decreased thereafter in all the cultivars up to 49th day of storage except Rich-A-
Red (Table 2). The highest mean TSS content was recorded in Skyline Supreme (14.93 °B) followed by Red Spur (14.50 °B) and Top Red (13.83 °B), while lowest was in Rich-A-Red (12.12 °B), Bright-N-Early (12.26 °B) and Red Chief (12.31 °B) during storage. The increase in TSS might be associated with transformation of pectic substances, starch, hemicelluloses and other polysaccharides into soluble sugars as well as dehydration of fruits (Bhullar et al., 2). The titratable acidity consistently decreased in all the cultivars up to 49th day of storage (Table 3). The lowest mean titratable acidity was recorded in cv. Red Delicious (0.30%) followed by Bright-N-Early (0.33%) and Red Chief (0.34%), while highest in cv. Starkrimson (0.42%) followed by Top Red (0.41%)
Table 3. Changes in titratable acidity and ascorbic acid content during storage in apple cultivars at ambient condition (pooled mean).
Cultivars Storage period (days)0 7 14 21 28 35 42 49 Mean
Titratable acidity (%)Golden Delicious 0.52 0.51 0.50 0.44 0.37 0.36 0.23 0.20 0.39Skyline Supreme 0.56 0.55 0.54 0.37 0.34 0.20 0.20 0.19 0.37Red Chief 0.51 0.50 0.47 0.34 0.34 0.20 0.19 0.18 0.34Bright-N-Early 0.49 0.43 0.37 0.32 0.32 0.27 0.23 0.21 0.33Top Red 0.56 0.52 0.50 0.44 0.40 0.30 0.29 0.27 0.41Starkrimson 0.51 0.47 0.44 0.34 0.40 0.40 0.40 0.40 0.42Red Spur 0.52 0.51 0.50 0.43 0.33 0.27 0.25 0.22 0.38Oregon Spur 0.49 0.46 0.40 0.37 0.30 0.33 0.33 0.32 0.37Rich-A-Red 0.50 0.43 0.40 0.39 0.33 0.30 0.30 0.28 0.36Red Delicious 0.46 0.41 0.37 0.30 0.27 0.20 0.18 0.18 0.30Mean 0.51 0.48 0.45 0.37 0.34 0.28 0.26 0.24
Storage period (S) Cultivar (C) S×CC.D. 0.05 0.006 0.006 0.018
Ascorbic acid (mg/100 g)Golden Delicious 18.96 18.25 17.14 13.72 9.14 6.86 5.72 4.89 10.82Skyline Supreme 19.23 18.23 17.14 9.14 8.00 8.00 6.86 6.11 10.50Red Chief 22.39 22.00 21.72 18.29 6.86 6.86 5.72 4.79 12.32Bright-N-Early 24.00 23.56 22.86 6.86 5.72 5.72 5.72 4.57 10.71Top Red 20.23 19.00 18.29 6.86 6.86 6.86 6.86 4.57 9.90Starkrimson 23.00 22.53 21.72 12.57 8.00 6.86 6.86 5.21 11.96Red Spur 16.59 15.23 14.86 8.00 8.00 8.00 6.86 5.72 9.52Oregon Spur 20.00 19.56 18.29 12.57 6.86 5.72 5.72 5.23 10.56Rich-A-Red 15.21 14.23 13.72 13.72 9.14 8.00 6.86 6.12 10.26Red Delicious 20.00 19.25 18.29 13.72 10.23 6.86 5.72 5.11 11.31Mean 19.96 19.18 18.40 11.54 7.88 6.97 6.29 5.23
Storage period (S) Cultivar (C) S×CC.D. 0.05 0.18 0.20 0.56

323
Apple Storage Under Ambient Conditions
and Golden Delicious (0.39%) during storage. The decline in titratable acidity during storage may be associated with bio-conversion of organic acids to sugars. Similar pattern in change of TSS and titratable acidity level during storage was reported by Sharma et al. (13) and Singh et al. (14).
Initially, after harvest highest ascorbic content was found in cv. Bright-N-Early (24.00 mg/100 g) followed by Starkrimson (23.00 mg/100 g) and Red Chief (22.39 mg/100 g), whereas lowest in cv. Rich-A-Red (15.21 mg/100 g). Overall, ascorbic acid contents decreased significantly on advancement of storage period in all the cultivars (Table 3). However, highest mean retention of ascorbic acid was found in Red Chief (12.32 mg/100 g) followed by Starkrimson
(11.96 mg/100 g) and Red Delicious (11.31 mg/100 g), while lowest was in Red Spur (9.52 mg/100 g) and Top Red (9.90 mg/100 g) till termination of storage. Large variation in decreasing trend of ascorbic acids might be associated with genetic variability among the cultivars. The decreasing ascorbic acid content upon prolonged storage might also be associated with differential ascorbic acid oxidase activity in fruits (Mapson, 8). Similar results were also reported by Singh et al. (14).
The changes in the levels of reducing sugars, total sugars and non-reducing sugars showed a sharp increase during storage in all the cultivars (Table 4 and 5). However, the increase was more prominent up to 28th to 35th day of storage in most
Table 4. Effect of storage on reducing and total sugars content in apple cultivars at ambient storage conditions (pooled mean).
Cultivars Storage period (days)0 7 14 21 28 35 42 49 Mean
Reducing sugars (%)Golden Delicious 6.00 6.23 6.76 8.62 8.77 8.89 9.35 10.12 8.39Skyline Supreme 6.06 6.12 7.35 8.93 9.61 9.80 7.35 7.11 8.04Red Chief 6.23 7.12 8.73 9.26 10.00 10.42 8.67 8.06 8.89Bright-N-Early 6.95 7.42 8.20 8.29 8.35 8.47 8.62 7.76 8.16Top Red 6.46 7.11 8.33 8.47 10.64 11.11 6.33 5.15 8.16Starkrimson 6.82 7.86 8.06 8.51 9.43 9.43 8.06 7.57 8.42Red Spur 6.25 7.12 7.57 8.62 9.09 8.77 7.57 5.21 7.71Oregon Spur 6.56 7.98 8.06 8.93 10.00 8.20 7.14 5.68 8.00Rich-A-Red 5.11 5.12 5.88 6.85 7.46 10.20 6.17 7.69 7.05Red Delicious 6.05 6.23 7.57 7.57 8.47 9.09 6.17 5.88 7.28Mean 6.25 6.83 7.65 8.40 9.18 9.44 7.54 7.02
Storage period (S) Cultivar (C) S×CC.D. 0.05 0.10 0.11 0.33
Total sugars (%)Golden Delicious 7.05 7.23 8.85 9.76 9.76 9.89 9.97 12.50 9.71Skyline Supreme 6.93 7.12 8.38 10.38 10.93 11.11 9.75 9.00 9.52Red Chief 7.12 8.23 9.19 10.53 11.69 12.97 10.81 10.69 10.59Bright-N-Early 7.69 8.12 9.17 10.05 10.47 10.90 9.22 9.16 9.58Top Red 7.12 7.95 8.94 11.51 12.12 12.92 8.43 7.52 9.91Starkrimson 7.05 8.33 9.16 9.19 12.27 10.12 9.11 8.17 9.48Red Spur 7.23 8.26 9.95 11.76 12.34 9.57 8.76 7.14 9.68Oregon Spur 7.26 8.10 8.35 10.63 11.86 9.27 8.61 7.04 9.12Rich-A-Red 7.23 6.95 6.64 7.55 9.95 11.87 7.69 8.55 8.46Red Delicious 6.98 7.25 8.16 8.90 9.85 10.40 7.93 7.36 8.55Mean 7.17 7.75 8.68 10.03 11.12 10.90 9.03 8.71
Storage period (S) Cultivar (C) S×CC.D. 0.05 0.13 0.15 0.42

324
Indian Journal of Horticulture, June 2018
Table 5. Changes in non-reducing sugars and organoleptic score in apple cultivars at ambient storage conditions (pooled mean).
Cultivars Storage period (days)0 7 14 21 28 35 42 49 Mean
Non-reducing sugars (%)Golden Delicious 1.00 0.95 1.99 1.08 0.94 0.95 0.59 2.26 1.25Skyline Supreme 0.83 0.95 0.98 1.48 1.25 1.24 2.28 1.80 1.43Red Chief 0.85 1.39 0.44 1.21 1.61 2.42 2.03 2.50 1.66Bright-N-Early 0.70 0.67 0.92 1.67 2.01 2.31 0.57 1.33 1.35Top Red 0.63 0.80 0.58 2.89 1.41 1.72 2.00 2.25 1.66Starkrimson 0.22 0.44 1.05 0.65 2.70 0.66 1.00 0.57 1.01Red Spur 0.93 1.08 2.26 2.98 3.09 0.76 1.13 1.84 1.88Oregon Spur 0.66 0.11 0.28 1.62 1.77 1.02 1.40 1.29 1.07Rich-A-Red 2.01 1.74 0.72 0.67 2.37 1.59 1.44 0.82 1.33Red Delicious 0.88 0.97 0.56 1.95 1.31 1.24 1.67 1.41 1.30Mean 0.87 0.91 0.98 1.62 1.84 1.39 1.41 1.61
Storage period (S) Cultivar (C) S×CC.D. 0.05 0.17 0.19 0.53
Organoleptic score (1-9)Golden Delicious 7.33 8.00 4.67 4.67 4.67 5.33 5.33 4.00 5.24Skyline Supreme 8.00 8.33 6.67 7.33 8.00 7.33 6.67 6.00 7.19Red Chief 5.67 5.33 6.00 6.67 6.00 5.33 4.67 4.00 5.43Bright-N-Early 6.67 7.33 6.00 5.33 6.00 6.00 6.00 4.00 5.81Top Red 6.67 7.00 6.67 4.67 7.33 6.00 4.67 4.67 5.86Starkrimson 6.67 7.33 7.33 6.00 4.67 6.00 6.00 6.00 6.19Red Spur 8.00 8.67 7.67 6.67 7.33 6.67 6.00 6.00 7.00Oregon Spur 6.33 7.33 6.67 6.00 5.33 4.00 4.00 4.00 5.33Rich-A-Red 6.00 6.67 4.00 5.33 7.33 6.00 4.67 4.67 5.52Red Delicious 6.33 6.67 6.00 7.33 6.00 6.00 4.67 4.00 5.81Mean 6.77 7.27 6.17 6.00 6.27 5.87 5.27 4.73
Storage period (S) Cultivar (C) S×CC.D. 0.05 0.46 0.52 1.47
of the cultivars. The highest mean reducing sugars and total sugars was found in Red Chief (8.89% and 10.59%), while lowest in cv. Rich-A-Red (7.05% and 8.46%) during storage, respectively. However, the highest mean non-reducing sugars were found in Red Spur (1.88%), while lowest in cv. Starkrimson (1.01%) during storage. The increase in sugars during storage may possibly be due to breakdown of complex organic metabolites into simple molecules or due to hydrolysis of starch into sugars. On complete hydrolysis of starch no further increase in sugars occurs and subsequently a decline in these parameters is predictable as they along with other organic acids are primary substrate for respiration (Wills et al., 17). Wang et al. (16) also reported similar results as ascorbic acid, titratable
acidity and sugars in apple fruits stored at room temperature.
The organoleptic score decreased gradually in all the cultivars with the advancement of storage period (Table 5). The mean organoleptic score was found highest in cv. Skyline Supreme (7.19) followed by Red Spur (7.00) and Starkrimson (6.19). On the other hand, the cv. Golden Delicious (5.24), Oregon Spur (5.33) and Red Chief (5.43) recorded the lowest score. Initially, most of the cultivars recorded the highest organoleptic score up to 7 days of storage showing acceptability but thereafter sudden decline in sensory quality was noticed. The organoleptic score of the cultivars revealed that cultivars having medium to high TSS and total sugars scored higher

325
Apple Storage Under Ambient Conditions
values while lower values for any of these character resulted in lower score. The results obtained in the present investigation are found to be close conformity with the studies of Pandey et al. (9) and Issar et al. (5). Hence, on the basis of investigation, it was concluded that Skyline Supreme, Red Chief and Bright-N-Early have better shelf-life than other apple cultivars under ambient storage conditions.
REFERENCES1. Amerine, M.A., Pangborn, R.M. and Roessler,
E.B. 1965. Principles of Sensory Evaluation of Food. Academic Press, London, 5 p.
2. Bhullar, J.S., Khakhar, U.U. and Agnihotri, R.P. 1981. Studies on storage behaviour of Kinnow mandarin. Punjab Hort. J. 21: 27-31.
3. Das, B., Krishna, H., Attri, B.L., Ahmad, N. and Ranjan, J.K. 2011. Harvest maturity standards and fruit quality of some apple cultivars under high altitudal conditions. Indian J. Hort. 68: 170-79.
4. Iglesias, J., Graell, J., Echeverria, G. and Vendrell, M. 1999. Difference in fruit colour development, anthocyanin content, yield and quality of seven Delicious apple strains. Fruit Varieties J. 53: 133-45.
5. Issar, K., Sharma, S.K. and Nautiyal, M.C. 2010. Effect of waxing on shelf life and quality of apple. Indian J. Hort. 67(Special Issue): 488-91.
6. Kang, I., Kim, H.Y., Kweon, H.J. and Byun, J. 1999. Changes in ethylene production, respiration rates and cell wall hydrolyses activity during storage of apple. J. Korean Soc. Hort. Sci. 40: 451-54.
7. Maini, S.B., Diwan, B., Lal, B.B. and Anand, J.C. 1983. Effect of some pre-treatments on the quality of apples in cool store. 3rd Indian Convention of Food Scientists and Technologists, Mysore, 75 p.
8. Mapson, C.W. 1970. Vitamins in fruits: Stability of L-ascorbic acid. In: Bio-chemistry of Fruits and
Their Products, Academic Press, London, pp. 376-87.
9. Pandey, G., Verma, M.K. and Tripathi, A.N. 2006. Studies on storage behaviour of apple cultivars. Indian J. Hort. 63: 368-71.
10. Panse, V.G. and Sukhatme, P.V. 1976. Statistical Methods for Agricultural Workers. ICAR, New Delhi.
11. Ranganna, S. 2010. Handbook of Analysis and Quality Control for Fruit and Vegetable Products, Tata McGraw Hill Publishing Company Ltd., New Delhi, 1103 p.
12. Sharma, D.P., Sharma, H.R. and Sharma, N. 2017. Evaluation of apple cultivars under sub-temperate mid hill conditions of Himachal Pradesh. Indian J. Hort. 74: 162-67.
13. Sharma, R.R., Singh, D. and Singh, R. 2009. Studies on transportation losses in apples packed in different containers. Indian J. Hort. 66: 245-48.
14. Singh, A., Yadav, D.S., Patel, R.K. and Bhuyan, M.. 2007. Effect on shelf-life and quality of passion fruit with polythene packaging under specific temperature. J. Fd. Sci. Tech. 44: 201-04.
15. Singh, S., Singh, A.K. and Joshi, H.K. 2003. Storage behaviour of Indian gooseberry (Emblica officinalis Gaertn.) cultivars in semi-arid ecosystem of Gujarat. Indian J. Agric. Res. 73: 530-34.
16. Wang, Z., Gu, Z.X. and Fang. 1998. Effect of room temperature storage on change of quality and physiology of apple fruit. J. Nanjing Agri. Univ. 21: 107-11.
17. Wills, R.B.H., Bembridge, P.A. and Scott, K.J. 1980. Use of flesh firmness and other objective tests to determine consumer acceptability of Delicious apples. Aust. J. Exp. Agri. Anim. Husb. 20: 252-56.
Received : July, 2017; Revised : April, 2018; Accepted : May, 2018

326
DOI : 10.5958/0974-0112.2018.00055.5
Indian J. Hort. 75(2), June 2018: 326-331
Temperate fruit crops namely apple, peach, pear, plum, apricot, almond and walnut occupy major share in North Western Himalayan states of India. However, production and productivity of temperate fruit crops in India was recorded to be lesser in comparison to other major temperate fruit producing countries. Productivity of apple is only 8.1 t/ha in India; whereas, it is above 50.0 t/ha in many countries (NHB, 10 and FAOSTAT, 6). Similarly, it is only 4.5 t/ha and 2.3 t/ha in stone and nut fruits in India, respectively. One of the major causes of low productivity of temperate fruits is associated with the scarcity of quality planting material of superior cultivars. The low rate of multiplication is the major hindrance in meeting the ever increasing demand of planting material. To meet the increasing requirement of quality planting material of different temperate fruit crops, standardization of suitable propagation methods is essential. Existing old and new fruit nurseries are employing traditional grafting and budding techniques for multiplication which is season specific and respond poorly in bud take especially in case of walnut (Ananda et al., 2 and Ahmed et al., 1). Success of walnut grafting are depended upon grafting/budding technique as well as micro-climatic conditions around the graft union (Sharma and Dar, 11). Chip budding has been reported to be very good for propagation (Gustafson and Morrissey, 7). Considering all these factors, the present experiment
was under taken to study the comparative bud take success of various grafting and budding methods as affect by season and bud/graft height.
The experiment was carr ied out in the experimental fruit nursery, Central Institute of Temperate Horticulture, Mukteshwar, Nainital, India, situated at an altitude of 7000 ft amsl. Average minimum and maximum temperature ranges 2.0-12.9ºC in winter, 5-18ºC in spring, 14-25ºC in summer, 12-22ºC in rainy season and 9-18ºC in fall. Relative humidity was 65-75%. Scion cultivars were collected from apple cv. Starkrimson, pear cv. Bartlett and peach cv. Red June, apricot cv. St. Ambroise, almond cv. Merced and walnut cv. Sulaiman. Rootstocks namely crab apple seedling rootstock ‘Parhu’ (Malus baccata var. Himalaika) and clonal rootstock M9 for apple, ‘Mahel’ (Pyrus pashia Kumaonii) seedling for pear, wild peach seedling ‘Katero’ (Prunus persica) for peach, wild apricot seedling ‘Chulli’ (Prunus americana) for apricot, Bitter almond (Prunus amygdalus) seedlings for almond and Hard shell (Juglan regia) seedlings for walnut were used. One year old rootstocks with average diameter of 10 mm in apple, pear, apricot and almond, 11 mm in peach and 13 mm in walnut were selected. In the 1st Experiment (Table 1), chip budding, tongue and wedge grafting were performed in December-January and February-March at rootstock height of 8-10 cm, 13-15 cm and 18-20 cm. In the 2nd experiment (Table 2), chip budding and T-budding were performed during July-August and September-October at same height as in case of grafting. Bench grafting
Budding and grafting time and height as determining factors for bud take and successive plant growth in some temperate fruits
Biswajit Das*,**, Arun Kishor and N. Ahmed Central Institute of Temperate Horticulture, Regional Station, Mukteshwar 263 138, Uttarakhand
ABSTRACTSeasonal effect of different grafting and budding methods performed at three heights on pome, stone and
nut fruits were studied under polyhoused condition. Chip budding at height of 8-10 cm and even 13-15 cm during February-March and July-August was highly successful for pome and stone fruits with graft/bud success rate of 86.9% to 95.9%. This was closely followed by wedge grafting (81.5% to 89.1%) and tongue grafting (79.4% to 86.55). In case of walnut, chip budding and wedge grafting during February-March at height of 8-10 cm (83.1%) and 13-15 cm (77.8%) gave higher graft success. T-budding at 8-10 cm height during July-August gave 84.6% to 89.5% success in different temperate fruit crops except walnut. Chip budding, done with active vegetative or dormant mature buds on active vegetative or dormant stocks, respectively, extended the regular budding/grafting season, even if, bud is not slipping in the dormancy period or started stock/scion sap flow in the spring. Key words: Pome fruit, stone fruit, nut fruit, wedge grafting, chip budding.
*Corresponding author’s E-mail: [email protected]**ICAR-Research Complex for NEH Region, Tripura Centre, PO: Lembucherra- 799 210, Tripura
Short communication

327
Budding and Grafting Time and Height for Bud Take in Temperate Fruits
and bench chip budding was done on dormant rootstocks during winter, whereas, in-situ budding was performed during active growth stage during July-October and planted in polyhoused condition where temperature 20-30ºC and RH 70-85% were maintained. Observation was recoded on grafting success, diameter at grafting union and plant height after the end of growing season. The experiment was laid out in factorial RBD with 3 replication consisting 25 plants in each replication. Two years data were analyses using MiniTab 17.
The bud success of chip budding in comparison to tongue and wedge grafting on apple cv. Starkrimson was higher in the month of February-March (Table 1 and Table 3) with success rate of 93.5% and 92.3% at budding height 13-15 cm and 8-10 cm(T5 and T4) on rootstock Malus baccata. Similarly, 95.9% at budding height 8-10 cm (T4) and 94.5% at 13-15 cm height bud success was recorded on rootstock M9. However, 85.6% and 87.7% bud success was also recorded at budding height 18-20 cm on the respective rootstocks. The bud success of wedge grafting was 86.0% and
Table 1. Treatment combinations of budding/grafting methods, time and height.
Treatment Designation Grafting/Budding method Grafting Season Grafting Height (cm)T1 Chip budding December-January 8-10T2 Chip budding December-January 13-15T3 Chip budding December-January 18-20T4 Chip budding February-March 8-10T5 Chip budding February-March 13-15T6 Chip budding February-March 18-20T7 Tongue grafting December-January 8-10T8 Tongue grafting December-January 13-15T9 Tongue grafting December-January 18-20T10 Tongue grafting February-March 8-10T11 Tongue grafting February-March 13-15T12 Tongue grafting February-March 18-20T13 Wedge grafting December-January 8-10T14 Wedge grafting December-January 13-15T15 Wedge grafting December-January 18-20T16 Wedge grafting February-March 8-10T17 Wedge grafting February-March 13-15T18 Wedge grafting February-March 18-20
Table 2. Treatment combinations of budding methods, time and height.
Treatment Designation Grafting/Budding method Grafting Season Grafting Height (cm)T1 Chip budding July-August 8-10T2 Chip budding July-August 13-15T3 Chip budding July-August 18-20T4 Chip budding September-October 8-10T5 Chip budding September-October 13-15T6 Chip budding September-October 18-20T7 T-budding July-August 8-10T8 T-budding July-August 13-15T9 T-budding July-August 18-20T10 T-budding September-October 8-10T11 T-budding September-October 13-15T12 T-budding September-October 18-20

328
Indian Journal of Horticulture, June 2018
88.7% at 8-10 cm height on the respective rootstocks during the same period. Whereas, tongue grafting recorded 82.6% and 86.1% graft success at 8-10 cm height on the respective rootstocks. Higher rate of chip bud success (Table 1 and Table 3) at height 8-10 cm (T4) and 13-15 cm (T5) during February-March was also recorded on pear (93.6% and 92.5%, respectively), peach (94.2% and 92.6%, respectively), apricot (90.4% and 84.5, respectively), almond (89.6% and 86.9%, respectively) and walnut (83.1% and 77.9%, respectively). Success of wedge and tongue grafting on pome, stone and nut fruit crops was above 80% except walnut when performed during February-March at height 8-10 cm as evident in Treatments T10 (tongue grafting × February-March × 8-10 cm graft height) and T16 (wedge grafting × February-March × 8-10 cm graft height). In case of walnut, tongue grafting gave 73.2% (T10) and wedge grafting gave 77.8% (T16) at height 8-10 cm. Comparative assessment of chip budding with T-budding in experiment 2 (Table 2), revealed that chip budding resulted in higher bud success (Table 4) in all the temperate fruit crops not only in July-August but also in September–October particularly at 8-10 cm (T1) and 13-15 cm (T2) budding height, except in case of walnut. The chip budding success during
July-August at 8-10 cm height is 93.3% on Malus baccata and 94.2% on M9 in apple, 91.7% in pear, 93.1% in peach, 86.9% in apricot and 84.3% in almond. This was followed by treatments T2 (chip budding × July-August × 13-15 cm height) and T3 (chip × July-August × 15-20 cm height). On the other hand during September-October (Table 4), chip bud success at height 8-10 cm (T4) was in the range of 82.2% (almond) to 91.5% (pear). T-budding during July-August at 8-10 cm height gave 84.6% on Malus baccata and 87.3% on M9 in apple, 81.4% in pear, 77.2% in peach, 71.4% in apricot and 64.4% in almond. In walnut, chip budding during July-August gave 40.1% success at 8-10 cm height (Table 4). Apart from the grafting or budding methods, season and grafting/budding height was found to be very critical for better success. In case of plant growth parameters as recorded on the plants grafted/ budded (Table 5 and Table 6), it was observed that chip budding during February-March resulted in maximum plant growth (121.9 cm) in comparison to tongue (110.1 cm) or wedge (113.9 cm) grafted plants. During July-August and September-October, chip budded plants recorded height 104.4 cm and 115.4 cm respectively. Similarly, graft/bud union diameter was in the range of 14.1 to 15.1cm when grafted/chip budded during
Table 3. Interaction effect of grafting method, time and height on graft success of temperate fruit.
Treatments Apple Pear Peach Apricot Almond WalnutRootstock
Malus baccata M9 Pyrus pashia Prunus persica Prunus americana Prunus amygdalus Hard shellT1 61.2 64.2 45.5 42.9 34.8 31.6 21.5T2 60.5 65.7 41.2 37.2 33.2 29.9 19.4T3 42.5 44.7 39.5 27.7 21.8 21.9 8.5T4 92.3 95.9 93.6 94.2 90.4 89.6 83.1T5 93.5 94.5 92.5 92.6 84.5 86.9 77.9T6 85.6 87.7 83.8 86.1 83.8 77.9 62.1T7 39.8 43.2 54.6 42.1 37.9 35.6 41.8T8 35.3 36.3 51.9 39.9 35.8 32.3 31.6T9 34.7 36.1 43.8 35.8 32.8 23.2 26.4T10 82.6 86.1 86.5 81.8 82.6 84.7 73.2T11 78.6 80.5 84.3 79.4 81.6 80.3 68.4T12 71.4 81.6 74.2 72.3 73.6 68.8 63.6T13 40.3 45.2 56.9 47.1 43.9 36.9 55.6T14 37.3 39.6 54.6 44.6 41.8 37 46.6T15 35.5 36.8 45.5 41.2 34.9 25.5 36.3T16 86 88.7 87.1 84.2 85.9 89.1 77.8T17 79.6 78.5 86.9 81.5 82.9 86.9 74.8T18 76.8 82.3 76.5 74.9 76.2 70.8 61.3CD(0.05) 8.1 6.9 7.7 7.3 6.9 5.5 6.5

329
Budding and Grafting Time and Height for Bud Take in Temperate Fruits
Table 4. Interaction effect of budding method, time and height on bud success of temperate fruits.
Treatments Apple Pear Peach Apricot Almond WalnutRootstock
Malus baccata
M9 Pyrus pashia
Prunus persica
Prunus americana
Prunus amygdalus
Hard shell
T1 93.3 94.2 91.7 93.1 86.9 84.3 40.1
T2 86.2 88.1 89.6 89.6 83.7 86.9 42.6
T3 84.3 86.7 84.3 78.9 75.3 75.1 31.7
T4 87.6 88.8 91.5 90.6 85.9 82.2 21.6
T5 82.5 85.4 88.6 88 76.8 74.7 20.6
T6 80.2 83.2 81.4 77.2 71.4 64.4 27.3
T7 84.6 87.3 85.5 89.5 85.7 87.5 28.2
T8 77.2 84.5 83.5 86.7 82.6 85.7 16.8
T9 75.3 77.7 75.7 78.3 74.4 74.9 12.1
T10 69.6 68.4 71.7 76.2 71.3 72.2 18.3
T11 60.3 65.7 66.7 67.7 64.6 64.6 11.3
T12 57.4 62.3 51.8 60.3 52.5 54.1 8.3
CD (0.05) 7.2 6.2 5.6 6.7 5.8 6.4 6.2
Table 5. Interaction effect of grafting and budding methods and time on plant height.
Grafting/Budding method and Time
Apple Pear Peach Apricot Almond Walnut Avg.Rootstocks
M. baccata
M9 P. pashia
P. persica
P. americana
P. amygdalus
Hard shell
Grafting in different timeChip: Dec.-Jan. 114.9 98.4 93.7 96.7 93.6 89.0 59.1 92.2Chip: Feb.-Mar. 133.6 118.2 131.6 127.7 122.3 116.2 103.4 121.9Tongue: Dec.-Jan. 108.6 99.5 87.3 84.6 122.4 80.6 83.1 95.1Tongue: Feb.-Mar. 120.3 100.9 125.9 122.6 81.6 114.2 105.5 110.1Wedge: Dec.-Jan. 108.0 98.0 92.4 83.3 122.3 88.7 85.7 96.9Wedge: Feb.-Mar. 120.7 102.9 127.4 117.7 106.2 119.7 102.4 113.9CD (0.05) 2.6 2.0 1.5 1.5 1.7 3.2 4.3 2.2Budding in different timeChip: Jul.-Aug 107.9 81.8 123.4 116.0 113.4 109.4 79.2 104.4Chip: Sept.-Oct. 126.1 111.2 133.6 117.5 113.2 114.6 91.6 115.4T-Bud: Jul.-Aug. 109.0 83.8 122.4 113.6 112.4 110.7 74.8 103.8T-Bud: Sept.-Oct. 122.0 93.9 115.4 112.3 103.7 118.3 80.0 106.5CD(0.05) 1.5 3.5 1.34 1.4 1.2 2.6 1.7 1.2
dormant season and 14.7 to 15.4 cm when budded during July-August or September-October (Table 6).
Chip budding has given higher success rate when performed during February-March, July-August and also in September-October in comparison to all the
grafting or budding methods, whereas, wedge grafting was found to be highly successful only during February-March. In case of apple on M. baccata seedling plants recorded comparatively higher growth than the plants on clonal root stock M 9. The reason may be clonal

330
Indian Journal of Horticulture, June 2018
Table 6. Interaction effect of grafting and budding method and time on graft/bud union diameter.
Graf t ing/Budding method and Time
Apple Pear Peach Apricot Almond Walnut Avg.Rootstocks
M. baccata
M9 P. pashia
P. persica
P. americana
P. amygdalus
Hard shell
Grafting in different time
Chip: Dec.-Jan. 14.0 14.3 14.5 15.2 14.2 14.1 15.6 14.4
Chip: Feb.-Mar. 15.5 15.0 15.2 15.6 14.6 14.6 16.1 15.1Tongue: Dec.-Jan. 13.1 14.4 14.6 14.9 13.9 13.9 15.5 14.1Tongue Feb.-Mar. 14.4 14.0 14.3 14.8 13.9 13.8 15.3 14.2Wedge: Dec.-Jan. 13.5 14.6 14.8 15.1 14.0 13.9 15.8 14.3Wedge: Feb.-Mar. 14.4 14.1 14.3 14.8 13.8 13.7 15.5 14.2CD (0.05) 0.03 0.05 0.07 0.15 0.25 0.24 0.30 0.15
Budding in different timeChip: Jul.-Aug 14.5 14.7 15.1 15.4 14.4 14.3 16.3 14.7
Chip: Sept.-Oct. 14.8 15.5 15.7 15.9 14.8 14.7 16.7 15.2T-Bud: Jul.-Aug. 14.2 15.1 15.3 15.6 14.6 14.4 16.4 15.4T-Bud: Sept.-Oct. 14.4 15.9 16.0 16.1 15.1 15.0 16.9 14.9CD (0.05) 0.02 0.13 0.20 0.30 0.24 0.41 0.22 0.30
rootstock M 9 is genetically dwarf rootstock. Chip bud contains a triangular wood chip attached to the bud bark which is inserted into the groove on the rootstock. This wood plays a vital role in strong and higher union formation even in dormant season. Thus, chip budding method extends the regular budding/grafting season with active or dormant buds on active or dormant stocks (Gustafson and Morrissey, 7). Chip budding, done with active vegetative or dormant mature buds on active vegetative or dormant stocks, respectively, extended the regular budding/grafting season, even if, bud is not slipping in the dormancy period or started stock/scion sap flow in the spring (Crasweller, 3). Further, chip budding assures better cambial contact and more rapid healing with a complete union of the xylem and the continuous cambial tissues than any other budding techniques like T-budding (Skene et al., 12; Gustafson and Morrissey, 7). This is because of the fact that chip bud tissue contains bark and an angular scion wood piece under the bark which tightly fixed into the matching groove made on the rootstock after removing the wood in similar size. The scion chip wood is inserted very closely by matching cambium of the stock. This is not true in case of T-budding, where the cambium layers of the both, scion and stock, are not adjacent and initial union formation can be weak and slow (Howard, 8). Similarly, in case of other grafting method, late winter time grafting gave better success due to favourable environment
prevailing at that time for better graft union by callus bridge formation, vascular cambium differentiation across the callus bridge, and secondary xylem and phloem production. Chip budding in apple in the month of mid-February to March gave better result under North Western Himalayan zone in comparison to tongue grafting in March and T-budding in late summer (Ananda, et al., 2 and Dimri et al., 4). Micro-environmental factors around the walnut grafts have a major impact on callus formation and ultimate graft success, where, temperature and relative humidity 25ºC and 70% during day and 21ºC and 39% during night were found to be optimum for better callus formation, which is not met under open field condition as a result budding or grafting is not highly successful under open environment condition (Sharma and Dar, 11 and Ebrahimi et al., 5). Grafting and budding height also effects the linear and radial growth of plant (Kumar and Ananda, 9). Chip budding at height of 8-10 cm and even 13-15 cm during February-March and July-August was highly successful for pome and stone fruits. This was closely followed by wedge and tongue grafting. In case of walnut, chip budding and wedge grafting during February-March at height of 8-10 cm and 13-15 cm gave higher graft success.
REFERENCES1. Ahmed, N., Singh, S.R., Srivastava, K.K.,
Shagoo, P.A. and Hayat, S. 2012. Effect of
331
Budding and Grafting Time and Height for Bud Take in Temperate Fruits
different environments, grafting methods and times on sprouting, graft success and plant growth of walnut (Juglans regia). Indian J. Agric. Sci. 82: 1022-26.
2. Ananda, S.A., Negi, K.S., Dwivedi, M.P. 1999. Evaluation of chip budding in apple propagation. Indian J. Hort. 56: 42-45.
3. Crasweller, R.M. 2005. Grafting and propagating fruit trees. Penn State’s College of Agricultural Science. Agri. Res. and Coo. Ex., pp. 1-12.
4. Dimri D.C., Petwal A., Kamboj P. 2009. Determination of optimum time for chip budding in apple cv. Red Fuji. Indian J. Hort. 66: 254-56.
5. Ebrahimi, A., Vahdati, K. and Fallahi, E. 2007. Improved success of Persian walnut grafting under environmentally controlled conditions. Int. J. Fruit Sci. 6: 3-12.
6. FAOSTAT, 2016. Food and Agriculture Organization of the United Nations, Rome, Italy. www.fao.org/faostat/.
7. Gustafson, W.A. and Morrissey, T.M. 2003. Chip budding: an old grafting technique for
woody plants with rediscovered advantages for Nebraska. Extension Historical Materials from University of Nebraska-Lincoln Extension. University of Nebraska – Lincoln. G03-1518, pp. 1-5.
8. Howard, B.H. 1993. Understanding vegetative propagation. Comb. Proc. Intl. Plant Prop. Soc., 43:157-62.
9. Kumar, R. and Ananda, S.A. 2002. Effects of grafting method and height on the growth of grafted plants and production of feathers in spur-type apple cultivars at nursery stage, J Appl. Hort. 4: 54-55.
10. NHB. 2017. Indian horticulture database. National Horticulture Board, Govt. of India. www. nhb.gov.in/.
11. Sharma, A.K. and Dar, M.Y. 2006. Walnut grafting as influenced by environment conditions and rootstocks. Indian J Hort. 63: 264-66.
12. Skene, D.S., Shepart, H.R., Howard, B.H. 1983. Characteristic anatomy of union formation in T- and chip budded fruit and ornamental trees. J. Hort. Sci. 58: 295-99.
Received : May, 2017; Revised : May, 2018; Accepted : May, 2018

332
DOI : 10.5958/0974-0112.2018.00056.7
Indian J. Hort. 75(2), June 2018: 332-336
Cucumber (Cucumis sativus L.) is an important fruit vegetable crop of the tropical and subtropical regions of the world, grown in plains and river beds. It is grown throughout the country for its high nutritive value and medicinal properties. Among the cucurbits, cucumber has a unique sex mechanism and this feature can be easily manipulated for the production of F1 hybrid (Airina et al., 1). Heterosis breeding is one of the most efficient tools to exploit the genetic diversity in cucumber (Singh et al., 6). It has been utilized in cucurbits to exploit dominance variance through the production of hybrids. The extent of heterosis over economic parent is a prerequisite for commercial exploitation of hybrid vigour in cucumber (Singh et al., 7). F1 hybrids in cucumber have several well known advantages over open pollinated varieties as in many vegetable crops and hence, provide a scope for the breeder to find out more appropriate combination to develop superior hybrids. Keeping in view the above facts, the present investigation was carried out to obtain information for assessment of heterosis for yield and yield attributing traits.
The experiment was carried out at the main experimental farm of the Division of Vegetable Science, ICAR-IARI, New Delhi. Eight genetically diverse parental lines P1 (DC-77), P2 (DC-70), P3 (DC-83), P4 (Pusa Uday), P5 (Punjab Naveen), P6 (DC-1), P7 (Swarna Ageti) and P8 (Kalyanpur Green) were used to develop twenty eight F1 hybrids following 8 × 8 half diallel mating system. The 28 F1
hybrids along with eight parents were evaluated in a randomized block design with three replications. Five to six seeds were sown on the side of the channel in a well prepared hill, with a spacing of 1.5 m between channels and 60 cm between hills. Standard and uniform agronomic practices recommended under irrigated conditions were followed throughout the growing season to raise a healthy crop. Five plants were randomly selected for taking observations after discarding the border plants at both the ends. Data were recorded on days to first female flower anthesis, days to first fruit set, days to first fruit harvest, number of fruits per plant, fruit length (cm), fruit diameter (cm), average fruit weight (g) and total yield per plant (g). Heterosis for each cross was calculated as percentage deviation of F1 mean over the better parent and standard check for all the traits and their significance was tested by t-test. Pusa Uday was used as standard check.
The analysis of variance showed highly significant differences among the genotypes studied. The percent heterosis over better and standard check and the range of mean values for different traits of parents, F1 hybrids and heterosis (over better and standard parent) are presented in Table 1 and Table 2, respectively. The result indicated that there was wide variation in magnitude and direction of heterosis for all the characters. Similar findings were reported by Kumar et al. (3). Among all the parents, parent P6 (DC-1) took minimum days to first female flower opening (49.05), days to first fruit set (52.05), days to fruit harvest (57.05) and had maximum fruit diameter (3.83 cm). P8 (Kalyanpur Green) recorded maximum fruit length (16.88 cm) and average fruit weight (251.98 cm). Highest number of fruits per plant (7.10)
Estimates of heterosis for yield and its contributing traits in cucumber T.L. Bhutia*, A.D. Munshi, T.K. Behera, A.K. Sureja, S.K. Lal** and Azeze Seyie***
Division of Vegetable Science, ICAR-Indian Agricultural Research Institute, New Delhi 110 012
ABSTRACT Heterosis was studied for yield and its component traits in eight parental lines and 28 F1 hybrids obtained
from 8 × 8 half diallel cross excluding reciprocals in randomized block design (RBD) with three replication. P4 (Pusa Uday), P6 (DC-1) and P5 (Punjab Naveen) were observed to be three best performing parents for total yield per plant. Appreciable heterosis was recorded over standard check (Pusa Uday) for all the traits studied except for fruit width. Three best performing hybrids were Pusa Uday × DC-1 followed by Pusa Uday × Kalyanpur Green and Pusa Uday × Punjab Naveen which showed significant heterosis of 86, 62.9 and 56.11%, respectively over standard parent for yield and other desirable traits and these hybrid combinations may be exploited for commercial cultivation.Key words: Cucumis sativus, earliness, hybrid.
*Corresponding author’s E-mail: [email protected]; [email protected]**Division of Crop Research, ICAR-Research Complex for Eastern Region, P.O. B.V. College, Patna 800014***Division of Genetics, ICAR-Indian Agricultural Research Institute, New Delhi 110012****ICAR Research Complex for Northeastern Hill Region, Nagaland Centre, Jharnapani 797106
Short communication

333
Estimates of Heterosis in Cucumber
and total yield per plant (1473.33 g) was recorded in P4 (Pusa Uday).
The F1 hybrids had higher range of mean values than that of parents for all the characters studied except days to first female flower opening and days to first fruit set and days to first fruit harvest. Our results are in conformity with Shailaja et al. (5).The present study revealed appreciable amount of heterosis in positive and negative directions for all the characters except for fruit diameter which did not show any heterosis over better parent and standard check. Heterosis in negative direction is desirable for characters like days to first female
flower opening, days to first fruit set and days to first fruit harvest. Earliness (indicated by negative estimates of heterosis) is an important objective of any breeding programme as it helps the grower to fetch higher market price earlier. The crosses Pusa Uday × DC-1 (P4 × P6), were found to be the most promising for earliness (-6.22 and -19.35% over better parent and standard check, respectively). Similar findings were reported by Singh et al. (7) in cucumber. Out of 28 F1 hybrids, the heterotic effects over their respective better and standard parent were observed in 13 and 9 hybrids for fruit length. Maximum fruit length was observed in the
Table 1. Heterosis percentage over better parent and standard check for eight quantitative characters.
Cross Days to first female flower opening
Days to first fruit set Days to first fruit harvest Fruit length (cm)
BPH SPH BPH SPH BPH SPH BPH SPH1 × 2 -1.75* -0.07 -2.88** -1.38 -3.09** -1.51 -3.33 -0.851 × 3 3.50** 1.68* 2.47** 0.87 2.68** 0.93 -4.47 -7.911 × 4 -1.82* -1.82* -2.61** -2.61** -2.84** -2.84** -1.99 -1.961 × 5 -1.96* -8.84** -3.13** -9.04** -3.31** -9.75** -7.27 -7.411 × 6 1.94 -12.34** 0.47 -11.86** 0.55 -12.84** -2.31 3.601 × 7 -2.55** -10.59** -2.84** -9.89** -3.14** -10.73** -17.56** -3.221 × 8 1.66 -1.82* 1.25 -1.81* 1.31 -1.99* -12.04** 11.99*
2 × 3 -1.85* -3.58** -2.11** -3.63** -2.32** -3.98** 11.27* 14.13**
2 × 4 -1.82* -1.82* -2.48** -2.48** -2.74** -2.75** -5.31 -2.882 × 5 1.81* -5.33** 0.44 -5.69** 0.53 -6.17** 4.82 7.512 × 6 1.94 -12.34** 1.36 -11.08** 1.58 -11.95** -14.67** -9.502 × 7 -0.62 -8.82** -0.51 -7.73** -0.61 -8.39** 6.13 24.60**
2 × 8 -1.97* -5.33** -1.68* -4.66** -1.87* -5.06** -1.50 25.41**
3 × 4 -3.63** -5.33** -3.79** -5.28** -4.10** -5.73** 7.76 7.793 × 5 -0.08 -7.08** -0.92 -6.97** -0.96 -7.56** -5.48 -5.623 × 6 2.14* -12.17** 1.97* -10.54** 2.18* -11.42** -19.41** -14.53**
3 × 7 -2.55** -10.59** -2.17** -9.27** -2.42** -10.06** -23.99** -10.76*
3 × 8 -3.78** -7.08** -3.24** -6.17** -3.56** -6.70** -24.95** -4.454 × 5 -2.90** -9.71** -3.26** -9.17** -3.52** -9.95** -6.86 -6.834 × 6 -6.22** -19.35** -5.35** -16.96** -5.85** -18.39** 1.45 7.594 × 7 -2.55** -10.59** -2.17** -9.27** -2.42** -10.06** -13.66** 1.374 × 8 -1.97* -5.33** -1.68* -4.66** -1.87* -5.06** -4.23 21.95**
5 × 6 -4.18** -17.60** -3.56** -15.40** -3.92** -16.71** -13.49** -8.255 × 7 -4.46** -12.34** -2.17** -9.27** -2.42** -10.06** -1.76 15.33**
5 × 8 -1.96* -8.84** 0.09 -6.02** -1.64 -8.20** -26.24** -6.086 × 7 -2.14* -15.85** -1.84* -13.89** -2.01* -15.06** -9.29* 6.506 × 8 1.94 -12.34** 1.67* -10.81** 1.83* -11.73** -11.67** 12.47*
7 × 8 1.27 -7.08** 1.14 -6.20** 1.20 -6.73** -14.12** 9.35*&**Significance at 1 and 5%, respectively; BPH = Better parent heterosis; SPH = Standard parent heterosis

334
Indian Journal of Horticulture, June 2018
Table 1 contd…
Cross Fruit width (cm) Av. fruit wt. (g) No. of fruits/ plant Total yield/plant (g)BPH SPH BPH SPH BPH SPH BPH SPH
1 × 2 4.31 -5.14 19.83** -20.51** 6.17 -4.65 30.00** -28.73**
1 × 3 7.99 -0.25 22.25** -18.90** 42.00** 10.33** 47.06** -18.55**
1 × 4 -8.49 -8.40 -18.68** -18.68** 0.28 0.23 18.78** 18.70**
1 × 5 6.21 -1.03 -11.42* -31.65** 10.73** 2.21 54.99** 8.60**
1 × 6 -11.56 -4.89 -20.35** -24.83** -13.57** -20.14** 50.00** 22.17**
1 × 7 -1.17 -5.23 -1.83 -29.57** 5.08 -12.68** 36.19** -25.34**
1 × 8 -8.41 -14.57 -6.01 -7.33 21.24** 9.86** 38.65** -8.37**
2 × 3 4.15 -3.86 44.96** -12.48** 26.19** 13.33** 69.12** -6.33*
2 × 4 -4.76 -4.70 -11.48* -11.48* 23.77** 23.71** 28.28** 28.28**
2 × 5 -8.32 -14.66 -0.94 -23.57** 25.33** 15.68** 43.98** 0.882 × 6 4.43 12.23 -11.55* -16.53** 21.44** 12.21** 49.17** 21.49**
2 × 7 0.78 -3.39 12.27* -19.46** 25.48** 4.27 59.97** -14.48**
2 × 8 -7.21 -13.52 -13.95** -15.16** 8.81* -1.41 43.79** -4.983 × 4 6.34 6.44 -29.31** -29.31** 19.77** 19.72** 28.96** 28.96**
3 × 5 11.62 3.98 7.89 -16.75** 4.12 -3.90 59.35** 11.65**
3 × 6 -9.21 -2.43 -26.80** -30.91** 21.44** 12.21** 28.33** 4.533 × 7 10.03 5.51 0.03 -28.24** 14.97** -4.46 50.74** -16.52**
3 × 8 1.00 -5.79 -28.51** -29.51** 33.63** 21.08** 11.95** -26.02**
4 × 5 -4.01 -3.92 -14.68** -14.68** 53.05** 41.27** 56.11** 56.11**
4 × 6 0.52 8.03 12.37** 12.37** 65.60** 53.00** 86.65** 86.65**
4 × 7 -9.24 -9.15 -19.38** -19.38** 45.54** 20.94** 42.53** 42.53**
4 × 8 -6.34 -6.22 1.12 1.12 28.86** 16.76** 62.90** 62.90**
5 × 6 -7.04 -0.09 -6.09 -11.38* 28.00** 18.26** 113.11** 49.32**
5 × 7 -6.43 -10.27 2.52* -20.90** 19.28** 10.09** 74.36** 22.17**
5 × 8 0.00 -6.72 -9.68* -10.95* 29.81** 19.81** 64.68** 15.38**
6 × 7 -0.35 7.07 -11.20* -16.20** 19.41** 10.33** 58.33** 28.96**
6 × 8 -14.68 -8.28 3.03 1.58 17.99** 9.01** 36.81** 11.43**
7 × 8 8.96 4.51 -6.10 -7.42 34.97** 22.30** 33.52** -11.76**
*&**Significance at 1% and 5%, respectively; BPH = Better parent heterosis; SPH = Standard parent heterosis
hybrid DC-70 × DC-83 over better parent (11.27%) and hybrid DC-70 × Kalyanpur Green over standard parent (25.41%). Lima et al. (4) reported that heterosis for fruit yield was positive and high, while heterosis for fruit characteristics (length, diameter, relation of L/D and average fruit weight) was of smaller values. Maximum average fruit weight was recorded by the hybrid combination DC-70 × DC-83 over better (44.96%), while hybrid combination Pusa Uday × DC-1 showed maximum fruit weight over standard parent (12.37%). Hybrid Pusa Uday × DC-1 showed maximum heterosis of 12.37 and 12.37% and 113 and 86.65% over better parent and
standard parent for number of fruits and total yield per plant, respectively. The results also indicated that maximum yield per plant in the above mentioned hybrids was attributed by maximum number of fruits per plant. Yield in cucumber can be estimated more accurately by the no of fruits per plant rather than by its fruit size because fruit size of all the genotypes is almost similar but may vary in their thickness or shape. Therefore, a breeder always concentrates on increasing this particular trait to increase the yield of cucumber. Heterosis for number of fruits per plant and yield per plant has also been reported by Jat et al. (2) and Singh et al. (7).

335
Estimates of Heterosis in Cucumber
Table 2. Range of mean values for different traits of parents, F1 hybrids and heterosis (over better and standard parent).
Particulars Days to first female flower
opening
Days to first fruit
set
Days to first fruit harvest
Fruit length (cm)
Fruit dia. (cm)
Av. fruit wt. (g)
No. of fruits per
plant
Total yield per plant
(g)Range of mean valuesParent 49.56 to
59.0252.04 to
62.0357.05 to
67.0311.32
to16.882.98 to
3.83153.28 to
255.585.24 to
7.10775.63 to 1473.33
F1 46.00 to 57.00
49.00 to 60.60
54.00 to 65.60
11.33 to 16.63
3.05 to 4.01
174.68 to 287.19
5.67 to 10.86
1050.00 to 2750
Range of heterosis % overBP -6.22 to 3.50 -5.85 to
2.68-5.35 to
2.47-26.24 to
11.27-14.68 to
11.62-29.31 to
44.960.28 to 65.60
11.95 to 113.11
SP -19.35 to 1.68 -18.39 to 0.93
-16.96 to 0.87
-14.53 to 25.41
-14.66 to 12.23
-31.65 to 12.37
-4.65 to 53.00
-28.73 to 86.65
No. of heterotic crosses overBP 21 20 20 13 - 19 24 28SP 27 26 26 09 - 24 21 25Three top parents with their mean values
P6 (49.05) P6 (52.05) P6 (57.05) P8 (16.88) P6 (3.83) P8 (251.98)
P4 (7.10) P4 (1473.33)
P7 (52.33) P7 (55.34) P7 (60.31) P7 (15.57) P4 (3.57) P4 (255.58)
P6 (6.56) P6 (1200.00)
P5 (53.04) P5 (56.04) P5 (61.06) P6 (14.06) P7 (3.42) P6 (241.20)
P5 (6.55) P5 (1032.33)
Three top F1 hybrids with heterosis% over BP
P4 × P6 (-6.22) P4 × P6 (-5.85)
P4 × P6 (-5.35)
P2 × P3 (11.27)
- P2 × P3 (44.96)
P4 × P6 (53.08)
P5 × P6 (113.11)
P5 × P7 (-4.46) P3 × P4 (-4.10)
P3 × P4 (-3.79)
P3 × P4 (7.76)
- P1× P3 (22.25)
P1 × P3 (41.57)
P4 × P6 (86.65)
P5 × P6 (-4.18) P5 × P6 (-3.92 )
P5 × P6 (-3.56)
P2 × P7 (6.13)
- P1 × P2 (19.83)
P4 × P5 (41.33)
P5 × P7 (74.36)
Three top F1 hybrids with heterosis% over SP
P4 × P6 (-19.35)
P4 × P6 (-18.39)
P4 × P6 (-16.96)
P2 × P8 (25.41)
- P4 × P6 (12.37)
P4 × P6 (53.00)
P4 × P6 (86.65)
P5 × P6 (-17.60)
P5 × P6 (-16.71)
P5 × P6 (-15.40)
P2 × P7 (24.60)
- P6 × P8 (1.58)
P4 × P5 (41.27)
P4 × P8 (62.9)
P6 × P7 (-15.85)
P6 × P7 (-15.06)
P6 × P7 (-13.89)
P4 × P8 (21.95)
- P4 × P8 (1.12)
P2 × P4 (23.71)
P4 × P5 (56.11)
BP = Better parent; SP = Standard parent (Pusa uday)
It is apparent that atleast one good performer parent was involved in those hybrids showing best effect for the particular trait. A cross showing high and desirable heterosis and have at least one good performing parent, then the possibility of exploitation of such cross is very high. Three best performing hybrids Pusa Uday × DC-1 followed by Pusa Uday × Kalyanpur Green and Pusa Uday × Punjab Naveen which showed significant heterosis of 86, 62.9 and 56.11%, respectively over standard parent for yield and other desirable characters may be exploited for commercial cultivation.
REFERENCES 1. Airina, C.K., Pradeepkumar, T., George, T.E.,
Sadhankumar, P.G. and Krishnan, S. 2013. Heterosis breeding exploiting gynoecy in cucumber (Cucumis sativus L.). J. Tropical Agril. 51: 144-48.
2. Jat, G.S., Munshi, A.D., Behera, T.K. and Dev, B. 2015. Exploitation of heterosis in cucumber for earliness, yield and yield components utilizing gynoecious lines. Indian J. Hort. 72: 494-99.

336
Indian Journal of Horticulture, June 2018
3. Kumar, S., Kumar, R., Kumar, D., Gautam, N., Singh, N., Prakash, C., Dhiman, M.R. and Shukla, Y.R. 2017. Heterotic potential, potence ratio, combining ability and genetic control of yield and its contributing traits in cucumber (Cucumis sativus L.). New Zealand J. Crop and Hort. Sci. 45: 175-90.
4. Lima, A.T., De, S. and Cardoso, A.I.I. 2012. Production and heterosis of experimental hybrids of Japanese cucumber. Revista Ceres. 59: 484-92.
5. Shailaja, P., Singh, D.K., Makanur, B., Singh, N.K. and Pandey, D.T. 2017. Heterosis studies for yield and yield contributing traits in cucumber (Cucumis sativus L.). Plant Archives, 17: 21-27.
6. Singh, G., Brar, P.S. and Dha, R.K. 2016. Exploiting yield potential in cucumber (Cucumis sativus L.) through heterosis breeding. Plant Gene and Trait, 7: 1-5.
7. Singh, S.K., Singh, S.V. and Srivastava, J.P. 2014. Heterosis and inbreeding depression for yield and its component traits in cucumber. Agriways, 2: 47-51.
Received : December, 2017; Revised : April, 2018; Accepted : May, 2018

337
Indian J. Hort. 75(2), June 2018: 337-340
Amaranth is one of the most important leafy vegetables of tropical and subtropical parts of the world. The leaves and tender stems provide cheap but rich source of vitamins A and C and elements like N, P, K, Ca, Mg, Fe, Na and Zn (Peter et al., 3). Being a C4 plant, it is highly efficient in biomass production. Among the different species of amaranth, Amaranthus tricolor L. is the most commonly grown species in India. The crop is grown almost round the year in Eastern Plateau and Hill Region of India. There is no report of recommended stable and high yielding cultivar of vegetable amaranth for Eastern Plateau and Hill Region. In this context, a large number of germplasm of vegetable amaranth were collected from different parts of the country and evaluated at ICAR Research Complex for Eastern Region Research Centre, Ranchi, Jharkhand which is located in Eastern Plateau and Hill Region. This resulted in isolation of 12 promising genotypes. The stability parameters have been studied by Shukla and Singh (4) for foliage yield parameters in vegetable amaranth under northern Indian condition of Lucknow, Uttar Pradesh. However, there is no information on stability of yield of greens (leafy shoots) and its components in vegetable amaranth in Eastern Plateau and Hill Region of India. With this background, the promising genotypes of vegetable amaranth were evaluated to identify a few stable and high yielding genotypes to be suitable for commercial cultivation in Eastern Plateau and Hill Region of India through stability analysis.
Twelve genotypes of vegetable amaranth viz., HAMTH-5, HAMTH-9, HAMTH-13, HAMTH-15,
HAMTH-16, HAMTH-21, HAMTH-24, HAMTH-29, HAMTH-33, HAMTH-42, HAMTH-43 and HAMTH-48 collected from Jharkhand, Bihar, West Bengal and NBPGR Regional Station, Vellanikkara, Thrissur, Kerala and two released varieties Pusa Lal Chaulai and Pusa Kirti collected from Indian Agricultural Research Institute were grown during summer season (February-April) of 2008, 2010 and 2011. An experiment on each environment (year) was conducted in Randomized Block Design with 3 replications. A spacing of 30 cm × 3-4 cm was maintained. Observations on a set of nine agro-morphological characters viz., days to 1st clipping, girth of stem, length of internode, length of lamina, width of lamina, leaf-stem ratio, number of clippings, duration of harvest and total yield of greens (leafy shoots)/plot (1.8 m2) were recorded. The total yield of greens/plot was converted into t/ha. Ten randomly selected leafy shoots were used for recording data on girth of stem, length of internode, length of lamina and width of lamina. The data were analyzed statistically for stability parameters based on Eberhart and Russell (1) model.
The analysis of variance of pooled data indicated highly significant/significant differences among 14 genotypes of vegetable amaranth and the environments for all the nine characters studied. However, stability analysis of variance of mean data indicated significant/highly significant differences among the genotypes for length of internode, length of lamina and leaf-stem ratio. The environment + G × E interactions were highly significant when tested against pooled error for all the characters which satisfied the requirement of stability analysis
Stability of yield and its components in vegetable amaranth R.S. Pan* and A.K. Singh
ICAR Research Complex for Eastern Region Research Centre, Ranchi 834 010, Jharkhand
ABSTRACTAn experiment was conducted during summer season (February-April) of 2008, 2010 and 2011 at ICAR
Research Complex for Eastern Region Research Centre, Ranchi (Jharkhand, India) to study the stability parameters viz., regression coefficient (bi) and mean square deviations (s2di) from linear regression, along with per-se performance of 14 lines/varieties of vegetable amaranth (Amaranthus tricolor L.) for nine yield related characters. The line HAMTH-15 (19.79 t/ha) was the top yielder of greens/ha, stable and suitable for favourable environment. The line was also better performing, stable and suitable for favourable environment for length of internode (6.16 cm), length of lamina (9.23 cm) and width of lamina (6.34 cm) and for unfavourable environment for girth of stem (0.64 cm) and leaf-stem ratio (1.05). The line HAMTH-13 was also very promising, stable and suitable for unfavourable environment for yield of greens (17.43 t/ha).Key words: Amaranthus tricolor, stability parameters, regression coefficient.
Short Communication
*Corresponding author's E-mail: [email protected]
DOI : 10.5958/0974-0112.2018.00057.9

338
Indian Journal of Horticulture, June 2018
i.e., the genotypes interacted considerably with the environment in expression of the characters. Similar results were reported by Varalakshmi (7) in her study on stability analysis of five quantitative traits in 14 vegetable amaranth lines. Sharma et al. (5) and Varalakshmi and Pratap Reddy (8) also observed significant differences for environments and G × E interactions for yield characters in their studies in grain amaranth. Highly significant mean sum of squares due to environment (linear) for all the characters except width of lamina indicated considerable differences among the environments and their predominant effects on the characters. This was due to variation in weather conditions during different years and locations. Shukla and Singh (4) also observed highly significant mean sum of squares due to environment and environment + G × E interaction in their study on stability of foliage yield in vegetable amaranth (Amaranthus tricolor L.). Non-significant linear component of G × E interactions and highly significant pooled deviation for all the characters except length of internode indicated non-linear response of the genotypes due to environmental changes and role of unpredictable component of G × E interactions towards differences in stability of the genotypes. Kishore et al. (2) also reported significant pooled deviation for seed yield
traits in stability analysis of eight diverse genotypes of grain amaranth (Amaranthus hypochondriacus L.). However, even for unpredictable traits, prediction can still be made on considering stability parameters of individual genotypes (Singh et al., 6).
Eberhart and Russell (1) suggested an ideal genotype as one having high mean performance, regression coefficient (bi) near unity and deviation from regression (s2di) near zero. The line HAMTH-48 took 39 days for 1st clipping which was earlier than population mean (43 days) (Table 1a). The line recorded bi value <1 and very less and non-significant s2di value which indicated its stability and adaptation to unfavourable environment.
The lines HAMTH-29 (0.67 cm), HAMTH-42 (0.66 cm) and HAMTH-15 (0.64) performed better than population mean (0.63 cm) in respect of girth of stem. HAMTH-42 and HAMTH-15 recorded bi values <1 and zero s2di values which indicated their stability and adaptation to unfavourable environment. HAMTH-29 recorded bi value >1 and zero s2di value which indicated its stability and adaptation to specific favourable environment. The lines HAMTH-48 (6.37 cm), HAMTH-15 (6.16 cm), HAMTH-29 (5.68 cm) and HAMTH-42 (5.63 cm) performed better than population mean (5.10 cm) in respect of length of internode. HAMTH-48, HAMTH-15 and HAMTH-42
Table 1a: Stability parameters for yield and its contributing characters in vegetable amaranth.
Accession Days to 1st clipping Girth of stem (cm) Length of internode (cm)X bi S2di X bi S2di X bi S2di
1. HAMTH-5 44.3 1.17 0.10 0.46 0.97* 0.00 3.59 0.86 1.122. HAMTH-9 44.0 1.12 -0.35 0.61 1.75* 0.01* 3.93 0.73 -0.113. HAMTH-13 44.1 1.14 -0.28 0.63 0.22* -0.00 5.40 0.82 1.194. HAMTH-15 44.1 1.14 -0.28 0.64 -0.22* 0.00 6.16 1.27 0.455. HAMTH-16 44.1 1.14 -0.28 0.63 1.33* 0.00 4.91 1.32 0.116. HAMTH-21 41.3 0.85 11.46** 0.79 0.64* 0.06** 4.89 0.85 -0.457. HAMTH-24 44.3 1.17 0.10 0.70 0.70* 0.01* 4.46 1.05 -0.328. HAMTH-29 43.0 0.96 2.89** 0.67 1.60* -0.00 5.68 0.87 -0.449. HAMTH-33 42.1 0.82 11.58** 0.61 2.37** 0.00 4.99 1.03 -0.4210. HAMTH-42 43.2 1.00 1.57* 0.66 0.55* -0.00 5.63 1.25 -0.2511. HAMTH-43 43.7 1.08 -0.23 0.46 1.07* 0.00 5.08 1.26 -0.3312. HAMTH-48 39.0 0.48 0.45 0.73 0.48* 0.02* 6.37 1.16 0.9513. Pusa Lal Chaulai 41.3 0.85 11.46** 0.67 0.99* 0.09** 5.08 0.53 -0.0914. Pusa Kirti 43.3 1.01 1.04* 0.62 1.50* -0.00 5.20 0.93 -0.07General mean 43.0 0.63 5.10SE (Mean) 1.26 0.10 0.52SE of bi 0.17 1.50 0.24
*Significant at 0.05, **Significant at 0.01 probability level

339
Stability Studies in Vegetable Amaranth
recorded bi values >1 and very low/negative and non-significant s2di values which indicated their stability and adaptation to specific favourable environment. HAMTH-29 recorded bi value <1 and negative and non-significant s2di value which indicated its stability and adaptation to unfavourable environment.
The lines HAMTH-16 (9.53 cm), HAMTH-15 (9.23 cm), HAMTH-24 (8.15 cm) and HAMTH-29 (7.98 cm) performed better than population mean (7.85 cm) in respect of length of lamina (Table 1b). HAMTH-16 and HAMTH-15 recorded bi values >1 and very low and non-significant s2di values which indicated their stability and adaptation to specific favourable environment. HAMTH-24 and HAMTH-29 recorded bi value <1 and very low and non-significant s2di value which indicated their stability and adaptation to unfavourable environment. The lines HAMTH-15 (6.34 cm), HAMTH-24 (5.65 cm), HAMTH-29 (4.97 cm) and HAMTH-48 (4.89 cm) performed better than population mean (4.79 cm) in respect of width of lamina. HAMTH-15 and HAMTH-48 recorded bi values >1 and negative/very low and non-significant s2di values which indicated their stability and adaptation to specific favourable environment. HAMTH-24 and HAMTH-29 recorded bi value <1 and negative/very low and non-significant s2di value which indicated their stability and adaptation to unfavourable environment.
The line HAMTH-15 (1.05 cm) performed better than population mean (0.86 cm) in respect of leaf-stem ratio. The line recorded bi value <1 and zero s2di value which indicated its stability and adaptation to unfavourable environment.
The line HAMTH-9 (3.55) performed better than population mean (3.46) in respect of number of clipping (Table 1c). The line recorded bi value <1 and almost zero and non-significant s2di value which indicated its stability and adaptation to unfavourable environment. The lines HAMTH-48 (35.22 days) and HAMTH-21 (34.55 days) performed better than population mean (32.61 days) in respect of duration of harvest. Both the lines recorded bi value <1 and very low and non-significant s2di values which indicated their stability and adaptation to unfavourable environment. The lines HAMTH-15 (red leaved; 19.79 t/ha) and HAMTH-13 (green leaved; 17.43 t/ha) recorded total yield of greens (leafy shoots) more than population mean (16.36 t/ha). HAMTH-15 recorded bi value >1 and negative and non-significant s2di value which indicated its stability and adaptation to specific favourable environment whereas HAMTH-13 recorded bi value<1 and negative and non-significant s2di value which indicated its stability and adaptation to unfavourable environment. Both the leaf amaranth lines HAMTH-15 (red leaved) and HAMTH-13 (green
Table 1b: Stability parameters for yield and its contributing characters in vegetable amaranth.
Accession Length of lamina (cm) Width of lamina (cm) Leaf-stem ratioX bi S2di X bi S2di X bi S2di
1. HAMTH-5 6.66 1.35 0.02 4.18 3.72** -0.06 1.30 3.07 0.01*2. HAMTH-9 8.02 1.20 1.65* 4.82 -2.42** 0.29 1.02 2.29 0.11**3. HAMTH-13 6.93 0.90 -0.12 4.06 -0.72** -0.12 0.73 0.62** -0.004. HAMTH-15 9.23 1.46 -0.18 6.34 13.07** -0.09 1.05 0.09** 0.005. HAMTH-16 9.53 1.18 -0.22 6.11 13.00** 0.52* 1.45 0.11** 0.50**6. HAMTH-21 8.72 0.67 5.34** 5.60 -2.34** 1.93** 0.95 0.66** 0.03**7. HAMTH-24 8.15 0.80 0.15 5.65 -4.78** -0.10 1.14 2.52 0.07**8. HAMTH-29 7.98 0.65 0.11 4.97 -8.45** 0.23 0.58 0.70** 0.02**9. HAMTH-33 7.48 0.22 0.37 4.14 -3.98** -0.14 0.58 -0.27** 0.0010. HAMTH-42 7.46 0.88 -0.02 3.88 -1.72** -0.12 0.71 0.42** 0.05**11. HAMTH-43 6.17 1.29 -0.15 3.50 4.20** -0.14 0.75 1.47** 0.03**12. HAMTH-48 8.12 1.29 2.20** 4.86 2.96** 0.08 0.61 1.12** 0.11**13. Pusa Lal Chaulai 7.53 0.81 1.95** 4.51 -1.03** 1.90** 0.60 0.52** 0.01*14. Pusa Kirti 7.86 1.24 0.27 4.48 2.49** 0.17 0.59 0.63** -0.00General mean 7.85 4.79 0.86SE (Mean) 0.74 0.47 0.19SE of bi 0.39 7.02 1.07
*Significant at 0.05, **Significant at 0.01 probability level

340
Indian Journal of Horticulture, June 2018
Table 1c: Stability parameters for yield and its contributing characters in vegetable amaranth.
Accession Number of clipping Duration of harvest (days) Total yield of greens (t/ha)X bi S2di X bi S2di X bi S2di
1. HAMTH-5 3.33 1.12 0.02 31.33 1.16 3.50 13.52 0.93 -0.892. HAMTH-9 3.55 0.95 0.05 32.66 0.99 -3.23 15.36 0.97 -0.463. HAMTH-13 3.44 1.24 0.19** 31.33 1.06 42.44** 17.43 0.75 -0.944. HAMTH-15 3.44 1.04 -0.02 32.55 1.00 -3.19 19.79 2.18** -0.885. HAMTH-16 3.33 1.12 0.02 31.55 1.13 1.43 14.78 0.95 9.24**6. HAMTH-21 3.55 0.55 0.34** 34.55 0.81 2.43 18.17 1.11 25.94**7. HAMTH-24 3.44 0.84 0.15* 31.88 1.07 -3.10 12.53 1.04 4.28*8. HAMTH-29 3.66 0.86 0.28** 32.11 1.03 -1.64 16.66 0.52 8.95**9. HAMTH-33 3.66 0.86 0.28** 31.22 1.15 -3.01 17.12 0.63 14.48**10. HAMTH-42 3.66 0.86 0.28** 34.33 0.78 7.42 16.96 0.60 13.87**11. HAMTH-43 3.33 1.12 0.02 31.66 1.12 0.54 17.96 1.97 5.92**12. HAMTH-48 3.33 1.12 0.02 35.22 0.69 3.85 17.34 -0.26** 6.23**13. Pusa Lal Chaulai 3.44 0.84 0.15* 33.77 0.91 11.98* 15.79 1.39** -0.5214. Pusa Kirti 3.22 1.41 -0.02 32.33 1.03 -2.82 15.64 1.16** -0.73General mean 3.46 32.61 16.36SE (Mean) 0.28 1.90 1.87SE of bi 0.57 0.23 0.44
*Significant at 0.05, **Significant at 0.01 probability level
leaved) can be recommended for cultivation as stable and high yielding genotypes.
REFERENCES1. Eberhart, S.A. and Russell, W.A. 1966. Stability
parameters for comparing varieties. Crop Sci. 6: 36-40.
2. Kishore, N., Dogra, R.K., Thakur, S.R. and Chahota, R.K. 2007. Stability analysis for seed yield and component traits in amaranthus (Amaranthus hypochondriacus L.) in high altitude dry temperate regions. Indian J. Genet. 67: 153-55.
3. Peter, K.V., Nirmaladevi, S. and Sadhan Kumar, P.G. 2009. Advances in improvement of leaf vegetables.(In) Leafy Vegetable Research in India, a Compendium on Brainstorming Session on Leafy Vegetables held on 12th February, 2009 at Tamil Nadu Agricultural University, Coimbatore, Tamil Nadu, India, Pugalendhi et al. (compiled), pp 52-66.
4. Shukla, S. and Singh, S.P. 2003. Stability of foliage yield in vegetable amaranth (Amaranthus tricolor L.). Indian J. Genet. 63: 357-58.
5. Sharma, J.K., Lata, S. and Sharma, R.P. 2001. Study for grain yield in amaranth (Amaranthus hypochondriacus L.). Indian J. Agric. Sci. 71: 319-24.
6. Singh, J.V., Paroda, R.S., Arora, R.N. and Saini, M.L. 1991. Stability analysis for green and dry fodder yield in cluster bean. Indian J. Genet. Pl. Br. 51: 345-48.
7. Varalakshmi, B. 2003. Phenotypic stability for economic traits in vegetable amaranth (Amaranthus tricolor). Indian J. Agric. Sci. 73: 114-15.
8. Varalakshmi, B. and Pratap Reddy, V.V. 2002. Genotype × Environment interactions for some quantitative characters in grain amaranth (Amaranthus hypochondriacus L.). Indian J. Agric. Res. 36: 216-18.
Received : February, 2017; Revised : April, 2018; Accepted : May, 2018

341
Elephant foot yam (Amorphophallus paeoniifolius (Dennst.) Nicolson) is a tropical tuber crop that offers excellent scope for adoption in the tropical countries as a cash crop due to its production potential and popularity as a vegetable in various delicious cuisines. It is a crop of southeast Asian origin, and grows in wild form in the Philippines, Malaysia, Indonesia and south-east Asian countries. It is considered as a famine food in the Pacific Islands. It is becoming very much popular in different parts of India due to its palatability and better cooking quality (Srinivas and Ramanathan, 6; Venkatesan et al., 7). There are different studies that quantified the impact of climate change on different crops and also on tuber crops like cassava, yams and sweet potato using different crop growth models like GEPIC, EcoCrop etc. Jarvis et al. (4) studied the impact of 2030 climate on cassava and other staple food crops like maize, millets, sorghum, banana and beans of Africa using EcoCrop model. Mijiyawa et al. (5) analyzed the climatic and crop yield data using correlation analytical techniques, multiple regression and trend analysis in order to evaluate the impact of climate on the yield of the most important tuber crops in Kwara State, Nigeria viz: cassava, yam, and sweet potato. The study of the impact of climate change on root crops is crucial because these food crops are vital to the rural poor and are a cash crop in several
countries. The aim of present study was to develop an elephant foot yam (EFY) presence point map based on expert knowledge, to assess what are the projected climatic changes in EFY growing areas of India, to calibrate the EcoCrop model and to model the suitability of current EFY growing areas and to study the impact of future climate (2030 climate) on climate suitability of EFY in India.
Current and future climate data were downloaded from the WorldClim dataset (Hijmans et al., 2), freely available for download from the website http://www.WorldClim.org. The data downloaded for this study was at the resolution of 30 arc-seconds, restricted to India. The data downloaded were the monthly time series of maximum, minimum and mean temperature and total monthly precipitation for SRES-A1B emission scenarios of the 21st century simulations from 22 different coupled global climate models (GCMs) used in the IPCC Fourth Assessment Report (IPCC, 3) for the period 2030s (2020-2049), centred in 2035. Change in climate was calculated by subtracting the current climate grid of India from the future climate grid. The GCM specific changes in total annual precipitation and annual mean temperature were extracted for the EFY growing regions in India for further analysis. The basic mechanistic model (EcoCrop) we implemented uses environmental ranges as inputs to determine the main niche of a crop and then produces a suitability index as output.
Projected climate changes and environment suitability of foot yam in major growing areas of India
G. Byju*, Sabitha Soman and M. VaniICAR-Central Tuber Crops Research Institute, Sreekariyam, Thiruvananthapuram 695 017, Kerala
ABSTRACTThe projected climatic changes were in the major elephant foot yam growing environments of India which
were identified based on expert knowledge and from literature review; and also calibrated and evaluated the EcoCrop model, of FAO to study the impact of 2030 climate the suitability of elephant foot yam in the major growing environments of India. The current and future climatic projections of 22 Global Circulation models from the SRES-A1B emission scenario were used for the study. A total of 9345 unique coordinates, as points was obtained as elephant foot yam presence points in India. The projected change in annual mean temperature and total annual precipitation in the major growing areas ranged from 0.9 to 1.20C and from 19 to 68 mm respectively. The calibrated data were used to drive the EcoCrop model to find out the suitability of current and future climatic conditions. The change in suitability for all the 22 GCMs used was calculated on pixel basis and the mean suitability change indicate that elephant foot yam is actually positively impacted in the current growing areas of India with 0.8 to 9.6% changes in climate suitability. The overall suitability change in the major elephant foot yam growing areas showed that the crop is potentially highly resilient to future climatic changes. Key words: Amorphophallus paeoniifolius, temperature, participation, EcoCrop.
Short Communication
*Corresponding author's email: [email protected]
DOI : 10.5958/0974-0112.2018.00058.0
Indian J. Hort. 75(2), June 2018: 341-344

342
Indian Journal of Horticulture, June 2018
The calibration of EcoCrop model for EFY was done following the procedure given by Villegas et al. (8). Crop suitability modeling involved the evaluation of the model and the usage of the selected ecological parameter set(s) to run the model using certain climate scenario(s). All the suitability analysis was carried out by using DivaGIS and ArcGIS softwares. For each projection, the change in suitability was calculated on a pixel basis and the following impact matrices were derived for EFY growing regions for each GCM specific predictions.a. The overall suitability change (average % change
of all pixels)b. The average suitability change in positively
impacted areas (ie., areas increasing suitability)c. The average suitability change in negatively
impacted areas (ie., areas decreasing suitability)Out of the 22 GCMs studied, only one GCM viz.
MRI-CGCM2.3.2A predicted that the temperature will remain stable or reduce in some of the current EFY growing areas with annual mean temperature change from -0.5 (Jharkhand) to +0.3º C (Kerala). A maximum increase of 1.7º C was predicted by different GCMs for Bihar (GFDL-CM2.1 and GISS-MODEL-EH), Jharkhand (GISS-MODEL-EH and GISS-MODEL-ER) and Gujarat (MIROC3.2-HIRES). The highest and lowest mean temperature changes for Kerala (+1.4 to 0.3º C) was predicted by the GCMs, MIROC3.2-HIRES and MRI-CGCM2.3.2A respectively. An increase in annual mean temperature of 1.3º C for Andhra Pradesh was predicted by two GCMs viz. INM-CM3.0 and IPSL-CM4 and the lowest increase of 0.2º C was predicted by MRI-CGCM2.3.2A. For West Bengal, the highest and lowest changes in annual mean temperature (+1.5 to -0.2º C) were predicted by the GCMs GISS-MODEL-ER and MRI-CGCM2.3.2A respectively.
The average of the 22 different GCMs under the SRES A1B emission scenario showed that by 2030, all the major EFY growing states in India will have an increase in their annual mean temperature and the predicted increase ranged between 0.9 and 1.2º C. Out of the 50 districts selected as current growing areas of EFY, about 40% of districts showed an increase in annual mean temperature of 0.9º C, 28% districts showed 1º C increase, 18% districts showed 1.1º C increase and the remaining 14% districts showed 1.2º C increase in annual mean temperature. The highest increase was observed in the Gumla district of Jharkhand (1.3º C). For the major EFY producing states of Andhra Pradesh, Kerala, and West Bengal, the change in annual mean temperature ranged from 0.9 to 1.1º C 0.9 to 1.0º C and 0.9 to 1.1º C respectively. In other growing areas, the mean increase in temperature was 1.1º C for Bihar, 1.2º C
for Gujarat and Jharkhand, 1.0º C for Karnataka and 0.9º C for Tamil Nadu.
Out of the 22 GCMs studied, three GCMs viz. CCCMA-CGCM3.1 (T47), NCAR-CCSM3.0 and UKMO-HADCM3 predicted an increase in total annual precipitation in all the EFY growing states with a range of 44 (Tamil Nadu) to 235 mm (Andhra Pradesh), from 6 (West Bengal) to 153 mm (Jharkhand) and from 41(Karnataka) to 124 mm (Andhra Pradesh) respectively. The GCM, IAP-FGOALS1.0-G predicted that by 2030 all the EFY growing states will experience a decrease in total annual precipitation with values ranging from -129 (Kerala) to -24 mm (Jharkhand) and the remaining GCMs showed varying precipitation changes. The highest annual precipitation increase was observed for Bihar ranging from 88 to 380 mm with mean value of 241 mm showed by the GCM ‘GFDL-CM2.0’.
The average of the 22 GCMs showed that by 2030 all the major EFY growing states will have an increase in total annual precipitation with values ranging from 19 (Andhra Pradesh) to 68 mm (Tamil Nadu). In the major growing areas of Andhra Pradesh, Kerala and West Bengal, the annual precipitation increase ranged from 12 to 19 mm, 5 to 51 mm and 17 to 33 mm respectively. The increase of total annual precipitation in other growing areas ranged from 12 to 19 mm for Bihar, 20 to 22 mm for Gujarat, 17 to 29 mm for Jharkhand, 15 to 30 mm for Karnataka and 5 to 68 mm for Tamil Nadu. Predicted changes (average of 22 GCMs) in annual precipitation for the major EFY growing districts ranged between 10 and 57 mm/year with the minimum increase in the Wayanad district of Kerala (10 mm) and the maximum increase was observed in the Pashchim Champaran district of Bihar (57 mm).
The current suitability of the EFY growing regions was studied using the calibrated ecological parameters in EcoCrop. According to the EcoCrop model, highly sui areas for growing EFY (> 80 %) were predicted to be located in the states of Andhra Pradesh, Gujarat, Kerala, Karnataka, Tamil Nadu and West Bengal, matching the known distribution of the crop. All the areas selected as EFY presence points showed a suitability of above 60 per cent by EcoCrop model. The current suitability prediction showed that the suitability of all districts in Kerala ranged from 60 to 100%. The East Godavari and West Godavari districts of Andhra Pradesh showed 80 to 100% suitability. Almost all the districts selected as EFY growing regions in West Bengal showed a suitability range of 80 to 100%. A suitability range of below 40% was observed in the northern and northeastern states of India which are not major growing areas of elephant foot yam.

343
Climate changes and Foot Yam Environment Suitability
The future predictions on EFY climatic suitability showed that, on an average, EFY production in India is favored by climate change or there are not much decrease in climatic suitability of EFY by 2030 (Fig. 1). The future suitability predictions in the major EFY growing areas were almost similar as in the current suitability predictions. In the states of Andhra Pradesh, Kerala, Gujarat, Jharkhand and Tamil Nadu, the future suitability percentage is almost similar as in the current condition. A little increase in suitability for growing EFY by 2030 was observed in some districts of Bihar, Karnataka and West Bengal. Almost all the districts in West Bengal showed 80 to 100% suitability for growing EFY in future. In the state of Bihar, the current suitability for all the districts was in the range of 60 to 80%, whereas in future some districts showed increase in their suitability from 80 to 100%.
The individual GCM predicted changes in suitability is presented in Table 1. The overall suitability change in the EFY growing regions ranged between -5.3 (MRI-CGCM2.3.2A) and 12.0 % (NCAR-PCM1) with suitability change in positively and negatively impacted areas ranged from 5.0 (IAP-FGOALS1.0-G) to 19.8 % (NCAR-PCM1) and from -28.9 (IAP-FGOALS1.0-G) to -2.9 % (UKMO-HADCM3) respectively. Only one GCM viz., MRI-CGCM2.3.2A predicted a decrease in suitability for EFY in the major growing areas of India. All other GCMs predicted an increase in suitability ranging from 0.7 to 12.0 % for all the EFY growing areas by 2030. In the case of Andhra Pradesh, Kerala
Fig. 1. Future suitability of EFY (average of 22 GCMs) in India predicted by EcoCrop model
Table 1. Regional changes in EFY suitability for individual GCMs.
GCM OSC* SCPIA* SCNIA*CCCMA-CGCM3.1 (T47) 2.3 9 -4.6CCMA-CGCM3.1 (T63) 5.6 11 -13.8CNRM-CM3 2.3 6.9 -5.5CSIRO-MK3.0 6.1 9.5 -5.2CSIRO-MK3.5 6.3 9.5 -5GFDL-CM2.0 6.8 10.9 -12.9GFDL-CM2.1 8.6 12 -4GISS-AOM 6.5 9.8 -5.2GISS-MODEL-EH 8.9 12.1 -4.6GISS-MODEL-ER 5.9 10.2 -6.6IAP-FGOALS1.0-G 1.2 5 -28.9INGV-ECHAM4 5.9 9.8 -14.4INM-CM3.0 8.9 12.3 -3.7IPSL-CM4 4.8 8 -6.6MIROC3.2-HIRES 8.7 14.4 -9.7MIROC3.2-MEDRES 4.6 10.3 -16.3MPI-ECHAM5 0.7 5.9 -4.2MRI-CGCM2.3.2A -5.3 6.4 -9.3NCAR-CCSM3.0 10.9 16.7 -8.5NCAR-PCM1 12 19.8 -4.2UKMO-HADCM3 5.7 9.5 -2.9UKMO-HADGEM1 3.6 8.4 -19.4
OSC* - overall suitability change, SCPIA*- suitability change in positively impacted area, SCNIA*- suitability change in negatively impacted area
and West Bengal, where majority of the EFY area is located in India, only one GCM, ‘MRI-CGCM2.3.2A’ predicted a negative suitability change for Andhra Pradesh (-1.1), seven GCMs viz., CCCMA-CGCM3.1 (T47), CCMA-CGCM3.1 (T63), CNRM-CM3, CSIRO-MK3.0, MIROC3.2-HIRES, MIROC3.2-MEDRES and NCAR-CCSM3.0 predicted negative suitability change for Kerala ranging from -8.5 to -0.4%, for West Bengal, three GCMs viz., MRI-CGCM2.3.2A, MPI-ECHAM5 and CCCMA-CGCM3.1 (T47) predicted negative suitability change ranging from -9.8 to -0.9% and the remaining predicted a positive suitability change for these three states.
The overall suitability changes in all the EFY growing states ranged from 0.8 (Kerala) to 9.6 % (Jharkhand). The change in suitability from current to future climatic conditions showed that there are no severe impacts for EFY suitability by 2030. The predicted increase in suitability for the major growing states was observed to be 9.6 % for Jharkhand, for

344
Indian Journal of Horticulture, June 2018
Gujarat 8.8 % increase in suitability, for West Bengal 7.1 % increase, for Tamil Nadu 6.4 % increase, for Bihar 6.3 % increase, for Karnataka 4.8 % increase, for Andhra Pradesh 1.6 % increase, for Kerala 0.8 % increase. The average of the 22 GCMs showed that the overall suitability change of all the major EFY growing states are positive indicating the increase in suitability of EFY in future climatic conditions. Different authors reported the beneficial characteristics and resilience of other tuber crops like cassava in the context of climate change (Ceballos et al., 1; Jarvis et al., 4).
The changes in annual mean temperature ranged between 0.9 and 1.2ºC. The highest increase was observed in the Gumla district of Jharkhand (1.3ºC). According to the prediction of the average of 22 GCMs, the major EFY producing states like Andhra Pradesh, Kerala, and West Bengal, the change in annual mean temperature ranged from 0.9 to 1.1ºC 0.9 to 1.0ºC and 0.9 to 1.1ºC respectively. The change in total annual precipitation ranged from 19 (Andhra Pradesh) to 68 mm (Tamil Nadu). In the major growing states like Andhra Pradesh, Kerala and West Bengal, the annual precipitation increase ranged from 12 to 19 mm, 5 to 51 mm and 17 to 33 mm respectively. The minimum increase in precipitation was observed in the Wayanad district of Kerala (10 mm) and the maximum increase was observed in the Pashchim Champaran district of Bihar (57 mm).
REFERENCES1. Ceballos, H., Ramirez, J., Bellotti, A.C., Jarvis,
A., Alvarez, E. 2011. Adaptation of cassava to changing climates. In: Crop adaptation to climate change, Chapter 16. Shyam, S.Y., Robert, J.R., Jerry, L.H., Hermann, L.C., Anthony, E.H. (eds.). John Wiley and Sons.
2. Hijmans, R.J., Cameron, S.E., Parra, J.L., Jones, P.G. and Jarvis, A. 2005. Very high resolution interpolated climate surfaces for global land areas. Int. J. Climatol. 25: 1965-978.
3. IPCC. 2007. IPCC Fourth Assessment Report: Climate Change 2007 (AR4). IPCC, Geneva, Switzerland.
4. Jarvis, A., Villegas, J.R., Herrera Campo, B.V. and Navarro-Racines, C. 2012. Is cassava the answer to African climate change adaptation?. Tropical Plant Biol. 5: 9-29.
5. Mijiyawa, Y., Akpenpuun, T.D. and Amao, B.R. 2015. Climate change effect on tuber crops yield in the tropics. Int. J. Eng. Tech. Innov. 2: 10-13.
6. Srinivas, T. and Ramanathan, S. 2005. A study on economic analysis of elephant foot yam production in India. Agric. Econ. Res. Rev. 18: 241-52.
7. Venkatesan, K., Saraswathi, T., Jansirani, P., Kamalkumar, R. and Sujatha, R. 2013. Integrated nutrient management improves yield and quality in elephant foot yam. J. Root Crops 39: 257-59.
8. Villegas, J.R., Jarvis, A. and Laderach, P. 2013. Empirical approaches for assessing impacts of climate change on agriculture: The EcoCrop model and a case study with grain sorghum. Agric. For. Meteorol. 170: 67-78.
Received : July, 2016; Revised : February, 2018; Accepted : May, 2018
345
Marigold (Tagetes erecta L) is a multipurpose flowering plant belonging to the Asteraceae family. Its habit of free flowering, short duration to produce marketable flowers, wide spectrum of attractive colour, shape, size and good keeping quality attracted the attention of flower growers. In India, it is one of the most commonly grown flowers used in religious and social functions. Besides, there is great demand for marigold in food colouring industry, aromatherapy, therapeutic, cosmetic industry and traditional medicine. Presently, a wide range of neutral genetic markers is available for assessment of molecular characterization in plants. Among different classes of molecular markers, Simple Sequence Repeat (SSR) or microsatellite marker is one of the most effective and widely used marker types for assessment of molecular characterization in crops considering their co dominant inheritance along with their reproducibility, multi-allelic nature, relative abundance and high genome coverage. However, in Tagetes sps, only limited SSR markers have been developed and there is an urgent need to identify a set of microsatellite nuclear markers. The genomic SSRs (gSSRs) reported for Chrysanthemum (Li et al.,6) was tested as they belong to the same family asteraceae. gSSRs of carrot, which belongs to different taxa, were also used to test cross taxa amplification. The present study is an endeavor to evaluate the cross-amplification of chrysanthemum and carrot gSSRs primers in marigold and to evaluate the utility of selected markers in discriminating diverse marigold germplasm.
The present study was undertaken in molecular characterization laboratory in the division of Plant Genetic Resources, ICAR-Indian Institute of Horticultural Research, Bengaluru, India during 2014-15. Twelve diverse genotypes viz., homozygous fertile (single and double flower types); apetaloid sterile and petaloid sterile (vegetatively propagated types) were used. Genomic DNA was extracted from 2g of young leaves using CTAB method (Doyle and Doyle, 4) with modifications. The PCR protocol reported for carrot SSRs (Cavagnaro et al., 2) and Chrysanthemum SSrs (Li et al., 6) was used without any modification. The amplicon data generated by transferable primers were analyzed using using software NTSYS-PC version 2.1 (Rohlf et al., 7). The binary data was used to generate Jaccard’s similarity coefficient (Jaccard et al., 5). These similarity coefficients were used to construct a dendrogram depicting genetic relationships among the genotypes by employing the Unweighted Paired Group Method of Arithmetic Averages (UPGMA) algorithm and SAHN clustering. Gene diversity (Hj), also termed as the polymorphism information content (PIC) and was calculated for all the amplifying SSR. The expected heterozygosity estimated for each individual locus of the 33 genomic SSRs assayed, 17 (9 Chrysanthemum and 8 Carrot) SSRs amplified fragments in all the 12 genotypes of marigold. Eight out of 10 (80%) carrot SSR primer pairs produced amplification in all genotypes and the number of alleles generated ranged from 1-3 (GSSR 3 & GSSR5). All the amplicons generated were monomorphic. The allele size ranged from 100-400 bp. Though transferability of carrot microsatellite markers was high, none of these markers were able to differentiate different genotypes. These cross
Cross amplification of SSR loci in marigold for molecular characterizationAnuradha Sane*, Madhuri Ghatke, Archana Gadre**, Tejaswini**
Division of Plant Genetic Resources, ICAR-Indian Institute of Horticultural Research, Hessaraghatta, Bengaluru 560 089, Karnataka
ABSTRACT The present study was undertaken to develop Simple Sequence Repeats in marigold by evaluating cross
amplification from related genera and other taxa as the availability of microsatellite primer is very limited in this crop. A total of 33 primer pairs from Chrysanthemum and carrot were used, of which nine from the former and eight from the latter were selected for generating amplicons. This work confirmed that microsatellite primers developed for a particular species can be used across genera within and between botanical families. The shortlisted primers were utilized to characterize diverse genotypes of marigold to understand the similarities and/or differences between them.Key words: Tagetes erecta, simple sequence repeats, male sterility systems
Indian J. Hort. 75(2), June 2018: 345-348
*Corresponding author's E-mail: [email protected]**Division of Ornamental Crops, ICAR-IIHR, Hessaraghatta, Bengaluru 560089
Short communication
DOI : 10.5958/0974-0112.2018.00059.2

346
Indian Journal of Horticulture, June 2018
taxa amplifiable markers can be used in marigold for characterisation as the number of available SSRs is limited to a few. Greater evolutionary distance between carrot and marigold has greatly decreased chance of successful amplification in terms of polymorphic markers. Studies have indicated that the number of SSRs amplified in a species was positively correlated with the phylogenetic relatedness of that species and the species from which the marker was signed (Saha, 8).
Nine out of 23 Chrysanthemum SSR primer pairs were used to screen 12 genotypes and scoring was considered for the primer pairs that generated amplicons in the expected base pair range (Li et al., 6) (Fig. 1). 4 primer pairs out of 9 showed polymorphism (44%) in at least one of the genotypes screened, 14 failed to amplify and 5 were monomorphic. These results clearly indicated that the primers selected in this study cross amplified across genera, and are moderately polymorphic based on fragment size differentiation. High levels of polymorphism associated with microsatellites are expected because of the unique mechanism responsible for generating microsatellite allelic diversity by replication slippage (Tautz and Renz, 9) rather than by simple mutations or insertions/deletions (Datta et al., 3).
Nine chrysanthemum SSR primers amplified scorable bands in the expected size range in all the marigold genotypes. A total of 21 alleles were amplified by the 5 microsatellite markers (Table 1). The number of alleles per locus varied from 1 (A33) to 3 (C12).PIC values ranged from 0.269 to
0.325. PIC values higher than 0.5 will be highly informative for genetic studies and are extremely useful in distinguishing the polymorphism rate of the marker at specific locus. The expected heterozygosity ranged from 0.337-1.0. These results confirm that cross amplification across the genera is possible in Asteraceae family, where chrysanthemum primers can be successfully used in Marigold. High amplification success was observed between genera indicating a great potential to use microsatellites and their flanking regions as a source of single- or low-copy nuclear sequences (Zhang & Hewitt,10). Hence, screening of SSR primers from different genera can lead to the development of SSR loci in crops where SSRs are not available.
Since carrot gSSRs resulted in monomorphic amplicons, the scored data of amplicons generated by chrysanthemum primers was utilized for estimating genetic distance using Jaccard coefficient and UPGMA algorithm. Based on genetic distance 12 genotypes were clustered into two major groups (Fig. 2). Arka Bangara, Arka Agni and Arka Alankara, all three are petaloid male sterile samples were found in one cluster as expected with close proximity. The rest which include apetaloid fertile, apetaloid sterile and homozygous fertile grouped together in the second cluster. In the second cluster, 9-3 (Fertile double types) and 1-2 (Apetaloid Fertile) shared 100% similarity. Similar is the case with 1-2 (Apetaloid Sterile) and R-7 (Apetaloid Sterile) also. R-7 (Apetaloid Fertile) and (Apetaloid Sterile) formed a sub cluster. Two homozygous fertile types viz., 9-4
Fig. 1. DNA profile of different male sterility systems using Chrysanthemum SSR Primers B05; Lane 1- 100bp Ladder; Lane 2- 9-4(64); Lane 3- 9-3(63); Lane 4-1-2; Lane 5-1-3; Lane 6-R-7; Lane 7-1-1; Lane 8-1-2; Lane 9-2-2; Lane 10-R-7; Lane 11- Arka Bangara; Lane 12- Arka Alankara; Lane 13- Arka Agni.

347
Cross Amplification of SSR Loci in Marigold
Table 1. Properties of polymorphic Chrysanthemum SSR used.
Primer ID Sequence (5’-3’) No. of alleles No. of polymorphic alleles
Size range of alleles (bp)
B05 F: CTCCTGCTTCCCTCTCCTCC R: CCATCTTGGGTCCATTTAG
2 0 231-283
B12 F:GATGCGAGCAAATGAGCC R: CGAACGACTGGACACGAC
2 0 156-229
B10 F:ACTAACCCACCATTCCACR: CAAATCCACCAAACCAAC
2 0 177-208
A31 F: TTGGTGGTAGTGGTGTG R: ACACACTATCTTCCACTTCT ’
2 2 145-336
C12 F: GCTCATTCCTCACATCT R:ATAAGGCTGAAGACGAG
3 3 115-213
A12 F: 5CTGTCAGTTAGCCGTTTTCGR: CCTCATTTGTAAGGTGTGTG
3 2 191-239
A33 F: ACACAAGTTAGGCGAGATAC R: CACACAGTCCCTAAAATCC
2 1 144-252
B20 F: ATAACGACCAACTCCCTTTCR: GTGTTATGATGGTGAAGTGG
3 2 120-394
C15 F: GCCGAAGAGTAAACAGAGR: CGAACACGACACAAATCC
2 0 200-261
Fig. 2. Dendrogram depicting genetic relationships between genotypes belonging to different male sterility systems.

348
Indian Journal of Horticulture, June 2018
(Fertile single types) and 9-3 (Fertile double types) were found in two different sub clusters indicating greater distance between the two.
It is, however, important to bear in mind that when using SSR markers across distantly-related species the amplification of a PCR product does not necessarily imply locus conservation, since size homoplasy, i.e. convergence in size of non-homologous fragments, may occur. Considering the possibility of this source of confusion, verification of the PCR product identity by sequencing has been suggested previously, particularly when working across genera and if there is uncertainty regarding the size range of the amplicons obtained (Barbara et al.,1). However, verification through sequencing may not be necessary if working within the same genus as the species from which the SSRs markers were developed.
Chrysanthemum primers generated information in different genotypes of marigold that can be used to categorize them based on alleles shared and genetic distance. Since very limited SSRs are available in this crop, this kind of cross amplification within a family can save a lot of time and capital. Although the number of loci tested generally remains small, there appears to be moderate cross species transferability.
ACKNOWLEDGEMENTAuthors thank ICAR, New Delhi for funding
Flagship programme on male sterility systems in horticultural crops
REFERENCES 1. Barbara, H. Palma-Silva, C. Paggi, G.M. 2007.
Cross-species transfer of nuclear microsatellite markers: potential and limitations. Mol. Ecol. 16, 3759–67.
2. Cavagnaro, P.F., Chung, S., Manin, S., Yildiz, M., Ali, A., Alessandro, M.S., Iorizzo. M., Senalik. D.A., Simon, P.W. 2011. Microsatellite isolation and marker development in carrot - genomic distribution, linkage mapping, genetic
diversity analysis and marker transferability across Apiaceae. BMC Genomics, 12, (online publication 1-20).
3. Datta, S., Mahfooz, S., Singh, P., Choudhary, A.K., Singh, F., Kumar, S. 2010. Cross-genera amplification of informative microsatellite markers from common bean and lentil for the assessment of genetic diversity in pigeonpea. Physiol Mol Biol Plants, 16: 123-34.
4. Doyle, J.J., Doyle, J.L. 1987. A rapid DNA isolation procedure from small quantities of fresh leaf tissue. Phytochem Bull. 19: 11-15.
5. Jaccard, P. 1908. Nouvelles recherches sur la distribution florale. Bull Soc Vaudoise Sci. 44: 223-70.
6. Li, Y.H., Luo, C., Wu, Z.Y., Zhang, X.H., Cheng, X., Dong, R, and Huang, C.L. 2013. Microsatellite Enrichment by Magnetic Beads in Chrysanthemum. Acta Hort. 977.
7. Rohlf, F. 1998. On applications of geometric morphometrics to studies of ontogeny and phylogeny. Syst Biol. 47: 147-58.
8. Saha, M.C., Mian, M.A.R., Eujayl, I., Zwonitzer,J,C., Wang, L. and May, G.D. 2004. Tall fescue EST-SSR markers with transferability across several grass species Theor Appl Genet. 109: 783-91.
9. Tautz, D. and Renz, M. 1984. Simple sequences are ubiquitous repetitive components of eukaryote genomes. Nucleic Acids Res. 12: 4127-83.
10. Zhang, D. X. and Hewitt, G. M. 2003. Nuclear DNA analyses in genetic studies of population: Practice problems and prospects. Mol Ecol. 12: 563-84.
Received : May, 2016; Revised : April, 2018; Accepted : May, 2018

349
DOI : 110.5958/0974-0112.2018.00060.9
Indian J. Hort. 75(2), June 2018: 349-351
Rosa hybrida L. belonging to family Rosaceae, is commercially important flower crop. Its flowers are also edible and have been used for centuries as food components, either in the fresh form or in processed products, as well as medicinal remedies of various illnesses. Rose petals have been consumed for many years in teas, cakes, and flavour extracts, as well as folk medicine to treat blood circulation disorders, and to control cancer growth (Shafei et al., 6). Many investigations have also revealed that roses contain a wide diversity of phenolic compounds such as gallic acid, catechin, epicatechin, kaempferol, rutin, myricetin, and quercetin that not only possess antioxidant activities but also exert antiallergic, anti inflammatory, antiatopic, antibacterial, antiviral, antifungal, antidepressant, and antistress effects (Boskabady et al., 1 and Ulusoy et al., 9). Phenolic compounds are a class of low molecular weight secondary plant metabolites. These compounds scavenge free radicals which are produced during cell metabolism [reactive oxygen species (ROS) or free radicals such as hydrogen peroxide, hydroxyl radical and singlet oxygen] that can lead to oxidative stress. Oxidative stress is associated with major chronic health problems like cancer, inflammation, neurodegeneration diseases, heart diseases, aging and also food deterioration. The antioxidant activity of phenolics is mainly attributed to their redox properties. Special attention has been paid to plants because they are very rich sources of phenolic compounds. However, there are only a few studies concerning the comparison of the phenolic composition of Indian
rose varieties. This study is aimed to evaluate the total phenolic content and its profiling in Indian rose varieties.
In the present investigation, 13 rose varieties, viz., Pusa Arun (dark red), Bhim (red), Nehru Centenary (dark red), Raktima (red), Pusa Bahadur (red), Ashwini (dark red), Dr S.S. Bhatnagar (dark red), Raktagandha (red), Pusa Ajay (pink), Pusa Virangana (red), Suryakiran (orange), Surkhab (red+white) and Rose Sherbet (deep pink) were used for the estimation of total phenolic content and its profiling. Fresh rose petals were collected in the morning hours from the Research Farm of the Division of Floriculture and Landscaping, ICAR-Indian Agricultural Research Institute, New Delhi.
The total phenols were estimated according to the procedure given by Singleton and Rossi (7). A 0.5 g sample of rose petal was extracted with 20 ml methanol (80%). The aliquot (1 ml) was taken in the test tubes and added with 2.9 ml of Folin and Ciocalteau’s Phenol Reagent (1N) and 0.5 ml of distilled water. The test tubes were then shaken well; then, 2 ml of sodium carbonate (20%) solution was added and kept for incubation at room temperature for 30 minutes. The colour developed was measured in spectrophotometer at 750 nm wavelength. Standard curve was drawn using gallic acid as standard. Different concentrations of gallic acid were prepared and O.D was read at 700 nm wavelength. The concentration of samples was calculated based on the standard curve.
Identification and characterization of phenolic compounds from Indian rose varieties was done using HPLC. Five standard stock solutions, catechin (500 μg/
Short communication
Characterization of phenolic compounds in petal extracts of rose Poonam Kumari*, D.V.S. Raju, Kanwar Pal Singh, K.V. Prasad** and Sapna Panwar
Division of Floriculture and Landscaping, ICAR- Indian Agricultural Research Institute, New Delhi 110 012
ABSTRACTThe experiment was carried out during 2015-16 to evaluate the phenolic content and its chemical composition
in rose petal extracts. Among 13 varieties tested, Ashwini recorded the highest phenolic content (427.59 mg GAE/100g FW) followed by Dr. S.S. Bhatnagar (379.24 mg GAE/100g FW) and Nehru Centenary (342.67 mg GAE/100g FW), whereas Pusa Ajay showed the lowest phenolic content (101.03 mg GAE/100g FW). High performance liquid chromatography (HPLC) analysis identified the presence of five major phenolic compounds in rose petal extract, viz. quercetin, catechin, epicatechin, rutin and 3-hydroxy cinnamic acid. From the present study it can be concluded that rose petals are rich in phenols and can be further utilised as natural source of antioxidants. Phenol rich varieties can be selected for processing extracts with health promoting properties or can be incorporated into functional foods with bioactive properties related to oxidative stress.Key words: Rosa hybrida, phenolics, antioxidants, HPLC.
*Corresponding author’s E-mail: [email protected] **ICAR-Directorate of Floricultural Research, Pune

350
Indian Journal of Horticulture, June 2018
ml), rutin (500 μg/ml), quercetin (500 μg/ml), epicatechin and 3-hydroxy cinnamic acid (500 μg/ml) were prepared in HPLC grade solvent mixture of acetonitrile/formic acid (1: 1; v/v) and filtered using membrane disc filter (0.45 μm). Solution (5 mg/ml) of all samples was prepared in HPLC grade solvent mixture of acetonitrile/formic acid (1: 1; v/v) and filtered using membrane disc filter (0.45 μm). HPLC instrument (Alliance, Waters Corp., Milford, Mass., U.S.A.) equipped with e2695 quaternary pump, auto injector (20µL loop), a 2998 photodiode array detector and an “Empower 2” software programme was used for characterization of phenolic compounds. A C-18 column (Thermo, USA) 25 cm × 4.6 mm × 5μ was used for separation of phenolic compounds using a mobile phase comprising of gradient elution of solvent A: water (0.1 % formic acid) and solvent B: acetonitrile (0.1% formic acid) at a flow rate of 0.5 ml/min. The elution profile was 0 min 100 % A, then the solvent B was increased first to 20 % in 20 min, thereafter to 30% in 10 min followed by 50% in 10 more min and finally to 100% for 10 min. The total run time was 50 min. The injected volume was 20 μl. For detection and quantification of phenolics, the photodiode array detector was set at 280 nm.
Fig. 1 depicts the total phenolic content of the extracts that were analysed. Among the 13 rose varieties tested, the total phenolic content varied from 101.03 mg GAE/100g FW to 427.59 mg GAE/100g FW of petals. The variety Ashwini showed highest phenolic content(427.59 mg GAE/100g FW) followed by Dr S.S. Bhatnagar (379.24 mg GAE/100g FW), Nehru Centenary (342.67 mg GAE/100g FW), Bhim (333.20mg GAE/100g FW) and Pusa Arun (306.78 mg GAE/100g FW). Variety Pusa Ajay recorded lowest phenolic content (101.03 mg GAE/100g FW).
It was evident from the results that light colour variety showed lesser phenolic content whereas the bright red colour variety showed higher phenolic content in the petals. Our results are in accordance with the findings of Vinokur et al. (10) and Qin and Xiaojun (4) in rose. Roman et al. (5) also reported that the total phenolic content in petal of Rosa canina, varied from 326 mg/100g to 575 mg/100 g. The differences among the rose varieties regarding the phenolics compounds could be due to genetic derivation.
HPLC chromatogram was generated for phenols in all varieties indicating several peaks. Characteristic peaks showed the typical absorbance of phenols. Phenolic identification was conducted by comparing RT (retention time) and elution order of sample with those of standards under the same HPLC conditions. Several peaks were detected in all varieties corresponding to different kinds of phenolic fractions. A total of five different types of phenolic compounds were identified in crude extract of rose petals (Table 1). It was observed that quercetin was present in all the varieties and its content ranged from 23.83 to 6038.78 µg/g. The presence of catechin was observed in variety Nehru Centenary (27.50 µg/g) and Suryakiran (38.73 µg/g). Epicatechin was found among most of the varieties except Nehru Centenary and Pusa Arun and its content ranged from 20.43 to 1980.66 µg/g Rutin was observed in four varieties, viz. Raktagandha, Bhim, Raktima and Nehru Centenary and its content ranged from 11.68 µg/g to 94.37 µg/g. 3-hydroxy cinnamic acid was observed only in one variety Pusa Ajay (9.76 µg/g). The identified compounds in this study are in agreement with the findings of Hvattum (2) and Stanila et al. (8) in rose. The present results are also in confirmation with the findings of Kumar et
Fig. 1. Total phenolic content of Indian rose varieties.
351
Phenolic Compounds in Petal Extracts of Rose
Table 1. Characterization of phenolic compounds of rose varieties using HPLC.
Variety RT(min.)
Peak area (%)
Identified compound
Content(µg/g)
Nehru Centenary
24.270 0.39 Catechin 27.5030.608 0.94 Rutin 20.3041.223 98.67 Quercetin 6038.78
Dr. S. S. Bhatnagar
29.629 27.42 Epicatechin 135.0941.268 72.58 Quercetin 327.74
Suryakiran 24.097 24.37 Catechin 38.7329.819 58.49 Epicatechin 88.7041.420 17.15 Quercetin 23.83
Pusa Bahadur
29.784 21.26 Epicatechin 256.0641.398 78.74 Quercetin 869.05
Bhim 29.758 4.95 Epicatechin 20.4333.476 10.27 Rutin 13.7041.365 84.78 Quercetin 321.02
Surkhab 29.698 16.10 Epicatechin 291.0241.312 83.90 Quercetin 1390.03
Pusa Ajay 29.686 77.46 Epicatechin 1980.6634.842 4.04 3-hydroxy
cinnamic acid9.76
41.277 18.50 Quercetin 433.50Pusa Virangana
29.774 62.31 Epicatechin 370.9341.348 37.69 Quercetin 205.69
Rose Sherbet
29.734 17.76 Epicatechin 184.7341.352 82.24 Quercetin 784.06
Pusa Arun 41.305 100.00 Quercetin 82.44Raktagandha 29.673 16.95 Epicatechin 298.83
30.761 2.05 Rutin 11.6841.272 81.00 Quercetin 1308.94
Raktima 30.026 63.85 Epicatechin 791.2830.848 23.58 Rutin 94.3741.367 12.58 Quercetin 142.87
Ashwini 30.026 86.47 Epicatechin 275.4741.405 13.53 Quercetin 39.50
al. (3), who reported gallic acid, catechin, epicatechin, rutin, m-coumaric acid, quercitrin, myricetin, quercetin, apigenin, and kaempferol in fresh flowers of Rosa bourboniana and Rosabrunonii.
From the present investigation it can be concluded that rose petals are rich in phenols and can be further utilised as natural source of antioxidants. Phenol rich varieties can be selected for processing extracts with health promoting properties or to be incorporated into functional foods with bioactive properties related to oxidative stress.
REFERENCES 1. Boskabady, M. H., Shafei, M. N., Saberi, Z. and
Amini, S. 2011. Pharmacological effects of Rosa damascena. Iranian J. Basic Med. Sci.14: 295-307.
2. Hvattum, E. 2002. Determination of phenolic compounds in rose hip (Rosa canina) using liquid chromatography coupled to electrospray ionisation tandem mass spectrometry and diode-array detection. Rapid Comm. Mass Spectro.16: 655-62.
3. Kumar, N., Bhandari, P., Singh, B., Gupta, A.P. and Kaul, V.K. 2008. Reversed phase-HPLC for rapid determination of polyphenols in flowers of rose species. J. Sep. Sci. 31: 262-67.
4. Qin, G. and Xiaojun, M. 2013. Composition and antioxidant activity of anthocyanins isolated from Yunnan edible rose (A ning). Food Sci. Human Wellness. 2: 68-74.
5. Roman, I., Stanila, A. and Stanila, S. 2013. Bioactive compounds and antioxidant activity of Rosa canina L. biotypes from spontaneous flora of Transylvania. Chem. Cent. J. 7: 73.
6. Shafei, M.N., Rakhshandah, H., and Boskabady, M.H. 2010. Antitussive effect of Rosa damascena in guinea pigs. Iran J. Pharm. Res. 2: 231-34.
7. Singleton, V.L. and Rossi, J. A. 1965. Colorimetry of total phenolics with phosphomolybdic-phosphotungstic acid reagents. American J. Enol. Vitic. 16: 144-58.
8. Stanila, A., Diaconeasa, Z., Roman, I., Sima, N., Măniuţiu, D., Roman, A., and Sima, R. 2015. Extraction and characterization of phenolic compounds from rose hip (Rosa canina L.) using liquid chromatography coupled with electrospray ionization - mass spectrometry. Not. Bot. Horti. Agrobot. Cluj Napoca. 43: 349-54.
9. Ulusoy, S., Boţgelmez-Týnaz, G. and Seçilmiş-Canbay, H. 2009. Tocopherol, carotene, phenolic contents and antibacterial properties of rose essential oil, hydrosol and absolute. Curr. Microbiol. 59: 554-58.
10. Vinokur, Y., Rodov, V., Reznick, N., Goldman, G., Horev, B., Umiel, N. and Friedman, H. 2006. Rose petal tea as an antioxidant-rich beverage: cultivar effects. J. Food Sci. Technol. 71: 42-47.
Received : June, 2017; Revised : January, 2018; Accepted : April, 2018

352
Indian J. Hort. 75(2), June 2018: 352-354
Antirrhinum majus L. commonly known as snapdragon is a herbaceous plant having flower with inquisitive shape and brilliant colours (Huxley et al., 5). Antirrhinum is used as cut flower and bedding plant throughout the world. It is native to Mediterranean region and belongs to family Plantaginaceae. Antirrhinum is a facultative long day plant and flowering hastens under long days; but also occurs under short days. A number of studies carried out on Antirrhinum suggest that longer photoperiod and warmer temperature results in early flowering (Sanderson and Link, 7).
Flower seed production is now gaining popularity in India as it is having great export potential. It has increased profit 2.5 to 3 times more as compared to wheat in Punjab (Singh et al., 8). Similarly in H.P. seed production of flowers is relatively remunerative enterprise. Planting dates depend upon the environmental conditions and the geographical location of the area. Same date of planting cannot be standardized for all geographical location of the zone because of difference in the natural environmental conditions. Therefore, attempts were made to examine an applied possibility of plant scheduling of snapdragon by planting it at different dates to find out the optimum time of planting for flower and seed production.
The experiment was carr ied out at the experimental farm of the Department of Floriculture and Landscape Architecture, YSPUH&F, Nauni,
Solan, Himachal Pradesh for two tears. Solan is located at an elevation of 1276 m above mean sea level lying between 32°51’0’’ North latitude and 77°11’30’’ East longitude. The climate is sub-temperate with an annual rainfall between 800-1300 mm. Experiment was conducted on plants obtained from open-pollinated seeds of snapdragon. Nursery raising was done 1 to 1½ months before transplanting depending upon the planting date. One week before planting, well rotten farm yard manure (5 kg/m2) was applied uniformly along with full doses of phosphorous and potassium along with half dose of nitrogen were incorporated into the beds. The remaining half dose of nitrogen was applied after 30 days of planting. Nitrogen, phosphorus and potassium (30 g/ m2 each) were applied through urea (46%), single super phosphate (16% P2O5) and muriate of potash (60% K2O) mixed in the soil @ 65.22, 187.2 and 50 g/ m2. The transplanting of uniform sized seedlings was done at a spacing of 30 cm × 30 cm from plant to plant and row to row accommodating nine plants per square meter area. Transplanting was done on six different dates starting from September 17 to December 1 at an interval of 15 days, viz. September 17, October 2, October 17, November 1, November 16 and December 1. Pinching was done at 4 node stage by removing the apical growing portion of the plant in order to produce multi-stemmed plants. The experiment was laid out in randomized block design with six planting dates as treatments and four replications. The data
Effect of planting dates on growth, flowering and seed production of snapdragon
Priyanka Sharma*, Y.C. Gupta, S.R. Dhiman and Puja SharmaDepartment of Floriculture and Landscape Architecture, Dr. Y. S. Parmar University of Horticulture and Forestry,
Nauni, Solan 173 230, Himachal Pradesh
ABSTRACTStudies were carried with an objective to identify the best date of planting to get optimum growth, flowering
and seed production of snapdragon. The experiment was conducted for two years under mid-hill conditions of Himachal Pradesh. Planting was done at an interval of 15 day starting from September 17 in both the years with planting dates as; September 17, October 2, October 17, November 1, November 16 and December 1. The maximum plant height (91.83 cm), plant spread (36.68 cm), number of stems per plant (6.08), stem length (82.00 cm), early flower bud formation (70.18 days) and flowering (107.35 days) with maximum duration of flowering (39.97 days), number of flowers per stem (31.70), number of pods per stem (30.87), seeds per pod (390.76), seed yield per plant (8.44 g) and 1000-seed weight (0.13 g) were recorded when planting was done on September 17. However, pod formation was earliest (182.48 days) in December 1 planting.Key words: Antirrhinum majus, planting time, quantitative traits.
*Corresponding author’s E-mail: [email protected]
Short communication
DOI : 10.5958/0974-0112.2018.00061.0

353
Effect of Planting Dates on Seed Production of Snapdragon
were subjected to statistical analysis employing a Randomized Block Design and were analyzed by one-way ANOVA using OP STAT statistical software.
Significant effect of planting time on vegetative growth, flowering and seed yield of snapdragon was observed (Table 1 & 2). Maximum plant height (91.83 cm), plant spread (36.68 cm), number of stems per plant (6.08) and stem length (82.00 cm) were obtained with September 17 planting followed by October 2 planting (Table 1). Warmer weather conditions prevailing during earlier planting dates might have resulted in luxuriant vegetative growth producing more number of stems per plant and finally increased plant spread. In a similar studies on planting dates in pyrethrum maximum plant height, number of shoots per plant, percentage of flowering plants and number of flowers per plant with early planting, i.e. 3rd of November, whereas with delay in planting (i.e. on 23rd November and 13th December) a corresponding decline in all the parameters was observed (Singh et al., 9).
Minimum days from planting to flower bud formation and flowering were taken by September 17 planted crop (70.18 and 107.35 days) with maximum
duration of flowering (39.97 days) and number of florets per stem (31.70) (Table 1). Snapdragon planted on 17th September flowered earlier because of congenial environmental factors such as mild temperature, high humidity and sunshine hours in both the years. It was also reported that delay in flowering of different bedding plants with decrease in mean daily temperature (Blanchard and Runkle, 1). According to the report as temperature decreased from 20 to 15°C, the time to flower increased by 4-8 days in French marigold, dahlia, petunia, snapdragon, and viola; 11-18 days in African marigold, cosmos, dianthus, gazania, moss rose, petunia, verbena, and zinnia; and 20-38 days in angelonia, blue salvia, browallia, and pentas. Maximum duration of flowering (41.43 days), number of flowers per stem (21.98) and biggest flowers (5.66 cm in diameter) were also recorded in September 17 planted crop. Extended flowering may be ascribed to optimum temperature conditions at the time of flowering. These results are in conformity with (Dhatt and Kumar, 3) who also reported maximum duration of flowering with early planting (October 20) in larkspur. More number of flowers per stem may be attributed to
Table 1. Effect of planting dates on vegetative growth and flowering of snapdragon.
Planting date Plant height (cm)
Plant spread (cm)
No. of stems
per plant
Stem length (cm)
Days taken for visible bud
formation
Days taken for flowering
Duration of flowering
(days)
No. of florets per
stemSeptember, 17 91.83 36.68 6.08 82.00 70.18 107.35 39.97 31.70October, 2 89.06 33.03 5.66 72.71 82.90 119.34 38.33 29.51October, 17 86.90 31.96 5.73 70.13 112.37 140.64 37.94 28.73November, 1 80.34 30.43 5.13 66.20 109.81 138.27 35.99 25.82November, 16 74.59 28.49 4.66 62.52 107.15 136.88 34.39 24.09December, 1 71.78 27.33 3.75 58.78 103.36 131.88 31.39 19.25LSD(P =0.05) 4.48 2.25 0.64 3.43 4.28 2.66 1.06 1.58
Data are the pooled means of two years
Table 2. Effect of planting dates on seed characters of snapdragon.
Planting date Days taken for pod formation
No. of pods per stem
No. of seeds per pod
Seed yield per plant (g)
1000-seed wt.(g)
September, 17 203.93 30.87 390.76 8.44 0.13 October, 2 197.31 28.75 371.61 6.43 0.12 October, 17 192.00 27.15 313.38 5.83 0.11 November, 1 190.92 25.21 274.21 3.78 0.11 November, 16 186.66 22.76 268.21 3.18 0.11 December, 1 182.48 17.63 255.38 2.32 0.11LSD(P = 0.05) 2.78 1.62 24.60 0.75 0.01
Data are the pooled means of two years

354
Indian Journal of Horticulture, June 2018
abundant growth in terms of more plant height, plant spread and number of stems per plant which in return increased photosynthetic area and ultimately increased photosynthetic assimilates.
Though, late planting i.e. December 1 resulted in earliest pod formation (182.48 days) but quality and quantity of seed was significantly low in comparison to all earlier plantings (Table 2). Warmer temperature and low relative humidity during pod formation of December 1 planted crop resulted in faster maturation of pods. In our study September 17 planted crop produced maximum number of pods per stem (30.87), number of seeds per pod (390.76), seed yield per plant (8.44 g). More number of pods per stem could be attributed to the corresponding abundant vegetative growth (plant height, plant spread and number of side stems per plant) and more number of flowers per stem in September 17 planted crop which ultimately resulted in more number of pods per stem. Similar results of increased seed production have been reported by Dubey et al. (4) in cosmos and Dhatt and Kumar, (2) in coreopsis. Higher seed yield per plant with seeds having higher weight was also observed in September 17 planting. More seed yield in September 17 planted crop might have been resulted due to increased number of pods per stem, along with more number of seeds per pod. These findings are in line with findings of increased seed yield with earlier planting in phlox (Kumar and Kaur, 6) and in larkspur (Dhatt and Kumar, 3).As regards 1000 seed weight, it was also recorded maximum in September 17 planting which could be attributed to favourable temperature (comparatively cooler) conditions prevailing at the time of flowering and at the time of seed maturity which resulted in better seed filling.
From the present findings it is evident that planting snapdragon in mid September produced more luxuriant vegetative growth which ultimately resulted in improved flowering and seed production. Thus, it may be concluded that to get maximum flower and seed yields in snapdragon mid-September is optimum planting time.
ACKNOWLEDGEMENTAll the authors are thankful to Head, Department
of Floriculture and Landscape Architecture, Dr YS Parmar University of Horticulture and Forestry, Nauni, Solan, Himachal Pradesh for the financial assistance.
REFERENCES1. Blanchard, Mathew G. and Runkle, Erik S.
2011. Quantifying the thermal flowering rates of eighteen species of annual bedding plants. Scientia Hort. 128: 30-37.
2. Dhatt, K.K. and Kumar, Ramesh. 2007. Effect of planting time and spacing on growth, flowering and seed yield in Coreopsis lanceolata and Coreopsis tinctoria. J. Orn. Hort. 10: 105-09.
3. Dhatt, K.K. and Kumar, Ramesh. 2010. Effect of planting time and growth regulators on growth and seed quality parameters of larkspur (Delphinium ajacis L.). J. Orn. Hort. 13: 50-54.
4. Dubey, R.K., Kumar, R. and Poonam. 2002. Effect of planting time and spacing on cosmos. J. Orn. Hort. 5: 46-47.
5. Huxley, A., Griffiths, M. and Levy, M. 1992. Antirrhinums. The new royal horticultural society dictionary of gardening, vol 1. Stackton Press, New York, pp. 194-95.
6. Kumar, Ramesh and Kaur, Kiranjeet. 2000. Effect of planting time and cultivars on growth, flowering and seed yield in phlox (Phlox drumondii). Seed Res. 28: 23-26.
7. Sanderson, K.C. and Link, C.B. 1967. The influence of temperature and photoperiod on the growth and quality of a winter and summer cultivar of snapdragon, Antirrhinum majus L. Proc. Amer. Soc. Hor. Sci. 91: 598-611.
8. Singh, R., Dhaliwal, H.S. and Joshi, A. S. 2009. Contract farming of floriculture in Punjab-problems and prospects. Floriculture Today, 13: 32-37.
9. Singh, S., Singh, M., Singh, A.K. and Verma, R.K. 2011. Effects of calliterpenone and GA3 on the growth, yield, and pyrethrin contents of pyrethrum [Tanacetum cinerariifolium (Trevir.) Sch. Bip.] planted on different dates. J. Hort. Sci. Biotech. 6: 19-24.
Received : August, 2017; Revised : April, 2018; Accepted : May, 2018

List of Referees for Review of Research Papers during 2018 (January to June)
Dr S. E. Apshara, Dakshina Kannada, Karnataka
Dr B.L. Attri, PDMR, Solan
Dr Anju Bajpai, CISH, Lucknow
Dr Reeta Bhatia, IARI-RS, Katrain
Dr S.S. Dey, IARI-RS, Katrain, Himachal Pradesh
Dr W.S. Dhillon, ICAR, New Delhi
Dr A.K. Dubey, IARI, New Delhi
Dr Kishor Gaikwad, IARI, New Delhi
Dr P.P.S. Gill, PAU, Ludhiana
Dr A.K. Goswami, IARI, New Delhi
Dr Vinayaka Hegde, CPCRI, Kasaragod
Dr Gograj S. Jat, IARI, New Delhi
Dr Pradeep Karmakar, IIVR, Varanasi
Dr Arun Kishor, CITH-RS, Mukteshwar
Dr Ajay Kumar, NRCP, Sholapur
Dr P. Suresh Kumar, NRC Banana, Trichy
Dr Shiv Lal, CITH, Srinagar
Dr. Vijay Mahajan, PDOG, Pune
Dr R.L. Misra, , New Delhi
Dr Sujatha Nair, IIHR, Bengaluru
Dr C.K. Narayana, IIHR, Bengaluru
Dr R.K. Pal, NRCP, Sholapur
Dr V.B. Patel, IARI, New Delhi
Dr M. Pitchaimuthu, IIHR, Bengaluru
Dr D. Prasath, IISR, Kerala
Dr H. Rymbai, ICAR CNEHR, Umiam, Meghalaya
Dr M.S. Saraswathi, Thruchirapalli, Tamilnadu
Dr Shruti Sethi, IARI, New Delhi
Dr Akhilesh Sharma, YSPUH&F, Solan
Dr R.M. Sharma, IARI, New Delhi
Dr A.K. Shukla, IARI RS, Shimla
Dr Awtar Singh, IARI, New Delhi
Dr Desh Beer Singh, Srinagar, Jammu & Kashmir
Dr Kanhaiya Singh, IARI, New Delhi
Dr Rakesh Singh, NBPGR, New Delhi
Dr V. Sridhar, IIHR, Bengaluru
Dr Sachin S. Suroshe, IARI, New Delhi
Dr Madhubala Thakre, IARI, New Delhi
Dr S. Uma, NRCB, Thruchirapalli
Dr M.K. Verma, IARI, New Delhi
Dr Ashish K. Yadav, NRCO, Gangtok
Dr S.K. Yadav, IARI, New Delhi
Dr Ram Asrey, IARI, New Delhi
Dr O.P. Awasthi, IARI, New Delhi
Dr D.R. Biswas, IARI, New Delhi
Dr Anchal Dass, IARI, New Delhi
Dr Ajmer Singh Dhatt, PAU, Ludhiana
Dr M.R. Dinesh, IIHR, Bangaluru
Dr S.K. Dutta, ICAR CNEHR, Kosalib, Mizoram
Dr K.K. Gangopadhaya, IARI, New Delhi
Dr Robin Gogoi, IARI, New Delhi
Dr P.M. Haldankar, KKV, Dapoli
Dr Zakir Hussain, IARI, New Delhi
Dr K.J. Jeyabaskaran, Tamilnadu
Dr Anil Khar, IARI, New Delhi
Dr Hare Krishna, CIAH, Bikaner
Dr Rajiv Kumar, , IIHR, Bengaluru
Dr Sandeep K. Lal, IARI, New Delhi
Dr B.V.C. Mahajan, PAU, Ludhiana
Dr L.N. Mahawar, MPUA&T, Udaipur
Dr A. Nagaraja, IARI, New Delhi
Dr Namita, IARI, New Delhi
Dr Vishal Nath, NRCL, Bihar
Dr Sapna Panwar, IARI, New Delhi
Dr Kalidas Pati, CTCRI-RS, Bhubaneswar
Dr Jai Prakash, IARI, New Delhi
Dr K.V. Raman, USA
Dr Naved Sabir, IARI, New Delhi
Dr Indu Sawant, NRCG, Pune
Dr M. Shareefa, IISR, Kozhikode, Kerala
Dr Nimisha Sharma, IARI, New Delhi
Dr S.K. Sharma, IARI RS, Pune
Dr Anshuman Singh, CSSRI, Karnal
Dr Brahma Singh, New Delhi
Dr Dinesh Singh, IARI, New Delhi
Dr N.V. Singh, Solapur
Dr Zora Singh, Australia
Dr Manish Srivastav, IARI, New Delhi
Dr C.K. Thankamani, IISR, Kozhikode, Kerala
Dr Jagesh K. Tiwari, CPRI, Shimla
Dr B. Varalakshmi, IIHR, Bengaluru
Dr A.K. Yadava, USA
Dr R.K. Yadav, IARI, New Delhi
The Editorial Team of the Horticultural Society of India gratefully acknowledges the assistance provided by the above referees in reviewing the articles published in the Indian Journal of Horticulture during 2018.
Editor-in-ChiefIndian Journal of Horticulture

The 8th Indian Horticulture Congress-2018 will be held at Indira Gandhi Krishi Vishwavidyalaya at Raipur, Chhattisgarh from October 29 to November 2, 2018.
The following themes/ sub-themes have been identified for the Congress.
CROPS COVEREDAll horticulture crops namely, Fruits, Vegetables & Tuber
Crops, Floriculture, M&A Plants, Spices, Plantation Crops, Bamboo and Mushroom.
THEMES/SUB-THEMES• Quality Planting Material: Innovation in Production of
Elite Quality Planting Material/Seed, Diagnostics, Plug Plant Production and Vegetable Grafting.
• Breeding Approaches: Genetic Resources for Trait-specific Breeding, Pre-Breeding for Abiotic and Biotic Stresses, Next Generation Breeding Approaches for Trait-specific Improvement (Nutrition, Quality, Pest Resistance Processing and Export), Breeding of Rootstocks, Harnessing Underutilized Crops, Use of Molecular Markers, QTL Mapping, Genome Editing, Application of Omics, Transgenes, Cisgenics, Genotyping Chips, NGS and Bio-Informatics.
• Innovative Production Systems: Urban and Peri-urban Horticulture, Protected Cultivation, Hydroponics, Aeroponics, Vertical Farming, Farming Systems in Horticulture.
• Input Management for Improving Productivity and Quality: Canopy architecture, HDP, Juvenility, New Generation Inorganic/ Organic Fertilizers, Bio-Fertilizers, Fertigation, Organic Horticulture, Conservation Horticulture, Emerging Nutrient and Water Efficient Technologies, Deficit Irrigation, new nutrient and growth regulator sources.
• Managing Pests & Diseases: Emerging Pest Problems, Modern Approaches for Diagnostics in Disease Protection, Disease & Pest Dynamics under Climate Change, New Molecules and Botanicals, Bio-Control for Enhancing Productivity and Quality; Safe Food, Pesticide Residue and Environmental Issues.
• Post-harvest Management: Post-harvest Handling Protocols, Emerging Post-harvest Technologies, Ozonation, UV Treatments, Irradiation, Nano Encapsulation, Smart Packaging.
• Value Addition: Minimal Processing, Thermal and Non-Thermal Processing, Functional Foods, Field and Industrial Waste Management.
• Horticultural Engineering: Mechanisation and use of Automation, use of Sensors, Robotics, Drones, Customized Tools & Implements, Use of Non-Conventional Energy sources.
• Innovation in Social Sciences and Horti-business: New Start-Ups in Horticulture Sector, Extension Innovations, Capacity Building and Skill Development, Public Private Partnership (PPP) in Extension, use of ICT, Advisory Services, GAP, Certification, Farmer-Producer Organisations (FPOs), Policy Needs in Horticulture sector.
• Opportunities in Horticulture R&D in Chhattisgarh: Horticulture research and development in Chhattisgarh; Tribal area Horticulture-led Development Models, Developmental Schemes and their Impact, Crop Insurance and Marketing Innovations, Promotion of Ethnic Crops and ITKs in Horticulture, Successful Entrepreneurs and PPP Models, Marketing Models.
PRESENTATIONSThe Congress will cover lead, oral and poster papers.
While lead papers are being invited, suggestions for oral papers related to different themes indicating the title of the paper and the speaker (from within or outside country) are invited by the Programme Committee latest by 31.07.2018. All members/ non-members of the HSI, students, farmers, foreign delegates and representative of corporate sector are invited to participate.
IMPORTANT DATESLast date for receiving Abstract(s) : July 31, 2018Last date for sending Acceptance letter : August 15, 2018Last date for sending Full length paper : August 31, 2018Last date for sending Registration fee : September 30, 2018
REGISTRATION FEEDetails of Registration Fee for various categories of
participants are as under:
Category On time With late feeHSI members/State Hort. Staff ` 7,500/- ` 8,500/-Non-members of HSI/Corporate sector
` 10,000/- ` 11,000/-
Student/Research Fellows ` 3,000/- ` 3,500/-Farmers ` 2,500/- ` 2,500/-Foreign Delegates SAARC countries (US$ 150)
others US$ 200 or € 150
8th Indian Horticulture Congress-2018on
Shaping Future of Indian Horticulture Venue : Indira Gandhi Krishi Vishwavidyalaya at Raipur, Chhattisgarh
(October 29th to November 2st, 2018)
FURTHER CORRESPONDENCE
SecretariatThe Horticultural Society of India
F-1, National Societies Block, NASC Complex, DPS Marg, New Delhi-110012, INDIA; Tel.: +91-11-25842127
Secretariat8th Indian Horticultural Congress 2018
Director Research Services, Indira Gandhi Krishi Vishwa Vidyalaya, Krishak Nagar, Raipur - 492012, Chhattisgarh; Phone: 0771-2443035
Congress E-mail : [email protected]; Website : www.hsi1942.in

GUIDELINES TO THE CONTRIBUTORS
Indian Journal of Horticulture is the official publication of the Horticultural Society of India. It features the original research in all branches of Horticulture and other cognate sciences of sufficient relevance and primary interest to the horticulturists. The publication is generally open to the members the Horticultural Society of India but it also accepts papers from non-members on subjects related to Horticulture. The journal publishes three types of articles, i.e., Review/ Strategy paper (exclusively by invitation from the personalities of eminence), Research paper and Short communication. The manuscripts should be submitted in duplicate in all respect to the Editor-in-Chief, the Horticultural Society of India, F1, National Society’s Block, National Agricultural Science Centre Complex, Todapur, Pusa Campus, New Delhi - 110 012, India. Each manuscript must be typed doubled spaced on one side of a A4 size page. Clearness, brevity and conciseness are essential in form, style, punctuation, spelling and use of English language. Manuscripts should conform to the S.I. system for numerical data and data should be subjected to appropriate statistical analysis. On receipt of an article at the Editorial Office, an acknowledgement giving the manuscript number is sent to the corresponding author. This number should be quoted while making any future enquiry about its status.
Review/ Strategy paper: This article is received through invitation. It should be comprehensive, up-to-date and critical on a recent topic of importance. The maximum page limit is of 16 double-spaced typed pages including tables and figures. It should cite latest literatures and identify some gaps for future. It should have a specific Title followed by the Name(s) of the author(s), Affiliation, Abstract, Key words, main text with subheadings, Acknowledgements (wherever applicable) and References.
Research paper: The paper should describe a new and confirmed findings. Should not generally exceed 12 typed pages including tables/ figures etc. A research paper has the following features.Title followed by Author(s) and Affiliation: Address of the institution(s) where the research was undertaken. Abstract: A concise summary (200 to 300 words) of the entire work done along with the highlights of the findings.Key words: Maximum of five key words to be indicated.Introduction: A short introduction of the crop along with the research problem followed by a brief review of literature. Materials and methods: Describe the materials used in the experiments, year of experimentation, site etc. Describe the methods employed for collection of data in short.Results and discussion: This segment should focus on the fulfillment of stated objectives as given in the introduction. Should contain the findings presented in the form of tables, figures and photographs. As far as possible, the data should be statistically analyzed following a suitable experimental design. Same data should not be presented in the table and figure form. Avoid use of numerical values in findings, rather mention the trends and discuss with the available literatures. At the end give short conclusion. Insertion of coloured figures as photograph(s) will be charged from the author(s) as applicable and suggested by the printer.Acknowledgements (wherever applicable).References: Reference to literature should be arranged alphabetically and numbered according to author’s names, should be placed at the end of the article. Each reference should contain the names of the author with initials, the year of the publication, title of the article, the abbreviated title of the publication according to the World List of Scientific Periodicals, volume and page(s). In the text, the reference should be indicated by the author’s name, followed by the serial number in brackets. Maximum of 15 key references to be cited.1. Scaffer, B. and Guaye, G.O. 1989. Effects of pruning on light interception, specific leaf density and chlorophyll content of mango.
Scientia Hort. 41: 55-61. 2. Laxmi, D.V. 1997. Studies on somatic embryogenesis in mango (Mangifera indica L.). Ph.D. thesis, P.G. School, Indian Agricultural
Research Institute, New Delhi. 3. Sunderland, N. 1977. Nuclear cytology. In: Plant Cell and Tissue Culture, Vol. II. H.E. Street (Ed.), University of California
Press, Berkeley, California, USA, pp.171-206. 4. Chase, S.S. 1974. Utilization of haploids in plant breeding: breeding diploid species. In: Haploids in Higher Plants: Advances
and Potential. Proc. Intl. Symp. 10-14 June, 1974, University of Guelph. K.J. Kasha (Ed.), University of Guelph, Canada, pp. 211-30.
5. Panse, V.G. and Sukhatme, P.V. 1978. Statistical Methods for Agricultural Workers, Indian Council of Agricultural Research, New Delhi, 381 p.
Short communication: The text including table(s) and figure(s) should not exceed five typed pages. It should have a short title; followed by name of author(s) and affiliation, Abstract (100 words), Key words (3-5), Short research paper and References (7 max.). There should be no sub-headings, i.e. Introduction, Materials and Methods, Results & Discussion etc. The manuscript should be in paragraphs mentioning the brief introduction of the of the topic and relevance of the work, followed by a short description of the materials and the methods employed, results and discussion based on the data presented in 1 or 2 table(s)/ figure(s) and a short conclusion at the end.
General instructions All the manuscript should be typed double-spaced on one side of A4 size paper with proper margin. Generic and specific names should be italicized throughout the manuscript. Similarly, the vernacular names are to italicized. Each table should have a heading stating its content clearly and concisely. Place at which a table is to be inserted should be
indicated in the text by pencil. Tables should be typed on separate sheets, each with a heading. Tables should be typed with the first letter (T) only capital, table No. in Arabic numerals. All measurements should be in metric units.
Data to be presented in graphical form should be sent on quality glossy contrast paper without folding. Each illustration must be referred to in the text and Roman numerals should be used in numbering. Photograph(s) of good contract must be mounted on hard paper to avoid folding and a separate sheet must be given for the title for each photograph sent as figure.
At the bottom of the first page present address of the corresponding author, E-mail ID etc. must be specified. Revised manuscript is acceptable in duplicate along with a CD/E-mail. It is essential to cite related research papers published
in Indian Journal of Horticulture and other horticultural journals and update the references while revising a manuscript. No reprint of the published article will be supplied to the authors. Article forwarded to the Editor-in-Chief for publication is understood to be offered to INDIAN JOURNAL OF HORTICULTURE
exclusively. It is also understood that the authors have obtained a prior approval of their Department, Faculty or Institute in case where such approval is a necessary.
Acceptance of a manuscript for publication in Indian Journal of Horticulture shall automatically mean transfer of Copyright to the Horticultural Society of India. At the time of acceptance of a manuscript, all the authors should be the annual member of the Society.
The Editorial Board takes no responsibility for the fact or the opinion expressed in the Journal. Electronic submission of manuscript : www.indianjournals.com; [email protected] All submissions should strictly follow journal format. Deviation from format and exceeding the page limit are liable for
non-starter of the review process and further processing. Up-to-date literature must be cited. Avoid self citation.

CONTENTS
Published by Dr K.L. Chadha and edited by Dr Pritam Kalia for the Horticultural Society of India, F1, National Society’s Block, National Agricultural Science Centre Complex, Todapur, Pusa Campus, New Delhi 110 012, India and printed at Malhotra Publishing House, B-6, DSIDC Packaging Complex, Kirti Nagar, New Delhi 110 015, India.
Genetic diversity in qualitative and quantitative traits of papaya – Kaluram, Jai Prakash, S. K. Singh, A. K. Goswami, Preeti Singh, Zakir Hussain and A. K. Singh
Morphological characterization of walnut genotypes of diverse origin – J.I. Mir, N. Ahmed, D.B. Singh,
Megna Rashid, S.R. Singh, O.C. Sharma, S. Lal and Anil Sharma
Existence of genetically diverse ecotypes of Ziziphus nummularia: a wild species of ber from western India – Palaiyur N Sivalingam, Karun Gurjar, Dhurendra Singh, Sarita Chauhan and Chander Bhan
Quality characteristics and antioxidant activity of passion fruit (Passiflora edulis Sims.) accessions – S.M. Charan, Saji Gomez, K.B. Sheela, P. Meagle Joseph and C.V. Sruthi
Response of prohexadione calcium and paclobutrazol on growth and physio-chemical characteristics of pear cv. Clapp’s Favorite – Manmohan Lal, M.M. Mir, Umar Iqbal and Amit Kumar
Effect of fertigation on growth, yield and quality of almond under Kashmir conditions – Dinesh Kumar and D.B. Singh
Nutritional status of Santa Rosa Japanese plum as affected by nitrogen and boron under rainfed conditions of Kashmir – Gowhar A. Dar, Amit Kumar, F.A. Misgar and Kounser Javeed
Mapping of spatial variability in soil properties for site-specific nutrient management of Nagpur Mandarin in Central India – S.S. Sawant, M.S.S. Nagaraju, Rajeev Srivastava, Jagdish Prasad, R.A. Nasre and D.S. Mohekar
Characterization of cultivated and wild species of Capsicum using microsatellite markers – Arpita Srivastava, Manisha Mangal, Gokul Gosavi and Pritam Kalia
Characterization and association of phenotypic and biochemical traits in onion under short day tropical conditions – Ravindra Dangi, Anil Khar, Sabina Islam and Amrender Kumar
Development of pollen germination medium to test pollen viability of eggplant and its wild species – P. Jayaprakash, Sheeba D, Vikas, V.K., Sivasamy. M, and T. Sabesan
Comparative evaluation of hybrid seed production of bitter gourd in rainy and spring-summer season – Nagamani Sandra, Sudipta Basu and T.K. Behera
Influence of fertigation and training systems on yield and other horticultural traits in greenhouse cucumber – Sanjeev Kumar, N.B. Patel and S.N. Saravaiya
Performance of soilless cucumbers under partially controlled greenhouse environment in relation to deficit fertigation – M.C. Singh, K.G. Singh and J.P. Singh
165
172
177
185
191
197
202
209
218
226
237
245
252
259
Morphological diversity of trichomes and phytochemicals in wild and cultivated eggplant species – P.D. Kamala Jayanthi, M.A. Ravindra, Vivek Kempraj, T.K. Roy, K.S. Shivashankara and T.H. Singh
Circumventing phenolic exudation and poor survival in micropropagation of marigold – K. Ravindra Kumar, Kanwar Pal Singh, D.V.S. Raju, Prabhat Kumar, Sapna Panwar and Reeta Bhatia
Productivity and economic advantages of flower crops in coconut based intercropping system – S. Rani, D. Rajakumar, N. Shoba and H.P. Maheswarappa
Effect of pre-treatment and packaging on quality of β-carotene rich mango powder – V.R. Sagar
Development and evaluation of vitamin C enriched low calorie Aloe vera- aonla blended functional squash using stevioside – Rakesh Sharma, Ranjana Sharma and Abhishek Thakur
Value addition and economics of Arecanut processing plant – A study from North-Eastern India – G. Mula, S.C. Sarker and A. Sarkar
Effect of different packaging films and pre washing on the shelf life of button mushrooms – Narges Hassani and Orang Khademi
Post-harvest losses in different varieties of onion – Kalyani Gorrepati, A.A. Murkute, Yogesh Bhagat and Jai Gopal
Storage behaviour of apple cultivars under ambient conditions – Arun Kishor, Raj Narayan, Manoj Brijwal, Brij Lal Attri, Anil Kumar and Sovan Debnath
Short communicationsBudding and grafting time and height as determining factors for bud take and successive plant growth in some temperate fruits – Biswajit Das, Arun Kishor and N. Ahmed
Estimates of heterosis for yield and its contributing traits in cucumber – T.L. Bhutia, A.D. Munshi, T.K. Behera, A.K. Sureja, S.K. Lal and Azeze Seyie
Stability of yield and its components in vegetable amaranth – R.S. Pan and A.K. Singh
Projected climate changes and environment suitability of foot yam in major growing areas of India – G. Byju, Sabitha Soman and M. Vani
Cross amplification of SSR loci in marigold for molecular characterization – Anuradha Sane, Madhuri Ghatke, Archana Gadre, Tejaswini
Characterization of phenolic compounds in petal extracts of rose – Poonam Kumari, D.V.S. Raju, Kanwar Pal Singh, K.V. Prasad and Sapna Panwar
Effect of planting dates on growth, flowering and seed production of snapdragon – Priyanka Sharma, Y.C. Gupta, S.R. Dhiman and Puja Sharma
265
273
279
283
289
295
306
314
319
326
332
337
341
345
349
352