1.Executive Summary - krishi icar
119
-
Upload
khangminh22 -
Category
Documents
-
view
5 -
download
0
Transcript of 1.Executive Summary - krishi icar


Executive Summary 1 ICAR-RCER n Annual Report 2013-14
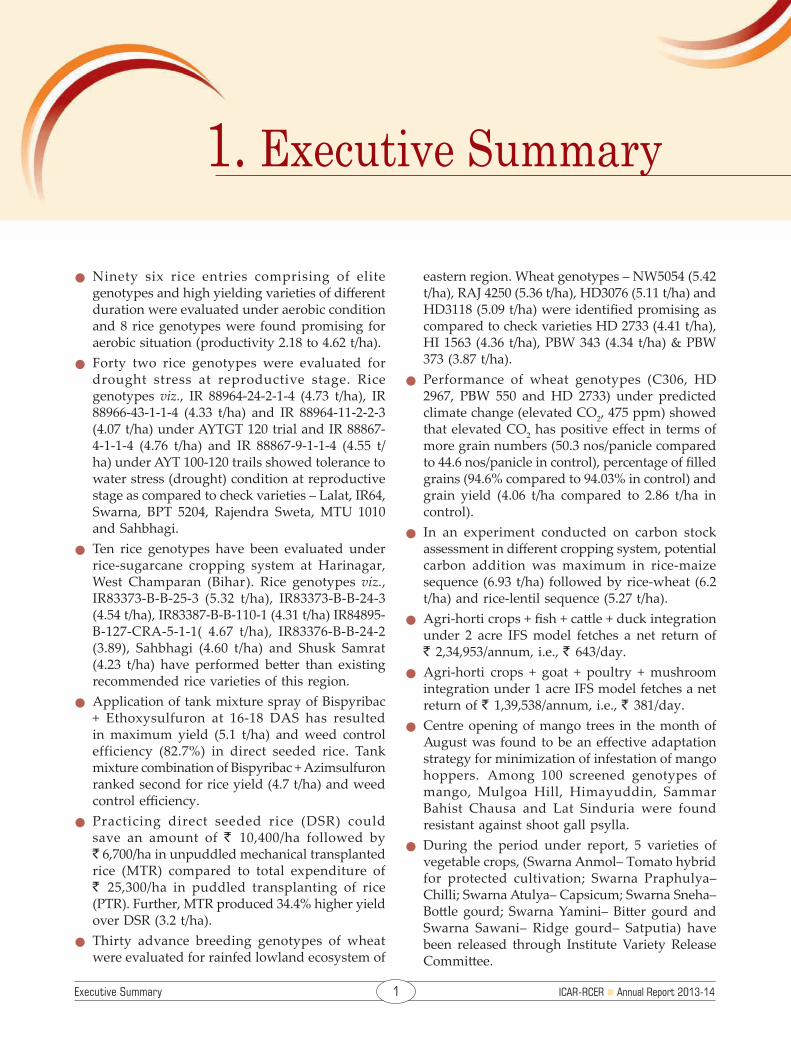
n Ninety six rice entries comprising of elite genotypes and high yielding varieties of different duration were evaluated under aerobic condition and 8 rice genotypes were found promising for aerobic situation (productivity 2.18 to 4.62 t/ha).
n Forty two rice genotypes were evaluated for drought stress at reproductive stage. Rice genotypes viz., IR 88964-24-2-1-4 (4.73 t/ha), IR 88966-43-1-1-4 (4.33 t/ha) and IR 88964-11-2-2-3 (4.07 t/ha) under AYTGT 120 trial and IR 88867-4-1-1-4 (4.76 t/ha) and IR 88867-9-1-1-4 (4.55 t/ha) under AYT 100-120 trails showed tolerance to water stress (drought) condition at reproductive stage as compared to check varieties – Lalat, IR64, Swarna, BPT 5204, Rajendra Sweta, MTU 1010 and Sahbhagi.
n Ten rice genotypes have been evaluated under rice-sugarcane cropping system at Harinagar, West Champaran (Bihar). Rice genotypes viz., IR83373-B-B-25-3 (5.32 t/ha), IR83373-B-B-24-3 (4.54 t/ha), IR83387-B-B-110-1 (4.31 t/ha) IR84895-B-127-CRA-5-1-1( 4.67 t/ha), IR83376-B-B-24-2 (3.89), Sahbhagi (4.60 t/ha) and Shusk Samrat (4.23 t/ha) have performed better than existing recommended rice varieties of this region.
nApplication of tank mixture spray of Bispyribac + Ethoxysulfuron at 16-18 DAS has resulted in maximum yield (5.1 t/ha) and weed control efficiency (82.7%) in direct seeded rice. Tank mixture combination of Bispyribac + Azimsulfuron ranked second for rice yield (4.7 t/ha) and weed control efficiency.
n Practicing direct seeded rice (DSR) could save an amount of ` 10,400/ha followed by ` 6,700/ha in unpuddled mechanical transplanted rice (MTR) compared to total expenditure of ` 25,300/ha in puddled transplanting of rice (PTR). Further, MTR produced 34.4% higher yield over DSR (3.2 t/ha).
n Thirty advance breeding genotypes of wheat were evaluated for rainfed lowland ecosystem of
eastern region. Wheat genotypes – NW5054 (5.42 t/ha), RAJ 4250 (5.36 t/ha), HD3076 (5.11 t/ha) and HD3118 (5.09 t/ha) were identified promising as compared to check varieties HD 2733 (4.41 t/ha), HI 1563 (4.36 t/ha), PBW 343 (4.34 t/ha) & PBW 373 (3.87 t/ha).
n Performance of wheat genotypes (C306, HD 2967, PBW 550 and HD 2733) under predicted climate change (elevated CO2, 475 ppm) showed that elevated CO2 has positive effect in terms of more grain numbers (50.3 nos/panicle compared to 44.6 nos/panicle in control), percentage of filled grains (94.6% compared to 94.03% in control) and grain yield (4.06 t/ha compared to 2.86 t/ha in control).
n In an experiment conducted on carbon stock assessment in different cropping system, potential carbon addition was maximum in rice-maize sequence (6.93 t/ha) followed by rice-wheat (6.2 t/ha) and rice-lentil sequence (5.27 t/ha).
nAgri-horti crops + fish + cattle + duck integration under 2 acre IFS model fetches a net return of ` 2,34,953/annum, i.e., ` 643/day.
nAgri-horti crops + goat + poultry + mushroom integration under 1 acre IFS model fetches a net return of ` 1,39,538/annum, i.e., ` 381/day.
n Centre opening of mango trees in the month of August was found to be an effective adaptation strategy for minimization of infestation of mango hoppers. Among 100 screened genotypes of mango, Mulgoa Hill, Himayuddin, Sammar Bahist Chausa and Lat Sinduria were found resistant against shoot gall psylla.
nDuring the period under report, 5 varieties of vegetable crops, (Swarna Anmol– Tomato hybrid for protected cultivation; Swarna Praphulya– Chilli; Swarna Atulya– Capsicum; Swarna Sneha– Bottle gourd; Swarna Yamini– Bitter gourd and Swarna Sawani– Ridge gourd– Satputia) have been released through Institute Variety Release Committee.
Executive Summary1. Executive Summary

ICAR-RCER n Annual Report 2013-14 2 Executive Summary
n "Swarna Vaidehi" first ever variety of makhana (Euryale ferox Salisb.) has also been developed and released by Institute Variety Release Committee with production potential of 3.0 t/ha compared to 1.4 - 1.6 t/ha in traditional cultivars.
n Five brinjal genotypes (HAB-905, IC-545931, IC-545941, IC-545901, IC261786) were found resistant to bacterial wilt and are being used in the crossing programme. Similarly, tomato genotypes– EC-596747, HAT-296, HAT-305 and Swarna Lalima were found resistant for bacterial wilt, and HAT-310 and HAT-311 for root knot nematode.
nDemonstration of low poly tunnel off-season cultivation of bottle gourd in winter resulted in early harvest of produce in February-March with the maximum net income of ` 1571/- from one decimal (40 m2) area. Cultivation of oyster mushroom also found economically most viable in tribal dominated areas.
nMore than 230 germplasm of wild edibles including tuber crops viz., elephant foot yam, taro, yams, giant taro, cassava, sweet potato, arrowroot and wild musk melon have been collected from the surveys undertaken in Chhattisgarh, Jharkhand, Odisha and West Bengal during the period under report.
n The ridge and furrow planting method was found to be the superior methods of planting cauliflower. Further, use of plastic mulch in ridge and furrow method showed maximum yield of 35.79 t/ha.
n The exchangeable Al content in acidic soils was low to medium [0.31-1.08 cmol (p+)/kg] status among the mango orchards of 1-3, 4-5 and 6-7 years in Jharkhand. The total acidity of the acidic soils of different mango orchards of Jharkhand varied from 0.88-2.34 cmol (p+)/kg.
n Two year old orchard of guava had highest organic carbon stock in soils (10.77 t/ha), followed by litchi (10.16 t/ha). Whereas in 4 year old orchard, the organic carbon stock was highest in mango orchard (12.58 t/ha) followed by litchi (11.38 t/ha) and guava (10.78 t/ha) before rainy season. However, after rainy season, highest organic carbon stock was found in litchi orchard (10.87 t/ha) and least in mango (10.36 t/ha).
nAmong various diversified cropping systems, rice-tomato-bottle gourd, rice–cabbage–cowpea, rice-coriander-ladies finger and rice–potato–onion have been found the most promising cropping systems under irrigated ecosystem.
nDuring the period under report, more than 1000 nos of artificial insemination (AI) were performed in non-descript buffalo with elite Murrah germplasm.
n Supplementation of phytase enzyme @ 20 g/100 kg feed improved average daily gain by 2.25% and feed conversion ratio by 5.62% over control group in broiler chicken.
n Feeding of Total Mixed Ration (TMR) increased milk yield by 19.5% and dry matter and crude protein digestibility by 12.43 and 42.26%, respectively in dairy cows.
n Feeding of leguminous fodder (ground nut, soybean and rice bean) has saved 75-80% of concentrate in broiler rabbit.
n Experiment on round the year fodder production with multicut sudan and cowpea/rice bean in kharif and barseem and oat in rabi season, revealed that a total biomass yield of 67.90 and 51.99 t were produced from one ha of land during kharif and rabi season respectively, which was sufficient to meet the fodder requirements of 14 crossbred cows round the year.
n Screening of serum samples of goats from Bihar for three viral antibodies (PPR, CAE and BT) indicated that there was no prevalence of Lenti virus antibody in goat and all the samples tested were negative for CAE antibody. However, prevalence of PPR and blue tongue was recorded at 34.07 and 14.01%., respectively.
n Induced breeding of Magur recorded 93.16% fertilization, 55.10% hatching and 21.55% survival (spawn to fry).
n Breeding of Labeo bata has been successfully completed with hatching percentage varying between 39.67 and 84.00%. Ovaprim at the dose of 0.3 ml/ kg for female and 0.1 ml /kg for male was found most effective.
n Rice-fish integration resulted into fish yield of 1.62-1.86 t/ha of rohu and catla with a stocking density of 10,000 yearlings/ha.
nDuring the year under report, a total of 183 training programs, 22 Front Line Demonstrations, 13 On Farm Trials and 6 Farmers' Fair have been conducted for the farmers and the state Government officials.
n The institute also organized Agri-Summit 2013 – A Step towards Second Green Revolution and Regional Chapter meet on IPR issue in Agriculture at Patna and Ranchi.
Introduction 3 ICAR-RCER n Annual Report 2013-14
Historical PerspectiveThe eastern region comprises of plains of As-
sam, Bihar, Chhattisgarh, Eastern Uttar Pradesh, Jharkhand, Odisha and West Bengal, representing 21.85% of the geographical area of the country and supporting 33.64% of country’s population. Though the region is endowed with rich natural resources to support higher agricultural production includ-ing livestock and fisheries, the production levels have remained low due mainly to lack of location-specific production technologies, dissemination of scientific knowledge to farmers, fragmented land holdings, low seed replacement rate, large popu-lation of non-descript type of livestock, poverty, lack of infrastructure facilities, natural calamities, e.g., frequent floods and droughts, water logging and social conflicts. Nevertheless, the region has vast untapped potential to enhance the production. Keeping this fact in view, planning priorities has also been set up to achieve the food self sufficiency at national level from eastern region under Look East Policy of Govt. of India.
ICAR Research Complex for Eastern Region (ICAR-RCER), Patna came into existence on the 22nd February 2001 so as to address diverse issues relating to land and water resources management, crop husbandry, horticulture, agroforestry, aquatic crops, fishery, livestock and poultry, agro-process-ing and socio-economic aspects in holistic manner for enhancing research capability and providing a backstopping for improvement in agricultural pro-ductivity and sustainability. Hence, the mandate of the institute is “to undertake strategic and adaptive research for efficient integrated management of natural resources so as to enhance productivity of agricultural production systems comprising of field, agricultural and horticultural crops, aquatic crops, agro-forestry, livestock, avian, and fisheries in different agro-ecological zones of the eastern region”. The modalities to achieve the mandate are:n To facilitate and promote coordination and
dissemination of appropriate agricultural
technologies through network/consortia approach involving ICAR institutes, State Agricultural Universities, and other agencies for generating location-specific agricultural production technologies through sustainable use of natural resources.
n To provide scientific leadership and to act as a center for vocational as well as advanced training to promote agricultural production technologies.
n To act as repository of available information and its dissemination on all aspects of agricultural production systems.
n To collaborate with relevant national and international agencies in liaison with state and central government departments for technology dissemination.
n To provide need based consultancy and advisory support for promoting agriculture, horticulture and livestock in the region.
n Socio-economic evaluation and impact assessment of agricultural technologies.
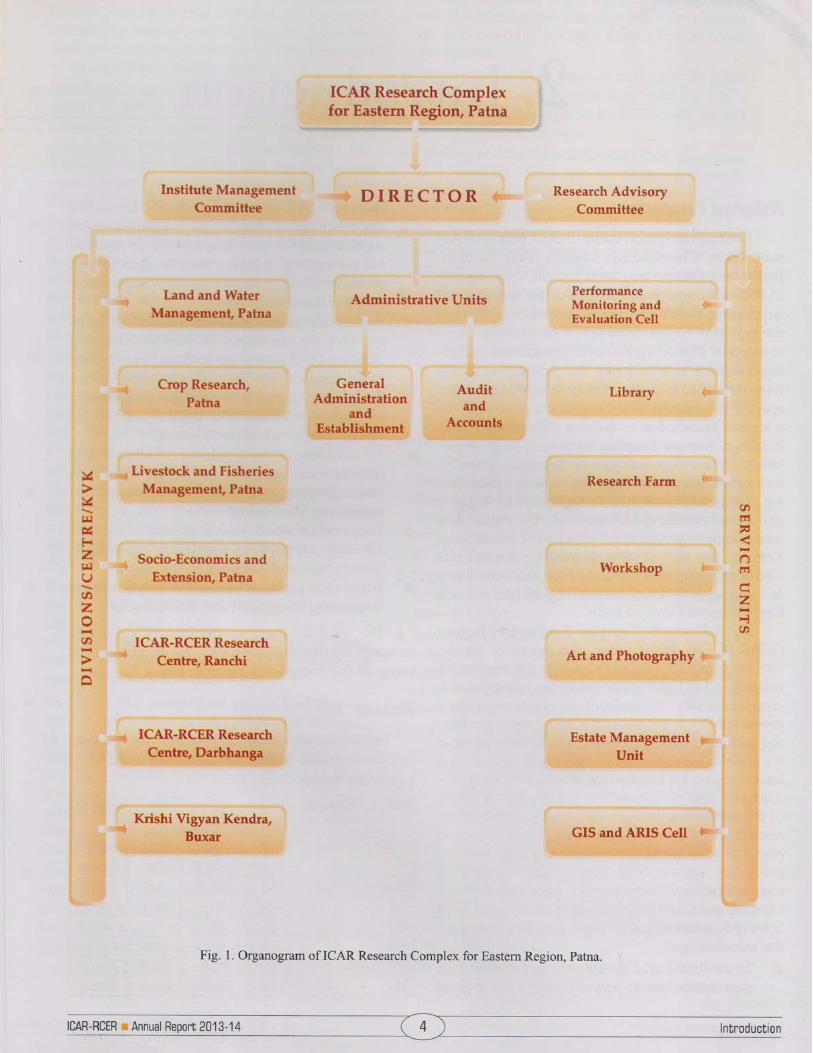
The complex has four divisions besides two research centres and one KVK. The organizational setup of the complex is given in Fig. 1
FinanceSummary of allocation and expenditure dur-
ing the financial year 2013-2014 of the complex is presented below (Table 1).Table 1. Financial allocation and expenditure during the
year 2013-14 (` in Lakhs)
Head of accounts Budget allocation Actual expenditure
Plan Non-plan Plan Non-plan
Establishment charges 0.00 1520.00 0.00 1437.71
T. A. 24.56 10.00 24.55 10.00
HRD 1.01 0.00 1.01 0.00
Works 12.90 0.00 12.90 0.00
Other charges 276.53 712.56 276.50 644.60
Total 315.00 2242.56 314.96 2092.31
2. Introduction
Wheather 5 ICAR-RCER n Annual Report 2013-14
Temperature, humidity, rainfall, wind speed, wind direction, solar radiation, soil temperature and leaf wetness in hourly interval was recorded at Patna and Ranchi.
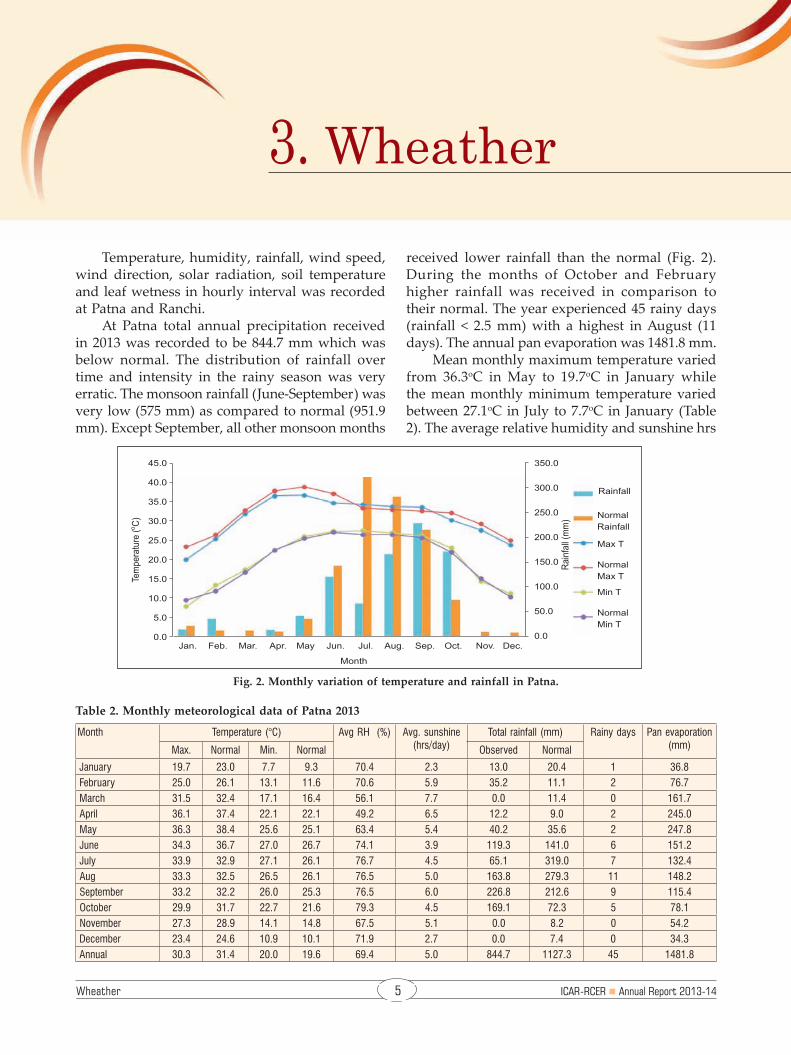
At Patna total annual precipitation received in 2013 was recorded to be 844.7 mm which was below normal. The distribution of rainfall over time and intensity in the rainy season was very erratic. The monsoon rainfall (June-September) was very low (575 mm) as compared to normal (951.9 mm). Except September, all other monsoon months
received lower rainfall than the normal (Fig. 2). During the months of October and February higher rainfall was received in comparison to their normal. The year experienced 45 rainy days (rainfall < 2.5 mm) with a highest in August (11 days). The annual pan evaporation was 1481.8 mm.
Mean monthly maximum temperature varied from 36.3oC in May to 19.7oC in January while the mean monthly minimum temperature varied between 27.1oC in July to 7.7oC in January (Table 2). The average relative humidity and sunshine hrs
Table 2. Monthly meteorological data of Patna 2013
Month Temperature (°C) Avg RH (%) Avg. sunshine (hrs/day)
Total rainfall (mm) Rainy days Pan evaporation (mm)Max. Normal Min. Normal Observed Normal
January 19.7 23.0 7.7 9.3 70.4 2.3 13.0 20.4 1 36.8February 25.0 26.1 13.1 11.6 70.6 5.9 35.2 11.1 2 76.7March 31.5 32.4 17.1 16.4 56.1 7.7 0.0 11.4 0 161.7April 36.1 37.4 22.1 22.1 49.2 6.5 12.2 9.0 2 245.0May 36.3 38.4 25.6 25.1 63.4 5.4 40.2 35.6 2 247.8June 34.3 36.7 27.0 26.7 74.1 3.9 119.3 141.0 6 151.2July 33.9 32.9 27.1 26.1 76.7 4.5 65.1 319.0 7 132.4Aug 33.3 32.5 26.5 26.1 76.5 5.0 163.8 279.3 11 148.2September 33.2 32.2 26.0 25.3 76.5 6.0 226.8 212.6 9 115.4October 29.9 31.7 22.7 21.6 79.3 4.5 169.1 72.3 5 78.1November 27.3 28.9 14.1 14.8 67.5 5.1 0.0 8.2 0 54.2December 23.4 24.6 10.9 10.1 71.9 2.7 0.0 7.4 0 34.3Annual 30.3 31.4 20.0 19.6 69.4 5.0 844.7 1127.3 45 1481.8
Fig. 2. Monthly variation of temperature and rainfall in Patna.
3. Wheather
ICAR-RCER n Annual Report 2013-14 6 Wheather
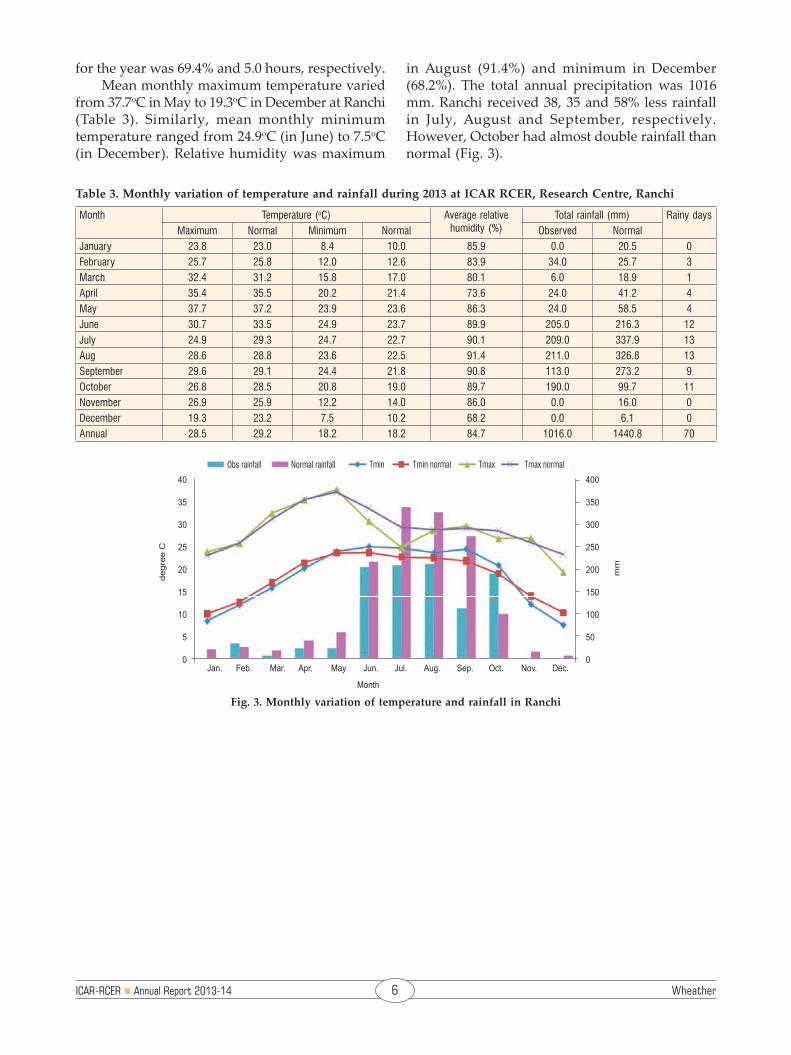
Fig. 3. Monthly variation of temperature and rainfall in Ranchi
for the year was 69.4% and 5.0 hours, respectively.Mean monthly maximum temperature varied
from 37.7oC in May to 19.3oC in December at Ranchi (Table 3). Similarly, mean monthly minimum temperature ranged from 24.9oC (in June) to 7.5oC (in December). Relative humidity was maximum
Table 3. Monthly variation of temperature and rainfall during 2013 at ICAR RCER, Research Centre, Ranchi
Month Temperature (oC) Average relative humidity (%)
Total rainfall (mm) Rainy daysMaximum Normal Minimum Normal Observed Normal
January 23.8 23.0 8.4 10.0 85.9 0.0 20.5 0February 25.7 25.8 12.0 12.6 83.9 34.0 25.7 3March 32.4 31.2 15.8 17.0 80.1 6.0 18.9 1April 35.4 35.5 20.2 21.4 73.6 24.0 41.2 4May 37.7 37.2 23.9 23.6 86.3 24.0 58.5 4June 30.7 33.5 24.9 23.7 89.9 205.0 216.3 12July 24.9 29.3 24.7 22.7 90.1 209.0 337.9 13Aug 28.6 28.8 23.6 22.5 91.4 211.0 326.8 13September 29.6 29.1 24.4 21.8 90.8 113.0 273.2 9October 26.8 28.5 20.8 19.0 89.7 190.0 99.7 11November 26.9 25.9 12.2 14.0 86.0 0.0 16.0 0December 19.3 23.2 7.5 10.2 68.2 0.0 6.1 0Annual 28.5 29.2 18.2 18.2 84.7 1016.0 1440.8 70
in August (91.4%) and minimum in December (68.2%). The total annual precipitation was 1016 mm. Ranchi received 38, 35 and 58% less rainfall in July, August and September, respectively. However, October had almost double rainfall than normal (Fig. 3).
Climate Change 7 ICAR-RCER n Annual Report 2013-14
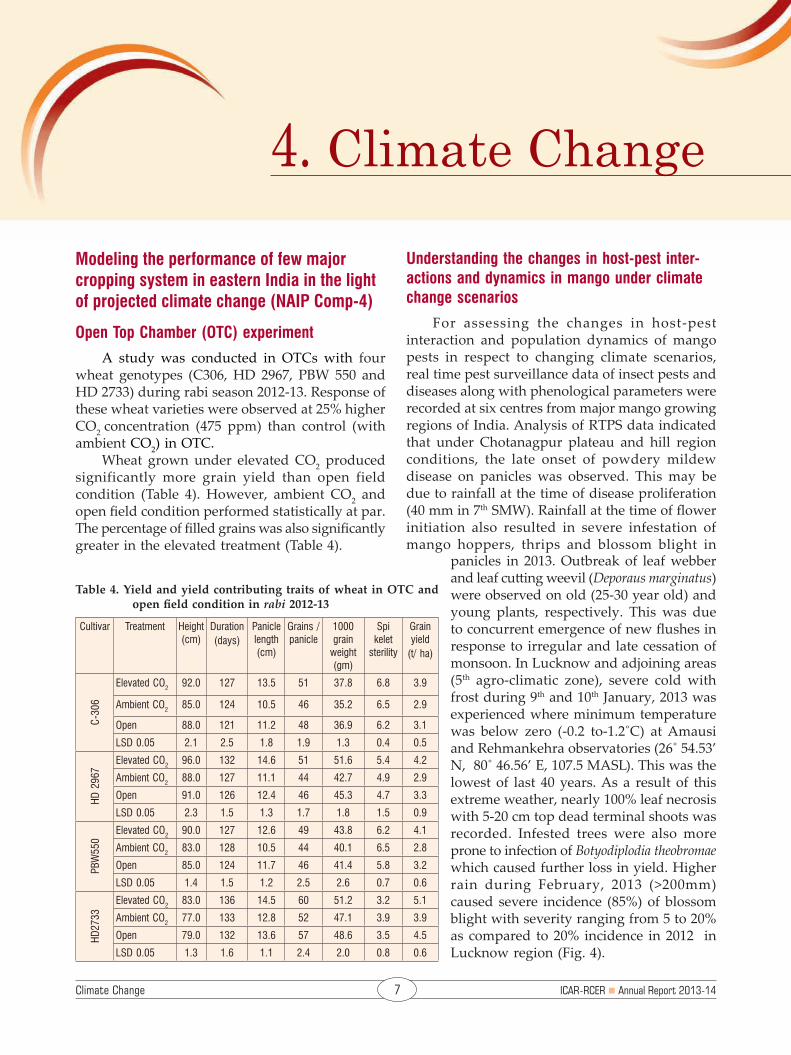
Modeling the performance of few major cropping system in eastern India in the light of projected climate change (NAIP Comp-4)
Open Top Chamber (OTC) experiment
A study was conducted in OTCs with four wheat genotypes (C306, HD 2967, PBW 550 and HD 2733) during rabi season 2012-13. Response of these wheat varieties were observed at 25% higher CO2 concentration (475 ppm) than control (with ambient CO2) in OTC.
Wheat grown under elevated CO2 produced significantly more grain yield than open field condition (Table 4). However, ambient CO2 and open field condition performed statistically at par. The percentage of filled grains was also significantly greater in the elevated treatment (Table 4).
Table 4. Yield and yield contributing traits of wheat in OTC and open field condition in rabi 2012-13
Cultivar Treatment Height (cm)
Duration(days)
Panicle length (cm)
Grains / panicle
1000 grain
weight (gm)
Spi kelet
sterility
Grain yield
(t/ ha)
C-30
6
Elevated CO2 92.0 127 13.5 51 37.8 6.8 3.9
Ambient CO2 85.0 124 10.5 46 35.2 6.5 2.9
Open 88.0 121 11.2 48 36.9 6.2 3.1
LSD 0.05 2.1 2.5 1.8 1.9 1.3 0.4 0.5
HD 2
967
Elevated CO2 96.0 132 14.6 51 51.6 5.4 4.2
Ambient CO2 88.0 127 11.1 44 42.7 4.9 2.9
Open 91.0 126 12.4 46 45.3 4.7 3.3
LSD 0.05 2.3 1.5 1.3 1.7 1.8 1.5 0.9
PBW
550
Elevated CO2 90.0 127 12.6 49 43.8 6.2 4.1
Ambient CO2 83.0 128 10.5 44 40.1 6.5 2.8
Open 85.0 124 11.7 46 41.4 5.8 3.2
LSD 0.05 1.4 1.5 1.2 2.5 2.6 0.7 0.6
HD27
33
Elevated CO2 83.0 136 14.5 60 51.2 3.2 5.1
Ambient CO2 77.0 133 12.8 52 47.1 3.9 3.9
Open 79.0 132 13.6 57 48.6 3.5 4.5
LSD 0.05 1.3 1.6 1.1 2.4 2.0 0.8 0.6
Understanding the changes in host-pest inter-actions and dynamics in mango under climate change scenarios
For assessing the changes in host-pest interaction and population dynamics of mango pests in respect to changing climate scenarios, real time pest surveillance data of insect pests and diseases along with phenological parameters were recorded at six centres from major mango growing regions of India. Analysis of RTPS data indicated that under Chotanagpur plateau and hill region conditions, the late onset of powdery mildew disease on panicles was observed. This may be due to rainfall at the time of disease proliferation (40 mm in 7th SMW). Rainfall at the time of flower initiation also resulted in severe infestation of mango hoppers, thrips and blossom blight in
panicles in 2013. Outbreak of leaf webber and leaf cutting weevil (Deporaus marginatus) were observed on old (25-30 year old) and young plants, respectively. This was due to concurrent emergence of new flushes in response to irregular and late cessation of monsoon. In Lucknow and adjoining areas (5th agro-climatic zone), severe cold with frost during 9th and 10th January, 2013 was experienced where minimum temperature was below zero (-0.2 to-1.2˚C) at Amausi and Rehmankehra observatories (26˚ 54.53’ N, 80˚ 46.56’ E, 107.5 MASL). This was the lowest of last 40 years. As a result of this extreme weather, nearly 100% leaf necrosis with 5-20 cm top dead terminal shoots was recorded. Infested trees were also more prone to infection of Botyodiplodia theobromae which caused further loss in yield. Higher rain during February, 2013 (>200mm) caused severe incidence (85%) of blossom blight with severity ranging from 5 to 20% as compared to 20% incidence in 2012 in Lucknow region (Fig. 4).
4. Climate Change

ICAR-RCER n Annual Report 2013-14 8 Climate Change
Under Gujarat conditions, mango hopper on fl ower panicles was the major pest with highest population (25/panicle) in fi rst week of November, 2012 on Alphonso variety of mango. The population exhibited significant positive correlation with maximum temperature and sun shine. Apart from mango hoppers, shoot borers, powdery mildew and anthracnose were recorded as major insect pests and diseases in the region. In Konkan region of Maharashtra, mango hopper species, Idioscopus nitidulus was the major hopper species as compared to I. nagpurensis. Thrips incidence was severe in the month of December to January due to suitable range of maximum temperature in the region (17oC to 22oC). In northern Telangana region of Andhra Pradesh, outbreak of leaf webber (almost 100 webs/tree) and hairy caterpillars (Euproctis fraterna, Porthesia scintillans) on panicles (2.6 larvae/infl orescence) and leaves were observed during the year 2012-2013. This outbreak may be att ributed to irregular and late cessation of rainfall. In Deccan (Karnataka) Plateau, increased emergence of new vegetative fl ushes during January-February resulted in infestation of shoot borer in panicles (emerging in January-February).
Hot spot mapping of pests
Based on the RTPS data collected, representa-tive hot-spot maps for mango hopper and powdery mildew at 100% fl owering stage have been gener-ated indicating the pest scenario below or above ETL (Fig. 5).
For molecular characterization of mango hop-per, Amritodus atkinsoni based on mitochondrial cy-tochrome oxidase I (COXI), nucleotide sequence have been submitt ed in NCBI and accession number have been obtained as KC513458 to KC513474.
Models for forewarning of pest/diseases
Based on three years data of hopper popula-tion, host plant phenology and weather param-eters, a forecasting model for prediction of mango hopper population was developed. The simple regression model was best fi tt ed with weather and phenological data (R2 = 0.60 and VIF = 2.47) as compared to weather alone (R2 = 0.18) or phenologi-cal parameters (R2 = 0.42). Thus, the simple linear regression model derived for weather and pheno-logical stage had the strongest relationship with hopper population per panicle or per sweep.
Prediction of future pest scenarios usingdifferent approaches
An att empt was made to understand the in-fl uence of climate change on potential population fl uctuation of fruit fl ies in Lucknow region based on historical data. Prediction of the potential population dynamics of fruit fl ies was done for diff erent time frames (2030, 2050, 2070 and 2090) under the A2B climate change scenario using re-gression equation (Fig. 6). The model predicted
Fig. 4. Blossom blight in 5th agro-climatic zone due to rain in February, 2013
Fig. 5. Leaf hopper population status on 100% fl owering stage in 2012 in diff erent locations of India based on ETL
Fig. 6. Predicted fruit fl y population using HadCM3 A2a scenarios based on average temperature
Climate Change 9 ICAR-RCER n Annual Report 2013-14
an overall gradual increase in time of fruit flies infestation period.
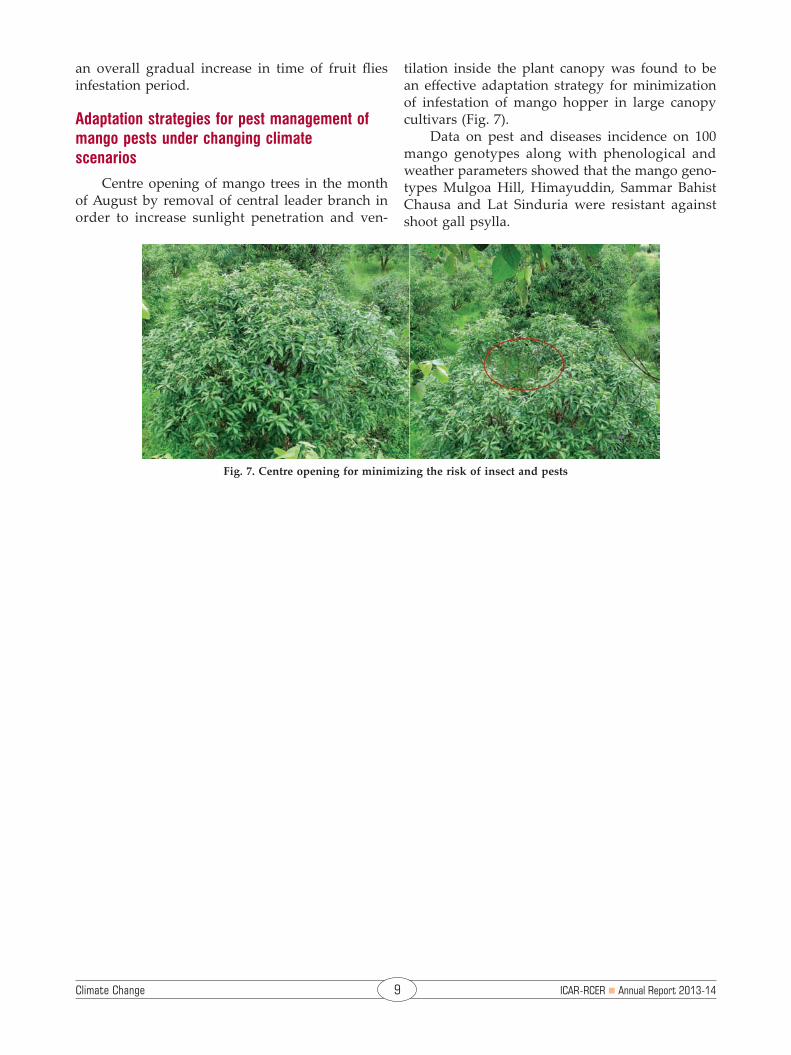
Adaptation strategies for pest management of mango pests under changing climate scenarios
Centre opening of mango trees in the month of August by removal of central leader branch in order to increase sunlight penetration and ven-
Fig. 7. Centre opening for minimizing the risk of insect and pests
tilation inside the plant canopy was found to be an effective adaptation strategy for minimization of infestation of mango hopper in large canopy cultivars (Fig. 7).
Data on pest and diseases incidence on 100 mango genotypes along with phenological and weather parameters showed that the mango geno-types Mulgoa Hill, Himayuddin, Sammar Bahist Chausa and Lat Sinduria were resistant against shoot gall psylla.
ICAR-RCER n Annual Report 2013-14 10 Cereals
5. Cereals
n Rice
characterization and evaluation of elite Genotypes and High Yielding Varieties of Rice for Aerobic condition
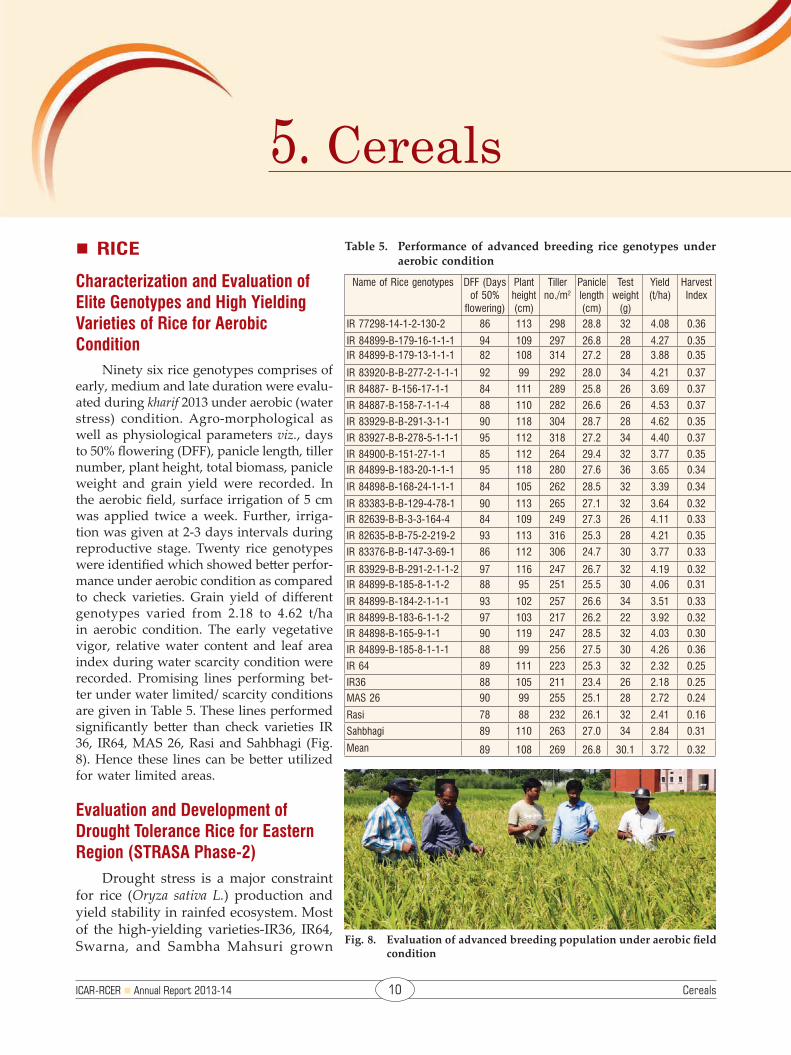
Ninety six rice genotypes comprises of early, medium and late duration were evalu-ated during kharif 2013 under aerobic (water stress) condition. Agro-morphological as well as physiological parameters viz., days to 50% flowering (DFF), panicle length, tiller number, plant height, total biomass, panicle weight and grain yield were recorded. In the aerobic field, surface irrigation of 5 cm was applied twice a week. Further, irriga-tion was given at 2-3 days intervals during reproductive stage. Twenty rice genotypes were identified which showed better perfor-mance under aerobic condition as compared to check varieties. Grain yield of different genotypes varied from 2.18 to 4.62 t/ha in aerobic condition. The early vegetative vigor, relative water content and leaf area index during water scarcity condition were recorded. Promising lines performing bet-ter under water limited/ scarcity conditions are given in Table 5. These lines performed significantly better than check varieties IR 36, IR64, MAS 26, Rasi and Sahbhagi (Fig. 8). Hence these lines can be better utilized for water limited areas.
evaluation and Development of Drought Tolerance Rice for eastern Region (STRASA Phase-2)
Drought stress is a major constraint for rice (Oryza sativa L.) production and yield stability in rainfed ecosystem. Most of the high-yielding varieties-IR36, IR64, Swarna, and Sambha Mahsuri grown
Table 5. Performance of advanced breeding rice genotypes under aerobic condition
Name of Rice genotypes DFF (Days of 50%
flowering)
Plant height (cm)
Tiller no./m2
Panicle length (cm)
Test weight
(g)
Yield (t/ha)
Harvest Index
IR 77298-14-1-2-130-2 86 113 298 28.8 32 4.08 0.36
IR 84899-B-179-16-1-1-1 94 109 297 26.8 28 4.27 0.35IR 84899-B-179-13-1-1-1 82 108 314 27.2 28 3.88 0.35
IR 83920-B-B-277-2-1-1-1 92 99 292 28.0 34 4.21 0.37
IR 84887- B-156-17-1-1 84 111 289 25.8 26 3.69 0.37
IR 84887-B-158-7-1-1-4 88 110 282 26.6 26 4.53 0.37
IR 83929-B-B-291-3-1-1 90 118 304 28.7 28 4.62 0.35
IR 83927-B-B-278-5-1-1-1 95 112 318 27.2 34 4.40 0.37
IR 84900-B-151-27-1-1 85 112 264 29.4 32 3.77 0.35IR 84899-B-183-20-1-1-1 95 118 280 27.6 36 3.65 0.34
IR 84898-B-168-24-1-1-1 84 105 262 28.5 32 3.39 0.34
IR 83383-B-B-129-4-78-1 90 113 265 27.1 32 3.64 0.32IR 82639-B-B-3-3-164-4 84 109 249 27.3 26 4.11 0.33
IR 82635-B-B-75-2-219-2 93 113 316 25.3 28 4.21 0.35
IR 83376-B-B-147-3-69-1 86 112 306 24.7 30 3.77 0.33
IR 83929-B-B-291-2-1-1-2 97 116 247 26.7 32 4.19 0.32IR 84899-B-185-8-1-1-2 88 95 251 25.5 30 4.06 0.31
IR 84899-B-184-2-1-1-1 93 102 257 26.6 34 3.51 0.33
IR 84899-B-183-6-1-1-2 97 103 217 26.2 22 3.92 0.32IR 84898-B-165-9-1-1 90 119 247 28.5 32 4.03 0.30
IR 84899-B-185-8-1-1-1 88 99 256 27.5 30 4.26 0.36
IR 64 89 111 223 25.3 32 2.32 0.25
IR36 88 105 211 23.4 26 2.18 0.25MAS 26 90 99 255 25.1 28 2.72 0.24
Rasi 78 88 232 26.1 32 2.41 0.16
Sahbhagi 89 110 263 27.0 34 2.84 0.31
Mean 89 108 269 26.8 30.1 3.72 0.32
Fig. 8. Evaluation of advanced breeding population under aerobic field condition

Cereals 11 ICAR-RCER n Annual Report 2013-14
in rainfed areas are bred for irrigated ecosystems, and thereby susceptible to drought. Because of the absence of high-yielding good-quality drought-tolerant varieties, farmers in the rainfed ecosystem continue to grow these varieties. Keeping this fact in view, 42 rice entries, received from IRRI along with some local varieties were evaluated under two treatment, i.e., reproductive stage stress condition and non-stress (irrigated). Fifty five days old seedlings were subjected to drought by withholding irrigation and withdrawing water from the field. Thereafter, crop was left rainfed and there was no standing water up to maturity. Morpho-physiological data related to drought tolerance were recorded. Some breeding lines showed better drought tolerance under field stress as compared to check varieties (Fig. 9). Grain yield varied from 2.47-7.48 t/ha and 1.26-4.76 t/ha under non stress (Irrigated) and stress (Rainfed) condition, respectively. The relative water content (RWC), chlorophyll content, and leaf area index were also recorded. The RWC values of advance breeding lines varied from 49-68%. Rice genotypes IR 88964-24-2-1-4, IR 88966-43-1-1-4, IR 88964-11-2-2-3, IR 84895-B-127-CRA-5-1-1, IR 88906-27-1-1-1 and IR 88836-4-1-4-2 under AYTGT 120 trial (Table 6) and IR 88867-4-1-1-4, IR 88867-9-1-1-4, IR 87651-26-1-1-3, IR 87638-10-1-1-3, CR 2732-2-2-1-2-1, IR 88963-3-7-2-4, IR 88864-2-1-1-3, CRR 632-34-1, REWA 842 and CRR 611-8-3-1 under AYT 100-120 trails (Table 7) performed better and showed tolerance under water stress (drought) condition at reproductive stage as compared to check varieties (Lalat, IR64, Swarna, BPT 5204, Rajendra Sweta, MTU 1010 and Sahbhagi).
Development of Management Prac-tices for Drought Tolerant Genotypes in Rainfed Agricultural System in Bihar (iRRAS)
Six drought tolerant genotypes viz., Abhishek, CR Dhan 40, Shusk Samrat, IR84899-B-183-CRA-19-1, IR83387-B-B-40-1 and IR82870-11 were evaluated
Table 6. Performance of promising genotypes of AYTGT-120 days under water stress condition
Name of rice genotypes
Days to 50%
flowering
Plant height (cm)
Panicle no./ hill
Biomass (dry wt.)/
hill (g)
Grain yield (t/ha) Har-vest IndexStress Non-stress
IR 88964-24-2-1-4 79 109.0 13.3 43.96 4.73 7.16 0.34IR 88966-43-1-1-4 75 117.0 11.7 45.73 4.33 5.62 0.35
IR 88964-11-2-2-3 77 115.0 9.3 44.12 4.07 6.34 0.28
IR 84895-B-127- CRA-5-1-1
79 123.0 11.7 41.53 3.80 6.65 0.29
IR 88906-27-1-1-1 80 121.0 12.0 40.76 3.73 6.10 0.32IR 88836-4-1-4-2 74 118.0 11.3 42.33 3.62 6.32 0.35Lalat 81 112 9.3 28.7 2.42 6.06 0.23Swarna 103 104 10.0 29.8 1.26 6.27 0.17Sambha Mahsuri 109 102 8.7 31.1 1.30 5.49 0.12Rajendra Sweta 98 96 7.3 33.7 1.47 4.98 0.15Mean 84 114 10.4 41.2 2.58 6.03 0.27CV (%) 5.90 4.54 10.31 13.22 12.98 6.47 10.7LSD (5%) 8.09 8.48 1.14 9.65 0.68 0.80 0.008
Table 7. Performance of promising genotypes of AYT 100-120 days under water stress condition
Name of entries Days to 50%
flowering
Plant height (cm)
Panicle no./ hill
Biomass (dry wt.) / hill (g)
Grain yield (t/ha) Har-vest Index
Stress Non-stress
IR 88867-4-1-1-4 73 92 11.7 36.73 4.76 6.19 0.44
IR 88867-9-1-1-4 75 87 9.5 35.63 4.55 5.97 0.47
IR 87651-26-1-1-3 74 106 11.4 42.33 4.46 5.60 0.45IR 87638-10-1-1-3 84 114 10.3 36.77 4.21 7.48 0.37CR 2732-2-2-1-2-1 79 101 11.7 29.66 3.86 5.85 0.41
IR 88963-3-7-2-4 74 98 9.9 36.43 3.74 5.94 0.46IR 88864-2-1-1-3 76 91 9.1 34.46 3.51 5.17 0.45
CRR 632-34-1 70 91 11.4 28.03 3.50 4.37 0.42
REWA 842 74 103 9.8 31.33 3.23 5.10 0.39CRR 611-8-3-1 74 107 11.5 37.91 3.32 5.09 0.37Lalat 83 103 10.5 35.08 2.69 6.31 0.38MTU1010 74 109 11.6 38.46 3.04 4.78 0.46IR64 73 95 10.2 32.72 2.04 5.40 0.40Sahbhagi 76 109 9.5 28.82 2.87 4.86 0.46Mean 78 102 10.49 34.45 3.13 5.74 0.42CV (%) 1.89 3.95 4.64 15.43 12.45 3.95 9.95LSD (5%) 2.47 6.60 3.26 4.45 0.68 0.70 0.06
Fig. 9. Screening of rice genotypes under drought stress condition

ICAR-RCER n Annual Report 2013-14 12 Cereals
under rainfed ecosystem. The main objective of this experiment was to develop, validate, refine and demonstrate best agronomic technologies for improved rice varieties along with complementary crops to increase the productivity and reduce the risk of rainfed rice based systems. All these rice genotypes used in this study were evaluated under different management practices such as SRI vs. best management practices (BMP); puddle vs. un-puddled transplanting field; and weed management. Sahbhagi, a drought tolerant variety, was also evaluated under different management practices (Fig. 10).
g/m2 in relatively weed free condition. Whereas, weed dry biomass was 330.5 and 183.4 g/m2 in plots with IR 83387-B-B-40-1 and in IR 84899-B-183-CRA-19-1, respectively. Data on interaction indicated that IR 84899-B-183-CRA-19-1 proved superior under weed free environment and produced 3.06 t/ha grain yield, while IR 82870-11 performed better under partially weeded condition (2.54 t/ha).
Genetic variability analysis and development of mapping population for drought tolerance in rice
The mapping population derived from diverse parents IR64 and IR55419-04, comprising of 196 F4 recombinant inbred lines (RILs) were evaluated under moisture stress environment during kharif 2013-14 alongwith parents. Water stress was im-posed at reproductive stage (55 days old plants) by withholding irrigation for one month and be-yond till the susceptible checks showed permanent wilting (Fig. 11). During the reproductive stage (stress period), soil moisture content status was monitored through periodical soil sampling at 30 cm soil depth after suspension water. Depth of water table was also monitored during the stress period. Observations of yield and yield contribut-ing traits were recorded on ten randomly selected plants per lines per replication for the traits, i.e., Days to 50% flowering (DFF), panicle length, tiller number, plant height, total biomass, test weight and grain yield were recorded (Table 6). Drought related data such as leaf rolling, tip drying, relative water content, total dry matter were also recorded. The F5 seeds were collected for further study. The screening of mapping population (RILs) showed that 119 recombinant inbred lines were found tolerant to drought stress at reproductive stage. Further confirmation of submergence tolerance was based on the use of polymorphic SSR markers (RM327, RM263, RM250, RM264, RM26, RM510,
Fig. 10. Evaluation of of rice varieties under different man-agement practices
Fig. 11. F4 breeding population under water stress (drought) field condition.
Grain yield of rice was significantly higher in unpuddled transplanted plots (1.72 t/ha) as compared to puddled transplanting (1.53 t/ha) under rainfed ecology. Results indicated that the maximum grain yield was attained by the genotype Abhishek under unpuddled transplanted (2.60 t/ha) and puddled transplanted (1.95 t/ha) condi-tions, respectively. Similarly, Abhishek produced maximum straw yield under both planting meth-ods. However, lowest grain yield (1.05 t/ha) was found in genotype IR 82870-11 under puddled transplanting. Interaction of establishment meth-ods and genotypes indicated that highest B:C ratio (1.86) was recorded in Abhishek when it was grown under unpuddled transplanted condition. Abhishek performed poor in puddled transplanted rice (PTR), however, it was still better than all other varieties with B:C ratio of 1.34.
Grain yield or rice was significantly higher in weed free plots (2.90 t/ha) as compared to partial weeded plots (2.37 t/ha).Weed population (72.0) and weed biomass (175.5 g/m2) were significantly higher in partial weeded plots than in relatively weed free plots (42.8 and 71.8 g/m2) at 60 DAS. The corresponding figures at harvest were 159.1 and 374.8 g/m2 in partially weeded and 94.6 and 156.0

Cereals 13 ICAR-RCER n Annual Report 2013-14
Development of Mapping Population (RiLs) for Submergence Stress Tolerance in Rice Grown in Rainfed Lowland ecosystem
The mapping population derived from diverse parents IR64 and FR13A, comprising of 217 F4 recombinant inbred lines (RILs) were evaluated under submergence stress environment during kharif 2013 alongwith parents. Stress was imposed on vegetative stage (25 days old seedling) for two weeks (Fig. 13). Agro-morphological and physiological characters viz., Days to 50% flowering (DFF), panicle number, tiller number, plant height, total biomass, test weight and grain yield were recorded. The mapping population significantly differed for all the traits studied. The days to 50% flowering ranged from 88 to 119 days whereas, plant height ranged from 108 to 156 cm, tiller number 9 to 18 per hill and grain yield 7.35 to 11.69 kg/m2 among breeding populations (Table 8). The screening of mapping population showed that 138 recombinant inbred lines were found tolerant to submergence for 10 days. Further confirmation of submergence tolerance was based on the use of polymorphic SSR markers (RM 553, RM 5515, RM 257, RM 410, RM 552, RM 222, RM 5349, RM 28755 and RM 216) linked to different submergence related characteristics (Fig. 14).
Fig. 12. Molecular profile of parents and F3 breeding popula-tion for drought tolerance with SSR Markers (RM 14, RM 250, RM520 and RM 9)
Fig. 14. Molecular profile of parents and F3 breeding popula-tion for submergence tolerance with SSR Markers (RM410, RM 553 and RM 5515)
Fig. 13. F4 breeding population under water stress (submergence) field condition
Table 8. Range in different agro-morphological traits among F4 materials generated for submergence and drought tolerance in rice
Traits F4 mapping popula-tion (Submergence)
F4 mapping popu-lation (Drought)
Mean Range Mean Range
DFF (Days to 50% flowering) 94.6 88-119 86.3 76-97
Plant height (cm) 119.9 108-156 98.6 87-125
Panicle length (cm) 27.3 23-30.5 25.6 22-32
Tiller no/ plant 13.0 9-18 11.3 8-17
Biomass (g)/ plant 134.7 109-216 97.4 83-123
Grain yield (g)/ m2 994.0 735-1169 733.0 564-1092
Leaf area (cm2) 877.0 562-1681 648.0 492-1366
Test weight (g) 21.69 20.6-22.5 21.3 18.7-23.8
Total grain/panicle 146.4 132-184 138.7 94-212
Grain sterility (%) 26.40 14.3-44.2 11.49 3.48-21.78
Survival % 63.0 32-87 — —
Varietal evaluation of wheat and lentil under different tillage practices
To see the effect of establishment methods of rice on the performance of rabi crop, five wheat and lentil varieties were evaluated during rabi season. In rainfed system, un-puddled rice field produced higher wheat and lentil yield (3.25 and 1.44 t/ha, respetively to wheat and lentil) over puddled rice field (3.13 & 1.39 t/ha accordingly to wheat and lentil) (Table 9). In puddled transplanted rice field,
RM3, RM9, RM5, RM14, RM246, RM561, RM 208, RM37, RM218, RM35 and RM520) linked to mois-ture stress (drought) (Fig. 12).

ICAR-RCER n Annual Report 2013-14 14 Cereals
conventional tillage gave higher wheat (3.14 t/ha) and lentil (1.43 t/ha) yield over zero tillage (3.12 and 1.35 t/ha, respetively, to wheat and lentil). Performance of wheat variety HI-1563 (3.39 t/ha) was found best under conventional tillage, whereas HD-2733 (3.37 t/ha) performed bett er under zero tillage environment. Performance of lentil variety Pusa Vaibhav (1.53 t/ha) was found best under conventional tillage, whereas Mallika and Pusa Vaibhav performed equally good (1.49 t/ha for both the varieties) under zero tillage.
WHeAT
Screening and evaluation of Advanced Breeding Lines of Wheat Under Rainfed Low-land ecosystem
Thirty advanced breeding lines of wheat com-prising of timely sown and late sown genotypes were evaluated under rainfed ecosystem (Fig. 15). The recommended farming practices like seed rate, fertilizers, irrigation etc. were adopted. Yield and yielding att ributes of diff erent genotypes were regularly monitored and recorded (Table 10). Wheat genotypes viz., NW5054, RAJ 4250, HD3076, HD3118 and HD3117 were identifi ed promising as compared to check varieties HD 2733, HI 1563, K307, PBW 343 & PBW 373.
Table 10. Yield and yielding att ributes of promising wheat genotypes
Genotypes Code EVV DFF (days)
Height (cm)
Test weight (g)
Grain yield (t/ha)
improved
PBW661 NE-TS-10 1 81 103 48.4 4.91
HD3076 NE-TS-11 3 82 110 49.33 5.11
NW5054 NE-TS-12 1 91 115 46.0 5.42
WH1137 NE-TS-15 1 84 99 44.5 4.86
RAJ 4250 NE-LS-05 3 70 91 39.7 5.36
HD3118 NE-LS-09 1 71 99 39.3 5.09
HD3117 NE-LS-12 1 76 102 34.5 5.06
PBW 688 NE-LS-14 3 69 99 39.1 4.87
check
HD2733 NE-TS-01 3 91 97 45.21 4.41
HI1563 NE-LS-04 3 68 98 36.7 4.36
PBW 343 PBW 343 3 85 99 42.53 4.34
PBW 373 PBW 373 5 77 93 37.18 3.87
K307 NE-TS-07 3 90 101 43.2 4.47
DBW 39 NE-TS-08 5 89 92 41.7 4.26
DBW 14 NE-LS-08 5 67 89 34.7 4.05
EVV = Early Vegetative Vigour; DFF = Days of 50% flowering
effect of irrigation frequency at varying soil depth on productivity of wheat in Bihar plains
Scheduling irrigation of wheat based on soil water tension can help in increasing irrigation water productivity through avoiding water defi cit stress and excess irrigation. However, there are no rigorously determined guidelines on what depth to place the tensiometers, nor the optimum irrigation threshold. Therefore, a series of experiments was conducted to evaluate the effects of irrigation threshold and measurement depth on wheat yield, irrigation water use and water productivity.
Maximum irrigation water was applied in plots where the tensiometer was set at 20 kPa. However,
Fig. 15. Screening of wheat genotypes under rainfed condi-tion
Table 9. Eff ect of tillage practices on grain yield (t/ha) of wheat and lentil varieties under rice based cropping system
Wheat varieties Puddled transplanted field Un-puddled transplanted fieldCT ZT CT ZT
PBW 343 3.13 2.98 3.15 3.14
HD 2733 3.06 3.38 3.20 3.39
HD 2824 2.94 3.14 3.19 3.48
HI 1563 3.31 3.01 3.31 3.30
PBW 373 3.24 3.10 3.20 3.19
Mean 3.14 3.12 3.21 3.30
Lentil varieties
Arun 1.19 1.11 1.18 1.26
PL 406 1.46 1.34 1.48 1.48
Mallika 1.52 1.47 1.51 1.51
Pusa Vaibhav 1.53 1.45 1.52 1.53
Shivalik 1.47 1.36 1.47 1.53
Mean 1.43 1.35 1.41 1.46
CT= Conventional tillage, ZT= Zero tillage
Cereals 15 ICAR-RCER n Annual Report 2013-14
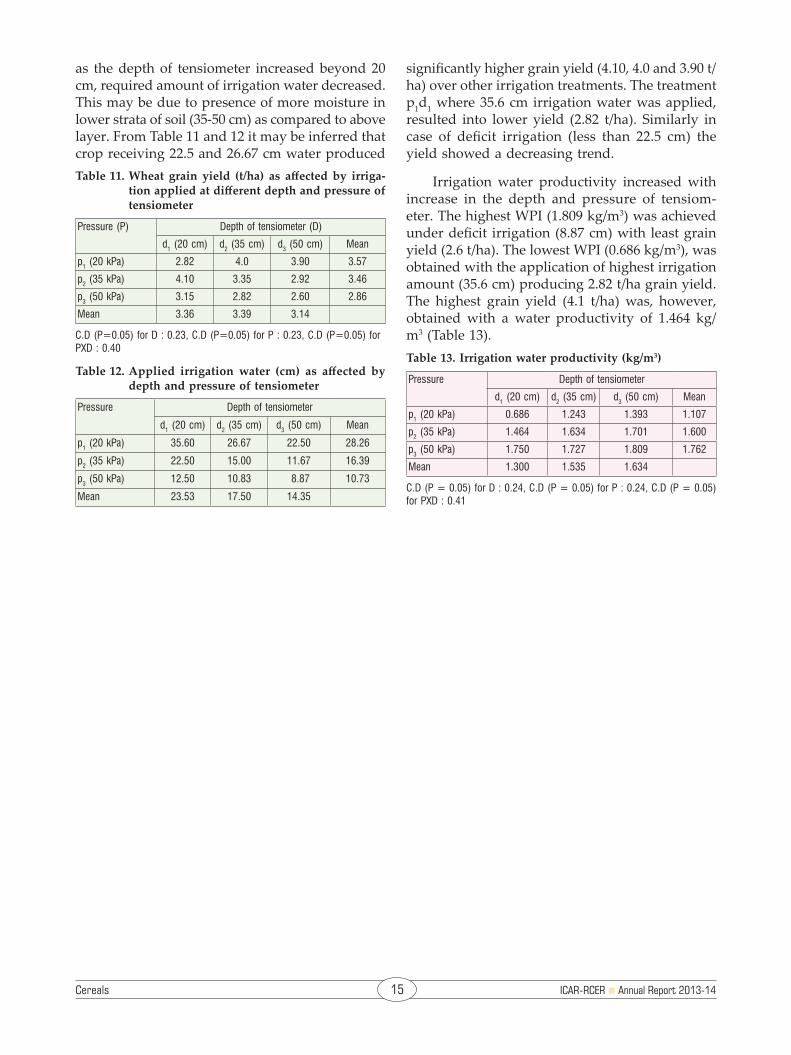
as the depth of tensiometer increased beyond 20 cm, required amount of irrigation water decreased. This may be due to presence of more moisture in lower strata of soil (35-50 cm) as compared to above layer. From Table 11 and 12 it may be inferred that crop receiving 22.5 and 26.67 cm water produced
significantly higher grain yield (4.10, 4.0 and 3.90 t/ha) over other irrigation treatments. The treatment p1d1 where 35.6 cm irrigation water was applied, resulted into lower yield (2.82 t/ha). Similarly in case of deficit irrigation (less than 22.5 cm) the yield showed a decreasing trend.
Irrigation water productivity increased with increase in the depth and pressure of tensiom-eter. The highest WPI (1.809 kg/m3) was achieved under deficit irrigation (8.87 cm) with least grain yield (2.6 t/ha). The lowest WPI (0.686 kg/m3), was obtained with the application of highest irrigation amount (35.6 cm) producing 2.82 t/ha grain yield. The highest grain yield (4.1 t/ha) was, however, obtained with a water productivity of 1.464 kg/m3 (Table 13).Table 13. Irrigation water productivity (kg/m3)
Pressure Depth of tensiometer
d1 (20 cm) d2 (35 cm) d3 (50 cm) Mean
p1 (20 kPa) 0.686 1.243 1.393 1.107
p2 (35 kPa) 1.464 1.634 1.701 1.600
p3 (50 kPa) 1.750 1.727 1.809 1.762
Mean 1.300 1.535 1.634
C.D (P = 0.05) for D : 0.24, C.D (P = 0.05) for P : 0.24, C.D (P = 0.05) for PXD : 0.41
Table 11. Wheat grain yield (t/ha) as affected by irriga-tion applied at different depth and pressure of tensiometer
Pressure (P) Depth of tensiometer (D)
d1 (20 cm) d2 (35 cm) d3 (50 cm) Mean
p1 (20 kPa) 2.82 4.0 3.90 3.57
p2 (35 kPa) 4.10 3.35 2.92 3.46
p3 (50 kPa) 3.15 2.82 2.60 2.86
Mean 3.36 3.39 3.14
C.D (P=0.05) for D : 0.23, C.D (P=0.05) for P : 0.23, C.D (P=0.05) for PXD : 0.40
Table 12. Applied irrigation water (cm) as affected by depth and pressure of tensiometer
Pressure Depth of tensiometer
d1 (20 cm) d2 (35 cm) d3 (50 cm) Mean
p1 (20 kPa) 35.60 26.67 22.50 28.26
p2 (35 kPa) 22.50 15.00 11.67 16.39
p3 (50 kPa) 12.50 10.83 8.87 10.73
Mean 23.53 17.50 14.35
ICAR-RCER n Annual Report 2013-14 16 Pulses
Crop Diversification with Faba bean to Improve Land and Water Productivity
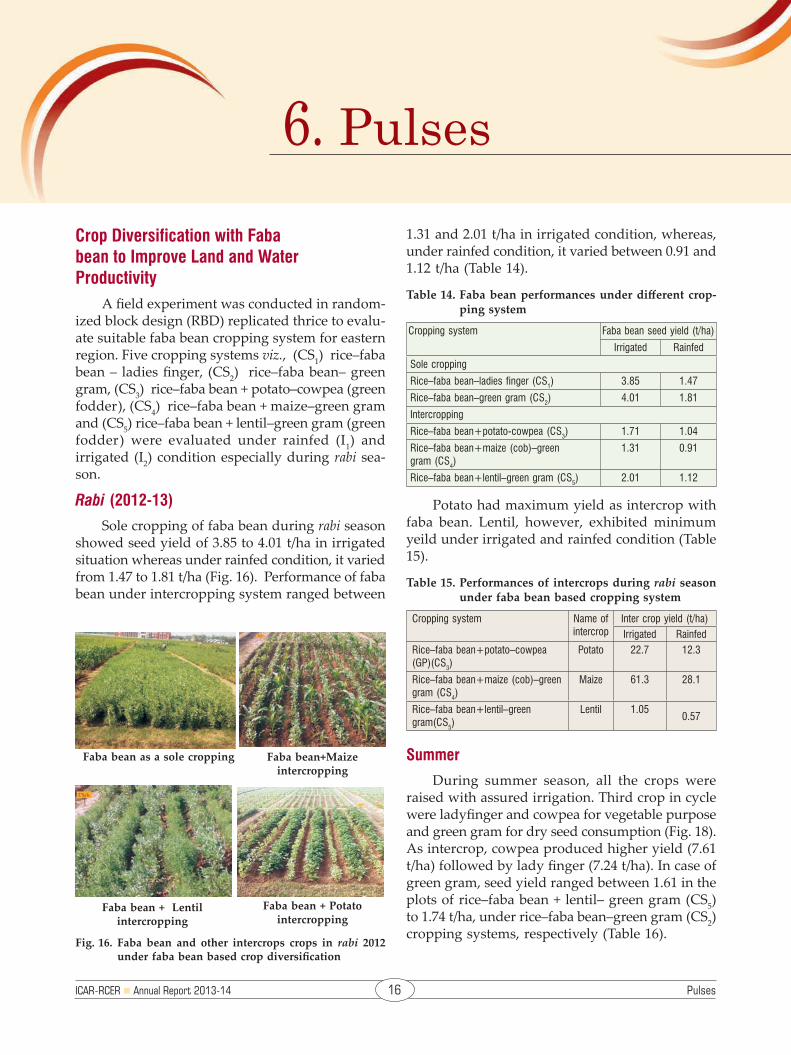
A field experiment was conducted in random-ized block design (RBD) replicated thrice to evalu-ate suitable faba bean cropping system for eastern region. Five cropping systems viz., (CS1) rice–faba bean – ladies finger, (CS2) rice–faba bean– green gram, (CS3) rice–faba bean + potato–cowpea (green fodder), (CS4) rice–faba bean + maize–green gram and (CS5) rice–faba bean + lentil–green gram (green fodder) were evaluated under rainfed (I1) and irrigated (I2) condition especially during rabi sea-son.
Rabi (2012-13)
Sole cropping of faba bean during rabi season showed seed yield of 3.85 to 4.01 t/ha in irrigated situation whereas under rainfed condition, it varied from 1.47 to 1.81 t/ha (Fig. 16). Performance of faba bean under intercropping system ranged between
1.31 and 2.01 t/ha in irrigated condition, whereas, under rainfed condition, it varied between 0.91 and 1.12 t/ha (Table 14).
Table 14. Faba bean performances under different crop-ping system
Cropping system Faba bean seed yield (t/ha)
Irrigated Rainfed
Sole cropping
Rice–faba bean–ladies finger (CS1) 3.85 1.47
Rice–faba bean–green gram (CS2) 4.01 1.81
Intercropping
Rice–faba bean+potato-cowpea (CS3) 1.71 1.04
Rice–faba bean+maize (cob)–green gram (CS4)
1.31 0.91
Rice–faba bean+lentil–green gram (CS5) 2.01 1.12
Potato had maximum yield as intercrop with faba bean. Lentil, however, exhibited minimum yeild under irrigated and rainfed condition (Table 15).
Table 15. Performances of intercrops during rabi season under faba bean based cropping system
Cropping system Name of intercrop
Inter crop yield (t/ha)Irrigated Rainfed
Rice–faba bean+potato–cowpea (GP)(CS3)
Potato 22.7 12.3
Rice–faba bean+maize (cob)–green gram (CS4)
Maize 61.3 28.1
Rice–faba bean+lentil–green gram(CS5)
Lentil 1.050.57
Summer
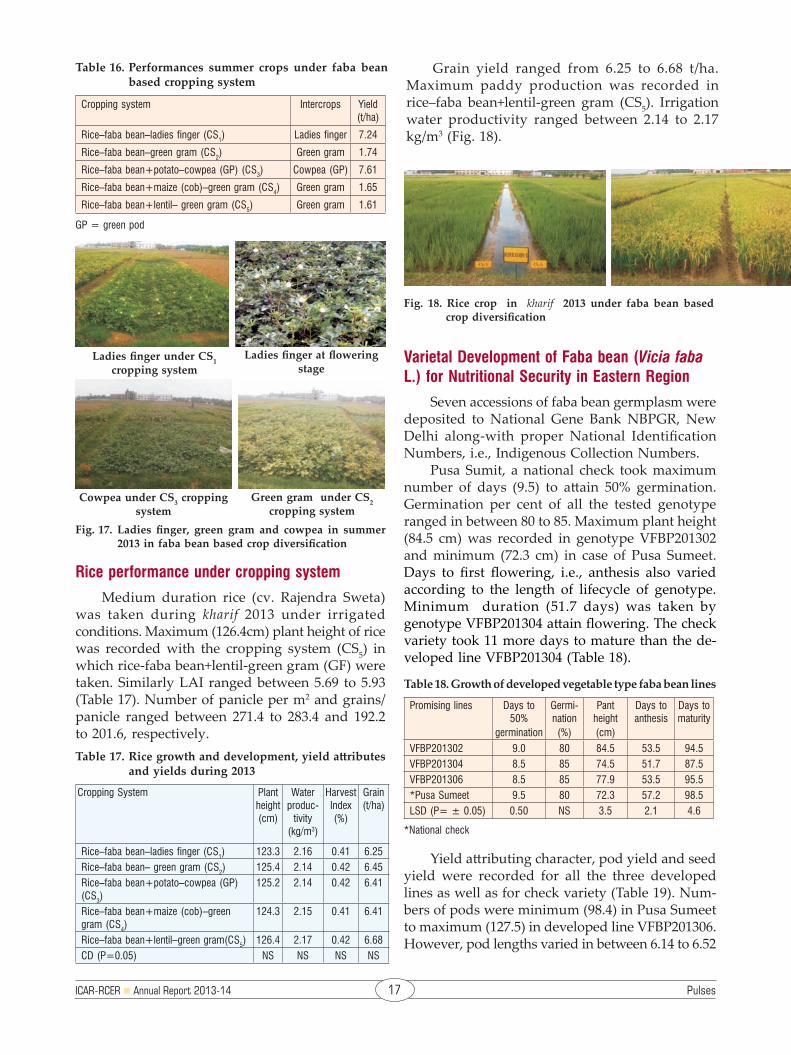
During summer season, all the crops were raised with assured irrigation. Third crop in cycle were ladyfinger and cowpea for vegetable purpose and green gram for dry seed consumption (Fig. 18). As intercrop, cowpea produced higher yield (7.61 t/ha) followed by lady finger (7.24 t/ha). In case of green gram, seed yield ranged between 1.61 in the plots of rice–faba bean + lentil– green gram (CS5) to 1.74 t/ha, under rice–faba bean–green gram (CS2) cropping systems, respectively (Table 16).
Faba bean as a sole cropping Faba bean+Maizeintercropping
Faba bean + Lentilintercropping
Faba bean + Potato intercropping
Fig. 16. Faba bean and other intercrops crops in rabi 2012 under faba bean based crop diversification
6. Pulses
ICAR-RCER n Annual Report 2013-14 17 Pulses
Table 16. Performances summer crops under faba bean based cropping system
Cropping system Intercrops Yield (t/ha)
Rice–faba bean–ladies finger (CS1) Ladies finger 7.24
Rice–faba bean–green gram (CS2) Green gram 1.74
Rice–faba bean+potato–cowpea (GP) (CS3) Cowpea (GP) 7.61
Rice–faba bean+maize (cob)–green gram (CS4) Green gram 1.65
Rice–faba bean+lentil– green gram (CS5) Green gram 1.61
GP = green pod
Ladies finger under CS1 cropping system
Ladies finger at flowering stage
Cowpea under CS3 cropping system
Green gram under CS2 cropping system
Fig. 17. Ladies finger, green gram and cowpea in summer 2013 in faba bean based crop diversification
Rice performance under cropping system
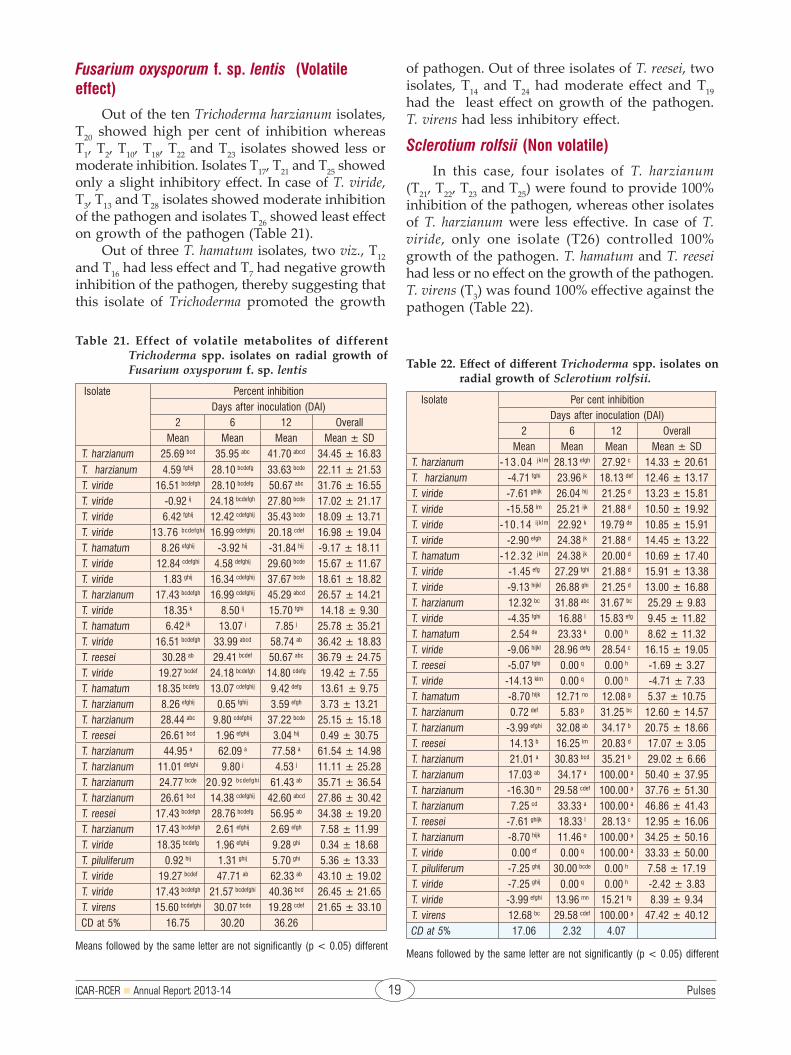
Medium duration rice (cv. Rajendra Sweta) was taken during kharif 2013 under irrigated conditions. Maximum (126.4cm) plant height of rice was recorded with the cropping system (CS5) in which rice-faba bean+lentil-green gram (GF) were taken. Similarly LAI ranged between 5.69 to 5.93 (Table 17). Number of panicle per m2 and grains/panicle ranged between 271.4 to 283.4 and 192.2 to 201.6, respectively.Table 17. Rice growth and development, yield attributes
and yields during 2013
Cropping System Plant height (cm)
Water produc-
tivity (kg/m3)
Harvest Index (%)
Grain (t/ha)
Rice–faba bean–ladies finger (CS1) 123.3 2.16 0.41 6.25Rice–faba bean– green gram (CS2) 125.4 2.14 0.42 6.45Rice–faba bean+potato–cowpea (GP)(CS3)
125.2 2.14 0.42 6.41
Rice–faba bean+maize (cob)–green gram (CS4)
124.3 2.15 0.41 6.41
Rice–faba bean+lentil–green gram(CS5) 126.4 2.17 0.42 6.68CD (P=0.05) NS NS NS NS
Fig. 18. Rice crop in kharif 2013 under faba bean based crop diversification
Grain yield ranged from 6.25 to 6.68 t/ha. Maximum paddy production was recorded in rice–faba bean+lentil-green gram (CS5). Irrigation water productivity ranged between 2.14 to 2.17 kg/m3 (Fig. 18).
Varietal Development of Faba bean (Vicia faba L.) for Nutritional Security in Eastern Region
Seven accessions of faba bean germplasm were deposited to National Gene Bank NBPGR, New Delhi along-with proper National Identification Numbers, i.e., Indigenous Collection Numbers.
Pusa Sumit, a national check took maximum number of days (9.5) to attain 50% germination. Germination per cent of all the tested genotype ranged in between 80 to 85. Maximum plant height (84.5 cm) was recorded in genotype VFBP201302 and minimum (72.3 cm) in case of Pusa Sumeet. Days to first flowering, i.e., anthesis also varied according to the length of lifecycle of genotype. Minimum duration (51.7 days) was taken by genotype VFBP201304 attain flowering. The check variety took 11 more days to mature than the de-veloped line VFBP201304 (Table 18).
Table 18. Growth of developed vegetable type faba bean lines
Promising lines Days to 50%
germination
Germi-nation(%)
Pant height(cm)
Days to anthesis
Days to maturity
VFBP201302 9.0 80 84.5 53.5 94.5VFBP201304 8.5 85 74.5 51.7 87.5VFBP201306 8.5 85 77.9 53.5 95.5*Pusa Sumeet 9.5 80 72.3 57.2 98.5LSD (P= ± 0.05) 0.50 NS 3.5 2.1 4.6
*National check
Yield attributing character, pod yield and seed yield were recorded for all the three developed lines as well as for check variety (Table 19). Num-bers of pods were minimum (98.4) in Pusa Sumeet to maximum (127.5) in developed line VFBP201306. However, pod lengths varied in between 6.14 to 6.52

ICAR-RCER n Annual Report 2013-14 18 Pulses
cm (Table 19). Minimum time taken (days to first pod picking) ranged from 63.5 for developed line VFBP201302 to 69.5 in case of Pusa Sumeet. Num-bers of seed per pods varied narrowly in between 5.1 to 5.6. Green pod yield (t/ha) ranged in between 18.92 (Pusa Sumeet) to 23.54 (VFBP201302). All the developed lines yielded higher and found superior to Pusa Sumeet (check variety). Similar trend was also observed in case of grain yield and it ranged in between 29.7 to 36.9. However, 100 seed weight did not vary significantly.
Table 19. Yield attribution of developed vegetable type faba bean lines
Name of line/variety
Pods /plant
Green pod yield (t/ha)
First pod picking (days)
Grain yield (t/ha)
VFBP201302 112.7 23.54 63.5 3.69VFBP201304 123.4 21.51 65.5 3.57VFBP201306 127.5 22.64 66.5 3.61*Pusa Sumeet 98.4 18.92 69.5 2.97LSD (P< 0.05) 4.21 1.19 2.3 0.25
*National check
In vitro Evaluation of Trichoderma Isolates against Wilt Complex Pathogen of Lentil
Fusarium oxysporum f. sp. lentis (non volatile effect)
Thirty isolates of Trichoderma spp. (referred herein as T1-T30). The data were recorded at 2, 6 and 12 days after incubation (Table 20 & Fig. 19). At the end of 12 days of incubation, out of ten T. harzianum isolates tested, seven (T10, T17, T18, T20, T22, T23 and T25) were found to provide 100% inhibition, whereas isolate T1 has moderate inhibitory effect
Fig. 19. Culture features of pathogen on PDA 1. Fusarium oxysporum f. sp. lentis (Nos. 1, 2, 3, 4 plates in dif-ferent locations of wilted lentil plants) and Nos. 5 & 6 initially rotted plants due to Sclerotium rolfsii
Table 20. Effect of different Trichoderma spp. isolates on radial growth of Fusarium oxysporum f.sp. lentis
Isolate Per cent inhibitionDays after inoculation (DAI)
2 6 12 OverallMean Mean Mean Mean ± SD
T. harzianum 20.37 abcde 45.21bcd 62.67 d 62.96 ± 2.56T. harzianum 6.48 defgh 28.77 ghij 13.33 ghi 40.74 ± 21.02T. viride 15.74 bcdef 30.14 fghij 6.67 jkl 40.30 ± 25.48T. viride 13.89 cdef 35.62 defgh 1.78 m 39.56 ± 28.45T. viride 9.26 cdefg 26.71 hij -12.00 n 32.30 ± 33.58T. viride 1.85 efgh 21.23 jk 8.89 ijk 37.19 ± 21.73T. hamatum 0.00 fgh 26.71 hij 0.89 m 36.15 ± 26.49T. viride 10.19 cdefg 35.62 defgh 5.33 klm 40.15 ± 26.14T. viride 16.67 abcdef 33.56 efghi 1.33 m 39.41 ± 28.65T. harzianum 27.78 abc 45.21 bcd 100.00 a 76.59 ± 17.68T. viride 16.67 abcdef 28.77 ghij 5.33 klm 39.70 ± 25.94T. hamatum 12.96 cdef 36.99 defgh 3.56 lm 40.30 ± 28.14T. viride 21.30 abcd 46.58 bcd 100.00 a 75.85 ± 18.34T. reesei 16.67 abcdef 42.47 bcde 35.11 e 52.59 ± 13.63T. viride 0.00 fgh 28.77 ghij 9.78 hijk 38.52 ± 21.97T. hamatum 22.22 abcd 38.36 cdefg 10.67 hij 44.44 ± 25.43T. harzianum -11.11 hi 15.07 k 100.00 a 66.22 ± 25.79T. harzianum 35.19 a 100.00 a 100.00 a 89.63 ± 16.02T. reesei 14.81 cdef 23.29 ijk 15.56 g 41.63 ± 19.96T. harzianum 22.22 abcd 41.10 bcdef 100.00 a 74.81 ± 18.97T. harzianum 11.11 cdefg 46.58 bcd 79.56 b 67.41 ± 10.29T. harzianum 34.26 ab 52.05 b 100.00 a 79.11 ± 15.69T. harzianum -1.85 fghi 28.08 ghij 100.00 a 68.15 ± 25.30T. reesei 9.26 cdefg 31.51 efghij 71.11 c 61.04 ± 9.09T. harzianum -7.41 ghi 49.32 bc 100.00 a 74.22 ± 20.35T. viride 12.96 cdef 41.10 bcdef 100.00 a 73.33 ± 20.13T. piluliferum 5.56 defgh 15.07 k 13.78 gh 37.78 ± 19.52T. viride 6.48 defgh 23.29 ijk 23.11 f 43.41 ± 15.78T. viride -20.37 i 28.77 ghij 16.89 g 41.33 ± 18.68T. virens 16.67 abcdef 38.36 cdefg 17.78 g 45.93 ± 21.20CD at 5% 18.77 11.63 4.52
Means followed by the same letter are not significantly (p < 0.05) different.
(62.67% inhibition). In all these cases there was 100% inhibition by T. harzianum, the antagonist also grew over the pathogen’s mycelium causing lysis. Microscopic examination indicated that the myce-lium of the F. oxysporum f. sp. lentis was partially or completely degraded by T. harzianum. T10, T18, T22 and T23 isolates completely degraded the pathogen. Trend of inhibition observed at 2 and 6 days after inoculation was similar to the one observed after 12 days of incubation.
Out of the twelve T. viride isolates tested, only two isolates viz., T13 and T26 showed 100% inhibition of the pathogen. Microscopic examination revealed that there was partial to complete mycelium degra-dation of the pathogen by the antagonists.
ICAR-RCER n Annual Report 2013-14 19 Pulses
Fusarium oxysporum f. sp. lentis (Volatile effect)
Out of the ten Trichoderma harzianum isolates, T20 showed high per cent of inhibition whereas T1, T2, T10, T18, T22 and T23 isolates showed less or moderate inhibition. Isolates T17, T21 and T25 showed only a slight inhibitory effect. In case of T. viride, T3, T13 and T28 isolates showed moderate inhibition of the pathogen and isolates T26 showed least effect on growth of the pathogen (Table 21).
Out of three T. hamatum isolates, two viz., T12 and T16 had less effect and T7 had negative growth inhibition of the pathogen, thereby suggesting that this isolate of Trichoderma promoted the growth
of pathogen. Out of three isolates of T. reesei, two isolates, T14 and T24 had moderate effect and T19 had the least effect on growth of the pathogen. T. virens had less inhibitory effect.
Sclerotium rolfsii (Non volatile)
In this case, four isolates of T. harzianum (T21, T22, T23 and T25) were found to provide 100% inhibition of the pathogen, whereas other isolates of T. harzianum were less effective. In case of T. viride, only one isolate (T26) controlled 100% growth of the pathogen. T. hamatum and T. reesei had less or no effect on the growth of the pathogen. T. virens (T3) was found 100% effective against the pathogen (Table 22).
Table 21. Effect of volatile metabolites of different Trichoderma spp. isolates on radial growth of Fusarium oxysporum f. sp. lentis
Isolate Percent inhibitionDays after inoculation (DAI)
2 6 12 OverallMean Mean Mean Mean ± SD
T. harzianum 25.69 bcd 35.95 abc 41.70 abcd 34.45 ± 16.83
T. harzianum 4.59 fghij 28.10 bcdefg 33.63 bcde 22.11 ± 21.53T. viride 16.51 bcdefgh 28.10 bcdefg 50.67 abc 31.76 ± 16.55T. viride -0.92 ij 24.18 bcdefgh 27.80 bcde 17.02 ± 21.17T. viride 6.42 fghij 12.42 cdefghij 35.43 bcde 18.09 ± 13.71T. viride 13.76 bcdefghi 16.99 cdefghij 20.18 cdef 16.98 ± 19.04T. hamatum 8.26 efghij -3.92 hij -31.84 hij -9.17 ± 18.11T. viride 12.84 cdefghi 4.58 defghij 29.60 bcde 15.67 ± 11.67T. viride 1.83 ghij 16.34 cdefghij 37.67 bcde 18.61 ± 18.82T. harzianum 17.43 bcdefgh 16.99 cdefghij 45.29 abcd 26.57 ± 14.21T. viride 18.35 k 8.50 ij 15.70 fghi 14.18 ± 9.30T. hamatum 6.42 jk 13.07 j 7.85 j 25.78 ± 35.21T. viride 16.51 bcdefgh 33.99 abcd 58.74 ab 36.42 ± 18.83T. reesei 30.28 ab 29.41 bcdef 50.67 abc 36.79 ± 24.75T. viride 19.27 bcdef 24.18 bcdefgh 14.80 cdefg 19.42 ± 7.55T. hamatum 18.35 bcdefg 13.07 cdefghij 9.42 defg 13.61 ± 9.75T. harzianum 8.26 efghij 0.65 fghij 3.59 efgh 3.73 ± 13.21T. harzianum 28.44 abc 9.80 cdefghij 37.22 bcde 25.15 ± 15.18T. reesei 26.61 bcd 1.96 efghij 3.04 hij 0.49 ± 30.75T. harzianum 44.95 a 62.09 a 77.58 a 61.54 ± 14.98T. harzianum 11.01 defghi 9.80 j 4.53 j 11.11 ± 25.28T. harzianum 24.77 bcde 20.92 bcdefghi 61.43 ab 35.71 ± 36.54T. harzianum 26.61 bcd 14.38 cdefghij 42.60 abcd 27.86 ± 30.42T. reesei 17.43 bcdefgh 28.76 bcdefg 56.95 ab 34.38 ± 19.20T. harzianum 17.43 bcdefgh 2.61 efghij 2.69 efgh 7.58 ± 11.99T. viride 18.35 bcdefg 1.96 efghij 9.28 ghi 0.34 ± 18.68T. piluliferum 0.92 hij 1.31 ghij 5.70 ghi 5.36 ± 13.33T. viride 19.27 bcdef 47.71 ab 62.33 ab 43.10 ± 19.02T. viride 17.43 bcdefgh 21.57 bcdefghi 40.36 bcd 26.45 ± 21.65T. virens 15.60 bcdefghi 30.07 bcde 19.28 cdef 21.65 ± 33.10CD at 5% 16.75 30.20 36.26
Means followed by the same letter are not significantly (p < 0.05) different
Table 22. Effect of different Trichoderma spp. isolates on radial growth of Sclerotium rolfsii.
Isolate Per cent inhibitionDays after inoculation (DAI)
2 6 12 OverallMean Mean Mean Mean ± SD
T. harzianum -13.04 jk lm 28.13 efgh 27.92 c 14.33 ± 20.61T. harzianum -4.71 fghi 23.96 jk 18.13 def 12.46 ± 13.17T. viride -7.61 ghijk 26.04 hij 21.25 d 13.23 ± 15.81T. viride -15.58 lm 25.21 ijk 21.88 d 10.50 ± 19.92T. viride -10.14 ijklm 22.92 k 19.79 de 10.85 ± 15.91T. viride -2.90 efgh 24.38 jk 21.88 d 14.45 ± 13.22T. hamatum -12.32 jk lm 24.38 jk 20.00 d 10.69 ± 17.40T. viride -1.45 efg 27.29 fghi 21.88 d 15.91 ± 13.38T. viride -9.13 hijkl 26.88 ghi 21.25 d 13.00 ± 16.88T. harzianum 12.32 bc 31.88 abc 31.67 bc 25.29 ± 9.83T. viride -4.35 fghi 16.88 l 15.83 efg 9.45 ± 11.82T. hamatum 2.54 de 23.33 k 0.00 h 8.62 ± 11.32T. viride -9.06 hijkl 28.96 defg 28.54 c 16.15 ± 19.05T. reesei -5.07 fghi 0.00 q 0.00 h -1.69 ± 3.27T. viride -14.13 klm 0.00 q 0.00 h -4.71 ± 7.33T. hamatum -8.70 hijk 12.71 no 12.08 g 5.37 ± 10.75T. harzianum 0.72 def 5.83 p 31.25 bc 12.60 ± 14.57T. harzianum -3.99 efghi 32.08 ab 34.17 b 20.75 ± 18.66T. reesei 14.13 b 16.25 lm 20.83 d 17.07 ± 3.05T. harzianum 21.01 a 30.83 bcd 35.21 b 29.02 ± 6.66T. harzianum 17.03 ab 34.17 a 100.00 a 50.40 ± 37.95T. harzianum -16.30 m 29.58 cdef 100.00 a 37.76 ± 51.30T. harzianum 7.25 cd 33.33 a 100.00 a 46.86 ± 41.43T. reesei -7.61 ghijk 18.33 l 28.13 c 12.95 ± 16.06T. harzianum -8.70 hijk 11.46 o 100.00 a 34.25 ± 50.16T. viride 0.00 ef 0.00 q 100.00 a 33.33 ± 50.00T. piluliferum -7.25 ghij 30.00 bcde 0.00 h 7.58 ± 17.19T. viride -7.25 ghij 0.00 q 0.00 h -2.42 ± 3.83T. viride -3.99 efghi 13.96 mn 15.21 fg 8.39 ± 9.34T. virens 12.68 bc 29.58 cdef 100.00 a 47.42 ± 40.12CD at 5% 17.06 2.32 4.07
Means followed by the same letter are not significantly (p < 0.05) different
ICAR-RCER n Annual Report 2013-14 20 Pulses
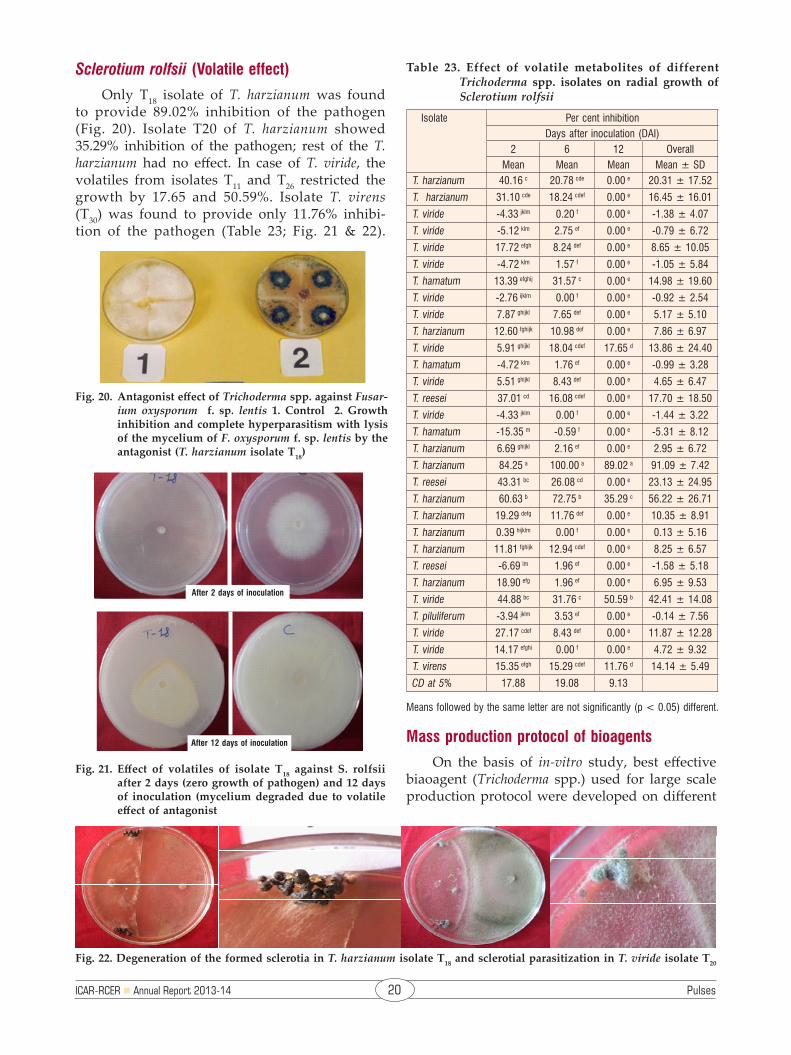
Sclerotium rolfsii (Volatile effect)
Only T18 isolate of T. harzianum was found to provide 89.02% inhibition of the pathogen (Fig. 20). Isolate T20 of T. harzianum showed 35.29% inhibition of the pathogen; rest of the T. harzianum had no effect. In case of T. viride, the volatiles from isolates T11 and T26 restricted the growth by 17.65 and 50.59%. Isolate T. virens (T30) was found to provide only 11.76% inhibi-tion of the pathogen (Table 23; Fig. 21 & 22).
Mass production protocol of bioagents
On the basis of in-vitro study, best effective biaoagent (Trichoderma spp.) used for large scale production protocol were developed on different
Fig. 20. Antagonist effect of Trichoderma spp. against Fusar-ium oxysporum f. sp. lentis 1. Control 2. Growth inhibition and complete hyperparasitism with lysis of the mycelium of F. oxysporum f. sp. lentis by the antagonist (T. harzianum isolate T18)
Fig. 21. Effect of volatiles of isolate T18 against S. rolfsii after 2 days (zero growth of pathogen) and 12 days of inoculation (mycelium degraded due to volatile effect of antagonist
Table 23. Effect of volatile metabolites of different Trichoderma spp. isolates on radial growth of Sclerotium rolfsii
Isolate Per cent inhibitionDays after inoculation (DAI)
2 6 12 OverallMean Mean Mean Mean ± SD
T. harzianum 40.16 c 20.78 cde 0.00 e 20.31 ± 17.52
T. harzianum 31.10 cde 18.24 cdef 0.00 e 16.45 ± 16.01
T. viride -4.33 jklm 0.20 f 0.00 e -1.38 ± 4.07
T. viride -5.12 klm 2.75 ef 0.00 e -0.79 ± 6.72
T. viride 17.72 efgh 8.24 def 0.00 e 8.65 ± 10.05
T. viride -4.72 klm 1.57 f 0.00 e -1.05 ± 5.84
T. hamatum 13.39 efghij 31.57 c 0.00 e 14.98 ± 19.60
T. viride -2.76 ijklm 0.00 f 0.00 e -0.92 ± 2.54
T. viride 7.87 ghijkl 7.65 def 0.00 e 5.17 ± 5.10
T. harzianum 12.60 fghijk 10.98 def 0.00 e 7.86 ± 6.97
T. viride 5.91 ghijkl 18.04 cdef 17.65 d 13.86 ± 24.40
T. hamatum -4.72 klm 1.76 ef 0.00 e -0.99 ± 3.28
T. viride 5.51 ghijkl 8.43 def 0.00 e 4.65 ± 6.47
T. reesei 37.01 cd 16.08 cdef 0.00 e 17.70 ± 18.50
T. viride -4.33 jklm 0.00 f 0.00 e -1.44 ± 3.22
T. hamatum -15.35 m -0.59 f 0.00 e -5.31 ± 8.12
T. harzianum 6.69 ghijkl 2.16 ef 0.00 e 2.95 ± 6.72
T. harzianum 84.25 a 100.00 a 89.02 a 91.09 ± 7.42
T. reesei 43.31 bc 26.08 cd 0.00 e 23.13 ± 24.95
T. harzianum 60.63 b 72.75 b 35.29 c 56.22 ± 26.71
T. harzianum 19.29 defg 11.76 def 0.00 e 10.35 ± 8.91
T. harzianum 0.39 hijklm 0.00 f 0.00 e 0.13 ± 5.16
T. harzianum 11.81 fghijk 12.94 cdef 0.00 e 8.25 ± 6.57
T. reesei -6.69 lm 1.96 ef 0.00 e -1.58 ± 5.18
T. harzianum 18.90 efg 1.96 ef 0.00 e 6.95 ± 9.53
T. viride 44.88 bc 31.76 c 50.59 b 42.41 ± 14.08
T. piluliferum -3.94 jklm 3.53 ef 0.00 e -0.14 ± 7.56
T. viride 27.17 cdef 8.43 def 0.00 e 11.87 ± 12.28
T. viride 14.17 efghi 0.00 f 0.00 e 4.72 ± 9.32
T. virens 15.35 efgh 15.29 cdef 11.76 d 14.14 ± 5.49
CD at 5% 17.88 19.08 9.13
Means followed by the same letter are not significantly (p < 0.05) different.
Fig. 22. Degeneration of the formed sclerotia in T. harzianum isolate T18 and sclerotial parasitization in T. viride isolate T20
After 2 days of inoculation
After 12 days of inoculation
ICAR-RCER n Annual Report 2013-14 21 Pulses
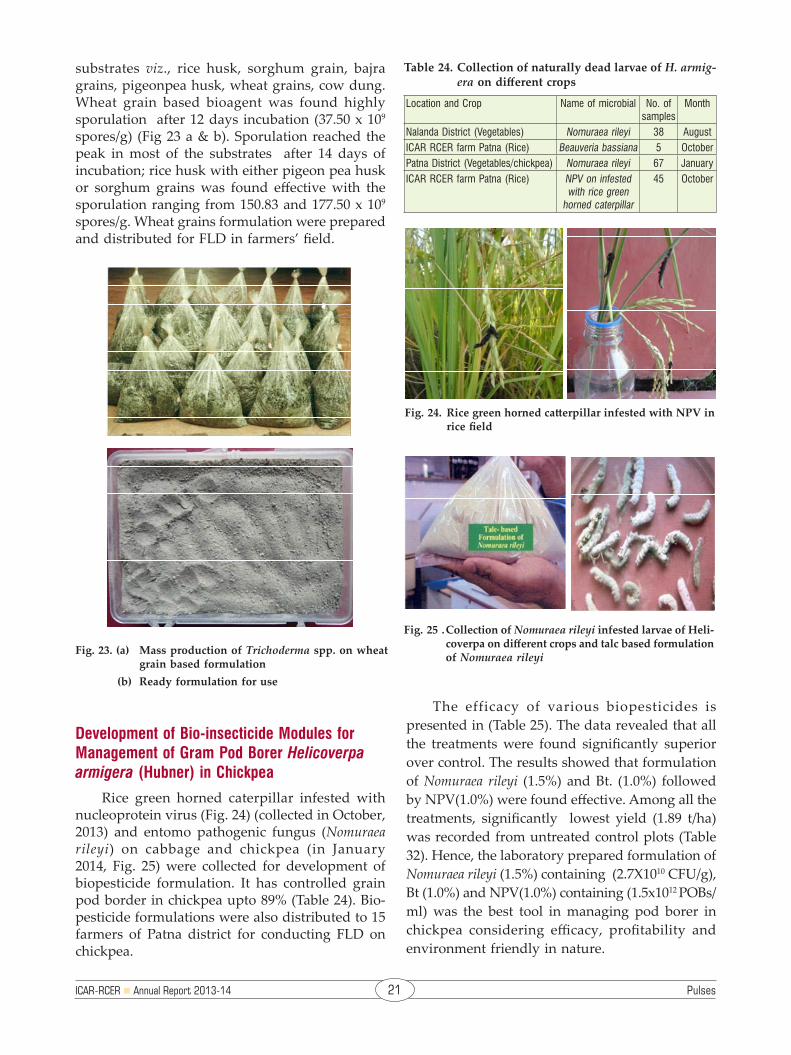
substrates viz., rice husk, sorghum grain, bajra grains, pigeonpea husk, wheat grains, cow dung. Wheat grain based bioagent was found highly sporulation after 12 days incubation (37.50 x 10⁹
spores/g) (Fig 23 a & b). Sporulation reached the peak in most of the substrates after 14 days of incubation; rice husk with either pigeon pea husk or sorghum grains was found effective with the sporulation ranging from 150.83 and 177.50 x 10⁹
spores/g. Wheat grains formulation were prepared and distributed for FLD in farmers’ field.
Fig. 23. (a) Mass production of Trichoderma spp. on wheat grain based formulation
(b) Ready formulation for use
Table 24. Collection of naturally dead larvae of H. armig-era on different crops
Location and Crop Name of microbial No. of samples
Month
Nalanda District (Vegetables) Nomuraea rileyi 38 August ICAR RCER farm Patna (Rice) Beauveria bassiana 5 October Patna District (Vegetables/chickpea) Nomuraea rileyi 67 January ICAR RCER farm Patna (Rice) NPV on infested
with rice green horned caterpillar
45 October
Fig. 24. Rice green horned catterpillar infested with NPV in rice field
Development of Bio-insecticide Modules for Management of Gram Pod Borer Helicoverpa armigera (Hubner) in Chickpea
Rice green horned caterpillar infested with nucleoprotein virus (Fig. 24) (collected in October, 2013) and entomo pathogenic fungus (Nomuraea rileyi) on cabbage and chickpea (in January 2014, Fig. 25) were collected for development of biopesticide formulation. It has controlled grain pod border in chickpea upto 89% (Table 24). Bio-pesticide formulations were also distributed to 15 farmers of Patna district for conducting FLD on chickpea.
The efficacy of various biopesticides is presented in (Table 25). The data revealed that all the treatments were found significantly superior over control. The results showed that formulation of Nomuraea rileyi (1.5%) and Bt. (1.0%) followed by NPV(1.0%) were found effective. Among all the treatments, significantly lowest yield (1.89 t/ha) was recorded from untreated control plots (Table 32). Hence, the laboratory prepared formulation of Nomuraea rileyi (1.5%) containing (2.7X10¹⁰ CFU/g), Bt (1.0%) and NPV(1.0%) containing (1.5x10¹² POBs/ml) was the best tool in managing pod borer in chickpea considering efficacy, profitability and environment friendly in nature.
Fig. 25 . Collection of Nomuraea rileyi infested larvae of Heli-coverpa on different crops and talc based formulation of Nomuraea rileyi

ICAR-RCER n Annual Report 2013-14 22 Pulses
Table 25. Efficacy of biopesticides against Helicoverpa armigera in chickpea
Treatment (percent) Grain yield (t/ha)
Straw yield (t/ha)
Harvest index
Bb- 0.1 2.10 5.39 0.28
Bb-0.25 2.22 4.44 0.33
Bb-0.5 2.22 4.31 0.34
Bb-1.0 2.42 4.67 0.36
Bb-1.5 2.29 4.63 0.33
Ma-0.1 1.96 4.71 0.30
Ma-0.25 1.82 4.76 0.28
Ma-0.5 2.07 4.73 0.30
Ma-1.0 2.17 5.14 0.30
Ma-1.5 1.83 4.78 0.28
Nr- 0.1 2.57 4.04 0.39
Nr-0.25 2.64 5.28 0.33
Nr-0.5 2.49 5.01 0.33
Nr-1.0 2.26 4.68 0.33
Nr-1.5 2.92 5.64 0.34
Bt- 0.1 2.28 4.17 0.35
Bt-0.25 2.05 5.31 0.28
Bt-0.5 2.13 4.54 0.32
Bt-1.0 2.83 4.83 0.37
Bt-1.5 2.26 4.40 0.35
NPV-0.1 1.93 4.18 0.32
NPV-0.25 2.15 4.51 0.32
NPV-0.5 1.81 5.83 0.24
NPV1.0 2.28 5.22 0.30
NPV-1.5 2.22 5.03 0.31
Control 1.89 4.50 0.30
*Nuclear polyhedrosis virus (NPV), Beauveria bassiana (Bb), Metarrhiz-ium anisopliae (Ma), Nomuraea rileyi (Nr), Bacillus thuringiensis (Bt)
ICAR-RCER n Annual Report 2013-14 23 Fruits
g Mango
Plant genetic resource management
Under the trial on collection, evaluation and characterization of mango genotypes, 118 mango genotypes were evaluated for fruit quality and yield. The average fruit weight ranged between 83.07 g (Illaichi) and to 805.50 g (Sahabale) and a total of 69 numbers of genotypes had fruit weight varying from 200 to 500 g. The average pulp content ranged between 45.23% (Khirospatti) and 85.73% (Fazali) and a total of 37 genotypes had more than 70% pulp content. The TSS varied between 11.56oB (Mahmood-al-Samar) to 24.30oB (Chausa) and a total of 44 number of genotypes had TSS value of more than 18oB. The TSS: acidity ratio ranged between 10.24 (Khirospatti) and 391.93 (Hathijhool) and the genotypes, Jardalu, Gulab Khas, Gaurjeet, Dashehari, Lucknow Safeda, Sarikhas, Indonesia, Mulgoa Hill, Neeluddin, Goa Bandar, Hathi Jhool, Nileshwari and Black Andrew had TSS: acidity value of more than 200. The fruit yield ranged between 2.1 kg/tree (Indonesia) to 87.4 kg/tree (Jardalu) and 18 genotypes of more than 20 years age had yield of more than 45 kg/tree. Hence keeping in view fruit quality (fruit weight > 200g, pulp content > 70%, TSS > 18oB and TSS: acidity > 200) and yield (> 45 kg/tree in case of 20 years or more tree age), the genotypes Jardalu, Lucknow Safeda, Goa Bundar, Neeleswari were found promising.
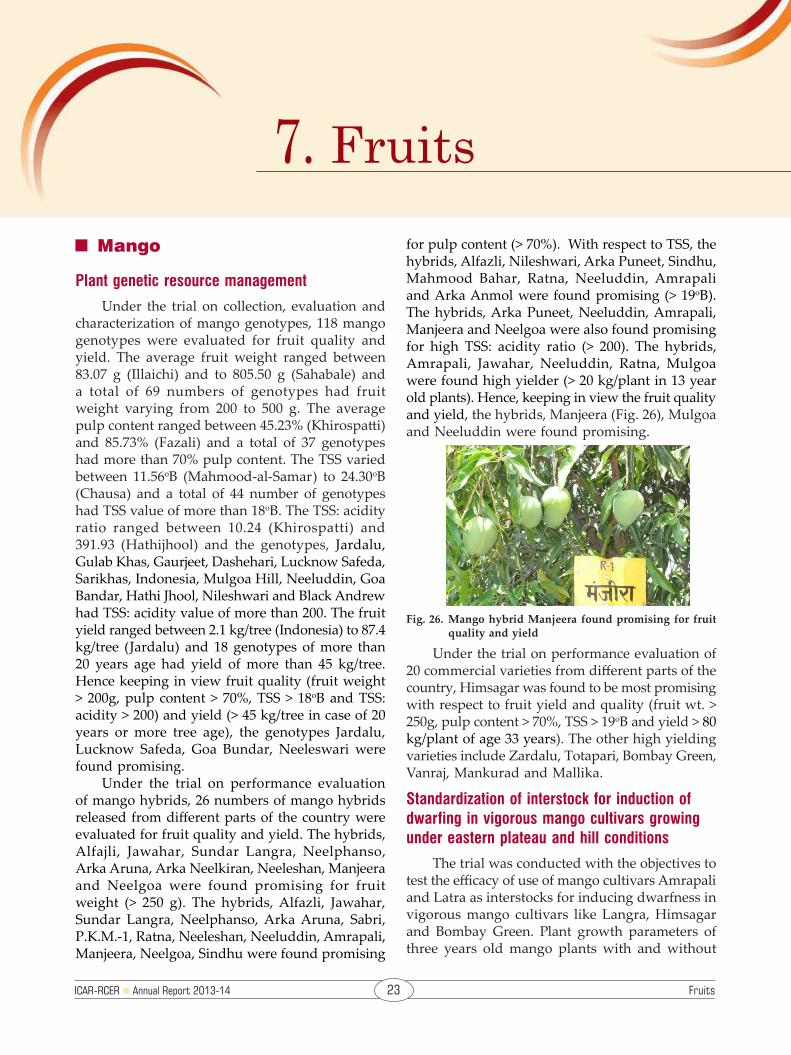
Under the trial on performance evaluation of mango hybrids, 26 numbers of mango hybrids released from different parts of the country were evaluated for fruit quality and yield. The hybrids, Alfajli, Jawahar, Sundar Langra, Neelphanso, Arka Aruna, Arka Neelkiran, Neeleshan, Manjeera and Neelgoa were found promising for fruit weight (> 250 g). The hybrids, Alfazli, Jawahar, Sundar Langra, Neelphanso, Arka Aruna, Sabri, P.K.M.-1, Ratna, Neeleshan, Neeluddin, Amrapali, Manjeera, Neelgoa, Sindhu were found promising
for pulp content (> 70%). With respect to TSS, the hybrids, Alfazli, Nileshwari, Arka Puneet, Sindhu, Mahmood Bahar, Ratna, Neeluddin, Amrapali and Arka Anmol were found promising (> 19oB). The hybrids, Arka Puneet, Neeluddin, Amrapali, Manjeera and Neelgoa were also found promising for high TSS: acidity ratio (> 200). The hybrids, Amrapali, Jawahar, Neeluddin, Ratna, Mulgoa were found high yielder (> 20 kg/plant in 13 year old plants). Hence, keeping in view the fruit quality and yield, the hybrids, Manjeera (Fig. 26), Mulgoa and Neeluddin were found promising.
Fig. 26. Mango hybrid Manjeera found promising for fruit quality and yield
Under the trial on performance evaluation of 20 commercial varieties from different parts of the country, Himsagar was found to be most promising with respect to fruit yield and quality (fruit wt. > 250g, pulp content > 70%, TSS > 19oB and yield > 80 kg/plant of age 33 years). The other high yielding varieties include Zardalu, Totapari, Bombay Green, Vanraj, Mankurad and Mallika.
Standardization of interstock for induction of dwarfing in vigorous mango cultivars growing under eastern plateau and hill conditions
The trial was conducted with the objectives to test the efficacy of use of mango cultivars Amrapali and Latra as interstocks for inducing dwarfness in vigorous mango cultivars like Langra, Himsagar and Bombay Green. Plant growth parameters of three years old mango plants with and without
7. Fruits

ICAR-RCER n Annual Report 2013-14 24 Fruits
interstock planted in the field were recorded. During third year after planting, significant effect of the interstocks was recorded on plant height, girth of rootstock including scion. The plant height in all the genotypes without interstocks were significantly higher than that recorded in case of plants with interstocks. With respect to percentage increase in plant height over the previous year, mango genotype Latra as interstock resulted in significantly higher values (29.44%) whereas the mango genotype Amrapali as interstock resulted in significantly lower values (5.76%) than that recorded in case of plants without interstock (18.48%). The higher values recorded in case of Latra can be attributed to lower initial plant growth parameters due to delayed establishment of the in situ grafted plants with Latra as interstock. Among all the genotypes, the minimum increase in plant height on Amrapali interstock was recorded in case of Himsagar (4.08%). Similarly, significant influence of interstock was recorded on girth of rootstck in all the genotypes and the plants with interstock had significantly lower girth than that without interstock.
With respect to percentage increase in girth over the previous year, the minimum value was recorded in case of Amrapali as interstock (26.76%) as compared to 52.97% recorded in case of plants without interstock. Among all the genotypes, the maximum increase in girth of rootstock was recorded in Langra (58.94%) whereas the other two genotypes were at par. With respect to girth of scion, similar patttern was recorded as in case of girth of rootstock. Panicle emergence recorded after three years of planting in both single grafted as well as double grafted plants (Amrapali as interstock).
Under the trial on “Standardization of rapid plant multiplication technique for production of mango grafts with interstocks”, efficacy of two methods viz., 1. Simultaneous grafting and 2. Step-wise grafting were evaluated for rapid multiplication of double grafted mango plants. Step-wise grafting resulted in significantly higher success rate (82.95%) than simultaneous grafting (14.85%). In case of stepwise grafting, significant effects of interstock could not be recorded on success rate. However, in case of simultaneous grafting, significantly higher success rate was recorded with Latra as interstock (21.01%) than that of Amrapali (8.69%) and among the mango genotypes, the maximum success rate was recorded in case of Langra (17.41%). (Fig. 27).
g Litchi
Biology, seasonal incidence and management of stink bug (Tessaratoma sp.) on litchi in eastern plateau and hill region
The trial is being conducted to develop eco-friendly and economically viable litchi stink bug (LSB) management modules through understand-ing the seasonal incidence and biology of the bugs. Observation on seasonal incidence indicated that bugs activation from dormancy, feeding poten-tiality and egg lying capacity was significantly positively correlated with temperature. Bugs were found to congregate at the time of initiation of flowering in panicles. Observations on feeding preference of bugs indicated that the adult and nymphs preferred to feed on flower panicles fol-lowed by younger and softer shoots. Maximum population of nymphs was recorded from 12th to 18th Standard Meteorological Week (SMW) on flowering panicles and on stalk of young fruits. The maximum egg laid was found in the month of March to mid April. Fresh laid egg batches were found up to last week of June but very few in numbers. Maximum number of 1.20 ± 0.08 egg batch/twig was recorded in the 15th SMW of year (Fig. 28).
A study was also conducted on parasitization of natural enemies and effect of pesticides on rate of parasitization. All the species of parasitoids (Anastatus bangalorensis, A. acherontiae and Ooen-cyrtus spp.) were observed in eggs collected from both unsprayed as well as insecticide applied litchi orchard. However, the emergence rate was low in insecticide applied litchi orchard. Eclosion of nymphs and emergence of A. bengalorensis started from third week of February in both years. Maxi-mum parasitized eggs were found in the month of
Fig. 27. Success rate under different methods of preparation of double grafted plants

ICAR-RCER n Annual Report 2013-14 25 Fruits
March with 46.12% parasitization in insecticide-free orchard. The maximum rate of egg parasitiza-tion was observed in case of A. bengalorensis. The emergence time of Ooencyrtus spp. was very late than A. bengalorensis and A. acherontiae. Data on hatching per cent revealed that egg parasitoids have significant influence on reduction of the hatch percentage of LSB eggs in insecticide free orchard (Fig. 29).
one of the major insect pests in the eastern plateau and hill region. The larvae bore into developing fruit through the stem and then feed on the seed inside the fruit. The rate of infestation was 26.19 ± 3.67 per cent. Flower Webbers were recorded as another major pest at flowering stage with 1 to 2 webs per flower panicle (Fig. 31).
Fig. 28. Seasonality of egg batches of T. javanica per twig (± S.D.) on litchi plants
Fig. 29. Egg parasitism and hatch percentage of T. javanica eggs in unsprayed litchi orchard
Fig. 30. (a) Parasitization of LSB eggs by A. bangalorensis (Size of emergence hole was 0.97+0.06 mm)
(b) Parasitization of LSB eggs by A. acherontiae (Size of emergence hole was 0.64+0.07mm)
(c) Unparsitized LSB eggs (size of emergence hole was 1.67+0.11mm)
(a) (b)
(c)
The experimental data showed that A. banglo-rensis and A. acherontiae were found to parasitize LSB eggs in early season, however, parasitization by all the parasitoids were found decreased at the time of maximum laid eggs in the season by LSB in the insecticide applied orchard.
Study was conducted to characterize the para-sitized eggs for enhancing the parasitization rate. It was found that parasitized eggs could be easily identified based on their colour, shape and size of emergence holes (Fig. 30 (a-c).
Survey and surveillance of pest complex and their natural enemies on litchi
Survey of pest complex in litchi indicated that litchi fruit-borer (or litchi stem end borers), Cono-pomorpha sinensis (Lepidoptera: Gracillariidae) was
Fig. 31. Flower web of litchi formed by Dudua aprobola
Developing national repository & creating facilities for DUS testing in litchi (Litchi chinensis)
Out of the 34 characters identified for DUS characterization of litchi, characters like young leaf colour, leaflet blade shape, leaf margin curvature, length of paracladia, time of opening of male flower,

ICAR-RCER n Annual Report 2013-14 26 Fruits
flower disc colour of hermaphrodite flowers, fruit shape, time of fruit maturity and seed shape were recorded to be consistent for distinguishing the litchi genotypes. Based on the distinct descriptor states, the example varieties of litchi have also been identified.
Based on the characters identified at both cen-tres, the document on “Guidelines for the conduct of test for distinctiveness, uniformity and stability of litchi (Litchi Chinensis Sonn.)” have been final-ized (Table 26).
g Bael
Plant genetic resource management
The trial is being conducted to identify suit-able genotype of bael for cultivation under eastern plateau and hill conditions. A total of 37 genotypes including 33 seedling selections were evaluated for fruit quality and yield. The average fruit weight ranged between 0.47 (ICAR-RCER BS 6/4) to 2.05 kg (Pant Sujata) and 12 number of genotypes had fruit weight between 1.00 to 1.50 kg (medium sized). The skull content ranged between 14.70 (Godda Collection) to 33.27% (ICAR RCER BS 3/2) and a total of 16 number of genotypes had low skull content (< 20%). The number of seeds per fruit ranged between 49 (ICAR RCER BS 10/4) to 208 (ICAR RCER BS 6/5) while the seed content ranged between 1.51 (Godda Collection) to 7.64% (ICAR RCER BS 2/5). A total of 13 genotypes had low seed content in fruit (< 3.0%). The pulp content in fruit ranged between 63.44 (ICAR RCER BS 3/2) to 83.77% (Godda Collection) and a total of seven genotypes had high pulp content (> 80.0%). The TSS of fruits ranged between 10.4 oB (ICAR RCER BS 6/11) to 24.7oB (ICAR RCER BS 1/1) and a total of nine genotypes had high TSS (> 20oB). The fruit yield per plant ranged between 23.48 kg/tree (ICAR RCER BS 2/7) to 168.4 kg (Pant Aparna) and eight genotypes were recorded as high yielders (> 100.0 kg/tree). Hence, keeping in view the fruit quality and yield, the genotype ICAR RCER BS 4/3 was found promising (average fruit weight–1.12 kg, skull content–15.59%, seed content–3.50%, TSS–20.6oB and yield–108.4 kg/tree) (Fig. 34).
Fig. 32. Cream coloured flower disc in hermaphrodite flower of Ajhauli
Fig. 33. P i n k c o l o u r e d flower disc in her-maphrodite flower of Green
Fig. 34. Bael genotype ICAR RCER BS 4/3
Table 26. Example varieties for distinct states of charac-teristics for DUS testing of litchi
Characteristics States Example variety Young leaf: Colour Light green Sarguja Selection 2
Reddish green Rose scented
Reddish brown Nafarpal
Leaf shape index (length of leaflet:width of leaflet) (Second middle pair of leaves)
Low (<3.5) China
Medium (3.5-3.7) Green
High (>3.7) Late Large
Leaflet margin curvature Curve upward from midrib
Shahi
Curve downward from midrib
China
Flower disc colour of hermaph-rodite flower
Light cream Ajhauli
Pinkish Green
Inflorescence: Length of paracladia
Short Swarna Roopa
Medium China
Long Late Large
Fruit: Fruit maturity group Early Shahi
Mid-maturity Kasba
Late maturity China
Fruit: Fruit shape Round Bedana
Oblong Shahi
Conical China
Wedge Shahi
Obtuse Bedana
Fruit: Seed shape Round Late large
Oval Shahi
Oblong Purbi
Elongated China
Chicken tongue Bedana

ICAR-RCER n Annual Report 2013-14 27 Fruits
Survey and surveillance of pest complex and their natural enemies on bael
From the survey of insect pest complex in bael, it was found that infestation of the fruit borer, Cryptophlebia (Argyroploca) spp. on bael fruits paved way for entry of fruit fl ies. Nearly 20-30% fruits were infested with fruit borer in surveyed areas (Fig. 35).
g Jackfruit
Plant genetic resource management
Under the trial on collection and conservation of germplasm, a fi eld survey was conducted in Tripura to collect superior genotypes of jackfruit. A total of 32 promising genotypes were identifi ed which comprised of nine pink fl eshed genotypes, eight Baramasi type genotypes. Cluster bearing was recorded to be a predominant character among the genotypes contributing towards high yield of jackfruit under Tripura conditions (Fig. 36). The genotypes have been collected and conserved in the Field Gene Bank of the institute.
Under the trial on evaluation of germplasm, 32 genotypes conserved in the fi eld gene bank of
Fig. 35. Infested fruit of bael due to fruit borers
the institute were evaluated for fruit characters of fully matured fruits. The average fruit weight ranged between 4.12 kg (ICAR RCER JS-1/10) to 13.85 kg (ICAR RCER JS-5/4). The average pulp content in the fruit was 44.61% and the genotypes ICAR RCER JS- 3/9, 3/8, ½, 1/7, 2/10, 1/7 were found promising for high pulp content. Jackfruit seed is a delicacy in the tribal cuisine as a vegetable. Among the genotypes evaluated, the average seed content was 8.70% and the genotypes, ICAR RCER JS-3/9, 3/8, 1/7, 2/10, 1/7, 5/2 and 6/1 had higher seed content than the other genotypes. The average TSS was 18.22oB and the genotypes ICAR RCER JS-2/10, 1/5, 1/7, ¾, 1/6, 2/1 and 5/4 had higher TSS than other genotypes. The rind and core of ripe jackfruit are also used as animal feed. The average rind content was 46.03% and the genotypes ICAR RCER JS-1/9, 1/5, 2/4, 4/6, 6/1 and 5/4 had higher content of rind. The average content of core was 5.66% and the genotypes ICAR RCER JS-3/9, 3/8, 1/2, 1/9, 1/7 and 5/2 had higher content than other genotypes. Hence, based on overall performance, the jackfruit genotype ICAR RCER JS-2/7 was found to be most promising for fruit quality (Medium sized and cylindrical shaped fruit having > 70% pulp content, TSS > 20oB and fi breless fl akes with pleasant fl avour).
Survey and surveillance of pest complex and their natural enemies on Jackfruit
Only Rhizopus rot disease of Jackfruitcaused by Rhizopus artocarpi was found as the major biotic stress factor. The incidence of disease intensity was recorded as 34 ± 2.01 per cent on mature fruits.
Fig. 36. Cluster bearing jackfruit genotype in Tripura

ICAR-RCER n Annual Report 2013-14 28 Vegetables
g Brinjal
Variety identified for releaseThe line HABR-21 was identified for release in
Zone-IV (Bihar, Jharkhand, Uttar Pradesh, Punjab) in 31st group meeting of AICRP(VC) held at CSKH-PKV, Palampur (HP) from 2nd-5th May 2013.
60-70g, TSS 4.5-5.0o brix, acidity 0.30-0.35% and ascorbic acid 40-42 mg/100 g fruit. It is indeterminate in growth habit (5.0-5.5 m), high yielding (160-180 t/ha), resistant to bacterial wilt and can be cultivated round the year. It recorded 110% increase in yield over the check, GS-600 (Fig. 38 and Table 28). An average yield of 159.5 t/ha was recorded in farmers’ field under continuous evaluation for three years 2009-2012 (Table 29).Table 28. Yield (t/ha) performance of Swarna Anmol
(HATH-10) at the experimental farm of the institute
Name of hybrids 2008-09 2009-10 2010-11 2011-12 2012-13 Average
Swarna Anmol (HATH-10)
151.6 187.8 177.2 163.5 182.5 172.5
GS-600 (Check) 95.0 60.8 82.5 92.0 79.5 81.9
Table 29. Performance of Swarna Anmol (HATH-10) at farmers’ field during 2009-12
Name & address of Institution/NGOs/farmers Year Yield HATH-10 (t/ha)
KGVK, Rukka, Ranchi 2009-12 157.5
A three Agrotech Piska Nagari, Ranchi 2009-12 168.5
Dinesh Mahto, Berwari Angra, Ranchi 2009-12 149.5
Balak Mahto Kuchhu, Ormanjhi ,Ranchi 2010 -12 162.5
Average yield 2009-12 159.5
Maintenance of genetic purity of released varieties (Swarna Lalima, Swarna Naveen), pa-rental lines of hybrids (Swarna Sampada, Swarna Samridhi, Swarna Baibhav, Swarna Vijaya, Swarna Deepti and Swarna Anmol) was done through nucleus seed production.
Maintenance of genetic purity of released varieties/parental lines of F1 hybrids
Maintanance of genetic purity of released va-rieties (Swarna Shyamli, Swarna Pratibha, Swarna Abhilamb, Swarna Sobha, Swarna Mani, Swarna Shree, HABR-21), parental lines of hybrids (Swarna Ajay, Swarna Shakti, Swarna Mohit, Swarna Neeli-ma) was done through nucleus seed production.
g Tomato
F1 hybrid releasedThe tomato F1 hybrid Swarna Anmol, developed
by heterosis breeding, was released through Institute Variety Release Committee for protected cultivation in Jharkhand, Bihar and adjoining areas where bacterial wilt is a problem.
Its fruits are round, red, with light green shoulder and borne in clusters of 5-6. Fruit weight
Fig. 37. Brinjal line HABR-21
Table 27. Premium attri-butes of brinjal line HABR-21
Fruit length 18-20 cm
Fruit breadth 7-8 cm
No. of fruits/plant 10-12 fruits
Fruit weight 300-350 gm
Yield/plant 2.0-3.0 kg
Yield in t/ha 55-60 t/ha
Fig. 38. Swarna Anmol
8. Vegetables
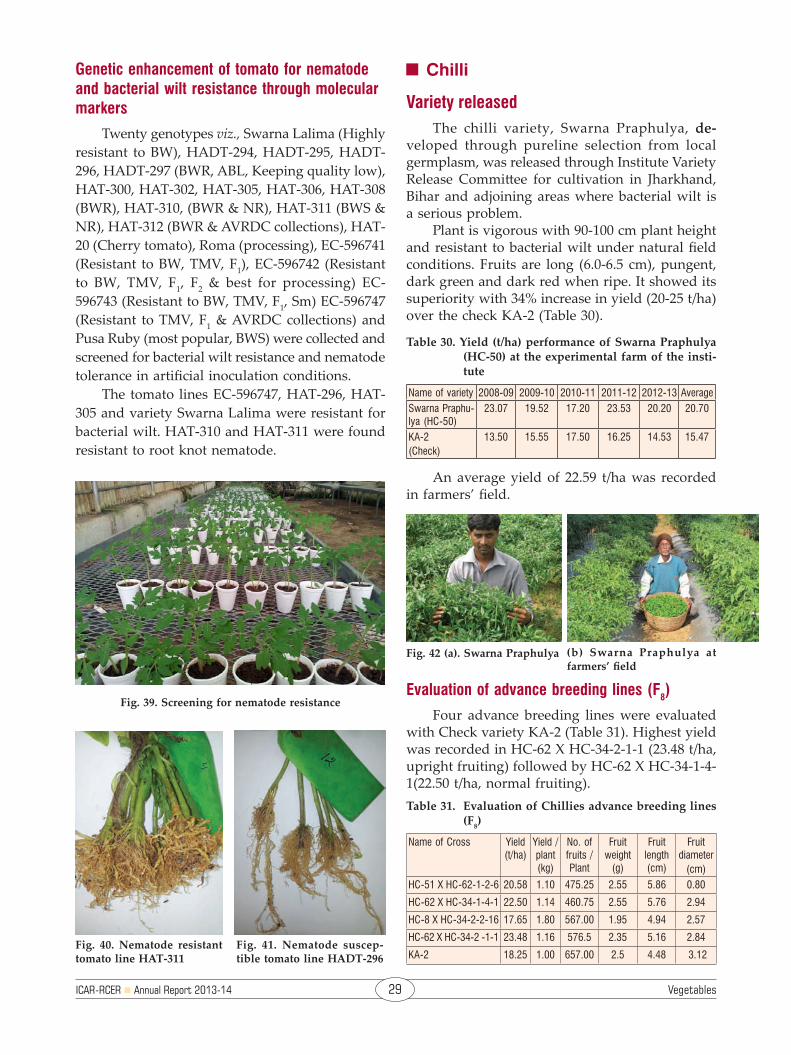
ICAR-RCER n Annual Report 2013-14 29 Vegetables
Fig. 42 (a). Swarna Praphulya (b) Swarna Praphulya at farmers’ field
Genetic enhancement of tomato for nematode and bacterial wilt resistance through molecular markers
Twenty genotypes viz., Swarna Lalima (Highly resistant to BW), HADT-294, HADT-295, HADT-296, HADT-297 (BWR, ABL, Keeping quality low), HAT-300, HAT-302, HAT-305, HAT-306, HAT-308 (BWR), HAT-310, (BWR & NR), HAT-311 (BWS & NR), HAT-312 (BWR & AVRDC collections), HAT-20 (Cherry tomato), Roma (processing), EC-596741 (Resistant to BW, TMV, F1), EC-596742 (Resistant to BW, TMV, F1, F2 & best for processing) EC-596743 (Resistant to BW, TMV, F1, Sm) EC-596747 (Resistant to TMV, F1 & AVRDC collections) and Pusa Ruby (most popular, BWS) were collected and screened for bacterial wilt resistance and nematode tolerance in artificial inoculation conditions.
The tomato lines EC-596747, HAT-296, HAT-305 and variety Swarna Lalima were resistant for bacterial wilt. HAT-310 and HAT-311 were found resistant to root knot nematode.
g Chilli
Variety releasedThe chilli variety, Swarna Praphulya, de-de-
veloped through pureline selection from local germplasm, was released through Institute Variety Release Committee for cultivation in Jharkhand, Bihar and adjoining areas where bacterial wilt is a serious problem.
Plant is vigorous with 90-100 cm plant height and resistant to bacterial wilt under natural field conditions. Fruits are long (6.0-6.5 cm), pungent, dark green and dark red when ripe. It showed its superiority with 34% increase in yield (20-25 t/ha) over the check KA-2 (Table 30).
Table 30. Yield (t/ha) performance of Swarna Praphulya (HC-50) at the experimental farm of the insti-tute
Name of variety 2008-09 2009-10 2010-11 2011-12 2012-13 AverageSwarna Praphu-lya (HC-50)
23.07 19.52 17.20 23.53 20.20 20.70
KA-2 (Check)
13.50 15.55 17.50 16.25 14.53 15.47
An average yield of 22.59 t/ha was recorded in farmers’ field.
Fig. 39. Screening for nematode resistance
Fig. 40. Nematode resistant tomato line HAT-311
Fig. 41. Nematode suscep-tible tomato line HADT-296
Evaluation of advance breeding lines (F8)
Four advance breeding lines were evaluated with Check variety KA-2 (Table 31). Highest yield was recorded in HC-62 X HC-34-2-1-1 (23.48 t/ha, upright fruiting) followed by HC-62 X HC-34-1-4-1(22.50 t/ha, normal fruiting).Table 31. Evaluation of Chillies advance breeding lines
(F8)
Name of Cross Yield (t/ha)
Yield /plant (kg)
No. of fruits / Plant
Fruit weight
(g)
Fruit length (cm)
Fruit diameter
(cm)HC-51 X HC-62-1-2-6 20.58 1.10 475.25 2.55 5.86 0.80
HC-62 X HC-34-1-4-1 22.50 1.14 460.75 2.55 5.76 2.94
HC-8 X HC-34-2-2-16 17.65 1.80 567.00 1.95 4.94 2.57
HC-62 X HC-34-2 -1-1 23.48 1.16 576.5 2.35 5.16 2.84
KA-2 18.25 1.00 657.00 2.5 4.48 3.12

ICAR-RCER n Annual Report 2013-14 30 Vegetables
Maintenance of genetic purity of released/pre -released varieties (Swarna Praphulya, HC-68, HC-25) was done through nucleus seed production
g Capsicum
Variety releasedThe capsicum variety, Swarna Atulya was
released through Institute Variety Release Committee for cultivation in Jharkhand, Bihar and adjoining areas.
It was developed through pureline selection from EC-596749 collected from World Vegetable Centre, Taiwan through NBPGR. Plant is vigorous with 45-50 cm plant height, early flowering and fruiting and suit-able for kharif and rabi cultivation. It showed its superi-ority with 63% in-63% in-crease in yield (40-45 t/ha) over local check (California Wonder). It is toler-. It is toler-ant to powdery mil-dew. Fruits (90-100 g) are almost round (4.5-5.0 cm length, 5.5-6.0 cm breadth), green and yellow in colour at maturity (Table 32). An aver-age yield of 43.46 t/ha was recorded.
Table 32. Yield (t/ha) performance of Swarna Atulya (HACAV-271) at the experimental farm of the institute
Name of variety 2008-09 2009-10 2010-11 2011-12 2012-13 AverageSwarna Atulya (HACAV-271)
45.50 42.50 43.50 45.50 43.50 44.10
Local (check) 25.00 27.50 30.00 25.50 27.50 27.10
Maintenance of genetic purity of released/pre -released varieties (Swarna Atulya, HACAV-845), was done through nucleus seed production.
g Bottle Gourd
Variety releasedThe bottle gourd variety, Swarna Sneha
was released through Institute Variety Release Committee for cultivation in Jharkhand, Bihar and adjoining areas.
It was developed through pureline selection from IC 284939, collected from NBPGR, New Delhi. Plant is vigorous with 4-5 m vine length early flowering and fruiting and suitable for rainy season crop. It showed its superiority with 40% increase in yield (50-55 t/ha) over local check (Arka Bahar) (Table 33). It is tolerant to powdery mildew and downy mildew. Fruits are long (30-35 cm length), light green and fruit weight 90-100 g. An average yield of 53.93 t/ha was recorded in farmers’ field.
Table 33. Yield (t/ha) performance of Swarna Sneha (HABOG-6) at the experimental farm of the institute
Name of variety 2008-09 2009-10 2010-11 2011-12 2012-13 AverageSwarna Sneha (HABOG-6)
55.00 54.50 55.50 52.50 50.00 53.50
Local(Check)
37.500 40.00 41.50 39.50 32.50 38.20
Maintenance of genetic purity of release/pre-released varieties Swarna Sneha and HABOG-16 was done through nucleus seed production.
g Bitter Gourd
Variety releasedThe bitter gourd variety, Swarna Yamini
was released through Institute Variety Release Committee for cultivation in Jharkhand, Bihar and adjoining areas.
It was developed through hybridization followed by pe-digree selection. Plant is vigorous with 2.5-3.0 m vine length, early flow-ering and fruiting and suitable for rainy season crop. It showed its su-periority with 49%
Fig. 43. Capsicum variety Swarna Atulya
Fig. 44. Swarna Atulya at farmers’ field
Fig. 45. Bottle gourd variety Swarna Sneha
Fig. 46. Bitter gourd variety Swarna Yamini

ICAR-RCER n Annual Report 2013-14 31 Vegetables
increase in yield (20 t/ha) over local check (Arka Harit). It is tolerant to powdery mildew and downy mildew (Table 34). Fruits (65-70 g) are dark green with deep tubercles. An average yield of 19.39 t/ha was recorded in farmers’ field under continuous evaluation for five years 2008-13.
Table 34. Yield (t/ha) performance of Swarna Yamini (HABG-30) at the experimental farm of the institute
Name of variety 2008-09 2009-10 2010-11 2011-12 2012-13 Average
Swarna Yamini (HABG-30)
19.50 19.90 20.50 21.00 20.00 20.18
Local (check) 12.50 13.00 15.00 13.80 13.50 13.56
Maintenance of genetic purity of release/pre -released varieties Swarna Yamini, HABG-21, HABG-22 and HABG-29 was also carried out through nucleus seed production.
g Ridge Gourd
Variety released
The Satputia variety Swarna Sawani was released through Institute Variety Release Committee for cultivation in Jharkhand and Bihar and adjoining areas.
It was developed through pureline selection from local collection. Plant is vigorous with 3-4 m vine length early flowering and fruiting and suitable for rainy season crop. It showed superiority with 42% increase in yield (20-25 t/ha) over local check. It is tolerant to powdery mildew and downy mildew (Table 35). Fruits (35-45 g) are borne in clusters with 6-8 fruits per cluster. An average yield of 30.41 t/ha was recorded in farmers’ field.
Table 35. Yield (t/ha) performance of Swarna Sawani (HASS-1) at the experimental farm of the in-stitute
Name of variety 2008-09 2009-10 2010-11 2011-12 2012-13 Average
Swarna Sawani (HASS-1)
23.50 25.55 23.97 24.88 25.99 24.78
Local (check) 15.00 13.98 15.687 21.90 20.90 17.49
Maintenance of genetic purity of released /pre- released varieties Swarna Manjari, Swarna Uphar, Swarna Sawani, HARG-111 was done through nucleus seed production.
g Pumpkin
Maintenance of genetic purity of released varieties
Maintenance of genetic purity of released varieties Swarna Amrit was done through nucleus seed production.
AICRP (VC) trial
Under AICRP, in varietal trial AVT-II (6+1) on pumpkin, highest yield was recorded in 2010/PUMVAR-1(14.973 t/ha) followed by 2010/PUMVAR-3 (13.929 t/ha)
g Cucumber
Maintenance of genetic purity of released varieties
Maintenance of genetic purity of Swarna Poorna, Swarna Sheetal, Swarna Ageti was done through nucleus seed production.
Under AICRP, in varietal trial AVT-1 on cu-cumber, highest yield was recorded in Pusa Sanyog (c) (17.07 t/ha), followed by 2011/CUCUVAR-2 (12.78 t/ha).
g Sponge GourdUnder AICRP, in varietal trial AVT-1 (8+1) on
sponge gourd, highest yield was recorded in 2011/SPGVAR-1(17.7 t/ha), followed by 2011/SPGVAR-3 (13.77 t/ha).
g Long MelonUnder AICRP, in varietal trial IET on long mel-
on, highest yield was recorded in 2011/LGMVAR-3 (19.2 t/ha), followed by 2011/LGMVAR-1 (16.5 t/ha). These entries performed better than the best check Punjab long melon (13.87 t/ha).
g Ash gourdUnder AICRP, in varietal trial IET on ash
gourd, highest yield was recorded in 2011/ASG-VAR-3 (5.2 t/ha), followed by 2011/ASGVAR-6 (4.3 t/ha). These entries performed better than the best check Pusa Ujwal (13.8 t/ha).
Fig. 47. Satputia variety Swarna Sawani
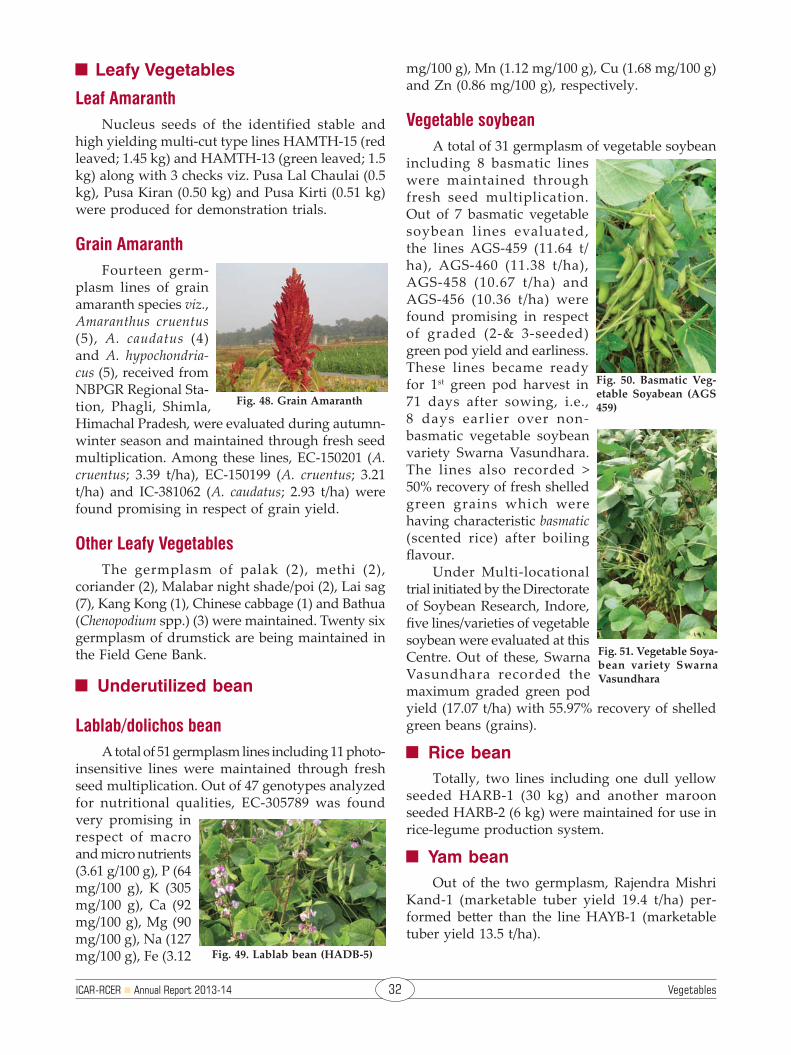
ICAR-RCER n Annual Report 2013-14 32 Vegetables
g Leafy Vegetables
Leaf AmaranthNucleus seeds of the identified stable and
high yielding multi-cut type lines HAMTH-15 (red leaved; 1.45 kg) and HAMTH-13 (green leaved; 1.5 kg) along with 3 checks viz. Pusa Lal Chaulai (0.5 kg), Pusa Kiran (0.50 kg) and Pusa Kirti (0.51 kg) were produced for demonstration trials.
Grain Amaranth Fourteen germ-
plasm lines of grain amaranth species viz., Amaranthus cruentus (5), A. caudatus (4) and A. hypochondria-cus (5), received from NBPGR Regional Sta-tion, Phagli, Shimla, Himachal Pradesh, were evaluated during autumn-winter season and maintained through fresh seed multiplication. Among these lines, EC-150201 (A. cruentus; 3.39 t/ha), EC-150199 (A. cruentus; 3.21 t/ha) and IC-381062 (A. caudatus; 2.93 t/ha) were found promising in respect of grain yield.
Other Leafy VegetablesThe germplasm of palak (2), methi (2),
coriander (2), Malabar night shade/poi (2), Lai sag (7), Kang Kong (1), Chinese cabbage (1) and Bathua (Chenopodium spp.) (3) were maintained. Twenty six germplasm of drumstick are being maintained in the Field Gene Bank.
g Underutilized bean
Lablab/dolichos beanA total of 51 germplasm lines including 11 photo-
insensitive lines were maintained through fresh seed multiplication. Out of 47 genotypes analyzed for nutritional qualities, EC-305789 was found very promising in respect of macro and micro nutrients (3.61 g/100 g), P (64 mg/100 g), K (305 mg/100 g), Ca (92 mg/100 g), Mg (90 mg/100 g), Na (127 mg/100 g), Fe (3.12
mg/100 g), Mn (1.12 mg/100 g), Cu (1.68 mg/100 g) and Zn (0.86 mg/100 g), respectively.
Vegetable soybeanA total of 31 germplasm of vegetable soybean
including 8 basmatic lines were maintained through fresh seed multiplication. Out of 7 basmatic vegetable soybean lines evaluated, the lines AGS-459 (11.64 t/ha), AGS-460 (11.38 t/ha), AGS-458 (10.67 t/ha) and AGS-456 (10.36 t/ha) were found promising in respect of graded (2-& 3-seeded) green pod yield and earliness. These lines became ready for 1st green pod harvest in 71 days after sowing, i.e., 8 days earlier over non-basmatic vegetable soybean variety Swarna Vasundhara. The lines also recorded > 50% recovery of fresh shelled green grains which were having characteristic basmatic (scented rice) after boiling flavour.
Under Multi-locational trial initiated by the Directorate of Soybean Research, Indore, five lines/varieties of vegetable soybean were evaluated at this Centre. Out of these, Swarna Vasundhara recorded the maximum graded green pod yield (17.07 t/ha) with 55.97% recovery of shelled green beans (grains).
g Rice beanTotally, two lines including one dull yellow
seeded HARB-1 (30 kg) and another maroon seeded HARB-2 (6 kg) were maintained for use in rice-legume production system.
g Yam beanOut of the two germplasm, Rajendra Mishri
Kand-1 (marketable tuber yield 19.4 t/ha) per-formed better than the line HAYB-1 (marketable tuber yield 13.5 t/ha).
Fig. 48. Grain Amaranth
Fig. 49. Lablab bean (HADB-5)
Fig. 50. Basmatic Veg-etable Soyabean (AGS 459)
Fig. 51. Vegetable Soya-bean variety Swarna Vasundhara
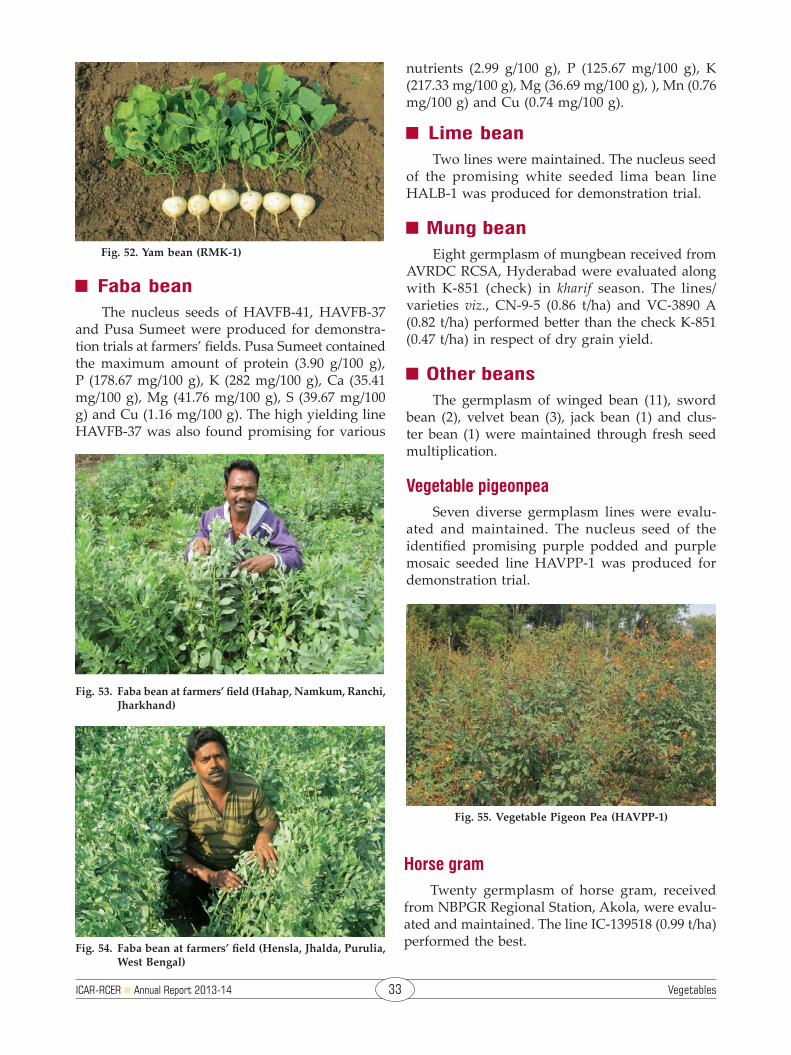
ICAR-RCER n Annual Report 2013-14 33 Vegetables
g Faba beanThe nucleus seeds of HAVFB-41, HAVFB-37
and Pusa Sumeet were produced for demonstra-tion trials at farmers’ fields. Pusa Sumeet contained the maximum amount of protein (3.90 g/100 g), P (178.67 mg/100 g), K (282 mg/100 g), Ca (35.41 mg/100 g), Mg (41.76 mg/100 g), S (39.67 mg/100 g) and Cu (1.16 mg/100 g). The high yielding line HAVFB-37 was also found promising for various
nutrients (2.99 g/100 g), P (125.67 mg/100 g), K (217.33 mg/100 g), Mg (36.69 mg/100 g), ), Mn (0.76 mg/100 g) and Cu (0.74 mg/100 g).
g Lime beanTwo lines were maintained. The nucleus seed
of the promising white seeded lima bean line HALB-1 was produced for demonstration trial.
g Mung beanEight germplasm of mungbean received from
AVRDC RCSA, Hyderabad were evaluated along with K-851 (check) in kharif season. The lines/varieties viz., CN-9-5 (0.86 t/ha) and VC-3890 A (0.82 t/ha) performed better than the check K-851 (0.47 t/ha) in respect of dry grain yield.
g Other beansThe germplasm of winged bean (11), sword
bean (2), velvet bean (3), jack bean (1) and clus-ter bean (1) were maintained through fresh seed multiplication.
Vegetable pigeonpeaSeven diverse germplasm lines were evalu-
ated and maintained. The nucleus seed of the identified promising purple podded and purple mosaic seeded line HAVPP-1 was produced for demonstration trial.
Fig. 53. Faba bean at farmers’ field (Hahap, Namkum, Ranchi, Jharkhand)
Fig. 54. Faba bean at farmers’ field (Hensla, Jhalda, Purulia, West Bengal)
Fig. 52. Yam bean (RMK-1)
Fig. 55. Vegetable Pigeon Pea (HAVPP-1)
Horse gramTwenty germplasm of horse gram, received
from NBPGR Regional Station, Akola, were evalu-ated and maintained. The line IC-139518 (0.99 t/ha) performed the best.

ICAR-RCER n Annual Report 2013-14 34 Vegetables
Perennial cucurbitsTwo germplasm of ivy gourd, one spindle
shape fruited and another long fruited, are being maintained in the Field Gene Bank. Four germ-plasm lines of spine gourd including 2 female and 2 male lines are also being maintained in the Field Gene Bank.
g Tuber crops and wild edibles
Collection, characterization and evaluation of potential wild edibles including tuber crops
In order to collect, characterize and evaluate wild edibles including tuber crops, survey were conducted in tribal dominated areas including forests of Jharkhand (10 districts; 15 blocks), Chhat-tisgarh (1 district; 2 blocks), Odisha (2 districts; 3 blocks) and West Bengal (4 districts; 6 blocks). The districts surveyed include Chatra, Latehar, Garhwa, Palamau, Jamtara, Dumka, Khunti, Lohardaga, West Singhbhum and Ranchi in Jharkhand, Uttar Bastar Kanker in Chhattisgarh, Bhubaneswar and Kalah-andi in Odisha and Birbhum, Bankura, Purulia and
West Midnapore in West Bengal. A total of 232 germplasm were collected and multiplied in the field for further characterization and evaluation. These include germplasm of Dioscorea spp. (62), Ipomoea batatas (10), Maranta arundinacea (1), Colo-casia spp. (81), Amorphophallus spp. (48), Alocasia spp. (18), Manihot spp. (7) and Cucumis melo var agrestis (5).
g Cowpea
Varietal evaluation
Under AICRP, two lines of bush type cowpea (HACP-44 and HACP-43) were evaluated. In Cow-pea (Bush) AVT-I, the entries 2012/COPBVAR-5 (14.39 t/ha) and 2012/COPBVAR-1 (12.19 t/ha) performed better than the check variety Kashi Kanchan (11.20 t/ha).
In Cowpea (Bush) AVT-II, the entries 2011/COPBVAR-6 (12.94 t/ha) and 2011/COPBVAR-4 (11.89 t/ha) performed better than the check variety Kashi Kanchan (11.20 t/ha).
g Garden pea
Development of powdery mildew resistant cultivars
To develop powdery mildew resistant early garden pea lines for testing under AICRP, two powdery mildew resistant and early maturing lines were derived from the cross of VRP-16 x IPS-1 and evaluated. The line (VRP-16 x IPS-1)-4-3 (13.48 t/ha) performed better than the line (VRP-16 x IPS-1)-3-4 (11.68 t/ha). In Peas, early AVT-I, 2012/PEVAR-5 (11.83 t/ha) and 2012/PEVAR-1 (11.10 t/ha) performed better than the check Azad Pea-3 (10.77 t/ha).
Similarly, in early AVT-II, 2011/PEVAR-9 (13.05 t/ha), 2011/PEVAR-7 (12.99 t/ha) and 2011/PEVAR-1 (12.44 t/ha) performed better than the best check Azad Pea-3 (10.77 t/ha).
Midseason AVT-I, 2012/PMVAR-4 (15.33 t/ha) and 2012/PMVAR-1 (13.38 t/ha) also performed better than the best check PC-531 (11.66 t/ha).
Fig. 56. Germplasm of different tuber crops in experimental plot
Fig. 57. Wild Musk melon
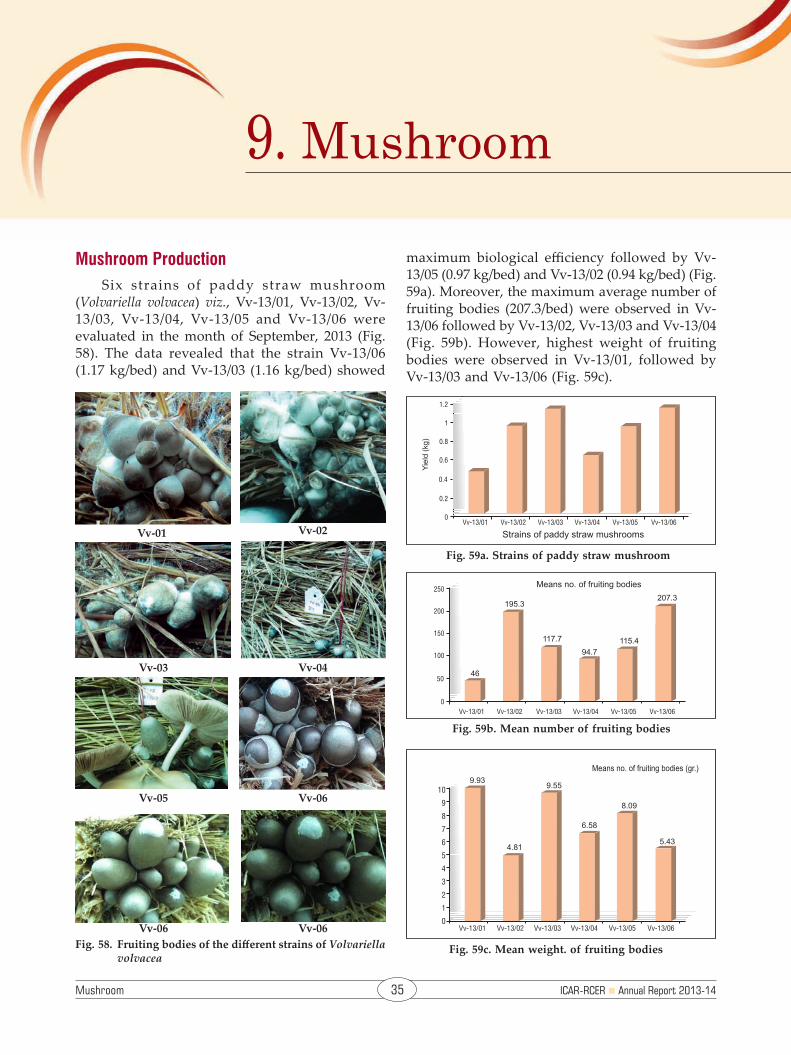
Mushroom 35 ICAR-RCER n Annual Report 2013-14
Mushroom ProductionSix strains of paddy straw mushroom
(Volvariella volvacea) viz., Vv-13/01, Vv-13/02, Vv-13/03, Vv-13/04, Vv-13/05 and Vv-13/06 were evaluated in the month of September, 2013 (Fig. 58). The data revealed that the strain Vv-13/06 (1.17 kg/bed) and Vv-13/03 (1.16 kg/bed) showed
Fig. 59a. Strains of paddy straw mushroom
Fig. 59b. Mean number of fruiting bodies
Fig. 59c. Mean weight. of fruiting bodies
Vv-01 Vv-02
Vv-03
Vv-05
Vv-06Fig. 58. Fruiting bodies of the different strains of Volvariella
volvacea
Vv-04
Vv-06
Vv-06
maximum biological efficiency followed by Vv-13/05 (0.97 kg/bed) and Vv-13/02 (0.94 kg/bed) (Fig. 59a). Moreover, the maximum average number of fruiting bodies (207.3/bed) were observed in Vv-13/06 followed by Vv-13/02, Vv-13/03 and Vv-13/04 (Fig. 59b). However, highest weight of fruiting bodies were observed in Vv-13/01, followed by Vv-13/03 and Vv-13/06 (Fig. 59c).
9. Mushroom

ICAR-RCER n Annual Report 2013-14 36 Mushroom
PL-13/01
PL-13/06
PL-13/04
Fig. 60. Different strains of Oyster and their fruiting bodies
PL-13/03
PL-13/07PL-13/05
PL-13/02
Similarly, seven strains of oyster (PL-13/01, PL-13/02, PL-13/03, PL-13/04, PL-13/05, PL-13/06 and PL-13/07) were evaluated for their biological efficiency, number of sporophores and weight of sporophores (Fig. 60). Among various strains of Oyster, PL-13/02 showed highest biological efficien-cy (74%), followed by PL-13/06 (61.9%), PL-13/04 (64.1%). Moreover, highest number of sporophores per bag were observed in PL-13/02 (63.8), followed by PL-13/06 (59) and PL-13/04 (53.1). The maximum weight of sporophores were observed in PL-13/03 followed by PL-13/04, PL-13/05 and PL-13/07.
Spawn Production
Mushroom unit at Research Centre, Ranchi is a premier spawn production centre of the Jharkhand. Producing of mushroom spawn throughout the year. Maximum spawn production of oyster mushroom was in the month of July to January and wards after, milky and paddy straw mushroom spawns were produced. Maximum spawn sale was observed in the month of October (524.4 kg) followed by December, 2013 (513.6 kg) and January, 2014 (508 kg).
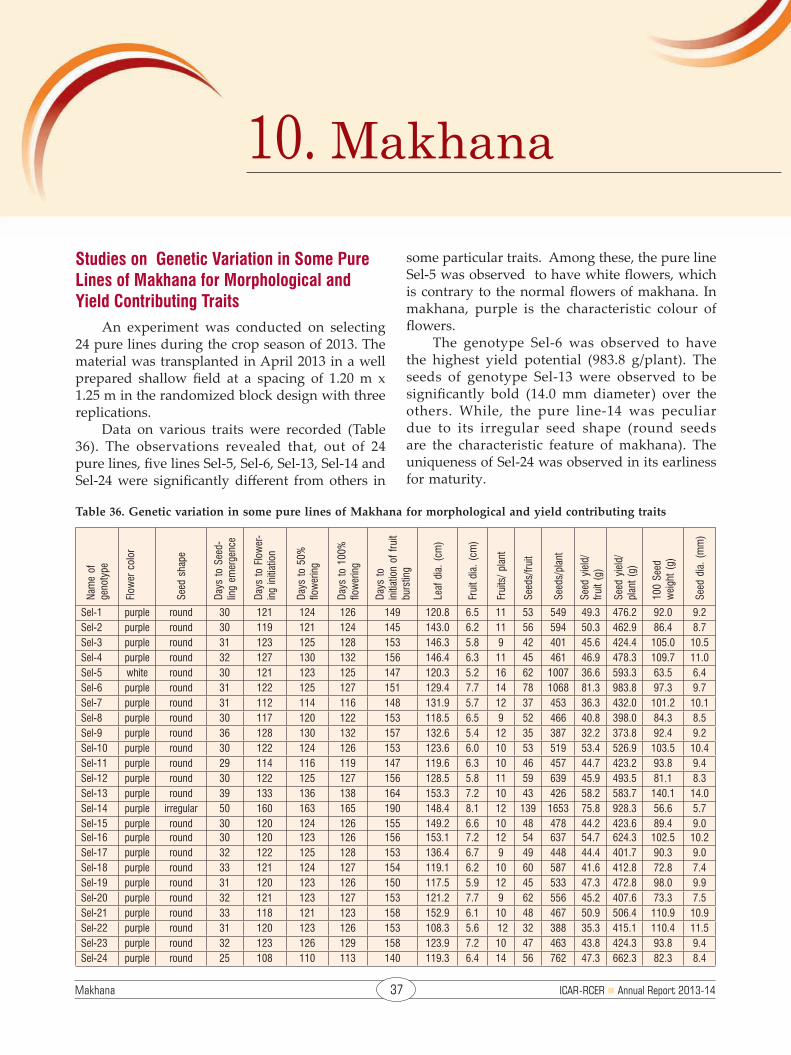
Makhana 37 ICAR-RCER n Annual Report 2013-14
Studies on Genetic Variation in Some Pure Lines of Makhana for Morphological and Yield Contributing Traits
An experiment was conducted on selecting 24 pure lines during the crop season of 2013. The material was transplanted in April 2013 in a well prepared shallow field at a spacing of 1.20 m x 1.25 m in the randomized block design with three replications.
Data on various traits were recorded (Table 36). The observations revealed that, out of 24 pure lines, five lines Sel-5, Sel-6, Sel-13, Sel-14 and Sel-24 were significantly different from others in
some particular traits. Among these, the pure line Sel-5 was observed to have white flowers, which is contrary to the normal flowers of makhana. In makhana, purple is the characteristic colour of flowers.
The genotype Sel-6 was observed to have the highest yield potential (983.8 g/plant). The seeds of genotype Sel-13 were observed to be significantly bold (14.0 mm diameter) over the others. While, the pure line-14 was peculiar due to its irregular seed shape (round seeds are the characteristic feature of makhana). The uniqueness of Sel-24 was observed in its earliness for maturity.
Table 36. Genetic variation in some pure lines of Makhana for morphological and yield contributing traits
Nam
e of
ge
noty
pe
Flow
er c
olor
Seed
sha
pe
Days
to S
eed-
ling
emer
genc
e
Days
to F
low
er-
ing
initi
atio
n
Days
to 5
0%
flow
erin
g
Days
to 1
00%
flo
wer
ing
Days
to
initi
atio
n of
frui
t bu
rstin
g
Leaf
dia
. (cm
)
Frui
t dia
. (cm
)
Frui
ts/
plan
t
Seed
s/fru
it
Seed
s/pl
ant
Seed
yie
ld/
fru
it (g
)
Seed
yie
ld/
plan
t (g)
100
Seed
w
eigh
t (g)
Seed
dia
. (m
m)
Sel-1 purple round 30 121 124 126 149 120.8 6.5 11 53 549 49.3 476.2 92.0 9.2Sel-2 purple round 30 119 121 124 145 143.0 6.2 11 56 594 50.3 462.9 86.4 8.7Sel-3 purple round 31 123 125 128 153 146.3 5.8 9 42 401 45.6 424.4 105.0 10.5Sel-4 purple round 32 127 130 132 156 146.4 6.3 11 45 461 46.9 478.3 109.7 11.0Sel-5 white round 30 121 123 125 147 120.3 5.2 16 62 1007 36.6 593.3 63.5 6.4Sel-6 purple round 31 122 125 127 151 129.4 7.7 14 78 1068 81.3 983.8 97.3 9.7Sel-7 purple round 31 112 114 116 148 131.9 5.7 12 37 453 36.3 432.0 101.2 10.1Sel-8 purple round 30 117 120 122 153 118.5 6.5 9 52 466 40.8 398.0 84.3 8.5Sel-9 purple round 36 128 130 132 157 132.6 5.4 12 35 387 32.2 373.8 92.4 9.2Sel-10 purple round 30 122 124 126 153 123.6 6.0 10 53 519 53.4 526.9 103.5 10.4Sel-11 purple round 29 114 116 119 147 119.6 6.3 10 46 457 44.7 423.2 93.8 9.4Sel-12 purple round 30 122 125 127 156 128.5 5.8 11 59 639 45.9 493.5 81.1 8.3Sel-13 purple round 39 133 136 138 164 153.3 7.2 10 43 426 58.2 583.7 140.1 14.0Sel-14 purple irregular 50 160 163 165 190 148.4 8.1 12 139 1653 75.8 928.3 56.6 5.7Sel-15 purple round 30 120 124 126 155 149.2 6.6 10 48 478 44.2 423.6 89.4 9.0Sel-16 purple round 30 120 123 126 156 153.1 7.2 12 54 637 54.7 624.3 102.5 10.2Sel-17 purple round 32 122 125 128 153 136.4 6.7 9 49 448 44.4 401.7 90.3 9.0Sel-18 purple round 33 121 124 127 154 119.1 6.2 10 60 587 41.6 412.8 72.8 7.4Sel-19 purple round 31 120 123 126 150 117.5 5.9 12 45 533 47.3 472.8 98.0 9.9Sel-20 purple round 32 121 123 127 153 121.2 7.7 9 62 556 45.2 407.6 73.3 7.5Sel-21 purple round 33 118 121 123 158 152.9 6.1 10 48 467 50.9 506.4 110.9 10.9Sel-22 purple round 31 120 123 126 153 108.3 5.6 12 32 388 35.3 415.1 110.4 11.5Sel-23 purple round 32 123 126 129 158 123.9 7.2 10 47 463 43.8 424.3 93.8 9.4Sel-24 purple round 25 108 110 113 140 119.3 6.4 14 56 762 47.3 662.3 82.3 8.4
10. Makhana
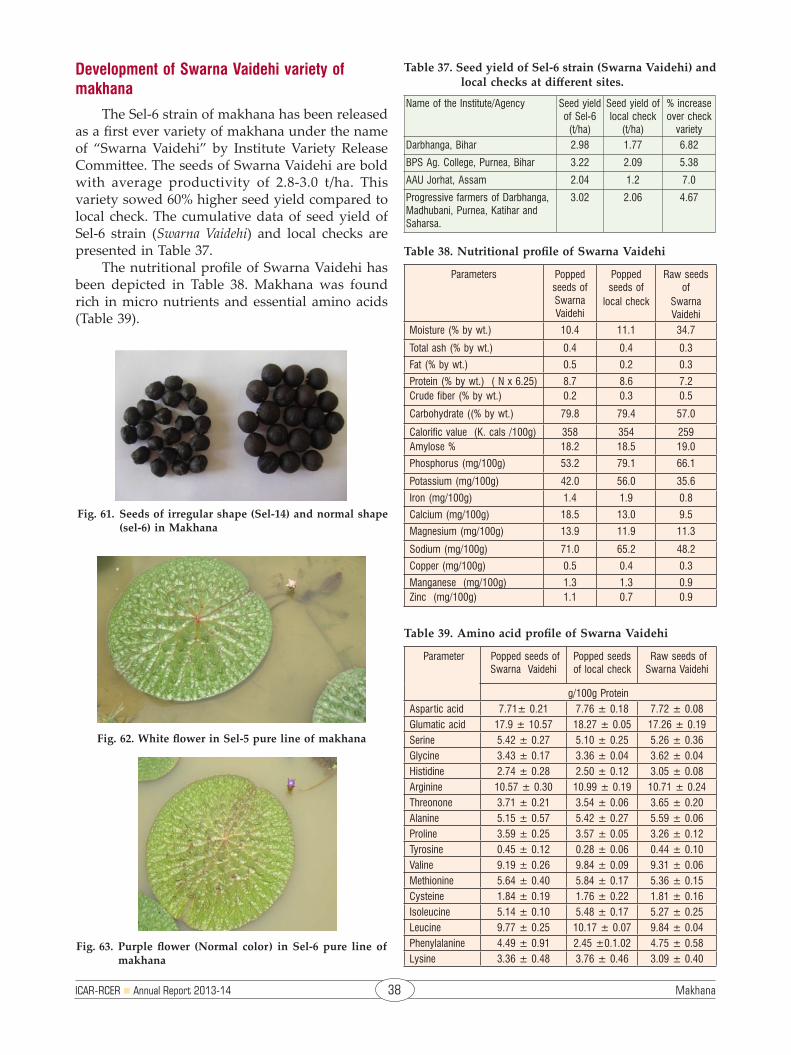
ICAR-RCER n Annual Report 2013-14 38 Makhana
Table 37. Seed yield of Sel-6 strain (Swarna Vaidehi) and local checks at different sites.
Name of the Institute/Agency Seed yield of Sel-6 (t/ha)
Seed yield of local check
(t/ha)
% increase over check
varietyDarbhanga, Bihar 2.98 1.77 6.82
BPS Ag. College, Purnea, Bihar 3.22 2.09 5.38
AAU Jorhat, Assam 2.04 1.2 7.0
Progressive farmers of Darbhanga, Madhubani, Purnea, Katihar and Saharsa.
3.02 2.06 4.67
Fig. 61. Seeds of irregular shape (Sel-14) and normal shape (sel-6) in Makhana
Fig. 62. White flower in Sel-5 pure line of makhana
Fig. 63. Purple flower (Normal color) in Sel-6 pure line of makhana
Development of Swarna Vaidehi variety of makhana
The Sel-6 strain of makhana has been released as a first ever variety of makhana under the name of “Swarna Vaidehi” by Institute Variety Release Committee. The seeds of Swarna Vaidehi are bold with average productivity of 2.8-3.0 t/ha. This variety sowed 60% higher seed yield compared to local check. The cumulative data of seed yield of Sel-6 strain (Swarna Vaidehi) and local checks are presented in Table 37.
The nutritional profile of Swarna Vaidehi has been depicted in Table 38. Makhana was found rich in micro nutrients and essential amino acids (Table 39).
Table 39. Amino acid profile of Swarna Vaidehi
Parameter Popped seeds of Swarna Vaidehi
Popped seeds of local check
Raw seeds of Swarna Vaidehi
g/100g ProteinAspartic acid 7.71± 0.21 7.76 ± 0.18 7.72 ± 0.08Glumatic acid 17.9 ± 10.57 18.27 ± 0.05 17.26 ± 0.19Serine 5.42 ± 0.27 5.10 ± 0.25 5.26 ± 0.36Glycine 3.43 ± 0.17 3.36 ± 0.04 3.62 ± 0.04Histidine 2.74 ± 0.28 2.50 ± 0.12 3.05 ± 0.08Arginine 10.57 ± 0.30 10.99 ± 0.19 10.71 ± 0.24Threonone 3.71 ± 0.21 3.54 ± 0.06 3.65 ± 0.20Alanine 5.15 ± 0.57 5.42 ± 0.27 5.59 ± 0.06Proline 3.59 ± 0.25 3.57 ± 0.05 3.26 ± 0.12Tyrosine 0.45 ± 0.12 0.28 ± 0.06 0.44 ± 0.10Valine 9.19 ± 0.26 9.84 ± 0.09 9.31 ± 0.06Methionine 5.64 ± 0.40 5.84 ± 0.17 5.36 ± 0.15Cysteine 1.84 ± 0.19 1.76 ± 0.22 1.81 ± 0.16Isoleucine 5.14 ± 0.10 5.48 ± 0.17 5.27 ± 0.25Leucine 9.77 ± 0.25 10.17 ± 0.07 9.84 ± 0.04Phenylalanine 4.49 ± 0.91 2.45 ±0.1.02 4.75 ± 0.58Lysine 3.36 ± 0.48 3.76 ± 0.46 3.09 ± 0.40
Table 38. Nutritional profile of Swarna Vaidehi
Parameters Popped seeds of Swarna Vaidehi
Popped seeds of
local check
Raw seeds of
Swarna Vaidehi
Moisture (% by wt.) 10.4 11.1 34.7
Total ash (% by wt.) 0.4 0.4 0.3
Fat (% by wt.) 0.5 0.2 0.3
Protein (% by wt.) ( N x 6.25) 8.7 8.6 7.2Crude fiber (% by wt.) 0.2 0.3 0.5
Carbohydrate ((% by wt.) 79.8 79.4 57.0
Calorific value (K. cals /100g) 358 354 259Amylose % 18.2 18.5 19.0
Phosphorus (mg/100g) 53.2 79.1 66.1
Potassium (mg/100g) 42.0 56.0 35.6
Iron (mg/100g) 1.4 1.9 0.8
Calcium (mg/100g) 18.5 13.0 9.5
Magnesium (mg/100g) 13.9 11.9 11.3
Sodium (mg/100g) 71.0 65.2 48.2
Copper (mg/100g) 0.5 0.4 0.3
Manganese (mg/100g) 1.3 1.3 0.9Zinc (mg/100g) 1.1 0.7 0.9

ICAR-RCER n Annual Report 2013-14 39 Farming System Research
Development of Location Specific Integrated Farming System Modules for Small and Marginal Farmers’ of Bihar
To increase the livelihood of small and margin-al farmers, two integrated farming system models were developed not only for food and nutritional security of the farm family but also for round the year employment opportunities. The area under different components has been allocated as per need of farm family and in view of nutrient recy-cling within the system.
In one acre model, goat, poultry, mushroom, and vermicomposting have been integrated with the crop components. Under crop components, rice–wheat, rice–maize, rice–lentil and rice–mustard (cereal based cropping system) and cowpea–okra–tomato, okra–pea-cabbage and cucurbits–cauliflower–onion (vegetable based cropping systems) were followed and nutrient recycling from the system was studied. Cowpea-cauliflower–onion cropping system along with poultry + mushroom + goatry fetched the highest net income of ` 1,39,338 in comparison with other cropping systems in a farming system mode which was about five times more than rice-wheat cropping system (` 28,256) in isolation (Table 40). In addition, 1.9 t of vermicompost, 1.0 t of goat manure and 2.12 t of poultry manure were also produced by the system which was equivalent to 200.0 kg of Urea, 401.5 kg of SSP and 86.7 kg of MOP (chemical fertilizers) which were recycled within the system (Table 41). An additional employment of 86 man-days was also generated through the system over traditional farming.
In two acre IFS model (Fig. 64), livestock (3 cows + 3 calves), fisheries, duckery and vegetables & fruits were integrated with prevalent rice–wheat, rice–maize, rice-lentil and rice-mustard cropping system. Different enterprises were evaluated with the same cropping system for their economic return and employment within different farming systems. It was found that rice–wheat + vegetables
Fig. 64. Integrated farming system mode of food production system
Table 40. Expenditure and income statement of 1 acre IFS model (2012-13)
Components Estb. Cost (`)
Recurring expd./ann. (`)
Net Income (NI) at 3rd year
(`)Crop (0.2 ha) - 16087 14128Horticulture : 0.09 ha 1080 30624 24656Fodder - 8925 9775Goat (20 + 1):0.018 ha 65,000 48516 21914Mushroom: 0.003 ha 10,000 11000 5800Poultry: 700 chicks 12,000 56280 36160Cropwaste/V.C/FYM pits 8000 6900 27105Total 96,080 176132 1,39,538
+ livestock + fisheries + duckery IFS model gave the maximum annual return. ` 2,34,953 (Table 42) with additional employment opportunity of 257 man-days. In addition to above income, 2.9 t of vermicompost and 8.6 t of cow dung were also produced which were recycled within the system and due to recycling of these wastes 149.6 kg of N,
11. Farming System Research

ICAR-RCER n Annual Report 2013-14 40 Farming System Research
114.6 kg of P and 105.4 kg of K were added to the soil which were equivalent to 325 kg of urea, 716 kg of SSP and 176 kg of MOP (Table 43).
Based upon different enterprises, different combinations were made and analyzed statistically for their sustainability index (SI) and the most sustainable farming system enterprises selected
were crop + veg. (S.I : 13.2), crop + veg. + fruits (S.I.-15.6) , crop + fish + poultry (S.I. 32.6), crop + fish + poultry + duck (S.I.-46.1), crop + mushroom +goat, crop+hort. + fish/duck + cattle, crop+ hort. + fish/duck + goat (S.I.-58.1). Further, it was also observed that due to waste recycling within the system there is an increase in organic carbon upto 1.6-9.3%, N 12.2-18.4%, P 9.9% and K 10.8-13.4% in the soil over a period of five years.
Development of Location Specific Integrated Farming System Model for Rainfed Ecosystem of Eastern Plateau and Hill Region
The IFS model was executed in an area of 1 acre comprising of vegetable (33% area), cereal (16%), pulse (7%), fruit (6.25%), fodder (5.4%), oil seed (3.12%), cattle shed (1.25%), compost unit (1.25%), other components (1.87%) and fish integration in pond (24%) with border plantation of Flemengia semialata for lac cultivation (Fig. 65).
Under vegetable components, vegetable soyabean and pea were grown. A total pod yield of 98 kg (0.74 t/ha) with straw yield of 30 kg (0.19 t/ha) in pea was obtained. The total pod yield of vegetable soybean was 670 kg (5.06 t/ha) with biomass yield of 700 kg (10.0 t/ha). The gross income from vegetable block was ` 23,200/- per year.
Sweat corn, paddy and maize were grown as cereal components. Sweat corn produced 224 kg (3.03 t/ha) and 388 kg (6.09 t/ha) grain and straw yield, respectively. Maize produced 238 kg (3.45 t/ha) grain yield with 537 kg (8.43 t/ha) straw yield. Likewise, paddy yielded 51 kg (0.80 t/ha) grain and 200 kg (3.14 t/ha) straw. The gross income fetched from cereal block was ` 7,897 per year
310 kg guava (12.4 t/ha) was obtained from fruit block. Inter cropping of French bean in guava (high density) orchard was done to fetch initial income from the newly established orchard. In
Fig. 65. Layout of different components of IFS
Table 41. Recycling of farm waste and gain/saving of nutrients in 1 acre IFS model (2012-13)
Farm waste
Qnt.
prod
uced
(t)
Production/use pattern (t)
Nutrient gain (kg)
Tota
l nut
rient
ga
in u
pon
recy
clin
g
Saving due to resource recycling
(`)
Fertiliser saving (kg)
Goat manure
1.461.0 (GM- 0.8)0.46 (VC- 0.35)
N- 17.5P- 9.25K-12.2
N-92.0P-64.25K-52.0
10113614451
200 kg urea
401.5 kg SSP
86.7 kg MOP
Veg. waste
5.252.0 (VC- 1.55)3.25- As fodder
N- 27.9P- 23.2K- 18.6
Poultry manure
2.12 Used in cropsN-46.6P- 31.8K- 21.2
RWMML straw
4.480.22-mushroom0.12- Hut4.14 t- sold
Total : 5076
Table 42. Expenditures and income statement of 2 acre IFS model (2012-13)
Components Estb. cost (`) Total expd./yr. (`)
Net income (NI) at 3rd year (`)
Crop (0.4 ha) - 30200 33566Veg. (0.15 ha) -- 31350 18450Orchards/fruits 2500 13820 14764Fodder (0.01ha) - 11000 19650Fishery (0.1 ha) 70000 9400
183001700028590Duckery (on the pond) 18000
Dairy (3 + 3) 0.016 ha 100000 95202 38048Crop waste ----- 1850 36485V.C. 15000 7120 28400Total 205000 218242 234953
Table 43. Recycling of farm waste and gain/saving of nutrients in 2 acre IFS model (2012-13)
Farmwaste
Qnt. pro-
duced (t)
Production/use pattern
(t)
Nutrient gain (kg)
Total nutrient
gain from recycling
Saving due to resource recycling
(`)
Fert. equiva-
lent (kg)
Cowdung
17.2 11.2(FYM- 8.6)2.0 (VC: 1.2)4.0-Pond treat
N-65.0P- 44.1K-49.0 N=149.6
P=114.6K=105.4
16456446 915
Total:9006/-
325 kg urea
716 kg SSP
176 kg MOP
Veg.waste
8.5 28.5 (VC-1.6) 5.7 (As fodder to cattle)
N- 84.6P- 70.5K- 56.4
Allocated areas (%) under 1 acre IFS Model for EPHR

ICAR-RCER n Annual Report 2013-14 41 Farming System Research
French bean, a yield of 27 kg (1.08 t/ha) with straw yield of 35 kg (1.40 t/ha) was received. The gross income from fruit block along with intercrop was ` 5,190/- per year.
Among pulses, black gram, mung bean, urd bean; and in oilseed, mustard were cultivated. The gross income from pulse and oilseed was ` 3,280/- per year. The fodder sorghum gave the production of 280 kg (12.96 t/ha) and fetched ` 1400/- per year.
The fish integration was done as composite culture of Rohu, Catla, Mrigal Common carp in last week of September 2011 and harvested in the last week of December. The fish yield obtained from the pond was 25 kg (0.26 t/ha) with gross income of `2,500/- per year. The total milk production was 964 litre with income of ` 28,920/- per year. The total vermicompost production of 0.2 t and 200 cft of FYM was recorded which fetched a total income of `6,000. About 400 saplings of Flemengia semialata was planted at fence for lac production. The total biomass produced from Flemengia semialata was 2.5 t/yr (Fig. 66 & 67).
Hence, during second year, net income of ` 36,462 per acre per year was recorded from different components under integrated farming system.
Development of Makhana Based Integrated Farming Systems for Lowlands and Waterlogged Areas of North Bihar
Makhana+ fish–water chestnut, fruit plants, vegetables and poultry (in a 16.72 m2 area over the pond) were integrated to enhance the net income of traditional makhana ponds. In second model, makhana+fish-water chestnut, makhana-rice-barseem, vegetables, fruit plants, and cattle were tried to augment the net income of makhana based agricultural fields. During the second year (2012-13) net return from all the components in pond model was obtained ` 37,890 with a gross income of ` 71,970. While, in field based model net return and gross income from all components were ` 47,524 and 80,762, respectively (Table 44 & 45). The comparative analysis of two models indicate that the net return in field based integrated model is approximately 25% higher than the pond based model.
Sustainable Livelihood Improvement through Need Based Integrated Farming System Models in Disadvantaged Districts of Bihar
To improve the livelihood of makhana growers the above mentioned project was initiated in April, 2009 in 50 ha pond area of makhana growers of Sadar block in Darbhanga district. During the year 2013-2014, the coverage area of this project was extended from one district to three districts
Fig. 66. Yield attributes of different enterprises ( ` ) from different components under integrated farming system
Fig. 67. Yield contribution of different enterprises (%) from different components under integrated farming system
Table 44. Economic analysis of Pond based model
Name ofcomponents
Area (m2)
Production details Market rate of produce
(`/q)
Gross return
(`)
Net return
(`)Items Wt.
(q)Makhana + fish-Water chestnut
1600 Makhana 2.56 7000 17920 8960Fish 0.38 15000 5700 3800Water chestnut
12.60 1000 12600 8400
Poultry 16.72 120 broiler 2.12 6000 12,720 1200Fruit plants:Mango- 30Guava- 35Banana- 40
1400 Mango 0.75 2000 1500 1200Guava 3.20 1500 4800 3600
Vegetables:OkraBottle guardSponge guardBitter guardCucumber
1000 Okra 6.00 800 4800 3200Bottle guard
2.25 500 1350 900
Sponge guard
1.70 600 1020 675
Bitter guard 0.95 1000 950 635Cucumber 2.85 6 00 1710 1140Potato 5.00 500 2500 1250Radish 8.80 500 4400 2930
71,970 37,890

ICAR-RCER n Annual Report 2013-14 42 Farming System Research
(Darbhanga, Madhubani and Muzaffarpur) and the mode of makhana cultivation widened from traditional ponds to shallow agricultural fields. Out
Table 45. Economic analysis of field based model
Name ofcomponents
Area (m2)
Production details Market Rate of produce
(`/q)
Gross return
(`)
Net return
(`) Item Weight
(q)
Makhana +fish andwater chestnut fish
1000
Makhana 2.9 7000 20300 10150Fish 0.30 15000 4500 3000
Water chestnut
12.0 1000 12000 8000
Makhana-rice-barseem
1000
MakhanaRice
Barseem
2.84.1056.0
70001500100
1960061505600
980040604480
Sudan grass-wheat 1000
Sudan grass 50.0 50 2500 2000Wheat grainWheat straw
4.34.3
1350150
5805645
2900645
Vegetable cropsBottle guardSponge guardBitter guardCucumber
500
Bottle guard 1.26 500 630 472Sponge guard
1.68 600 1008 670
Cucumber 0. 84 600 504 335Bitter guard 1.5 1000 1520 1012
Fruit plantsBanana-25Citrus-25
400 - - - - -
Cattle 100 - - - - -80762 47524
of 50 ha area, 36.4 ha was allotted under traditional pond system while rest 13.6 ha was covered under field mode of makhana cultivation. In both systems, integrated concepts of farming systems were adopted to augment net income of makhana growers (Table 46 & 47). Results indicate that the net returns in both integrated farming systems was two fold higher than sole makhana production system. The findings of this project suggest that integrated farming may be very helpful to improve the economic status of makhana growers by providing sustainable livelihood to them.
Fig. 68. A view of makhana crop at farmer’s field and fish harvesting from makhana field
Table 46. Economic analysis of different combinations in pond system of makhana cultivation
Component combina-tions
Total area (ha)
Total production (t) Net return(`) /ha
Makha-na seed
Fish Water chest-
nut
Makhana + fish 22.60 33.67 14.01 -- 1,02,635Makhana – water chestnut
6.40 10.37 --- 88.32 1,07,660
Makhana + fish – water chestnut
4.65 6.73 1.71 64.17 1,26,505
Makhana 2.75 4.55 ---- ---- 57,960
Table 47. Economic analysis of different combinations in field mode of makhana cultivation
Component combinations
Total area (ha)
Total production (t) Net return(`)/ha
Makhana Fish Water chest-
nut
Rice
Makhana + fish 8.40 24.02 3.78 - - 1,21,520Makhana – rice 3.00 9.07 - - 12.36 1,16,322Makhana–water chestnut
1.20 3.55 - 25.2 - 1,56,436
Makhana 1.00 3.16 - - - 88,368
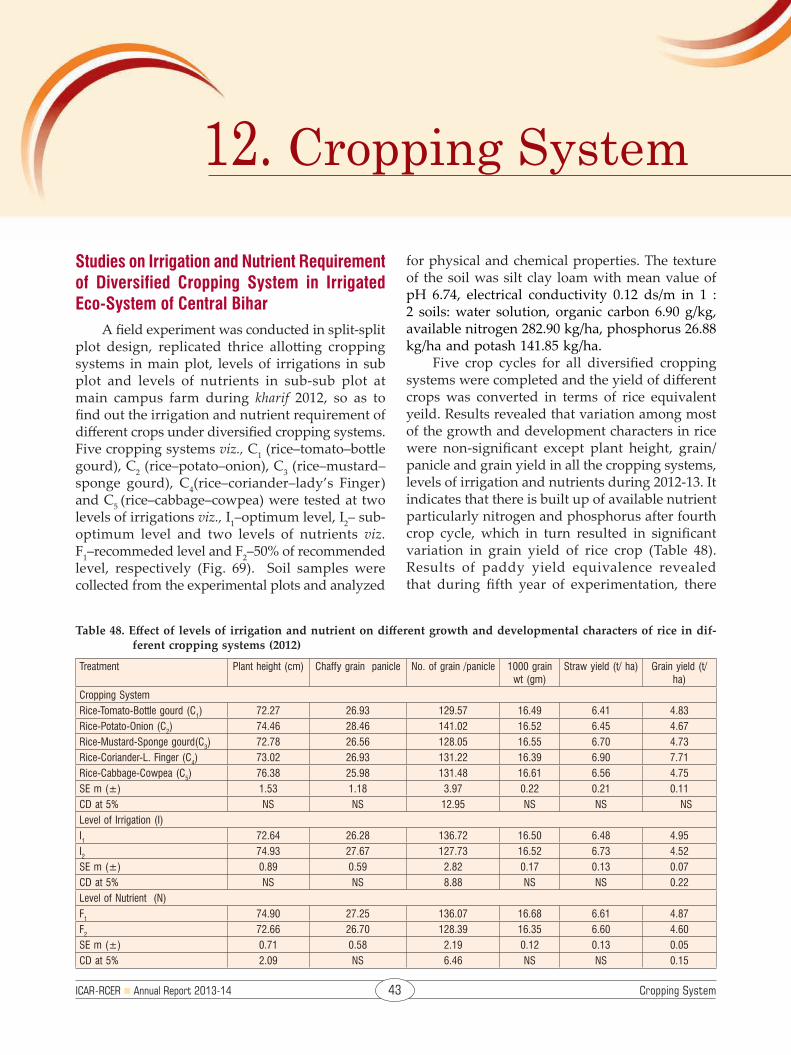
ICAR-RCER n Annual Report 2013-14 43 Cropping System
Studies on Irrigation and Nutrient Requirement of Diversified Cropping System in Irrigated Eco-System of Central Bihar
A field experiment was conducted in split-split plot design, replicated thrice allotting cropping systems in main plot, levels of irrigations in sub plot and levels of nutrients in sub-sub plot at main campus farm during kharif 2012, so as to find out the irrigation and nutrient requirement of different crops under diversified cropping systems. Five cropping systems viz., C1 (rice–tomato–bottle gourd), C2 (rice–potato–onion), C3 (rice–mustard–sponge gourd), C4(rice–coriander–lady’s Finger) and C5 (rice–cabbage–cowpea) were tested at two levels of irrigations viz., I1–optimum level, I2– sub- optimum level and two levels of nutrients viz. F1–recommeded level and F2–50% of recommended level, respectively (Fig. 69). Soil samples were collected from the experimental plots and analyzed
for physical and chemical properties. The texture of the soil was silt clay loam with mean value of pH 6.74, electrical conductivity 0.12 ds/m in 1 : 2 soils: water solution, organic carbon 6.90 g/kg, available nitrogen 282.90 kg/ha, phosphorus 26.88 kg/ha and potash 141.85 kg/ha.
Five crop cycles for all diversified cropping systems were completed and the yield of different crops was converted in terms of rice equivalent yeild. Results revealed that variation among most of the growth and development characters in rice were non-significant except plant height, grain/ panicle and grain yield in all the cropping systems, levels of irrigation and nutrients during 2012-13. It indicates that there is built up of available nutrient particularly nitrogen and phosphorus after fourth crop cycle, which in turn resulted in significant variation in grain yield of rice crop (Table 48). Results of paddy yield equivalence revealed that during fifth year of experimentation, there
Table 48. Effect of levels of irrigation and nutrient on different growth and developmental characters of rice in dif-ferent cropping systems (2012)
Treatment Plant height (cm) Chaffy grain panicle No. of grain /panicle 1000 grain wt (gm)
Straw yield (t/ ha) Grain yield (t/ha)
Cropping SystemRice-Tomato-Bottle gourd (C1) 72.27 26.93 129.57 16.49 6.41 4.83Rice-Potato-Onion (C2) 74.46 28.46 141.02 16.52 6.45 4.67Rice-Mustard-Sponge gourd(C3) 72.78 26.56 128.05 16.55 6.70 4.73Rice-Coriander-L. Finger (C4) 73.02 26.93 131.22 16.39 6.90 7.71Rice-Cabbage-Cowpea (C5) 76.38 25.98 131.48 16.61 6.56 4.75SE m (±) 1.53 1.18 3.97 0.22 0.21 0.11CD at 5% NS NS 12.95 NS NS NSLevel of Irrigation (I)I1 72.64 26.28 136.72 16.50 6.48 4.95I2 74.93 27.67 127.73 16.52 6.73 4.52SE m (±) 0.89 0.59 2.82 0.17 0.13 0.07CD at 5% NS NS 8.88 NS NS 0.22Level of Nutrient (N)F1 74.90 27.25 136.07 16.68 6.61 4.87F2 72.66 26.70 128.39 16.35 6.60 4.60SE m (±) 0.71 0.58 2.19 0.12 0.13 0.05CD at 5% 2.09 NS 6.46 NS NS 0.15
12. Cropping System
ICAR-RCER n Annual Report 2013-14 44 Cropping System
C1I1F1 (Rice-tomato-bottlegourd)
C1I1F2 (Rice-tomato bottlegourd)
C5 I1F1 (Rice-cabbage-cowpea)
C5 I1F2 (Rice-cabbage-cowpea)
Fig. 69. Different cropping systems developed for irrigated ecosystems
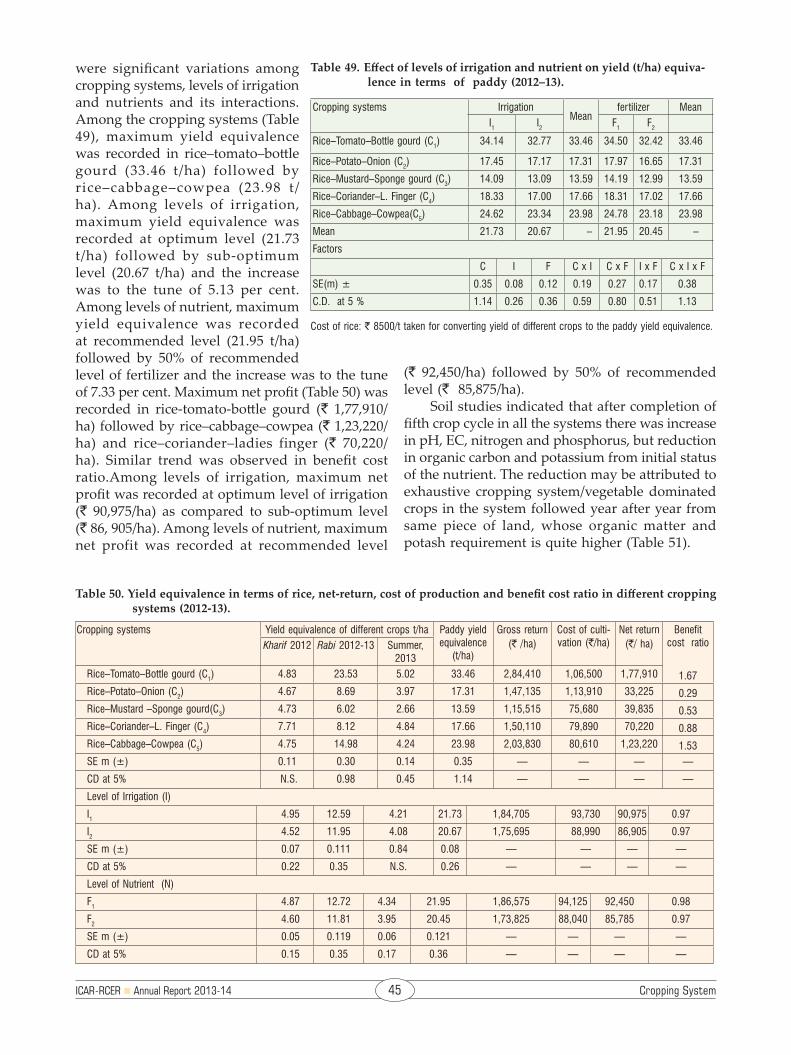
ICAR-RCER n Annual Report 2013-14 45 Cropping System
Table 49. Effect of levels of irrigation and nutrient on yield (t/ha) equiva-lence in terms of paddy (2012–13).
Cropping systems IrrigationMean
fertilizer MeanI1 I2 F1 F2
Rice–Tomato–Bottle gourd (C1) 34.14 32.77 33.46 34.50 32.42 33.46
Rice–Potato–Onion (C2) 17.45 17.17 17.31 17.97 16.65 17.31
Rice–Mustard–Sponge gourd (C3) 14.09 13.09 13.59 14.19 12.99 13.59
Rice–Coriander–L. Finger (C4) 18.33 17.00 17.66 18.31 17.02 17.66
Rice–Cabbage–Cowpea(C5) 24.62 23.34 23.98 24.78 23.18 23.98
Mean 21.73 20.67 – 21.95 20.45 –
Factors
C I F C x I C x F I x F C x I x F
SE(m) ± 0.35 0.08 0.12 0.19 0.27 0.17 0.38
C.D. at 5 % 1.14 0.26 0.36 0.59 0.80 0.51 1.13
Cost of rice: ` 8500/t taken for converting yield of different crops to the paddy yield equivalence.
Table 50. Yield equivalence in terms of rice, net-return, cost of production and benefit cost ratio in different cropping systems (2012-13).
Cropping systems Yield equivalence of different crops t/ha Paddy yield equivalence
(t/ha)
Gross return(` /ha)
Cost of culti-vation (`/ha)
Net return(`/ ha)
Benefit cost ratioKharif 2012 Rabi 2012-13 Summer,
2013Rice–Tomato–Bottle gourd (C1) 4.83 23.53 5.02 33.46 2,84,410 1,06,500 1,77,910 1.67Rice–Potato–Onion (C2) 4.67 8.69 3.97 17.31 1,47,135 1,13,910 33,225 0.29Rice–Mustard –Sponge gourd(C3) 4.73 6.02 2.66 13.59 1,15,515 75,680 39,835 0.53Rice–Coriander–L. Finger (C4) 7.71 8.12 4.84 17.66 1,50,110 79,890 70,220 0.88Rice–Cabbage–Cowpea (C5) 4.75 14.98 4.24 23.98 2,03,830 80,610 1,23,220 1.53SE m (±) 0.11 0.30 0.14 0.35 — — — —
CD at 5% N.S. 0.98 0.45 1.14 — — — —
Level of Irrigation (I)
I1 4.95 12.59 4.21 21.73 1,84,705 93,730 90,975 0.97
I2 4.52 11.95 4.08 20.67 1,75,695 88,990 86,905 0.97
SE m (±) 0.07 0.111 0.84 0.08 — — — —
CD at 5% 0.22 0.35 N.S. 0.26 — — — —
Level of Nutrient (N)
F1 4.87 12.72 4.34 21.95 1,86,575 94,125 92,450 0.98
F2 4.60 11.81 3.95 20.45 1,73,825 88,040 85,785 0.97
SE m (±) 0.05 0.119 0.06 0.121 — — — —
CD at 5% 0.15 0.35 0.17 0.36 — — — —
were significant variations among cropping systems, levels of irrigation and nutrients and its interactions. Among the cropping systems (Table 49), maximum yield equivalence was recorded in rice–tomato–bottle gourd (33.46 t/ha) followed by rice–cabbage–cowpea (23.98 t/ha). Among levels of irrigation, maximum yield equivalence was recorded at optimum level (21.73 t/ha) followed by sub-optimum level (20.67 t/ha) and the increase was to the tune of 5.13 per cent. Among levels of nutrient, maximum yield equivalence was recorded at recommended level (21.95 t/ha) followed by 50% of recommended level of fertilizer and the increase was to the tune of 7.33 per cent. Maximum net profit (Table 50) was recorded in rice-tomato-bottle gourd (` 1,77,910/ha) followed by rice–cabbage–cowpea (` 1,23,220/ha) and rice–coriander–ladies finger (` 70,220/ha). Similar trend was observed in benefit cost ratio.Among levels of irrigation, maximum net profit was recorded at optimum level of irrigation (` 90,975/ha) as compared to sub-optimum level (` 86, 905/ha). Among levels of nutrient, maximum net profit was recorded at recommended level
(` 92,450/ha) followed by 50% of recommended level (` 85,875/ha).
Soil studies indicated that after completion of fifth crop cycle in all the systems there was increase in pH, EC, nitrogen and phosphorus, but reduction in organic carbon and potassium from initial status of the nutrient. The reduction may be attributed to exhaustive cropping system/vegetable dominated crops in the system followed year after year from same piece of land, whose organic matter and potash requirement is quite higher (Table 51).

ICAR-RCER n Annual Report 2013-14 46 Cropping System
Intercropping of Rice and Legumes in Hill and Plateau region
In rice-legume cropping system under rainfed upland situation in kharif season, the upland rice (variety Anjali) and legumes like soybean (variety Swarna Vasundhara), groundnut (variety Birsa Bold), black gram (variety Uttara), green gram (variety CN 9-5), cowpea (line EC 452), rice bean (line HARB-1) and horse gram (variety GKP-7C) were grown both as sole crops (each of 12 rows) and in combination (6 row rice + 6 row of each legume). The sowing of rice, groundnut, black gram, soybean, rice bean and cowpea was done on 03.07.2013 whereas green gram and horse gram were sown on 01.08.2013. The sole crop of groundnut recorded the maximum rice equivalent yield (10.74 t/ha) followed by soybean (9.03 t/ha). Among the combinations, the treatment of 6 row rice + 6 row groundnuts (7.13 t/ha) was the best followed by that of 6 row rice + 6 row soybean (6.38 t/ha) (Table 52 & Fig. 70).
Table 52. Rice equivalent yield (t/ha) in rice–legume cropping system
Treatments Rice Equivalent Yield (REY)
T1 (12 Row Rice) 3.44
T2 (12 Row Black gram) 4.74
T3 (12 Row Green gram) 2.86
T4 (12 Row Soybean) 9.03
T5 (12 Row Cowpea) 2.81
T6 (12 Row Rice bean) 5.46
T7 (12 Row Horse gram) 3.49
T8 (12 Row Groundnut) 10.74
T9 (6 Row Rice + 6 Row Black gram) 3.89
T10 (6 Row Rice + 6 Row Green gram) 2.98
T11 (6 Row Rice + 6 Row Soybean) 6.38
T12 (6 Row Rice + 6 Row Cowpea) 2.87
T13 (6 Row Rice + 6 Row Rice bean) 4.62
T14 (6 Row Rice + 6 Row Horse gram) 2.86
T15 (6 Row Rice + 6 Row Groundnut) 7.13
CD at 5% 0.83
Eco-biology and management of rodent fauna of rice-wheat cropping system
The rodent trapping was carried out round the year from different cropping system of Bihar. Three rodents species, i.e., lesser bandicoot rat (Bandicota bengalensis), field mouse (Mus booduga) and soft furred field rat (Millardia meltada pallidior) were collected. Out of three species, former species was found predominantly in the rice-wheat cropping system of the region. Round the year trapping of predominant species revealed that the incidence of both the male and female bandicoot rats were more in October to January and March and April with peak in December. The declined trend was observed in the month of February, May, and June to September (Fig. 71). Body weight of collected bandicoot rat ranged from 123.0 to 221.08 g (Fig. 72). Data indicates that the bandicoots collected from July to October were adult and in other months were sub adult. Due to scarce food availability in the months of July to October, rat stopped their breeding however; the food availability in November to February was abundant due to maturity of paddy and sowing of wheat crops, induced breeding potential of bandicoots hence rats having less body weight (sub adults) were collected. It was also confirmed by percent prevalence of pregnancy during these months (Fig. 73)
Fig. 70. Rice-legume cropping system under rainfed situation
Table 51. Effect of levels of irrigation and nutrient on chemical status of soil in diversified cropping systems (2008-09 to 2012-13)
Treatments pH EC Org. carbon (g/kg)
Available nitrogen (kg/ha)
Available phosphorus (kg/ha)
Available potash (kg/ha)
Initial status of nutrients in the soil of experimental site 6.50 0.11 10.5 281.00 23.56 193.20Average nutrient status after first crop cycle (2008-09) 7.08 0.10 8.52 247.62 24.17 151.01Average nutrient status after second crop cycle (2009-10) 6.97 0.12 6.64 262.68 26.40 181.02Average nutrient status after third crop cycle (2010-11) 6.73 0.20 7.20 356.95 30.32 135.72Average nutrient status after fourth crop cycle (2011-12) 6.73 0.12 6.92 285.93 28.68 145.65Average nutrient status after fifth crop cycle (2012-13) 6.74 0.12 6.90 282.90 26.88 141.85
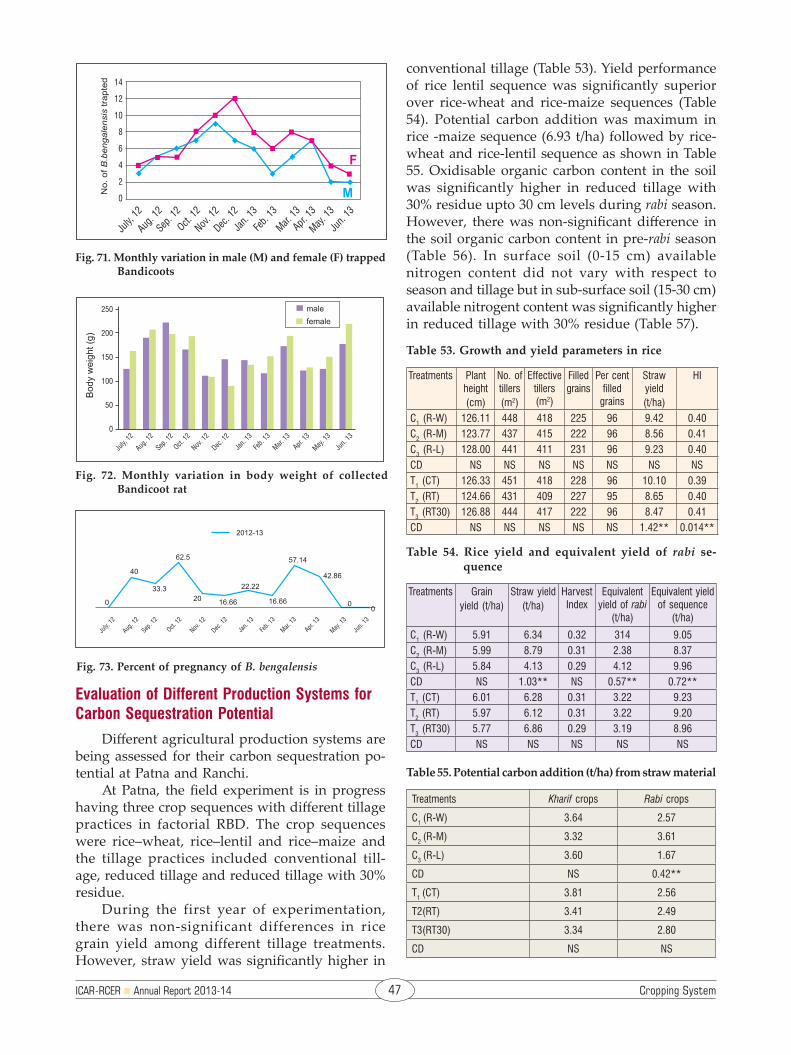
ICAR-RCER n Annual Report 2013-14 47 Cropping System
conventional tillage (Table 53). Yield performance of rice lentil sequence was significantly superior over rice-wheat and rice-maize sequences (Table 54). Potential carbon addition was maximum in rice -maize sequence (6.93 t/ha) followed by rice-wheat and rice-lentil sequence as shown in Table 55. Oxidisable organic carbon content in the soil was significantly higher in reduced tillage with 30% residue upto 30 cm levels during rabi season. However, there was non-significant difference in the soil organic carbon content in pre-rabi season (Table 56). In surface soil (0-15 cm) available nitrogen content did not vary with respect to season and tillage but in sub-surface soil (15-30 cm) available nitrogent content was significantly higher in reduced tillage with 30% residue (Table 57).
Table 53. Growth and yield parameters in rice
Treatments Plant height(cm)
No. of tillers(m2)
Effective tillers (m2)
Filled grains
Per cent filled
grains
Straw yield(t/ha)
HI
C1 (R-W) 126.11 448 418 225 96 9.42 0.40 C2 (R-M) 123.77 437 415 222 96 8.56 0.41 C3 (R-L) 128.00 441 411 231 96 9.23 0.40 CD NS NS NS NS NS NS NS T1 (CT) 126.33 451 418 228 96 10.10 0.39 T2 (RT) 124.66 431 409 227 95 8.65 0.40 T3 (RT30) 126.88 444 417 222 96 8.47 0.41 CD NS NS NS NS NS 1.42** 0.014**
Table 54. Rice yield and equivalent yield of rabi se-quence
Treatments Grainyield (t/ha)
Straw yield(t/ha)
Harvest Index
Equivalent yield of rabi
(t/ha)
Equivalent yield of sequence
(t/ha)
C1 (R-W) 5.91 6.34 0.32 314 9.05C2 (R-M) 5.99 8.79 0.31 2.38 8.37C3 (R-L) 5.84 4.13 0.29 4.12 9.96CD NS 1.03** NS 0.57** 0.72**T1 (CT) 6.01 6.28 0.31 3.22 9.23T2 (RT) 5.97 6.12 0.31 3.22 9.20T3 (RT30) 5.77 6.86 0.29 3.19 8.96CD NS NS NS NS NS
Table 55. Potential carbon addition (t/ha) from straw material
Treatments Kharif crops Rabi crops
C1 (R-W) 3.64 2.57
C2 (R-M) 3.32 3.61
C3 (R-L) 3.60 1.67
CD NS 0.42**
T1 (CT) 3.81 2.56
T2(RT) 3.41 2.49
T3(RT30) 3.34 2.80
CD NS NS
Fig. 71. Monthly variation in male (M) and female (F) trapped Bandicoots
Evaluation of Different Production Systems for Carbon Sequestration Potential
Different agricultural production systems are being assessed for their carbon sequestration po-tential at Patna and Ranchi.
At Patna, the field experiment is in progress having three crop sequences with different tillage practices in factorial RBD. The crop sequences were rice–wheat, rice–lentil and rice–maize and the tillage practices included conventional till-age, reduced tillage and reduced tillage with 30% residue.
During the first year of experimentation, there was non-significant differences in rice grain yield among different tillage treatments. However, straw yield was significantly higher in
Fig. 72. Monthly variation in body weight of collected Bandicoot rat
Fig. 73. Percent of pregnancy of B. bengalensis
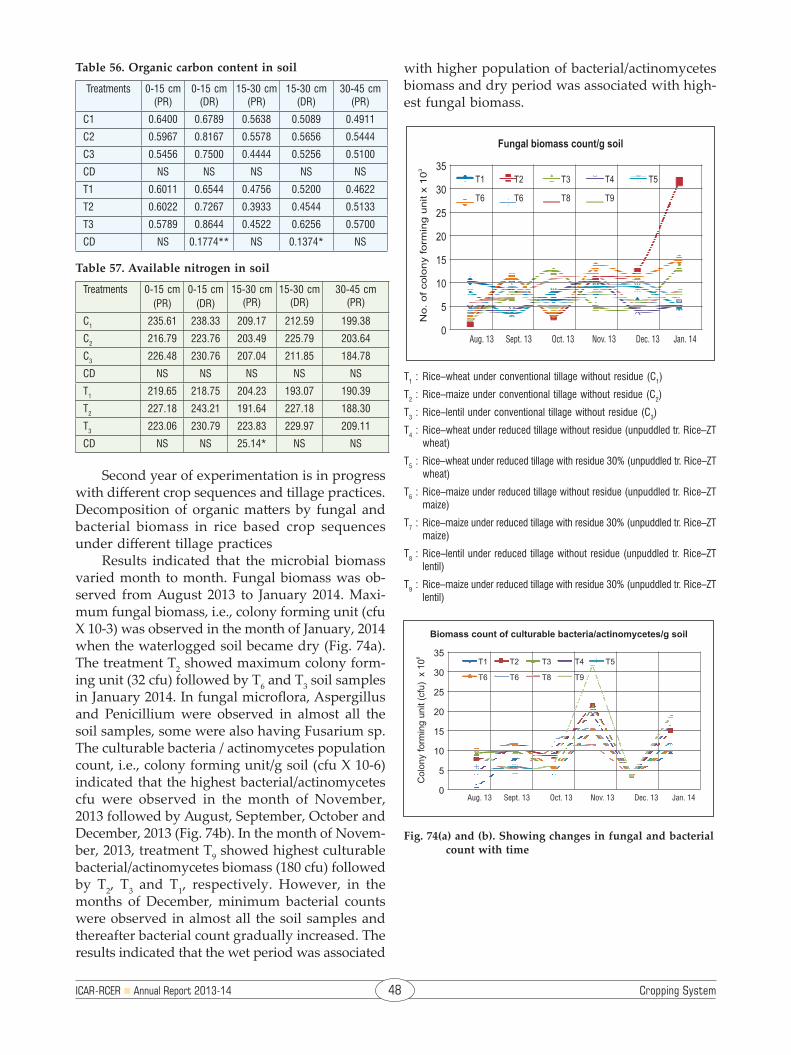
ICAR-RCER n Annual Report 2013-14 48 Cropping System
T1 : Rice–wheat under conventional tillage without residue (C1)
T2 : Rice–maize under conventional tillage without residue (C2)
T3 : Rice–lentil under conventional tillage without residue (C3)
T4 : Rice–wheat under reduced tillage without residue (unpuddled tr. Rice–ZT wheat)
T5 : Rice–wheat under reduced tillage with residue 30% (unpuddled tr. Rice–ZT wheat)
T6 : Rice–maize under reduced tillage without residue (unpuddled tr. Rice–ZT maize)
T7 : Rice–maize under reduced tillage with residue 30% (unpuddled tr. Rice–ZT maize)
T8 : Rice–lentil under reduced tillage without residue (unpuddled tr. Rice–ZT lentil)
T9 : Rice–maize under reduced tillage with residue 30% (unpuddled tr. Rice–ZT lentil)
Table 56. Organic carbon content in soil
Treatments 0-15 cm (PR)
0-15 cm (DR)
15-30 cm (PR)
15-30 cm (DR)
30-45 cm (PR)
C1 0.6400 0.6789 0.5638 0.5089 0.4911
C2 0.5967 0.8167 0.5578 0.5656 0.5444
C3 0.5456 0.7500 0.4444 0.5256 0.5100
CD NS NS NS NS NS
T1 0.6011 0.6544 0.4756 0.5200 0.4622
T2 0.6022 0.7267 0.3933 0.4544 0.5133
T3 0.5789 0.8644 0.4522 0.6256 0.5700
CD NS 0.1774** NS 0.1374* NS
Table 57. Available nitrogen in soil
Treatments 0-15 cm(PR)
0-15 cm(DR)
15-30 cm (PR)
15-30 cm (DR)
30-45 cm (PR)
C1 235.61 238.33 209.17 212.59 199.38
C2 216.79 223.76 203.49 225.79 203.64
C3 226.48 230.76 207.04 211.85 184.78
CD NS NS NS NS NS
T1 219.65 218.75 204.23 193.07 190.39
T2 227.18 243.21 191.64 227.18 188.30
T3 223.06 230.79 223.83 229.97 209.11
CD NS NS 25.14* NS NS
Second year of experimentation is in progress with different crop sequences and tillage practices. Decomposition of organic matters by fungal and bacterial biomass in rice based crop sequences under different tillage practices
Results indicated that the microbial biomass varied month to month. Fungal biomass was ob-served from August 2013 to January 2014. Maxi-mum fungal biomass, i.e., colony forming unit (cfu X 10-3) was observed in the month of January, 2014 when the waterlogged soil became dry (Fig. 74a). The treatment T2 showed maximum colony form-ing unit (32 cfu) followed by T6 and T3 soil samples in January 2014. In fungal microflora, Aspergillus and Penicillium were observed in almost all the soil samples, some were also having Fusarium sp. The culturable bacteria / actinomycetes population count, i.e., colony forming unit/g soil (cfu X 10-6) indicated that the highest bacterial/actinomycetes cfu were observed in the month of November, 2013 followed by August, September, October and December, 2013 (Fig. 74b). In the month of Novem-ber, 2013, treatment T9 showed highest culturable bacterial/actinomycetes biomass (180 cfu) followed by T2, T3 and T1, respectively. However, in the months of December, minimum bacterial counts were observed in almost all the soil samples and thereafter bacterial count gradually increased. The results indicated that the wet period was associated
Fig. 74(a) and (b). Showing changes in fungal and bacterial count with time
with higher population of bacterial/actinomycetes biomass and dry period was associated with high-est fungal biomass.

ICAR-RCER n Annual Report 2013-14 49 Soil Science
Dynamics of Nutrients Under Makhana and Makhana-Based Cropping Systems Grown in Inceptisols of Northern Bihar
Nutrient contribution by makhana crop to the soil and removal of nutrients by seed parts
Roots of makhana plants absorb nutrients from the sediments and accumulate high concentra-tions of micronutrients like Fe, Mn and Zn (Table 58). Shoots and leaves also contain considerable amount of nutrients.
Biomass of makhana on decomposition added approximately 31, 47, 40 and 22 kg/ha of nitrogen, phosphorus, potassium and iron, respectively, to the soil (Table 59). The removal of N, P, K and Fe by the seed material from the soil was recorded at 40, 9.5, 1.5 and 2.3 kg/ha, respectively. The uptake and removal of other nutrients from the soil was, however, very less (Table 60).
Soil fertility status under different makhana and makhana based cropping system
Field experiments were conducted to study the impact of makhana based cropping systems on fertility status of soil. It was observed that makha-na–chestnut–barseem cropping system appreciably increased the nutrient status of soil over other makhana–based cropping systems. Soil organic carbon in makhana–chestnut–barseem increased due to addition of comparatively higher amount of organic matter to the soil. The highest amount of available nitrogen (280 kg/ha), phosphorus (22 kg/ha) and potassium (230 kg/ha) was also recorded with makhana–chestnut–barseem cropping system followed by makhana–barseem cropping system. The lowest quantity of available nitrogen (188 kg/ha), phosphorus (12 kg/ha) and potassium (206 kg/ha) was recorded with makhana–rice–wheat, makhana–rice and makhana–rice–barseem crop-
ping system, respectively. However, all the crop-ping systems could not registered any appreciable changes in pH and EC of soil (Table 61).Table 58. Nutrient status of makhana plants
Plant Parts N(%)
P(%)
K(%)
S (%)
Fe (ppm)
Mn (ppm)
Cu (ppm)
Zn (ppm)
Leaf 0.36 0.48 0.30 0.04 2060 942 6 106
Petiole 0.25 0.45 0.41 0.01 2155 885 6 82
Root 0.26 0.38 0.50 0.01 2310 945 7 92
Fruit sheath 0.21 0.51 0.25 0.02 1750 915 9 91
Seed (starch) 1.61 0.38 0.06 0.02 913 25 9 109
Table 59. Nutrient contribution through makhana plants to the soil
Plant parts N (kg/ha) P (kg/ha) K (kg/ha) Fe (kg/ha)
Leaf 14.59 19.45 12.16 8.10Petiole 3.60 6.48 5.90 3.16Root 2.82 6.86 3.36 2.28Fruit sheath 9.72 14.20 18.69 8.59 Total 30.73 46.99 40.11 22.13
Table 60. Nutrient uptake by crops
Crop N (kg/ha) P (kg/ha) K (kg/ha)
Makhana 74 55 41
Rice 60 13 89
Wheat 103 20 76
Barseem 334 24 174
Chestnut 63 8 79
Table 61. The physico-chemical properties of soil under different makhana based cropping system
Cropping systems pH EC (dSm-1)
Org. C.(%)
Av. N (kg/ha)
Av. P (kg/ha)
Av. K (kg/ha)
Makhana–makhana 7.38 0.06 0.51 245 16 215
Makhana–wheat 7.72 0.10 0.60 257 19 213
Makhana–rice 6.53 0.18 0.62 200 12 217
Makhana–barseem 6.78 0.20 0.75 265 20 210
Makhana–chestnut 7.05 0.16 0.55 248 17 225Makhana–rice–wheat 7.45 0.21 0.65 190 16 208Rice–wheat 7.40 0.21 0.46 234 18 212Makhana–rice–barseem 7.12 0.17 0.68 220 14 206Makhana–chestnut–barseem
7.33 0.22 0.77 280 22 230
Makhana+fish–rice+fish 6.87 0.24 0.58 205 13 209
13. Soil Science
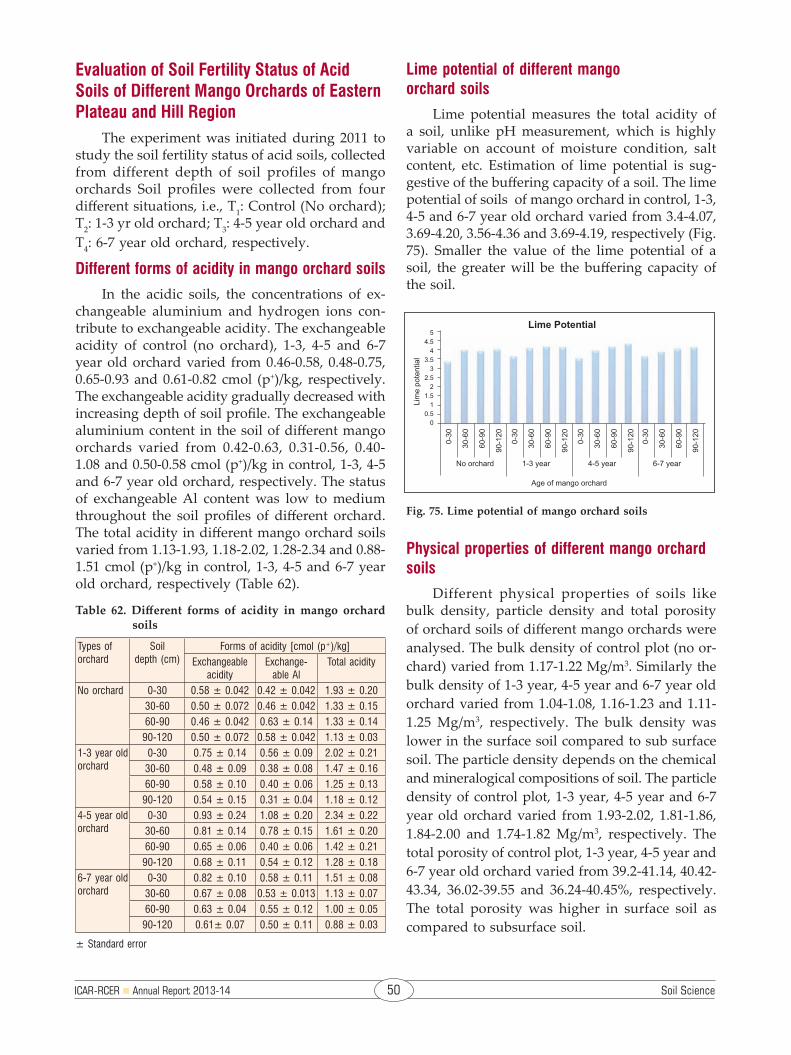
ICAR-RCER n Annual Report 2013-14 50 Soil Science
Evaluation of Soil Fertility Status of Acid Soils of Different Mango Orchards of Eastern Plateau and Hill Region
The experiment was initiated during 2011 to study the soil fertility status of acid soils, collected from different depth of soil profiles of mango orchards Soil profiles were collected from four different situations, i.e., T1: Control (No orchard); T2: 1-3 yr old orchard; T3: 4-5 year old orchard and T4: 6-7 year old orchard, respectively.
Different forms of acidity in mango orchard soils
In the acidic soils, the concentrations of ex-changeable aluminium and hydrogen ions con-tribute to exchangeable acidity. The exchangeable acidity of control (no orchard), 1-3, 4-5 and 6-7 year old orchard varied from 0.46-0.58, 0.48-0.75, 0.65-0.93 and 0.61-0.82 cmol (p+)/kg, respectively. The exchangeable acidity gradually decreased with increasing depth of soil profile. The exchangeable aluminium content in the soil of different mango orchards varied from 0.42-0.63, 0.31-0.56, 0.40-1.08 and 0.50-0.58 cmol (p+)/kg in control, 1-3, 4-5 and 6-7 year old orchard, respectively. The status of exchangeable Al content was low to medium throughout the soil profiles of different orchard. The total acidity in different mango orchard soils varied from 1.13-1.93, 1.18-2.02, 1.28-2.34 and 0.88-1.51 cmol (p+)/kg in control, 1-3, 4-5 and 6-7 year old orchard, respectively (Table 62).
Table 62. Different forms of acidity in mango orchard soils
Types of orchard
Soil depth (cm)
Forms of acidity [cmol (p+)/kg]Exchangeable
acidity Exchange-
able AlTotal acidity
No orchard 0-30 0.58 ± 0.042 0.42 ± 0.042 1.93 ± 0.2030-60 0.50 ± 0.072 0.46 ± 0.042 1.33 ± 0.1560-90 0.46 ± 0.042 0.63 ± 0.14 1.33 ± 0.14
90-120 0.50 ± 0.072 0.58 ± 0.042 1.13 ± 0.031-3 year old orchard
0-30 0.75 ± 0.14 0.56 ± 0.09 2.02 ± 0.2130-60 0.48 ± 0.09 0.38 ± 0.08 1.47 ± 0.1660-90 0.58 ± 0.10 0.40 ± 0.06 1.25 ± 0.13
90-120 0.54 ± 0.15 0.31 ± 0.04 1.18 ± 0.124-5 year old orchard
0-30 0.93 ± 0.24 1.08 ± 0.20 2.34 ± 0.2230-60 0.81 ± 0.14 0.78 ± 0.15 1.61 ± 0.2060-90 0.65 ± 0.06 0.40 ± 0.06 1.42 ± 0.21
90-120 0.68 ± 0.11 0.54 ± 0.12 1.28 ± 0.186-7 year old orchard
0-30 0.82 ± 0.10 0.58 ± 0.11 1.51 ± 0.0830-60 0.67 ± 0.08 0.53 ± 0.013 1.13 ± 0.0760-90 0.63 ± 0.04 0.55 ± 0.12 1.00 ± 0.05
90-120 0.61± 0.07 0.50 ± 0.11 0.88 ± 0.03
± Standard error
Lime potential of different mango orchard soils
Lime potential measures the total acidity of a soil, unlike pH measurement, which is highly variable on account of moisture condition, salt content, etc. Estimation of lime potential is sug-gestive of the buffering capacity of a soil. The lime potential of soils of mango orchard in control, 1-3, 4-5 and 6-7 year old orchard varied from 3.4-4.07, 3.69-4.20, 3.56-4.36 and 3.69-4.19, respectively (Fig. 75). Smaller the value of the lime potential of a soil, the greater will be the buffering capacity of the soil.
Fig. 75. Lime potential of mango orchard soils
Physical properties of different mango orchard soils
Different physical properties of soils like bulk density, particle density and total porosity of orchard soils of different mango orchards were analysed. The bulk density of control plot (no or-chard) varied from 1.17-1.22 Mg/m3. Similarly the bulk density of 1-3 year, 4-5 year and 6-7 year old orchard varied from 1.04-1.08, 1.16-1.23 and 1.11-1.25 Mg/m3, respectively. The bulk density was lower in the surface soil compared to sub surface soil. The particle density depends on the chemical and mineralogical compositions of soil. The particle density of control plot, 1-3 year, 4-5 year and 6-7 year old orchard varied from 1.93-2.02, 1.81-1.86, 1.84-2.00 and 1.74-1.82 Mg/m3, respectively. The total porosity of control plot, 1-3 year, 4-5 year and 6-7 year old orchard varied from 39.2-41.14, 40.42-43.34, 36.02-39.55 and 36.24-40.45%, respectively. The total porosity was higher in surface soil as compared to subsurface soil.

ICAR-RCER n Annual Report 2013-14 51 Soil Science
Leaf nutrient status of mango plants of different orchards
Secondary and micronutrient content in mango leaf
The secondary nutrients like calcium, mag-nesium and sulphur content of mango leaf (var. Amrapali) were analyzed for different orchard varying in age. The calcium content varied from 1.4 to 2.31%, magnesium from 0.26-0.35% and sul-phur from 0.11-0.14% among the different mango orchard. The calcium and sulphur content was found in normal range while magnesium content was in deficient range (Fig. 76). The total iron con-tent was 142, 94 and 171 mg/kg in 1-3, 4-5 and 6-7 year old orchard, respectively. The total manganese content was 560, 554 and 721 mg/kg in 1-3, 4-5 and 6-7 year old orchard, respectively. The total iron content was found in normal range while total manganese content was in high range (Fig. 77). The total copper content of different mango orchard varied from 18.91-25.46 mg/kg and was found in high range. The total zinc content in the leaves of different mango orchard varied from 21.6-38 mg/kg and was in normal range (Fig. 78).
Carbon Sequestration Assessment of Different Tree Systems for Carbon Sequestration Potential (Destructive Study)
The different age of two and six year old or-chard of litchi, mango and guava were uprooted. Soil samples were collected at depths of 0-15, 15-30, 30-45, 45-60 cm during harvest of tree. All the soil samples were dried, powdered and passed through 2 mm sieve and stored for analysis in the laboratory. Further the different size fractions of 2000-200 µ, 200-53 µ and ≤ 53 µ were separated and organic carbon content was determined. The organic carbon content in 2000 to 53 µ soil particle size represents the slow pool of organic carbon while organic carbon content in ≤ 53 µ soil particle size corresponds to passive pool of organic carbon.
Organic and biotic carbon content in two year old orchard
The soil organic carbon content (SOC) in differ-ent size fractions of soils of two year old orchard at different depths was analyzed. The organic carbon content under the two year old tree canopy in the surface soils by all the size fractions (2000-200 µ, 200-53 µ and ≤ 53 µ) was recorded highest in guava orchard (0.58%) followed by litchi (0.55%) and mango (0.5%). Among the different size fractions, SOC was highest in the 2000-200 µ size in all the orchards. The SOC gradually decreased with in-creasing depth of soil. The highest SOC in different size fractions in surface soil was 0.39% (2000-200 µ size), 0.13% (200-53 µ size and 0.06% (≤ 53 µ) in guava orchard (Table 63).
The biotic carbon content in different parts of two year old fruit plant in different orchards was recorded. The highest biotic-C was 158.0 g C/plant in mango, followed by litchi (147.8 g C/plant) and guava (78.3 g C/plant) plant (Fig. 79). Among dif-ferent parts of plant, stem part recorded the highest carbon in all the orchard.
Fig. 76. Total calcium, magnesium and sulphur content of different mango orchard (var. Amrapalli) (± SE)
Fig. 77. Total iron and manganese content of different mango orchard (Var. Amrapalli) (± SE)
Fig. 78. Total copper and zinc content of different mango orchard (var. Amrapalli) (± SE)
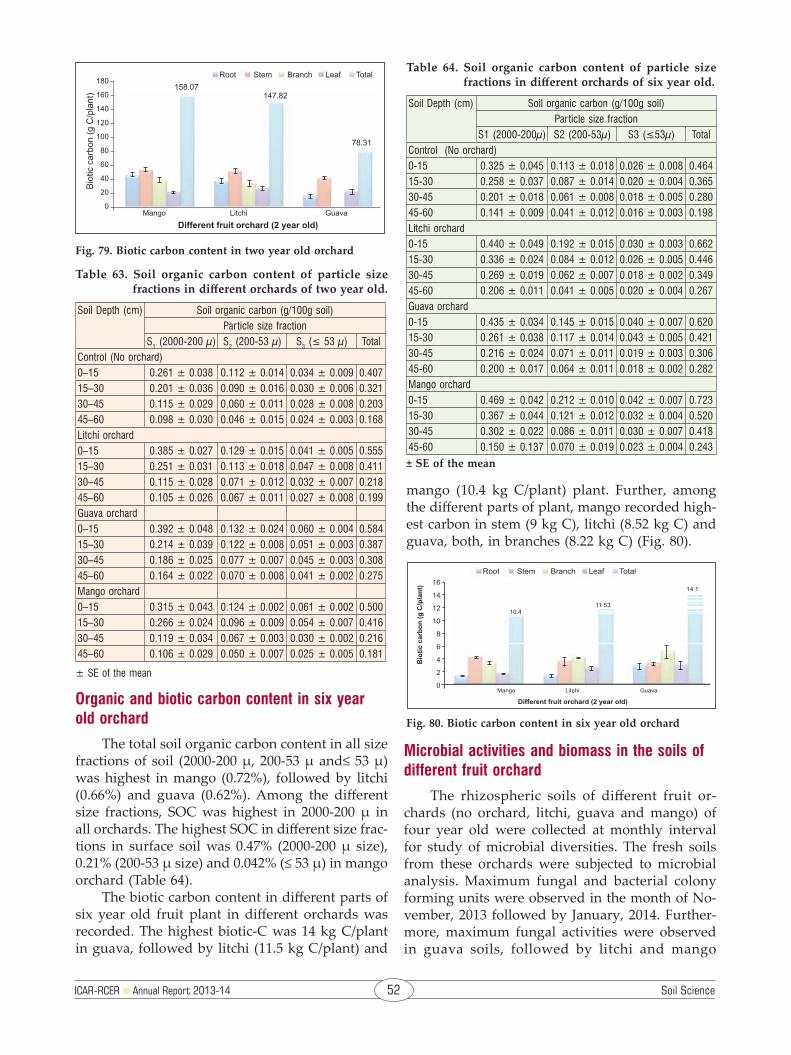
ICAR-RCER n Annual Report 2013-14 52 Soil Science
Organic and biotic carbon content in six year old orchard
The total soil organic carbon content in all size fractions of soil (2000-200 µ, 200-53 µ and≤ 53 µ) was highest in mango (0.72%), followed by litchi (0.66%) and guava (0.62%). Among the different size fractions, SOC was highest in 2000-200 µ in all orchards. The highest SOC in different size frac-tions in surface soil was 0.47% (2000-200 µ size), 0.21% (200-53 µ size) and 0.042% (≤ 53 µ) in mango orchard (Table 64).
The biotic carbon content in different parts of six year old fruit plant in different orchards was recorded. The highest biotic-C was 14 kg C/plant in guava, followed by litchi (11.5 kg C/plant) and
mango (10.4 kg C/plant) plant. Further, among the different parts of plant, mango recorded high-est carbon in stem (9 kg C), litchi (8.52 kg C) and guava, both, in branches (8.22 kg C) (Fig. 80).
Fig. 79. Biotic carbon content in two year old orchard
Fig. 80. Biotic carbon content in six year old orchard
Table 63. Soil organic carbon content of particle size fractions in different orchards of two year old.
Soil Depth (cm) Soil organic carbon (g/100g soil)Particle size fraction
S1 (2000-200 µ) S2 (200-53 µ) S3 (≤ 53 µ) TotalControl (No orchard)0–15 0.261 ± 0.038 0.112 ± 0.014 0.034 ± 0.009 0.40715–30 0.201 ± 0.036 0.090 ± 0.016 0.030 ± 0.006 0.32130–45 0.115 ± 0.029 0.060 ± 0.011 0.028 ± 0.008 0.20345–60 0.098 ± 0.030 0.046 ± 0.015 0.024 ± 0.003 0.168Litchi orchard0–15 0.385 ± 0.027 0.129 ± 0.015 0.041 ± 0.005 0.55515–30 0.251 ± 0.031 0.113 ± 0.018 0.047 ± 0.008 0.41130–45 0.115 ± 0.028 0.071 ± 0.012 0.032 ± 0.007 0.21845–60 0.105 ± 0.026 0.067 ± 0.011 0.027 ± 0.008 0.199Guava orchard0–15 0.392 ± 0.048 0.132 ± 0.024 0.060 ± 0.004 0.58415–30 0.214 ± 0.039 0.122 ± 0.008 0.051 ± 0.003 0.38730–45 0.186 ± 0.025 0.077 ± 0.007 0.045 ± 0.003 0.30845–60 0.164 ± 0.022 0.070 ± 0.008 0.041 ± 0.002 0.275Mango orchard0–15 0.315 ± 0.043 0.124 ± 0.002 0.061 ± 0.002 0.50015–30 0.266 ± 0.024 0.096 ± 0.009 0.054 ± 0.007 0.41630–45 0.119 ± 0.034 0.067 ± 0.003 0.030 ± 0.002 0.21645–60 0.106 ± 0.029 0.050 ± 0.007 0.025 ± 0.005 0.181
± SE of the mean
Table 64. Soil organic carbon content of particle size fractions in different orchards of six year old.
Soil Depth (cm) Soil organic carbon (g/100g soil)Particle size fraction
S1 (2000-200µ) S2 (200-53µ) S3 (≤53µ) Total Control (No orchard)0-15 0.325 ± 0.045 0.113 ± 0.018 0.026 ± 0.008 0.46415-30 0.258 ± 0.037 0.087 ± 0.014 0.020 ± 0.004 0.36530-45 0.201 ± 0.018 0.061 ± 0.008 0.018 ± 0.005 0.28045-60 0.141 ± 0.009 0.041 ± 0.012 0.016 ± 0.003 0.198Litchi orchard0-15 0.440 ± 0.049 0.192 ± 0.015 0.030 ± 0.003 0.66215-30 0.336 ± 0.024 0.084 ± 0.012 0.026 ± 0.005 0.44630-45 0.269 ± 0.019 0.062 ± 0.007 0.018 ± 0.002 0.34945-60 0.206 ± 0.011 0.041 ± 0.005 0.020 ± 0.004 0.267Guava orchard0-15 0.435 ± 0.034 0.145 ± 0.015 0.040 ± 0.007 0.62015-30 0.261 ± 0.038 0.117 ± 0.014 0.043 ± 0.005 0.42130-45 0.216 ± 0.024 0.071 ± 0.011 0.019 ± 0.003 0.30645-60 0.200 ± 0.017 0.064 ± 0.011 0.018 ± 0.002 0.282Mango orchard0-15 0.469 ± 0.042 0.212 ± 0.010 0.042 ± 0.007 0.72315-30 0.367 ± 0.044 0.121 ± 0.012 0.032 ± 0.004 0.52030-45 0.302 ± 0.022 0.086 ± 0.011 0.030 ± 0.007 0.41845-60 0.150 ± 0.137 0.070 ± 0.019 0.023 ± 0.004 0.243
± SE of the mean
Microbial activities and biomass in the soils of different fruit orchard
The rhizospheric soils of different fruit or-chards (no orchard, litchi, guava and mango) of four year old were collected at monthly interval for study of microbial diversities. The fresh soils from these orchards were subjected to microbial analysis. Maximum fungal and bacterial colony forming units were observed in the month of No-vember, 2013 followed by January, 2014. Further-more, maximum fungal activities were observed in guava soils, followed by litchi and mango

ICAR-RCER n Annual Report 2013-14 53 Soil Science
(Fig. 81). Similarly, the bacterial/actinomycetes ac-tivities were gradually increased from September 2013 and attained its peak in the month of Novem-ber 2013 and thereafter decreased abruptly in the month of December, 2013. It was observed that the bacterial/actinomycetes activities were highest in litchi orchard soil followed by mango and guava in November 2013. However, a sharp peak activity was observed in the month of January 2014 and recorded the highest in litchi orchard soil followed by mango and guava (Fig. 83).
to Th14. Mass multiplication technique of these potential isolates (Th7 and Th14) of Trichoderma was developed on grain and talc based (CaSO4 and CaCO3) formulations. Both the isolates of Trichoderma were applied in Fusarium wilt sick plot as a seed treatment of pea and furrow application with vermicompost (Fig. 126). The performance in disease controlling efficacy showed 100% protection against Fusarium wilt of pea (Fig. 84).
In development of consortia based formulation, three rhizospheric Pseudomonas species (A1, A2 and C3) were identified. The Pseudomonas species A2 and C3 were found to be compatible with Trichoder-ma isolates Th7 while A1 and C3 with Th14 isolate. They may be mixed together for development of consortia formulation which will have multifaceted mode of action when applied in the field.
Fig. 81. Fungal biomass in different orchard soils
Fig. 82. Bacterial/actinomycetes biomass in different orchard soils
Exploration of biocontrol agents for the management of soil borne phytopathogens in eastern plateau and hill region
Thirty eight isolates of Trichoderma were isolated, and characterized for their phosphate solubilization and antagonistic potential against some important soilborne phytopathogens, viz., Fusarium, Sclerotium and Rhizoctonia. Two isolates of Trichoderma (Th7 and Th14) were identified po-tential for antagonism, plant growth promotion, phosphate solubilization and cellulase activity. Both the isolates were also characterized for their heavy metal scavenging potential under in vitro conditions. The Th7 isolate of Trichoderma showed strong scavenging potential of heavy metal {espe-cially Cadmium (Cd) and Lead (Pb)} as compared
Fig. 83. Test of compatibility of Trichoderma Th 7 with strains of Pseudomonas (A1, A2 and C3, respectively) (a) front view, (b) back view; Th 14 with strains of Pseudomonas (A1, A2 and C3, respectively) (c) front view, d. back view.
Fig. 84. (a) Talc based Trichoderma formulation, (b) Trichoderma based formulation applied in the
field of garden pea

ICAR-RCER n Annual Report 2013-14 54 Water Quality and Productivity
Standardization of Planting Geometry and Growth Stage Based Fertigation Patterns for Commercial Cultivation of Vegetables Using Drip Irrigation System
An experiment was conducted to evaluate the efficacy of different growth stage based fertigation and crop geometry on yield potential of sweet corn and tomato in acidic soils of eastern hill and plateau region. The experiment comprised of three growth stage based fertigation level of F1, F2 and F3 and four crop geometry S1, S2, S3 and S4 of twelve treatment combinations. The experiment was laid out in split plot design of summer (sweet corn– cauliflower–tomato) and winter crops (tomato–broccoli–chilli).
Tomato and chillies seedlings were trans-planted as per the planting geometry as S1–plant to plant (PP) 75 cm; row to row (RR) 50 cm (Rect-angular with two rows per lateral system), S2–PP 30 cm; RR 40 cm; between plant & row (PR) 60 cm (Triangulated paired row system), S3–PP 50 cm; RR 40 cm; PR 60 cm (Triangulated paired row system) and S4-PP 70 cm; RR 40 cm: PR 70 cm (Triangulated paired row system).
In broccoli, planting geometry as S1-PP 50 cm; RR 50 cm (square with two rows per lateral system), S2-PP 30 cm; RR 40 cm; PR 60 cm (tri-angulated paired rows per lateral system), S3-PP 45 cm; RR 40 cm; PR 60 cm (triangulated paired row system) and S4- PP 60 cm; RR 40 cm: PR 70 cm (triangulated paired row system) in an area of 1800 sq. m. was followed.
The three fertigation level as per the crop dura-tion was applied on tomato, chilies and broccoli. The recommended dose of 120:60:60 kg NPK in tomato (Fig. 85 & 86), 50:60:60 kg NPK in chilli and 150:60:60 kg NPK in broccoli was applied.
Effect of different treatments on tomato
At 90 days after transplanting and using fertigation pattern (FP2) significant differences
Fig. 85. Fertigation schedule of tomato at different stages
Fig. 86. Tomato cultivation in different geometry and fertiga-tion pattern
were recorded in plant height. Planting geometry, however, did not show any significant differences in plant height. The analysis of data revealed that fruit yield/ plant were significantly affected by the fertigation pattern and crop geometry and fertiga-tion pattern FP2 resulted in highest fruits yield (874 g/plant) with S1 planting geometry. The planting geometry S4 showed highest tomato yield of 98.34 t/ha. (Fig. 87)
Estimation of water use efficiency (WUE) under different treatments in tomato indicated significant difference among the fertigation treat-ments. The highest WUE (37.6 kg/m3) was recorded in fertigation pattern FP3 as depicted in Fig. 88. The S4 planting geometry showed the highest water use efficiency of 41.3 kg/m3. The fertigation pattern FP3 with planting geometry S4 showed maximum water use efficiency of 41.3 kg/m3.
14. Water Quality and Productivity
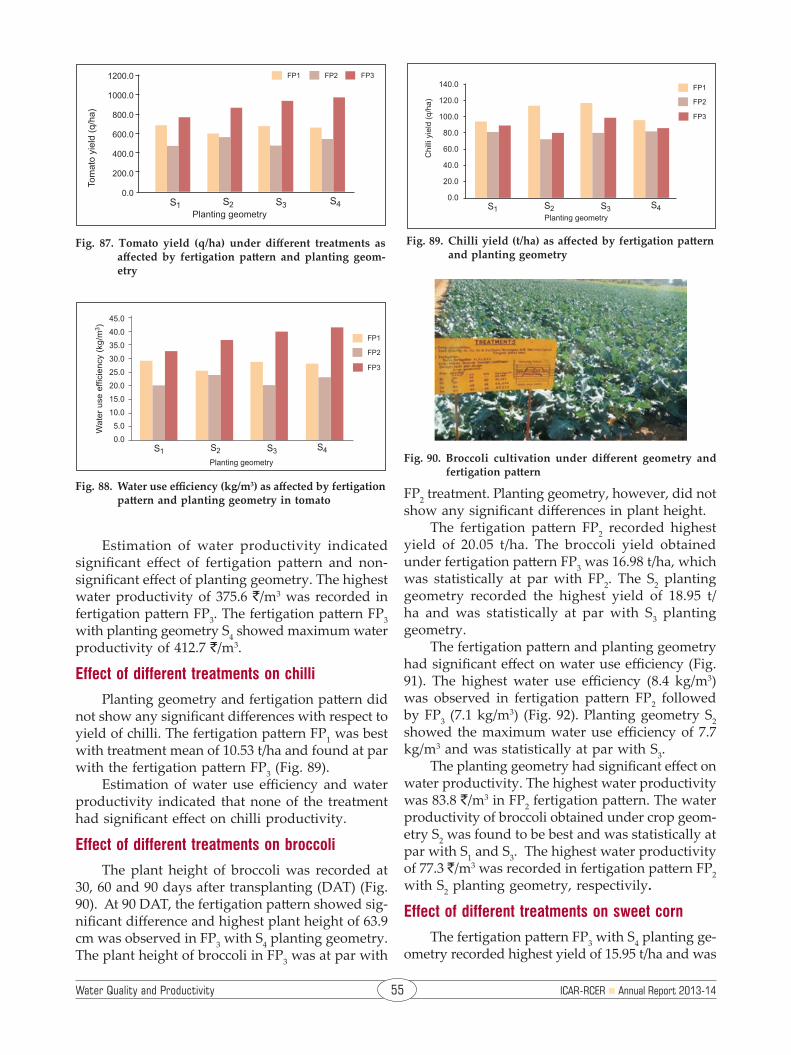
Water Quality and Productivity 55 ICAR-RCER n Annual Report 2013-14
Fig. 87. Tomato yield (q/ha) under different treatments as affected by fertigation pattern and planting geom-etry
Fig. 89. Chilli yield (t/ha) as affected by fertigation pattern and planting geometry
Fig. 88. Water use efficiency (kg/m3) as affected by fertigation pattern and planting geometry in tomato
Estimation of water productivity indicated significant effect of fertigation pattern and non-significant effect of planting geometry. The highest water productivity of 375.6 `/m3 was recorded in fertigation pattern FP3. The fertigation pattern FP3 with planting geometry S4 showed maximum water productivity of 412.7 `/m3.
Effect of different treatments on chilli
Planting geometry and fertigation pattern did not show any significant differences with respect to yield of chilli. The fertigation pattern FP1 was best with treatment mean of 10.53 t/ha and found at par with the fertigation pattern FP3 (Fig. 89).
Estimation of water use efficiency and water productivity indicated that none of the treatment had significant effect on chilli productivity.
Effect of different treatments on broccoli
The plant height of broccoli was recorded at 30, 60 and 90 days after transplanting (DAT) (Fig. 90). At 90 DAT, the fertigation pattern showed sig-nificant difference and highest plant height of 63.9 cm was observed in FP3 with S4 planting geometry. The plant height of broccoli in FP3 was at par with
Fig. 90. Broccoli cultivation under different geometry and fertigation pattern
FP2 treatment. Planting geometry, however, did not show any significant differences in plant height.
The fertigation pattern FP2 recorded highest yield of 20.05 t/ha. The broccoli yield obtained under fertigation pattern FP3 was 16.98 t/ha, which was statistically at par with FP2. The S2 planting geometry recorded the highest yield of 18.95 t/ha and was statistically at par with S3 planting geometry.
The fertigation pattern and planting geometry had significant effect on water use efficiency (Fig. 91). The highest water use efficiency (8.4 kg/m3) was observed in fertigation pattern FP2 followed by FP3 (7.1 kg/m3) (Fig. 92). Planting geometry S2 showed the maximum water use efficiency of 7.7 kg/m3 and was statistically at par with S3.
The planting geometry had significant effect on water productivity. The highest water productivity was 83.8 `/m3 in FP2 fertigation pattern. The water productivity of broccoli obtained under crop geom-etry S2 was found to be best and was statistically at par with S1 and S3. The highest water productivity of 77.3 `/m3 was recorded in fertigation pattern FP2 with S2 planting geometry, respectivily.
Effect of different treatments on sweet corn
The fertigation pattern FP3 with S4 planting ge-ometry recorded highest yield of 15.95 t/ha and was
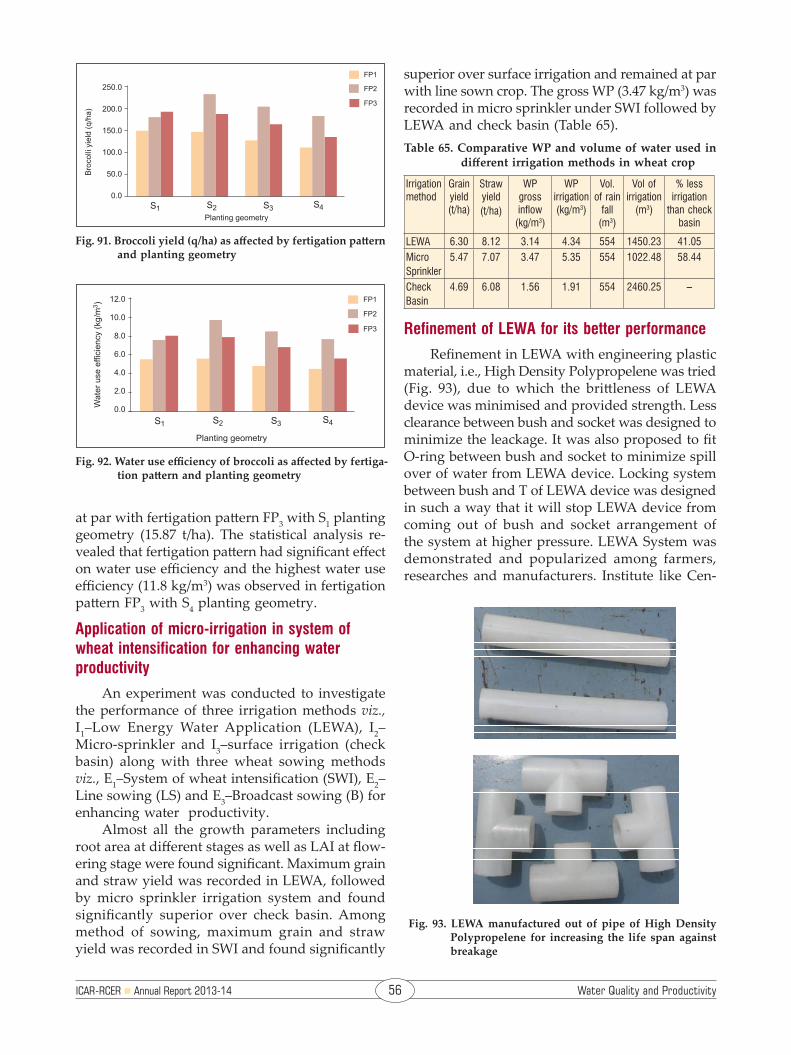
ICAR-RCER n Annual Report 2013-14 56 Water Quality and Productivity
Fig. 93. LEWA manufactured out of pipe of High Density Polypropelene for increasing the life span against breakage
Fig. 92. Water use efficiency of broccoli as affected by fertiga-tion pattern and planting geometry
at par with fertigation pattern FP3 with S1 planting geometry (15.87 t/ha). The statistical analysis re-vealed that fertigation pattern had significant effect on water use efficiency and the highest water use efficiency (11.8 kg/m3) was observed in fertigation pattern FP3 with S4 planting geometry.
Application of micro-irrigation in system of wheat intensification for enhancing water productivity
An experiment was conducted to investigate the performance of three irrigation methods viz., I1–Low Energy Water Application (LEWA), I2–Micro-sprinkler and I3–surface irrigation (check basin) along with three wheat sowing methods viz., E1–System of wheat intensification (SWI), E2–Line sowing (LS) and E3–Broadcast sowing (B) for enhancing water productivity.
Almost all the growth parameters including root area at different stages as well as LAI at flow-ering stage were found significant. Maximum grain and straw yield was recorded in LEWA, followed by micro sprinkler irrigation system and found significantly superior over check basin. Among method of sowing, maximum grain and straw yield was recorded in SWI and found significantly
superior over surface irrigation and remained at par with line sown crop. The gross WP (3.47 kg/m3) was recorded in micro sprinkler under SWI followed by LEWA and check basin (Table 65). Table 65. Comparative WP and volume of water used in
different irrigation methods in wheat crop
Irrigation method
Grain yield (t/ha)
Straw yield(t/ha)
WP gross inflow
(kg/m3)
WP irrigation (kg/m3)
Vol. of rain
fall (m3)
Vol of irrigation
(m3)
% less irrigation
than check basin
LEWA 6.30 8.12 3.14 4.34 554 1450.23 41.05MicroSprinkler
5.47 7.07 3.47 5.35 554 1022.48 58.44
CheckBasin
4.69 6.08 1.56 1.91 554 2460.25 –
Refinement of LEWA for its better performance
Refinement in LEWA with engineering plastic material, i.e., High Density Polypropelene was tried (Fig. 93), due to which the brittleness of LEWA device was minimised and provided strength. Less clearance between bush and socket was designed to minimize the leackage. It was also proposed to fit O-ring between bush and socket to minimize spill over of water from LEWA device. Locking system between bush and T of LEWA device was designed in such a way that it will stop LEWA device from coming out of bush and socket arrangement of the system at higher pressure. LEWA System was demonstrated and popularized among farmers, researches and manufacturers. Institute like Cen-
Fig. 91. Broccoli yield (q/ha) as affected by fertigation pattern and planting geometry
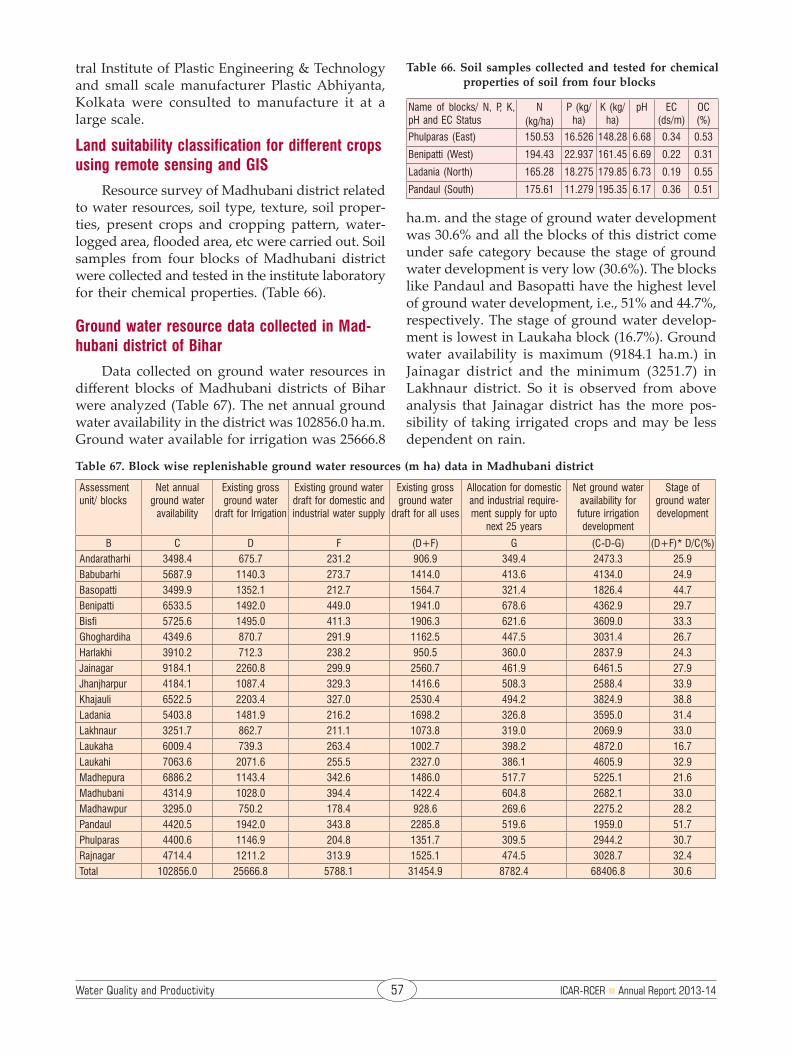
Water Quality and Productivity 57 ICAR-RCER n Annual Report 2013-14
tral Institute of Plastic Engineering & Technology and small scale manufacturer Plastic Abhiyanta, Kolkata were consulted to manufacture it at a large scale.
Land suitability classification for different crops using remote sensing and GIS
Resource survey of Madhubani district related to water resources, soil type, texture, soil proper-ties, present crops and cropping pattern, water-logged area, flooded area, etc were carried out. Soil samples from four blocks of Madhubani district were collected and tested in the institute laboratory for their chemical properties. (Table 66).
Ground water resource data collected in Mad-hubani district of Bihar
Data collected on ground water resources in different blocks of Madhubani districts of Bihar were analyzed (Table 67). The net annual ground water availability in the district was 102856.0 ha.m. Ground water available for irrigation was 25666.8
ha.m. and the stage of ground water development was 30.6% and all the blocks of this district come under safe category because the stage of ground water development is very low (30.6%). The blocks like Pandaul and Basopatti have the highest level of ground water development, i.e., 51% and 44.7%, respectively. The stage of ground water develop-ment is lowest in Laukaha block (16.7%). Ground water availability is maximum (9184.1 ha.m.) in Jainagar district and the minimum (3251.7) in Lakhnaur district. So it is observed from above analysis that Jainagar district has the more pos-sibility of taking irrigated crops and may be less dependent on rain.
Table 66. Soil samples collected and tested for chemical properties of soil from four blocks
Name of blocks/ N, P, K, pH and EC Status
N (kg/ha)
P (kg/ha)
K (kg/ha)
pH EC (ds/m)
OC (%)
Phulparas (East) 150.53 16.526 148.28 6.68 0.34 0.53
Benipatti (West) 194.43 22.937 161.45 6.69 0.22 0.31
Ladania (North) 165.28 18.275 179.85 6.73 0.19 0.55
Pandaul (South) 175.61 11.279 195.35 6.17 0.36 0.51
Table 67. Block wise replenishable ground water resources (m ha) data in Madhubani district
Assessment unit/ blocks
Net annual ground water
availability
Existing gross ground water
draft for Irrigation
Existing ground water draft for domestic and industrial water supply
Existing gross ground water
draft for all uses
Allocation for domestic and industrial require-ment supply for upto
next 25 years
Net ground water availability for
future irrigation development
Stage of ground water development
B C D F (D+F) G (C-D-G) (D+F)* D/C(%)Andaratharhi 3498.4 675.7 231.2 906.9 349.4 2473.3 25.9Babubarhi 5687.9 1140.3 273.7 1414.0 413.6 4134.0 24.9Basopatti 3499.9 1352.1 212.7 1564.7 321.4 1826.4 44.7Benipatti 6533.5 1492.0 449.0 1941.0 678.6 4362.9 29.7Bisfi 5725.6 1495.0 411.3 1906.3 621.6 3609.0 33.3Ghoghardiha 4349.6 870.7 291.9 1162.5 447.5 3031.4 26.7Harlakhi 3910.2 712.3 238.2 950.5 360.0 2837.9 24.3Jainagar 9184.1 2260.8 299.9 2560.7 461.9 6461.5 27.9Jhanjharpur 4184.1 1087.4 329.3 1416.6 508.3 2588.4 33.9Khajauli 6522.5 2203.4 327.0 2530.4 494.2 3824.9 38.8Ladania 5403.8 1481.9 216.2 1698.2 326.8 3595.0 31.4Lakhnaur 3251.7 862.7 211.1 1073.8 319.0 2069.9 33.0Laukaha 6009.4 739.3 263.4 1002.7 398.2 4872.0 16.7Laukahi 7063.6 2071.6 255.5 2327.0 386.1 4605.9 32.9Madhepura 6886.2 1143.4 342.6 1486.0 517.7 5225.1 21.6Madhubani 4314.9 1028.0 394.4 1422.4 604.8 2682.1 33.0Madhawpur 3295.0 750.2 178.4 928.6 269.6 2275.2 28.2Pandaul 4420.5 1942.0 343.8 2285.8 519.6 1959.0 51.7Phulparas 4400.6 1146.9 204.8 1351.7 309.5 2944.2 30.7Rajnagar 4714.4 1211.2 313.9 1525.1 474.5 3028.7 32.4Total 102856.0 25666.8 5788.1 31454.9 8782.4 68406.8 30.6

ICAR-RCER n Annual Report 2013-14 58 Conservation Technology
Resource Conservation and Methods of Planting in Acid Soil by Vegetable Based Cropping System
A field experiment was conducted to evaluate the production technology of resource conserva-tion and methods of planting vegetable cropping system of cauliflower-brinjal-tomato in acid soil of eastern hill and plateau region. (Fig. 94) with a plot size of 22.4 sq. m.
The experiment comprised of six treatments i.e., T1 (flat bed and no plastic mulch), T2 (flat bed with plastic mulch), T3 (broad bed with no plastic mulch), T4 (broad bed with plastic mulch), T5 (ridge and furrow with no plastic mulch) and T6 (ridge and furrow with plastic mulch) based on drip irri-gation. Seventy five per cent manures and fertilizer were applied as recommended basal dose in first crop and 50% each in subsequent 2nd and 3rd crops supplemented by fertigation. The minimum tillage was practiced in mulched treatment by uprooting of crop and planting seedlings of subsequent crop. The results revealed that plastic mulches and dif-ferent methods of planting have significant effect on weed biomass production and yield attributes of cauliflower (Fig. 95). The mulched treatments showed significantly less weed biomass produc-tion in comparison to non mulched treatments. The maximum weed biomass was 27.57 kg/plot in
ridge and furrow followed by broad bed without mulch and least was recorded in flat bed with mulch (11.57 kg/plot) (Fig. 96).
Plastic mulch with ridge and furrow showed maximum cauliflower yield of 35.79 t/ha. The flat bed with no plastic mulch showed lowest cauliflower yield of 14.45 t/ha. The yield recorded in plastic mulching with different systems of planting was higher than non-mulching. The ridge and furrow planting method was found to be su-perior to other methods of planting irrespective of mulched or non mulched which was followed by broad bed (Fig. 97). There was significant varia-tion in soil moisture content in mulched and non-mulched condition during the crop season, which resulted in yield variation in different treatments. (Fig. 98).
Fig. 94. View of experimental field
Fig. 95. Weed biomass (kg/ plot) in cauliflower
Fig. 96. View of cauliflower crop in the field
15. Conservation Agriculture
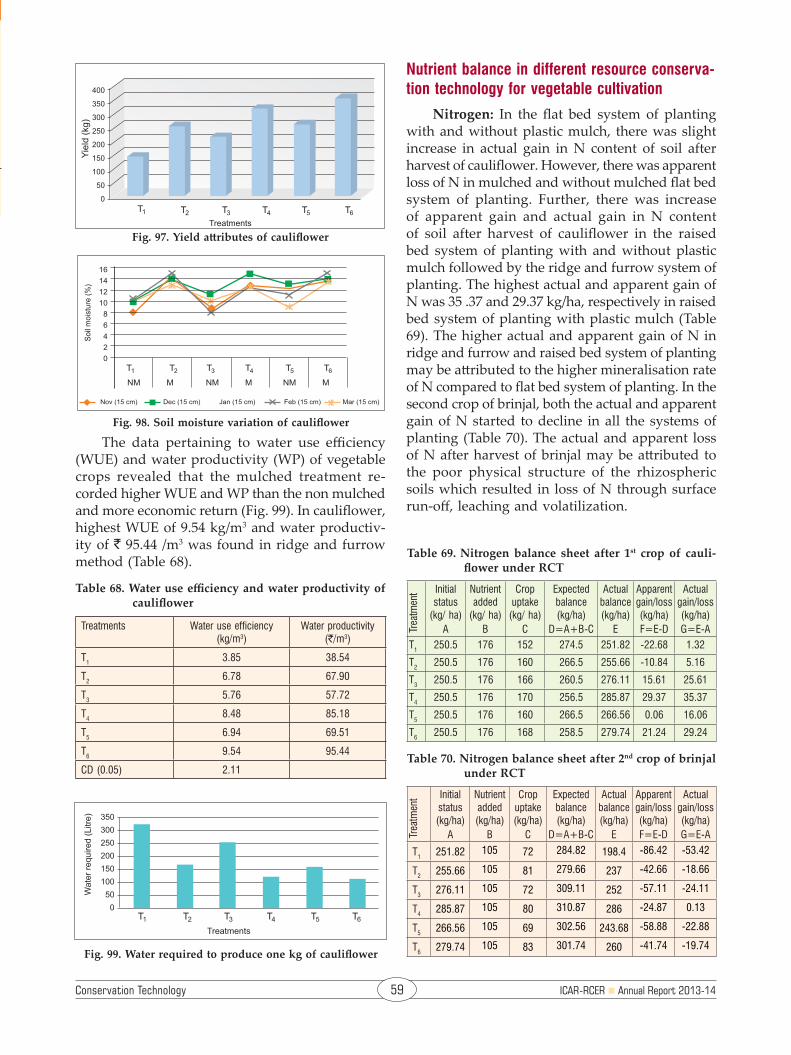
Conservation Technology 59 ICAR-RCER n Annual Report 2013-14
The data pertaining to water use efficiency (WUE) and water productivity (WP) of vegetable crops revealed that the mulched treatment re-corded higher WUE and WP than the non mulched and more economic return (Fig. 99). In cauliflower, highest WUE of 9.54 kg/m3 and water productiv-ity of ` 95.44 /m3 was found in ridge and furrow method (Table 68).
Table 68. Water use efficiency and water productivity of cauliflower
Treatments Water use efficiency (kg/m3)
Water productivity (`/m3)
T1 3.85 38.54
T2 6.78 67.90
T3 5.76 57.72
T4 8.48 85.18
T5 6.94 69.51
T6 9.54 95.44
CD (0.05) 2.11
Nutrient balance in different resource conserva-tion technology for vegetable cultivation
Nitrogen: In the flat bed system of planting with and without plastic mulch, there was slight increase in actual gain in N content of soil after harvest of cauliflower. However, there was apparent loss of N in mulched and without mulched flat bed system of planting. Further, there was increase of apparent gain and actual gain in N content of soil after harvest of cauliflower in the raised bed system of planting with and without plastic mulch followed by the ridge and furrow system of planting. The highest actual and apparent gain of N was 35 .37 and 29.37 kg/ha, respectively in raised bed system of planting with plastic mulch (Table 69). The higher actual and apparent gain of N in ridge and furrow and raised bed system of planting may be attributed to the higher mineralisation rate of N compared to flat bed system of planting. In the second crop of brinjal, both the actual and apparent gain of N started to decline in all the systems of planting (Table 70). The actual and apparent loss of N after harvest of brinjal may be attributed to the poor physical structure of the rhizospheric soils which resulted in loss of N through surface run-off, leaching and volatilization.
Fig. 98. Soil moisture variation of cauliflower
Fig. 99. Water required to produce one kg of cauliflower
Fig. 97. Yield attributes of cauliflower
Table 69. Nitrogen balance sheet after 1st crop of cauli-flower under RCT
Trea
tmen
t Initial status
(kg/ ha)A
Nutrient added
(kg/ ha)B
Crop uptake
(kg/ ha)C
Expected balance (kg/ha)
D=A+B-C
Actual balance (kg/ha)
E
Apparent gain/loss (kg/ha)F=E-D
Actual gain/loss (kg/ha)G=E-A
T1 250.5 176 152 274.5 251.82 -22.68 1.32
T2 250.5 176 160 266.5 255.66 -10.84 5.16
T3 250.5 176 166 260.5 276.11 15.61 25.61
T4 250.5 176 170 256.5 285.87 29.37 35.37
T5 250.5 176 160 266.5 266.56 0.06 16.06
T6 250.5 176 168 258.5 279.74 21.24 29.24
Table 70. Nitrogen balance sheet after 2nd crop of brinjal under RCT
Trea
tmen
t Initial status (kg/ha)
A
Nutrient added (kg/ha)
B
Crop uptake (kg/ha)
C
Expected balance (kg/ha)
D=A+B-C
Actual balance (kg/ha)
E
Apparent gain/loss (kg/ha)F=E-D
Actual gain/loss (kg/ha)G=E-A
T1 251.82 105 72 284.82 198.4 -86.42 -53.42
T2 255.66 105 81 279.66 237 -42.66 -18.66
T3 276.11 105 72 309.11 252 -57.11 -24.11
T4 285.87 105 80 310.87 286 -24.87 0.13
T5 266.56 105 69 302.56 243.68 -58.88 -22.88
T6 279.74 105 83 301.74 260 -41.74 -19.74

ICAR-RCER n Annual Report 2013-14 60 Conservation Technology
Phosphorus: The actual gain of P after harvest of cauliflower was recorded with use of plastic mulch in all the systems of planting (Table 71). However, there was actual loss of P in non-mulched planting systems after harvest of cauliflower. The actual gain of P in mulched plots may be attributed to the formation of uniform soil moisture zone in the rhizospheric soil which resulted in increased availability of P as compared to non-mulch system of planting. The highest actual gain of P was 10.31 kg/ha in raised bed system of planting with plastic mulch. There was an apparent loss of P in all the systems of planting irrespective of plastic mulch due to fixation of P by sesquioxide in acidic soil. Further, after the harvest of second crop of brinjal, there was actual as well as apparent loss of P in all the systems of planting (Table 72).
Potassium: The actual gain of K after harvest of cauliflower was recorded in the treatments hav-ing plastic mulch (Table 73). The highest actual gain was 20.67 kg/ha in raised bed with plastic mulch over the initial K status in soil. There was an appar-ent loss of K in all the systems of planting, except in raised bed and ridge and furrow with plastic mulch, due to leaching of K in the acidic sandy loam soils. After the harvest of cauliflower, there was actual as well as apparent loss of K in all the
systems of planting in brinjal due to compaction of the soils resulting from no tillage (Table 74).
Table 73. Potassium balance sheet after 1st crop of cauli-flower under RCT
Trea
tmen
t Initial status (kg/ha)
A
Nutrient added (kg/ha)
B
Crop uptake (kg/ha)
C
Expected balance (kg/ha)
D=A+B-C
Actual balance (kg/ha)
E
Apparent gain/loss (kg/ha)F=E-D
Actual gain/loss (kg/ha)G=E-A
T1280 82 70 292 278.72 -13.28 -1.28
T2280 82 72 290 285.00 -5.00 5.00
T3280 82 73 289 280.03 -8.97 0.03
T4280 82 77 285 300.67 15.67 20.67
T5280 82 70 292 273.92 -18.08 -6.08
T6280 82 74 288 289.01 1.01 9.01
Table 74. Potassium balance sheet after 2nd crop of brinjal under RCT
Trea
tmen
t Initial status (kg/ha)
A
Nutrient added (kg/ha)
B
Crop uptake (kg/ha)
C
Expected balance (kg/ha)
D=A+B-C
Actual balance (kg/ha)
E
Apparent gain/loss (kg/ha)F=E-D
Actual gain/loss (kg/ha)G=E-A
T1 278.72 84 70 292.72 255 -37.72 -23.72
T2 285.00 84 79 290.00 268 -22.00 -17.00
T3 280.00 84 67 297.00 265 -32.00 -15.00
T4 300.67 84 76 308.67 290 -18.67 -10.67
T5 273.92 84 69 288.92 255 -33.92 -18.92
T6 289.01 84 79 294.01 275 -19.01 -14.01
Post harvest studies of vegetable crops in different RCTs
The shrink pack exhibited less physiological loss in weight than unpack sample. The shrink pack resulted in higher appearance ratings and less curd and bud discoloration. However, shrink pack under heat should be avoided as it leads to damage of curd tissue resulting in a favourable environment for decay. Among field treatments, T2 (flat bed with minimum tillage and plastic mulch) exhibited minimum physiological loss in weight as well as minimum dry matter content (Fig. 100 & 101).
Fig. 100. Physiological loss of weight in cauliflower with influence of packing
Table 71. Phosphorus balance sheet after 1st crop of cau-liflower under RCT
Trea
tmen
t Initial status (kg/ha)
A
Nutrient added (kg/ha)
B
Crop uptake (kg/ha)
C
Expected balance (kg/ha)
D=A+B-C
Actual balance (kg/ha)
E
Apparent gain/loss (kg/ha)F=E-D
Actual gain/loss (kg/ha)G=E-A
T155.5 76 16 115.5 49.53 -65.97 -5.97
T255.5 76 20 111.5 62.61 -48.89 7.11
T355.5 76 14 117.5 53.31 -64.19 -2.19
T455.5 76 15 116.5 65.81 -50.69 10.31
T555.5 76 15 116.5 51.21 -65.29 -4.29
T655.5 76 14 117.5 59.14 -58.36 3.64
Table 72. Phosphorus balance sheet after 2nd crop of brin-jal under RCT
Trea
tmen
t Initial status (kg/ha)
A
Nutrient added (kg/ha)
B
Crop uptake (kg/ha)
C
Expected balance (kg/ha)
D=A+B-C
Actual balance (kg/ha)
E
Apparent gain/loss (kg/ha)F=E-D
Actual gain/loss (kg/ha)G=E-A
T1 49.53 60 15 94.53 45.5 -49.03 -4.03
T2 62.61 60 18 104.61 58.33 -46.28 -4.28
T3 53.31 60 16 97.31 47.32 -49.99 -5.99
T4 65.81 60 19 106.81 60.34 -46.47 -5.47
T5 51.21 60 17 94.21 45.27 -48.94 -5.94
T6 59.14 60 19 100.14 55.24 -44.9 -3.90

Conservation Technology 61 ICAR-RCER n Annual Report 2013-14
In case of brinjal also, shrink pack exhibited less physiological loss in weight than unpack sam-ple. The shrink pack resulted in higher appearance ratings & discoloration. Among field treatments, T6 (Ridge and furrow with minimum tillage and plastic mulch) exhibited minimum physiological loss in weight while minimum dry matter content was found in flat bed with minimum tillage and plastic mulch (Fig. 102 & 103).
for weed management in DSR, where tank mix-tures of herbicides play a vital role in controlling complex weed flora. Keeping above facts in view, the experiment has been repeated to evaluate the efficiency of tank mixture of POE herbicides to control the weed population under DSR and to study the shifting and control of weed flora. The major weed population observed under (ZT)DSR were mainly, i.e., mixed population of narrow leaved, broad leaved and sedges. Echinochloa sp., Cynodon sp., Leptochloa sp., under narrow leaves weed, Physalis sp., Ageratum sp., Cleome sp. under broad leaved weed, and Cyperus sp. under sedge group were found more dominant.
Application of tank mixture of Bispyribac + Ethoxysulfuron (T5), controlled the weeds most efficiently over other combinations except weed free treatments (T9) and was followed by the tank mixture of Bispyribac + Azimsulfuron (T5). Higher yield of rice (5.1 t/ha and 4.7 t/ha) was recorded under these treatments, respectively which were found at par with weed free yield (5.2 t/ha). Weed index was found minimum (Fig. 104) while, weed control efficiency was found higher to the tune of 82.7% with spray of tank mixture of Bispyribac + Ethoxysulfuron (Fig. 105) than other weedicide combinations applied (Table 75).
Fig. 102. Physiological loss in weight of brinjal with influ-ence of packing
Fig. 103. Drymatter content of brinjal
Fig. 104. Weed index at 60 DAS as affected by different tank mixture of herbicides
Fig. 105. Weed Control efficiency at maturity as affected by different tank mixture of herbicides
Fig. 101. Physiological loss of weight in cauliflower with influence of packing
Effect of tank mixture application of post emergence herbicides on complex weed flora under direct seeded rice (DSR)
DSR is getting popular in rice grown areas to save time, energy, water and labour but severe weeds is observed to be the major problem. In-tegrated weed management is an important tool

ICAR-RCER n Annual Report 2013-14 62 Conservation Technology
Table 75. Effect of different weed management practices on weed density, weed dry weight, weed index and weed control efficiency in direct seeded rice
Treatment Weed density/ m2 Weed dry wt. (g) Weed index(%)
W.C.E. (%)
15 DAS
40 DAS
Flow-ering
15 DAS
40 DAS
Flow-ering
at matu-rity
at flower-ing
T1 19.1 21.5 26.0 6.02 47.8 77.3 23.1 61.1
T2 24.2 25.0 30.2 7.15 61.4 89.5 25.0 54.9
T3 19.3 21.7 25.8 5.34 50.2 73.5 17.3 61.4
T4 22.3 27.3 34.0 7.00 78.2 100.2 23.1 49.2
T5 14.9 13.5 11.6 5.83 30.2 49.6 3.8 82.7
T6 16.3 15.0 15.4 6.02 38.3 57.0 7.7 77.0
T7 23.0 26.1 34.8 6.77 61.2 80.6 28.8 48.0
T8 18.5 21.0 20.6 6.40 44.8 66.8 15.4 69.2
T9 18.2 12.5 10.0 5.63 17.5 34.6 - 85.1
T10 34.2 47.6 66.9 8.12 138.4 233.0 42.3 -
S.E.M.± 4.87 3.82 3.63 2.42 5.7 4.4 1.9 1.8
C.D. (P=0.05)
14.5 11.3 10.8 7.19 16.9 13.1 5.6 5.3
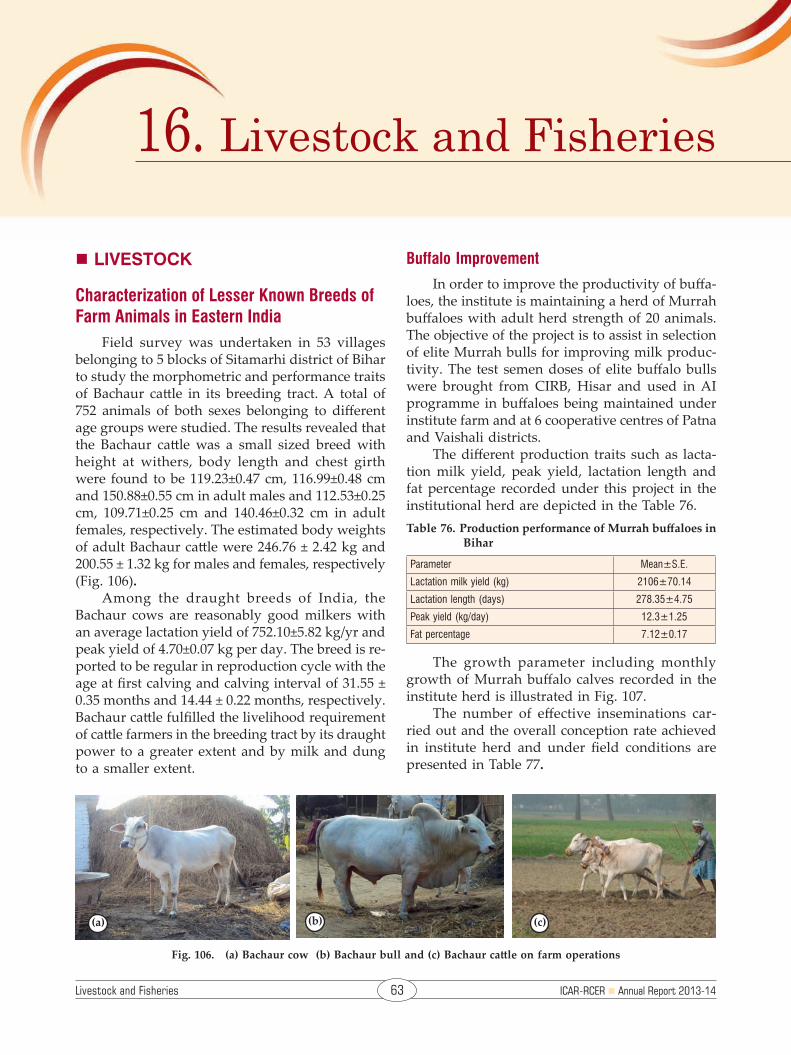
Livestock and Fisheries 63 ICAR-RCER n Annual Report 2013-14
n Livestock
Characterization of Lesser Known Breeds of Farm Animals in Eastern India
Field survey was undertaken in 53 villages belonging to 5 blocks of Sitamarhi district of Bihar to study the morphometric and performance traits of Bachaur cattle in its breeding tract. A total of 752 animals of both sexes belonging to different age groups were studied. The results revealed that the Bachaur cattle was a small sized breed with height at withers, body length and chest girth were found to be 119.23±0.47 cm, 116.99±0.48 cm and 150.88±0.55 cm in adult males and 112.53±0.25 cm, 109.71±0.25 cm and 140.46±0.32 cm in adult females, respectively. The estimated body weights of adult Bachaur cattle were 246.76 ± 2.42 kg and 200.55 ± 1.32 kg for males and females, respectively (Fig. 106).
Among the draught breeds of India, the Bachaur cows are reasonably good milkers with an average lactation yield of 752.10±5.82 kg/yr and peak yield of 4.70±0.07 kg per day. The breed is re-ported to be regular in reproduction cycle with the age at first calving and calving interval of 31.55 ± 0.35 months and 14.44 ± 0.22 months, respectively. Bachaur cattle fulfilled the livelihood requirement of cattle farmers in the breeding tract by its draught power to a greater extent and by milk and dung to a smaller extent.
Buffalo Improvement
In order to improve the productivity of buffa-loes, the institute is maintaining a herd of Murrah buffaloes with adult herd strength of 20 animals. The objective of the project is to assist in selection of elite Murrah bulls for improving milk produc-tivity. The test semen doses of elite buffalo bulls were brought from CIRB, Hisar and used in AI programme in buffaloes being maintained under institute farm and at 6 cooperative centres of Patna and Vaishali districts.
The different production traits such as lacta-tion milk yield, peak yield, lactation length and fat percentage recorded under this project in the institutional herd are depicted in the Table 76.Table 76. Production performance of Murrah buffaloes in
Bihar
Parameter Mean±S.E.
Lactation milk yield (kg) 2106±70.14
Lactation length (days) 278.35±4.75
Peak yield (kg/day) 12.3±1.25
Fat percentage 7.12±0.17
The growth parameter including monthly growth of Murrah buffalo calves recorded in the institute herd is illustrated in Fig. 107.
The number of effective inseminations car-ried out and the overall conception rate achieved in institute herd and under field conditions are presented in Table 77.
Fig. 106. (a) Bachaur cow (b) Bachaur bull and (c) Bachaur cattle on farm operations
(a) (b) (c)
16. Livestock and Fisheries
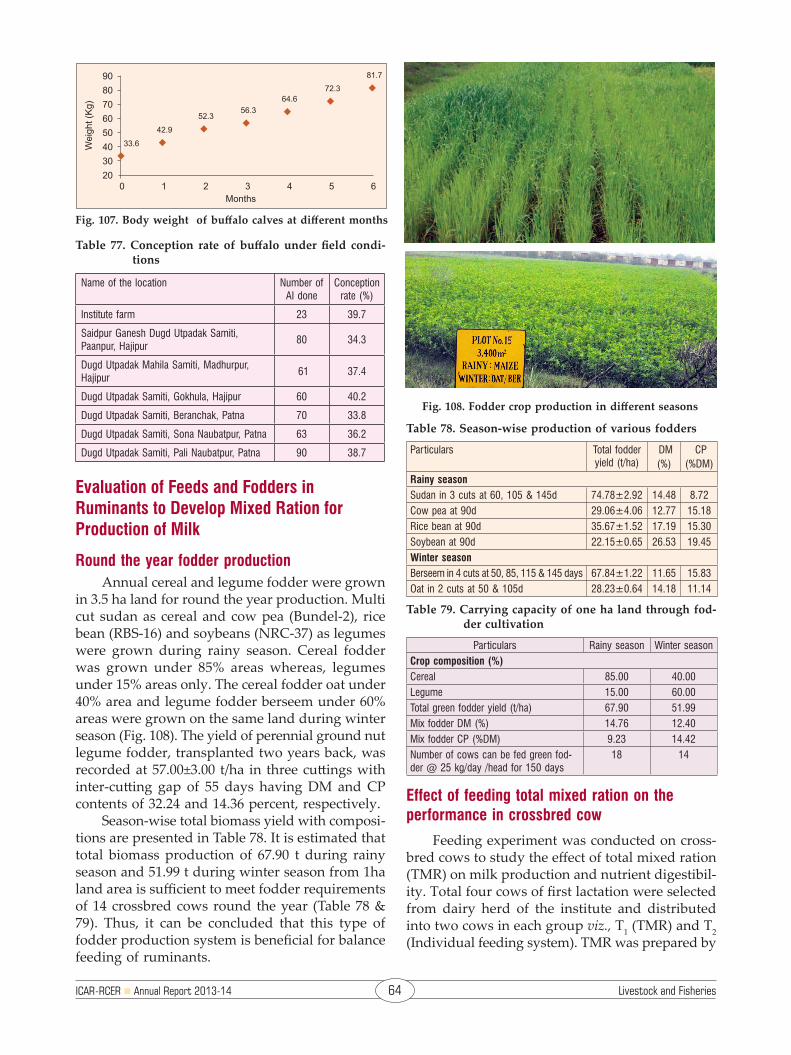
ICAR-RCER n Annual Report 2013-14 64 Livestock and Fisheries
Table 77. Conception rate of buffalo under field condi-tions
Name of the location Number of AI done
Conception rate (%)
Institute farm 23 39.7
Saidpur Ganesh Dugd Utpadak Samiti, Paanpur, Hajipur
80 34.3
Dugd Utpadak Mahila Samiti, Madhurpur, Hajipur
61 37.4
Dugd Utpadak Samiti, Gokhula, Hajipur 60 40.2
Dugd Utpadak Samiti, Beranchak, Patna 70 33.8
Dugd Utpadak Samiti, Sona Naubatpur, Patna 63 36.2
Dugd Utpadak Samiti, Pali Naubatpur, Patna 90 38.7
Evaluation of Feeds and Fodders in Ruminants to Develop Mixed Ration for Production of Milk
Round the year fodder productionAnnual cereal and legume fodder were grown
in 3.5 ha land for round the year production. Multi cut sudan as cereal and cow pea (Bundel-2), rice bean (RBS-16) and soybeans (NRC-37) as legumes were grown during rainy season. Cereal fodder was grown under 85% areas whereas, legumes under 15% areas only. The cereal fodder oat under 40% area and legume fodder berseem under 60% areas were grown on the same land during winter season (Fig. 108). The yield of perennial ground nut legume fodder, transplanted two years back, was recorded at 57.00±3.00 t/ha in three cuttings with inter-cutting gap of 55 days having DM and CP contents of 32.24 and 14.36 percent, respectively.
Season-wise total biomass yield with composi-tions are presented in Table 78. It is estimated that total biomass production of 67.90 t during rainy season and 51.99 t during winter season from 1ha land area is sufficient to meet fodder requirements of 14 crossbred cows round the year (Table 78 & 79). Thus, it can be concluded that this type of fodder production system is beneficial for balance feeding of ruminants.
Table 78. Season-wise production of various fodders
Particulars Total fodder yield (t/ha)
DM(%)
CP (%DM)
Rainy seasonSudan in 3 cuts at 60, 105 & 145d 74.78±2.92 14.48 8.72Cow pea at 90d 29.06±4.06 12.77 15.18Rice bean at 90d 35.67±1.52 17.19 15.30Soybean at 90d 22.15±0.65 26.53 19.45Winter seasonBerseem in 4 cuts at 50, 85, 115 & 145 days 67.84±1.22 11.65 15.83Oat in 2 cuts at 50 & 105d 28.23±0.64 14.18 11.14
Table 79. Carrying capacity of one ha land through fod-der cultivation
Particulars Rainy season Winter seasonCrop composition (%)Cereal 85.00 40.00Legume 15.00 60.00Total green fodder yield (t/ha) 67.90 51.99Mix fodder DM (%) 14.76 12.40Mix fodder CP (%DM) 9.23 14.42Number of cows can be fed green fod-der @ 25 kg/day /head for 150 days
18 14
Effect of feeding total mixed ration on the performance in crossbred cow
Feeding experiment was conducted on cross-bred cows to study the effect of total mixed ration (TMR) on milk production and nutrient digestibil-ity. Total four cows of first lactation were selected from dairy herd of the institute and distributed into two cows in each group viz., T1 (TMR) and T2 (Individual feeding system). TMR was prepared by
Fig. 107. Body weight of buffalo calves at different months
Fig. 108. Fodder crop production in different seasons

Livestock and Fisheries 65 ICAR-RCER n Annual Report 2013-14
mixing wheat straw (2 kg), multi cut sudan (25 kg), rice bean (2 kg) and concentrate feed (5 kg with 17 per cent CP). The total quantities of feed were divided into two parts and each part after mixing with water given to the cows (T1) in the morning and in the evening hours (Fig. 109). In the T2 group, same quantities of above feed ingredients were fed separately to the cows also in the morning and eve-ning hours. Initially wheat straw and concentrate feed was offered after mixing with water and after a gap of 1-2 hours un-chopped green forages was offered. Total 10.68 kg dry matter (DM) per day per animal was provided to both the groups. Daily milk production was recorded before and during experiment period. A digestion trial at end of the experiment was conducted to study the nutrient digestibility.
Production Performance and Management Study of Rabbit in Bihar
Nutritive value of legume fodder for rabbit feeding
Digestion experiment was conducted in New Zealand White (NZW) rabbits to assess the nutritive value of legume fodders. Adult male NZW rabbits (n=18; average body weight of 2067±111g) were divided into three groups and kept in nine cages in pairs. All rabbits were provided concentrate pelleted ration having 18% dietary crude protein in ad-libitum during morning hours. Three fresh legume fodders viz., perennial groundnut (T1), rice bean (T2) and soybean (T3) were provided daily to the rabbits during evening hours in ad-libitum. After preliminary feeding of 21 days, a digestion trial was conducted for the period of 5 days. Daily feed intake and faeces voided were recorded. Samples were analyzed for dry matter (DM) and crude protein (CP). digestible crude protein (DCP) and digestible energy (DE) values were calculated and presented in the Table 81.Table 81. Intake and nutritive value of legume fodder
in rabbit
Particulars Treatment
T1 T2 T3
DMI (g/d/h)
Fodder 96.95b±3.84 52.10a±2.18 65.52a±1.93
Concentrate feed 31.10b±1.54 17.91a±1.39 15.46a±2.07
Total 128.05b±5.37 70.01a±2.44 80.98a±1.91
% Fodder intake 75.73±0.22 74.42±1.77 80.95±2.31
Digestibility and nutritive value
DMD (%) 61.49±0.93 58.57±1.39 59.56±0.86
CPD (%) 62.29b±0.56 56.06a±1.52 62.44b±0.67
DCP (%) 9.49a±0.09 8.80a±0.21 12.89b±0.40
DE (Kcal/kg DMI) 2227±16.01 2224±23.29 2235±30.14
Values with different superscripts in a row differ significantly (P<0.01). Data are expressed in Mean±SE
Significantly maximum DMI (fodder, con-centrate feed and total) in rabbits was recorded in group T1, but fodder intake percentage out of total DMI was not affected. Similarly, there were no significant differences for DM digestibility and DE value of the ration provided to rabbit, However, higher CP digestibility (P<0.01) and DCP values (P<0.01) were recorded in rabbits fed on soybean fodder (T3). Thus, it is concluded that feeding of legume fodder to adult rabbits can save 75-80% concentrate feed requirement in rabbit.
Fig. 109. Preparation of TMR and feeding to cows
At the end of study, T1 and T2 group showed 19.49% and 6.41% increase in milk production, respectively. This increase might be due to feed-ing of balanced ration either in mixed form or fed separately.
However, feeding of TMR increased 2.48% DMI (Dry matter intake), 12.43% digestibility of DM and 42.26% of CP (Table 80) in T1 group. This might have resulted in 580 g increase in milk pro-duction per day per cow than individual feeding system. Thus, it can be concluded that feeding of TMR is beneficial for nutrient digestibility and milk production in cow. Table 80. Performance of cow fed on TMR
Particulars T1 T2
Age from date of calving (d) 246±19.50 222±2.50
Av. body wt. (kg) 354±42 360±32
Av. DMI (kg/100 kg body wt.) 4.14±0.49 4.04±0.41
Milk production (kg/d/head)
Before experiment 5.13±0.06 6.55±0.44
During experiment 6.13±0.24 6.97±0.09
Nutrient digestibility
DMD (%) 67.54±0.41 60.07±0.02
CPD (%) 44.70±0.91 31.42±2.72
DCP (%) 5.30±0.11 3.73±0.32
DE (Kcal.kg DMI) 2542±2.00 2287±14.50

ICAR-RCER n Annual Report 2013-14 66 Livestock and Fisheries
Fig. 110. Use of reaper for collection and preparation of wheat bhusa
Field Bailing of Crop Residues It was observed that 6 t of wheat straw can
be harvested from 1 ha of land if collected manu-ally. Use of reaper recovered only 50% of straw by taking 3 hours per ha of land (Fig. 110). Cost of collection of wheat bhusa was ` 125 by reaper and ` 365 by manual operation resulting a saving of 65% of the cost. Chemical analysis of both the bhusa collected by reaper and manual operation revealed that the bhusa contained 18% more pro-tein and 25% less acid insoluble ash.
Effect of phytase supplementation on growth performance and nutrient balance in broiler chicken
Feeding experiment was conducted on broiler chicken to study the effect of phytase enzyme supplementation on growth performance and nutrient balance. Broiler chickens (4 days old; 70 Nos.; Vencob strain) were distributed into two groups. The pelleted concentrate ration, contain-ing dietary crude protein 19 and rice polish 12 per cent, was provided to group one (T1) and same ration was provided to group two (T2) after fortification with phytase enzyme @ 20 g/100 kg feed. Metabolism trial was conducted at the end of feeding experiment for the period of four days to study the nutrients balances. The results revealed that average daily gain (ADG) was increased by 2.25% with improvement in feed conversion ratio (FCR) value by 5.62% over control group due to phytase supplementation (Table 82). Similarly, DM and CP retention was also increased margin-ally by 2.04 and 2.17 per cent, respectively. Thus, it is concluded that phytase supplementation may be beneficial for better growth performance and nutrient balance in broiler chicken fed higher rice polish based ration. Table 82. Growth performance and nutrient balance in
broiler chicken
Particulars T1 T2
Growth performanceInitial wt. (g) 55.2±0.20 56.6±0.40Final wt. (g) 1189±7.03 1216±10.37ADG (g/d) 40.48±0.24 41.39±0.40Av. feed intake (g/d) 76.30 73.59FCR 1.88 1.78Nutrient balance (g/100 g DM)DM 77.87±1.52 79.46±1.35CP 74.17±1.27 75.78±1.06
Exploring Growth Hormone Gene for Improve-ment of Growth Performance Traits in Black Bengal Goat
A 272 bp fragment (partial intron 2, exon 3 and partial intron 3) of growth hormone gene was amplified (50 samples) by polymerase chain reac-tion. Primer was designed on the basis of sequence available publicly at NCBI. PCR programme fol-lowed for amplification of gene fragment was initial denaturation for 95oC for 2 min followed by 30 cycles of denaturation at 95oC for 30 Sec, annealing at 59oC for 45 Sec, extension at 72oC for 45 sec and then final extension of 72oC at 5 min (Fig. 112). Fig. 111. Feeding practices of livestock in Bihar
Soil–plant–animal continum in Bihar
Feeds & fodder, soil, blood and water samples were collected from 8 districts of Bihar from four agro-climatic zones (Fig. 111). It was observed that 100% soil samples contained excess iron, man-ganese and copper, however, 72% samples were deficient in Zn to the tune of 70% than the critical level. Similarly, rice and wheat straw contained excess of copper, iron and manganese but were deficient in zinc to the tune of 72%. All the samples of green fodder contained excess iron, copper and manganese except the green fodder collected from Darbhanga and Madhubani districts, which con-tained excess manganese. Green fodder collected from Jamui, Buxar and Madhubani were deficient in zinc. All grains and crop by-products used for animal feeding were deficient in manganese and zinc but contained excess iron and copper. Like-wise, serum of cattle and buffalo contained excess iron and copper, however, deficient in manganese and zinc as compared to the critical values.
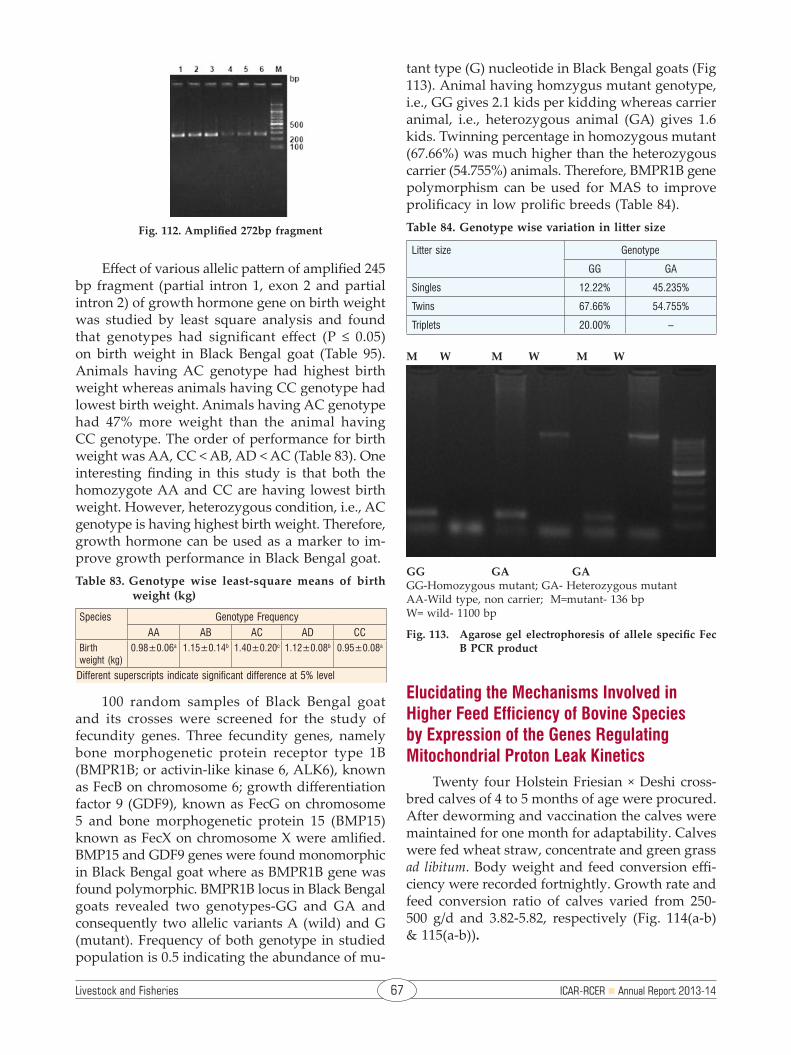
Livestock and Fisheries 67 ICAR-RCER n Annual Report 2013-14
Effect of various allelic pattern of amplified 245 bp fragment (partial intron 1, exon 2 and partial intron 2) of growth hormone gene on birth weight was studied by least square analysis and found that genotypes had significant effect (P ≤ 0.05) on birth weight in Black Bengal goat (Table 95). Animals having AC genotype had highest birth weight whereas animals having CC genotype had lowest birth weight. Animals having AC genotype had 47% more weight than the animal having CC genotype. The order of performance for birth weight was AA, CC < AB, AD < AC (Table 83). One interesting finding in this study is that both the homozygote AA and CC are having lowest birth weight. However, heterozygous condition, i.e., AC genotype is having highest birth weight. Therefore, growth hormone can be used as a marker to im-prove growth performance in Black Bengal goat.Table 83. Genotype wise least-square means of birth
weight (kg)
Species Genotype FrequencyAA AB AC AD CC
Birth weight (kg)
0.98±0.06a 1.15±0.14b 1.40±0.20c 1.12±0.08b 0.95±0.08a
Different superscripts indicate significant difference at 5% level
100 random samples of Black Bengal goat and its crosses were screened for the study of fecundity genes. Three fecundity genes, namely bone morphogenetic protein receptor type 1B (BMPR1B; or activin-like kinase 6, ALK6), known as FecB on chromosome 6; growth differentiation factor 9 (GDF9), known as FecG on chromosome 5 and bone morphogenetic protein 15 (BMP15) known as FecX on chromosome X were amlified. BMP15 and GDF9 genes were found monomorphic in Black Bengal goat where as BMPR1B gene was found polymorphic. BMPR1B locus in Black Bengal goats revealed two genotypes-GG and GA and consequently two allelic variants A (wild) and G (mutant). Frequency of both genotype in studied population is 0.5 indicating the abundance of mu-
tant type (G) nucleotide in Black Bengal goats (Fig 113). Animal having homzygus mutant genotype, i.e., GG gives 2.1 kids per kidding whereas carrier animal, i.e., heterozygous animal (GA) gives 1.6 kids. Twinning percentage in homozygous mutant (67.66%) was much higher than the heterozygous carrier (54.755%) animals. Therefore, BMPR1B gene polymorphism can be used for MAS to improve prolificacy in low prolific breeds (Table 84).Table 84. Genotype wise variation in litter size
Litter size Genotype
GG GA
Singles 12.22% 45.235%
Twins 67.66% 54.755%
Triplets 20.00% –
M W M W M W
GG GA GAGG-Homozygous mutant; GA- Heterozygous mutantAA-Wild type, non carrier; M=mutant- 136 bp W= wild- 1100 bp
Fig. 113. Agarose gel electrophoresis of allele specific Fec B PCR product
Fig. 112. Amplified 272bp fragment
Elucidating the Mechanisms Involved in Higher Feed Efficiency of Bovine Species by Expression of the Genes Regulating Mitochondrial Proton Leak Kinetics
Twenty four Holstein Friesian × Deshi cross-bred calves of 4 to 5 months of age were procured. After deworming and vaccination the calves were maintained for one month for adaptability. Calves were fed wheat straw, concentrate and green grass ad libitum. Body weight and feed conversion effi-ciency were recorded fortnightly. Growth rate and feed conversion ratio of calves varied from 250-500 g/d and 3.82-5.82, respectively (Fig. 114(a-b) & 115(a-b)).

ICAR-RCER n Annual Report 2013-14 68 Livestock and Fisheries
Fig. 114a. Body weight of calves
Fig. 115a. Feed conversion ratio of calves
Fig. 114b. Average body weight of calves at different time interval
Fig. 115b. Variations in feed conversion rations of calves at different time interval
Chronic Exposure Effect of Carbofuran and Chlorpyrifos in Ducks and Role of Vitamin C and E in its Amelioration
Effect of Chlorpyrifos on ducks was investi-gated by giving individual oral dose of chlorpyrifos at 2.24 mg/kg (1/5th of LD50) for a period of 6 weeks. Ducks were also given pretreatment with vitamin C and E for one week. Results indicated that vitamin C and E at the provided dose (@ 400 mg/kg body weight and 250 mg/kg body weight., respectively had ameliorative effect on reducing the oxidative stress parameters (Catalase, SOD, GPx), lowering the mean erythrocyte osmatic fragility rate, increas-ing body weight gain and maintaining normal bio-chemical parameters in chlorpyrifos exposed ducks. Thus, it is concluded that Vitamin C and vitamin E had ameliorative effect on oxidative stress induced by chronic exposure of chlorpyrifos in ducks.
Evaluation of nutraceuticals as supportive therapy for subclinical mastitis in peri-urban cattle
Milk sample collected from institute farm, peri-urban areas of Patna, Motihari, Sitamarhi, Saharsa and Vaishali were screened for subclinical mastitis by CMT. Results were arbitrarily graded from 0 to +3 depending upon the type of clumps and coagulation of milk. Subclinical mastitis was considered when CMT score were <2. pH of milk
samples was estimated using pH meter ranged from 6.09-6.96. Somatic cell count of individual milk samples counted. Samples were also cultured for bacterial identification. SCC was estimated after spreading 10 µl milk in 1 cm2 area. On glass slide and stained with modified Newman’s stain and counted under microscope. SCC in milk samples with no CMT result ranged from 1.92-3.64 × 10⁵/ml. Milk samples with CMT positive upto + 2 had SCC ranging from 9.50 to 12.56 × 10⁵ cells /ml. The positive samples of milk were subjected to bacte-rial isolation in blood agar (Himedia) followed by selective media. Bacterial isolate identified was Staphylococcus (62.50%), Streptococcus (12.5%) and mixed infection (12.05%). Positive samples of milk were subjected to Mastitest ABST test kit (Himedia) for antibiotic sensitivity (Fig. 116 a-b). Results of ABST indicated gentamicin as most sensitive, fol-lowed by enrofloxacin, ciprofloxacin, Ampicillin/cloxacillin, tetracycline. However, chlorphenicol, strepto-penicillin was found to be non-sensitive.
Fig. 116 (a) California Mastitis Test
b) Somatic cell count for detec-tion of sub-clinical mastitis
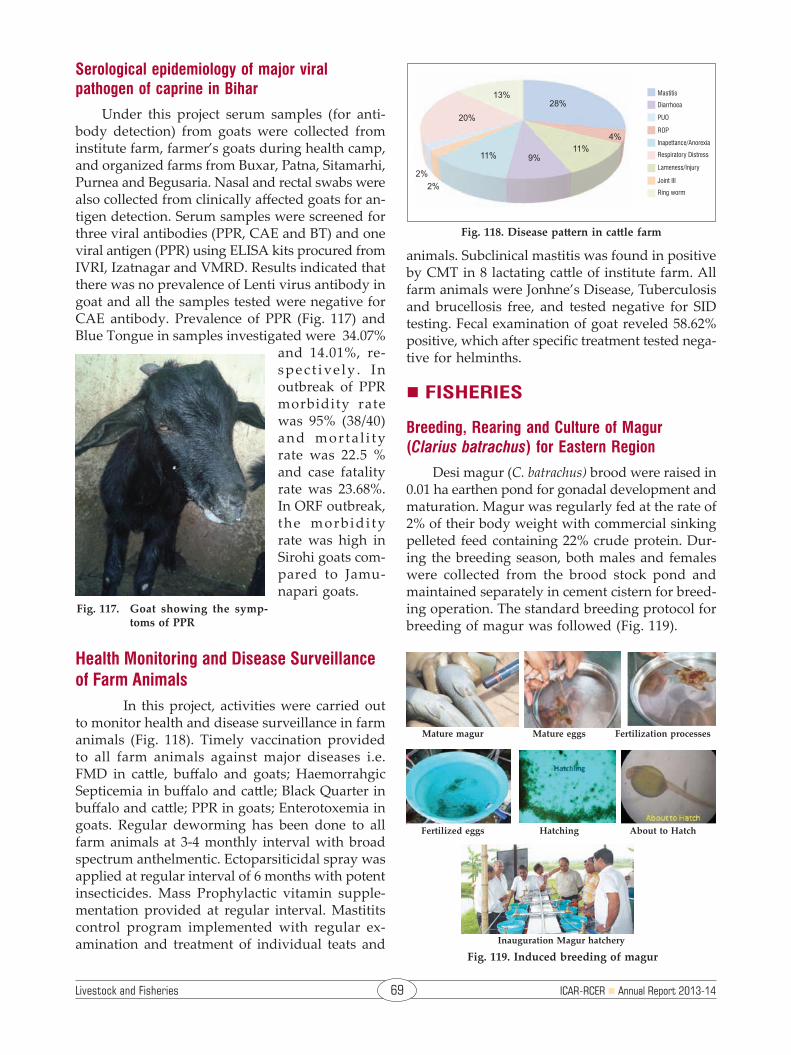
Livestock and Fisheries 69 ICAR-RCER n Annual Report 2013-14
Serological epidemiology of major viral pathogen of caprine in Bihar
Under this project serum samples (for anti-body detection) from goats were collected from institute farm, farmer’s goats during health camp, and organized farms from Buxar, Patna, Sitamarhi, Purnea and Begusaria. Nasal and rectal swabs were also collected from clinically affected goats for an-tigen detection. Serum samples were screened for three viral antibodies (PPR, CAE and BT) and one viral antigen (PPR) using ELISA kits procured from IVRI, Izatnagar and VMRD. Results indicated that there was no prevalence of Lenti virus antibody in goat and all the samples tested were negative for CAE antibody. Prevalence of PPR (Fig. 117) and Blue Tongue in samples investigated were 34.07%
and 14.01%, re-spec t ive ly . In outbreak of PPR morbidity rate was 95% (38/40) and morta l i ty rate was 22.5 % and case fatality rate was 23.68%. In ORF outbreak, the morbidi ty rate was high in Sirohi goats com-pared to Jamu-napari goats.
Fig. 118. Disease pattern in cattle farm
Health Monitoring and Disease Surveillance of Farm Animals
In this project, activities were carried out to monitor health and disease surveillance in farm animals (Fig. 118). Timely vaccination provided to all farm animals against major diseases i.e. FMD in cattle, buffalo and goats; Haemorrahgic Septicemia in buffalo and cattle; Black Quarter in buffalo and cattle; PPR in goats; Enterotoxemia in goats. Regular deworming has been done to all farm animals at 3-4 monthly interval with broad spectrum anthelmentic. Ectoparsiticidal spray was applied at regular interval of 6 months with potent insecticides. Mass Prophylactic vitamin supple-mentation provided at regular interval. Mastitits control program implemented with regular ex-amination and treatment of individual teats and
Fig. 119. Induced breeding of magur
animals. Subclinical mastitis was found in positive by CMT in 8 lactating cattle of institute farm. All farm animals were Jonhne’s Disease, Tuberculosis and brucellosis free, and tested negative for SID testing. Fecal examination of goat reveled 58.62% positive, which after specific treatment tested nega-tive for helminths.
n FISHERIES
Breeding, Rearing and Culture of Magur (Clarius batrachus) for Eastern Region
Desi magur (C. batrachus) brood were raised in 0.01 ha earthen pond for gonadal development and maturation. Magur was regularly fed at the rate of 2% of their body weight with commercial sinking pelleted feed containing 22% crude protein. Dur-ing the breeding season, both males and females were collected from the brood stock pond and maintained separately in cement cistern for breed-ing operation. The standard breeding protocol for breeding of magur was followed (Fig. 119).
Fig. 117. Goat showing the symp-toms of PPR
Mature magur Mature eggs Fertilization processes
Inauguration Magur hatchery
Fertilized eggs Hatching About to Hatch

ICAR-RCER n Annual Report 2013-14 70 Livestock and Fisheries
Fig 120. Embryonic development of fertilized eggs of magur
On an average, about 6,000-7,000 eggs were obtained from a fully riped female. The fertilization percentage obtained varied from 89 to 96% with an average of 93.16% whereas the hatching percent-age varied between 23 and 75% with an average of 55.10%. An average of 21.55% survival was achieved from spawn to fry stage with a maximum of 34%. Detail embryonic developmental stages of magur larvae are illustrated in Fig. 120.
Fig 121. Natural breeding of magur
Hatchery water temperature, pH, dissolved oxygen and total alkalinity were in the ranges of 26-32oC, 7.4-8.1, 6.5-7.1 mg/l and 160-190 mg/l, re-spectively. Hatching time varied between 23 hours and 26 hours at a temperature range of 29oC–34.5oC and water pH range of 7.6-8.1. The maximum survival percentage from spawn to fry was 34%.Three different dosages of ovaprim was attempted to study the effectiveness of the dose on ovulation. Out of these, a single injection of 0.7 ml/kg body weight was the most effective. The males were given a single dose of 0.1-0.2 ml/kg body weight. Breeding response of the magur was evaluated and found to be good. The translucent eggs containing embryonic eyes were considered fertilized. Unfer-tilized eggs were removed immediately from the tray to avoid the fouling of water. After hatching to at least 16-20 days they were maintained in the hatchery itself and were transferred to 2 × 0.5 × 0.3 cm3 size FRP tanks for another 30 days. More than 1000 early fry and fingerlings with average length (75 mm ± 9 mm) and average weight (5.1 ± 0.10 g) were obtained after first sampling. After that fishes (8-10 cm size) were released to the nursery pond for further rearing and fed with eggs yolk suspen-sion along with crumbled powder feed having 20% protein and boiled poultry eggs.
Natural breeding of magur was also suc-cessfully attempted after suitably modifying the breeding ground with 70-80 cm depth. About 20 breeding pits were dug on upper portion of the breeding pond. Several earthen pots, aquatics weeds and hideouts were provided for facilitating good breeding response. Water level in the breed-ing ground was maintained at 15-20 cm above the breeding pits. The breeding and spawning response of magur in natural site was found to be good. About 1000 magur fry and fingerlings recovered from natural breeding ground were being reared for further maturity and development (Fig. 121).
Diversification of Fish Farming System to Maximize the Water Productivity
The objective of the study is to standardize the breeding protocol and rearing practices of IMCs, Grass Carp and Labeo bata and to evaluate the per-formances in different fish farming system.
Breeding of Labeo bata and IMCs
Labeo bata, locally called as Bata belongs to the Family Cyprinidae. The most identifying charac-teristic of the fish is the presence of small black spot on 5th and 6th scales on the lateral line. The hatching of larvae took place between 5-6 hours after ovulation at 27-28oC in all the breeding trials. The highest percentage of hatching was recorded at 84.00% and the lowest at 39.67%. The best dose
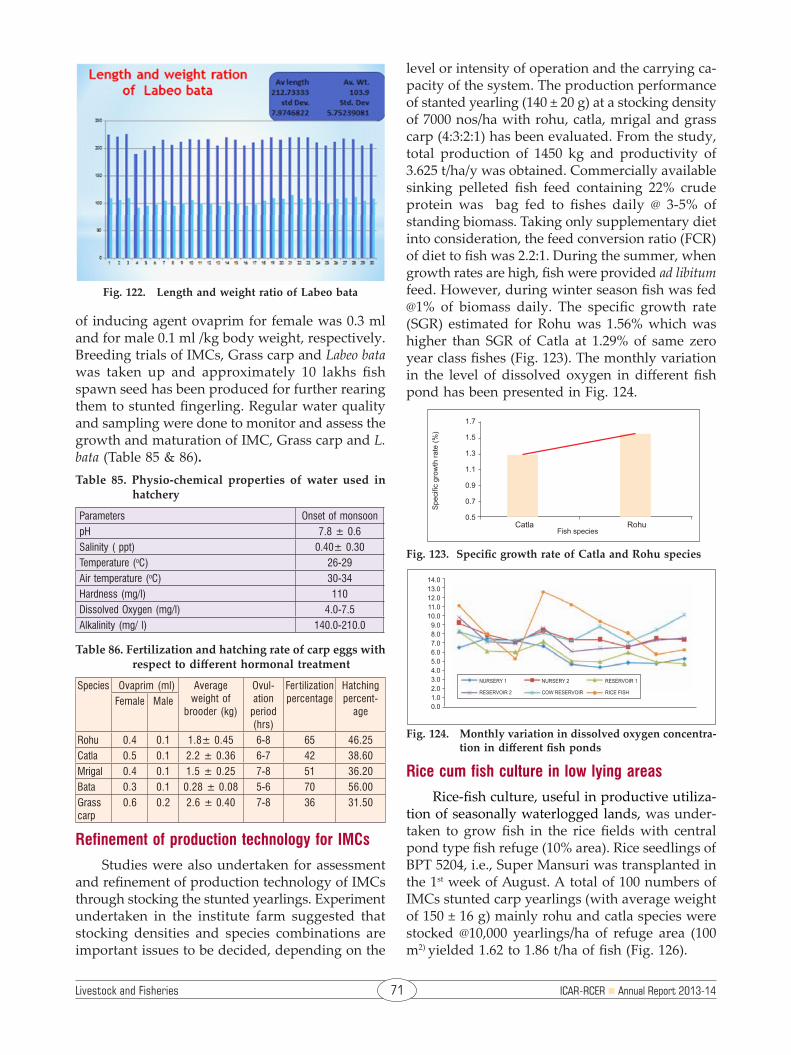
Livestock and Fisheries 71 ICAR-RCER n Annual Report 2013-14
of inducing agent ovaprim for female was 0.3 ml and for male 0.1 ml /kg body weight, respectively. Breeding trials of IMCs, Grass carp and Labeo bata was taken up and approximately 10 lakhs fish spawn seed has been produced for further rearing them to stunted fingerling. Regular water quality and sampling were done to monitor and assess the growth and maturation of IMC, Grass carp and L. bata (Table 85 & 86).Table 85. Physio-chemical properties of water used in
hatchery
Parameters Onset of monsoon pH 7.8 ± 0.6Salinity ( ppt) 0.40± 0.30 Temperature (oC) 26-29 Air temperature (oC) 30-34Hardness (mg/l) 110 Dissolved Oxygen (mg/l) 4.0-7.5 Alkalinity (mg/ l) 140.0-210.0
Table 86. Fertilization and hatching rate of carp eggs with respect to different hormonal treatment
Species Ovaprim (ml) Average weight of
brooder (kg)
Ovul-ation
period (hrs)
Fer tilization percentage
Hatching percent-
ageFemale Male
Rohu 0.4 0.1 1.8± 0.45 6-8 65 46.25Catla 0.5 0.1 2.2 ± 0.36 6-7 42 38.60Mrigal 0.4 0.1 1.5 ± 0.25 7-8 51 36.20Bata 0.3 0.1 0.28 ± 0.08 5-6 70 56.00Grass carp
0.6 0.2 2.6 ± 0.40 7-8 36 31.50
Refinement of production technology for IMCs
Studies were also undertaken for assessment and refinement of production technology of IMCs through stocking the stunted yearlings. Experiment undertaken in the institute farm suggested that stocking densities and species combinations are important issues to be decided, depending on the
level or intensity of operation and the carrying ca-pacity of the system. The production performance of stanted yearling (140 ± 20 g) at a stocking density of 7000 nos/ha with rohu, catla, mrigal and grass carp (4:3:2:1) has been evaluated. From the study, total production of 1450 kg and productivity of 3.625 t/ha/y was obtained. Commercially available sinking pelleted fish feed containing 22% crude protein was bag fed to fishes daily @ 3-5% of standing biomass. Taking only supplementary diet into consideration, the feed conversion ratio (FCR) of diet to fish was 2.2:1. During the summer, when growth rates are high, fish were provided ad libitum feed. However, during winter season fish was fed @1% of biomass daily. The specific growth rate (SGR) estimated for Rohu was 1.56% which was higher than SGR of Catla at 1.29% of same zero year class fishes (Fig. 123). The monthly variation in the level of dissolved oxygen in different fish pond has been presented in Fig. 124.
Fig. 122. Length and weight ratio of Labeo bata
Fig. 123. Specific growth rate of Catla and Rohu species
Fig. 124. Monthly variation in dissolved oxygen concentra-tion in different fish ponds
Rice cum fish culture in low lying areas
Rice-fish culture, useful in productive utiliza-tion of seasonally waterlogged lands, was under-taken to grow fish in the rice fields with central pond type fish refuge (10% area). Rice seedlings of BPT 5204, i.e., Super Mansuri was transplanted in the 1st week of August. A total of 100 numbers of IMCs stunted carp yearlings (with average weight of 150 ± 16 g) mainly rohu and catla species were stocked @10,000 yearlings/ha of refuge area (100 m2) yielded 1.62 to 1.86 t/ha of fish (Fig. 126).
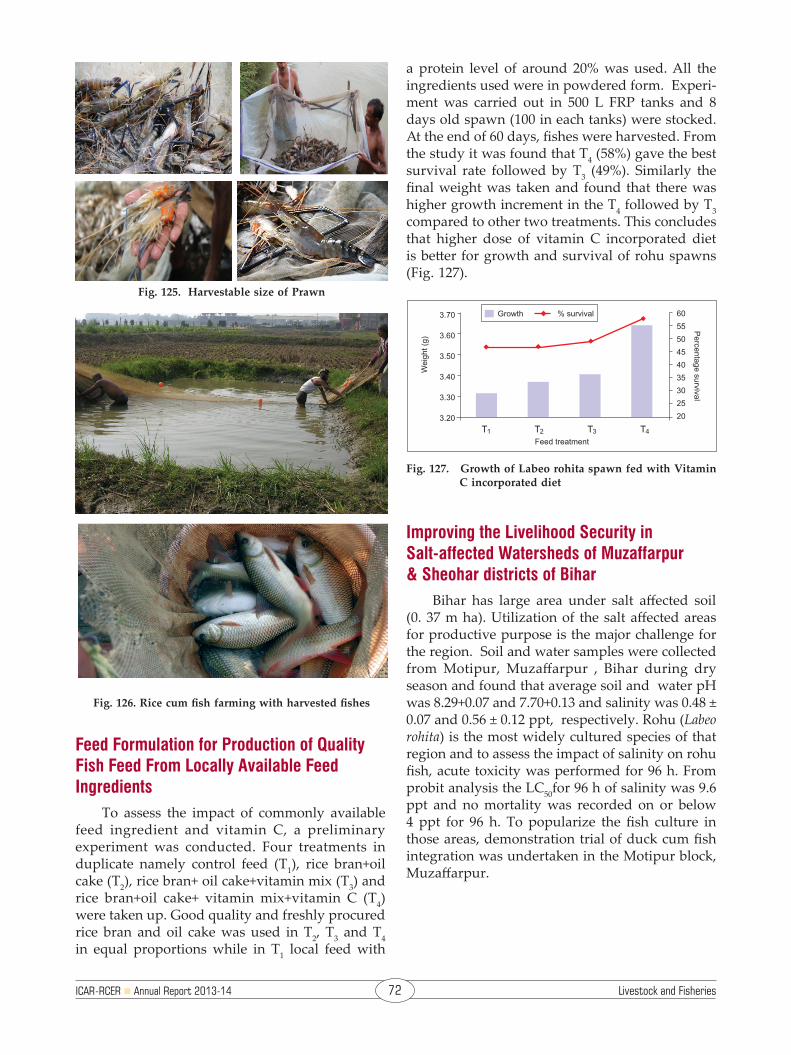
ICAR-RCER n Annual Report 2013-14 72 Livestock and Fisheries
Fig. 125. Harvestable size of Prawn
Fig. 126. Rice cum fish farming with harvested fishes
Fig. 127. Growth of Labeo rohita spawn fed with Vitamin C incorporated diet
a protein level of around 20% was used. All the ingredients used were in powdered form. Experi-ment was carried out in 500 L FRP tanks and 8 days old spawn (100 in each tanks) were stocked. At the end of 60 days, fishes were harvested. From the study it was found that T4 (58%) gave the best survival rate followed by T3 (49%). Similarly the final weight was taken and found that there was higher growth increment in the T4 followed by T3 compared to other two treatments. This concludes that higher dose of vitamin C incorporated diet is better for growth and survival of rohu spawns (Fig. 127).
Feed Formulation for Production of Quality Fish Feed From Locally Available Feed Ingredients
To assess the impact of commonly available feed ingredient and vitamin C, a preliminary experiment was conducted. Four treatments in duplicate namely control feed (T1), rice bran+oil cake (T2), rice bran+ oil cake+vitamin mix (T3) and rice bran+oil cake+ vitamin mix+vitamin C (T4) were taken up. Good quality and freshly procured rice bran and oil cake was used in T2, T3 and T4 in equal proportions while in T1 local feed with
Improving the Livelihood Security in Salt-affected Watersheds of Muzaffarpur & Sheohar districts of Bihar
Bihar has large area under salt affected soil (0. 37 m ha). Utilization of the salt affected areas for productive purpose is the major challenge for the region. Soil and water samples were collected from Motipur, Muzaffarpur , Bihar during dry season and found that average soil and water pH was 8.29+0.07 and 7.70+0.13 and salinity was 0.48 ± 0.07 and 0.56 ± 0.12 ppt, respectively. Rohu (Labeo rohita) is the most widely cultured species of that region and to assess the impact of salinity on rohu fish, acute toxicity was performed for 96 h. From probit analysis the LC50for 96 h of salinity was 9.6 ppt and no mortality was recorded on or below 4 ppt for 96 h. To popularize the fish culture in those areas, demonstration trial of duck cum fish integration was undertaken in the Motipur block, Muzaffarpur.

Energy 73 ICAR-RCER n Annual Report 2013-14
Solar Energy Utilization in AgricultureEastern India is blessed with enormous solar
energy resources, and therefore it can be a year round reliable source of energy for ground water pumping and operating pressurised irrigation sys-tem to enhance water use effi ciency as well as crop productivity. For eff ective harnessing and proper utilization of solar energy, appropriate system design and preliminary data sets are required for system optimization to fulfi l the irrigation needs in view of cropping patt ern, land holding sizes and solar irradiance conditions round the year. Installa-tion and testing of a solar photovoltaic system (Fig. 128) was undertaken at ICAR Research Complex for Eastern Region, Patna.
delivery pressure. The average daily water output from 3 HP pump in diff erent months is shown in Fig. 129. Interpretation shows that, on a bright sun-shine day nearly 179 m3 of water can be extracted in the month of April whereas 105 m3 of water in the month of December. On the basis of daily water availability, farmers can develop crop calendar as per the cropping patt ern and water requirement. The excess water can be used for adjoining fi elds, as delivery pump can easily send water up to 250-300 m through pipe system.
Generally 6 cm water is required for irrigating fi eld crops under fl ood irrigation method. There-fore, on an average a cropped area of 2000-3000 m2 can be irrigated on a bright day.
The static delivery head vs. discharge and static delivery head vs. solar irradiance of centrifugal pump on a cloud free day is shown in Fig. 132 and Fig. 131, respectively. The centrifugal static delivery head of this pump ranges from 0.9-1.5 m and solar irradiance is ranges between 550-850 W/m2. This range of irradiance value prevails in almost all the months between 9.30 am to 2.30 pm, except November and December (Fig. 132). Therefore, delivery pump can successfully handle any pressur-ized irrigation system requiring operating pressures of 1.0 -1.5 bar on every cloud free day round the year between 9.30 am to 2.30 pm.
Fig. 128. Solar unit for ground water
A 3.0 kWp solar array was used to energize a 3 H.P. A.C. submersible pump with drawdown depth of 20 m. Selection of depth was taken in view of water depth in Eastern India where, in general, the water depth below ground label lie in the range of 2 to 15 m with annual fl uctuations of ± 2 to ± 4 m in post and pre monsoon, respectively.
The ground water extracted into a grounded storage tank of dimension 9.75 m × 4.8 m × 2.5 m, i.e., (117 m3). An additional 2 H.P D.C. centrifugal pump, operated by 1.4 kWp solar array was used to deliver water from storage tank to the adjoining fi elds to irrigate crop either by fl ood or pressurized method of irrigation, as this pump create high
Fig. 129. Mean monthly daily water output of submersible pump along with solar global radiation for dif-ferent months
17. Energy

ICAR-RCER n Annual Report 2013-14 74 Energy
Fig. 130. Static delivery head vs. discharge curve of centrifu-gal pump
Fig. 131. Delivery head vs. solar irradiance curve of cen-trifugal pump
Fig. 132. Diagram, showing the mean monthly diurnal varia-tion of solar irradiance, received on cloud free day at Patna (25.65°N).
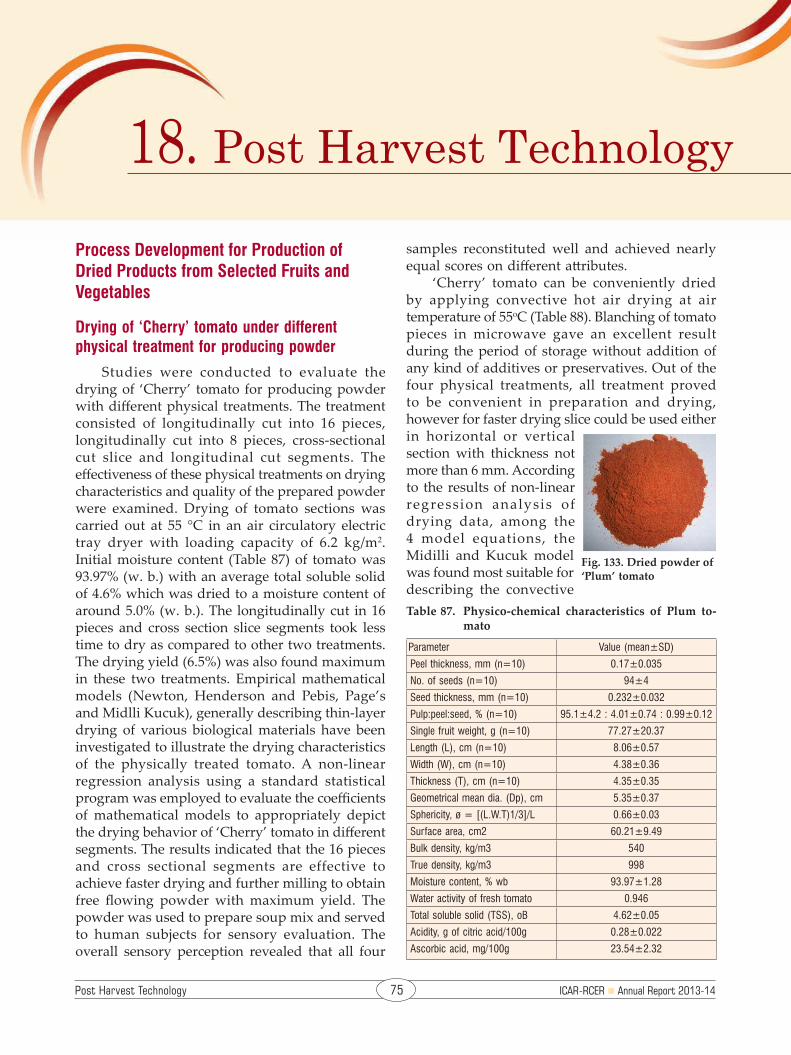
Post Harvest Technology 75 ICAR-RCER n Annual Report 2013-14
Process Development for Production of Dried Products from Selected Fruits and Vegetables
Drying of ‘Cherry’ tomato under different physical treatment for producing powder
Studies were conducted to evaluate the drying of ‘Cherry’ tomato for producing powder with different physical treatments. The treatment consisted of longitudinally cut into 16 pieces, longitudinally cut into 8 pieces, cross-sectional cut slice and longitudinal cut segments. The effectiveness of these physical treatments on drying characteristics and quality of the prepared powder were examined. Drying of tomato sections was carried out at 55 °C in an air circulatory electric tray dryer with loading capacity of 6.2 kg/m2. Initial moisture content (Table 87) of tomato was 93.97% (w. b.) with an average total soluble solid of 4.6% which was dried to a moisture content of around 5.0% (w. b.). The longitudinally cut in 16 pieces and cross section slice segments took less time to dry as compared to other two treatments. The drying yield (6.5%) was also found maximum in these two treatments. Empirical mathematical models (Newton, Henderson and Pebis, Page’s and Midlli Kucuk), generally describing thin-layer drying of various biological materials have been investigated to illustrate the drying characteristics of the physically treated tomato. A non-linear regression analysis using a standard statistical program was employed to evaluate the coefficients of mathematical models to appropriately depict the drying behavior of ‘Cherry’ tomato in different segments. The results indicated that the 16 pieces and cross sectional segments are effective to achieve faster drying and further milling to obtain free flowing powder with maximum yield. The powder was used to prepare soup mix and served to human subjects for sensory evaluation. The overall sensory perception revealed that all four
samples reconstituted well and achieved nearly equal scores on different attributes.
‘Cherry’ tomato can be conveniently dried by applying convective hot air drying at air temperature of 55oC (Table 88). Blanching of tomato pieces in microwave gave an excellent result during the period of storage without addition of any kind of additives or preservatives. Out of the four physical treatments, all treatment proved to be convenient in preparation and drying, however for faster drying slice could be used either in horizontal or vertical section with thickness not more than 6 mm. According to the results of non-linear regression analysis of drying data, among the 4 model equations, the Midilli and Kucuk model was found most suitable for describing the convective
Fig. 133. Dried powder of ‘Plum’ tomato
Table 87. Physico-chemical characteristics of Plum to-mato
Parameter Value (mean±SD)
Peel thickness, mm (n=10) 0.17±0.035
No. of seeds (n=10) 94±4
Seed thickness, mm (n=10) 0.232±0.032
Pulp:peel:seed, % (n=10) 95.1±4.2 : 4.01±0.74 : 0.99±0.12
Single fruit weight, g (n=10) 77.27±20.37
Length (L), cm (n=10) 8.06±0.57
Width (W), cm (n=10) 4.38±0.36
Thickness (T), cm (n=10) 4.35±0.35
Geometrical mean dia. (Dp), cm 5.35±0.37
Sphericity, ø = [(L.W.T)1/3]/L 0.66±0.03
Surface area, cm2 60.21±9.49
Bulk density, kg/m3 540
True density, kg/m3 998
Moisture content, % wb 93.97±1.28
Water activity of fresh tomato 0.946
Total soluble solid (TSS), oB 4.62±0.05
Acidity, g of citric acid/100g 0.28±0.022
Ascorbic acid, mg/100g 23.54±2.32
18. Post Harvest Technology
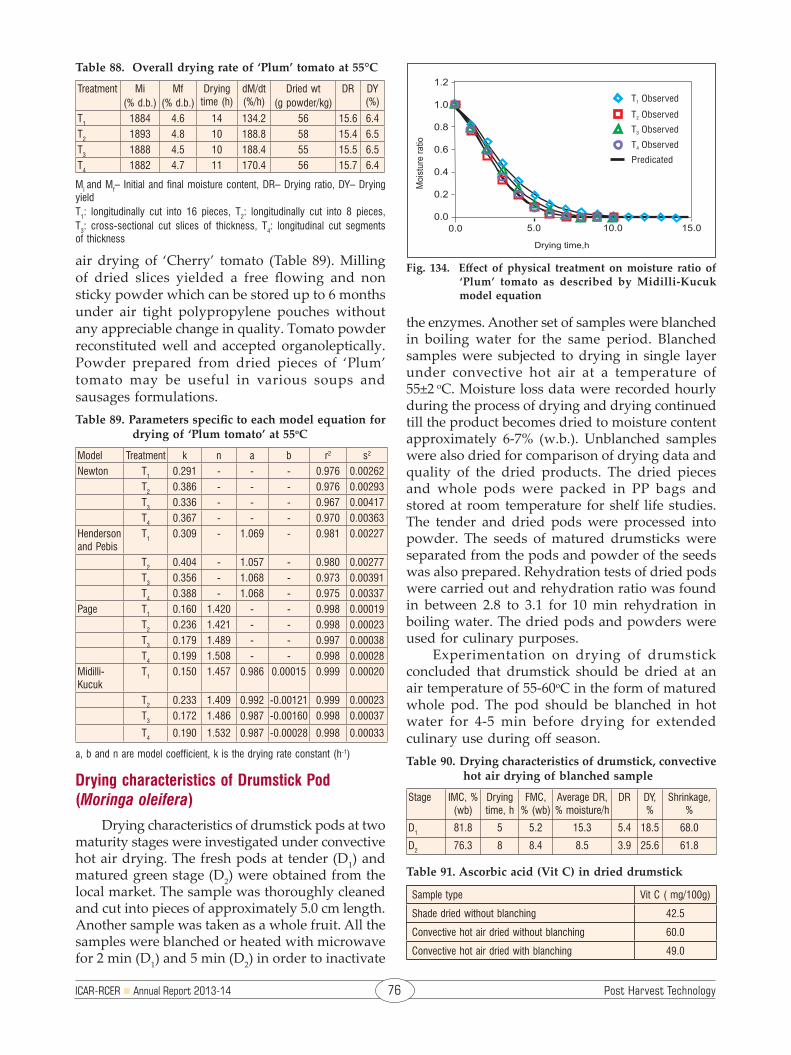
ICAR-RCER n Annual Report 2013-14 76 Post Harvest Technology
air drying of ‘Cherry’ tomato (Table 89). Milling of dried slices yielded a free flowing and non sticky powder which can be stored up to 6 months under air tight polypropylene pouches without any appreciable change in quality. Tomato powder reconstituted well and accepted organoleptically. Powder prepared from dried pieces of ‘Plum’ tomato may be useful in various soups and sausages formulations. Table 89. Parameters specific to each model equation for
drying of ‘Plum tomato’ at 55oC
Model Treatment k n a b r2 s2
Newton T1 0.291 - - - 0.976 0.00262 T2 0.386 - - - 0.976 0.00293
T3 0.336 - - - 0.967 0.00417T4 0.367 - - - 0.970 0.00363
Henderson and Pebis
T1 0.309 - 1.069 - 0.981 0.00227
T2 0.404 - 1.057 - 0.980 0.00277T3 0.356 - 1.068 - 0.973 0.00391T4 0.388 - 1.068 - 0.975 0.00337
Page T1 0.160 1.420 - - 0.998 0.00019T2 0.236 1.421 - - 0.998 0.00023T3 0.179 1.489 - - 0.997 0.00038T4 0.199 1.508 - - 0.998 0.00028
Midilli-Kucuk
T1 0.150 1.457 0.986 0.00015 0.999 0.00020
T2 0.233 1.409 0.992 -0.00121 0.999 0.00023T3 0.172 1.486 0.987 -0.00160 0.998 0.00037
T4 0.190 1.532 0.987 -0.00028 0.998 0.00033
a, b and n are model coefficient, k is the drying rate constant (h-1)
Drying characteristics of Drumstick Pod (Moringa oleifera)
Drying characteristics of drumstick pods at two maturity stages were investigated under convective hot air drying. The fresh pods at tender (D1) and matured green stage (D2) were obtained from the local market. The sample was thoroughly cleaned and cut into pieces of approximately 5.0 cm length. Another sample was taken as a whole fruit. All the samples were blanched or heated with microwave for 2 min (D1) and 5 min (D2) in order to inactivate
the enzymes. Another set of samples were blanched in boiling water for the same period. Blanched samples were subjected to drying in single layer under convective hot air at a temperature of 55±2 oC. Moisture loss data were recorded hourly during the process of drying and drying continued till the product becomes dried to moisture content approximately 6-7% (w.b.). Unblanched samples were also dried for comparison of drying data and quality of the dried products. The dried pieces and whole pods were packed in PP bags and stored at room temperature for shelf life studies. The tender and dried pods were processed into powder. The seeds of matured drumsticks were separated from the pods and powder of the seeds was also prepared. Rehydration tests of dried pods were carried out and rehydration ratio was found in between 2.8 to 3.1 for 10 min rehydration in boiling water. The dried pods and powders were used for culinary purposes.
Experimentation on drying of drumstick concluded that drumstick should be dried at an air temperature of 55-60oC in the form of matured whole pod. The pod should be blanched in hot water for 4-5 min before drying for extended culinary use during off season. Table 90. Drying characteristics of drumstick, convective
hot air drying of blanched sample
Stage IMC, % (wb)
Drying time, h
FMC, % (wb)
Average DR, % moisture/h
DR DY, %
Shrinkage, %
D1 81.8 5 5.2 15.3 5.4 18.5 68.0
D2 76.3 8 8.4 8.5 3.9 25.6 61.8
Table 91. Ascorbic acid (Vit C) in dried drumstick
Sample type Vit C ( mg/100g)
Shade dried without blanching 42.5
Convective hot air dried without blanching 60.0
Convective hot air dried with blanching 49.0
Fig. 134. Effect of physical treatment on moisture ratio of ‘Plum’ tomato as described by Midilli-Kucuk model equation
Table 88. Overall drying rate of ‘Plum’ tomato at 55°C
Treatment Mi(% d.b.)
Mf(% d.b.)
Drying time (h)
dM/dt (%/h)
Dried wt(g powder/kg)
DR DY (%)
T1 1884 4.6 14 134.2 56 15.6 6.4T2 1893 4.8 10 188.8 58 15.4 6.5T3 1888 4.5 10 188.4 55 15.5 6.5T4 1882 4.7 11 170.4 56 15.7 6.4
Mi and Mf– Initial and final moisture content, DR– Drying ratio, DY– Drying yieldT1: longitudinally cut into 16 pieces, T2: longitudinally cut into 8 pieces,T3: cross-sectional cut slices of thickness, T4: longitudinal cut segments of thickness

Post Harvest Technology 77 ICAR-RCER n Annual Report 2013-14
Evaluation of different weeding technologies for Direct Seeded Rice-Maize cropping system
Different weeding technologies and their combinations were evaluated for maize crop and it was found that hand weeding was most efficient followed by herbicide/weedicide application and cono weeder.
Fig. 135. Effect of drumstick type on moisture ratios as de-scribed by Page’s model MR = exp(-ktn) [For D2, k = 0.284, n = 1.161, r2 = 0.998
Fig. 136. Drumstick powder and dried drumstik pods
When weeder works over the crop the field efficiency of the weeder is almost double as compared to traditional weeder. However, during the evaluation it was felt that during the second weeding of crop, crop height is around 20-25 cm. Hence suitable attachment has been provided to overcome this problem. The weeder can work over the crops up to a crop height of 30 cm. The cutting width of the weeder is 27.5 cm which works very well between the row crops (Fig. 138). The average weeding efficiency was 78%. By interchanging the position of shank in the groves the method of weeding can be changed. The weeder has been evaluated in direct seeded rice field (Fig. 139).
Fig. 137. Method of weeding of new weeder and type of tyne used
Fig. 139. Performance evaluation of weeder in direct seeded rice field
Fig. 138. Cutting width of the weeder
The project was taken with two objectives, to evaluate the existing weeding technologies and to modify the weeders as per local needs. It was felt that there is a need of little modification in the size of shovel/tyne and method of weeding in existing weeder. Traditional weeders work between the rows of the crops. A new weeder is developed which can work between rows of crop as well as over the crop (Fig. 137).
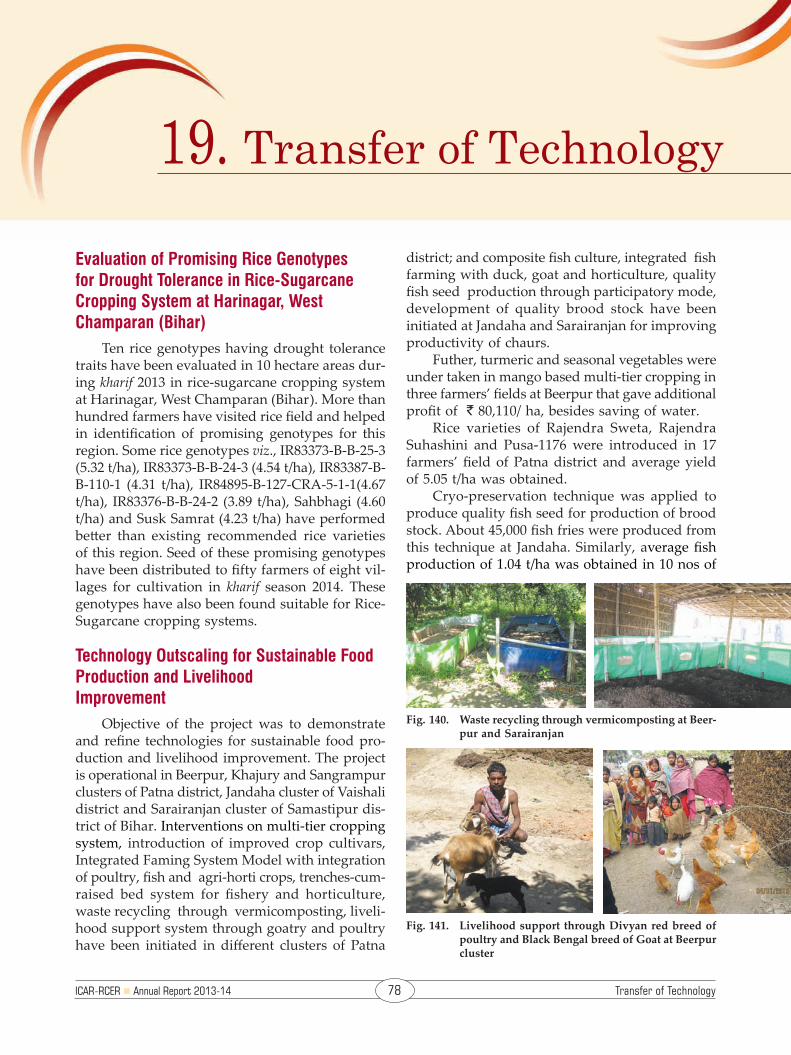
ICAR-RCER n Annual Report 2013-14 78 Transfer of Technology
Evaluation of Promising Rice Genotypes for Drought Tolerance in Rice-Sugarcane Cropping System at Harinagar, West Champaran (Bihar)
Ten rice genotypes having drought tolerance traits have been evaluated in 10 hectare areas dur-ing kharif 2013 in rice-sugarcane cropping system at Harinagar, West Champaran (Bihar). More than hundred farmers have visited rice field and helped in identification of promising genotypes for this region. Some rice genotypes viz., IR83373-B-B-25-3 (5.32 t/ha), IR83373-B-B-24-3 (4.54 t/ha), IR83387-B-B-110-1 (4.31 t/ha), IR84895-B-127-CRA-5-1-1(4.67 t/ha), IR83376-B-B-24-2 (3.89 t/ha), Sahbhagi (4.60 t/ha) and Susk Samrat (4.23 t/ha) have performed better than existing recommended rice varieties of this region. Seed of these promising genotypes have been distributed to fifty farmers of eight vil-lages for cultivation in kharif season 2014. These genotypes have also been found suitable for Rice-Sugarcane cropping systems.
Technology Outscaling for Sustainable Food Production and Livelihood Improvement
Objective of the project was to demonstrate and refine technologies for sustainable food pro-duction and livelihood improvement. The project is operational in Beerpur, Khajury and Sangrampur clusters of Patna district, Jandaha cluster of Vaishali district and Sarairanjan cluster of Samastipur dis-trict of Bihar. Interventions on multi-tier cropping system, introduction of improved crop cultivars, Integrated Faming System Model with integration of poultry, fish and agri-horti crops, trenches-cum-raised bed system for fishery and horticulture, waste recycling through vermicomposting, liveli-hood support system through goatry and poultry have been initiated in different clusters of Patna
district; and composite fish culture, integrated fish farming with duck, goat and horticulture, quality fish seed production through participatory mode, development of quality brood stock have been initiated at Jandaha and Sarairanjan for improving productivity of chaurs.
Futher, turmeric and seasonal vegetables were under taken in mango based multi-tier cropping in three farmers’ fields at Beerpur that gave additional profit of ` 80,110/ ha, besides saving of water.
Rice varieties of Rajendra Sweta, Rajendra Suhashini and Pusa-1176 were introduced in 17 farmers’ field of Patna district and average yield of 5.05 t/ha was obtained.
Cryo-preservation technique was applied to produce quality fish seed for production of brood stock. About 45,000 fish fries were produced from this technique at Jandaha. Similarly, average fish production of 1.04 t/ha was obtained in 10 nos of
Fig. 140. Waste recycling through vermicomposting at Beer-pur and Sarairanjan
Fig. 141. Livelihood support through Divyan red breed of poultry and Black Bengal breed of Goat at Beerpur cluster
19. Transfer of Technology

Transfer of Technology 79 ICAR-RCER n Annual Report 2013-14
farmers’ field at different clusters of Patna dis-trict without any supplemental feeding during 8 months’ culture.
Tracking Change in Rural Poverty in Households and Village Economies in South Asia
Study revealed that in Bihar, per capita in-come increased by about two-fold during last two decades, but the increase was higher during last five years mainly due to increase in crop and livestock productivity and more employment op-portunities in even rural areas. Per capita income differed significantly from one village to another village, mainly due to per capita land availability and educational level. Non-farm employment was the main source of income and income through migration was much higher in all the villages. There was no trend in diversity of income, but it was more on large households than on labour households. The inequality of income was higher on large households than that on labour house-holds, mainly due to higher level of education and income diversification on these households.
In Jharkhand, the rate of decline in poverty was more in agricultural labour class households (27%) than that of farming households (1.9%). A high incidence of rural poverty ranging from 20 to 76% was observed in different villages. Incidence of poverty among different groups of households showeda mixed pattern. Labour households and large households were comparatively less poor, than small and medium households in most of the villages. Under the project, two Farmers Field Days were organized in Jharkhand during 2013 and a total of 950 farmers participated in the programme.
Developing Sustainable Farming System Models for Prioritized Micro Watersheds in Rainfed Areas of Jharkhand
Low polytunnel cultivation of cucurbits in winter for early summer harvest and better remuneration
Low polytunnel cultivation of cucurbits in winter for early summer harvest and better remu-neration was demonstrated in 88 farmers’ fields in Jamtara and Dumka districts of Jharkhand. Farmers have earned the maximum net income of ` 1571/- (estimated ` 392750/ha) from bottle gourd cultivation in 1.0 decimal (40 m2) area. The
crop was sown on 13.12.2012 and the first harvest started on 10.3.13 and continued up to 14.5.2013. Total harvest was 191 kg (estimated 47.75 t/ha) which was sold @ ` 10–8 per kg.
Demonstration of vegetable cultivation
The improved method of vegetable cultiva-tion was demonstrated in the 713 farmers’ field in Jamtara and Dumka districts of Jharkhand. The maximum annual net income of ` 2544/- was ob-tained by a marginal farmer through cultivation of summer and kharif vegetables in 1.0 decimal (40m2) area of backyard garden. Pointed gourd, a perennial cucurbit was introduced as a new crop in NAIP area in three farmers’ fields and its cultivation was found to be remunerative. After undergoing training on vegetable seed production at ICAR RCER Research Centre, Ranchi, Sh. Churamani Prasad Yadav started production of pure seeds of improved varieties of vegetable crops in his own field. He could able to sell pure seeds of brinjal (560 g), bottle gourd (1300 g) and cucumber (1020 g) in local village markets (haats) and to 6 farmers of 3 villages of Jama block of Dumka district.
Fig. 142. Marketing of bottle gourd produced under low poly tunnel
Demonstration of fruit based multitier cropping system
Twenty mango and guava based multitier orchards were established and out of which, 14 are being maintained. The maximum income of ` 24950/- from filler crop (guava) and intercrops (vegetables like potato, tomato, brinjal, radish, okra and chilli) was obtained by the farmer in the 5th year (2013) of establishment of fruit based multi-tier cropping system.
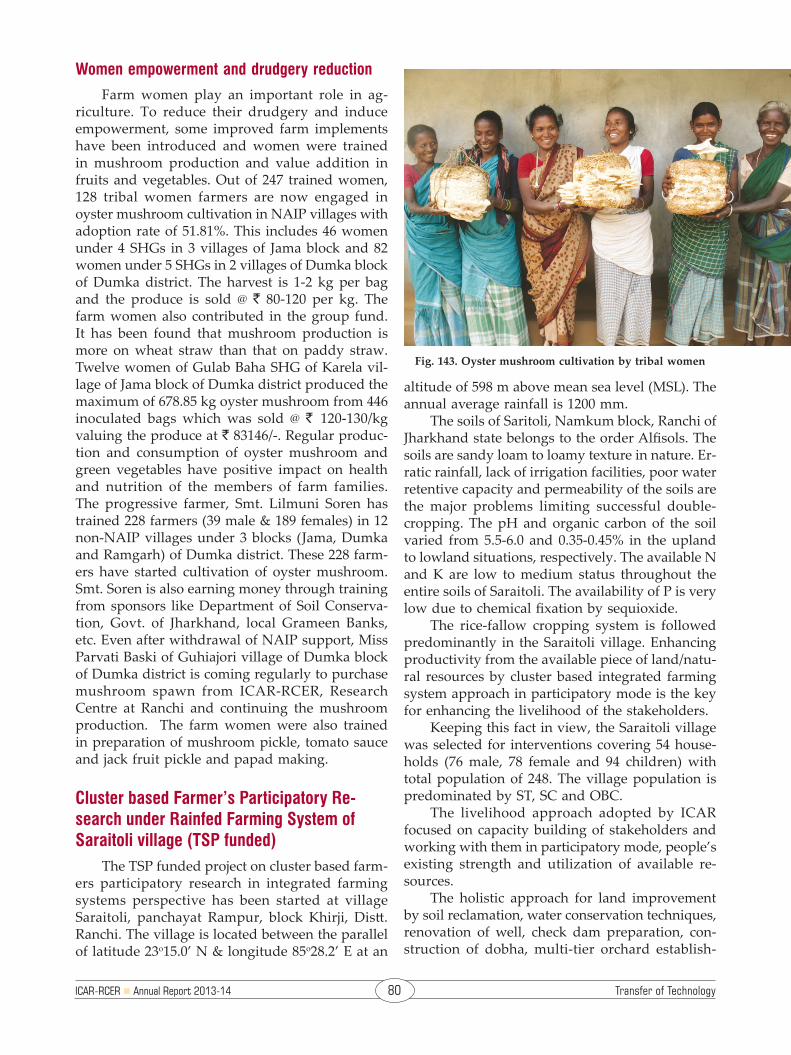
ICAR-RCER n Annual Report 2013-14 80 Transfer of Technology
Women empowerment and drudgery reduction
Farm women play an important role in ag-riculture. To reduce their drudgery and induce empowerment, some improved farm implements have been introduced and women were trained in mushroom production and value addition in fruits and vegetables. Out of 247 trained women, 128 tribal women farmers are now engaged in oyster mushroom cultivation in NAIP villages with adoption rate of 51.81%. This includes 46 women under 4 SHGs in 3 villages of Jama block and 82 women under 5 SHGs in 2 villages of Dumka block of Dumka district. The harvest is 1-2 kg per bag and the produce is sold @ ` 80-120 per kg. The farm women also contributed in the group fund. It has been found that mushroom production is more on wheat straw than that on paddy straw. Twelve women of Gulab Baha SHG of Karela vil-lage of Jama block of Dumka district produced the maximum of 678.85 kg oyster mushroom from 446 inoculated bags which was sold @ ` 120-130/kg valuing the produce at ` 83146/-. Regular produc-tion and consumption of oyster mushroom and green vegetables have positive impact on health and nutrition of the members of farm families. The progressive farmer, Smt. Lilmuni Soren has trained 228 farmers (39 male & 189 females) in 12 non-NAIP villages under 3 blocks (Jama, Dumka and Ramgarh) of Dumka district. These 228 farm-ers have started cultivation of oyster mushroom. Smt. Soren is also earning money through training from sponsors like Department of Soil Conserva-tion, Govt. of Jharkhand, local Grameen Banks, etc. Even after withdrawal of NAIP support, Miss Parvati Baski of Guhiajori village of Dumka block of Dumka district is coming regularly to purchase mushroom spawn from ICAR-RCER, Research Centre at Ranchi and continuing the mushroom production. The farm women were also trained in preparation of mushroom pickle, tomato sauce and jack fruit pickle and papad making.
Cluster based Farmer’s Participatory Re-search under Rainfed Farming System of Saraitoli village (TSP funded)
The TSP funded project on cluster based farm-ers participatory research in integrated farming systems perspective has been started at village Saraitoli, panchayat Rampur, block Khirji, Distt. Ranchi. The village is located between the parallel of latitude 23o15.0’ N & longitude 85o28.2’ E at an
altitude of 598 m above mean sea level (MSL). The annual average rainfall is 1200 mm.
The soils of Saritoli, Namkum block, Ranchi of Jharkhand state belongs to the order Alfisols. The soils are sandy loam to loamy texture in nature. Er-ratic rainfall, lack of irrigation facilities, poor water retentive capacity and permeability of the soils are the major problems limiting successful double-cropping. The pH and organic carbon of the soil varied from 5.5-6.0 and 0.35-0.45% in the upland to lowland situations, respectively. The available N and K are low to medium status throughout the entire soils of Saraitoli. The availability of P is very low due to chemical fixation by sequioxide.
The rice-fallow cropping system is followed predominantly in the Saraitoli village. Enhancing productivity from the available piece of land/natu-ral resources by cluster based integrated farming system approach in participatory mode is the key for enhancing the livelihood of the stakeholders.
Keeping this fact in view, the Saraitoli village was selected for interventions covering 54 house-holds (76 male, 78 female and 94 children) with total population of 248. The village population is predominated by ST, SC and OBC.
The livelihood approach adopted by ICAR focused on capacity building of stakeholders and working with them in participatory mode, people’s existing strength and utilization of available re-sources.
The holistic approach for land improvement by soil reclamation, water conservation techniques, renovation of well, check dam preparation, con-struction of dobha, multi-tier orchard establish-
Fig. 143. Oyster mushroom cultivation by tribal women
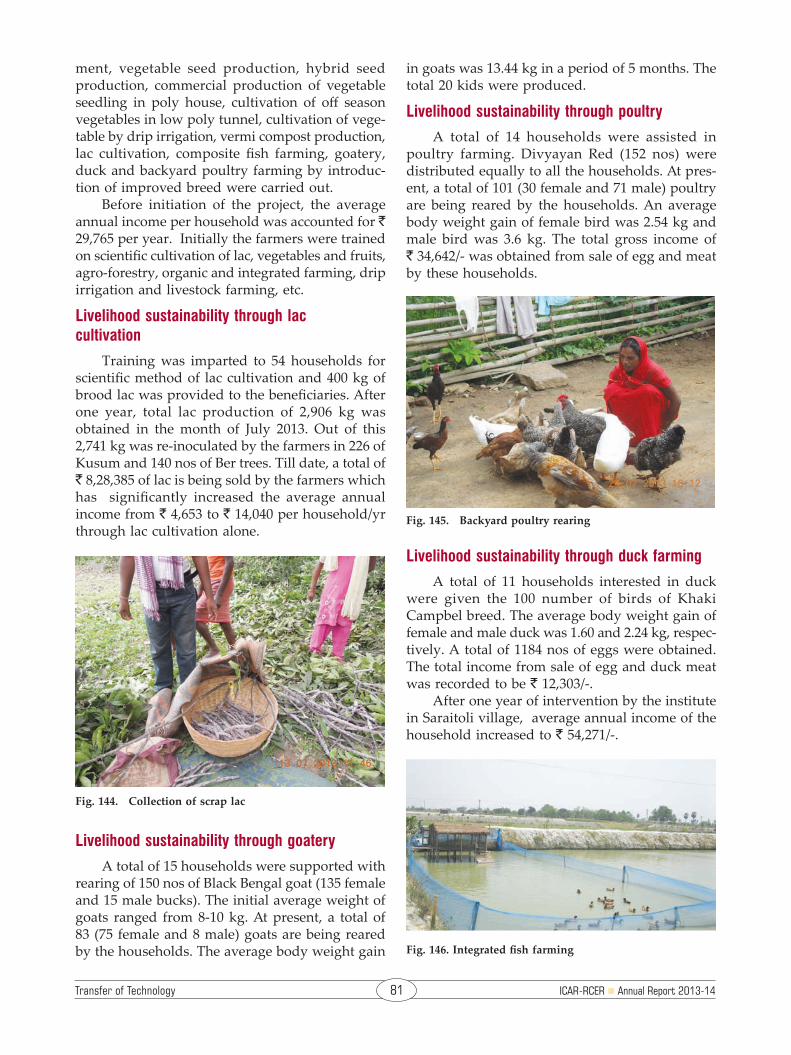
Transfer of Technology 81 ICAR-RCER n Annual Report 2013-14
ment, vegetable seed production, hybrid seed production, commercial production of vegetable seedling in poly house, cultivation of off season vegetables in low poly tunnel, cultivation of vege-table by drip irrigation, vermi compost production, lac cultivation, composite fish farming, goatery, duck and backyard poultry farming by introduc-tion of improved breed were carried out.
Before initiation of the project, the average annual income per household was accounted for ` 29,765 per year. Initially the farmers were trained on scientific cultivation of lac, vegetables and fruits, agro-forestry, organic and integrated farming, drip irrigation and livestock farming, etc.
Livelihood sustainability through lac cultivation
Training was imparted to 54 households for scientific method of lac cultivation and 400 kg of brood lac was provided to the beneficiaries. After one year, total lac production of 2,906 kg was obtained in the month of July 2013. Out of this 2,741 kg was re-inoculated by the farmers in 226 of Kusum and 140 nos of Ber trees. Till date, a total of ` 8,28,385 of lac is being sold by the farmers which has significantly increased the average annual income from ` 4,653 to ` 14,040 per household/yr through lac cultivation alone.
in goats was 13.44 kg in a period of 5 months. The total 20 kids were produced.
Livelihood sustainability through poultry
A total of 14 households were assisted in poultry farming. Divyayan Red (152 nos) were distributed equally to all the households. At pres-ent, a total of 101 (30 female and 71 male) poultry are being reared by the households. An average body weight gain of female bird was 2.54 kg and male bird was 3.6 kg. The total gross income of ` 34,642/- was obtained from sale of egg and meat by these households.
Fig. 144. Collection of scrap lac
Fig. 145. Backyard poultry rearing
Fig. 146. Integrated fish farming
Livelihood sustainability through goatery
A total of 15 households were supported with rearing of 150 nos of Black Bengal goat (135 female and 15 male bucks). The initial average weight of goats ranged from 8-10 kg. At present, a total of 83 (75 female and 8 male) goats are being reared by the households. The average body weight gain
Livelihood sustainability through duck farming
A total of 11 households interested in duck were given the 100 number of birds of Khaki Campbel breed. The average body weight gain of female and male duck was 1.60 and 2.24 kg, respec-tively. A total of 1184 nos of eggs were obtained. The total income from sale of egg and duck meat was recorded to be ` 12,303/-.
After one year of intervention by the institute in Saraitoli village, average annual income of the household increased to ` 54,271/-.

ICAR-RCER n Annual Report 2013-14 82 Transfer of Technology
Training-cum-awareness Programmes for Management of Mango Fruit Flies using Para-Pheromone traps
A series of training-cum-awareness pro-grammes for the management of mango fruit flies have been conducted under the NICRA project on Mango pest. A total of 25,000 nos of methyl eugenol based para-pheromone traps have been distributed among the farmers of Jharkhand, Chhattisgarh and West Bengal for creating awareness about the traps. Training of mango farmers of Lohardaga, Khunti and Gumla was also conducted. In the training programme, farmers were made aware of the use of fruit flies traps alongwith other approaches of integrated fruit flies management.
Technology dissemination in Bali Island, Sundarban, South 24 Parganas of West Bengal
The Bali island covering an area of 20 km2 with an population of 35000. Two farmers-scientist interactions were organized by ICAR-RCER. Vari-ous vegetable seeds like Swarna Lalima (Tomato), Swarna Shymali (Brinjal), Swarna Praphulya (Chilli), cucurbitaceous seeds (Cucumber, Ridge
gourd, Sponge gourd, Pumkin, Bitter gourd and Bottle gourd) of ICAR-RCER, RC, Ranchi and Azad (Mung bean) were distributed to 100 farm families and package of practices of these varieties were briefed to them.
Training on dendrobium orchid cultivation in Jharkhand
One day training programme on Dendrobium orchid cultivation was organized at ICAR Research Complex for Eastern Region, Ranchi Centre on 26th September 2013. The details of production technol-ogy of Dendrobium cultivation was described with demonstration to the farmers’ of Jharkhand.
Fig. 147. Farmers’ meeting and distribution of vegetable seeds at Bali Island, West Bengal
n ExTEnSIOn PROGRAMMES
On-farm trial for the management of brown plant hopper in rice
Rice-wheat cropping system is the dominat-ing cropping system in Buxar where 80% area is covered under rice cultivation during kharif sea-son. The Brown plant hopper (Nilaparvata lugens) is the most destructive insect pest found in high yielding rice crop in Buxar. Continuous two year trial for the management of brown plant hopper in rice with 4 treatments and 6 replications re-vealed that, application of 875 ml/ha Buprofezine (25 SC) increased rice yield by 16.90% (5.05 t/ha) and was better over the conventional practice of brown plant hopper management. Application of Ethiprole + Imidacloprid (40% WG) 100 g/ha in-creased yield to 14.58% (5.05 t/ha). The net return (` 55680/ha) and B:C ratio (3.28) was also higher by application of Buprofezine (25 SC).
Demonstration of fine rice variety (Rajendra Shweta)
KVK Buxar has demonstrated production processes of fine rice variety, Rajendra shweta in
Fig. 148. Training on Dendrobium orchid cultivation
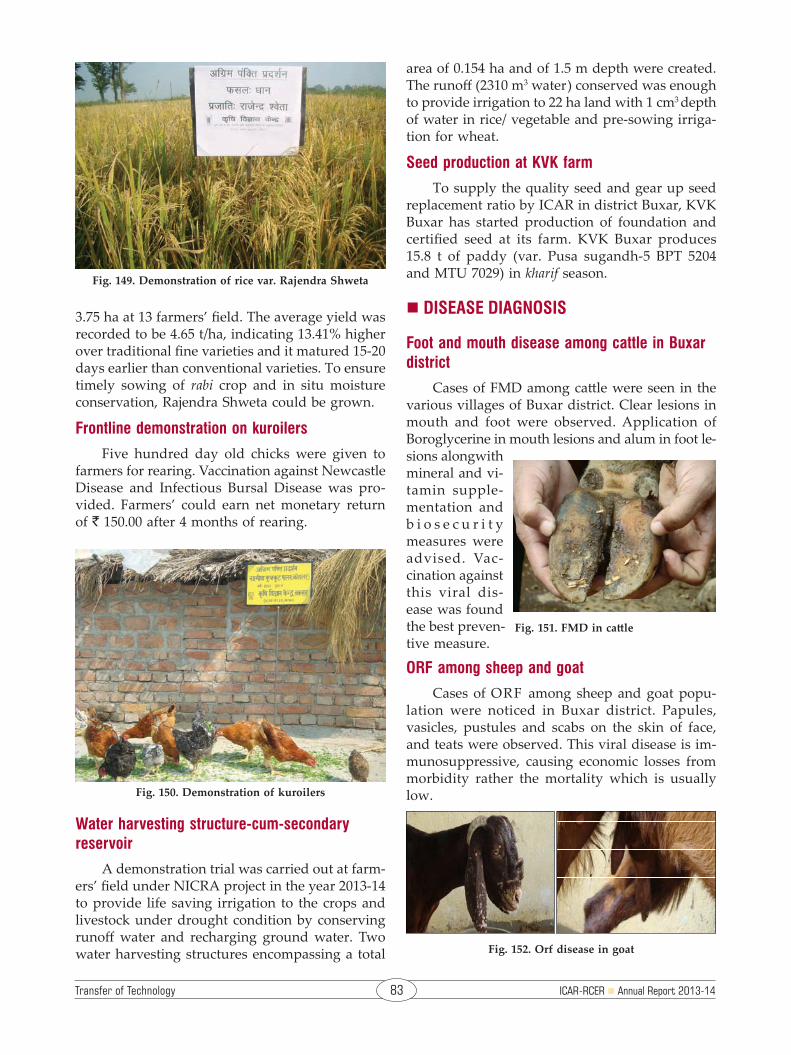
Transfer of Technology 83 ICAR-RCER n Annual Report 2013-14
3.75 ha at 13 farmers’ field. The average yield was recorded to be 4.65 t/ha, indicating 13.41% higher over traditional fine varieties and it matured 15-20 days earlier than conventional varieties. To ensure timely sowing of rabi crop and in situ moisture conservation, Rajendra Shweta could be grown.
Frontline demonstration on kuroilers
Five hundred day old chicks were given to farmers for rearing. Vaccination against Newcastle Disease and Infectious Bursal Disease was pro-vided. Farmers’ could earn net monetary return of ` 150.00 after 4 months of rearing.
area of 0.154 ha and of 1.5 m depth were created. The runoff (2310 m3 water) conserved was enough to provide irrigation to 22 ha land with 1 cm3 depth of water in rice/ vegetable and pre-sowing irriga-tion for wheat.
Seed production at KVK farm
To supply the quality seed and gear up seed replacement ratio by ICAR in district Buxar, KVK Buxar has started production of foundation and certified seed at its farm. KVK Buxar produces 15.8 t of paddy (var. Pusa sugandh-5 BPT 5204 and MTU 7029) in kharif season.
n DISEASE DIAGnOSIS
Foot and mouth disease among cattle in Buxar district
Cases of FMD among cattle were seen in the various villages of Buxar district. Clear lesions in mouth and foot were observed. Application of Boroglycerine in mouth lesions and alum in foot le-sions alongwith mineral and vi-tamin supple-mentation and b i o s e c u r i t y measures were advised. Vac-cination against this viral dis-ease was found the best preven-tive measure.
Fig. 149. Demonstration of rice var. Rajendra Shweta
Fig. 150. Demonstration of kuroilers
Fig. 151. FMD in cattle
Fig. 152. Orf disease in goat
Water harvesting structure-cum-secondary reservoir
A demonstration trial was carried out at farm-ers’ field under NICRA project in the year 2013-14 to provide life saving irrigation to the crops and livestock under drought condition by conserving runoff water and recharging ground water. Two water harvesting structures encompassing a total
ORF among sheep and goat
Cases of ORF among sheep and goat popu-lation were noticed in Buxar district. Papules, vasicles, pustules and scabs on the skin of face, and teats were observed. This viral disease is im-munosuppressive, causing economic losses from morbidity rather the mortality which is usually low.

ICAR-RCER n Annual Report 2013-14 84 Transfer of Technology
Degnala in cattle
Cases of Degnala disease have been observed in the Bijhaura, Bhelpur and adjoining villages in Buxar district. Fusarium sp. was responsible for causing the disease. The treatment (administra-tion of sulpha drugs mixed with cod liver oil and acriflavine on the affected extremities such as tail along with supplementation of mineral mixture and vitamins) was recommended. Farmers’ were also advised to maintain hygiene and feed wheat straw instead of paddy straw.
Fig. 153. Degnala in buffalo
Animal health camps organized
Six animal health camps were organised as depicted below: Table 92. Animal health camps organized at different
villages by KVK, Buxar
Particulars of Animal Health Camp Date organized
Farmers Field, Animal Health camp and awareness programme at Sarai-Ranjan, Samastipur, Bihar
27th Sep., 2013
Animal Health camp and awareness programme at Baghakol, Ara, Bihar
1st Oct., 2013
Animal Health camp at Kushwar, Sheohar, Bihar 30th Jan., 2014
Animal health camp at Motipur under NAIP (Component III)
25th Oct., 2013
Animal health camp at Sheohar under NAIP (Component III)
30th Jan. 2014
Animal health camp at Belsand, Muzaffarpur, under NAIP (Component III)
30th Jan. 2014
Exposure visit of farmers under nICRA project to Pusa Krishi Vigyan Mela at IARI, new Delhi
A visit of group of twenty farmers of adopted village Kukurha of NICRA Project was made in Pusa Krishi Vigyan Mela at IARI, New Delhi to create awareness and exposure towards various modern innovative technologies, research high-lights, and frontline demonstration on new variety of field and vegetable crops, hi-tech vegetable cultivation, water management techniques, latest
farm machinery and quality seed production and farmer-scientist interaction.
Training Programmes ConductedThe details of training programmes conducted
are depicted below:Table 93. Training programme conducted by Institute
HQs, Patna
Title of the training programme Sponsored by No. of Participants
Soil Conservation and Integrated Watershed Management
BAMETI 43
Soil and Water Conservation Department of Environment and Forest, Govt. of Bihar
26
Watershed Management through Soil and Water Conservation
Department of Environment and Forest, Govt. of Bihar
25
DPR Preparation under IWMP Directorate of Soil Conser-vation (BWDS), Govt. of Bihar
30
Training Programme on DPR Preparation under IWMP
Directorate of Soil Conser-vation (BWDS), Govt. of Bihar
30
Characterization of Rice (Oryza sativa L.) Genotypes for abiotic stress tolerance for the students of VMKVEC, Salem, T.N.
VMKVEC, Salem, T.N. 03
Makhana cultivation Govt. of Bihar 28Gender perspective in IFS (National level)
DAC, Govt. of India 25
Integrated goat farming NABARD 45Integrated fish farming NABARD 25Field survey and electronic compilation of data for project staff of Bihar, Jharkhand and Odisha at ICAR-RCER, Patna
ICRISAT, Hyderabad 25
Table 94. Training programme conducted by Regional Research Centre, Ranchi
Topic Sponsored by No. of Participants
Improved production technique in vegetable cultivation
ATMA, Lohardaga 24
Udyan Mitra Training (total 10 num-bers)
Directorate of Horticulture, Govt. of Jharkhand
184
Establishment of Bari ATMA, Purnea(Bihar) 20
Plant Propagation ATMA, Purnea(Bihar) 24
Fruit based multitier cropping system ATMA, Purnea(Bihar 25
Fruit based multitier cropping system ATMA, Lohardaga 25
Cultivation of pointed gourd Atma,Pakur 21
Improved production technique in fruits &vegetable cultivation
Central Coalfield limited, Ranchi
27
Phase 2 of Udyan Mitra Training (total 10 numbers)
Directorate of Horticulture, Govt. of Jharkhand
176
Phase 3 of Udyan Mitra Training (total 10 numbers)
Directorate of Horticulture, Govt. of Jharkhand
206

Transfer of Technology 85 ICAR-RCER n Annual Report 2013-14
Topic Sponsored by No. of Participants
Off-season cultivation of vegetables ATMA, Bokaro 19
Micro irrigation in vegetable crops ATMA, Bokaro 28
Nursery management in horticultural crops
ATMA, Bokaro 29
Mushroom cultivation ATMA, Bokaro 33
Improved practices of vegetable cul-tivation
ATMA, Giridih 16
Seed production in vegetable crops ATMA, Deoghar 27
Off-season cultivation of vegetables ATMA, Jamtara 22
Improved practices of vegetable cul-tivation
ATMA, Purnea 23
Production, processing, storage and statury requirement in marketing of vegetable seeds
ATMA, Lohardaga 20
Vegetable cultivation ATMA, Sitamarhi 24
Multitier cropping system in hor ti-culture
ATMA, Lohardaga 20
Mushroom cultivation ATMA, Lohardaga 25
Cultivation of seasonal and off-season al vegetables
ATMA, Lohardaga 25
Integrated nutrient management in vegetable crops
ATMA, Loherdaga 22
Integrated insect pest and disease management in horticulture crops
ATMA, Loherdaga 15
Total 1080
Table 95. Training Programmes for Rural Youth at KVK, Buxar
Topic Total
Poultry production 10
Goat production ( 2 numbers) 28
Bee keeping : A source of income generation 10
Table 96. Off-campus training programmes conducted at KVK, Buxar
Topic TotalPod borer and pod fly damage in arhar and their control measure 20Microbial pesticide and their use in plant protection 20IPM in mango leaf hopper & mealy bug 20Identification and utilization of bio-control agent in rabi season (rai, mustard, cabbage, cauliflower, lentil, gram etc.)
20
Collection and utilization of neem seeds in plant protection 20
Seed borne diseases of cereals and pulses and their management
20
Insects and disease management in wheat 20
Storage pest of cereals and their control measure 20
Management of insect pest by cultural practices in summer season 20
Management of diseases and insects through soil solarization in nursery 21
Insect pest and disease management in jowar and bajra 20
Integrated pest management in rice nursery 20
Damage caused by plant hopper in rice and their management 22
Termite damage and their control measure 20
Insect and disease management in oil seed crop 33
Topic TotalInsect and disease management in mentha 20
Importance of seed treatment in cereals and pulses crop 21
Microbial pesticide and their use in plant protection 31
Integrated insect pest management in rabi vegetables (cabbage, cauliflower, pea, brinjal, tomato)
26
Conservation of natural enemies in rice ecosystem biocontrol of pest 22
Damage caused by aphid in mustard, lentil & their control measure
24
Early and late blight disease of tomato and potato and their management
20
Nursery management of paddy 20
Seed production of paddy 20
Seed production of maize 20
Seed production techniques of pigeon pea 20
Quality seed production of okra 20
Quality seed production of paddy 20
Quality seed production of chickpea 23
Seed production techniques of lentil 22
Seed production techniques of potato 25
Seed production techniques of mustard 21
Seed production of tomato 20
Seed production of pigeon pea 20
Manure & fertilizer management in japani pudina 26
INM in onion 23
Foliar application of micronutrient in mango 23
Manure and fertilizer management in cucurbits 21
Manure and fertilizer management in sugarcane 22
Crop residue management for increasing soil fertility 31
Water management in summer vegetable 20
Method of in-situ rain water management & its importance 20Rasing bund height around the rice field 20Method of bunding & its importance 24Method of soil and water sample collection 20Integrated nutrient management in rice 22Inoculation of rhizobium culture in kharif pulses (pigeon pea) 21Method of rhizobium culture inoculation and sulpher in rabi pulses 21Method of INM in cauliflower 20INM in potato 32Nitrogen management in paddy by leaf color chart (LCC) 23Fertilzer management in pearl millet 23Scientific cultivation of cucumber 20Layout and management of orchard 20Scientific cultivation of cucumber 20Scientific management of guava orchard 21Production technology of elephant foot yam 21Layout and management of fruits garden 20Production technology of garden pea 25Production technology of year round cultivation of radish/tomato 20Production technology of cauliflower, cabbage and broccoli (cole crops) 20Integrated nutrient management in maize 20Integrated crop management in rajmash 20Nutrient management in sunflower 20Seed production techniques of green gram 20Improved management techniques for rice nursery production 20
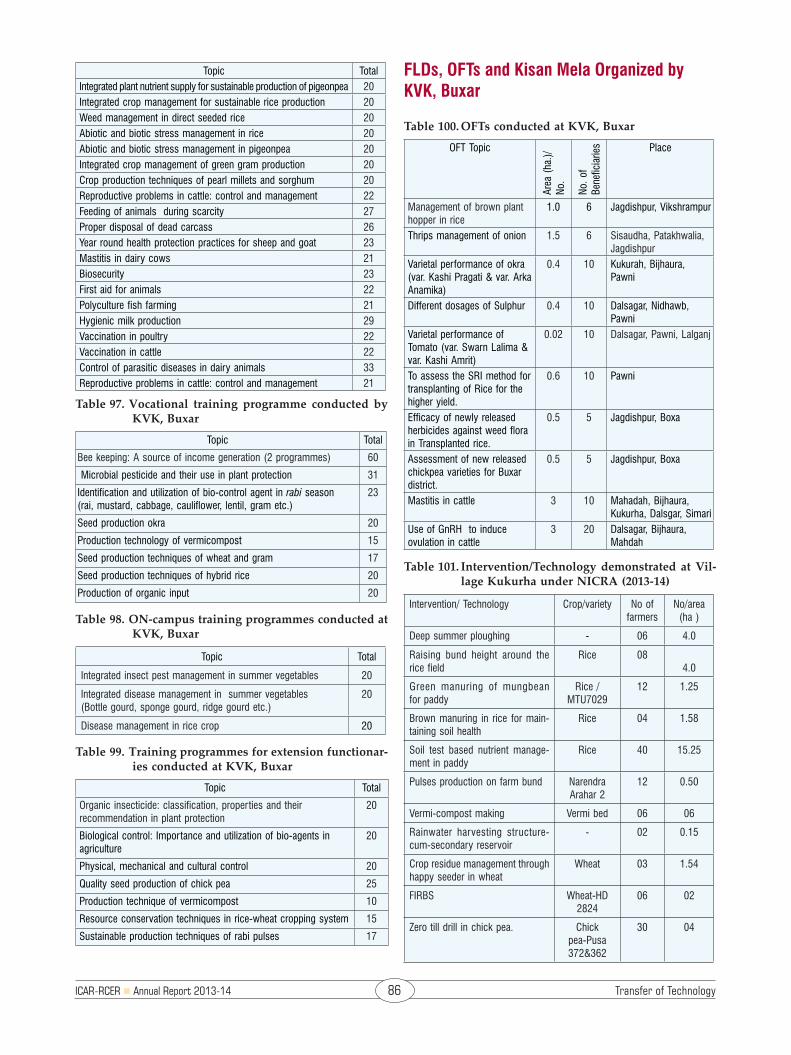
ICAR-RCER n Annual Report 2013-14 86 Transfer of Technology
Topic TotalIntegrated plant nutrient supply for sustainable production of pigeonpea 20Integrated crop management for sustainable rice production 20Weed management in direct seeded rice 20Abiotic and biotic stress management in rice 20Abiotic and biotic stress management in pigeonpea 20Integrated crop management of green gram production 20Crop production techniques of pearl millets and sorghum 20Reproductive problems in cattle: control and management 22Feeding of animals during scarcity 27Proper disposal of dead carcass 26Year round health protection practices for sheep and goat 23Mastitis in dairy cows 21Biosecurity 23First aid for animals 22Polyculture fish farming 21Hygienic milk production 29Vaccination in poultry 22Vaccination in cattle 22Control of parasitic diseases in dairy animals 33Reproductive problems in cattle: control and management 21
Table 97. Vocational training programme conducted by KVK, Buxar
Topic Total
Bee keeping: A source of income generation (2 programmes) 60
Microbial pesticide and their use in plant protection 31
Identification and utilization of bio-control agent in rabi season (rai, mustard, cabbage, cauliflower, lentil, gram etc.)
23
Seed production okra 20
Production technology of vermicompost 15
Seed production techniques of wheat and gram 17
Seed production techniques of hybrid rice 20
Production of organic input 20
Table 98. ON-campus training programmes conducted at KVK, Buxar
Topic Total
Integrated insect pest management in summer vegetables 20
Integrated disease management in summer vegetables (Bottle gourd, sponge gourd, ridge gourd etc.)
20
Disease management in rice crop 20
Table 99. Training programmes for extension functionar-ies conducted at KVK, Buxar
Topic Total
Organic insecticide: classification, properties and their recommendation in plant protection
20
Biological control: Importance and utilization of bio-agents in agriculture
20
Physical, mechanical and cultural control 20
Quality seed production of chick pea 25
Production technique of vermicompost 10
Resource conservation techniques in rice-wheat cropping system 15
Sustainable production techniques of rabi pulses 17
FLDs, OFTs and Kisan Mela Organized by KVK, Buxar
Table 100. OFTs conducted at KVK, Buxar
OFT Topic
Area
(ha
.)/No
.
No. o
f Be
nefic
iarie
s Place
Management of brown plant hopper in rice
1.0 6 Jagdishpur, Vikshrampur
Thrips management of onion 1.5 6 Sisaudha, Patakhwalia, Jagdishpur
Varietal performance of okra (var. Kashi Pragati & var. Arka Anamika)
0.4 10 Kukurah, Bijhaura, Pawni
Different dosages of Sulphur 0.4 10 Dalsagar, Nidhawb, Pawni
Varietal performance of Tomato (var. Swarn Lalima & var. Kashi Amrit)
0.02 10 Dalsagar, Pawni, Lalganj
To assess the SRI method for transplanting of Rice for the higher yield.
0.6 10 Pawni
Efficacy of newly released herbicides against weed flora in Transplanted rice.
0.5 5 Jagdishpur, Boxa
Assessment of new released chickpea varieties for Buxar district.
0.5 5 Jagdishpur, Boxa
Mastitis in cattle 3 10 Mahadah, Bijhaura, Kukurha, Dalsgar, Simari
Use of GnRH to induce ovulation in cattle
3 20 Dalsagar, Bijhaura, Mahdah
Table 101. Intervention/Technology demonstrated at Vil-lage Kukurha under NICRA (2013-14)
Intervention/ Technology Crop/variety No of farmers
No/area (ha )
Deep summer ploughing - 06 4.0
Raising bund height around the rice field
Rice 08 4.0
Green manuring of mungbean for paddy
Rice / MTU7029
12 1.25
Brown manuring in rice for main-taining soil health
Rice 04 1.58
Soil test based nutrient manage-ment in paddy
Rice 40 15.25
Pulses production on farm bund Narendra Arahar 2
12 0.50
Vermi-compost making Vermi bed 06 06
Rainwater harvesting structure-cum-secondary reservoir
- 02 0.15
Crop residue management through happy seeder in wheat
Wheat 03 1.54
FIRBS Wheat-HD 2824
06 02
Zero till drill in chick pea. Chick pea-Pusa 372&362
30 04

Transfer of Technology 87 ICAR-RCER n Annual Report 2013-14
Intervention/ Technology Crop/variety No of farmers
No/area (ha )
Demonstration of mid-duration var Rajendra Sweta of paddy
Rice/ Rajendra
Sweta
08 3.25
Demonstration of drought tolerant var Naveen of paddy
Rice/Naveen 16 6.60
Advance planting of rabi crop. timely sowing & harvesting date 09.11.2013 & 30.03.2014
PBW 502 04 2.5
Raised community nursery Paddy (750 m²)
RajendraSweta, PRH
10
10 2.61
Demonstration of zero till drill in wheat
Equipment 17 11.87
IPM in chickpea Pheromone trap loaded
with lure
04 01
High yielding var. Paddy Pusa-44
03 01
Heat tolerant variety Wheat-WR 544
04 1.75
Demonstration of short duration vegetable as contingent crop
Vegetable pea var.
Kashi uday
20 02
Heat tolerant wheat var. WR544 04 1.75
Demonstration of drumstick for nutritional security
175 300 plant
Demonstration of MP Chari for green fodder production
MP Chari 18 02
Deworming of ruminant and small ruminant animal
Animal 51 205 (animal)
Animal health checkup Animal 50 255 (animal)
Vaccination (HS& BQ) Animal 51 205 (animal)
Quality fodder production Oat varietyJHO-822
38 04
Rural backyard poultry production Kuroiler day old chicks
39 378
Fodder production MP chari 29 2.90
Fish farming Policulture 04 0.60
Custom hiring from timely opera-tion
MB Plough 08 04
Raising community nursery in different interval
Rice/Naveen, Rajendra
Sweta
750m² 08
Community irrigation from com-munity rain water structure
Paddy 58 40
Agro-advisory services Paddy, wheat & lentil
175
NICRA, awareness companion A forestation 46 02
In-situ moisture conservation - 52 01
Crop residue management for improving soil health
T &V 29 01
Cultivation of vegetable pea 25 01
Intervention/ Technology Crop/variety No of farmers
No/area (ha )
Year round cultivation of radish 20 01
Quality seed production of radish 20 01
Application of sulphur and rhizo-bium culture in rabi pulses
21 01
Methode of INM in cauliflower 20 01
IPM in cucurbits 20 01
Degnalla disease in cattle 21 01
Production technology of vermi compost
34 01
Exposure visit of DSR field area DSR 33 01
Exposure visit of showcasing of innovative Agril. Tech. at ICAR-RCER, Patna
Innovative agril tech.
40 01
Agro-advisory services Paddy,wheat, pulses, and
livestock production
373 ----
World earth day (22.04.14) NRM 51 01
Word environment day (05.06.13) Global Warming
100
Table 102. FLDs conducted at KVK, Buxar
Demonstration
Area
(h
a.)/
No.
No. o
f ben
-ef
icia
ries
Village covered
Rice (var. Rajendra Shweta)
2.0 10 Dullahpur, Mahdah, ataon, Bharchakia, Nandan
Pigeon pea (var. Naren-dra arhar-2)
5.0 24 Pawni, Dhakaich, Dullahpur, Sondhila
Peral millet 2.0 07 Pawni, Nidhuaa, Dhullahpur, Chanda, Phuli
Pheromone trap in chick pea
10.0 40 Kukudha, Vikshrampur, Ataon, Boxa, Pawni
Biopesticide in chickpea and lentil
5.0 30 Ataon, Simri, Boxa, Pawni, Kamarpur, Ktharkhurd, Dhakaich, Kukudha, Milki, Govindpur
Okra (var. Pusa A-4) 1.0 10 Kukurah, BijhauraOkra (var. Kashi Pragati) 0.5 10 Pawani, Kanpura, BijhauraOkra (var. Kashi Kranti) 0.5 07 Pawani, Kanpura, BijhauraVegetable pea (var. Kashi Uday)
2.0 21 Kukurah, Pawani
Onion (var. Pusa Red/Arka Niketan)
1.0 15 Dalsagar, Pawni, Nidhawan
Tomato (var. Swarn Lalima)
0.01 03 Dalsagar, Kukurah
Pigeon pea (var. Naren-dra Arhar-2)
1.0 4 Nagpura, Balihar, Dumari
Mustard (var. NDR 8501)
3.0 11 Pavni, Khairahati, Manikpur, Sardahpur, Surodha, Vikarm English, Pandey patti, Basudhar, Simari,
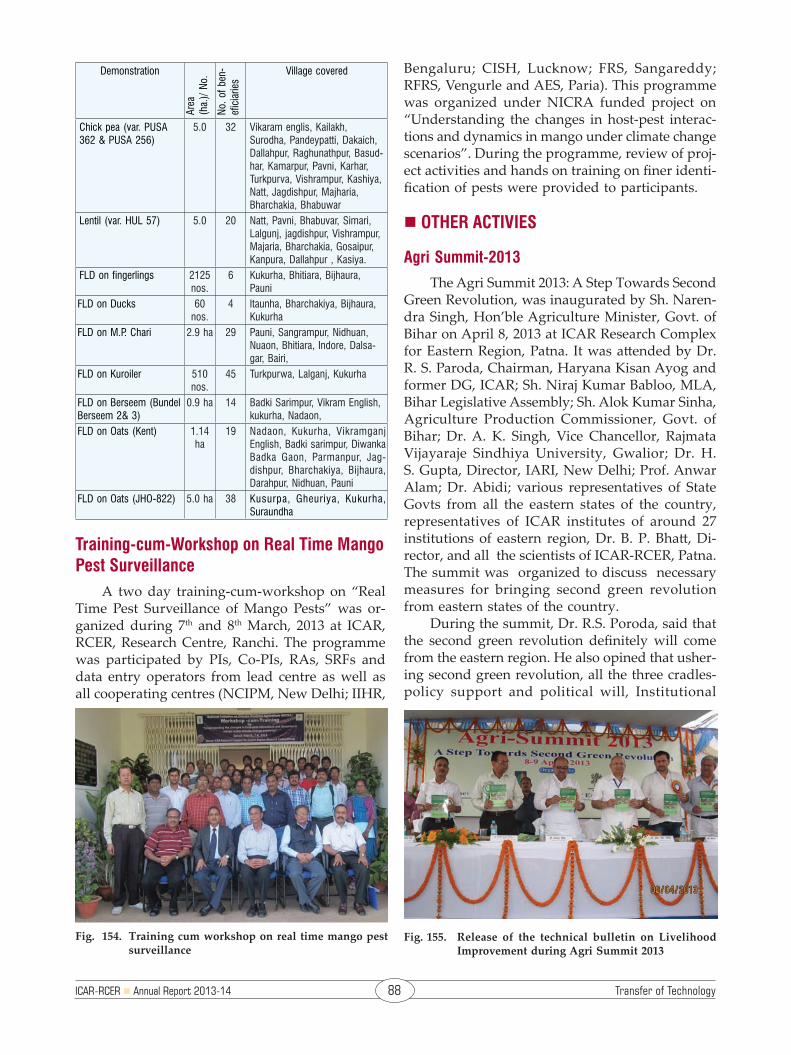
ICAR-RCER n Annual Report 2013-14 88 Transfer of Technology
Demonstration
Area
(h
a.)/
No.
No. o
f ben
-ef
icia
ries
Village covered
Chick pea (var. PUSA 362 & PUSA 256)
5.0 32 Vikaram englis, Kailakh, Surodha, Pandeypatti, Dakaich, Dallahpur, Raghunathpur, Basud-har, Kamarpur, Pavni, Karhar, Turkpurva, Vishrampur, Kashiya, Natt, Jagdishpur, Majharia, Bharchakia, Bhabuwar
Lentil (var. HUL 57) 5.0 20 Natt, Pavni, Bhabuvar, Simari, Lalgunj, jagdishpur, Vishrampur, Majaria, Bharchakia, Gosaipur, Kanpura, Dallahpur , Kasiya.
FLD on fingerlings 2125 nos.
6 Kukurha, Bhitiara, Bijhaura, Pauni
FLD on Ducks 60 nos.
4 Itaunha, Bharchakiya, Bijhaura, Kukurha
FLD on M.P. Chari 2.9 ha 29 Pauni, Sangrampur, Nidhuan, Nuaon, Bhitiara, Indore, Dalsa-gar, Bairi,
FLD on Kuroiler 510 nos.
45 Turkpurwa, Lalganj, Kukurha
FLD on Berseem (Bundel Berseem 2& 3)
0.9 ha 14 Badki Sarimpur, Vikram English, kukurha, Nadaon,
FLD on Oats (Kent) 1.14 ha
19 Nadaon, Kukurha, Vikramganj English, Badki sarimpur, Diwanka Badka Gaon, Parmanpur, Jag-dishpur, Bharchakiya, Bijhaura, Darahpur, Nidhuan, Pauni
FLD on Oats (JHO-822) 5.0 ha 38 Kusurpa, Gheuriya, Kukurha, Suraundha
Training-cum-Workshop on Real Time Mango Pest Surveillance
A two day training-cum-workshop on “Real Time Pest Surveillance of Mango Pests” was or-ganized during 7th and 8th March, 2013 at ICAR, RCER, Research Centre, Ranchi. The programme was participated by PIs, Co-PIs, RAs, SRFs and data entry operators from lead centre as well as all cooperating centres (NCIPM, New Delhi; IIHR,
Bengaluru; CISH, Lucknow; FRS, Sangareddy; RFRS, Vengurle and AES, Paria). This programme was organized under NICRA funded project on “Understanding the changes in host-pest interac-tions and dynamics in mango under climate change scenarios”. During the programme, review of proj-ect activities and hands on training on finer identi-fication of pests were provided to participants.
n OTHER ACTIVIES
Agri Summit-2013
The Agri Summit 2013: A Step Towards Second Green Revolution, was inaugurated by Sh. Naren-dra Singh, Hon’ble Agriculture Minister, Govt. of Bihar on April 8, 2013 at ICAR Research Complex for Eastern Region, Patna. It was attended by Dr. R. S. Paroda, Chairman, Haryana Kisan Ayog and former DG, ICAR; Sh. Niraj Kumar Babloo, MLA, Bihar Legislative Assembly; Sh. Alok Kumar Sinha, Agriculture Production Commissioner, Govt. of Bihar; Dr. A. K. Singh, Vice Chancellor, Rajmata Vijayaraje Sindhiya University, Gwalior; Dr. H. S. Gupta, Director, IARI, New Delhi; Prof. Anwar Alam; Dr. Abidi; various representatives of State Govts from all the eastern states of the country, representatives of ICAR institutes of around 27 institutions of eastern region, Dr. B. P. Bhatt, Di-rector, and all the scientists of ICAR-RCER, Patna. The summit was organized to discuss necessary measures for bringing second green revolution from eastern states of the country.
During the summit, Dr. R.S. Poroda, said that the second green revolution definitely will come from the eastern region. He also opined that usher-ing second green revolution, all the three cradles-policy support and political will, Institutional
Fig. 154. Training cum workshop on real time mango pest surveillance
Fig. 155. Release of the technical bulletin on Livelihood Improvement during Agri Summit 2013

Transfer of Technology 89 ICAR-RCER n Annual Report 2013-14
to work for the betterment of small and marginal farmers in respect of food security, profitability and sustainability. He asked the scientists to join hands with the state department in dissemination of technologies developed by the institutes.
Farmers’ Fair cum Training Programme on Makhana Cultivation
Shri Tariq Anwar, Hon’ble Union Minister of State for Agriculture and Food Processing Indus-tries inaugurated farmers training programme on “Improve cultivation techniques in Makhana” at ICAR Research Complex for Eastern Region, Makhana Research Centre, Darbhanga on 16th Sep-tember, 2013. Seven makhana growing progressive farmers from Darbhanga, Madhubani and Katihar districts were also felicitated on this occasion. Around 1250 farmers, representatives from SBI, NABARD, KVKs, NGOs participated in the train-ing programme.
support for developing capable human resources and new innovation/technology are required to be strengthened. He stressed on reorientation in agriculture from cropping system mode to farm-ing system mode and diversification in agriculture for increasing per unit productivity. Dr. Paroda also said that hybrid maize, micro irrigation and protected cultivation will play an important role in bringing 2nd green revolution in eastern region states.
Visit of the US Ambassador at CSISA Experimental Farm
The US Ambassador to India, Nancy J. Powell visited the project experimental site of the Cereal Systems Initiative for South Asia (CSISA) on 13th May, 2013 and interacted with scientists from CSISA and ICAR, Subject Matter Specialists (SMS) of State Agriculture Department, Govt. of Bihar, women farmers of Muzaffarpur and Samastipur districts and service providers from Bhojpur and Buxar districts of Bihar. During interaction with various stakeholders, she tried to get feedback on Conservation Agricultural (CA) being adopted by the farmers. Demonstrations on laser land leveling, unpuddled rice transplanting through machine and direct seeding of green gram through zero tillage in wheat residue were also demonstrated in pres-ence of august gathering.
Fig. 157. Dr. A. K. Sikka DDG (NRM), apprising ICAR initiatives in eastern states
Fig. 158. Farmers Fair cum Training Programme on Makha-na Cultivation
Fig. 156. Interaction with women farmers during the visit of the US Ambassador
Review Meeting of ICAR Institutes and Regional Centres of Bihar
Shri Tariq Anwar, Hon’ble Union Minister of State for Agriculture and Food Processing In-dustries, Govt. of India reviewed the activities of ICAR Institutes and Centres located in Bihar on 3rd August, 2013. Hon’ble Minsiter urged the scientists
Felicitation of Innovative Farmers of Eastern States
Farmers Innovation Day was organized on 5th October, 2013 by the institute, which was attended

ICAR-RCER n Annual Report 2013-14 90 Transfer of Technology
by the farmers of Jharkhand, Bihar, West Bengal, Odisha and Chhattisgarh.
Dr. Mangala Rai, Agriculture Advisor to Chief Minister of Bihar and former DG, ICAR graced this occasion as Chief Guest and felicitated 21 pro-gressive farmers of various eastern states for their innovative work in the field of crop, horticulture, animal husbandry, fishery, integrated farming and natural resource management.
Showcasing of Agricultural Technologies from Seven states of the Eastern India
Showcasing of “Agricultural Technologies 2013” was inaugurated by Dr. Mangala Rai, Agri-cultural Advisor to Chief Minister, Govt. of Bihar at ICAR Research Complex for Eastern Region, Patna, on 6th December 2014. The two-day programme (6-7th December, 2013) was jointly organized by the institute and Directorate of Knowledge Manage-ment in Agriculture (DKMA), ICAR, New Delhi. On the occasion, 70 farmers and agri-entrepreneurs from the eastern states were felicitated for their significant contribution in the field of agriculture and allied sector.
During the showcasing event, Assam Agricultural University, Jorhat; Bihar Agricultural University, Sabour; BIAF, Bihar; Cereal Systems Initiatives for South Asia; KVKs of Ambala, Patiala and Ludhiana; and seventeen ICAR institutes and their centres (NIRJAFT, Kolkata, DWM,
Bhubaneswar, DRWA, Bhubaneswar; CPRS, Patna, CIBA, Kakdwip, CNRG, Mathura; IARI Regional Centre, Pusa, CHES, Bhubaneswar; NDRI Eastern regional centre, Kalyani; CRIJAF, Barracpore; IVRI Regional Centre, West Bengal; CIFRI, Barracpore; DSR, Mau; IIVR, Varanasi; NIRG, Ranchi; DKMA, New Delhi and ICAR RCER, Patna participated and showcased their activities, latest technologies and products. More than one thousand farmers, farmwomen, entrepreneurs, extension workers, development functionaries from different parts of eastern region participated and shared their rich experiences during the function.
Fig. 159. Inauguration of Farmers Innovation Day and fe-licitation of the progressive farmers.
Fig. 160. Inauguration of programme and felicitation of a farmwoman by Dr. Mangala Rai during the tech-nology showcasing
Fig. 161. Demonstration of Makhana seed grading ma-chine

Transfer of Technology 91 ICAR-RCER n Annual Report 2013-14
Agricultural Education Day
Agricultural Education Day was celebrated on 10th December, 2013 in which 80 students from different schools of Patna participated. The pro-gramme consisted of field and laboratory visits, interaction with scientists followed by lecture on Importance of Agricultural Education in India. A documentary film on activities and achievements of the institute was also shown to the students. A debate on the topic “Agriculture is the main stay of Indian Economy” was organised in which a fairly good number of students from various schools par-ticipated. In addition to this a quiz completion on general topic was also organised among the schools as team events. The winners of the competitions were awarded with prizes.
Farmers’ Fair-cum-Farmers-Scientists Interac-tion Organized at Katihar
Shri Tariq Anwar, Union Minister of State for Agriculture and food processing industries inau-gurated 2-day Farmers’ fair-cum-farmers-scientist interaction meet at Katihar on 25th December, 2013. Sri Anwar insisted scientists for speedy dissemina-tion of the latest farmers’ friendly technologies to the stakeholders so as to increase the production and income.
Fig. 162. Inauguration and address by chief guest
Fig. 163. Inauguration of book and felicitation of the staff by Padmabhushan Shri Chandi Prasad Bhatt Ji
Fig. 164. Agricultural Education Day
14th Foundation Day of ICAR Research Com-plex for Eastern Region, Patna
The 14th Foundation Day was celebrated on 22nd Feb., 2014 at ICAR Research Complex for East-ern Region (ICAR RCER), Patna. Padmabhushan Shri Chandi Prasad Bhatt, a noted environmental-ist, social activists and Magsaysay Award Winner graced this occasion as Chief Guest. During the Foundation Day Lecture, he shared his experience about Chipko Movement and his journey from the Himalayas to the Gangetic basin. He cautioned the scientists about the possible impact of climate change and deforestation on agriculture in the Gangetic basin. He felt the need of establishing Glacier Monitoring Agency in the country.

ICAR-RCER n Annual Report 2013-14 92 Transfer of Technology
Celebration of World Environment Day
World environment day was celebrated on 5th June 2013 at Kukurha village under NICRA project in the presence of more than 100 farmers to create awareness on role of changing climate and their impact on crop growth, yield potential, diseases and insect pest, and livestock.
ICAR-Industry Meet
The institute organized ICAR Industry Meet at its Research Centre, Ranchi on 16th November, 2013. The meet was organized in collaboration with Indian Institute of Natural Resins and Gums (IINRG), Ranchi; Birsa Agricultural University (BAU), Ranchi and Zonal Technology Management Unit, Kolkata.
The technologies regarding low energy water application, Instant Swarna Mushroom Soup Mix and Elite line of capsicum HACAV 271 were also displayed in the exhibition. Improved varieties of different crops developed by ICAR-RCER viz., Swarna Vaidehi in makhana, Swarna Anmol in tomato, Swarna Prafulya in chili, Swarna Atulya in capsicum, Swarna Sneha in bottle gourd, Swarna Yamini in bitter gourd were also released by the Institute Variety Release Committee of ICAR RCER. Swarna Vaidehi is the first variety of makhana to be released in the country.
Visit of Dr. K. Kasturirangan, Member, Planning Commission, Govt. of India
Padma Vibhushan, Dr. K. Kasturirangan visited ICAR-RCER, RC, Ranchi on 3rd May 2013 and discussed about the technology developed at ICAR-RCER, RC, Ranchi.
Workshops, Seminars, Symposium, Meetings, Farmer’s Day Organized
n Farmers’ awareness programme on ‘Livelihood promotion through value addition’ was con-ducted at ICAR-RCER, Research Centre Ranchi in association with Krishi Vikash Kendra, Na-landa (Bihar) during March 2013. Around 80 farmers participated in the programme and got acquainted with the importance of post harvest management and value addition of horticulture and forest produce.
n Summer school on “Horticulture based di-versification options for livelihood security in tribal areas” was organized by Dr. A.K. Singh, Principal Scientist, ICAR RCER Research Centre, Ranchi for 21 days on at ICAR RCER Research Centre, Ranchi from 21st May to 10th June, 2013.
n Seminar was organized on “Baudhik Sampada Ke Adhikar” on 12th Sept, 2013 at, ICAR RCER Research Centre, Ranchi.
n IVRC meeting was held on 14th Nov., 2013 at ICAR RCER Research Centre, Ranchi, where proposals and release of seven varieties were presented and submitted.
n Project Advisory Committee meeting for VDSA project organized on 9th July, 2013.
Fig. 165. Visit of Padmavibhushan Dr. K. Kasturiranjan
Fig. 166. Summer School on “Horticulture based diversifica-tion options for livelihood security in tribal Areas at ICAR RCER, Research Centre, Ranchi
Exposure Visits
n To Central Rice Research Institute, Cuttack, from 31.08.2013 to 06.09.2013 in which 40 farm-ers (20 each from Durgapur and Dumariya villages) participated.
n To Indian Institute of Vegetable Research, Vara-nasi, from 10.08.2013 to 17.08.2013 in which 40 farmers (20 each from Inai and Susari villages) participated.
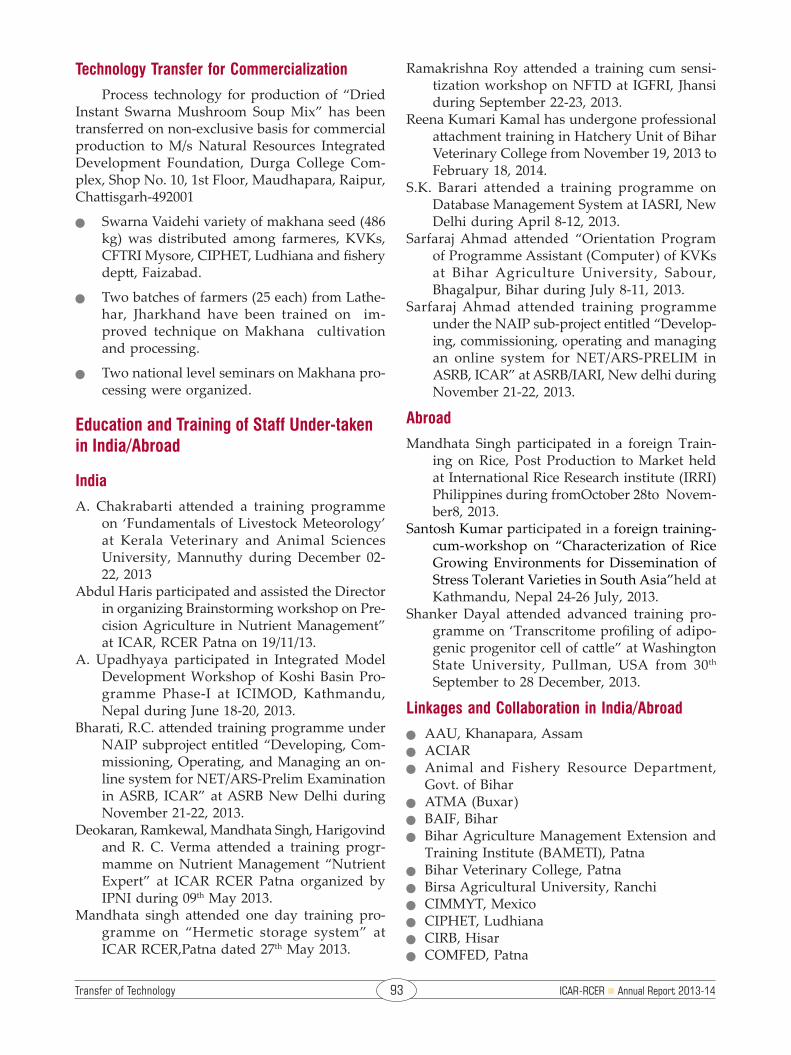
Transfer of Technology 93 ICAR-RCER n Annual Report 2013-14
Technology Transfer for Commercialization
Process technology for production of “Dried Instant Swarna Mushroom Soup Mix” has been transferred on non-exclusive basis for commercial production to M/s Natural Resources Integrated Development Foundation, Durga College Com-plex, Shop No. 10, 1st Floor, Maudhapara, Raipur, Chattisgarh-492001
n Swarna Vaidehi variety of makhana seed (486 kg) was distributed among farmeres, KVKs, CFTRI Mysore, CIPHET, Ludhiana and fishery deptt, Faizabad.
n Two batches of farmers (25 each) from Lathe-har, Jharkhand have been trained on im-proved technique on Makhana cultivation and processing.
n Two national level seminars on Makhana pro-cessing were organized.
Education and Training of Staff Under-taken in India/Abroad
India
A. Chakrabarti attended a training programme on ‘Fundamentals of Livestock Meteorology’ at Kerala Veterinary and Animal Sciences University, Mannuthy during December 02-22, 2013
Abdul Haris participated and assisted the Director in organizing Brainstorming workshop on Pre-cision Agriculture in Nutrient Management” at ICAR, RCER Patna on 19/11/13.
A. Upadhyaya participated in Integrated Model Development Workshop of Koshi Basin Pro-gramme Phase-I at ICIMOD, Kathmandu, Nepal during June 18-20, 2013.
Bharati, R.C. attended training programme under NAIP subproject entitled “Developing, Com-missioning, Operating, and Managing an on-line system for NET/ARS-Prelim Examination in ASRB, ICAR” at ASRB New Delhi during November 21-22, 2013.
Deokaran, Ramkewal, Mandhata Singh, Harigovind and R. C. Verma attended a training progr-mamme on Nutrient Management “Nutrient Expert” at ICAR RCER Patna organized by IPNI during 09th May 2013.
Mandhata singh attended one day training pro-gramme on “Hermetic storage system” at ICAR RCER,Patna dated 27th May 2013.
Ramakrishna Roy attended a training cum sensi-tization workshop on NFTD at IGFRI, Jhansi during September 22-23, 2013.
Reena Kumari Kamal has undergone professional attachment training in Hatchery Unit of Bihar Veterinary College from November 19, 2013 to February 18, 2014.
S.K. Barari attended a training programme on Database Management System at IASRI, New Delhi during April 8-12, 2013.
Sarfaraj Ahmad attended “Orientation Program of Programme Assistant (Computer) of KVKs at Bihar Agriculture University, Sabour, Bhagalpur, Bihar during July 8-11, 2013.
Sarfaraj Ahmad attended training programme under the NAIP sub-project entitled “Develop-ing, commissioning, operating and managing an online system for NET/ARS-PRELIM in ASRB, ICAR” at ASRB/IARI, New delhi during November 21-22, 2013.
Abroad
Mandhata Singh participated in a foreign Train-ing on Rice, Post Production to Market held at International Rice Research institute (IRRI) Philippines during fromOctober 28to Novem-ber8, 2013.
Santosh Kumar participated in a foreign training-cum-workshop on “Characterization of Rice Growing Environments for Dissemination of Stress Tolerant Varieties in South Asia”held at Kathmandu, Nepal 24-26 July, 2013.
Shanker Dayal attended advanced training pro-gramme on ‘Transcritome profiling of adipo-genic progenitor cell of cattle” at Washington State University, Pullman, USA from 30th September to 28 December, 2013.
Linkages and Collaboration in India/Abroad
n AAU, Khanapara, Assamn ACIAR n Animal and Fishery Resource Department,
Govt. of Biharn ATMA (Buxar)n BAIF, Biharn Bihar Agriculture Management Extension and
Training Institute (BAMETI), Patnan Bihar Veterinary College, Patnan Birsa Agricultural University, Ranchin CIMMYT, Mexicon CIPHET, Ludhianan CIRB, Hisarn COMFED, Patna

ICAR-RCER n Annual Report 2013-14 94 Transfer of Technology
n CRRI, Cuttackn Department of Agriculture (Govt. of Bihar)n Department of Biotechnology, Govt. of Indian Department of Horticulture (Govt. of Bihar)n District level programme management group
on Nutri farmn DRR, Hyderabad n IARI New Delhin IARI Regional Research Station Pusa Samas-
tipurn IFFCO, Buxarn IGFRI, Jhansin IRRI, Philippinesn IVRI, Izatnagar and Kolkatan Jay Prabha Mandal buxar (NGO)n KVK, Darbhangan KVK, Katiharn KVK, Purnean KVK, Saharsan KVK, Supauln Ministry of Water Resources, Govt. of Indian NABARD, Darbhangan NABARD, Madhubanin NGO, Dhamthari, Chhatisgarhn NRC on Pig, Guwahatin R.K. Sevashram, Bhadrak, Odishan Rajendra Agricultural University, Pusa, Samas-
tipur, Biharn UBKV, Coochbehar, West Bengaln Water Resources Department, Govt. of
Jharkhand
Participation in Conference/ Seminar/ Workshops/ Symposia/ MeetingsBhavana, P. attended “ICAR Industry Meet 2013”
organised by ICAR RCER & IINRG at ICAR RCER Research Centre, Ranchi on Nov.16, 2013.
Bhavana, P. attended Hindi workshop on “Intellec-tual Property Rights” at ICAR RCER Research Centre, Ranchi on 12th Sept., 2013.
Bhavana, P. attended National Symposium on “Abiotic and Biotic Stress Management in Vegetable Crops” at IIVR, Varanasi during April 12-14, 2013.
Bhavana, P. attended Sensitization Workshop for ERP Solution and Data Templates under NAIP sub project “Implementation of MIS including FMS in ICAR” organized by IASRI, CRIJAF & IINRG at IINRG, Ranchi on 31st October, 2013.
Bhavana, P. attended Summer School on “Hor-ticulture Based Diversification options for Livelihood Security in Tribal Areas” at ICAR RCER Research Centre, Ranchi from 21st May -10th June, 2013.
Bhavana, P. attended workshop on “Sophisticated Analytical Instruments” at IINRG, Ranchi from 18-23 February, 2013.
Chakrabarti, A. attended National Workshop on “Need and nature of Basic / Strategic Research in Agriculture” at NIRJAFT, Kolkata during 23-24th August, 2013.
Choudhary, J.S. attended winter school on NAIP-NABG Subject Training on “Bioinformatics: in vitro to in silico Approaches in Entomology” at NBAII, Bengaluru from 18-30 November, 2013.
Das, Bikash attended “BRICS Climate Change Seminar on Agriculture” held at Moulderdrift, South Africa during 23rd - 25th October, 2013.
Dayal, Shanker attended Xth National Symposium on “Integrated Development of Vast Biodiver-sity of Indigenous Livestock for Long Term Rural Livelihood Security” held at GBPUAT, Pantnagar from 7-8 February, 2013.
Deokaran participated in National Seminar on “Sustaining Soil Health in Ensuring Food Security” organized by Fertilizer Association of India, Eastern Zone, Kolkata at NIRJAFT, Kolkata from 21-22 November, 2013.
Deokaran participated in Review Workshop of NICRA Project organized by Zonal Project Directorate, Zone-II, Kolkata at UBKVK, Cooch Bihar (W.B.) from 4-5 November, 2013.
Deokaran participated in training on Direct Seeded Rice, organized by NICRA, CRIDA, at CRU-RRS, Hajaribagh, Jharkhand from 27-28 Sep-tember, 2013.
Govind, Hari participated in Sensitization work-shop on “Plant Protection Verities and Farm-ers Right (PPV&FRA)” organized by Zonal Project Directorate, Zone-II, Kolkata in col-laboration with PPV & FR Authority, New Delhi at BCKV, Kalyani, Nadia (W.B.) on 17th December, 2013.
Gupta, V.K. and Singh, I.S. attended Annual workshop-cum-CAC Meeting on “Sustainable Livelihood Improvement through Need-Based Integrated Farming System Models in Disad-vantageous Districts of Bihar” at ICAR RCER, Patna on 10th April, 2013.
Gupta, V.K. and Singh, I.S. attended meeting on “Demonstration of Integrated Model of Fish,

Transfer of Technology 95 ICAR-RCER n Annual Report 2013-14
Duck and Quail” organized by Deputy Su-perintendent of Police, Biraul, Darbhanga at Biraul, Darbhanga on 16th January, 2014.
Gupta, V.K. and Singh, I.S. participated in “Agri Summit-2013: A step Towards Second Green Revolution-2013” at ICAR RCER, Patna on 8-9 April, 2013.
Gupta, V.K.; Kumar, Lokendra and Singh, I.S. attended Subdivisional Level Workshop on “Shree Vidhi Maha Abhiyaan-2013” organized by ATMA, Darbhanga at Sabhagaar Ayukt Karyalaya, Darbhanga on 29th April, 2013.
Kumar, Abhay participated in the “Annual Work-shop of NAIP Comp. 3 Sub-projects”, orga-nized at BAU, Varanasi during 15-16 March, 2013.
Kumar, Lokendra; Gupta, V.K. and Singh, I. S. attended International Conference on “Impact of Technological Tools on Food Security under Global Warming Scenario (ITTFS-2012)” orga-nized by Hi-Tech Horticultural Society, Mer-rut, U.P. at SHOBHIT University, Modipuram, Merrut, on 11-12 May, 2013.
Kumar, S.; Das, B. and Choudhary, J. S. attended Training Cum Workshop on “Real Time Man-go Pest Surveillance under NICRA Project” or-ganized at ICAR Research Complex for Eastern Region, Ranchi from 7-8 March, 2013.
Kumar, S.; Das, B. and Choudhary, J.S. attended 2nd Annual Workshop of NICRA Project organized by CRIDA, Hyderabad at IARI, New Delhi during 17-19 June, 2013.
Kumar, Sanjeev participated in International Workshop on “Crop-manager/nutrient Man-ager for Rice-Wheat Cropping System,” orga-nized by CSISA (CIMMYT) along with IRRI, ILRI and IFRI at ICAR-RCER, Patna on 20th August, 2013.
Kumar, Sanjeev participated in the meeting “ Na-tional Mission on Sustainable Agriculture for Preparation of Proposal Draft and Discussion organised by Deptt. of Agri. Govt. of Bihar at Patna on 16th November, 2013.
Kumar, Sanjeev participated in the Nation-al Group meeting on “AICRP-IFS” orga-nized by PDFSR, Modipuram and ICAR Research Complex for N.E.H. Region, Umi-am held at ICAR-RC (NEH) Region, Umi-am, (Meghalaya) from 4-6 December, 2013.
Kumar, Sanjeev participated “Annual Workshop-cum-CAC Meeting of NAIP” Component-3 at ICAR- RCER, Patna on 10th April, 2013.
Kumar, Sanjeev participated in “31st Group Meet-ing of AICRP on Potato”, organized by CPRI, Shimla at CPRS, Patna from 20-22 Sept., 2013.
Kumar, Sanjeev participated in the meeting “Kharif Utpadan Karyakram 2013-14” organised by Dept. of Agril., Govt. of Bihar at Patna on 2nd March, 2013.
Kumar, Sanjeev participated in the meeting “For-mation of Unique Cost Committee” held at Patna on 31st October, 2013.
Kumar, Sanjeev participated in the meeting “Na-tional Food Security Programme” held at Patna on 19th September, 2013.
Kumar, Sanjeev participated in the meeting of Scientific Advisory Committee of K.V.K., Sita-marhi held at KVK, Sitamarhi on 11th March, 2013.
Kumar, Sanjeev participated in the workshop “Building Awareness About the Need and Nature of Basic/Strategic Research in Agricul-ture” organized by National Fund for Basic/strategic and Frontier Application Research in Agriculture (NFBSFARA) held at NIRJAFT, Kolkata from 23-24 August, 2013.
Kumar, Sanjeev participated in the workshop on “Nutrient Expert” organized by International Plant Nutrition Institute-South Asia Program held at ICAR- RCER, Patna on 9th May, 2013.
Kumar, Santosh participated in the “7th Internation-al Rice Genetics Symposium” held at Manila, Philippines during 5-8 November, 2013.
Kumar,Santosh participated in “Review Meeting for Foreign Aided Projects under NRM Divi-sion” held at Pusa, New Delhi on 4th February, 2013.
Kumar, Santosh participated in “48th Annual Rice Research Group Meeting”, held at SKUAST, Srinagar during 13-16 April, 2013.
Kumar, Santosh participated in “52nd All India Wheat and Barley Research Workers Meet”, held at CSAUA&T, Kanpur during 1-4 Sep-tember, 2013.
Kumar, Santosh participated in a foreign training-cum-workshop on “Characterization of Rice Growing Environments for Dissemination of Stress Tolerant Varieties in South Asia” held at Kathmandu, Nepal 24-26 July, 2013.
Kumar, Santosh participated in “Annual Review and Planning Workshop for India and Nepal (STRASA Phase 2)” held at NASC Complex, New Delhi during 09-11 April, 2013.
ICAR-RCER n Annual Report 2013-14 96 Transfer of Technology
Kumar, Ujjwal and Sarma, Kamal participated in training on “Agricultural Innovation Systems” Organized by Centre for Research on Innova-tion and science Policy (CRISP) & Australian Centre for International Agricultural Research (ACIAR) at Patna during 12-14 November, 2013.
Maurya, S. attended “Indian Mushroom Confer-ence 2013” at PAU, Ludhiana during 16-17th April, 2013.
Maurya, S. attended “National Symposium of In-dian Phytopathological Society (EZ)” at CRU-RRS, Hazaribag during 24-25th October, 2013.
Mondal, S.K. attended workshop on “Crop Nutrient Manager for Rice-Wheat Cropping Systems” at ICAR-RCER, Patna on 20th August, 2013.
Mondal, S.K. participated in Brainstorming Work-shop on “Precision Agriculture in Nutrient Management-Present Status and Future Need in Eastern India” organised by International Plant Nutrition Institute (IPNI) at ICAR-RCER, Patna on 19th November, 2013.
Mondal, S.K. participated in workshop on “Nutri-ent Expert for Hybrid Maize and Wheat-A Nu-trient Decision Support Tool” at ICAR-RCER, Patna on 9th May, 2013.
Naik, S. K. attended Brain Storming session on “Precision Agriculture in Nutrient Manage-ment” at ICAR Research Complex for Eastern Region, Patna on 19th November, 2013.
Pan, R.S. attended “XXXI AICRP (Vegetable Crops) Group Meeting” at CSK HPKV, Palampur, H.P. on 2-5 May, 2013.
Pan, R.S. attended Seminar on “Eastern Region Chapter on IPR in Agriculture” at ICAR RCER RC, Ranchi during 27-28 February, 2014.
Pan, R.S. attended State Level Workshop on “Im-pact of National Agricultural Innovation Proj-ects and Strategies for their Sustainability” at Birsa Agricultural University, Ranchi on 4th January, 2014.
Pan, R.S. attended Workshop on “Intellectual Prop-erty Rights” at ICAR RCER Research Centre, Ranchi on 12th Sept., 2013.
Ramkewal participate in “Kissan Goshthi” at Gandhi Maidan in Bihar Diwas organized by Dept of Agriculture, Govt. of Bihar from 22-24.3.13.
Ramkewal participated in “Agricultural Science Congress” organized by NAAS, New Delhi at OUAT Bhubaneswar, Odisha from 7-9 Febru-ary, 2013.
Ramkewal participated in seminar on “Enhancing Farmers Income through Value Addition and Efficient Marketing” organized by Bihar Indus-tries Association, Patna at Patliputra Ground, Patna from 14-17 March, 2013.
Roy, Ramakrishna attended training cum sensi-tization workshop on “National Initiative on Fodder Technology Demonstration” at In-dian Grassland and Fodder Research Institute, Jhansi from 22-23rd September, 2013.
Roy, Ramakrishna attended workshop for review-ing the lessons of “Diploma in Commercial Poultry Production” at National Institute of Open Schooling, Noida.
Sarma, Kamal attended Annual workshop cum CAC meeting on “Sustainable Livelihood Improvement through Need Based Integrated Farming System Model in Disadvantage Dis-tricts of Bihar” on 10th April, 2013.
Sarma, Kamal attended “Final Review Workshop of Component-3, Sub-projects” organized at NASC Complex, New Delhi during 3-4 Febru-ary, 2014.
Sarma, Kamal attended workshop on “Improving Rural Livelihood through Access to Water, Energy and Marke” organized by International Water Management Institute (IWMI) at Patna on 10th May, 2013.
Sarma, Kamal participated in National workshop on “Business Opportunities in Freshwater Fisheries” organized by Zonal Technology Management-Business Planning and Devel-opment Unit, South Zone in association with Directorate of Fisheries, Bihar at Patna on 23
March, 2013.Shinde, R. attended the “ICAR Industry Meet”
organized by ICAR Research Complex for Eastern Region at Research Centre, Ranchi in collaboration with IINRG, Ranchi, Birsa Agri-cultural University (BAU), Ranchi and Zonal Technology Management Unit, NIRJAFT, Kol-kata on 16th November, 2013.
Shinde, R. attended the Seminar on “Baudhik Sam-pada Ke Adhikar” organized by ICAR RCER Research Centre, Ranchi on 12th September, 2013.
Shivani participated in Brainstorming Workshop on “Precision Agriculture in Nutrient Man-agement: Present Status & Future Need in Eastern India” organized by CIMMYT, ICAR RCER, IPNI, CGIAR & CCAFS at Patna on 19th November, 2013.
Transfer of Technology 97 ICAR-RCER n Annual Report 2013-14
Singh, A.K. attended “Management Development program on Leadership Development at NAARM, Hyderabad from 26th August, 2013-6th September, 2013.
Singh, A.K. attended “31st Group Meeting of AICRP (VC)” at CSKHPKV, Palampur from 2-5 May, 2013.
Singh, R.D. participated in meeting on “Contin-gency Planning for Deficient Rainfall Districts in Bihar and Jharkhand-Kharif, 2013” organized by CRIDA Hyderabad and ICAR-RCER, Patna on 13th August, 2013.
Singh, R.D. participated in “Orientation Pro-gramme for K.V.K. Programme Co-ordinators and Assistant Professors” organized byR.A.U., Pusaon 27th September, 2013.
Singh, R.D. participated in “State level Meeting for Approval of RKVY Programme under Live-stock and Fishery Development in the State” on 6th January, 2014.
Singh, R.D. participated in “Vetting Workshop of District lLevel Contingency Plan (DLCP)” at Birsa Agricultural University, Kanke, Ranchi on 29th June, 2013.
Singh, R. D. participated in “Vetting Workshop of District Level Contingency Plan (DLCP)” orga-nized by Rajendra Agricultural University, at Pusa, Samastipur on 16th December, 2013.
Sundaram, P.K. attended in “47th Annual Conven-tion of ISAE and International Symposium on Bio Energy” organised by Indian Society of Agricultural Engineering (ISAE) at DRR, Hyderabad from 28-30 January, 2013.
Sundaram, P.K. attended Brainstorming Session in “Farm Mechanisation, Processing Technology and Value Addition for Enhancing Profitabil-ity” organised by College of Agricultural Engi-neering, RAU, Samastipur from 6-7 April,2013.
Sundaram, P.K. participated in travelling seminar on “Conservation Agriculture” organized jointly by ICAR-CIMMYT from 16-25 Sep-tember, 2013.
Upadhyaya, A. attended “Management Develop-ment Programme on Leadership Develop-ment” at NAARM, Hyderabad during 26th November -7th December, 2013.
Upadhyaya, A. attended Consultancy Workshop on “Conservation and Management of Wet-lands of Bihar” at ICAR-RCER, Patna on 23rd February, 2013.
Upadhyaya, A. participated in “India Water Week” organized at Vigyan Bhawan New Delhi dur-ing 8-12 April, 2013.
Upadhyaya, A. participated in International Con-ference on “Water Quality Management for Climate Resilient Agriculture” at Jalgaon dur-ing 28-30 May, 2013.
Upadhyaya, A. participated in International Workshop on “Moving from Water Prob-lems to Water Solutions: Research Needs Assessment for the Eastern Gangetic Plains” at New Delhi during 6-9 May, 2013.
Upadhyaya, A. participated in Workshop on “Enhancing Water Use Efficiency in Yamuna Basin” held at NASC, New Delhi on 30th Au-gust, 2013.
new Entrants, Selection, Promotion, Transfer, Retirements and Resignation
new entrants
Mrs. Reshma Shinde joined as Scientist (Soil Science) at ICAR-RCER, RC, Ranchi w.e.f 06.05.2013
Dr. Reena Kumari Kamal joined on 9th Octo-ber, 2013 as Scientist (Livestock Production and Management).
Mr. Ravi Chatterjee, Stenographer, Gr. III joined KVK, Buxar on 25th November, 2013.
Mr. Hari Govind Jaiswal, SMS (Plant Breed-ing) joined KVK, Buxar on 20th March, 2013 on transfer from KVK, Chiniyalisaur, Uttarkashi, Uttarakhand.
Mr. Ramesh Chandra Verma, SMS (Horti-culture), joined KVK, Buxar on 1st April, 2013 on transfer from KVK, Ranipur, Sikkim
Mr. Vikas Kumar, Programme Assistant (Com-puter) joined KVK, Buxar on 26th September, 2013 on transfer from KVK, Deoria, Uttar Pradesh.
Promotion
Dr. Bikash Das promoted to Senior Scientist (RGP 9000, PB-IV) w.e.f 22.06.2012
Shri Y. N. Pathak promoted to Asst. Chief Technical Officer w.e.f 20.11.2011
Shri Shashi Kumar Azad promoted to Techni-cal Asst.(Farm) w.e.f 16.02.2011
Retirements
Dr. Janardan Jee, Pr. Scientist w.e.f.31.12.2013Dr. Shivendra Kumar, Pr. Scientist and Head
w.e.f 31.01.2014.Dr. A.R. Khan, Pr. Scientist w.e.f. 31.03.2014

ICAR-RCER n Annual Report 2013-14 98 Publication
Research Papers
National
Haris, A., Abdul; Bhatt, B. P.; Chhabra, V.; Biswas, S. and Elanchezhian, R. (2013). Climate change impacts on yields of phenologically different rice varieties over a sub-humid climatic environment. Agricultural Research, 2(4): 319-329.
Haris, A., Abdul; Chhabra, V. and Bhatt, B.P. (2012). Agroforestry in climate change adaptation and mitigation. Agriculture Situation in India, 69(8): 405-408.
Haris, A., Abdul; Chhabra, Vandna and Biswas, Sandeep (2013). Carbon sequestration for mitigation of climate change- a review. Agri. Reviews, 34(2): 129-136.
Ajay, P.; Raval, A.P.; Yogesh, M.; Gami; Kumar, S.; Devchand, A.; Sadrasaniya, S.; Bhagwat, R. and Kumari, Rajni (2013). Effect of probiot-ics supplementation on nutrient utilization, production performance and economics of feeding in lactating kankrej cows. Indian Journal of Animal Nutrition, 30(2): 113-118.
Chandran, P. C.; Pandian, S. J.; Ray, P. K.; Dey, A.; Barari, S. K. and Kaushal, D. K. (2014). Selective breeding Black Bengal goats for improving productivity. In-dian Journal of Animal Sciences, 84: 78-81.
Chandran, P. C.; Verma, S. B.; Mandal, K. G.; Singh, R. K. and Kumar, B. (2013). Characteristics and role of shahabadi sheep in elevating the socio-economic status of farmers in Bihar. In-dian Journal of Animal Sciences, 83: 971-975.
Choudhary, C. S.; Jain, S. C.; Kumar, R. and Choudhary, J. S. (2013). Efficacy of different fungicides, biocides and botanical extract seed treatment for controlling seed-borne Colletotrichum sp. in chilli (Capsicum annuum L.). The Bioscan, 8(1): 123-126.
Dayal, S.; Kumar, P. and Kaushik, P. (2013). Breed effect on serum lysozyme activity in in-
digenous breed of sheep. Journal of Animal Research, 3(1): 43-45.
Dwivedi, S. K.; Arora, A., Singh, S. D.; Singh, G. P.; Nagar, S. and Kumar, S. (2013). PGRs improve carbohydrate metabolism and yield attributes in wheat (Triticum aestivum) under water deficit condition. J. Wheat Res., 5(2): 12-17.
Dwivedi, S. K.; Arora, Ajay; Singh, S. D.; Singh, G. P.; Nagar, S. and Kumar, Santosh (2013). PGRs improves carbohydrate metabolism and yield attributes in wheat (Triticum aesti-vum L.) under water deficit stress condition. J. Wheat Res., 5(2): 1-62.
Elanchezhian, R.; Kumar, S.; Singh, S. S.; Dwivedi, S. K.; Shivani and Bhatt, B. P. (2013). Plant survival, growth and yield attributing traits of rice (Oryza sativa L.) genotypes under submergence stress in rainfed lowland eco-system. Indian Journal of Plant Physiology, 18(4): 326-332.
Gupta, J. J.; Singh, K. M.; Bhatt, B. P. and Dey, A. (2014). A diagnostic study on livestock production system in eastern region of In-dia. Indian Journal of Animal Sciences, 84(2): 198-203.
Kamal, R. K.; Dutt, Triveni; Singh, Mukesh; Kamra, Nandan, Devki; Patel, Manjunath; Choud-hary, Lal Chandra; Agarwal, Neeta; Kumar, Sanjay; and Islam, Manzarul (2013). Effect of live Saccharomyces cerevisiae (NCDC-49) supplementation on growth performance and rumen fermentation pattern in local goat. Journal of Applied Animal Research, 41(3): 258-288..
Khan, A.R.; Rahman, A. and Singh, R.D. (2013). Influence of soil surface manipulation on soil temperature in relation to peanut produc-tion. Journal of Applied and Natural Science, 5(1) : 53-57.
Kothyari, U.C.; Kumar, A. and Jain, R.K. (2013). Influence of cohesion on river bed scour in wake region of piers. J. of Hydraulic Eng. 140(1): 1-13.
20. Publications
Publication 99 ICAR-RCER n Annual Report 2013-14
Krishnan, P.; Balasubramaniam, M.; Roy, S.D.; Sarma, K.; Hairun, R. and Sunder, J. (2014). Characterization of the antibacterial activ-ity of bacteria associated with Stylissa sp., a marine sponge. Adv. Anim. Vet. Sci., 2(1): 20-25.
Krishnan, P.; Veeramani, S.; Roy, S.D.; Sarma, K.; Pavel, K. and Sunder, J. (2014). Antimicrobial activity of Ircinia sp.; a marine sponge and its associated bacteria from Andaman coast. Adv. Anim. Vet. Sci., 2(1): 37-41.
Kumar, D.; Kumar, A.; Singh, A.K. and Tripathi, H. S. (2013). Induction of resistance in field pea against rust disease through various chemicals/micronutrients and their impacts on growth and yield. Plant Pathology Journal, 12(2): 36-49.
Kumar, Rajesh; Pandey, A. K.; Singh, Anil Kumar and Verma, A. K. (2013). Extent and pattern of rice root phenology under low land condi-tions. Envi. & Ecol., 31(4): 1797-1800.
Kumar, Rajesh; Pandey, A. K.; Singh, Anil, Kumar and Verma, A. K. (2013). Performance of rice genotypes under low land ecosystems of Jharkhand. Envi. & Ecol., 31(4): 1801-1805.
Kumar, Rajesh; Pandey, A.K.; Singh, Anil, Kumar and Verma, A.K. (2013). Extent and pattern of rice (Oryza sativa L.) leaf phenology under low land conditions of Jhanrkhand as influ-enced by genotype. Envi. & Ecol., 31(4A): 1810-1815.
Kumar, Rajesh; Pandey, A.K.; Singh, Anil, Kumar and Verma, A.K. (2013). Magnitude of rice (Oryza sativa L.) performance as influenced by genotypes under low land agro-ecosys-tem. Envi. & Ecol., 31(4A): 1816-1822.
Kumar, S.; Dwivedi, S. K.; Elanchezhian, R.; Singh, S. S.; Singh, O. N.; Arora, A. and Bhatt, B. P. (2013). Influence of aerobic condition on physiological traits and yield attributes of rice (Oryza sativa L.) genotypes under rainfed lowland ecosystem. Indian Journal of Plant Physiology, 18(3): 263-269.
Kumar, S.; Elanchezhian, R.; Singh, S. S.; Singh, A. K.; Mall, A. K.; Sangle, U. R. and Sundaram P. K. (2013). Field screening of rice genotypes for resistance against bacterial leaf blight and brown spot under aerobic condition. Journal of Plant Disease Sciences, 8(2): 148-152.
Kumar, Santosh; Elanchezhian, R.; Singh, S. S.; Singh, Anil, Kumar; Mall, A. K.; Sangle, U. R. and Sundaram, P. K. (2013). Field screening of rice genotypes for resistance against bacte-rial leaf blight and brown spot under aerobic condition. J. Plant Disease Sci., 8(2): 148-152.
Kumari Anjali; Kumar, R.; Maurya, S.; Choudhary, J.S. and Kumar, S. (2013). Antifungal efficacy of aqueous extracts of neem cake, karanj cake and vermicompost against some phytopatho-genic fungi. The Bioscan, 8(1): 1-10.
Kushwaha, P.K.; Singh, M.K. and Singh, Mand-hata (2013). Integrated weed management in black gram (Vigna mungo L.) under custard apple and guava based agri-horti system in vindhyan region of eastern Uttar Pradesh. Environment and Ecology, 31(4): 1651-1653.
Manibhushan; Patel, N.; Sahoo, G. and Singh, A.K. (2013). Image classification for different land use and land covers using Fuzzy Logic for improvement of accuracies. Journal of Agri-cultural Science, 5(3): 278-283.
Manibhushan; Patel, Nilanchal and Sahoo, Gadad-har (2013). A fuzzy approach for urban land use and land cover classification to enhance producer’s accuracy. International Journal of Tropical Agriculture, 31(1-2): 27-32.
Manibhushan; Patel, Nilanchal and Sahoo, Gad-adhar (2013). Land use and land cover clas-sification of individual and stacked satellite images using supervised maximum likeli-hood method. Advances in Applied Research, 5(1): 9-13.
Manibhushan; Sahoo, Gadadhar and Patel, Nilanchal (2013). Spectral mixture analysis- a tool for classification of mixed pixels of sat-ellite images. International Journal of Tropical Agriculture, 31(1-2): 33-37.
Meena, A.S.; Kumar, Rajiv; Kumari, Rajni; Jyotsana, B.; Prince, L.L.L. and Kumar, Satish (2013). Genetic polymorphism of melatonin recep-tor 1A gene in Indian sheep breeds. Indian Journal of Animal Science, 83(12):
Meena, A.S.; Kumar, Satish; Kumar, Rajiv; Kumari, Rajni and Prince, L.L.L. (2013). Kendrapada bedo ki naslon mein FecB gene ki anuvan-shiki bahurupata ka adhyan avom pahchan. Avi Vigyan Shodh Patrika, 1(1): 1-5.
Meena, B.L.; Singh, A.K.; Phogat, B.S. and Sharma, H.B. (2013). Effects of nutrient management and planting systems on root phenology and grain yield of wheat. Indian J. Agril. Sci., 83(6): 627-632.
Meena, M.S. and Singh, K.M. (2013). Changing behaviour of self help group members: pathway for sustainable rural livelihoods in eastern India. Indian Journal of Agricultural Sciences, 83(8): 847-851.
Meena, M.S. and Singh, K. M. (2013). Impact of self help groups on attitudes of members.
ICAR-RCER n Annual Report 2013-14 100 Publication
Indian Journal of Agricultural Sciences, 83(9): 971-976.
Meena, M. S. and Singh, K. M. (2013). Information and communication technologies for natural resource management. Journal of Environmen-tal Management and Tourism, IV2(8): 77-90. http://dx.doi.org/10.14505/jemt
Mehta, Sarita; Singh, Sanjay Kumar; Das, Bikash; Jana, B. R. and Mali, S.S. (2012). Effect of pruning on guava cv Sardar under ultra high density orcharding system. Vegetos, 25(2): 192-195.
Mere, V.; Singh, A. K.; Singh, Mandhata; Zamir, Zulutemjen and Gupta, R. C. (2013). Effect of nutritional schedule on productivity and quality of soybean varieties and soil fertility. Legume Research, 36(6): 528-534.
Minten, Bart; Singh, K. M. and Sutradhar, R. (2013). Branding and agricultural value chains in developing countries: insights from Bihar. Food Policy, 38(2): 23-34.
Mishra, D. S.; Kumar, A.; Prajapati, C. R.; Singh, A. K. and Sharma, S. D. (2013). Identification of compatible bacterial and fungal isolate and their effectiveness against plant disease. J. Environ. Biology, 34(2): 183-189.
Naik, S.K.; Maurya, S.; Kumar, R.; Das, B. and Kumar, S. (2013). Evaluation of rhizospheric fungi from acid soils of Jharkhand on phosphate solubilization. The Bioscan, 8(3): 875-880.
Pan, R. S.; Kumar, S.; Pal, G.; Tirkey, I. and Singh, A. K. (2011). Economics and resource use efficiency of brinjal (Solanum melongena) cul-tivation in Jharkhand. Agricultural Situation in India, LXVIII (7): 335-341.
Pandey, A. K.; Singh, A. K.; Kumar, A. and Singh, S. K. (2013). Effect of drip irrigation, spacing and nitrogen fertigation on productivity of chilli (Capsicum annuum L.). Environment & Ecology, 31(1): 139-142.
Sarma, Kamal; Kumar, Anand; Grinson, A.; Pan-dian, George, Krishnan; K., Prabakaran; Roy, Sibnarayan, Dam and Srivastava, Ramesh Chandra (2012). Impact of coastal pollution on biological, biochemical and nutritional status of edible oyster, Crassostrea rivularis, (Gould, 1861) in Phoenix Bay Jetty and North Wandoor of Andaman. Indian Journal of Ani-mal Sciences, 83(3): 321–325.
Sentimenla; Singh, A. K.; Singh, Mandhata and Gupta, R. C. (2013). Effect of phosphorus and boron on production potential, profitability and efficiency indices of soybean. Soybean
Research, 11(2): 79-85.Singh, A. K. (2013). Studies on faba bean growth,
yield attributes and yield in response to vary-ing planting pattern, geometry and seeding depth. Indian J. Hort., 70(2): 238-242.
Singh, A. K. and Bhatt, B. P. (2013). Effects of fo-liar application of zinc on growth and seed yield of late-sown lentil. Indian J. Agril. Sci., 83(6): 622-626.
Singh, A. K. and Bhatt, B. P. (2013). Vegetable type faba bean lines identified suitable for eastern region of India. HortFlora Research Spectrum, 2(3): 225-229.
Singh, A. K. and Umrao, V. K. (2013). GAP: non-monetary way to manage faba bean dis-eases– a review. HortFlora Research Spectrum, 2(2): 93-102.
Singh, A. K.; Bhatt, B. P. and Manibhushan (2013). Occurrence of Phytoplasma phyllody and witches’ broom disease of faba bean in Bihar. Journal of Environ. Biology, 34: 837-840.
Singh, A. K.; Bhatt, B. P.; Singh, K. M.; Kumar, Ab-hay; Manibhushan; Kumar, Ujjwal; Chandra, Naresh and Bharati, R. C. (2013). Dynamics of powdery mildew (Erysiphe trifolii) disease of lentil influenced by sulphur and zinc nu-trition. Plant Pathology Journal, 12(2): 71-77. http://doi:10.3923/ppj.2013.71.77.
Singh, A. K.; Kumar, P. and Chandra, N. (2013). Studies on yield production of mung bean (Vigna radiate) sown at different dates. Journal of Environ. Biology, 34: 1007-1011.
Singh, A. K.; Manibhushan; Bhatt, B. P.; Singh, K. M. and Upadhyaya, A. (2013). An analysis of oilseeds and pulses scenario in eastern India during 2050-51. Journal of Agricultural Science, 5(1): 241-249.
Singh, A. K.; Meena, M. K.; Bharati, R. C. and Gade, R. M. (2013). Effect of sulphur and zinc management on yield, nutrient uptake, changes in soil fertility and economics in rice (Oryza sativa L.)-lentil (Lens culinaris) crop-ping system. Indian Journal of Agricultural Sciences, 83(3): 344-348.
Singh, A. K.; Pan, R.S. and Bhavana, P. (2012). Correlation and path coefficient analysis for quantitative traits in early season bottle gourd [Lagenaria siceraria (Mol.) Stand L.]. Vegetable Science, 39(2): 195-197.
Singh, A.K.; Pan, R.S. and Bhavana, P. (2013). Heterosis and combining aability analysis in bittergourd (Momordica charantia L.). The Bioscan, 8(4): 1533-1536.

Publication 101 ICAR-RCER n Annual Report 2013-14
Singh, Deepak; Kumar, Ashish; Singh, Anil Kumar and Tripathi, Hirdai Shankar (2013). Severity of chickpea wilt in north Bihar and nutri-tional studies on Fusarium oxysporum J. Plant Disease Sci., 8(2): 137-140.
Singh, H. K.; Srivastava, Shilpi; Singh, R. B. and Singh, Anil, Kumar (2013). Management of alternaria blight of rapeseed-mustard. J. Plant Disease Sci., 8(2): 131-136.
Singh, I.S.; Awasthi, O.P. and Nagaraja, A. (2013). Effect of manuring and mulches on irrigated arid brinjal in western India. Indian Journal of Horticulture, 70(2): 248-254.
Singh, K. M.; Singh, R. K. P.; Jha, A. K. and Kumar, Abhay (2013). Fodder markets in Bihar: An exploratory study. Economic Affairs, 58(4): 355-364.
Singh, S. S.; Mukherjee, J.; Kumar, S. and Idris, M. (2013). Effect of elevated CO2 on growth and yield determination of rice crop in Open Top Chamber in sub humid climate of eastern India. J. Agrometeorology, 15(1): 1-10.
Swain, S.; Das, S.P.; Bej, D.; Patel, A.; Jayasankar, P.; Chaudhary, B.K.; Jena, J.K.; Routray, P.; Swain, S.K.; Das, P. C.; Lakra, W.S. and Das, P. (2013). Evaluation of genetic variation in Labeo fimbriatus (Bloch, 1795) populations using heterologous primers. Indian Journal of Fisheries, 60(1): 29-35.
International
Choudhary, Binod, Kumar; Sarma, Kamal; Majhi, Sullip, K.; Kaushal, D.K.; Dey, A. and Bhatt, B.P. (2013). Climate change and its impact on fisheries and aquatic ecosystem in Bihar. International Journal of Advanced Research, 2(1): 587-592.
Das, Sofia, P.; Bej, D.; Swain, S.; Das, P.; Choudhary, B.K.; Jena, J.K.; Routray, P.; Swain, S.K.; Das, P.C. and Jayasankar, P. (2013). Comparative and evolutionary analysis of mitochondrial genes in Indian major carps. Biochemical Sys-tematics and Ecology, 47: 56-73.
Grace, Kusuma; Sharma, J.K.; Suma, L.; Srinivas, C.M.; Mandal, K.; Raju, B.M.K.; Korwar, G., R.; Venkateswarlu, B.; Kumar, Shalander; Sankar, G.M.; Munnalal, R.; Kumar, T., Satish; Srinivas, Reddy. K. and Shinde, R. (2013). Effect of long term use of tillage, residues and N levels in sorghum (Sorghum vulgare (L)- Castor (Ricinis comminis) crop-ping system under rainfed conditions-crop response and economic performance-part I. Experimental Agriculture, 42:1-21.
Jha, M. N.; Chourasia, S. K. and Bharati, R. C. (2013). Effect of integrated nutrient manage-ment on rice yield, soil nutrient profile and cynobacterial nitrogenage activity under rice-wheat cropping system. Communication in Soil Science and Plant Analysis, 44:1961-1975.
Kirubasankar, R.; Roy, S.D.; Grinson, George; Sarma, K.; Krishnan, P.; Kumar, S., Ram; Kaliyamoorthy, M. and Gouthambharathi, M.P. (2013). Fishery and exploitation of Ma-labar Grouper, Epinephelus malabaricus (Bloch & Schneider 1801) from Andaman Islands. Asian Fisheries Science, 26: 167-175.
Kumar, D.; Kumar, A.; Singh, A. K.; Prajapati, C.R. and Tripathi, H. S. (2013). Studies on surviv-ability of field pea rust caused by Uromyces viciae-fabae (Pers.) de Bary in Tarai region of Uttarakhand (India). African Journal of Agri-cultural Research, 8(17): 1671-1622.
Kumar, R.; Kumari, Anjali; Sinha, A. and Maurya, S. (2013). New report of Lasiodiplodia theobromae causing Jatropha decline in Eastern Plateau and Hill region of India. Archives of Phytopa-thology and Plant Protection, http://dx.doi.org/10.1080/03235408.2013.840100.
Manjhi, S. K. and Choudhary, B. K. (2014). El-evated water temperature induce germ cell proliferation in Loach Lepidocephalus guntea (Hamilton): Implication for brood stock de-velopment. National Academy of Science Letters, India, DOI 10.1007/s40009-013-0208-1.
Maruthi, Sankar; Sharma, G. R.; Gabhane, K. L.; Nagdeve, V. V.; Pushpanjali, M. B. M.; O., Gopinath, K. A.; Shinde, R.; Ganvir, M. M.; Karunakar, A. P.; Anitha, Chorey, B.; Mishra, P. K.; Venkateswarlu, B.; Singh, A. K., and Suma, C. M. (2013). Long-term effects of fertilizer application and rainfall distribution on cotton productivity, profitability and soil fertility in a semi-arid vertisol. Communica-tions in Soil Science and Plant Analysis, 45(3): 362-380.
Maruthi, Sankar; Sharma, G.R.; Srinivas, K.L.; Reddy, K.; Prathiba, G.; Shinde, R.; Singh., S.; R., Nema., Singh., A. K.; Rath, R.P.; Mishra, B. S.; Behera, A.; Subudhi., B. D.; Singh, Bhagwan; Singh., C. R., H. C.; Singh, A. K.; Rusia, D. K.; Yadav., M. S.; Thyagaraj, C.R.; Mishra, P. K.; Suma, C. M. and Venkateswar-lu, B. (2013). Efficient tillage and nutrient management practices for sustainable yields, profitability and energy use efficiency for rice-based cropping system in different soils and agro-climatic conditions. Experimental Agriculture, 49(2): 161-178.
ICAR-RCER n Annual Report 2013-14 102 Publication
Maurya, S.; Kumar, R.; Choudhary, J. S.; Das, B. and Kumar, S. (2013). New report of neozyg-ites sp. infecting red spider mite Tetranychus urticae infesting French bean from Eastern Plateau and Hill region, India. Archives of Phytopathology and Plant Protection, DOI:10.1080/03235408.2013.793051.
Maurya, S.; Kumar, R.; Choudhary, J.S.; Prabhaker, C.S.; Shuka, G.; Das, B. and Kumar, S. (2013). Torrubiella pruinosa, a teliomorph of an en-tomopathogenic fungus Hirsutella versicolor of mango hopper (Ideoscopus clypelis) from India. Archives of Phytopathology and Plant Protection, DOI:10.1080/03235408.2013.794530.
Naik, S. K.; Barman, D. and Pathak, N. (2013). Response of graded levels of calcium and magnesium on growth and flowering of Cymbidium hybrid ‘Mint Ice Glacier’. Af-rican Journal of Agricultural Research, 8(17): 1767-1778.
Naik, S. K.; Barman, D.; Devadas, R. and Ushab-harathi, T. (2013). Evaluation of Panchgavya as source of nutrient for Cymbidium orchids. African Journal of Agricultural Research, 8(46): 5728-5732.
Naik, S. K.; Barman, D.; Rampal, Medhi, R. P. (2013). Evaluation of electrical conductivity of the fertilizer solution on growth and flow-ering of a Cymbidium hybrid. South African Journal of Plant and Soil, 30(1): 33-39.
Naik, S. K.; Maurya, S.; Kumar, R.; Sadhna, K.; Gagrai, S.; Das, B.; Kumar, S. and Bhatt, B. P. (2013). Inorganic phosphate solubilization by phosphate solubilising fungi isolated from acidic soils. African Journal of Microbiology Research, 7(34): 4310-4316.
Naik, S. K.; Pandit, T. K.; Patra, P. K. and Das, D. K. (2013). Effects of graded levels of cad-mium on spinach and cabbage grown in an Inceptisol. Communications in Soil Science and Plant Analysis, 44(10): 1629-1642.
Sarma, Kamal; Prabakaran, K.; Krishnan, P.; Grinson, G. and Kumar, A. Anand (2013). Response of a freshwater air-breathing fish, Clarias batrachus to salinity stress: An ex-perimental case for their farming in brackish water areas in Andaman, India. Aquacult. Int., 21:183-196.
Singh, A. K.; Bharati, R. C.; Chandra, N.; Manib-hushan and Pedapati, A. (2013). An assess-ment of faba bean (Vicia faba L.) : current status and future prospect. African Journal of Agricultural Research, 8(50): 6634-6641.
Singh, A. K.; Singh, K. A.; Bharati, R. C. and Chan-dra, N. (2013). Response of intercrops and nutrient management on the performance of tobacco based intercropping system and as-sessment of system sustainability. Bangladesh J. Bot., 42(2): 334-348.
Upadhyaya, A. (2013). Hybrid finite analytic so-lution for computation of spacing between drains in sloping lands. Journal of Irrigation and Drainage Engg., ASCE, 139(2): 131-136.
Books
Bharati, R.C. and Singh, A. K. (2014). Designing Ag-ricultural Research. ISBN 978-93-81226-83-4, Satish Serial Publication House, Delhi.
Bharati, R. C. and Singh, A. K. (2014). Elements of Agricultural Statistics. ISBN 978-93-81226-69-8, Satish Serial Publication House, Delhi.
Das, Bikash; Singh, A. K.; Kumar, S.; Bhatt, B. P. and Sikka, A. K. (2013). Natural Resource Management for Horticulture Development. Satish Serial Publishing House, Delhi, pp.179.
Dwivedi, S.K. and Arora, Ajay (2013). Vase life en-hancement of flower via nitric oxide: Biochem. Superstar. ISBN 978-3-659-40109-1, Lambert Academic Publishing, Saarbrucken, Ger-many, p.117.
Kumar, Sanjeev; Singh, S. S.; Shivani; Bhatt, B. P. and Singh, R. N. (2013). Samekit Krishi Pranali: Ek Brihat Drishtikon. Published by BAMETI, Govt. of Bihar, p. 333.
Book chapter
Awasthi, O.P.; Singh, I.S. and Verma, M.K. (2013). Fruit based diversified cropping system for arid region. In: Singh, J. et al. (eds.): Precision Farming in Horticulture. NIPA, New Delhi, pp. 45-53.
Bhavana, Patnayakuni and Gadag, R.N. (2012). Gene action, heritability, heterosis, path analysis for yield, yield components and resistance to banded leaf and sheath blight. In: Dghmisli (ed): Maize. LAP Lambert Academic Publishing Gmb H & Co. KG, Germany. ISBN-13:978-3-8465-9205-2.
Jha, B.K.; Kumar, L.; Gupta, V. K.; Singh, I. S. and Jee, Janardan (2012). An overview of makhana cultivation. In: Bhatt, B. P. et al. (eds.): Status of Agricultural Development in Eastern India. Published by ICAR-RCER, Patna, pp. 361-369.
Publication 103 ICAR-RCER n Annual Report 2013-14
Kumar, S.; Elanchezhian, R.; and Singh, S.K. (2013). Agricultural scenario. In: Bhatt, B. P.; Sikka, A. K.; Mukherjee, J.; Islam, A. and Dey, A. (eds.): Status of Agricultural Development in Eastern India. Published by ICAR-RCER, Patna, pp. 33-47.
Mishra, C.; Das, D.; Kumar, P.; Khanna, K.; Selva-ramesh, A. S.; Dayal, S.; Singh, A. P.; Nagpal, N. K.; Bhushan, B. and Sharma, A. (2013). Molecular studies on MX1 gene in chicken by PCR-SSCP Technique. In: Singh, C.V. and Barwal, R.S. (eds.): Genetic Improvement of Livestock and Poultry. New India Publishing Agency, New Delhi, pp. 255-259.
Sanjeev, Kumar; Singh, S.S.; Kumar, Ujjwal; Dey, A. and Shivani (2013). Sustainability of Integrated Farming Systems in Eastern Region. In: Madhu, M. M.; Jakhar, Praveen; Adhikary, P. P.; Gowda, Hombe; Sharda, V. N.; Mishra, P. K. and Khan, M. K. (eds.): Natural Resource Conservation: Emerging Issue & Future Challenges. Satish Serial Publishing House, Delhi, pp. 455-464.
Singh, A. K.; Sangle, U. R. and Kumar, Pravesh (2013). Crop selection - an efficient tool for sustainable agricultural production in the impending climate change situation. In: Ku-mar and Prasad (eds.): Modern Technologies for Sustainable Agriculture. New India Pub-lishing Agency, New Delhi, pp. 17-32.
Singh, R. D.; Shivani and Singh, A. K. (2013). Promising cropping pattern for irrigated ecosystem of eastern region. In: Bhatt, B. P. et al. (eds.): Status of Agricultural Development in Eastern India. Published by ICAR-RCER, Patna, pp.187-203.
Upadhyaya, A.; Singh, A. K. and Sikka, A. K. (2013). Management of waterlogged areas. In: Bhatt, B. P.; Sikka, A. K.; Mukherjee, Joydeep; Islam, Adlul and Dey, A. (eds.): Status of Agricultural Development in Eastern India. ICAR Research Complex for Eastern Region, Patna. pp 395-405.
Training Manuals
Baruah, D. J.; Kaishop, D.; Choudhary, B. K. and Sarma, Kamal (2013). Training manual on in-tegrated fish farming for sustainable livelihood (in Assamese). ICAR Research Complex for Eastern Region, Patna.
Choudhary, B. K.; Sarma, Kamal; Prasad, S. S.; Ku-mar, Santosh; Dey, A.; Kaushal, D.K. (2014). lesfdr eRL; ikyu. ICAR Research Complex for Eastern Region, Patna and NAIP, p. 44.
Research/Technical BulletinKumar, Lokendra; Gupta,V.K.; Jha, B.K.; Singh, I.S.;
Bhatt, B.P and Singh, A.K. (2013). Makhana kheti ki unnat taknik. Technical Bulletin No.: E-116/Patna. ICAR-RCER, Patna, pp. 30.
Kumar, Santosh,; Singh, S. S.; Idris, Md.; Kumar, Ssanjeev.,; Upadhaya, A. and Bhatt. B. P. (2013). iwohZ Hkkjr ds lq[kkxzLr {ks=kksa eas /ku dh oSKkfud [ksrh ,oa ty laj{k.k. Technical Bul-letin No.: R-41/PAT-27. ICAR RCER, Patna, pp.41.
pkSèkjh] fcuksn dqekj_ 'kekZ] dey; çlkn] ,l-,l-_ dqekj] larks"k_ Ms] vferkHk_ dkS'ky] Mh-ds- ^lesfdr eRL; ikyu }kjk thfodksiktZu lqèkkj* jk"Vªh; d`f"k uoksUes"kh ifj;kstuk% iwohZ {ks=k ds fy, Hkkjrh; d`f"k vuqlaèkku ifj"kn~ dk vuqlaèkku ifjlj] iVuk&800 014-
Extension BulletinDayal, S.; Dey, A. and Gupta, J.J. (2013). HkSal ds
cPpksa dk ikYku iks"k.k ,oa izca/u. ICAR-RCER, Patna.
Deokaran; Ramkewal; Dwivedi, V.; Roy, Ra-makrishna; Singh, Mandhata; Verma, R.C. and Harigovind (2013). Sukha ki sthiti mein kharif phasal aom pashudhan prabandhan ke upay tatha akasmik phasal yojana heyu sujhao. KVK, Buxar.
Naik, S.K.; Maurya, S. and Choudhary, J.S. (2014). Growing orchid– an overview. Extension Folder No.: E-117/Ranchi-40. ICAR Research Complex for Eastern Region, Research Cen-tre, Ranchi.
Singh, A.K.; Jaiswal, A.K.; Singh, C.V.; Pan, R.S.; Prasad, S.; Saha, P.B.; Kumar, M.; Raghav, D. and Saini, K.P. (2014). Safal Kahaniyan. Birsa Agricultural University, Ranchi, pp. 1-31.
Popular ArticleAishwath, O. P, Mehta, R. S, Meena, Jha, B. K.,
Mishra, B. K, Meena, S. S and Singh, Balraj. (2013). Bigri bhumi ke liye upuykt bijyie masale. (2013). Phal Phool, pp. 26-28, 34, Vo. 6, Nov.-Dec. 2013, DIPA, ICAR.
bnjhl eqgEen ,oa flag lrh 'kadj 2013- /ku vkSj xsgw¡ dk
'k=kq&NksVh ?kwalA [ksrh i`- 30&33A
Dayal S. and Kaushik P. (2013). Disease resistance in livestock. Indian Farming, 63(4): 7-9.
Dwivedi S. K., Kumar Santosh and Singh S.S. (2013). Sustaining wheat food production system under adverse climatic condition. Indian Farming, October pp. 70-72.

ICAR-RCER n Annual Report 2013-14 104 Publication
Dwivedi S.K. (2013). Mausam ka badlao: fashlo par maar, Farm n Food 16 Dec. pp.30-31.
Kumar Sanjeev, Shivani, Kumar Santosh and Singh S. S. (2013). Sustainable food and nutritional security through integrated farming system. Indian Farming 63(7): 30-36.
Kumar Sanjeev, Singh S.S. and Shivani. 2013. Un-puddled mechanical transplanting of rice : a way towards conservation agriculture. Indian Farming 62(12): 21-26.
Kumar Sanjeev, Sudaram P. K., Singh S.S. and Shi-vani. (2013). Unpuddled mechanical trans-planting of rice: a way towards conservation agriculture. Indian Farming 62(12): 21-26.
Kumar Santosh, Idris Md. and Singh S. S. (2013). Sukhagrast shetro me upaj kaise badhaye. Kheti May. 32-34.
larks"k dqekj] eqgEen bnjhl vkSj lrh 'kadj flag (2013) lw[kk xzLr {ks=kksa esa mit dSls c<+k,¡A [ksrh 66(2): 32-34-
Mondal, S; Kumar, S; Sundaram, P.K. and Dwivedi, S.K. (2014). Soil acidity: a limiting factor of crop production in india. Krishisewa http://www.krishisewa.com/cms/articles/soil-fertility/381-soil-acidity.html
Pan, R. S., Singh, A. K., Kumar, S. and Bhatt, B. P. (2013). Swarna Rituvar-a photo-insensitive lablab bean. ICAR NEWS (April-June 2013), 19(2):7.
Kumar, Santosh; Dwivedi, S. K.; Kumar, Sanjeev and Singh, S. S. (2013). Sustainable food pro-duction system and food security in rainfed areas of eastern India through drought tol-erant rice varieties. Indian Farming, October pp. 16-21.
Sharma R. P., Kumar Sanjeev, Sushant and Shivani. (2013). Samanvit Krishi Pranali: Ek Vawasay (in hindi). Krishi Udhamita Vikas- Badhate Kadam, Published by Bihar Agril. University, Sabour, pp. 23-34.
Singh, A. K.; and Bhatt, B. P. (2013). Faba bean: a crop that serves as complete food. Indian Farming, 63 (5) 3-6.
Singh, A. K.; Bhatt, B. P. and Singh, Deepak. (2013).Efficient cultural practices-curbing plant disease in the climate change era. In-dian Farming, April, pp 63(1)6-11.
Singh, A. K.; Bhavana, P., Kumar, S.; Bhatt, B. P. (2013), Tomato-plant grafting for resistance to bacterial wilt. ICAR News, 19(3):7.
Singh, A. K.; Pan, R. S., Kumar; S., Sharma, J. P.; Bhatt, B. P. (2013), Vegetable varieties from the ICAR Research Complex for Eastern Region. ICAR News, 19 (3):19.
Singh, A. K. and Kumar, Pravesh (2013) Hkkjrh; lUnHkZ esa iQly tSo fofof/rk vkSj mlds laj{k.k ds mik; jktnjckj] flrEcj] i`- 33&34A
Singh, A. K.; A. K., Pandey and S. K., Singh (2013)vkenuh vkSj jkstxkj iku dh [ksrh lsA [ksrh] twu i`- 09&10A
Singh, AK. (2013) vf/d ueh okys {ks=kksa djs iSjk fof/ ls xsgw¡ dh liQy [ksrh dSls djsa\ jktnjckj uoEcj] i`- 31&33A
Singh, AK. (2013) [kq'kcq dk [ktkuk tkikuh iqnhuk iQkeZ,uiQwM] ekpZ 16] i`- 32&35A
Singh, A. K. (2013) ckdyk% ,d cgqmi;ksxh HkksT; ,oa vkS"k/h; iQly b{kq 2(2) tqykbZ&fnlEcj] i`- 66&69A
Singh, A. K. (2013) ckdyk cM+s dke dh iQly dke dh iQly] iQkeZ,uiQwM] tqykbZ 16] i`- 32&33A
Singh, A. K. (2013) rqylh dh [ksrh] iQkeZ,uiQwM] ekpZ 1] i`- 31&32A
Singh, A. K. (2013) iku dh [ksrh] iQkeZ,uiQwM] vxLr] 16] i`- 24&25A
Singh, A.K. (2013) ckdyk% ,d HkksT; iQly\ jktnkjckj] vxLr] i`- 32&33A
Singh, A. K. (2013) Hkkjrh; ijkn`'; esa cnyrs tyok;q dk d`f"k ,oa tu&thou ij vlj] ;wih dh vkokt uoEcj] i`- 26&27A
Singh, S. S.; Idris M. and Bhatt, B. P. (2013). De-mand and strategies: for food security in eastern region. Indian Farming 63(7): 56, 66.
Sundaram, P.K. (2013). [ksrh esa dSls djsa rsy dh cpr http://krishisewa.com/cms/articles/miscellaneous/380-fuel_farm_machine.html
Sundaram, P.K. (2013)- [ksrh ds e'khuksa dk lgh bL-rseky ,oa ns[kHkky dj mldh mez c<+k,¡A http://krishisewa.com/cms/articles/miscellaneous/379-farm_machines_1.html
e-Publication
Chakrabarti, A.; Kumari, R.; Dey, A. and Bhatt, B. P. (2014). Sweet potato (Ipomoea batatas) - an excellent source of livestock feed. ‘Krishisewa’ http://www.krishisewa.com/cms/articles/production-technology/391-sweet-potato.html
Dwivedi, S. K. (2013). Enhancement of Gladiolus flower vase life with sodium nitroprusside treatment. KrishiSewa (www.krishisewa.com/cms/article/pht/290-gladiolus-vase-life-html).
Kumar, Abhay; Singh, K. M.; Singh, R. K. P.; Meena, M. S. and Kumar, Anjani (2013).

Publication 105 ICAR-RCER n Annual Report 2013-14
Dynamics of income in Bihar: evidence from village studies. Available at: http://dx.doi.org/10.2139/ssrn.2330853.
Kumar, Ujjwal and Singh, K. M. (2013). On-farm water management constraints-a Comparative study between canal and tubewell command. International Journal of Extension Education, 9: 37-42.
Meena, M. S. and Singh, K. M. (2013). Information and communications technologies for natural resource management. Journal of Environ-mental Management and Tourism, 4:2-8. http://dx.doi.org/10.14505/jemt.v4.2(8).03
Meena, M. S.; Singh, K. M.; Singh, R. K. P.; Kumar, Abhay and Kumar, Anjani (2013). Dynam-ics of income in Jharkhand: evidences from village studies. Available at: http://dx.doi.org/10.2139/ssrn.2330848
Meena, M. S. and Singh, K. M. (2013). Impact of self help groups on attitudes of members. Indian Journal of Agricultural Sciences, 83(9): 971-976.
Meena, M. S. and Singh, K. M. (2013). Chang-ing behaviour of self help group members: pathway for sustainable rural livelihoods in eastern India. Indian Journal of Agricultural Sciences, 83(8): 847-851.
Minten, Bart; Singh, K.M. and Sutradhar, R. (2013). Branding and agricultural value chains in developing countries: insights from Bihar (India). Food Policy, 38(C): 23-34. http://dx.doi.org/10.1016/j.foodpol.2012.09.003
Ramkewal; Stanley, J.; Gupta, J. P. and Rai, Deepak (2012). Dhan ke phasal mein samekit keet vyadhi Prabandhan. Krishi Jyoti (April 12- March 2013), 3: 32-35.
Ramkewal; Stanley, J.; Prasad, Reema; Deokaran; Singh, Mandhata and Dwivedi, V. (2012).
vaigyanik vidhi se arhar utpadan aom keet vyadhi prabandhan. Krishi Jyoti (April 12- March 2013), 3: 36-40.
Singh, K.M.; Singh, R.K.P.; Meena, M.S.; Kumar, Abhay; Jha, A.K. and Kumar, Anjani (2013). Rural poverty in Jharkhand: an empirical exploration of socio-economic determinants using high frequency panel data. Available at : http://dx.doi.org/10.2139/ssrn.2330844
Singh, R.K.P.; Singh, K.M.; Kumar, Abhay; Meena, M.S.; Jha, A.K. and Kumar, Anjani (2013). Dimensions of rural poverty in Bihar: a vil-lage level study. Available at: http://dx.doi.org/10.2139/ssrn.2330841
Singh, K.M.; Singh, R.K.P.; Meena, M.S.; Kumar, Abhay; Jha, A.K. and Kumar, Anjani (2013). Determinants of rural poverty: an empirical study of socio-economic factors in Jharkhand, India. http://dx.doi.org/10.2139/ssrn.2226902
Singh, K. M.; Singh, R. K. P. and Kumar, Abhay (2013). A socio-economic study on adop-tion of modern agricultural technologies in Bihar, India. http://mpra.ub.uni-muenchen.de/52032/
Singh, K.M.; Singh, R.K.P. and Kumar, Anjani (2013). Male worker migration and women empowerment: The case of Bihar, India. http://mpra.ub.uni-muenchen.de/49385/
Singh, Mandhata; Ramkewal and Dwivedi, V. (2012). SRI: dhan utpadan ke sansadhan sara-nkshan takneek. Krishi Jyoti (April 12- March 2013), 3: 29-31.
Singh, Mandhata; Sultan, Md. Afroj; Ramkewal and Parwez, Arif (2012). Phasalo mein samekit kharpatwar prabandhan. Vindhya Krishi, Rabi 2012, ISSN No. 0974-9934. pp.4-5.

ICAR-RCER n Annual Report 2013-14 106 On Going Research Project
21. On-going Research Projects
Sl. No.
Project code Project title Name of PI & CO-PI Start year
Comp. year
Funding agency
Theme 1. Farming System Research Including Climate Resilient Agriculture1 Integrated Farming System and Cropping System for Eastern Region1.1 ICAR-RCER/ AICRP/ IFS/
EF/ 2010/ 25(i)Development of location specific Integrated farming System models for small and mar-ginal farmers of Bihar
Sanjeev Kumar, A. DeyA. K. Jain, S. S. SinghU. Kumar, N. Chandra
M. Idris
June2010
Dec 2012Ext.
March2014
PDFSR, AICRP
(Externally funded)
1.2 ICAR-RCER/ RCM/2011/ 25(ii)
Development of makhana based Integrated Farming System models for low land eco-system
L. KumarI.S. SinghV.K. Gupta
July2011
June2014
ICARRCER
1.3 ICAR-RCER/ RC Ranchi/ 2011/25(iii)
Development of location specific integrated farming system models for rainfed eco-sys-tem of eastern plateau hill region
B.K. Jha, S. K. NaikBikash Das, A. K. Singh,
R. S. Pan, S. MauryaA. K. Thakur, J. S. Choudhary
June2011
May2014
ICARRCER
1.4 ICAR-RCER/ EF/NAIP/2008/08
Developing sustainable farming system mod-els for prioritized micro watersheds in rainfed areas of Jharkhand
R. S. PanB. R. Jana
2008 March, 2014
PIU,NAIP
(Externally funded)
1.6 ICAR-RCER/ R.C Makhana/ 2011/ 117
Dynamics of nutrients under makhana and makhana based cropping system grown in inceptisols of Bihar
I.S. SinghV.K. GuptaL. Kumar
A. K.Singh
April2012
March2015
ICARRCER
2 Resource Conservation Technology 2.1 ICAR-RCER/ R.C Ranchi/
2011/98Resource conservation and methods of plant-ing in acid soil by vegetable based cropping system
B.K. Jha, S. K. NaikA. K. Thakur
J. S. Choudhary
June 2011
May2014
ICARRCER
2.2 ICAR-RCER/ IFAD/DCR/EF/2011/27
Accelerating RCTs adoption to improve food security and rural livelihoods while reducing adverse environ-mental impacts in Indo-Gangetic Plains (IFED)
Sanjeev KumarS. S. Singh, U. Kumar
P. K. SundaramShivani
June2011
April2013
IRRI
(Externally funded)
3. Climate Resilient Agriculture3.1 ICAR-RCER/ SEET/
2011/ 112Weather based forecasting for agricultural growth in eastern India
R.C. BharatiK. M. Singh, A. Haris A.
J. Mukherjee, U.R. Sangle
July2011
June2014
ICARRCER
3.2 ICAR-RCER/ DCR/ 2011/115
Weather crop-pest-disease interaction studies of major crops of eastern region
J. MukherjeeM. Idris, U. R. Sangle
July 2012
June2015
ICARRCER
3.3 ICAR-RCER/ EFP/NAIP/2009/19
Modeling the performance of a new major cropping system in eastern India in the light of projected climate change (NAIP)
S. S. Singh, R.C. Bharati Jan. 2009
Ext.2013
NAIP

On Going Research Project 107 ICAR-RCER n Annual Report 2013-14
Sl. No.
Project code Project title Name of PI & CO-PI Start year
Comp. year
Funding agency
3.4 ICAR-RCER / RC R / E.F./2011/29
Understanding the changes in host-pest inter-actions and dynamics in mango under climate change scenario (NICRA) (2011 -2013)
S. Kumar, Bikash Das,S. S. Mali,
J. S. Choudhary
Jan.2011
Jan.2014
NICRA(Externally
funded)3.5 ICAR-RCER /DLWM/
2012/126Land suitability classification for different crops using remote sensing and GIS
ManibhushanSurajit Mondal A. K. Singh, A. Upadhyaya
Jan. 2013
Dec. 2015
ICARRCER
Theme 2. Genetic Resource Management and Improvement of Field, Horticultural and Aquatic Crops
4 Varietal Development4.1 (a)
ICAR-RCER/ DCR/ 2010/ 84
Management of abiotic stress in rice through biotechnological approachesManagement of submergence tolerance through biotechnological approaches in rice grown in lowland ecosystem
Santosh KumarShivani
July2010
June2014
ICARRCER
4.1(b)
Genetic variability analysis and development of mapping population for drought tolerance in rice
Santosh KumarS. S. Singh
4.2 ICAR-RCER/ DCR/ 2011/ 93
Characterization and evaluation of elite geno-types and high yielding varieties of rice for aerobic condition
Santosh KumarS. S. Singh
July2011
June2014
ICARRCER
4.3 ICAR RCER/ FF /2011/ 30
Evaluation and development of drought toler-ant rice for eastern region (STRASA Phase-II)
Santosh KumarS. S. Singh, M. Idris
U. R. Sangle
July2011
June2014
IRRI(Externally
funded)4.4 ICAR-RCER/ EF/IRRI/
2012/33Improved rice based rainfed agricultural sys-tem (IRRAS) in Bihar state, India
S. S. Singh, S. Kumar A. K. Singh, U. R. Sangle
July2012
June2015
IRRI(Externally
funded)4.5 ICAR-RCER / DLWM/
2011 /116Varietal development of faba bean (Vicia faba L.) for nutritional security in eastern region
A. K. Singh, Santosh KumarU. R. Sangle,
P. K. Sundaram, I.S. Singh, R. S. Pan,
Janardan Jee
Sept.2011
July2014
ICARRCER
4.6 ICAR RCER/ RC Ranchi/ EF/2011/ 28
Developing national repository and creating facilities for DUS testing in mango, guava and litchi (Litchi chinensis)
Bikash Das June2011
June2014
PPV &FRA
(Externally funded)
4.7 ICAR-RCER/RC Ranchi/2010/ 83
Characterization of bacterial wilt resistance in brinjal using conventional and molecular ap-proaches
P. Bhavana, A. K. SinghJ. P. Sharma
Jan.2010
March2014
ICARRCER
4.8 ICAR-RCER/ HARP/ 2006/33
Evaluation of advance breeding lines and maintenance of breeding in Solanaceous and Cucurbitaceous vegetable crops
A. K. Singh R. S. Pan, P. Bhavana
2006 Ext.2014
ICARRCER
4.9 ICAR-RCER/ HARP/2006/34
Management of plant genetic resources and improvement of leafy and underutilized vegetable crops
R. S. Pan, A. K. SinghS. Kumar, Bikash Das
S. K. Naik
2006 Ext.2014
ICARRCER
4.10 ICAR-RCER / RC Ranchi/ 2012/ 128
Genetic enhancement of tomato for nematode and bacterial wilt resistance through molecu-lar markers
P. BhavanaA. K. Singh, S. Maurya
J. S. Choudhary
Jan.2013
Dec.2016
ICAR RCER
4.11 ICAR-RCER / HARP/ 2001/ 03
Plant genetic resource and improvement of fruit and ornamental crops
Bikash DasB. R. Jana, S. Kumar
2001 Long term
ICARRCER
4.12 ICAR-RCER/ RC Ranchi /2010/ 86
Standardization of inter-stock for induction of dwarfing in vigorous mango cultivars growing under eastern under eastern plateau and hill conditions
Bikash DasB. R. Jana
July2010
Aug.2015
ICARRCER
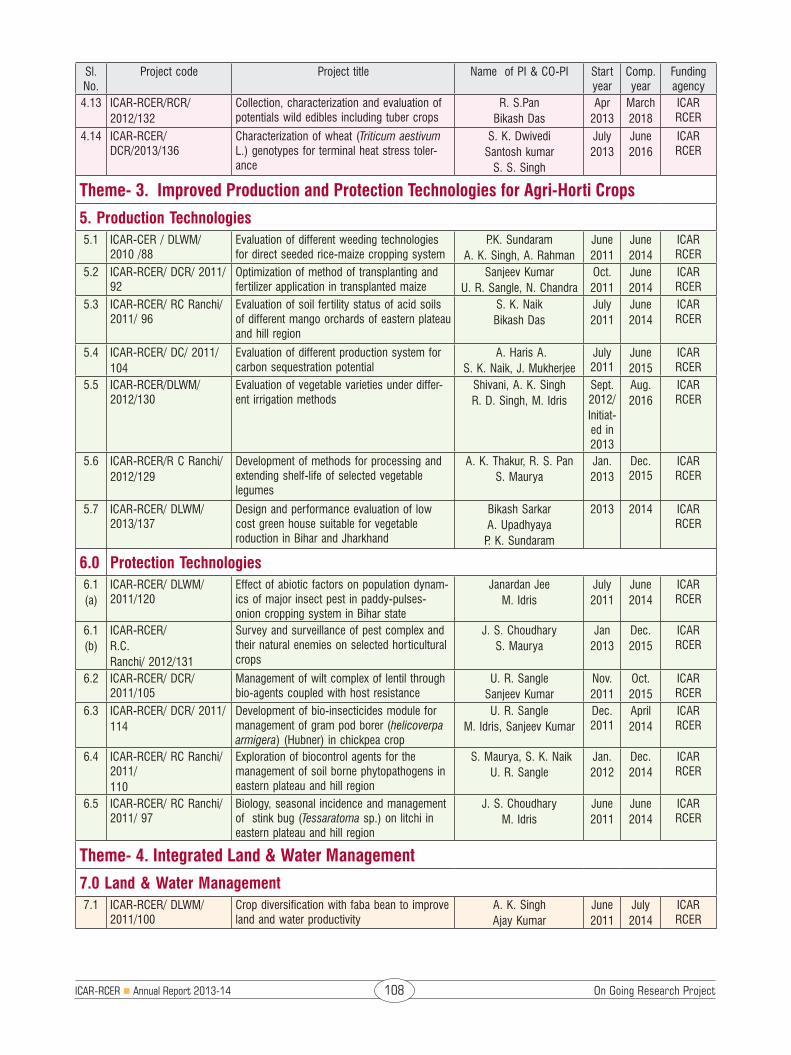
ICAR-RCER n Annual Report 2013-14 108 On Going Research Project
Sl. No.
Project code Project title Name of PI & CO-PI Start year
Comp. year
Funding agency
4.13 ICAR-RCER/RCR/2012/132
Collection, characterization and evaluation of potentials wild edibles including tuber crops
R. S.PanBikash Das
Apr2013
March2018
ICAR RCER
4.14 ICAR-RCER/ DCR/2013/136
Characterization of wheat (Triticum aestivum L.) genotypes for terminal heat stress toler-ance
S. K. DwivediSantosh kumar
S. S. Singh
July2013
June2016
ICAR RCER
Theme- 3. Improved Production and Protection Technologies for Agri-Horti Crops
5. Production Technologies5.1 ICAR-CER / DLWM/
2010 /88Evaluation of different weeding technologies for direct seeded rice-maize cropping system
P.K. SundaramA. K. Singh, A. Rahman
June2011
June2014
ICAR RCER
5.2 ICAR-RCER/ DCR/ 2011/ 92
Optimization of method of transplanting and fertilizer application in transplanted maize
Sanjeev KumarU. R. Sangle, N. Chandra
Oct.2011
June2014
ICAR RCER
5.3 ICAR-RCER/ RC Ranchi/ 2011/ 96
Evaluation of soil fertility status of acid soils of different mango orchards of eastern plateau and hill region
S. K. NaikBikash Das
July2011
June2014
ICAR RCER
5.4 ICAR-RCER/ DC/ 2011/104
Evaluation of different production system for carbon sequestration potential
A. Haris A.S. K. Naik, J. Mukherjee
July 2011
June2015
ICAR RCER
5.5 ICAR-RCER/DLWM/ 2012/130
Evaluation of vegetable varieties under differ-ent irrigation methods
Shivani, A. K. SinghR. D. Singh, M. Idris
Sept. 2012/Initiat-ed in 2013
Aug.2016
ICAR RCER
5.6 ICAR-RCER/R C Ranchi/2012/129
Development of methods for processing and extending shelf-life of selected vegetable legumes
A. K. Thakur, R. S. Pan S. Maurya
Jan.2013
Dec. 2015
ICAR RCER
5.7 ICAR-RCER/ DLWM/ 2013/137
Design and performance evaluation of low cost green house suitable for vegetable roduction in Bihar and Jharkhand
Bikash SarkarA. Upadhyaya
P. K. Sundaram
2013 2014 ICAR RCER
6.0 Protection Technologies6.1(a)
ICAR-RCER/ DLWM/ 2011/120
Effect of abiotic factors on population dynam-ics of major insect pest in paddy-pulses-onion cropping system in Bihar state
Janardan JeeM. Idris
July2011
June2014
ICAR RCER
6.1(b)
ICAR-RCER/R.C.Ranchi/ 2012/131
Survey and surveillance of pest complex and their natural enemies on selected horticultural crops
J. S. ChoudharyS. Maurya
Jan2013
Dec.2015
ICAR RCER
6.2 ICAR-RCER/ DCR/ 2011/105
Management of wilt complex of lentil through bio-agents coupled with host resistance
U. R. SangleSanjeev Kumar
Nov.2011
Oct.2015
ICAR RCER
6.3 ICAR-RCER/ DCR/ 2011/114
Development of bio-insecticides module for management of gram pod borer (helicoverpa armigera) (Hubner) in chickpea crop
U. R. SangleM. Idris, Sanjeev Kumar
Dec. 2011
April2014
ICAR RCER
6.4 ICAR-RCER/ RC Ranchi/ 2011/110
Exploration of biocontrol agents for the management of soil borne phytopathogens in eastern plateau and hill region
S. Maurya, S. K. NaikU. R. Sangle
Jan.2012
Dec.2014
ICAR RCER
6.5 ICAR-RCER/ RC Ranchi/ 2011/ 97
Biology, seasonal incidence and management of stink bug (Tessaratoma sp.) on litchi in eastern plateau and hill region
J. S. ChoudharyM. Idris
June2011
June2014
ICAR RCER
Theme- 4. Integrated Land & Water Management
7.0 Land & Water Management7.1 ICAR-RCER/ DLWM/
2011/100Crop diversification with faba bean to improve land and water productivity
A. K. SinghAjay Kumar
June2011
July2014
ICAR RCER
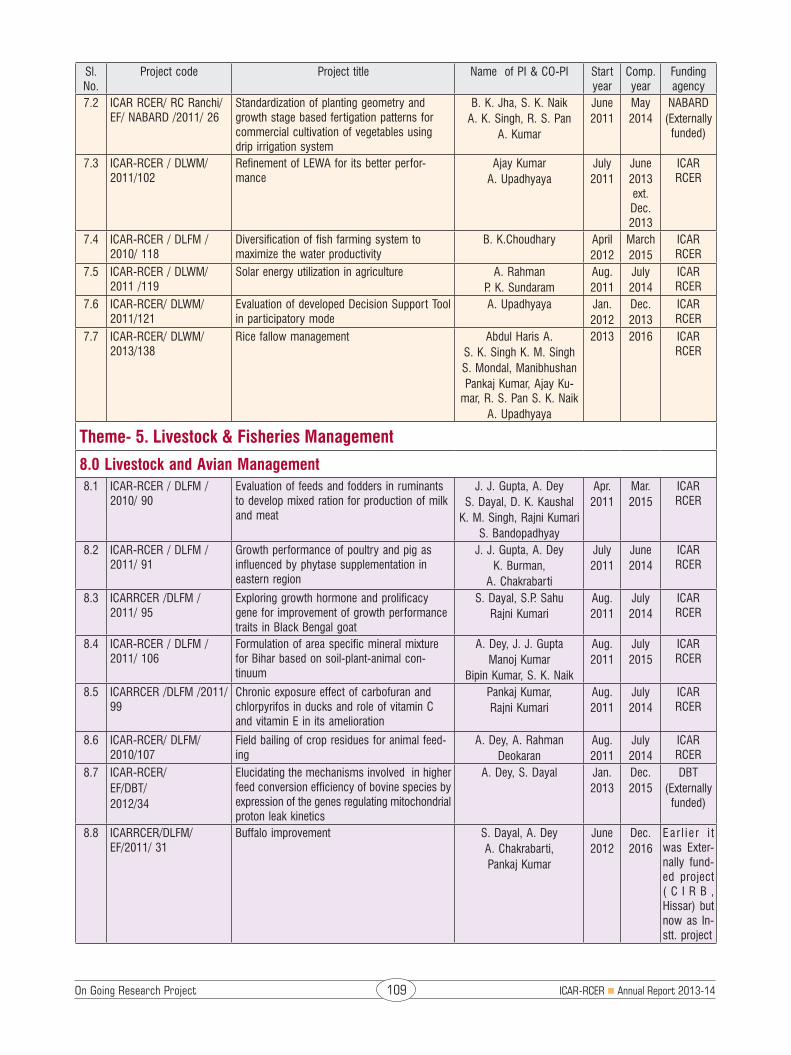
On Going Research Project 109 ICAR-RCER n Annual Report 2013-14
Sl. No.
Project code Project title Name of PI & CO-PI Start year
Comp. year
Funding agency
7.2 ICAR RCER/ RC Ranchi/ EF/ NABARD /2011/ 26
Standardization of planting geometry and growth stage based fertigation patterns for commercial cultivation of vegetables using drip irrigation system
B. K. Jha, S. K. Naik A. K. Singh, R. S. Pan
A. Kumar
June2011
May2014
NABARD(Externally
funded)
7.3 ICAR-RCER / DLWM/ 2011/102
Refinement of LEWA for its better perfor-mance
Ajay KumarA. Upadhyaya
July2011
June2013 ext. Dec. 2013
ICAR RCER
7.4 ICAR-RCER / DLFM / 2010/ 118
Diversification of fish farming system to maximize the water productivity
B. K.Choudhary April2012
March2015
ICAR RCER
7.5 ICAR-RCER / DLWM/ 2011 /119
Solar energy utilization in agriculture A. RahmanP. K. Sundaram
Aug.2011
July2014
ICAR RCER
7.6 ICAR-RCER/ DLWM/ 2011/121
Evaluation of developed Decision Support Tool in participatory mode
A. Upadhyaya Jan.2012
Dec.2013
ICAR RCER
7.7 ICAR-RCER/ DLWM/ 2013/138
Rice fallow management Abdul Haris A.S. K. Singh K. M. SinghS. Mondal, ManibhushanPankaj Kumar, Ajay Ku-
mar, R. S. Pan S. K. NaikA. Upadhyaya
2013 2016 ICAR RCER
Theme- 5. Livestock & Fisheries Management
8.0 Livestock and Avian Management8.1 ICAR-RCER / DLFM /
2010/ 90Evaluation of feeds and fodders in ruminants to develop mixed ration for production of milk and meat
J. J. Gupta, A. DeyS. Dayal, D. K. Kaushal
K. M. Singh, Rajni KumariS. Bandopadhyay
Apr.2011
Mar.2015
ICAR RCER
8.2 ICAR-RCER / DLFM / 2011/ 91
Growth performance of poultry and pig as influenced by phytase supplementation in eastern region
J. J. Gupta, A. DeyK. Burman,
A. Chakrabarti
July2011
June2014
ICAR RCER
8.3 ICARRCER /DLFM / 2011/ 95
Exploring growth hormone and prolificacy gene for improvement of growth performance traits in Black Bengal goat
S. Dayal, S.P. SahuRajni Kumari
Aug.2011
July2014
ICAR RCER
8.4 ICAR-RCER / DLFM / 2011/ 106
Formulation of area specific mineral mixture for Bihar based on soil-plant-animal con-tinuum
A. Dey, J. J. GuptaManoj Kumar
Bipin Kumar, S. K. Naik
Aug.2011
July2015
ICAR RCER
8.5 ICARRCER /DLFM /2011/ 99
Chronic exposure effect of carbofuran and chlorpyrifos in ducks and role of vitamin C and vitamin E in its amelioration
Pankaj Kumar, Rajni Kumari
Aug.2011
July2014
ICAR RCER
8.6 ICAR-RCER/ DLFM/ 2010/107
Field bailing of crop residues for animal feed-ing
A. Dey, A. RahmanDeokaran
Aug.2011
July2014
ICAR RCER
8.7 ICAR-RCER/EF/DBT/2012/34
Elucidating the mechanisms involved in higher feed conversion efficiency of bovine species by expression of the genes regulating mitochondrial proton leak kinetics
A. Dey, S. Dayal Jan.2013
Dec.2015
DBT(Externally
funded)
8.8 ICARRCER/DLFM/ EF/2011/ 31
Buffalo improvement S. Dayal, A. DeyA. Chakrabarti, Pankaj Kumar
June2012
Dec.2016
Ear l i e r i t was Exter-nally fund-ed project ( C I R B , Hissar) but now as In-stt. project
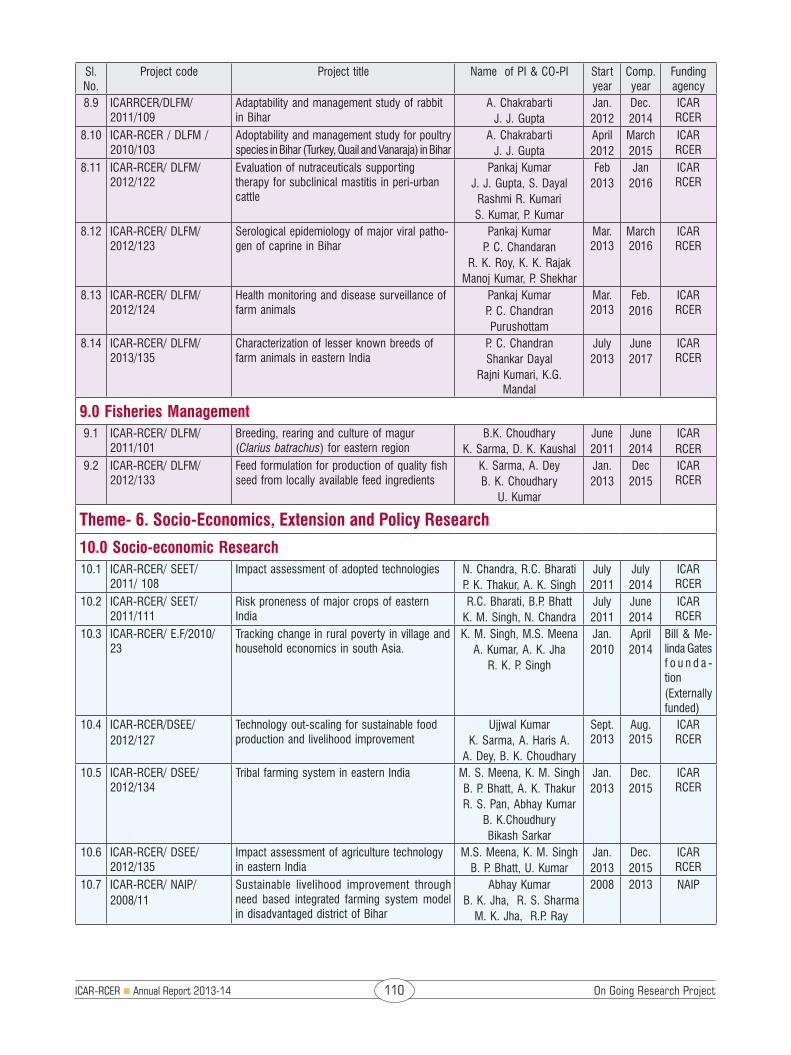
ICAR-RCER n Annual Report 2013-14 110 On Going Research Project
Sl. No.
Project code Project title Name of PI & CO-PI Start year
Comp. year
Funding agency
8.9 ICARRCER/DLFM/ 2011/109
Adaptability and management study of rabbit in Bihar
A. ChakrabartiJ. J. Gupta
Jan.2012
Dec.2014
ICAR RCER
8.10 ICAR-RCER / DLFM / 2010/103
Adoptability and management study for poultry species in Bihar (Turkey, Quail and Vanaraja) in Bihar
A. ChakrabartiJ. J. Gupta
April2012
March2015
ICAR RCER
8.11 ICAR-RCER/ DLFM/ 2012/122
Evaluation of nutraceuticals supporting therapy for subclinical mastitis in peri-urban cattle
Pankaj KumarJ. J. Gupta, S. Dayal
Rashmi R. KumariS. Kumar, P. Kumar
Feb2013
Jan2016
ICAR RCER
8.12 ICAR-RCER/ DLFM/ 2012/123
Serological epidemiology of major viral patho-gen of caprine in Bihar
Pankaj KumarP. C. Chandaran
R. K. Roy, K. K. RajakManoj Kumar, P. Shekhar
Mar. 2013
March 2016
ICAR RCER
8.13 ICAR-RCER/ DLFM/ 2012/124
Health monitoring and disease surveillance of farm animals
Pankaj KumarP. C. ChandranPurushottam
Mar. 2013
Feb.2016
ICAR RCER
8.14 ICAR-RCER/ DLFM/ 2013/135
Characterization of lesser known breeds of farm animals in eastern India
P. C. ChandranShankar Dayal
Rajni Kumari, K.G. Mandal
July2013
June2017
ICAR RCER
9.0 Fisheries Management 9.1 ICAR-RCER/ DLFM/
2011/101Breeding, rearing and culture of magur (Clarius batrachus) for eastern region
B.K. ChoudharyK. Sarma, D. K. Kaushal
June2011
June2014
ICARRCER
9.2 ICAR-RCER/ DLFM/ 2012/133
Feed formulation for production of quality fish seed from locally available feed ingredients
K. Sarma, A. DeyB. K. Choudhary
U. Kumar
Jan.2013
Dec2015
ICAR RCER
Theme- 6. Socio-Economics, Extension and Policy Research
10.0 Socio-economic Research10.1 ICAR-RCER/ SEET/
2011/ 108Impact assessment of adopted technologies N. Chandra, R.C. Bharati
P. K. Thakur, A. K. SinghJuly2011
July2014
ICAR RCER
10.2 ICAR-RCER/ SEET/ 2011/111
Risk proneness of major crops of eastern India
R.C. Bharati, B.P. BhattK. M. Singh, N. Chandra
July2011
June2014
ICAR RCER
10.3 ICAR-RCER/ E.F/2010/ 23
Tracking change in rural poverty in village and household economics in south Asia.
K. M. Singh, M.S. MeenaA. Kumar, A. K. Jha
R. K. P. Singh
Jan.2010
April2014
Bill & Me-linda Gates f o u n d a -tion(Externally funded)
10.4 ICAR-RCER/DSEE/2012/127
Technology out-scaling for sustainable food production and livelihood improvement
Ujjwal KumarK. Sarma, A. Haris A.
A. Dey, B. K. Choudhary
Sept. 2013
Aug. 2015
ICAR RCER
10.5 ICAR-RCER/ DSEE/ 2012/134
Tribal farming system in eastern India M. S. Meena, K. M. SinghB. P. Bhatt, A. K. ThakurR. S. Pan, Abhay Kumar
B. K.ChoudhuryBikash Sarkar
Jan.2013
Dec.2015
ICAR RCER
10.6 ICAR-RCER/ DSEE/ 2012/135
Impact assessment of agriculture technology in eastern India
M.S. Meena, K. M. SinghB. P. Bhatt, U. Kumar
Jan.2013
Dec.2015
ICAR RCER
10.7 ICAR-RCER/ NAIP/2008/11
Sustainable livelihood improvement through need based integrated farming system model in disadvantaged district of Bihar
Abhay Kumar B. K. Jha, R. S. Sharma
M. K. Jha, R.P. Ray
2008 2013 NAIP

Contributors 111 ICAR-RCER n Annual Report 2013-14
Division of Land and Water ManagementScientists
Dr. A. Upadhyaya Pr. Scientist (SWCE) & HeadDr. Janardan Jee, Pr. Scientist (Ento.)Dr. S. K. Singh, Pr. Scientist (Agron.) Dr. A. Rahman, Pr. Scientist (Phy.)Dr. Anil Kr. Singh, Sr Scientist (Agron.) Dr. Bikash Sarkar, Sr. Scientist (FMPE)Dr. Ajay Kumar, Sr. Scientist (SWCE) Mr. Manibhushan, Scientist(SS) (Comp. App.)Er. P. K. Sundaram , Scientist (FMPE)Mr. Surajit Mondal, Scientist (Soil Science)Mr. M. K.Meena, Scientist (Soil Chem.) (on Study
leave)
Technical Officer
Sh. P. K. Singh, Technical Officer (T-5)
Division of Crop ResearchScientists
Dr. S. S. Singh, Pr. Scientist (Agronomy) & Head Dr. A. R. Khan, Pr. Scientist (Soil Phy.)Dr. Abdul Haris A., Pr. Scientist (Agro.)Dr. Md. Idris, Pr. Scientist (Entomology)Dr. Sanjeev Kumar, Sr. Scientist (Agronomy)Dr. Narayan Bhakta, Sr. Scientist (Genetics & Plant
Breeding)Dr. U.R. Sangle, Sr. Scientist (Plant Pathology)Dr. Santosh Kumar, Scientist (Plant Breeding)Dr. S. K. Dwivedi, Scientist (Plant Physiology)
Technical Officer
Sh. Anil Kumar, Technical Officer (T-5)
Division of Livestock and Fishery ManagementScientists
Dr. A. Dey, Pr. Scientist (Animal Nutrition) & Head
Dr. J. J. Gupta, Pr. Scientist. (Animal Nutrition)Dr. Kamal Sharma, Pr. Scientist (Fishery)Dr. A. K. Jain, Sr. Scientist (Fish and Fishery
Science)Dr. S. Dayal, Sr. Scientist (Animal Gen. &
Breeding)Dr. Asit Chakrabarti, Sr. Scientist (LPM)Dr. P. K. Ray, Scientist (Veterinary Pathology)
(on Study leave)Dr. B. K. Chaudhary, Scientist (Fish & Fishery
Science)Dr. P. C. Chandran, Scientist (Animal Genetics
and Breeding) Dr. S. J. Pandian, Scientist. (Veterinary Medicine)Dr. Rajni Kumari, Scientist (Animal Biotechnol-
ogy)Dr. Pankaj Kumar, Scientist (Veterinary
Medicine)
Technical Officers
Dr. S. K. Barari, Technical Officer (T-7-8)
Division of Socio-Economics and ExtensionScientists
Dr. K. M. Singh, Pr. Scientist (Agril. Econ) & Head
Dr. Abhay Kumar, Pr. Scientist (Agril. Stat.)Dr. Ujjwal Kumar, Pr. Scientist (Agril. Extn.)Dr. R. C. Bharati, Pr. Scientist (Agril. Stat.)Dr. N. Chandra, Sr. Scientist (Agril. Econ.)
Technical Officers
Sh. V. K.Tiwari, Technical Officer (T-5)Sh Sanjay Rajput, Technical Officer (T-5)
Performance Monitoring and Evaluation CellScientists
Dr. R. D.Singh, Pr. Scientist (Agron) and HeadDr. (Mrs) Shivani, Sr. Scientist (Agron.)
22. Contributors

ICAR-RCER n Annual Report 2013-14 112 Contributors
Technical Officer
Sh. Kishan Singh, Technical Officer (T-7-8)Sh. Sarfaraj Ahmad, Prog. Asstt. Computer (T-4)
Farm SectionDr. A. K. Khan, Farm Manager (T-9) Sh. Hari Shankar, Technical Officer (T-7-8)Sh. R. K. Tiwari, Technical Officer (T-5)
Workshop and Estate SectionSh. M. L. Swarnkar, Workshop Engineer (T-7-8)
ICAR RCER, Research Centre, RanchiScientists
Dr. S. Kumar, Pr. Scientist (Plant Pathology) & Head
Dr. A. K. Singh, Pr. Scientist (Horticulture)Dr. R. S. Pan, Pr. Scientist (Horticulture)Dr. A. K. Thakur, Pr. Scientist (AS & PE)Dr. B. K. Jha, Sr. Scientist (Horticulture)Dr. Bikash Das, Sr. Scientist (Horticulture) Dr. S. K. Naik, Sr. Scientist (Soil Sci.-Soil Chemistry
/ Fertility / Microbiology)Dr. Sudarshan Maurya, Sr. Scientist (Plant Pathol-
ogy)Dr. B. R. Jana, Scientist (Horticulture)Dr. (Mrs.) P. Bhavana, Scientist (Plant Breeding)Dr. Jaipal Singh Choudhary, Scientist (Entomol-
ogy)Er. S. S. Mali, Scientist (CWC) (on Study leave)Ms. R. Shinde, Scientist
Technical Officers
Sh. Y. N. Pathak, Technical Officer (T-6)Sh. D. K. Sah, Technical Officer (T-6)Sh. Paul Sanjay Sircar, Technical Officer-Computer
(T-6)Sh. Om Prakash, Technical Officer (T-5)Sh. Gokul Baraik, Technical Officer (T-5)Sh. Chandrakant, Technical Officer (T-5)Sh. Ganga Ram, Technical Officer (T-5)Sh. Birendra Prasad Mishra, Technical Officer
(T-5)Sh. Arun Kumar, Technical Officer (T-5)Sh. M. K. Pandey, Technical Officer- Library
(T-5)Sh. Kushal Kesariar, Technical Officer (T-5)Sh. Dhananjay Kumar, Technical Officer (T-5)Sh. Chandrashekher Prasad, Technical Officer
(T-5)Sh. Birendra Prasad Srivastava, Technical Officer
(T-5)Sh. Pradeep Kumar Singh, Technical Officer (T-5)Sh. Suresh Kumar, Technical Officer (T-5)Sh. Kishore Kumar, Technical Officer (Driver)
(T-5)
ICAR RCER, Research Centre Makhana, Darb-hangaScientists
Dr. V. K.Gupta, Pr. Scientist (Plant Breeding) & Head
Dr. Lokendra Kumar, Sr. Scientist (Plant Breed-ing)
Dr. I. S. Singh, Sr. Scientist (Soil Science)
ICAR RCER, Krishi Vigyan Kendra, BuxarSubject Matter Specialist
Dr. V. Dwivedi, Programme CoordinatorDr. Deokaran, SMS (Soil Sci.)Dr. Ramakrishna Roy, SMS (Animal Sci.)Dr. R. C. Verma, SMS (Hort.)Mr. Ramkewal, SMS (Plant Protection)Dr. Hari Govind Jiswal, SMS (Plant Breeding)Dr. Mandhata Singh, SMS (Agronomy)
Technical
Sh. Arif Parwez, Farm Manager