okf"kZd izfrosnu - Annual Report 2018-19 - krishi icar
274
-
Upload
khangminh22 -
Category
Documents
-
view
0 -
download
0
Transcript of okf"kZd izfrosnu - Annual Report 2018-19 - krishi icar

Annual Report2018-19
ISO : 9001 : 2015
okf"kZd�izfrosnu
ICAR-CENTRAL SOIL SALINITY RESEARCH INSTITUTEKARNAL - 132001 (HARYANA)
Citation Annual Report, 2018-19, ICAR-Central Soil Salinity Research Institute, Karnal-132001, Haryana, India
Edited by P. C. Sharma, Anshuman Singh and Madhu Choudhary
Compiled by Madan Singh
Photography D.B. Thapa
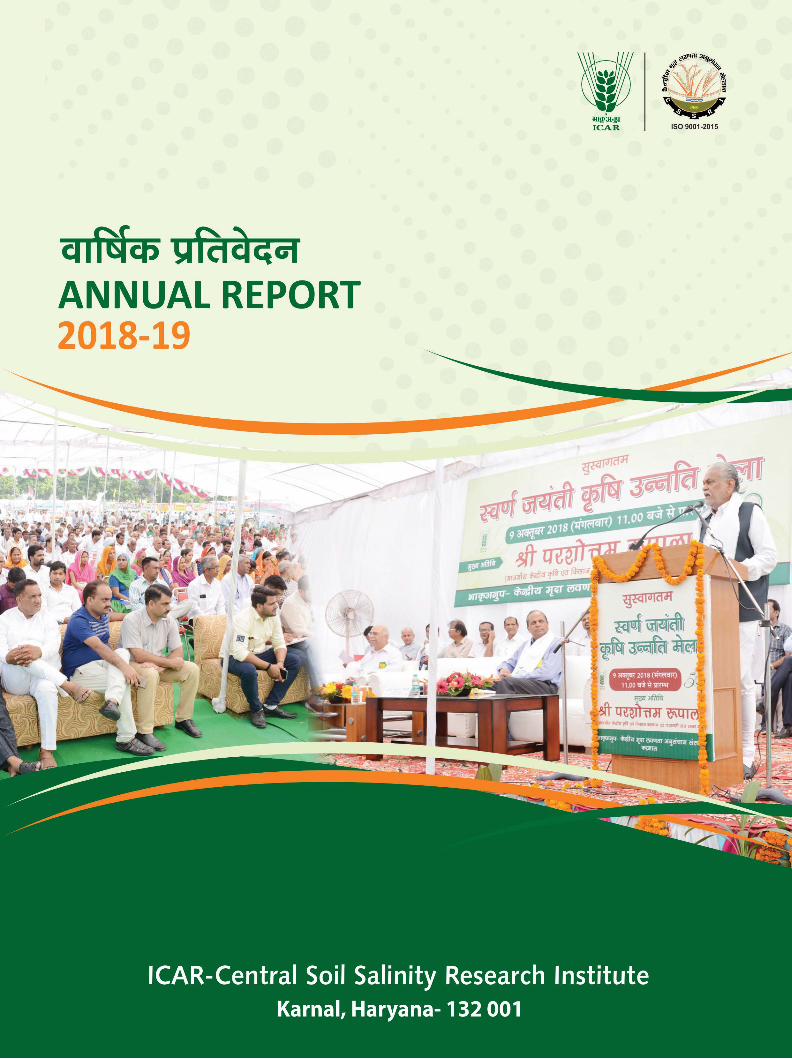
Cover Photo Swarn Jayanti Krishi Unnati Mela
Published by Director, ICAR-Central Soil Salinity Research Institute , Karnal-132001, India Telephone : + 91-184-2290501; Fax +91-184-2290480,2292489 Email: [email protected]; Website: www.cssri.org, cssri.res.in
Printing Aaron Media UG-17, First Floor, Super Mall, Sector-12, Karnal | +91-98964-33225 Email : [email protected]
ISO 9001-2015
okf"kZd�izfrosnuANNUAL REPORT2018-19
ICAR-Central Soil Salinity Research InstituteKarnal, Haryana- 132 001
ContentsPreface 01
lkjka'k 03
Executive Summary 09
Introduction 15
Research Achievements
Database on Salt Affected Soils 23
Reclamation and Management of Alkali Soils 26
Management of Waterlogged/Saline Soils 38
Management of Marginal Quality Waters 53
Crop Improvement for Salinity, Alkalinity and Waterlogging Stresses 64
Alternate Land Use 93
Reclamation and Management of Alkali Soils of Central and Eastern Gangetic Plains 102
Reclamation and Management of Salt Affected Vertisols 131
Reclamation and Management of Coastal Saline Soils 151
AICRP on Management of Salt Affected Soils and Use of Saline Water in Agriculture 185
Technology Assessed and Transferred 198
Miscellaneous
Trainings in India and Abroad 211
Deputation of Scientists Abroad 212
Awards and Recognitions 213
Linkages and Collaborations 214
Publications 217
Conference/ Seminar/ Symposia/Workshop papers 224
Technical Bulletin/Popular Article/Folder 233
Book/Manual /Chapter 234
Books/Training Mannual/Chapter 236
Participation In Conference/Seminar/Symposium/Workshop 237
List of On-going Projects 239
Institute Activities 245
Workshop, Seminar, Training, Foundation Day and Kisan Mela organised 247
List of Scientific, Technical and Administrative Personnel 261
Weather Report, 2018 264
Mandate
1
2
3
4
Developing technologies for reclamation and management of salt affected soils and use of poor quality irrigation waters in different agro-ecological regions of India
Evaluate and recommend strategies that promote adoption of preventive/ameliorative technology
Coordinate/support the network of research for generating and testing location speci�c technologies
Centre for training in salinity researches in the country
Preface
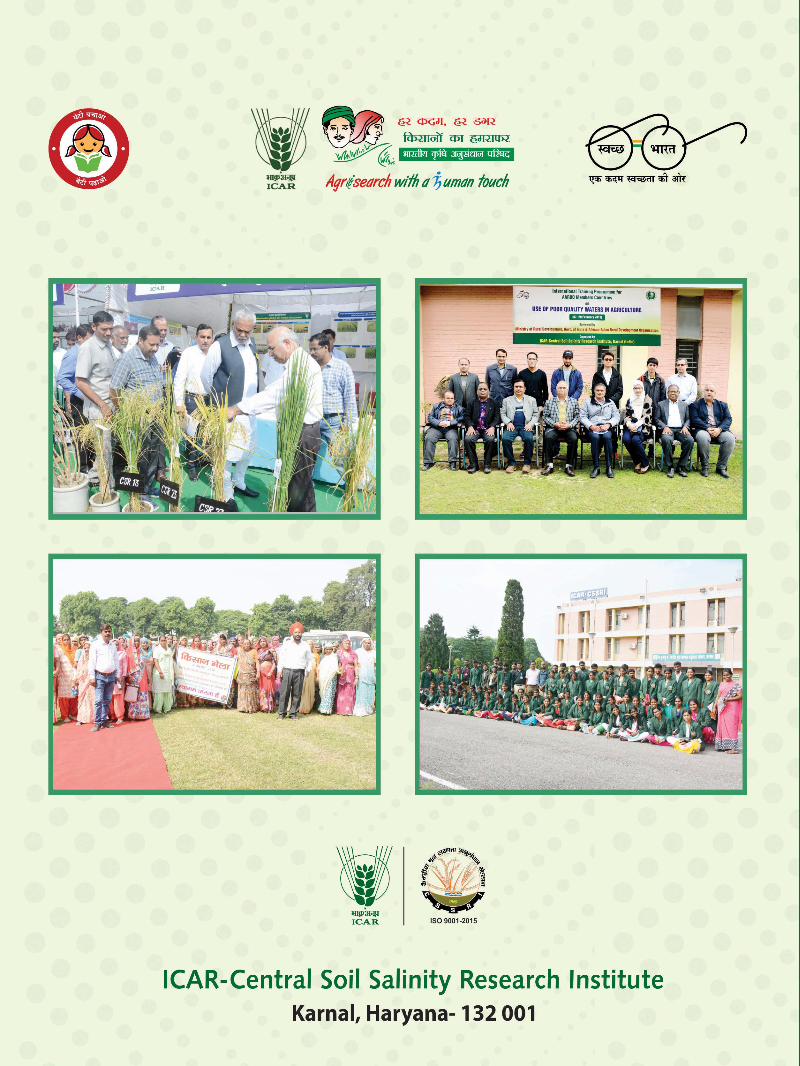
Salt-induced land degradation and the accompanying problems like drought and waterlogging continue to pose serious threats to the environmental sustainability and livelihood security in several irrigated and dryland areas transcending continental boundaries. Rapidly growing economies like India witnessing burgeoning population, rising food demands and diversifying diets on one hand; and �erce competition for prime lands and fresh water, natural resource degradation and climate change impacts on other remain particularly highly vulnerable to salinity onslaught. Exponential increase in secondary salinity problem has only added insult to the injury, setting the alarm bells ringing in some most productive agricultural regions across the globe. In tune with the global initiatives like the 'Sustainable Development Goals' (SDGs) placing a critical emphasis on sustainable soil and water management, we remain committed to halting salinization of new areas and reviving the productivity of salty lands and poor quality waters by developing and disseminating feasible salinity management solutions in every nook and corner of the country. It is pertinent to mention that instead of almost exclusive focus on 'reclamation', concerted efforts for making salt-affected lands sustainable income generating assets resilient to multiple external shocks are inevitable. Some critical areas of attention for accelerating the pace of soil restoration in coming years would be precision salinity mapping, development of potential alternative amendments for alkali lands, removing barriers in the adoption of sub-surface drainage technology, increasing area coverage under salt tolerant cultivars and disseminating proven resource conservation technologies to the reclaimed areas.
The Annual Report for the period 2018-19 brings out the major achievements in the areas of technology development, transfer and farmers' empowerment. Some major research breakthroughs during the period under report were : Identi�cation of promising salt tolerant rice line, CSR 59, Development of GypKIT: A Field Testing Kit for the Rapid Assessment of Sodic Soil, Identi�cation of Marine Gypsum : A potential alternative to Mineral Gypsum for Reclaiming Sodic Soils, Resource conservation techniques for
Pref
ace
Ann
ual R
epor
t 201
8-19
01
sustainable rice-wheat cultivation, Integrated nutrient management for maximizing the yield and factor productivity in desi cotton-based cropping systems in saline Vertisols, and the promotion of land shaping techniques as farming business models in coastal saline areas, Institute produced 8.35 tonnes of breeder seeds of rice, wheat and mustard for distribution among various agencies during the period under report. Different capacity development programmes were organized to enhance the knowledge and skills of the
thfarmers and farm women. A pre-Rabi Kisan Mela, organized on 9 October, 2018 on the Main Campus, witnessed the presence of over 500 farmers and extension workers. A total of 5 pre-Rabi and 5 pre-Kharif Kisan Gosthis were organized under 'Mera Gaon Mera Gaurav' programme in salinity affected parts of Haryana, Uttar Pradesh, West Bengal and Gujarat states involving over 2000 farmers. Similarly, 215 front line demonstrations on salt tolerant crop varieties were also conducted during this period. Rabi Kisan Mela was
thorganized on 16 March, 2019 at Habri village of Kaithal district. About 1000 farmers, school students and extension workers attended the Mela. During 2018-19, a total of 8 exhibitions were also organized at different research institutions and developmental agencies.
'Swachh Bharat Abhiyan' was organized periodically on the Main Campus, at Regional Research Stations and in some of the adopted villages to spread the message that keeping homes and surroundings clean was critical to human well being. National Productivity week was celebrated during 12-18 February, 2019 with the aim to enhance agricultural productivity by increased adoption of appropriate technologies developed
st thby the Institute. Institute celebrated its 51 Foundation Day on 19 March 2019. Chief Guest Dr. Ashok Dalwai, CEO, National Rainfed Area Authority, Govt of India, in his foundation day lecture, exhorted the need for integrated policy and planning for the productive management of salt-affected lands.
thA two-day meeting (2-3 November 2018) of 25 ICAR Regional Committee Zone-V (Punjab, Haryana & Delhi) organised at ICAR-CSSRI, Karnal was inaugurated by Shri Om Prakash Dhankar, Hon'ble Minister for Agriculture and Farmers Welfare, Government of Haryana. Biennial Workshop of AICRP on Management of Salt Affected Soils and Use of Saline Water in Agriculture was organized during 5-6 February 2019. Golden Jubilee International Salinity Conference (GJISC- 2019) was organized from 7-9 February, 2019 in collaboration of Indian Society of Soil Salinity and Water Quality, Karnal. In his valedictory address, Chief Guest Prof. Ramesh Chand, Member, NITI Aayog applauded the ICAR-CSSRI's illustrious journey of �ve decades that has led to the productive use of about 2.14 Million ha salt affected area in environmentally harsh conditions. Hindi Pakhwara was celebrated during September, 14-28, 2018.
I express my gratitude to Dr. Trilochan Mohapatra, Secretary, DARE and Director General, ICAR, New Delhi, Dr. K. Alagusundaram, DDG (AE & NRM), ICAR, New Delhi and Dr. S. K. Chaudhari, ADG (SWM) for their continued guidance and support. The efforts of Dr. Anshuman Singh and Shri Madan Singh in compilation, editing and timely printing of the Annual Report are commendable. I thank my colleagues for providing the material for the timely publication of the report.
I am convinced that the information furnished in this report will provide valuable insights to the readers about the current R&D efforts, trends and constraints in salinity management in agriculture. Suggestions/inputs from the readers are welcome to further improve the quality of the Annual Report.
(Parbodh Chander Sharma)
Director
02
lkjka'ko"kZ 1969 esa djuky ¼gfj;k.kk½ esa LFkkfir dsUnzh; e`nk yo.krk vuqla/kku laLFkku ,d izeq[k vuqla/kku laxBu gSA ;g ns”k ds fofHkUu d`f"k ikfjfLFkfrdh {ks=ksa esa yo.krk izca/ku ,oa d`f"k esa fuEu xq.koÙkk okys ty ds iz;ksx ij cgqfo"k;d vuqla/kku dk;ksZa ds fy, lefiZr gSA eq[;ky; esa cgqfo"k;d vuqla/kku dk;ZØe pkj foHkkxksa&e`nk ,oa Qly izca/k] flapkbZ ,oa tyfudkl vfHk;kaf=dh] Qly lq/kkj vkSj lkekftd foKku vuqla/kku }kjk lapkfyr fd;s tkrs gSaA fofHkUu d`f"k tyok;q {ks=ksa dh fofufnZ"V vuqla/kku vko”;drkvksa dks iwjk djus ds fy, laLFkku ds rhu {ks=h; vuqla/kku dsUnz&dsfuax Vkmu ¼i- caxky½] Hk:p ¼xqtjkr½ vkSj y[kuŽ ¼mÙkj izns”k½ Øe”k% leqnz rVh; yo.krk] yo.kxzLr oVhZlksy vkSj lrgh ty Lrj okyh e/; ,oa iwohZ fla/kq&xaxk ds eSnkuksa dh {kkjh; e`nk laca/kh leL;kvksa ds funku gsrq dk;Zjr gSaA laLFkku esa ,d vf[ky Hkkjrh; lefUor ifj;kstuk yo.kxzLr Hkwfe;ksa ds izca/ku vkjS [kkj s ikuh d s df̀"k e as i;z kxs grs q fofHkUu ikfjfLFkfrdh {k=s k&as vkxjk] dkuijq ] fglkj] bna kjS ] chdkujs ] ckiVyk] xxa koVh vkjS f=pjq kiYyh cfBMa k ¼ita kc½] iuoys ¼egkjk"V½ª ] iksVZCys;j ¼v.Mseku ,oa fudksckj vkbZyS.M ½] ,oa okbZfVYyk ¼dsjy½ esa dk;Zjr gSaA lanfHkZr vof/k ds fy, fofHkUUk egRoiw.kZ {ks=ksa esa laLFkku dh dqN izeq[k vuqla/kku miyfC/k;k¡ fuEufyf[kr gSaA
lh,lvkj 59% yo.k lfg".kq /kku iztkfr
dqy lkr pkoy ds thuksVkbi] lh,lvkj 59, lh,lvkj 36 ¼{kkjh;rk ds fy, jk"Vªh; tk¡p½] lh,lvkj 23 ¼yo.krk ds fy, jk"Vªh; psd½] lh,lvkj 10 ¼psd½] dsvkj 09003 ¼DokyhQkbax pkoy ykbu vkSj vkÃÃVh 24525½] mit dh tkap ¼t;k½ ½ vkSj LFkkuh; tkap ¼lh,lvkj 27½ dk ewY;kadu 7-5 ds ih,p vkSj 7-5&9-0 ds ih,pbZ ds lkFk lh,l,lvkjvkbZ&djuky ds [kkjk ruko dh fLFkfr esa fd;k x;k Fkk] vkSj uSu] ikuhir ds 8-0 vkSj bZlh ds lkFk 8-0&16-0 ds bZlh ij rhu [kjhQ lhtu ¼2014½A 2015 vkSj 2016½ mPp mit ued lfg".kq pkoy thuksVkbi ds fodkl ds mís'; ls iwjh rjg ls ;k–fPNd
Cy‚d fMtkbu ds rhu çfr—fr ds lkFkA 50% Qwyksa] iSfudYl / m vkSj vukt dh mit ds 2
fnuksa ds voyksdu ntZ fd, x,A 2014 esa] lh,lvkj 59 us 8%] 94%] 10%] 7% vkSj 8% ij lh,lvkj 36 ¼{kkjh; psd½] t;k ¼;hYM psd½] lh,lvkj 10] yksdy pkSd vkSj lh,lvkj 23 ls vf/kd Js"Brk dk ykHk fn[kk;kA gfj;k.kk ds ikuhir vkSj djuky ftyksa esa fLFkfr;k¡A 2015 esa] lh,lvkj 59 us lh,lvkj 36 ¼{kkjh; psd½] t;k ¼;hYM psd½] lh,lvkj 10] yksdy psd] vkSj dsvkj 09003 ij 4%] 174%] 26%] 2% vkSj 28% ls Js"Brk dk ykHk fn[kk;kA½ gfj;k.kk esa ikuhir vkSj djuky ds ued çHkkfor LFkkuksa esa Øe'kA 2016 ds nkSjku] lh,lvkj 59 us lh,lvkj 36 ¼{kkjh; psd½] t;k ¼;hYM psd½] lh,lvkj 10] yksdy psd] lh,lvkj 23 vkSj dsvkj 09003 ij 66%] 722%] 42%] 61%] 75% vkSj 39 ls Js"Brk dk ykHk fn[kk;kA ¼gfj;k.kk esa ikuhir vkSj djuky ds ued çHkkfor LFkkuksa esa Øe'k% ;ksX;rk½A pkoy ykbu lh,lvkj 59 [kkjs ruko ds rgr 18 çfr'kr vukt dh mit ls vf/kd jk"Vªh; tkap ¼ lh,lvkj 23½ ls
vkxs fudy x;kA lh,lvkj 59 ykbu dk çn'kZu fiNys o"kksaZ esa 2945 fdyksxzke / gsDVs;j dh vkSlr mit {kerk ds lkFk LFkkuksa ij fLFkj FkkA
lh,lvkj 59 dk çn'kZu [kkjk ruko okys LFkkuksa esa yxkrkj rhu o"kksaZ rd [kkjsiu ds v/khu jgkA blus lh,lvkj 36 ¼us'kuy psd½] t;k ¼;hYM psd½] lh,lvkj 10] yksdy psd]
lkjka'k
Ann
ual R
epor
t 201
8-19
03
lh,lvkj 23 vkSj dsvkj 09003 ¼DokfyQkbax oSjkbVh vkÃÃVh 24538½ ls vf/kd Js"Brk fn[kkbZA pkoy ykbu lh,lvkj 59 dk mi;ksx vkxs ds çtuu dk;ZØe esa fd;k tk ldrk gS rkfd [kkjs ruko okys {ks=ksa esa pkoy dh iSnkokj c<+kbZ tk ldsA
ftifdV % Ålj e`nk vkadyu ds fy, ,d QhYM ijh{k.k fdV
{kkjh; e`nkvksa esa mifLFkr fofues; lksfM;e dh vf/kd ek=k vf/kdka'k ikS/kksa ds fodkl dks çfrdwy :i ls çHkkfor djrh gSA ftIle lLrk ,oa vklkuh ls miyC/k gksus ds dkj.k Ålj e`nk lq/kkj gsrq O;kid :i ls iz;qDr lq/kkjd gSA gkykafd] Ålj e`nk ds lq/kkj gsrq ftIle (CaSO 2H O) dh okafNr ek=k fofHkUu dkjdksa tSls lksfM;e lar`fIr dh ek=k] e`nk dh 4 2
lajpuk] okafNr lq/kkj dh fMxzh] ikuh dh xq.koÙkk] mxk;s tkus okyh Qlysa vkfn dkjdksa ij fuHkZj djrh gSA Ålj e`nk ds jklk;fud lq/kkj gsrq ftIle dh mfpr ek=k dk vuqeku yxkuk cgqr vko';d gS D;ksafd t:jr ls T;knk ;k de ftIle ds iz;ksx ls e`nk ,oa i;kZoj.k ij izfrdwy izHkko iM+ ldrs gaSA Ålj e`nk dh ftIle vko';drk ds fu/kkZj.k ds fy, ç;ksx'kkyk fof/k cgqr dfBu vkSj le; ysus okyh gSA pwafd vf/kdka'k ç;ksx'kkykvksa esa ftIle vko';drk ds vkadyu ds fy, fo'ks"kKrk vkSj lqfo/kkvksa dh deh gksrh gS] blfy, e`nk {kkjh;rk vkSj ftIle dh vko';drk ds Rofjr vkadyu ds fy, ,d fdV ¼^fti&fdV^½ fodflr dh xbZ gSA ;g fdV {ks= dk;ZdrkZvksa vuqla/kku o lacaf/kr foHkkxksa ds vf/kdkfj;ksa tks {kkjh; e`nkvksa ds lq/kkj ds bPNqd gSa] gsrq ykHkdkjh gSA [kfut ftIle dh ek=k dk vkadyu djus ds bPNqd fdlku bl fdV dk mi;ksx vklkuh ls dj ldrs gSaA Hkkjrh; —f"k vuqla/kku ifj"kn }kjk bl fdV ds O;kolk;hdj.k dh eatwjh ns nh xbZ gSA çR;sd fdV dks lHkh vko';d jlk;uksa ds lkFk miyC/k djk;k tkrk gS ftUgsa jhfQy Hkh fd;k tk ldrk gSA fdV ds lkFk fganh o vaxzsth Hkk"kkvksa esa vuqns'k eSuqvy Hkh miyC/k djk;k x;k gSA bl QhYM fdV dks bl rjg ls rS;kj fd;k x;k gS fd blds iz;ksx gsrq fctyh ;k vU; mtkZ lzksr dh vko';drk ugha gksrh gSA bl fdV ds iz;ksx }kjk ftIle vko';drk dk Rofjr vkadyu dj ftIle dh mfpr ek=k dk ç;ksx laHko gSA bl fdV dk ikjaifjd ç;ksx'kkyk fof/k ds lkFk ijh{k.k vkSj lR;kiu Hkh fd;k x;k gSA
leqnzh ftIle% {kkjh; e`nkvksa ds lq/kkj gsrq ,d n{k oSdfYid lq/kkjd
Hkkd`vuqi&dsUnzh; e`nk yo.krk vuqla/kku laLFkku] {ks=h; vuqla/kku dsUnz] y[kuÅ }kjk lapkfyr iz{ks= iz;ksx®a us bafxr fd;k fd {kkjh; e`nkvksa dh mRikndrk c<+kus gsrq [kfut ftIle ds LFkku ij leqnzh ftIle ,d O;ogk;Z lq/kkjd gks ldrk gSA nksuksa e`nk lq/kkjd ¼[kfut ftIle ,oa leqnzh ftIle½ ftIle ekax ¼thvkj½ ds vk/kkj ij iz;ksx fd, x,A [kjhQ] 2018 esa /kku dh mit ¼4-11 Vu@gs-½ 25 thvkj [kfut ftIle $ 25 thvkj leqnzh ftIle mipkj esa vU; mipkjksa dh rqyuk esa vf/kd Fkh vfirq lkaf[dh; n`f"V ls ;g 50 thvkj [kfut ftIle $ 50 thvkj leqnzh ftIle mipkj ds lerqY; FkhA e`nk ih,p esa lokZf/kd fxjkoV Hkh 25 thvkj [kfut ftIle $ 25 thvkj leqnzh ftIle mipkj esa ns[kh xbZA lq/kkjs x, Hkw[k.Mksa esa e`nk ds lar`Ir ?kksy dh fo|qr pkydrk ds vf/kd gksus dk ,d dkj.k ?kksy dh vk;fud cy esa o`f) gks ldrh gS ftlus e`nk ?kksy esa fo|qr vi?kV~; dh lkanzrk c<+k nhA e`nk dk fMLiflZo pktZ 50 thvkj leqnzh ftIle mipkj esa U;wure ¼4946 feyheksy@fdxzk½ Fkk tks fd lkaf[;dh; n`f"V ls 50 thvkj [kfut ftIle ,oa 25 thvkj ftIle $ 25 thvkj leqnzh ftIle mipkjksa ds lerqY; FkkA blh izdkj e`nk dk Q~yksdqysfVax pktZ 50 thvkj leqnzh ftIle ,oa 25 thvkj ftIle $ 25 thvkj leqnzh ftIle mipkjksa ds lerqY; FkkA leqnzh ftIle }kjk mipkfjr e`nkvksa ds HkkSfrd&jklk;fud xq.kksa vkSj mRikndrk esa nh?kkZof/k esa gksus okys ifjorZuksa dh tkap gsrq vuqla/kku vuojr gSA
04
lrr /kku&xsgw¡ mRiknu gsrq lalk/ku laj{k.k rduhfd;ka
flapkbZ ty dk vf/kd iz;ksx] c<+rh gqbZ Je ,oa mtkZ ekax ,oa izkd`frd lalk/ku {kj.k /kku&xsgw¡ Qly iz.kkyh ds le{k xaHkhj pqukSfr;k¡ gSaA v)Z&lq/kjh {kkjh; e`nkvksa esa /kku&xsgw¡ Qly pØ dh mRikndrk ij lalk/ku laj{k.k rduhfd;ksa ,oa feuh&ckSNkjh flapkbZ ds ewY;kadu gsrq ,d iz{ks= iz;ksx lapkfyr fd;k x;kA lrgh flapkbZ fof/k esa “kwU; tqrkbZ ,oa “kr izfr”kr /kku ijkyh ds iyokj ds lkFk xsgw¡ dh lokZf/kd nku mit ¼5-45 Vu@gs-½ izkIr gqbZA blds ckn feuh ckSNkjh flapkbZ] “kwU; tqrkbZ ,oa “kr izfr”kr /kku ijkyh iyokj mipkj dk LFkku Fkk ¼5-26 Vu@gs-½A lrgh flapkbZ dh rqyuk esa feuh&ckSNkjh flapkbZ us xsgw¡ esa 34-61 izfr”kr rd flapkbZ ty dh cpr dhA QVhZxsVsM xsgw¡ Qly dh u=tu iz;ksx n{krk 72-3 fdxzk nkuk izfr fdxzk ukbVªkstu rd Fkh ftlls vuq”kaflr ukbVªkstu ¼150 fdxzk@gs-½ esa 50 izfr”kr dh cpr gqbZA /kku dh lokZf/kd tSfod mit ¼13-08 Vu@gs-½ ijEijkxr jksi.k mipkj esa ns[kh xbZ ftlds ckn lh/kh fctkbZ $ feuh ckSNkjh flapkbZ $ U;wure tqrkbZ mipkj dk LFkku Fkk ¼12-45 Vu@gs-½A iz;ksx izkjaHk gksus ds 5 o"kksZa i”pkr /kku dh lh/kh fctkbZ esa feuh ckSNkj flapkbZ }kjk 57-73 izfr”kr flapkbZ ty dh cpr gqbZ vkSj 1-98 fdxzk@?ku eh- dh ty mRikndrk izkIr gqbZ tks fd ijEijkxr jksfir /kku ¼0-926 fdxzk@?ku eh-½ dh rqyuk esa 2-14 xquk vf/kd FkhA blh izdkj U;wure tqrkbZ ds lkFk /kku dh lh/kh fctkbZ djus ij lrgh flapkbZ fof/k esa flapkbZ ty esa 27-35 izfr”kr dh deh vkbZ vkSj 1-24 fdxzk@?ku ehVj dh ty mRikndrk izkIr gqbZA ijEijkxr jksfir /kku dh rqyuk esa lh/kh fctkbZ ds lkFk feuh ckSNkjh flapkbZ djus ij fo|qr dh 32-49 izfr”kr rd de [kir gqbZA
yo.kh; oVhZlksy e`nkvksa esa nslh dikl vk/kkfjr Qly pØksa esa ,dhd`r iks"kd rRo izca/ku }kjk mit ,oa dkjd mRikndrk esa o`f)
xqtjkr izns”k ds yo.kh; ofVZlksy {ks=ksa esa dikl ,d eq[; udnh Qly gSA bl vuqla/kku iz;ksx dk mn~ns”; nslh dikl vk/kkfjr Qly i)fr;ksa dh mit vkSj fLFkjrk ij ,dhd`r iks"kd rRo izca/ku ds izHkko dk ewY;kadu djuk FkkA nslh dikl&vjgj&xsgw¡ Qly pØ esa mojZdksa dh vuq”kaflr ek=k dk 50 izfr”kr] 50 izfr”kr uxjh; Bksl vif”k"V inkFkZ [kkn }kjk] ,tksVkscSDVj ,oa e`nk esa ftad ds iz;ksx ¼25 fdxzk@gs-½ ls xsgw¡ esa lokZf/kd fVyj@ikS/kk ¼7-4½] 1000 nkuk Hkkj ¼44-8 xzk-½] nkuk mit ¼2-95 Vu@gs½ ,oa Hkwlk mit ¼9-9 Vu@gs½ izkIr gqbZA blh mipkj esa lrgh e`nk ¼0&15 lseh-½ esa lokZf/kd tSfod dkcZu ,oa miyC/k ukbVªkstu dh ek=k ik;h xbZA blh izdkj] nslh dikl&Tokj&xsgw¡ Qly i)fr esa Hkh xsgw¡ dh lokZf/kd nkuk ¼2-61 Vu@gs½ ,oa Hkwlk mit ¼8-59 Vu@gs½ Hkh blh mipkj esa izkIr gqbZA izkjafHkd ifj.kkeksa us bafxr fd;k fd ,dhd`r iks"kd rRo izca/ku }kjk xsgw¡ dh mit o e`nk xq.koÙkk esa o`f) ds lkFk gh jklk;fud moZjdksa ds iz;ksx esa Hkh dkQh deh laHko gSA
rVh; yo.kh; {ks=ksa esa Hkw&vkdkj nsus okyh rduhfd;ksa dk d`f"k O;olk; ekMy ds :i esa izlkj
Hkw&vkdkj nsus okyh rduhfd;ksa ,oa o"kkZ ty laxzg.k }kjk yo.krk ruko ?kVkdj ,oa flapkbZ ty dh miyC/krk c<+kdj voØfer Hkw rVh; yo.kh; Hkwfe;ksa dh mRiknu {kerk esa dbZ xq.kk o`f) laHko gSA bu rduhdh gLr{ksiksa ls o"kZ Hkj iz{ks= ,oa lCth Qlyksa dh [ksrh dh tk ldrh gSA ,slh Hkwfe;k¡ [kjhQ /kku dh dVkbZ ds mijkar jch _rq esa lw[kk ruko ds dkj.k [kkyh iM+h jgrh gaSA Hkw&vkdkj nsus okyh rduhfd;ksa us lqUnjou o v.Meku ,oa fudksckj }hi lewg ds rVh; yo.kh; {ks=ksa esa Qly l?kurk yxHkx 100 izfr”kr ls c<+kdj 166&240 izfr”kr dj nh ftlls fdlkuksa dh vk; ,oa jkstxkj l`tu esa dkQh c<+ksÙkjh gqbZA ,slh rduhfd;k¡ ns”k ds nwljs rVh; yo.kh; {ks=ksa esa Hkh viuk;h tk ldrh gaSA gkykafd bu
lkjka'k
Ann
ual R
epor
t 201
8-19
05
rduhfd;ksa ds fØ;kUo;u esa] [kkldj feêh dh [kqnkbZ esa] izkjaHk esa vf/kd ykxr vkrh gSA vkfFkZd fo'ys"k.k ls og Kkr gqvk fd bu rduhfd;ksa ij fd;k x;k fuos”k vkfFkZd n`f"V ls O;ogk;Z gSA blds ckotwn bu rduhfd;ksa ds vf/kdkf/kd izpkj&izlkj gsrq dqN lkekftd&vkfFkZd ,oa uhfrxr ck/kkvksa dks nwj djuk vfr vko”;d gSA ukckMZ us gky gh esa ^Hkwfe leryhdj.k ,oa xBu^ dks if”pe caxky jkT; esa Hkwfe fodkl dk;ksZa ds :i esa fpfUgr fd;k gSA iz{ks= rkykcksa dh [kqnkbZ] ,dhd`r d`f"k i)fr;ksa ,oa eNyh ikyu ds fy, miyC/k vkfFkZd lgk;rk dk mi;ksx bu rduhfd;ksa dks c<+kus gsrq fd;k tk ldrk gSA blds vfrfjDr] ljdkjh ;kstukvksa tSls jk"Vªh; d`f"k fodkl ;kstuk ,oa eujsxk ds varxZr fd, tkus okys xzkeh.k fodkl dk;ksZa dks Hkh Hkw&vkdkj rduhfd;ksa ls tksM+us dh vko”;drk gSA
iqjLdkj ,oa ekU;rk,a
· Mk-jktsUnz dqekj ;kno izHkxk/;{k] e`nk ,oa Qly izca/ku izHkkx uss Hkk- d`- vuq- i-& `dsUnzh; e`nk yo.krk vuqla/kku laLFkku] djUkky dk o"kZ 2016 dk mRd"Vrk iqjLdkj
izkIr fd;k
· Mk- izoh.k dqekj] iz/kku oSKkfud us Hkk- d`- vuq- i-& dsUnzh; e`nk yo.krk vuqla/kku `laLFkku] djUkky dk o"kZ 2017 dk mRd"Vrk iqjLdkj izkIr fd;kA
· Mk- lrh”k dqekj luoky] iz/kku oSKkfud dks Hkkjrh; lCth foKku lfefr dk o"kZ 2017 esa Qsy® pquk x;kA
· Mk- lrh”k dqekj luoky us rsy voho] btjk;y esa 29 vizSy ls 11 ebZ] 2018 ds e/; vk;ksftr iz{ks«k ,oa lCth Qlyksa esa chtksRiknu ,oa mipkj fo"k; ij vk;ksftr varjkZ"Vªh; izf”k{k.k dk;ZØe esa Hkkx ysus gsrq e”kko Qsyksf”ki izkIr dhA
· Mk- HkkLdj utZjh ,oa Mk- e/kq pkS/kjh us Hkkjrh; e`nk yo.krk ,oa ty xq.koRrk lfefr] djuky dk o"kZ 2018&2019 ds fy, ;qok oSKkfud iqjLdkj izkIr fd;kA
· Mk- jat; dqekj flag pkYlZ MkfoZu fo”ofo|k~y;] ds gkujsjh Qsyks p;fur fd, x,A
· Mk- jat; dqekj flag dks izd`fr laj{k.k ds varjkZ"Vªh; la?k dh ikfjLFkfrdh ra= lfefr dk lnL; p;fur fd;k x;kA
· Mk- jat; dqekj flag dks jk"Vªh; d`f"k foKku vdkneh] ubZ fnYyh dk Qsyks ¼lkekftd foKku % d`f"k izlkj½ p;fur fd;k x;kA
· Mk- ijosUnz “;ksjk.k us Hkkjrh; lL; foKku lfefr] ubZ fnYyh dk Mk- ih- ,l- ns”keq[k ;qok ,xzksukfeLV iqjLdkj izkIr fd;kA
· Mk- va”kqeku flag us tSo foKku ,oa xzkeh.k fodkl lfefr] iz;kxjkt dh Qsyksf”ki izkIr dhA
dk;Z'kkyk
· Hkkjrh; d`f"k vuqla/kku ifj"kn] ubZ fnYyh ,oa ftjdkl] tkiku ds e/; lg;ksxkRed vuqla/kku ifj;kstuk] ftldk mn~ns”; dV Lok;yj vk/kkfjr fuEu ykxr milrgh ty fudkl mik;ksa dk fodkl djuk gS] dh fdd LVkVZ cSBd 15 twu] 2018 dks lEiUu gqbZA
06
· Hkkjrh; d`f"k vuqla/kku ifj"kn] ubZ fnYyh }kjk izk;ksftr nl fnolh; izf”k{k.k dk;Zdze Qly lq/kkj ds fy;s vtSfod ruko ds fo:) ikni fØ;kvksa dh fodflr rduhfd;k¡^ 20&29 vxLr] 2018 ds e/; vk;ksftr fd;k x;kA
· ^fdlkuksa dh vk; c<+kus gsrq fofHkUu tyok;q {ks=ksa esa yo.krk o {kkjh; izcU/ku dh mUur rduhfd;k¡ fo"k; ij 21 fnolh; “khrdkyhu ikB~;Øe dk vk;kstu 04&24 flracj] 2018 ds e/; fd;k x;kA
· egkjk"Vª izns”k ds vgenuxj ftys ds fdlkuksa gsrq ^yo.k izHkfor e`nkvksa ,oa fuEu xq.koRrk flapkbZ ty dk izca/ku* fo"k; ij ,d pkj fnolh; izf”k{k.k dk;Zdze 26&29 flracj] 2019 ds e/; vk;ksftr fd;k x;kA
· 09 vDrwcj 2018 dks Lo.kZt;arh mUur d`f"k esyk vk;ksftr fd;k x;kA Jh ij"kksÙke `:ikyk] ekuuh; dsUnzh; d̀f"k ,oa d"kd dY;k.k o iapk;rh jkt jkT; ea=h dk;ZØe ds
eq[; vfrfFk FksA
· Hkkjrh; d̀f"k vuqla/kku ifj"kn] ubZ fnYyh dh {ks=h; lfefr ik¡p dh 25oha cSBd 2&3 uoacj] 2018 ds chp vk;ksftr dh xbZA
· fo”o e`nk fnol dk vk;kstu 5 fnlacj] 2018 dks dSFky ftys ds gkcMh xk¡o esa fd;k x;kA
· Lo.kZ t;arh varjkZ"Vªh; yo.krk lEesyu dk vk;kstu 7&9 Qjojh] 2019 ds e/; fd;k x;kA izks- jes'k pUn] ekuuh; lnL;] uhfr vk;ksx us lekiu Hkk"k.k fn;kA
· jk"Vªh; mRikndrk lIrkg 12&18] Qjojh] 2019 ds e/; vk;ksftr fd;k x;kA
· [kjhQ fdlku esys dk vk;kstu 16 ekpZ] 2019 dks dSFky ftys ds gkcM+h xk¡o esa fd;k x;kA
{ks= izn'kZuh o Hkze.k
o"kZ 2018&19 ds nkSjku d`f"k esa yo.kxzLr e`nk ds lq/kkj vkSj izca/ku o fuEu dksfV ty ds mi;ksx ij fofHkUu vuqla/kku laLFkkuksa vkSj fodkl vfHkdj.kksa esa 8 izn”kZfu;ka yxkbZ xbZA 2656 fgr/kkjdksa us laLFkku ds lwpuk izkS|ksfxdh dsUnz o izk;ksfxd QkeZ dk nkSjk fd;kA 489 fdlku 1981 fo|kFkhZ 101 izlkjdehZ vkSj oLrq fo"k; fo”ks"kK] 85 Hkkjrh; o fons”kh oSKkfud vk, FksA
fdlku lykgdkj lsok
fdlkuksa dh e`nk yo.krk] {kkjh;rk o ty xq.koÙkk lacaf/kr leL;kvksa ds Rofjr vkSj leqfpr lek/kku gsrq laLFkku esa Vksy Qz h u- 18001801014 ij fu%”kqYd Qksu lsok “kq: dh gSA o"kZ 2018&19 ds nkSjku ns”k ds fofHkUu {ks=ksa ls d`f"k lacaf/kr leL;kvksa lacaf/kr 361 dkWy izkIr gqbZ vkSj laLFkku ds oSKkfudksa }kjk bu leL;kvksa ds funku gsrq mik; lq>k, x,A
varjkZ"Vªh; lg;ksx
· vQzhdk vkSj nf{k.k ,f”k;k ds xjhc fdlkuksa ds fy, ruko lfg".kq /kku ¼vkbZvkjvkjvkbZ o oh,eth,Q }kjk izk;ksftr½
lkjka'k
Ann
ual R
epor
t 201
8-19
07
· lw[kk] tyeXurk vkSj yo.k lfg".kqrk ds fy, ekdZj dh lgk;rk ls çeq[k D;wVh,y] ds lkFk vtSfod ruko lfg".kq pkoy fdLeksa dk çtuu ¼Mh-Ckh-Vh-] vkbZ- vkj- vkj- vkbZ-] foÙk iksf"kr½
· /kku dh vf/kd tLrk;qDr fdLeksa dk fodkl ¼vkbZ- vkj- vkj- vkbZ-] }kjk foÙk iksf"kr½
· nf{k.k ,f”k;k esa “kgjh ckM+ dks de djus rFkk xzkeh.k {ks=ksa esa ikuh dh lqj{kk esa lq/kkj ds fy;s Hkwxr uoizorZudkjh ijh{k.kkRed dks c<+kok nsuk ¼vkbZ- MCY;w- ,e- vkbZ-½
· Hkkjr ds ty laosnu'khy {ks=ksa esa lrr lalk/ku izca/ku iz.kkfy;ksa dk fodkl ¼ftjdkl] tkiku½
· izfrdwy n”kkvksa gsrq tyok;q n{k iztkfr;ksa ds fodkl ds fy;s xq.kksa] thu ,oa dkf;Zdh y{k.kksa dk fpUghdj.k
· tyok;q ifjorZu] d`f"k ,oa [kk| lqj{kk ¼lhlh,,Q,l½ ¼lhvkbZ,eokbZVh] eSfDldks½
· ckaXykns”k ,oa if”pe caxky] Hkkjr ds yo.k izHkkfor rVh; {ks=ksa esa Qly iz.kkyh l?kuhdj.k ¼lh,lvkbZvkjvks ,oa eqMksdZ fo”ofo|ky;] vkLVªsfy;k }kjk foÙk iksf"kr½
izdk'ku
· laLFkku }kjk izeq[k tjuyksa esa 124 vuqla/kku vkys[k] 11 iqLrd v/;k;] 20 iqLrd@eSuqvy] 3 cqysfVu@QksYMj] 18 izpfyr vkys[k] rduhdh izfrosnu Niok;s x;s vkSj 109 vkys[k lsehukj@fleiksfl;k vkSj dkuQz sUlksa esa izLrqr fd;s x;sA
oSKkfudksa dk fons'k Hkze.k dk;Zxzg.k o lsokfuo`fÙk
· Kku o dq”kyrk dks c<+kus gsrq laLFkku ds 8 oSKkfudksa us fofHkUu ns”kksa tSls eSfDld®] e®jDd®] fQyhihUl] ÃtjkÃy] flxakiqj] phu] vesfjdk vkSj ckaXykns”k dk nkSjk fd;kA bl vof/k esa 3 oSKkfudksa us dk;ZHkkj laHkkykA
08
Executive Summary
ICAR-Central Soil Salinity Research Institute (CSSRI), Karnal, Haryana is an internationally recognized premier research organization dedicated to multi-disciplinary research on salinity management and use of poor quality irrigation water in different agro-ecological regions of the country. Multi-disciplinary research programmes at the main institute are conducted through four divisions: Soil and Crop Management, Irrigation and Drainage Engineering, Crop Improvement and Social Science Research. To pursue speci�c research needs of different agro-climatic regions, the institute has also established three Regional Research Stations at Canning Town (West Bengal), Bharuch (Gujarat) and Lucknow (Uttar Pradesh) to deal with the problems of coastal salinity, salt-affected vertisols and alkali soils of the central and eastern Indo-Gangetic plains, respectively. The Coordinating Unit of All India Coordinated Research Project on Management of Salt Affected Soils and Use of Saline Water in Agriculture is also located at the main institute and is functioning through 8 regular research centres at Agra (Uttar Pradesh), Baptala (Andhra Pradesh), Bikaner (Rajasthan), Gangawati (Karnataka), Hisar (Haryana), Indore (Madhya Pradesh), Kanpur (Uttar Pradesh), Tiruchirapalli (Tamil Nadu) along with 4 voluntary centres at Bathinda (Punjab), Panvel (Maharashtra), Port Blair (A&N islands) and Vyttila (Kerala) representing different agro-ecological regions of the country. For the period under report, some of the major research achievements of the institute in different thrust areas are as under:
CSR 59: A Promising Salt Tolerant Rice Line Identi�ed
A new salt tolerant rice line 'CSR 59' has been identi�ed based on its consistent superior performance over the check varieties for salinity/alkalinity tolerance and grain yield. During 2014, CSR 59 showed yield advantage of 8%, 94%, 10%, 7% and 8% over CSR 36 (National check), Jaya (Yield check), CSR 10, Local Check and CSR 23, respectively under high salinity conditions in Panipat and Karnal districts of Haryana. Similarly, during 2015,
Exec
utiv
e Su
mm
ary
Ann
ual R
epor
t 201
8-19
09
CSR 59 produced 4%, 174 %, 26%,2% and 28 % more grain yield over CSR 36 (National check), Jaya (Yield check), CSR 10, Local Check, and KR09003 (Qualifying Variety IET 24538), respectively at salt affected locations. During 2016 as well, CSR 59 showed yield advantage of 66%, 722%, 42% , 61%, 75% and 39 over CSR 36 (National check), Jaya (Yield check), CSR 10, Local Check, CSR 23 and KR09003 (Qualifying Variety IET 24538), respectively across the salt affected locations in Panipat and Karnal in Haryana. The rice line CSR59 surpassed the national check (CSR23) by over 18 per cent grain yield under saline stress. The performance of CSR 59 line was stable across the locations over the years
-1with an average yielding ability of 2945 kg ha . Rice line CSR 59 could be a promising material for the genetic improvement of rice for high yield and salt tolerance.
GypKIT: A Field Testing Kit for the Rapid Assessment of Sodic Soil
Sodic soils have excessive exchangeable sodium that adversely affect the growth of most crop plants. Gypsum being cheap, easily available and easy to apply is a widely used ameliorant for sodic soils. However, the amount of gypsum (CaSO .2H O) required to 4 2
reclaim sodic soil depends upon various factors such as degree of Na saturation, texture, degree of improvement desired, water quality, crops to be grown etc. It is essential to estimate the gypsum requirement (GR) of sodic soil before reclamation to avoid any over or under use of the amendments. Laboratory method for determining GR is tedious and time consuming. As most of the labs lack expertise and facility for GR estimation, a kit was developed for the quick assessment of soil sodicity and estimation of GR. The GypKIT was developed for the titrimetric estimation of GR of sodic soils of Indo-Gangetic Plains. This kit can be useful to the �eld functionaries, researchers, line department officials as well as farmers desirous of assessing soil sodicity and quantity of mineral gypsum required for chemical reclamation to optimize the crop production. GypKIT has been approved for commercialization by ICAR. Each kit is supplied with all required chemicals that can be re�lled and the vials and bottles required for the procedure. Also, an operational manual is supplied with the kit. This �eld kit is devised in such a way that it can be easily used at the farm itself and does not require electricity or any power source. It instantly estimates the gypsum requirement of sodic soils. It has been tested and validated using the traditional laboratory method.
Marine Gypsum: A potential Alternative to Mineral Gypsum for Reclaiming Sodic Soils
A �eld experiment conducted at Lucknow showed that marine gypsum (MG) could be a feasible alternative to mineral gypsum (GYP) for reviving the productivity of degraded sodic lands. Amendments (GYP and MG) were added based on gypsum requirement (GR).
-1In kharif 2018, rice yield was found to be numerically higher (4.11 t ha ) in 25 GR GYP+25 GR MG but was statistically on par with 50 GR GYP and 50 GR MG. The maximum reduction in soil pH was also observed in 25GR GYP + 25GR MG than control. Higher EC values in the e
amended plots may probably be due to the increased ionic activity of the solution that provided enough electrolyte concentration in soil solution. The dispersive charge in the
-1soil in the present experiment was found lowest (4946 mmol kg ) in the 50 GR MG treatment which was statistically on par with 50GR GYP and 25 GR GYP+25 GR MG. The
-1�occulating charge, on the other hand, was found to be maximum (486 mmol kg ) in 50 GR MG, though statistically on par with 50 GR GYP and 25 GR GYP+25 GR MG. Investigations are being continued to see the long term trends in the physico-chemical properties and productivity of the marine gypsum treated sodic lands.
10
Resource Conservation Techniques For Sustainable Rice-Wheat Cultivation
Over use of irrigation water, high labour and energy requirements and natural resource degradation including secondary salinity are increasingly making rice-wheat system unsustainable. A �eld experiment was conducted to assess the effects of resource conservation strategies and mini-sprinkler irrigation on crop productivity of rice-wheat cropping system in reclaimed alkali soils. Zero tillage with 100% rice straw mulch
-1produced the highest wheat grain yield (5.45 t ha ) under surface irrigation method -1 followed by 5.26 t ha in zero tillage with 100% rice straw mulch under mini-sprinkler
irrigation. Mini-sprinkler irrigation method in wheat saved up to 34.61% irrigation water over surface irrigation. Nitrogen use efficiency of fertigated wheat crop was up to 72.3
-1 -1kg grain kg N saving 50% of recommended (150 kg ha ) N. Maximum rice biological -1yield (13.08 t ha ) was obtained in conventional transplanted rice followed by mini-
-1sprinkler irrigation in DSR with minimum tillage (12.45 t ha ). Mini-sprinkler irrigation under DSR technique saved 57.73 % of irrigation water in rice with water productivity of
-3 -1.98 kg m which was 2.14 times higher than conventional transplanted rice (0.926 kg m3) after 5 years of experiment. Similarly, DSR with minimum tillage under surface
-3irrigation saved irrigation water up to 27.35 % with water productivity of 1.24 kg m . Irrigation through mini-sprinkler method in DSR saved up to 32.49% electricity in comparison to conventional transplanted rice.
Integrated Nutrient Management for Maximizing the Yield and Factor Productivity in Desi Cotton-based Cropping Systems in Saline Vertisols
Desi cotton is a major cash crop in saline Vertisol areas of Gujarat state. This investigation intended to assess the effects of integrated nutrient management (INM) on yield and sustainability on desi cotton-based systems. In desi cotton-pigeon pea-wheat system, application of 50% RDF, 50% through MSWC, Azotobacter and soil application of Zn (25 kg
-1 -1ha ) led to signi�cantly higher tillers plant (7.4), 1000-seed weight (44.8 g), grain yield -1 -1(2.95 t ha ) and straw yield (9.9 t ha ) of wheat. Signi�cantly higher soil organic carbon
(SOC) and available nitrogen contents in the surface soil (0-15 cm depth) were also recorded in this treatment. Similarly, in cotton-sorghum-wheat cropping system, the
-1 -1maximum wheat grain (2.61 t ha ) and straw (8.59 t ha ) yields were obtained when -1nutrients were supplied as 50% RDF, 50% MSWC, Azotobacter and soil Zn @ 25 kg ha .
Preliminary results suggest that chemical fertilizer applications can be minimized to a great extent while improving the wheat yield and soil quality.
Promoting land shaping techniques as farming business models in coastal saline areas
Land shaping techniques and rainwater harvesting can transform degraded coastal salty lands into productive assets by minimizing salinity stress and augmenting irrigation water availability for growing �eld and vegetable crops round the year. Such lands otherwise remain fallow during the dry rabi season after the harvest of kharif rice. Land shaping techniques increased the cropping intensity from around 100% to 166-240% in the coastal salt-affected areas of Sundarbans and Andaman & Nicobar Islands leading to manifold increases in farm incomes and employment opportunities. Such techniques can also be disseminated to other costal saline areas of the country. However, these land shaping techniques involve high initial investment, particularly on soil excavation. Financial analysis has indicated that investments on such interventions were �nancially viable. Nonetheless, some socio-economic and policy constraints need to be overcome for out-scaling these technologies. NABARD has recently enlisted 'Land Leveling and
Exec
utiv
e Su
mm
ary
Ann
ual R
epor
t 201
8-19
11
Shaping' as one of the land development activities in the West Bengal state. Financial support provided for the excavation of farm ponds, integrated farming systems and �sh farming can be harnessed for promoting the land shaping technologies in coastal areas. Further, there is a need for linking the ongoing rural development activities under government schemes like RKVY and MGNREGA for promoting the land shaping models.
Awards and Recognitions
· Dr. R.K. Yadav, Head, S&CM and Dr. Parveen Kumar, Principal Scientist received ICAR-CSSRI Excellence Award for the years 2016 and 2017 respectively.
· Dr. S.K. Sanwal, Principal Scientist, conferred Fellowship of the Indian Society of Vegetable Science (ISVS) 2017.
· Dr. S.K. Sanwal, got MASHAV Scholarship for an International Training on “Seed thProduction & Treatments for Field and Vegetable Crops” from April 29 to May
th11 , 2018 held at Tel Aviv, Israel.
· Dr. Bhaskar Narjary and Dr. Madhu Chaudhry were conferred Young Scientist Award, 2018-19 by Indian Society of Soil Salinity and Water Quality (ISSSWQ), Karnal.
· Dr. Ranjay K. Singh was elected Honorary Fellow of the Charles Darwin University.
· Dr. Ranjay K. Singh was selected as the Member, IUCN Committee on Ecosystem Management (Human Dimension).
· Dr. Ranjay K. Singh was elected Fellow (Social Sciences: Agricultural Extension) of the National Academy of Agricultural Sciences (NAAS), New Delhi.
· Dr. Parvender Sheoran received Dr. P.S. Deshmukh Young Agronomist Award of the Indian Society of Agronomy, New Delhi.
· Dr. Anshuman Singh was conferred the fellowship of the Society of Biological Sciences and Rural Development, Paryagraj.
Workshop, Seminars, Trainings, Foundation Day and Kisan Mela organized
· Kick start meeting of the collaborative project between ICAR, New Delhi and JIRCAS, Japan aiming to develop cut-soiler based low cost SSD solutions was
thheld on 15 June 2018.
· ICAR-sponsored ten days training programme on 'Advancement of Physiological Strategies for Crop Improvement against Abiotic Stresses' held from 20-29 August 2018.
· A 21-days Winter School on 'Advances in Salinity and Sodicity Management under Different Agro-Climatic Regions for Enhancing Farmers' Income' was organized during 04-24 September 2018.
· A 4-days training programme on 'Management of Salt affected Soils and Poor Quality Irrigation Water' for the farmers from salt affected areas Ahmadnagar district of Maharashtra was organized during 26-29 September, 2018.
th· Golden Jubilee Unnat Krishi Mela' was organized on 9 October, 2018. Sh. Parshottam Rupala, Hon'ble Union Minister of State for Agriculture and Farmers' Welfare, and Panchayati Raj graced the occasion as Chief Guest.
12
th· The 25 Meeting of the ICAR Regional Committee Zone-V (Punjab, Haryana & Delhi) was organized during 2-3 November 2018.
th· World Soil Day was celebrated on 5 December, 2018 in sodicity-affected Habri village of Kaithal district.
· Golden Jubilee International Salinity Conference was held during 7-9 February, 2019. Prof. Ramesh Chand, Hon'ble Member, NITI Aayog delivered the valedictory address.
· The 'National Productivity Week' was organized during 12-18 February, 2019.th· Kharif Kisan Mela was organized on 16 March 2019 at Habri village of Kaithal
district.
Field Exhibition and Visit
During 2018-19, a total of 8 exhibitions were organized at different research institutions and developmental agencies to portray the improved technologies for the reclamation and management of salt-affected soils and poor quality waters. Out of 2656 stakeholders, 489 farmers, 1981 students,101 extension workers and 85 scientists from India and abroad visited Institute Technology Information Centre and experimental farms to learn about the technologies commercialized and being developed.
Farmers' Advisory Services
During 2018-19, a total of 361 advisories on soil testing, salinity and alkalinity management, salt tolerant crop varieties, crop management practices, animal husbandry, horticultural crops, and nutrient management were provided to the farmers through TOLL Free Number 1800 180 1014.
International Collaboration
· Stress Tolerant Rice for Poor Farmers of Africa and South Asia (funding IRRI-BMGF)
· Marker Assisted Breeding of Abiotic Stress Tolerant Rice Varieties with Major QTL for Drought, Submergence and Salt Tolerance ( funding DBT,IRRI)
· Development of high zinc rice varieties (IRRI Funded)
· Piloting and up-scaling an innovative underground approach for mitigating urban �oods and improving rural water security in South Asia (IWMI)
· Developing of Sustainable Resource Management System in the Water-Vulnerable Area in India (Funding JIRCAS)
· Identi�cation of traits, genes, physiological mechanisms to develop climate smart varieties for unfavourable environment. (ICAR-IRRI)
· Strategic Research Platform on Climate Smart Agriculture “Developing and de�ning climate smart agricultural practices portfolios in South Asia”. (ICAR-CCAFS)
· CSIRO, Murdoch University, Australia–Project on cropping system intensi�cation in the salt affected coastal zones of Bangladesh and West Bengal, India
Exec
utiv
e Su
mm
ary
Ann
ual R
epor
t 201
8-19
13
Publications
The Institute published 124 research papers in peer reviewed journals, 11 Books/Training Manuals, 20 Book/Manual/ Chapter, 3 Technical Bulletins/Folder, 18 popular articles. Besides, 109 papers were presented in different National and International Seminar/Symposia and Conferences.
Scientists' visits abroad and new scientists joined
To upgrade their knowledge and skills, 8 scientists of the institute visited different countries viz. Mexico, Morocco, Philippines, Israel, Singapore, China, USA and Bangladesh. Three scientists joined the Institute during period under report.
14
IntroductionHistorical Perspective
ICAR-Central Soil Salinity Research Institute (ICAR-CSSRI) is a premier research institute dedicated to pursue interdisciplinary researches on salinity/alkalinity management and use of poor quality irrigation waters in different agro-ecological zones of the country. Government of India constituted an Indo-American team to assist the Indian Council of Agricultural Research in developing a comprehensive water management programme for the country. As a follow up of these recommendations, Central Soil Salinity Research Institute was established under Fourth Five Year Plan period. The Institute started
stfunctioning at Hisar (Haryana) on 1 March, 1969. Later on, in October, 1969, it was shifted to Karnal. In February 1970, the Central Rice Research Station, Canning Town, West Bengal was transferred to CSSRI, Karnal to conduct research on problems of coastal salinity. Another Regional Research Station for carrying out research on problems of inland salinity prevailing in the black soils region of western parts of the country started functioning at Anand (Gujarat) from February, 1989. As per recommendations of the QRT, the station was shifted from Anand to Bharuch in April 2003. Keeping in view the need of undertaking research to manage alkali soils of Central and Eastern Gangetic Plains having surface drainage congestion and high water table conditions, another Regional Research Station was established during October, 1999 at Lucknow. The Coordinating Unit of AICRP on Management of Salt Affected Soils and Use of Saline Water in Agriculture is located at the Institute with a network of eight research centres located in different agro-ecological regions of the country (Agra, Bapatala, Bikaner, Gangawati, Hisar, Indore, Kanpur and Tiruchirapalli). In 2014, four new voluntary centres have started functioning at Bathinda (Punjab), Panvel (Maharastra), Vytilla (Kerela) and Port Blair (Andaman & Nicobar Islands).
Over the years, Institute has grown into an internationally recognized esteemed centre of excellence in salinity research. Multidisciplinary research activities at the main institute are being strengthened through four research divisions. The major research activities in the Division of Soil and Crop Management include preparation and digitization of database on salt affected soils besides periodic assessment of state of soil resources, developing alternate amendments for the reclamation of alkali soils besides developing technologies for the optimal management of gypsum amended alkali soils and the use of high RSC and saline waters for crop production. In the post reclamation phase, focus is on developing resource conservation technologies and development of farming system models for resource poor farmers. Agro-forestry and horticulture on salt affected soils is another area of focus that includes multipurpose tree species, fruit plants, vegetables and seed spices. Development and propagation of individual farmer based groundwater recharge technologies, subsurface drainage for amelioration of waterlogged saline soils and decision support systems for ground water contaminations with �uoride and climate change are some of the major issues being addressed by the Division of Irrigation and Drainage Engineering. Development of high yielding genotypes tolerant to salinity, alkalinity and water logging stresses in rice, wheat, mustard and chickpea through conventional breeding and modern molecular and physiological approaches are the major concerns of the Division of Crop Improvement. The Division of Technology
Intr
oduc
tion
Ann
ual R
epor
t 201
8-19
15
Evaluation and Transfer identi�es the constraints hampering adoption of land reclamation technologies and their impact on rural development.
The Institute has developed technologies for the chemical amendment based reclamation of alkali soils, reclamation of saline soils through subsurface drainage, development and release of salt tolerant crop varieties of rice, wheat, mustard and chickpea and the biological reclamation of salt affected soils through salt tolerant multipurpose trees. A microbial consortia CSR BIO as a plant growth enhancer has been developed and commercialized. Land shaping technologies for the productive utilization of waterlogged sodic soils and coastal saline soils have also been developed. Nearly 2.0 million ha salt affected lands have been reclaimed using these technologies and put to productive use. It has been estimated that reclaimed area is contributing about 17 million tonnes food grains to the national pool. For waterlogged saline soils, subsurface drainage technology developed by the Institute initially for Haryana has been widely adopted and replicated in Rajasthan, Gujarat, Andhra Pradesh, Maharashtra and Karnataka. So far, about 70,000 ha waterlogged saline areas have been reclaimed, through institutional and private modes. Arti�cial groundwater recharge is another area of interest for the region with depleting water table. Besides, the technologies are also being developed for the salt affected areas of Vertisols and coastal regions of the country.
An International Training Centre to impart training at national and international level was established during 2001 under Indo-Dutch collaborative research programme. The Institute faculty also serve as guest teachers and advisors for the Post Graduate education and research programmes of State Agricultural Universities (SAUs), other Universities and Institutes. The Institute has several national and international projects to fund its research and development activities. The notable amongst them are: IRRI sponsored rice improvement programme, ACIAR sponsored programme for coastal saline soils, CIMMYT sponsored programme on the improvement of cereal based systems and IWMI sponsored programme on taming underground �ood water systems.
The institute has created state of the art facilities of sodic and saline micro-plots. Depending upon the objectives, desired stress levels of sodicity and salinity can be created for screening and better genotypic comparisons. Similarly, an environmentally controlled glass house facility is in place for growing crops and screening genetic resources during off-season. This allows precise screening under saline hydroponics and advancement of breeding generations. A transgenic green house facility has also been created. A central laboratory with modern equipments has been established.
16
OrganogramThe current organizational set up for implementing its research programmes is shown below.
ICAR-CSSRI
DirectorResearch
Advisory CommitteeInstitute Management
Committee
Main Institute Research Stations
Canning Town(West Bengal)
Bharuch(Gujarat)
Lucknow(Uttar Pradesh)
Divisions Units Coordinated Project
Research Farm, Karnal
Agricultural farm at ICAR-CSSRI, Karnal has total area of 82 ha. A motorable road has been laid all along the boundary of this farm, for regular monitoring, upkeep and proper watch and ward. Whole of the farm area under cultivation has been divided and laid out in standard plot size of 1.0 ha size and each plot is connected with road for easy accessibility, underground water conveyance and lined channels for irrigation. Eight tube wells are installed in the farm to meet irrigation requirement of general agriculture, research experiments and water supply in the campus and laboratories. All essential farm machinery and implements viz., laser leveler, multi-crop thresher, turbo seeder, zero till machines, laser leveler, tractors, hydraulic trolley, cleaner, shrub master, maize thresher, ride on lawn mower etc. are available; most of farm operations are mechanized. To achieve the optimization of water and other inputs, all the plots are precisely leveled with laser leveler at regular intervals. Combination of different cropping system is being practiced to optimize the land use in the farm. Experimental crops are grown on 21.60 ha area, while general crops are grown in 16.6 ha, which also includes the 10 ha area under seed production mainly of salt tolerant varieties of rice and wheat. This year seed processing plant is also installed to provide quality of seed of salt tolerant varieties to the farmers.
Org
anog
ram
Ann
ual R
epor
t 201
8-19
Social Science Research
17
During the period under report, the farm unit generated revenue of Rs. 92 lakh. To reduce the emission of green house gases, most of area has been put under minimum tillage and residue burning is not practiced in the farm. Agro-forestry system is practiced on 6.2 ha area of the farm, where multipurpose tree species have been planted in combination with arable crops of the region. The area under fruit crops such as ber (Ziziphus mauritiana Lam.), aonla (Emblica officinalis L.), jamun (Syzygium cumini L.), guava (Psidium guajava L.), litchi (Litchi chinensis Sonn.) and mango (Mangifera indica) is 7.4 ha. An herbal garden consisting of 104 species of medicinal/ aromatic herbs, shrubs and trees has also been established and maintained in an area of 1.20 ha, besides �sh are reared in ponds covering about 2.5 ha area. The 27.3 ha area of the farm is permanently covered under glass house, net houses, micro-plots, laboratories, offices, residences, oxidation pond, roads and landscape.
Nain Experimental Farm, Panipat
The Nain experimental farm is located at Nain village, west of Panipat-Gohana road, 25 km from Panipat town (District Panipat) and is about 65 km from Karnal. This farm covers an area of 10.8 ha. Initially, the site had Prosopis juli�ora and other salt tolerant grasses and herbs as Sporobolus marginatus, Saccharum spontanium (Kans), Cynodon dactylon (Dub grass), Suaeda fruticosa (Noon khari), Kochia indica (Bui) and Calotropis procera (Aak) etc.
-1A wide range of soil salinity (<4 to >30 dS m ) existed at surface and sub-surface. The soil reaction showed sodic nature ranging from <8.2 to 8.9. The area has watertable at a depth
-1of about 15 metres. The ground water showed neutral pH (7.7) and higher EC (13 dS m ) + + + - 2- -indicating high salinity with dominance of Na , Ca , Mg , Cl , SO and HCO . Higher SAR 2 2 4 3
1/2 -1/2(19.3 mmol L ) showed limitations for use during seed germination. Such water may be used in cyclic mode with good quality water preferably for salt tolerant crops and forestry/fruit plantations. Institute has initiated many experiments on forestry, horticulture, agro-forestry and sustainable management of such salt affected resources. Since no fresh water supply source is available on the farm, two ponds have been dug to harvest and store rain water and two tubwells have also been installed for supply of different quality water for experiments. Institute screens its mustard, wheat and rice germplasm and agroforestry/fruit crops for salinity tolerance. In addition, institutes like Regional Research Stations of IARI and SBI, Karnal also use this facility for screening of the germplasm.
Productivity of crops at CSSRI farmCrop Variety Average
-1 yield (t ha )Rabi 2017 - 18
KRL 210 5.10KRL 213 4.15CS 52 2.00CS54 2.45CS56 2.65CS 58 2.84CS 60 2.90Karnal chana 1 2.25
Kharif 2018CSR 30 3.60CSR 36 5.40CSR 43 5.35CSR 56 5.60CSR 60 5.90
Progressive Progressive Progressive Grand Expenditure Expenditure Expenditure Progressive (other than (TSP) (NEH) Expenditure NEH & TSP expenditure)Capital (Grant for creation of capital assets) 42.60 - - 42.60Establishment Expenses (grant in aid-salaries) 2599.60 - - 2599.60Grant in aid general 1327.53 - - 1327.53Grand Total 3969.73 - - 3969.73Loan and advance 14.06 - - 14.06
Head
Finances
Summary of a allocation and expenditure during the year 2018-19 budget is presented below :
18
Staff
The total staff strength of the institute is 319. The category wise details are:
Category of post Sanctioned In position Vacant % VacantScienti�c 81 68 13 16.04Technical 112 90 22 19.64Administrative 56 37 19 33.92Skilled Supporting Staff 70 43 27 38.57Total 319 239 80 25.07
Library
Library plays a crucial role in supporting the research and academic programmes of the Institute. It identi�es, evaluates, procures, processes and then makes these learning resources available to the faculty and students to meet their teaching and research needs. Library has always been striving hard to meet the expectations of its users. ICAR-CSSRI library is well furnished, fully air-conditioned and equipped with four computers, one server and two UPS. The Institute library has rare and large collection of Technical, Scienti�c books, Journals, Reports and other publications. Library possesses Indian and Foreign publications related to the �elds of Water Management, Soil Salinity, Drainage, Alkalinity, Water Resources, etc. to achieve the mandate of the institute. Presently, the library has total collection of 15655 books including Hindi books. A separate section is maintained for Hindi books. There are 8451 bound volumes of the Journals. It has a rich collection of special publications of FAO, IRRI, UNESCO, ILRI, ICID, IFPRI, ASA, ASAE which ful�ll the needs of scientists, researchers, teachers and students. About 162 theses on subjects relating to Soil Science, Agric. Engg., Water Management, etc. are available in the library. Annual Reports from the different Institutes, Agricultural Universities are being received from time to time.
e-Services
Online Journals: More than 3000 scienti�c research journals are available online through Consortium for e-Resources in Agriculture (CeRA) (Now jgateplus portal) on request.
CD-ROM Data Bases: World wide agricultural information retrieval services of published agricultural researches are available on CD-ROM data base where abstracts of the researches can be consulted. The research databases are available since 1972 of AGRIS, Plant Gene CD, Soil CD.
Online Public Access Catalogue (OPAC): Library book catalogue is available in online form which is a systematic record of the holding of a collection to �nd the physical location of information for easier to search using LIBSYS software version 6.0. Now “KOHA” software has also been implemented and all the data of Books, Journals, Theses, etc. has been migrated to “KOHA” to strengthen the digital resources of all Libraries under NARS (e-Granth). The Web OPAC of Library in “KOHA” may be accessed through http// egranth.ac.in
Institutional Digital Repository: Institute Library has a Digital repository i.e. “Krishikosh “which has been created through the digitized CSSRI documents including Institutional Publications, Annual Reports, Foundation day lecture notes, Tech. Bulletins, rare and important books (150) by IARI, New Delhi centre. The digitized documents uploaded in “KrishiKosh” may be accessed online through the link http:// krishikosh.egranth.ac.in
Org
anog
ram
Ann
ual R
epor
t 201
8-19
19
Bar-code based Circulation: Library provides Bar-coded Electronic Membership Cards to its readers for easy circulation and to know the borrower status.
Documentation and other Services
Documentation Services: Under Documentation Services, Current Awareness Services (CAS) and Selective Dissemination of Information (SDI) are provided to users with the help of Fresh Arrivals display on board and in training, advertisement �les, etc.
The library also works as a repository center where Institute's Publications such as Salinity News, Technical Bulletins, Annual Reports, Brochures, etc. are stocked and sent to Research Institutes, Agricultural Universities, NAAS members, QRT members, RAC members etc. and also distributed amongst the distinguished visitors, farmers, etc. We have 03 priced publications also which are supplied on cash payment or D.D.in advance.
Laboratories
Well equipped laboratories for undertaking researches on various aspects of salinity management are in place with some of the advanced facilities like Atomic Absorption Spectrophotometer, Inductively Coupled Plasma (ICP), HPLC,GLC Carbon-Nitrogen-Hydrogen-Sulphur analyzer (CNHS), Ion Chromatograph, UV VIS Spectro Photometer, Ultra pure water system, PCR, Gel documentation, Radio meter, Kjeltek N-analyser, EM Salinity Probe, Neutron Moisture meter, Growth Chamber, Modulated �urometer, Dilutor, Hydraulic conductivity measurement apparatus, Pressure plate apparatus, etc. Large number of screen houses and micro-plots are also available for precision experimental works. The facilities of image processing and interpreting satellite imageries and geographical information system besides testing facilities of drainage �lter materials are also available. Recently, a multimedia laboratory has also been established to cater to the need of photographic and image processing and power point presentation etc.
Allied Facilities
A conference hall, seminar room and an auditorium with modern facilities are available for scienti�c meetings and group discussions. The institute has an 'Information Technology Centre' for displaying salient research �ndings and the technologies commercialized. This centre is periodically upgraded with new additions and state of art display infrastructure/material. An international guesthouse and scientists hostel with boarding facilities cater to the need of scientists and other visitors. A dispensary with physiotherapy unit is also available. A community center and sports complex consisting of playgrounds for football, hockey, cricket, volley ball, lawn tennis court etc. besides indoor facilities for table tennis, chess, carom and badminton are available. The staff recreation club functions to meet the recreational requirements of the staff. Besides this, a Staff Welfare Club is also functioning actively for the welfare of the CSSRI staff.
20
RESE
ARC
H A
CHIE
VEM
ENTS Re
sear
ch A
chie
vem
ents
21
22
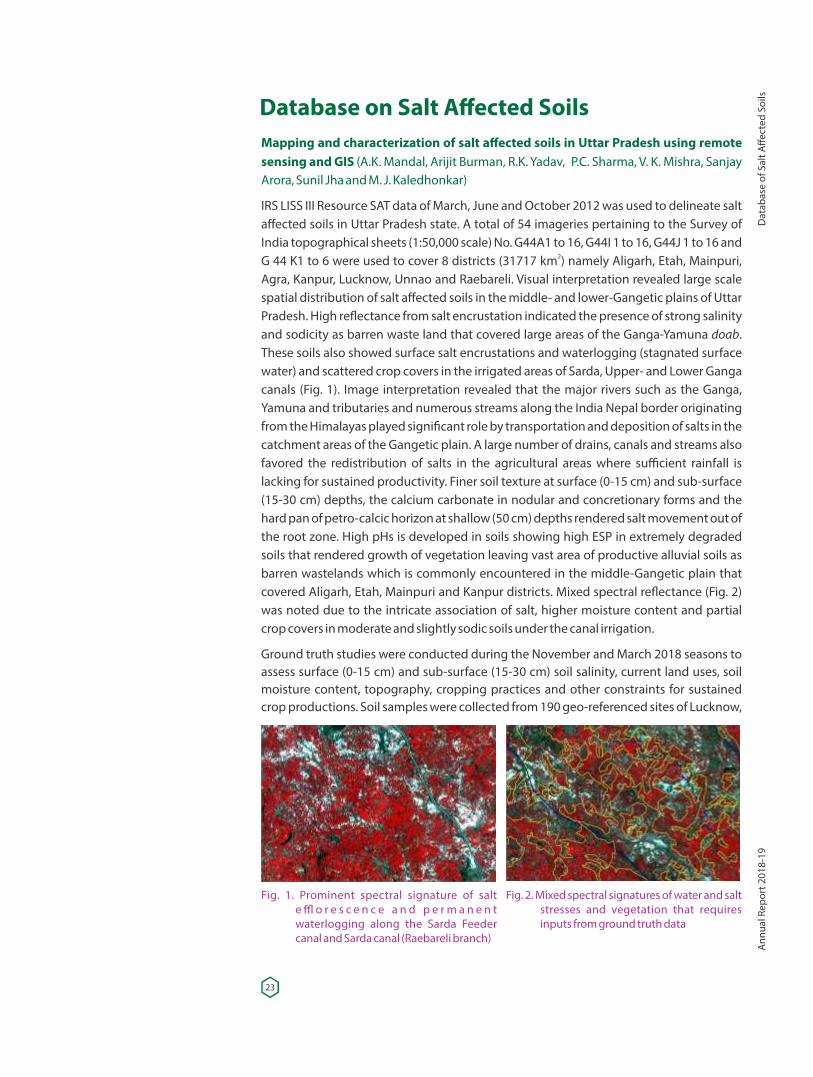
Database on Salt Affected SoilsMapping and characterization of salt affected soils in Uttar Pradesh using remote sensing and GIS (A.K. Mandal, Arijit Burman, R.K. Yadav, P.C. Sharma, V. K. Mishra, Sanjay Arora, Sunil Jha and M. J. Kaledhonkar)
IRS LISS III Resource SAT data of March, June and October 2012 was used to delineate salt affected soils in Uttar Pradesh state. A total of 54 imageries pertaining to the Survey of India topographical sheets (1:50,000 scale) No. G44A1 to 16, G44I 1 to 16, G44J 1 to 16 and G 44 K1 to 6 were used to cover 8 districts (31717 km ) namely Aligarh, Etah, Mainpuri, 2
Agra, Kanpur, Lucknow, Unnao and Raebareli. Visual interpretation revealed large scale spatial distribution of salt affected soils in the middle- and lower-Gangetic plains of Uttar Pradesh. High re�ectance from salt encrustation indicated the presence of strong salinity and sodicity as barren waste land that covered large areas of the Ganga-Yamuna . doabThese soils also showed surface salt encrustations and waterlogging (stagnated surface water) and scattered crop covers in the irrigated areas of Sarda, Upper- and Lower Ganga canals (Fig. 1). Image interpretation revealed that the major rivers such as the Ganga, Yamuna and tributaries and numerous streams along the India Nepal border originating from the Himalayas played signi�cant role by transportation and deposition of salts in the catchment areas of the Gangetic plain. A large number of drains, canals and streams also favored the redistribution of salts in the agricultural areas where sufficient rainfall is lacking for sustained productivity. Finer soil texture at surface (0-15 cm) and sub-surface (15-30 cm) depths, the calcium carbonate in nodular and concretionary forms and the hard pan of petro-calcic horizon at shallow (50 cm) depths rendered salt movement out of the root zone. High pHs is developed in soils showing high ESP in extremely degraded soils that rendered growth of vegetation leaving vast area of productive alluvial soils as barren wastelands which is commonly encountered in the middle-Gangetic plain that covered Aligarh, Etah, Mainpuri and Kanpur districts. Mixed spectral re�ectance (Fig. 2) was noted due to the intricate association of salt, higher moisture content and partial crop covers in moderate and slightly sodic soils under the canal irrigation.
Ground truth studies were conducted during the November and March 2018 seasons to assess surface (0-15 cm) and sub-surface (15-30 cm) soil salinity, current land uses, soil moisture content, topography, cropping practices and other constraints for sustained crop productions. Soil samples were collected from 190 geo-referenced sites of Lucknow,
Dat
abas
e of
Sal
t Affe
cted
Soi
lsA
nnua
l Rep
ort 2
018-
19
Fig. 1. Prominent spectral signature of salt e ffl o r e s c e n c e a n d p e r m a n e n t waterlogging along the Sarda Feeder canal and Sarda canal (Raebareli branch)
Fig. 2. Mixed spectral signatures of water and salt stresses and vegetation that requires inputs from ground truth data
23
Unnao, Raebareli and of Kanpur districts were analyzed for the determinations of soil reaction (pH ) and electrical conductivity (EC ). Soil analysis indicated three categories of 2 2
sodic soils viz., slight, moderate and strong. Slightly sodic covered 85% of the reported soil samples followed by moderate and strongly sodic soils. In order to authenticate the areas under the mixed pixels, limited soil sampling were carried out in areas showing poor spectral signatures. Soil sodicity is primary land degradation in the middle- and lower-Gangetic plains of Uttar Pradesh.
Spectral characterizations of saline soil located at Nain experimental farm of ICAR-CSSRI in Panipat district of Haryana (Arijit Barman, Rajeev Srivastava, A.K. Mandal, Jogendra Singh and R. K. Yadav)
Increasing rate of salt concentration had lower re�ectance value due to hygroscopic nature of Na dominated salt. The shifting of absorption peak to higher wavelengths at 1900 nm was found to well correlate with increase in the salt concentration (Fig.3).
Fig. 3. Effect of different salinity levels on soil re�ectance spectra
Fig. 4.Correlogram of SAS parameters with 1st derivative spectra
A gradual decline in soil re�ectance value with increasing concentration of salt is observed to be pronounced in the longer wavelength (1900, 1400 and 2200 nm). Higher
Fig. 5. Scatter plot of measured & predicted EC and pH in e s
validation dataset
24
correlation value (both positive and negative) of respective parameters represents the prominent signi�cant band for that respective parameter. Relatively high correlation of
+ - stEC , pH , SAR, SOC, saturation extract Na and Cl with 1 derivative soil re�ectance values e s
was found between 1300 to 2400 nm (Fig. 4). The application of models developed for prediction of soil salinity related parameters in the unknown validation sets resulted in a
+ - high coefficient of determination value for EC , pH , saturated extract Na and Cle s
parameters (Fig. 5). Relatively higher absolute values of PLSR regression coefficients at respective wavebands for respective soil salinity variables indicated that these wavebands are contributing signi�cantly in prediction of these soil salinity parameters. Table 1 presents the respective wavebands for respective soil salinity variables.
Table 1. Signi�cant wavebands of respective soil salinity parameters
Soil Properties Waveband (µm)-1ECe (dS m ) 1.42, 1.91, 1.98
pHs 0.45, 1.37, 1.97, 2.21, 2.26, 2.37, 2.42SOC(%) 0.69, 1.36, 1.85, 2.14, 2.21, 2.23, 2.36, 2.4
-1SE SAR ([meq l ]0.5) 1.37, 1.94, 1.97, 2.1, 2.29, 2.36, 2.42+ -1SE Na (meq l ) 1.42, 1.91, 1.98, 2.18
- -1SE Cl (meq l ) 1.86, 1.90, 1.94, 2.39
25
Dat
abas
e of
Sal
t Affe
cted
Soi
lsA
nnua
l Rep
ort 2
018-
19
Reclamation and Management of Alkali SoilsProductive utilization of reclaimed sodic soil through conservation agriculture under rice –wheat cropping system (Ranbir Singh, A.K. Rai, Parvender Sheoran and Pathan A. Latiff)
The productivity of rice-wheat cropping system in the Western Indo-Gangetic plains is either stagnating or decreasing with the associated problems of declining water table, decreasing level of soil organic carbon, nutrient imbalance, emerging de�ciencies of secondary and micronutrients, extensive tillage and residue burning practices. Keeping these constraints in view, a �eld experiment has been continuing from 2006 with revised treatments from 2011 to evaluate the effect of resource conservation strategies viz., tillage, residue and irrigation methods for enhancing crop productivity and sustaining soil health in semi-reclaimed sodic soils. Conventional practice (CV) vis-à-vis eight adopted resource conservation techniques were imposed. High yielding varieties (HYV) of rice (Arize 6129) and wheat (HD 2967) were taken as test crops.
-1The highest grain yield of rice (7.01 t ha ) was recorded in DSR with wheat residue incorporation followed by conventional transplanting with crop residue incorporation
-1(6.85 t ha ). Crop residue incorporation in transplanted rice (CV+R) gave 2.85% additional grain yield compared to conventional transplanting without residue incorporation (CV).
-1DSR with residue incorporation (DSR+R) produced 5.26% higher grain yield (7.01 t ha ) 34.15% less irrigation water and 34.15% less electricity compared to TPR. Grain yield under DSR+R was 5.57% higher than DSR without residue (Fig.6.).
-1In wheat, the highest grain yield (6.01 t ha ) was recorded under reduced tillage (RT) with rice residue incorporation (RTW+RRI), which was 16.47% higher than conventional practice. Incorporation of residue under conventional tillage gave additional 13.18% grain yield than without residue. Likewise, wheat under RT with anchored rice residue and under zero tillage (ZT) without rice residue produced 13.17% and 13.19% higher grain yield than conventional practice (Fig.7.).
Sprinkler irrigation in wheat under zero tillage with 100% rice residue produced 5.38 t -1 -1grain yield ha , the highest nutrient use efficiency (NUE) of 78.31 kg grain kg N with
-1saving of 14.63% irrigation water and 54.2% nitrogen (175.2 kg urea ha ) compared to conventional practice. Drip irrigation in ZT wheat with 100% rice residue produced 5.95 t
-1 -1grain yield ha , highest NUE 70.83 kg grain kg N along with saving of 27.51% irrigation -1water and 44.0% nitrogen (~120 kg urea ha ) compared to the conventional practice.
Fig.6 Effects of tillage and residue management on grain yield (t
- 1ha ) of r ice (Note : TPR= Transplanted rice; WRI= wheat residue incorporation; DSR= direct seeded rice; ZT= zero tillage; WR= Wheat residue retention/anchored; GY=Grain yield)
Rice 2018
-1Ri
ce g
rain
yie
ld (t
ha
)
26
Similarly, mini-sprinkler irrigation in DSR under reduced tillage with wheat residue -1incorporation produced 6.10 t grain yield ha along with saving of 70.1% of irrigation
-1water than conventional transplanted rice (32.97 kg grain kg N). DSR under reduced -1 -1tillage produced 7.17 t grain yield ha with NUE of 23.0 kg grain kg N and irrigation water
-3productivity of 5.49 kg grain m along with saving of 81% irrigation water and 82% electricity compared to conventional transplanted rice.
Sustainable nutrient management strategies for partially reclaimed salt affected soils (Ajay Kumar Bhardwaj, Bhaskar Narjary and Priyanka Chandra)
Integrated nutrient management experiments were continued with ten treatments replicated four times in randomized block design. The treatments are- T =Control 1
(without organic and inorganic fertilizer, O), T =N P K Zn (Farmers' practice; FP), 2 180 22 0 5
T =N P K Zn (R), T = N P K + Moong (LE), T = N P K + green manuring with 3 180 39 63 7 4 100 16 26 5 100 16 26 -1Sesbania aculeate before rice transplanting (GM), T = N P K +FYM @10t ha before rice 6 100 16 26
transplanting (FYM), T =N P K +wheat straw (standing stubble incorporated before 7 100 16 26
rice transplanting, WS), T = N P K +Rice straw(standing stubble incorporated before 8 100 16 26
wheat sowing (RS), T = N P K S Zn Mn (SMN) and T = N P K S Zn Mn (S). At the 9 150 26 42 30 7 7 10 150 26 42 30 7 0
time of harvesting, 33% of the total rice stalk length was kept untouched and incorporated into the soil by power tiller before wheat (DBW-17) sowing in T treatment. 8
Before rice transplanting, greengram seeds (SML 668) were sown in �rst fortnight of May in the speci�ed plots and incorporated in situ after two pickings of pods. Similarly, dhaincha (Sesbania aculeate) as green manure crop was sown in May in the plots of T 5
treatment. At the age of 45 days, it was harvested, weighed and incorporated in situ in the speci�ed plots before rice transplanting. Farm yard manure (FYM) and wheat straw (WS) were added in soil 15 and 30 days before rice transplanting, respectively. Rice (Pusa-44) seedlings (30 days old) were transplanted in �rst week of July at 20 × 15 cm spacing. One third of N and full doses of other macro and micro nutrients were applied at the time of sowing (in wheat)/transplanting (in rice) according to the treatment speci�cations. Remaining N was applied in two equal splits after 3 and 6 weeks of sowing (in wheat) / transplanting (in rice). Soil samples were taken at the time of harvesting of both rice and wheat crops. Ion exchange resin (IER) membranes (cation, anion) were used as plant root simulators. The membranes are implanted in soil for 10-15 days intervals, throughout the season, to determine daily nutrient availability in soil solution.
Full season total N in GM was 20% higher compared to chemical fertilizers alone (F). Averaging all INM management revealed unique patterns with 100% fertilizers having more available N just after application, while INM treatment matching up to 30-60 days after transplanting (DAT), and exceeding F during rest of the growth period beyond 60
Fig.7. Effects of tillage and residue management on grain yield
-1(t ha ) of wheat (Note: CVW= Conventional wheat tillage; R R I = R i c e r e s i d u e incorporation; RT= Reduced tillage; ZTW= Wheat in zero tillage; RR=Rice residue; GY= Grain yield)
Fig.8. Trends in plant available N + -(NH -N, NO -N and total-N) in 4 3
soil solution with F (100% inorganic fertilizers) and INM ( i n t e g r a t e d n u t r i e n t management, 55% inorganic fertilizers + organic inputs) during rice growth season. M a n a g e m e n t : F = 1 0 0 % inorganic fertilizers only, INM= I n t e g r a t e d n u t r i e n t management (55% inorganic f e r t i l i z e r + o r g a n i c a m e n d m e n t ) . E r r o r b a r s denote ± 1SE.
27
Recl
amat
ion
and
Man
agem
ent o
f Alk
ali S
oils
Ann
ual R
epor
t 201
8-19
+ -DAT (Fig. 8). The effects were more pronounced for NH -N than NO -N. The fertilizer-N use 4 3
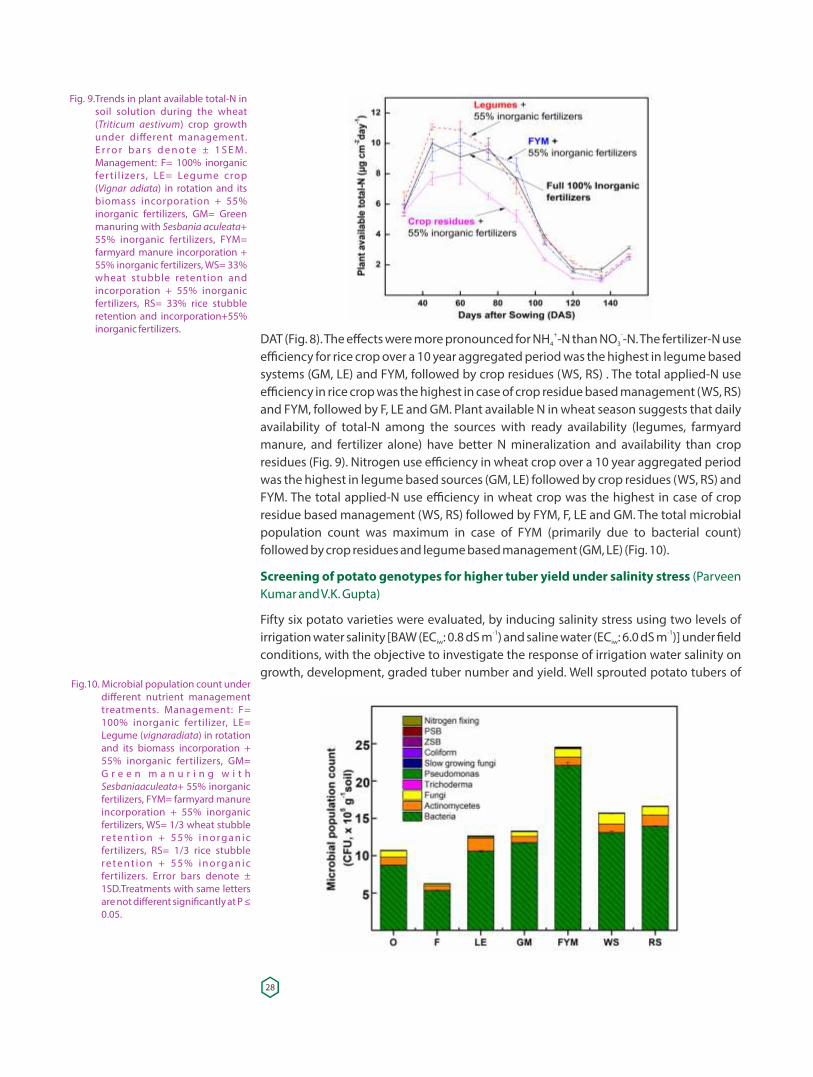
efficiency for rice crop over a 10 year aggregated period was the highest in legume based systems (GM, LE) and FYM, followed by crop residues (WS, RS) . The total applied-N use efficiency in rice crop was the highest in case of crop residue based management (WS, RS) and FYM, followed by F, LE and GM. Plant available N in wheat season suggests that daily availability of total-N among the sources with ready availability (legumes, farmyard manure, and fertilizer alone) have better N mineralization and availability than crop residues (Fig. 9). Nitrogen use efficiency in wheat crop over a 10 year aggregated period was the highest in legume based sources (GM, LE) followed by crop residues (WS, RS) and FYM. The total applied-N use efficiency in wheat crop was the highest in case of crop residue based management (WS, RS) followed by FYM, F, LE and GM. The total microbial population count was maximum in case of FYM (primarily due to bacterial count) followed by crop residues and legume based management (GM, LE) (Fig. 10).
Screening of potato genotypes for higher tuber yield under salinity stress (Parveen Kumar and V.K. Gupta)
Fifty six potato varieties were evaluated, by inducing salinity stress using two levels of -1 -1irrigation water salinity [BAW (EC : 0.8 dS m ) and saline water (EC : 6.0 dS m )] under �eld iw iw
conditions, with the objective to investigate the response of irrigation water salinity on growth, development, graded tuber number and yield. Well sprouted potato tubers of
Fig. 9.Trends in plant available total-N in soil solution during the wheat (Triticum aestivum) crop growth under different management. E r r o r b a r s d e n o t e ± 1 S E M . Management: F= 100% inorganic fer ti l izers, LE= Legume crop (Vignar adiata) in rotation and its biomass incorporation + 55% inorganic fertilizers, GM= Green manuring with Sesbania aculeata+ 55% inorganic fertilizers, FYM= farmyard manure incorporation + 55% inorganic fertilizers, WS= 33% wheat stubble retention and incorporation + 55% inorganic fertilizers, RS= 33% rice stubble retention and incorporation+55% inorganic fertilizers.
Fig.10. Microbial population count under different nutrient management treatments. Management: F= 100% inorganic fertilizer, LE= Legume (vignaradiata) in rotation and its biomass incorporation + 55% inorganic fertilizers, GM= G r e e n m a n u r i n g w i t h Sesbaniaaculeata+ 55% inorganic fertilizers, FYM= farmyard manure incorporation + 55% inorganic fertilizers, WS= 1/3 wheat stubble r e t e n t i o n + 5 5 % i n o r g a n i c fertilizers, RS= 1/3 rice stubble r e t e n t i o n + 5 5 % i n o r g a n i c fertilizers. Error bars denote ± 1SD.Treatments with same letters are not different signi�cantly at P ≤ 0.05.
28
different varieties were planted in October, 2018 with 60 × 30 cm crop geometry with recommended dose of fertilizers. First two irrigations were given with best available water (BAW) to facilitate proper emergence and saline water irrigation was started after earthing up (23 d). Dehaulming was done at 100 days after planting and harvesting was done after one week to ensure proper curing. Initial observations indicated that growth
-1 -1traits (plant height and stem no. plant ), tuber number and yield plant were not affected signi�cantly due to salinity stress (Table 2). However, all physiological characteristics decreased in response to saline water irrigation. This can mainly be ascribed to the fact that 49 mm rainfall received during crop season allowed salinity buildup of only EC 4.80, e
-1 3.4 and 2.97 dS m in 0 – 15 cm soil layer at 55 and 90 days and at harvest, respectively -1even after applying 3 irrigations of saline water (EC 6 dS m ). Rains helped in leaching of iw
+ + + salts added through saline water. Na content and Na /K ratio increased signi�cantly in potato tubers irrigated with saline water. Similarly, all the cations and anions increased in soil by applying saline irrigation water than BAW.
Table 2. Effect of Irrigation water salinity on tuber yield per plant of potato varieties
-1Irrigation water salinity Tuber yield plant (g) Marketable (>20 g) Small (<20 g) Total
-1BAW (0.8 dS m ) 737 18.4 756-1SW (6 dS m ) 758 20.7 778
CD (P=0.05) NS NS NS-1Varieties (based upon yield plant )
Kufri Arun 1210 26.1 1236Kufri Khyati 1148 24.9 1173Kufri. Mohan 1064 22.2 1086Kufri Sindhuri 1006 64.7 1070Kufri Neelkanth 1040 21.5 1062Sagitta (Check) 629 6.75 635Range 376-1210 6.75-93.6 383-1236
BAW: best available water; SW: saline water
Developing alternate strategies for reclamation of sodic soils (A.K. Rai, N. Basak, R. L. Meena, R. K. Yadav, P.C. Sharma, P. Sundha, S.K. Jha, U.R. Khandkar, R.V. Jasra, C. Chudasama, Prakash Kumar, K. Sidhpuria, S. Rawalekar, Y. Shah, C. Gadipelly, Sunil Soni, Niranjan Kumar, Jyothirmayi Kumpatla and Hemant Katti)
Sodic soils occupy more than 50% (3.77 m ha) of the total salt-affected area of India. There has been an increasing interest in using elemental S for calcareous-sodic soil reclamation. Different lysimeter and �eld experiments, conducted during last year, showed the reduction in soil pH after application of RFS alone or in a combination of gypsum with a
0signi�cant increase in crop yield. About 80-90% of applied S oxidized within 150 days depending upon the soil types (Fig. 11). The rate of oxidation depends upon the soil type and rate of RFS application. During 150 days of incubation, Reliance Formulated Sulphur
-1RFS oxidation produced 150.5, 71.5, 213.3 and 76.3 me kg acidity in Shivri, Haibatpur, Indore and Dharamgarh soils, respectively. To augment the S°oxidation rate, about 150 morpho-types of sulphur oxidizing bacteria (SOB) were isolated from varied habitats. These isolates were tested for S°oxidation in modi�ed thiosulphate broth. Best 10 isolates showing pH reduction in the range of 3.6-5.8 with distinct de-coloration of bromocressol
29
Recl
amat
ion
and
Man
agem
ent o
f Alk
ali S
oils
Ann
ual R
epor
t 201
8-19
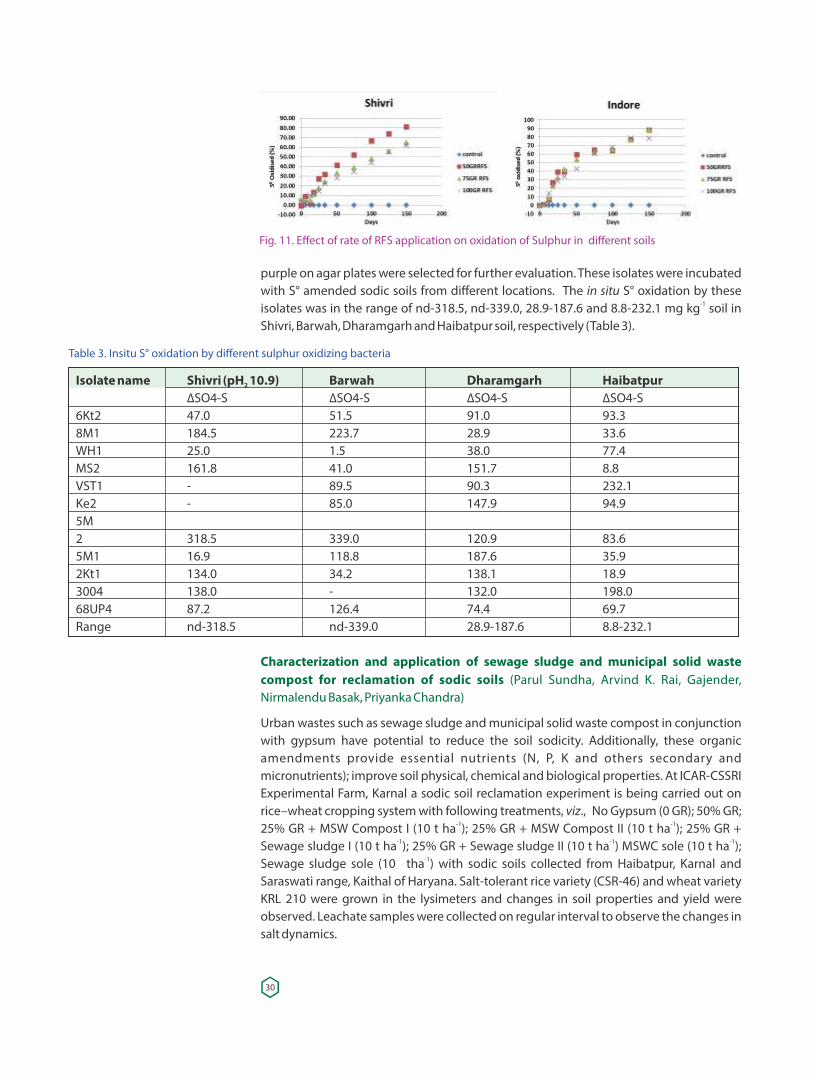
purple on agar plates were selected for further evaluation. These isolates were incubated with S° amended sodic soils from different locations. The in situ S° oxidation by these
-1isolates was in the range of nd-318.5, nd-339.0, 28.9-187.6 and 8.8-232.1 mg kg soil in Shivri, Barwah, Dharamgarh and Haibatpur soil, respectively (Table 3).
Fig. 11. Effect of rate of RFS application on oxidation of Sulphur in different soils
Table 3. Insitu S° oxidation by different sulphur oxidizing bacteria
Isolate name Shivri (pH 10.9) Barwah Dharamgarh Haibatpur2
∆SO4-S ∆SO4-S ∆SO4-S ∆SO4-S6Kt2 47.0 51.5 91.0 93.38M1 184.5 223.7 28.9 33.6WH1 25.0 1.5 38.0 77.4MS2 161.8 41.0 151.7 8.8VST1 - 89.5 90.3 232.1Ke2 - 85.0 147.9 94.95M2 318.5 339.0 120.9 83.65M1 16.9 118.8 187.6 35.92Kt1 134.0 34.2 138.1 18.93004 138.0 - 132.0 198.068UP4 87.2 126.4 74.4 69.7Range nd-318.5 nd-339.0 28.9-187.6 8.8-232.1
Characterization and application of sewage sludge and municipal solid waste compost for reclamation of sodic soils (Parul Sundha, Arvind K. Rai, Gajender, Nirmalendu Basak, Priyanka Chandra)
Urban wastes such as sewage sludge and municipal solid waste compost in conjunction with gypsum have potential to reduce the soil sodicity. Additionally, these organic amendments provide essential nutrients (N, P, K and others secondary and micronutrients); improve soil physical, chemical and biological properties. At ICAR-CSSRI Experimental Farm, Karnal a sodic soil reclamation experiment is being carried out on rice–wheat cropping system with following treatments, viz., No Gypsum (0 GR); 50% GR;
-1 -125% GR + MSW Compost I (10 t ha ); 25% GR + MSW Compost II (10 t ha ); 25% GR + -1 -1 -1Sewage sludge I (10 t ha ); 25% GR + Sewage sludge II (10 t ha ) MSWC sole (10 t ha );
-1Sewage sludge sole (10 tha ) with sodic soils collected from Haibatpur, Karnal and Saraswati range, Kaithal of Haryana. Salt-tolerant rice variety (CSR-46) and wheat variety KRL 210 were grown in the lysimeters and changes in soil properties and yield were observed. Leachate samples were collected on regular interval to observe the changes in salt dynamics.
30
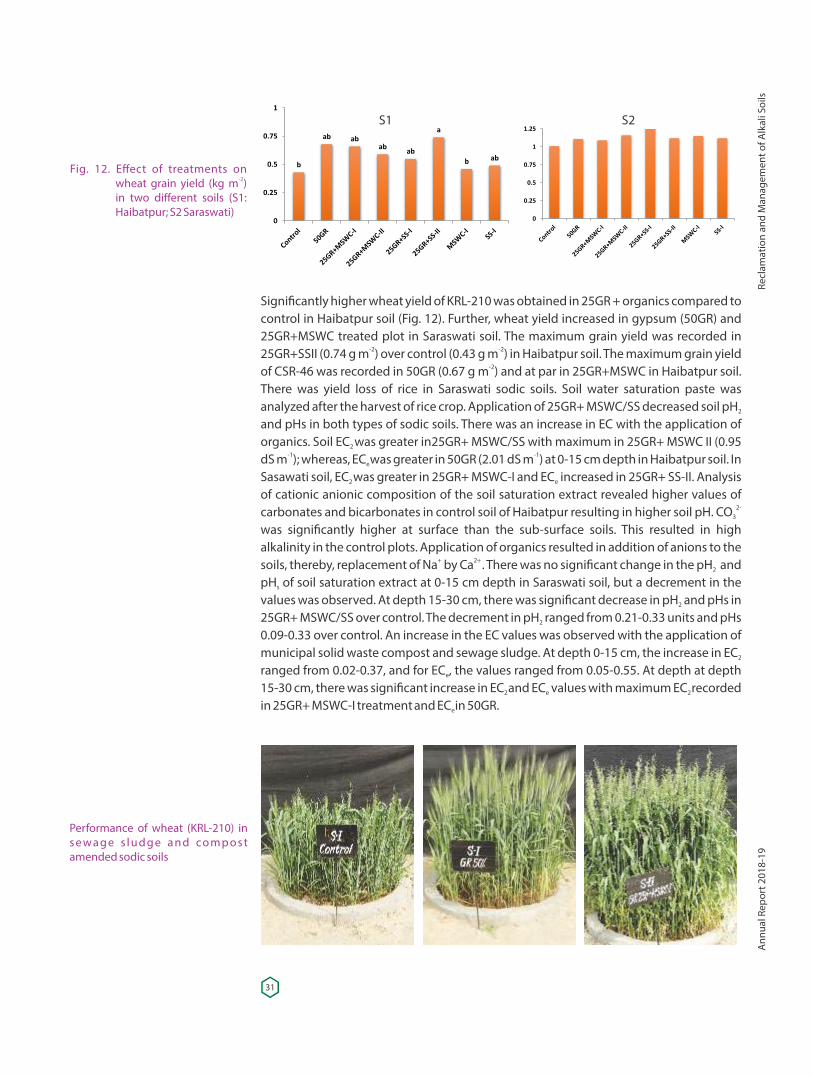
Signi�cantly higher wheat yield of KRL-210 was obtained in 25GR + organics compared to control in Haibatpur soil (Fig. 12). Further, wheat yield increased in gypsum (50GR) and 25GR+MSWC treated plot in Saraswati soil. The maximum grain yield was recorded in
-2 -225GR+SSII (0.74 g m ) over control (0.43 g m ) in Haibatpur soil. The maximum grain yield -2of CSR-46 was recorded in 50GR (0.67 g m ) and at par in 25GR+MSWC in Haibatpur soil.
There was yield loss of rice in Saraswati sodic soils. Soil water saturation paste was analyzed after the harvest of rice crop. Application of 25GR+ MSWC/SS decreased soil pH 2
and pHs in both types of sodic soils. There was an increase in EC with the application of organics. Soil EC was greater in25GR+ MSWC/SS with maximum in 25GR+ MSWC II (0.95 2
-1 -1dS m ); whereas, EC was greater in 50GR (2.01 dS m ) at 0-15 cm depth in Haibatpur soil. In e
Sasawati soil, EC was greater in 25GR+ MSWC-I and EC increased in 25GR+ SS-II. Analysis 2 e
of cationic anionic composition of the soil saturation extract revealed higher values of 2- carbonates and bicarbonates in control soil of Haibatpur resulting in higher soil pH. CO3
was signi�cantly higher at surface than the sub-surface soils. This resulted in high alkalinity in the control plots. Application of organics resulted in addition of anions to the
+ 2+ soils, thereby, replacement of Na by Ca . There was no signi�cant change in the pH and 2
pH of soil saturation extract at 0-15 cm depth in Saraswati soil, but a decrement in the s
values was observed. At depth 15-30 cm, there was signi�cant decrease in pH and pHs in 2
25GR+ MSWC/SS over control. The decrement in pH ranged from 0.21-0.33 units and pHs 2
0.09-0.33 over control. An increase in the EC values was observed with the application of municipal solid waste compost and sewage sludge. At depth 0-15 cm, the increase in EC2
ranged from 0.02-0.37, and for EC , the values ranged from 0.05-0.55. At depth at depth e
15-30 cm, there was signi�cant increase in EC and EC values with maximum EC recorded 2 e 2
in 25GR+ MSWC-I treatment and EC in 50GR.e
Fig. 12. Effect of treatments on -2wheat grain yield (kg m )
in two different soils (S1: Haibatpur; S2 Saraswati)
Performance of wheat (KRL-210) in s e wa g e s l u d g e a n d co m p o s t amended sodic soils
S1 S2
31
Recl
amat
ion
and
Man
agem
ent o
f Alk
ali S
oils
Ann
ual R
epor
t 201
8-19
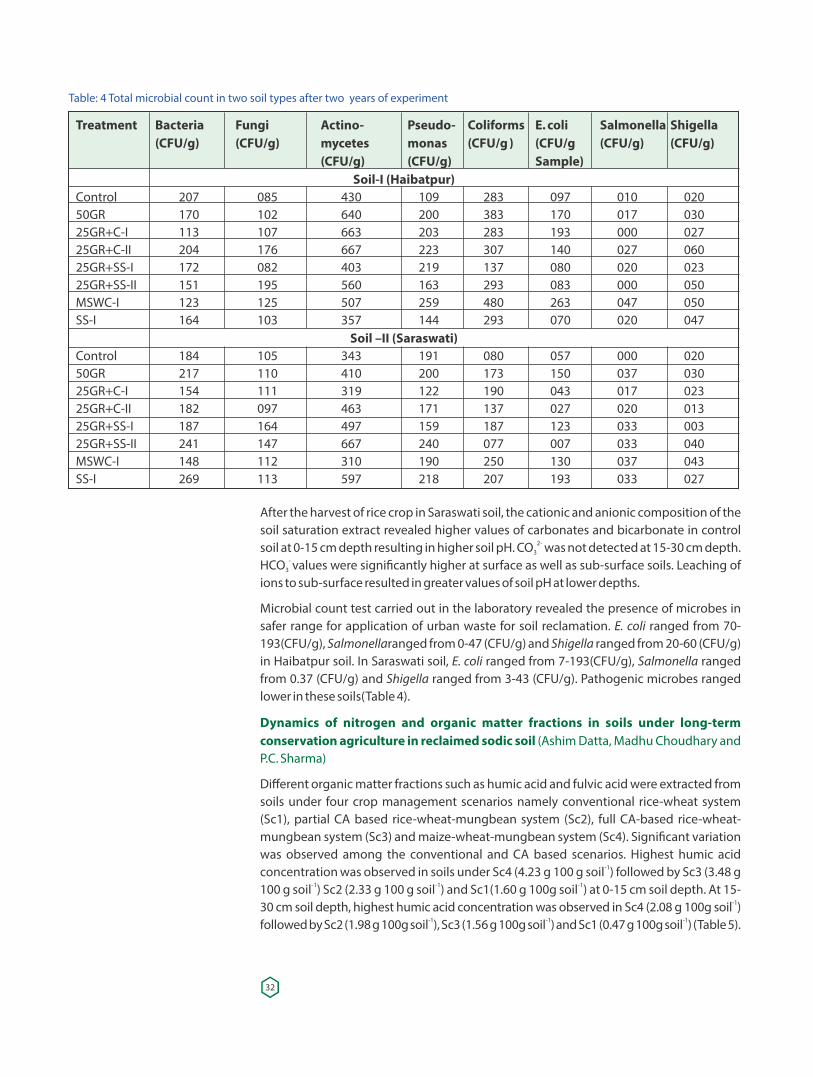
After the harvest of rice crop in Saraswati soil, the cationic and anionic composition of the soil saturation extract revealed higher values of carbonates and bicarbonate in control
2- soil at 0-15 cm depth resulting in higher soil pH. CO was not detected at 15-30 cm depth. 3- HCO values were signi�cantly higher at surface as well as sub-surface soils. Leaching of 3
ions to sub-surface resulted in greater values of soil pH at lower depths.
Microbial count test carried out in the laboratory revealed the presence of microbes in safer range for application of urban waste for soil reclamation. E. coli ranged from 70-193(CFU/g), Salmonellaranged from 0-47 (CFU/g) and Shigella ranged from 20-60 (CFU/g) in Haibatpur soil. In Saraswati soil, E. coli ranged from 7-193(CFU/g), Salmonella ranged from 0.37 (CFU/g) and Shigella ranged from 3-43 (CFU/g). Pathogenic microbes ranged lower in these soils(Table 4).
Dynamics of nitrogen and organic matter fractions in soils under long-term conservation agriculture in reclaimed sodic soil (Ashim Datta, Madhu Choudhary and P.C. Sharma)
Different organic matter fractions such as humic acid and fulvic acid were extracted from soils under four crop management scenarios namely conventional rice-wheat system (Sc1), partial CA based rice-wheat-mungbean system (Sc2), full CA-based rice-wheat-mungbean system (Sc3) and maize-wheat-mungbean system (Sc4). Signi�cant variation was observed among the conventional and CA based scenarios. Highest humic acid
-1concentration was observed in soils under Sc4 (4.23 g 100 g soil ) followed by Sc3 (3.48 g -1 -1 -1100 g soil ) Sc2 (2.33 g 100 g soil ) and Sc1(1.60 g 100g soil ) at 0-15 cm soil depth. At 15-
-130 cm soil depth, highest humic acid concentration was observed in Sc4 (2.08 g 100g soil ) -1 -1 -1followed by Sc2 (1.98 g 100g soil ), Sc3 (1.56 g 100g soil ) and Sc1 (0.47 g 100g soil ) (Table 5).
Table: 4 Total microbial count in two soil types after two years of experiment
Treatment Bacteria Fungi Actino- Pseudo- Coliforms E. coli Salmonella Shigella (CFU/g) (CFU/g) mycetes monas (CFU/g ) (CFU/g (CFU/g) (CFU/g) (CFU/g) (CFU/g) Sample)
Soil-I (Haibatpur)Control 207 085 430 109 283 097 010 02050GR 170 102 640 200 383 170 017 03025GR+C-I 113 107 663 203 283 193 000 02725GR+C-II 204 176 667 223 307 140 027 06025GR+SS-I 172 082 403 219 137 080 020 02325GR+SS-II 151 195 560 163 293 083 000 050MSWC-I 123 125 507 259 480 263 047 050SS-I 164 103 357 144 293 070 020 047
Soil –II (Saraswati)Control 184 105 343 191 080 057 000 02050GR 217 110 410 200 173 150 037 03025GR+C-I 154 111 319 122 190 043 017 02325GR+C-II 182 097 463 171 137 027 020 01325GR+SS-I 187 164 497 159 187 123 033 00325GR+SS-II 241 147 667 240 077 007 033 040MSWC-I 148 112 310 190 250 130 037 043SS-I 269 113 597 218 207 193 033 027
32
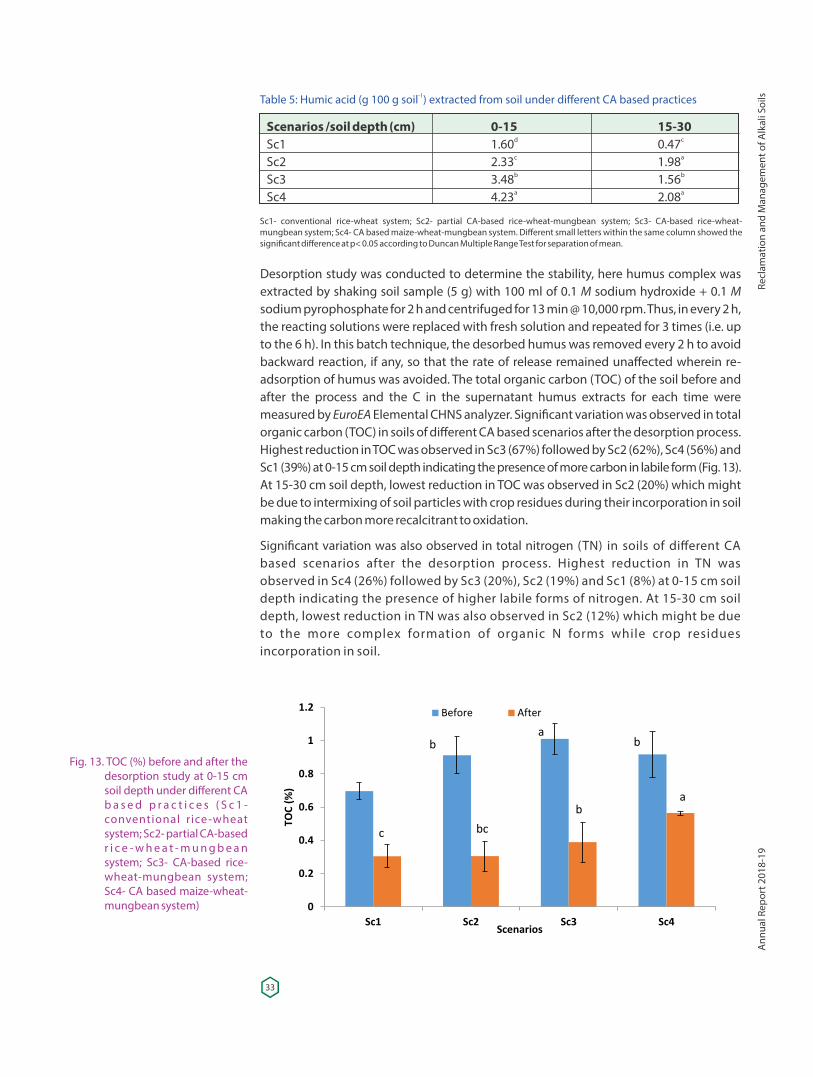
Desorption study was conducted to determine the stability, here humus complex was extracted by shaking soil sample (5 g) with 100 ml of 0.1 M sodium hydroxide + 0.1 M sodium pyrophosphate for 2 h and centrifuged for 13 min @ 10,000 rpm. Thus, in every 2 h, the reacting solutions were replaced with fresh solution and repeated for 3 times (i.e. up to the 6 h). In this batch technique, the desorbed humus was removed every 2 h to avoid backward reaction, if any, so that the rate of release remained unaffected wherein re-adsorption of humus was avoided. The total organic carbon (TOC) of the soil before and after the process and the C in the supernatant humus extracts for each time were measured by EuroEA Elemental CHNS analyzer. Signi�cant variation was observed in total organic carbon (TOC) in soils of different CA based scenarios after the desorption process. Highest reduction in TOC was observed in Sc3 (67%) followed by Sc2 (62%), Sc4 (56%) and Sc1 (39%) at 0-15 cm soil depth indicating the presence of more carbon in labile form (Fig. 13). At 15-30 cm soil depth, lowest reduction in TOC was observed in Sc2 (20%) which might be due to intermixing of soil particles with crop residues during their incorporation in soil making the carbon more recalcitrant to oxidation.
Signi�cant variation was also observed in total nitrogen (TN) in soils of different CA based scenarios after the desorption process. Highest reduction in TN was observed in Sc4 (26%) followed by Sc3 (20%), Sc2 (19%) and Sc1 (8%) at 0-15 cm soil depth indicating the presence of higher labile forms of nitrogen. At 15-30 cm soil depth, lowest reduction in TN was also observed in Sc2 (12%) which might be due to the more complex formation of organic N forms while crop residues incorporation in soil.
-1Table 5: Humic acid (g 100 g soil ) extracted from soil under different CA based practices
Scenarios /soil depth (cm) 0-15 15-30d cSc1 1.60 0.47 c aSc2 2.33 1.98 b bSc3 3.48 1.56 a aSc4 4.23 2.08
Sc1- conventional rice-wheat system; Sc2- partial CA-based rice-wheat-mungbean system; Sc3- CA-based rice-wheat-mungbean system; Sc4- CA based maize-wheat-mungbean system. Different small letters within the same column showed the signi�cant difference at p< 0.05 according to Duncan Multiple Range Test for separation of mean.
Fig. 13. TOC (%) before and after the desorption study at 0-15 cm soil depth under different CA b a s e d p r a c t i c e s ( S c 1 - conventional r ice -wheat system; Sc2- partial CA-based r i c e - w h e a t - m u n g b e a n system; Sc3- CA-based rice-wheat-mungbean system; Sc4- CA based maize-wheat-mungbean system)
33
Recl
amat
ion
and
Man
agem
ent o
f Alk
ali S
oils
Ann
ual R
epor
t 201
8-19
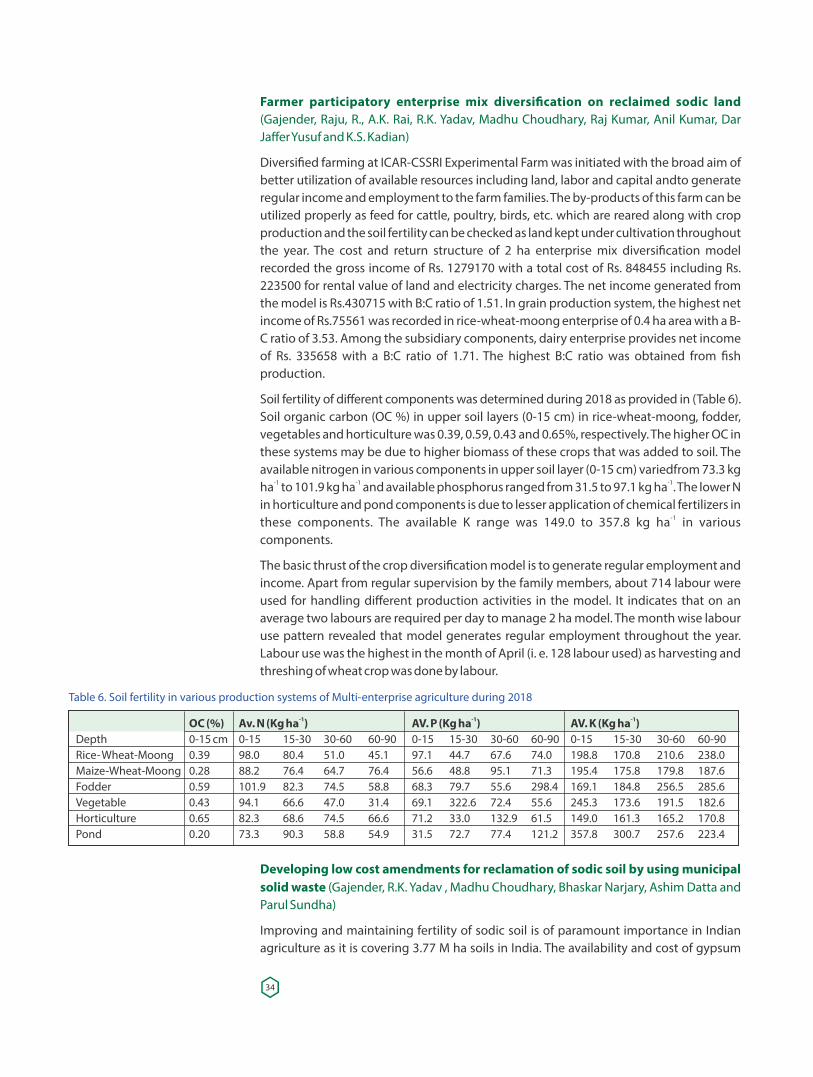
Farmer participatory enterprise mix diversi�cation on reclaimed sodic land (Gajender, Raju, R., A.K. Rai, R.K. Yadav, Madhu Choudhary, Raj Kumar, Anil Kumar, Dar Jaffer Yusuf and K.S. Kadian)
Diversi�ed farming at ICAR-CSSRI Experimental Farm was initiated with the broad aim of better utilization of available resources including land, labor and capital andto generate regular income and employment to the farm families. The by-products of this farm can be utilized properly as feed for cattle, poultry, birds, etc. which are reared along with crop production and the soil fertility can be checked as land kept under cultivation throughout the year. The cost and return structure of 2 ha enterprise mix diversi�cation model recorded the gross income of Rs. 1279170 with a total cost of Rs. 848455 including Rs. 223500 for rental value of land and electricity charges. The net income generated from the model is Rs.430715 with B:C ratio of 1.51. In grain production system, the highest net income of Rs.75561 was recorded in rice-wheat-moong enterprise of 0.4 ha area with a B-C ratio of 3.53. Among the subsidiary components, dairy enterprise provides net income of Rs. 335658 with a B:C ratio of 1.71. The highest B:C ratio was obtained from �sh production.
Soil fertility of different components was determined during 2018 as provided in (Table 6). Soil organic carbon (OC %) in upper soil layers (0-15 cm) in rice-wheat-moong, fodder, vegetables and horticulture was 0.39, 0.59, 0.43 and 0.65%, respectively. The higher OC in these systems may be due to higher biomass of these crops that was added to soil. The available nitrogen in various components in upper soil layer (0-15 cm) variedfrom 73.3 kg
-1 -1 -1ha to 101.9 kg ha and available phosphorus ranged from 31.5 to 97.1 kg ha . The lower N in horticulture and pond components is due to lesser application of chemical fertilizers in
-1these components. The available K range was 149.0 to 357.8 kg ha in various components.
The basic thrust of the crop diversi�cation model is to generate regular employment and income. Apart from regular supervision by the family members, about 714 labour were used for handling different production activities in the model. It indicates that on an average two labours are required per day to manage 2 ha model. The month wise labour use pattern revealed that model generates regular employment throughout the year. Labour use was the highest in the month of April (i. e. 128 labour used) as harvesting and threshing of wheat crop was done by labour.
Table 6. Soil fertility in various production systems of Multi-enterprise agriculture during 2018
-1 -1 -1 OC (%) Av. N (Kg ha ) AV. P (Kg ha ) AV. K (Kg ha )Depth 0-15 cm 0-15 15-30 30-60 60-90 0-15 15-30 30-60 60-90 0-15 15-30 30-60 60-90Rice- Wheat-Moong 0.39 98.0 80.4 51.0 45.1 97.1 44.7 67.6 74.0 198.8 170.8 210.6 238.0Maize-Wheat-Moong 0.28 88.2 76.4 64.7 76.4 56.6 48.8 95.1 71.3 195.4 175.8 179.8 187.6Fodder 0.59 101.9 82.3 74.5 58.8 68.3 79.7 55.6 298.4 169.1 184.8 256.5 285.6Vegetable 0.43 94.1 66.6 47.0 31.4 69.1 322.6 72.4 55.6 245.3 173.6 191.5 182.6Horticulture 0.65 82.3 68.6 74.5 66.6 71.2 33.0 132.9 61.5 149.0 161.3 165.2 170.8Pond 0.20 73.3 90.3 58.8 54.9 31.5 72.7 77.4 121.2 357.8 300.7 257.6 223.4
Developing low cost amendments for reclamation of sodic soil by using municipal solid waste (Gajender, R.K. Yadav , Madhu Choudhary, Bhaskar Narjary, Ashim Datta and Parul Sundha)
Improving and maintaining fertility of sodic soil is of paramount importance in Indian agriculture as it is covering 3.77 M ha soils in India. The availability and cost of gypsum
34
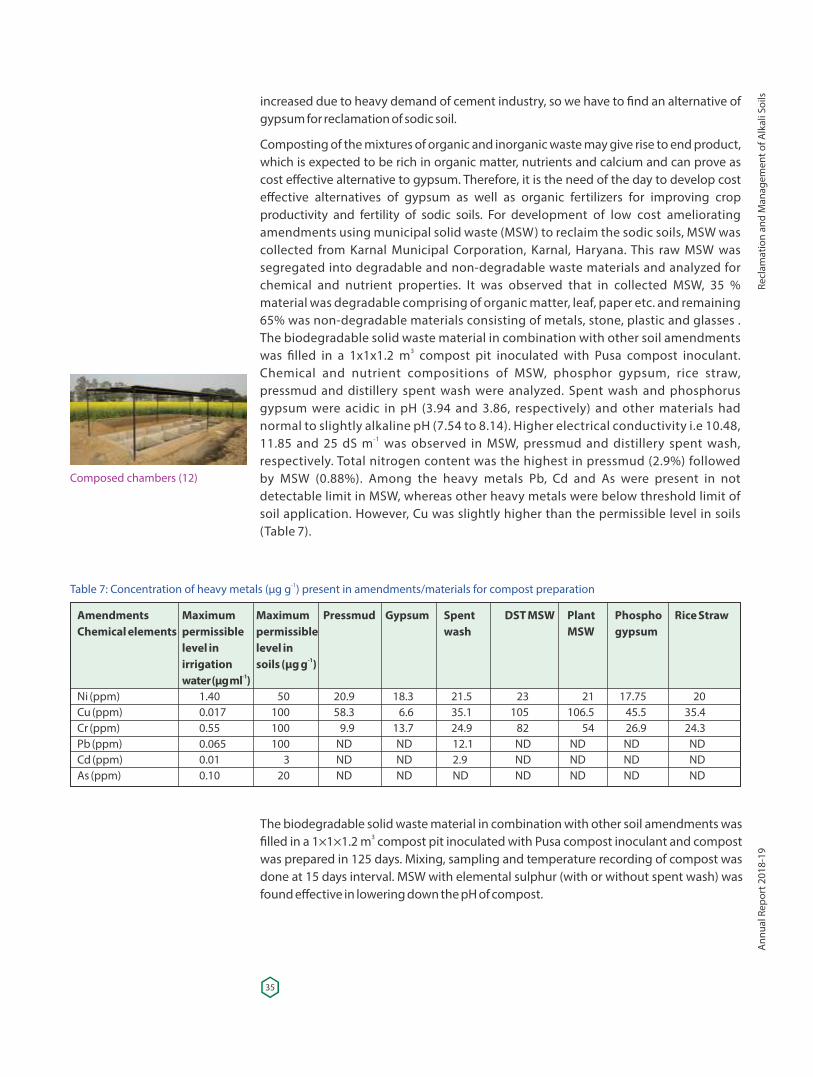
increased due to heavy demand of cement industry, so we have to �nd an alternative of gypsum for reclamation of sodic soil.
Composting of the mixtures of organic and inorganic waste may give rise to end product, which is expected to be rich in organic matter, nutrients and calcium and can prove as cost effective alternative to gypsum. Therefore, it is the need of the day to develop cost effective alternatives of gypsum as well as organic fertilizers for improving crop productivity and fertility of sodic soils. For development of low cost ameliorating amendments using municipal solid waste (MSW) to reclaim the sodic soils, MSW was collected from Karnal Municipal Corporation, Karnal, Haryana. This raw MSW was segregated into degradable and non-degradable waste materials and analyzed for chemical and nutrient properties. It was observed that in collected MSW, 35 % material was degradable comprising of organic matter, leaf, paper etc. and remaining 65% was non-degradable materials consisting of metals, stone, plastic and glasses . The biodegradable solid waste material in combination with other soil amendments
3was �lled in a 1x1x1.2 m compost pit inoculated with Pusa compost inoculant. Chemical and nutrient compositions of MSW, phosphor gypsum, rice straw, pressmud and distillery spent wash were analyzed. Spent wash and phosphorus gypsum were acidic in pH (3.94 and 3.86, respectively) and other materials had normal to slightly alkaline pH (7.54 to 8.14). Higher electrical conductivity i.e 10.48,
-111.85 and 25 dS m was observed in MSW, pressmud and distillery spent wash, respectively. Total nitrogen content was the highest in pressmud (2.9%) followed by MSW (0.88%). Among the heavy metals Pb, Cd and As were present in not detectable limit in MSW, whereas other heavy metals were below threshold limit of soil application. However, Cu was slightly higher than the permissible level in soils (Table 7).
-1Table 7: Concentration of heavy metals (μg g ) present in amendments/materials for compost preparation
Amendments Maximum Maximum Pressmud Gypsum Spent DST MSW Plant Phospho Rice StrawChemical elements permissible permissible wash MSW gypsum level in level in
-1 irrigation soils (μg g )-1 water (μg ml )
Ni (ppm) 1.40 50 20.9 18.3 21.5 23 21 17.75 20Cu (ppm) 0.017 100 58.3 6.6 35.1 105 106.5 45.5 35.4Cr (ppm) 0.55 100 9.9 13.7 24.9 82 54 26.9 24.3Pb (ppm) 0.065 100 ND ND 12.1 ND ND ND NDCd (ppm) 0.01 3 ND ND 2.9 ND ND ND NDAs (ppm) 0.10 20 ND ND ND ND ND ND ND
The biodegradable solid waste material in combination with other soil amendments was 3�lled in a 1×1×1.2 m compost pit inoculated with Pusa compost inoculant and compost
was prepared in 125 days. Mixing, sampling and temperature recording of compost was done at 15 days interval. MSW with elemental sulphur (with or without spent wash) was found effective in lowering down the pH of compost.
Composed chambers (12)
35
Recl
amat
ion
and
Man
agem
ent o
f Alk
ali S
oils
Ann
ual R
epor
t 201
8-19
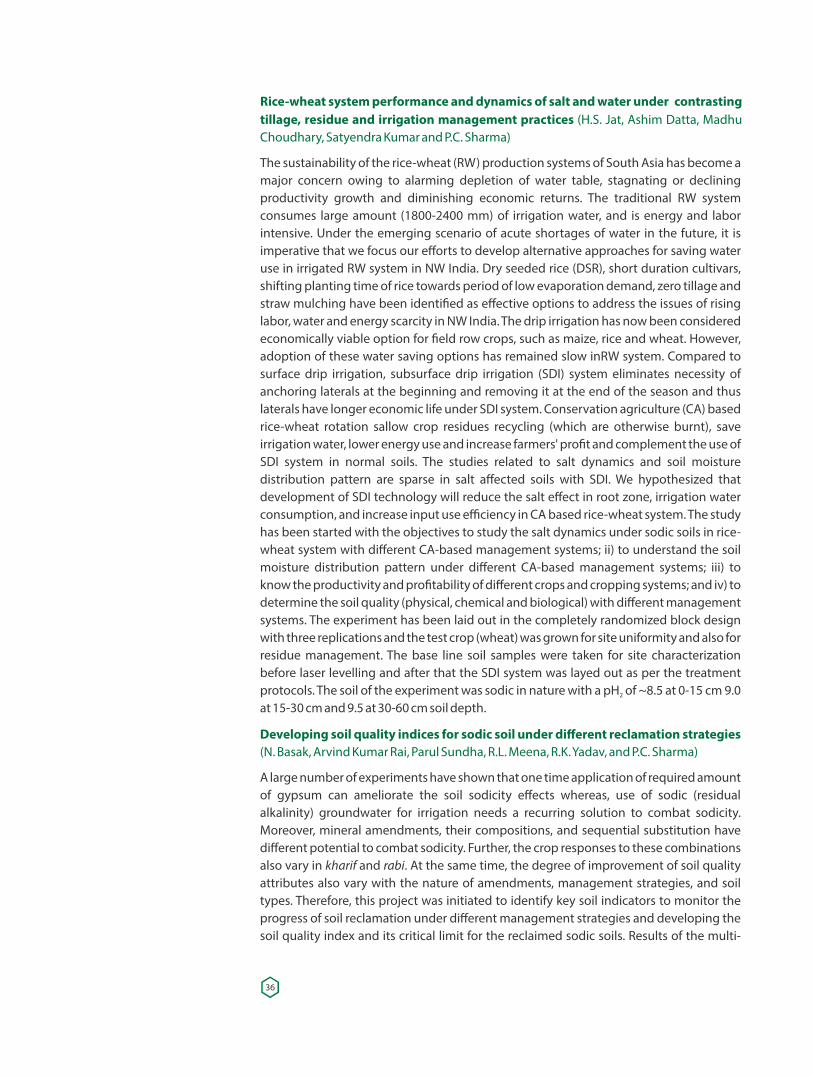
Rice-wheat system performance and dynamics of salt and water under contrasting tillage, residue and irrigation management practices (H.S. Jat, Ashim Datta, Madhu Choudhary, Satyendra Kumar and P.C. Sharma)
The sustainability of the rice-wheat (RW) production systems of South Asia has become a major concern owing to alarming depletion of water table, stagnating or declining productivity growth and diminishing economic returns. The traditional RW system consumes large amount (1800-2400 mm) of irrigation water, and is energy and labor intensive. Under the emerging scenario of acute shortages of water in the future, it is imperative that we focus our efforts to develop alternative approaches for saving water use in irrigated RW system in NW India. Dry seeded rice (DSR), short duration cultivars, shifting planting time of rice towards period of low evaporation demand, zero tillage and straw mulching have been identi�ed as effective options to address the issues of rising labor, water and energy scarcity in NW India. The drip irrigation has now been considered economically viable option for �eld row crops, such as maize, rice and wheat. However, adoption of these water saving options has remained slow inRW system. Compared to surface drip irrigation, subsurface drip irrigation (SDI) system eliminates necessity of anchoring laterals at the beginning and removing it at the end of the season and thus laterals have longer economic life under SDI system. Conservation agriculture (CA) based rice-wheat rotation sallow crop residues recycling (which are otherwise burnt), save irrigation water, lower energy use and increase farmers' pro�t and complement the use of SDI system in normal soils. The studies related to salt dynamics and soil moisture distribution pattern are sparse in salt affected soils with SDI. We hypothesized that development of SDI technology will reduce the salt effect in root zone, irrigation water consumption, and increase input use efficiency in CA based rice-wheat system. The study has been started with the objectives to study the salt dynamics under sodic soils in rice-wheat system with different CA-based management systems; ii) to understand the soil moisture distribution pattern under different CA-based management systems; iii) to know the productivity and pro�tability of different crops and cropping systems; and iv) to determine the soil quality (physical, chemical and biological) with different management systems. The experiment has been laid out in the completely randomized block design with three replications and the test crop (wheat) was grown for site uniformity and also for residue management. The base line soil samples were taken for site characterization before laser levelling and after that the SDI system was layed out as per the treatment protocols. The soil of the experiment was sodic in nature with a pH of ~8.5 at 0-15 cm 9.0 2
at 15-30 cm and 9.5 at 30-60 cm soil depth.
Developing soil quality indices for sodic soil under different reclamation strategies (N. Basak, Arvind Kumar Rai, Parul Sundha, R.L. Meena, R.K. Yadav, and P.C. Sharma)
A large number of experiments have shown that one time application of required amount of gypsum can ameliorate the soil sodicity effects whereas, use of sodic (residual alkalinity) groundwater for irrigation needs a recurring solution to combat sodicity. Moreover, mineral amendments, their compositions, and sequential substitution have different potential to combat sodicity. Further, the crop responses to these combinations also vary in kharif and rabi. At the same time, the degree of improvement of soil quality attributes also vary with the nature of amendments, management strategies, and soil types. Therefore, this project was initiated to identify key soil indicators to monitor the progress of soil reclamation under different management strategies and developing the soil quality index and its critical limit for the reclaimed sodic soils. Results of the multi-
36
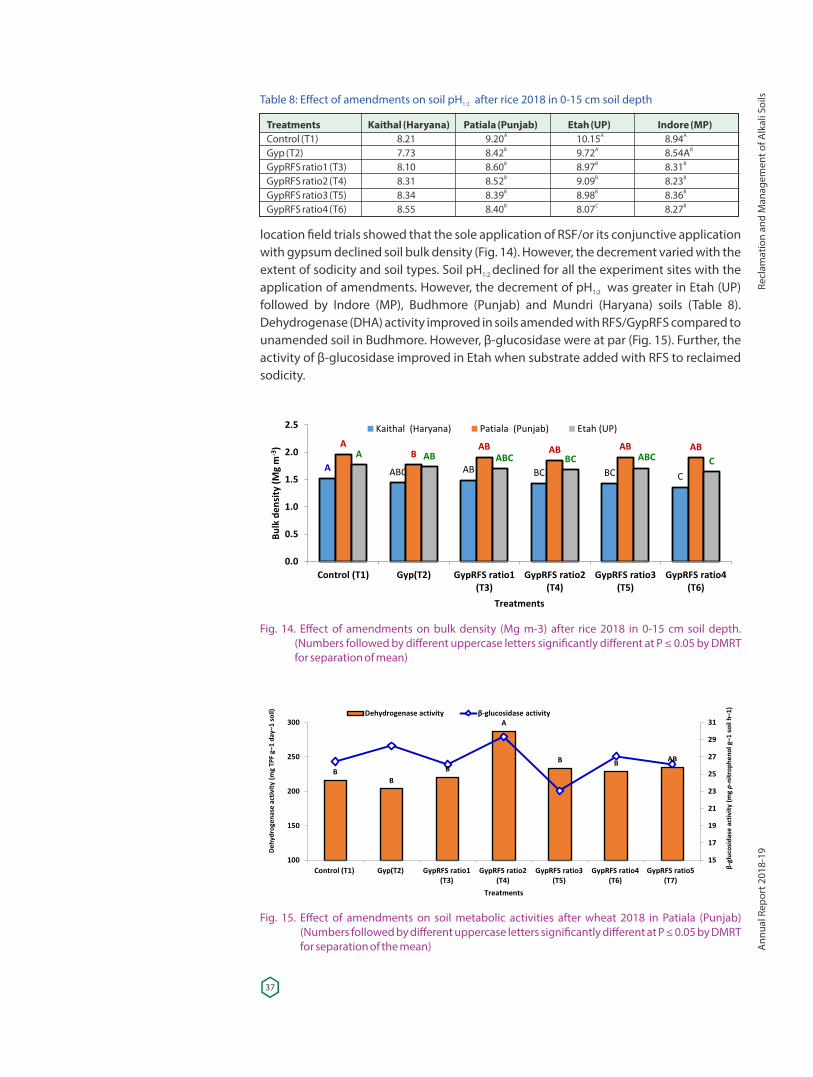
location �eld trials showed that the sole application of RSF/or its conjunctive application with gypsum declined soil bulk density (Fig. 14). However, the decrement varied with the extent of sodicity and soil types. Soil pH declined for all the experiment sites with the 1:2
application of amendments. However, the decrement of pH was greater in Etah (UP) 1:2
followed by Indore (MP), Budhmore (Punjab) and Mundri (Haryana) soils (Table 8). Dehydrogenase (DHA) activity improved in soils amended with RFS/GypRFS compared to unamended soil in Budhmore. However, β-glucosidase were at par (Fig. 15). Further, the activity of β-glucosidase improved in Etah when substrate added with RFS to reclaimed sodicity.
Table 8: Effect of amendments on soil pH after rice 2018 in 0-15 cm soil depth1:2
Treatments Kaithal (Haryana) Patiala (Punjab) Etah (UP) Indore (MP)A A AControl (T1) 8.21 9.20 10.15 8.94 B A BGyp (T2) 7.73 8.42 9.72 8.54A B B B GypRFS ratio1 (T3) 8.10 8.60 8.97 8.31 B B B GypRFS ratio2 (T4) 8.31 8.52 9.09 8.23 B B B GypRFS ratio3 (T5) 8.34 8.39 8.98 8.36 B C BGypRFS ratio4 (T6) 8.55 8.40 8.07 8.27
Fig. 14. Effect of amendments on bulk density (Mg m-3) after rice 2018 in 0-15 cm soil depth. (Numbers followed by different uppercase letters signi�cantly different at P ≤ 0.05 by DMRT for separation of mean)
Fig. 15. Effect of amendments on soil metabolic activities after wheat 2018 in Patiala (Punjab) (Numbers followed by different uppercase letters signi�cantly different at P ≤ 0.05 by DMRT for separation of the mean)
37
Recl
amat
ion
and
Man
agem
ent o
f Alk
ali S
oils
Ann
ual R
epor
t 201
8-19
Management of waterlogged/Saline SoilsTechnical guidance & monitoring and evaluation of large scale SSD projects in Haryana (D.S. Bundela, Satyendra Kumar, R.L. Meena, Bhaskar Narjary, R. Raju, R.K. Fagodiya, Jaffer Y Dar, Raj Mukhopadhyay, Arijit Barman, Kailash Prajapat, and P.C. Sharma)
Identi�cation of new sites
Three new sites at Dighal (Jhajjar district), Julana (Jind) and Uklana (Hisar) with a total waterlogged saline area of 2,900 ha were during 2018-19 based on the jointly identi�edfeasibility for SSD system. These new sites were characterized by shallow water (water
-1table depth ≤ 1.5 m), moderate to high soil salinity (EC > 8 dS m ) and groundwater e-1salinity (EC > 2 dS m ) with adjoining gw availability of surface drain for discharge of
drainage water. Pre-drainage investigations and topographic surveys at these sites are recommended to be conducted for designing of SSD systems to be submitted to ICAR-CSSRI by HOPP for evaluation and approval and further funding under RKVY scheme.
Evaluation of design and layout of SSD systems
The design and layout of SSD system with 60 m drain spacing for a drainage block (H1 block) for 44 ha at CCS HAU, Hisar under Rohtak-III project was technically evaluated on the basis of discharge capacities and permissible length of lateral pipes and drainable area of collector pipes, �ow directions, lateral and collector slope, and were found in conformity with the National Drainage Guidelines and our past practices (Table 9). Therefore, design and layout for the H1 drainage block was approved and recommended for the implementation. Further, three SSD systems were installed in 258 ha affected area at Kahni (Rohtak), CCSHAU Hisar and Gangana (Sonipat) bene�tting 266 farmers. Up to March 2019, total of 10,884 ha waterlogged saline area in Haryana has been provided with SSD systems under 15 projects which have helped to reclaim waterlogged saline soils for restoring their productivity. Of these, 5,153 ha area has been covered under RKVY scheme during the past nine years, bene�tting 3,299 farmers.
Table 9: Hydraulic evaluation of design of SSD system at CCS HAU, Hisar
S SSD Block Gross area Net area Lateral Max Range of Collector Maximum Actual Area No (ha) (ha) OD/ID permi length of OD/ ID Permissible drained by (mm) -ssible lateral (mm) area drained collector (ha) length of used (m) by collector lateral (m) (ha)1 H-1 44.0 38.1 80/72 621.50* 60-450* 200/178 30.17 24.78 294/258 64.10 37.02
Salinization of irrigated lands and r e c l a m a t i o n f o r r e s t o r i n g productivity using SSD technology
Poor watermanagement(Rise in watertable)
Soil Salinity Drainageand
leaching
Sustainableproductivity
38
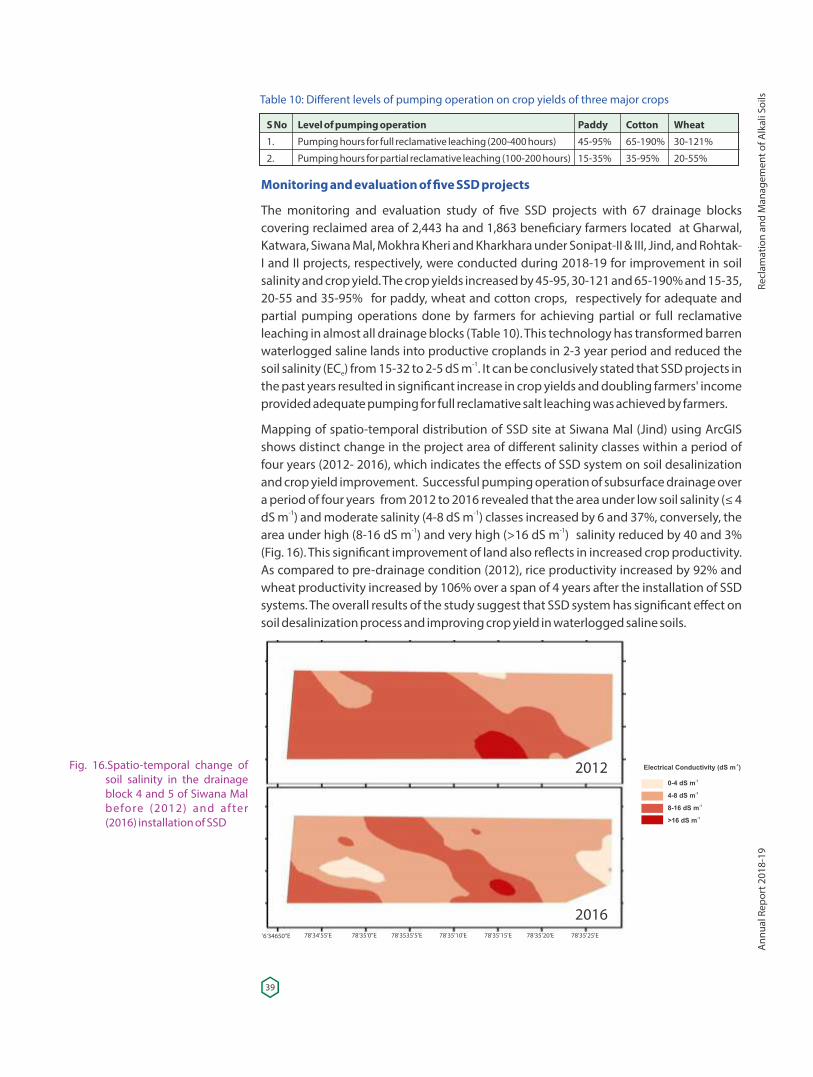
Monitoring and evaluation of �ve SSD projects
The monitoring and evaluation study of �ve SSD projects with 67 drainage blocks covering reclaimed area of 2,443 ha and 1,863 bene�ciary farmers located at Gharwal, Katwara, Siwana Mal, Mokhra Kheri and Kharkhara under Sonipat-II & III, Jind, and Rohtak-I and II projects, respectively, were conducted during 2018-19 for improvement in soil salinity and crop yield. The crop yields increased by 45-95, 30-121 and 65-190% and 15-35, 20-55 and 35-95% for paddy, wheat and cotton crops, respectively for adequate and partial pumping operations done by farmers for achieving partial or full reclamative leaching in almost all drainage blocks (Table 10). This technology has transformed barren waterlogged saline lands into productive croplands in 2-3 year period and reduced the soil salinity (EC ) from 15-32 to 2-5 dS m . It can be conclusively stated that SSD projects in e
-1
the past years resulted in signi�cant increase in crop yields and doubling farmers' income provided adequate pumping for full reclamative salt leaching was achieved by farmers.
Mapping of spatio-temporal distribution of SSD site at Siwana Mal (Jind) using ArcGIS shows distinct change in the project area of different salinity classes within a period of four years (2012- 2016), which indicates the effects of SSD system on soil desalinization and crop yield improvement. Successful pumping operation of subsurface drainage over a period of four years from 2012 to 2016 revealed that the area under low soil salinity (≤ 4 dS m ) and moderate salinity (4-8 dS m ) classes increased by 6 and 37%, conversely, the -1 -1
area under high (8-16 dS m ) and very high (>16 dS m ) salinity reduced by 40 and 3% -1 -1
(Fig. 16). This signi�cant improvement of land also re�ects in increased crop productivity. As compared to pre-drainage condition (2012), rice productivity increased by 92% and wheat productivity increased by 106% over a span of 4 years after the installation of SSD systems. The overall results of the study suggest that SSD system has signi�cant effect on soil desalinization process and improving crop yield in waterlogged saline soils.
Table 10: Different levels of pumping operation on crop yields of three major crops
S No Level of pumping operation Paddy Cotton Wheat
1. Pumping hours for full reclamative leaching (200-400 hours) 45-95% 65-190% 30-121%
2. Pumping hours for partial reclamative leaching (100-200 hours) 15-35% 35-95% 20-55%
Fig. 16.Spatio-temporal change of soil salinity in the drainage block 4 and 5 of Siwana Mal before (2012) and after (2016) installation of SSD
2012
2016'6'34650"E 78'34'55'E 78'35'0"E 78'3535'5'E 78'35'10'E 78'35'15'E 78'35'20'E 78'35'25'E
-1Electrical Conductivity (dS m )
-10-4 dS m
-14-8 dS m
-18-16 dS m
-1>16 dS m
39
Recl
amat
ion
and
Man
agem
ent o
f Alk
ali S
oils
Ann
ual R
epor
t 201
8-19
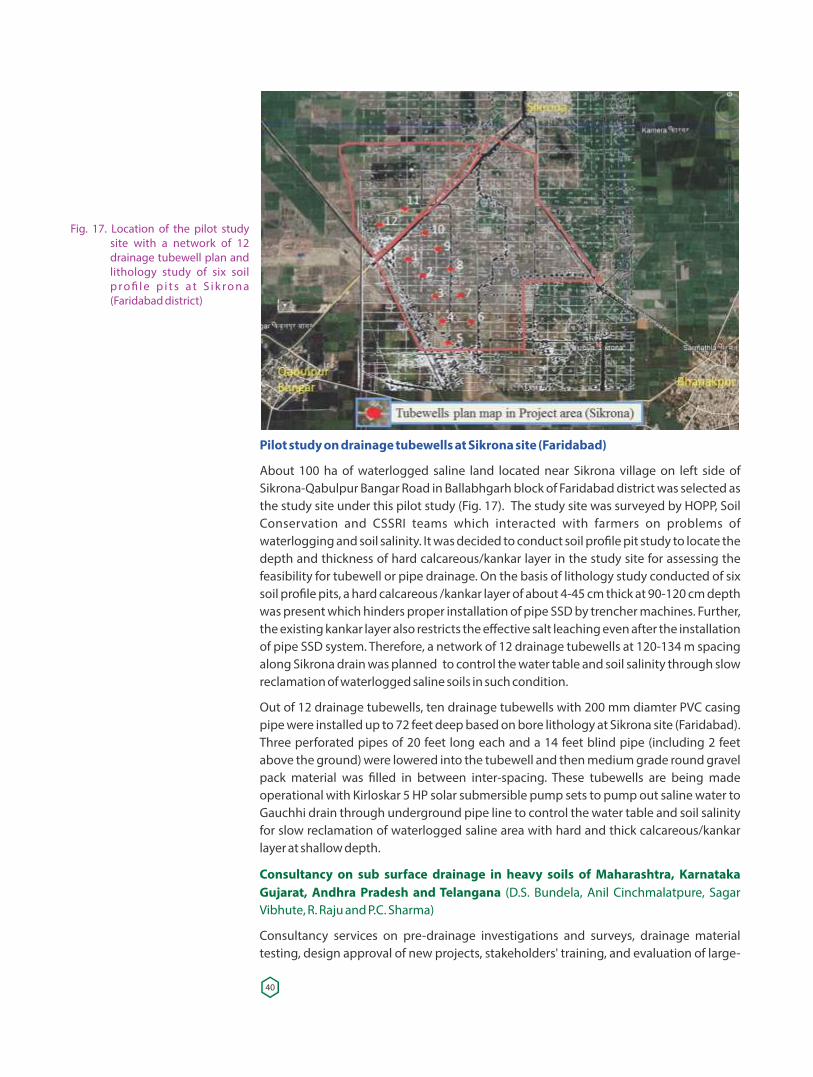
Pilot study on drainage tubewells at Sikrona site (Faridabad)
About 100 ha of waterlogged saline land located near Sikrona village on left side of Sikrona-Qabulpur Bangar Road in Ballabhgarh block of Faridabad district was selected as the study site under this pilot study (Fig. 17). The study site was surveyed by HOPP, Soil Conservation and CSSRI teams which interacted with farmers on problems of waterlogging and soil salinity. It was decided to conduct soil pro�le pit study to locate the depth and thickness of hard calcareous/kankar layer in the study site for assessing the feasibility for tubewell or pipe drainage. On the basis of lithology study conducted of six soil pro�le pits, a hard calcareous /kankar layer of about 4-45 cm thick at 90-120 cm depth was present which hinders proper installation of pipe SSD by trencher machines. Further, the existing kankar layer also restricts the effective salt leaching even after the installation of pipe SSD system. Therefore, a network of 12 drainage tubewells at 120-134 m spacing along Sikrona drain was planned to control the water table and soil salinity through slow reclamation of waterlogged saline soils in such condition.
Out of 12 drainage tubewells, ten drainage tubewells with 200 mm diamter PVC casing pipe were installed up to 72 feet deep based on bore lithology at Sikrona site (Faridabad). Three perforated pipes of 20 feet long each and a 14 feet blind pipe (including 2 feet above the ground) were lowered into the tubewell and then medium grade round gravel pack material was �lled in between inter-spacing. These tubewells are being made operational with Kirloskar 5 HP solar submersible pump sets to pump out saline water to Gauchhi drain through underground pipe line to control the water table and soil salinity for slow reclamation of waterlogged saline area with hard and thick calcareous/kankar layer at shallow depth.
Consultancy on sub surface drainage in heavy soils of Maharashtra, Karnataka Gujarat, Andhra Pradesh and Telangana (D.S. Bundela, Anil Cinchmalatpure, Sagar Vibhute, R. Raju and P.C. Sharma)
Consultancy services on pre-drainage investigations and surveys, drainage material testing, design approval of new projects, stakeholders' training, and evaluation of large-
Fig. 17. Location of the pilot study site with a network of 12 drainage tubewell plan and lithology study of six soil p r o � l e p i t s a t S i k r o n a (Faridabad district)
40
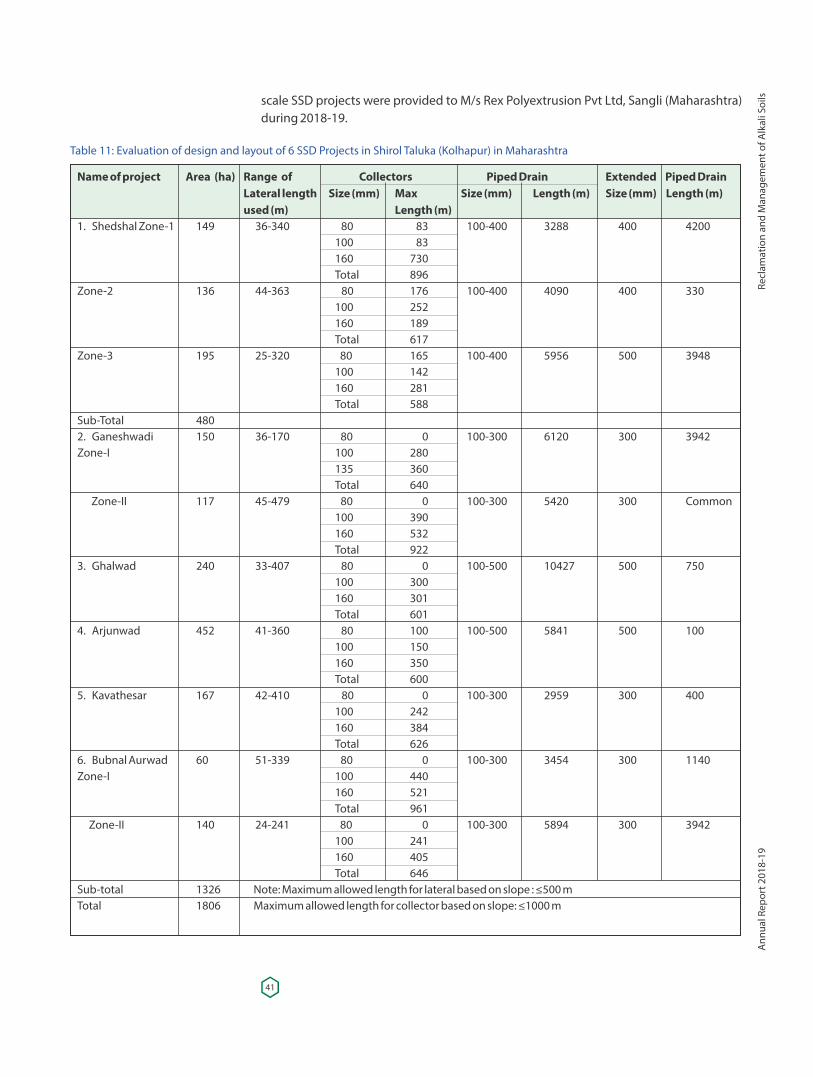
scale SSD projects were provided to M/s Rex Polyextrusion Pvt Ltd, Sangli (Maharashtra) during 2018-19.
Table 11: Evaluation of design and layout of 6 SSD Projects in Shirol Taluka (Kolhapur) in Maharashtra
Name of project Area (ha) Range of Collectors Piped Drain Extended Piped Drain Lateral length Size (mm) Max Size (mm) Length (m) Size (mm) Length (m) used (m) Length (m)1. Shedshal Zone-1 149 36-340 80 83 100-400 3288 400 4200 100 83 160 730 Total 896 Zone-2 136 44-363 80 176 100-400 4090 400 330 100 252 160 189 Total 617 Zone-3 195 25-320 80 165 100-400 5956 500 3948 100 142 160 281 Total 588 Sub-Total 480 2. Ganeshwadi 150 36-170 80 0 100-300 6120 300 3942Zone-I 100 280 135 360 Total 640 Zone-II 117 45-479 80 0 100-300 5420 300 Common 100 390 160 532 Total 922 3. Ghalwad 240 33-407 80 0 100-500 10427 500 750 100 300 160 301 Total 601 4. Arjunwad 452 41-360 80 100 100-500 5841 500 100 100 150 160 350 Total 600 5. Kavathesar 167 42-410 80 0 100-300 2959 300 400 100 242 160 384 Total 626 6. Bubnal Aurwad 60 51-339 80 0 100-300 3454 300 1140Zone-I 100 440 160 521 Total 961 Zone-II 140 24-241 80 0 100-300 5894 300 3942 100 241 160 405 Total 646 Sub-total 1326 Note: Maximum allowed length for lateral based on slope : ≤500 mTotal 1806 Maximum allowed length for collector based on slope: ≤1000 m
41
Recl
amat
ion
and
Man
agem
ent o
f Alk
ali S
oils
Ann
ual R
epor
t 201
8-19
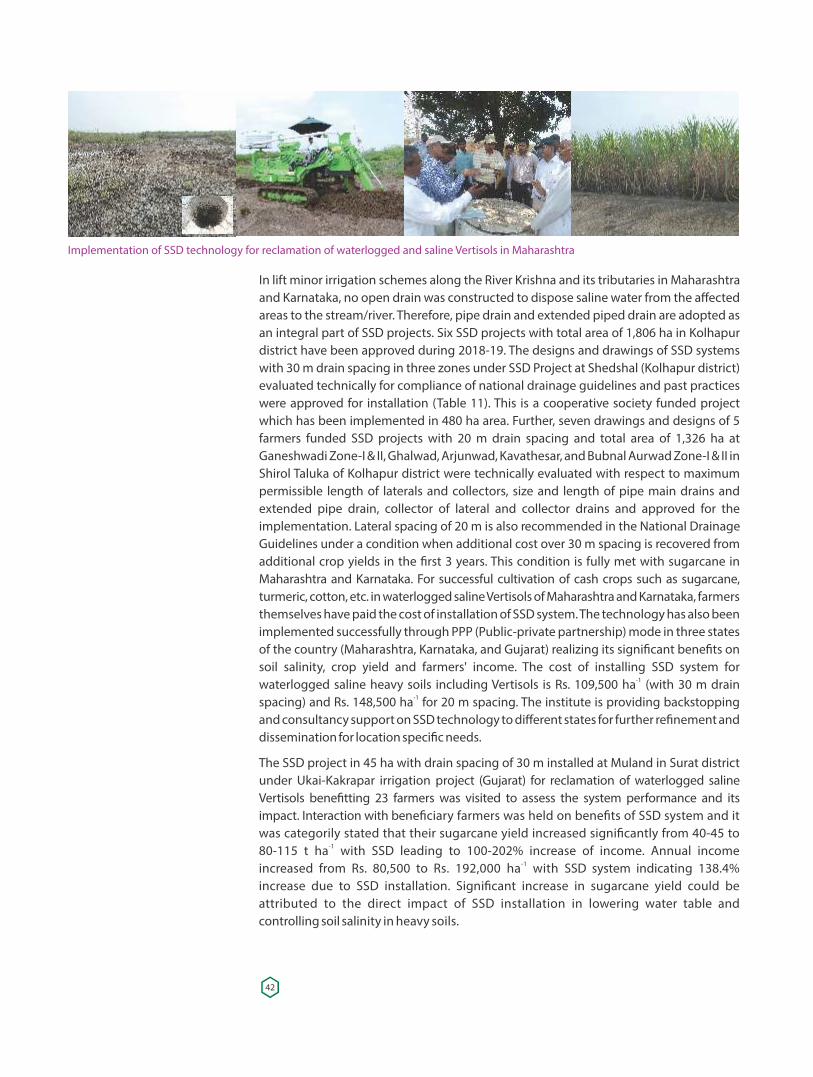
In lift minor irrigation schemes along the River Krishna and its tributaries in Maharashtra and Karnataka, no open drain was constructed to dispose saline water from the affected areas to the stream/river. Therefore, pipe drain and extended piped drain are adopted as an integral part of SSD projects. Six SSD projects with total area of 1,806 ha in Kolhapur district have been approved during 2018-19. The designs and drawings of SSD systems with 30 m drain spacing in three zones under SSD Project at Shedshal (Kolhapur district) evaluated technically for compliance of national drainage guidelines and past practices were approved for installation (Table 11). This is a cooperative society funded project which has been implemented in 480 ha area. Further, seven drawings and designs of 5 farmers funded SSD projects with 20 m drain spacing and total area of 1,326 ha at Ganeshwadi Zone-I & II, Ghalwad, Arjunwad, Kavathesar, and Bubnal Aurwad Zone-I & II in Shirol Taluka of Kolhapur district were technically evaluated with respect to maximum permissible length of laterals and collectors, size and length of pipe main drains and extended pipe drain, collector of lateral and collector drains and approved for the implementation. Lateral spacing of 20 m is also recommended in the National Drainage Guidelines under a condition when additional cost over 30 m spacing is recovered from additional crop yields in the �rst 3 years. This condition is fully met with sugarcane in Maharashtra and Karnataka. For successful cultivation of cash crops such as sugarcane, turmeric, cotton, etc. in waterlogged saline Vertisols of Maharashtra and Karnataka, farmers themselves have paid the cost of installation of SSD system. The technology has also been implemented successfully through PPP (Public-private partnership) mode in three states of the country (Maharashtra, Karnataka, and Gujarat) realizing its signi�cant bene�ts on soil salinity, crop yield and farmers' income. The cost of installing SSD system for
-1waterlogged saline heavy soils including Vertisols is Rs. 109,500 ha (with 30 m drain -1spacing) and Rs. 148,500 ha for 20 m spacing. The institute is providing backstopping
and consultancy support on SSD technology to different states for further re�nement and dissemination for location speci�c needs.
The SSD project in 45 ha with drain spacing of 30 m installed at Muland in Surat district under Ukai-Kakrapar irrigation project (Gujarat) for reclamation of waterlogged saline Vertisols bene�tting 23 farmers was visited to assess the system performance and its impact. Interaction with bene�ciary farmers was held on bene�ts of SSD system and it was categorily stated that their sugarcane yield increased signi�cantly from 40-45 to
-180-115 t ha with SSD leading to 100-202% increase of income. Annual income -1increased from Rs. 80,500 to Rs. 192,000 ha with SSD system indicating 138.4%
increase due to SSD installation. Signi�cant increase in sugarcane yield could be attributed to the direct impact of SSD installation in lowering water table and controlling soil salinity in heavy soils.
Implementation of SSD technology for reclamation of waterlogged and saline Vertisols in Maharashtra
42
Developing guidelines for suitability of synthetic �lter materials for SSD systems in different agro-climatic regions (D.S. Bundela, R.K. Fagodiya and Raj Mukhopadhyay)
Under the project, non-woven and woven synthetic �lters are tested at Drainage Engineering Lab using BIS/ISO standards based methodologies to ensure the optimal quality of �lter fabrics in different agro-climatic regions in order to avoid clogging of drain pipes of SSD systems. Five non-woven polypropylene and polyester fabrics have been tested for thickness, mass per unit area and characteristic opening size (O ) for 80 mm lateral 90
pipe. During 2018-19, three non-woven polypropylene �lters (CA-1 to 3) from M/s CA Polytech Pvt Ltd, Gaziabad have met all three criteria and were recommended for use in SSD projects in Haryana whereas two punched type polyester samples (Manas-1 & 2) from M/s Manas Geo Tech India Pvt Ltd, Bawal (Rewari) have failed on O criterion and were not 90
recommended for use (Table 12). One woven nylon sock from M/s CA Polytech Pvt Ltd for collector pipes has been tested for thickness, mass per unit area and pore size (mesh< 60) and has met all three criteria and was recommended for use in SSD projects in Haryana.
Studies on salt load of drainage water and improvement in soil salinity in sub-surface drainage sites in Haryana (Satyendra Kumar, Bhaskar Narjary, Kailash Prajapat and D.S. Bundela)
Performance evaluation of SSD systems is necessary as operation and maintenance of sub surface drainage with pumped outlet conditions determine the success or failure of the project. Drainage water quality and soil salinity in the SSD system over time period depends upon the pump operating hours, so as to optimize the pumping hours will help in saving of running cost as well as increasing the efficiency of SSD system. There is also a need to resolve the environmental issue related to disposal of drainage water into surface drains and its further effect on the downstream quality of large drains/streams. Irrigation water quality from canal, open drain water or drainage water reuse affects soil salinity of the project area which needs to be spatio-temporally monitored by modern geophysical tools cost effectively. Keeping these facts in mind, this study was planned at Kahni site in Rohtak district. In order to achieve the project objectives, a total of 10 observation wells up to 3 m deep were installed in the drainage block-2. In this block, pumping was undertaken by the farmers at their own expenses continuously. The performance of the block-1 where pumping is yet to be started, was also monitored. Soil samples collected during the installation of observation wells from different depths were analyzed. The lithology of the project area varies from loam at the top to sandy clay loam at depth more
-1than 1.5 m (Table 13) and the EC of soils varies between 2.7 to 7.0 dS me
Table 12. Results of testing of 5 non-woven synthetic geotextile fabric �lters
S No Parameter Reference Value /Guideline Sample-wise Test Results Filter Sample ID --- CA-1 CA-2 CA-3 Manas-1 Manas-21. Material type Polypropylene Not tested chemically2. Category Non-woven Non-woven3. Appearance Regular Regular4. Strip width for 80 mm pipe 310 mm 320 321 320 325 3255. Thickness > 3 mm 4.73 4.34 4. 43 4.10 4.15
26. Mass per unit area (gsm) >300 g/m 334 325 328 306 3107. Apparent opening size (O90) >300 micron 345 355 350 210* 222*
Recommendation: The First three samples (CA-1 to 3) met O90 criterion and hence suitable to use on lateral pipe of SSD system whereas the last two samples (Manas-1 & 2) failed to meet O90 criterion* and hence not suitable
43
Recl
amat
ion
and
Man
agem
ent o
f Alk
ali S
oils
Ann
ual R
epor
t 201
8-19
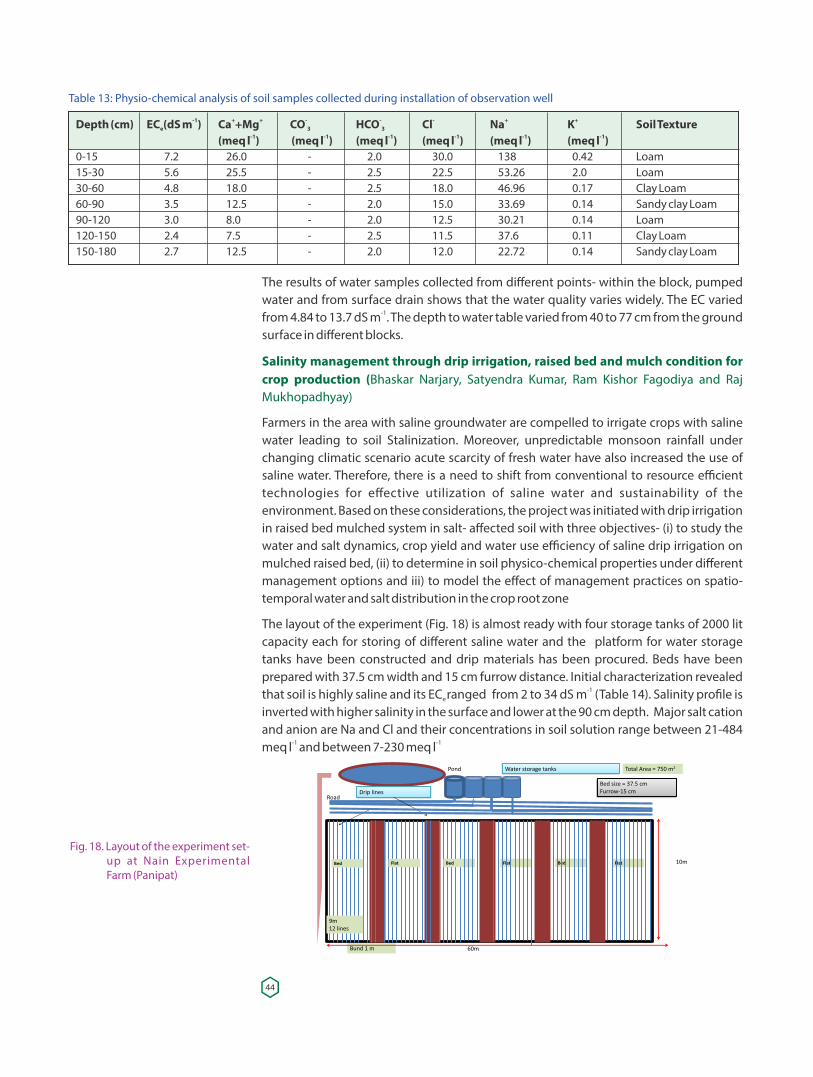
Table 13: Physio-chemical analysis of soil samples collected during installation of observation well
-1 + + - - - + +Depth (cm) EC (dS m ) Ca +Mg CO HCO Cl Na K Soil Texturee 3 3-1 -1 -1 -1 -1 -1 (meq l ) (meq l ) (meq l ) (meq l ) (meq l ) (meq l )
0-15 7.2 26.0 - 2.0 30.0 138 0.42 Loam15-30 5.6 25.5 - 2.5 22.5 53.26 2.0 Loam30-60 4.8 18.0 - 2.5 18.0 46.96 0.17 Clay Loam60-90 3.5 12.5 - 2.0 15.0 33.69 0.14 Sandy clay Loam90-120 3.0 8.0 - 2.0 12.5 30.21 0.14 Loam120-150 2.4 7.5 - 2.5 11.5 37.6 0.11 Clay Loam150-180 2.7 12.5 - 2.0 12.0 22.72 0.14 Sandy clay Loam
The results of water samples collected from different points- within the block, pumped water and from surface drain shows that the water quality varies widely. The EC varied
-1from 4.84 to 13.7 dS m . The depth to water table varied from 40 to 77 cm from the ground surface in different blocks.
Salinity management through drip irrigation, raised bed and mulch condition for crop production (Bhaskar Narjary, Satyendra Kumar, Ram Kishor Fagodiya and Raj Mukhopadhyay)
Farmers in the area with saline groundwater are compelled to irrigate crops with saline water leading to soil Stalinization. Moreover, unpredictable monsoon rainfall under changing climatic scenario acute scarcity of fresh water have also increased the use of saline water. Therefore, there is a need to shift from conventional to resource efficient technologies for effective utilization of saline water and sustainability of the environment. Based on these considerations, the project was initiated with drip irrigation in raised bed mulched system in salt- affected soil with three objectives- (i) to study the water and salt dynamics, crop yield and water use efficiency of saline drip irrigation on mulched raised bed, (ii) to determine in soil physico-chemical properties under different management options and iii) to model the effect of management practices on spatio-temporal water and salt distribution in the crop root zone
The layout of the experiment (Fig. 18) is almost ready with four storage tanks of 2000 lit capacity each for storing of different saline water and the platform for water storage tanks have been constructed and drip materials has been procured. Beds have been prepared with 37.5 cm width and 15 cm furrow distance. Initial characterization revealed
-1that soil is highly saline and its EC ranged from 2 to 34 dS m (Table 14). Salinity pro�le is e
inverted with higher salinity in the surface and lower at the 90 cm depth. Major salt cation and anion are Na and Cl and their concentrations in soil solution range between 21-484
-1 -1meq l and between 7-230 meq l
Fig. 18. Layout of the experiment set-up at Nain Experimental Farm (Panipat)
44
Table 14: Initial soil characteristics of the study site at Nain Experimental Farm (Panipat)
+ + + + - - - Sr. No. Depth EC Ca +Mg Na K CO HCO Cl e 3 3-1 -1 -1 -1 -1 -1 (dS m ) (meq l ) (meq l) (meq l ) (meq l ) (meq l ) (meq l )
1 15 34.0 58 483.5 1.90 -- 2.76 201.35 30 14.16 25.5 198.9 0.50 -- 2.30 65.56 60 17.75 7 265.2 0.15 -- 2.76 101.37 90 36.2 40 318.2 0.43 -- 2.30 230.172 15 10.39 8 142.6 0.27 -- 4.14 56.26 30 9.23 4.5 121.3 0.08 0.92 3.22 47.89 60 13.81 5.5 197.3 0.12 -- 3.22 75.79 90 22 13.5 324.3 0.16 0.92 2.30 126.943 15 10.64 32.5 126.1 0.52 -- 2.76 28.36 30 5.98 13.5 73.5 0.12 -- 2.30 11.16 60 4.66 7 55.54 0.08 -- 2.76 10.69 90 4.33 7 50.7 0.07 -- 2.76 7.14 15 5.81 29 55.7 0.96 -- 2.76 12.55 30 5.24 36 39.3 0.66 -- 2.30 10.69 60 3.5 26 22.6 0.33 -- 2.30 6.51 90 2.73 14 20.7 0.16 -- 2.30 9.35 15 11.26 17.5 143.9 0.25 -- 2.76 47.43 30 9.56 7.5 121.3 0.07 0.92 2.76 39.99 60 9.13 6.5 116.5 0.05 0.92 2.76 39.06 90 11.4 10.5 154.8 0.10 -- 2.30 51.156 15 10.08 7.5 125.2 0.35 0.92 2.76 49.75 30 9.98 3.5 130.9 0.09 0.92 3.68 88.35 60 15.29 6 212.9 0.09 1.84 2.76 77.66 90 17.18 7.5 299.5 0.08 0.92 2.30 88.35Mean 12.3 16.4 158.4 0.3 1.00 2.70 61.8Standard Deviation 8.5 14.0 113.4 0.4 0.3 0.50 58.0Minimum 2.7 3.5 20.7 0.1 0.9 2.30 6.50Maximum 36.2 58.0 483.5 1.9 1.8 4.10 230.2
Development of salinity-yield relations for different crops under micro-irrigation for updating water quality guidelines (R.K. Fagodiya, B.L. Meena, R.L. Meena, M.J. Kaledhonkar, D.S. Bundela and P.C. Sharma)
In order to update the water quality guidelines for irrigation with respect to micro-irrigation methods i.e. drip and sprinkler, the experimental data from four AICRP (SAS&USW) Centres at Agra, Bapatla, Bikaner and Hisar working with the use of saline and alkali groundwater for crop production were collected. These experiments were conducted for vegetables, cereals, oilseeds, pulses crops, and medicinal plants. The EC of
-1saline water ranged from 0.25 to 12.00 dS m . The preliminary salinity-yield relations (crop production functions) between the crop yield and irrigation water salinity (EC ) were iw
developed for these crops under surface, sprinkler and drip irrigation methods (Table 15). The boundary conditions i.e. the range of EC used for developing these crop production iw
functions were mentioned together showing the best �tting of these functions between these boundary conditions. Using these preliminary salinity-yield relations, the EC at 90, iw
75 and 50 per cent relative yield were worked out. The results showed that the various crops responded differentially to varying levels of saline waters under different irrigation methods. The comparative study of a particular crop under surface, sprinkler and drip irrigation methods showed that crops tolerated the higher level of irrigation water salinity
45
Recl
amat
ion
and
Man
agem
ent o
f Alk
ali S
oils
Ann
ual R
epor
t 201
8-19
Table 15: Preliminary salinity-yield relations for crop yield and irrigation water salinity.
Crop Location Soil type No. of years Irrigation methods Crop production function Range of EC*-1 (dS m )
VegetablesBrinjal Bapatla cs 2 Drip y = -0.929x + 8.4943 0.6-6.0 Surface y = -0.7658x + 6.3605 0.6-6.0 Bikaner sl 2 Drip y = -0.2797x2 + 1.2072x + 19.871 0.25-6.0Cabbage Bapatla sl 2 Drip y = -3.7498x + 40.669 0.6-8.0 Drip (shadenets) y = -5.0572x + 55.776 0.6-8.0Cauli�ower Bapatla sl 2 Drip y = -1.8616x + 20.11 0.6-8.0 Drip (shadenets) y = -2.0975x + 25.304 0.6-8.0 Hisar s 1 Drip y = -0.1872x2 + 0.5149x + 43.322 0.4-7.5Capsicum Agra sl 1 Drip y = -1.4627x + 21.186 2.5-8.0 2 Surface y = -0.9807x + 13.48 2.5-8.0 Bapatla sl 1 Drip y = -1.1032x + 11.285 0.6-8.0 3 Drip (Shadenets) 0.6-8.0Clusterbean Bapatla sl 1 Drip y = -0.8331x + 8.8963 0.6-8.0 Bikaner sl 3 Drip y = -0.1243x2 + 0.3903x + 11.69 0.25-8.0Drumstick Bapatla sl 2 drip y = -16.31ln(x) + 35.248 0.6-8.0Fenugreek Agra sl 1 Surface y = -0.0564x + 1.0728 0.6-8.0
Chilli Bapatla cs 1 Drip y = -1.0939x + 14.85 0.6-6.0 Surface y = -1.184x + 11.179 0.6-6.0Okra Agra sl 2 Drip y = -1.3635x + 12.995 2.5-8.0 1 Surface y = -1.6441x + 12.382 2.5-8.0 Bapatla cs 3 Drip y = -0.3657x2 + 2.025x + 12.117 0.6-6.0 Surface y = -0.3981x2 + 1.85x + 10.633 0.6-6.0
Onion Bapatla cs 1 Drip y = -0.3657x2 + 2.025x + 12.117 0.6-6.0 Surface y = -0.3981x2 + 1.85x + 10.633 0.6-6.0 Bikaner sl 3 Drip y = -1.453x + 35.769 0.25-6.0 Surface y = -1.7256x + 31.092 0.25-6.0 Hisar sl 3 Drip y = -0.6406x2 + 1.5243x + 30.693 Spinach Bapatla sl 2 Drip y = -1.0686x + 10.335 0.6-8.0Radish Bapatla sl 1 Drip y = -0.9256x + 14.053 0.6-6.0Tomato Agra sl 2 Drip-plastic tunnel y = -1.2121x + 51.591 0.6-8.0 Surface-open �eld y = -0.7609x + 24.263 0.6-8.0 Hisar s 3 Drip y = -0.1158x2 - 0.2354x + 41.43 0.4-7.5
CEREALSWheat Bikaner s 2 Drip y = -0.0699x2 + 0.0377x + 29.461 0.25-12 Hisar sl 1 Sprinkler y = -0.0031x2 - 0.0168x + 4.4592 0.4-7.5Pearlmillet Bikaner sl 3 Drip y = -0.0532x2 + 0.0538x + 13.18 0.25-8.0FIBRECotton Bikaner sl 4 Drip y = -0.0752x + 2.3062 0.25-8.0 Sprinkler y = -0.0765x + 1.7534 0.25-8.0
OILSEEDSMustard Agra sl 1 Sprinkler y = -0.0765x + 2.4869 4.8-8.0Groundnut Bapatla sl 5 Drip y = -0.1434x + 2.1358 0.6-8.0 Bikaner sl 4 Drip y = -2.3736x + 34.672 0.25-12.0
MISCELLANEOUSTulsi Agra sl 2 Surface y = -0.6022x + 19.431 0.6-8.0Isabgol Agra sl 2 Surface y = -0.0563x + 1.0609 0.6-8.0 Bikaner sl 4 Drip y = -0.0971x2 + 0.4075x + 7.8467 0.25-8.0Fennel Agra sl 2 Surface y = -0.0547x + 0.9583 0.6-8.0Chrysanthamum Bapatla sl 1 Drip y = -2.9835x + 37.092 0.6-8.0Marigold Bapatla sl 1 Drip y = -3.1425x + 40.147 0.6-8.0
Soil type: s - sandy, sl - sandy loam, cs - coastal sandy soil*Range of ECiw is the salinity of irrigation water used for develop the preliminary salinity-yield relations
46
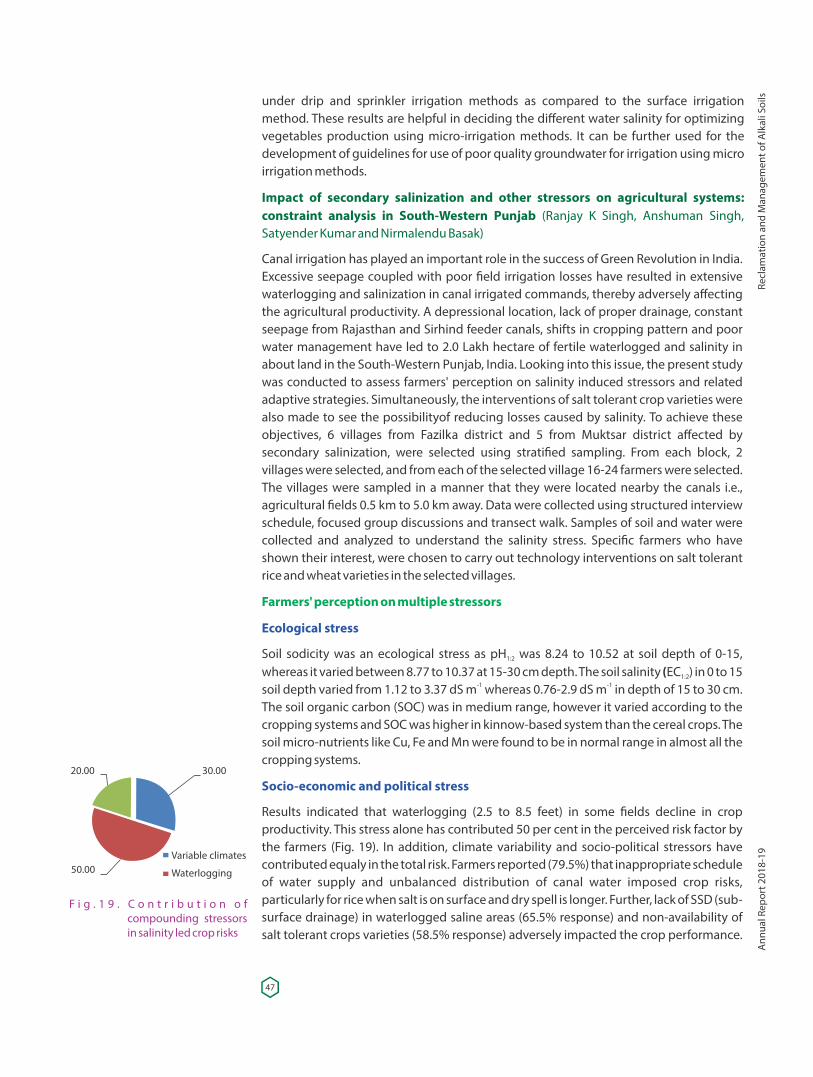
under drip and sprinkler irrigation methods as compared to the surface irrigation method. These results are helpful in deciding the different water salinity for optimizing vegetables production using micro-irrigation methods. It can be further used for the development of guidelines for use of poor quality groundwater for irrigation using micro irrigation methods.
Impact of secondary salinization and other stressors on agricultural systems: constraint analysis in South-Western Punjab (Ranjay K Singh, Anshuman Singh, Satyender Kumar and Nirmalendu Basak)
Canal irrigation has played an important role in the success of Green Revolution in India. Excessive seepage coupled with poor �eld irrigation losses have resulted in extensive waterlogging and salinization in canal irrigated commands, thereby adversely affecting the agricultural productivity. A depressional location, lack of proper drainage, constant seepage from Rajasthan and Sirhind feeder canals, shifts in cropping pattern and poor water management have led to 2.0 Lakh hectare of fertile waterlogged and salinity in about land in the South-Western Punjab, India. Looking into this issue, the present study was conducted to assess farmers' perception on salinity induced stressors and related adaptive strategies. Simultaneously, the interventions of salt tolerant crop varieties were also made to see the possibilityof reducing losses caused by salinity. To achieve these objectives, 6 villages from Fazilka district and 5 from Muktsar district affected by secondary salinization, were selected using strati�ed sampling. From each block, 2 villages were selected, and from each of the selected village 16-24 farmers were selected. The villages were sampled in a manner that they were located nearby the canals i.e., agricultural �elds 0.5 km to 5.0 km away. Data were collected using structured interview schedule, focused group discussions and transect walk. Samples of soil and water were collected and analyzed to understand the salinity stress. Speci�c farmers who have shown their interest, were chosen to carry out technology interventions on salt tolerant rice and wheat varieties in the selected villages.
Farmers' perception on multiple stressors
Ecological stress
Soil sodicity was an ecological stress as pH was 8.24 to 10.52 at soil depth of 0-15, 1:2
whereas it varied between 8.77 to 10.37 at 15-30 cm depth. The soil salinity (EC ) in 0 to 15 1:2-1 -1soil depth varied from 1.12 to 3.37 dS m whereas 0.76-2.9 dS m in depth of 15 to 30 cm.
The soil organic carbon (SOC) was in medium range, however it varied according to the cropping systems and SOC was higher in kinnow-based system than the cereal crops. The soil micro-nutrients like Cu, Fe and Mn were found to be in normal range in almost all the cropping systems.
Socio-economic and political stress
Results indicated that waterlogging (2.5 to 8.5 feet) in some �elds decline in crop productivity. This stress alone has contributed 50 per cent in the perceived risk factor by the farmers (Fig. 19). In addition, climate variability and socio-political stressors have contributed equaly in the total risk. Farmers reported (79.5%) that inappropriate schedule of water supply and unbalanced distribution of canal water imposed crop risks, particularly for rice when salt is on surface and dry spell is longer. Further, lack of SSD (sub-surface drainage) in waterlogged saline areas (65.5% response) and non-availability of salt tolerant crops varieties (58.5% response) adversely impacted the crop performance.
F i g . 1 9 . C o n t r i b u t i o n o f compounding stressors in salinity led crop risks
20.00 30.00
50.00Variable climates
Waterlogging
47
Recl
amat
ion
and
Man
agem
ent o
f Alk
ali S
oils
Ann
ual R
epor
t 201
8-19
Farmers' perception indicated that summers have expanded (72.5%), winters reduced (68.5%), onset of monsoon delayed (90.2%), rainfall occurrence became erratic (95.0%) and drought frequency (e.g. 2016) increased (52.8%) during the recent past. Drought or fewer rains provide opportunity for wheat cultivation in waterlogged saline soils but enhance risks for rice particularly when electricity and or canal water supply are not regular.
Adaptation strategies
Farmers adopt diverse adaptation strategies to mitigate the risks caused by soil salinity and associated stressors. The mean score taken for the extent of adaptation indicated that social migration (1.95), taking debt from Adhatiya (informal institution) (1.90), diversi�cation through dairy (1.90), relying on SSD (1.90) and agronomic manipulation (1.85) were the most prominent adaptive and mitigative strategies to reduce the risks and vulnerability caused by salinity and associated stressors (Table 16).
However, farmers reported that speed and extent of SSD installation were rather slow and large areas were yet to be covered. Taking loans from formal institutions (1.65), custom hiring of agricultural machinery for reducing salinity risks (e.g., laser land leveler) (1.60) and relying on the facility like access of free electricity (1.65) to uplift water for irrigation were observed to be the supportive adaptive strategies among the farmers. Interestingly, these adaptive strategies varied with the typology of farmers. For example, the capital intensive (except dairy) technologies were more adopted by large and medium farmers, while labour intensive strategies were prominent among the small and medium farmers. Except MGNREGA (for BPL farmers), almost all the policy centric adaptations, such as crop insurance were prominent among the large farmers. Taking loan from bank, inputs from private dealers and relying on SSD technologies were equally important adaptive strategies among the farmers.
Table 16: Adaptation strategies among farmers of saline-sodic environments
Adaptation strategies Mean score SD CV% Adaptation scale: higher to lower extentSalt tolerant varieties 1.30 0.33 25.0 L and M farmers Agronomic manipulations 1.85 0.39 21.0 S, M and L farmers Diversi�cation through dairy 1.90 0.40 21.0 S and M farmers Policy support (free electric) 1.65 0.46 27.0 M and L farmers Sub-surface drainage (SSD) 0.90 0.47 52.0 All farmers Agricultural loan (from banks) 1.64 0.48 29.0 All farmers Debt from Adhatiya 1.90 0.30 16.0 S and M farmers Crop-insurance 1.53 0.50 33.0 Large farmers Wages through MGNREGA/other places 1.40 0.49 35.0 S and M farmers Social migration (circular/ permanent) 1.95 0.23 12.0 S and M farmers Inputs from private dealers (timely) 1.41 0.49 35.0 All farmers Giving land on lease 1.54 0.50 32.0 M and L farmers Access of formal institutions 1.01 0.45 45.0 L farmers Customized hiring of lazer leveler, combine, 1.60 0.25 16.0 S and M farmers harrow and subsidized seeds
Note: L= Large; M= Medium and S= Small
48
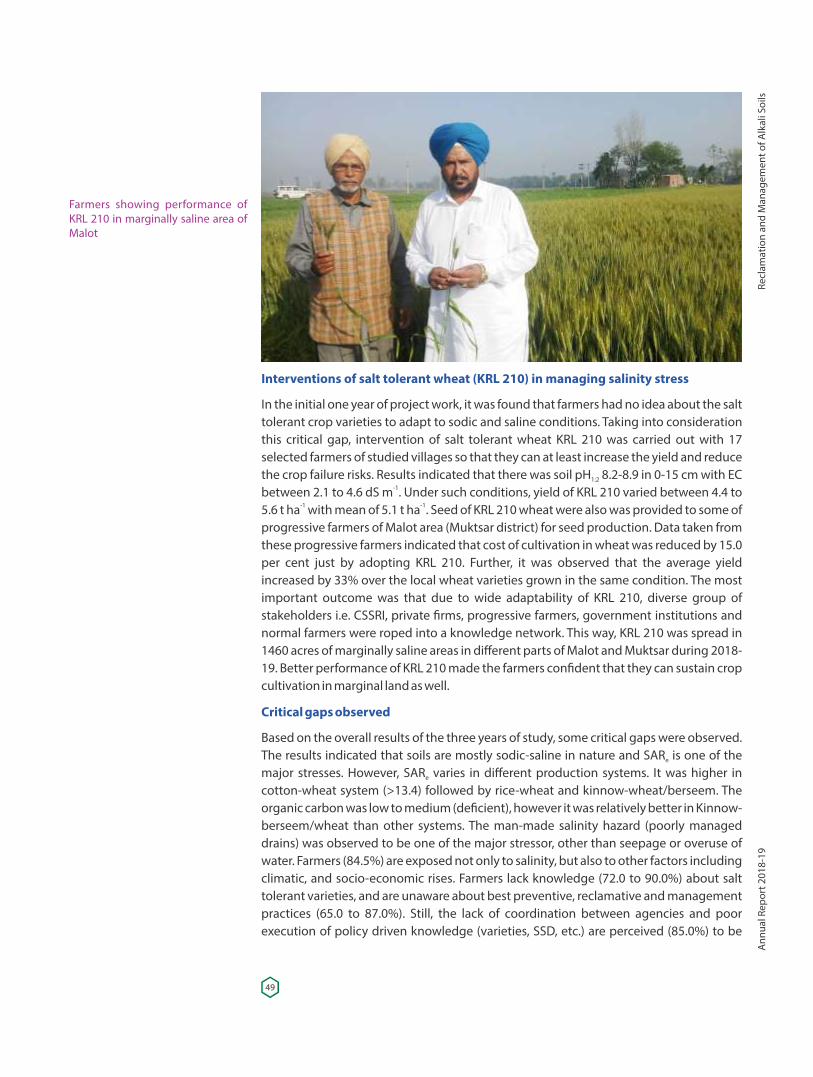
Interventions of salt tolerant wheat (KRL 210) in managing salinity stress
In the initial one year of project work, it was found that farmers had no idea about the salt tolerant crop varieties to adapt to sodic and saline conditions. Taking into consideration this critical gap, intervention of salt tolerant wheat KRL 210 was carried out with 17 selected farmers of studied villages so that they can at least increase the yield and reduce the crop failure risks. Results indicated that there was soil pH 8.2-8.9 in 0-15 cm with EC 1:2
between 2.1 to 4.6 dS m . Under such conditions, yield of KRL 210 varied between 4.4 to -1
5.6 t ha with mean of 5.1 t ha . Seed of KRL 210 wheat were also was provided to some of -1 -1
progressive farmers of Malot area (Muktsar district) for seed production. Data taken from these progressive farmers indicated that cost of cultivation in wheat was reduced by 15.0 per cent just by adopting KRL 210. Further, it was observed that the average yield increased by 33% over the local wheat varieties grown in the same condition. The most important outcome was that due to wide adaptability of KRL 210, diverse group of stakeholders i.e. CSSRI, private �rms, progressive farmers, government institutions and normal farmers were roped into a knowledge network. This way, KRL 210 was spread in 1460 acres of marginally saline areas in different parts of Malot and Muktsar during 2018-19. Better performance of KRL 210 made the farmers con�dent that they can sustain crop cultivation in marginal land as well.
Critical gaps observed
Based on the overall results of the three years of study, some critical gaps were observed. The results indicated that soils are mostly sodic-saline in nature and SAR is one of the e
major stresses. However, SAR varies in different production systems. It was higher in e
cotton-wheat system (>13.4) followed by rice-wheat and kinnow-wheat/berseem. The organic carbon was low to medium (de�cient), however it was relatively better in Kinnow-berseem/wheat than other systems. The man-made salinity hazard (poorly managed drains) was observed to be one of the major stressor, other than seepage or overuse of water. Farmers (84.5%) are exposed not only to salinity, but also to other factors including climatic, and socio-economic rises. Farmers lack knowledge (72.0 to 90.0%) about salt tolerant varieties, and are unaware about best preventive, reclamative and management practices (65.0 to 87.0%). Still, the lack of coordination between agencies and poor execution of policy driven knowledge (varieties, SSD, etc.) are perceived (85.0%) to be
Farmers showing performance of KRL 210 in marginally saline area of Malot
49
Recl
amat
ion
and
Man
agem
ent o
f Alk
ali S
oils
Ann
ual R
epor
t 201
8-19
major constraints by the farmers. Farmers were in lock-in adaptation from one mal-adaptive to other mal-adaptive practices i.e., Kinnow with �ood irrigation and intensive rice crop which is further enhancing their risks.
It was concluded that salinity (ecological stress), climate, socioeconomic and policy stressors have compounding impacts on crop cultivation/livelihoods. Some planned adaptation strategies, although at low scale, such as adopting salt tolerant wheat variety (KRL 210) and SSD, made farmers aware about the solutions available to combat salinity in rice-wheat and cotton-wheat systems to minimize livelihood risks. Salt tolerant wheat KRL 210 appears to be the robust technology for farmers of Fazilka and Muktsar regions who are exposed to a range of salinity induced stressors.
Impact assessment of subsurface drainage technology in canal command areas of Karnataka (Raju, R., Thimmappa, K. and A.L. Pathan)
The canal command areas in Belgaum district (Karnataka) are affected by waterlogging and soil salinity, which threaten the land productivity and reduce the farm incomes. The farmers of village Ugar Budruk faced severe problem of waterlogging and soil salinity over the decades and majority of the lands were left barren. Some progressive farmers came forward to convert these barren lands into productive land through installation of subsurface drainage (SSD) systems. However, this technology is capital intensive and individual farmers cannot afford it and hence they approached the Government for funding. With the funding from Central government (60%), State government (20%) and farmers contribution (20%), the SSD systems were installed in the years 2009-10 to 2011-12. After installation there was a signi�cant improvement in the land productivity in the project area. While seeing the good performance of the technology, the individual farmers (whose lands were affected with waterlogging and soil salinity) came forward for installation of SSD on their farm by investing their own amount though it is a capital intensive technology. This study was undertaken to assess the impact of the technology on yield, farm income and employment in the project area. For impact assessment, the study used both primary as well as secondary data collected from different sources. Salient features of different SSD schemes in Belgaum district are given in Table 17.
Table 17: Project features of different SSD schemes in Belgaum, Karnataka
SSD Project Features Govt. Scheme Farmers Scheme Type of Scheme Funded by Government (Central and State) Funded by individual farmers’ and installed in and implemented in larger area (>100 ha). smaller areas (up to 10 ha). Installation year 2009-10 to 2011-12 2009-10 to 2017-18SSD Project Area (location) Village Ugar BK, Belgaum Dist. (Karnataka) Different villages of Belgaum Dist. (Karnataka)Average cost of SSD (Rs.ha-1) Rs. 52000 Rs. 1.5 lakhs Spacing between lateral pipes (m) 30 20Area covered ~ 940 ha >1000 haFarmers covered (No.) ~ 650 >1000 Type of farmers/ bene�ciaries Mostly small and marginal farmers with Medium and large farmers, with average land average land holding of 0.99 ha holding 4.37 ha.
50
Economics of Sugarcane cultivation: The impact study envisaged comparison between SSD schemes systems installed under government with farmers' scheme. Yield advantage was about 17.5 per cent higher in farmers' scheme as compared to govt. scheme (Table 18). The gross and net returns were also higher in farmers' scheme (Rs. 301134/- and Rs. 116186/-) as compared to govt. scheme (Rs. 255964/- and Rs. 80956/-). The higher yield obtained infarmers' scheme revealed lesser cost of production (Rs. 1605 t ) -1
compared to govt. scheme (Rs. 1786 t ). The input-output ratios were 1.46 and 1.63 for -1
sugarcane produced under govt. scheme and farmers' scheme, respectively. The per hectare per annum employment generation was about 186 and 195 person days, respectively under govt. scheme and farmers' scheme due to which the resource poor farmers' respective earnings were Rs. 46500/- and Rs. 48750/- on account of farm employment due to reclamation of waterlogged and salinity affected lands.
Economic viability of SSD projects: Estimation of economic viability of the project considering its life span gives a clear idea about the investment activity (Table 19). The study reveals that the investment on SSD technology in both the cases (Govt. and farmers’ scheme) are economically viable. The net present worth which is positive, bene�t-cost ratio of more than one, internal rate of returns more than the existing interest rate of bank and the least pay back period indicates the economic viability of SSD projects in the region.
Constraints in SSD adoption: Constraint analysis was carried out to examine the difficulties faced by the farmers in adoption of SSD technology in Belgaum district of Karnataka (Table 20). Majority of the farmers in the study region informed that the lack of institutional support either in terms of providing credit facility from �nancial institutes or subsidy from the Government for the SSD technology is the major resource constraint followed by lack of adequate �nance with the individual farmers which falls under economic constraints. Lack of cooperation from neighbouring farmers for installation of collector pipes for carrying drain water is the major social constraint faced by the farmers in the study region.
Table 18: Economics of sugarcane cultivation under different SSD schemes
Particulars Govt. Scheme Farmers’ Scheme % Change-1Yield (t ha ) 98 115 17.35
-1Gross Returns (Rs.ha ) 255964 301134 17.65-1Cost of cultivation (Rs. ha ) 175008 184948 5.68
-1Net Returns (Rs. ha ) 80956 116186 43.52-1Cost of production (Rs. t ) 1786 1605 -10.13
Input-Output Ratio 1.46 1.63 11.32Employment generated 186 195 4.84
-1 -1 (Man days ha annum )Wage earnings from farm 46500 48750 4.84
-1 -1employment (Rs. ha annum )
Table 19: Economic viability of different SSD projects in Karnataka
Economic Indicators Govt. Scheme Farmer’s Scheme Net Present Value (NPV) 299576 756015 Bene�t Cost Ratio (BCR) 1.18 1.39 Internal Rate of Returns (IRR) 52% 64% Pay Back Period (PBP) 2 Years 2 Years
51
Recl
amat
ion
and
Man
agem
ent o
f Alk
ali S
oils
Ann
ual R
epor
t 201
8-19
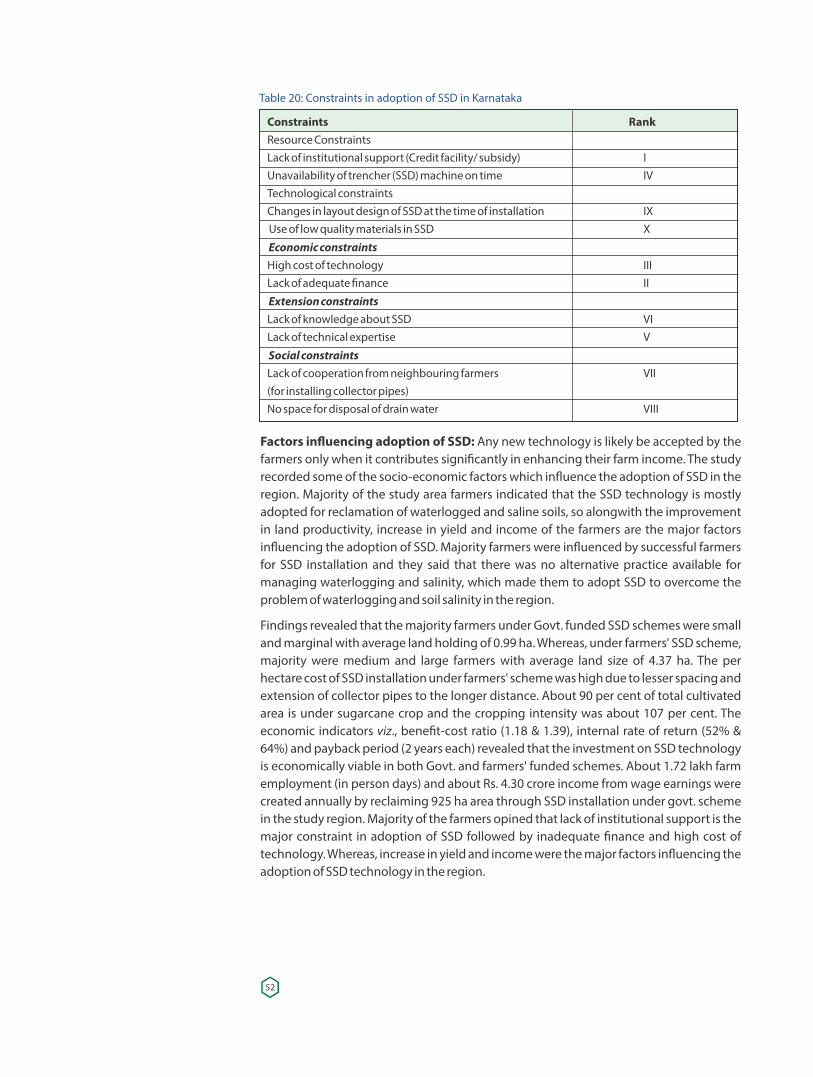
Table 20: Constraints in adoption of SSD in Karnataka
Constraints RankResource Constraints Lack of institutional support (Credit facility/ subsidy) IUnavailability of trencher (SSD) machine on time IVTechnological constraints Changes in layout design of SSD at the time of installation IX Use of low quality materials in SSD X
Economic constraints High cost of technology IIILack of adequate �nance II
Extension constraints Lack of knowledge about SSD VILack of technical expertise V
Social constraints Lack of cooperation from neighbouring farmers VII(for installing collector pipes) No space for disposal of drain water VIII
Factors in�uencing adoption of SSD: Any new technology is likely be accepted by the farmers only when it contributes signi�cantly in enhancing their farm income. The study recorded some of the socio-economic factors which in�uence the adoption of SSD in the region. Majority of the study area farmers indicated that the SSD technology is mostly adopted for reclamation of waterlogged and saline soils, so alongwith the improvement in land productivity, increase in yield and income of the farmers are the major factors in�uencing the adoption of SSD. Majority farmers were in�uenced by successful farmers for SSD installation and they said that there was no alternative practice available for managing waterlogging and salinity, which made them to adopt SSD to overcome the problem of waterlogging and soil salinity in the region.
Findings revealed that the majority farmers under Govt. funded SSD schemes were small and marginal with average land holding of 0.99 ha. Whereas, under farmers' SSD scheme, majority were medium and large farmers with average land size of 4.37 ha. The per hectare cost of SSD installation under farmers' scheme was high due to lesser spacing and extension of collector pipes to the longer distance. About 90 per cent of total cultivated area is under sugarcane crop and the cropping intensity was about 107 per cent. The economic indicators viz., bene�t-cost ratio (1.18 & 1.39), internal rate of return (52% & 64%) and payback period (2 years each) revealed that the investment on SSD technology is economically viable in both Govt. and farmers' funded schemes. About 1.72 lakh farm employment (in person days) and about Rs. 4.30 crore income from wage earnings were created annually by reclaiming 925 ha area through SSD installation under govt. scheme in the study region. Majority of the farmers opined that lack of institutional support is the major constraint in adoption of SSD followed by inadequate �nance and high cost of technology. Whereas, increase in yield and income were the major factors in�uencing the adoption of SSD technology in the region.
52
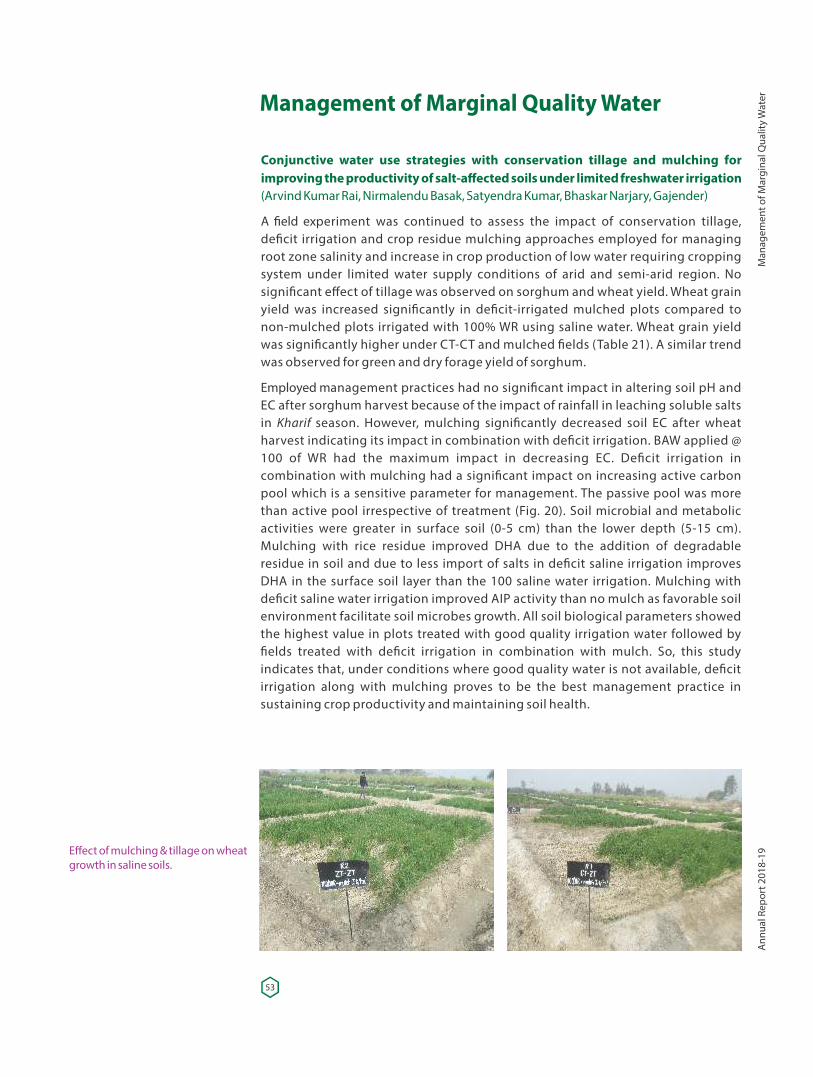
Management of Marginal Quality Water
Conjunctive water use strategies with conservation tillage and mulching for improving the productivity of salt-affected soils under limited freshwater irrigation (Arvind Kumar Rai, Nirmalendu Basak, Satyendra Kumar, Bhaskar Narjary, Gajender)
A �eld experiment was continued to assess the impact of conservation tillage, de�cit irrigation and crop residue mulching approaches employed for managing root zone salinity and increase in crop production of low water requiring cropping system under limited water supply conditions of arid and semi-arid region. No signi�cant effect of tillage was observed on sorghum and wheat yield. Wheat grain yield was increased signi�cantly in de�cit-irrigated mulched plots compared to non-mulched plots irrigated with 100% WR using saline water. Wheat grain yield was signi�cantly higher under CT-CT and mulched �elds (Table 21). A similar trend was observed for green and dry forage yield of sorghum.
Employed management practices had no signi�cant impact in altering soil pH and EC after sorghum harvest because of the impact of rainfall in leaching soluble salts in Kharif season. However, mulching signi�cantly decreased soil EC after wheat harvest indicating its impact in combination with de�cit irrigation. BAW applied @ 100 of WR had the maximum impact in decreasing EC. De�cit irrigation in combination with mulching had a signi�cant impact on increasing active carbon pool which is a sensitive parameter for management. The passive pool was more than active pool irrespective of treatment (Fig. 20). Soil microbial and metabolic activities were greater in surface soil (0-5 cm) than the lower depth (5-15 cm). Mulching with rice residue improved DHA due to the addition of degradable residue in soil and due to less import of salts in de�cit saline irrigation improves DHA in the surface soil layer than the 100 saline water irrigation. Mulching with de�cit saline water irrigation improved AIP activity than no mulch as favorable soil environment facilitate soil microbes growth. All soil biological parameters showed the highest value in plots treated with good quality irrigation water followed by �elds treated with de�cit irrigation in combination with mulch. So, this study indicates that, under conditions where good quality water is not available, de�cit irrigation along with mulching proves to be the best management practice in sustaining crop productivity and maintaining soil health.
Effect of mulching & tillage on wheat growth in saline soils.
53
Man
agem
ent o
f Mar
gina
l Qua
lity
Wat
erA
nnua
l Rep
ort 2
018-
19
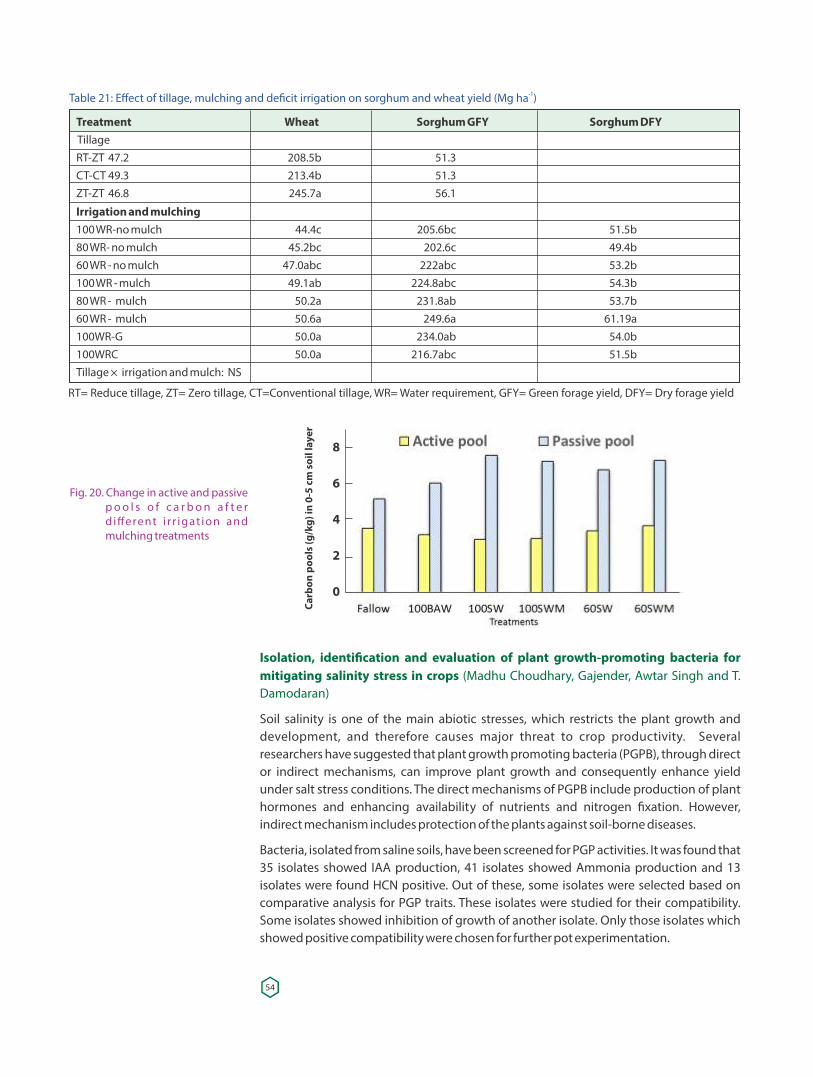
-1Table 21: Effect of tillage, mulching and de�cit irrigation on sorghum and wheat yield (Mg ha )
Treatment Wheat Sorghum GFY Sorghum DFY Tillage RT-ZT 47.2 208.5b 51.3CT-CT 49.3 213.4b 51.3ZT-ZT 46.8 245.7a 56.1
Irrigation and mulching100 WR-no mulch 44.4c 205.6bc 51.5b80 WR- no mulch 45.2bc 202.6c 49.4b60 WR - no mulch 47.0abc 222abc 53.2b100 WR - mulch 49.1ab 224.8abc 54.3b80 WR - mulch 50.2a 231.8ab 53.7b60 WR - mulch 50.6a 249.6a 61.19a100WR-G 50.0a 234.0ab 54.0b100WRC 50.0a 216.7abc 51.5bTillage × irrigation and mulch: NS
RT= Reduce tillage, ZT= Zero tillage, CT=Conventional tillage, WR= Water requirement, GFY= Green forage yield, DFY= Dry forage yield
Fig. 20. Change in active and passive p o o l s o f c a r b o n a f t e r d ifferent i r r igat ion and mulching treatments
Isolation, identi�cation and evaluation of plant growth-promoting bacteria for mitigating salinity stress in crops (Madhu Choudhary, Gajender, Awtar Singh and T. Damodaran)
Soil salinity is one of the main abiotic stresses, which restricts the plant growth and development, and therefore causes major threat to crop productivity. Several researchers have suggested that plant growth promoting bacteria (PGPB), through direct or indirect mechanisms, can improve plant growth and consequently enhance yield under salt stress conditions. The direct mechanisms of PGPB include production of plant hormones and enhancing availability of nutrients and nitrogen �xation. However, indirect mechanism includes protection of the plants against soil-borne diseases.
Bacteria, isolated from saline soils, have been screened for PGP activities. It was found that 35 isolates showed IAA production, 41 isolates showed Ammonia production and 13 isolates were found HCN positive. Out of these, some isolates were selected based on comparative analysis for PGP traits. These isolates were studied for their compatibility. Some isolates showed inhibition of growth of another isolate. Only those isolates which showed positive compatibility were chosen for further pot experimentation.
54
8
6
4
2
0
Carb
on p
ools
(g/k
g) in
0-5
cm
soi
l lay
er
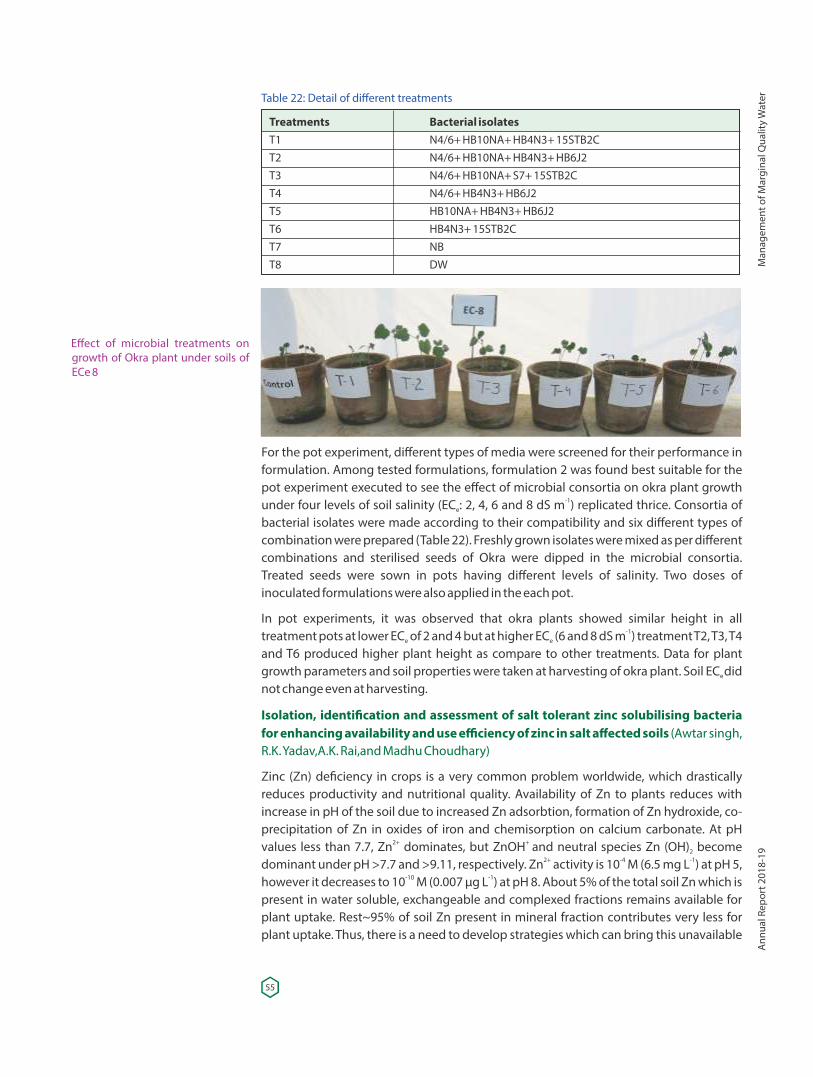
For the pot experiment, different types of media were screened for their performance in formulation. Among tested formulations, formulation 2 was found best suitable for the pot experiment executed to see the effect of microbial consortia on okra plant growth
-1under four levels of soil salinity (EC : 2, 4, 6 and 8 dS m ) replicated thrice. Consortia of e
bacterial isolates were made according to their compatibility and six different types of combination were prepared (Table 22). Freshly grown isolates were mixed as per different combinations and sterilised seeds of Okra were dipped in the microbial consortia. Treated seeds were sown in pots having different levels of salinity. Two doses of inoculated formulations were also applied in the each pot.
In pot experiments, it was observed that okra plants showed similar height in all -1treatment pots at lower EC of 2 and 4 but at higher EC (6 and 8 dS m ) treatment T2, T3, T4 e e
and T6 produced higher plant height as compare to other treatments. Data for plant growth parameters and soil properties were taken at harvesting of okra plant. Soil EC did e
not change even at harvesting.
Isolation, identi�cation and assessment of salt tolerant zinc solubilising bacteria for enhancing availability and use efficiency of zinc in salt affected soils (Awtar singh, R.K. Yadav,A.K. Rai,and Madhu Choudhary)
Zinc (Zn) de�ciency in crops is a very common problem worldwide, which drastically reduces productivity and nutritional quality. Availability of Zn to plants reduces with increase in pH of the soil due to increased Zn adsorbtion, formation of Zn hydroxide, co-precipitation of Zn in oxides of iron and chemisorption on calcium carbonate. At pH
2+ + values less than 7.7, Zn dominates, but ZnOH and neutral species Zn (OH) become 22+ -4 -1dominant under pH >7.7 and >9.11, respectively. Zn activity is 10 M (6.5 mg L ) at pH 5,
-10 -1however it decreases to 10 M (0.007 μg L ) at pH 8. About 5% of the total soil Zn which is present in water soluble, exchangeable and complexed fractions remains available for plant uptake. Rest~95% of soil Zn present in mineral fraction contributes very less for plant uptake. Thus, there is a need to develop strategies which can bring this unavailable
Table 22: Detail of different treatments
Treatments Bacterial isolatesT1 N4/6+ HB10NA+ HB4N3+ 15STB2CT2 N4/6+ HB10NA+ HB4N3+ HB6J2T3 N4/6+ HB10NA+ S7+ 15STB2CT4 N4/6+ HB4N3+ HB6J2T5 HB10NA+ HB4N3+ HB6J2T6 HB4N3+ 15STB2CT7 NBT8 DW
Effect of microbial treatments on growth of Okra plant under soils of ECe 8
55
Man
agem
ent o
f Mar
gina
l Qua
lity
Wat
erA
nnua
l Rep
ort 2
018-
19
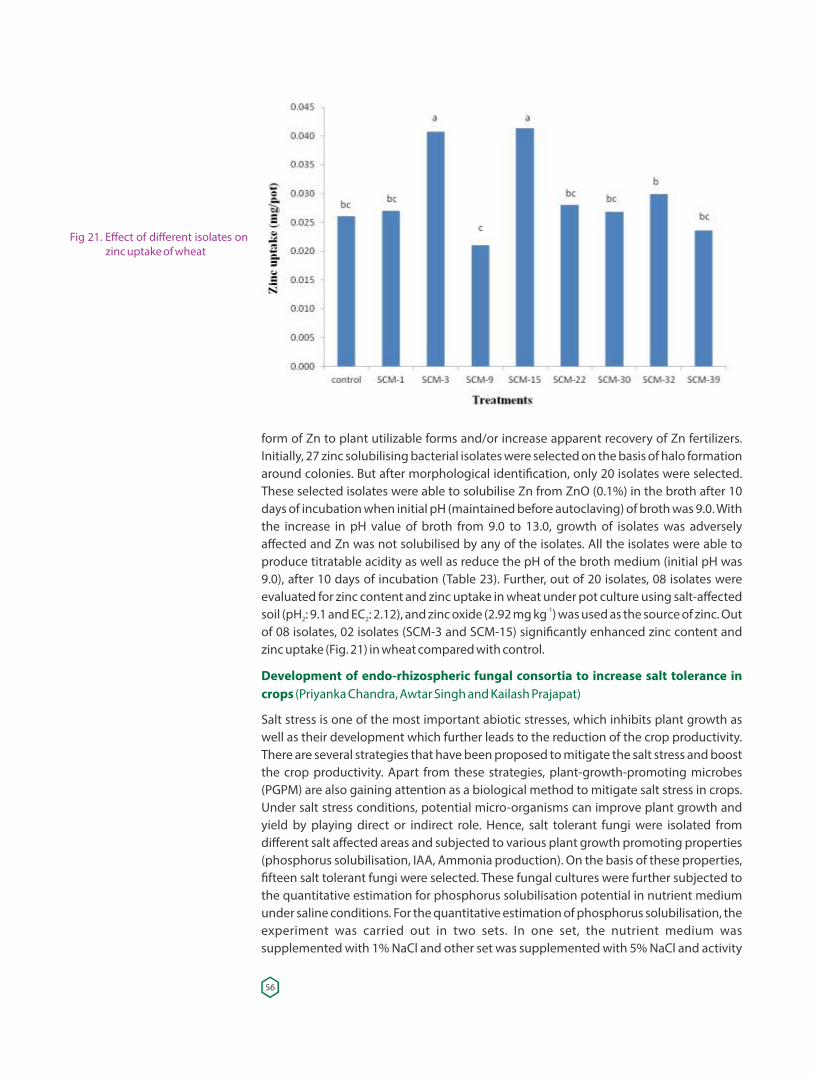
form of Zn to plant utilizable forms and/or increase apparent recovery of Zn fertilizers. Initially, 27 zinc solubilising bacterial isolates were selected on the basis of halo formation around colonies. But after morphological identi�cation, only 20 isolates were selected. These selected isolates were able to solubilise Zn from ZnO (0.1%) in the broth after 10 days of incubation when initial pH (maintained before autoclaving) of broth was 9.0. With the increase in pH value of broth from 9.0 to 13.0, growth of isolates was adversely affected and Zn was not solubilised by any of the isolates. All the isolates were able to produce titratable acidity as well as reduce the pH of the broth medium (initial pH was 9.0), after 10 days of incubation (Table 23). Further, out of 20 isolates, 08 isolates were evaluated for zinc content and zinc uptake in wheat under pot culture using salt-affected
-1soil (pH : 9.1 and EC : 2.12), and zinc oxide (2.92 mg kg ) was used as the source of zinc. Out 2 2
of 08 isolates, 02 isolates (SCM-3 and SCM-15) signi�cantly enhanced zinc content and zinc uptake (Fig. 21) in wheat compared with control.
Development of endo-rhizospheric fungal consortia to increase salt tolerance in crops (Priyanka Chandra, Awtar Singh and Kailash Prajapat)
Salt stress is one of the most important abiotic stresses, which inhibits plant growth as well as their development which further leads to the reduction of the crop productivity. There are several strategies that have been proposed to mitigate the salt stress and boost the crop productivity. Apart from these strategies, plant-growth-promoting microbes (PGPM) are also gaining attention as a biological method to mitigate salt stress in crops. Under salt stress conditions, potential micro-organisms can improve plant growth and yield by playing direct or indirect role. Hence, salt tolerant fungi were isolated from different salt affected areas and subjected to various plant growth promoting properties (phosphorus solubilisation, IAA, Ammonia production). On the basis of these properties, �fteen salt tolerant fungi were selected. These fungal cultures were further subjected to the quantitative estimation for phosphorus solubilisation potential in nutrient medium under saline conditions. For the quantitative estimation of phosphorus solubilisation, the experiment was carried out in two sets. In one set, the nutrient medium was supplemented with 1% NaCl and other set was supplemented with 5% NaCl and activity
Fig 21. Effect of different isolates on zinc uptake of wheat
56
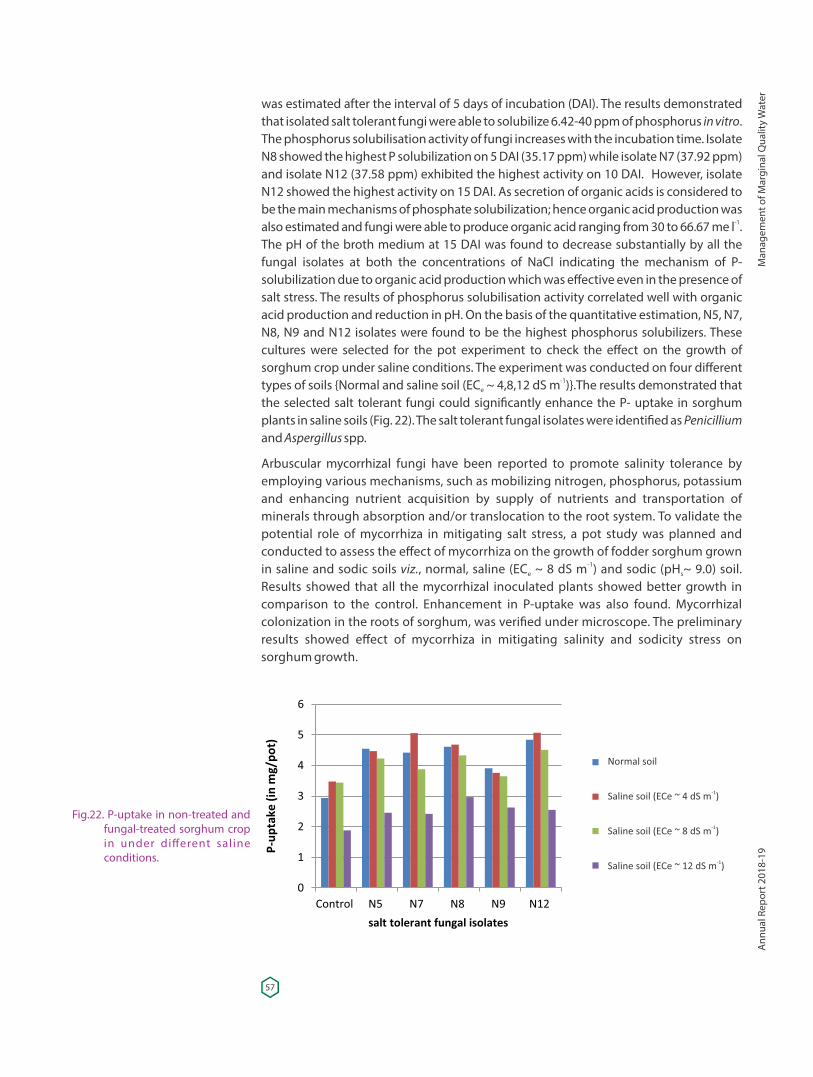
was estimated after the interval of 5 days of incubation (DAI). The results demonstrated that isolated salt tolerant fungi were able to solubilize 6.42-40 ppm of phosphorus in vitro. The phosphorus solubilisation activity of fungi increases with the incubation time. Isolate N8 showed the highest P solubilization on 5 DAI (35.17 ppm) while isolate N7 (37.92 ppm) and isolate N12 (37.58 ppm) exhibited the highest activity on 10 DAI. However, isolate N12 showed the highest activity on 15 DAI. As secretion of organic acids is considered to be the main mechanisms of phosphate solubilization; hence organic acid production was
-1also estimated and fungi were able to produce organic acid ranging from 30 to 66.67 me l . The pH of the broth medium at 15 DAI was found to decrease substantially by all the fungal isolates at both the concentrations of NaCl indicating the mechanism of P-solubilization due to organic acid production which was effective even in the presence of salt stress. The results of phosphorus solubilisation activity correlated well with organic acid production and reduction in pH. On the basis of the quantitative estimation, N5, N7, N8, N9 and N12 isolates were found to be the highest phosphorus solubilizers. These cultures were selected for the pot experiment to check the effect on the growth of sorghum crop under saline conditions. The experiment was conducted on four different
-1types of soils {Normal and saline soil (EC ~ 4,8,12 dS m )}.The results demonstrated that e
the selected salt tolerant fungi could signi�cantly enhance the P- uptake in sorghum plants in saline soils (Fig. 22). The salt tolerant fungal isolates were identi�ed as Penicillium and Aspergillus spp.
Arbuscular mycorrhizal fungi have been reported to promote salinity tolerance by employing various mechanisms, such as mobilizing nitrogen, phosphorus, potassium and enhancing nutrient acquisition by supply of nutrients and transportation of minerals through absorption and/or translocation to the root system. To validate the potential role of mycorrhiza in mitigating salt stress, a pot study was planned and conducted to assess the effect of mycorrhiza on the growth of fodder sorghum grown
-1in saline and sodic soils viz., normal, saline (EC ~ 8 dS m ) and sodic (pH ~ 9.0) soil. e s
Results showed that all the mycorrhizal inoculated plants showed better growth in comparison to the control. Enhancement in P-uptake was also found. Mycorrhizal colonization in the roots of sorghum, was veri�ed under microscope. The preliminary results showed effect of mycorrhiza in mitigating salinity and sodicity stress on sorghum growth.
Fig.22. P-uptake in non-treated and fungal-treated sorghum crop in under different saline conditions.
Normal soil
-1Saline soil (ECe ~ 4 dS m )
-1Saline soil (ECe ~ 8 dS m )
-1Saline soil (ECe ~ 12 dS m )
57
Man
agem
ent o
f Mar
gina
l Qua
lity
Wat
erA
nnua
l Rep
ort 2
018-
19
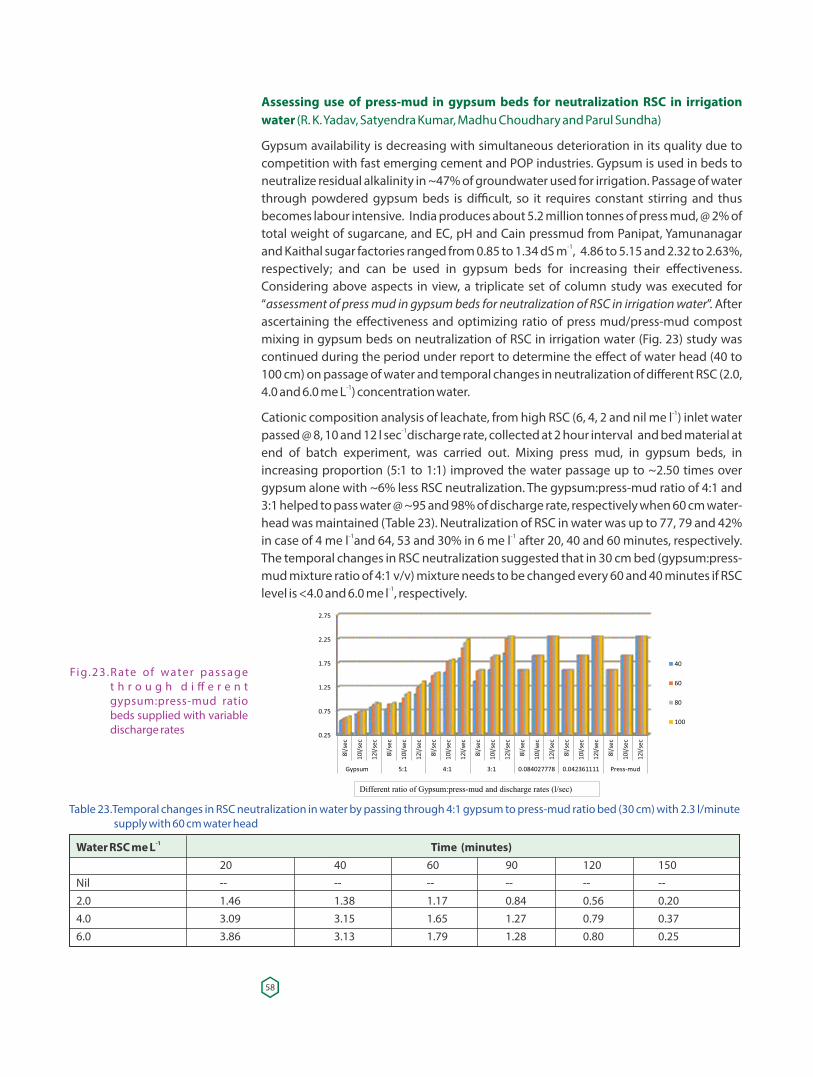
Assessing use of press-mud in gypsum beds for neutralization RSC in irrigation water (R. K. Yadav, Satyendra Kumar, Madhu Choudhary and Parul Sundha)
Gypsum availability is decreasing with simultaneous deterioration in its quality due to competition with fast emerging cement and POP industries. Gypsum is used in beds to neutralize residual alkalinity in ~47% of groundwater used for irrigation. Passage of water through powdered gypsum beds is difficult, so it requires constant stirring and thus becomes labour intensive. India produces about 5.2 million tonnes of press mud, @ 2% of total weight of sugarcane, and EC, pH and Cain pressmud from Panipat, Yamunanagar
-1and Kaithal sugar factories ranged from 0.85 to 1.34 dS m , 4.86 to 5.15 and 2.32 to 2.63%, respectively; and can be used in gypsum beds for increasing their effectiveness. Considering above aspects in view, a triplicate set of column study was executed for “assessment of press mud in gypsum beds for neutralization of RSC in irrigation water”. After ascertaining the effectiveness and optimizing ratio of press mud/press-mud compost mixing in gypsum beds on neutralization of RSC in irrigation water (Fig. 23) study was continued during the period under report to determine the effect of water head (40 to 100 cm) on passage of water and temporal changes in neutralization of different RSC (2.0,
-14.0 and 6.0 me L ) concentration water.-1Cationic composition analysis of leachate, from high RSC (6, 4, 2 and nil me l ) inlet water
-1passed @ 8, 10 and 12 l sec discharge rate, collected at 2 hour interval and bed material at end of batch experiment, was carried out. Mixing press mud, in gypsum beds, in increasing proportion (5:1 to 1:1) improved the water passage up to ~2.50 times over gypsum alone with ~6% less RSC neutralization. The gypsum:press-mud ratio of 4:1 and 3:1 helped to pass water @ ~95 and 98% of discharge rate, respectively when 60 cm water-head was maintained (Table 23). Neutralization of RSC in water was up to 77, 79 and 42%
-1 -1in case of 4 me l and 64, 53 and 30% in 6 me l after 20, 40 and 60 minutes, respectively. The temporal changes in RSC neutralization suggested that in 30 cm bed (gypsum:press-mud mixture ratio of 4:1 v/v) mixture needs to be changed every 60 and 40 minutes if RSC
-1level is <4.0 and 6.0 me l , respectively.
Fig.23 .R ate of water passage t h r o u g h d i ff e r e n t gypsum:press-mud ratio beds supplied with variable discharge rates
Table 23.Temporal changes in RSC neutralization in water by passing through 4:1 gypsum to press-mud ratio bed (30 cm) with 2.3 l/minute supply with 60 cm water head
-1Water RSC me L Time (minutes) 20 40 60 90 120 150Nil -- -- -- -- -- --2.0 1.46 1.38 1.17 0.84 0.56 0.204.0 3.09 3.15 1.65 1.27 0.79 0.376.0 3.86 3.13 1.79 1.28 0.80 0.25
58
Development of sustainable resources management systems in the water-vulnerable areas of India (ICAR-JIRCAS) (R. K. Yadav, D.S. Bundela, Satyendra Kumar, A.K. Rai, Gajender, Bhasker Najary, P. C. Sharma, S. Tobita, T. Watanabe, K. Omori, J. Onishi and D. Xu)
Development of low-cost subsurface drainage (SSD) and irrigation technology and regionally-adopted salt-tolerant crops in salt-affected �elds for sustainable agricultural production are thrust areas of ICAR-CSSRI, Karnal. Cut soiler based low cost SSD technologies were successfully applied in the multipurpose paddy �elds of Japan. These technologies could be remunerative alternative for the sustainable management of soil and water and crop production on salt affected soils of India. In this back ground, Indian Council of Agricultural Research (ICAR) and Japan International Research Center for Agricultural Sciences (JIRCAS) have started a collaborative project to provide sustainable resource management system for saline arid regions of India. ICAR- Central Soil Salinity Research Institute is lead institute for this collaborative project.
This research project focuses mainly on the low-cost subsurface drainage technology through Cut-soiler experimentation in saline conditions to evaluate its utility on salt leaching and salt and water dynamics in �eld and lysimeter conditions. For this purpose 'cut-soiler' equipment, which cuts soil in V-shape and lifts up at the same time and then puts materials on the ground surface into the space, was introduced for supplementary subsurface drainage. To monitor the weather conditions of experimental sites two HOBO automatic weather stations, one at ICAR-CSSRI, Karnal and other at Nain Farm, Panipat were installed.
ICAR-CSSRI mainly deals with the objective 1 i.e. “Development of low-cost subsurface drainage and irrigation technology in salt-affected �elds for sustainable agricultural production”. In addition to low cost drainage alternative, an adaptable irrigation technology is intended to be applied on the improved �eld drainage. Therefore, the research focus is on the development of low cost SSD experimentation in conjunction with efficient irrigation management in saline conditions to evaluate its utility on salt leaching, water saving and nutrient dynamics. To achieve the objective, a �eld experiment has been started to optimize spacing of Cut-soiler construction line by a material-�lled subsurface drain in salinized �elds of arid zone at Nain Experimental Farm (Panipat). Simultaneously, lysimeter experiments were started at CSSRI, Karnal to study the effect of Cut-soiler drainage on salt and water dynamics under �uctuating water table and on efficient irrigation methods for such conditions.
Field experiment at Nain farm is laid out to optimize the Cut-soiler spacing according to soil salinity and moisture and evaluate water-saving effect of Every Furrow Irrigation (EFI) and Skip Furrow Irrigation (SFI)in order to achieve the objective “Development of low-cost subsurface drainage and irrigation technology in salt-affected �elds for sustainable
2agricultural production”. The Cut-soiler was run in 15 plots (30*30 M ) with a spacing interval of 2.5, 5.0, 7.5 and 10.0 meters as per treatments with desired rice straw residue load on the soil surface. Irrigation and Drainage Channels were delineated; 25 TDR sensor monitoring access tubes and observation well in each plot have been installed.
Each plot has been subdivided into three subplots to superimpose three irrigation treatments i.e. Border Irrigation, Every Furrow Irrigation and Skip Furrow Irrigation. Beds were made with bed maker with 37cm ridge width and 15cm furrow width. Mustard crop was grown with recommended agro-practices and observations on changes in crop
59
Man
agem
ent o
f Mar
gina
l Qua
lity
Wat
erA
nnua
l Rep
ort 2
018-
19
growth, development, yield attributes and yield and spatio-temporal changes in salt, water and nutrient dynamics have been recorded and being in process of analysis.
To demonstrate the utility of Cut-soiler in salt-affected lands with �uctuating water table,the 24 lysimeters were re�lled using two soil types i.e. saline soil from Nain Farm and a heavy textured soil from selected site near Karnal. Cut soiler V shape residue �lled drains prepared in lysimeters to simulate the effect of Cut soiler drainage in �eld. 5TE (VWC, EC, temperature) sensors were installed at 10, 50 and 80 cm depths in cut soiler drain and outside (Fig. 24). HOBO Water level loggers were installed to monitor the water table depth in lysimeters . For moisture recoding, TDR sensor monitoring access tubes installed. Soil moisture and EC is also monitored by TDR sensor (IMKO, TRIME-PICO IPH/T3). Groundwater table is controlled every 10 days for 6 months based on the 3 years WTD
-1observations at Nain. Three saline irrigation water treatments (EC 4, 8, 12 dS m ) were iw
applied in each soil type. Test crop of Brassica was sown in October 2018.
Fig. 24. Schematic diagram of Cut-soiler V shape residue �lled drains and water table m o n i t o r i n g p o i n t s i n lysimeters.
Soil EC, moisture and temperature monitor ing sensors and data loggers in lysimeters.
60
To clarify effect of different irrigation methods i.e. EFI, SFI, combination of SFI with dehydrant and border irrigation (conventional) method of irrigation on water saving and desalination; twelve lysimeters were �lled with saline soils from Nain Farm (Panipat). Experiment was laid out in ridge and furrow system with four irrigation methods i.e. conventional, EFI, Fixed Skip Furrow Irrigation (FSFI) and FSFI+ Dehydration (Black and White) in three replications. METER 5TE sensors were installed, tested and continuously recording the EC, moisture and temperature data. Depth of monitoring is 15, 25, 35, 50, 70 cm from the center of ridge and/or 25, 35 cm depths under furrow. HOBO Water level loggers were installed to monitor the water table depth in lysimeters. Black and White dehydrant clothes (1.0 m) are put on south side of ridge to collect the salt load. For TDR sensor monitoring access tube were installed. Soil moisture and EC is monitored by TDR sensor (IMKO, TRIME-PICO IPH/T3) at every 30 cm, up to 150 cm. Variations in crop growth, development, yield attributes and yield and spatio-temporal changes in salt, water and nutrient dynamics have been recorded and being in process of analysis. Analysis of initial soil properties reveals that initial EC varies from 0.11 to 2.4 and pH varies from 7.94 to 2 2
8.69. Regular sampling, observation recording and automated data recording is in progress in lysimeters at CSSRI, Karnal and at Nain Farm (Panipat).
Improving farm productivity through sustainable use of alkali waters at farmer's �eld in rice-wheat production system (Parvender Sheoran, R.K. Yadav, Nirmalendu Basak, Satyender Kumar, K. Thimmappa and R.K. Singh)
The �eld experiment was initiated in June 2014 with rice as the �rst crop to evaluate the performance of salt tolerant varieties and RSC neutralizing ameliorants (gypsum and pressmud) used either individually or in combination for sustained use of sodic waters. A total of 4 treatments as RSC neutralizing ameliorants viz., available RSC water/untreated control (T ); T + gypsum @ 7.5 t ha (T ); T + pressmud @ 10 t ha (T ) and T + gypsum @ -1 -1
1 1 2 1 3 1
3.75 t ha + pressmud @ 5 t ha (T ) were taken in main plots while two varieties one each -1 -14
as salt tolerant (Basmati CSR 30 and KRL 210) and most adopted ones ('Pusa 1121' rice and 'HD 2967' wheat) in respective growing seasons were superimposed to the neutralization treatments at both locations. All other cultural practices including fertilization and plant protection measures were adopted as per the state recommendation related to the respective crops. Two sites were selected for the experimental purpose in village Mundri, District Kaithal, having RSC ≈7.0 and 5.0 meq l . The data were compiled for 3 years crop -1
iw
(rice-wheat) rotation to showcase the treatment effects on seasonal (mono-cropped) as well as yearly (system) basis.
Physiological adaptations to salt stress.
In rice, the leaf RWC decreased from 88.91 to 81.30% in basmati CSR 30 whereas, it decreased from 83.57 to 75.58% in PB 1121. In wheat, 'HD 2967' exhibited much lower leaf RWC compared to salt tolerant 'KRL 210' at each level of sodicity (RSC) stress. Membrane injury index (MII) signi�cantly increased from 24.6% (basmati CSR 30) to 29.6 % (PB 1121) in rice whereas it increased from 15.9% (KRL 210) to 29.1% (HD 2967) in wheat. Neutralization treatments applied alone or together improved the RWC by 5.7% in rice and 9.9% in wheat while MII reduced by 22.9% in rice and 16.5% in wheat following the sequence of Gyp+PM>PM>Gyp for both parameters. Lower Na /K ratio in both shoot and + +
root portion and associated relative increase with increasing RSC levels was observed in basmati CSR 30 (rice) and KRL 210 (wheat) varieties compared to their seasonal counterparts.
61
Man
agem
ent o
f Mar
gina
l Qua
lity
Wat
erA
nnua
l Rep
ort 2
018-
19
Biometric observations: Tillers sterility was 5.87% in basmati CSR 30 and 11.03% in PB 1121 in plots irrigated with RSC~5 me L which further increased to 6.77 and 13.10%, -1
respectively with increased sodicity stress (RSC~7 me L ). Number of un�lled grains per -1
panicle in sodic water irrigated plots increased from 9.43 to 13.50 in Basmati CSR 30 and 11.57 to 17.67 in PB 1121 with increasing RSC levels. For wheat, the number of spikelets per spike effectively decreased from 16.93 to 15.20 for KRL 210 and 18.07 to 16.13 for HD 2967 with increasing RSC levels. Adverse effect of high RSC waters was compensated by neutralization amendments as witnessed by signi�cant reduction in tillers sterility (3.2-3.5%) and chaffy grains per panicle (12.9-16.4%). The complementary effects of applying neutralization amendments in both rice and wheat for yield attributing parameters were more pronounced when applied together (Gyp+PM).
Grain yields
The mean grain yield of basmati CSR 30 decreased from 2.73 t ha (RSC~5 me L ) to 2.39 t ha -1 -1 -1
(RSC~7 me L ) indicating yield loss of 12.7% with the increase in residual alkalinity of -1
irrigation water. In contrast, the relative decline of 18.3% in rice yield was noticed with PB 1121. In wheat, salt tolerant wheat variety KRL 210 revealed its superiority at both the locations recording 0.31 t ha (RSC~5 me L ) and 0.44 t ha (RSC~7 me L ) yield gain over the -1 -1 -1 -1
traditionally cultivated HD 2967. Mean yield loss of 11.4% (0.44 t ha ) and 16.1% (0.57 t ha ) -1 -1
with KRL 210 and HD 2967, respectively (Fig. 25) was recorded with increasing residual alkalinity of irrigation water under sodic water irrigated plots (non-amended control).
Fig. 25: Production potential of rice a n d w h e a t v a r i e t i e s i n r e l a t i o n t o c o n t i n u o u s irrigation with sodic water (pooled data of 4 years)
Table 24: Interactive effect of RSC irrigation water neutralization ameliorants and varieties on the crop’s productivity (t ha-1) at two locations (mean of 4 years)
-1Varieties Yield (t ha )-1 -1 RSC≈5 me L RSC≈7 me L
RSC water Gyp PM Gyp + PM Mean RSC water Gyp PM Gyp + PM MeanRice
b bCSR 30 Basmati 2.73 3.19 3..32 3.43 3.17 2.40 2.79 2.94 3.01 2.78a aPB 1121 3.23 3.71 3.869 3.94 3.68 2.64 3.08 3.22 3.31 3.06
d c b a d c b a Mean 2.98 3.45 3.59 3.68 2.51 2.93 3.08 3.16Wheat
a aKRL 210 3.87 4.43 4.61 4.74 4.41 3.43 4.03 4.21 4.30 3.99b bHD 2967 3.56 4.01 4.16 4.29 4.00 2.99 3.58 3.71 3.84 3.53
d c b a d c b a Mean 3.71 4.22 4.38 4.52 3.21 3.80 3.96 4.07
Data followed by different lowercase letters within same row (neutralization amendments mean across varieties) or within column (variety mean across neutralization amendments) differ signi�cantly at P=0.05 according to DMRT for separation of means.
62
Grain yields of rice and wheat strongly re�ected the in�uence of residual alkalinity of irrigation water (RSC ) applied during the crop period. Application of neutralization iw
ameliorants for RSC irrigation water resulted in signi�cant improvement in crop yields compared to continuous irrigation with available sodic waters (Table 24). Varietal differences indicated that at the same level of RSC , the salt tolerant varieties (basmati iw
CSR 30 and KRL 210) responded better to neutralization ameliorants in comparison to traditional ones (PB 1121 and HD 2967).
Neutralization amendments used either individually (Gyp or PM) or in combination (Gyp -1+ PM) resulted in 21.6% (0.55 t ha ) higher mean yield gain with CSR 30 Basmati and 20.0%
-1(0.58 t ha ) with PB 1121 in comparison to unamended RSC water used for irrigation. However, it remained almost similar (20% yield advantage) for both varieties in wheat
-1though the yield enhancement was numerically better (0.74 t ha ) with KRL 210 -1compared to HD 2967 (0.66 t ha ). With continuous use of high RSC waters for irrigation in
-1annual rotation for rice-wheat cropping system, the highest yields of rice (3.42 t ha ) was -1 recorded with integrated use of gypsum @ 3.75 and pressmud @ 5 t ha indicating 2.7 and
-17.2% yield advantage over the individual application of gypsum @ 7.5 t ha and pressmud -1@ 5 t ha , respectively.
-1Cumulative yield gain for both the crops increased sharply from 0.28 t ha (2014) to 0.76 t -1 -1 -1 ha (2017) for rice and 0.57 t ha (2014-15) to 0.80 t ha (2017-18) for wheat. Decline in the
yields of rice and wheat due to sodic water irrigation was small in the initial years which kept on increasing with each passing year (Fig. 26).
Fig. 26. Cumulative gain in rice and wheat yield in response to neutralization treatments
63
Man
agem
ent o
f Mar
gina
l Qua
lity
Wat
erA
nnua
l Rep
ort 2
018-
19
Crop Improvement for Salinity, Alkalinity andWaterlogged StressesDevelopment of salt tolerant genotypes in rice – conventional and molecular breeding approaches (S. L. Krishnamurthy, P. C. Sharma, Y. P. Singh and S. K. Sarangi,)
This project aims at the development, evaluation and dissemination of better salt tolerant rice genotypes. To achieve the objectives, following trials were conducted and the breeding material was advanced during Kharif 2018.
IVT-Alkaline and Inland Saline Tolerant Variety Trial-2018
The IVT-Alkaline and Inland Saline Tolerant Variety Trial (IVT-AL&ISTVT) comprising of 28 entries including check varieties(CSR 36, CSR 23 and yield check - Jaya) which were evaluated across �ve locations in Random Block Design with three replications ( . Table 25)The GGE analysis was carried out using 28 IVT rice genotypes for yield across the 5 salt stress locations.
Under salinity stress at Karnal, eighteen entries outperformed the national salinity check -1 -1CSR 27 (2.89 t ha ). The entry 2106 showed the highest grain yield (3.48 t ha ) followed
-1 -1 -1by 2116 (3.45 t ha ), 2023 (3.43 t ha ) and 2101 (3.39 t ha ), Under sodic stress at Karnal, nineteen entries performed better than the local check CSR 36. The entry 2107 showed
-1the highest grain yield (4.67 t ha ).
Analysis of genotype by environment (GxE) interaction for IVT-Alkaline and Inland Saline Tolerant Variety Trial-2018
Biplots for grain yield of 28 rice genotypes tested across 5 salt stress locations (Fig 27. a,b,c)
• E5 (Lucknow) is highly discriminating location, but not representative
• E1 and (Saline microplot) E2 (Sodic microplot) is ideal location with high representativeness and appreciable discriminating ability
• Five mega environments were identi�ed namely E2, E1, E3 and E4 with winning genotypes of G26 and E5 with winning genotypes of E7.
• G7(2107), G11(2011) and G16(2016) - the stable genotype with highest and stable mean yield
Table 25: Soil status at different locations under IVT-AL&ISTVT Trial-2018-1S.N Locations Local check Name pH EC (dS m )2
E1 Salinity Karnal CSR 27 7.5 8.0E2 Sodic Karnal CSR 36 9.8 0.4E3 GB Nagar CSR 36 9.5 0.3E4 Kurukshetra CSR 36 9.5 0.3E5 Lucknow CSR 36 9.7 0.1
Fig. 27. (a) Genotypes (b) which-won-where, (c) and “ideal genotype” of GGE biplots co n s t r u c te d u s i n g I V T genotypes tested across salt stress locations during 2018 grain yield
b) AVT-Alkaline and Inland Saline Tolerant Variety Trial-2018
The AVT-Alkaline and Inland Saline Tolerant Variety Trial (AVT-AL&ISTVT) comprising of 23 entries including check varieties (CSR 36, CSR 23 and yield check - Jaya) were tested across �ve locations in Random Block Design with three replications. The GGE analysis was carried out using 23 AVT rice genotypes for yield across the 5 locations. AVT2012, AVT 2001 and AVT2008 were the ideal genotype with highest mean yield and
64
stability (Fig. 28 a,b and c). Under salinity stress at Karnal, eleven entries outperformed -1than local check CSR 27. The entry 2015 showed the highest grain yield (3.38 t ha )
-1followed by entry 2020 (3.26 t ha ). Under sodic stress at Karnal, �fteen entries performed better than the local check CSR 36. The entry 2015 showed the highest grain
-1yield (5.20 t ha ).
Analysis of genotype by environment interaction for AVT-Alkaline and Inland Saline Tolerant Variety Trial-2017
• E4 (GB Nagar) is highly discriminating location,
• E1 (Karnal Saline MP) is ideal location with high representativeness and appreciable discriminating ability
• Five mega environments were identi�ed namely E2 with winning genotype of G7, E1, E3 and E4 with winning genotypes of G1 and G8 and E5 with winning genotype of G15
• G12, G1 and G8 - the stable genotype with highest mean yield
B. Station Trials
Monitoring, maintenance and development of breeding materials
Many salt tolerant lines were used in hybridization with high yielding varieties to enhance the genetic variation and to transfer the salt tolerance in high yielding varieties. Many
-1segregating populations (Table 26) were screened under high salinity (ECiw ~ 12 dS m ) in micro plots, sodic microlplots and �eld. The top performing progenies were selected from each segregating population for further screening/evaluation in the next cropping season.
Advancement and screening of breeding materials for salt tolerance during 2018
Different combination of crosses made during Kharif 2018 to combine the yield and salt tolerance in rice were multiplied during Kharif 2018 and same were advanced for next generation. Simultaneously, breeding materials of different generations were also screened across salt affected situations. The top 50 progenies were selected from each segregating population by considering the yield, quality, tolerance and other traits for further screening/evaluation in the next cropping season.
Development of back cross inbred lines in the back ground of Basmati CSR 30
The main aim was to develop or improve the Basmati CSR 30. Hence, we developed the BC F by crossing the Basmati CSR 30 with FL 478. We have identi�ed some lines with 1 6
Basmati back ground and salt tolerance in different duration. We evaluated 408 BILs in -1non stress and saline stress (EC ~ 8.00 dS m ) and identi�ed many line with salt tolerance iw
lines.
Fig. 28. (a) Environment, (b) which-w o n - w h e r e , ( c ) a n d “genotype” of GGE biplots c o n s t r u c t e d u s i n g AV T genotypes tested across salt stress locations during 2018
Table 26: List of generated different rice breeding materials to transfer and combine the salt tolerance
S.No. Generation of the material No. of cross combination Remarks1 F2 242 F3 2063 F5 234 F7 435 F9 24
To combine the salt tolerance
with locally adapted varieties,
high yielding varieties and
different Basmati varieties
65
Crop
Impr
ovem
ent f
or S
alin
ity, A
lkal
inity
and
Wat
erlo
gged
Str
esse
sA
nnua
l Rep
ort 2
018-
19
Performance of CSR 59 in saline stress locations
The performance of CSR 59 was consistently higher under salinity for three successive years in Haryana. It showed yield superiority of 18 % higher than national check CSR 23. The performance of CSR 59 was stable across the locations over the years with an average
-1yielding ability of 2945 kg ha (Table 27). The performance of CSR 59 was consistently high under salinity for three successive years in saline stress locations. It showed yield superiority over CSR 36 (National check), Jaya (Yield check), CSR 10, Local Check, CSR 23 and KR09003 (Qualifying Variety IET 24538).
Breeder seed production
Breeder seed of the salt tolerant rice varieties i.e., CSR 10 (1.0 q), CSR 13 (1.0 q), CSR 23 (1.0 q), CSR 27 (1.0 q), CSR 30 (15.0 q) CSR36 (10.0 q), CSR 43 (20.0 q ), CSR 46 (5.0 q), CSR49 (2.0 q), CSR52 (2.0 q), CSR56 (5.0 q), CSR60(5.0 q), was produced to meet the demand of seed producing agencies as per DAC (Department of Agriculture and Cooperation) indent during 2018.
Rice entries nominated to AICRP 2018
1. AL&ISTVT: CSR MAGIC117, CSR MAGIC153, CSR MAGIC157, CSR MAGIC160, CSR MAGIC167 and CSR MAGIC193
2. CSTVT- CSR2748 – 44, CSR RIL-06-102, CSR RIL-01-175and CSR RIL-06-103
3. Basmati trials - CSR-B-99, CSR-B-31
Molecular genetic analysis of resistance/tolerance in rice wheat chickpea and mustard including sheath blight complex genomics (Sub-project 1: Rice component) (S.L. Krishnamurthy and P.C. Sharma).
The main aim of this project is to map the important genomic regions/QTLs controlling sodicity tolerance traits in rice. This is a network project involving various components with salinity/sodicity component being dealt by ICAR-CSSRI, Karnal and genotyping by IARI, New Delhi.
Phenotyping of mapping population (Trichy1/Pusa Basmati 1) for sodicity tolerance
The salient �ndings of the systematic phenotyping of 215 recombinant inbred lines (RILs) derived from Trichy 1/Pusa Basmati 1 cross are presented. A total of 225 genotypes including 215 RILs along with parents were evaluated in replicated Simple Lattice Design in 3 environments [normal, moderate sodic (pH ~ 9.5) and high sodic (pH ~ 9.9 soil 2 2
conditions] during Kharif 2018.
Table 27: Mean performance of rice lines for yield and its contributing traits across saline stress locations -2Genotypes Days to 50% �owering Panicles m Grain yield Per cent yield
-1 t ha advantageCSR 59 94.25 240.97 2.94 KR 09003 96.44 235.39 2.50 18CSR 36 107.47 236.45 2.47 19CSR 23 96.06 260.53 2.62 12CSR 10 98.69 254.42 2.40 23Jaya 86.97 207.04 1.03 185Local check 93.28 266.10 2.52 17
66
The range, mean and per cent reduction of different traits for RIL population were recorded during 2018. High mean grain yield and other related traits performance was noticed under normal soil as compared to moderate sodic and high sodic stresses. The grain yield was the most sensitive trait and was reduced by 48.44% followed by productive tiller, total tillers per plant, plant height, spikelet fertility and panicle length under moderate sodicity stress. The grain yield was reduced by 84.82% under high sodicity stress followed by plant height, productive tiller, spikelet fertility, total tillers per plant, and panicle length. The grain yield/plant (g) ranged from 2.90 (RIL163) to 33.90 (RIL58), 1.00 (RIL6) to18.60 (RIL129) and 0.30 (RIL208) to 15.60 (RIL129) under normal, moderate sodic and high sodicity, respectively. The spikelet fertility ranged from 36.01 (RIL163) to 95.59 (RIL160), 21.03 (RIL199) to 90.63 (RIL160) and 8.39 (RIL208) to 79.27 (RIL129) under normal, moderate and high sodicity, respectively. The top 10 lines based on grain yield under normal, moderate and high sodicity stress are presented in Table 28. The top 10 lines showed less per cent reduction for grain yield under moderate and high sodicity stress (Fig. 29).
Table 28: Top 10 RILs with high grain yield per plant under normal, moderate and high sodicity stress.
S.No. Normal Moderate Sodic High Sodic 1 RIL58 33.90 RIL129 18.60 RIL129 15.602 RIL160 31.00 RIL79 17.80 RIL116 8.703 RIL117 29.00 RIL116 15.60 RIL79 8.004 RIL188 28.30 RIL158 15.50 RIL43 6.405 RIL215 28.20 RIL20 14.40 RIL141 5.506 RIL173 26.20 RIL179 13.70 RIL127 5.307 RIL30 26.00 RIL157 13.50 RIL144 5.298 RIL31 24.50 RIL159 13.50 RIL215 5.209 RIL129 24.40 RIL117 12.70 RIL82 5.1010 RIL116 24.30 RIL43 12.60 RIL130 5.10
-1Fig. 29. Performance of RIL s for grain yield plant (g) under high sodicity (pH ~ 9.9) stress2
67
Crop
Impr
ovem
ent f
or S
alin
ity, A
lkal
inity
and
Wat
erlo
gged
Str
esse
sA
nnua
l Rep
ort 2
018-
19
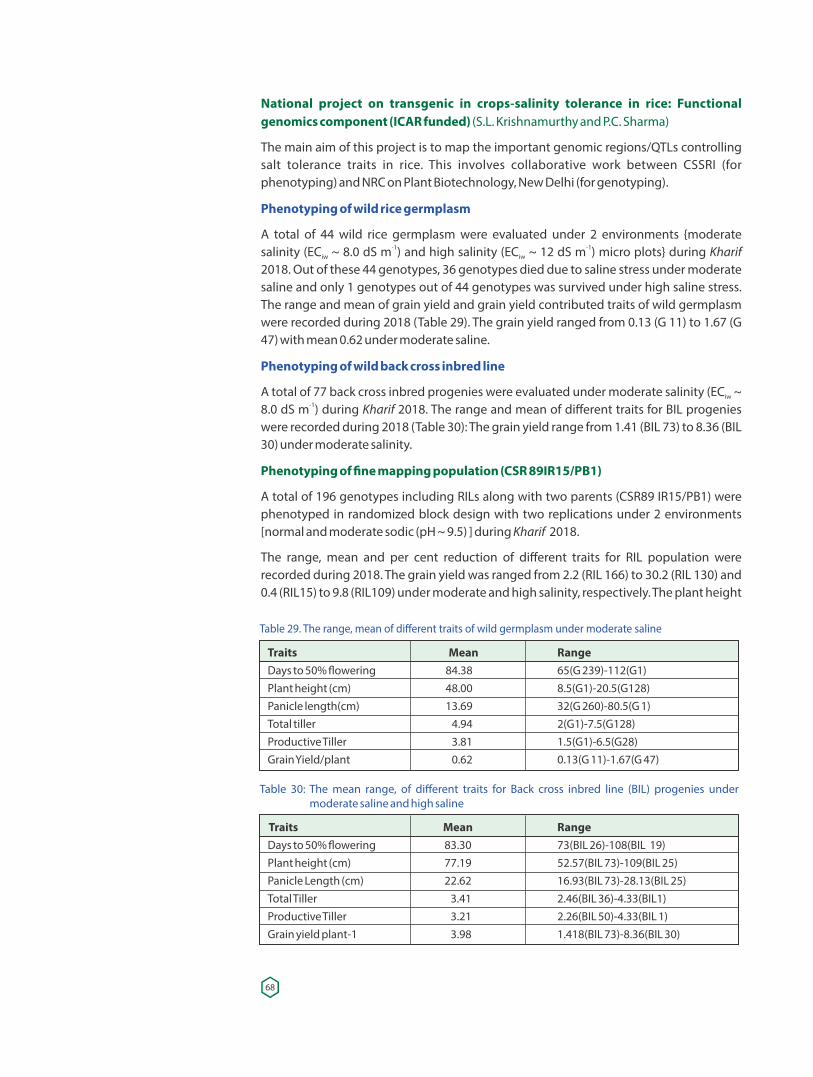
National project on transgenic in crops-salinity tolerance in rice: Functional genomics component (ICAR funded) (S.L. Krishnamurthy and P.C. Sharma)
The main aim of this project is to map the important genomic regions/QTLs controlling salt tolerance traits in rice. This involves collaborative work between CSSRI (for phenotyping) and NRC on Plant Biotechnology, New Delhi (for genotyping).
Phenotyping of wild rice germplasm
A total of 44 wild rice germplasm were evaluated under 2 environments {moderate -1 -1salinity (EC ~ 8.0 dS m ) and high salinity (EC ~ 12 dS m ) micro plots} during Kharif iw iw
2018. Out of these 44 genotypes, 36 genotypes died due to saline stress under moderate saline and only 1 genotypes out of 44 genotypes was survived under high saline stress. The range and mean of grain yield and grain yield contributed traits of wild germplasm were recorded during 2018 (Table 29). The grain yield ranged from 0.13 (G 11) to 1.67 (G 47) with mean 0.62 under moderate saline.
Phenotyping of wild back cross inbred line
A total of 77 back cross inbred progenies were evaluated under moderate salinity (EC ~ iw-18.0 dS m ) during Kharif 2018. The range and mean of different traits for BIL progenies
were recorded during 2018 (Table 30): The grain yield range from 1.41 (BIL 73) to 8.36 (BIL 30) under moderate salinity.
Phenotyping of �ne mapping population (CSR 89IR15/PB1)
A total of 196 genotypes including RILs along with two parents (CSR89 IR15/PB1) were phenotyped in randomized block design with two replications under 2 environments [normal and moderate sodic (pH ~ 9.5) ] during Kharif 2018.
The range, mean and per cent reduction of different traits for RIL population were recorded during 2018. The grain yield was ranged from 2.2 (RIL 166) to 30.2 (RIL 130) and 0.4 (RIL15) to 9.8 (RIL109) under moderate and high salinity, respectively. The plant height
Table 29. The range, mean of different traits of wild germplasm under moderate saline
Traits Mean Range Days to 50% �owering 84.38 65(G 239)-112(G1)Plant height (cm) 48.00 8.5(G1)-20.5(G128)Panicle length(cm) 13.69 32(G 260)-80.5(G 1)Total tiller 4.94 2(G1)-7.5(G128)Productive Tiller 3.81 1.5(G1)-6.5(G28)Grain Yield/plant 0.62 0.13(G 11)-1.67(G 47)
Table 30: The mean range, of different traits for Back cross inbred line (BIL) progenies under moderate saline and high saline
Traits Mean Range Days to 50% �owering 83.30 73(BIL 26)-108(BIL 19)Plant height (cm) 77.19 52.57(BIL 73)-109(BIL 25)Panicle Length (cm) 22.62 16.93(BIL 73)-28.13(BIL 25)Total Tiller 3.41 2.46(BIL 36)-4.33(BIL1)Productive Tiller 3.21 2.26(BIL 50)-4.33(BIL 1)Grain yield plant-1 3.98 1.418(BIL 73)-8.36(BIL 30)
68
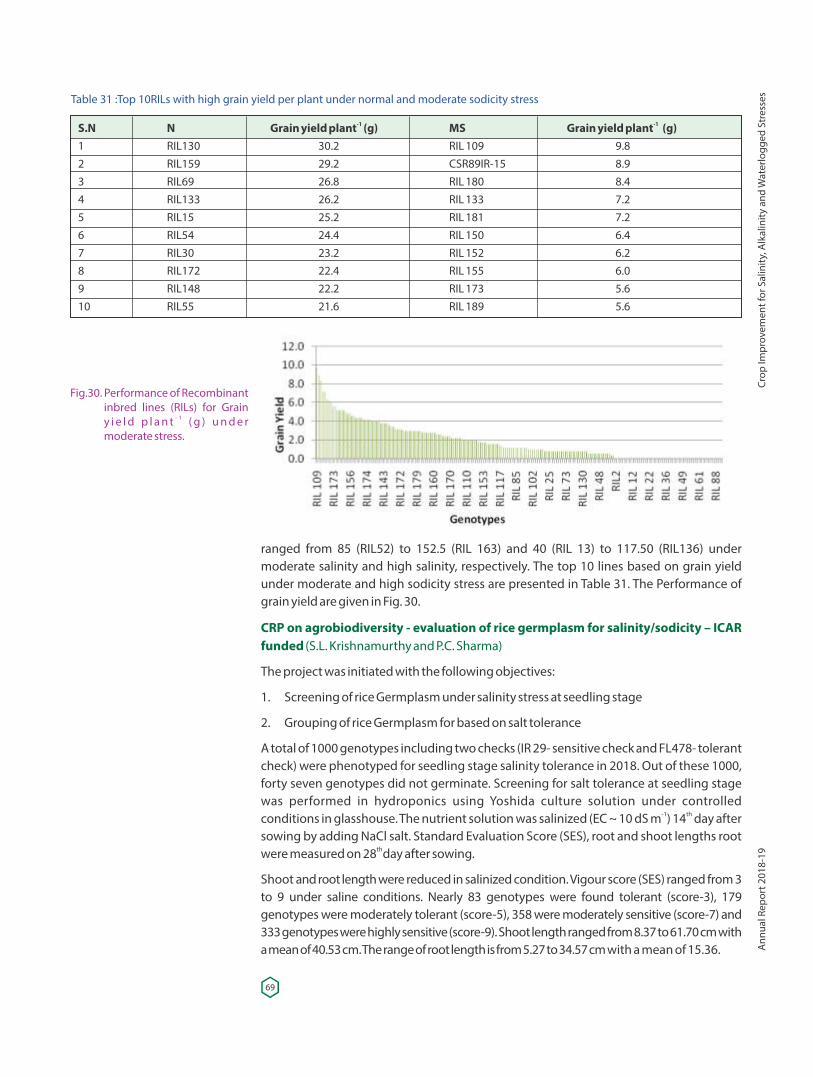
ranged from 85 (RIL52) to 152.5 (RIL 163) and 40 (RIL 13) to 117.50 (RIL136) under moderate salinity and high salinity, respectively. The top 10 lines based on grain yield under moderate and high sodicity stress are presented in Table 31. The Performance of grain yield are given in Fig. 30.
CRP on agrobiodiversity - evaluation of rice germplasm for salinity/sodicity – ICAR funded (S.L. Krishnamurthy and P.C. Sharma)
The project was initiated with the following objectives:
1. Screening of rice Germplasm under salinity stress at seedling stage
2. Grouping of rice Germplasm for based on salt tolerance
A total of 1000 genotypes including two checks (IR 29- sensitive check and FL478- tolerant check) were phenotyped for seedling stage salinity tolerance in 2018. Out of these 1000, forty seven genotypes did not germinate. Screening for salt tolerance at seedling stage was performed in hydroponics using Yoshida culture solution under controlled
-1 thconditions in glasshouse. The nutrient solution was salinized (EC ~ 10 dS m ) 14 day after sowing by adding NaCl salt. Standard Evaluation Score (SES), root and shoot lengths root
th were measured on 28 day after sowing.
Shoot and root length were reduced in salinized condition. Vigour score (SES) ranged from 3 to 9 under saline conditions. Nearly 83 genotypes were found tolerant (score-3), 179 genotypes were moderately tolerant (score-5), 358 were moderately sensitive (score-7) and 333 genotypes were highly sensitive (score-9). Shoot length ranged from 8.37 to 61.70 cm with a mean of 40.53 cm. The range of root length is from 5.27 to 34.57 cm with a mean of 15.36.
Table 31 :Top 10RILs with high grain yield per plant under normal and moderate sodicity stress
-1 -1S.N N Grain yield plant (g) MS Grain yield plant (g) 1 RIL130 30.2 RIL 109 9.82 RIL159 29.2 CSR89IR-15 8.93 RIL69 26.8 RIL 180 8.44 RIL133 26.2 RIL 133 7.25 RIL15 25.2 RIL 181 7.26 RIL54 24.4 RIL 150 6.47 RIL30 23.2 RIL 152 6.28 RIL172 22.4 RIL 155 6.09 RIL148 22.2 RIL 173 5.610 RIL55 21.6 RIL 189 5.6
Fig.30. Performance of Recombinant inbred lines (RILs) for Grain
- 1y i e l d p l a n t ( g ) u n d e r moderate stress.
69
Crop
Impr
ovem
ent f
or S
alin
ity, A
lkal
inity
and
Wat
erlo
gged
Str
esse
sA
nnua
l Rep
ort 2
018-
19
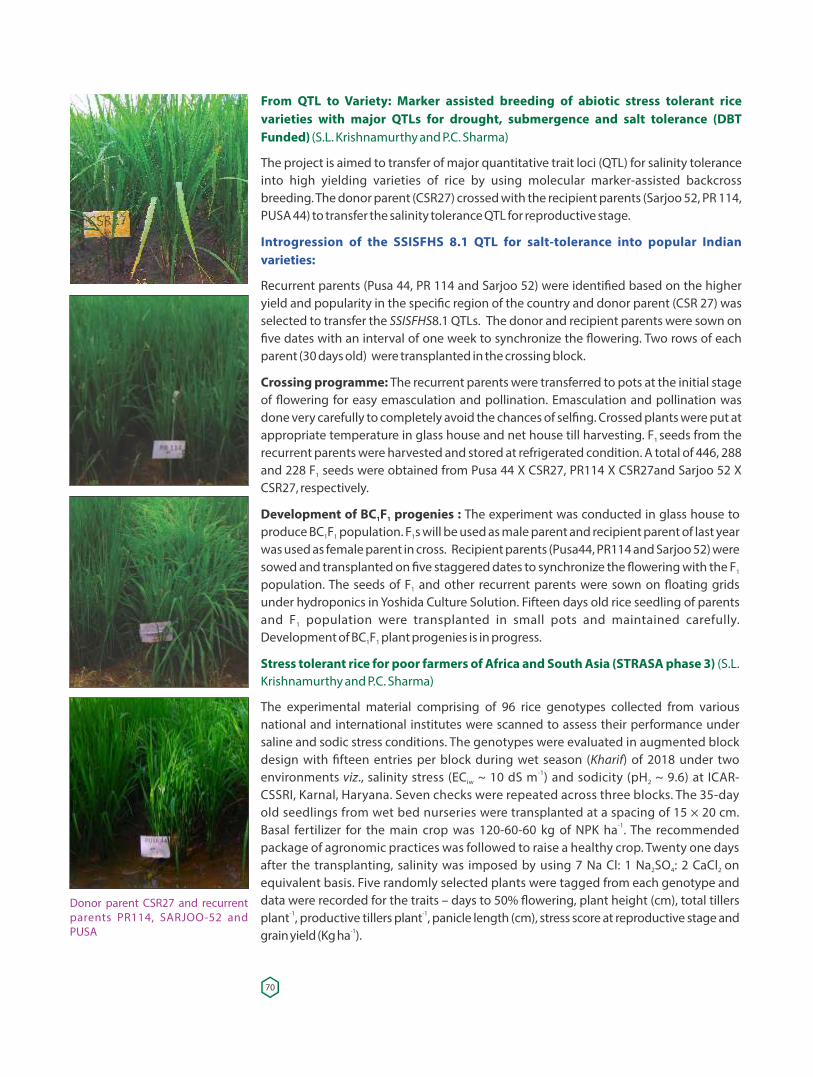
From QTL to Variety: Marker assisted breeding of abiotic stress tolerant rice varieties with major QTLs for drought, submergence and salt tolerance (DBT Funded) (S.L. Krishnamurthy and P.C. Sharma)
The project is aimed to transfer of major quantitative trait loci (QTL) for salinity tolerance into high yielding varieties of rice by using molecular marker-assisted backcross breeding. The donor parent (CSR27) crossed with the recipient parents (Sarjoo 52, PR 114, PUSA 44) to transfer the salinity tolerance QTL for reproductive stage.
Introgression of the SSISFHS 8.1 QTL for salt-tolerance into popular Indian varieties:
Recurrent parents (Pusa 44, PR 114 and Sarjoo 52) were identi�ed based on the higher yield and popularity in the speci�c region of the country and donor parent (CSR 27) was selected to transfer the SSISFHS8.1 QTLs. The donor and recipient parents were sown on �ve dates with an interval of one week to synchronize the �owering. Two rows of each parent (30 days old) were transplanted in the crossing block.
Crossing programme: The recurrent parents were transferred to pots at the initial stage of �owering for easy emasculation and pollination. Emasculation and pollination was done very carefully to completely avoid the chances of sel�ng. Crossed plants were put at appropriate temperature in glass house and net house till harvesting. F seeds from the 1
recurrent parents were harvested and stored at refrigerated condition. A total of 446, 288 and 228 F seeds were obtained from Pusa 44 X CSR27, PR114 X CSR27and Sarjoo 52 X 1
CSR27, respectively.
Development of BC F progenies : The experiment was conducted in glass house to 1 1
produce BC F population. F s will be used as male parent and recipient parent of last year 1 1 1
was used as female parent in cross. Recipient parents (Pusa44, PR114 and Sarjoo 52) were sowed and transplanted on �ve staggered dates to synchronize the �owering with the F 1
population. The seeds of F and other recurrent parents were sown on �oating grids 1
under hydroponics in Yoshida Culture Solution. Fifteen days old rice seedling of parents and F population were transplanted in small pots and maintained carefully. 1
Development of BC F plant progenies is in progress.1 1
Stress tolerant rice for poor farmers of Africa and South Asia (STRASA phase 3) (S.L. Krishnamurthy and P.C. Sharma)
The experimental material comprising of 96 rice genotypes collected from various national and international institutes were scanned to assess their performance under saline and sodic stress conditions. The genotypes were evaluated in augmented block design with �fteen entries per block during wet season (Kharif) of 2018 under two
-1environments viz., salinity stress (EC ~ 10 dS m ) and sodicity (pH ~ 9.6) at ICAR-iw 2
CSSRI, Karnal, Haryana. Seven checks were repeated across three blocks. The 35-day old seedlings from wet bed nurseries were transplanted at a spacing of 15 × 20 cm.
-1Basal fertilizer for the main crop was 120-60-60 kg of NPK ha . The recommended package of agronomic practices was followed to raise a healthy crop. Twenty one days after the transplanting, salinity was imposed by using 7 Na Cl: 1 Na SO : 2 CaCl on 2 4 2
equivalent basis. Five randomly selected plants were tagged from each genotype and data were recorded for the traits – days to 50% �owering, plant height (cm), total tillers
-1 -1plant , productive tillers plant , panicle length (cm), stress score at reproductive stage and -1grain yield (Kg ha ).
Donor parent CSR27 and recurrent parents PR114, SARJOO-52 and PUSA
70
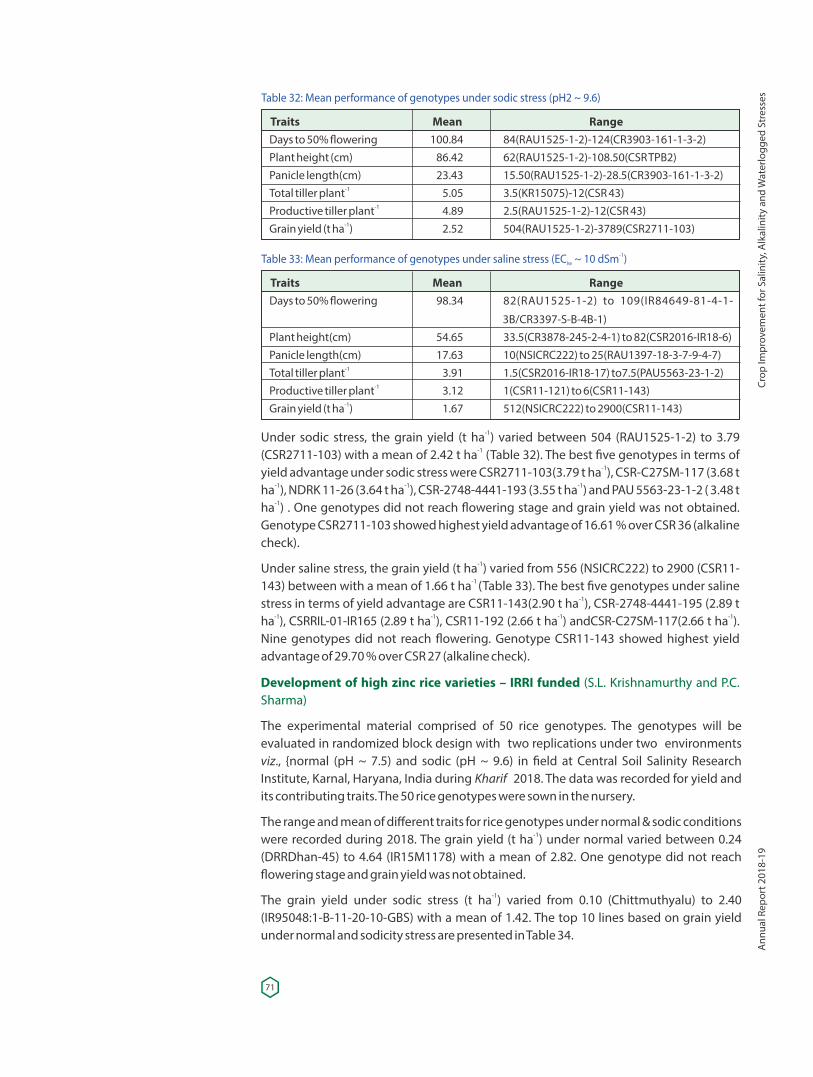
-1Under sodic stress, the grain yield (t ha ) varied between 504 (RAU1525-1-2) to 3.79 -1(CSR2711-103) with a mean of 2.42 t ha (Table 32). The best �ve genotypes in terms of
-1yield advantage under sodic stress were CSR2711-103(3.79 t ha ), CSR-C27SM-117 (3.68 t -1 -1 -1ha ), NDRK 11-26 (3.64 t ha ), CSR-2748-4441-193 (3.55 t ha ) and PAU 5563-23-1-2 ( 3.48 t -1ha ) . One genotypes did not reach �owering stage and grain yield was not obtained.
Genotype CSR2711-103 showed highest yield advantage of 16.61 % over CSR 36 (alkaline check).
-1Under saline stress, the grain yield (t ha ) varied from 556 (NSICRC222) to 2900 (CSR11--1 143) between with a mean of 1.66 t ha (Table 33). The best �ve genotypes under saline
-1stress in terms of yield advantage are CSR11-143(2.90 t ha ), CSR-2748-4441-195 (2.89 t -1 -1 -1 -1ha ), CSRRIL-01-IR165 (2.89 t ha ), CSR11-192 (2.66 t ha ) andCSR-C27SM-117(2.66 t ha ).
Nine genotypes did not reach �owering. Genotype CSR11-143 showed highest yield advantage of 29.70 % over CSR 27 (alkaline check).
Development of high zinc rice varieties – IRRI funded (S.L. Krishnamurthy and P.C. Sharma)
The experimental material comprised of 50 rice genotypes. The genotypes will be evaluated in randomized block design with two replications under two environments viz., {normal (pH ~ 7.5) and sodic (pH ~ 9.6) in �eld at Central Soil Salinity Research Institute, Karnal, Haryana, India during Kharif 2018. The data was recorded for yield and its contributing traits. The 50 rice genotypes were sown in the nursery.
The range and mean of different traits for rice genotypes under normal & sodic conditions -1were recorded during 2018. The grain yield (t ha ) under normal varied between 0.24
(DRRDhan-45) to 4.64 (IR15M1178) with a mean of 2.82. One genotype did not reach �owering stage and grain yield was not obtained.
-1The grain yield under sodic stress (t ha ) varied from 0.10 (Chittmuthyalu) to 2.40 (IR95048:1-B-11-20-10-GBS) with a mean of 1.42. The top 10 lines based on grain yield under normal and sodicity stress are presented in Table 34.
Table 32: Mean performance of genotypes under sodic stress (pH2 ~ 9.6)
Traits Mean RangeDays to 50% �owering 100.84 84(RAU1525-1-2)-124(CR3903-161-1-3-2)Plant height (cm) 86.42 62(RAU1525-1-2)-108.50(CSR TPB2)Panicle length(cm) 23.43 15.50(RAU1525-1-2)-28.5(CR3903-161-1-3-2)
-1Total tiller plant 5.05 3.5(KR15075)-12(CSR 43)-1Productive tiller plant 4.89 2.5(RAU1525-1-2)-12(CSR 43)
-1Grain yield (t ha ) 2.52 504(RAU1525-1-2)-3789(CSR2711-103)
-1Table 33: Mean performance of genotypes under saline stress (EC ~ 10 dSm )iw
Traits Mean RangeDays to 50% �owering 98.34 82(RAU1525-1-2) to 109(IR84649-81-4-1-
3B/CR3397-S-B-4B-1) Plant height(cm) 54.65 33.5(CR3878-245-2-4-1) to 82(CSR2016-IR18-6) Panicle length(cm) 17.63 10(NSICRC222) to 25(RAU1397-18-3-7-9-4-7)
-1Total tiller plant 3.91 1.5(CSR2016-IR18-17) to7.5(PAU5563-23-1-2) -1Productive tiller plant 3.12 1(CSR11-121) to 6(CSR11-143)
-1Grain yield (t ha ) 1.67 512(NSICRC222) to 2900(CSR11-143)
71
Crop
Impr
ovem
ent f
or S
alin
ity, A
lkal
inity
and
Wat
erlo
gged
Str
esse
sA
nnua
l Rep
ort 2
018-
19
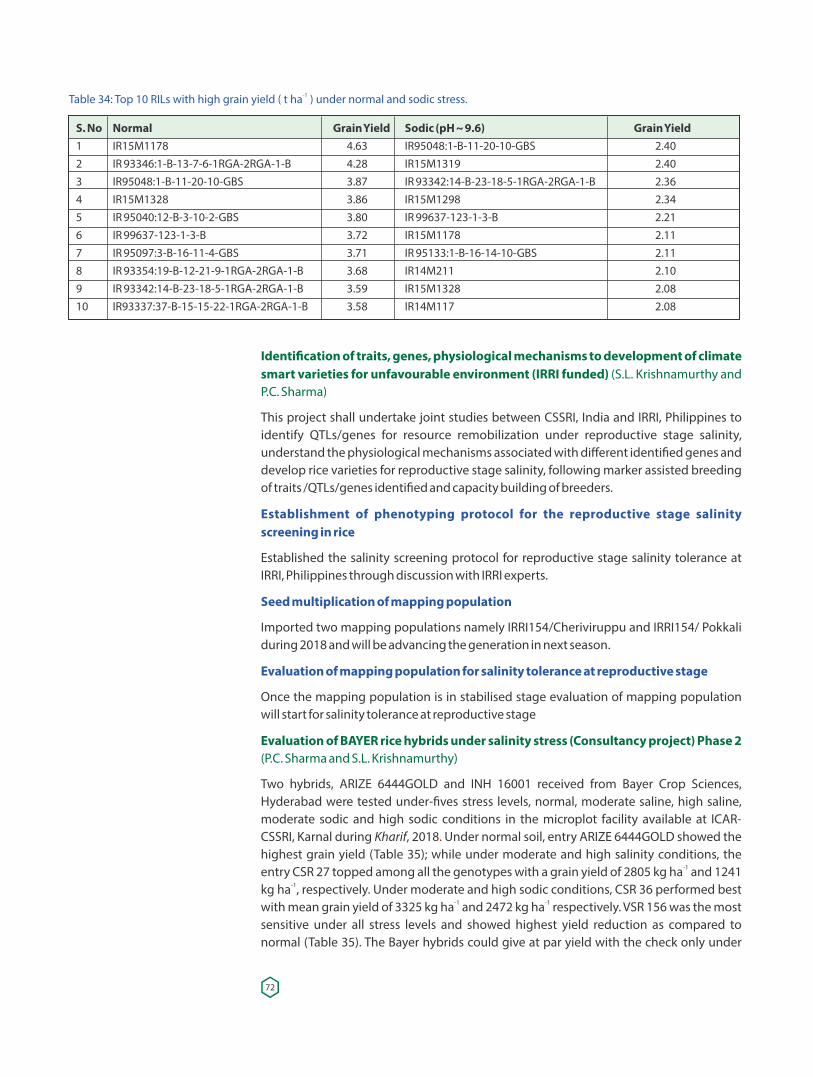
-1Table 34: Top 10 RILs with high grain yield ( t ha ) under normal and sodic stress.
S. No Normal Grain Yield Sodic (pH ~ 9.6) Grain Yield 1 IR15M1178 4.63 IR95048:1-B-11-20-10-GBS 2.402 IR 93346:1-B-13-7-6-1RGA-2RGA-1-B 4.28 IR15M1319 2.403 IR95048:1-B-11-20-10-GBS 3.87 IR 93342:14-B-23-18-5-1RGA-2RGA-1-B 2.364 IR15M1328 3.86 IR15M1298 2.345 IR 95040:12-B-3-10-2-GBS 3.80 IR 99637-123-1-3-B 2.216 IR 99637-123-1-3-B 3.72 IR15M1178 2.117 IR 95097:3-B-16-11-4-GBS 3.71 IR 95133:1-B-16-14-10-GBS 2.118 IR 93354:19-B-12-21-9-1RGA-2RGA-1-B 3.68 IR14M211 2.109 IR 93342:14-B-23-18-5-1RGA-2RGA-1-B 3.59 IR15M1328 2.0810 IR93337:37-B-15-15-22-1RGA-2RGA-1-B 3.58 IR14M117 2.08
Identi�cation of traits, genes, physiological mechanisms to development of climate smart varieties for unfavourable environment (IRRI funded) (S.L. Krishnamurthy and P.C. Sharma)
This project shall undertake joint studies between CSSRI, India and IRRI, Philippines to identify QTLs/genes for resource remobilization under reproductive stage salinity, understand the physiological mechanisms associated with different identi�ed genes and develop rice varieties for reproductive stage salinity, following marker assisted breeding of traits /QTLs/genes identi�ed and capacity building of breeders.
Establishment of phenotyping protocol for the reproductive stage salinity screening in rice
Established the salinity screening protocol for reproductive stage salinity tolerance at IRRI, Philippines through discussion with IRRI experts.
Seed multiplication of mapping population
Imported two mapping populations namely IRRI154/Cheriviruppu and IRRI154/ Pokkali during 2018 and will be advancing the generation in next season.
Evaluation of mapping population for salinity tolerance at reproductive stage
Once the mapping population is in stabilised stage evaluation of mapping population will start for salinity tolerance at reproductive stage
Evaluation of BAYER rice hybrids under salinity stress (Consultancy project) Phase 2 (P.C. Sharma and S.L. Krishnamurthy)
Two hybrids, ARIZE 6444GOLD and INH 16001 received from Bayer Crop Sciences, Hyderabad were tested under-�ves stress levels, normal, moderate saline, high saline, moderate sodic and high sodic conditions in the microplot facility available at ICAR-CSSRI, Karnal during Kharif, 2018 Under normal soil, entry ARIZE 6444GOLD showed the . highest grain yield (Table 35); while under moderate and high salinity conditions, the
-1entry CSR 27 topped among all the genotypes with a grain yield of 2805 kg ha and 1241 -1kg ha , respectively. Under moderate and high sodic conditions, CSR 36 performed best
-1 -1with mean grain yield of 3325 kg ha and 2472 kg ha respectively. VSR 156 was the most sensitive under all stress levels and showed highest yield reduction as compared to normal (Table 35). The Bayer hybrids could give at par yield with the check only under
72
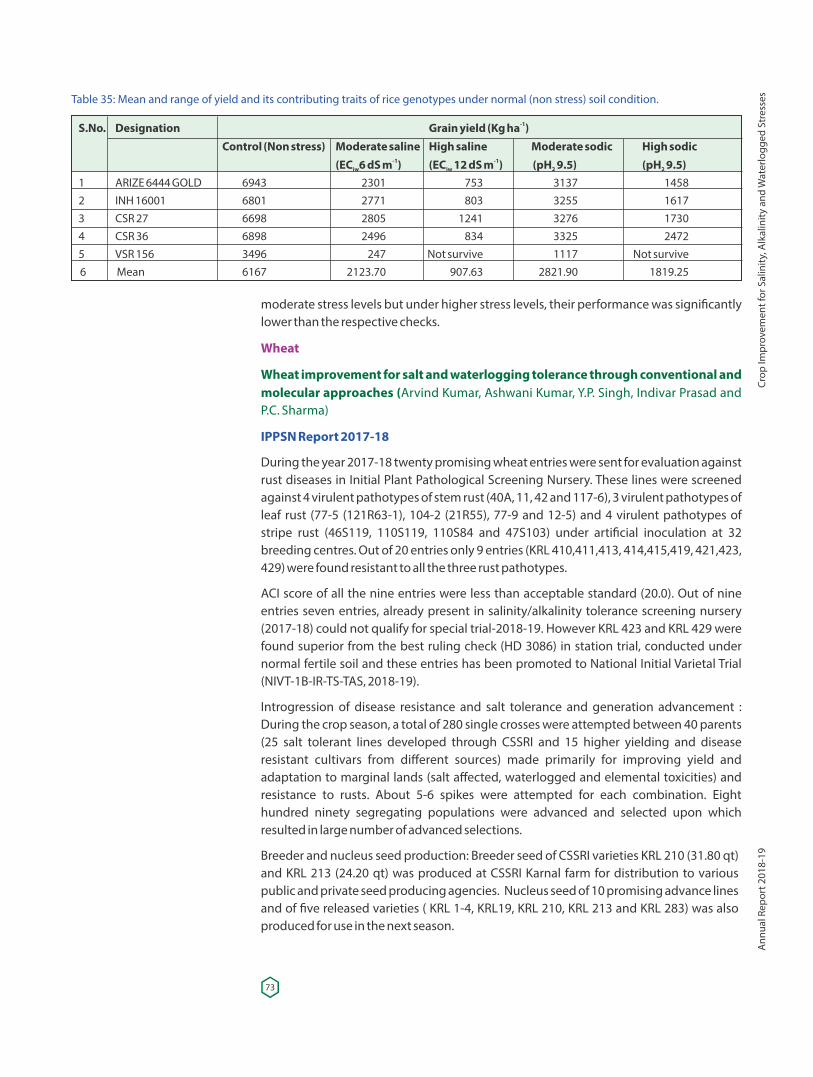
moderate stress levels but under higher stress levels, their performance was signi�cantly lower than the respective checks.
Wheat
Wheat improvement for salt and waterlogging tolerance through conventional and molecular approaches (Arvind Kumar, Ashwani Kumar, Y.P. Singh, Indivar Prasad and P.C. Sharma)
IPPSN Report 2017-18
During the year 2017-18 twenty promising wheat entries were sent for evaluation against rust diseases in Initial Plant Pathological Screening Nursery. These lines were screened against 4 virulent pathotypes of stem rust (40A, 11, 42 and 117-6), 3 virulent pathotypes of leaf rust (77-5 (121R63-1), 104-2 (21R55), 77-9 and 12-5) and 4 virulent pathotypes of stripe rust (46S119, 110S119, 110S84 and 47S103) under arti�cial inoculation at 32 breeding centres. Out of 20 entries only 9 entries (KRL 410,411,413, 414,415,419, 421,423, 429) were found resistant to all the three rust pathotypes.
ACI score of all the nine entries were less than acceptable standard (20.0). Out of nine entries seven entries, already present in salinity/alkalinity tolerance screening nursery (2017-18) could not qualify for special trial-2018-19. However KRL 423 and KRL 429 were found superior from the best ruling check (HD 3086) in station trial, conducted under normal fertile soil and these entries has been promoted to National Initial Varietal Trial (NIVT-1B-IR-TS-TAS, 2018-19).
Introgression of disease resistance and salt tolerance and generation advancement : During the crop season, a total of 280 single crosses were attempted between 40 parents (25 salt tolerant lines developed through CSSRI and 15 higher yielding and disease resistant cultivars from different sources) made primarily for improving yield and adaptation to marginal lands (salt affected, waterlogged and elemental toxicities) and resistance to rusts. About 5-6 spikes were attempted for each combination. Eight hundred ninety segregating populations were advanced and selected upon which resulted in large number of advanced selections.
Breeder and nucleus seed production: Breeder seed of CSSRI varieties KRL 210 (31.80 qt) and KRL 213 (24.20 qt) was produced at CSSRI Karnal farm for distribution to various public and private seed producing agencies. Nucleus seed of 10 promising advance lines and of �ve released varieties ( KRL 1-4, KRL19, KRL 210, KRL 213 and KRL 283) was also produced for use in the next season.
Table 35: Mean and range of yield and its contributing traits of rice genotypes under normal (non stress) soil condition.
-1S.No. Designation Grain yield (Kg ha ) Control (Non stress) Moderate saline High saline Moderate sodic High sodic
-1 -1 (EC 6 dS m ) (EC 12 dS m ) (pH 9.5) (pH 9.5)iw iw 2 2
1 ARIZE 6444 GOLD 6943 2301 753 3137 14582 INH 16001 6801 2771 803 3255 16173 CSR 27 6698 2805 1241 3276 17304 CSR 36 6898 2496 834 3325 24725 VSR 156 3496 247 Not survive 1117 Not survive 6 Mean 6167 2123.70 907.63 2821.90 1819.25
73
Crop
Impr
ovem
ent f
or S
alin
ity, A
lkal
inity
and
Wat
erlo
gged
Str
esse
sA
nnua
l Rep
ort 2
018-
19
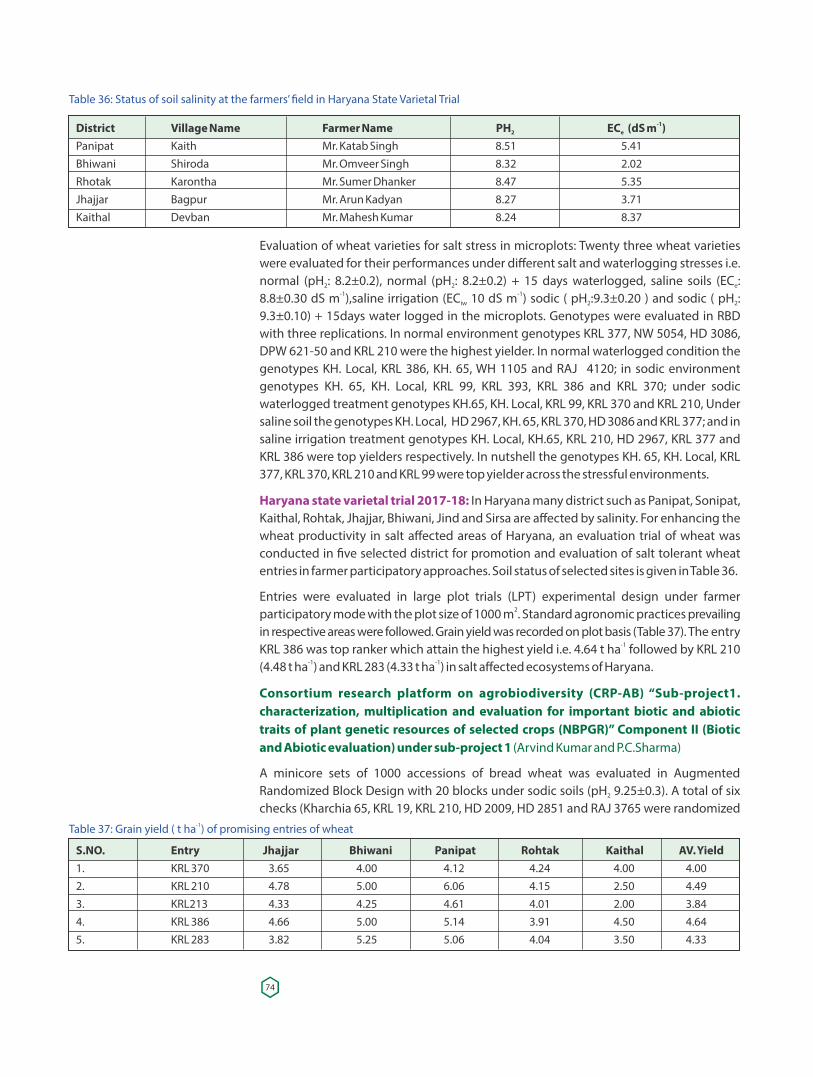
Evaluation of wheat varieties for salt stress in microplots: Twenty three wheat varieties were evaluated for their performances under different salt and waterlogging stresses i.e. normal (pH : 8.2±0.2), normal (pH : 8.2±0.2) + 15 days waterlogged, saline soils (EC : 2 2 e
-1 -18.8±0.30 dS m ),saline irrigation (EC 10 dS m ) sodic ( pH :9.3±0.20 ) and sodic ( pH : iw 2 2
9.3±0.10) + 15days water logged in the microplots. Genotypes were evaluated in RBD with three replications. In normal environment genotypes KRL 377, NW 5054, HD 3086, DPW 621-50 and KRL 210 were the highest yielder. In normal waterlogged condition the genotypes KH. Local, KRL 386, KH. 65, WH 1105 and RAJ 4120; in sodic environment genotypes KH. 65, KH. Local, KRL 99, KRL 393, KRL 386 and KRL 370; under sodic waterlogged treatment genotypes KH.65, KH. Local, KRL 99, KRL 370 and KRL 210, Under saline soil the genotypes KH. Local, HD 2967, KH. 65, KRL 370, HD 3086 and KRL 377; and in saline irrigation treatment genotypes KH. Local, KH.65, KRL 210, HD 2967, KRL 377 and KRL 386 were top yielders respectively. In nutshell the genotypes KH. 65, KH. Local, KRL 377, KRL 370, KRL 210 and KRL 99 were top yielder across the stressful environments.
Haryana state varietal trial 2017-18: In Haryana many district such as Panipat, Sonipat, Kaithal, Rohtak, Jhajjar, Bhiwani, Jind and Sirsa are affected by salinity. For enhancing the wheat productivity in salt affected areas of Haryana, an evaluation trial of wheat was conducted in �ve selected district for promotion and evaluation of salt tolerant wheat entries in farmer participatory approaches. Soil status of selected sites is given in Table 36.
Entries were evaluated in large plot trials (LPT) experimental design under farmer 2participatory mode with the plot size of 1000 m . Standard agronomic practices prevailing
in respective areas were followed. Grain yield was recorded on plot basis (Table 37). The entry -1KRL 386 was top ranker which attain the highest yield i.e. 4.64 t ha followed by KRL 210
-1 -1(4.48 t ha ) and KRL 283 (4.33 t ha ) in salt affected ecosystems of Haryana.
Consortium research platform on agrobiodiversity (CRP-AB) “Sub-project1. characterization, multiplication and evaluation for important biotic and abiotic traits of plant genetic resources of selected crops (NBPGR)” Component II (Biotic and Abiotic evaluation) under sub-project 1 (Arvind Kumar and P.C.Sharma)
A minicore sets of 1000 accessions of bread wheat was evaluated in Augmented Randomized Block Design with 20 blocks under sodic soils (pH 9.25±0.3). A total of six 2
checks (Kharchia 65, KRL 19, KRL 210, HD 2009, HD 2851 and RAJ 3765 were randomized
Table 36: Status of soil salinity at the farmers’ �eld in Haryana State Varietal Trial
-1District Village Name Farmer Name PH EC (dS m )2 e
Panipat Kaith Mr. Katab Singh 8.51 5.41Bhiwani Shiroda Mr. Omveer Singh 8.32 2.02Rhotak Karontha Mr. Sumer Dhanker 8.47 5.35Jhajjar Bagpur Mr. Arun Kadyan 8.27 3.71Kaithal Devban Mr. Mahesh Kumar 8.24 8.37
-1Table 37: Grain yield ( t ha ) of promising entries of wheat
S.NO. Entry Jhajjar Bhiwani Panipat Rohtak Kaithal AV. Yield1. KRL 370 3.65 4.00 4.12 4.24 4.00 4.002. KRL 210 4.78 5.00 6.06 4.15 2.50 4.493. KRL213 4.33 4.25 4.61 4.01 2.00 3.844. KRL 386 4.66 5.00 5.14 3.91 4.50 4.645. KRL 283 3.82 5.25 5.06 4.04 3.50 4.33
74
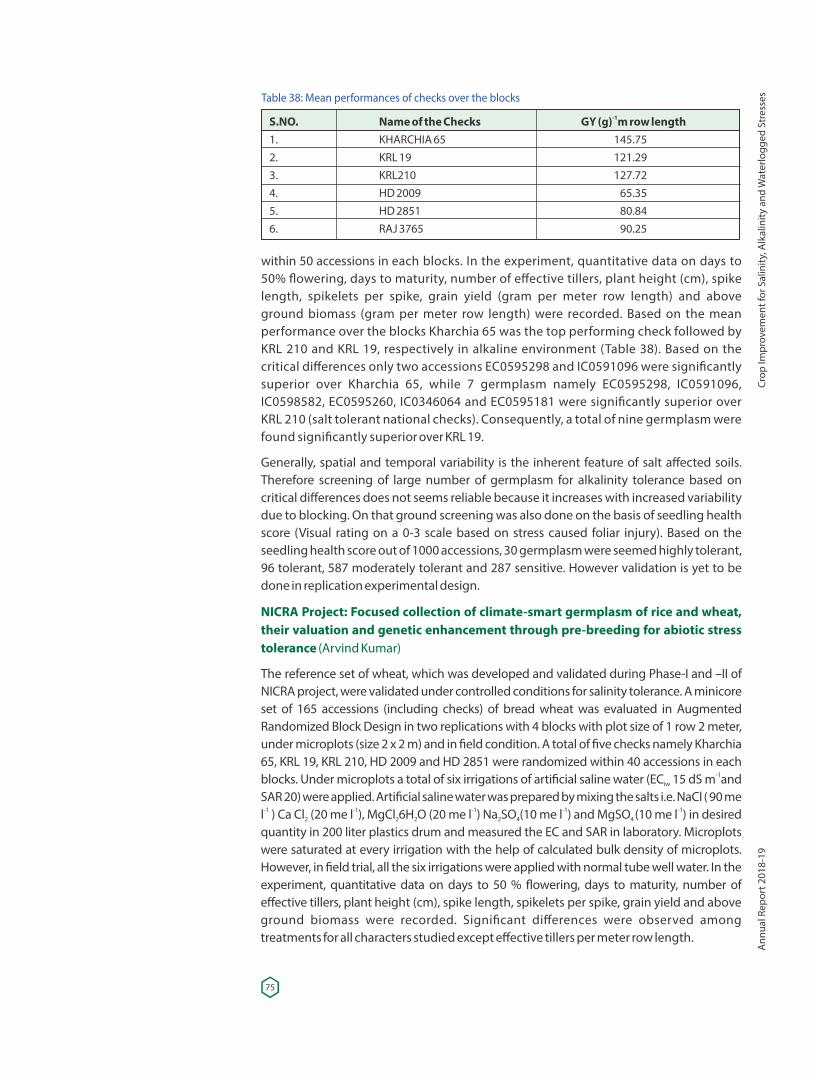
within 50 accessions in each blocks. In the experiment, quantitative data on days to 50% �owering, days to maturity, number of effective tillers, plant height (cm), spike length, spikelets per spike, grain yield (gram per meter row length) and above ground biomass (gram per meter row length) were recorded. Based on the mean performance over the blocks Kharchia 65 was the top performing check followed by KRL 210 and KRL 19, respectively in alkaline environment (Table 38). Based on the critical differences only two accessions EC0595298 and IC0591096 were signi�cantly superior over Kharchia 65, while 7 germplasm namely EC0595298, IC0591096, IC0598582, EC0595260, IC0346064 and EC0595181 were signi�cantly superior over KRL 210 (salt tolerant national checks). Consequently, a total of nine germplasm were found signi�cantly superior over KRL 19.
Generally, spatial and temporal variability is the inherent feature of salt affected soils. Therefore screening of large number of germplasm for alkalinity tolerance based on critical differences does not seems reliable because it increases with increased variability due to blocking. On that ground screening was also done on the basis of seedling health score (Visual rating on a 0-3 scale based on stress caused foliar injury). Based on the seedling health score out of 1000 accessions, 30 germplasm were seemed highly tolerant, 96 tolerant, 587 moderately tolerant and 287 sensitive. However validation is yet to be done in replication experimental design.
NICRA Project: Focused collection of climate-smart germplasm of rice and wheat, their valuation and genetic enhancement through pre-breeding for abiotic stress tolerance (Arvind Kumar)
The reference set of wheat, which was developed and validated during Phase-I and –II of NICRA project, were validated under controlled conditions for salinity tolerance. A minicore set of 165 accessions (including checks) of bread wheat was evaluated in Augmented Randomized Block Design in two replications with 4 blocks with plot size of 1 row 2 meter, under microplots (size 2 x 2 m) and in �eld condition. A total of �ve checks namely Kharchia 65, KRL 19, KRL 210, HD 2009 and HD 2851 were randomized within 40 accessions in each
-1blocks. Under microplots a total of six irrigations of arti�cial saline water (EC 15 dS m and iw
SAR 20) were applied. Arti�cial saline water was prepared by mixing the salts i.e. NaCl ( 90 me -1 -1 -1 -1 -1l ) Ca Cl (20 me l ), MgCl 6H O (20 me l ) Na SO (10 me l ) and MgSO (10 me l ) in desired 2 2 2 2 4 4
quantity in 200 liter plastics drum and measured the EC and SAR in laboratory. Microplots were saturated at every irrigation with the help of calculated bulk density of microplots. However, in �eld trial, all the six irrigations were applied with normal tube well water. In the experiment, quantitative data on days to 50 % �owering, days to maturity, number of effective tillers, plant height (cm), spike length, spikelets per spike, grain yield and above ground biomass were recorded. Signi�cant differences were observed among treatments for all characters studied except effective tillers per meter row length.
Table 38: Mean performances of checks over the blocks-1S.NO. Name of the Checks GY (g) m row length
1. KHARCHIA 65 145.752. KRL 19 121.293. KRL210 127.724. HD 2009 65.355. HD 2851 80.846. RAJ 3765 90.25
75
Crop
Impr
ovem
ent f
or S
alin
ity, A
lkal
inity
and
Wat
erlo
gged
Str
esse
sA
nnua
l Rep
ort 2
018-
19
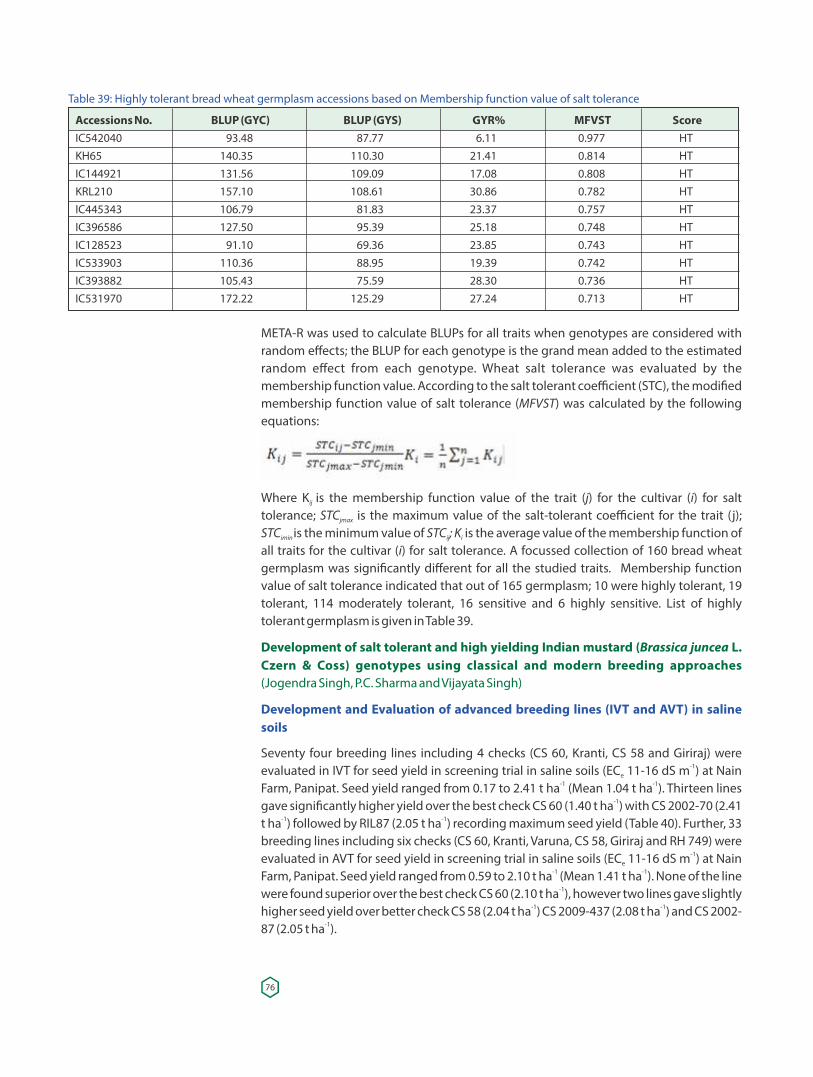
META-R was used to calculate BLUPs for all traits when genotypes are considered with random effects; the BLUP for each genotype is the grand mean added to the estimated random effect from each genotype. Wheat salt tolerance was evaluated by the membership function value. According to the salt tolerant coefficient (STC), the modi�ed membership function value of salt tolerance (MFVST) was calculated by the following equations:
Where K is the membership function value of the trait (j) for the cultivar (i) for salt ij
tolerance; STC is the maximum value of the salt-tolerant coefficient for the trait (j); jmax
STC is the minimum value of STC ; K is the average value of the membership function of imin ij i
all traits for the cultivar (i) for salt tolerance. A focussed collection of 160 bread wheat germplasm was signi�cantly different for all the studied traits. Membership function value of salt tolerance indicated that out of 165 germplasm; 10 were highly tolerant, 19 tolerant, 114 moderately tolerant, 16 sensitive and 6 highly sensitive. List of highly tolerant germplasm is given in Table 39.
Development of salt tolerant and high yielding Indian mustard (Brassica juncea L. Czern & Coss) genotypes using classical and modern breeding approaches (Jogendra Singh, P.C. Sharma and Vijayata Singh)
Development and Evaluation of advanced breeding lines (IVT and AVT) in saline soils
Seventy four breeding lines including 4 checks (CS 60, Kranti, CS 58 and Giriraj) were -1evaluated in IVT for seed yield in screening trial in saline soils (EC 11-16 dS m ) at Nain e
-1 -1Farm, Panipat. Seed yield ranged from 0.17 to 2.41 t ha (Mean 1.04 t ha ). Thirteen lines -1gave signi�cantly higher yield over the best check CS 60 (1.40 t ha ) with CS 2002-70 (2.41
-1 -1t ha ) followed by RIL87 (2.05 t ha ) recording maximum seed yield (Table 40). Further, 33 breeding lines including six checks (CS 60, Kranti, Varuna, CS 58, Giriraj and RH 749) were
-1evaluated in AVT for seed yield in screening trial in saline soils (EC 11-16 dS m ) at Nain e-1 -1Farm, Panipat. Seed yield ranged from 0.59 to 2.10 t ha (Mean 1.41 t ha ). None of the line
-1were found superior over the best check CS 60 (2.10 t ha ), however two lines gave slightly -1 -1higher seed yield over better check CS 58 (2.04 t ha ) CS 2009-437 (2.08 t ha ) and CS 2002-
-187 (2.05 t ha ).
Table 39: Highly tolerant bread wheat germplasm accessions based on Membership function value of salt tolerance
Accessions No. BLUP (GYC) BLUP (GYS) GYR% MFVST ScoreIC542040 93.48 87.77 6.11 0.977 HTKH65 140.35 110.30 21.41 0.814 HTIC144921 131.56 109.09 17.08 0.808 HTKRL210 157.10 108.61 30.86 0.782 HTIC445343 106.79 81.83 23.37 0.757 HTIC396586 127.50 95.39 25.18 0.748 HTIC128523 91.10 69.36 23.85 0.743 HTIC533903 110.36 88.95 19.39 0.742 HTIC393882 105.43 75.59 28.30 0.736 HTIC531970 172.22 125.29 27.24 0.713 HT
76
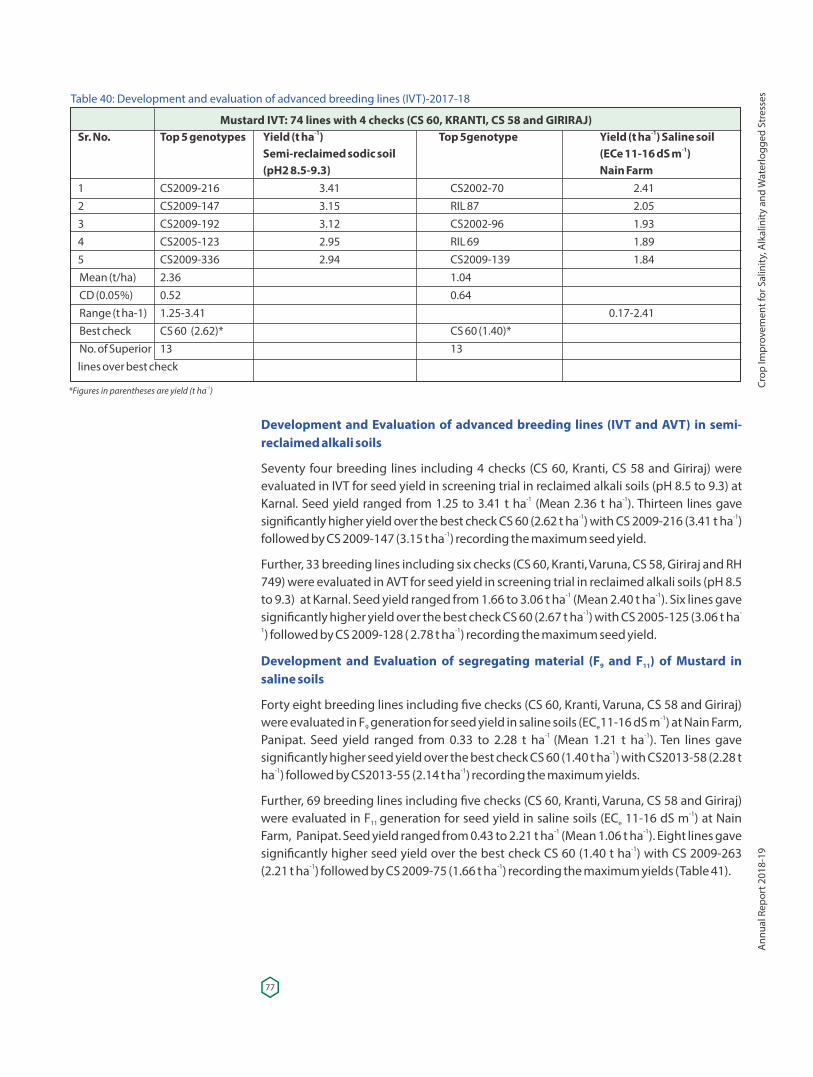
Development and Evaluation of advanced breeding lines (IVT and AVT) in semi-reclaimed alkali soils
Seventy four breeding lines including 4 checks (CS 60, Kranti, CS 58 and Giriraj) were evaluated in IVT for seed yield in screening trial in reclaimed alkali soils (pH 8.5 to 9.3) at
-1 -1Karnal. Seed yield ranged from 1.25 to 3.41 t ha (Mean 2.36 t ha ). Thirteen lines gave -1 -1signi�cantly higher yield over the best check CS 60 (2.62 t ha ) with CS 2009-216 (3.41 t ha )
-1followed by CS 2009-147 (3.15 t ha ) recording the maximum seed yield.
Further, 33 breeding lines including six checks (CS 60, Kranti, Varuna, CS 58, Giriraj and RH 749) were evaluated in AVT for seed yield in screening trial in reclaimed alkali soils (pH 8.5
-1 -1to 9.3) at Karnal. Seed yield ranged from 1.66 to 3.06 t ha (Mean 2.40 t ha ). Six lines gave -1 -signi�cantly higher yield over the best check CS 60 (2.67 t ha ) with CS 2005-125 (3.06 t ha
1 -1) followed by CS 2009-128 ( 2.78 t ha ) recording the maximum seed yield.
Development and Evaluation of segregating material (F and F ) of Mustard in 9 11
saline soils
Forty eight breeding lines including �ve checks (CS 60, Kranti, Varuna, CS 58 and Giriraj) -1were evaluated in F generation for seed yield in saline soils (EC 11-16 dS m ) at Nain Farm, 9 e
-1 -1Panipat. Seed yield ranged from 0.33 to 2.28 t ha (Mean 1.21 t ha ). Ten lines gave -1signi�cantly higher seed yield over the best check CS 60 (1.40 t ha ) with CS2013-58 (2.28 t
-1 -1ha ) followed by CS2013-55 (2.14 t ha ) recording the maximum yields.
Further, 69 breeding lines including �ve checks (CS 60, Kranti, Varuna, CS 58 and Giriraj) -1were evaluated in F generation for seed yield in saline soils (EC 11-16 dS m ) at Nain 11 e
-1 -1Farm, Panipat. Seed yield ranged from 0.43 to 2.21 t ha (Mean 1.06 t ha ). Eight lines gave -1signi�cantly higher seed yield over the best check CS 60 (1.40 t ha ) with CS 2009-263
-1 -1(2.21 t ha ) followed by CS 2009-75 (1.66 t ha ) recording the maximum yields (Table 41).
Table 40: Development and evaluation of advanced breeding lines (IVT)-2017-18
Mustard IVT: 74 lines with 4 checks (CS 60, KRANTI, CS 58 and GIRIRAJ)-1 -1Sr. No. Top 5 genotypes Yield (t ha ) Top 5genotype Yield (t ha ) Saline soil
-1 Semi-reclaimed sodic soil (ECe 11-16 dS m ) (pH2 8.5-9.3) Nain Farm1 CS2009-216 3.41 CS2002-70 2.412 CS2009-147 3.15 RIL 87 2.053 CS2009-192 3.12 CS2002-96 1.934 CS2005-123 2.95 RIL 69 1.895 CS2009-336 2.94 CS2009-139 1.84 Mean (t/ha) 2.36 1.04 CD (0.05%) 0.52 0.64 Range (t ha-1) 1.25-3.41 0.17-2.41 Best check CS 60 (2.62)* CS 60 (1.40)* No. of Superior 13 13lines over best check
-1*Figures in parentheses are yield (t ha )
77
Crop
Impr
ovem
ent f
or S
alin
ity, A
lkal
inity
and
Wat
erlo
gged
Str
esse
sA
nnua
l Rep
ort 2
018-
19
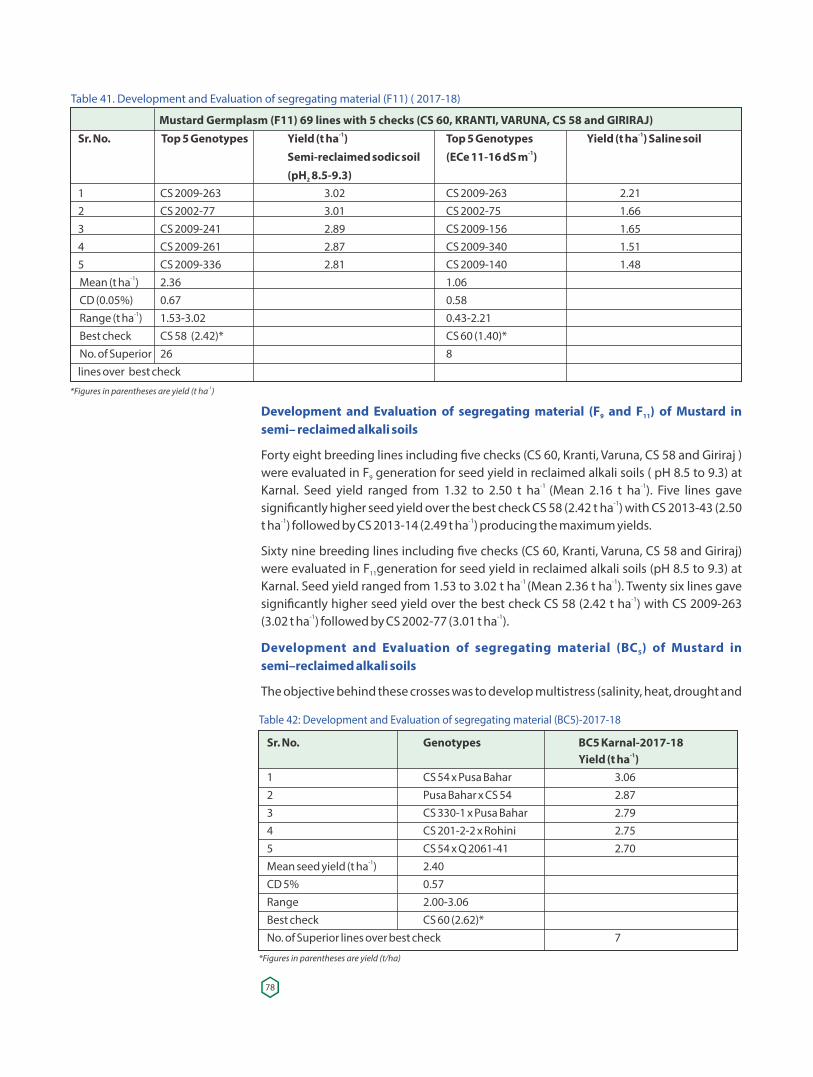
Development and Evaluation of segregating material (F and F ) of Mustard in 9 11
semi– reclaimed alkali soils
Forty eight breeding lines including �ve checks (CS 60, Kranti, Varuna, CS 58 and Giriraj ) were evaluated in F generation for seed yield in reclaimed alkali soils ( pH 8.5 to 9.3) at 9
-1 -1Karnal. Seed yield ranged from 1.32 to 2.50 t ha (Mean 2.16 t ha ). Five lines gave -1signi�cantly higher seed yield over the best check CS 58 (2.42 t ha ) with CS 2013-43 (2.50
-1 -1t ha ) followed by CS 2013-14 (2.49 t ha ) producing the maximum yields.
Sixty nine breeding lines including �ve checks (CS 60, Kranti, Varuna, CS 58 and Giriraj) were evaluated in F generation for seed yield in reclaimed alkali soils (pH 8.5 to 9.3) at 11
-1 -1Karnal. Seed yield ranged from 1.53 to 3.02 t ha (Mean 2.36 t ha ). Twenty six lines gave -1signi�cantly higher seed yield over the best check CS 58 (2.42 t ha ) with CS 2009-263
-1 -1(3.02 t ha ) followed by CS 2002-77 (3.01 t ha ).
Development and Evaluation of segregating material (BC ) of Mustard in 5
semi–reclaimed alkali soils
The objective behind these crosses was to develop multistress (salinity, heat, drought and
Table 41. Development and Evaluation of segregating material (F11) ( 2017-18)
Mustard Germplasm (F11) 69 lines with 5 checks (CS 60, KRANTI, VARUNA, CS 58 and GIRIRAJ)-1 -1Sr. No. Top 5 Genotypes Yield (t ha ) Top 5 Genotypes Yield (t ha ) Saline soil
-1 Semi-reclaimed sodic soil (ECe 11-16 dS m ) (pH 8.5-9.3) 2
1 CS 2009-263 3.02 CS 2009-263 2.212 CS 2002-77 3.01 CS 2002-75 1.663 CS 2009-241 2.89 CS 2009-156 1.654 CS 2009-261 2.87 CS 2009-340 1.515 CS 2009-336 2.81 CS 2009-140 1.48
-1 Mean (t ha ) 2.36 1.06 CD (0.05%) 0.67 0.58
-1 Range (t ha ) 1.53-3.02 0.43-2.21 Best check CS 58 (2.42)* CS 60 (1.40)* No. of Superior 26 8lines over best check
-1*Figures in parentheses are yield (t ha )
Table 42: Development and Evaluation of segregating material (BC5)-2017-18
Sr. No. Genotypes BC5 Karnal-2017-18-1 Yield (t ha )
1 CS 54 x Pusa Bahar 3.062 Pusa Bahar x CS 54 2.873 CS 330-1 x Pusa Bahar 2.794 CS 201-2-2 x Rohini 2.755 CS 54 x Q 2061-41 2.70
-1Mean seed yield (t ha ) 2.40CD 5% 0.57Range 2.00-3.06Best check CS 60 (2.62)*No. of Superior lines over best check 7
*Figures in parentheses are yield (t/ha)
78
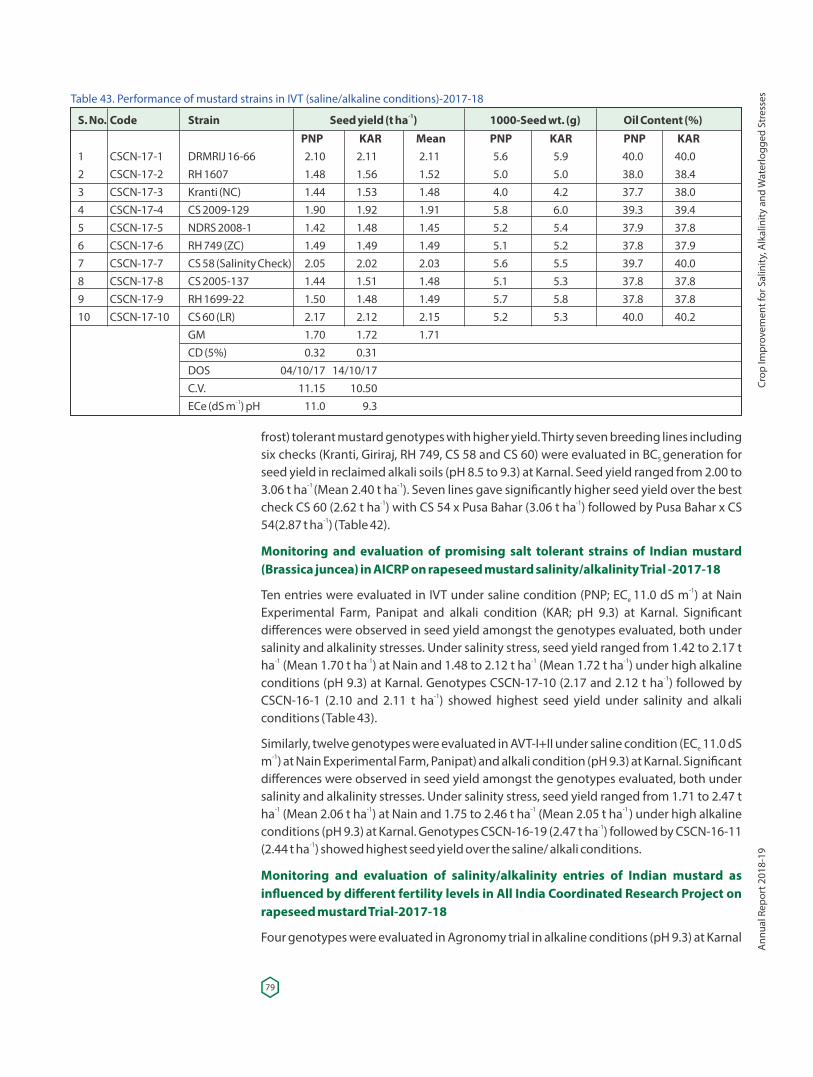
frost) tolerant mustard genotypes with higher yield. Thirty seven breeding lines including six checks (Kranti, Giriraj, RH 749, CS 58 and CS 60) were evaluated in BC generation for 5
seed yield in reclaimed alkali soils (pH 8.5 to 9.3) at Karnal. Seed yield ranged from 2.00 to -1 -13.06 t ha (Mean 2.40 t ha ). Seven lines gave signi�cantly higher seed yield over the best
-1 -1check CS 60 (2.62 t ha ) with CS 54 x Pusa Bahar (3.06 t ha ) followed by Pusa Bahar x CS -154(2.87 t ha ) (Table 42).
Monitoring and evaluation of promising salt tolerant strains of Indian mustard (Brassica juncea) in AICRP on rapeseed mustard salinity/alkalinity Trial -2017-18
-1Ten entries were evaluated in IVT under saline condition (PNP; EC 11.0 dS m ) at Nain e
Experimental Farm, Panipat and alkali condition (KAR; pH 9.3) at Karnal. Signi�cant differences were observed in seed yield amongst the genotypes evaluated, both under salinity and alkalinity stresses. Under salinity stress, seed yield ranged from 1.42 to 2.17 t
-1 -1 -1 -1ha (Mean 1.70 t ha ) at Nain and 1.48 to 2.12 t ha (Mean 1.72 t ha ) under high alkaline -1conditions (pH 9.3) at Karnal. Genotypes CSCN-17-10 (2.17 and 2.12 t ha ) followed by
-1CSCN-16-1 (2.10 and 2.11 t ha ) showed highest seed yield under salinity and alkali conditions (Table 43).
Similarly, twelve genotypes were evaluated in AVT-I+II under saline condition (EC 11.0 dS e-1m ) at Nain Experimental Farm, Panipat) and alkali condition (pH 9.3) at Karnal. Signi�cant
differences were observed in seed yield amongst the genotypes evaluated, both under salinity and alkalinity stresses. Under salinity stress, seed yield ranged from 1.71 to 2.47 t
-1 -1 -1 -1 ha (Mean 2.06 t ha ) at Nain and 1.75 to 2.46 t ha (Mean 2.05 t ha ) under high alkaline -1conditions (pH 9.3) at Karnal. Genotypes CSCN-16-19 (2.47 t ha ) followed by CSCN-16-11
-1(2.44 t ha ) showed highest seed yield over the saline/ alkali conditions.
Monitoring and evaluation of salinity/alkalinity entries of Indian mustard as in�uenced by different fertility levels in All India Coordinated Research Project on rapeseed mustard Trial-2017-18
Four genotypes were evaluated in Agronomy trial in alkaline conditions (pH 9.3) at Karnal
Table 43. Performance of mustard strains in IVT (saline/alkaline conditions)-2017-18-1S. No. Code Strain Seed yield (t ha ) 1000-Seed wt. (g) Oil Content (%)
PNP KAR Mean PNP KAR PNP KAR1 CSCN-17-1 DRMRIJ 16-66 2.10 2.11 2.11 5.6 5.9 40.0 40.02 CSCN-17-2 RH 1607 1.48 1.56 1.52 5.0 5.0 38.0 38.43 CSCN-17-3 Kranti (NC) 1.44 1.53 1.48 4.0 4.2 37.7 38.04 CSCN-17-4 CS 2009-129 1.90 1.92 1.91 5.8 6.0 39.3 39.45 CSCN-17-5 NDRS 2008-1 1.42 1.48 1.45 5.2 5.4 37.9 37.86 CSCN-17-6 RH 749 (ZC) 1.49 1.49 1.49 5.1 5.2 37.8 37.97 CSCN-17-7 CS 58 (Salinity Check) 2.05 2.02 2.03 5.6 5.5 39.7 40.08 CSCN-17-8 CS 2005-137 1.44 1.51 1.48 5.1 5.3 37.8 37.89 CSCN-17-9 RH 1699-22 1.50 1.48 1.49 5.7 5.8 37.8 37.810 CSCN-17-10 CS 60 (LR) 2.17 2.12 2.15 5.2 5.3 40.0 40.2 GM 1.70 1.72 1.71 CD (5%) 0.32 0.31 DOS 04/10/17 14/10/17 C.V. 11.15 10.50
-1 ECe (dS m ) pH 11.0 9.3
79
Crop
Impr
ovem
ent f
or S
alin
ity, A
lkal
inity
and
Wat
erlo
gged
Str
esse
sA
nnua
l Rep
ort 2
018-
19
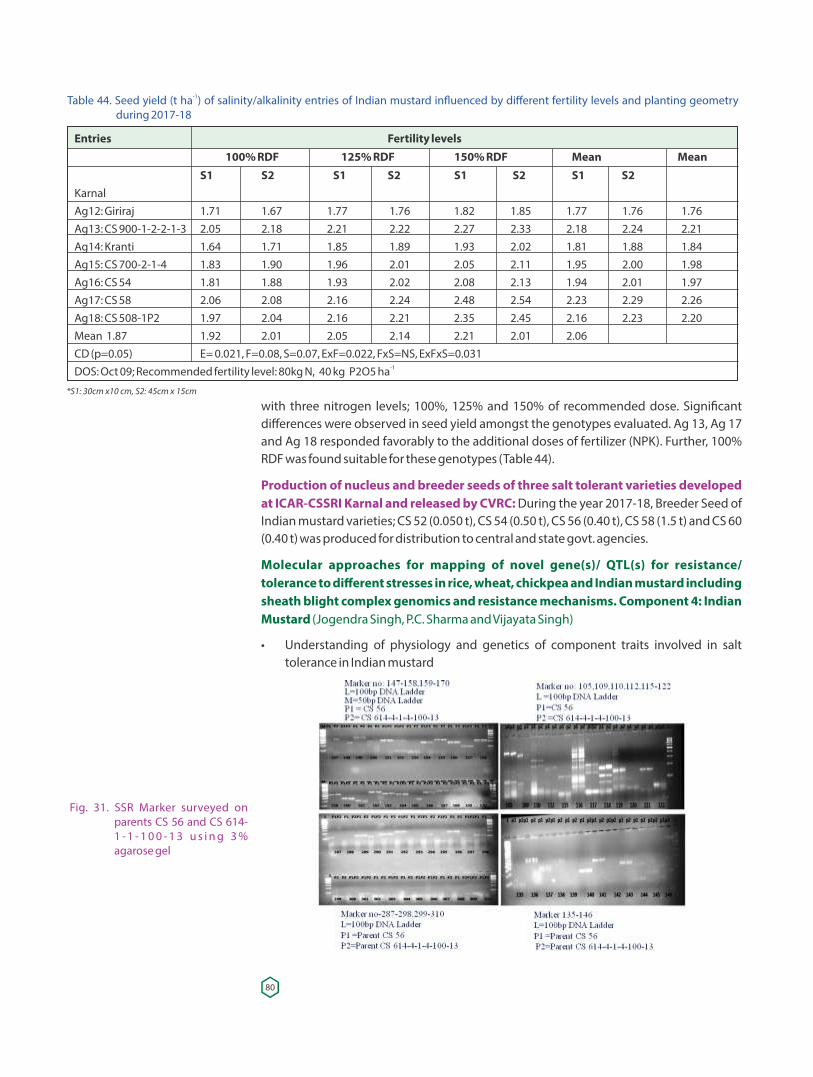
-1Table 44. Seed yield (t ha ) of salinity/alkalinity entries of Indian mustard in�uenced by different fertility levels and planting geometry during 2017-18
Entries Fertility levels 100% RDF 125% RDF 150% RDF Mean Mean S1 S2 S1 S2 S1 S2 S1 S2 KarnalAg12: Giriraj 1.71 1.67 1.77 1.76 1.82 1.85 1.77 1.76 1.76Ag13: CS 900-1-2-2-1-3 2.05 2.18 2.21 2.22 2.27 2.33 2.18 2.24 2.21Ag14: Kranti 1.64 1.71 1.85 1.89 1.93 2.02 1.81 1.88 1.84Ag15: CS 700-2-1-4 1.83 1.90 1.96 2.01 2.05 2.11 1.95 2.00 1.98Ag16: CS 54 1.81 1.88 1.93 2.02 2.08 2.13 1.94 2.01 1.97Ag17: CS 58 2.06 2.08 2.16 2.24 2.48 2.54 2.23 2.29 2.26Ag18: CS 508-1P2 1.97 2.04 2.16 2.21 2.35 2.45 2.16 2.23 2.20Mean 1.87 1.92 2.01 2.05 2.14 2.21 2.01 2.06 CD (p=0.05) E= 0.021, F=0.08, S=0.07, ExF=0.022, FxS=NS, ExFxS=0.031
-1DOS: Oct 09; Recommended fertility level: 80kg N, 40 kg P2O5 ha
*S1: 30cm x10 cm, S2: 45cm x 15cm
with three nitrogen levels; 100%, 125% and 150% of recommended dose. Signi�cant differences were observed in seed yield amongst the genotypes evaluated. Ag 13, Ag 17 and Ag 18 responded favorably to the additional doses of fertilizer (NPK). Further, 100% RDF was found suitable for these genotypes (Table 44).
Production of nucleus and breeder seeds of three salt tolerant varieties developed at ICAR-CSSRI Karnal and released by CVRC: During the year 2017-18, Breeder Seed of Indian mustard varieties; CS 52 (0.050 t), CS 54 (0.50 t), CS 56 (0.40 t), CS 58 (1.5 t) and CS 60 (0.40 t) was produced for distribution to central and state govt. agencies.
Molecular approaches for mapping of novel gene(s)/ QTL(s) for resistance/ tolerance to different stresses in rice, wheat, chickpea and Indian mustard including sheath blight complex genomics and resistance mechanisms. Component 4: Indian Mustard (Jogendra Singh, P.C. Sharma and Vijayata Singh)
• Understanding of physiology and genetics of component traits involved in salt tolerance in Indian mustard
Fig. 31. SSR Marker surveyed on parents CS 56 and CS 614-1 - 1 - 1 0 0 - 1 3 u s i n g 3 % agarose gel
80
Identi�cation of polymorphic markers marker
A total of 729 SSR markers were surveyed on parents CS 56 and CS 614-1-1-100-13 to identify polymorphic markers. Out of them, 40 markers showed polymorphism, which will be further used for genotyping of RILs and tagging QTLs for salt tolerance in Indian Mustard (Fig. 31).
Phenotyping of RILs
Two hundred �fty two Recombinant Inbred Lines (RILs) including their parents (CS 56 and -1CS 614-1-1-100-13) were sown under normal and saline (EC 12 dS m ) conditions for iw
phenotyping. The plant height of the parental lines CS 614-1-1-100-13 and CS 56 was 202.5 and 196.5 cm respectively under normal and 148.5 and 120.0 cm respectively
-1undersaline (EC 12 dS m ) conditions. The height of RILs ranged from 153- 251 cm under iw
normal and 102.5-175.0 cm under saline soils, respectively.
The number of primary branches of RILs ranged from 3.5 to 8 and 3 to 8.5 under normal and saline soils, respectively. There was no signi�cant difference in the mean number of primary branches of parents and RILs. The number of secondary branches of RILs ranged from 5.5 to 18.5 and 2 to 15 under normal and saline conditions, respectively. The number of secondary branches of the parental lines CS 56 and CS 614-1-1-100-13 was 10.5 and 7.5 under normal and 11 and 5.5 in saline conditions. The main shoot length of RILs ranged from 61.5-105.5 cm under normal and 34-71.5 cm under saline conditions, respectively. The main shoot length of the parental lines CS 56 and CS 614-1-1-100-13 was 87.0 and 77.0 under normal and 56.0 cm and 54.0 cm in saline conditions.
The test weight of RILs range varies from 3.55-7.21 g and 3.84-6.6 g under normal and saline conditions, respectively. CS 56 and CS 614-1-1-100-13 displayed test weight of 5.3 and 5.2 g under normal and 4.2 and 4.3 g in saline conditions. The yield/plant of RIL ranged from 21.7 to 58.8 g and 6.83 to 14.01 g under normal and saline conditions, respectively. CS 56 and CS 614-1-1-100-13 displayed yield of 38.2 and 30.8 g under normal and 11.3 and 8.9 g in saline conditions.
Root fresh weight of the RILs ranged from 0.25 to 0.99 g and 0.07 to 1.78 g under normal and saline conditions, respectively. CS 56 and CS 614-1-1-100-13 displayed root fresh weight of 4.3 and 2.5 g under normal and 1.3 and 0.3 g in saline conditions.
Shoot fresh weight of the RILs ranged from 4.5 to 9.5gand 2.55 to 47.5 g under normal and saline conditions, respectively. CS 56 and CS 614-1-1-100-13 displayed shoot fresh weight of 67.5 and 44.5 g under normal and 13.9 and 7.0 g in saline conditions. Shoot dry weight
Develop breeding lines with need based combined tolerance to salt stressDeveloped 22 crosses (BC5) for combining multistress tolerance (salinity, heat, drought and frost) as under:
Pusa Bahar (Heat Tolerance)
Q 2061-41 (Zero Eruric Acid)
CS56 RH 819 (Heat and Drought Tolerance)
CS 204-2-2 RH 781 (Heat, Drought and Frost tolerance)
CS 330-1 Rohini (High Oil)
RL 1359 (High Oil and Zonal Check)
LES-39 (Low Eruric Acid)
x
81
Crop
Impr
ovem
ent f
or S
alin
ity, A
lkal
inity
and
Wat
erlo
gged
Str
esse
sA
nnua
l Rep
ort 2
018-
19
of the RILs ranged from 0.42 to 4.02 g and 0.2 to 2.04 g under normal and saline conditions, respectively. CS 56 and CS 614-1-1-100-13 displayed shoot dry weight of 3.3 and 2.0 g under normal and 1.6 and 0.7 g in saline conditions.
Molecular approaches for mapping of novel gene(s)/ QTL(s) for resistance/ tolerance to different stresses in rice, wheat, chickpea and Indian mustard including sheath blight complex genomics and resistance mechanisms. Sub Project 3: Chickpea (S.K. Sanwal and P.C. Sharma)
Phenotyping of Chickpea genotypes: Yield and contributing traits
One hundred �fty one advance breeding lines received from IARI, New Delhi were -1evaluated for seed yield and other yield contributing traits in control, saline (EC 6 dS m ) iw
and alkali (pH 9.0) conditions at Karnal.
The plant height of 151 breeding lines ranged from 39.00 to 75.33, 24.0 to 67.0 and 29.67 to 67.00 cm, respectively under control, saline and alkali conditions. The number of branches ranged from 3.67 to 13.67, 1.67 to 4.33 and 2.33 to 8.67, respectively under control, saline and alkali condition. The number of pods ranged from 5.31 to 260.37, 6.67-22.33and17.33 and 251.67 respectively under control, saline and alkali condition. The 100 seed weight of these advance breeding lines ranged from 4.18 to 101.26 g, 1.07 to 11.23 g
-1and 1.64 to 98.78 g, respectively under control, saline and alkali condition. The yield plant ranged from 7.17 to 49.22, 4.35 to 21.77 and 5.04 to 46.23 g, respectively under control,
-1saline and alkali conditions. There was reduction in yield plant , plant height, number branches, pods and seed weight under salinity and alkali conditions compared to control, whereas, this reduction was high under saline condition.
Similarly, 50 advanced breeding (AB) lines received from IIPR, Kanpur were also evaluated -1for seed yield and other yield contributing traits in control and saline (EC 6 dS m ) and iw
alkaline (pH 9.0) conditions at Karnal. Saline water led to drastic reduction in yield and contributing traits. Top 20 lines from each treatment were selected on the basis of yield. Out of 151 ABL from IARI, the lines IARI-133, 137 and 125 recorded >85 g seed yield/plant under controlled conditions. Under saline environment the lines IARI-130, 125 and 35 performed better but yield reduction was very high while under alkaline condition the lines IARI-17, IARI-19 and IARI-58 found promising.
Top 20 lines were also selected from 50 lines received from IIPR, Kanpur. The lines L-84, L-132 and L-160 found promising under controlled conditions. Under saline environment, the lines L-167, L-201 and L-166 have good performance while under alkaline condition the lines L-160, L-63 and L-40 found better than other lines.
Phenotyping of Chickpea genotypes (Physiological traits): Under alkaline condition the lines IARI 105, IARI 73 and IARI 51 had maximum chlorophyll while at saline condition lines IARI 132, IARI 131 and IARI 102 maintained high chlorophyll content. Among 50 IIPR lines, the lines L-169, L-84 and L-195 maintained high chlorophyll than check under salt stress. Total proline was measured using ninhydrin at �owering stage of 151 and 50 lines received from IARI and IIPR, Kanpur respectively. Under stress condition proline content increased. The increment was more in tolerant genotypes than susceptible. High proline content was noted from lines IARI 104, IARI 132 and IARI130 from IARI lines while from Kanpur lines none of the lines have more proline than check K-850.
82
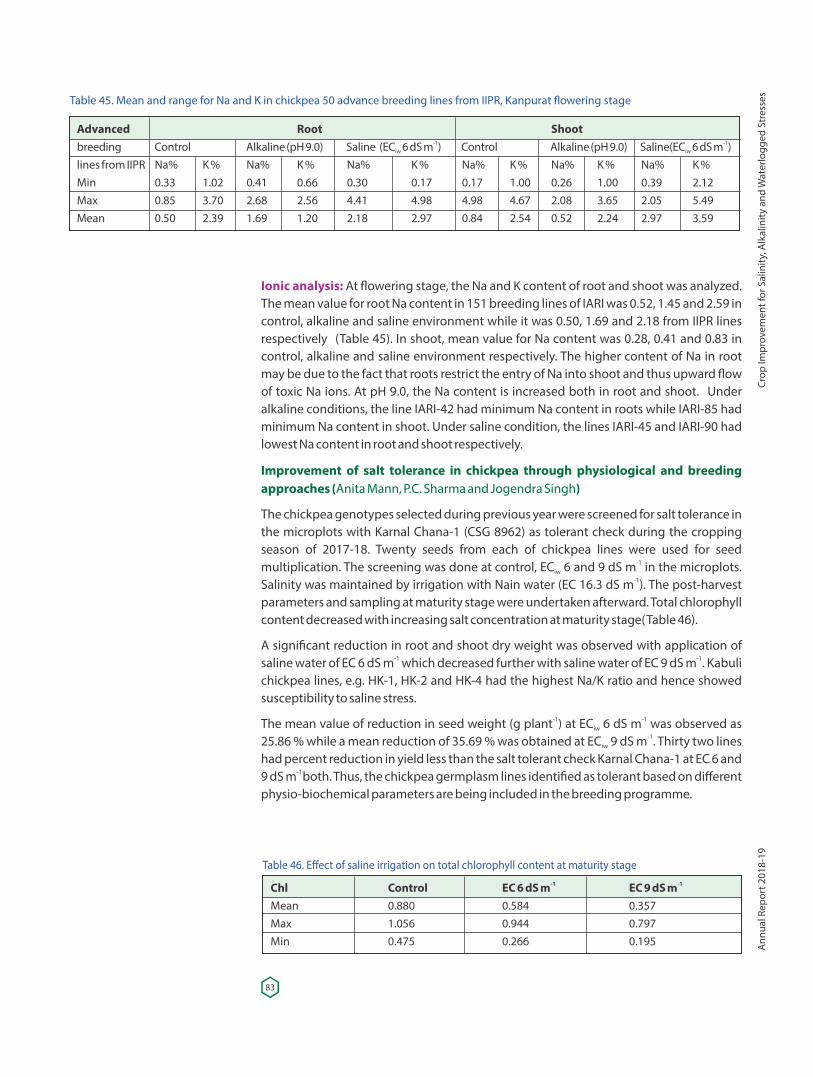
Ionic analysis: At �owering stage, the Na and K content of root and shoot was analyzed. The mean value for root Na content in 151 breeding lines of IARI was 0.52, 1.45 and 2.59 in control, alkaline and saline environment while it was 0.50, 1.69 and 2.18 from IIPR lines respectively (Table 45). In shoot, mean value for Na content was 0.28, 0.41 and 0.83 in control, alkaline and saline environment respectively. The higher content of Na in root may be due to the fact that roots restrict the entry of Na into shoot and thus upward �ow of toxic Na ions. At pH 9.0, the Na content is increased both in root and shoot. Under alkaline conditions, the line IARI-42 had minimum Na content in roots while IARI-85 had minimum Na content in shoot. Under saline condition, the lines IARI-45 and IARI-90 had lowest Na content in root and shoot respectively.
Improvement of salt tolerance in chickpea through physiological and breeding approaches (Anita Mann, P.C. Sharma and Jogendra Singh)
The chickpea genotypes selected during previous year were screened for salt tolerance in the microplots with Karnal Chana-1 (CSG 8962) as tolerant check during the cropping season of 2017-18. Twenty seeds from each of chickpea lines were used for seed
-1multiplication. The screening was done at control, EC 6 and 9 dS m in the microplots. iw-1Salinity was maintained by irrigation with Nain water (EC 16.3 dS m ). The post-harvest
parameters and sampling at maturity stage were undertaken afterward. Total chlorophyll content decreased with increasing salt concentration at maturity stage( Table 46).
A signi�cant reduction in root and shoot dry weight was observed with application of -1 -1saline water of EC 6 dS m which decreased further with saline water of EC 9 dS m . Kabuli
chickpea lines, e.g. HK-1, HK-2 and HK-4 had the highest Na/K ratio and hence showed susceptibility to saline stress.
-1 -1The mean value of reduction in seed weight (g plant ) at EC 6 dS m was observed as iw-125.86 % while a mean reduction of 35.69 % was obtained at EC 9 dS m . Thirty two lines iw
had percent reduction in yield less than the salt tolerant check Karnal Chana-1 at EC 6 and -1 9 dS m both. Thus, the chickpea germplasm lines identi�ed as tolerant based on different
physio-biochemical parameters are being included in the breeding programme.
Table 45. Mean and range for Na and K in chickpea 50 advance breeding lines from IIPR, Kanpurat �owering stage
Advanced Root Shoot-1 -1breeding Control Alkaline (pH 9.0) Saline (EC 6 dS m ) Control Alkaline (pH 9.0) Saline(EC 6 dS m )iw iw
lines from IIPR Na% K % Na% K % Na% K % Na% K % Na% K % Na% K %Min 0.33 1.02 0.41 0.66 0.30 0.17 0.17 1.00 0.26 1.00 0.39 2.12Max 0.85 3.70 2.68 2.56 4.41 4.98 4.98 4.67 2.08 3.65 2.05 5.49Mean 0.50 2.39 1.69 1.20 2.18 2.97 0.84 2.54 0.52 2.24 2.97 3.59
Table 46. Effect of saline irrigation on total chlorophyll content at maturity stage-1 -1Chl Control EC 6 dS m EC 9 dS m
Mean 0.880 0.584 0.357Max 1.056 0.944 0.797Min 0.475 0.266 0.195
83
Crop
Impr
ovem
ent f
or S
alin
ity, A
lkal
inity
and
Wat
erlo
gged
Str
esse
sA
nnua
l Rep
ort 2
018-
19
Development of soybean [Glycine max (L.) Merrillis] genotypes for higher yield under salt stress (Vijayata Singh and S.K. Sanwal)
The main aim of this project is to categorize soybean germplasm for salt tolerance and identi�cation of donors for salt tolerance and its introgression in to high yielding varieties. A panel of 203 soybean genotypes (germplasm, released varieties, wild accession and
-1breeding lines) was evaluated under irrigation saline water (EC 5.0 and 8.0 dS m ) and iw
the �eld sodicity conditions (Control, pH 9.0 and pH 9.3) during of Kharif 2018.
Screening of soybean germplasm under saline irrigation water conditions
Initially, �ve seeds of each of accessions were sown at depth of 1 cm in 20 kg capacity ceramic pots �lled with sand inside the net house facility. The bottom of each pot was delved for drainage of extra water. The pots were irrigated by normal tap water (control),
-1saline water (EC 5.0 and 8.0 dS m ) and maintained at full strength �eld capacity. Here, iw-1 we selected above salinity levels because EC 5 dS m is the threshold limit for soybean iw
crop. The saline water for irrigation was prepared in Hoagland nutrient solution by adding NaCl, Na SO and CaCl , keeping Na:Ca and Cl:SO ratios of 4:1 which re�ect the major ion 2 4 2 4
compositions of naturally occurring saline waters/soils. The pots were arranged in a factorial experiment based in completely randomized block design (CRBD) with 2 replications. The pots were irrigated daily to maintain the respective salinity level in the root zone throughout the life cycle of the crop. Saline irrigation was continued until the harvest of the crop for recording yield. Out of 203 only 108 survived till maturity under
Table 47. Top �ve best performing soyabean germplasm
Soybean (203 lines)Means over the salinity (Control, Eciw 5 and Eciw 8)
-1Code No. Genotype Yield plant Pods per 100 Seed- Shoot Na Shoot K Root Na Root K -1 -1 -1 -1 (g) plant Weight (g) (mg kg (mg kg (mg kg (mg kg
dry wt.) dry wt.) dry wt.) dry wt.)G24 AGS 75-13 20.03 120 13.8 3.9 12.7 3.6 13.8G22 IC 195 18.5 116 10.1 5.2 11.6 6.5 5.4G21 AGS-751-4 16.32 112 15.2 6.4 10.9 6.3 10.9G23 SL-1254 14.23 108 8.7 3.5 9.2 6.1 6.2G14 IC391326 13.51 98 10.9 3.7 13.3 8.5 5.8Mean (g) 16.51 110.8 11.74 4.54 11.54 6.2 8.42 CD (0.05%) 6.2 26.7 0.7 1.3 1.2 0.6 0.9Range (g) 10.7-25.31 31.5-126.8 2.9-15.2 0.03-8.5 2.9-18.5 0.1-8.6 2.7-12.8
Salinity tolerant Soybean genotypes
AGS 75-13
Screening of soybean germplasm under sal ine i r r igat ion water conditions
IC 195
84
-1saline condition. The higher salinity signi�cantly reduced 62% pods plant , 72% seed -1yield plant and 68% 100- seed weight.
-1The higher salinity signi�cantly reduced seed yield plant and 100-seed weight. Whereas, Na/K ratio in root and shoot was signi�cantly increased with increasing salinity levels as compared to control (Table 47). Top �ve best performing soybean germplasm under salinity were AGS 75-13, IC 195, AGS 75-14, SL-1254 and IC 391326. The mean seed yield/plant over the salinity stress was 16.51 g. The mean 100- seed weight over the salinity stress was 11.74 g g.
Screening of soybean germplasm under sodicity conditions
All the 203 accessions were also evaluated under the �eld sodicity conditions (Control, pH -19.0 and pH 9.3) during Kharif 208. Impact of sodicity was more pronounced on pods plant
-1 -1and seed yied plant which signi�cantly reduced these traits 78% pods plant , 81% seed -1yield plant and 58% 100- seed weight.
-1 The higher salinity signi�cantly reduced seed yield plant and 100-Seed weight. Whereas, Na/K ratio in root and shoot was signi�cantly increased with increasing salinity levels as compared to control (Table 48). Top �ve best performing soybean germplasm under sodicity were (SL-1113, SL 1209, AGS 75-16, SL-1210 and IC 392529).
-1 The mean seed yield plant over the salinity stress was 49.20 g with C.D. (5%) 9.3.
Development and validation of multi-trait allele speci�c SNP panel for high throughput genotyping of breeding populations in soybean (Vijayata Singh) Collaborative project ICAR-CSSRI with ICAR-IISR, Indore)
Total 42 genotypes containing haplotype associated with salt tolerance gene GmSALT along with three checks JS 335, JS 97-52, EC 538828 were evaluated under ECiw 5 and 8 dS/m at ICAR CSSRI, Karnal. Out of them �ve genotypes IC 195, Type 49, CAT 1996, UPSM 862 and CAT 1832 were found promising for salinity tolerance.
Table 48. Top �ve best performing soybean germplasm under sodicity
Soybean 203 linesMeans over the sodicity (pH2 :Control, 9.0, 9.3)
-1Code No. Genotype Yield plant Pods per 100 Seed- Shoot Na Shoot K Root Na Root K -1 -1 -1 -1 (g) plant Weight (g) (mg kg (mg kg (mg kg (mg kg
dry wt.) dry wt.) dry wt.) dry wt.)G34 SL-1113 127.3 468.5 10.8 4.9 13.7 3.8 12.8G41 SL-1209 99.2 256.2 10.1 5.2 11.6 6.5 5.4G28 AGS-75-16 97.3 269.7 15.2 6.4 10.9 6.3 10.9G42 SL-1210 97 317.7 8.7 3.5 9.2 6.1 6.2G1 IC-392529 94.8 335 6.9 3.7 13.3 8.5 5.8 Mean (g) 49.2 175.5 7.1 3.1 10.4 4.1 6.5 CD (0.05%) 9.3 26.7 0.6 1.3 1.7 0.8 0.9 Range (g) 10.7-127.3 31.5-468.5 2.9-15.2 0.03-8.5 2.9-18.5 0.1-8.6 2.7-12.8
85
Crop
Impr
ovem
ent f
or S
alin
ity, A
lkal
inity
and
Wat
erlo
gged
Str
esse
sA
nnua
l Rep
ort 2
018-
19
QTL mapping and identi�cation of markers linked to salinity tolerance in chickpea (Cicer arietinum L.)(JAU, Junagadh– CSSRI, Karnal Collaboration Project)
-1Phenotyping of RILs under Salinity (EC 6 dS m )e
Phenotyping of 300 Chickpea Recombinant Inbred Lines (RILs) including their parents received from JAU, Junagadh was done in saline field at Nain Farm during rabi 2018-19 for morpho-physiological traits and crop is yet to be harvest.
Enhancement of genetic potential of moongbean and lentil in multi season- and different cropping system adaptation (Vijayata Singh and S.K. Sanwal) Collaborative project ICAR-CSSRI with ICAR-IARI, Pusa, New Delhi)
-1A total 40 genotypes with three replications were screened for yield under EC 5 dS m e
salinity during rabi 2018-19 at Nain Farm. The highest yield was recorded for PDL-1 (1438) followed by LSL-16-3 (1272), PSL-9 (1700) and LSL-16-13 (1967) as compared to checks
-1 -1DPL-62, 616 kg ha ) and IPL-406, 164 kg ha ) under salt stress condition.
Genetic enhancement of tomato (Solanumlycopersicum) and okra (Abelmoschus esculentus L) for salt tolerance (S.K. Sanwal, P.C. Sharma, Anita Mann, Raj Kumar and A.K. Rai)
Induced tolerance of tomato plants through grafting on salt tolerant brinjal rootstock
The present experiment was carried out to determine whether grafting could improve salinity tolerance in tomato and to study the changes induced by the rootstock on growth, physiological and ionic levels in the grafted plants. Tomato variety Kashi Aman was grafted on brinjal rootstocks IC-354557 and IC-111056 and transplanted in pots �lled
-1with soil and irrigated with saline waters (control, EC 6 and 9 dS m ) at regular intervals. iw
Soil samples were also taken on regular intervals to monitor the EC buildup of the soil. e
Observations were recorded on horticultural traits, physiological traits and ionic analysis. In control treatment (best available water), there was no signi�cant difference in plant height, av. fruit weight, yield and physiological parameters between grafted and
-1ungrafted plants (Table 49). Under stress conditions (EC 6 and 9 dS m ), there was iw
signi�cant reduction in plant height and fruit weight. But the reduction was less in grafted plants. Among the two rootstocks, the plants grafted onto rootstock IC-111056 performed better and recorded 3.94 % and 20.12 % higher yield than rootstock IC-354557
-1and 31.70% and 142.05% more than ungrafted plants at EC 6 and 9 dS m respectively. iw
The leaf greenness measured though SPAD was also higher in grafted plants (90.7%) on -1rootstock IC-111056 than non-grafted plants (41.9%) at higher level of salinity EC 9 dS m . iw
Field view of tolerant genotypes at Nain Farm, Panipat under salinity stress
86
The activity of free radical scavenging enzyme, superoxide peroxidase was also higher in non-grafted plants (49-67%) under saline stress than the grafted ones (15-35%) along with the H O produced. The salt tolerant rootstock may be providing inbuilt resistance to 2 2
the grafted plants and hence less free radicals are produced. Under saline conditions, + +roots of grafted plants had signi�cantly higher Na content. On average upper leaves Na
content of grafted plants (IC-111056 x K. Aman ) was 23.68 % and 22.12 % lower than that of ungrafted plants while bottom leaves of same grafted plant had 17.74 and 8.45%
+ -1higher Na content at EC 6 and 9 dS m respectively. There was no signi�cant difference in iw + +Na content of stem and middle leaves of grafted and ungrafted plants. The K content of
young leaves of grafted plants were found signi�cantly higher than that of ungrafted + -1plants while K of stem was signi�cantly higher at high salinity (EC 9 dS m ). Thus, plants iw
+grafted onto IC-111056 rootstock showed a higher capacity to modulate shoot Na +partitioning with respect to ungrafted plants by increasing Na accumulation in older
+ + +leaves and reducing Na content in younger leaves, thus maintaining lower Na /K ratios compared to ungrafted plants.
Mineral nutrient diagnostic and site speci�c nutrient management demonstrations to improve agricultural productivity of salt affected soils in Haryana (Anita Mann, R.K. Yadav, Parvender, Ashwani Kumar and B. L. Meena)
Approximately 500 samples of soil and water were collected from four villages, Nain (Panipat), Jagsi (Sonepat), Sanch (Kaithal) and Mundri (Kaithal). The grid map of respective village was prepared based on soil and water sampling. The major and micronutrients were estimated in soil and water samples. Based on the mineral nutrient analysis, �eld demonstrations were conducted at these sites.
The demonstration of wheat was done at all the four sites during cropping season of 2017-18 and rice during 2018. The experiment was designed based on the defeciency of the element or in combination. The recommended package of practice was followed for all the site demonstrations. Three experiments were conducted at each farmers' �eld as FP (Farmer practice), RD (recommended dose) and STV (soil test based value) in all the four villages (Fig. 32).
-1Nitrogen less than 125 kg ha was calculated as low with 1.5 times recommendation of RD, 125-250 was considered as medium with 1.25 times of RD. Similarly, based on soil test
Table 49. Effect of salinity on horticultural and physiological traits of tomato
Salt Graft Plant height Av. fruit wt. Fruit yield/ Hydrogen SOD Proline SPAD RWCtreatment combination (cm) (g) plant (g) peroxide (Units/g (ug/gFW) (u mole/g FW) FW)Control Ungrafted 64.33 64.30 2577.27 5862.86 185.83 387.10 89.40 83.69 IC-111056 x K. Aman 69.67 63.25 2518.00 2905.71 173.97 365.70 102.05 82.64 IC-354557 x K. Aman 62.67 63.85 2388.00 3908.57 151.81 335.56 97.85 89.456 ECiw Ungrafted 58.33 56.40 1420.80 6145.71 247.64 754.96 62.10 78.16 IC-111056 x K. Aman 60.67 59.20 1871.30 2931.43 299.84 943.23 91.65 78.99 IC-354557 x K. Aman 57.33 60.30 1800.43 4422.86 265.49 937.70 71.15 78.089 ECiw Ungrafted 48.33 41.45 522.75 6788.57 294.14 990.87 41.90 73.43 IC-111056 x K. Aman 55.00 48.55 1265.33 4422.86 433.61 1324.01 90.65 76.48 IC-354557 x K. Aman 51.66 47.60 1053.37 5400.00 378.38 1111.31 77.75 78.24CD at 5% 4.42 5.65 192.30 336.24 43.08 112.10 12.46 3.64 2.32
87
Crop
Impr
ovem
ent f
or S
alin
ity, A
lkal
inity
and
Wat
erlo
gged
Str
esse
sA
nnua
l Rep
ort 2
018-
19
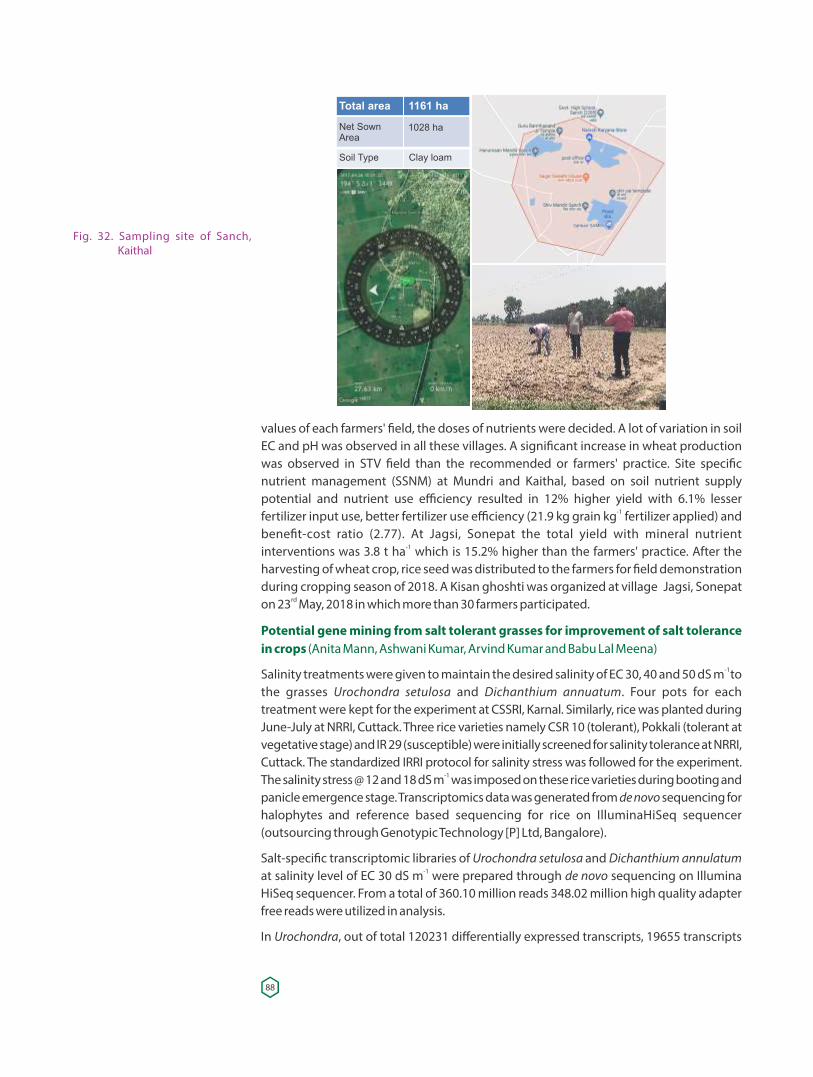
values of each farmers' �eld, the doses of nutrients were decided. A lot of variation in soil EC and pH was observed in all these villages. A signi�cant increase in wheat production was observed in STV �eld than the recommended or farmers' practice. Site speci�c nutrient management (SSNM) at Mundri and Kaithal, based on soil nutrient supply potential and nutrient use efficiency resulted in 12% higher yield with 6.1% lesser
-1fertilizer input use, better fertilizer use efficiency (21.9 kg grain kg fertilizer applied) and bene�t-cost ratio (2.77). At Jagsi, Sonepat the total yield with mineral nutrient
-1interventions was 3.8 t ha which is 15.2% higher than the farmers' practice. After the harvesting of wheat crop, rice seed was distributed to the farmers for �eld demonstration during cropping season of 2018. A Kisan ghoshti was organized at village Jagsi, Sonepat
rdon 23 May, 2018 in which more than 30 farmers participated.
Potential gene mining from salt tolerant grasses for improvement of salt tolerance in crops (Anita Mann, Ashwani Kumar, Arvind Kumar and Babu Lal Meena)
-1 Salinity treatments were given to maintain the desired salinity of EC 30, 40 and 50 dS m to the grasses Urochondra setulosa and Dichanthium annuatum. Four pots for each treatment were kept for the experiment at CSSRI, Karnal. Similarly, rice was planted during June-July at NRRI, Cuttack. Three rice varieties namely CSR 10 (tolerant), Pokkali (tolerant at vegetative stage) and IR 29 (susceptible) were initially screened for salinity tolerance at NRRI, Cuttack. The standardized IRRI protocol for salinity stress was followed for the experiment.
-1The salinity stress @ 12 and 18 dS m was imposed on these rice varieties during booting and panicle emergence stage. Transcriptomics data was generated from de novo sequencing for halophytes and reference based sequencing for rice on IlluminaHiSeq sequencer (outsourcing through Genotypic Technology [P] Ltd, Bangalore).
Salt-speci�c transcriptomic libraries of Urochondra setulosa and Dichanthium annulatum -1at salinity level of EC 30 dS m were prepared through de novo sequencing on Illumina
HiSeq sequencer. From a total of 360.10 million reads 348.02 million high quality adapter free reads were utilized in analysis.
In Urochondra, out of total 120231 differentially expressed transcripts, 19655 transcripts
Fig. 32. Sampling site of Sanch, Kaithal
Total area 1161 ha
Net SownArea
1028 ha
Soil Type Clay loam
88
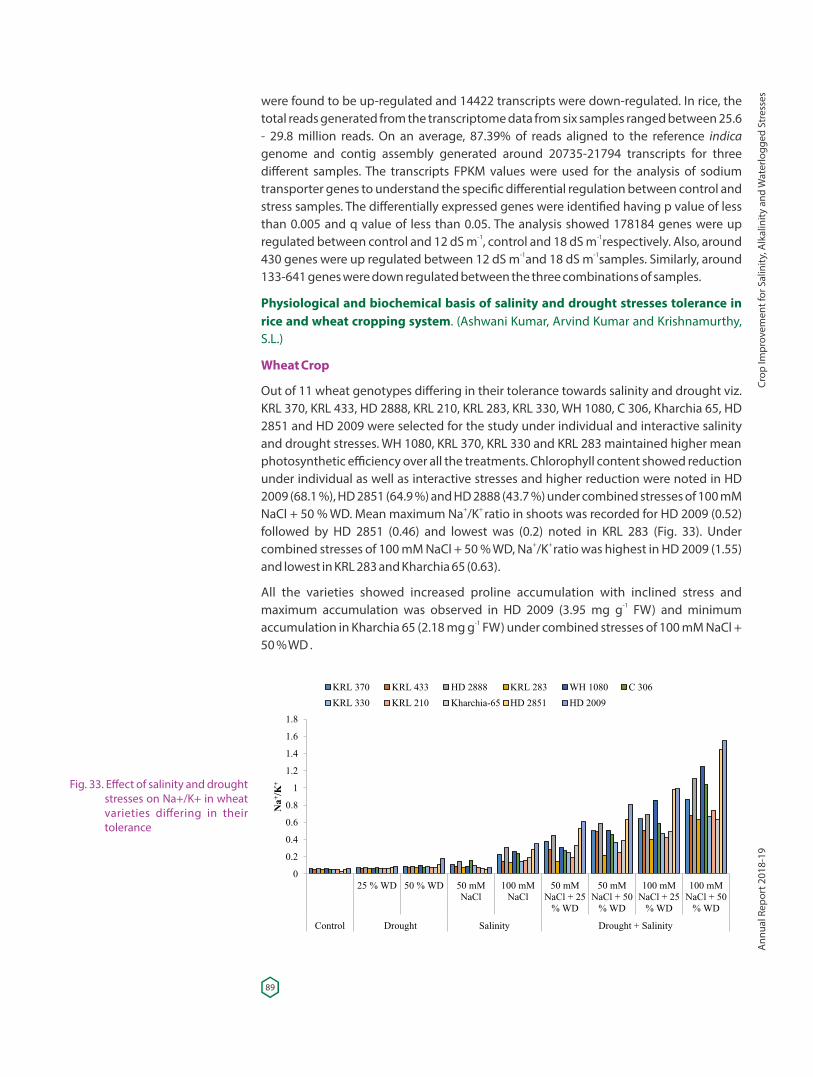
were found to be up-regulated and 14422 transcripts were down-regulated. In rice, the total reads generated from the transcriptome data from six samples ranged between 25.6 - 29.8 million reads. On an average, 87.39% of reads aligned to the reference indica genome and contig assembly generated around 20735-21794 transcripts for three different samples. The transcripts FPKM values were used for the analysis of sodium transporter genes to understand the speci�c differential regulation between control and stress samples. The differentially expressed genes were identi�ed having p value of less than 0.005 and q value of less than 0.05. The analysis showed 178184 genes were up
-1 -1regulated between control and 12 dS m , control and 18 dS m respectively. Also, around -1 -1430 genes were up regulated between 12 dS m and 18 dS m samples. Similarly, around
133-641 genes were down regulated between the three combinations of samples.
Physiological and biochemical basis of salinity and drought stresses tolerance in rice and wheat cropping system. (Ashwani Kumar, Arvind Kumar and Krishnamurthy, S.L.)
Wheat Crop
Out of 11 wheat genotypes differing in their tolerance towards salinity and drought viz. KRL 370, KRL 433, HD 2888, KRL 210, KRL 283, KRL 330, WH 1080, C 306, Kharchia 65, HD 2851 and HD 2009 were selected for the study under individual and interactive salinity and drought stresses. WH 1080, KRL 370, KRL 330 and KRL 283 maintained higher mean photosynthetic efficiency over all the treatments. Chlorophyll content showed reduction under individual as well as interactive stresses and higher reduction were noted in HD 2009 (68.1 %), HD 2851 (64.9 %) and HD 2888 (43.7 %) under combined stresses of 100 mM
+ + NaCl + 50 % WD. Mean maximum Na /K ratio in shoots was recorded for HD 2009 (0.52) followed by HD 2851 (0.46) and lowest was (0.2) noted in KRL 283 (Fig. 33). Under
+ + combined stresses of 100 mM NaCl + 50 % WD, Na /K ratio was highest in HD 2009 (1.55) and lowest in KRL 283 and Kharchia 65 (0.63).
All the varieties showed increased proline accumulation with inclined stress and -1maximum accumulation was observed in HD 2009 (3.95 mg g FW) and minimum
-1accumulation in Kharchia 65 (2.18 mg g FW) under combined stresses of 100 mM NaCl + 50 % WD .
Fig. 33. Effect of salinity and drought stresses on Na+/K+ in wheat varieties differing in their tolerance
89
Crop
Impr
ovem
ent f
or S
alin
ity, A
lkal
inity
and
Wat
erlo
gged
Str
esse
sA
nnua
l Rep
ort 2
018-
19
Table 50: Effect of salinity and drought stresses on grain weight(g)/plant in Rice varieties differing in their tolerance
Treatment/Varieties Control T1 T2 T3 T4 T5 T6 T7 T8 MeanKRL 370 8.88 7.35 6.85 7.88 7.19 7.52 6.62 6.24 5.64 7.13AKRL 433 9.30 6.83 6.06 6.85 6.72 7.16 6.38 6.17 5.70 6.8BHD 2888 8.52 6.88 6.07 5.80 4.81 6.09 4.88 4.80 3.99 5.76DKRL 283 9.05 7.39 6.91 7.74 7.05 7.43 6.31 5.75 5.28 6.99ABWH 1080 8.63 7.58 7.10 7.58 6.08 6.06 5.11 5.02 4.51 6.41CC 306 7.55 6.39 5.62 4.39 4.12 4.35 3.99 3.14 2.35 4.66FKRL 330 8.94 7.53 6.98 8.27 7.09 7.03 6.50 5.63 4.85 6.98ABKRL 210 8.33 7.35 6.43 7.44 6.32 6.51 5.62 5.35 4.57 6.43CKh-65 7.55 7.14 6.35 7.24 5.90 5.99 5.03 4.26 4.02 5.94DHD 2851 8.10 7.04 5.63 5.79 4.45 4.93 4.35 3.90 3.23 5.27EHD 2009 8.08 6.96 5.54 5.38 4.32 5.00 4.26 3.58 2.51 5.07EGeneral Mean 8.45A 7.13B 6.32D 6.76C 5.82E 6.19D 5.37F 4.89G 4.24H LSD @ 5% Varieties : 0.27 Treatment : 0.22 Treatment means at same level of varieties : 0.72 Varieties means at same or different level of Treatment : 0.73
T1: 25% Water De�cit; T2: 50% Water De�cit; T3: 50 mM NaCl; T4: 100 mM NaCl; T5: 25% Water De�cit + 50 mM NaCl; T6: 25% Water De�cit + 100 mM NaCl; T7: 50% Water De�cit + 50 mM NaCl; T8: 50% Water De�cit + 100 mM NaCl
Biomass (g) was also reduced with increasing stress conditions and maximum mean biomass was observed for Kharchia 65 and minimum for HD 2009. Under combined stresses of 100 mM NaCl + 50 % WD, higher biomass was recorded for KRL 433 (13.65 g) followed by C-306 (13.42g) and KRL 283 (13.01 g). Grain yield was signi�cantly reduced in
-1 -1all the genotypes and higher grain yield was recorded in KRL 370 i.e. 7.13 g plant dS m -1followed by KRL 283 and KRL 330 (6.98 g plant ) and lowest was recorded in C-306 (4.66 g
-1plant ) Table 50.
Phytoremediation potential of selected halophytes for salt affected lands of Haryana (Ashwani Kumar, Arvind Kumar, BL Meena and Anita Mann) – RKVY funded
Under this project, we have surveyed salt affected sites of Hisar, Sonipat, Jhajjar, Rohtak etc. of Haryana and collected soil/water samples. From these sites we also collected about 20 halophytic plant species namely Heliotropium ramossimum, Arva tomentosa, Casia tora, Withania somnifera, Atriplex amnicola, Setaria gluaca, Chenopodium ambryosoides, Portulaca portucalustrum, Atriplex nummularia, Atriplex lentiformis, Tamarix sp., Arundodonax, Suaeda fruticosa, Suaeda nudi�ora, Aelurolopus lagopoides, Leptachloa fusca, wild quinoa and Dicanthium annulatum that were grown naturally under the problematic soils. These halophytic species were established and maintained in microplots under natural conditions.
Morpho-physiological characterization and standardization of agronomic practices of quinoa (Chenopodium quinoa) for salt affected agro-ecosystems (Kailash Prajapat, S.K. Sanwal and P.C. Sharma)
Breeding crops for salinity tolerance is one of the major pathways to bring saline soils along with saline water under use for agricultural production. Nature has its own ways to combat every environmental stress and has evolved plants acclimatized to adverse ecology. There are certain crop plants which naturally have inherent tolerance to wider
90
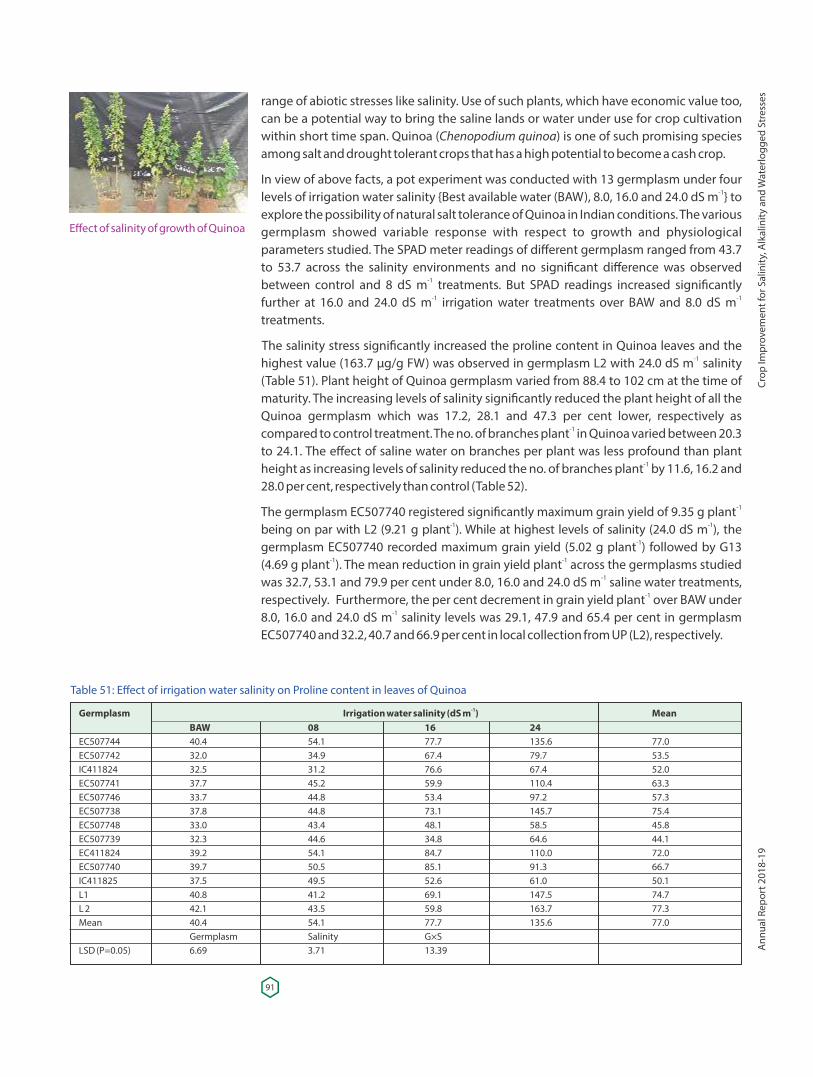
Effect of salinity of growth of Quinoa
Table 51: Effect of irrigation water salinity on Proline content in leaves of Quinoa -1Germplasm Irrigation water salinity (dS m ) Mean
BAW 08 16 24 EC507744 40.4 54.1 77.7 135.6 77.0EC507742 32.0 34.9 67.4 79.7 53.5IC411824 32.5 31.2 76.6 67.4 52.0EC507741 37.7 45.2 59.9 110.4 63.3EC507746 33.7 44.8 53.4 97.2 57.3EC507738 37.8 44.8 73.1 145.7 75.4EC507748 33.0 43.4 48.1 58.5 45.8EC507739 32.3 44.6 34.8 64.6 44.1EC411824 39.2 54.1 84.7 110.0 72.0EC507740 39.7 50.5 85.1 91.3 66.7IC411825 37.5 49.5 52.6 61.0 50.1L1 40.8 41.2 69.1 147.5 74.7L 2 42.1 43.5 59.8 163.7 77.3Mean 40.4 54.1 77.7 135.6 77.0 Germplasm Salinity G×S LSD (P=0.05) 6.69 3.71 13.39
range of abiotic stresses like salinity. Use of such plants, which have economic value too, can be a potential way to bring the saline lands or water under use for crop cultivation within short time span. Quinoa (Chenopodium quinoa) is one of such promising species among salt and drought tolerant crops that has a high potential to become a cash crop.
In view of above facts, a pot experiment was conducted with 13 germplasm under four -1levels of irrigation water salinity {Best available water (BAW), 8.0, 16.0 and 24.0 dS m } to
explore the possibility of natural salt tolerance of Quinoa in Indian conditions. The various germplasm showed variable response with respect to growth and physiological parameters studied. The SPAD meter readings of different germplasm ranged from 43.7 to 53.7 across the salinity environments and no signi�cant difference was observed
-1between control and 8 dS m treatments. But SPAD readings increased signi�cantly -1 -1further at 16.0 and 24.0 dS m irrigation water treatments over BAW and 8.0 dS m
treatments.
The salinity stress signi�cantly increased the proline content in Quinoa leaves and the -1highest value (163.7 µg/g FW) was observed in germplasm L2 with 24.0 dS m salinity
(Table 51). Plant height of Quinoa germplasm varied from 88.4 to 102 cm at the time of maturity. The increasing levels of salinity signi�cantly reduced the plant height of all the Quinoa germplasm which was 17.2, 28.1 and 47.3 per cent lower, respectively as
-1compared to control treatment. The no. of branches plant in Quinoa varied between 20.3 to 24.1. The effect of saline water on branches per plant was less profound than plant
-1height as increasing levels of salinity reduced the no. of branches plant by 11.6, 16.2 and 28.0 per cent, respectively than control (Table 52).
-1The germplasm EC507740 registered signi�cantly maximum grain yield of 9.35 g plant -1 -1being on par with L2 (9.21 g plant ). While at highest levels of salinity (24.0 dS m ), the
-1germplasm EC507740 recorded maximum grain yield (5.02 g plant ) followed by G13 -1 -1(4.69 g plant ). The mean reduction in grain yield plant across the germplasms studied
-1was 32.7, 53.1 and 79.9 per cent under 8.0, 16.0 and 24.0 dS m saline water treatments, -1respectively. Furthermore, the per cent decrement in grain yield plant over BAW under
-18.0, 16.0 and 24.0 dS m salinity levels was 29.1, 47.9 and 65.4 per cent in germplasm EC507740 and 32.2, 40.7 and 66.9 per cent in local collection from UP (L2), respectively.
91
Crop
Impr
ovem
ent f
or S
alin
ity, A
lkal
inity
and
Wat
erlo
gged
Str
esse
sA
nnua
l Rep
ort 2
018-
19
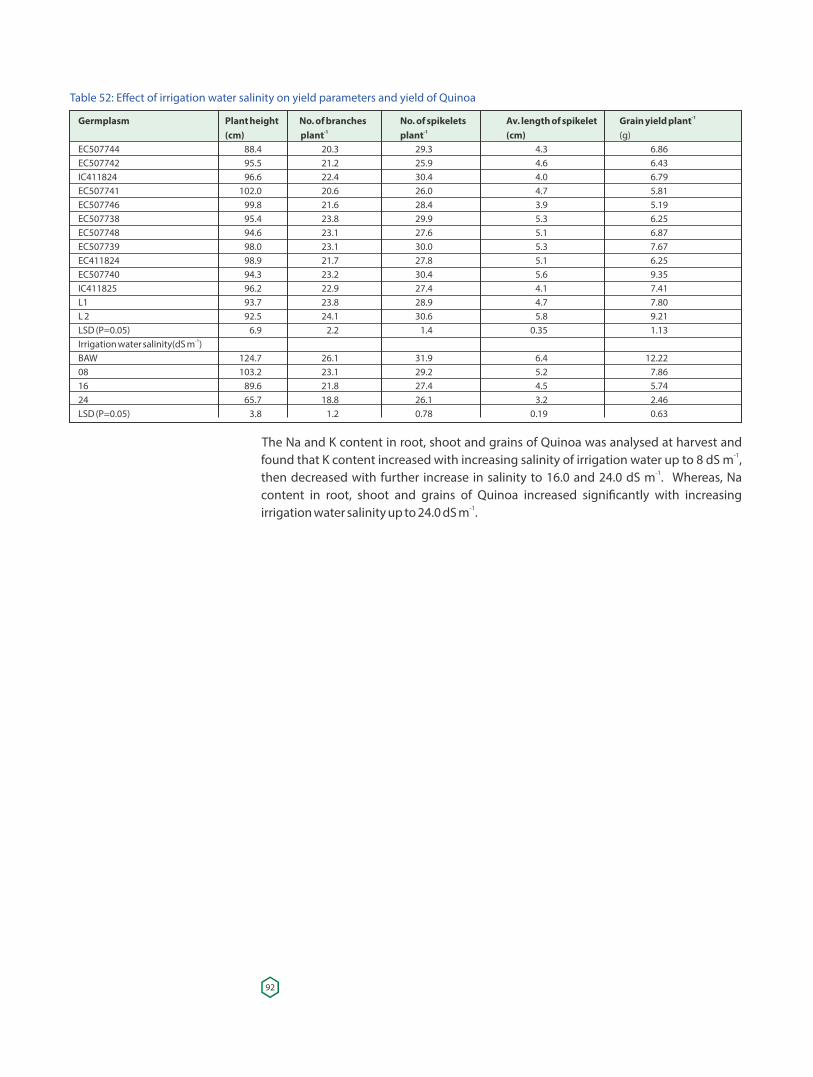
The Na and K content in root, shoot and grains of Quinoa was analysed at harvest and -1found that K content increased with increasing salinity of irrigation water up to 8 dS m ,
-1then decreased with further increase in salinity to 16.0 and 24.0 dS m . Whereas, Na content in root, shoot and grains of Quinoa increased signi�cantly with increasing
-1irrigation water salinity up to 24.0 dS m .
Table 52: Effect of irrigation water salinity on yield parameters and yield of Quinoa-1 Germplasm Plant height No. of branches No. of spikelets Av. length of spikelet Grain yield plant
-1 -1 (cm) plant plant (cm) (g)EC507744 88.4 20.3 29.3 4.3 6.86EC507742 95.5 21.2 25.9 4.6 6.43IC411824 96.6 22.4 30.4 4.0 6.79EC507741 102.0 20.6 26.0 4.7 5.81EC507746 99.8 21.6 28.4 3.9 5.19EC507738 95.4 23.8 29.9 5.3 6.25EC507748 94.6 23.1 27.6 5.1 6.87EC507739 98.0 23.1 30.0 5.3 7.67EC411824 98.9 21.7 27.8 5.1 6.25EC507740 94.3 23.2 30.4 5.6 9.35IC411825 96.2 22.9 27.4 4.1 7.41L1 93.7 23.8 28.9 4.7 7.80L 2 92.5 24.1 30.6 5.8 9.21LSD (P=0.05) 6.9 2.2 1.4 0.35 1.13
-1Irrigation water salinity(dS m )BAW 124.7 26.1 31.9 6.4 12.2208 103.2 23.1 29.2 5.2 7.8616 89.6 21.8 27.4 4.5 5.7424 65.7 18.8 26.1 3.2 2.46LSD (P=0.05) 3.8 1.2 0.78 0.19 0.63
92
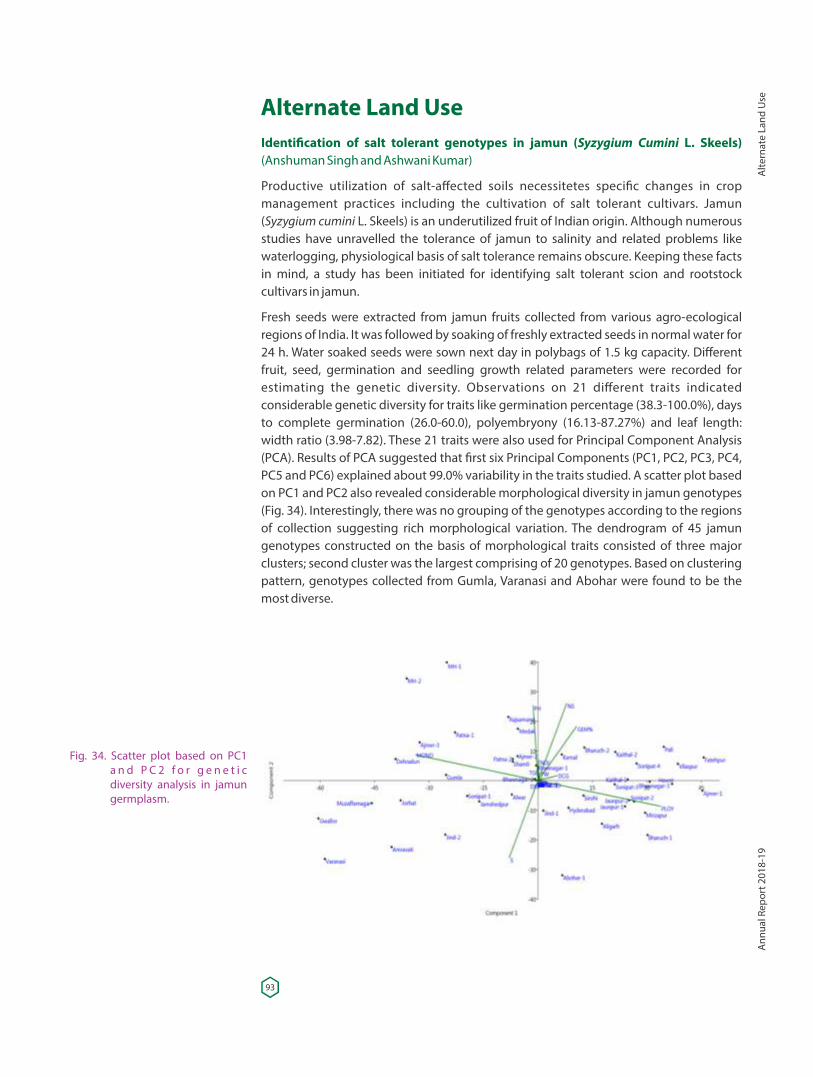
Alternate Land UseIdenti�cation of salt tolerant genotypes in jamun (Syzygium Cumini L. Skeels) (Anshuman Singh and Ashwani Kumar)
Productive utilization of salt-affected soils necessitetes speci�c changes in crop management practices including the cultivation of salt tolerant cultivars. Jamun (Syzygium cumini L. Skeels) is an underutilized fruit of Indian origin. Although numerous studies have unravelled the tolerance of jamun to salinity and related problems like waterlogging, physiological basis of salt tolerance remains obscure. Keeping these facts in mind, a study has been initiated for identifying salt tolerant scion and rootstock cultivars in jamun.
Fresh seeds were extracted from jamun fruits collected from various agro-ecological regions of India. It was followed by soaking of freshly extracted seeds in normal water for 24 h. Water soaked seeds were sown next day in polybags of 1.5 kg capacity. Different fruit, seed, germination and seedling growth related parameters were recorded for estimating the genetic diversity. Observations on 21 different traits indicated considerable genetic diversity for traits like germination percentage (38.3-100.0%), days to complete germination (26.0-60.0), polyembryony (16.13-87.27%) and leaf length: width ratio (3.98-7.82). These 21 traits were also used for Principal Component Analysis (PCA). Results of PCA suggested that �rst six Principal Components (PC1, PC2, PC3, PC4, PC5 and PC6) explained about 99.0% variability in the traits studied. A scatter plot based on PC1 and PC2 also revealed considerable morphological diversity in jamun genotypes (Fig. 34). Interestingly, there was no grouping of the genotypes according to the regions of collection suggesting rich morphological variation. The dendrogram of 45 jamun genotypes constructed on the basis of morphological traits consisted of three major clusters; second cluster was the largest comprising of 20 genotypes. Based on clustering pattern, genotypes collected from Gumla, Varanasi and Abohar were found to be the most diverse.
Fig. 34. Scatter plot based on PC1 a n d P C 2 f o r g e n e t i c diversity analysis in jamun germplasm.
93
Alte
rnat
e La
nd U
seA
nnua
l Rep
ort 2
018-
19
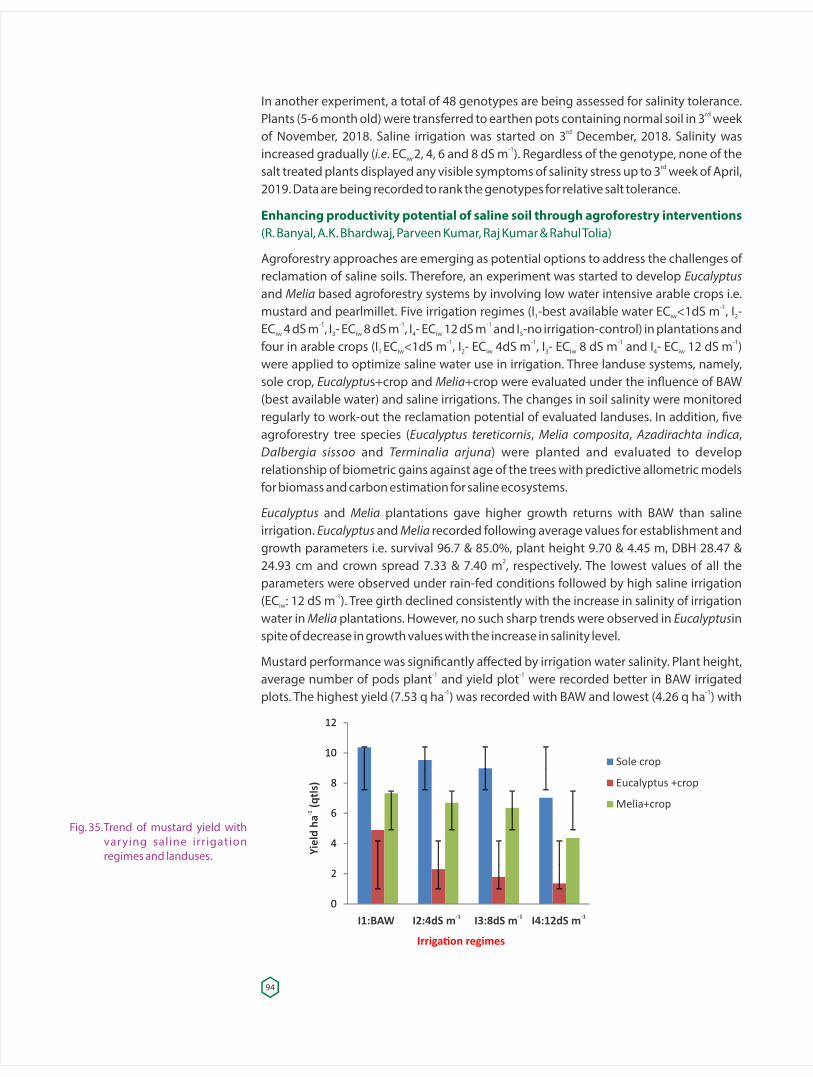
In another experiment, a total of 48 genotypes are being assessed for salinity tolerance. rdPlants (5-6 month old) were transferred to earthen pots containing normal soil in 3 week
rdof November, 2018. Saline irrigation was started on 3 December, 2018. Salinity was -1increased gradually (i.e. EC 2, 4, 6 and 8 dS m ). Regardless of the genotype, none of the iw
rdsalt treated plants displayed any visible symptoms of salinity stress up to 3 week of April, 2019. Data are being recorded to rank the genotypes for relative salt tolerance.
Enhancing productivity potential of saline soil through agroforestry interventions (R. Banyal, A.K. Bhardwaj, Parveen Kumar, Raj Kumar & Rahul Tolia)
Agroforestry approaches are emerging as potential options to address the challenges of reclamation of saline soils. Therefore, an experiment was started to develop Eucalyptus and Melia based agroforestry systems by involving low water intensive arable crops i.e.
-1mustard and pearlmillet. Five irrigation regimes (I -best available water EC <1dS m , I - 1 iw 2-1 -1 -1EC 4 dS m , I - EC 8 dS m , I - EC 12 dS m and I -no irrigation-control) in plantations and iw 3 iw 4 iw 5
-1 -1 -1 -1four in arable crops (I EC <1dS m , I - EC 4dS m , I - EC 8 dS m and I - EC 12 dS m ) 1 iw 2 iw 3 iw 4 iw
were applied to optimize saline water use in irrigation. Three landuse systems, namely, sole crop, Eucalyptus+crop and Melia+crop were evaluated under the in�uence of BAW (best available water) and saline irrigations. The changes in soil salinity were monitored regularly to work-out the reclamation potential of evaluated landuses. In addition, �ve agroforestry tree species (Eucalyptus tereticornis, Melia composita, Azadirachta indica, Dalbergia sissoo and Terminalia arjuna) were planted and evaluated to develop relationship of biometric gains against age of the trees with predictive allometric models for biomass and carbon estimation for saline ecosystems.
Eucalyptus and Melia plantations gave higher growth returns with BAW than saline irrigation. Eucalyptus and Melia recorded following average values for establishment and growth parameters i.e. survival 96.7 & 85.0%, plant height 9.70 & 4.45 m, DBH 28.47 &
224.93 cm and crown spread 7.33 & 7.40 m , respectively. The lowest values of all the parameters were observed under rain-fed conditions followed by high saline irrigation
-1(EC : 12 dS m ). Tree girth declined consistently with the increase in salinity of irrigation iw
water in Melia plantations. However, no such sharp trends were observed in Eucalyptusin spite of decrease in growth values with the increase in salinity level.
Mustard performance was signi�cantly affected by irrigation water salinity. Plant height, -1 -1average number of pods plant and yield plot were recorded better in BAW irrigated
-1 -1plots. The highest yield (7.53 q ha ) was recorded with BAW and lowest (4.26 q ha ) with
Fig. 35. Trend of mustard yield with varying saline irrigation regimes and landuses.
0
2
4
6
8
10
12
I1:BAW -1I2:4dS m -1I3:8dS m -1I4:12dS m
-1Y
ield
ha
(q
tls)
Irriga�on regimes
Sole crop
Eucalyptus +crop
Melia+crop
94
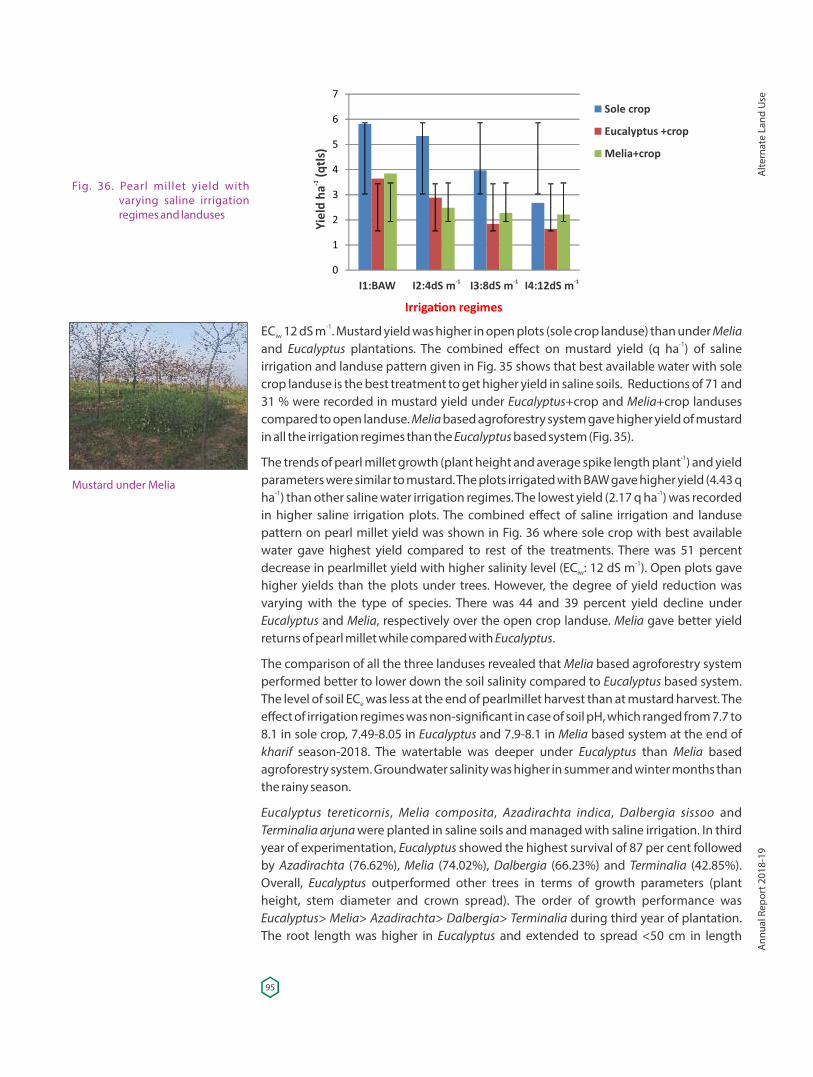
-1EC 12 dS m . Mustard yield was higher in open plots (sole crop landuse) than under Melia iw-1and Eucalyptus plantations. The combined effect on mustard yield (q ha ) of saline
irrigation and landuse pattern given in Fig. 35 shows that best available water with sole crop landuse is the best treatment to get higher yield in saline soils. Reductions of 71 and 31 % were recorded in mustard yield under Eucalyptus+crop and Melia+crop landuses compared to open landuse. Melia based agroforestry system gave higher yield of mustard in all the irrigation regimes than the Eucalyptus based system (Fig. 35).
-1The trends of pearl millet growth (plant height and average spike length plant ) and yield parameters were similar to mustard. The plots irrigated with BAW gave higher yield (4.43 q
-1 -1ha ) than other saline water irrigation regimes. The lowest yield (2.17 q ha ) was recorded in higher saline irrigation plots. The combined effect of saline irrigation and landuse pattern on pearl millet yield was shown in Fig. 36 where sole crop with best available water gave highest yield compared to rest of the treatments. There was 51 percent
-1decrease in pearlmillet yield with higher salinity level (EC : 12 dS m ). Open plots gave iw
higher yields than the plots under trees. However, the degree of yield reduction was varying with the type of species. There was 44 and 39 percent yield decline under Eucalyptus and Melia, respectively over the open crop landuse. Melia gave better yield returns of pearl millet while compared with Eucalyptus.
The comparison of all the three landuses revealed that Melia based agroforestry system performed better to lower down the soil salinity compared to Eucalyptus based system. The level of soil EC was less at the end of pearlmillet harvest than at mustard harvest. The e
effect of irrigation regimes was non-signi�cant in case of soil pH, which ranged from 7.7 to 8.1 in sole crop, 7.49-8.05 in Eucalyptus and 7.9-8.1 in Melia based system at the end of kharif season-2018. The watertable was deeper under Eucalyptus than Melia based agroforestry system. Groundwater salinity was higher in summer and winter months than the rainy season.
Eucalyptus tereticornis, Melia composita, Azadirachta indica, Dalbergia sissoo and Terminalia arjuna were planted in saline soils and managed with saline irrigation. In third year of experimentation, Eucalyptus showed the highest survival of 87 per cent followed by Azadirachta (76.62%), Melia (74.02%), Dalbergia (66.23%) and Terminalia (42.85%). Overall, Eucalyptus outperformed other trees in terms of growth parameters (plant height, stem diameter and crown spread). The order of growth performance was Eucalyptus> Melia> Azadirachta> Dalbergia> Terminalia during third year of plantation. The root length was higher in Eucalyptus and extended to spread <50 cm in length
Fig. 36. Pearl millet yield with varying saline irrigation regimes and landuses
Mustard under Melia
0
1
2
3
4
5
6
7
I1:BAW -1I2:4dS m -1I3:8dS m -1I4:12dS m
-1Y
ield
ha
(q
tls)
Irriga�on regimes
Sole crop
Eucalyptus +crop
Melia+crop
95
Alte
rnat
e La
nd U
seA
nnua
l Rep
ort 2
018-
19
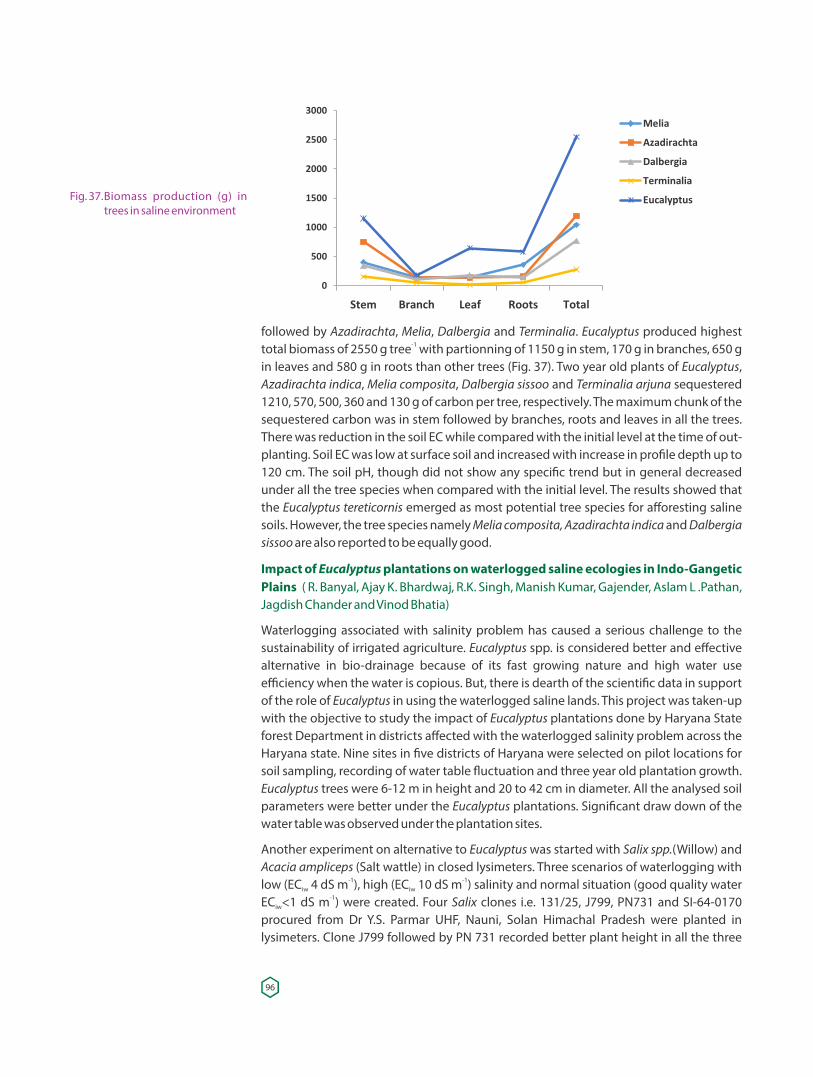
followed by Azadirachta, Melia, Dalbergia and Terminalia. Eucalyptus produced highest -1total biomass of 2550 g tree with partionning of 1150 g in stem, 170 g in branches, 650 g
in leaves and 580 g in roots than other trees (Fig. 37). Two year old plants of Eucalyptus, Azadirachta indica, Melia composita, Dalbergia sissoo and Terminalia arjuna sequestered 1210, 570, 500, 360 and 130 g of carbon per tree, respectively. The maximum chunk of the sequestered carbon was in stem followed by branches, roots and leaves in all the trees. There was reduction in the soil EC while compared with the initial level at the time of out-planting. Soil EC was low at surface soil and increased with increase in pro�le depth up to 120 cm. The soil pH, though did not show any speci�c trend but in general decreased under all the tree species when compared with the initial level. The results showed that the Eucalyptus tereticornis emerged as most potential tree species for afforesting saline soils. However, the tree species namely Melia composita, Azadirachta indica and Dalbergia sissoo are also reported to be equally good.
Impact of Eucalyptus plantations on waterlogged saline ecologies in Indo-Gangetic Plains ( R. Banyal, Ajay K. Bhardwaj, R.K. Singh, Manish Kumar, Gajender, Aslam L .Pathan, Jagdish Chander and Vinod Bhatia)
Waterlogging associated with salinity problem has caused a serious challenge to the sustainability of irrigated agriculture. Eucalyptus spp. is considered better and effective alternative in bio-drainage because of its fast growing nature and high water use efficiency when the water is copious. But, there is dearth of the scienti�c data in support of the role of Eucalyptus in using the waterlogged saline lands. This project was taken-up with the objective to study the impact of Eucalyptus plantations done by Haryana State forest Department in districts affected with the waterlogged salinity problem across the Haryana state. Nine sites in �ve districts of Haryana were selected on pilot locations for soil sampling, recording of water table �uctuation and three year old plantation growth. Eucalyptus trees were 6-12 m in height and 20 to 42 cm in diameter. All the analysed soil parameters were better under the Eucalyptus plantations. Signi�cant draw down of the water table was observed under the plantation sites.
Another experiment on alternative to Eucalyptus was started with Salix spp.(Willow) and Acacia ampliceps (Salt wattle) in closed lysimeters. Three scenarios of waterlogging with
-1 -1low (EC 4 dS m ), high (EC 10 dS m ) salinity and normal situation (good quality water iw iw-1EC <1 dS m ) were created. Four Salix clones i.e. 131/25, J799, PN731 and SI-64-0170 iw
procured from Dr Y.S. Parmar UHF, Nauni, Solan Himachal Pradesh were planted in lysimeters. Clone J799 followed by PN 731 recorded better plant height in all the three
Fig. 37. Biomass production (g) in trees in saline environment
96
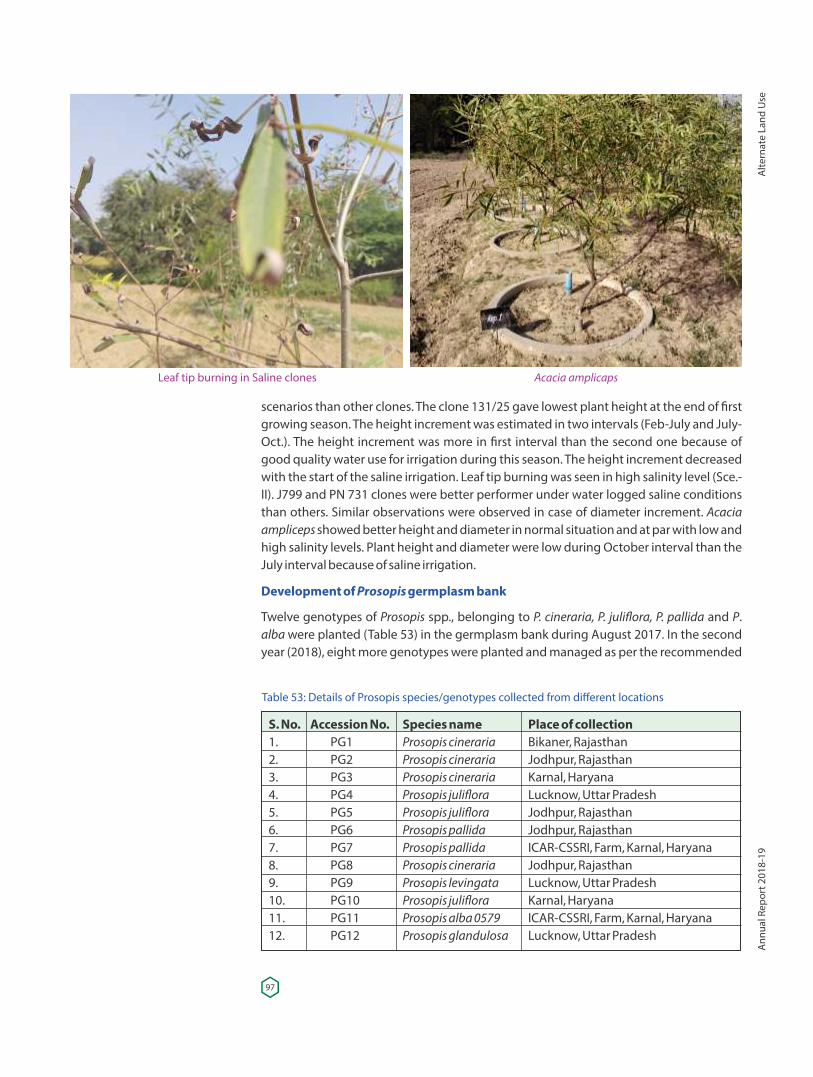
scenarios than other clones. The clone 131/25 gave lowest plant height at the end of �rst growing season. The height increment was estimated in two intervals (Feb-July and July-Oct.). The height increment was more in �rst interval than the second one because of good quality water use for irrigation during this season. The height increment decreased with the start of the saline irrigation. Leaf tip burning was seen in high salinity level (Sce.-II). J799 and PN 731 clones were better performer under water logged saline conditions than others. Similar observations were observed in case of diameter increment. Acacia ampliceps showed better height and diameter in normal situation and at par with low and high salinity levels. Plant height and diameter were low during October interval than the July interval because of saline irrigation.
Development of Prosopis germplasm bank
Twelve genotypes of Prosopis spp., belonging to P. cineraria, P. juli�ora, P. pallida and P. alba were planted (Table 53) in the germplasm bank during August 2017. In the second year (2018), eight more genotypes were planted and managed as per the recommended
Table 53: Details of Prosopis species/genotypes collected from different locations
S. No. Accession No. Species name Place of collection1. PG1 Prosopis cineraria Bikaner, Rajasthan2. PG2 Prosopis cineraria Jodhpur, Rajasthan3. PG3 Prosopis cineraria Karnal, Haryana4. PG4 Prosopis juli�ora Lucknow, Uttar Pradesh5. PG5 Prosopis juli�ora Jodhpur, Rajasthan6. PG6 Prosopis pallida Jodhpur, Rajasthan7. PG7 Prosopis pallida ICAR-CSSRI, Farm, Karnal, Haryana8. PG8 Prosopis cineraria Jodhpur, Rajasthan9. PG9 Prosopis levingata Lucknow, Uttar Pradesh10. PG10 Prosopis juli�ora Karnal, Haryana11. PG11 Prosopis alba 0579 ICAR-CSSRI, Farm, Karnal, Haryana12. PG12 Prosopis glandulosa Lucknow, Uttar Pradesh
Leaf tip burning in Saline clones Acacia amplicaps
97
Alte
rnat
e La
nd U
seA
nnua
l Rep
ort 2
018-
19
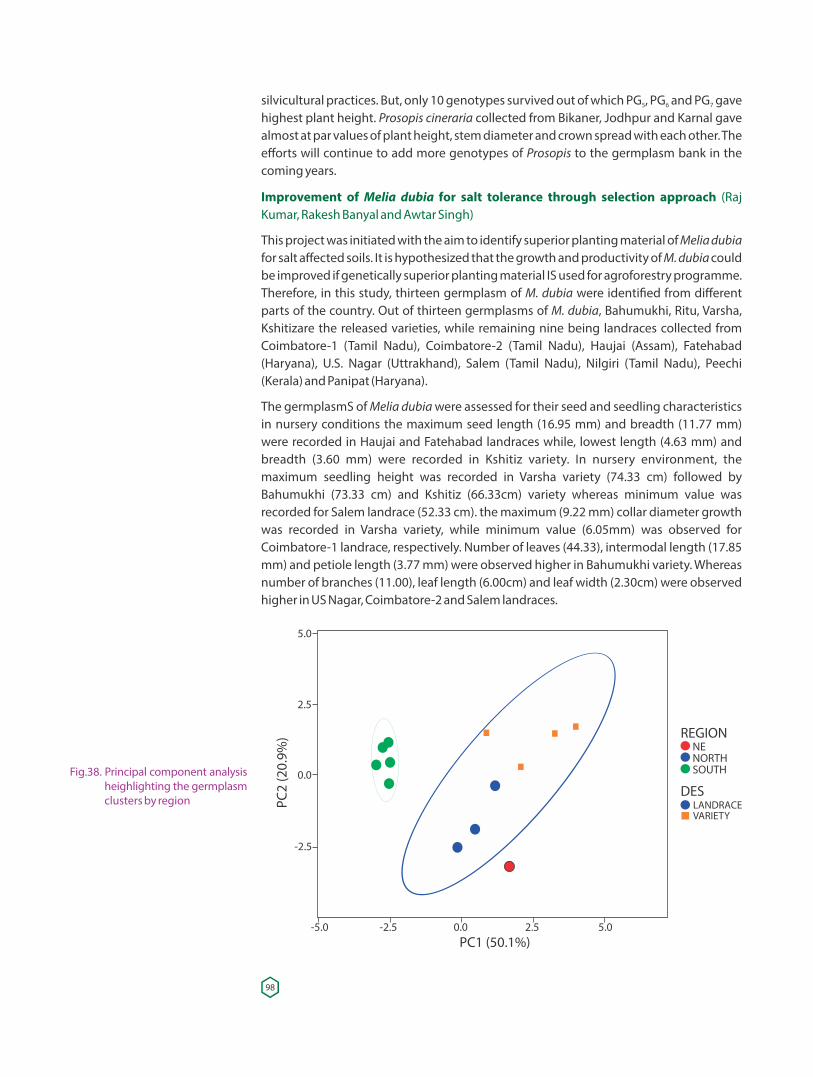
silvicultural practices. But, only 10 genotypes survived out of which PG , PG and PG gave 5 6 7
highest plant height. Prosopis cineraria collected from Bikaner, Jodhpur and Karnal gave almost at par values of plant height, stem diameter and crown spread with each other. The efforts will continue to add more genotypes of Prosopis to the germplasm bank in the coming years.
Improvement of Melia dubia for salt tolerance through selection approach (Raj Kumar, Rakesh Banyal and Awtar Singh)
This project was initiated with the aim to identify superior planting material of Melia dubia for salt affected soils. It is hypothesized that the growth and productivity of M. dubia could be improved if genetically superior planting material IS used for agroforestry programme. Therefore, in this study, thirteen germplasm of M. dubia were identi�ed from different parts of the country. Out of thirteen germplasms of M. dubia, Bahumukhi, Ritu, Varsha, Kshitizare the released varieties, while remaining nine being landraces collected from Coimbatore-1 (Tamil Nadu), Coimbatore-2 (Tamil Nadu), Haujai (Assam), Fatehabad (Haryana), U.S. Nagar (Uttrakhand), Salem (Tamil Nadu), Nilgiri (Tamil Nadu), Peechi (Kerala) and Panipat (Haryana).
The germplasmS of Melia dubia were assessed for their seed and seedling characteristics in nursery conditions the maximum seed length (16.95 mm) and breadth (11.77 mm) were recorded in Haujai and Fatehabad landraces while, lowest length (4.63 mm) and breadth (3.60 mm) were recorded in Kshitiz variety. In nursery environment, the maximum seedling height was recorded in Varsha variety (74.33 cm) followed by Bahumukhi (73.33 cm) and Kshitiz (66.33cm) variety whereas minimum value was recorded for Salem landrace (52.33 cm). the maximum (9.22 mm) collar diameter growth was recorded in Varsha variety, while minimum value (6.05mm) was observed for Coimbatore-1 landrace, respectively. Number of leaves (44.33), intermodal length (17.85 mm) and petiole length (3.77 mm) were observed higher in Bahumukhi variety. Whereas number of branches (11.00), leaf length (6.00cm) and leaf width (2.30cm) were observed higher in US Nagar, Coimbatore-2 and Salem landraces.
Fig.38. Principal component analysis heighlighting the germplasm clusters by region LANDRACE
VARIETY
REGIONNENORTHSOUTH
DES
5.0
2.5
0.0
-2.5
PC2
(20.
9%)
-5.0 -2.5 0.0 2.5 5.0PC1 (50.1%)
98
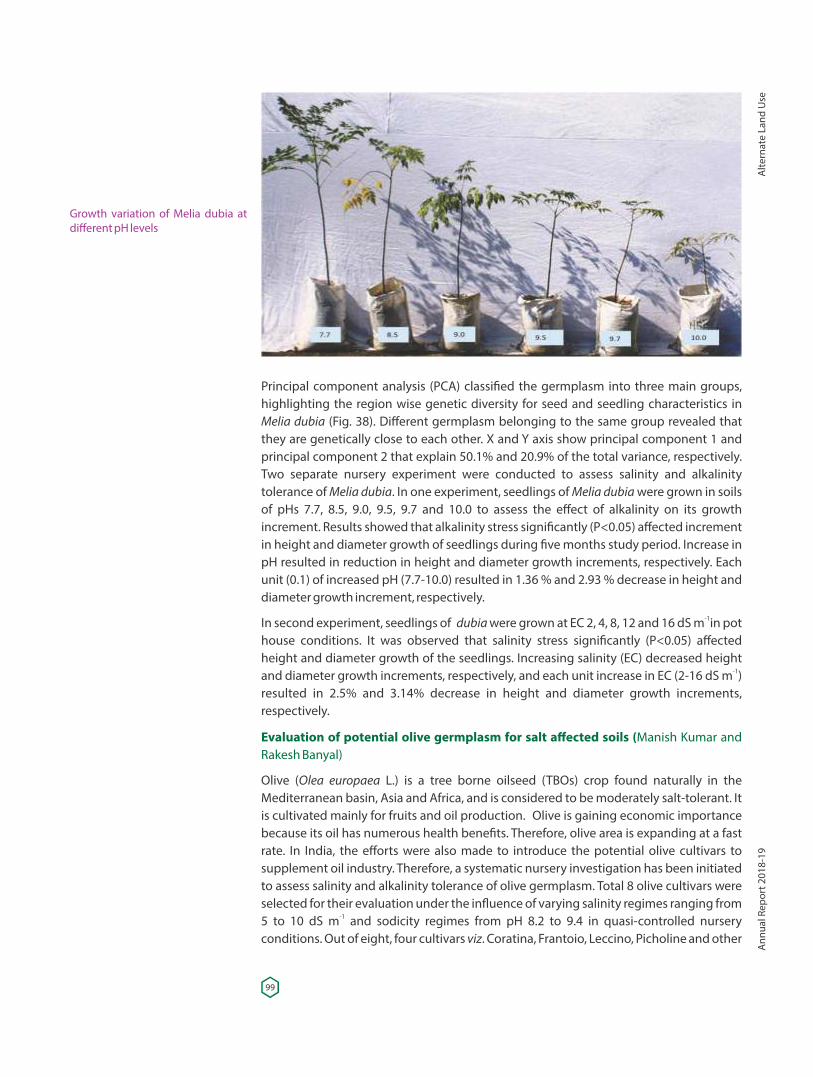
Principal component analysis (PCA) classi�ed the germplasm into three main groups, highlighting the region wise genetic diversity for seed and seedling characteristics in Melia dubia (Fig. 38). Different germplasm belonging to the same group revealed that they are genetically close to each other. X and Y axis show principal component 1 and principal component 2 that explain 50.1% and 20.9% of the total variance, respectively. Two separate nursery experiment were conducted to assess salinity and alkalinity tolerance of Melia dubia. In one experiment, seedlings of Melia dubia were grown in soils of pHs 7.7, 8.5, 9.0, 9.5, 9.7 and 10.0 to assess the effect of alkalinity on its growth increment. Results showed that alkalinity stress signi�cantly (P<0.05) affected increment in height and diameter growth of seedlings during �ve months study period. Increase in pH resulted in reduction in height and diameter growth increments, respectively. Each unit (0.1) of increased pH (7.7-10.0) resulted in 1.36 % and 2.93 % decrease in height and diameter growth increment, respectively.
-1In second experiment, seedlings of dubia were grown at EC 2, 4, 8, 12 and 16 dS m in pot house conditions. It was observed that salinity stress signi�cantly (P<0.05) affected height and diameter growth of the seedlings. Increasing salinity (EC) decreased height
-1and diameter growth increments, respectively, and each unit increase in EC (2-16 dS m ) resulted in 2.5% and 3.14% decrease in height and diameter growth increments, respectively.
Evaluation of potential olive germplasm for salt affected soils (Manish Kumar and Rakesh Banyal)
Olive (Olea europaea L.) is a tree borne oilseed (TBOs) crop found naturally in the Mediterranean basin, Asia and Africa, and is considered to be moderately salt-tolerant. It is cultivated mainly for fruits and oil production. Olive is gaining economic importance because its oil has numerous health bene�ts. Therefore, olive area is expanding at a fast rate. In India, the efforts were also made to introduce the potential olive cultivars to supplement oil industry. Therefore, a systematic nursery investigation has been initiated to assess salinity and alkalinity tolerance of olive germplasm. Total 8 olive cultivars were selected for their evaluation under the in�uence of varying salinity regimes ranging from
-15 to 10 dS m and sodicity regimes from pH 8.2 to 9.4 in quasi-controlled nursery conditions. Out of eight, four cultivars viz. Coratina, Frantoio, Leccino, Picholine and other
Growth variation of Melia dubia at different pH levels
99
Alte
rnat
e La
nd U
seA
nnua
l Rep
ort 2
018-
19
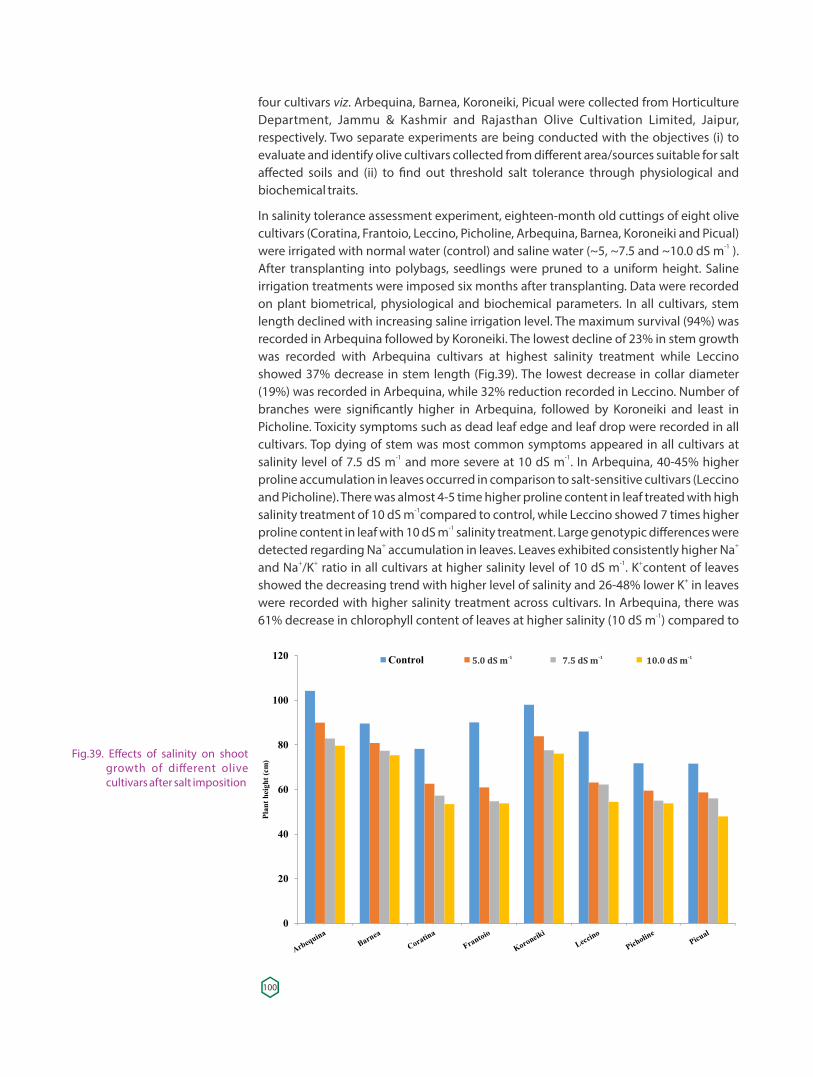
four cultivars viz. Arbequina, Barnea, Koroneiki, Picual were collected from Horticulture Department, Jammu & Kashmir and Rajasthan Olive Cultivation Limited, Jaipur, respectively. Two separate experiments are being conducted with the objectives (i) to evaluate and identify olive cultivars collected from different area/sources suitable for salt affected soils and (ii) to �nd out threshold salt tolerance through physiological and biochemical traits.
In salinity tolerance assessment experiment, eighteen-month old cuttings of eight olive cultivars (Coratina, Frantoio, Leccino, Picholine, Arbequina, Barnea, Koroneiki and Picual)
-1were irrigated with normal water (control) and saline water (~5, ~7.5 and ~10.0 dS m ). After transplanting into polybags, seedlings were pruned to a uniform height. Saline irrigation treatments were imposed six months after transplanting. Data were recorded on plant biometrical, physiological and biochemical parameters. In all cultivars, stem length declined with increasing saline irrigation level. The maximum survival (94%) was recorded in Arbequina followed by Koroneiki. The lowest decline of 23% in stem growth was recorded with Arbequina cultivars at highest salinity treatment while Leccino showed 37% decrease in stem length (Fig.39). The lowest decrease in collar diameter (19%) was recorded in Arbequina, while 32% reduction recorded in Leccino. Number of branches were signi�cantly higher in Arbequina, followed by Koroneiki and least in Picholine. Toxicity symptoms such as dead leaf edge and leaf drop were recorded in all cultivars. Top dying of stem was most common symptoms appeared in all cultivars at
-1 -1salinity level of 7.5 dS m and more severe at 10 dS m . In Arbequina, 40-45% higher proline accumulation in leaves occurred in comparison to salt-sensitive cultivars (Leccino and Picholine). There was almost 4-5 time higher proline content in leaf treated with high
-1salinity treatment of 10 dS m compared to control, while Leccino showed 7 times higher -1proline content in leaf with 10 dS m salinity treatment. Large genotypic differences were
+ +detected regarding Na accumulation in leaves. Leaves exhibited consistently higher Na + + -1 +and Na /K ratio in all cultivars at higher salinity level of 10 dS m . K content of leaves
+showed the decreasing trend with higher level of salinity and 26-48% lower K in leaves were recorded with higher salinity treatment across cultivars. In Arbequina, there was
-161% decrease in chlorophyll content of leaves at higher salinity (10 dS m ) compared to
Fig.39. Effects of salinity on shoot growth of different olive cultivars after salt imposition
-15.0 dS m -17.5 dS m -110.0 dS m
100
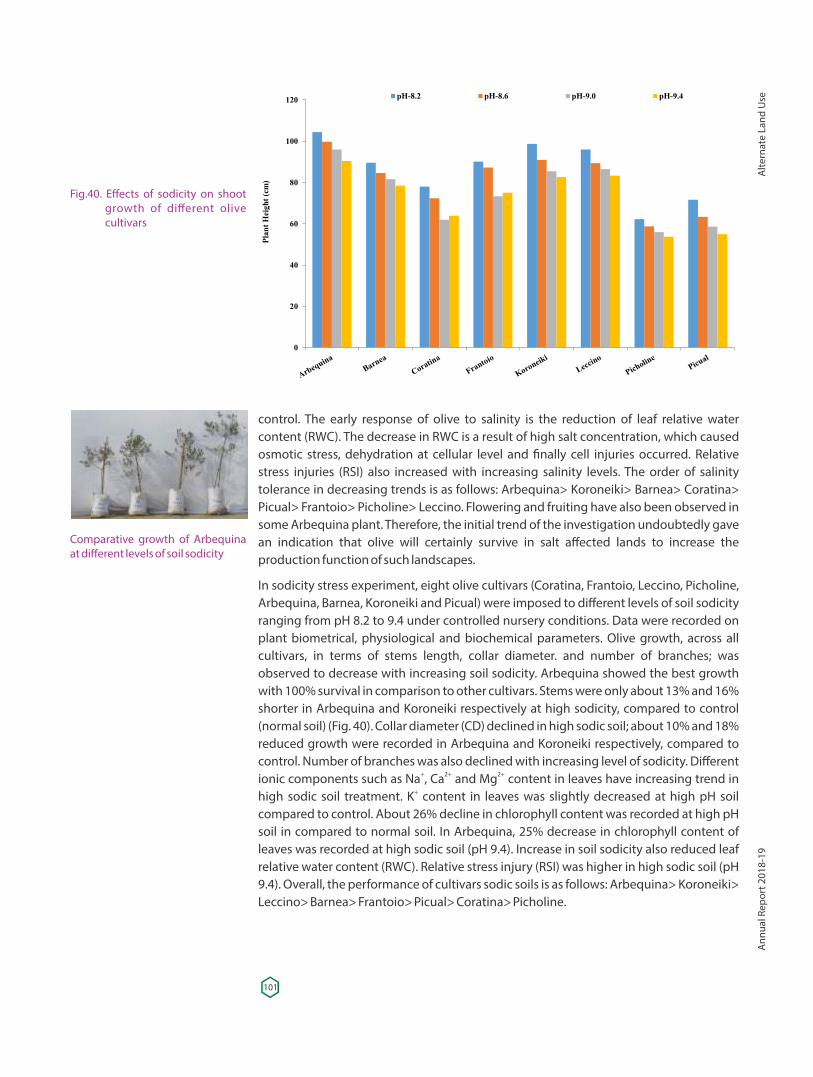
control. The early response of olive to salinity is the reduction of leaf relative water content (RWC). The decrease in RWC is a result of high salt concentration, which caused osmotic stress, dehydration at cellular level and �nally cell injuries occurred. Relative stress injuries (RSI) also increased with increasing salinity levels. The order of salinity tolerance in decreasing trends is as follows: Arbequina> Koroneiki> Barnea> Coratina> Picual> Frantoio> Picholine> Leccino. Flowering and fruiting have also been observed in some Arbequina plant. Therefore, the initial trend of the investigation undoubtedly gave an indication that olive will certainly survive in salt affected lands to increase the production function of such landscapes.
In sodicity stress experiment, eight olive cultivars (Coratina, Frantoio, Leccino, Picholine, Arbequina, Barnea, Koroneiki and Picual) were imposed to different levels of soil sodicity ranging from pH 8.2 to 9.4 under controlled nursery conditions. Data were recorded on plant biometrical, physiological and biochemical parameters. Olive growth, across all cultivars, in terms of stems length, collar diameter. and number of branches; was observed to decrease with increasing soil sodicity. Arbequina showed the best growth with 100% survival in comparison to other cultivars. Stems were only about 13% and 16% shorter in Arbequina and Koroneiki respectively at high sodicity, compared to control (normal soil) (Fig. 40). Collar diameter (CD) declined in high sodic soil; about 10% and 18% reduced growth were recorded in Arbequina and Koroneiki respectively, compared to control. Number of branches was also declined with increasing level of sodicity. Different
+ 2+ 2+ionic components such as Na , Ca and Mg content in leaves have increasing trend in +high sodic soil treatment. K content in leaves was slightly decreased at high pH soil
compared to control. About 26% decline in chlorophyll content was recorded at high pH soil in compared to normal soil. In Arbequina, 25% decrease in chlorophyll content of leaves was recorded at high sodic soil (pH 9.4). Increase in soil sodicity also reduced leaf relative water content (RWC). Relative stress injury (RSI) was higher in high sodic soil (pH 9.4). Overall, the performance of cultivars sodic soils is as follows: Arbequina> Koroneiki> Leccino> Barnea> Frantoio> Picual> Coratina> Picholine.
Fig.40. Effects of sodicity on shoot growth of different olive cultivars
Comparative growth of Arbequina at different levels of soil sodicity
101
Alte
rnat
e La
nd U
seA
nnua
l Rep
ort 2
018-
19
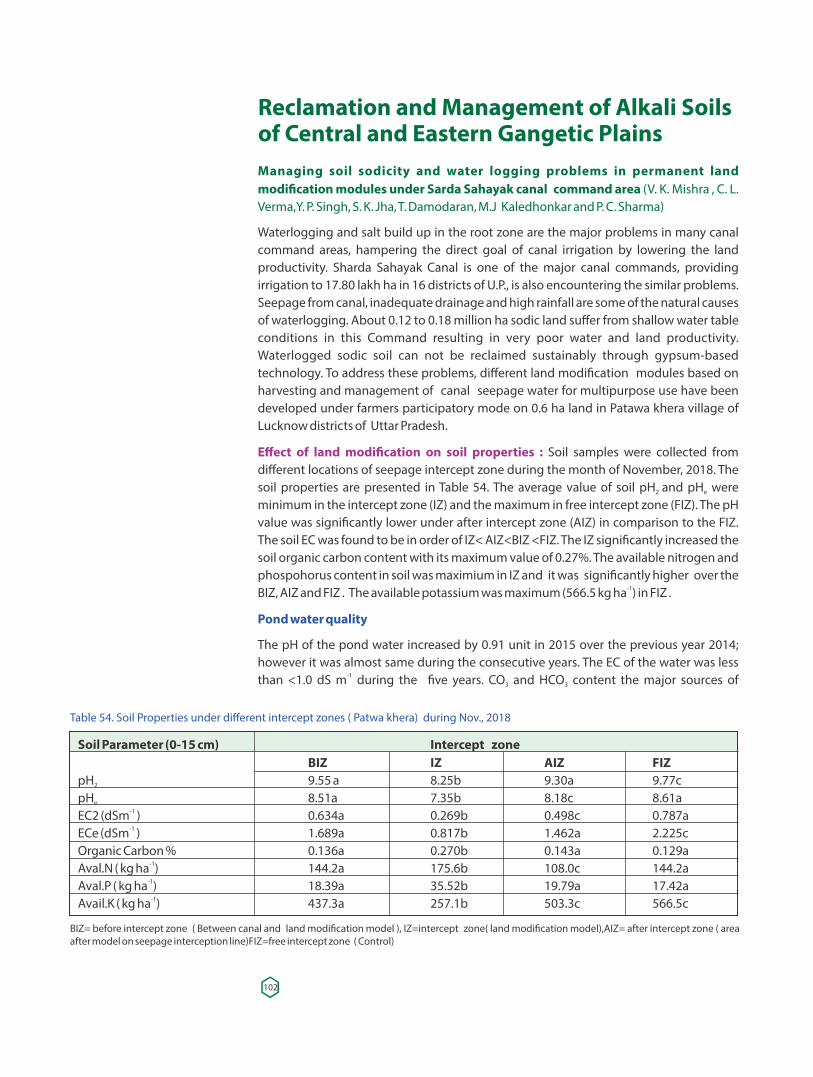
Reclamation and Management of Alkali Soilsof Central and Eastern Gangetic PlainsManaging soil sodicity and water logging problems in permanent land modi�cation modules under Sarda Sahayak canal command area (V. K. Mishra , C. L. Verma,Y. P. Singh, S. K. Jha, T. Damodaran, M.J Kaledhonkar and P. C. Sharma)
Waterlogging and salt build up in the root zone are the major problems in many canal command areas, hampering the direct goal of canal irrigation by lowering the land productivity. Sharda Sahayak Canal is one of the major canal commands, providing irrigation to 17.80 lakh ha in 16 districts of U.P., is also encountering the similar problems. Seepage from canal, inadequate drainage and high rainfall are some of the natural causes of waterlogging. About 0.12 to 0.18 million ha sodic land suffer from shallow water table conditions in this Command resulting in very poor water and land productivity. Waterlogged sodic soil can not be reclaimed sustainably through gypsum-based technology. To address these problems, different land modi�cation modules based on harvesting and management of canal seepage water for multipurpose use have been developed under farmers participatory mode on 0.6 ha land in Patawa khera village of Lucknow districts of Uttar Pradesh.
Effect of land modi�cation on soil properties : Soil samples were collected from different locations of seepage intercept zone during the month of November, 2018. The soil properties are presented in Table 54. The average value of soil pH and pH were 2 e
minimum in the intercept zone (IZ) and the maximum in free intercept zone (FIZ). The pH value was signi�cantly lower under after intercept zone (AIZ) in comparison to the FIZ. The soil EC was found to be in order of IZ< AIZ<BIZ <FIZ. The IZ signi�cantly increased the soil organic carbon content with its maximum value of 0.27%. The available nitrogen and phospohorus content in soil was maximium in IZ and it was signi�cantly higher over the
-1BIZ, AIZ and FIZ . The available potassium was maximum (566.5 kg ha ) in FIZ .
Pond water quality
The pH of the pond water increased by 0.91 unit in 2015 over the previous year 2014; however it was almost same during the consecutive years. The EC of the water was less
-1than <1.0 dS m during the �ve years. CO and HCO content the major sources of 3 3
Table 54. Soil Properties under different intercept zones ( Patwa khera) during Nov., 2018
Soil Parameter (0-15 cm) Intercept zone BIZ IZ AIZ FIZpH 9.55 a 8.25b 9.30a 9.77c2
pH 8.51a 7.35b 8.18c 8.61ae-1EC2 (dSm ) 0.634a 0.269b 0.498c 0.787a-1ECe (dSm ) 1.689a 0.817b 1.462a 2.225c
Organic Carbon % 0.136a 0.270b 0.143a 0.129a-1Aval.N ( kg ha ) 144.2a 175.6b 108.0c 144.2a
-1Aval.P ( kg ha ) 18.39a 35.52b 19.79a 17.42a-1Avail.K ( kg ha ) 437.3a 257.1b 503.3c 566.5c
BIZ= before intercept zone ( Between canal and land modi�cation model ), IZ=intercept zone( land modi�cation model),AIZ= after intercept zone ( area after model on seepage interception line)FIZ=free intercept zone ( Control)
102
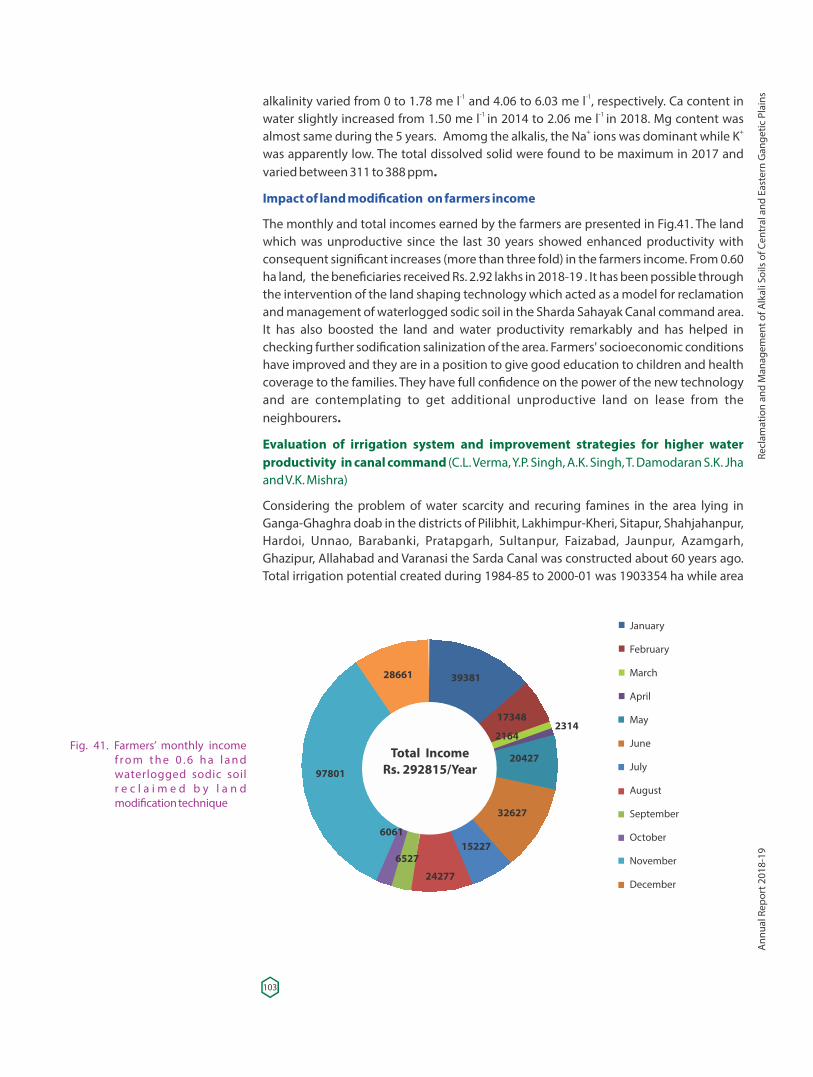
-1 -1alkalinity varied from 0 to 1.78 me l and 4.06 to 6.03 me l , respectively. Ca content in -1 -1 water slightly increased from 1.50 me l in 2014 to 2.06 me l in 2018. Mg content was
+ +almost same during the 5 years. Amomg the alkalis, the Na ions was dominant while K was apparently low. The total dissolved solid were found to be maximum in 2017 and varied between 311 to 388 ppm.
Impact of land modi�cation on farmers income
The monthly and total incomes earned by the farmers are presented in Fig.41. The land which was unproductive since the last 30 years showed enhanced productivity with consequent signi�cant increases (more than three fold) in the farmers income. From 0.60 ha land, the bene�ciaries received Rs. 2.92 lakhs in 2018-19 . It has been possible through the intervention of the land shaping technology which acted as a model for reclamation and management of waterlogged sodic soil in the Sharda Sahayak Canal command area. It has also boosted the land and water productivity remarkably and has helped in checking further sodi�cation salinization of the area. Farmers' socioeconomic conditions have improved and they are in a position to give good education to children and health coverage to the families. They have full con�dence on the power of the new technology and are contemplating to get additional unproductive land on lease from the neighbourers.
Evaluation of irrigation system and improvement strategies for higher water productivity in canal command (C.L. Verma, Y.P. Singh, A.K. Singh, T. Damodaran S.K. Jha and V.K. Mishra)
Considering the problem of water scarcity and recuring famines in the area lying in Ganga-Ghaghra doab in the districts of Pilibhit, Lakhimpur-Kheri, Sitapur, Shahjahanpur, Hardoi, Unnao, Barabanki, Pratapgarh, Sultanpur, Faizabad, Jaunpur, Azamgarh, Ghazipur, Allahabad and Varanasi the Sarda Canal was constructed about 60 years ago. Total irrigation potential created during 1984-85 to 2000-01 was 1903354 ha while area
Fig. 41. Farmers’ monthly income f r o m t h e 0 . 6 h a l a n d waterlogged sodic soil r e c l a i m e d b y l a n d modi�cation technique
28661 39381
17348
21642314
20427
32627
152276527
6061
24277
97801
Total IncomeRs. 292815/Year
January
February
March
April
May
June
July
August
September
October
November
December
103
Recl
amat
ion
and
Man
agem
ent o
f Alk
ali S
oils
of C
entr
al a
nd E
aste
rn G
ange
tic P
lain
sA
nnua
l Rep
ort 2
018-
19
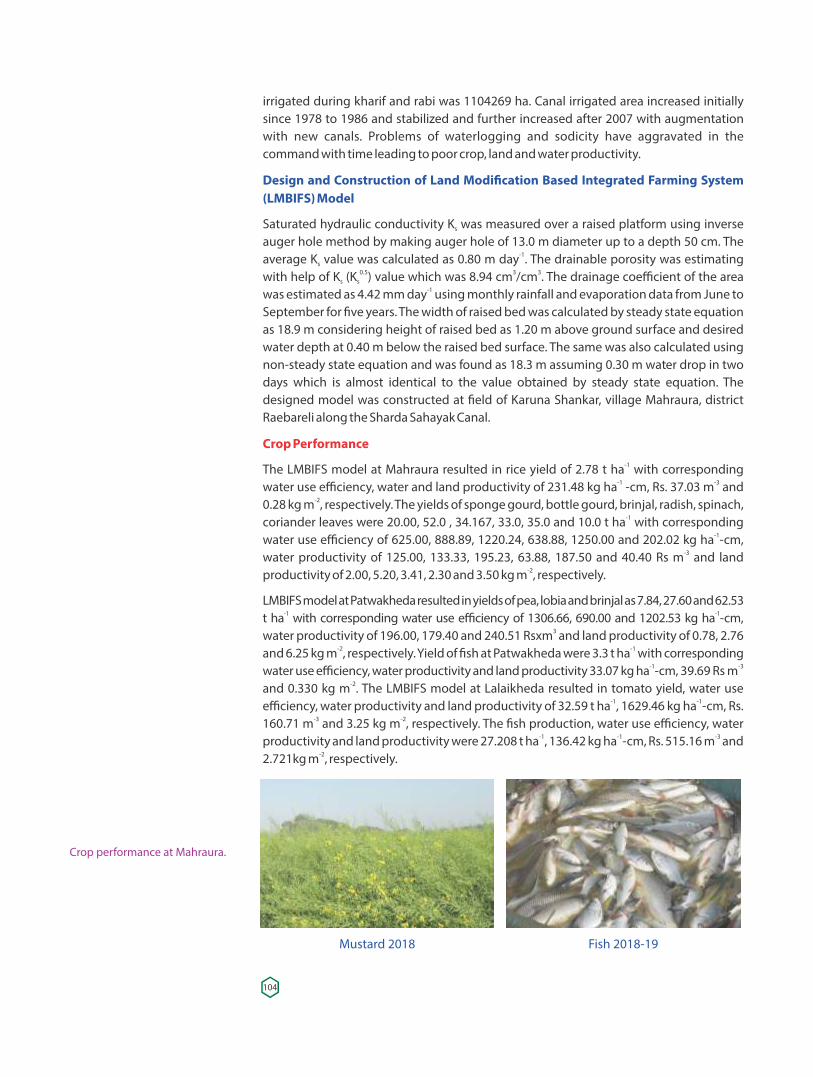
irrigated during kharif and rabi was 1104269 ha. Canal irrigated area increased initially since 1978 to 1986 and stabilized and further increased after 2007 with augmentation with new canals. Problems of waterlogging and sodicity have aggravated in the command with time leading to poor crop, land and water productivity.
Design and Construction of Land Modi�cation Based Integrated Farming System (LMBIFS) Model
Saturated hydraulic conductivity K was measured over a raised platform using inverse s
auger hole method by making auger hole of 13.0 m diameter up to a depth 50 cm. The -1average K value was calculated as 0.80 m day . The drainable porosity was estimating s
0.5 3 3with help of K (K ) value which was 8.94 cm /cm . The drainage coefficient of the area s s-1was estimated as 4.42 mm day using monthly rainfall and evaporation data from June to
September for �ve years. The width of raised bed was calculated by steady state equation as 18.9 m considering height of raised bed as 1.20 m above ground surface and desired water depth at 0.40 m below the raised bed surface. The same was also calculated using non-steady state equation and was found as 18.3 m assuming 0.30 m water drop in two days which is almost identical to the value obtained by steady state equation. The designed model was constructed at �eld of Karuna Shankar, village Mahraura, district Raebareli along the Sharda Sahayak Canal.
Crop Performance-1The LMBIFS model at Mahraura resulted in rice yield of 2.78 t ha with corresponding
-1 -3water use efficiency, water and land productivity of 231.48 kg ha -cm, Rs. 37.03 m and -20.28 kg m , respectively. The yields of sponge gourd, bottle gourd, brinjal, radish, spinach,
-1coriander leaves were 20.00, 52.0 , 34.167, 33.0, 35.0 and 10.0 t ha with corresponding -1water use efficiency of 625.00, 888.89, 1220.24, 638.88, 1250.00 and 202.02 kg ha -cm,
-3water productivity of 125.00, 133.33, 195.23, 63.88, 187.50 and 40.40 Rs m and land -2productivity of 2.00, 5.20, 3.41, 2.30 and 3.50 kg m , respectively.
LMBIFS model at Patwakheda resulted in yields of pea, lobia and brinjal as 7.84, 27.60 and 62.53 -1 -1t ha with corresponding water use efficiency of 1306.66, 690.00 and 1202.53 kg ha -cm,
3water productivity of 196.00, 179.40 and 240.51 Rsxm and land productivity of 0.78, 2.76 -2 -1and 6.25 kg m , respectively. Yield of �sh at Patwakheda were 3.3 t ha with corresponding
-1 -3water use efficiency, water productivity and land productivity 33.07 kg ha -cm, 39.69 Rs m -2and 0.330 kg m . The LMBIFS model at Lalaikheda resulted in tomato yield, water use
-1 -1efficiency, water productivity and land productivity of 32.59 t ha , 1629.46 kg ha -cm, Rs. -3 -2160.71 m and 3.25 kg m , respectively. The �sh production, water use efficiency, water
-1 -1 -3productivity and land productivity were 27.208 t ha , 136.42 kg ha -cm, Rs. 515.16 m and -22.721kg m , respectively.
Mustard 2018 Fish 2018-19
Crop performance at Mahraura.
104
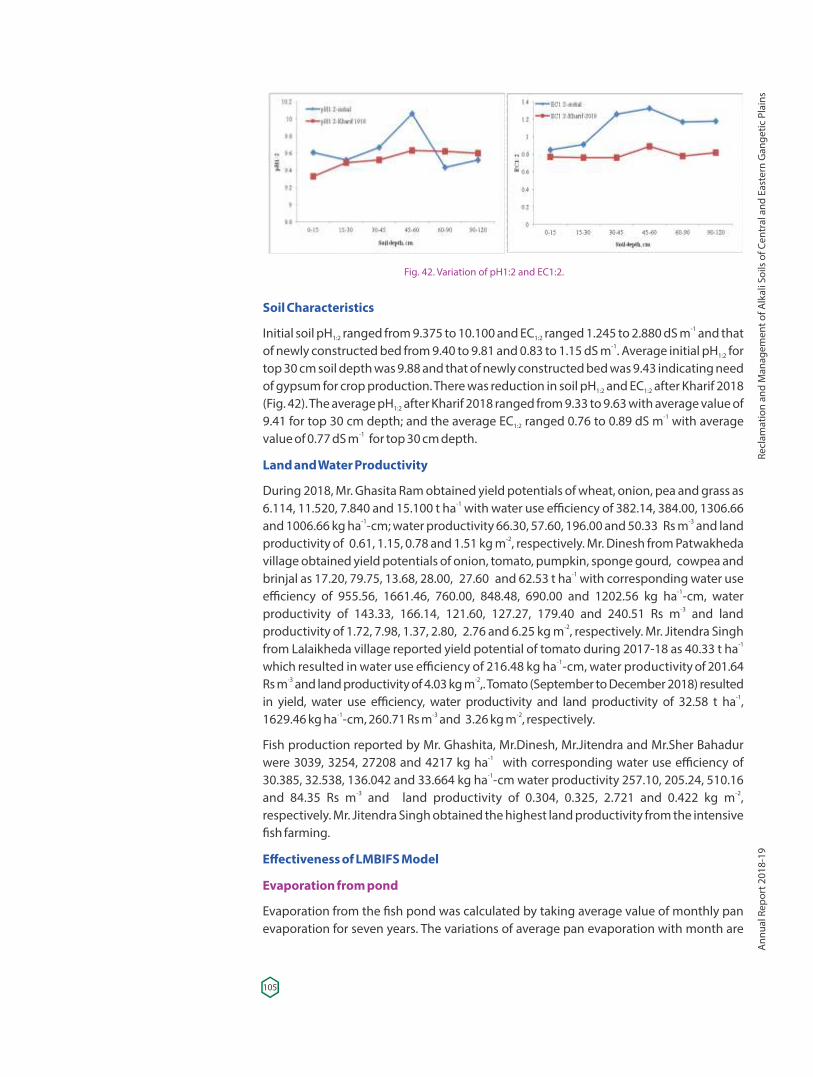
Soil Characteristics-1Initial soil pH ranged from 9.375 to 10.100 and EC ranged 1.245 to 2.880 dS m and that 1:2 1:2
-1of newly constructed bed from 9.40 to 9.81 and 0.83 to 1.15 dS m . Average initial pH for 1:2
top 30 cm soil depth was 9.88 and that of newly constructed bed was 9.43 indicating need of gypsum for crop production. There was reduction in soil pH and EC after Kharif 2018 1:2 1:2
(Fig. 42). The average pH after Kharif 2018 ranged from 9.33 to 9.63 with average value of 1:2-19.41 for top 30 cm depth; and the average EC ranged 0.76 to 0.89 dS m with average 1:2
-1value of 0.77 dS m for top 30 cm depth.
Land and Water Productivity
During 2018, Mr. Ghasita Ram obtained yield potentials of wheat, onion, pea and grass as -16.114, 11.520, 7.840 and 15.100 t ha with water use efficiency of 382.14, 384.00, 1306.66
-1 -3and 1006.66 kg ha -cm; water productivity 66.30, 57.60, 196.00 and 50.33 Rs m and land -2productivity of 0.61, 1.15, 0.78 and 1.51 kg m , respectively. Mr. Dinesh from Patwakheda
village obtained yield potentials of onion, tomato, pumpkin, sponge gourd, cowpea and -1brinjal as 17.20, 79.75, 13.68, 28.00, 27.60 and 62.53 t ha with corresponding water use
-1efficiency of 955.56, 1661.46, 760.00, 848.48, 690.00 and 1202.56 kg ha -cm, water -3productivity of 143.33, 166.14, 121.60, 127.27, 179.40 and 240.51 Rs m and land
-2productivity of 1.72, 7.98, 1.37, 2.80, 2.76 and 6.25 kg m , respectively. Mr. Jitendra Singh -1from Lalaikheda village reported yield potential of tomato during 2017-18 as 40.33 t ha
-1which resulted in water use efficiency of 216.48 kg ha -cm, water productivity of 201.64 -3 -2Rs m and land productivity of 4.03 kg m ,. Tomato (September to December 2018) resulted
-1in yield, water use efficiency, water productivity and land productivity of 32.58 t ha , -1 -3 -21629.46 kg ha -cm, 260.71 Rs m and 3.26 kg m , respectively.
Fish production reported by Mr. Ghashita, Mr.Dinesh, Mr.Jitendra and Mr.Sher Bahadur -1were 3039, 3254, 27208 and 4217 kg ha with corresponding water use efficiency of -130.385, 32.538, 136.042 and 33.664 kg ha -cm water productivity 257.10, 205.24, 510.16
-3 -2and 84.35 Rs m and land productivity of 0.304, 0.325, 2.721 and 0.422 kg m , respectively. Mr. Jitendra Singh obtained the highest land productivity from the intensive �sh farming.
Effectiveness of LMBIFS Model
Evaporation from pond
Evaporation from the �sh pond was calculated by taking average value of monthly pan evaporation for seven years. The variations of average pan evaporation with month are
Fig. 42. Variation of pH1:2 and EC1:2.
105
Recl
amat
ion
and
Man
agem
ent o
f Alk
ali S
oils
of C
entr
al a
nd E
aste
rn G
ange
tic P
lain
sA
nnua
l Rep
ort 2
018-
19
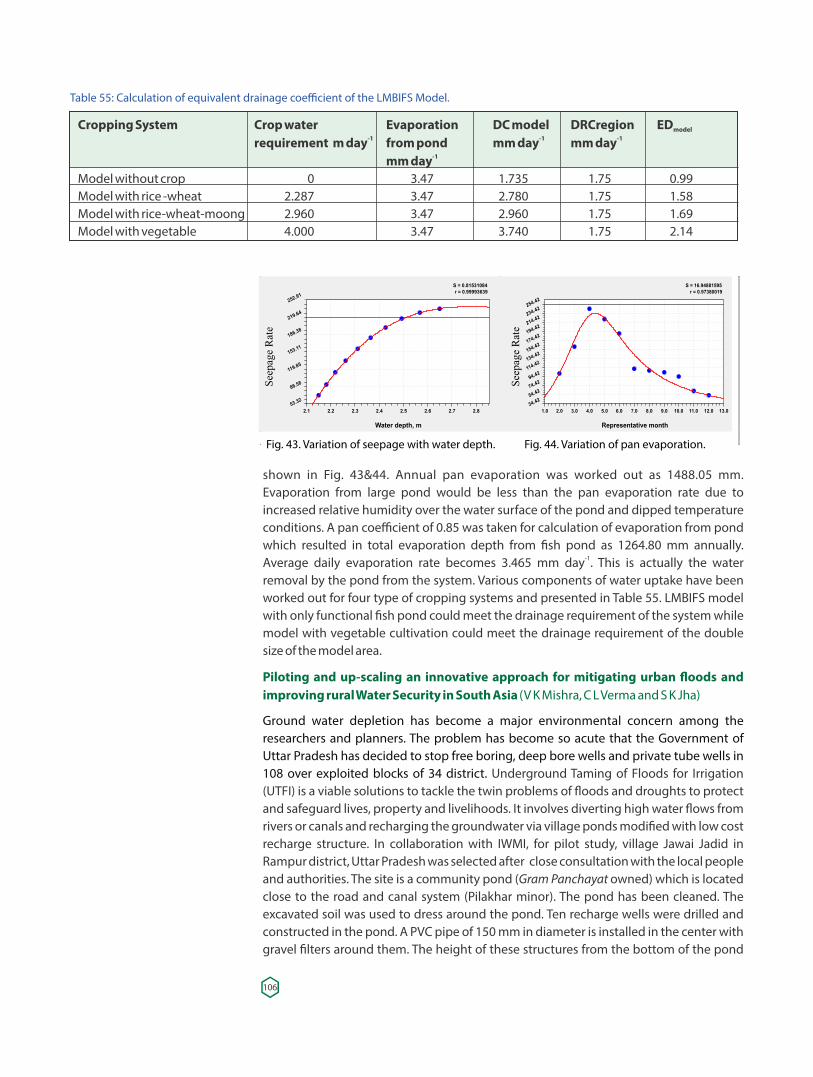
shown in Fig. 43&44. Annual pan evaporation was worked out as 1488.05 mm. Evaporation from large pond would be less than the pan evaporation rate due to increased relative humidity over the water surface of the pond and dipped temperature conditions. A pan coefficient of 0.85 was taken for calculation of evaporation from pond which resulted in total evaporation depth from �sh pond as 1264.80 mm annually.
-1Average daily evaporation rate becomes 3.465 mm day . This is actually the water removal by the pond from the system. Various components of water uptake have been worked out for four type of cropping systems and presented in Table 55. LMBIFS model with only functional �sh pond could meet the drainage requirement of the system while model with vegetable cultivation could meet the drainage requirement of the double size of the model area.
Piloting and up-scaling an innovative approach for mitigating urban �oods and improving rural Water Security in South Asia (V K Mishra, C L Verma and S K Jha)
Ground water depletion has become a major environmental concern among the researchers and planners. The problem has become so acute that the Government of Uttar Pradesh has decided to stop free boring, deep bore wells and private tube wells in 108 over exploited blocks of 34 district. Underground Taming of Floods for Irrigation (UTFI) is a viable solutions to tackle the twin problems of �oods and droughts to protect and safeguard lives, property and livelihoods. It involves diverting high water �ows from rivers or canals and recharging the groundwater via village ponds modi�ed with low cost recharge structure. In collaboration with IWMI, for pilot study, village Jawai Jadid in Rampur district, Uttar Pradesh was selected after close consultation with the local people and authorities. The site is a community pond (Gram Panchayat owned) which is located close to the road and canal system (Pilakhar minor). The pond has been cleaned. The excavated soil was used to dress around the pond. Ten recharge wells were drilled and constructed in the pond. A PVC pipe of 150 mm in diameter is installed in the center with gravel �lters around them. The height of these structures from the bottom of the pond
Table 55: Calculation of equivalent drainage coefficient of the LMBIFS Model.
Cropping System Crop water Evaporation DC model DRCregion EDmodel-1 -1 -1 requirement m day from pond mm day mm day
-1 mm dayModel without crop 0 3.47 1.735 1.75 0.99Model with rice -wheat 2.287 3.47 2.780 1.75 1.58Model with rice-wheat-moong 2.960 3.47 2.960 1.75 1.69Model with vegetable 4.000 3.47 3.740 1.75 2.14
Fig. 43. Variation of seepage with water depth. Fig. 44. Variation of pan evaporation.
S = 0.81531084r = 0.99993639
Water depth, m
2.1 2.2 2.3 2.4 2.5 2.6 2.7 2.853.32
86.58
119.85
153.11
186.38
219.64
252.91
S = 16.94881595r = 0.97380019
Representative month
1.0 2.0 3.0 4.0 5.0 6.0 7.0 8.0 9.0 10.0 11.0 12.0 13.034.4254.4274.4294.42
114.42134.42154.42174.42194.42214.42234.42254.42
S
eep
age
Rat
e
See
pag
e R
ate
106
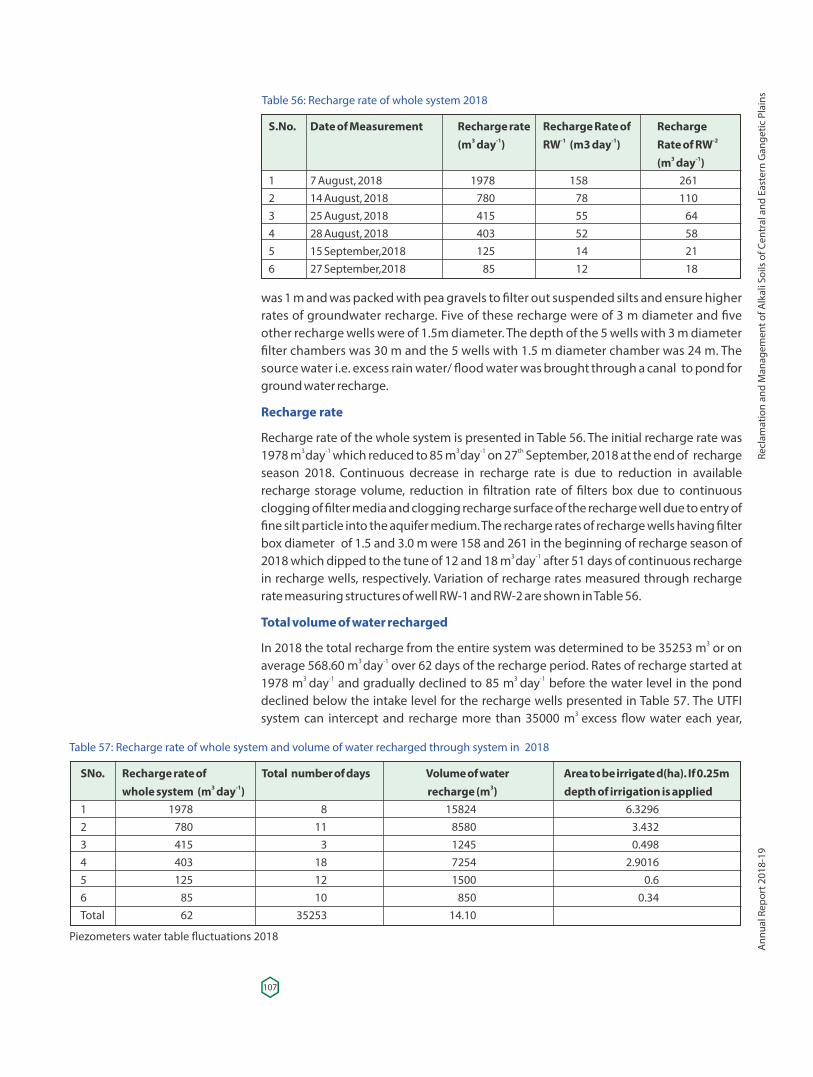
was 1 m and was packed with pea gravels to �lter out suspended silts and ensure higher rates of groundwater recharge. Five of these recharge were of 3 m diameter and �ve other recharge wells were of 1.5m diameter. The depth of the 5 wells with 3 m diameter �lter chambers was 30 m and the 5 wells with 1.5 m diameter chamber was 24 m. The source water i.e. excess rain water/ �ood water was brought through a canal to pond for ground water recharge.
Recharge rate
Recharge rate of the whole system is presented in Table 56. The initial recharge rate was 3 -1 3 -1 th1978 m day which reduced to 85 m day on 27 September, 2018 at the end of recharge
season 2018. Continuous decrease in recharge rate is due to reduction in available recharge storage volume, reduction in �ltration rate of �lters box due to continuous clogging of �lter media and clogging recharge surface of the recharge well due to entry of �ne silt particle into the aquifer medium. The recharge rates of recharge wells having �lter box diameter of 1.5 and 3.0 m were 158 and 261 in the beginning of recharge season of
3 -12018 which dipped to the tune of 12 and 18 m day after 51 days of continuous recharge in recharge wells, respectively. Variation of recharge rates measured through recharge rate measuring structures of well RW-1 and RW-2 are shown in Table 56.
Total volume of water recharged3In 2018 the total recharge from the entire system was determined to be 35253 m or on
3 -1average 568.60 m day over 62 days of the recharge period. Rates of recharge started at 3 -1 3 -11978 m day and gradually declined to 85 m day before the water level in the pond
declined below the intake level for the recharge wells presented in Table 57. The UTFI 3 system can intercept and recharge more than 35000 m excess �ow water each year,
Table 56: Recharge rate of whole system 2018
S.No. Date of Measurement Recharge rate Recharge Rate of Recharge 3 -1 -1 -1 -2 (m day ) RW (m3 day ) Rate of RW
3 -1 (m day )1 7 August, 2018 1978 158 2612 14 August, 2018 780 78 1103 25 August, 2018 415 55 644 28 August, 2018 403 52 585 15 September,2018 125 14 216 27 September,2018 85 12 18
Table 57: Recharge rate of whole system and volume of water recharged through system in 2018
SNo. Recharge rate of Total number of days Volume of water Area to be irrigate d(ha). If 0.25m3 -1 3 whole system (m day ) recharge (m ) depth of irrigation is applied
1 1978 8 15824 6.32962 780 11 8580 3.4323 415 3 1245 0.4984 403 18 7254 2.90165 125 12 1500 0.66 85 10 850 0.34Total 62 35253 14.10
Piezometers water table �uctuations 2018
107
Recl
amat
ion
and
Man
agem
ent o
f Alk
ali S
oils
of C
entr
al a
nd E
aste
rn G
ange
tic P
lain
sA
nnua
l Rep
ort 2
018-
19
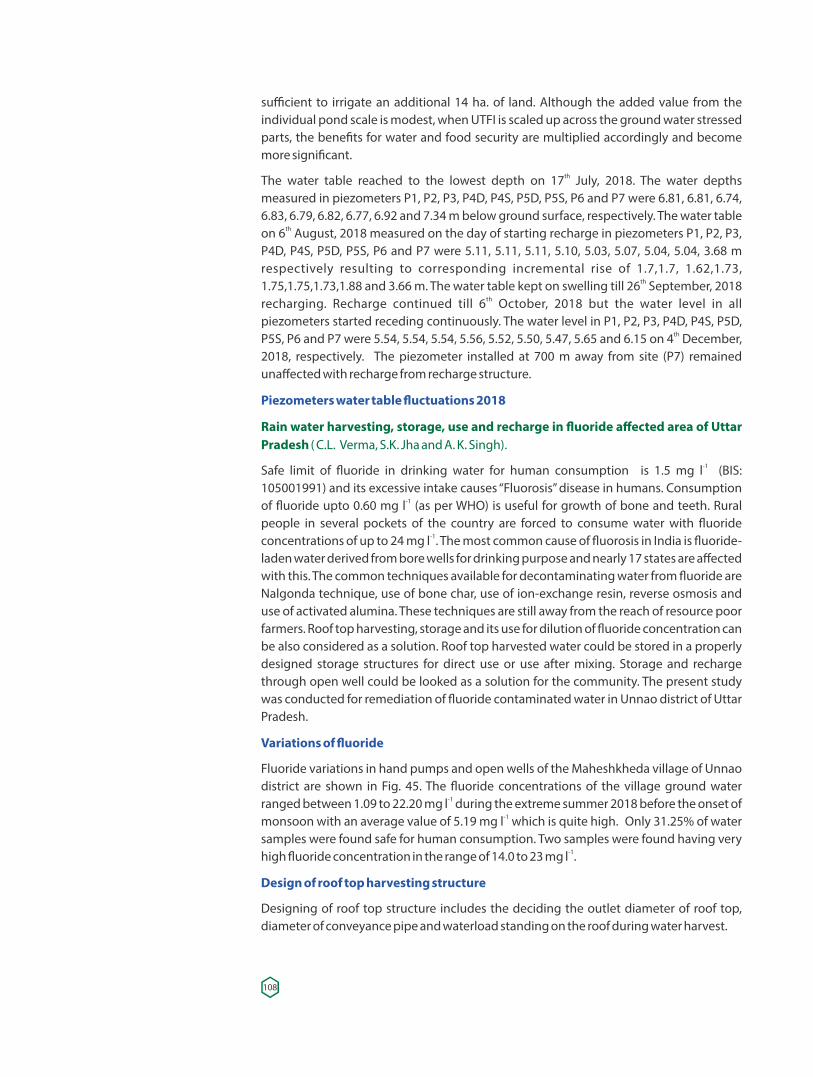
sufficient to irrigate an additional 14 ha. of land. Although the added value from the individual pond scale is modest, when UTFI is scaled up across the ground water stressed parts, the bene�ts for water and food security are multiplied accordingly and become more signi�cant.
The water table reached to the lowest depth on 17 July, 2018. The water depths th
measured in piezometers P1, P2, P3, P4D, P4S, P5D, P5S, P6 and P7 were 6.81, 6.81, 6.74, 6.83, 6.79, 6.82, 6.77, 6.92 and 7.34 m below ground surface, respectively. The water table on 6 August, 2018 measured on the day of starting recharge in piezometers P1, P2, P3, th
P4D, P4S, P5D, P5S, P6 and P7 were 5.11, 5.11, 5.11, 5.10, 5.03, 5.07, 5.04, 5.04, 3.68 m respectively resulting to corresponding incremental rise of 1.7,1.7, 1.62,1.73, 1.75,1.75,1.73,1.88 and 3.66 m. The water table kept on swelling till 26 September, 2018 th
recharging. Recharge continued till 6 October, 2018 but the water level in all th
piezometers started receding continuously. The water level in P1, P2, P3, P4D, P4S, P5D, P5S, P6 and P7 were 5.54, 5.54, 5.54, 5.56, 5.52, 5.50, 5.47, 5.65 and 6.15 on 4 December, th
2018, respectively. The piezometer installed at 700 m away from site (P7) remained unaffected with recharge from recharge structure.
Piezometers water table �uctuations 2018
Rain water harvesting, storage, use and recharge in �uoride affected area of Uttar Pradesh ( C.L. Verma, S.K. Jha and A. K. Singh).
-1 Safe limit of �uoride in drinking water for human consumption is 1.5 mg l (BIS: 105001991) and its excessive intake causes “Fluorosis” disease in humans. Consumption
-1of �uoride upto 0.60 mg l (as per WHO) is useful for growth of bone and teeth. Rural people in several pockets of the country are forced to consume water with �uoride
-1concentrations of up to 24 mg l . The most common cause of �uorosis in India is �uoride-laden water derived from bore wells for drinking purpose and nearly 17 states are affected with this. The common techniques available for decontaminating water from �uoride are Nalgonda technique, use of bone char, use of ion-exchange resin, reverse osmosis and use of activated alumina. These techniques are still away from the reach of resource poor farmers. Roof top harvesting, storage and its use for dilution of �uoride concentration can be also considered as a solution. Roof top harvested water could be stored in a properly designed storage structures for direct use or use after mixing. Storage and recharge through open well could be looked as a solution for the community. The present study was conducted for remediation of �uoride contaminated water in Unnao district of Uttar Pradesh.
Variations of �uoride
Fluoride variations in hand pumps and open wells of the Maheshkheda village of Unnao district are shown in Fig. 45. The �uoride concentrations of the village ground water
-1ranged between 1.09 to 22.20 mg l during the extreme summer 2018 before the onset of -1monsoon with an average value of 5.19 mg l which is quite high. Only 31.25% of water
samples were found safe for human consumption. Two samples were found having very -1high �uoride concentration in the range of 14.0 to 23 mg l .
Design of roof top harvesting structure
Designing of roof top structure includes the deciding the outlet diameter of roof top, diameter of conveyance pipe and waterload standing on the roof during water harvest.
108
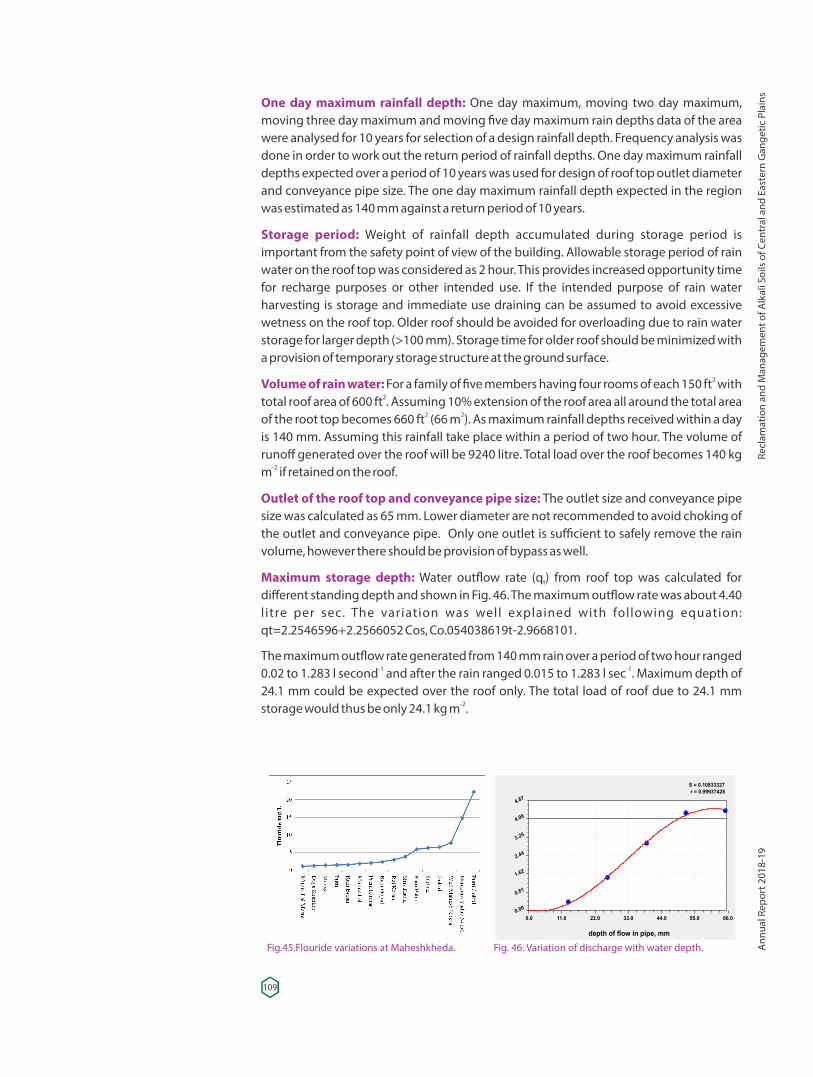
One day maximum rainfall depth: One day maximum, moving two day maximum, moving three day maximum and moving �ve day maximum rain depths data of the area were analysed for 10 years for selection of a design rainfall depth. Frequency analysis was done in order to work out the return period of rainfall depths. One day maximum rainfall depths expected over a period of 10 years was used for design of roof top outlet diameter and conveyance pipe size. The one day maximum rainfall depth expected in the region was estimated as 140 mm against a return period of 10 years.
Storage period: Weight of rainfall depth accumulated during storage period is important from the safety point of view of the building. Allowable storage period of rain water on the roof top was considered as 2 hour. This provides increased opportunity time for recharge purposes or other intended use. If the intended purpose of rain water harvesting is storage and immediate use draining can be assumed to avoid excessive wetness on the roof top. Older roof should be avoided for overloading due to rain water storage for larger depth (>100 mm). Storage time for older roof should be minimized with a provision of temporary storage structure at the ground surface.
Volume of rain water: 2 For a family of �ve members having four rooms of each 150 ft with 2total roof area of 600 ft . Assuming 10% extension of the roof area all around the total area
2 2of the root top becomes 660 ft (66 m ). As maximum rainfall depths received within a day is 140 mm. Assuming this rainfall take place within a period of two hour. The volume of runoff generated over the roof will be 9240 litre. Total load over the roof becomes 140 kg
-2m if retained on the roof.
Outlet of the roof top and conveyance pipe size: The outlet size and conveyance pipe size was calculated as 65 mm. Lower diameter are not recommended to avoid choking of the outlet and conveyance pipe. Only one outlet is sufficient to safely remove the rain volume, however there should be provision of bypass as well.
Maximum storage depth: Water out�ow rate (q ) from roof top was calculated for t
different standing depth and shown in Fig. 46. The maximum out�ow rate was about 4.40 l itre per sec. The variation was well explained with following equation: qt=2.2546596+2.2566052 Cos, Co.054038619t-2.9668101.
The maximum out�ow rate generated from 140 mm rain over a period of two hour ranged -1 -10.02 to 1.283 l second and after the rain ranged 0.015 to 1.283 l sec . Maximum depth of
24.1 mm could be expected over the roof only. The total load of roof due to 24.1 mm storage would thus be only 24.1 kg m .-2
Fig.45.Flouride variations at Maheshkheda. Fig. 46. Variation of discharge with water depth.
S = 0.10833327
r = 0.99937428
depth of ow in pipe, mm
0.0 11.0 22.0 33.0 44.0 55.0 66.0
0.00
0.81
1.62
2.44
3.25
4.06
4.87
109
Recl
amat
ion
and
Man
agem
ent o
f Alk
ali S
oils
of C
entr
al a
nd E
aste
rn G
ange
tic P
lain
sA
nnua
l Rep
ort 2
018-
19
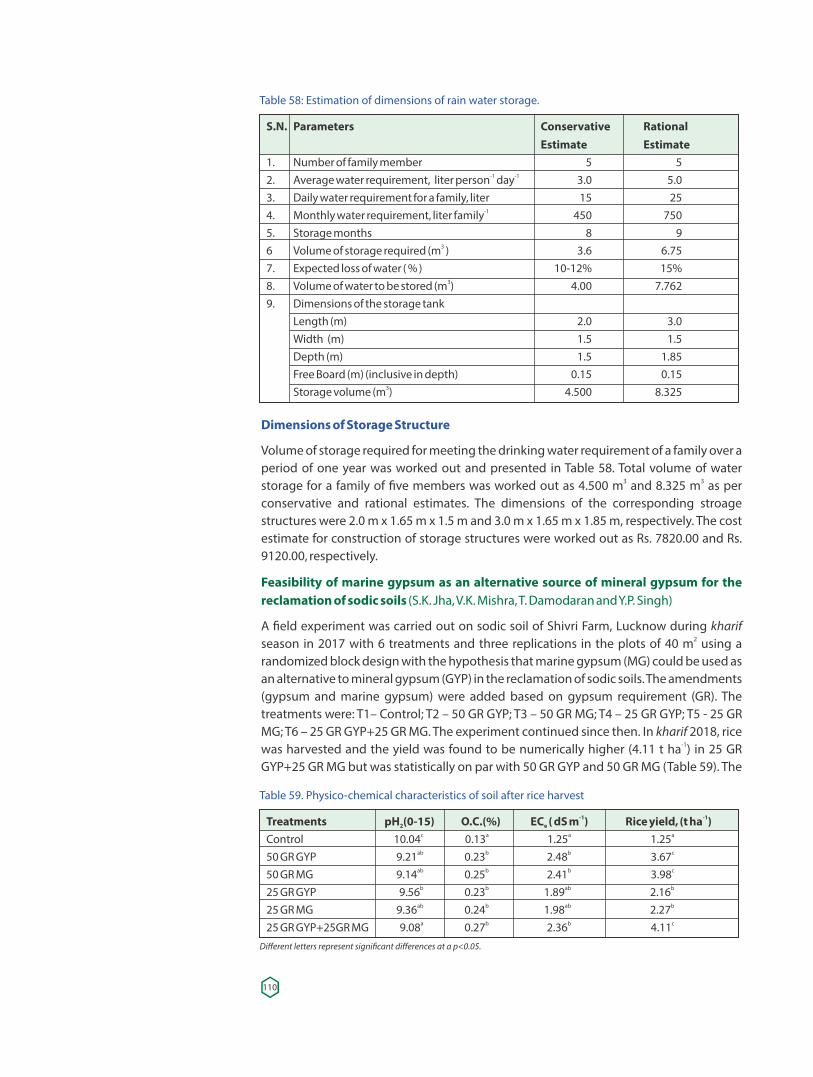
Dimensions of Storage Structure
Volume of storage required for meeting the drinking water requirement of a family over a period of one year was worked out and presented in Table 58. Total volume of water storage for a family of �ve members was worked out as 4.500 m and 8.325 m as per 3 3
conservative and rational estimates. The dimensions of the corresponding stroage structures were 2.0 m x 1.65 m x 1.5 m and 3.0 m x 1.65 m x 1.85 m, respectively. The cost estimate for construction of storage structures were worked out as Rs. 7820.00 and Rs. 9120.00, respectively.
Feasibility of marine gypsum as an alternative source of mineral gypsum for the reclamation of sodic soils (S.K. Jha, V.K. Mishra, T. Damodaran and Y.P. Singh)
A �eld experiment was carried out on sodic soil of Shivri Farm, Lucknow during kharif 2season in 2017 with 6 treatments and three replications in the plots of 40 m using a
randomized block design with the hypothesis that marine gypsum (MG) could be used as an alternative to mineral gypsum (GYP) in the reclamation of sodic soils. The amendments (gypsum and marine gypsum) were added based on gypsum requirement (GR). The treatments were: T1– Control; T2 – 50 GR GYP; T3 – 50 GR MG; T4 – 25 GR GYP; T5 - 25 GR MG; T6 – 25 GR GYP+25 GR MG. The experiment continued since then. In kharif 2018, rice
-1was harvested and the yield was found to be numerically higher (4.11 t ha ) in 25 GR GYP+25 GR MG but was statistically on par with 50 GR GYP and 50 GR MG (Table 59). The
Table 58: Estimation of dimensions of rain water storage.
S.N. Parameters Conservative Rational Estimate Estimate1. Number of family member 5 5
-1 -12. Average water requirement, liter person day 3.0 5.03. Daily water requirement for a family, liter 15 25
-14. Monthly water requirement, liter family 450 7505. Storage months 8 9
36 Volume of storage required (m ) 3.6 6.757. Expected loss of water ( % ) 10-12% 15%
38. Volume of water to be stored (m ) 4.00 7.7629. Dimensions of the storage tank Length (m) 2.0 3.0 Width (m) 1.5 1.5 Depth (m) 1.5 1.85 Free Board (m) (inclusive in depth) 0.15 0.15
3 Storage volume (m ) 4.500 8.325
Table 59. Physico-chemical characteristics of soil after rice harvest
-1 -1Treatments pH (0-15) O.C.(%) EC ( dS m ) Rice yield, (t ha )2 e
c a a aControl 10.04 0.13 1.25 1.25ab b b c50 GR GYP 9.21 0.23 2.48 3.67ab b b c50 GR MG 9.14 0.25 2.41 3.98
b b ab b25 GR GYP 9.56 0.23 1.89 2.16ab b ab b25 GR MG 9.36 0.24 1.98 2.27
a b b c25 GR GYP+25GR MG 9.08 0.27 2.36 4.11
Different letters represent signi�cant differences at a p<0.05.
110
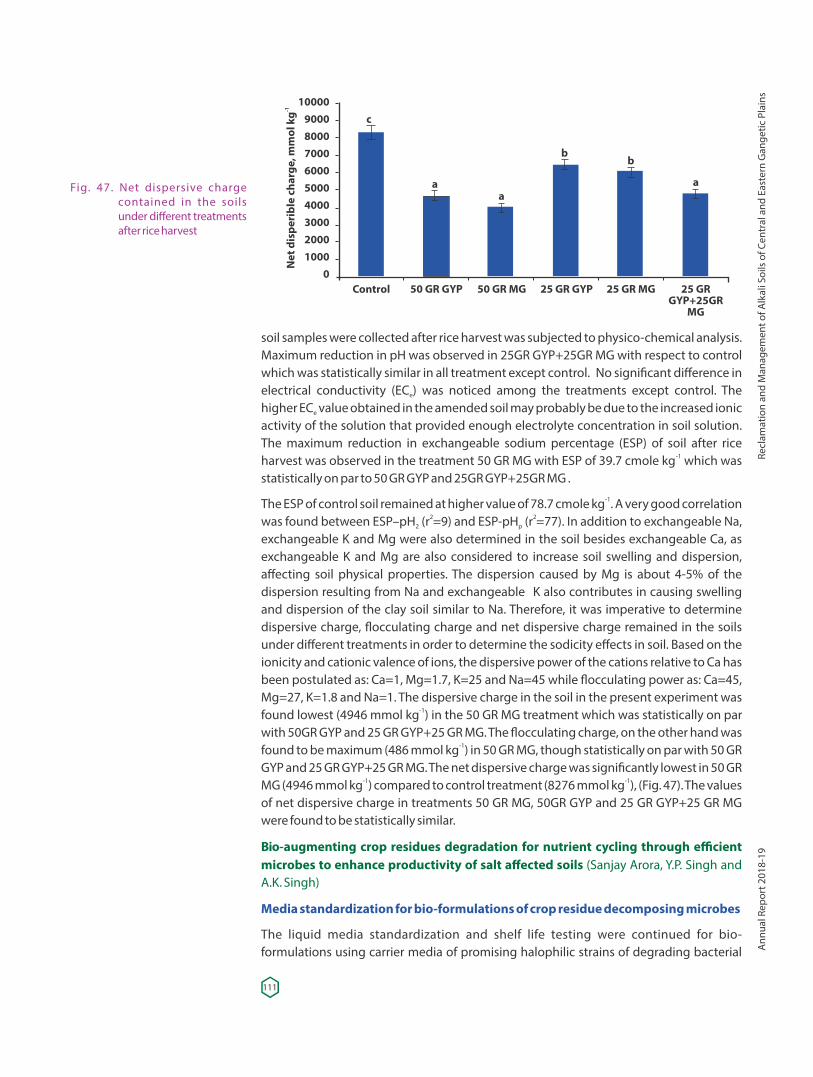
soil samples were collected after rice harvest was subjected to physico-chemical analysis. Maximum reduction in pH was observed in 25GR GYP+25GR MG with respect to control which was statistically similar in all treatment except control. No signi�cant difference in electrical conductivity (EC ) was noticed among the treatments except control. The e
higher EC value obtained in the amended soil may probably be due to the increased ionic e
activity of the solution that provided enough electrolyte concentration in soil solution. The maximum reduction in exchangeable sodium percentage (ESP) of soil after rice harvest was observed in the treatment 50 GR MG with ESP of 39.7 cmole kg which was -1
statistically on par to 50 GR GYP and 25GR GYP+25GR MG .
The ESP of control soil remained at higher value of 78.7 cmole kg . A very good correlation -1
was found between ESP–pH (r =9) and ESP-pH (r =77). In addition to exchangeable Na, p2 2
2
exchangeable K and Mg were also determined in the soil besides exchangeable Ca, as exchangeable K and Mg are also considered to increase soil swelling and dispersion, affecting soil physical properties. The dispersion caused by Mg is about 4-5% of the dispersion resulting from Na and exchangeable K also contributes in causing swelling and dispersion of the clay soil similar to Na. Therefore, it was imperative to determine dispersive charge, �occulating charge and net dispersive charge remained in the soils under different treatments in order to determine the sodicity effects in soil. Based on the ionicity and cationic valence of ions, the dispersive power of the cations relative to Ca has been postulated as: Ca=1, Mg=1.7, K=25 and Na=45 while �occulating power as: Ca=45, Mg=27, K=1.8 and Na=1. The dispersive charge in the soil in the present experiment was found lowest (4946 mmol kg ) in the 50 GR MG treatment which was statistically on par -1
with 50GR GYP and 25 GR GYP+25 GR MG. The �occulating charge, on the other hand was found to be maximum (486 mmol kg ) in 50 GR MG, though statistically on par with 50 GR -1
GYP and 25 GR GYP+25 GR MG. The net dispersive charge was signi�cantly lowest in 50 GR MG (4946 mmol kg ) compared to control treatment (8276 mmol kg ), (Fig. 47). The values -1 -1
of net dispersive charge in treatments 50 GR MG, 50GR GYP and 25 GR GYP+25 GR MG were found to be statistically similar.
Bio-augmenting crop residues degradation for nutrient cycling through efficient microbes to enhance productivity of salt affected soils (Sanjay Arora, Y.P. Singh and A.K. Singh)
Media standardization for bio-formulations of crop residue decomposing microbes
The liquid media standardization and shelf life testing were continued for bio-formulations using carrier media of promising halophilic strains of degrading bacterial
Fig. 47. Net dispersive charge contained in the soils under different treatments after rice harvest
10000900080007000600050004000300020001000
0Control 50 GR GYP 50 GR MG 25 GR GYP 25 GR MG 25 GR
GYP+25GRMG
-1N
et d
ispe
ribl
e ch
arge
, mm
ol k
g c
aa
bb
a
111
Recl
amat
ion
and
Man
agem
ent o
f Alk
ali S
oils
of C
entr
al a
nd E
aste
rn G
ange
tic P
lain
sA
nnua
l Rep
ort 2
018-
19
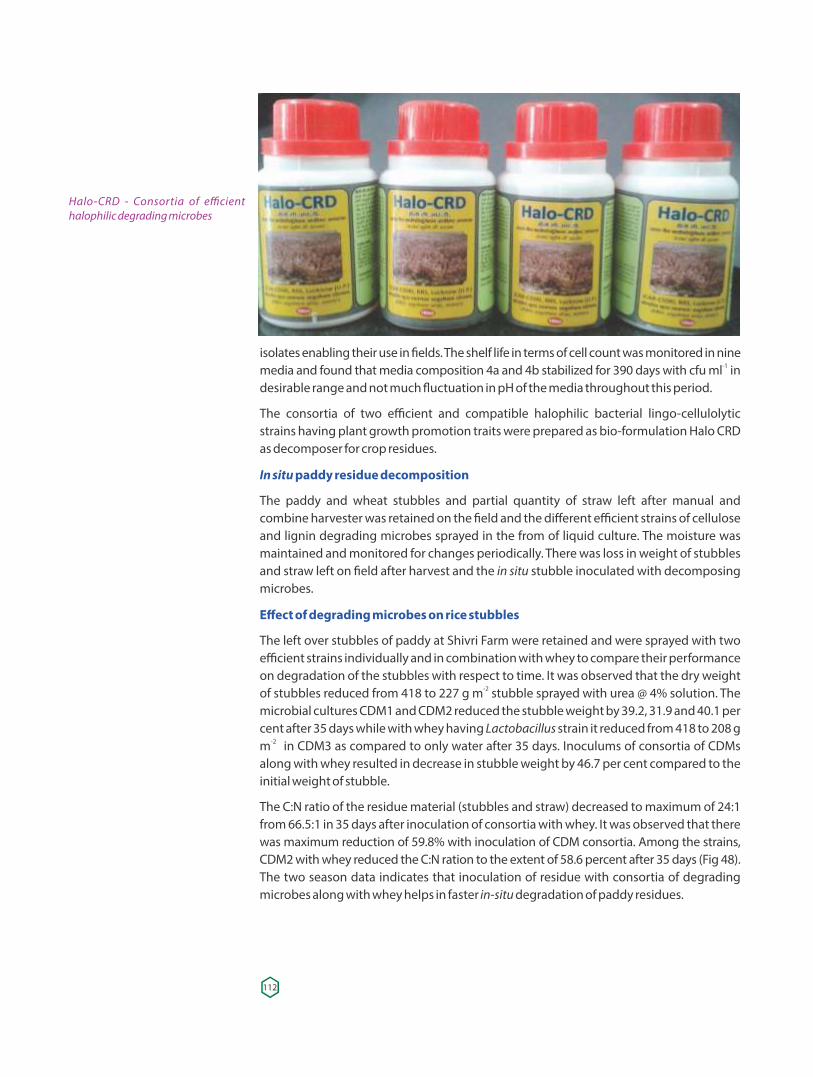
isolates enabling their use in �elds. The shelf life in terms of cell count was monitored in nine -1media and found that media composition 4a and 4b stabilized for 390 days with cfu ml in
desirable range and not much �uctuation in pH of the media throughout this period .
The consortia of two efficient and compatible halophilic bacterial lingo-cellulolytic strains having plant growth promotion traits were prepared as bio-formulation Halo CRD as decomposer for crop residues.
In situ paddy residue decomposition
The paddy and wheat stubbles and partial quantity of straw left after manual and combine harvester was retained on the �eld and the different efficient strains of cellulose and lignin degrading microbes sprayed in the from of liquid culture. The moisture was maintained and monitored for changes periodically. There was loss in weight of stubbles and straw left on �eld after harvest and the in situ stubble inoculated with decomposing microbes.
Effect of degrading microbes on rice stubbles
The left over stubbles of paddy at Shivri Farm were retained and were sprayed with two efficient strains individually and in combination with whey to compare their performance on degradation of the stubbles with respect to time. It was observed that the dry weight
-2of stubbles reduced from 418 to 227 g m stubble sprayed with urea @ 4% solution. The microbial cultures CDM1 and CDM2 reduced the stubble weight by 39.2, 31.9 and 40.1 per cent after 35 days while with whey having Lactobacillus strain it reduced from 418 to 208 g
-2m in CDM3 as compared to only water after 35 days. Inoculums of consortia of CDMs along with whey resulted in decrease in stubble weight by 46.7 per cent compared to the initial weight of stubble.
The C:N ratio of the residue material (stubbles and straw) decreased to maximum of 24:1 from 66.5:1 in 35 days after inoculation of consortia with whey. It was observed that there was maximum reduction of 59.8% with inoculation of CDM consortia. Among the strains, CDM2 with whey reduced the C:N ration to the extent of 58.6 percent after 35 days (Fig 48). The two season data indicates that inoculation of residue with consortia of degrading microbes along with whey helps in faster in-situ degradation of paddy residues.
Halo-CRD - Consortia of efficient halophilic degrading microbes
112
Fig. 48. Effect of degrading microbes on C:N ratio of rice residues
In situ residue decomposition and crop yields
After harvest of paddy, the leftover stubbles and straw was sprayed with different treatments including cultures of degrading microbes and moisture maintained to enhance in situ decomposition. It was monitored weekly and after 45 days, the wheat crop was sown through zero till and uniform fertilizer and management practices were adopted in each plot. The performance of crop in terms of growth and yield was recorded for each treatment.
The application of treatments in�uenced the in situ degradation of crop residues and also in�uenced the soil properties and yield of succeeding crop. Treatment application on residue of paddy increased the wheat yield to the maximum of 34.24 percent with CDM consortia application with whey over the untreated control (only water). It was observed that application of CDM3 + whey on paddy residue resulted in highest yield of wheat (1.68
-1t ha ) amongst the three strains of CDM. Consortia of CDM applied to paddy residue resulted in 17.3% higher yield over the urea application of 4%. Similarly, increase in paddy yield was recorded as in�uenced by application of in situ degradation of wheat residues mediated through halophilic cellulose and lignin degrading microbes. It was observed
-1 that paddy yield increased to the maximum of 2.22 t ha with consortia of CDM and whey application compared to control. However, the paddy yield was 13.28% higher over the application of urea 4% spray on the wheat residues. It was observed that both in wheat and paddy residue, the consortia of microbes performed to degrade the residue in 30-35 days after harvest and addition of whey had an additional advantage of 2-4 per cent in terms of succeeding crop yield.
Residue decomposition effect on soil properties
The soil properties from each harvested plots were analysed for bio-chemical properties and it was observed that soil pH was reduced to 9.33 with incorporation of residues inoculated with consortia of degrading microbes (Table 60). Soil organic C content was enriched in soil where residues were retained and inoculated with the microbial culture and maximum was in consortia. Soil available N and P content also enhanced in soil through paddy residue incorporation with halophilic degrading microbes.
113
Recl
amat
ion
and
Man
agem
ent o
f Alk
ali S
oils
of C
entr
al a
nd E
aste
rn G
ange
tic P
lain
sA
nnua
l Rep
ort 2
018-
19
Table 60. Effect of in-situ paddy residue microbial degradation on soil properties
-1 -1 -1Treatment pH EC (dS m ) O.C. (%) Av N (kg ha ) Av P (kg ha )2
Water 9.77 1.27 0.16 71.89 16.4Urea 4% 9.65 1.51 0.20 85.26 18.2CDM1 9.58 1.31 0.22 87.81 16.5CDM2 9.45 1.32 0.20 81.53 17.6CDM3 9.47 1.35 0.18 94.80 15.7CDM1+whey 9.61 1.27 0.24 90.30 16.2CDM2+whey 9.36 0.94 0.24 102.60 18.1CDM3+whey 9.44 1.06 0.24 112.89 18.4CDM consortia 9.42 1.29 0.28 122.40 21.7CDM consortia+whey 9.33 1.33 0.28 118.20 20.3CD(5%) 0.28 NS 0.09 8.60 4.8
CDM: cellulose degrading microbe
After harvest of paddy crop, soil bio-chemical properties showed improvement as in�uenced by treatments on residues. It was observed that soil MBC increased by 56.7 and 60.8 per cent with in-situ spray of CDM consortia and CDM consortia+whey, respectively over only water application (control). Bacterial and fungal population in soil almost doubled with the application of CDM consortia compared to control (Table 61). Among the halophilic strains applied with whey, CDM3 showed increase of 59.8 and 39.6% in respect of dehydrogenase and phosphatse activity in soil.
Residue burning v/s in situ management
Another experiment was conducted on a moderately sodic soil (pH 8.82) to compare different approaches for in situ crop residue management in comparison with the use of microbial formulation of halophilic decomposers. After treatments on the paddy residue, soil organic C was 0.45% in urea spray with residue incorporation followed by 0.42% in residue incorporation with Halo-CRD spray compared to 0.36% in residue burning.
-1Similarly, available N content in soil increased from initial value of 160.25 kg ha to -1maximum of 200.7 kg ha where residue were incorporated with CRD spray (Table 62).
Soil bio-chemical properties showed that MBC was increased from initial value of 68.4 to -1 -1112.6 mg kg with residue incorporation with Halo-CRD spray and 104.5 mg kg with urea
Table 61. Effect of in-situ paddy residue microbial degradation on soil bio-chemical properties
-1 -1 -1Treatment MBC (mg kg ) BP (cfu g ) *106 FP (cfu g ) *104Water 74 8.4 6.2Urea 4% 89 9.8 5.5CDM1 82 8.8 7.7CDM2 102 11.5 8.8CDM3 94 9.2 9.5CDM1+whey 92 9.8 9.1CDM2+whey 115 12.5 10.2CDM3+whey 88 13.2 11.5CDM consortia 116 16.7 12.5CDM consortia+whey 119 15.8 12.7CD(5%) 23.1 3.6 4.8
CDM: cellulose degrading microbe
114
spray on incorporated residue. Enzymatic activities like dehydrogenase and phosphatase increased respectively by 64.5 and 67.9% over the initial value. Burning of residues resulted in decrease in dehydrogenase and phosphatase activities to the tune of 11.3 and
620.9 per cent. Bacterial and fungal population reduced to the extent of 0.2x10 and 4 -10.7x10 cfu g with burning while there was three-fold increase in bacterial population
and two-fold increase in fungal population with residue incorporation and application of Halo-CRD bio-formulation. Net energy transformation due to management of crop residues through efficient degrading microbes was estimated. Net energy in terms of NPK increased by 84.2 and 86.4% with residue retained and residue incorporated sprayed with Halo-CRD over the residue burning. However, urea application @ 4% on incorporated residue resulted in 54.4% increase in net energy (Table 63). Net energy in terms of only nitrogen showed increase of 83.6% over residue burning and 59.4% over urea spray.
Assessment of municipal solid waste in conjunction with chemical amendments for harnessing productivity potential of salt affected soils ( Y.P. Singh, Sanjay Arora and V. K. Mishra)
Management of municipal solid waste (MSW) is a major challenge, particularly in urban areas. Several strategies have been applied for its efficient utilization but its performance in reclamation of salt affected soils has not been investigated. Therefore, �eld experiments were conducted were conducted to investigate the combined effect of organic (MSW compost, pressmud) and inorganic (gypsum and phosphogypsum) amendments for amelioration of sodic soil and sustaining productivity of rice-wheat cropping system.
After harvesting of rice in 2017, wheat crop with recommended dose of N, P, K (120 kg: 60 kg: 40 kg ha ) was sown with the same treatments as followed in rice. All the relevant -1
observations were recorded at speci�ed interval. Highest grain yield was recorded with the application of phosphogypsum @ 25% GR+ MSW compost @10 t ha which was -1
signi�cantly higher over application of gypsum @ 50% GR but statistically at par with
Table 62. Soil properties as in�uenced by paddy residue management
-1 -1 -1 -1Treatment pH EC (dS m ) O.C. (%) Av. N (kg ha ) Av. P (kg ha ) Av. K (kg ha )2 2
Residue burnt 8.80 0.37 0.36 177.71 15.27 353.75Residue retained 8.81 0.41 0.39 181.88 14.32 330Residue incorporated 8.70 0.31 0.42 184.6 16.63 361.25Urea 4%+residue incorporated 8.74 0.32 0.45 192.35 18.41 376.25CRD+ residue retained 8.75 0.35 0.40 188.40 16.82 391.25CRD+ residue incorporated 8.67 0.30 0.42 200.70 18.55 395 Initial 8.82 0.38 0.35 160.25 14.72 325.66
Table 63. Effect of residue management on energy transformations
Treatments Net Energy N (MJ) Total Net Energy NPK (MJ)Residue burnt 1819.78 2128.12Residue retained 2095.58 2232.97Residue incorporated 2275.48 2650.99Urea 4% +Residue incorporated 2788.06 3286.21CRD+ Residue retained 3340.53 3919.40CRD+ Residue incorporated 3340.53 3966.04CD (5%) 314.62 139.77
115
Recl
amat
ion
and
Man
agem
ent o
f Alk
ali S
oils
of C
entr
al a
nd E
aste
rn G
ange
tic P
lain
sA
nnua
l Rep
ort 2
018-
19
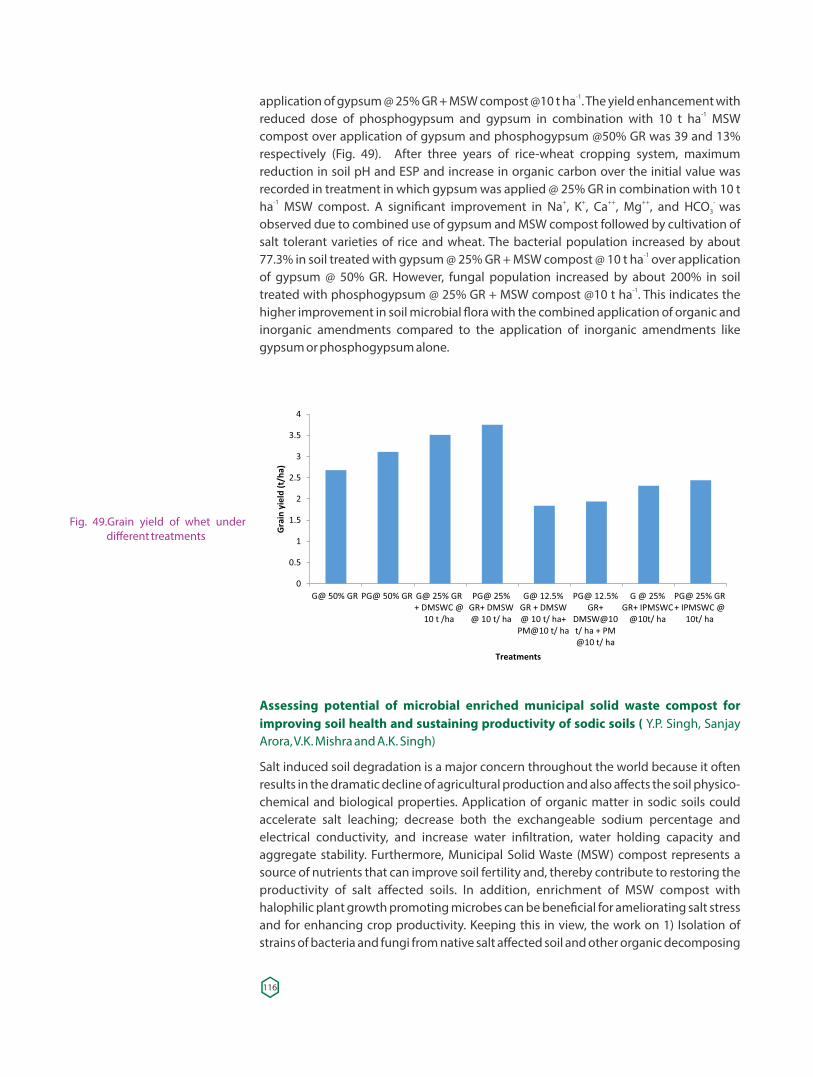
application of gypsum @ 25% GR + MSW compost @10 t ha . The yield enhancement with -1
reduced dose of phosphogypsum and gypsum in combination with 10 t ha MSW -1
compost over application of gypsum and phosphogypsum @50% GR was 39 and 13% respectively (Fig. 49). After three years of rice-wheat cropping system, maximum reduction in soil pH and ESP and increase in organic carbon over the initial value was recorded in treatment in which gypsum was applied @ 25% GR in combination with 10 t ha MSW compost. A signi�cant improvement in Na , K , Ca , Mg , and HCO was -1 + + ++ ++ -
3
observed due to combined use of gypsum and MSW compost followed by cultivation of salt tolerant varieties of rice and wheat. The bacterial population increased by about 77.3% in soil treated with gypsum @ 25% GR + MSW compost @ 10 t ha over application -1
of gypsum @ 50% GR. However, fungal population increased by about 200% in soil -1treated with phosphogypsum @ 25% GR + MSW compost @10 t ha . This indicates the
higher improvement in soil microbial �ora with the combined application of organic and inorganic amendments compared to the application of inorganic amendments like gypsum or phosphogypsum alone.
Fig. 49.Grain yield of whet under different treatments
Assessing potential of microbial enriched municipal solid waste compost for improving soil health and sustaining productivity of sodic soils ( Y.P. Singh, Sanjay Arora, V.K. Mishra and A.K. Singh)
Salt induced soil degradation is a major concern throughout the world because it often results in the dramatic decline of agricultural production and also affects the soil physico-chemical and biological properties. Application of organic matter in sodic soils could accelerate salt leaching; decrease both the exchangeable sodium percentage and electrical conductivity, and increase water in�ltration, water holding capacity and aggregate stability. Furthermore, Municipal Solid Waste (MSW) compost represents a source of nutrients that can improve soil fertility and, thereby contribute to restoring the productivity of salt affected soils. In addition, enrichment of MSW compost with halophilic plant growth promoting microbes can be bene�cial for ameliorating salt stress and for enhancing crop productivity. Keeping this in view, the work on 1) Isolation of strains of bacteria and fungi from native salt affected soil and other organic decomposing
116
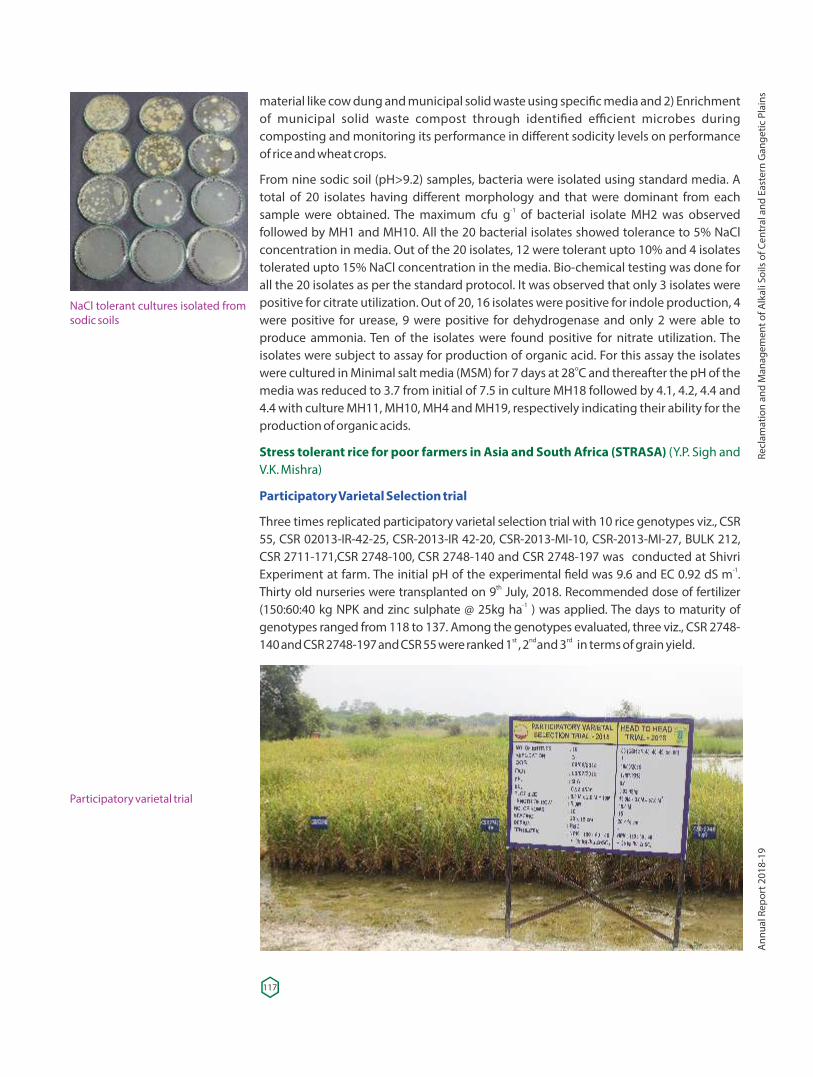
material like cow dung and municipal solid waste using speci�c media and 2) Enrichment of municipal solid waste compost through identi�ed efficient microbes during composting and monitoring its performance in different sodicity levels on performance of rice and wheat crops.
From nine sodic soil (pH>9.2) samples, bacteria were isolated using standard media. A total of 20 isolates having different morphology and that were dominant from each sample were obtained. The maximum cfu g of bacterial isolate MH2 was observed -1
followed by MH1 and MH10. All the 20 bacterial isolates showed tolerance to 5% NaCl concentration in media. Out of the 20 isolates, 12 were tolerant upto 10% and 4 isolates tolerated upto 15% NaCl concentration in the media. Bio-chemical testing was done for all the 20 isolates as per the standard protocol. It was observed that only 3 isolates were positive for citrate utilization. Out of 20, 16 isolates were positive for indole production, 4 were positive for urease, 9 were positive for dehydrogenase and only 2 were able to produce ammonia. Ten of the isolates were found positive for nitrate utilization. The isolates were subject to assay for production of organic acid. For this assay the isolates were cultured in Minimal salt media (MSM) for 7 days at 28 C and thereafter the pH of the o
media was reduced to 3.7 from initial of 7.5 in culture MH18 followed by 4.1, 4.2, 4.4 and 4.4 with culture MH11, MH10, MH4 and MH19, respectively indicating their ability for the production of organic acids.
Stress tolerant rice for poor farmers in Asia and South Africa (STRASA) (Y.P. Sigh and V.K. Mishra)
Participatory Varietal Selection trial
Three times replicated participatory varietal selection trial with 10 rice genotypes viz., CSR 55, CSR 02013-IR-42-25, CSR-2013-IR 42-20, CSR-2013-MI-10, CSR-2013-MI-27, BULK 212, CSR 2711-171,CSR 2748-100, CSR 2748-140 and CSR 2748-197 was conducted at Shivri
-1Experiment at farm. The initial pH of the experimental �eld was 9.6 and EC 0.92 dS m . thThirty old nurseries were transplanted on 9 July, 2018. Recommended dose of fertilizer
-1(150:60:40 kg NPK and zinc sulphate @ 25kg ha ) was applied. The days to maturity of genotypes ranged from 118 to 137. Among the genotypes evaluated, three viz., CSR 2748-
st nd rd140 and CSR 2748-197 and CSR 55 were ranked 1 , 2 and 3 in terms of grain yield.
NaCl tolerant cultures isolated from sodic soils
Participatory varietal trial
117
Recl
amat
ion
and
Man
agem
ent o
f Alk
ali S
oils
of C
entr
al a
nd E
aste
rn G
ange
tic P
lain
sA
nnua
l Rep
ort 2
018-
19
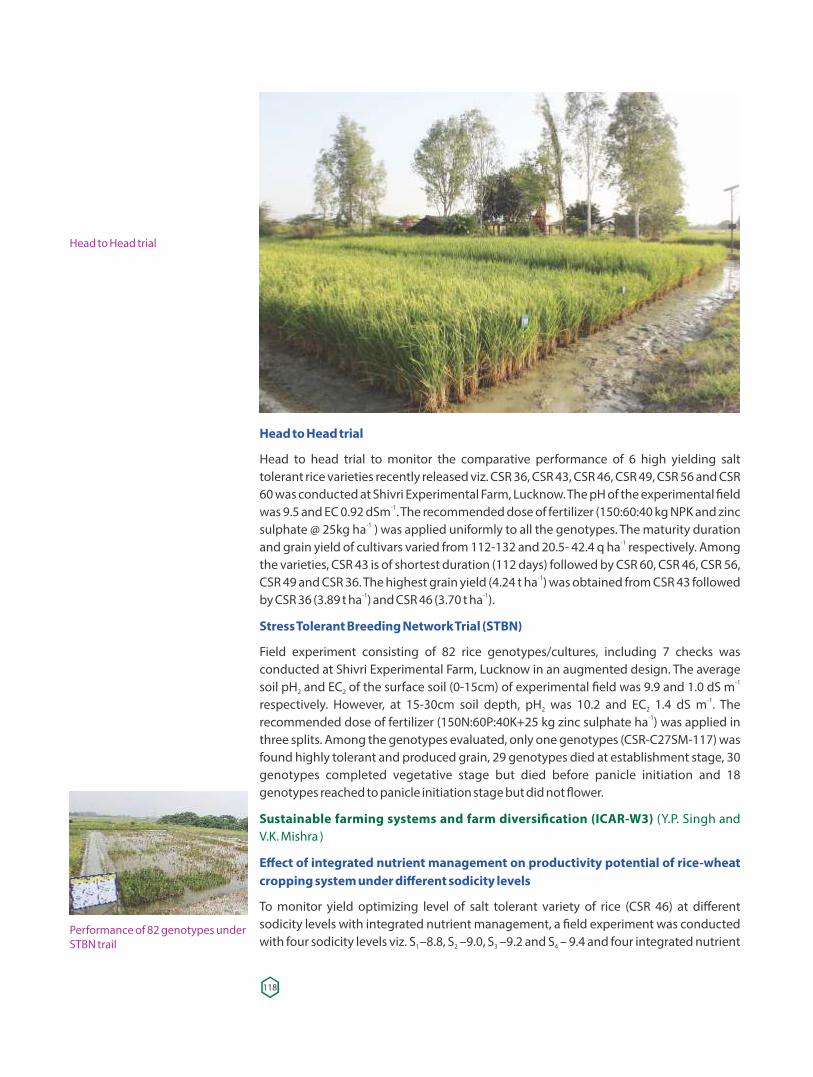
Head to Head trial
Head to head trial to monitor the comparative performance of 6 high yielding salt tolerant rice varieties recently released viz. CSR 36, CSR 43, CSR 46, CSR 49, CSR 56 and CSR 60 was conducted at Shivri Experimental Farm, Lucknow. The pH of the experimental �eld
-1was 9.5 and EC 0.92 dSm . The recommended dose of fertilizer (150:60:40 kg NPK and zinc -1sulphate @ 25kg ha ) was applied uniformly to all the genotypes. The maturity duration
-1and grain yield of cultivars varied from 112-132 and 20.5- 42.4 q ha respectively. Among the varieties, CSR 43 is of shortest duration (112 days) followed by CSR 60, CSR 46, CSR 56,
-1CSR 49 and CSR 36. The highest grain yield (4.24 t ha ) was obtained from CSR 43 followed -1 -1by CSR 36 (3.89 t ha ) and CSR 46 (3.70 t ha ).
Stress Tolerant Breeding Network Trial (STBN)
Field experiment consisting of 82 rice genotypes/cultures, including 7 checks was conducted at Shivri Experimental Farm, Lucknow in an augmented design. The average
-1soil pH and EC of the surface soil (0-15cm) of experimental �eld was 9.9 and 1.0 dS m 2 2-1respectively. However, at 15-30cm soil depth, pH was 10.2 and EC 1.4 dS m . The 2 2
-1recommended dose of fertilizer (150N:60P:40K+25 kg zinc sulphate ha ) was applied in three splits. Among the genotypes evaluated, only one genotypes (CSR-C27SM-117) was found highly tolerant and produced grain, 29 genotypes died at establishment stage, 30 genotypes completed vegetative stage but died before panicle initiation and 18 genotypes reached to panicle initiation stage but did not �ower.
Sustainable farming systems and farm diversi�cation (ICAR-W3) (Y.P. Singh and V.K. Mishra )
Effect of integrated nutrient management on productivity potential of rice-wheat cropping system under different sodicity levels
To monitor yield optimizing level of salt tolerant variety of rice (CSR 46) at different sodicity levels with integrated nutrient management, a �eld experiment was conducted with four sodicity levels viz. S –8.8, S –9.0, S –9.2 and S – 9.4 and four integrated nutrient 1 2 3 4
Head to Head trial
Performance of 82 genotypes under STBN trail
118
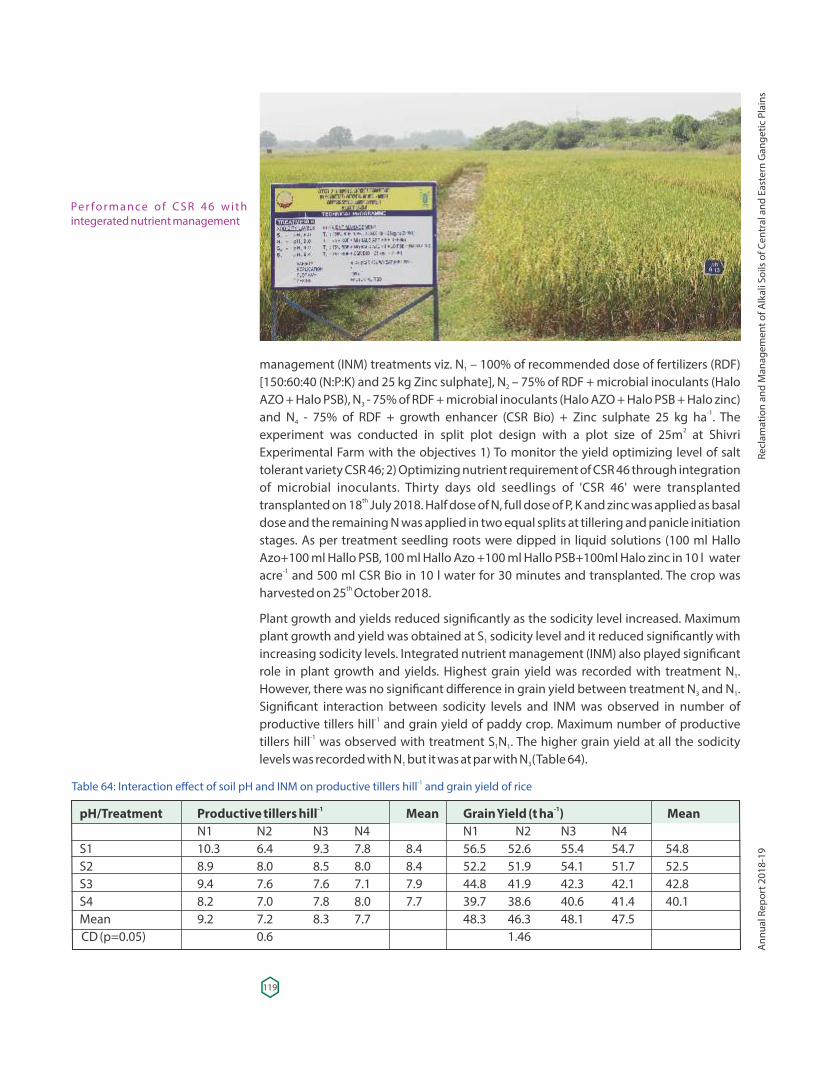
management (INM) treatments viz. N – 100% of recommended dose of fertilizers (RDF) 1
[150:60:40 (N:P:K) and 25 kg Zinc sulphate], N – 75% of RDF + microbial inoculants (Halo 2
AZO + Halo PSB), N - 75% of RDF + microbial inoculants (Halo AZO + Halo PSB + Halo zinc) 3
and N - 75% of RDF + growth enhancer (CSR Bio) + Zinc sulphate 25 kg ha . The -14
experiment was conducted in split plot design with a plot size of 25m at Shivri 2
Experimental Farm with the objectives 1) To monitor the yield optimizing level of salt tolerant variety CSR 46; 2) Optimizing nutrient requirement of CSR 46 through integration of microbial inoculants. Thirty days old seedlings of 'CSR 46' were transplanted transplanted on 18 July 2018. Half dose of N, full dose of P, K and zinc was applied as basal th
dose and the remaining N was applied in two equal splits at tillering and panicle initiation stages. As per treatment seedling roots were dipped in liquid solutions (100 ml Hallo Azo+100 ml Hallo PSB, 100 ml Hallo Azo +100 ml Hallo PSB+100ml Halo zinc in 10 l water
-1acre and 500 ml CSR Bio in 10 l water for 30 minutes and transplanted. The crop was harvested on 25 October 2018. th
Plant growth and yields reduced signi�cantly as the sodicity level increased. Maximum plant growth and yield was obtained at S sodicity level and it reduced signi�cantly with 1
increasing sodicity levels. Integrated nutrient management (INM) also played signi�cant role in plant growth and yields. Highest grain yield was recorded with treatment N . 1
However, there was no signi�cant difference in grain yield between treatment N and N . 3 1
Signi�cant interaction between sodicity levels and INM was observed in number of productive tillers hill and grain yield of paddy crop. Maximum number of productive -1
tillers hill was observed with treatment S N . The higher grain yield at all the sodicity -11 1
levels was recorded with N but it was at par with N (Table 64). 1 3
Pe r fo r m a n ce o f C S R 4 6 w i t h integerated nutrient management
-1Table 64: Interaction effect of soil pH and INM on productive tillers hill and grain yield of rice
-1 -1pH/Treatment Productive tillers hill Mean Grain Yield (t ha ) Mean N1 N2 N3 N4 N1 N2 N3 N4 S1 10.3 6.4 9.3 7.8 8.4 56.5 52.6 55.4 54.7 54.8S2 8.9 8.0 8.5 8.0 8.4 52.2 51.9 54.1 51.7 52.5S3 9.4 7.6 7.6 7.1 7.9 44.8 41.9 42.3 42.1 42.8S4 8.2 7.0 7.8 8.0 7.7 39.7 38.6 40.6 41.4 40.1Mean 9.2 7.2 8.3 7.7 48.3 46.3 48.1 47.5 CD (p=0.05) 0.6 1.46
119
Recl
amat
ion
and
Man
agem
ent o
f Alk
ali S
oils
of C
entr
al a
nd E
aste
rn G
ange
tic P
lain
sA
nnua
l Rep
ort 2
018-
19
Screening and evaluation of wheat, mustard, rice and lentil genotypes for sodicity tolerance ( Y.P. Singh and V.K. Mishra)
Wheat
All India Salinity /Alkalinity Tolerance Screening Nursery Trial
All India salinity/ alkalinity tolerant screening nursery trial on wheat consisting of 40 entries including 4 checks was conducted at Shivri Experimental Farm, Lucknow in an augmented design. The pH of the experimental �eld at the time of sowing was 9.5 and 2
EC 0.45 dS m . Each entry was sown in a net plot size of 3 m with �ve rows of 3 m length. -1 22
The trial was sown on 29 November 2017 and harvested on 11 April 2018. th th
Recommended dose of fertilizer (100:60:40 N: P: K) was applied. Among the genotypes evaluated, SAN-17, SAN-06, SAN-14, SAN-04 were found promising in terms of grain yield and produced 3.52, 3.50, 3.42, and 3.33 t ha respectively. -1
Mustard
All India coordinated Trial on rapeseed mustard
An IVT trial consisting of 10 lines was conducted under alkaline condition (pH 9.2 and EC 2 2
0.62 dS m ) at Shivri Experimental Farm, Lucknow. These lines were sown on 25 October -1 th
2017 and harvested on 13 March 2018. Each line was sown at a spacing of 45 x 15cm in a th
net plot size of 6.08 m and replicated three times. Signi�cant differences were observed 2
in seed yield amongst the genotypes evaluated. Seed yield ranged from 1.50 to 2.07 t ha . -1
Genotype CSCN 17-10 (2.07 t ha ) followed by CSCN17-1 (2.03 t ha ) and CSCN17-4 (1.98 t ha ) -1 -1 -1
produced the highest seed yield. Another AVT trial with 12 entries was conducted at the same site. The genotypes were sown on 24 October 2017 and harvested on 13 March th th
2018. Each genotype was grown in a net plot of 4.05 m . Signi�cant differences were 2
observed in seed yield amongst the genotypes evaluated. Recommended dose of fertilizer (80:60:40 N:P:K) was applied uniformly to all the genotypes. Seed yield ranged from 1.49 to 2.02 t ha . Genotype CSCN17-13 produced maximum grain yield (2.02 t ha ) -1 -1
followed by CSCN17-21 (2.00 t ha ) and CSCN 17-12 (1.99 t ha ) whereas minimum with -1 -1
CSCN 17-11(1.49 t ha ).-1
All India Coordinated Agronomy Trial was conducted to evaluate the performance of 7
-1 -2Table 65. Seed yield (q ha ) of mustard (Brassica juncea) AVT entries under different fertility levels and spacing under salinity/alkalinityconditions
Entries Spacing 30 x 10 cm Mean seed Spacing 45 x 15 cm Mean seed-1 -1 ertility levels Yield(t ha ) Fertility levels Yield (t ha )
100%RDF 125% RDF 150% RDF 100%RDF 125% RDF 150%RDF AG-12 17.26 18.77 19.67 1.86 17.88 18.88 20.01 1.89AG-13 18.55 20.11 21.81 2.02 18.81 20.78 22.48 2.07AG-14 16.70 17.61 18.63 1.77 17.28 17.86 19.14 1.81AG-15 17.81 19.40 21.23 1.95 18.40 20.44 21.78 2.02AG-16 17.59 19.70 21.59 1.96 18.50 20.81 22.22 2.05AG-17 21.48 23.70 24.59 2.33 24.18 25.13 24.06 2.41AG-18 18.71 20.62 22.18 2.05 19.12 20.99 22.77 2.09Mean 18.30 19.99 21.39 18.98 20.57 21.93 CD (5%) Entries Fertility Spacing Interaction Interaction Interaction (E x F x S) = 0.38 (E)=0.22 (F)=0.19 (S)=0.11 (E x F) =0.28 (F x S) =ns
120
promising rapeseed-mustard entries viz. AG-12, AG 13, AG 14, AG 15, AG 16, AG 17 and AG 18 under three fertilizer levels viz. 100% of RDF, 125% of RDF and 150% of RDF and two spacing viz. 30x10 cm and 45x15 cm. Three times replicated �eld experiment was conducted at pH 9.0 and EC 0.57 dS m in split plot design. These entries were sown on -1
24 October 2017 and harvested from 12 to 18 March, 2018. Each entry was sown in 4.5 th th th
m plot. Among the entries, AG 17 produced signi�cantly higher grain yield at all the 2
fertility levels at both the spacings. However, there was no signi�cant different among the entries due to interaction between fertility levels x spacing Table 65.
Lentil
Evaluation of lentil genotypes under alkaline conditions
A �eld trial with 155 lentil genotypes was conducted at Shivri Experimental Farm, Lucknow were during Rabi 2017-18 for phenotyping under alkaline �eld conditions. Signi�cant genotypic variation for alkalinity stress was observed among the genotypes evaluated in the �eld having pH 9.0. Among the evaluated entries, two genotypes PSL-9 and PDL-1 yielded better than the checks. These genotypes can be utilized for developing alkalinity tolerant genotypes.
Rice
Initial Variety Trial- Alkaline and Inland Saline Tolerant Variety Trial (IVT-AL & ISTVT)
To evaluate comparative performance of promising elite cultures under alkalinity and inland salinity, a �eld experiment consisting of 28 entries including one local check (CSR 36) was conducted at Shivri Experimental Farm, Lucknow. The pH of experimental �eld at
-10-30cm soil depth was 9.4 and EC 0.58 dS m . The experiment was conducted in a thRandomized Block Design with four replications. The crop was transplanted on 10
2August 2018 with 3 rows of 5 m length having plot size of 3.0 m . Among the entries evaluated, 2108, 2114, and 2102 were found promising and produced 5.38, 5.26, and 4.92
-1t ha respectively.
Performance of lentil genotypes at pH 9.0
121
Recl
amat
ion
and
Man
agem
ent o
f Alk
ali S
oils
of C
entr
al a
nd E
aste
rn G
ange
tic P
lain
sA
nnua
l Rep
ort 2
018-
19
Advance Varietal Trial- Alkaline and Inland Saline Tolerant Variety Trial (AVT-1 AL& ISTVT
Twenty three advance rice entries including one check (CSR 36) were evaluated under -1high sodicity conditions (pH 9.7 and EC 1.1 dS m ) at Shivri Experimental Farm, Lucknow,
during kharif 2018. The trial was conducted in RBD with four replications. Each genotype 2was planted at 20 x 15 cm apart in 7 rows of 4 m length having net plot size of 5.6 m . Thirty
thdays old seedlings were planted on 6 July 2018 and recommended dose of fertilizer -1(150:60:40 N:P:K ) and 25 kg ha zinc sulphate was applied. Among the entries evaluated,
-12010, 2021, and 2011 reported the highest grain yield (>4.0 t ha ) whereas, minimum -1(1.34 t ha ) was seen in entry 2003. (Fig. 50).
All India Coordinated Agronomy Trial
Nitrogen response trials on selected AVT-2 rice cultures under high and low input management environments were conducted at Shivri Experimental farm, Lucknow during Kharif 2018 with the objectives to maximize the yield of recent released varieties under high and low input management and to maximize the rice pro�ts through integrated nutrient management approaches. Treatments consisted of two fertilizer levels (F -100% of recommended dose of fertilizers, and F -150% recommended dose of 1 2
fertilizers in main plot and six rice cultures/varieties viz. CSR 10, CSR 23, CSR 36, Jaya, IET 22836 and Ganga kaveri (local check) in sub plots. Three times replicated �eld experiment
2was laid in split plot design with a net plot size of 8.0 m . The experiment was conducted at -1 -1soil having pH 8.9, available N 116.32 kg ha , available P 28.0 and K 336.12 kg ha . Grain
yield of all the entries increased with increasing fertilizer levels. The grain yield of CSR 36 at both the fertilizer levels was signi�cantly higher over rest of the varieties.
PET trial
A �eld trial with 150 entries was conducted at Shivri Experimental Farm, Lucknow during -1kharif 2018. The initial pH of the experimental �eld was 9.8 and EC 0.81dS m . Each entry
thwas planted in 2 rows at 20 x 15 cm spacing and 4.5 m length on 24 July 2018. -1Recommended dose of fertilizer (150:60:40 N:P:K + 25kg zinc sulphate ha ) was given
uniformly to each line. Among the entries evaluated, PET 36, PET 6, and PET 22 reported -1highest grain yield to the level of 3.89, 3.67 and 3.61 t ha , respectively. Nine entries did
not reach to �owering, and 29 entries produced panicles but there was no grain �lling.
Fig. 50 Grain yield of Advance Alkaline and Inland Saline Tolerant Variety Trial (AVT-1 AL& ISTVT)
-1G
rain
yie
ld (q
ha
)
122
F segregating rice lines2
To evaluate the comparative performance of F segregating lines for alkalinity tolerance, a 2
�eld experiment consisting of 138 entries was conducted at Shivri Experimental Farm, -1Lucknow. The pH of experimental �eld at 0-15 cm soil depth was 9.8 and EC 0.98 dS m .
thThe crop was transplanted on 25 July 2018 with 2 rows of 3 m length having plot size of 21.6 m . Among the lines evaluated, CSR 458-16, CSR 457-16, CSR 459-16 and CSR 417-16
-1were found promising and produced > 2.0 t ha grain yield. There was no �owering in 12 lines and 83 lines reached to panicle stage but there was no grain �lling.
Development of soil moisture sensor to automate solar PV based irrigation system for salt affected soils ( A.K. Singh, C. L. Verma, A. K. Bhardawaj, Anju K Singh and V.K. Mishra)
Introduction
Soil moisture is one of the basic parameter for making irrigation management decisions. Different methods are in vogue to estimate soil moisture content at particular soil depths in relation to the crop rooting depth and can be broadly classi�ed as feel method, direct methods, and indirect methods. Generally irrigation scheduling at farmers level, is being practiced by observing �eld conditions in paddy during kharif and based on crop growth stages or at �xed interval during rabi. There is no control or speci�c guidelines at farmers level on amount of water to be applied, leading to over or under application of irrigation water. Scienti�c approaches of irrigation management, require measurement of soil water content in the root zone. Sensor based instruments do provide opportunity for real time estimation of soil water content but most of the commonly available instruments are sophisticated and mostly manageable at R&D level. At farm level, we require user-friendly soil moisture sensors, which requires less technicality and are cost effective. Further, the sensor output can be integrated with pump operation in such a way that when soil water content drops below a critical limit the pumping unit can be operated automatically for irrigation and can be shut off after application of required amount of irrigation water. Considering above the project aims to develop a soil moisture sensor, this further can be explored to engage the developed sensor in automation of irrigation systems.
Soil moisture sensing techniques
Methods involving use of sensors are generally termed a indirect methods as these methods most commonly employ electrical properties of the soil (dielectric constant, acoustic impedance, capacitance, thermal conductivity and soil resistivity etc.), soil matric potential, magnetic resonance of the water molecules, infrared rays, and radioactive techniques such as neutron scattering, gamma attenuation and optical techniques based on re�ection and absorption to estimate the soil moisture status. These methods use sensors of different kinds to sense the wetness of soil, hence provides opportunity for real time irrigation scheduling also.
Fabrication of soil moisture probe and building of electronic circuits based on resisitive concept
Based on the resisitive soil mositure sensing concept, probes of copper and aluminium material were selected in form of plates available in the market. The copper probes of 1.9 and 0.9 cm width having 0.3 cm thickness and aluminium probes of 2.4 and 1.1 cm width having thickness of 0.5 cm were fabricated by varying the spacing between the probes (i.e. at 1, 2, 3 and 4 cm). The length of all the probes were equal and can be inserted at
123
Recl
amat
ion
and
Man
agem
ent o
f Alk
ali S
oils
of C
entr
al a
nd E
aste
rn G
ange
tic P
lain
sA
nnua
l Rep
ort 2
018-
19
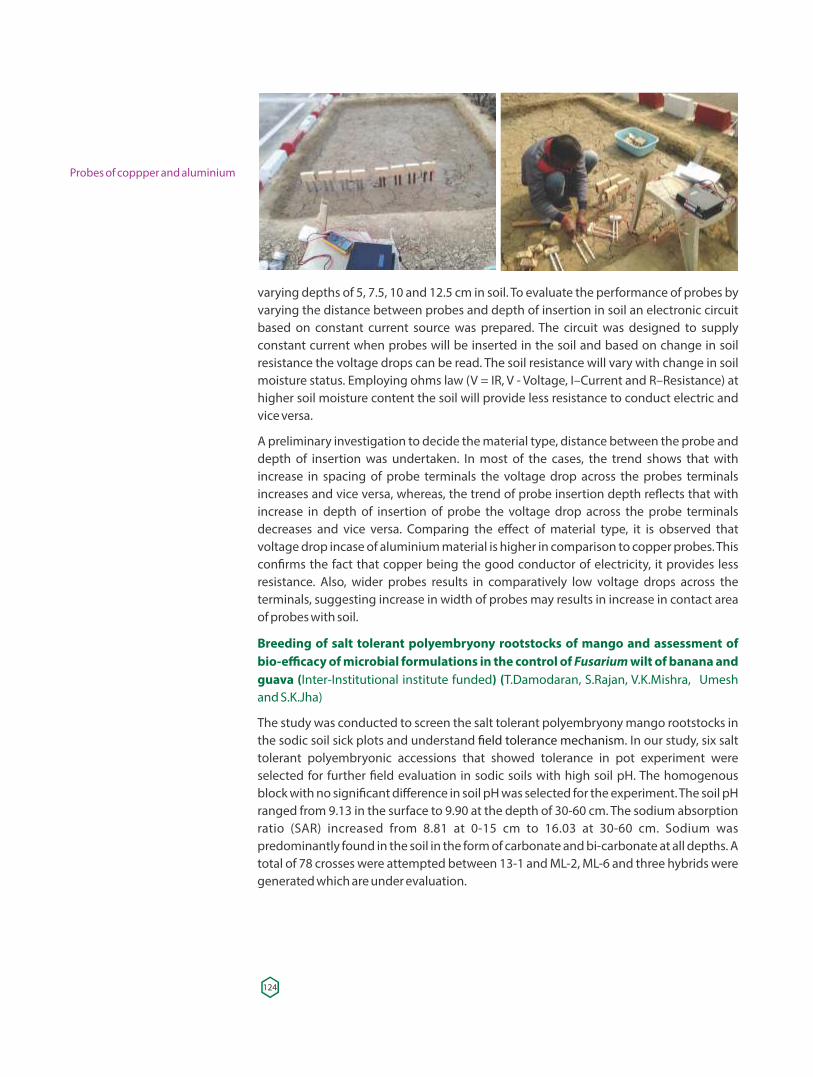
varying depths of 5, 7.5, 10 and 12.5 cm in soil. To evaluate the performance of probes by varying the distance between probes and depth of insertion in soil an electronic circuit based on constant current source was prepared. The circuit was designed to supply constant current when probes will be inserted in the soil and based on change in soil resistance the voltage drops can be read. The soil resistance will vary with change in soil moisture status. Employing ohms law (V = IR, V - Voltage, I–Current and R–Resistance) at higher soil moisture content the soil will provide less resistance to conduct electric and vice versa.
A preliminary investigation to decide the material type, distance between the probe and depth of insertion was undertaken. In most of the cases, the trend shows that with increase in spacing of probe terminals the voltage drop across the probes terminals increases and vice versa, whereas, the trend of probe insertion depth re�ects that with increase in depth of insertion of probe the voltage drop across the probe terminals decreases and vice versa. Comparing the effect of material type, it is observed that voltage drop incase of aluminium material is higher in comparison to copper probes. This con�rms the fact that copper being the good conductor of electricity, it provides less resistance. Also, wider probes results in comparatively low voltage drops across the terminals, suggesting increase in width of probes may results in increase in contact area of probes with soil.
Breeding of salt tolerant polyembryony rootstocks of mango and assessment of bio-efficacy of microbial formulations in the control of Fusarium wilt of banana and guava (Inter-Institutional institute funded) (T.Damodaran, S.Rajan, V.K.Mishra, Umesh and S.K.Jha)
The study was conducted to screen the salt tolerant polyembryony mango rootstocks in the sodic soil sick plots and understand . In our study, six salt �eld tolerance mechanismtolerant polyembryonic accessions that showed tolerance in pot experiment were selected for further �eld evaluation in sodic soils with high soil pH. The homogenous block with no signi�cant difference in soil pH was selected for the experiment. The soil pH ranged from 9.13 in the surface to 9.90 at the depth of 30-60 cm. The sodium absorption ratio (SAR) increased from 8.81 at 0-15 cm to 16.03 at 30-60 cm. Sodium was predominantly found in the soil in the form of carbonate and bi-carbonate at all depths. A total of 78 crosses were attempted between 13-1 and ML-2, ML-6 and three hybrids were generated which are under evaluation.
Probes of coppper and aluminium
124
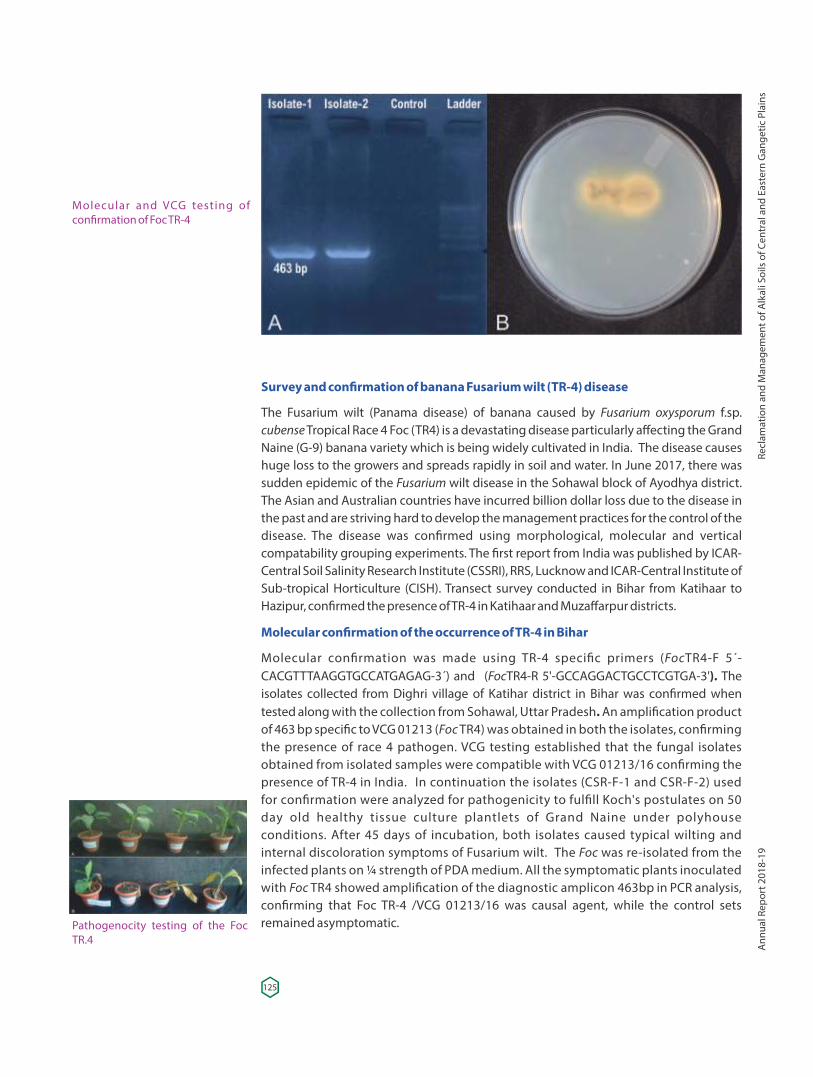
Survey and con�rmation of banana Fusarium wilt (TR-4) disease
The Fusarium wilt (Panama disease) of banana caused by Fusarium oxysporum f.sp. cubense Tropical Race 4 Foc (TR4) is a devastating disease particularly affecting the Grand Naine (G-9) banana variety which is being widely cultivated in India. The disease causes huge loss to the growers and spreads rapidly in soil and water. In June 2017, there was sudden epidemic of the Fusarium wilt disease in the Sohawal block of Ayodhya district. The Asian and Australian countries have incurred billion dollar loss due to the disease in the past and are striving hard to develop the management practices for the control of the disease. The disease was con�rmed using morphological, molecular and vertical compatability grouping experiments. The �rst report from India was published by ICAR-Central Soil Salinity Research Institute (CSSRI), RRS, Lucknow and ICAR-Central Institute of Sub-tropical Horticulture (CISH). Transect survey conducted in Bihar from Katihaar to Hazipur, con�rmed the presence of TR-4 in Katihaar and Muzaffarpur districts.
Molecular con�rmation of the occurrence of TR-4 in Bihar
Molecular con�rmation was made using TR-4 speci�c primers (FocTR4-F 5´-CACGTTTAAGGTGCCATGAGAG-3´) and (FocTR4-R 5'-GCCAGGACTGCCTCGTGA-3'). The isolates collected from Dighri village of Katihar district in Bihar was con�rmed when tested along with the collection from Sohawal, Uttar Pradesh. An ampli�cation product of 463 bp speci�c to VCG 01213 (Foc TR4) was obtained in both the isolates, con�rming the presence of race 4 pathogen. VCG testing established that the fungal isolates obtained from isolated samples were compatible with VCG 01213/16 con�rming the presence of TR-4 in India. In continuation the isolates (CSR-F-1 and CSR-F-2) used for con�rmation were analyzed for pathogenicity to ful�ll Koch's postulates on 50 day old healthy tissue culture plantlets of Grand Naine under polyhouse conditions. After 45 days of incubation, both isolates caused typical wilting and internal discoloration symptoms of Fusarium wilt. The Foc was re-isolated from the infected plants on ¼ strength of PDA medium. All the symptomatic plants inoculated with Foc TR4 showed ampli�cation of the diagnostic amplicon 463bp in PCR analysis, con�rming that Foc TR-4 /VCG 01213/16 was causal agent, while the control sets remained asymptomatic.
Molecular and VCG testing of con�rmation of Foc TR-4
Pathogenocity testing of the Foc TR.4
125
Recl
amat
ion
and
Man
agem
ent o
f Alk
ali S
oils
of C
entr
al a
nd E
aste
rn G
ange
tic P
lain
sA
nnua
l Rep
ort 2
018-
19
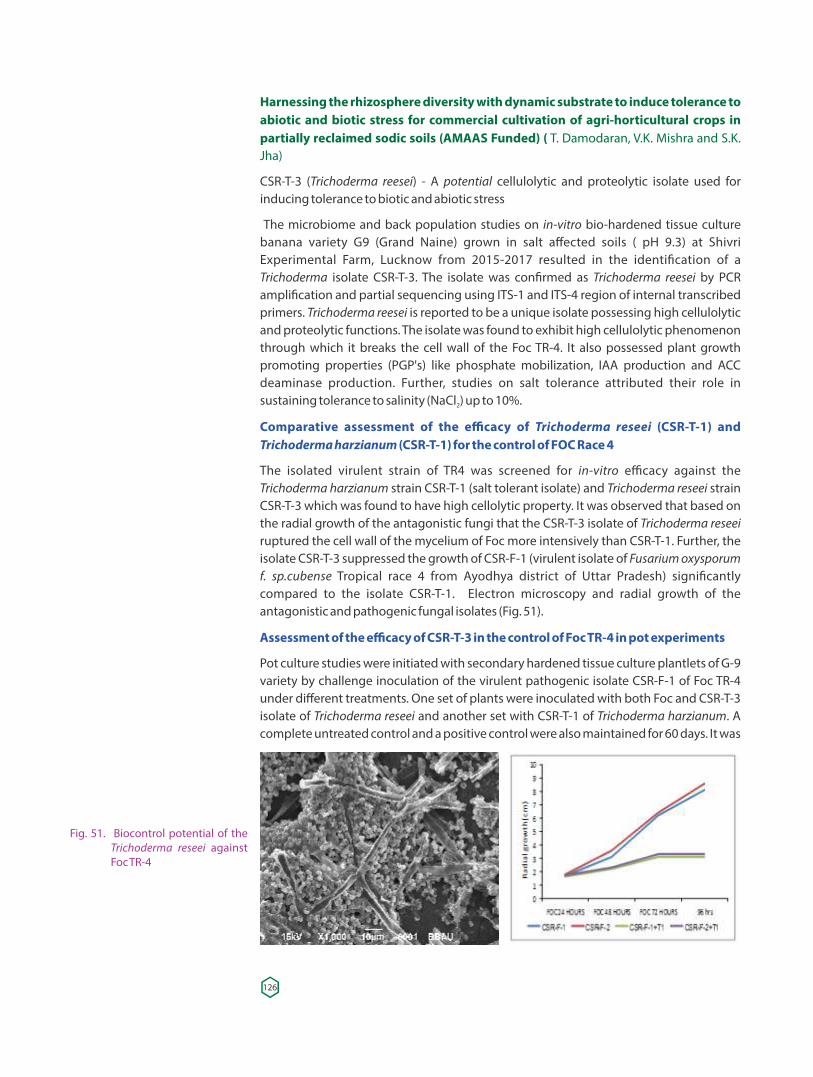
Harnessing the rhizosphere diversity with dynamic substrate to induce tolerance to abiotic and biotic stress for commercial cultivation of agri-horticultural crops in partially reclaimed sodic soils (AMAAS Funded) ( T. Damodaran, V.K. Mishra and S.K. Jha)
CSR-T-3 (Trichoderma reesei) - A potential cellulolytic and proteolytic isolate used for inducing tolerance to biotic and abiotic stress
The microbiome and back population studies on in-vitro bio-hardened tissue culture banana variety G9 (Grand Naine) grown in salt affected soils ( pH 9.3) at Shivri Experimental Farm, Lucknow from 2015-2017 resulted in the identi�cation of a Trichoderma isolate CSR-T-3. The isolate was con�rmed as Trichoderma reesei by PCR ampli�cation and partial sequencing using ITS-1 and ITS-4 region of internal transcribed primers. Trichoderma reesei is reported to be a unique isolate possessing high cellulolytic and proteolytic functions. The isolate was found to exhibit high cellulolytic phenomenon through which it breaks the cell wall of the Foc TR-4. It also possessed plant growth promoting properties (PGP's) like phosphate mobilization, IAA production and ACC deaminase production. Further, studies on salt tolerance attributed their role in sustaining tolerance to salinity (NaCl ) up to 10%. 2
Comparative assessment of the efficacy of Trichoderma reseei (CSR-T-1) and Trichoderma harzianum (CSR-T-1) for the control of FOC Race 4
The isolated virulent strain of TR4 was screened for in-vitro efficacy against the Trichoderma harzianum strain CSR-T-1 (salt tolerant isolate) and Trichoderma reseei strain CSR-T-3 which was found to have high cellolytic property. It was observed that based on the radial growth of the antagonistic fungi that the CSR-T-3 isolate of Trichoderma reseei ruptured the cell wall of the mycelium of Foc more intensively than CSR-T-1. Further, the isolate CSR-T-3 suppressed the growth of CSR-F-1 (virulent isolate of Fusarium oxysporum f. sp.cubense Tropical race 4 from Ayodhya district of Uttar Pradesh) signi�cantly compared to the isolate CSR-T-1. Electron microscopy and radial growth of the antagonistic and pathogenic fungal isolates (Fig. 51).
Assessment of the efficacy of CSR-T-3 in the control of Foc TR-4 in pot experiments
Pot culture studies were initiated with secondary hardened tissue culture plantlets of G-9 variety by challenge inoculation of the virulent pathogenic isolate CSR-F-1 of Foc TR-4 under different treatments. One set of plants were inoculated with both Foc and CSR-T-3 isolate of Trichoderma reseei and another set with CSR-T-1 of Trichoderma harzianum. A complete untreated control and a positive control were also maintained for 60 days. It was
Fig. 51. Biocontrol potential of the Trichoderma reseei against Foc TR-4
126
observed that the treatment involving CSR-T-3 effectively controlled the disease with the severity index of 0.75 while it was 3.50 in Foc treated alone where the plants showed speci�c wilt symptoms. A bio-formulation ICAR-FUSICONT was formulated using consortia of microbes involving CSR-T-3 and CSR-A-11 a growth promoter under stressed conditions in a speci�c media which is being applied for patent protection.
Assessment of the efficacy of FUSICONT in the control of Foc TR-4 in sick �elds of Ayodhya district
Field evaluation of the formulation at 10 sick �elds indicated that the bioformulation FUSICONT was effective in controlling the disease registering the disease index of 0.30 while it was 40-50% affected in the control with the disease score of 3.80 (Table 66). The yield of the plant was also signi�cantly higher in the FUSICONT treated plots compared to the untreated control. This suggests that the formulation can be commercialized as a source for the management of the disease in reclaimed sodic and normal soils.
Sodic agro-ecosystems of Uttar Pradesh: integrated and autonomous adaptations by material resource-poor farmers against multiple stressors (Ranjay K. Singh, Anshuman Singh, Satyendra Kumar, Parvender Sheoran and Dheeraj Singh)
World over, only few studies have been conducted for understanding the diversity of small scale and family managed agricultural systems, and informal strategies that millions of small farmers have adapted to strengthen their livelihoods in the face of multiple stressors. To better understand key aspects of autonomous strategy tracked from the study areas of Jaunpur which was spread up to Azamgarh district (sodicity affected track), by taking community as a case study example, we studied their traditional Bharintegrated approach for managing the terrestrial and aquatic resources. Keeping these facts in mind, this study was carried out with following objectives: to identify and understand integrated land use production systems and multiple stressors as perceived by community and assessing the adaptation strategies followed by people in Bhar Bharsodic agro-ecosystems.
This study was conducted in �ve -dominated villages in the eastern part of Azamgarh Bhardistrict of Uttar Pradesh (UP). The purpose was to understand integrated adaptation strategies led by autonomous practices. The community, is well known for its Bhar distinctive lifestyle, relying heavily on freshwater aquatic resources (wild rice, �sh, horticultural produce, etc). The lands where they grow crops are sodic in nature and less productive (1.8-2.2 t ha rice; 1.5-2.0 t ha wheat), compelling them to harness the aquatic -1 -1
resources as well as to make informed adaptive decisions for livelihood support from other land use systems. From each village, ten farmers (total 50) were identi�ed as the respondents using snowball sampling technique. The average age of respondents was 60 years and they had 25-40 years of experience in agriculture, and accessing wetland resources. A total of 15 key participants (~ 3 from each village) were also selected who helped in organizing the focus group discussions (FGD) in their respective villages and
Table 66: Effect of FUSICONT on plant growth and disease control
Treatments Plant height Plant girth No. of leaves No. of hands Yield Disease scoring -1 (cm) (cm) plant (kg) index
Control 120.69 (± 11.57) 30.86(± 2.83) 2.60(± 0.84) 4.50(± 1.17) 6.24(± 1.91) 3.80(± 0.78)FUSICONT 213.46(± 4.04) 37.43(± 2.83) 7.60(± 0.51) 10.00(± 1.41) 38.20(± 3.99) 0.30 (± 0.48)
127
Recl
amat
ion
and
Man
agem
ent o
f Alk
ali S
oils
of C
entr
al a
nd E
aste
rn G
ange
tic P
lain
sA
nnua
l Rep
ort 2
018-
19
offered their expertise during transect walk in and around the (lake).Badailataal
The content for developing interview schedule on perceived stressors was collected from a review of the local literature (news papers, magazines, relevant websites and research articles) and �eld visits held with the community. Perception about multiple stressor Bhar was measured on 5 �ve point continuum by applying Likert scale with scoring technique 5 to 1. The adaptation and conservation strategies were measured using four point continuum for which scores 3 to 0 was assigned. While, quantitative data on perceived stressors, adaptation strategies and willingness for conservation of selected wetland resources were generated using statements. Among the wetland resources, we selected three most widely used resources i.e. local �sh, and as part of knowing tinni kaul-gatta Bhar's willingness on conservation of wetland resources. The open-ended questions were inserted in interviews schedule covering traditional knowledge, access patterns and institutional perspectives (CPR and private resources) on wetland resources and socio-cultural and livelihood values of different land use resources (qualitative aspects). Both, quantitative and qualitative approaches were followed to analyze the data and interpret the results.
1Table 67: Seasonal pattern of access to resources across the landscapes, and the associated stressors
2Seasons Upper landscape Middle landscape Lower landscape to wetland Crops resources Stressors Crop resources Stressors Wild resources StressorsRabi Local wheat varieties.
-1 Yield: 1.8-2.2 t ha-1 rice, 1.5-2.0 t ha
wheat.
Kharif Rice crop with As above local varieties
Zayad No crop As above No crop
Higher soil pH (8.9-9.8), meagre investments, poor formal knowledge network, poor agricultural governance and climate variability
Wheat, pea, gram, sugarcane and local vegetables.
-1Yield: 2.0-2.5 t ha -1(rice), 1.8-2.1 t ha
(wheat).
Soil pH(8.5-9.0), tiny landholding making unable to adopt mechanization, low resource use capacity, climate variability
Wild rice with indigenous �shes, and aquatic plant resources.Yield: 2.2-3.2
-1t ha rice (local rice ~1.8
-1t ha ), 2.2-3.0 t -1ha wheat
Drought, �ood, land tenure issue, top-bottom governance issues on common property resources, encroachment and changes in wetland areas
Rice crop with local varieties (Lohatan)
Water crisis and low input use efficiency
Access of seasonal �sh and aquatic plant resources
As above
Micro-ecosystem being used for rice nursery and carrying fertile clay for upper landscape
As above
1 2Data pertaining to this table was generated using FGD (focus group discussion) with 15 key participants. Here landscape is a relative term and is applied in context of comparing the land use systems across the gradient.
128
Integrated land use systems and associated stressors: The results indicated that broadly there are three types of land use systems which are integral in nature (Table 67). Each land use system is exposed to a set of ecological (soil sodicity and poor soil fertility) and climatic (drought and �ood) stressors which in interaction with socio-political and institutional factors render community vulnerable to external shocks farmers Bhar . Bhar not only have less adaptive capacity (small land holdings, less education and poverty), but also face problems caused by the poor presence of formal institutions and the services they provide.
Perceived stressors: The results indicated that edaphic (soil pH), land tenure, climate variability; low economic status and poor governance of formal institutions were �rst �ve stressors in one cluster. Poor institutional presence, small land holdings, lack of required inputs (salt tolerant seed and gypsum) and changes in land use pattern were found to be the another perceived set of stressors impacting farmers' livelihoods. Results of Wilcoxon matched-pairs signed ranks test indicated that climatic, socio-economic and political (poor presence of institutions and governance in enabling adaptations) stresses were signi�cant stressors as perceived by the community.Bhar
Autonomous adaptation strategies among farmers
The qualitative results indicated that farmers follow autonomous adaptation Bharstrategies and accord top priority to rear and catch the indigenous �sh from wetlands (adaptation), growing crops in middle (rice-wheat with local vegetables, pulses and oil seeds) and upper (growing rice and wheat) landscapes to make their livelihoods resilient. Availing the bene�ts under schemes such as MGNREGA (Mahatma Gandhi National Rural Employment Guarantee Act) and PDS (Public Distribution System) as adaptation, willingness to conserve wetland resources such as kaul-gatta, access of alone, cyclic tinnimigration to cities and towns and accessing together with local �sh (as adaptation) tinniwere found to be of secondary priorities for adaptation to the perceived stressors.
The people, by harnessing the synergies of integrated land use systems and wetland Bharresources, have not only sustained their food and livelihood needs but have also developed unique local knowledge that needs to be integrated in the co-management of wetland resources for minimizing the livelihood risks of marginal communities of the studied and other similar communities. In a nutshell, the roles of wetland resources in maintaining livelihood resilience and sustaining ecosystem services need to be considered by the policy makers.
Impact of capacity building (Hisar case) on crop yields in saline environment: One of the core activities in project was to strengthen the capacity of farmers through training, knowledge and awareness, providing them timely agro-advisories and making available salt tolerant crop varieties. Under this, farmers of villages of Hisar block of Hisar district were provided agro advisories along with seeds of salt tolerant wheat (KRL 210), mustard (CS 58) and chick pea (Karnal Chana 1) varieties. Results indicated that soil salinity was in range of 2.5 to 3.0 dS m while salinity (EC ) of irrigation water varied between 2.5 to 7.0 -1
iw
dS m (Table 68). -1
Intervention of wheat KRL 210 along with agro-advisories on conjunctive use of irrigation water could help farmers to harvest yield 5.1 t ha as compared to 4.4 t ha -1 -1
local wheat variety (19.61% increase). In the saline conditions, salt tolerant mustard 'CS 58' yielded 2.3 t ha as compared to 1.4 t ha of local mustard variety (39.13% increase) -1 -1
(Table 68).
129
Recl
amat
ion
and
Man
agem
ent o
f Alk
ali S
oils
of C
entr
al a
nd E
aste
rn G
ange
tic P
lain
sA
nnua
l Rep
ort 2
018-
19
In case of chick pea, salt tolerant 'Karnal Chana-1' produced about 1.7 t ha grain yield -1
(29.41% increase) as compared to 1.2 t ha in local variety. The impacts of these salt -1
tolerant crop varieties could motivate other farmers, and 20% of fellow farmers (those who were in network of selected farmers) started using conjunctive use of water, while now 50 farmers started adopting KRL 210, 41 farmers 'CS 58' and 10 farmers ' Karnal Chana 1'.
Table 68: Impact of capacity building on intervention of salt tolerant crop varieties and changing irrigation method for saline water and thereby increase in crop yield
-1Crops/Varieties Soil EC (dS m ) Irrigation Irrigation Mode Mean Mean % Water EC no. yield STV yield increase
iw -1 (EC ) (t ha ) local varietyKRL 210 (n=10) 2.5 5.0 to 7.0 5 Conjunctive 5.1 4.4 19.61CS 58 (n=8) 3.0 4.5 7.5 2 Mixed 2.3 1.4 39.13Karnal Chana-1 (n=4) 2.5 2.5-4.5 1 Mixed 1.7 1.2 29.41
130
Reclamation and Management ofSalt Affected VertisolsAssessment and mapping of salt affected soils of Gujarat using remote sensing and GIS (Anil R. Chinchmalatpure, Shrvan Kumar, A.K. Mandal, Bisweswar Gorain, M. J. Kaledhonkar, Arijit Barman, and Scientist from AICRP Indore Centre)
Soil salinisation is a serious problem especially in irrigated arid and semi-arid regions, Out of total salt affected soils in India (6.74 m ha), the state of Gujarat has about 2.22 m ha which is about 11.33% of the total geographical area of Gujarat.
It is highly essential to monitor the extent of salt affected soils for reclamation and management. Remotely sensed data together with GIS provide the ability to study and inventorize salt affected lands with accuracy. The maps and information generated would help in the decision support system to plan at the command level and execute efficient management at farm level. Therefore, the present study has been undertaken to characterize, assess and map salt affected soils of Gujarat state using remote sensing and GIS.
Survey of India toposheets in the scale of 1: 50000 for the entire state of Gujarat (33 districts) were procured from Survey of India Office, Gandhinagar. These open series maps (OSM) are in printed map and digital plotter printed maps(293). These topomaps were digitized for use during delineating and mapping of salt affected area. The Satellite Imageries from Indian Remote Sensing satellite Resource Sat-2 LISS-III data for two seasons i.e. November 2017 and Feb-Mar 2018 for the state of Gujarat were procured from National Remote Sensing Centre, Hyderabad. Soil sampling for ground truth collection has been initiated for two districts (Bharuch and Surat). The grid size of soil sampling has been adopted is 6 m x 8 m. The soil samples from each grid point has been done up to a soil depth of 120 cm with depth intervals of 0-15 cm, 15-30 cm, 30-60 cm, 60-90 cm and 90-120 cm. Till date, soil samples were collected from 95 different geo-referenced points of Bharuch district. Soils of these districts are Vertisols and Inceptisols with clay to clay loam soil texture. At some sampling points, thin crust of salt was observed on the soil surface. The land use systems in the study area principally comprised of agriculture, pasture, grassland and fallow. The agricultural �elds in the area belonged to both irrigated as well as rainfed categories. The different crops observed in the �eld during the sampling period varied widely from �bre crops e.g. cotton (indigenous and Bt), food grains (wheat, rice, sorghum etc.), pulses (pigeon pea, green gram), oilseed (castor) and cash crop (sugarcane). Natural vegetations like Khejri, Neem, Babool, Salvadora etc. and fruit trees like ber, papaya, guava and mango etc. were also observed in the periphery of the agricultural �elds. Soil samples collected are being processed in the laboratory for detailed analysis.
Maximization of yield and factor productivity through integrated nutrient management in desi cotton-based cropping systems in saline Vertisols (Shrvan Kumar, Anil R. Chinchmalatpure, David Camus D and Bisweswar Gorain)
Monocropping is the risky business hence crop diversi�cation is essential for risk coverage and maintaining the soil fertility. By combining some approaches of integrated nutrient management (INM) and application of micronutrients, yield of �eld crops can be enhanced and sustainability of the system can be secured. The idea of inclusion of some
131
Recl
amat
ion
and
Man
agem
ent o
f Sal
t Affe
cted
Ver
tisol
sA
nnua
l Rep
ort 2
018-
19
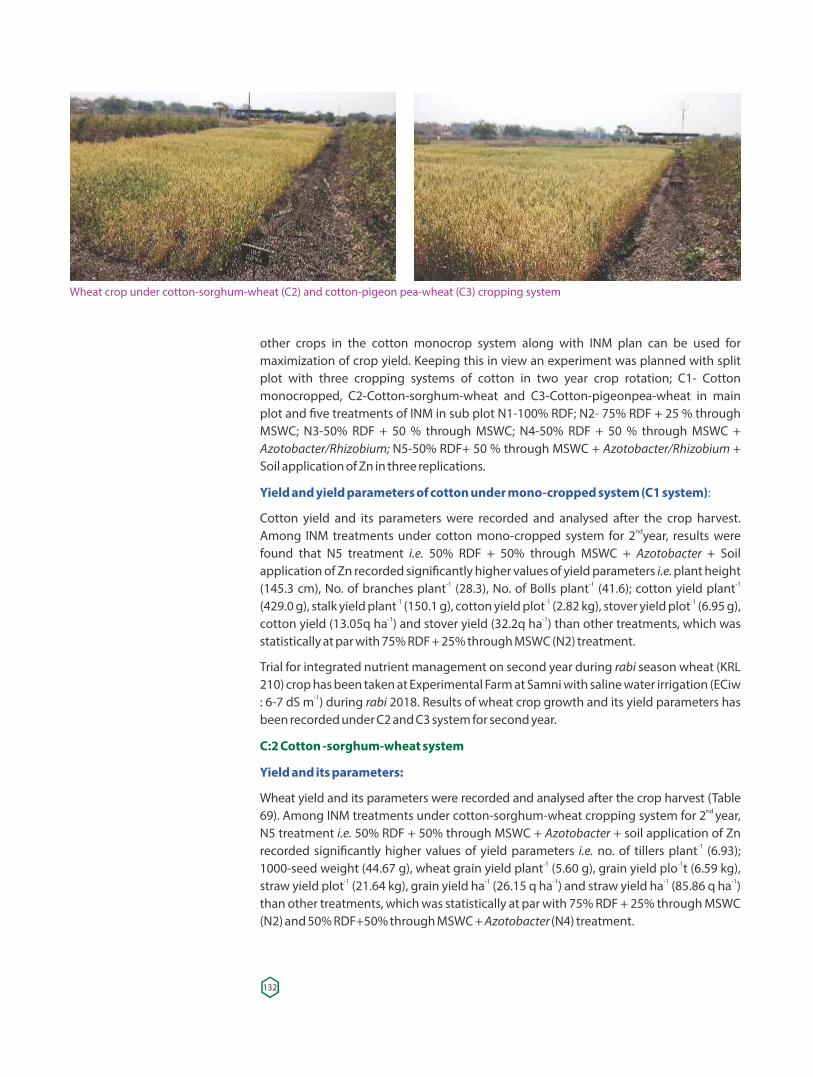
other crops in the cotton monocrop system along with INM plan can be used for maximization of crop yield. Keeping this in view an experiment was planned with split plot with three cropping systems of cotton in two year crop rotation; C1- Cotton monocropped, C2-Cotton-sorghum-wheat and C3-Cotton-pigeonpea-wheat in main plot and �ve treatments of INM in sub plot N1-100% RDF; N2- 75% RDF + 25 % through MSWC; N3-50% RDF + 50 % through MSWC; N4-50% RDF + 50 % through MSWC + Azotobacter/Rhizobium; N5-50% RDF+ 50 % through MSWC + Azotobacter/Rhizobium + Soil application of Zn in three replications.
Yield and yield parameters of cotton under mono-cropped system (C1 system):
Cotton yield and its parameters were recorded and analysed after the crop harvest. ndAmong INM treatments under cotton mono-cropped system for 2 year, results were
found that N5 treatment i.e. 50% RDF + 50% through MSWC + Azotobacter + Soil application of Zn recorded signi�cantly higher values of yield parameters i.e. plant height
-1 -1 -1(145.3 cm), No. of branches plant (28.3), No. of Bolls plant (41.6); cotton yield plant -1 -1 -1(429.0 g), stalk yield plant (150.1 g), cotton yield plot (2.82 kg), stover yield plot (6.95 g),
-1 -1cotton yield (13.05q ha ) and stover yield (32.2q ha ) than other treatments, which was statistically at par with 75% RDF + 25% through MSWC (N2) treatment.
Trial for integrated nutrient management on second year during rabi season wheat (KRL 210) crop has been taken at Experimental Farm at Samni with saline water irrigation (ECiw
-1: 6-7 dS m ) during rabi 2018. Results of wheat crop growth and its yield parameters has been recorded under C2 and C3 system for second year.
C:2 Cotton -sorghum-wheat system
Yield and its parameters:
Wheat yield and its parameters were recorded and analysed after the crop harvest (Table nd 69). Among INM treatments under cotton-sorghum-wheat cropping system for 2 year,
N5 treatment i.e. 50% RDF + 50% through MSWC + Azotobacter + soil application of Zn -1recorded signi�cantly higher values of yield parameters i.e. no. of tillers plant (6.93);
-1 -11000-seed weight (44.67 g), wheat grain yield plant (5.60 g), grain yield plo t (6.59 kg), -1 -1 -1 -1 -1straw yield plot (21.64 kg), grain yield ha (26.15 q ha ) and straw yield ha (85.86 q ha )
than other treatments, which was statistically at par with 75% RDF + 25% through MSWC (N2) and 50% RDF+50% through MSWC + Azotobacter (N4) treatment.
Wheat crop under cotton-sorghum-wheat (C2) and cotton-pigeon pea-wheat (C3) cropping system
132
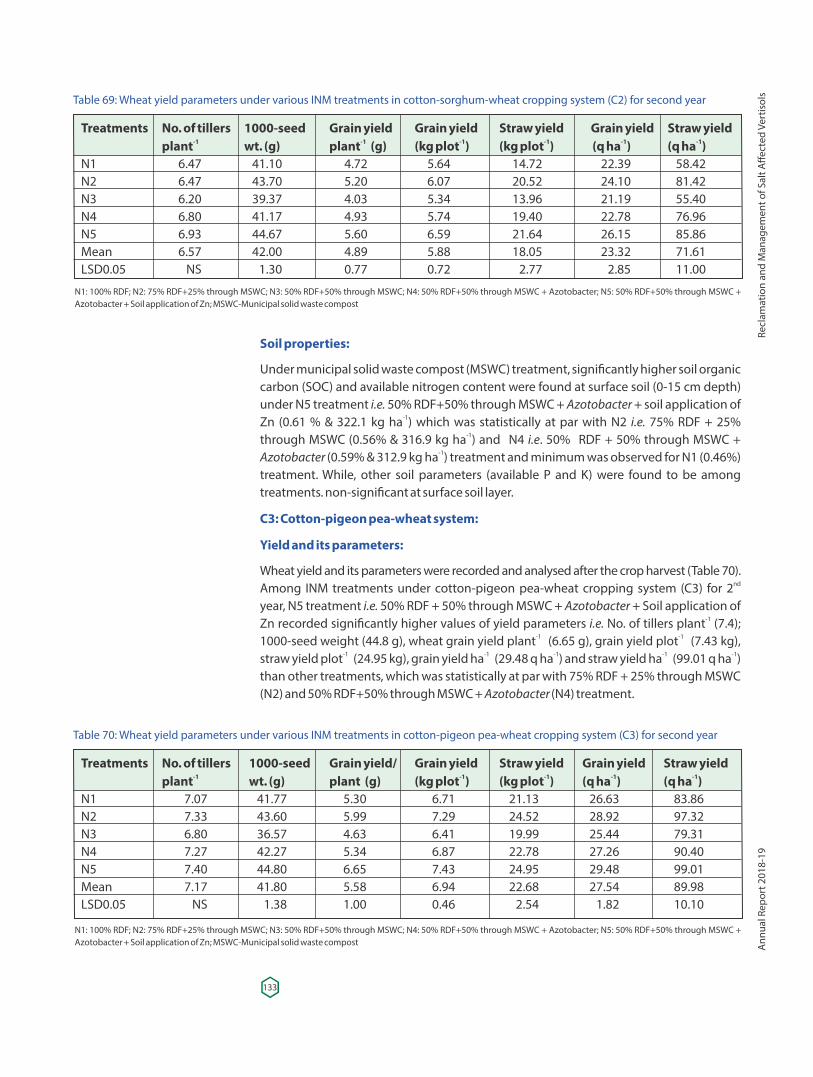
Table 69: Wheat yield parameters under various INM treatments in cotton-sorghum-wheat cropping system (C2) for second year
Treatments No. of tillers 1000-seed Grain yield Grain yield Straw yield Grain yield Straw yield -1 -1 -1 -1 -1 -1 plant wt. (g) plant (g) (kg plot ) (kg plot ) (q ha ) (q ha )
N1 6.47 41.10 4.72 5.64 14.72 22.39 58.42N2 6.47 43.70 5.20 6.07 20.52 24.10 81.42N3 6.20 39.37 4.03 5.34 13.96 21.19 55.40N4 6.80 41.17 4.93 5.74 19.40 22.78 76.96N5 6.93 44.67 5.60 6.59 21.64 26.15 85.86Mean 6.57 42.00 4.89 5.88 18.05 23.32 71.61LSD0.05 NS 1.30 0.77 0.72 2.77 2.85 11.00
N1: 100% RDF; N2: 75% RDF+25% through MSWC; N3: 50% RDF+50% through MSWC; N4: 50% RDF+50% through MSWC + Azotobacter; N5: 50% RDF+50% through MSWC + Azotobacter + Soil application of Zn; MSWC-Municipal solid waste compost
Soil properties:
Under municipal solid waste compost (MSWC) treatment, signi�cantly higher soil organic carbon (SOC) and available nitrogen content were found at surface soil (0-15 cm depth) under N5 treatment i.e. 50% RDF+50% through MSWC + Azotobacter + soil application of
-1Zn (0.61 % & 322.1 kg ha ) which was statistically at par with N2 i.e. 75% RDF + 25% -1through MSWC (0.56% & 316.9 kg ha ) and N4 i.e. 50% RDF + 50% through MSWC +
-1Azotobacter (0.59% & 312.9 kg ha ) treatment and minimum was observed for N1 (0.46%) treatment. While, other soil parameters (available P and K) were found to be among treatments. non-signi�cant at surface soil layer.
C3: Cotton-pigeon pea-wheat system:
Yield and its parameters:
Wheat yield and its parameters were recorded and analysed after the crop harvest (Table 70). nd Among INM treatments under cotton-pigeon pea-wheat cropping system (C3) for 2
year, N5 treatment i.e. 50% RDF + 50% through MSWC + Azotobacter + Soil application of -1Zn recorded signi�cantly higher values of yield parameters i.e. No. of tillers plant (7.4);
-1 -11000-seed weight (44.8 g), wheat grain yield plant (6.65 g), grain yield plot (7.43 kg), -1 -1 -1 -1 -1straw yield plot (24.95 kg), grain yield ha (29.48 q ha ) and straw yield ha (99.01 q ha )
than other treatments, which was statistically at par with 75% RDF + 25% through MSWC (N2) and 50% RDF+50% through MSWC + Azotobacter (N4) treatment.
Table 70: Wheat yield parameters under various INM treatments in cotton-pigeon pea-wheat cropping system (C3) for second year
Treatments No. of tillers 1000-seed Grain yield/ Grain yield Straw yield Grain yield Straw yield -1 -1 -1 -1 -1 plant wt. (g) plant (g) (kg plot ) (kg plot ) (q ha ) (q ha )
N1 7.07 41.77 5.30 6.71 21.13 26.63 83.86N2 7.33 43.60 5.99 7.29 24.52 28.92 97.32N3 6.80 36.57 4.63 6.41 19.99 25.44 79.31N4 7.27 42.27 5.34 6.87 22.78 27.26 90.40N5 7.40 44.80 6.65 7.43 24.95 29.48 99.01Mean 7.17 41.80 5.58 6.94 22.68 27.54 89.98LSD0.05 NS 1.38 1.00 0.46 2.54 1.82 10.10
N1: 100% RDF; N2: 75% RDF+25% through MSWC; N3: 50% RDF+50% through MSWC; N4: 50% RDF+50% through MSWC + Azotobacter; N5: 50% RDF+50% through MSWC + Azotobacter + Soil application of Zn; MSWC-Municipal solid waste compost
133
Recl
amat
ion
and
Man
agem
ent o
f Sal
t Affe
cted
Ver
tisol
sA
nnua
l Rep
ort 2
018-
19
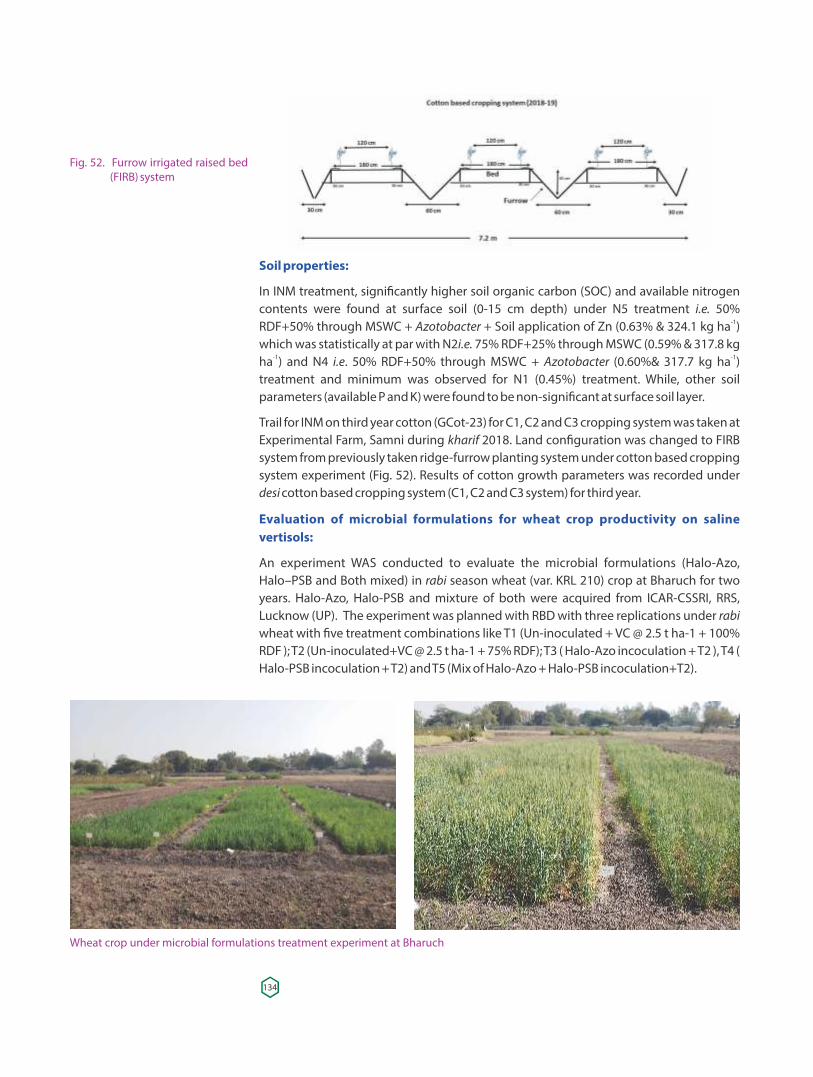
Soil properties:
In INM treatment, signi�cantly higher soil organic carbon (SOC) and available nitrogen contents were found at surface soil (0-15 cm depth) under N5 treatment i.e. 50%
-1RDF+50% through MSWC + Azotobacter + Soil application of Zn (0.63% & 324.1 kg ha ) which was statistically at par with N2i.e. 75% RDF+25% through MSWC (0.59% & 317.8 kg
-1 -1ha ) and N4 i.e. 50% RDF+50% through MSWC + Azotobacter (0.60%& 317.7 kg ha ) treatment and minimum was observed for N1 (0.45%) treatment. While, other soil parameters (available P and K) were found to be non-signi�cant at surface soil layer.
Trail for INM on third year cotton (GCot-23) for C1, C2 and C3 cropping system was taken at Experimental Farm, Samni during kharif 2018. Land con�guration was changed to FIRB system from previously taken ridge-furrow planting system under cotton based cropping system experiment (Fig. 52). Results of cotton growth parameters was recorded under desi cotton based cropping system (C1, C2 and C3 system) for third year.
Evaluation of microbial formulations for wheat crop productivity on saline vertisols:
An experiment WAS conducted to evaluate the microbial formulations (Halo-Azo, Halo–PSB and Both mixed) in rabi season wheat (var. KRL 210) crop at Bharuch for two years. Halo-Azo, Halo-PSB and mixture of both were acquired from ICAR-CSSRI, RRS, Lucknow (UP). The experiment was planned with RBD with three replications under rabi wheat with �ve treatment combinations like T1 (Un-inoculated + VC @ 2.5 t ha-1 + 100% RDF ); T2 (Un-inoculated+VC @ 2.5 t ha-1 + 75% RDF); T3 ( Halo-Azo incoculation + T2 ), T4 ( Halo-PSB incoculation + T2) and T5 (Mix of Halo-Azo + Halo-PSB incoculation+T2).
Fig. 52. Furrow irrigated raised bed (FIRB) system
Wheat crop under microbial formulations treatment experiment at Bharuch
134
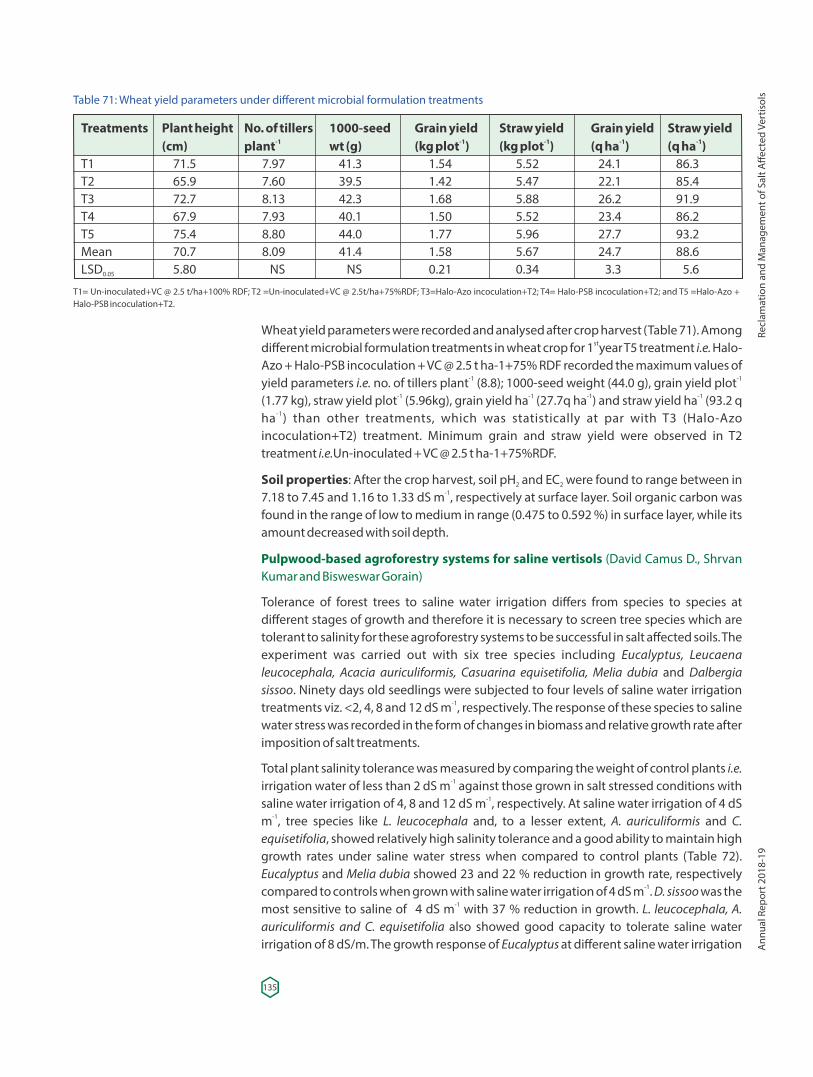
Wheat yield parameters were recorded and analysed after crop harvest (Table 71). Among st different microbial formulation treatments in wheat crop for 1 year T5 treatment i.e. Halo-
Azo + Halo-PSB incoculation + VC @ 2.5 t ha-1+75% RDF recorded the maximum values of -1 -1yield parameters i.e. no. of tillers plant (8.8); 1000-seed weight (44.0 g), grain yield plot
-1 -1 -1 -1(1.77 kg), straw yield plot (5.96kg), grain yield ha (27.7q ha ) and straw yield ha (93.2 q -1ha ) than other treatments, which was statistically at par with T3 (Halo-Azo
incoculation+T2) treatment. Minimum grain and straw yield were observed in T2 treatment i.e.Un-inoculated + VC @ 2.5 t ha-1+75%RDF.
Soil properties: After the crop harvest, soil pH and EC were found to range between in 2 2-17.18 to 7.45 and 1.16 to 1.33 dS m , respectively at surface layer. Soil organic carbon was
found in the range of low to medium in range (0.475 to 0.592 %) in surface layer, while its amount decreased with soil depth.
Pulpwood-based agroforestry systems for saline vertisols (David Camus D., Shrvan Kumar and Bisweswar Gorain)
Tolerance of forest trees to saline water irrigation differs from species to species at different stages of growth and therefore it is necessary to screen tree species which are tolerant to salinity for these agroforestry systems to be successful in salt affected soils. The experiment was carried out with six tree species including Eucalyptus, Leucaena leucocephala, Acacia auriculiformis, Casuarina equisetifolia, Melia dubia and Dalbergia sissoo. Ninety days old seedlings were subjected to four levels of saline water irrigation
-1treatments viz. <2, 4, 8 and 12 dS m , respectively. The response of these species to saline water stress was recorded in the form of changes in biomass and relative growth rate after imposition of salt treatments.
Total plant salinity tolerance was measured by comparing the weight of control plants i.e. -1irrigation water of less than 2 dS m against those grown in salt stressed conditions with
-1saline water irrigation of 4, 8 and 12 dS m , respectively. At saline water irrigation of 4 dS -1m , tree species like L. leucocephala and, to a lesser extent, A. auriculiformis and C.
equisetifolia, showed relatively high salinity tolerance and a good ability to maintain high growth rates under saline water stress when compared to control plants (Table 72). Eucalyptus and Melia dubia showed 23 and 22 % reduction in growth rate, respectively
-1compared to controls when grown with saline water irrigation of 4 dS m . D. sissoo was the -1most sensitive to saline of 4 dS m with 37 % reduction in growth. L. leucocephala, A.
auriculiformis and C. equisetifolia also showed good capacity to tolerate saline water irrigation of 8 dS/m. The growth response of Eucalyptus at different saline water irrigation
Table 71: Wheat yield parameters under different microbial formulation treatments
Treatments Plant height No. of tillers 1000-seed Grain yield Straw yield Grain yield Straw yield -1 -1 -1 -1 -1 (cm) plant wt (g) (kg plot ) (kg plot ) (q ha ) (q ha )
T1 71.5 7.97 41.3 1.54 5.52 24.1 86.3T2 65.9 7.60 39.5 1.42 5.47 22.1 85.4T3 72.7 8.13 42.3 1.68 5.88 26.2 91.9T4 67.9 7.93 40.1 1.50 5.52 23.4 86.2T5 75.4 8.80 44.0 1.77 5.96 27.7 93.2Mean 70.7 8.09 41.4 1.58 5.67 24.7 88.6LSD 5.80 NS NS 0.21 0.34 3.3 5.60.05
T1= Un-inoculated+VC @ 2.5 t/ha+100% RDF; T2 =Un-inoculated+VC @ 2.5t/ha+75%RDF; T3=Halo-Azo incoculation+T2; T4= Halo-PSB incoculation+T2; and T5 =Halo-Azo + Halo-PSB incoculation+T2.
135
Recl
amat
ion
and
Man
agem
ent o
f Sal
t Affe
cted
Ver
tisol
sA
nnua
l Rep
ort 2
018-
19
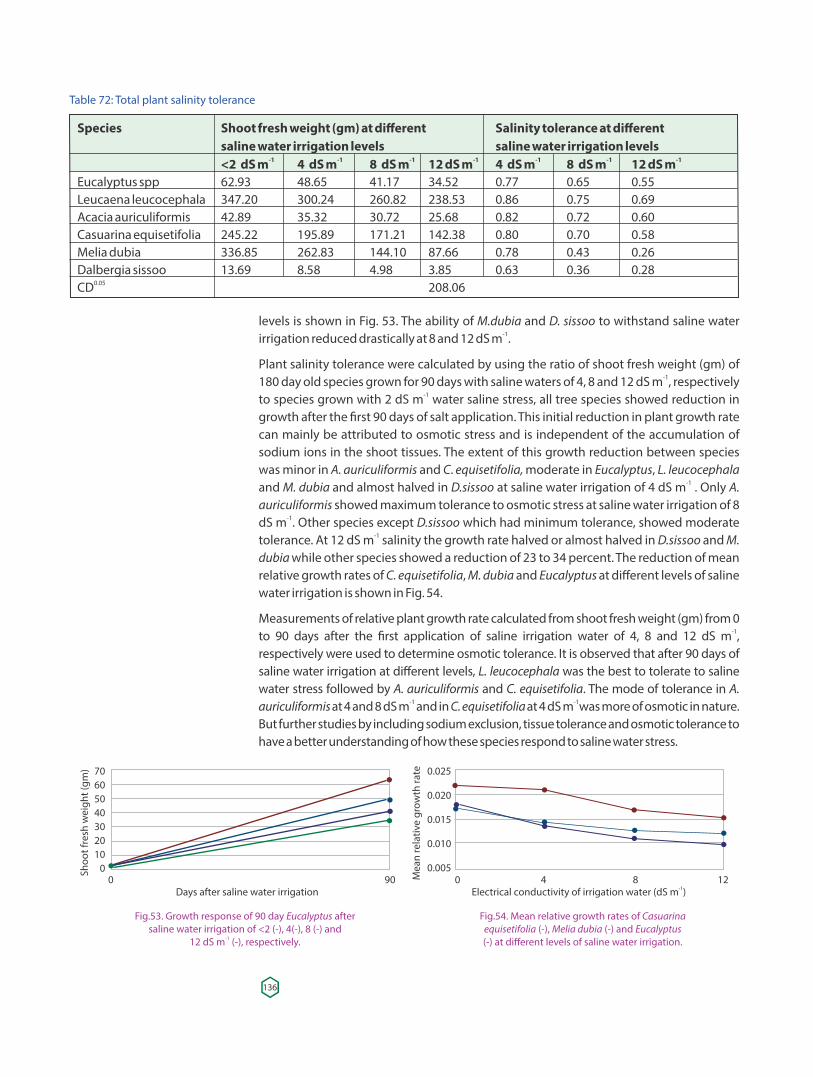
levels is shown in Fig. 53. The ability of M.dubia and D. sissoo to withstand saline water -1irrigation reduced drastically at 8 and 12 dS m .
Plant salinity tolerance were calculated by using the ratio of shoot fresh weight (gm) of 180 day old species grown for 90 days with saline waters of 4, 8 and 12 dS m , respectively -1
to species grown with 2 dS m water saline stress, all tree species showed reduction in -1
growth after the �rst 90 days of salt application. This initial reduction in plant growth rate can mainly be attributed to osmotic stress and is independent of the accumulation of sodium ions in the shoot tissues. The extent of this growth reduction between species was minor in and . moderate in , A. auriculiformis C equisetifolia, Eucalyptus L. leucocephala and and almost halved in at saline water irrigation of 4 dS m . Only -1M. dubia D.sissoo A. auriculiformis showed maximum tolerance to osmotic stress at saline water irrigation of 8 dS m . Other species except which had minimum tolerance, showed moderate -1 D.sissootolerance. At 12 dS m salinity the growth rate halved or almost halved in and-1 D.sissoo M. dubia while other species showed a reduction of 23 to 34 percent. The reduction of mean relative growth rates of , and at different levels of saline C. equisetifolia M. dubia Eucalyptus water irrigation is shown in Fig. 54.
Measurements of relative plant growth rate calculated from shoot fresh weight (gm) from 0 to 90 days after the �rst application of saline irrigation water of 4, 8 and 12 dS m , -1
respectively were used to determine osmotic tolerance. It is observed that after 90 days of saline water irrigation at different levels, was the best to tolerate to saline L. leucocephalawater stress followed by and . The mode of tolerance in A. auriculiformis C. equisetifolia A.
-1 -1 auriculiformis C. equisetifolia at 4 and 8 dS m and in at 4 dS m was more of osmotic in nature. But further studies by including sodium exclusion, tissue tolerance and osmotic tolerance to have a better understanding of how these species respond to saline water stress.
Table 72: Total plant salinity tolerance
Species Shoot fresh weight (gm) at different Salinity tolerance at different saline water irrigation levels saline water irrigation levels
-1 -1 -1 -1 -1 -1 -1 <2 dS m 4 dS m 8 dS m 12 dS m 4 dS m 8 dS m 12 dS mEucalyptus spp 62.93 48.65 41.17 34.52 0.77 0.65 0.55Leucaena leucocephala 347.20 300.24 260.82 238.53 0.86 0.75 0.69Acacia auriculiformis 42.89 35.32 30.72 25.68 0.82 0.72 0.60Casuarina equisetifolia 245.22 195.89 171.21 142.38 0.80 0.70 0.58Melia dubia 336.85 262.83 144.10 87.66 0.78 0.43 0.26Dalbergia sissoo 13.69 8.58 4.98 3.85 0.63 0.36 0.28
0.05CD 208.06
Fig.53. Growth response of 90 day Eucalyptus aftersaline water irrigation of <2 (-), 4(-), 8 (-) and
-112 dS m (-), respectively.
Fig.54. Mean relative growth rates of Casuarinaequisetifolia (-), Melia dubia (-) and Eucalyptus(-) at different levels of saline water irrigation.
136
Shoo
t fre
sh w
eigh
t (gm
) 70605040302010
00 90
Days after saline water irrigation -1Electrical conductivity of irrigation water (dS m )
Mea
n re
lativ
e gr
owth
rate 0.025
0.020
0.015
0.010
0.0050 4 8 12
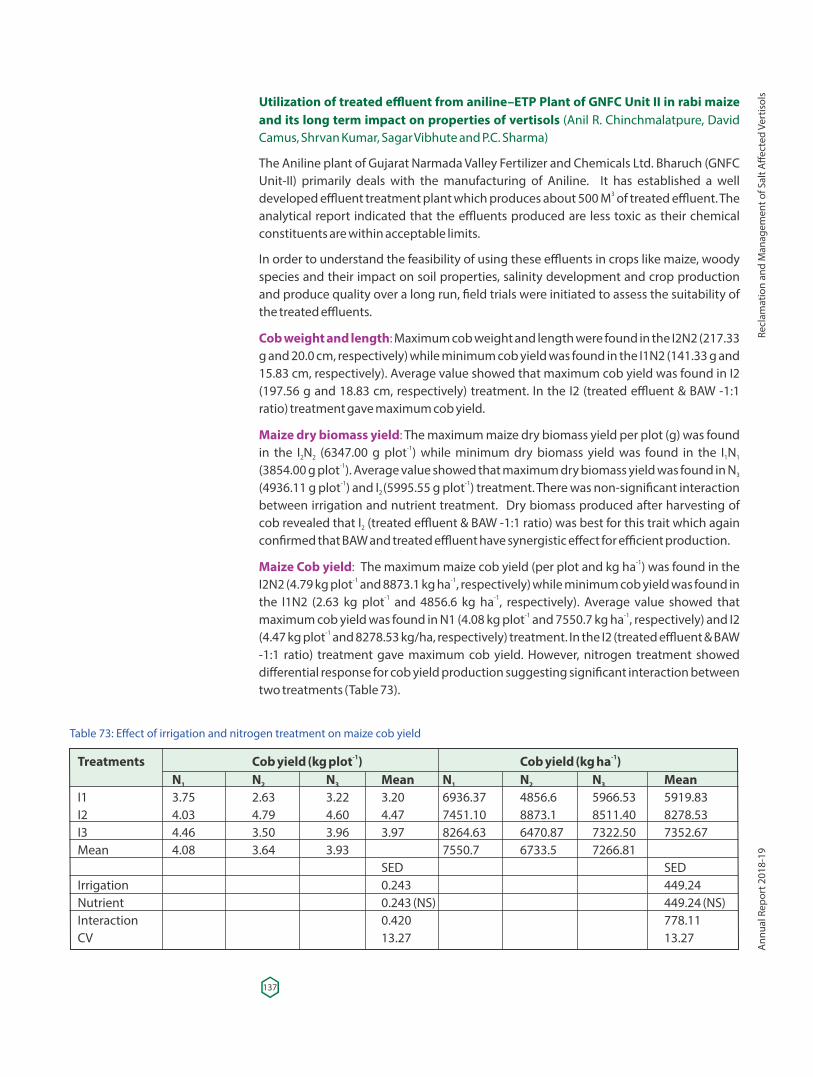
Utilization of treated effluent from aniline–ETP Plant of GNFC Unit II in rabi maize and its long term impact on properties of vertisols (Anil R. Chinchmalatpure, David Camus, Shrvan Kumar, Sagar Vibhute and P.C. Sharma)
The Aniline plant of Gujarat Narmada Valley Fertilizer and Chemicals Ltd. Bharuch (GNFC Unit-II) primarily deals with the manufacturing of Aniline. It has established a well
3developed effluent treatment plant which produces about 500 M of treated effluent. The analytical report indicated that the effluents produced are less toxic as their chemical constituents are within acceptable limits.
In order to understand the feasibility of using these effluents in crops like maize, woody species and their impact on soil properties, salinity development and crop production and produce quality over a long run, �eld trials were initiated to assess the suitability of the treated effluents.
Cob weight and length: Maximum cob weight and length were found in the I2N2 (217.33 g and 20.0 cm, respectively) while minimum cob yield was found in the I1N2 (141.33 g and 15.83 cm, respectively). Average value showed that maximum cob yield was found in I2 (197.56 g and 18.83 cm, respectively) treatment. In the I2 (treated effluent & BAW -1:1 ratio) treatment gave maximum cob yield.
Maize dry biomass yield: The maximum maize dry biomass yield per plot (g) was found -1in the I N (6347.00 g plot ) while minimum dry biomass yield was found in the I N2 2 1 1
-1(3854.00 g plot ). Average value showed that maximum dry biomass yield was found in N3 -1 -1(4936.11 g plot ) and I (5995.55 g plot ) treatment. There was non-signi�cant interaction 2
between irrigation and nutrient treatment. Dry biomass produced after harvesting of cob revealed that I (treated effluent & BAW -1:1 ratio) was best for this trait which again 2
con�rmed that BAW and treated effluent have synergistic effect for efficient production.
Maize Cob yield: -1 The maximum maize cob yield (per plot and kg ha ) was found in the -1 -1I2N2 (4.79 kg plot and 8873.1 kg ha , respectively) while minimum cob yield was found in
-1 -1the I1N2 (2.63 kg plot and 4856.6 kg ha , respectively). Average value showed that -1 -1maximum cob yield was found in N1 (4.08 kg plot and 7550.7 kg ha , respectively) and I2
-1(4.47 kg plot and 8278.53 kg/ha, respectively) treatment. In the I2 (treated effluent & BAW -1:1 ratio) treatment gave maximum cob yield. However, nitrogen treatment showed differential response for cob yield production suggesting signi�cant interaction between two treatments (Table 73).
Table 73: Effect of irrigation and nitrogen treatment on maize cob yield
-1 -1Treatments Cob yield (kg plot ) Cob yield (kg ha ) N N N Mean N N N Mean1 2 3 1 2 3
I1 3.75 2.63 3.22 3.20 6936.37 4856.6 5966.53 5919.83I2 4.03 4.79 4.60 4.47 7451.10 8873.1 8511.40 8278.53I3 4.46 3.50 3.96 3.97 8264.63 6470.87 7322.50 7352.67Mean 4.08 3.64 3.93 7550.7 6733.5 7266.81 SED SEDIrrigation 0.243 449.24Nutrient 0.243 (NS) 449.24 (NS)Interaction 0.420 778.11CV 13.27 13.27
137
Recl
amat
ion
and
Man
agem
ent o
f Sal
t Affe
cted
Ver
tisol
sA
nnua
l Rep
ort 2
018-
19
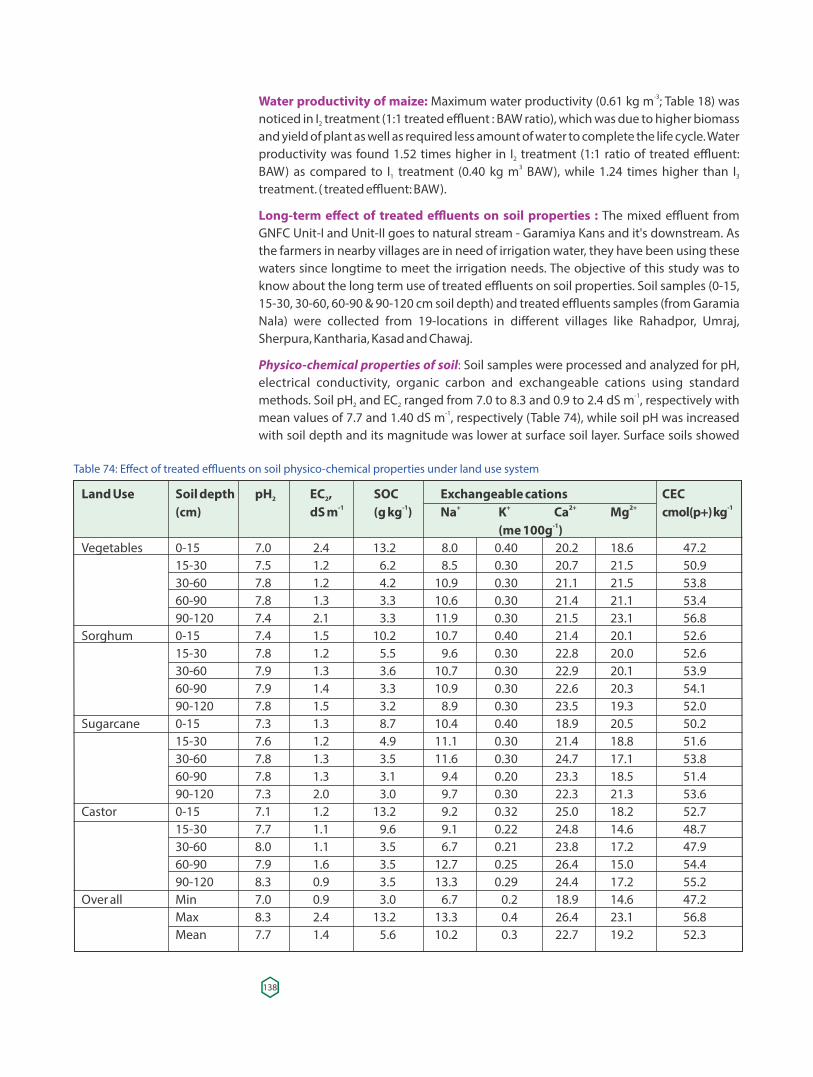
Table 74: Effect of treated effluents on soil physico-chemical properties under land use system
Land Use Soil depth pH EC , SOC Exchangeable cations CEC2 2-1 -1 + + 2+ 2+ -1 (cm) dS m (g kg ) Na K Ca Mg cmol(p+) kg
-1(me 100g )Vegetables 0-15 7.0 2.4 13.2 8.0 0.40 20.2 18.6 47.2 15-30 7.5 1.2 6.2 8.5 0.30 20.7 21.5 50.9 30-60 7.8 1.2 4.2 10.9 0.30 21.1 21.5 53.8 60-90 7.8 1.3 3.3 10.6 0.30 21.4 21.1 53.4 90-120 7.4 2.1 3.3 11.9 0.30 21.5 23.1 56.8Sorghum 0-15 7.4 1.5 10.2 10.7 0.40 21.4 20.1 52.6 15-30 7.8 1.2 5.5 9.6 0.30 22.8 20.0 52.6 30-60 7.9 1.3 3.6 10.7 0.30 22.9 20.1 53.9 60-90 7.9 1.4 3.3 10.9 0.30 22.6 20.3 54.1 90-120 7.8 1.5 3.2 8.9 0.30 23.5 19.3 52.0Sugarcane 0-15 7.3 1.3 8.7 10.4 0.40 18.9 20.5 50.2 15-30 7.6 1.2 4.9 11.1 0.30 21.4 18.8 51.6 30-60 7.8 1.3 3.5 11.6 0.30 24.7 17.1 53.8 60-90 7.8 1.3 3.1 9.4 0.20 23.3 18.5 51.4 90-120 7.3 2.0 3.0 9.7 0.30 22.3 21.3 53.6Castor 0-15 7.1 1.2 13.2 9.2 0.32 25.0 18.2 52.7 15-30 7.7 1.1 9.6 9.1 0.22 24.8 14.6 48.7 30-60 8.0 1.1 3.5 6.7 0.21 23.8 17.2 47.9 60-90 7.9 1.6 3.5 12.7 0.25 26.4 15.0 54.4 90-120 8.3 0.9 3.5 13.3 0.29 24.4 17.2 55.2Over all Min 7.0 0.9 3.0 6.7 0.2 18.9 14.6 47.2 Max 8.3 2.4 13.2 13.3 0.4 26.4 23.1 56.8 Mean 7.7 1.4 5.6 10.2 0.3 22.7 19.2 52.3
Water productivity of maize: -3 Maximum water productivity (0.61 kg m ; Table 18) was noticed in I treatment (1:1 treated effluent : BAW ratio), which was due to higher biomass 2
and yield of plant as well as required less amount of water to complete the life cycle. Water productivity was found 1.52 times higher in I treatment (1:1 ratio of treated effluent: 2
3BAW) as compared to I treatment (0.40 kg m BAW), while 1.24 times higher than I 1 3
treatment. ( treated effluent: BAW).
Long-term effect of treated effluents on soil properties : The mixed effluent from GNFC Unit-I and Unit-II goes to natural stream - Garamiya Kans and it's downstream. As the farmers in nearby villages are in need of irrigation water, they have been using these waters since longtime to meet the irrigation needs. The objective of this study was to know about the long term use of treated effluents on soil properties. Soil samples (0-15, 15-30, 30-60, 60-90 & 90-120 cm soil depth) and treated effluents samples (from Garamia Nala) were collected from 19-locations in different villages like Rahadpor, Umraj, Sherpura, Kantharia, Kasad and Chawaj.
Physico-chemical properties of soil: Soil samples were processed and analyzed for pH, electrical conductivity, organic carbon and exchangeable cations using standard
-1methods. Soil pH and EC ranged from 7.0 to 8.3 and 0.9 to 2.4 dS m , respectively with 2 2-1mean values of 7.7 and 1.40 dS m , respectively (Table 74), while soil pH was increased
with soil depth and its magnitude was lower at surface soil layer. Surface soils showed
138
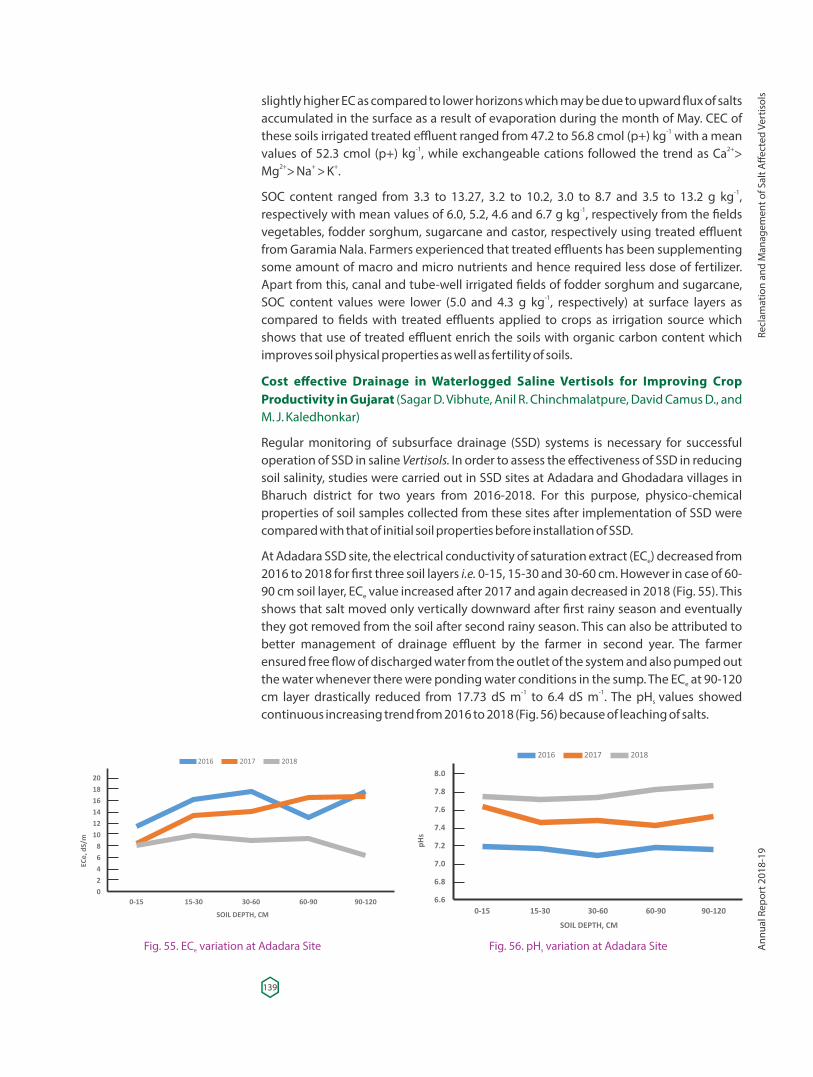
Fig. 55. EC variation at Adadara Sitee Fig. 56. pH variation at Adadara Sites
slightly higher EC as compared to lower horizons which may be due to upward �ux of salts accumulated in the surface as a result of evaporation during the month of May. CEC of
-1these soils irrigated treated effluent ranged from 47.2 to 56.8 cmol (p+) kg with a mean -1 2+values of 52.3 cmol (p+) kg , while exchangeable cations followed the trend as Ca >
2+ + +Mg > Na > K .-1SOC content ranged from 3.3 to 13.27, 3.2 to 10.2, 3.0 to 8.7 and 3.5 to 13.2 g kg ,
-1respectively with mean values of 6.0, 5.2, 4.6 and 6.7 g kg , respectively from the �elds vegetables, fodder sorghum, sugarcane and castor, respectively using treated effluent from Garamia Nala. Farmers experienced that treated effluents has been supplementing some amount of macro and micro nutrients and hence required less dose of fertilizer. Apart from this, canal and tube-well irrigated �elds of fodder sorghum and sugarcane,
-1SOC content values were lower (5.0 and 4.3 g kg , respectively) at surface layers as compared to �elds with treated effluents applied to crops as irrigation source which shows that use of treated effluent enrich the soils with organic carbon content which improves soil physical properties as well as fertility of soils.
Cost effective Drainage in Waterlogged Saline Vertisols for Improving Crop Productivity in Gujarat (Sagar D. Vibhute, Anil R. Chinchmalatpure, David Camus D., and M. J. Kaledhonkar)
Regular monitoring of subsurface drainage (SSD) systems is necessary for successful operation of SSD in saline Vertisols. In order to assess the effectiveness of SSD in reducing soil salinity, studies were carried out in SSD sites at Adadara and Ghodadara villages in Bharuch district for two years from 2016-2018. For this purpose, physico-chemical properties of soil samples collected from these sites after implementation of SSD were compared with that of initial soil properties before installation of SSD.
At Adadara SSD site, the electrical conductivity of saturation extract (EC ) decreased from e
2016 to 2018 for �rst three soil layers 0-15, 15-30 and 30-60 cm. However in case of 60-i.e.90 cm soil layer, EC value increased after 2017 and again decreased in 2018 (Fig. 55). This e
shows that salt moved only vertically downward after �rst rainy season and eventually they got removed from the soil after second rainy season. This can also be attributed to better management of drainage effluent by the farmer in second year. The farmer ensured free �ow of discharged water from the outlet of the system and also pumped out the water whenever there were ponding water conditions in the sump. The EC at 90-120 e
cm layer drastically reduced from 17.73 dS m to 6.4 dS m . The pH values showed -1 -1s
continuous increasing trend from 2016 to 2018 (Fig. 56) because of leaching of salts.
139
Recl
amat
ion
and
Man
agem
ent o
f Sal
t Affe
cted
Ver
tisol
sA
nnua
l Rep
ort 2
018-
19
At Ghodadara SSD site, the EC values which reduced in 2017, were found to increase in e
2018 (Fig. 57). The increase in EC was due to hindrance to the out�ow of drained water. e
The gravity �ow of drained water was not taking place and the farmer also did not undertake any pumping work resulting in waterlogged condition and subsequent increase in soil salinity. The pHs values also decreased in 2018 after slight increase in year 2017 (Fig. 58). This shows that the leaching of salts did not take place.
Site Selection for SSD sites
For selection of new SSD sites, preliminary survey of Motwan, Rayma, Sunev Kalla, Vadoli and Panoli villages was undertaken. The results of the survey are described below.
Motvan Village (Hansot Taluka)
The Ryma distributary of Ukai-kakrapar canal command is passing through the village and �elds surrounding this distributary have shallow water table (<1m). The properties of soil upto 150 cm soil depth taken from farmer's �eld are given in Table 75. Although the area is having high water table and SSD system can be installed, the non-availability of gravity outlet nearby the �eld is a major constraint. The system can still be operated by opting pumped outlet but its practicality is a major issue. Moreover, the extent of waterlogged area is large and installing SSD system on some part of the affected area will not provide adequate solution.
Practices to be adopted while making SSD cost effective in Vertisols
A) Adoption of Singular Drainage System
· Cost of collector pipe is 5 to 10 times more than that of lateral drain pipes, hence adoption of singular drainage system will eliminate use of collector drain and thereby reduce the cost of SSD.
Fig. 57. EC variation at Ghodadara Sitee Fig. 58. pH variation at Adadara Sites
Table 75: ECe, pHs and ESP of soils of Motvan village
Depth (cm) pHs ECe (dS/m) ESP (%)0-15 7.60-7.75 1.85-3.40 9.15-15.2315-30 7.90-8.13 1.48-2.20 19.20-20.3530-60 8.09-8.16 1.19-1.46 17.76-18.2460-90 8.16-8.34 0.86-1.18 14.79-22.8390-120 8.35-8.58 0.92-1.57 16.28-20.58
140
Fig. 59. Grain Yield under different drip irrigation treatments
· Singular drainage system does not require man holes.
· Shallow open drains are adequate.
B) Reduced dimension of lateral
· With decreased lateral spacing in Vertisols, the existing lateral size of 80 mm can be down sized to 65 mm. This will reduce the existing cost approximately by 20%.
· Closer drain spacing facilitates shallower drains and this will reduce the cost of installation.
C) Restricting use of envelope material for Vertisols wherever it is not necessary
Studies showed that soils with clay content more than 40% (SAR should be less than 8) do not require envelope material and cost of envelope material for the perforated pipes up to 100 mm is 50% of that pipe. Therefore signi�cant cost savings can be made by restricting the use of envelope material in Vertisols.
Conjunctive use of saline groundwater and surface water in vertisols for improving water productivity under drip irrigated wheat (Sagar D. Vibhute, Anil R. Chinchmalatpure, Shrvan Kumar, Indivar Prasad and Bisweswar Gorain)
Irrigated wheat is cultivated on about 1.14 million ha area in Gujarat state and both canal and tube well water is used for irrigation. However, canal water is affecting soil physical properties of saline Vertisols and soil surface is becoming very hard after its application. In the areas where adequate surface water is not available, groundwater is being utilised for irrigation. But compared to canal water, groundwater is highly saline and hence contributing more salts into the soil. So, conjunctive use of saline ground water and canal water can be undertaken to avoid detrimental effect of both the sources of irrigation. Moreover, reports suggested that drip irrigation can save up to 45% of water in wheat crop as compared to traditional �ood irrigation method. Therefore, drip irrigation will not only help to save water but also result into less soil salinity build up in the region. Also, drip irrigation gives more crops per drop and hence enhances water productivity. In present study, �eld experiment to assess the effect of conjunctive use of saline groundwater and surface water through drip irrigation on water productivity of wheat in Vertisols was undertaken at Samni Experimental Farm.
Grain yield and water productivity of wheat
Cyclic mode of conjunctive irrigation is adopted in the study and �ve drip irrigation treatments I (1:1 :: Groundwater :Surface Water irrigation), I (1:2 :: Groundwater: Surface 1 2
Water irrigation), I (2:1 :: Groundwater : Surface Water irrigation), I (all Surface Water 3 4
141
Recl
amat
ion
and
Man
agem
ent o
f Sal
t Affe
cted
Ver
tisol
sA
nnua
l Rep
ort 2
018-
19
irrigation), I (all Groundwater irrigation). The grain yield under different conjunctive use 5
treatments is given in �g. 59.-1 -1The highest yield was obtained in I (2.99) followed by I (2.96 t ha ) and I ( 2.79 t ha ) there 4 1 3
was only 1% reduction in the yield by replacing 50% good quality surface water with -3saline groundwater.The highest water productivity (0.94 kg m ) was observed in I 4
-3treatment while water productivity of conjunctive use treatment I was at par (0.92 kg m ) 1-3with treatment I . The lowest water productivity (0.73 kg m ) was noted in I treatment4 5
Impact evaluation of sub-surface drainage technology for reclamation of waterlogged saline soils in Maharashtra (Sagar D. Vibhute, Raju. R and Anil R. Chinchmalatpure)
Increasing soil salinity and subsequent reduction in crop yield is a major problem in sugarcane growing areas of Maharashtra. Installation of Subsurface Drainage (SSD) system on both large scale (through farmers' associations and government support) and small scale (private installation by individual famers or group of farmers) basis is emerging as a successful intervention to tackle this soil salinity situation in the area. In order to view impact of this technology in terms of improvement in socio-economic status of the farmers, enhanced crop yield, reduction in soil salinity conditions, etc. the present study was undertaken from July 2015 in Kasabe Digraj and Dudhgaon SSD project sites of Sangli district, and the combined �nding of 3 years' research work are summarized below.
Impact on crop yield: It was observed that the crop yield was improved in majority of parts of the project areas because of improvement in waterlogging and soil salinity condition. However, some �elds located in the low lying areas showed adverse effect on
crop yield because of persistent waterlogging and soil salinity condition. The yield of major crops before and after installation of SSD is given in Table 76. The yield of sugarcane, wheat, soybean and groundnut was increased by 117%, 173%, 185% and 195% respectively in Kasabe Digraj. The increase in yield of sugarcane, wheat and soybean was observed up to 135%, 148%, and 184% respectively in Dudhgaon village.
Economic Impact: The main source of income for the famers of both the villages is agriculture. The average agriculture income of farmers was increased by 134% (1.16 lakh to 2.72 lakh per annum) and 112% (1.25 lakh to 2.65 lakh per annum) after SSD installation in Kasabe Digraj and Dudhgaon villages, respectively.
Impact on Soil Salinity: The soil salinity improvement was found in the majority of the project area with EC values reducing to less than 4 dS m . However, some �elds because -1
e
of their lower elevations and poor maintenance of drainage system still have the problem of soil salinity with EC values as high as 31.5 dS m and 24.5 dS m in Kasabe digraj and -1 -1
e
Dudhgaon, respectively.
Table 76: Yield of major crops before and after installation of SSD
Crop Kasbe Digraj Dhudhgaon Yield before Yield after Yield before Yield after
-1 -1 -1 -1 SSD (t ha ) SSD (t ha ) SSD (t ha ) SSD (t ha )Sugarcane 48.9 106 46.3 108.7Wheat 1.08 2.95 1.16 2.88Soybean 0.96 2.74 0.92 2.61
142
Farmer's perception on SSD technology: Overall farmers agreed on usefulness of SSD technology in increasing crop yield and reducing soil salinity. However considering its initial cost, most of the farmers �nd it economically difficult to install this system. The percentage-wise opinion of the farmers is given in Fig. 60.
Operation and Maintenance Issues of SSD System: The successful operation of SSD system requires uninterrupted removal of drainage water collected by the system in the sump. However, poor maintenance of open drains are blocking out�ow water and hence resulting in improper functioning of the system.
Development of desi cotton genotypes (G. herbaceum and G. arboretum) for salt affected Vertisols (Shrvan Kumar, Anil R. Chinchmalatpure and P.C. Sharma)
Two National trials of All India Coordinated Cotton Improvement Project (AICCIP) were harvested and data was submitted to PI, ICAR-CICR, Coimbatore in time. In trial 32 b (IET of G. herbaceum), there were 15 entries from which �ve genotypes performed best which yielded more than average seed cotton yield i.e. 1030 kg ha but two genotypes (code -1
number 383 and 395) showed higher K Na ratio. Similarly in trial 22 b ( IET of G. + +
arboreum), there were 29 entries of which 15 lines performed best which yielded more than the average seed cotton yield i.e. 1449 kg ha , but three genotypes (Code number -1
301, 312 and 325) showed higher K Na ratio which is more than 10 . + +
Groundwater contamination due to geogenic factors and industrial effluents and its impact on food chain (Agri-CRP water platform project) (Anil R. Chinchmalatpure, David Camus and Shrvan Kumar)
In recent years, increasing industrialization, urbanization and developmental activities with the population explosion lead to generation of large amount of waste water from domestic, commercial, industrial and other sources. Industrial waste waters directly discharged into river, lake, nallas, and khadi and create new pollution problem. The present project was taken up to evaluate the impact of industrial effluent on ground water quality in Ankleshwar industrial estate (AIE) of Bharuch district of Gujarat, one of the heavily industrialized regions of Gujarat.
Pre-monsoon groundwater samples were collected in the month of April 2018 from 100 sites along , tributary of Narmada as well as from locations close to Ankleshwar Amla khadiIndustrial Estates in Gujarat. The groundwater quality for irrigation purposes were
Fig. 60. Farmers Perception on subsurface drainage technology
143
Recl
amat
ion
and
Man
agem
ent o
f Sal
t Affe
cted
Ver
tisol
sA
nnua
l Rep
ort 2
018-
19
INCREASE YIELD REDUCES SALINITY ECONOMICALLY FEASIBLE
Strongly Agree Agree Undecided Disagree Strongly Disagree
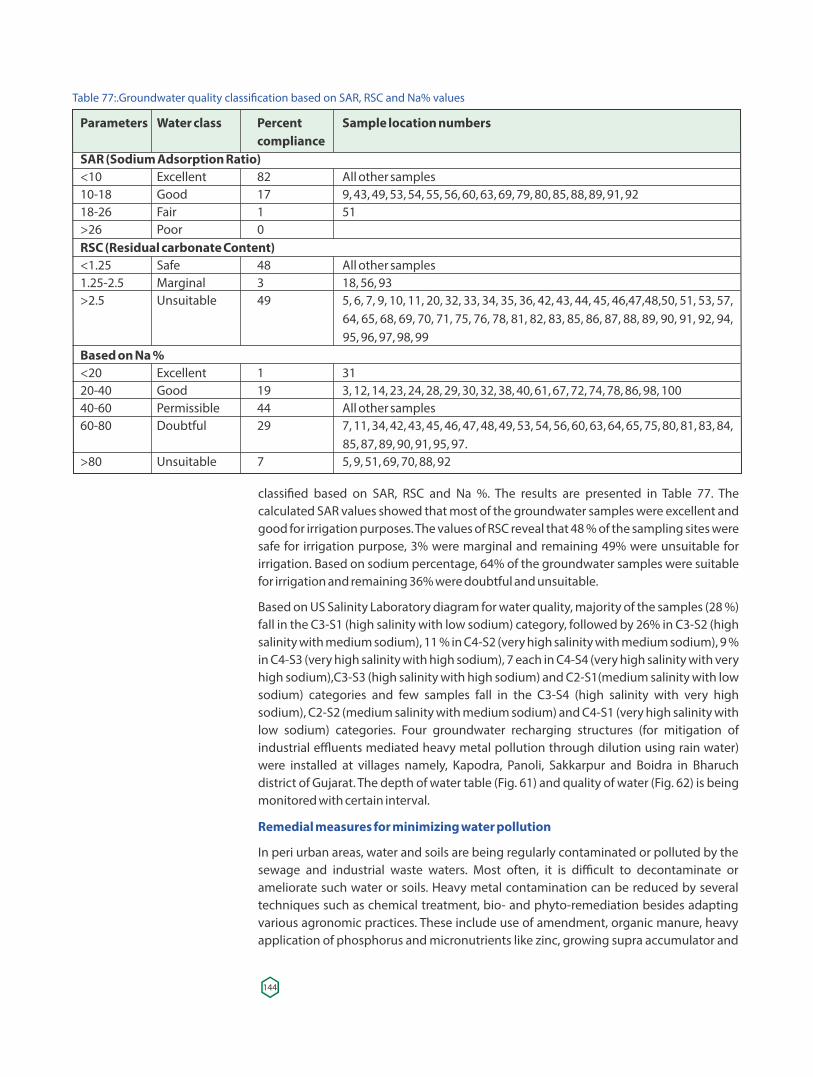
classi�ed based on SAR, RSC and Na %. The results are presented in Table 77. The calculated SAR values showed that most of the groundwater samples were excellent and good for irrigation purposes. The values of RSC reveal that 48 % of the sampling sites were safe for irrigation purpose, 3% were marginal and remaining 49% were unsuitable for irrigation. Based on sodium percentage, 64% of the groundwater samples were suitable for irrigation and remaining 36% were doubtful and unsuitable.
Based on US Salinity Laboratory diagram for water quality, majority of the samples (28 %) fall in the C3-S1 (high salinity with low sodium) category, followed by 26% in C3-S2 (high salinity with medium sodium), 11 % in C4-S2 (very high salinity with medium sodium), 9 % in C4-S3 (very high salinity with high sodium), 7 each in C4-S4 (very high salinity with very high sodium),C3-S3 (high salinity with high sodium) and C2-S1(medium salinity with low sodium) categories and few samples fall in the C3-S4 (high salinity with very high sodium), C2-S2 (medium salinity with medium sodium) and C4-S1 (very high salinity with low sodium) categories. Four groundwater recharging structures (for mitigation of industrial effluents mediated heavy metal pollution through dilution using rain water) were installed at villages namely, Kapodra, Panoli, Sakkarpur and Boidra in Bharuch district of Gujarat. The depth of water table (Fig. 61) and quality of water (Fig. 62) is being monitored with certain interval.
Remedial measures for minimizing water pollution
In peri urban areas, water and soils are being regularly contaminated or polluted by the sewage and industrial waste waters. Most often, it is difficult to decontaminate or ameliorate such water or soils. Heavy metal contamination can be reduced by several techniques such as chemical treatment, bio- and phyto-remediation besides adapting various agronomic practices. These include use of amendment, organic manure, heavy application of phosphorus and micronutrients like zinc, growing supra accumulator and
Table 77:.Groundwater quality classi�cation based on SAR, RSC and Na% values
Parameters Water class Percent Sample location numbers complianceSAR (Sodium Adsorption Ratio)<10 Excellent 82 All other samples10-18 Good 17 9, 43, 49, 53, 54, 55, 56, 60, 63, 69, 79, 80, 85, 88, 89, 91, 9218-26 Fair 1 51>26 Poor 0 RSC (Residual carbonate Content)<1.25 Safe 48 All other samples1.25-2.5 Marginal 3 18, 56, 93>2.5 Unsuitable 49 5, 6, 7, 9, 10, 11, 20, 32, 33, 34, 35, 36, 42, 43, 44, 45, 46,47,48,50, 51, 53, 57,
64, 65, 68, 69, 70, 71, 75, 76, 78, 81, 82, 83, 85, 86, 87, 88, 89, 90, 91, 92, 94, 95, 96, 97, 98, 99
Based on Na %<20 Excellent 1 3120-40 Good 19 3, 12, 14, 23, 24, 28, 29, 30, 32, 38, 40, 61, 67, 72, 74, 78, 86, 98, 10040-60 Permissible 44 All other samples60-80 Doubtful 29 7, 11, 34, 42, 43, 45, 46, 47, 48, 49, 53, 54, 56, 60, 63, 64, 65, 75, 80, 81, 83, 84,
85, 87, 89, 90, 91, 95, 97.>80 Unsuitable 7 5, 9, 51, 69, 70, 88, 92
144
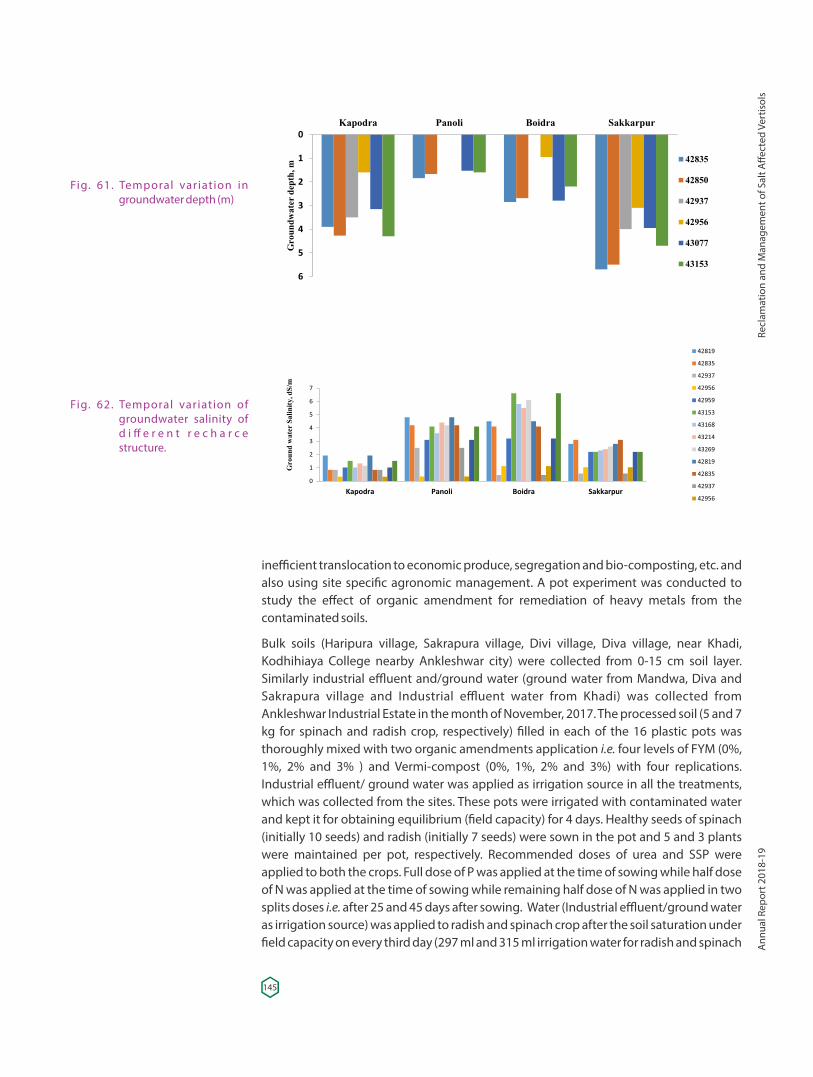
Fig. 61. Temporal variation in groundwater depth (m)
Fig. 62. Temporal variation of groundwater salinity of d i ff e r e n t r e c h a r c e structure.
inefficient translocation to economic produce, segregation and bio-composting, etc. and also using site speci�c agronomic management. A pot experiment was conducted to study the effect of organic amendment for remediation of heavy metals from the contaminated soils.
Bulk soils (Haripura village, Sakrapura village, Divi village, Diva village, near Khadi, Kodhihiaya College nearby Ankleshwar city) were collected from 0-15 cm soil layer. Similarly industrial effluent and/ground water (ground water from Mandwa, Diva and Sakrapura village and Industrial effluent water from Khadi) was collected from Ankleshwar Industrial Estate in the month of November, 2017. The processed soil (5 and 7 kg for spinach and radish crop, respectively) �lled in each of the 16 plastic pots was thoroughly mixed with two organic amendments application four levels of FYM (0%, i.e.1%, 2% and 3% ) and Vermi-compost (0%, 1%, 2% and 3%) with four replications. Industrial effluent/ ground water was applied as irrigation source in all the treatments, which was collected from the sites. These pots were irrigated with contaminated water and kept it for obtaining equilibrium (�eld capacity) for 4 days. Healthy seeds of spinach (initially 10 seeds) and radish (initially 7 seeds) were sown in the pot and 5 and 3 plants were maintained per pot, respectively. Recommended doses of urea and SSP were applied to both the crops. Full dose of P was applied at the time of sowing while half dose of N was applied at the time of sowing while remaining half dose of N was applied in two splits doses after 25 and 45 days after sowing. Water (Industrial effluent/ground water i.e.as irrigation source) was applied to radish and spinach crop after the soil saturation under �eld capacity on every third day (297 ml and 315 ml irrigation water for radish and spinach
145
Recl
amat
ion
and
Man
agem
ent o
f Sal
t Affe
cted
Ver
tisol
sA
nnua
l Rep
ort 2
018-
19
crop, respectively) up to three months. After two months, each crop was harvested, root and shoot dry biomass yield was recorded. After harvesting, the soil was removed from the pots, the roots of the plants were extracted and soil samples were taken for post-experiment soil analysis.
The soil reaction was neutral in range (pH 6.8). The EC was 6.5 dS m . The soil fertility -12
status was medium having SOC content 0.87 %, available N 328.2 kg ha and K 518.2 kg ha-1 -
1 -1 2+; while available P status was low (11.0 kg ha ). The exchangeable Ca was dominant cation followed by Mg , Na and K . The DTPA extracted heavy metal concentration in 2+ + +
soils were 0.0691 mg kg , 0.605 mg kg , 65.44 mg kg , 68.11 mg kg , 10.98 mg kg , 2.131 -1 -1 -1 -1 -1
mg kg , 1.228 mg kg and 14.06 mg kg , respectively of Cd, Cr, Cu, Fe, Mn, Ni, Pb and Zn, -1 -1 -1
respectively.
Metal Concentration in Radish Roots: Maximum Cd (1.096 mg kg ), Cr (5.25 mg kg ) and -1 -1
Zn (102.57 mg kg ) metal concentration of plant roots was observed in control pots. -1
Farmyard manure increased Fe, Ni and Pb metal concentrations in plant roots of radish crop up to FYM @ 2% level as compared to control, while FYM @ 3 % level it is decreasing. Minimum metal concentration (Cd, Cu, Ni and Pb) was observed for FYM @ 3% amended pots, while FYM @ 2% level Cr (2.842 mg kg ), Mn (45.23 mg kg ) and Zn (79.44 mg kg ) -1 -1 -1
metal concentration was observed in radish roots. In case of vermi-compost (VC) amended pots, minimum metals concentration (Cd, Cu, Fe and Zn) in radish roots were observed for VC @ 3% amended pots (0.969 mg kg , 116.48 mg kg , 680.67 mg kg and -1 -1 -1
101.82 mg kg respectively), while under 2% VC amended pots minimum Pb -1,
concentration (22.22 mg kg ) was observed (Table 30). The Cr, Mn and Ni metal -1
concentration in plant roots was maximum under vermicomposting (VC) amended pots i.e VC @ 2 % and 3% as compared to control.
Metal Concentration in Spinach Shoots: Spinach plants grown in FYM @ 2% amended pots had maximum Cd (1.82 mg kg ), Cu (75.6 mg kg ), Pb (13.05 mg kg ) and Zn (106.49 -1 -1 -1
mg kg ) in shoots and it was statistically at par with control and FYM @ 1% for Cd and Cu -1
metals. Minimum metal concentration (Cr, Fe, Mn and Zn) was observed for FYM @ 3% amended pots. In case of vermi-compost (VC) amended pots, minimum metals concentration (Cd, Mn and Zn) was observed for VC @ 2% amended pots while Fe metal concentration was minimum for VC @ 3% amended pots and others metals (Cr, Cu and Ni) in control pots.
DTPA- extractable Metals in Post Harvest Soils: Though the non-signi�cant effect of FYM and vermi-compost on the content of DTPA-extractable metals in the post harvest soils was observed but with the application of vermi-compost/FYM, the concentration of Cd, Cr, Cu, Pb and Zn in absolute term in post-harvest soils was higher as compared to control treatment which showed that the efficacy of these organic amendments in decreasing the availability of heavy metal to plants.
Management of harvested rainwater for enhancing water productivity and revival of village pond through scienti�c interventions in saline vertisol area of Gujarat (Anil R. Chinchmalatpure, Shrvan Kumar and Sagar Vibhute)
Harvesting of rain water and revival of village ponds for increasing water productivity has become necessary. This will not only serve the purpose of increasing ground water table, reducing ground water salinity in the region but also increasing irrigation potential for sustainable agriculture in salt affected area. Two village ponds each in villages Samni and
146
Sudi in Bharuach district have been identi�ed for taking up the study. Area of the pond at village Samni is 4.73 ha and at village Sudi is 7.19 ha. The study area is having deep, heavy textured black cotton soils (Vertisols) with subsurface salinity. It is observed that siltation is the major problem observed for the dysfunction of the pond and subsequently if desilted without proper speci�cation then the percolation loss is another problem in this area.
Physico-chemical properties of pond soil (Silt):
During the month of June 2018, pond soil samples were taken from both ponds at 4 to 5 points at the same distance along a transect from the top to the middle of the pond to know the nutrient content in the silt of the pond. Soil samples representing the entire pond area were collected and mixed thoroughly to get one composite sample for analysing different soil properties.
Pond soil (silt) is the deposition of soil from the catchment areas of the pond but fertility status of pond soil is different from that of catchment soils. Results revealed that Samni village pond soils was 'moderately alkaline' in nature (pHs 8.01) while Sudi pond soils was 'mildly alkaline' in nature (pH 7.63). Soils of Samni and Sudi village pond was saline (EC > s e
4.0 dS m ). The CaCO content values were 17.2 and 12.2%, respectively in Samni and Sudi -13
village pond soils. Saturation extract analysis of Samni pond soils showed the dominance of Mg cation followed by Na , Ca , and K while in case of Sudi pond soil the trend was 2+ + 2+ +
Ca > Mg > Na > K . However, in case of anions the trend for both pond soil was Cl > 2+ 2+ + + -
HCO > CO > SO . - 2- 2-3 3 4
Samni pond soil had low SOC (0.49 %) during dry period as a result of exploitation of soil resources for aquaculture activities throughout the year. However 'high' SOC content (1.08 %) was observed in Sudi pond soil this was might be due to plant and other aquatic vegetations occurred naturally throughout the year in pond along with animal activities. The available nitrogen status of Samni pond soils was 'medium' (332.4 kg ha ), while Sudi -1
pond soil was near to medium (282.2 kg ha ). Therefore, the lower SOC in the Samni pond -1
soil was supposed to be caused by input feed containing higher nitrogen content resulted in faster decomposition process in pond soil. While, both village (Samni and Sudi) pond soils have higher available nitrogen content than the soils of catchment areas of village ponds under both irrigated and rainfed and this was might be due to erosion of soil sediments from catchment area. Similarly, the available phosphorus and potassium content was also higher in both pond soils than catchment areas of soils. Hence the silt of the ponds can be used as manorial source for crops.
Analysis of water from Samni village pond:
Periodic collection of water samples and its subsequent analysis in laboratory was carried for Samni village pond. The different water quality parameters like EC, pH, RSC, SAR were analysed on monthly basis and their temporal variation is given in Fig. 63, whereas microbial analysis was carried out in the month of February 2018 and June 2018. Data revealed that EC of water continuously increased from 0.44 to 2.28 dS m from October -1
2017 to July 2018. This increase in EC was mainly because of evaporation of water from the pond. The SAR of pond water was varied between 1.49 and 2.5 from October 2017 to May 2018 and after that increased sharply in June (6.1) and July (7.75). However, the values were still below the permissible limit of 10 and hence there is no sodium hazard. Looking into EC and SAR values of pond water, it was found suitable for irrigation. The pH of water varied from 7.31 to 8.94. The RSC of water was lower than safe limit (1.25 me l ) for 7 -1
147
Recl
amat
ion
and
Man
agem
ent o
f Sal
t Affe
cted
Ver
tisol
sA
nnua
l Rep
ort 2
018-
19
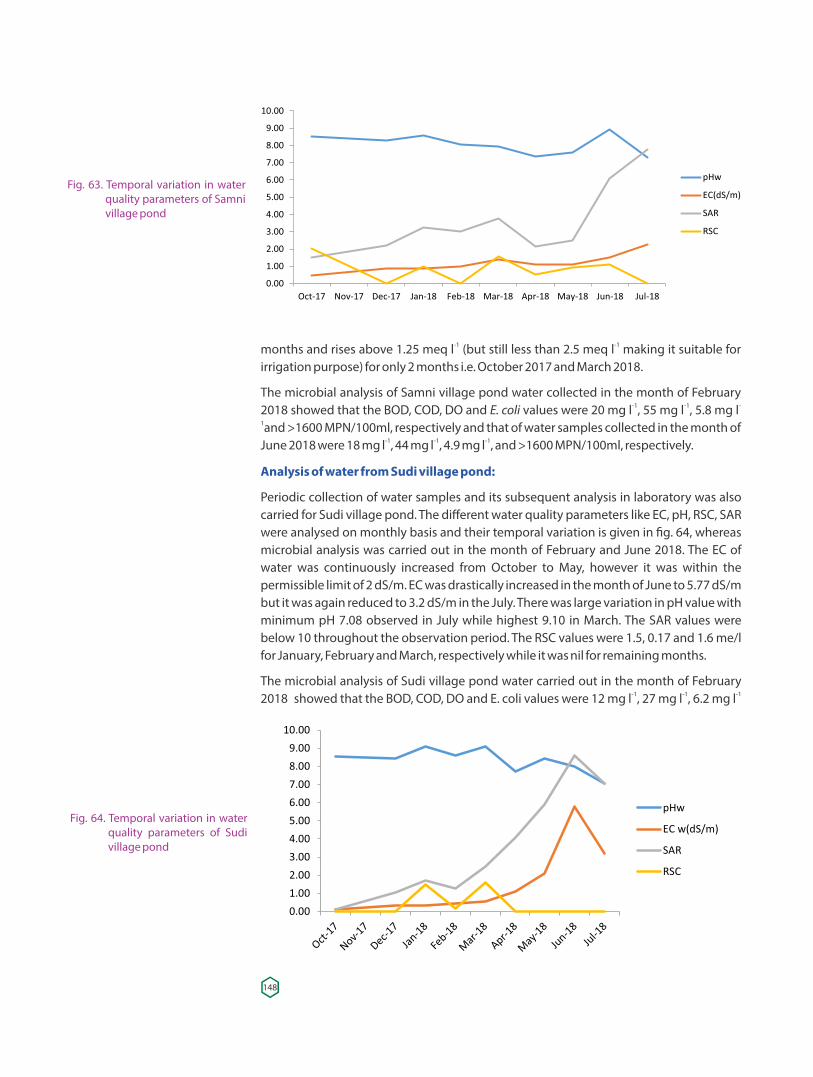
months and rises above 1.25 meq l (but still less than 2.5 meq l making it suitable for -1 -1
irrigation purpose) for only 2 months i.e. October 2017 and March 2018.
The microbial analysis of Samni village pond water collected in the month of February -1 -1 -2018 showed that the BOD, COD, DO and E. coli values were 20 mg l , 55 mg l , 5.8 mg l
1and >1600 MPN/100ml, respectively and that of water samples collected in the month of -1 -1 -1June 2018 were 18 mg l , 44 mg l , 4.9 mg l , and >1600 MPN/100ml, respectively.
Analysis of water from Sudi village pond:
Periodic collection of water samples and its subsequent analysis in laboratory was also carried for Sudi village pond. The different water quality parameters like EC, pH, RSC, SAR were analysed on monthly basis and their temporal variation is given in �g. 64, whereas microbial analysis was carried out in the month of February and June 2018. The EC of water was continuously increased from October to May, however it was within the permissible limit of 2 dS/m. EC was drastically increased in the month of June to 5.77 dS/m but it was again reduced to 3.2 dS/m in the July. There was large variation in pH value with minimum pH 7.08 observed in July while highest 9.10 in March. The SAR values were below 10 throughout the observation period. The RSC values were 1.5, 0.17 and 1.6 me/l for January, February and March, respectively while it was nil for remaining months.
The microbial analysis of Sudi village pond water carried out in the month of February -1 -1 -12018 showed that the BOD, COD, DO and E. coli values were 12 mg l , 27 mg l , 6.2 mg l
Fig. 64. Temporal variation in water quality parameters of Sudi village pond
Fig. 63. Temporal variation in water quality parameters of Samni village pond
148
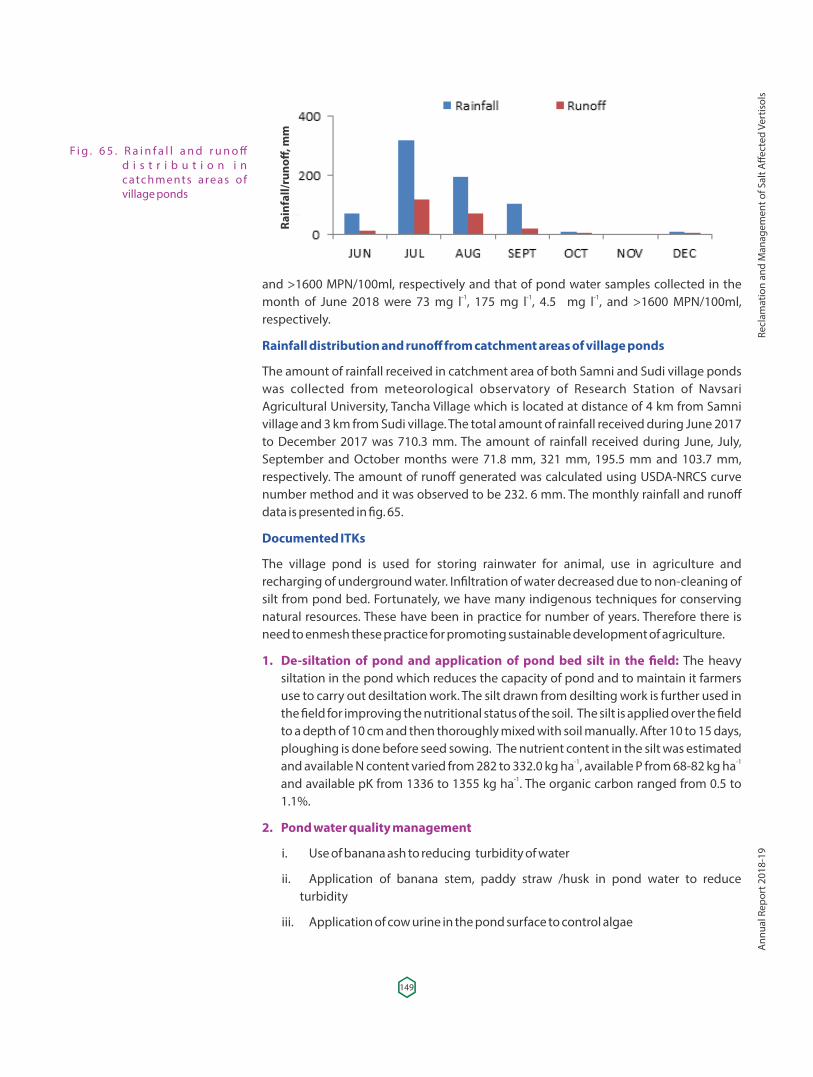
F i g . 6 5 . R a i n f a l l a n d r u n o ff d i s t r i b u t i o n i n catchments areas of village ponds
and >1600 MPN/100ml, respectively and that of pond water samples collected in the -1 -1 -1month of June 2018 were 73 mg l , 175 mg l , 4.5 mg l , and >1600 MPN/100ml,
respectively.
Rainfall distribution and runoff from catchment areas of village ponds
The amount of rainfall received in catchment area of both Samni and Sudi village ponds was collected from meteorological observatory of Research Station of Navsari Agricultural University, Tancha Village which is located at distance of 4 km from Samni village and 3 km from Sudi village. The total amount of rainfall received during June 2017 to December 2017 was 710.3 mm. The amount of rainfall received during June, July, September and October months were 71.8 mm, 321 mm, 195.5 mm and 103.7 mm, respectively. The amount of runoff generated was calculated using USDA-NRCS curve number method and it was observed to be 232. 6 mm. The monthly rainfall and runoff data is presented in �g. 65.
Documented ITKs
The village pond is used for storing rainwater for animal, use in agriculture and recharging of underground water. In�ltration of water decreased due to non-cleaning of silt from pond bed. Fortunately, we have many indigenous techniques for conserving natural resources. These have been in practice for number of years. Therefore there is need to enmesh these practice for promoting sustainable development of agriculture.
1. De-siltation of pond and application of pond bed silt in the �eld: The heavy siltation in the pond which reduces the capacity of pond and to maintain it farmers use to carry out desiltation work. The silt drawn from desilting work is further used in the �eld for improving the nutritional status of the soil. The silt is applied over the �eld to a depth of 10 cm and then thoroughly mixed with soil manually. After 10 to 15 days, ploughing is done before seed sowing. The nutrient content in the silt was estimated
-1 -1and available N content varied from 282 to 332.0 kg ha , available P from 68-82 kg ha -1and available pK from 1336 to 1355 kg ha . The organic carbon ranged from 0.5 to
1.1%.
2. Pond water quality management
i. Use of banana ash to reducing turbidity of water
ii. Application of banana stem, paddy straw /husk in pond water to reduce turbidity
iii. Application of cow urine in the pond surface to control algae
149
Recl
amat
ion
and
Man
agem
ent o
f Sal
t Affe
cted
Ver
tisol
sA
nnua
l Rep
ort 2
018-
19
Rain
fall/
runo
ff, m
m
3. Protection from seepage by using cow dung on the bottom of the pond
4. Establishing vegetation like coconut and betel nut on the dykes and also tur�ng of the side of the embankment with grasses
5. Management of dissolved oxygen de�ciency
Through indigenous methods like channelizing fresh spring water, beating the water with bamboo pole/banana pseudo stem, making children swim in pond and use of ducks.
6. Vegetative barrier by planting Ipomea , Sindhwar and Bamboo on bund
7. Opening up set furrow by onset of monsoon for harvesting more rain water.
8. Waste weir
After intercultural operation, the small furrow is opened with the help of blade hoe after every two crop rows. In the open furrow, moisture is conserved and become available to adjoining crop rows during a period of water stress. Furrow act as a drain under situation of excess water.
9. Earthen bund with pipe outlet
Exploration of medicinal and aromatic plants (MAPs) cultivation under different cropping systems and on marginal and degraded lands of semi-arid regions of India (Anil R. Chinchmalatpure)
Recent interest in indigenous medicines caused tremendous increase in consumption and demand of crude drugs and to ful�l this demand we are losing natural habitats of MAPs due to over exploitation of these plants. In Gujarat about 60 species of medicinal plants are under cultivation for various purposes which can be incorporated with in the existing high value cropping systems. The possibility to increase area under MAPs is through cultivation on marginal and degraded lands (saline soils). At present about 40% area in Gujarat is either left barren or unculturable/ culturable waste land due to different problems like soil salinity and soil and water erosion which can be used for cultivation of medicinal and aromatic plants. Thus, there is a wide scope of inclusion of medicinal and aromatic plants in the existing cropping systems and on marginal and degraded lands which not only improve the economic condition of small and marginal farmers owing to higher price and/or higher volume of their main and by-products but also conserve the natural resources and sustainable utilization of marginal lands.
The cultivation of these MAPs has been undertaken with different treatments including organic as well as inorganic fertilizer/manure and bio-fertilizer to study the performance on salt affected Vetisols with use of saline water. The experiment on Senna (Cassia angustifolia) was conducted using saline water on salt affected Vertisols. The sowing was done in the month of November 2017 and crop was harvested in May 2010. The pod yield
-1 -1per hectare varied between 265 to 325 kg ha under saline water irrigation (EC 8-9 dS m ) iw -1on saline Vertisols (EC 10 dS m ) The sennoside A and B content in leaves under saline e
water stress condition was found in the range of 2.2 to 2.5%. The experiment with Isabgol in rabi season using saline water on salt affected Vertisols is being carried out.
150
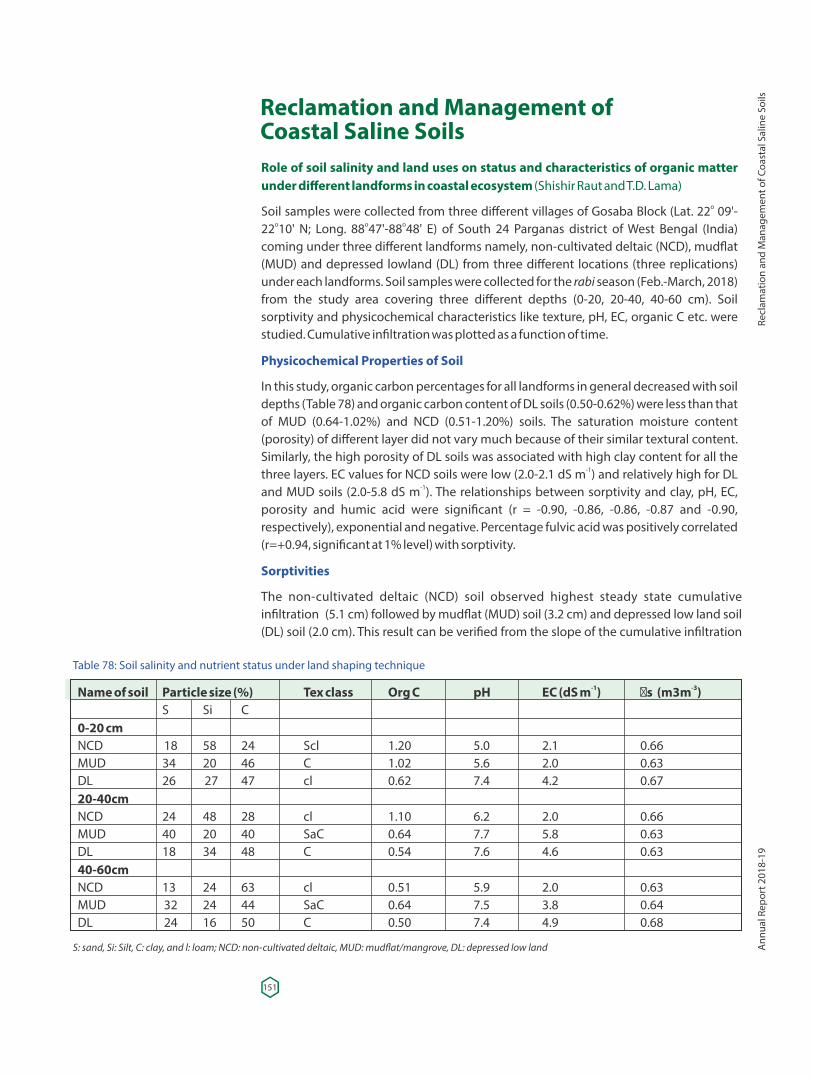
Reclamation and Management ofCoastal Saline SoilsRole of soil salinity and land uses on status and characteristics of organic matter under different landforms in coastal ecosystem (Shishir Raut and T.D. Lama)
oSoil samples were collected from three different villages of Gosaba Block (Lat. 22 09'-o o o22 10' N; Long. 88 47'-88 48' E) of South 24 Parganas district of West Bengal (India)
coming under three different landforms namely, non-cultivated deltaic (NCD), mud�at (MUD) and depressed lowland (DL) from three different locations (three replications) under each landforms. Soil samples were collected for the rabi season (Feb.-March, 2018) from the study area covering three different depths (0-20, 20-40, 40-60 cm). Soil sorptivity and physicochemical characteristics like texture, pH, EC, organic C etc. were studied. Cumulative in�ltration was plotted as a function of time.
Physicochemical Properties of Soil
In this study, organic carbon percentages for all landforms in general decreased with soil depths (Table 78) and organic carbon content of DL soils (0.50-0.62%) were less than that of MUD (0.64-1.02%) and NCD (0.51-1.20%) soils. The saturation moisture content (porosity) of different layer did not vary much because of their similar textural content. Similarly, the high porosity of DL soils was associated with high clay content for all the
-1three layers. EC values for NCD soils were low (2.0-2.1 dS m ) and relatively high for DL -1and MUD soils (2.0-5.8 dS m ). The relationships between sorptivity and clay, pH, EC,
porosity and humic acid were signi�cant (r = -0.90, -0.86, -0.86, -0.87 and -0.90, respectively), exponential and negative. Percentage fulvic acid was positively correlated (r=+0.94, signi�cant at 1% level) with sorptivity.
Sorptivities
The non-cultivated deltaic (NCD) soil observed highest steady state cumulative in�ltration (5.1 cm) followed by mud�at (MUD) soil (3.2 cm) and depressed low land soil (DL) soil (2.0 cm). This result can be veri�ed from the slope of the cumulative in�ltration
Table 78: Soil salinity and nutrient status under land shaping technique
-1 -3Name of soil Particle size (%) Tex class Org C pH EC (dS m ) �s (m3m ) S Si C 0-20 cmNCD 18 58 24 Scl 1.20 5.0 2.1 0.66MUD 34 20 46 C 1.02 5.6 2.0 0.63DL 26 27 47 cl 0.62 7.4 4.2 0.6720-40cmNCD 24 48 28 cl 1.10 6.2 2.0 0.66MUD 40 20 40 SaC 0.64 7.7 5.8 0.63DL 18 34 48 C 0.54 7.6 4.6 0.6340-60cmNCD 13 24 63 cl 0.51 5.9 2.0 0.63MUD 32 24 44 SaC 0.64 7.5 3.8 0.64DL 24 16 50 C 0.50 7.4 4.9 0.68
S: sand, Si: Silt, C: clay, and l: loam; NCD: non-cultivated deltaic, MUD: mud�at/mangrove, DL: depressed low land
151
Recl
amat
ion
and
Man
agem
ent o
f Coa
stal
Sal
ine
Soils
Ann
ual R
epor
t 201
8-19
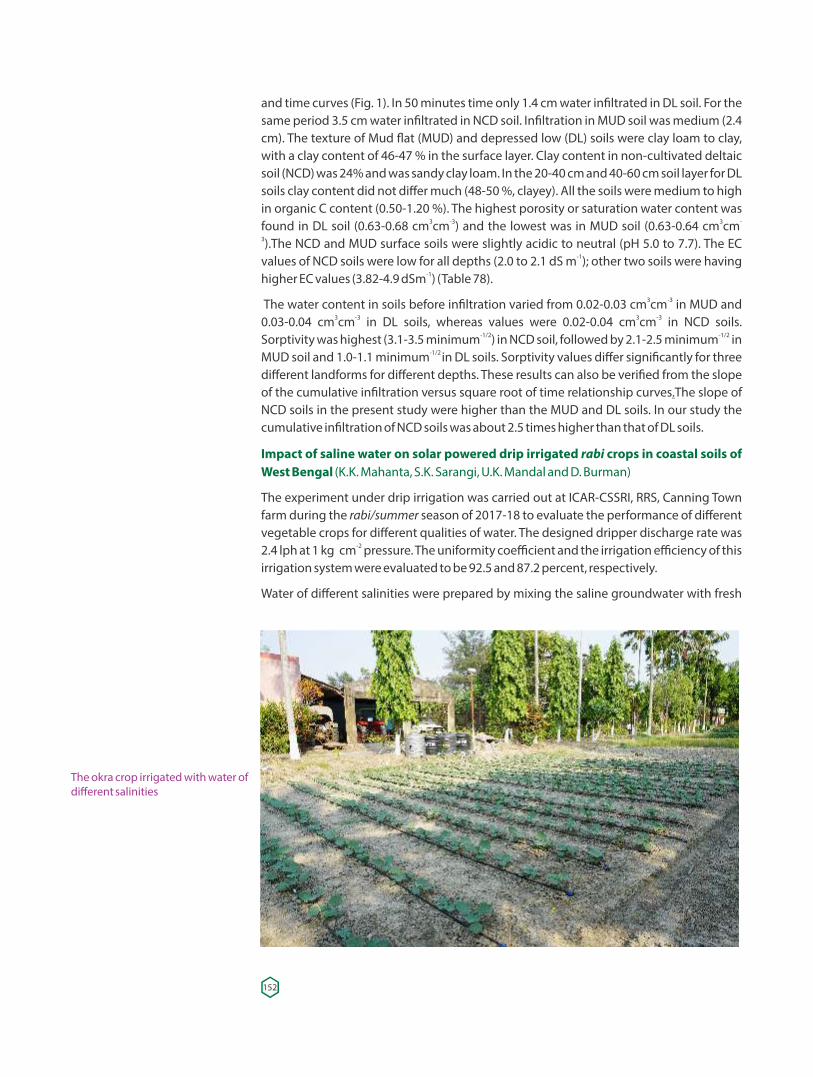
and time curves (Fig. 1). In 50 minutes time only 1.4 cm water in�ltrated in DL soil. For the same period 3.5 cm water in�ltrated in NCD soil. In�ltration in MUD soil was medium (2.4 cm). The texture of Mud �at (MUD) and depressed low (DL) soils were clay loam to clay, with a clay content of 46-47 % in the surface layer. Clay content in non-cultivated deltaic soil (NCD) was 24% and was sandy clay loam. In the 20-40 cm and 40-60 cm soil layer for DL soils clay content did not differ much (48-50 %, clayey). All the soils were medium to high in organic C content (0.50-1.20 %). The highest porosity or saturation water content was
3 -3 3 -found in DL soil (0.63-0.68 cm cm ) and the lowest was in MUD soil (0.63-0.64 cm cm3).The NCD and MUD surface soils were slightly acidic to neutral (pH 5.0 to 7.7). The EC
-1values of NCD soils were low for all depths (2.0 to 2.1 dS m ); other two soils were having -1higher EC values (3.82-4.9 dSm ) (Table 78).
3 -3 The water content in soils before in�ltration varied from 0.02-0.03 cm cm in MUD and 3 -3 3 -30.03-0.04 cm cm in DL soils, whereas values were 0.02-0.04 cm cm in NCD soils.
-1/2 -1/2Sorptivity was highest (3.1-3.5 minimum ) in NCD soil, followed by 2.1-2.5 minimum in -1/2 MUD soil and 1.0-1.1 minimum in DL soils. Sorptivity values differ signi�cantly for three
different landforms for different depths. These results can also be veri�ed from the slope of the cumulative in�ltration versus square root of time relationship curves.The slope of NCD soils in the present study were higher than the MUD and DL soils. In our study the cumulative in�ltration of NCD soils was about 2.5 times higher than that of DL soils.
Impact of saline water on solar powered drip irrigated rabi crops in coastal soils of West Bengal (K.K. Mahanta, S.K. Sarangi, U.K. Mandal and D. Burman)
The experiment under drip irrigation was carried out at ICAR-CSSRI, RRS, Canning Town farm during the rabi/summer season of 2017-18 to evaluate the performance of different vegetable crops for different qualities of water. The designed dripper discharge rate was
-22.4 lph at 1 kg cm pressure. The uniformity coefficient and the irrigation efficiency of this irrigation system were evaluated to be 92.5 and 87.2 percent, respectively.
Water of different salinities were prepared by mixing the saline groundwater with fresh
The okra crop irrigated with water of different salinities
152
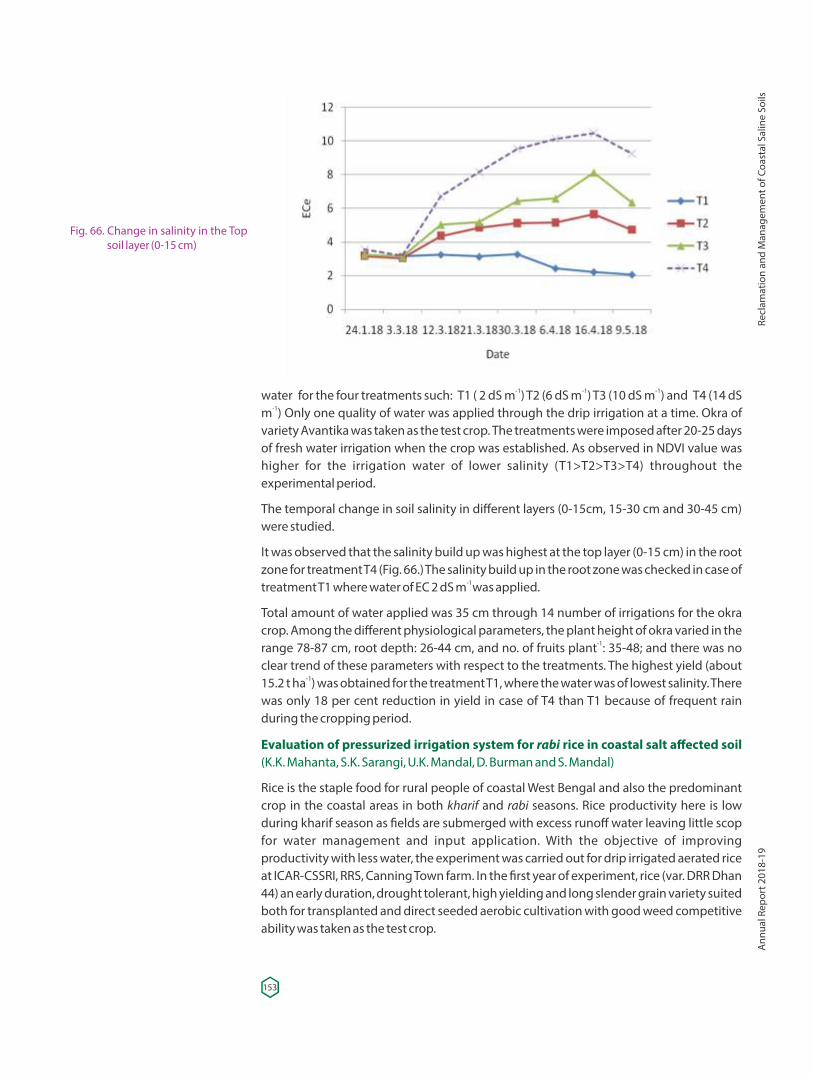
-1 -1 -1water for the four treatments such: T1 ( 2 dS m ) T2 (6 dS m ) T3 (10 dS m ) and T4 (14 dS -1m ) Only one quality of water was applied through the drip irrigation at a time. Okra of
variety Avantika was taken as the test crop. The treatments were imposed after 20-25 days of fresh water irrigation when the crop was established. As observed in NDVI value was higher for the irrigation water of lower salinity (T1>T2>T3>T4) throughout the experimental period.
The temporal change in soil salinity in different layers (0-15cm, 15-30 cm and 30-45 cm) were studied.
It was observed that the salinity build up was highest at the top layer (0-15 cm) in the root zone for treatment T4 (Fig. 66.) The salinity build up in the root zone was checked in case of
-1 treatment T1 where water of EC 2 dS m was applied.
Total amount of water applied was 35 cm through 14 number of irrigations for the okra crop. Among the different physiological parameters, the plant height of okra varied in the
-1range 78-87 cm, root depth: 26-44 cm, and no. of fruits plant : 35-48; and there was no clear trend of these parameters with respect to the treatments. The highest yield (about
-115.2 t ha ) was obtained for the treatment T1, where the water was of lowest salinity. There was only 18 per cent reduction in yield in case of T4 than T1 because of frequent rain during the cropping period.
Evaluation of pressurized irrigation system for rabi rice in coastal salt affected soil (K.K. Mahanta, S.K. Sarangi, U.K. Mandal, D. Burman and S. Mandal)
Rice is the staple food for rural people of coastal West Bengal and also the predominant crop in the coastal areas in both kharif and rabi seasons. Rice productivity here is low during kharif season as �elds are submerged with excess runoff water leaving little scop for water management and input application. With the objective of improving productivity with less water, the experiment was carried out for drip irrigated aerated rice at ICAR-CSSRI, RRS, Canning Town farm. In the �rst year of experiment, rice (var. DRR Dhan 44) an early duration, drought tolerant, high yielding and long slender grain variety suited both for transplanted and direct seeded aerobic cultivation with good weed competitive ability was taken as the test crop.
Fig. 66. Change in salinity in the Top soil layer (0-15 cm)
153
Recl
amat
ion
and
Man
agem
ent o
f Coa
stal
Sal
ine
Soils
Ann
ual R
epor
t 201
8-19
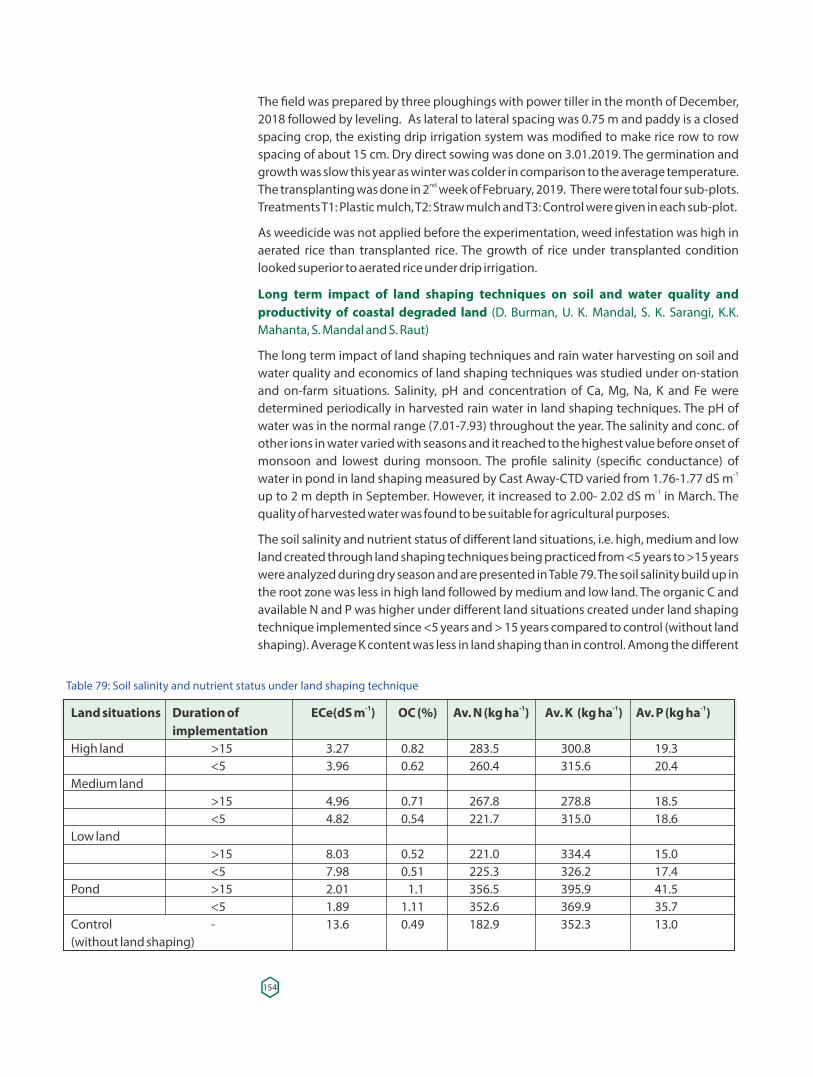
The �eld was prepared by three ploughings with power tiller in the month of December, 2018 followed by leveling. As lateral to lateral spacing was 0.75 m and paddy is a closed spacing crop, the existing drip irrigation system was modi�ed to make rice row to row spacing of about 15 cm. Dry direct sowing was done on 3.01.2019. The germination and growth was slow this year as winter was colder in comparison to the average temperature.
ndThe transplanting was done in 2 week of February, 2019. There were total four sub-plots. Treatments T1: Plastic mulch, T2: Straw mulch and T3: Control were given in each sub-plot.
As weedicide was not applied before the experimentation, weed infestation was high in aerated rice than transplanted rice. The growth of rice under transplanted condition looked superior to aerated rice under drip irrigation.
Long term impact of land shaping techniques on soil and water quality and productivity of coastal degraded land (D. Burman, U. K. Mandal, S. K. Sarangi, K.K. Mahanta, S. Mandal and S. Raut)
The long term impact of land shaping techniques and rain water harvesting on soil and water quality and economics of land shaping techniques was studied under on-station and on-farm situations. Salinity, pH and concentration of Ca, Mg, Na, K and Fe were determined periodically in harvested rain water in land shaping techniques. The pH of water was in the normal range (7.01-7.93) throughout the year. The salinity and conc. of other ions in water varied with seasons and it reached to the highest value before onset of monsoon and lowest during monsoon. The pro�le salinity (speci�c conductance) of
-1water in pond in land shaping measured by Cast Away-CTD varied from 1.76-1.77 dS m -1up to 2 m depth in September. However, it increased to 2.00- 2.02 dS m in March. The
quality of harvested water was found to be suitable for agricultural purposes.
The soil salinity and nutrient status of different land situations, i.e. high, medium and low land created through land shaping techniques being practiced from <5 years to >15 years were analyzed during dry season and are presented in Table 79. The soil salinity build up in the root zone was less in high land followed by medium and low land. The organic C and available N and P was higher under different land situations created under land shaping technique implemented since <5 years and > 15 years compared to control (without land shaping). Average K content was less in land shaping than in control. Among the different
Table 79: Soil salinity and nutrient status under land shaping technique
-1 -1 -1 -1Land situations Duration of ECe(dS m ) OC (%) Av. N (kg ha ) Av. K (kg ha ) Av. P (kg ha ) implementationHigh land >15 3.27 0.82 283.5 300.8 19.3 <5 3.96 0.62 260.4 315.6 20.4Medium land >15 4.96 0.71 267.8 278.8 18.5 <5 4.82 0.54 221.7 315.0 18.6Low land >15 8.03 0.52 221.0 334.4 15.0 <5 7.98 0.51 225.3 326.2 17.4Pond >15 2.01 1.1 356.5 395.9 41.5 <5 1.89 1.11 352.6 369.9 35.7Control - 13.6 0.49 182.9 352.3 13.0(without land shaping)
154
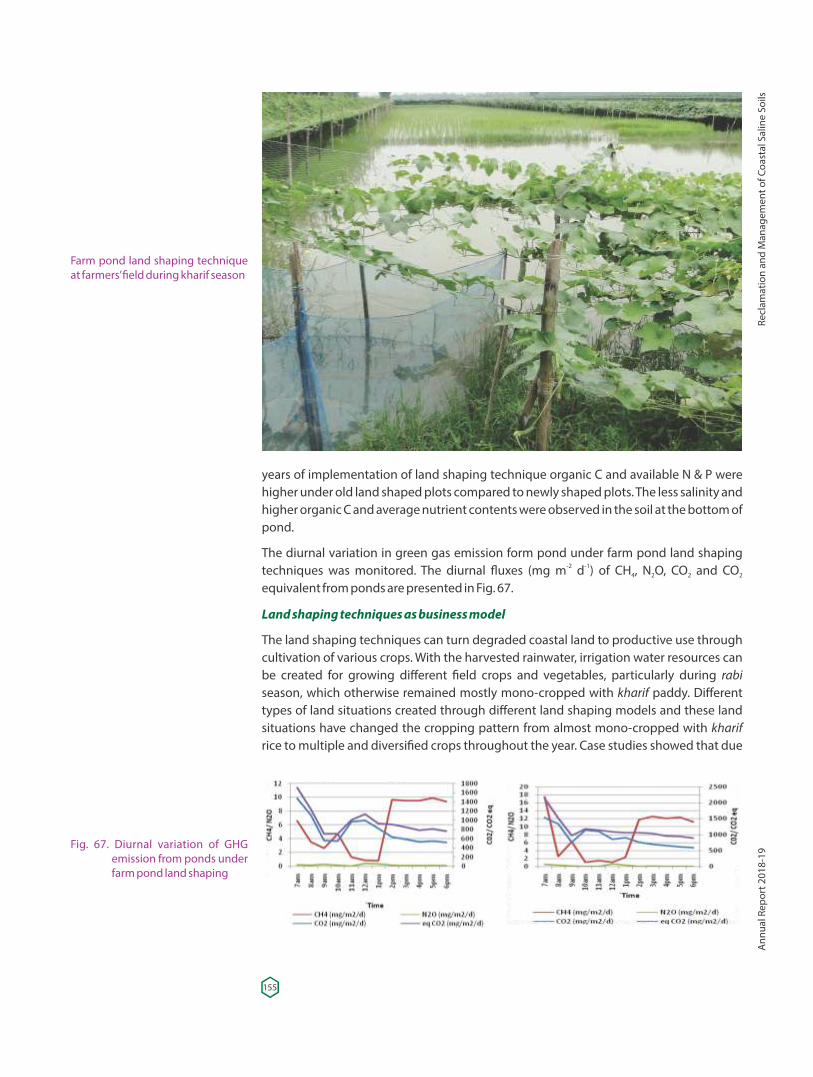
years of implementation of land shaping technique organic C and available N & P were higher under old land shaped plots compared to newly shaped plots. The less salinity and higher organic C and average nutrient contents were observed in the soil at the bottom of pond.
The diurnal variation in green gas emission form pond under farm pond land shaping -2 -1techniques was monitored. The diurnal �uxes (mg m d ) of CH , N O, CO and CO4 2 2 2
equivalent from ponds are presented in Fig. 67.
Land shaping techniques as business model
The land shaping techniques can turn degraded coastal land to productive use through cultivation of various crops. With the harvested rainwater, irrigation water resources can be created for growing different �eld crops and vegetables, particularly during rabi season, which otherwise remained mostly mono-cropped with kharif paddy. Different types of land situations created through different land shaping models and these land situations have changed the cropping pattern from almost mono-cropped with kharif rice to multiple and diversi�ed crops throughout the year. Case studies showed that due
Fig. 67. Diurnal variation of GHG emission from ponds under farm pond land shaping
Farm pond land shaping technique at farmers’ �eld during kharif season
155
Recl
amat
ion
and
Man
agem
ent o
f Coa
stal
Sal
ine
Soils
Ann
ual R
epor
t 201
8-19
to land shaping techniques, the cropping intensity could be increased to 166-240 % from 100-114% in the coastal salt-affected areas of Sundarbans and Andaman & Nicobar Islands . Such land shaping techniques can also be implemented in other parts of salt affected areas in coastal region.
On-farm demonstration have shown the success of these land shaping models in Sundarbans and Andaman & Nicobar Islands in terms of increasing farm income and providing gainful employment to the farmers. However, these land shaping techniques involved high initial investment, particularly on soil excavation. The �nancial analysis has revealed a direct relationship between investment on a land shaping model and value of Internal Rate of Return (IRR), Net Present Value (NPV), and Bene�t Cost Ratio (BCR). The payback period was calculated to be 1.41, 1.78 and 2.13 years, respectively under FP, PCF, and DFR type of land shaping models. Financial analysis of all land shaping models under study has indicated that investments on such interventions were �nancially viable and attractive proposition for the coastal region of Sundarbans (West Bengal) and Andaman & Nicobar Islands. For out-scaling of these technologies to a greater scale, there is a need to address some socio-economic constraints and policy support. Such proposition of crop-�sh integration in agriculture through these land-shaping models was highly suitable for pulling the income of intra-agricultural sector in coastal region of India.
Viewing its success and feasibility of investment, NABARD has enlisted 'Land Leveling and Shaping' as one of the land development activities for the state of West Bengal. Financial support is also provided for excavation of farm pond, integrated farming systems and �sh farming, which may be linked to promotion of land shaping technologies in the coastal area. Besides, ongoing government schemes like RKVY, MGNREGA, BGREI etc also provide �nancial support through developmental institutions (like NGOs) or through government departments.
Assessing carbon sequestration potential of conservation tillage practices under rice based cropping system in coastal saline soils (U.K. Mandal, D. Burman, S.K. Sarangi and T. D. Lama)
Inappropriate farm practices can increase green house gases (GHGs) emissions and reduce soil organic carbon sequestration, thereby increasing carbon footprints (CFs), jeopardizing ecosystem services and affecting climate change. In this study, a systematic assessment of energy budget, GHGs emissions, carbon footprints and ecosystem service values of climate regulation was estimated on conservation tillage practices under rice-based cropping system in coastal region of West Bengal. The design of experiment was split-split plot with cropping system (rice-rice and rice-cotton) (kharif-rabi) as main plot treatments and tillage type such as zero tillage (ZT), reduced tillage (RT), and conventional tillage (CT) as sub plot treatments and residue (R) and no residue (NR) under sub-sub plot treatments. Energy inputs of different tillage and residue treatments in rice-rice and rice-cotton systems were estimated by using both direct (amount of fossil fuel used in tillage, sowing, harvesting, human labour, and electricity or diesel for irrigation) and indirect (energy used in production like mineral fertilizers, pesticides and seeds) energy inputs. The energy output of rice grain and seed cotton and biomass for each
−1treatment was calculated based on the total yield (kg ha ) and its corresponding calori�c values. Operation wise energy used was calculated and treatment under reduced tillage condition was most efficient in utilizing energy. In most of the cases chemical fertilizer and pesticides consumed more than 70% of energy utilization. The static gas chamber consisted of a permanent round base (43 cm diameter), made of galvanized steel,
156
inserted 8–10 cm below the soil surface, and a portable chamber top, 100-L plastic bucket were used for collecting GHGs �ux from �elds and was analysed using gas chromatography. The GHGs emissions from agricultural inputs were estimated to 1096-
-1 -11520 and 1067-1447 kg CO -eq. ha yr under rice-rice and rice-cotton systems, 2
respectively. Whereas, the direct GHGs emissions �ux were 6002-9253 and 5710-8006 -1 -1CO -eq. ha yr under rice-rice and rice-cotton systems, respectively (Table 80). The CFs at 2
yield scale during the entire growing season were 0.84, 0.92, 0.98, 1.04, 1.11, 1.13, respectively, in rice-rice and 1.20, 1.26, 1.04, 1.09, 1.25, 1.27, respectively, in rice-cotton systems under treatments ZTR, ZTNR, RTR, RTNR, CTR and CTNR (Fig. 68). Regardless of tillage the CFs of rice-rice system was less than rice-cotton systems. We also calculated CFs considering the soil organic C (SOC) sequestration and reduced tillage with residue was estimated minimum CF among all tillage treatments. The ecosystem service value of climate regulation estimated considering from the point of biomass C �xation, SOC
Table 80: GHG emissions under different tillage treatments in rice-rice and rice-cotton systems
-2 -1 -1 -2 -1 -2 -1Treatment g CO m d mg CH m-2 d mg N O m d kg CO eq. ha yr 2 4 2 2
Rice-rice systemsZTR 1.351 29.514 0.609 6332aZTNR 1.294 27.264 0.611 6002bRTR 1.805 31.472 0.828 8105cRTNR 1.622 30.857 0.831 7920cCTR 1.612 36.340 1.200 9253dCTNR 2.000 35.592 1.990 8910dRice-cotton systemsZTR 2.162 19.577 2.990 6120aZTNR 2.255 18.158 1.945 5710bRTR 1.770 18.512 2.295 7820cRTNR 1.802 16.458 3.235 7622cCTR 1.614 20.806 3.892 8806dCTNR 1.414 17.826 3.990 8310e
Fig. 68.Carbon footprints under different tillage treatments in rice-rice and rice-cotton system
1.4
1.2
1.0
0.8
0.6
0.4
0.2
0.0
carb
onfo
otpr
int(
CF)
Carbon footprint (CF)CF considering SOC sequestration
1.4
1.2
1.0
0.8
0.6
0.4
0.2
0.0ZTR ZTNR RTR RTNR CTR CTNR
Rice-Rice
ZTR ZTNR RTR RTNR CTR CTNR
Rice-Cotton
157
Recl
amat
ion
and
Man
agem
ent o
f Coa
stal
Sal
ine
Soils
Ann
ual R
epor
t 201
8-19
sequestration, indirect GHGs emissions from agricultural inputs and direct GHGs emissions from the soil as well as cost of forestation and treatments wise values were
-114050, 11292, 14866, 12455, 14096, 12418 Rs ha , respectively, in rice-rice and 7638, 5840, -19374, 8165, 8743 and 7839 Rs. ha , respectively in rice-cotton systems under the
treatment ZTR, ZTNR, RTR, RTNR, CTR and CTNR.
Conservation agriculture for rice-maize cropping system in coastal saline region (Sukanta K. Sarangi, U. K. Mandal, K. K. Mahanta and T. D. Lama)
Rice-maize was found to be a pro�table cropping system for the coastal saline region. To develop sustainable practices for this system, this project was initiated from kharif 2016. The objectives were (i) increasing cropping intensity in the salt affected coastal region through improved crop management practices, (ii) studying the effect of crop residue retention on the soil properties and crop productivity, (iii) optimizing nitrogen dose for hybrid maize under different residue and previous crop management practices. The treatments consisted of four kharif rice crop management practices (1) conventional puddled transplanted rice (PTR) with residue removed (PTR-R) (2) PTR with 30-40% residue retained (PTR+R) (3) dry direct seeded rice (DSR) with residue removed (DSR-R) & (4) DSR with 30-40% residue retained (DSR+R) in main-plot and four nitrogen application
-1 -1to hybrid maize (1) Control (0% N), (2) 80 kg ha (50%), (3) 120 kg ha (75%) and (4) 160 kg -1ha (100%) in sub-plot. The experiment was conducted in split-plot design with three
replications.
There was a signi�cant effect of kharif rice crop establishment methods and residue management practices on the soil salinity during subsequent rabi season (Fig. 69). Soil salinity in the months of February and March was signi�cantly reduced in DSR+R (4.9-5.0
-1 -1dS m ), whereas in case of PTR-R, it was the highest (6.0-6.5 dS m ). However, during the months of April and May, due to summer rain (6.74 and 14.1 cm respectively), the salinity
-1was declined to less than 4 dS m .-1The kernel yield of maize during 2017-18 was signi�cantly highest (5.98 t ha ) due to
-1DSR+R, which was at par with PTR+R (5.87 t ha ). Retention of rice residue resulted in 18% increase in kernel yield of maize. The effect of residue retention on the stover yield was more conspicuous in DSR compared to PTR. There was a signi�cant effect of kharif rice establishment methods and residue management on the irrigation water requirement
-1Fig.69. Soil salinity (EC in dS m ) in e
the rabi maize as affected by p r e v i o u s k h a r i f c r o p establishment methods and r e s i d u e m a n a g e m e n t practices.
158
-1So
il Sa
linit
y (E
Ce, d
S m
)
(IW) and irrigation water productivity (IWp) of rabi maize. Lowest IW and highest IWp were observed due to DSR+R and vice-versa in case of PTR-R. At least 10 cm of IW can be saved by retention of rice residue in maize crop. Kernel yield of maize was signi�cantly highest
-1 -1(6.41 t ha ) due to application of 160 kg N ha , however, the stover yield was at par with -1 -1120 and 160 kg N ha . Similarly, the IWp was at par for 120 and 160 kg N ha .
In the third year of rice cropping (Kharif 2018), a signi�cant effect of retention of maize residue in rice on soil salinity build up was observed (Fig. 70). When, residue was retained in DSR (DSR+R), soil salinity in the month of May and June 2018 was reduced to 3.8 and 2.8
-1 -1dS m respectively compared to 6.3 dSm in DSR-R. However, as the kharif season progressed, due to the effect of rain, there was washing of salts and the effect of residue on salinity gradually decreased upto September, 2018 and again from October the effect was observed.
The results revealed that retention of maize stover in the rice �eld had a signi�cant effect on the yield attributes like panicle density, grains per panicle in DSR and fertility % in PTR. Grain yield of 2018 rice was signi�cantly higher in DSR compared to PTR and the kharifeffect of residue retention was conspicuous both in DSR and PTR (Table 81). Highest grain (7.33 t ha ) and straw (9.72 t ha ) yields were recorded in DSR+R and lowest in PTR-R (5.04 -1 -1
and 8.25 t ha respectively). Residual effect of N application on the subsequent rice crop -1
was observed in the third year of study. However, the yield of kharif rice was at par, when N doses of maize crop were 120 and 160 kg ha . -1
In the third maize crop (2018-19), soil salinity was signi�cantly reduced in DSR+R (3.5 dS m ) compared to PTR-R (6.2 dS m ) in January 2019 (Table 82). When no residue is -1 -1
retained, soil salinity was less in DSR than PTR, the difference between DSR and PTR become non-signi�cant when residue is retained. Similar trend was observed for the months of February and March 2019. In general, the soil salinity decreased gradually in
Fig. 70. Effect of establishment methods and residue management on soil salinity during kharif 2018 at Canning Town, West Bengal.
159
Recl
amat
ion
and
Man
agem
ent o
f Coa
stal
Sal
ine
Soils
Ann
ual R
epor
t 201
8-19
-1So
il Sa
linity
(ECe
, dS
m)
9
8
7
6
5
4
3
2
1
0
DSR-R DSR+R PT-R PT+R
May-18 Jun-18 Jul-18 Aug-18 Sep-18 Oct-18 Nov-18 Dec-18
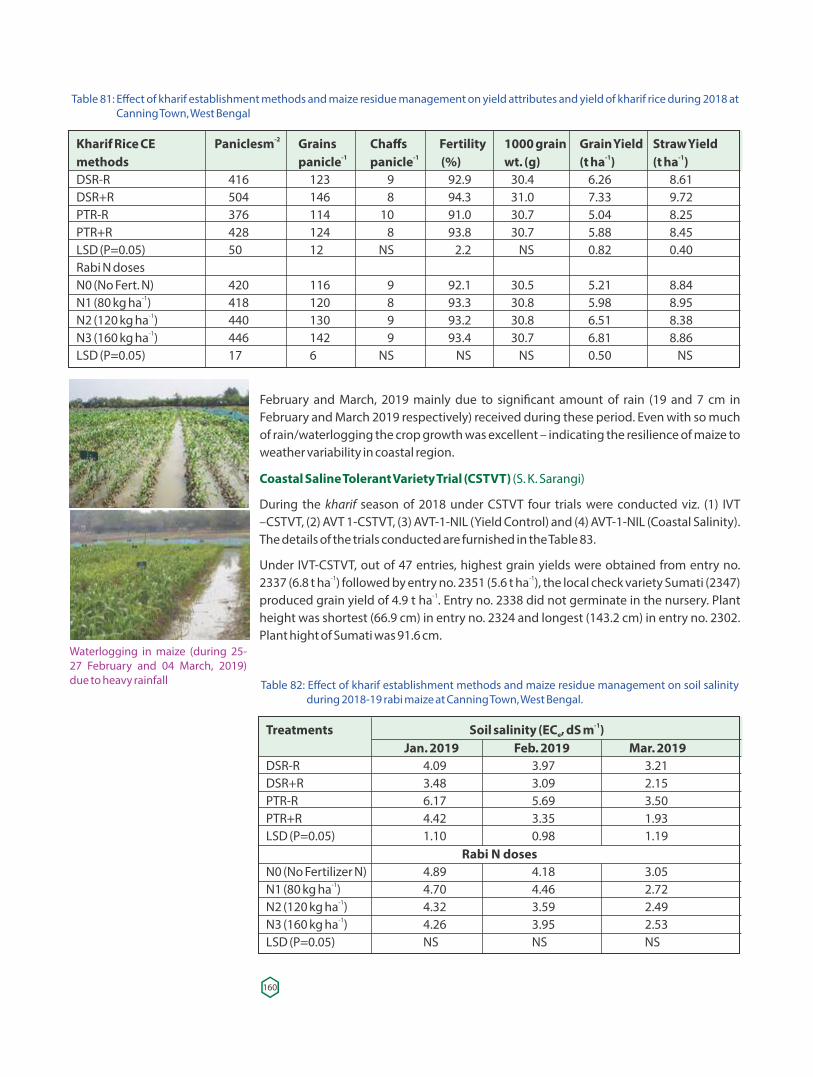
Table 81: Effect of kharif establishment methods and maize residue management on yield attributes and yield of kharif rice during 2018 at Canning Town, West Bengal
-2Kharif Rice CE Paniclesm Grains Chaffs Fertility 1000 grain Grain Yield Straw Yield -1 -1 -1 -1methods panicle panicle (%) wt. (g) (t ha ) (t ha )
DSR-R 416 123 9 92.9 30.4 6.26 8.61DSR+R 504 146 8 94.3 31.0 7.33 9.72PTR-R 376 114 10 91.0 30.7 5.04 8.25PTR+R 428 124 8 93.8 30.7 5.88 8.45LSD (P=0.05) 50 12 NS 2.2 NS 0.82 0.40Rabi N dosesN0 (No Fert. N) 420 116 9 92.1 30.5 5.21 8.84
-1N1 (80 kg ha ) 418 120 8 93.3 30.8 5.98 8.95-1N2 (120 kg ha ) 440 130 9 93.2 30.8 6.51 8.38-1N3 (160 kg ha ) 446 142 9 93.4 30.7 6.81 8.86
LSD (P=0.05) 17 6 NS NS NS 0.50 NS
February and March, 2019 mainly due to signi�cant amount of rain (19 and 7 cm in February and March 2019 respectively) received during these period. Even with so much of rain/waterlogging the crop growth was excellent – indicating the resilience of maize to weather variability in coastal region.
Coastal Saline Tolerant Variety Trial (CSTVT) (S. K. Sarangi)
During the kharif season of 2018 under CSTVT four trials were conducted viz. (1) IVT –CSTVT, (2) AVT 1-CSTVT, (3) AVT-1-NIL (Yield Control) and (4) AVT-1-NIL (Coastal Salinity). The details of the trials conducted are furnished in the Table 83.
Under IVT-CSTVT, out of 47 entries, highest grain yields were obtained from entry no. 2337 (6.8 t ha ) followed by entry no. 2351 (5.6 t ha ), the local check variety Sumati (2347) -1 -1
produced grain yield of 4.9 t ha . Entry no. 2338 did not germinate in the nursery. Plant -1
height was shortest (66.9 cm) in entry no. 2324 and longest (143.2 cm) in entry no. 2302. Plant hight of Sumati was 91.6 cm.
Table 82: Effect of kharif establishment methods and maize residue management on soil salinity during 2018-19 rabi maize at Canning Town, West Bengal.
-1Treatments Soil salinity (EC , dS m )e
Jan. 2019 Feb. 2019 Mar. 2019DSR-R 4.09 3.97 3.21DSR+R 3.48 3.09 2.15PTR-R 6.17 5.69 3.50PTR+R 4.42 3.35 1.93LSD (P=0.05) 1.10 0.98 1.19
Rabi N dosesN0 (No Fertilizer N) 4.89 4.18 3.05
-1N1 (80 kg ha ) 4.70 4.46 2.72-1N2 (120 kg ha ) 4.32 3.59 2.49-1N3 (160 kg ha ) 4.26 3.95 2.53
LSD (P=0.05) NS NS NS
Waterlogging in maize (during 25-27 February and 04 March, 2019) due to heavy rainfall
160
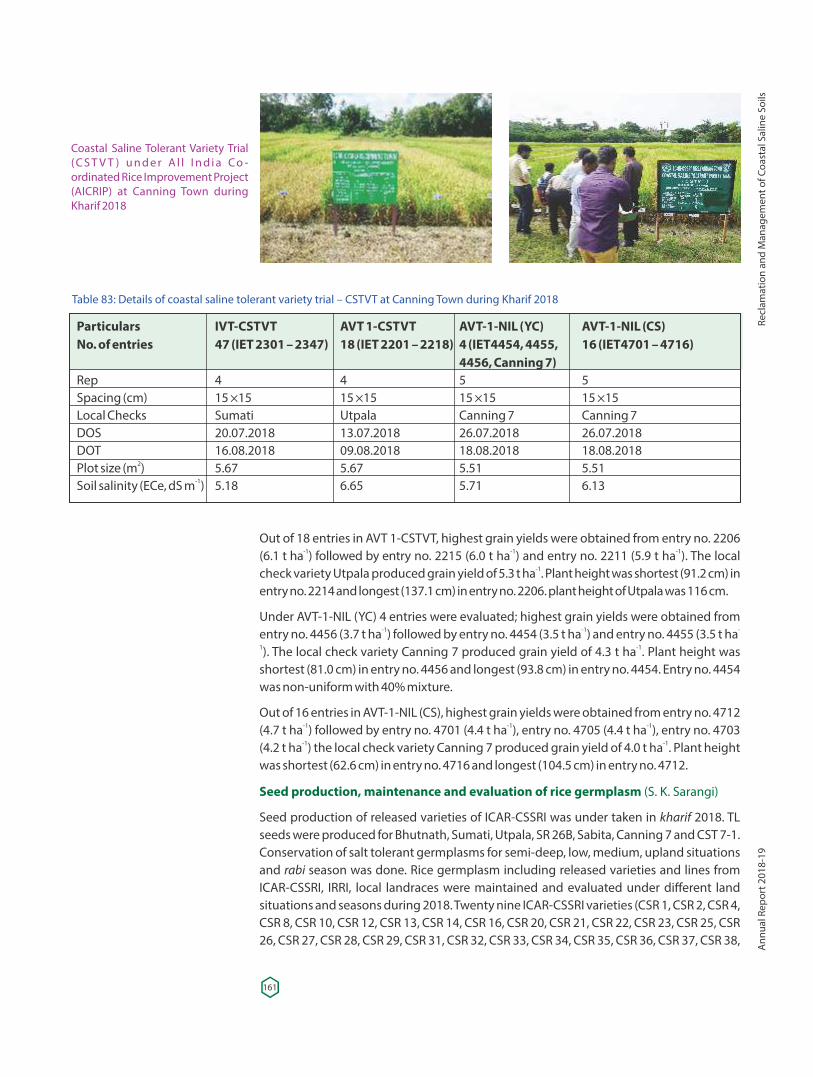
Coastal Saline Tolerant Variety Trial ( C S T V T ) u n d e r A l l I n d i a C o -ordinated Rice Improvement Project (AICRIP) at Canning Town during Kharif 2018
Table 83: Details of coastal saline tolerant variety trial – CSTVT at Canning Town during Kharif 2018
Particulars IVT-CSTVT AVT 1-CSTVT AVT-1-NIL (YC) AVT-1-NIL (CS) No. of entries 47 (IET 2301 – 2347) 18 (IET 2201 – 2218) 4 (IET4454, 4455, 16 (IET4701 – 4716) 4456, Canning 7) Rep 4 4 5 5Spacing (cm) 15 ×15 15 ×15 15 ×15 15 ×15Local Checks Sumati Utpala Canning 7 Canning 7 DOS 20.07.2018 13.07.2018 26.07.2018 26.07.2018 DOT 16.08.2018 09.08.2018 18.08.2018 18.08.2018
2Plot size (m ) 5.67 5.67 5.51 5.51 -1Soil salinity (ECe, dS m ) 5.18 6.65 5.71 6.13
Out of 18 entries in AVT 1-CSTVT, highest grain yields were obtained from entry no. 2206 (6.1 t ha ) followed by entry no. 2215 (6.0 t ha ) and entry no. 2211 (5.9 t ha ). The local -1 -1 -1
check variety Utpala produced grain yield of 5.3 t ha . Plant height was shortest (91.2 cm) in -1
entry no. 2214 and longest (137.1 cm) in entry no. 2206. plant height of Utpala was 116 cm.
Under AVT-1-NIL (YC) 4 entries were evaluated; highest grain yields were obtained from entry no. 4456 (3.7 t ha ) followed by entry no. 4454 (3.5 t ha ) and entry no. 4455 (3.5 t ha-1 -1 -
1 -1). The local check variety Canning 7 produced grain yield of 4.3 t ha . Plant height was shortest (81.0 cm) in entry no. 4456 and longest (93.8 cm) in entry no. 4454. Entry no. 4454 was non-uniform with 40% mixture.
Out of 16 entries in AVT-1-NIL (CS), highest grain yields were obtained from entry no. 4712 (4.7 t ha ) followed by entry no. 4701 (4.4 t ha ), entry no. 4705 (4.4 t ha ), entry no. 4703 -1 -1 -1
(4.2 t ha ) the local check variety Canning 7 produced grain yield of 4.0 t ha . Plant height -1 -1
was shortest (62.6 cm) in entry no. 4716 and longest (104.5 cm) in entry no. 4712.
Seed production, maintenance and evaluation of rice germplasm (S. K. Sarangi)
Seed production of released varieties of ICAR-CSSRI was under taken in 2018. TL kharifseeds were produced for Bhutnath, Sumati, Utpala, SR 26B, Sabita, Canning 7 and CST 7-1. Conservation of salt tolerant germplasms for semi-deep, low, medium, upland situations and season was done. Rice germplasm including released varieties and lines from rabi ICAR-CSSRI, IRRI, local landraces were maintained and evaluated under different land situations and seasons during 2018. Twenty nine ICAR-CSSRI varieties (CSR 1, CSR 2, CSR 4, CSR 8, CSR 10, CSR 12, CSR 13, CSR 14, CSR 16, CSR 20, CSR 21, CSR 22, CSR 23, CSR 25, CSR 26, CSR 27, CSR 28, CSR 29, CSR 31, CSR 32, CSR 33, CSR 34, CSR 35, CSR 36, CSR 37, CSR 38,
161
Recl
amat
ion
and
Man
agem
ent o
f Coa
stal
Sal
ine
Soils
Ann
ual R
epor
t 201
8-19
CSR 39, CSR 40 and CSR 41) were evaluated during kharif 2018. Under semi-deep water situation with stagnant �ooding 25 entries (Gitanjali, Swarna-Sub 1, SR 26 - B, Sabita, Patnai - 23, Dinesh, Purnendu, Ambica, Nalini, Manas swarabar, Tilak kanchari, Najani, Sada Mota, CSRC(D)5-2-2-2, CSRC(D)7-0-4, CSRC(D)7-12-1, CSRC(D)13-16-19, CSRC(D)12-8-12, CSRC(D)7-5-4, CSRC(D)2-0-8, CSRC(D) 2-17-5, C 300 BD-50-11, Asfal, NC 678 and Gavir saru) were evaluated. Twenty two entries were evaluated under low land situation (Amal-Mana, Utpala, Sumati, SR 26B, Dadsal, CST 7-1, Bhutnath, Namita-Dipti, Chamar Mani, Dudheswar, Buck Tulsi, CSR 1, CSR 2, CSR 6, Talmugur, Nona Bokra, Pankaj, Pokali, CN 1233-33-9, CN 1231-11-7, CN 1039-9 and Swarna-Sub 1). During season forty entries rabiare under evaluation.
Impact of de�cit irrigation on salt dynamics and crop productivity in coastal saline soil (T. D. Lama, D. Burman, B. Maji, S. K. Sarangi and K.K. Mahanta)
To study the salt dynamics and crop productivity under de�cit irrigation in a heavy textured coastal saline soil, �eld experiment was conducted during the rabi season of 2017-18 in 1split-plot design with water quality (GW – good quality water, SW - saline water with EC 4.0 dS m and SW - saline water with EC8.0 dSm ) as main plot treatments -1 -1
2
and irrigation levels [I -125%, I -100%, I -75% and I -50% of cumulative pan evaporation 1 2 3 4
(CPE)] as sub-plot treatments. Two crops namely maize and brinjal were grown under drip irrigation following normal agronomic management practices. The electrical conductivity (EC) of good quality water was 1.23 dS m having 6.90, 0.14, 0.21 and 0.43 -1
meq l of Na , K , Cl and SO , respectively. In saline irrigation water having EC 4.0 dS m , -1 + + - -2 -14
their contents were 27.00, 0.55, 2.99 and 7.23, respectively, while it was 59.87, 1.06, 5.55 and 8.71 meq l in irrigation water having 8.0 dS m salinity.-1 -1
Soil samples from 0-10, 10-20, 20-40 and 40-60 cm depths were sampled at regular intervals for measurement of EC and Na , K , Cl and SO in the saturation extract. The soil + + - -2
e 4
EC showed an increasing trend with the progress of the crop growing season. At harvest e
of maize crop, highest EC of 7.52 dS m was recorded in the surface soil layer with the -1e
application of irrigation water having salinity level 8.0 dS m . The soil EC at harvest was -1e
4.22 dS m with good quality water and 6.46 dS m with irrigation water having EC of 4.0 -1 -1e
dSm . In brinjal crop, the soil EC values were 4.91, 5.77 and 7.76, respectively, with the -1e
application of good quality water, and irrigation waters with salinity levels of 6.0 and 8.0 dS m , respectively. Similar trend was observed in the contents of Na , K , Cl and SO in -1 + + - -2
4
the soil with application of irrigation water having varying levels of salinity.
Signi�cantly highest yield (2.91 t ha ) of maize kernel was obtained at irrigation level of -1
125% CPE as compared to irrigation at 50% CPE and it was statistically at par with that obtained at 100% CPE (Table 84). Highest kernel yield was obtained with good quality water which was at par with that of irrigation water having 4.0 dS m water salinity. -1
Irrigation levels also in�uenced fruit yield in brinjal and highest fruit yield was obtained with irrigation at 125% CPE (34.32 t ha ), followed by 100% CPE (33.02 t ha ). With -1 -1
increasing irrigation water salinity, there was reduction in fruit yield and lowest yield (31.41 t ha ) was obtained with irrigation water having salinity of 8.0 dS m . De�cit drip -1 -1
irrigation at 75% and 50% CPE reduced kernel yield of maize by 12.9 and 27.9 % by respectively, over irrigation at 100% CPE. However, fruit yield of brinjal was reduced by 2.2 and 4.9 % only. Irrigation with 8.0 dS m saline water resulted in reduction of maize and -1
brinjal yields by 28.5 and 8.5 % respectively, while the reductions were by 11.2 and 5.4% with 4.0 dS m saline water over that obtained with good quality water.-1
162
Assessment and coping strategies of agricultural risk under coastal region of West Bengal and Odisha– A Socio-economic analysis (Subhasis Mandal, D. Burman, U. K. Mandal and T. D. Lama)
Key objectives of the project were to identify the types, sources, estimating the magnitude of risk and quantify the impact of these farm-level risks on agricultural production and income of the farmers under coastal areas in West Bengal. To understand the impact of agricultural risks on income and income inequality, primary survey was carried out covering 120 farm households (HH) in coastal areas of West Bengal. Extent of inequality was estimated through Gini-coefficients and Lorenz curve.
Agricultural risk impact on income inequality
Farm-level agricultural risk from various sources and its impact on production, income and income inequality has been analysed from data collected through primary survey. Income loss due to these various risks were estimated and imposed in the prevailing income level to arrive at the agricultural income with the risks. Cumulative share (%) of agricultural income was estimated under both prevailing scenario as well as imposed risk scenario to understand the impact of risk on distribution of income across the different income groups (e.g., below 10%, 10-20% and so on) (Table 85). Prevailing agricultural risk reduced the net return from crops cultivated. Extent of income loss was higher by 7% as compared to 3% with respect to households belonging to below 50% and above 50% cumulative income groups, respectively, indicating lower income groups are more affected in terms of income loss due to risks. Thus, although existing risks affects all farmers groups but increased income inequality which is further evident from the estimated Gini-coefficients.
Table 84: Effect of de�cit irrigation and irrigation water salinity on yield parameters of maize
Treatments Maize Brinjal-1 -1 -1 Kernel yield (t ha ) Stover yield of Maize (t ha ) Fruit yield of Brinjal (t ha ) Aboveground vegetative
-1 biomass (t ha ) GW SW SW Mean GW SW SW Mean GW SW SW Mean GW SW SW Mean1 2 1 2 1 2 1 2
A A AI1 3.14 3.06 2.53 2.91 11.26 10.73 9.95 10.65 35.58 34.13 33.24 34.32A 2.98 2.63 2.37 2.66AB AB AI2 3.10 2.80 2.21 2.70 10.83 10.40 9.63 10.29 34.92 32.50 31.65 33.02B 2.81 2.27 2.18 2.42BC C BC AI3 3.01 2.29 1.76 2.36 10.57 9.75 8.01 9.44 33.57 31.90 31.45 32.31 2.64 2.10 2.06 2.26CD D CD AI4 2.17 2.00 1.67 1.95 9.03 8.87 7.98 8.63 33.37 31.47 29.40 31.41 2.27 1.90 1.71 1.96
a ab bc a bc c a b bc a ab bc Mean 2.86 2.54 2.04 10.42 9.94 8.89 34.36 32.50 31.43 Mean 2.67 2.23 2.08
Means with at least one letter common are not statistically signi�cant
Table 85: Share and distribution of agricultural income
Population (%) Existing scenario Under imposed risk % income Cum % income % income Cum % income
0 0 0 0 0up to 10 1.1 1.1 0.9 0.9 10-20 2.4 3.5 2.3 3.2 20-30 3.9 7.4 3.3 6.5 30-40 5.2 12.6 4.7 11.2 40-50 6.5 19.0 1.6 12.8 50-60 8.7 27.7 9.0 21.8 60-70 10.6 38.3 11.1 32.9 70-80 13.2 51.5 13.7 46.7 80-90 17.5 69.0 19.3 65.990-100 31.0 100.0 34.1 100.0
163
Recl
amat
ion
and
Man
agem
ent o
f Coa
stal
Sal
ine
Soils
Ann
ual R
epor
t 201
8-19
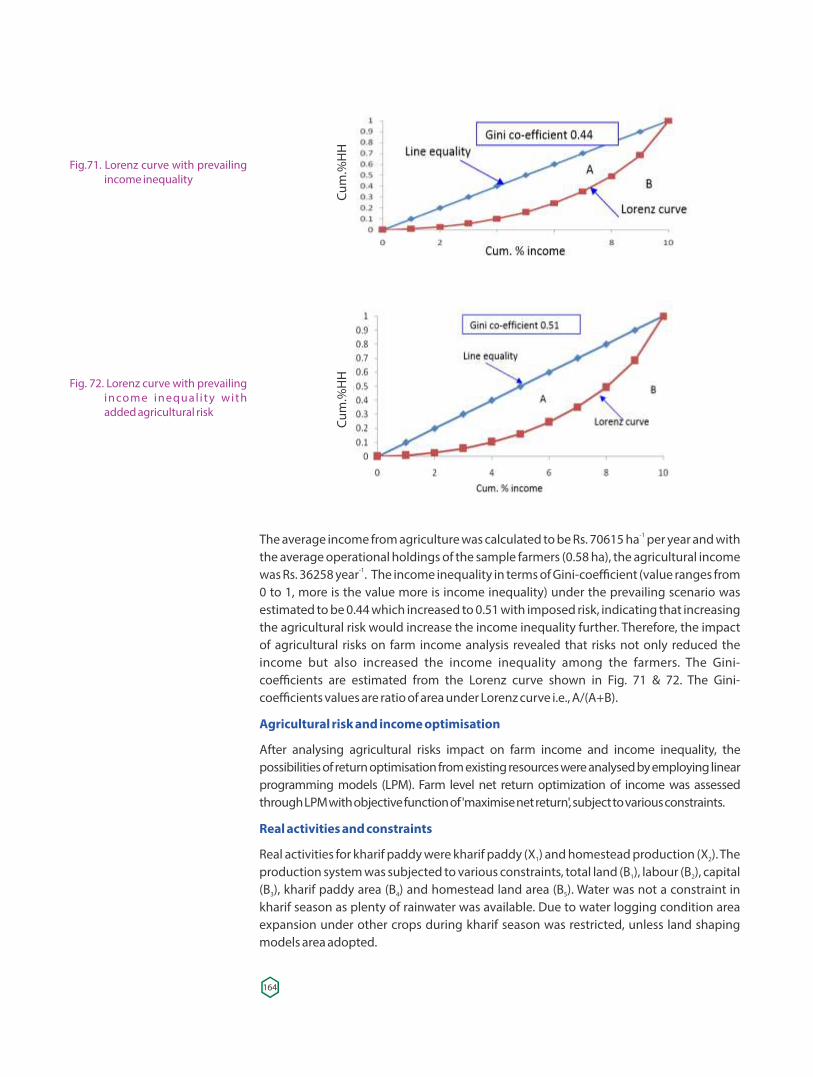
The average income from agriculture was calculated to be Rs. 70615 ha per year and with -1
the average operational holdings of the sample farmers (0.58 ha), the agricultural income was Rs. 36258 year . The income inequality in terms of Gini-coefficient (value ranges from -1
0 to 1, more is the value more is income inequality) under the prevailing scenario was estimated to be 0.44 which increased to 0.51 with imposed risk, indicating that increasing the agricultural risk would increase the income inequality further. Therefore, the impact of agricultural risks on farm income analysis revealed that risks not only reduced the income but also increased the income inequality among the farmers. The Gini-coefficients are estimated from the Lorenz curve shown in Fig. 71 & 72. The Gini-coefficients values are ratio of area under Lorenz curve i.e., A/(A+B).
Agricultural risk and income optimisation
After analysing agricultural risks impact on farm income and income inequality, the possibilities of return optimisation from existing resources were analysed by employing linear programming models (LPM). Farm level net return optimization of income was assessed through LPM with objective function of 'maximise net return', subject to various constraints.
Real activities and constraints
Real activities for kharif paddy were kharif paddy (X ) and homestead production (X ). The 1 2
production system was subjected to various constraints, total land (B ), labour (B ), capital 1 2
(B ), kharif paddy area (B ) and homestead land area (B ). Water was not a constraint in 3 4 5
kharif season as plenty of rainwater was available. Due to water logging condition area expansion under other crops during kharif season was restricted, unless land shaping models area adopted.
Fig.71. Lorenz curve with prevailing income inequality
Fig. 72. Lorenz curve with prevailing income inequal i t y with added agricultural risk
164
Cum
.%H
HCu
m.%
HH

Real activities for rabi season were, rabi paddy (X ), homestead production (X2), mixed 1
crop (X ), tomato (X ), potato (X ) and other crops like pulses (X ). Various constraints were 3 4 5 6
land (B ), labour (B ), capital (B ), water availability (B ), area under rabi paddy (B ), area 1 2 3 4 5
under homestead (B ), area under mixed crop (B ), area under tomato (B ), area under 6 7 8
potato (B ) and area under other crops/pulses (B ). 9 10
The analysis revealed that re-allocation of resources can increase the net income by -1around 38% (from Rs. 46995 to Rs. 64895 ha per year) during rabi season which is
otherwise restricted by the agricultural risks in the study area (Table 86). The increase in the net return would be possible by re-allocation of area under rabi paddy (37.5%) to other crops like area under homestead farming, growing tomato/cucurbits and pulses. However, the possibility of re-allocation of crop area under kharif season was restricted primarily due to existing prolonged waterlogged conditions in the study area. Unless the land con�gurations are changed (such as land shaping), the scope for increasing the net return from crops cultivated during kharif season area limited (assuming no varietal change) as changing cropping pattern was restricted.
Economics of land modi�cation models under waterlogged sodic soils of Uttar Pradesh (Subhasis Mandal, V. K. Mishra and C. L. Verma)
Sharda Sahayak Canal provides irrigation to 17.80 lakh ha of arable area in 16 districts of Uttar Pradesh. Currently, about 0.35 million ha sodic lands are affected by shallow water table conditions in Sharda Sahayak Canal Command area and are not suitable for cultivation economically, even after conventional method of gypsum based reclamation efforts. This has led to diminishing land-water productivity and loss of livelihoods for the farm families in this command. Harvesting and management of canal seepage water through modi�cation of land, an initiative by ICAR-CSSRI, RRS Lucknow, is viewed as one of the solutions to grow multiple crop on such land which otherwise remain unproductive. This study was conducted to assess the impact of land modi�cation models on livelihood security of farmers in waterlogged sodic soils of Raebareli and Lucknow districts, Uttar Pradesh in Sharda Sahayak Canal command.
Table 86: Income optimisation under prevailing agricultural risk
Enterprise Allocation under Optimum Difference (allocation prevailing agri risk (%) allocation (%) /return forgone)Kharif season Kharif paddy 81.5 81.5 0Homestead 18.5 18.5 0Total 100 100
-1Net return (Rs avg. area ) 13700 13700 0-1Net return (Rs ha ) 23620 23620 0
Rabi season Rabi paddy 37.5 0.0 -37.5Homestead 15.6 16.7 1.0Mixed crops 22.9 22.9 0.0Tomato/cucurbits 2.1 37.5 35.4Potato 6.3 6.3 0.0Pulses/others 15.6 16.7 1.0Total 100 100
-1Net return (Rs avg. area ) 22558 31150 8592-1Net return (kharif+rabi) (Rs ha ) 46995 64896 17901
Net returns includes income from major crops cultivated
165
Recl
amat
ion
and
Man
agem
ent o
f Coa
stal
Sal
ine
Soils
Ann
ual R
epor
t 201
8-19
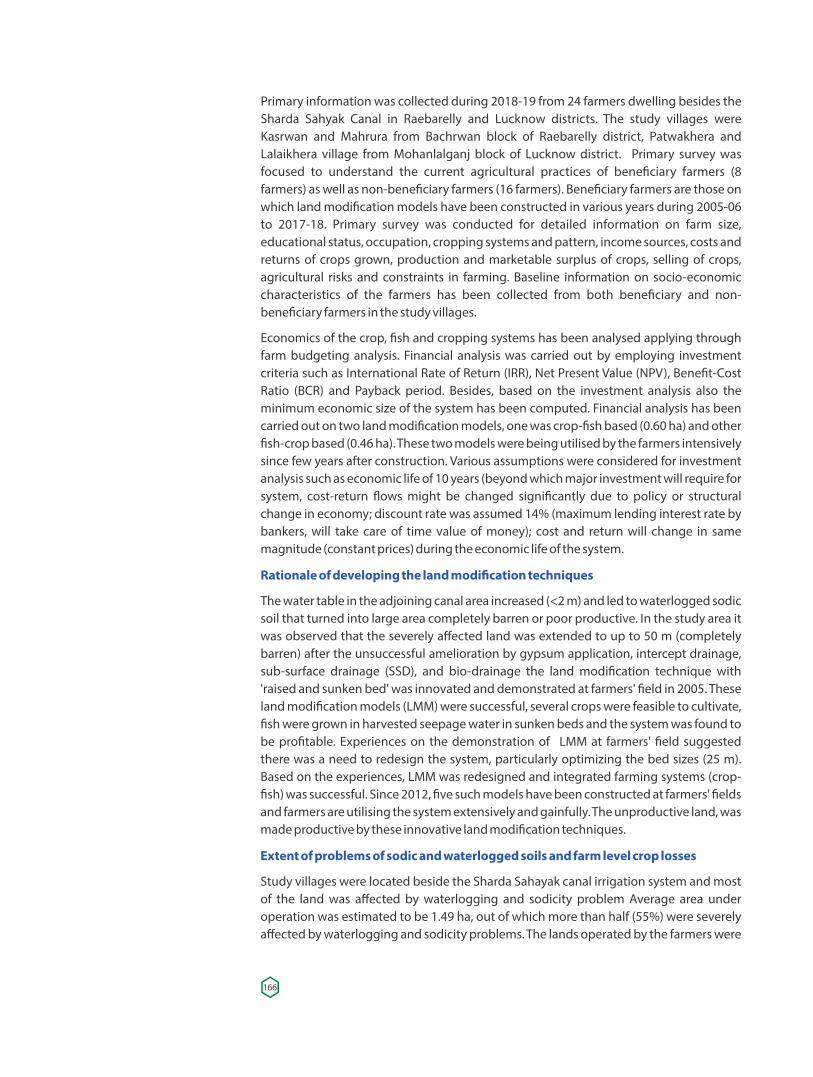
Primary information was collected during 2018-19 from 24 farmers dwelling besides the Sharda Sahyak Canal in Raebarelly and Lucknow districts. The study villages were Kasrwan and Mahrura from Bachrwan block of Raebarelly district, Patwakhera and Lalaikhera village from Mohanlalganj block of Lucknow district. Primary survey was focused to understand the current agricultural practices of bene�ciary farmers (8 farmers) as well as non-bene�ciary farmers (16 farmers). Bene�ciary farmers are those on which land modi�cation models have been constructed in various years during 2005-06 to 2017-18. Primary survey was conducted for detailed information on farm size, educational status, occupation, cropping systems and pattern, income sources, costs and returns of crops grown, production and marketable surplus of crops, selling of crops, agricultural risks and constraints in farming. Baseline information on socio-economic characteristics of the farmers has been collected from both bene�ciary and non-bene�ciary farmers in the study villages.
Economics of the crop, �sh and cropping systems has been analysed applying through farm budgeting analysis. Financial analysis was carried out by employing investment criteria such as International Rate of Return (IRR), Net Present Value (NPV), Bene�t-Cost Ratio (BCR) and Payback period. Besides, based on the investment analysis also the minimum economic size of the system has been computed. Financial analysis has been carried out on two land modi�cation models, one was crop-�sh based (0.60 ha) and other �sh-crop based (0.46 ha). These two models were being utilised by the farmers intensively since few years after construction. Various assumptions were considered for investment analysis such as economic life of 10 years (beyond which major investment will require for system, cost-return �ows might be changed signi�cantly due to policy or structural change in economy; discount rate was assumed 14% (maximum lending interest rate by bankers, will take care of time value of money); cost and return will change in same magnitude (constant prices) during the economic life of the system.
Rationale of developing the land modi�cation techniques
The water table in the adjoining canal area increased (<2 m) and led to waterlogged sodic soil that turned into large area completely barren or poor productive. In the study area it was observed that the severely affected land was extended to up to 50 m (completely barren) after the unsuccessful amelioration by gypsum application, intercept drainage, sub-surface drainage (SSD), and bio-drainage the land modi�cation technique with 'raised and sunken bed' was innovated and demonstrated at farmers' �eld in 2005. These land modi�cation models (LMM) were successful, several crops were feasible to cultivate, �sh were grown in harvested seepage water in sunken beds and the system was found to be pro�table. Experiences on the demonstration of LMM at farmers' �eld suggested there was a need to redesign the system, particularly optimizing the bed sizes (25 m). Based on the experiences, LMM was redesigned and integrated farming systems (crop-�sh) was successful. Since 2012, �ve such models have been constructed at farmers' �elds and farmers are utilising the system extensively and gainfully. The unproductive land, was made productive by these innovative land modi�cation techniques.
Extent of problems of sodic and waterlogged soils and farm level crop losses
Study villages were located beside the Sharda Sahayak canal irrigation system and most of the land was affected by waterlogging and sodicity problem Average area under operation was estimated to be 1.49 ha, out of which more than half (55%) were severely affected by waterlogging and sodicity problems. The lands operated by the farmers were
166
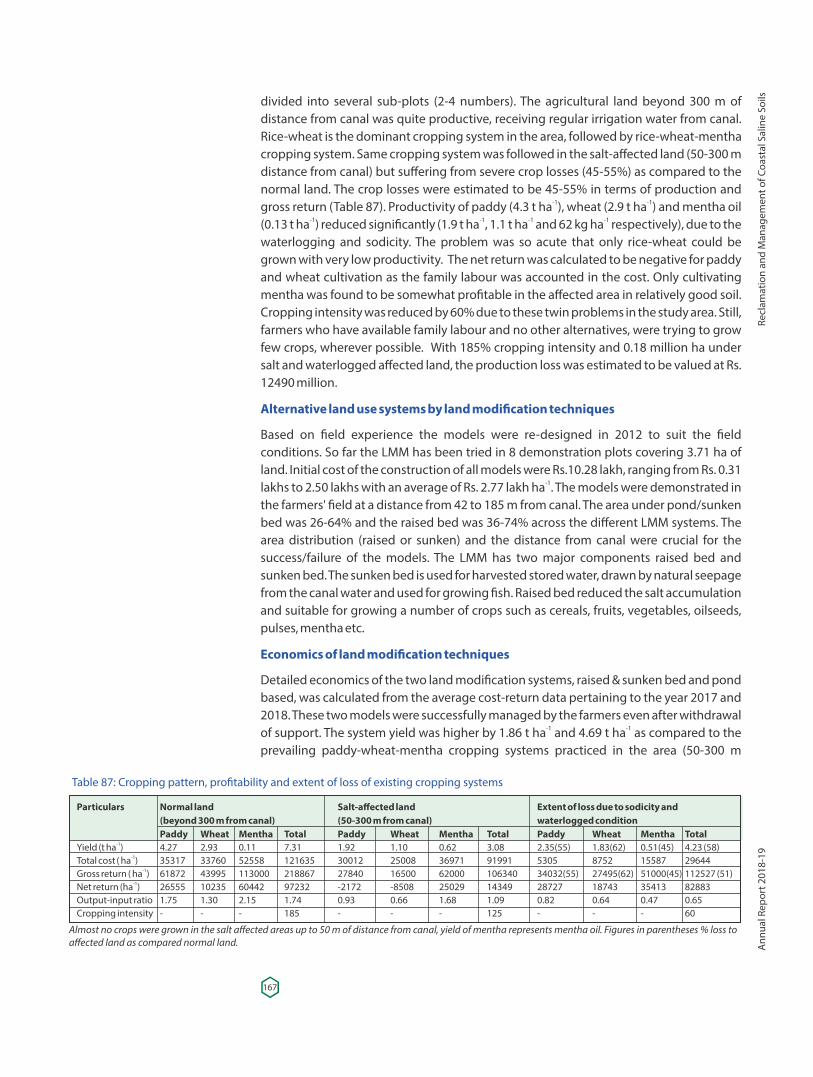
divided into several sub-plots (2-4 numbers). The agricultural land beyond 300 m of distance from canal was quite productive, receiving regular irrigation water from canal. Rice-wheat is the dominant cropping system in the area, followed by rice-wheat-mentha cropping system. Same cropping system was followed in the salt-affected land (50-300 m distance from canal) but suffering from severe crop losses (45-55%) as compared to the normal land. The crop losses were estimated to be 45-55% in terms of production and
-1 -1gross return (Table 87). Productivity of paddy (4.3 t ha ), wheat (2.9 t ha ) and mentha oil -1 -1 -1 -1(0.13 t ha ) reduced signi�cantly (1.9 t ha , 1.1 t ha and 62 kg ha respectively), due to the
waterlogging and sodicity. The problem was so acute that only rice-wheat could be grown with very low productivity. The net return was calculated to be negative for paddy and wheat cultivation as the family labour was accounted in the cost. Only cultivating mentha was found to be somewhat pro�table in the affected area in relatively good soil. Cropping intensity was reduced by 60% due to these twin problems in the study area. Still, farmers who have available family labour and no other alternatives, were trying to grow few crops, wherever possible. With 185% cropping intensity and 0.18 million ha under salt and waterlogged affected land, the production loss was estimated to be valued at Rs. 12490 million.
Alternative land use systems by land modi�cation techniques
Based on �eld experience the models were re-designed in 2012 to suit the �eld conditions. So far the LMM has been tried in 8 demonstration plots covering 3.71 ha of land. Initial cost of the construction of all models were Rs.10.28 lakh, ranging from Rs. 0.31
-1lakhs to 2.50 lakhs with an average of Rs. 2.77 lakh ha . The models were demonstrated in the farmers' �eld at a distance from 42 to 185 m from canal. The area under pond/sunken bed was 26-64% and the raised bed was 36-74% across the different LMM systems. The area distribution (raised or sunken) and the distance from canal were crucial for the success/failure of the models. The LMM has two major components raised bed and sunken bed. The sunken bed is used for harvested stored water, drawn by natural seepage from the canal water and used for growing �sh. Raised bed reduced the salt accumulation and suitable for growing a number of crops such as cereals, fruits, vegetables, oilseeds, pulses, mentha etc.
Economics of land modi�cation techniques
Detailed economics of the two land modi�cation systems, raised & sunken bed and pond based, was calculated from the average cost-return data pertaining to the year 2017 and 2018. These two models were successfully managed by the farmers even after withdrawal
-1 -1of support. The system yield was higher by 1.86 t ha and 4.69 t ha as compared to the prevailing paddy-wheat-mentha cropping systems practiced in the area (50-300 m
Table 87: Cropping pattern, pro�tability and extent of loss of existing cropping systems
Particulars Normal land Salt-affected land Extent of loss due to sodicity and (beyond 300 m from canal) (50-300 m from canal) waterlogged condition Paddy Wheat Mentha Total Paddy Wheat Mentha Total Paddy Wheat Mentha Total
-1Yield (t ha ) 4.27 2.93 0.11 7.31 1.92 1.10 0.62 3.08 2.35(55) 1.83(62) 0.51(45) 4.23 (58)-1Total cost ( ha ) 35317 33760 52558 121635 30012 25008 36971 91991 5305 8752 15587 29644
-1Gross return ( ha ) 61872 43995 113000 218867 27840 16500 62000 106340 34032(55) 27495(62) 51000(45) 112527 (51)-1Net return (ha ) 26555 10235 60442 97232 -2172 -8508 25029 14349 28727 18743 35413 82883
Output-input ratio 1.75 1.30 2.15 1.74 0.93 0.66 1.68 1.09 0.82 0.64 0.47 0.65Cropping intensity - - - 185 - - - 125 - - - 60
Almost no crops were grown in the salt affected areas up to 50 m of distance from canal, yield of mentha represents mentha oil. Figures in parentheses % loss to affected land as compared normal land.
167
Recl
amat
ion
and
Man
agem
ent o
f Coa
stal
Sal
ine
Soils
Ann
ual R
epor
t 201
8-19
distance from canal) (Table 88). Vegetable-vegetable-�sh and �sh-vegetable based -1integrated cropping system provided incremental net return of Rs. 1.30 lakh ha
-1(contribution of �sh was 45%) and Rs.3.14 lakh ha (contribution of �sh was 84%), respectively, over the paddy-wheat-mentha cropping system. Overall the output-input ratio increased from 1.09 to 2.18 (vegetable-�sh based) and 1.45 (�sh-vegetable based) in the evolved cropping systems under the models. Overall the cropping intensity of the system increased to 300% and 220% as compared to 125% in the existing cropping system. The rental income of the land modi�cation models could be increased to
-1 -1Rs.35000 ha (without cost sharing) from Rs. 10000-12000 ha .
Financial viability of the land modi�cation system
Economics of the evolved land modi�cation models were found to be favourable with consideration of the operational & maintenance cost (O&M cost) and gross return from the system. However, such models needed large amount of initial investment for excavation of land and followed by expenditures on O&M for the system over the subsequent years (economic life). For this analysis, the time value of money needs to be considered, therefore �nancial feasibility of the investment on such systems were computed in terms IRR, BCR, NPV, Payback period and economic size of the system. Economic life of 10 years was assumed for the analysis because beyond which major investment will require for the system, cost-return �ows might be changed signi�cantly due to policy or structural change in the economy. Discount rate was assumed 14% (maximum lending interest rate by bankers,); cost and return will change in same magnitude during the economic life of the system. Financial feasibility analysis was carried out assuming two alternative scenarios, �rst second, without any opportunity cost (completely barren) and , with opportunity cost (net return from paddy-wheat mentha was considered as the opportunity cost). The land modi�cation models can be constructed in these two kinds of land beside canal and such models are not recommended for the farmers operating normal land, which are otherwise quite productive.
The �nancial feasibility analysis was carried out on the two most successful models (currently under operation with active farmers engagement and fully managed by the farmers themselves) based on the actual area, 0.60 ha (crop-�sh based) and 0.46 ha (�sh-crop based). Financial feasibility analysis indicated both the models were quite attractive in terms of future investment with positive IRR (37% & 56%) and NPV (Rs. 249741 & Rs. 368752), BCR (1.37 & 1.22). The initial investment was quickly returned by pond based
Table 88: Incremental cost-return of the land modi�cation models (2018-19 prices) (per ha)
Particulars Salt-affected land Enterprises under Land Incremental cost/return (50-300 m) Modi�cation Paddy-Wheat-Mentha Vegt-Veg-Fish Fish-vegt. based* Vegt based Fish-vegt. based*
-1System Yield (t ha ) 3.08 4.94 7.78 1.86 4.69-1Total cost (Rs ha ) 91991 122512 731326 30521 639335
-1Gross return (Rs ha ) 106340 267372 1060115 161032 953775-1Net return (Rs ha ) 14349 144860 328789 130511 314440
Output-input ratio 1.09 2.18 1.45 1.09 0.36Cropping intensity 125 >300 >220 175 95
-1Rental income (Rs ha ) 10000-12000 35000 35000 25000 25000without cost sharing
*Contribution of �sh 84%.
168
(�sh-crop) system (1.75 years) as compared to crop-�sh based system (2.6 years). The pond based system was seen to be using the system very extensively (high cost and high return) with high density of �sh rearing, whereas crop-�sh (vegetables-�sh mainly) was utilised more extensively for growing crops, All the �nancial analysis criteria were also found to be favourable for investment on such models when the opportunity cost of the land was included. The minimum economic size of the models was found 1.00 ha and 0.55 ha for the crop-�sh based and �sh-crop based models, respectively. For resource rich farmers, pond based system and for other farmers crop-�sh based models can be proposed.
Opportunity cost is net return from prevailing rice-wheat-mentha cropping system for average area of 0.75 ha (Rs. 14722) and 0.60 ha (Rs. 9029). No opportunity cost indicates no return from 'next best alternative' option ie., land become unsuitable for any growing any crops. Such is prevailing near to the canal (within 50m of distance).
Perception of farmers and technology developers on land modi�cation techniques
A socio-economic study carried out to �nd out the perception of farmers as well as technology developers (Scientists and technical personnel) on effectiveness/ adoptability of such models. Farmers perceived the models are feasible and pro�table for growing a number of crops with simultaneous improvement in land quality and pro�tability. As water was available from the canal throughout the year, number of crops and �sh were grown continuously in the system. It provided the regular income and gainful employment of the farmers throughout the year. However, major constraints are high initial investment and highly labour intensive. Farmers having adequate family labour can manage the systems. Besides, �sh rearing is a taboo for some farmers, making the system utilised. This might be the reason as why few farmers who managed the systems very effectively in early years are now keeping the system somewhat uncared. Also high fragmentation of land could be major issue to the development of such models in many other farmers' �elds.
Scientists perceived that the models are problem solving and techno-economically sustainable. The land quality improved, good quality irrigation water was made available water quality remained good even after �ve years of establishment and intensive use of the systems, providing regular income and employment to the farm families and such models can be constructed in many other �elds. However, high initial investment and need for continuous cultivation (keeping fallow may lead to salt accumulation again) might be major issue for its large scale adoption. Also few questions like, what will happen to the water availability to a model if another model is constructed in between canal and the LMM system, how many such models can be constructed in the area or what if canal water �ow becomes critically low are remains to be unanswered. Some experts felt this can be a short term solution as there might be salt accumulation again after some years. This calls for need of further research on the designing of the system particularly to �nd the optimum number of systems to be constructed, ideal distance from the canal considering the seepage rate or soil structure and salt-water dynamics for long term sustainability of the systems.
Conclusion and options
The innovative land modi�cation models can be considered a solution to existing problems which is techno-economically sustainable but challenged by socio-economic constraints. There is a need for �nancial support for the initial investment to be made. Government schemes might be initiated from �nancial support for promotion of this
169
Recl
amat
ion
and
Man
agem
ent o
f Coa
stal
Sal
ine
Soils
Ann
ual R
epor
t 201
8-19
model or can be linked with existing schemes like NABARD which has already available scheme for �nancing on pond excavation in the state. Some farmers are having affected land but are not interested in such models as they are engaged in other alternative livelihoods like small business or as industrial worker. But some farmers engaged full time in farming and dwelling in the villages are interested to manage the system on lease after construction. Promoting multi-functionality approach (agriculture plus other services like tourism) in agriculture can be another opportunity to disseminate the systems in the study area. As the location is near the Lucknow city, promotion of agro-tourism with these models might be a good option. Agro-tourism entrepreneurship development based on this land modi�cation system may attract the investment from investors and promotion of the systems.
NICRA: Climate change mitigation and adaptation strategies for salt affected soils with the objective of Management of sea water intrusion due to climate variability in coastal regions (U.K. Mandal, K.K. Mahanta and S. Raut; PI: A.K. Bhardwaj)
The present study assessed climate change vulnerability in agricultural sector of Indian Sundarbans region. Vulnerability indices were estimated using spatially aggregated biophysical and socio-economic parameters by applying equal weight method. Village is the primary management unit in which �nancial resources are allocated and strategic decisions made. There are 1074 villages in the islands ecosystem under 191 Gram Panchayats. We selected the indicators for each category of exposure, sensitivity and adaptive capacity (Table 89). Exposure is represented as changes in the long-term climatic conditions and the projected changes in the climate variables which can impact the agrarian ecosystem. For the present analysis, we extracted spatially interpolated long period (1970-2000) climate data from 'WorldClim' database (http://www.worldclim.org). The data was prepared for global climate surfaces on monthly precipitation, minimum, mean and maximum temperature. We used HadGEM2 AO model output by the year 2050 under representative concentration pathways (RCP) 8.5. The cropping (mono and double cropped) area was extracted by landsat data. We aggregated agricultural, socio-economic as well as population data from Census 2011. Data were normalized during their integration into aggregate vulnerability index within a dimensionless range 0-1 based on directly and inversely related indicators to component of vulnerability. We
Exposure Sensitivity Adaptive capability
Fig. 73. Village level exposure, sensitivity and adaptive c a p a b i l i t y i n I n d i a n Sundarbans
170
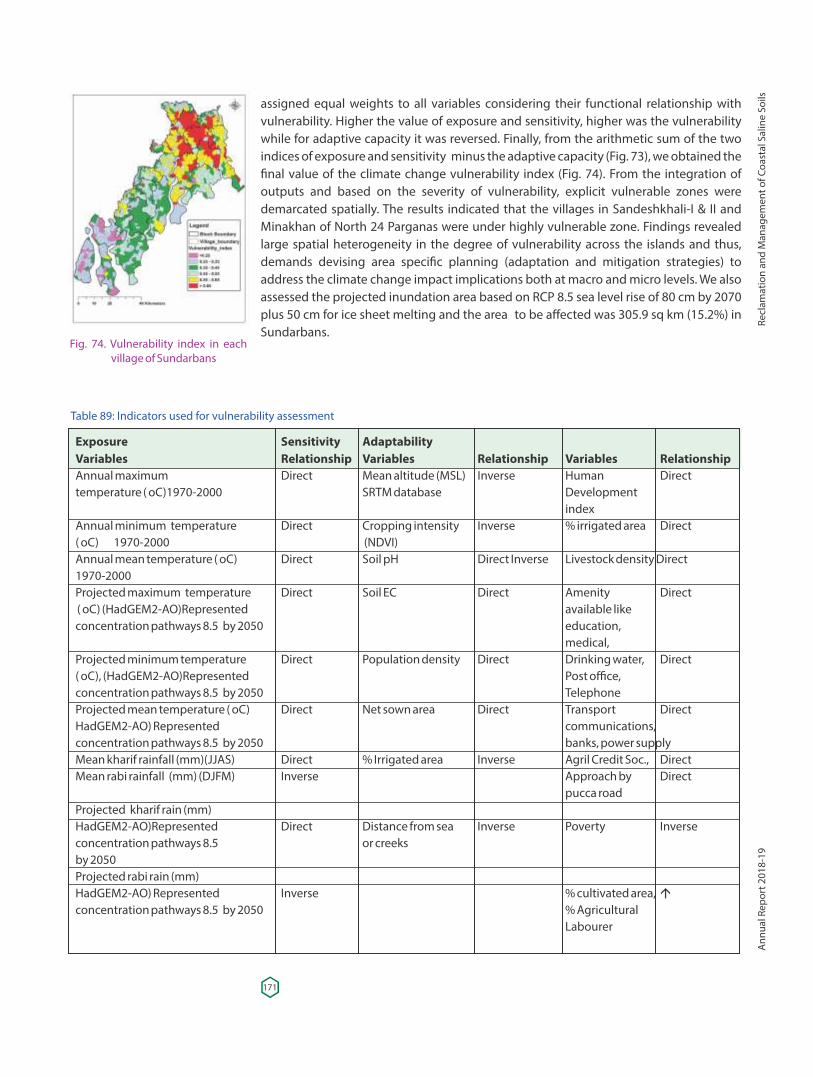
Table 89: Indicators used for vulnerability assessment
Exposure Sensitivity AdaptabilityVariables Relationship Variables Relationship Variables RelationshipAnnual maximum Direct Mean altitude (MSL) Inverse Human Directtemperature ( oC)1970-2000 SRTM database Development index Annual minimum temperature Direct Cropping intensity Inverse % irrigated area Direct( oC) 1970-2000 (NDVI)Annual mean temperature ( oC) Direct Soil pH Direct Inverse Livestock density Direct1970-2000 Projected maximum temperature Direct Soil EC Direct Amenity Direct ( oC) (HadGEM2-AO)Represented available like concentration pathways 8.5 by 2050 education, medical, Projected minimum temperature Direct Population density Direct Drinking water, Direct( oC), (HadGEM2-AO)Represented Post office, concentration pathways 8.5 by 2050 Telephone Projected mean temperature ( oC) Direct Net sown area Direct Transport DirectHadGEM2-AO) Represented communications,concentration pathways 8.5 by 2050 banks, power supply Mean kharif rainfall (mm)(JJAS) Direct % Irrigated area Inverse Agril Credit Soc., DirectMean rabi rainfall (mm) (DJFM) Inverse Approach by Direct pucca roadProjected kharif rain (mm)HadGEM2-AO)Represented Direct Distance from sea Inverse Poverty Inverseconcentration pathways 8.5 or creeks by 2050 Projected rabi rain (mm)HadGEM2-AO) Represented Inverse % cultivated area, á concentration pathways 8.5 by 2050 % Agricultural Labourer
assigned equal weights to all variables considering their functional relationship with vulnerability. Higher the value of exposure and sensitivity, higher was the vulnerability while for adaptive capacity it was reversed. Finally, from the arithmetic sum of the two indices of exposure and sensitivity minus the adaptive capacity (Fig. 73), we obtained the �nal value of the climate change vulnerability index (Fig. 74). From the integration of outputs and based on the severity of vulnerability, explicit vulnerable zones were demarcated spatially. The results indicated that the villages in Sandeshkhali-I & II and Minakhan of North 24 Parganas were under highly vulnerable zone. Findings revealed large spatial heterogeneity in the degree of vulnerability across the islands and thus, demands devising area speci�c planning (adaptation and mitigation strategies) to address the climate change impact implications both at macro and micro levels. We also assessed the projected inundation area based on RCP 8.5 sea level rise of 80 cm by 2070 plus 50 cm for ice sheet melting and the area to be affected was 305.9 sq km (15.2%) in Sundarbans.
Fig. 74. Vulnerability index in each village of Sundarbans
171
Recl
amat
ion
and
Man
agem
ent o
f Coa
stal
Sal
ine
Soils
Ann
ual R
epor
t 201
8-19
Stress-yolerant rice for Africa and South Asia (STRASA - Phase 3) stress tolerant rice for coastal soil (D. Burman, S. K. Sarangi and S. Mandal)
Salinity Tolerant Breeding Network (STBN) trial was conducted at the experimental farm of ICAR-CSSRI, RRS canning Town during kharif season in 2018 under Bill and Melinda Gates Foundation (BMGF) funded project. The soils of the experimental site have Hyperthermic temperature and Aquic moisture regimes. The soil is heavy in texture (silty
-clay) and normal in soil reaction. Soil salinity during dry moths is very high (EC , 9-12 dS me1 -1). However, it varied from 3.11 to 6.72 dS m during Kharif season. The experiment consisted of 82 rice genotypes including 6 check varieties (CSR 10, CSR 27, CSR 36, CST7-1, PUSA44 and NSICRC222) and 1 local check variety (Amal-Mana).
Days to 50 % �owering of the entries in the trial ranged from 68 days (RAU1525-1-2) to 109 days (CR3903-161-1-3-2) with a mean of 94 days. Plant height of the entries varied from 64.6 cm (CSR10 (Check)) to 139.6cm (Amal-Mana (Local Check)) with a mean height of 94.2 cm. Number of tillers per plant of the entries ranged from 9 [Pusa 44 (Check)] to 14 (CSR2016-IR18-9) with a mean value of 11. Number of productive tillers varied from 8 (CSR2016-IR18-5) to 14 (CSR2016-IR18-9) with a mean value of 10. Panicle length of the different entries under trial ranged from 14.6 cm (CSRRIL-01-IR165) to 25.4 cm (RAU1397-18-3-7-9-4-7) with a mean of 20.0 cm. Number of �lled grains per panicle varied from 38 (CSAR1604) to 97 [Amal-Mana (Local Check)] with a mean value of 55. Spikelet fertility of the entries under trial ranged from 60.5 % (CSAR17135) to 86.6 % [Amal-Mana (Local Check)] with a mean of 72.8% . In the trial, 1000 grain weight of the entries varies from 18.7 g (RP5706-120-7-2-2) to 35.2 g (CSR2016-IR18-3) with a mean weight of 28.2 g. At reproductive stage, stress score varied from 1 [CSR2016-IR18-15, CSR2016-IR18-17, CSR2016-IR18-1, CSR2016-IR18-2, CSR2016-IR18-3, CSRRIL-01-IR75, CSRRIL-01-IR165, CSR2016-IR18-11, CSR2016-IR18-14, CR3878-245-2-4-1, IR83421-6-B-3-1-1/CR3364-S-2B-14-2B, PAU3835-36-6-3-3-4, CSAR1620, CARI Dhan 6, JK-58, JK-238, NDRK 11-27, CR2851-S-1-6-2B-4-1, RAU1525-1-2, PAU5564-18-1-2, IRLON-GSR5, CSR10 (Check), CST7-1 (Check), Pusa 44 (Check), Amal-Mana (Local Check)] to 5 (CR3881-4-1-3-7-2-3) with a
-1 mean value of 2. Grain yield of the entries varies from 1.22 to 4.77 t ha with mean yield of -1 3.64 t ha . Out of all the entries higher grain yield was recorded with CARI Dhan 6 (4.61 t
-1 -1 -1 -1ha ), IRLON-GSR5 (4.61 t ha ), KR15075 (4.65 t ha ), CSR2016-IR18-15 (4.67 t ha ) and -1Amal-Mana (Local Check) (4.77 t ha ).
ACIAR Project: Cropping systems intensi�cation in the salt affected coastal zones of Bangladesh and West Bengal, India (Sukanta K. Sarangi, D. Burman, U. K. Mandal, S. Mandal and K.K. Mahanta)
This project is funded by Australian Centre for International Agricultural Research (ACIAR) was implemented both during wet (kharif) and dry (boro) seasons in the farmers' �elds (on-farm) during the reported period. The project is implemented both in India and Bangladesh. In India the project partners are ICAR-CSSRI, RRS, Canning Town, Bidhan Chandra Krishi Viswavidyalaya (BCKV), Mohanpur, Nadia and Tagore Society for Rural Development (TSRD), Rangabelia. Project partners in Bangladesh are Bangladesh Agricultural Research Institute (BARI), Bangladesh Rice Research Institute (BRRI), Institute of Water Modelling (IWM) and Khulna University (KU). Project partners from Australia are Commonwealth Scienti�c and Industrial Research Organization (CSIRO) and Murdoch University (MU). CSSRI, RRS, Canning Town is implementing the project at the Sonagaon village in the Gosaba island of South 24 Parganas district.
172
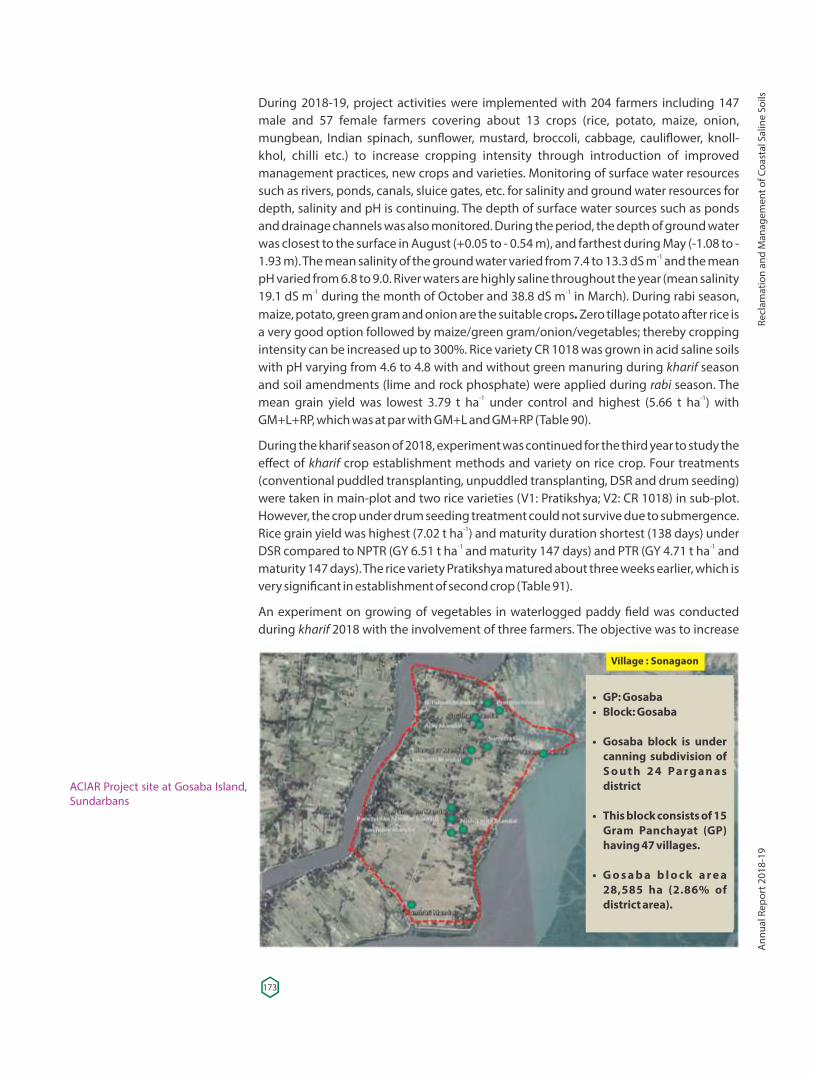
During 2018-19, project activities were implemented with 204 farmers including 147 male and 57 female farmers covering about 13 crops (rice, potato, maize, onion, mungbean, Indian spinach, sun�ower, mustard, broccoli, cabbage, cauli�ower, knoll-khol, chilli etc.) to increase cropping intensity through introduction of improved management practices, new crops and varieties. Monitoring of surface water resources such as rivers, ponds, canals, sluice gates, etc. for salinity and ground water resources for depth, salinity and pH is continuing. The depth of surface water sources such as ponds and drainage channels was also monitored. During the period, the depth of ground water was closest to the surface in August (+0.05 to - 0.54 m), and farthest during May (-1.08 to -
-11.93 m). The mean salinity of the ground water varied from 7.4 to 13.3 dS m and the mean pH varied from 6.8 to 9.0. River waters are highly saline throughout the year (mean salinity
-1 -119.1 dS m during the month of October and 38.8 dS m in March). During rabi season, maize, potato, green gram and onion are the suitable crops. Zero tillage potato after rice is a very good option followed by maize/green gram/onion/vegetables; thereby cropping intensity can be increased up to 300%. Rice variety CR 1018 was grown in acid saline soils with pH varying from 4.6 to 4.8 with and without green manuring during kharif season and soil amendments (lime and rock phosphate) were applied during rabi season. The
-1 -1mean grain yield was lowest 3.79 t ha under control and highest (5.66 t ha ) with GM+L+RP, which was at par with GM+L and GM+RP (Table 90).
During the kharif season of 2018, experiment was continued for the third year to study the effect of kharif crop establishment methods and variety on rice crop. Four treatments (conventional puddled transplanting, unpuddled transplanting, DSR and drum seeding) were taken in main-plot and two rice varieties (V1: Pratikshya; V2: CR 1018) in sub-plot. However, the crop under drum seeding treatment could not survive due to submergence.
-1Rice grain yield was highest (7.02 t ha ) and maturity duration shortest (138 days) under -1 -1DSR compared to NPTR (GY 6.51 t ha and maturity 147 days) and PTR (GY 4.71 t ha and
maturity 147 days). The rice variety Pratikshya matured about three weeks earlier, which is very signi�cant in establishment of second crop (Table 91).
An experiment on growing of vegetables in waterlogged paddy �eld was conducted during kharif 2018 with the involvement of three farmers. The objective was to increase
ACIAR Project site at Gosaba Island, Sundarbans
Village : Sonagaon
• GP: Gosaba• Block: Gosaba
• Gosaba block is under canning subdivision of S o u t h 2 4 Pa r g a n a s district
• This block consists of 15 Gram Panchayat (GP) having 47 villages.
• G o s a b a b l o c k a r e a 28,585 ha (2.86% of district area).
173
Recl
amat
ion
and
Man
agem
ent o
f Coa
stal
Sal
ine
Soils
Ann
ual R
epor
t 201
8-19
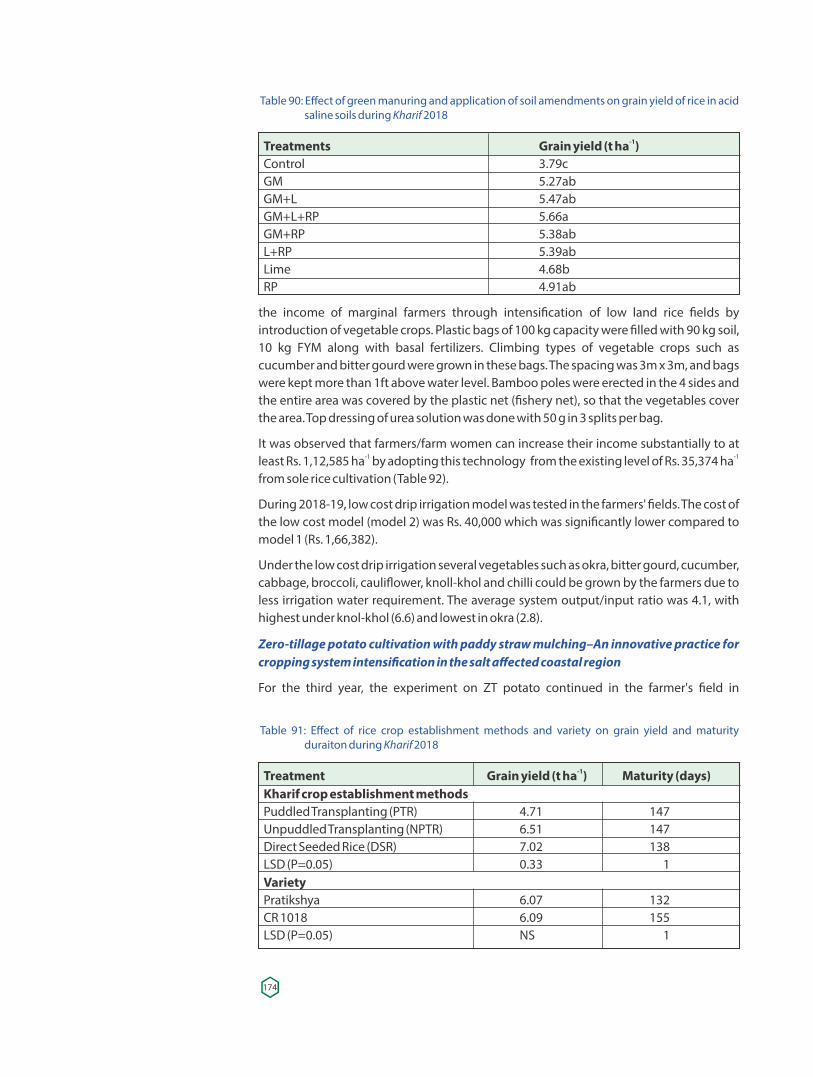
the income of marginal farmers through intensi�cation of low land rice �elds by introduction of vegetable crops. Plastic bags of 100 kg capacity were �lled with 90 kg soil, 10 kg FYM along with basal fertilizers. Climbing types of vegetable crops such as cucumber and bitter gourd were grown in these bags. The spacing was 3m x 3m, and bags were kept more than 1ft above water level. Bamboo poles were erected in the 4 sides and the entire area was covered by the plastic net (�shery net), so that the vegetables cover the area. Top dressing of urea solution was done with 50 g in 3 splits per bag.
It was observed that farmers/farm women can increase their income substantially to at -1 -1least Rs. 1,12,585 ha by adopting this technology from the existing level of Rs. 35,374 ha
from sole rice cultivation (Table 92).
During 2018-19, low cost drip irrigation model was tested in the farmers' �elds. The cost of the low cost model (model 2) was Rs. 40,000 which was signi�cantly lower compared to model 1 (Rs. 1,66,382).
Under the low cost drip irrigation several vegetables such as okra, bitter gourd, cucumber, cabbage, broccoli, cauli�ower, knoll-khol and chilli could be grown by the farmers due to less irrigation water requirement. The average system output/input ratio was 4.1, with highest under knol-khol (6.6) and lowest in okra (2.8).
Zero-tillage potato cultivation with paddy straw mulching–An innovative practice for cropping system intensi�cation in the salt affected coastal region
For the third year, the experiment on ZT potato continued in the farmer's �eld in
Table 90: Effect of green manuring and application of soil amendments on grain yield of rice in acid saline soils during Kharif 2018
-1Treatments Grain yield (t ha )Control 3.79cGM 5.27abGM+L 5.47abGM+L+RP 5.66aGM+RP 5.38abL+RP 5.39abLime 4.68bRP 4.91ab
Table 91: Effect of rice crop establishment methods and variety on grain yield and maturity duraiton during Kharif 2018
-1Treatment Grain yield (t ha ) Maturity (days)Kharif crop establishment methodsPuddled Transplanting (PTR) 4.71 147Unpuddled Transplanting (NPTR) 6.51 147Direct Seeded Rice (DSR) 7.02 138LSD (P=0.05) 0.33 1Variety Pratikshya 6.07 132CR 1018 6.09 155LSD (P=0.05) NS 1
174
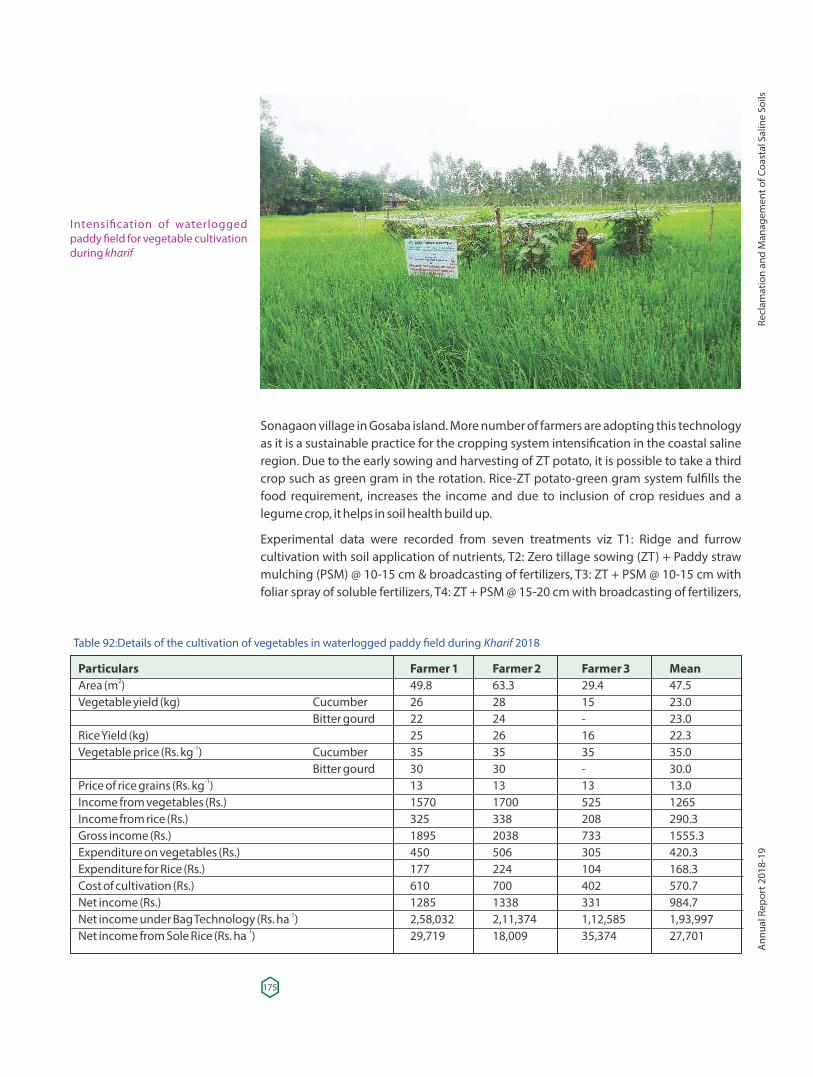
Sonagaon village in Gosaba island. More number of farmers are adopting this technology as it is a sustainable practice for the cropping system intensi�cation in the coastal saline region. Due to the early sowing and harvesting of ZT potato, it is possible to take a third crop such as green gram in the rotation. Rice-ZT potato-green gram system ful�lls the food requirement, increases the income and due to inclusion of crop residues and a legume crop, it helps in soil health build up.
Experimental data were recorded from seven treatments viz T1: Ridge and furrow cultivation with soil application of nutrients, T2: Zero tillage sowing (ZT) + Paddy straw mulching (PSM) @ 10-15 cm & broadcasting of fertilizers, T3: ZT + PSM @ 10-15 cm with foliar spray of soluble fertilizers, T4: ZT + PSM @ 15-20 cm with broadcasting of fertilizers,
Intensi�cation of waterlogged paddy �eld for vegetable cultivation during kharif
Table 92:Details of the cultivation of vegetables in waterlogged paddy �eld during Kharif 2018
Particulars Farmer 1 Farmer 2 Farmer 3 Mean2Area (m ) 49.8 63.3 29.4 47.5
Vegetable yield (kg) Cucumber 26 28 15 23.0 Bitter gourd 22 24 - 23.0Rice Yield (kg) 25 26 16 22.3
-1Vegetable price (Rs. kg ) Cucumber 35 35 35 35.0 Bitter gourd 30 30 - 30.0
-1Price of rice grains (Rs. kg ) 13 13 13 13.0Income from vegetables (Rs.) 1570 1700 525 1265Income from rice (Rs.) 325 338 208 290.3Gross income (Rs.) 1895 2038 733 1555.3Expenditure on vegetables (Rs.) 450 506 305 420.3Expenditure for Rice (Rs.) 177 224 104 168.3Cost of cultivation (Rs.) 610 700 402 570.7Net income (Rs.) 1285 1338 331 984.7
-1Net income under Bag Technology (Rs. ha ) 2,58,032 2,11,374 1,12,585 1,93,997-1Net income from Sole Rice (Rs. ha ) 29,719 18,009 35,374 27,701
175
Recl
amat
ion
and
Man
agem
ent o
f Coa
stal
Sal
ine
Soils
Ann
ual R
epor
t 201
8-19
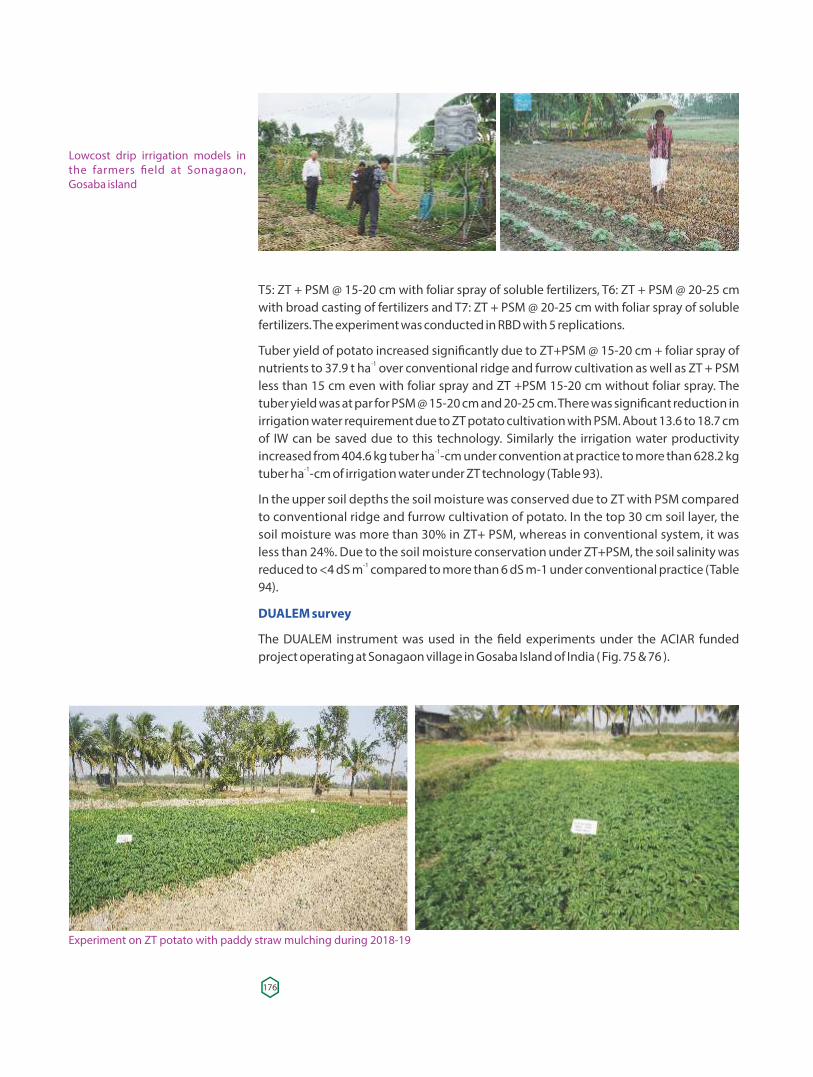
Lowcost drip irrigation models in the farmers �eld at Sonagaon, Gosaba island
T5: ZT + PSM @ 15-20 cm with foliar spray of soluble fertilizers, T6: ZT + PSM @ 20-25 cm with broad casting of fertilizers and T7: ZT + PSM @ 20-25 cm with foliar spray of soluble fertilizers. The experiment was conducted in RBD with 5 replications.
Tuber yield of potato increased signi�cantly due to ZT+PSM @ 15-20 cm + foliar spray of -1nutrients to 37.9 t ha over conventional ridge and furrow cultivation as well as ZT + PSM
less than 15 cm even with foliar spray and ZT +PSM 15-20 cm without foliar spray. The tuber yield was at par for PSM @ 15-20 cm and 20-25 cm. There was signi�cant reduction in irrigation water requirement due to ZT potato cultivation with PSM. About 13.6 to 18.7 cm of IW can be saved due to this technology. Similarly the irrigation water productivity
-1increased from 404.6 kg tuber ha -cm under convention at practice to more than 628.2 kg -1tuber ha -cm of irrigation water under ZT technology (Table 93).
In the upper soil depths the soil moisture was conserved due to ZT with PSM compared to conventional ridge and furrow cultivation of potato. In the top 30 cm soil layer, the soil moisture was more than 30% in ZT+ PSM, whereas in conventional system, it was less than 24%. Due to the soil moisture conservation under ZT+PSM, the soil salinity was
-1reduced to <4 dS m compared to more than 6 dS m-1 under conventional practice (Table 94).
DUALEM survey
The DUALEM instrument was used in the �eld experiments under the ACIAR funded project operating at Sonagaon village in Gosaba Island of India ( Fig. 75 & 76 ).
Experiment on ZT potato with paddy straw mulching during 2018-19
176
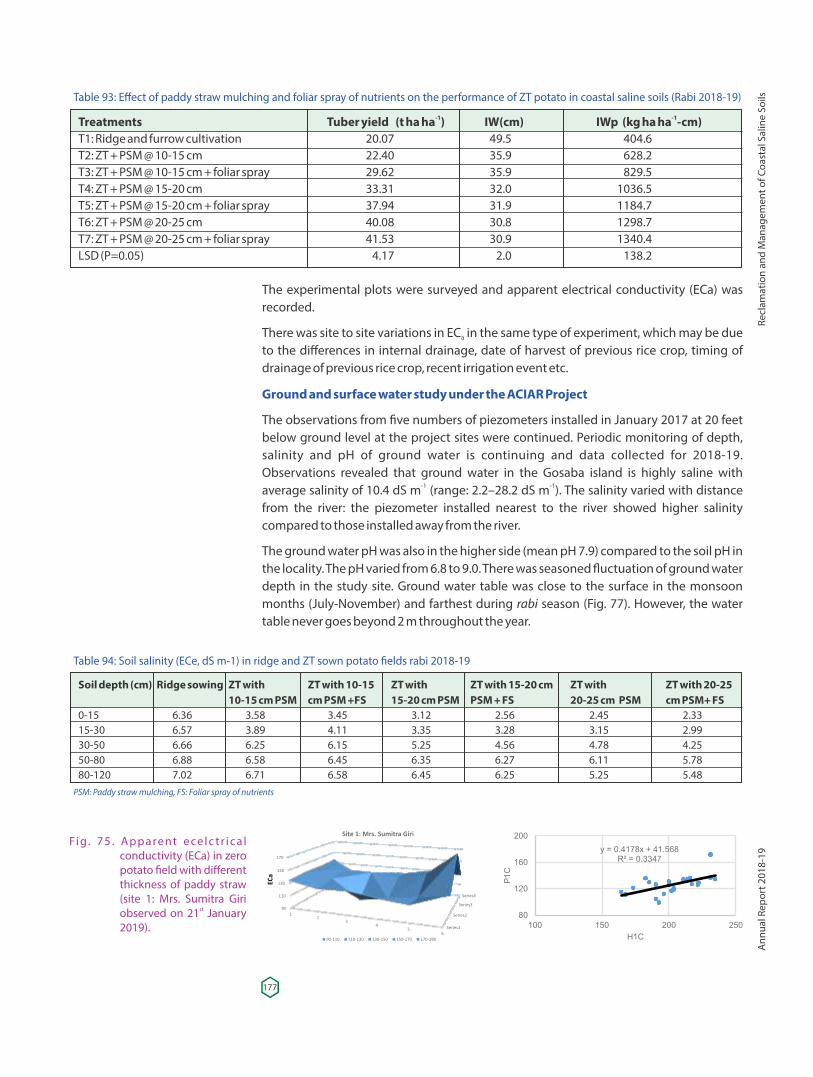
The experimental plots were surveyed and apparent electrical conductivity (ECa) was recorded.
There was site to site variations in EC in the same type of experiment, which may be due a
to the differences in internal drainage, date of harvest of previous rice crop, timing of drainage of previous rice crop, recent irrigation event etc.
Ground and surface water study under the ACIAR Project
The observations from �ve numbers of piezometers installed in January 2017 at 20 feet below ground level at the project sites were continued. Periodic monitoring of depth, salinity and pH of ground water is continuing and data collected for 2018-19. Observations revealed that ground water in the Gosaba island is highly saline with
-1 -1average salinity of 10.4 dS m (range: 2.2–28.2 dS m ). The salinity varied with distance from the river: the piezometer installed nearest to the river showed higher salinity compared to those installed away from the river.
The ground water pH was also in the higher side (mean pH 7.9) compared to the soil pH in the locality. The pH varied from 6.8 to 9.0. There was seasoned �uctuation of ground water depth in the study site. Ground water table was close to the surface in the monsoon months (July-November) and farthest during rabi season (Fig. 77). However, the water table never goes beyond 2 m throughout the year.
Table 93: Effect of paddy straw mulching and foliar spray of nutrients on the performance of ZT potato in coastal saline soils (Rabi 2018-19)
-1 -1Treatments Tuber yield (t ha ha ) IW(cm) IWp (kg ha ha -cm)T1: Ridge and furrow cultivation 20.07 49.5 404.6T2: ZT + PSM @ 10-15 cm 22.40 35.9 628.2T3: ZT + PSM @ 10-15 cm + foliar spray 29.62 35.9 829.5T4: ZT + PSM @ 15-20 cm 33.31 32.0 1036.5T5: ZT + PSM @ 15-20 cm + foliar spray 37.94 31.9 1184.7T6: ZT + PSM @ 20-25 cm 40.08 30.8 1298.7T7: ZT + PSM @ 20-25 cm + foliar spray 41.53 30.9 1340.4LSD (P=0.05) 4.17 2.0 138.2
Table 94: Soil salinity (ECe, dS m-1) in ridge and ZT sown potato �elds rabi 2018-19
Soil depth (cm) Ridge sowing ZT with ZT with 10-15 ZT with ZT with 15-20 cm ZT with ZT with 20-25 10-15 cm PSM cm PSM +FS 15-20 cm PSM PSM + FS 20-25 cm PSM cm PSM+ FS 0-15 6.36 3.58 3.45 3.12 2.56 2.45 2.33 15-30 6.57 3.89 4.11 3.35 3.28 3.15 2.99 30-50 6.66 6.25 6.15 5.25 4.56 4.78 4.25 50-80 6.88 6.58 6.45 6.35 6.27 6.11 5.78 80-120 7.02 6.71 6.58 6.45 6.25 5.25 5.48
PSM: Paddy straw mulching, FS: Foliar spray of nutrients
Fi g. 7 5 . Ap p a re nt e ce l c t r i c a l conductivity (ECa) in zero potato �eld with different thickness of paddy straw (site 1: Mrs. Sumitra Giri
stobserved on 21 January 2019).
177
Recl
amat
ion
and
Man
agem
ent o
f Coa
stal
Sal
ine
Soils
Ann
ual R
epor
t 201
8-19
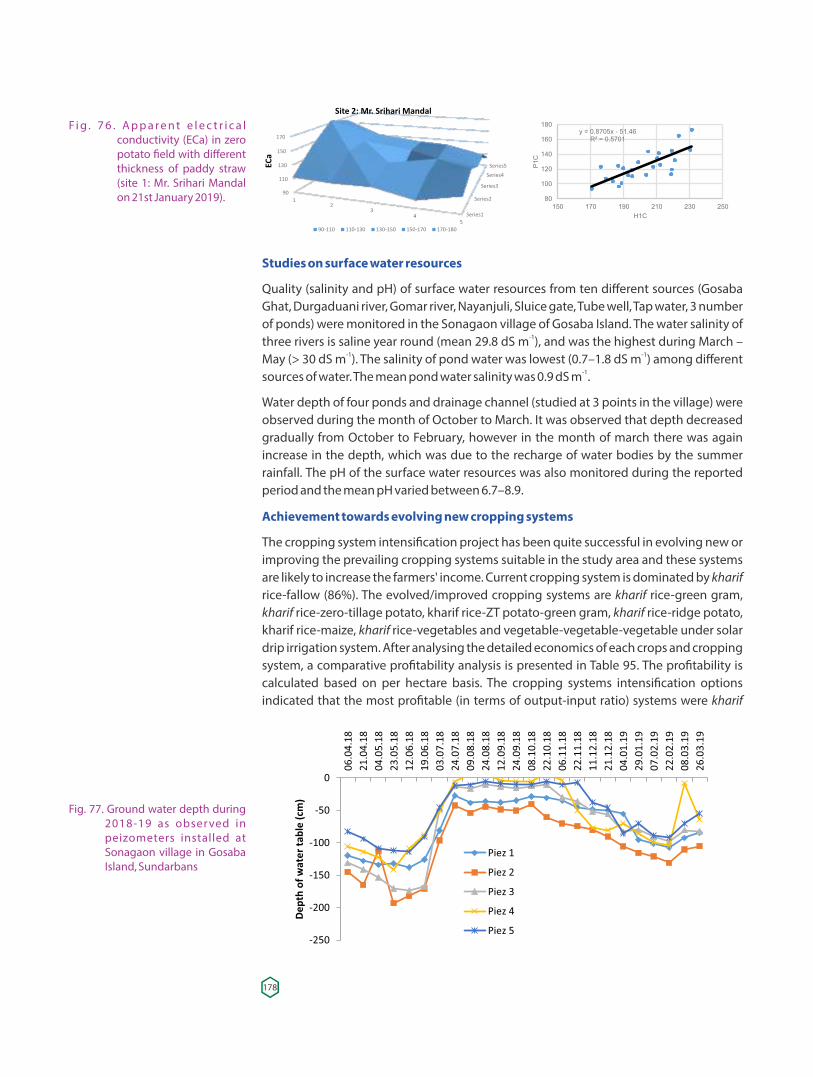
Fi g . 7 6 . A p p a r e n t e l e c t r i c a l conductivity (ECa) in zero potato �eld with different thickness of paddy straw (site 1: Mr. Srihari Mandal on 21st January 2019).
Studies on surface water resources
Quality (salinity and pH) of surface water resources from ten different sources (Gosaba Ghat, Durgaduani river, Gomar river, Nayanjuli, Sluice gate, Tube well, Tap water, 3 number of ponds) were monitored in the Sonagaon village of Gosaba Island. The water salinity of
-1three rivers is saline year round (mean 29.8 dS m ), and was the highest during March – -1 -1May (> 30 dS m ). The salinity of pond water was lowest (0.7–1.8 dS m ) among different
-1sources of water. The mean pond water salinity was 0.9 dS m .
Water depth of four ponds and drainage channel (studied at 3 points in the village) were observed during the month of October to March. It was observed that depth decreased gradually from October to February, however in the month of march there was again increase in the depth, which was due to the recharge of water bodies by the summer rainfall. The pH of the surface water resources was also monitored during the reported period and the mean pH varied between 6.7–8.9.
Achievement towards evolving new cropping systems
The cropping system intensi�cation project has been quite successful in evolving new or improving the prevailing cropping systems suitable in the study area and these systems are likely to increase the farmers' income. Current cropping system is dominated by kharif rice-fallow (86%). The evolved/improved cropping systems are kharif rice-green gram, kharif rice-zero-tillage potato, kharif rice-ZT potato-green gram, kharif rice-ridge potato, kharif rice-maize, kharif rice-vegetables and vegetable-vegetable-vegetable under solar drip irrigation system. After analysing the detailed economics of each crops and cropping system, a comparative pro�tability analysis is presented in Table 95. The pro�tability is calculated based on per hectare basis. The cropping systems intensi�cation options indicated that the most pro�table (in terms of output-input ratio) systems were kharif
Fig. 77. Ground water depth during 2018-19 as obser ved in peizometers installed at Sonagaon village in Gosaba Island, Sundarbans
178
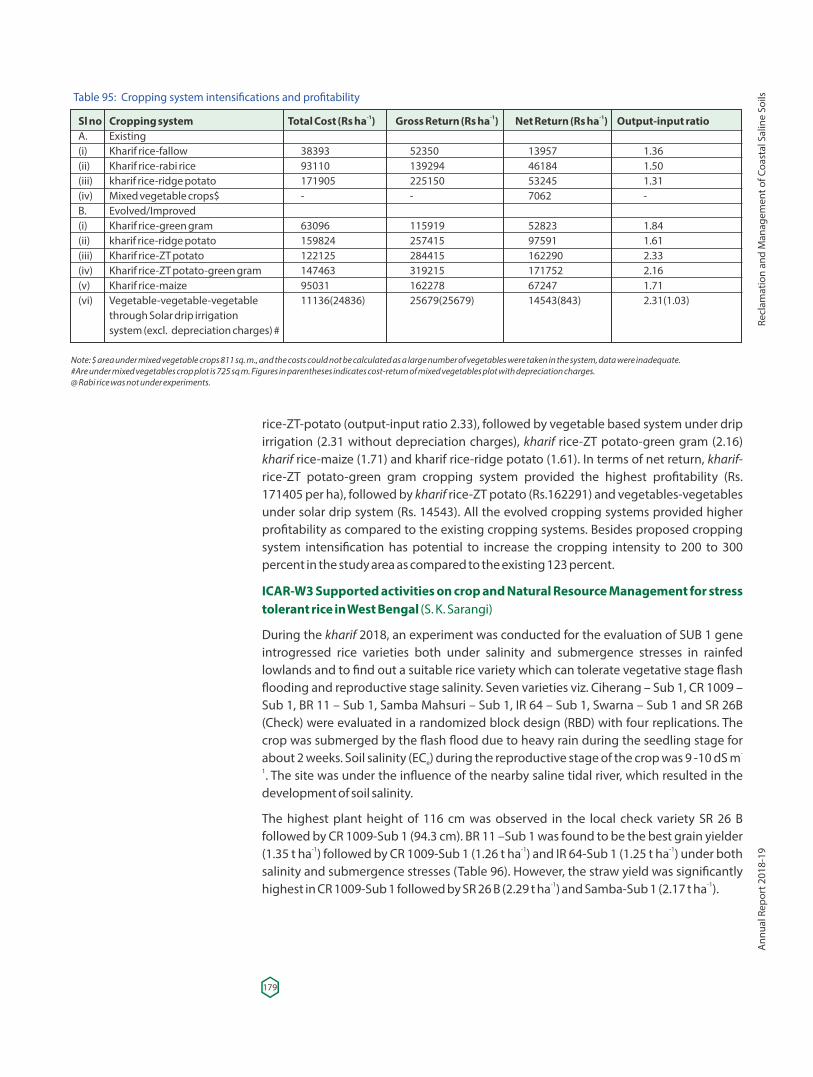
rice-ZT-potato (output-input ratio 2.33), followed by vegetable based system under drip irrigation (2.31 without depreciation charges), kharif rice-ZT potato-green gram (2.16) kharif rice-maize (1.71) and kharif rice-ridge potato (1.61). In terms of net return, kharif-rice-ZT potato-green gram cropping system provided the highest pro�tability (Rs. 171405 per ha), followed by kharif rice-ZT potato (Rs.162291) and vegetables-vegetables under solar drip system (Rs. 14543). All the evolved cropping systems provided higher pro�tability as compared to the existing cropping systems. Besides proposed cropping system intensi�cation has potential to increase the cropping intensity to 200 to 300 percent in the study area as compared to the existing 123 percent.
ICAR-W3 Supported activities on crop and Natural Resource Management for stress tolerant rice in West Bengal (S. K. Sarangi)
During the kharif 2018, an experiment was conducted for the evaluation of SUB 1 gene introgressed rice varieties both under salinity and submergence stresses in rainfed lowlands and to �nd out a suitable rice variety which can tolerate vegetative stage �ash �ooding and reproductive stage salinity. Seven varieties viz. Ciherang – Sub 1, CR 1009 – Sub 1, BR 11 – Sub 1, Samba Mahsuri – Sub 1, IR 64 – Sub 1, Swarna – Sub 1 and SR 26B (Check) were evaluated in a randomized block design (RBD) with four replications. The crop was submerged by the �ash �ood due to heavy rain during the seedling stage for
-about 2 weeks. Soil salinity (EC ) during the reproductive stage of the crop was 9 -10 dS me1. The site was under the in�uence of the nearby saline tidal river, which resulted in the development of soil salinity.
The highest plant height of 116 cm was observed in the local check variety SR 26 B followed by CR 1009-Sub 1 (94.3 cm). BR 11 –Sub 1 was found to be the best grain yielder
-1 -1 -1(1.35 t ha ) followed by CR 1009-Sub 1 (1.26 t ha ) and IR 64-Sub 1 (1.25 t ha ) under both salinity and submergence stresses (Table 96). However, the straw yield was signi�cantly
-1 -1highest in CR 1009-Sub 1 followed by SR 26 B (2.29 t ha ) and Samba-Sub 1 (2.17 t ha ).
Table 95: Cropping system intensi�cations and pro�tability
-1 -1 -1Sl no Cropping system Total Cost (Rs ha ) Gross Return (Rs ha ) Net Return (Rs ha ) Output-input ratioA. Existing (i) Kharif rice-fallow 38393 52350 13957 1.36(ii) Kharif rice-rabi rice 93110 139294 46184 1.50(iii) kharif rice-ridge potato 171905 225150 53245 1.31(iv) Mixed vegetable crops$ - - 7062 -B. Evolved/Improved (i) Kharif rice-green gram 63096 115919 52823 1.84(ii) kharif rice-ridge potato 159824 257415 97591 1.61(iii) Kharif rice-ZT potato 122125 284415 162290 2.33(iv) Kharif rice-ZT potato-green gram 147463 319215 171752 2.16(v) Kharif rice-maize 95031 162278 67247 1.71(vi) Vegetable-vegetable-vegetable 11136(24836) 25679(25679) 14543(843) 2.31(1.03) through Solar drip irrigation system (excl. depreciation charges) #
Note: $ area under mixed vegetable crops 811 sq. m., and the costs could not be calculated as a large number of vegetables were taken in the system, data were inadequate. #Are under mixed vegetables crop plot is 725 sq m. Figures in parentheses indicates cost-return of mixed vegetables plot with depreciation charges.@ Rabi rice was not under experiments.
179
Recl
amat
ion
and
Man
agem
ent o
f Coa
stal
Sal
ine
Soils
Ann
ual R
epor
t 201
8-19
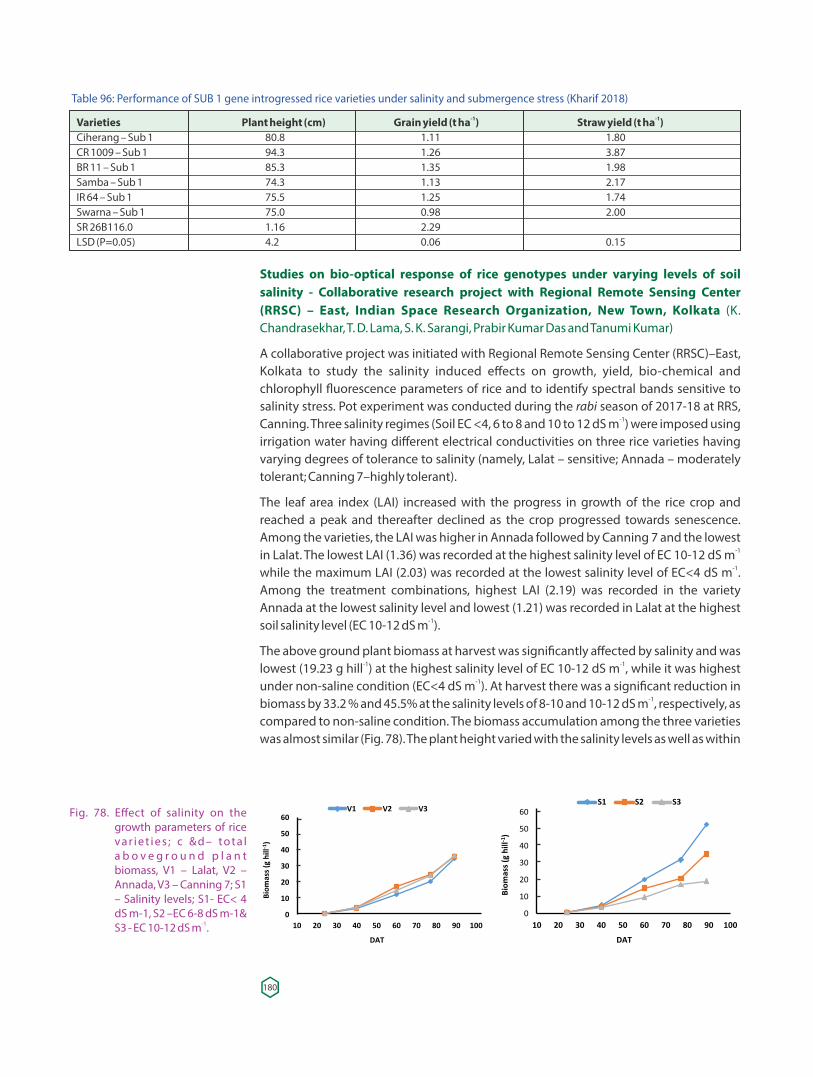
Studies on bio-optical response of rice genotypes under varying levels of soil salinity - Collaborative research project with Regional Remote Sensing Center (RRSC) – East, Indian Space Research Organization, New Town, Kolkata (K. Chandrasekhar, T. D. Lama, S. K. Sarangi, Prabir Kumar Das and Tanumi Kumar)
A collaborative project was initiated with Regional Remote Sensing Center (RRSC)–East, Kolkata to study the salinity induced effects on growth, yield, bio-chemical and chlorophyll �uorescence parameters of rice and to identify spectral bands sensitive to salinity stress. Pot experiment was conducted during the rabi season of 2017-18 at RRS,
-1Canning. Three salinity regimes (Soil EC <4, 6 to 8 and 10 to 12 dS m ) were imposed using irrigation water having different electrical conductivities on three rice varieties having varying degrees of tolerance to salinity (namely, Lalat – sensitive; Annada – moderately tolerant; Canning 7–highly tolerant).
The leaf area index (LAI) increased with the progress in growth of the rice crop and reached a peak and thereafter declined as the crop progressed towards senescence. Among the varieties, the LAI was higher in Annada followed by Canning 7 and the lowest
-1in Lalat. The lowest LAI (1.36) was recorded at the highest salinity level of EC 10-12 dS m -1while the maximum LAI (2.03) was recorded at the lowest salinity level of EC<4 dS m .
Among the treatment combinations, highest LAI (2.19) was recorded in the variety Annada at the lowest salinity level and lowest (1.21) was recorded in Lalat at the highest
-1soil salinity level (EC 10-12 dS m ).
The above ground plant biomass at harvest was signi�cantly affected by salinity and was -1 -1lowest (19.23 g hill ) at the highest salinity level of EC 10-12 dS m , while it was highest
-1under non-saline condition (EC<4 dS m ). At harvest there was a signi�cant reduction in -1biomass by 33.2 % and 45.5% at the salinity levels of 8-10 and 10-12 dS m , respectively, as
compared to non-saline condition. The biomass accumulation among the three varieties was almost similar (Fig. 78). The plant height varied with the salinity levels as well as within
Fig. 78. Effect of salinity on the growth parameters of rice va r i e t i e s ; c & d – to t a l a b o v e g r o u n d p l a n t biomass, V1 – Lalat, V2 – Annada, V3 – Canning 7; S1 – Salinity levels; S1- EC< 4 dS m-1, S2 –EC 6-8 dS m-1&
-1S3 - EC 10-12 dS m .
Table 96: Performance of SUB 1 gene introgressed rice varieties under salinity and submergence stress (Kharif 2018)
-1 -1Varieties Plant height (cm) Grain yield (t ha ) Straw yield (t ha )Ciherang – Sub 1 80.8 1.11 1.80CR 1009 – Sub 1 94.3 1.26 3.87BR 11 – Sub 1 85.3 1.35 1.98Samba – Sub 1 74.3 1.13 2.17IR 64 – Sub 1 75.5 1.25 1.74Swarna – Sub 1 75.0 0.98 2.00SR 26B 116.0 1.16 2.29LSD (P=0.05) 4.2 0.06 0.15
180
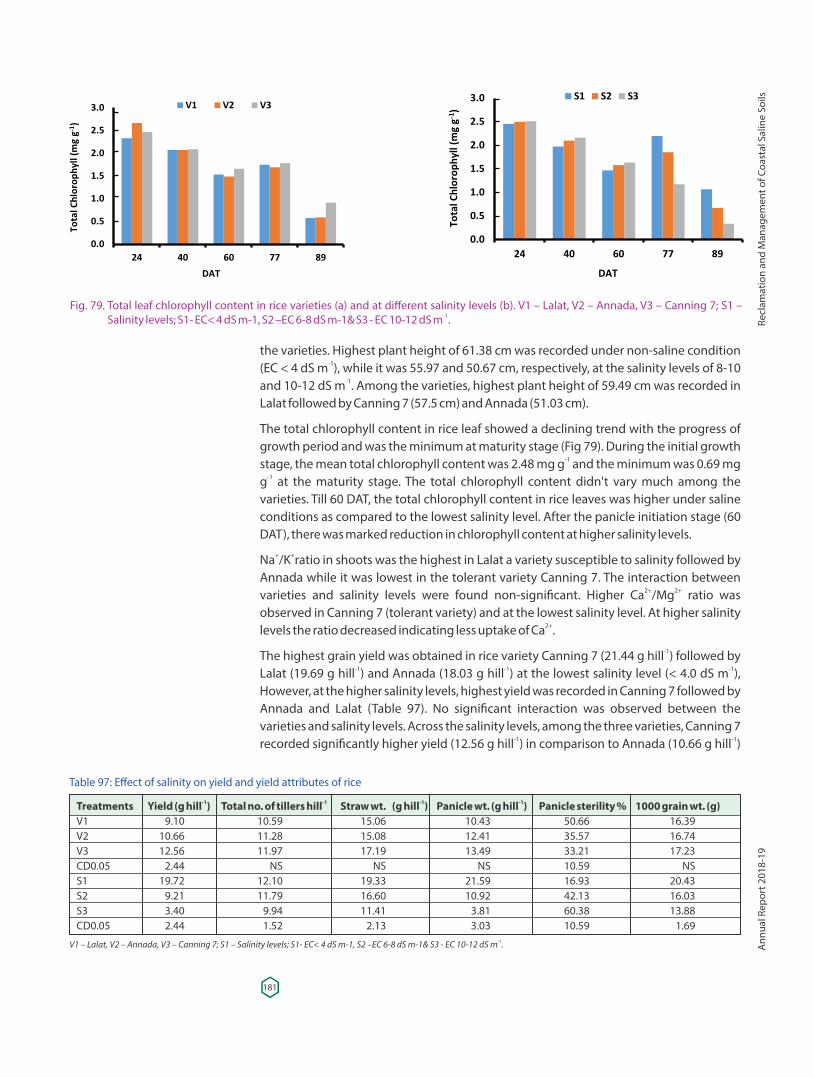
the varieties. Highest plant height of 61.38 cm was recorded under non-saline condition -1(EC < 4 dS m ), while it was 55.97 and 50.67 cm, respectively, at the salinity levels of 8-10
-1and 10-12 dS m . Among the varieties, highest plant height of 59.49 cm was recorded in Lalat followed by Canning 7 (57.5 cm) and Annada (51.03 cm).
The total chlorophyll content in rice leaf showed a declining trend with the progress of growth period and was the minimum at maturity stage (Fig 79). During the initial growth
-1stage, the mean total chlorophyll content was 2.48 mg g and the minimum was 0.69 mg -1g at the maturity stage. The total chlorophyll content didn't vary much among the
varieties. Till 60 DAT, the total chlorophyll content in rice leaves was higher under saline conditions as compared to the lowest salinity level. After the panicle initiation stage (60 DAT), there was marked reduction in chlorophyll content at higher salinity levels.
+ +Na /K ratio in shoots was the highest in Lalat a variety susceptible to salinity followed by Annada while it was lowest in the tolerant variety Canning 7. The interaction between
2+ 2+varieties and salinity levels were found non-signi�cant. Higher Ca /Mg ratio was observed in Canning 7 (tolerant variety) and at the lowest salinity level. At higher salinity
2+levels the ratio decreased indicating less uptake of Ca .-1The highest grain yield was obtained in rice variety Canning 7 (21.44 g hill ) followed by
-1 -1 -1Lalat (19.69 g hill ) and Annada (18.03 g hill ) at the lowest salinity level (< 4.0 dS m ), However, at the higher salinity levels, highest yield was recorded in Canning 7 followed by Annada and Lalat (Table 97). No signi�cant interaction was observed between the varieties and salinity levels. Across the salinity levels, among the three varieties, Canning 7
-1 -1recorded signi�cantly higher yield (12.56 g hill ) in comparison to Annada (10.66 g hill )
Fig. 79. Total leaf chlorophyll content in rice varieties (a) and at different salinity levels (b). V1 – Lalat, V2 – Annada, V3 – Canning 7; S1 – -1Salinity levels; S1- EC< 4 dS m-1, S2 –EC 6-8 dS m-1& S3 - EC 10-12 dS m .
Table 97: Effect of salinity on yield and yield attributes of rice
-1 -1 -1 -1Treatments Yield (g hill ) Total no. of tillers hill Straw wt. (g hill ) Panicle wt. (g hill ) Panicle sterility % 1000 grain wt. (g)V1 9.10 10.59 15.06 10.43 50.66 16.39V2 10.66 11.28 15.08 12.41 35.57 16.74V3 12.56 11.97 17.19 13.49 33.21 17.23CD0.05 2.44 NS NS NS 10.59 NSS1 19.72 12.10 19.33 21.59 16.93 20.43S2 9.21 11.79 16.60 10.92 42.13 16.03S3 3.40 9.94 11.41 3.81 60.38 13.88CD0.05 2.44 1.52 2.13 3.03 10.59 1.69
-1V1 – Lalat, V2 – Annada, V3 – Canning 7; S1 – Salinity levels; S1- EC< 4 dS m-1, S2 –EC 6-8 dS m-1& S3 - EC 10-12 dS m .
181
Recl
amat
ion
and
Man
agem
ent o
f Coa
stal
Sal
ine
Soils
Ann
ual R
epor
t 201
8-19
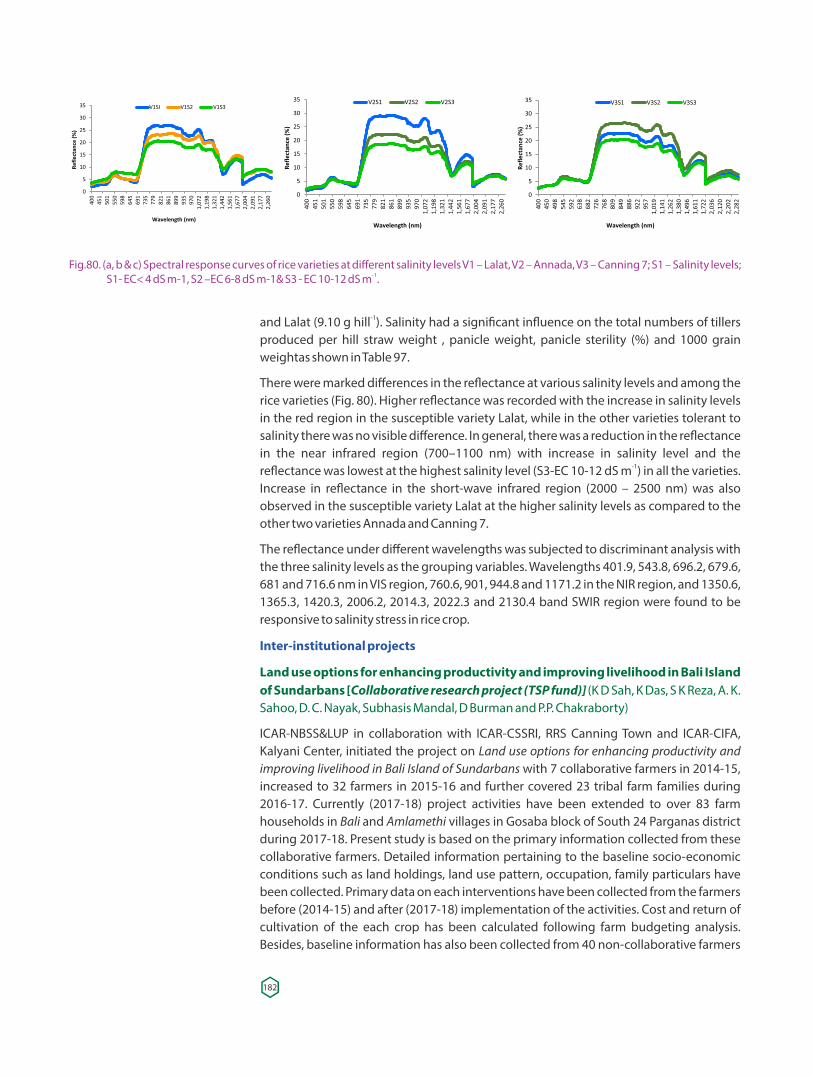
-1and Lalat (9.10 g hill ). Salinity had a signi�cant in�uence on the total numbers of tillers produced per hill straw weight , panicle weight, panicle sterility (%) and 1000 grain weightas shown in Table 97.
There were marked differences in the re�ectance at various salinity levels and among the rice varieties (Fig. 80). Higher re�ectance was recorded with the increase in salinity levels in the red region in the susceptible variety Lalat, while in the other varieties tolerant to salinity there was no visible difference. In general, there was a reduction in the re�ectance in the near infrared region (700–1100 nm) with increase in salinity level and the
-1re�ectance was lowest at the highest salinity level (S3-EC 10-12 dS m ) in all the varieties. Increase in re�ectance in the short-wave infrared region (2000 – 2500 nm) was also observed in the susceptible variety Lalat at the higher salinity levels as compared to the other two varieties Annada and Canning 7.
The re�ectance under different wavelengths was subjected to discriminant analysis with the three salinity levels as the grouping variables. Wavelengths 401.9, 543.8, 696.2, 679.6, 681 and 716.6 nm in VIS region, 760.6, 901, 944.8 and 1171.2 in the NIR region, and 1350.6, 1365.3, 1420.3, 2006.2, 2014.3, 2022.3 and 2130.4 band SWIR region were found to be responsive to salinity stress in rice crop.
Inter-institutional projects
Land use options for enhancing productivity and improving livelihood in Bali Island of Sundarbans [Collaborative research project (TSP fund)] (K D Sah, K Das, S K Reza, A. K. Sahoo, D. C. Nayak, Subhasis Mandal, D Burman and P.P. Chakraborty)
ICAR-NBSS&LUP in collaboration with ICAR-CSSRI, RRS Canning Town and ICAR-CIFA, Kalyani Center, initiated the project on Land use options for enhancing productivity and improving livelihood in Bali Island of Sundarbans with 7 collaborative farmers in 2014-15, increased to 32 farmers in 2015-16 and further covered 23 tribal farm families during 2016-17. Currently (2017-18) project activities have been extended to over 83 farm households in and villages in Gosaba block of South 24 Parganas district Bali Amlamethiduring 2017-18. Present study is based on the primary information collected from these collaborative farmers. Detailed information pertaining to the baseline socio-economic conditions such as land holdings, land use pattern, occupation, family particulars have been collected. Primary data on each interventions have been collected from the farmers before (2014-15) and after (2017-18) implementation of the activities. Cost and return of cultivation of the each crop has been calculated following farm budgeting analysis. Besides, baseline information has also been collected from 40 non-collaborative farmers
Fig.80. (a, b & c) Spectral response curves of rice varieties at different salinity levels V1 – Lalat, V2 – Annada, V3 – Canning 7; S1 – Salinity levels; -1S1- EC< 4 dS m-1, S2 –EC 6-8 dS m-1& S3 - EC 10-12 dS m .
182
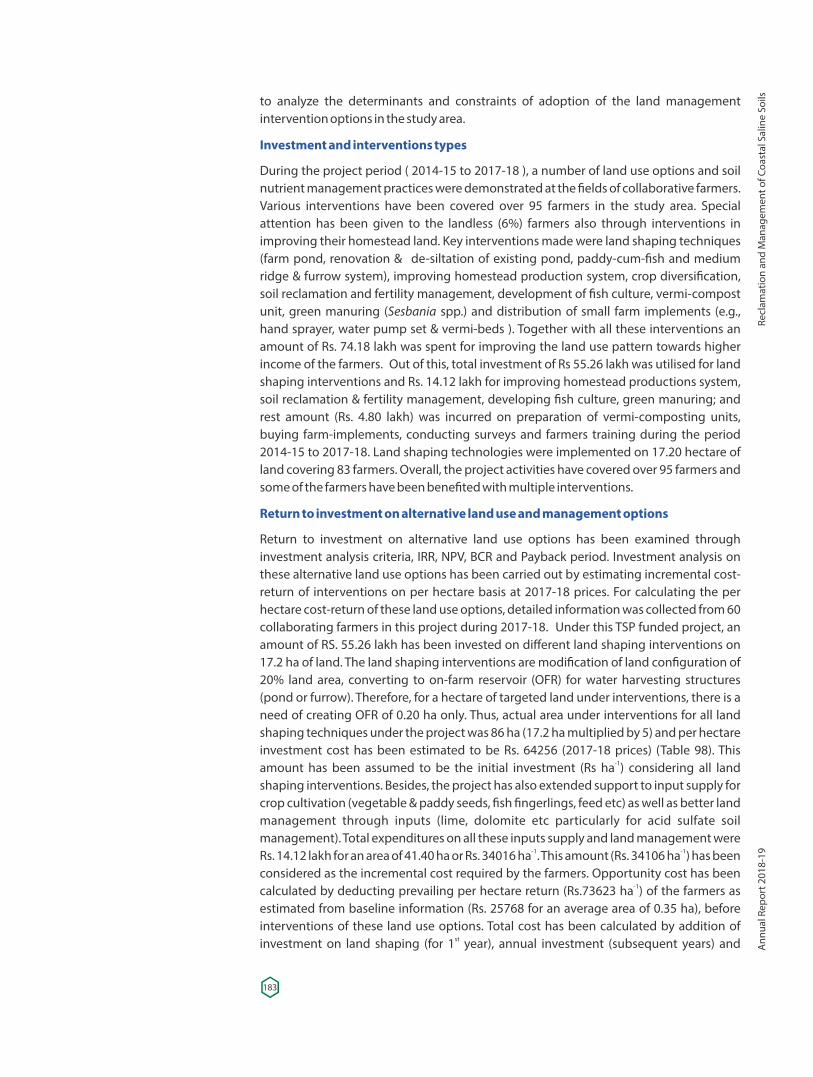
to analyze the determinants and constraints of adoption of the land management intervention options in the study area.
Investment and interventions types
During the project period ( 2014-15 to 2017-18 ), a number of land use options and soil nutrient management practices were demonstrated at the �elds of collaborative farmers. Various interventions have been covered over 95 farmers in the study area. Special attention has been given to the landless (6%) farmers also through interventions in improving their homestead land. Key interventions made were land shaping techniques (farm pond, renovation & de-siltation of existing pond, paddy-cum-�sh and medium ridge & furrow system), improving homestead production system, crop diversi�cation, soil reclamation and fertility management, development of �sh culture, vermi-compost unit, green manuring ( spp.) and distribution of small farm implements (e.g., Sesbaniahand sprayer, water pump set & vermi-beds ). Together with all these interventions an amount of Rs. 74.18 lakh was spent for improving the land use pattern towards higher income of the farmers. Out of this, total investment of Rs 55.26 lakh was utilised for land shaping interventions and Rs. 14.12 lakh for improving homestead productions system, soil reclamation & fertility management, developing �sh culture, green manuring; and rest amount (Rs. 4.80 lakh) was incurred on preparation of vermi-composting units, buying farm-implements, conducting surveys and farmers training during the period 2014-15 to 2017-18. Land shaping technologies were implemented on 17.20 hectare of land covering 83 farmers. Overall, the project activities have covered over 95 farmers and some of the farmers have been bene�ted with multiple interventions.
Return to investment on alternative land use and management options
Return to investment on alternative land use options has been examined through investment analysis criteria, IRR, NPV, BCR and Payback period. Investment analysis on these alternative land use options has been carried out by estimating incremental cost-return of interventions on per hectare basis at 2017-18 prices. For calculating the per hectare cost-return of these land use options, detailed information was collected from 60 collaborating farmers in this project during 2017-18. Under this TSP funded project, an amount of RS. 55.26 lakh has been invested on different land shaping interventions on 17.2 ha of land. The land shaping interventions are modi�cation of land con�guration of 20% land area, converting to on-farm reservoir (OFR) for water harvesting structures (pond or furrow). Therefore, for a hectare of targeted land under interventions, there is a need of creating OFR of 0.20 ha only. Thus, actual area under interventions for all land shaping techniques under the project was 86 ha (17.2 ha multiplied by 5) and per hectare investment cost has been estimated to be Rs. 64256 (2017-18 prices) (Table 98). This amount has been assumed to be the initial investment (Rs ha ) considering all land -1
shaping interventions. Besides, the project has also extended support to input supply for crop cultivation (vegetable & paddy seeds, �sh �ngerlings, feed etc) as well as better land management through inputs (lime, dolomite etc particularly for acid sulfate soil management). Total expenditures on all these inputs supply and land management were Rs. 14.12 lakh for an area of 41.40 ha or Rs. 34016 ha . This amount (Rs. 34106 ha ) has been -1 -1
considered as the incremental cost required by the farmers. Opportunity cost has been calculated by deducting prevailing per hectare return (Rs.73623 ha ) of the farmers as -1
estimated from baseline information (Rs. 25768 for an average area of 0.35 ha), before interventions of these land use options. Total cost has been calculated by addition of investment on land shaping (for 1 year), annual investment (subsequent years) and st
183
Recl
amat
ion
and
Man
agem
ent o
f Coa
stal
Sal
ine
Soils
Ann
ual R
epor
t 201
8-19
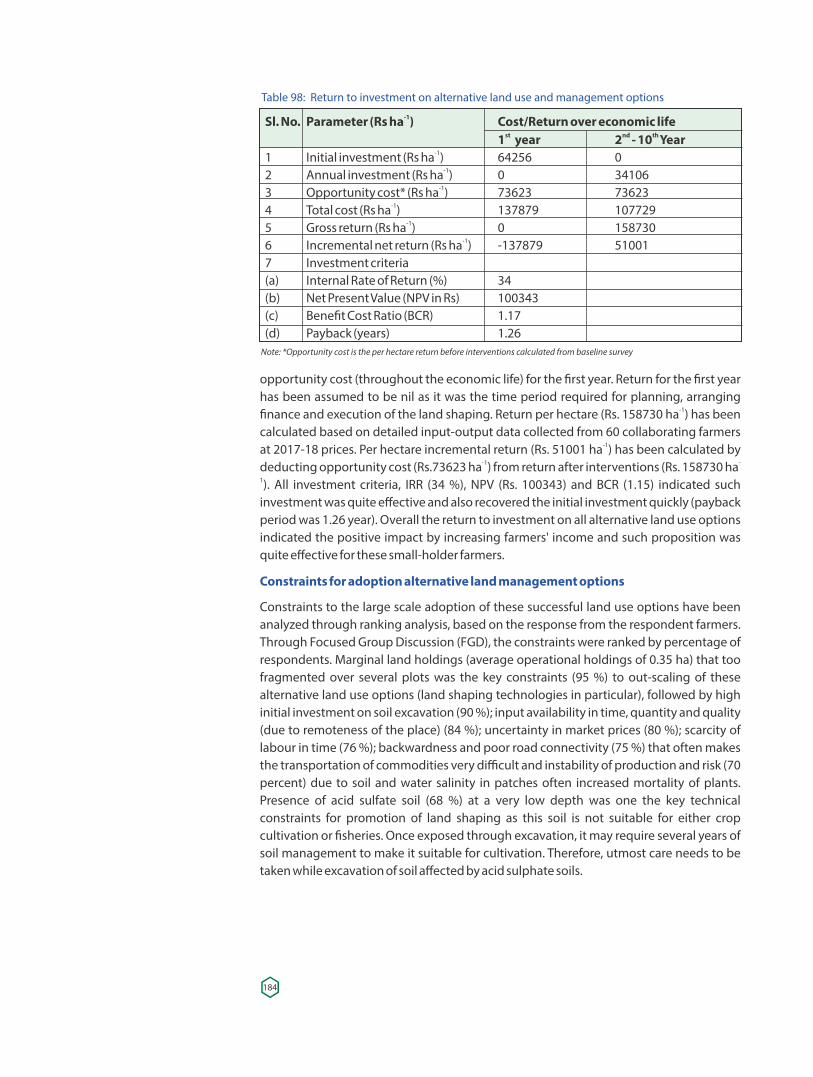
opportunity cost (throughout the economic life) for the �rst year. Return for the �rst year has been assumed to be nil as it was the time period required for planning, arranging �nance and execution of the land shaping. Return per hectare (Rs. 158730 ha ) has been -1
calculated based on detailed input-output data collected from 60 collaborating farmers at 2017-18 prices. Per hectare incremental return (Rs. 51001 ha ) has been calculated by -1
deducting opportunity cost (Rs.73623 ha ) from return after interventions (Rs. 158730 ha-1 -
1). All investment criteria, IRR (34 %), NPV (Rs. 100343) and BCR (1.15) indicated such investment was quite effective and also recovered the initial investment quickly (payback period was 1.26 year). Overall the return to investment on all alternative land use options indicated the positive impact by increasing farmers' income and such proposition was quite effective for these small-holder farmers.
Constraints for adoption alternative land management options
Constraints to the large scale adoption of these successful land use options have been analyzed through ranking analysis, based on the response from the respondent farmers. Through Focused Group Discussion (FGD), the constraints were ranked by percentage of respondents. Marginal land holdings (average operational holdings of 0.35 ha) that too fragmented over several plots was the key constraints (95 %) to out-scaling of these alternative land use options (land shaping technologies in particular), followed by high initial investment on soil excavation (90 %); input availability in time, quantity and quality (due to remoteness of the place) (84 %); uncertainty in market prices (80 %); scarcity of labour in time (76 %); backwardness and poor road connectivity (75 %) that often makes the transportation of commodities very difficult and instability of production and risk (70 percent) due to soil and water salinity in patches often increased mortality of plants. Presence of acid sulfate soil (68 %) at a very low depth was one the key technical constraints for promotion of land shaping as this soil is not suitable for either crop cultivation or �sheries. Once exposed through excavation, it may require several years of soil management to make it suitable for cultivation. Therefore, utmost care needs to be taken while excavation of soil affected by acid sulphate soils.
Table 98: Return to investment on alternative land use and management options
-1Sl. No. Parameter (Rs ha ) Cost/Return over economic lifest nd th 1 year 2 - 10 Year
-11 Initial investment (Rs ha ) 64256 0-12 Annual investment (Rs ha ) 0 34106
-13 Opportunity cost* (Rs ha ) 73623 73623-14 Total cost (Rs ha ) 137879 107729
-15 Gross return (Rs ha ) 0 158730-16 Incremental net return (Rs ha ) -137879 51001
7 Investment criteria (a) Internal Rate of Return (%) 34(b) Net Present Value (NPV in Rs) 100343(c) Bene�t Cost Ratio (BCR) 1.17(d) Payback (years) 1.26
Note: *Opportunity cost is the per hectare return before interventions calculated from baseline survey
184
AICRP on Management of Salt Affected Soilsand use of Saline Water in AgricultureEvaluation of commercial vegetable crops under protected cultivation structure in saline environments (R.L. Meena, B.L. Meena, Anshuman Singh, M.J. Kaledhonkar and S.K. Sanwal)
Growing of the commercial vegetables in polyhouse structures during off-season fetches remunerative prices. The evaluation of three vegetable crops was initiated during 2015 under naturally ventilated polyhouse structures with saline water irrigation at ICAR-CSSRI to study crop productivity and pro�tability performance so as to assess feasibility of such structures in ensuring livelihood security to resource poor farmers. During 2017-18 vegetables were grown consecutively for the third year from September 2017. Six saline
-1water irrigations EC ranging 0.8 to 10 dS m were used for irrigation. Capsicum, chilli and iw
tomato seedlings were transplanted on 11 September 2017 on raised beds of 15 cm at th spacing of 45 cm x 30 cm. Drip system operated under gravity �ow was used to apply saline irrigation water. The vegetables were harvested on regular interval till end of May 2018.
Plant growth and yield under saline environment in polyhouse structure: The no. of -1 -1fruits per plant was signi�cantly highest with EC 2 dS m (13.5 fruits plant ) while BAW, iw
-1 -1EC 4,6, and 8 produced at par number of fruits plant and lowest was under EC 10 dS m . iw iw-1 -1Fruit weight fruit was maximum under BAW (74 g) followed by EC 2 dS m (72.8 g) iw
irrigation and signi�cantly higher as compared to other saline water treatments. -1 -1Signi�cantly highest fruit yield of capsicum was recorded with EC 2 dS m (41.8 t ha ) iw
which was signi�cantly higher over all other irrigation salinity treatments including BAW -1 -1(36.9 t ha ) and this might be due to more number of fruits plant . Probably, requirement
of plant for Ca and K might have ful�lled through saline water. Fresh weight and dry weight of plants at harvest was recorded and was signi�cantly higher with BAW (254.4 g,
-170.2 g) and EC 2 dS m (260.0 g , 63.3 g). iw
In green chilli, plant height gradually decreased with increase in salinity of irrigation -1water and it was in order of BAW>2>4>6>8>10 dS m . Fruit yield of chilli was decreased
-1gradually with increasing salinity and signi�cantly highest (39.1 t ha ) was produced with -1 -1BAW followed by EC 2 dS m (36.8 t ha ) as compared to other saline water irrigation. iw
-1 -1Lowest fruit yield (15.5 t ha ) was produced with EC 10 dS m . The percent reduction was iw
5.9, 13.5, 33.7, 43.7 and 60.3 % respectively with each increasing salinity levels as compared to best water irrigation. Plants fresh weight differed non-signi�cantly with all
-1saline water irrigations though highest (199 g) was recorded with EC 2 dS m . iw
-1 -1In case of tomato number of fruits plant was maximum with EC 4 dS m (68.6) followed iw-1by EC 6 dS m (65.3) while signi�cantly lowest fruit number (49.4) was recorded with iw
-1BAW. Highest fruit weight (51 g) was observed with EC 10 dS m which was non-iw-1 -1signi�cant with EC 2, 4, 6, 8 dS m . Tomato fruit yield plant was signi�cantly higher iw
-1 -1 -1 -1(149.0 t ha ) with EC 4 dS m followed by EC 6 dS m (142.4 t ha ). Plant fresh weight was iw iw-1highest with BAW followed by EC 4 and 2 dS m .iw
Results of third year showed that fruit yield of capsicum and chilli reduced gradually with each increment of the salinity levels while tomato continued to yield better upto EC 10 iw
-1dS m . It con�rms that tomato could be grown successfully with saline water irrigation in polyhouse structures in resource poor conditions. Use of saline water irrigation was found
185
AIC
RP o
n M
anag
emen
t of S
alt A
ffect
ed S
oils
and
use
of S
alin
e W
ater
in A
gric
ultu
reA
nnua
l Rep
ort 2
018-
19
to be suitable for �rst two years for capsicum and chilli while for tomato, it can used successfully under naturally ventilated polyhouse structures.
Effect of saline water irrigation on soil salinity bulid-up at harvest: After harvesting of vegetables, soil samples from three depths (0-15cm, 15-30 cm and 30-45 cm) were collected and analyzed for EC and pH build-up under saline water irrigation in 2 2
vegetables. In case of capsicum, soil EC increased with irrigation water salinity. It was 2-1highest in 0-15 cm and decreased with depth. The highest EC (5.40 dS m ) was observed 2
-1with EC 10 dS m in 0-15 cm soil depth while it was comparatively less with increase in soil iw
depth. No much variation in soil pH was found with saline water irrigation. In case of 2
chilli, soil EC build-up was more than under capsicum beds and maximum salinity of 6.26, 2-1 -14.58 and 1.74 dS m was observed with EC 10 dS m saline water irrigation in 0-15, 15-30 iw
-1and 30-45 cm soil depth respectively. Soil pH build-up was almost similar upto 10 dS m 2
in all depths under saline water though the highest pH (8.38) was found in 0-15 cm soil 2
depth under best water irrigation. Soil salinity build-up in tomato beds ranged between -10.41 – 3.55, 0.28-3.08, and 0.21-1.95 dS m in 0-15 cm, 15-30 cm and 30-45 cm soil depth,
respectively and it was reducing with increased soil depth. This shows salinity build-up was less under tomato in all depths as compared to capsicum and chilli crop and this might be due to mulching effect of tomato plants over the bed surface limiting the capillary rise of salts in upper root zone. pH build-up was similar to that of capsicum and 2
chilli crops (Table 99).
Amelioration of iron de�ciency in direct seeded /aerobic rice grown on reclaimed sodic soil (B.L. Meena, R.K. Fagodiya, R.L. Meena, M.J. Kaledhonkar and P.C. Sharma
The aerobic rice system (ARS) is a new production system in which rice is grown under non-puddled, non�ooded and non-saturated soil conditions as other upland crops. Despite the usefulness of ARS, there are still many constraints that restrict its adoption by rice farmers. The major constraints in ARS are unavailability of varieties speci�cally bred for it, severe weed and nematode infestation, and of course, the iron de�ciency. It will be more pronounced in partially reclaimed sodic soils due to its low concentration of soluble iron, high pH of soils, wide P/Fe ratio, fast oxidation of ferrous iron, immobilization in the roots and excessive concentration of other metallic cations, and low potential of rice cultivars for excretion of organic acids responsible for Fe de�ciency. Keeping these facts in view, a �eld experiment was conducted during the 2018–2019 at ICAR-CSSRI, Karnal. The rice–wheat cropping system has been adopted continuously in the experimental �eld. The soil and foliar application of iron treatments were 9 (T -Control; no Fe application);T - 1 2
-1 -1 -130 kg Fe ha ; T - 40 kg Fe ha ; T - 50 kg Fe ha ;T -Three (30, 45, 60 DAS) foliar sprays of 1.5% 3 4 5
FeSO .7H O; T -Three (30, 45, 60 DAS) foliar sprays of 3% FeSO .7H O; T -Three (30, 45, 60 4 2 6 4 2 7
DAS) foliar sprays of 0.5% Fe-EDTA Chelate;T -Three (30, 45, 60 DAS) foliar sprays of 0.2% 8
Table 99: Soil salinity build-up with saline water irrigation in vegetable beds centre (2017-18)
Treatments Capsicum Green Chilli Tomato-1 -1 -1 -1EC (dS m ) EC (dS m ) EC (dS m ) EC (dS m )iw 2 2 2
0-15cm 15-30cm 30-45cm 0-15cm 15-30cm 30-45cm 0-15cm 15-30cm 30-45cmBAW 0.48 0.30 0.54 0.45 0.36 0.29 0.41 0.28 0.212 1.94 0.75 0.59 1.96 1.35 0.56 0.76 0.48 0.344 4.01 1.63 1.28 1.87 1.48 1.33 1.71 0.83 0.666 4.82 1.71 1.39 4.04 2.15 1.40 1.24 1.04 0.738 4.91 3.24 1.35 4.46 2.55 1.47 2.44 1.74 0.9910 5.40 4.54 1.86 6.26 4.58 1.74 3.55 3.08 1.95
186
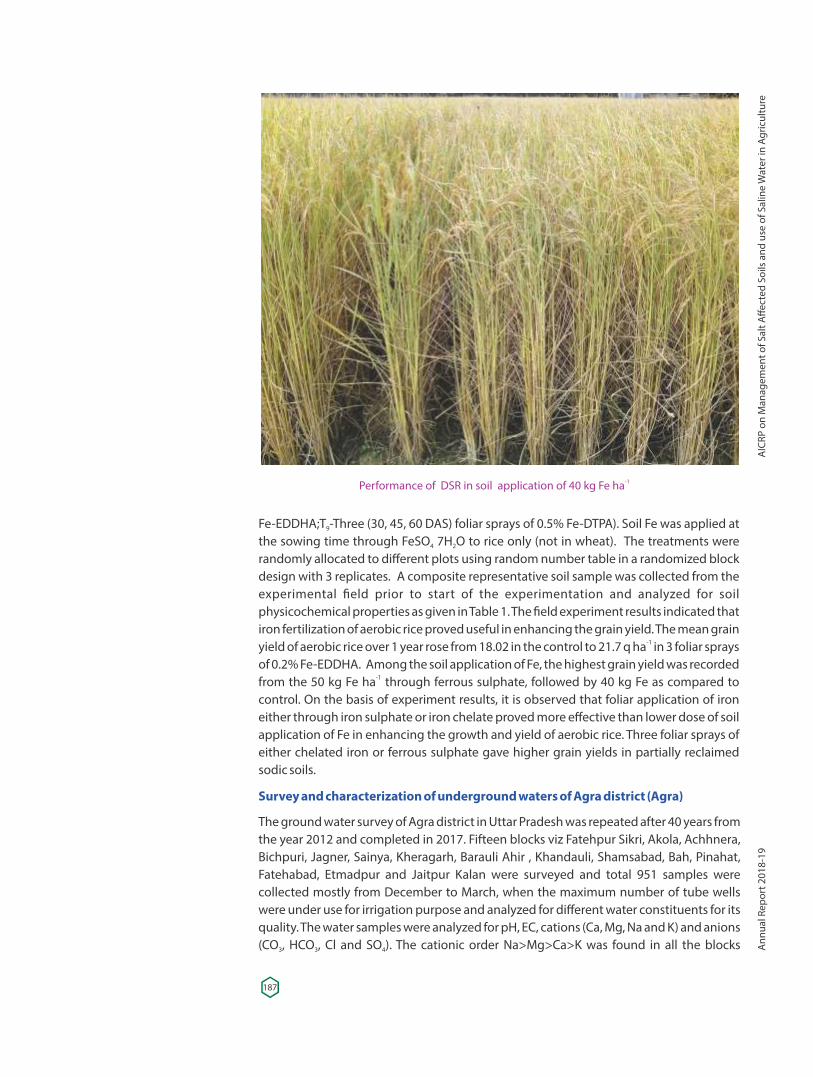
Fe-EDDHA;T -Three (30, 45, 60 DAS) foliar sprays of 0.5% Fe-DTPA). Soil Fe was applied at 9
the sowing time through FeSO 7H O to rice only (not in wheat). The treatments were 4 2
randomly allocated to different plots using random number table in a randomized block design with 3 replicates. A composite representative soil sample was collected from the experimental �eld prior to start of the experimentation and analyzed for soil physicochemical properties as given in Table 1. The �eld experiment results indicated that iron fertilization of aerobic rice proved useful in enhancing the grain yield. The mean grain
-1yield of aerobic rice over 1 year rose from 18.02 in the control to 21.7 q ha in 3 foliar sprays of 0.2% Fe-EDDHA. Among the soil application of Fe, the highest grain yield was recorded
-1from the 50 kg Fe ha through ferrous sulphate, followed by 40 kg Fe as compared to control. On the basis of experiment results, it is observed that foliar application of iron either through iron sulphate or iron chelate proved more effective than lower dose of soil application of Fe in enhancing the growth and yield of aerobic rice. Three foliar sprays of either chelated iron or ferrous sulphate gave higher grain yields in partially reclaimed sodic soils.
Survey and characterization of underground waters of Agra district (Agra)
The ground water survey of Agra district in Uttar Pradesh was repeated after 40 years from the year 2012 and completed in 2017. Fifteen blocks viz Fatehpur Sikri, Akola, Achhnera, Bichpuri, Jagner, Sainya, Kheragarh, Barauli Ahir , Khandauli, Shamsabad, Bah, Pinahat, Fatehabad, Etmadpur and Jaitpur Kalan were surveyed and total 951 samples were collected mostly from December to March, when the maximum number of tube wells were under use for irrigation purpose and analyzed for different water constituents for its quality. The water samples were analyzed for pH, EC, cations (Ca, Mg, Na and K) and anions (CO , HCO , Cl and SO ). The cationic order Na>Mg>Ca>K was found in all the blocks 3 3 4
-1Performance of DSR in soil application of 40 kg Fe ha
187
AIC
RP o
n M
anag
emen
t of S
alt A
ffect
ed S
oils
and
use
of S
alin
e W
ater
in A
gric
ultu
reA
nnua
l Rep
ort 2
018-
19
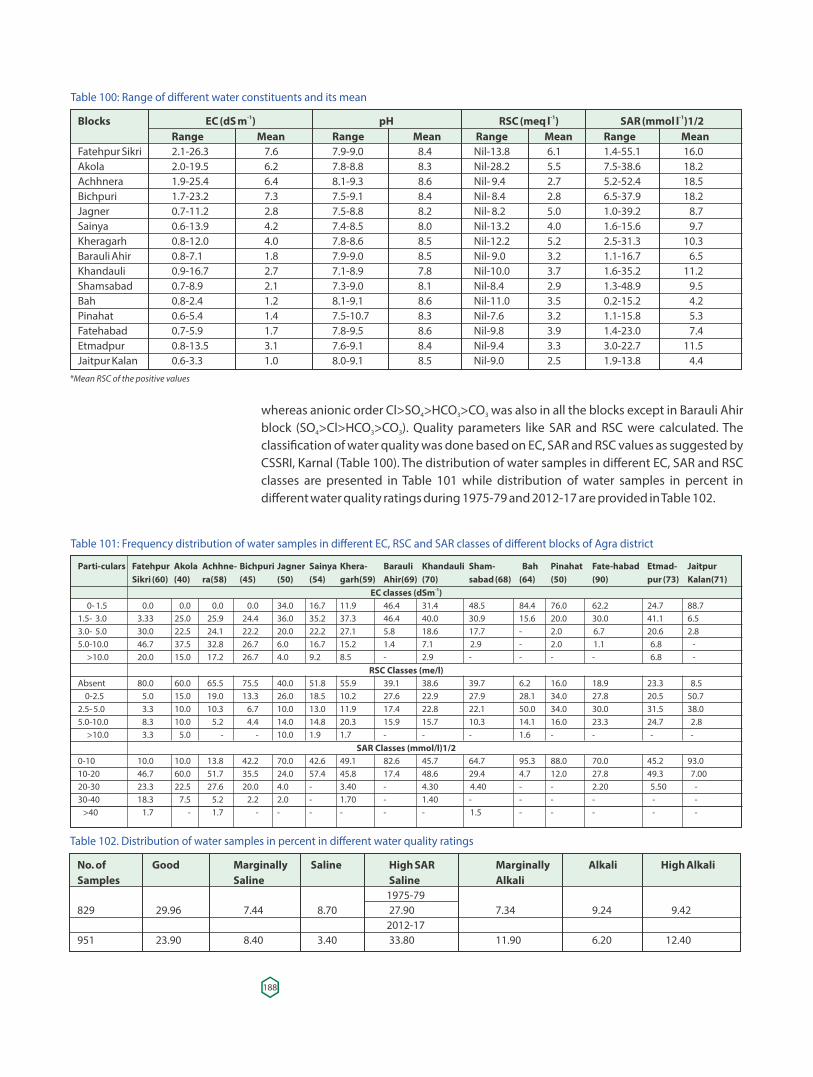
whereas anionic order Cl>SO >HCO >CO was also in all the blocks except in Barauli Ahir 4 3 3
block (SO >Cl>HCO >CO ). Quality parameters like SAR and RSC were calculated. The 4 3 3
classi�cation of water quality was done based on EC, SAR and RSC values as suggested by CSSRI, Karnal (Table 100). The distribution of water samples in different EC, SAR and RSC classes are presented in Table 101 while distribution of water samples in percent in different water quality ratings during 1975-79 and 2012-17 are provided in Table 102.
Table 100: Range of different water constituents and its mean
-1 -1 -1Blocks EC (dS m ) pH RSC (meq l ) SAR (mmol l )1/2 Range Mean Range Mean Range Mean Range MeanFatehpur Sikri 2.1-26.3 7.6 7.9-9.0 8.4 Nil-13.8 6.1 1.4-55.1 16.0Akola 2.0-19.5 6.2 7.8-8.8 8.3 Nil-28.2 5.5 7.5-38.6 18.2Achhnera 1.9-25.4 6.4 8.1-9.3 8.6 Nil- 9.4 2.7 5.2-52.4 18.5Bichpuri 1.7-23.2 7.3 7.5-9.1 8.4 Nil- 8.4 2.8 6.5-37.9 18.2Jagner 0.7-11.2 2.8 7.5-8.8 8.2 Nil- 8.2 5.0 1.0-39.2 8.7Sainya 0.6-13.9 4.2 7.4-8.5 8.0 Nil-13.2 4.0 1.6-15.6 9.7Kheragarh 0.8-12.0 4.0 7.8-8.6 8.5 Nil-12.2 5.2 2.5-31.3 10.3Barauli Ahir 0.8-7.1 1.8 7.9-9.0 8.5 Nil- 9.0 3.2 1.1-16.7 6.5Khandauli 0.9-16.7 2.7 7.1-8.9 7.8 Nil-10.0 3.7 1.6-35.2 11.2Shamsabad 0.7-8.9 2.1 7.3-9.0 8.1 Nil-8.4 2.9 1.3-48.9 9.5Bah 0.8-2.4 1.2 8.1-9.1 8.6 Nil-11.0 3.5 0.2-15.2 4.2Pinahat 0.6-5.4 1.4 7.5-10.7 8.3 Nil-7.6 3.2 1.1-15.8 5.3Fatehabad 0.7-5.9 1.7 7.8-9.5 8.6 Nil-9.8 3.9 1.4-23.0 7.4Etmadpur 0.8-13.5 3.1 7.6-9.1 8.4 Nil-9.4 3.3 3.0-22.7 11.5Jaitpur Kalan 0.6-3.3 1.0 8.0-9.1 8.5 Nil-9.0 2.5 1.9-13.8 4.4
*Mean RSC of the positive values
Table 101: Frequency distribution of water samples in different EC, RSC and SAR classes of different blocks of Agra district
Parti-culars Fatehpur Akola Achhne- Bichpuri Jagner Sainya Khera- Barauli Khandauli Sham- Bah Pinahat Fate-habad Etmad- Jaitpur Sikri (60) (40) ra(58) (45) (50) (54) garh(59) Ahir(69) (70) sabad (68) (64) (50) (90) pur (73) Kalan(71)
-1EC classes (dSm ) 0- 1.5 0.0 0.0 0.0 0.0 34.0 16.7 11.9 46.4 31.4 48.5 84.4 76.0 62.2 24.7 88.71.5- 3.0 3.33 25.0 25.9 24.4 36.0 35.2 37.3 46.4 40.0 30.9 15.6 20.0 30.0 41.1 6.53.0- 5.0 30.0 22.5 24.1 22.2 20.0 22.2 27.1 5.8 18.6 17.7 - 2.0 6.7 20.6 2.85.0-10.0 46.7 37.5 32.8 26.7 6.0 16.7 15.2 1.4 7.1 2.9 - 2.0 1.1 6.8 - >10.0 20.0 15.0 17.2 26.7 4.0 9.2 8.5 - 2.9 - - - - 6.8 -
RSC Classes (me/l)Absent 80.0 60.0 65.5 75.5 40.0 51.8 55.9 39.1 38.6 39.7 6.2 16.0 18.9 23.3 8.5 0-2.5 5.0 15.0 19.0 13.3 26.0 18.5 10.2 27.6 22.9 27.9 28.1 34.0 27.8 20.5 50.72.5- 5.0 3.3 10.0 10.3 6.7 10.0 13.0 11.9 17.4 22.8 22.1 50.0 34.0 30.0 31.5 38.05.0-10.0 8.3 10.0 5.2 4.4 14.0 14.8 20.3 15.9 15.7 10.3 14.1 16.0 23.3 24.7 2.8 >10.0 3.3 5.0 - - 10.0 1.9 1.7 - - - 1.6 - - - -
SAR Classes (mmol/l)1/20-10 10.0 10.0 13.8 42.2 70.0 42.6 49.1 82.6 45.7 64.7 95.3 88.0 70.0 45.2 93.010-20 46.7 60.0 51.7 35.5 24.0 57.4 45.8 17.4 48.6 29.4 4.7 12.0 27.8 49.3 7.0020-30 23.3 22.5 27.6 20.0 4.0 - 3.40 - 4.30 4.40 - - 2.20 5.50 -30-40 18.3 7.5 5.2 2.2 2.0 - 1.70 - 1.40 - - - - - - >40 1.7 - 1.7 - - - - - - 1.5 - - - - -
Table 102. Distribution of water samples in percent in different water quality ratings
No. of Good Marginally Saline High SAR Marginally Alkali High AlkaliSamples Saline Saline Alkali
1975-79829 29.96 7.44 8.70 27.90 7.34 9.24 9.42
2012-17951 23.90 8.40 3.40 33.80 11.90 6.20 12.40
188
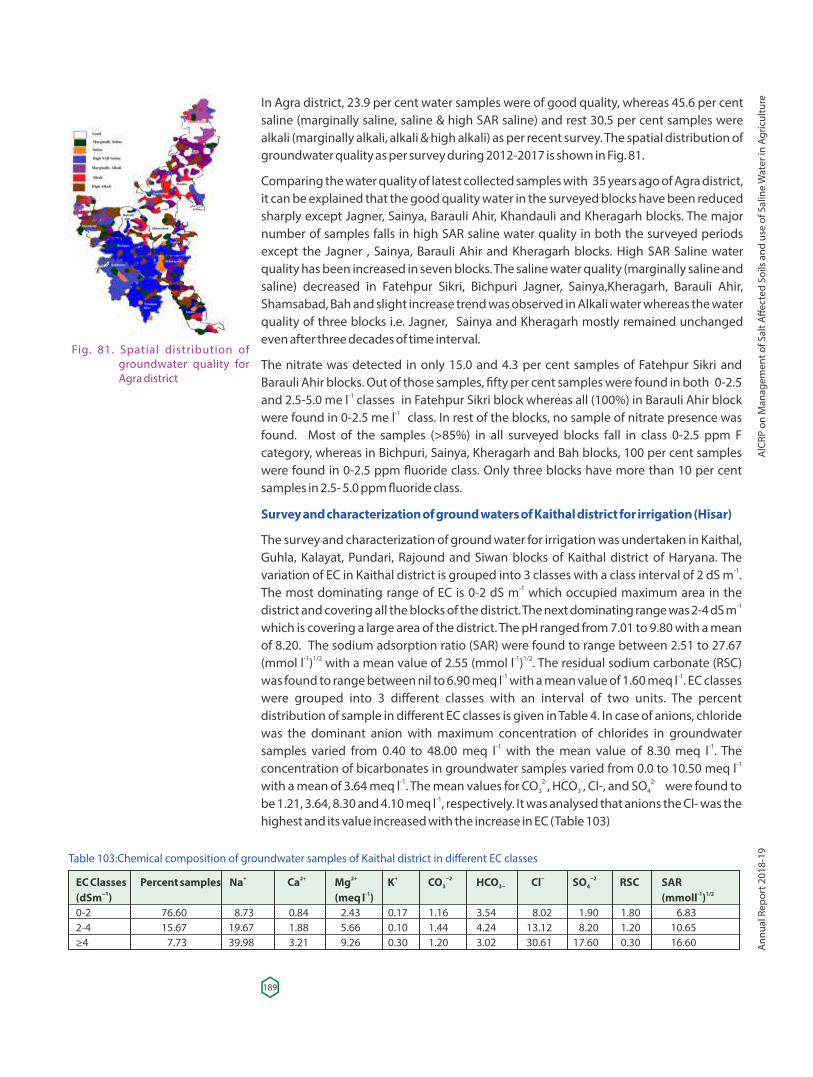
In Agra district, 23.9 per cent water samples were of good quality, whereas 45.6 per cent saline (marginally saline, saline & high SAR saline) and rest 30.5 per cent samples were alkali (marginally alkali, alkali & high alkali) as per recent survey. The spatial distribution of groundwater quality as per survey during 2012-2017 is shown in Fig. 81.
Comparing the water quality of latest collected samples with 35 years ago of Agra district, it can be explained that the good quality water in the surveyed blocks have been reduced sharply except Jagner, Sainya, Barauli Ahir, Khandauli and Kheragarh blocks. The major number of samples falls in high SAR saline water quality in both the surveyed periods except the Jagner , Sainya, Barauli Ahir and Kheragarh blocks. High SAR Saline water quality has been increased in seven blocks. The saline water quality (marginally saline and saline) decreased in Fatehpur Sikri, Bichpuri Jagner, Sainya,Kheragarh, Barauli Ahir, Shamsabad, Bah and slight increase trend was observed in Alkali water whereas the water quality of three blocks i.e. Jagner, Sainya and Kheragarh mostly remained unchanged even after three decades of time interval.
The nitrate was detected in only 15.0 and 4.3 per cent samples of Fatehpur Sikri and Barauli Ahir blocks. Out of those samples, �fty per cent samples were found in both 0-2.5
-1and 2.5-5.0 me l classes in Fatehpur Sikri block whereas all (100%) in Barauli Ahir block -1were found in 0-2.5 me l class. In rest of the blocks, no sample of nitrate presence was
found. Most of the samples (>85%) in all surveyed blocks fall in class 0-2.5 ppm F category, whereas in Bichpuri, Sainya, Kheragarh and Bah blocks, 100 per cent samples were found in 0-2.5 ppm �uoride class. Only three blocks have more than 10 per cent samples in 2.5- 5.0 ppm �uoride class.
Survey and characterization of ground waters of Kaithal district for irrigation (Hisar)
The survey and characterization of ground water for irrigation was undertaken in Kaithal, Guhla, Kalayat, Pundari, Rajound and Siwan blocks of Kaithal district of Haryana. The
-1variation of EC in Kaithal district is grouped into 3 classes with a class interval of 2 dS m . -1The most dominating range of EC is 0-2 dS m which occupied maximum area in the
-1district and covering all the blocks of the district. The next dominating range was 2-4 dS m which is covering a large area of the district. The pH ranged from 7.01 to 9.80 with a mean of 8.20. The sodium adsorption ratio (SAR) were found to range between 2.51 to 27.67
-1 1/2 -1 1/2(mmol l ) with a mean value of 2.55 (mmol l ) . The residual sodium carbonate (RSC) -1 -1was found to range between nil to 6.90 meq l with a mean value of 1.60 meq l . EC classes
were grouped into 3 different classes with an interval of two units. The percent distribution of sample in different EC classes is given in Table 4. In case of anions, chloride was the dominant anion with maximum concentration of chlorides in groundwater
-1 -1samples varied from 0.40 to 48.00 meq l with the mean value of 8.30 meq l . The -1concentration of bicarbonates in groundwater samples varied from 0.0 to 10.50 meq l
-1 2- - 2-with a mean of 3.64 meq l . The mean values for CO , HCO , Cl-, and SO were found to 3 3 4-1be 1.21, 3.64, 8.30 and 4.10 meq l , respectively. It was analysed that anions the Cl- was the
highest and its value increased with the increase in EC (Table 103)
Fig. 81. Spatial distribution of groundwater quality for Agra district
Table 103:Chemical composition of groundwater samples of Kaithal district in different EC classes
+ 2+ 2+ + −2 − −2EC Classes Percent samples Na Ca Mg K CO HCO Cl SO RSC SAR3 3− 4−1 -1 -1 1/2(dSm ) (meq l ) (mmoll )
0-2 76.60 8.73 0.84 2.43 0.17 1.16 3.54 8.02 1.90 1.80 6.832-4 15.67 19.67 1.88 5.66 0.10 1.44 4.24 13.12 8.20 1.20 10.65≥4 7.73 39.98 3.21 9.26 0.30 1.20 3.02 30.61 17.60 0.30 16.60
189
AIC
RP o
n M
anag
emen
t of S
alt A
ffect
ed S
oils
and
use
of S
alin
e W
ater
in A
gric
ultu
reA
nnua
l Rep
ort 2
018-
19
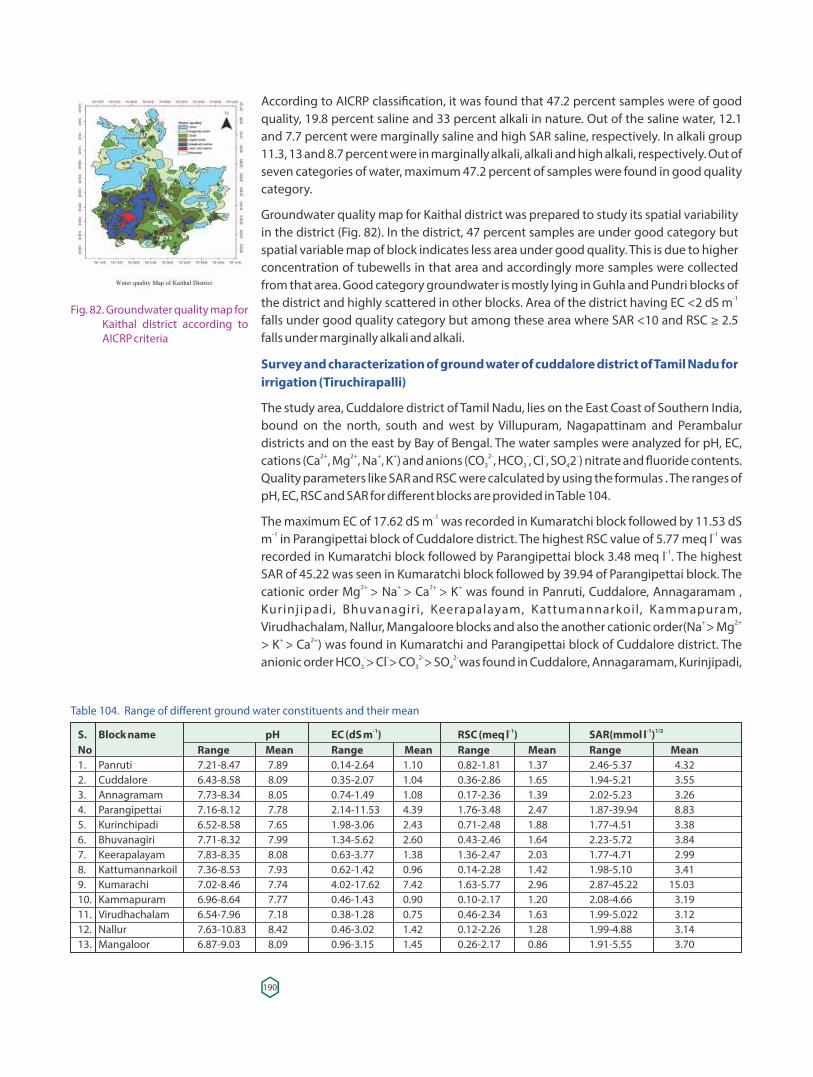
According to AICRP classi�cation, it was found that 47.2 percent samples were of good quality, 19.8 percent saline and 33 percent alkali in nature. Out of the saline water, 12.1 and 7.7 percent were marginally saline and high SAR saline, respectively. In alkali group 11.3, 13 and 8.7 percent were in marginally alkali, alkali and high alkali, respectively. Out of seven categories of water, maximum 47.2 percent of samples were found in good quality category.
Groundwater quality map for Kaithal district was prepared to study its spatial variability in the district (Fig. 82). In the district, 47 percent samples are under good category but spatial variable map of block indicates less area under good quality. This is due to higher concentration of tubewells in that area and accordingly more samples were collected from that area. Good category groundwater is mostly lying in Guhla and Pundri blocks of
-1the district and highly scattered in other blocks. Area of the district having EC <2 dS m falls under good quality category but among these area where SAR <10 and RSC ≥ 2.5 falls under marginally alkali and alkali.
Survey and characterization of ground water of cuddalore district of Tamil Nadu for irrigation (Tiruchirapalli)
The study area, Cuddalore district of Tamil Nadu, lies on the East Coast of Southern India, bound on the north, south and west by Villupuram, Nagapattinam and Perambalur districts and on the east by Bay of Bengal. The water samples were analyzed for pH, EC,
2+ + + 2- - - - cations (Ca , Mg , Na , K ) and anions (CO , HCO , Cl , SO 2 ) nitrate and �uoride contents. 3 3 42+
Quality parameters like SAR and RSC were calculated by using the formulas . The ranges of pH, EC, RSC and SAR for different blocks are provided in Table 104.
The maximum EC of 17.62 dS m was recorded in Kumaratchi block followed by 11.53 dS -1
m in Parangipettai block of Cuddalore district. The highest RSC value of 5.77 meq l was -1 -1
-1recorded in Kumaratchi block followed by Parangipettai block 3.48 meq l . The highest SAR of 45.22 was seen in Kumaratchi block followed by 39.94 of Parangipettai block. The cationic order Mg > Na > Ca > K was found in Panruti, Cuddalore, Annagaramam , 2+ + 2+ +
Kurinjipadi, Bhuvanagiri , Keerapalayam, Kattumannarkoil, Kammapuram, Virudhachalam, Nallur, Mangaloore blocks and also the another cationic order(Na > Mg+ 2+
> K > Ca ) was found in Kumaratchi and Parangipettai block of Cuddalore district. The + 2+
anionic order HCO > Cl > CO > SO was found in Cuddalore, Annagaramam, Kurinjipadi, - - 2- 2- 3 3 4
Fig. 82. Groundwater quality map for Kaithal district according to AICRP criteria
Table 104. Range of different ground water constituents and their mean
-1 -1 -1 1/2S. Block name pH EC (dS m ) RSC (meq l ) SAR(mmol l )No Range Mean Range Mean Range Mean Range Mean1. Panruti 7.21-8.47 7.89 0.14-2.64 1.10 0.82-1.81 1.37 2.46-5.37 4.322. Cuddalore 6.43-8.58 8.09 0.35-2.07 1.04 0.36-2.86 1.65 1.94-5.21 3.553. Annagramam 7.73-8.34 8.05 0.74-1.49 1.08 0.17-2.36 1.39 2.02-5.23 3.264. Parangipettai 7.16-8.12 7.78 2.14-11.53 4.39 1.76-3.48 2.47 1.87-39.94 8.835. Kurinchipadi 6.52-8.58 7.65 1.98-3.06 2.43 0.71-2.48 1.88 1.77-4.51 3.386. Bhuvanagiri 7.71-8.32 7.99 1.34-5.62 2.60 0.43-2.46 1.64 2.23-5.72 3.847. Keerapalayam 7.83-8.35 8.08 0.63-3.77 1.38 1.36-2.47 2.03 1.77-4.71 2.998. Kattumannarkoil 7.36-8.53 7.93 0.62-1.42 0.96 0.14-2.28 1.42 1.98-5.10 3.419. Kumarachi 7.02-8.46 7.74 4.02-17.62 7.42 1.63-5.77 2.96 2.87-45.22 15.0310. Kammapuram 6.96-8.64 7.77 0.46-1.43 0.90 0.10-2.17 1.20 2.08-4.66 3.1911. Virudhachalam 6.54-7.96 7.18 0.38-1.28 0.75 0.46-2.34 1.63 1.99-5.022 3.1212. Nallur 7.63-10.83 8.42 0.46-3.02 1.42 0.12-2.26 1.28 1.99-4.88 3.1413. Mangaloor 6.87-9.03 8.09 0.96-3.15 1.45 0.26-2.17 0.86 1.91-5.55 3.70
190
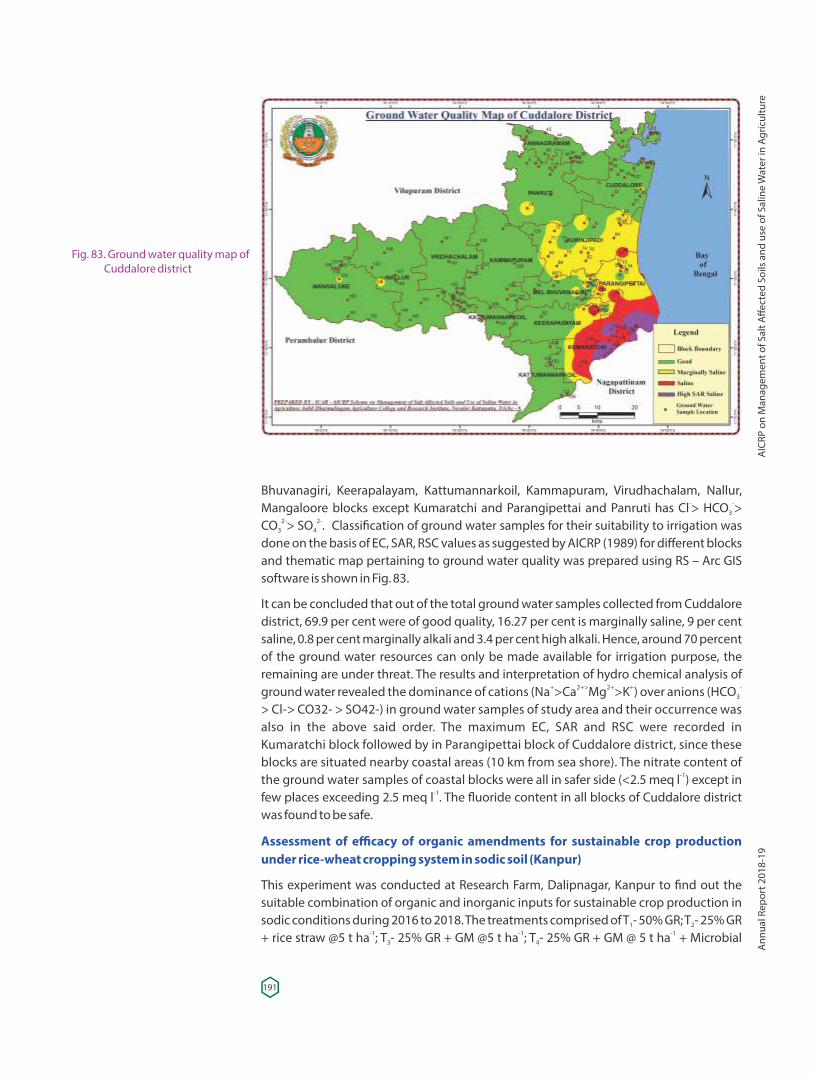
Bhuvanagiri, Keerapalayam, Kattumannarkoil, Kammapuram, Virudhachalam, Nallur, Mangaloore blocks except Kumaratchi and Parangipettai and Panruti has Cl > HCO > - -
3
CO > SO . Classi�cation of ground water samples for their suitability to irrigation was 2- 2-3 4
done on the basis of EC, SAR, RSC values as suggested by AICRP (1989) for different blocks and thematic map pertaining to ground water quality was prepared using RS – Arc GIS software is shown in Fig. 83.
It can be concluded that out of the total ground water samples collected from Cuddalore district, 69.9 per cent were of good quality, 16.27 per cent is marginally saline, 9 per cent saline, 0.8 per cent marginally alkali and 3.4 per cent high alkali. Hence, around 70 percent of the ground water resources can only be made available for irrigation purpose, the remaining are under threat. The results and interpretation of hydro chemical analysis of ground water revealed the dominance of cations (Na >Ca Mg >K ) over anions (+ 2+> 2+ + -HCO3
> Cl-> CO32- > SO42-) in ground water samples of study area and their occurrence was also in the above said order. The maximum EC, SAR and RSC were recorded in Kumaratchi block followed by in Parangipettai block of Cuddalore district, since these blocks are situated nearby coastal areas (10 km from sea shore). The nitrate content of the ground water samples of coastal blocks were all in safer side (<2.5 meq l ) except in -1
few places exceeding 2.5 meq l . The �uoride content in all blocks of Cuddalore district -1
was found to be safe.
Assessment of efficacy of organic amendments for sustainable crop production under rice-wheat cropping system in sodic soil (Kanpur)
This experiment was conducted at Research Farm, Dalipnagar, Kanpur to �nd out the suitable combination of organic and inorganic inputs for sustainable crop production in sodic conditions during 2016 to 2018. The treatments comprised of T - 50% GR; T - 25% GR 1 2
+ rice straw @5 t ha ; T - 25% GR + GM @5 t ha ; T - 25% GR + GM @ 5 t ha + Microbial -1 -1 -13 4
Fig. 83. Ground water quality map of Cuddalore district
191
AIC
RP o
n M
anag
emen
t of S
alt A
ffect
ed S
oils
and
use
of S
alin
e W
ater
in A
gric
ultu
reA
nnua
l Rep
ort 2
018-
19
culture; T - 25%GR + Poultry manure @ 3 t ha ; T - 25% GR + City Waste Manure @5 t ha -1 -15 6
and T - Control. Rice variety CSR 36 and wheat variety KRL 210 were sown during kharif 7
and rabi season. The initial soil status was pH 9.50, EC ( 0.94 dS m ), ESP 48.20 and OC -1
0.21%. The average grain yield of rice varied from 2.42 to 4.14 and straw yield 2.90-5.03 t ha (Table 105). The maximum grain yield (4.14 t ha ) and straw yield (5.03 t ha ) was -1 -1 -1
obtained from 25% GR + Poultry Manure @ 3 t ha treatment followed by 25% GR + GM @5 -1
t ha + Microbial culture and 25% GR + City Waste Manure @ 5 t ha . The average grain -1 -1
yield of wheat varied between 1.93 - 3.60 and straw yield between 2.38– 4.40 t ha (Table -1
106). The maximum grain yield (3.60 t ha ) and straw yield (4.40 t ha ) were obtained from -1 -1
25% GR + Poultry Manure @ 3 t ha followed by 25% GR + GM @ 5 t ha + Microbial culture -1 -1
and 25% GR + City Waste Manure @ 5 t ha . The soil properties improved with the -1
application of different treatments as compared to control. The maximum changes in pH, EC, ESP and OC in 50% GR followed by 25% GR + Poultry manure @3t ha and 25% GR + -1
GM @5 t ha + Microbial culture as compared to other treatments (Table 107). -1
Evaluation of subsurface drip irrigation on soil physico-chemical properties, growth and yield of salt tolerant sugarcane in saline vertisols of Tungabhadra Command Area (Gangavathi)
The experiment on evaluation of subsurface drip irrigation on soil physico-chemical properties, growth and yield of salt tolerant sugarcane in saline Vertisols was initiated during summer 2013-14 at Agricultural Research Station, Gangavati and continued during 2016-17. The experiment was laid out in three replications with main treatments such as surface drip (M1), subsurface drip (M2) and furrow irrigation (control) (M3) and sub treatments such as 0.8 (S1), 1.0 (S2) and 1.2 (S3) ET treatments. The sugarcane salt tolerant variety viz, Co-91010 (Dhanush) procured from Mudhol was sown during Feb-2014 in paired row system (0.6x1.20x0.6 m). The 16 mm inline pressure compensated (PC) anti siphon drippers (dripnet) with emitter spacing of 0.4 m and discharge 1.6 LPH were
-1Table 105. Effect of different treatments on grain and straw yield of rice (t ha )
Treatments Grain yield Straw yield 2016 2017 Mean 2016 2017 MeanT1- 50% GR 3.54 3.68 3.61 4.16 4.36 4.26
-1T2- 25% GR + rice straw @ 5 t ha 3.34 3.46 3.40 3.99 4.15 4.07-1T3- 25% GR + GM @ 5 t ha 3.77 3.90 3.84 4.55 4.70 4.62-1T4- 25% GR + GM @ 5 t ha + Microbial culture 3.93 4.08 4.01 4.75 4.94 4.89
-1T5- 25% GR + Poultry manure @ 3 t ha 4.07 4.22 4.14 4.97 5.10 5.03-1T6- 25% GR + City Waste Manure @ 5 t ha 3.85 3.97 3.89 4.59 4.79 4.69
T7 - Control 2.38 2.46 2.42 2.84 2.97 2.91CD (0.05) 1.87 1.93 -- 2.01 2.27 --
-1Table 106. Effect of different treatments on grain and straw yield of wheat (t ha )
Treatments Grain yield Straw yield 2016-17 2017-18 Mean 2016-17 2017-18 MeanT1- 50% GR 3.05 3.20 3.12 3.73 3.90 3.81
-1T2- 25% GR + rice straw @5 t ha 2.87 2.97 2.92 3.50 3.62 3.56-1T3- 25% GR + GM @ 5 t ha 2.97 3.03 3.00 3.65 3.81 3.73
-1T4- 25%GR + GM @ 5 t ha + Microbial culture 3.22 3.39 3.30 3.95 4.16 4.05-1T5- 25% GR + Poultry manure @ 3 t ha 3.53 3.67 3.60 4.31 4.48 4.50
-1T6- 25%GR + City Waste Manure @ 5 t ha 3.38 3.52 3.45 4.08 4.32 4.20T7 - Control 1.91 1.96 1.93 2.33 2.43 2.38CD (0.05) 0.19 0.19 -- 0.21 0.22 --
192
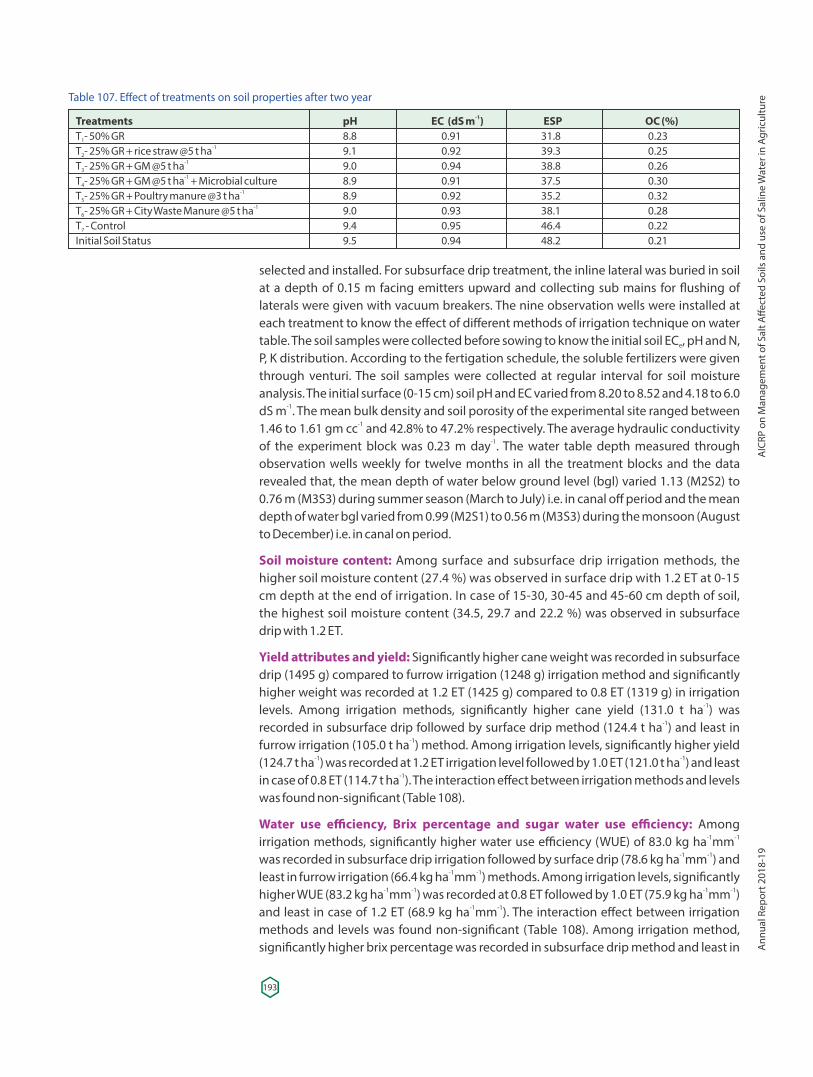
Table 107. Effect of treatments on soil properties after two year
-1Treatments pH EC (dS m ) ESP OC (%)T - 50% GR 8.8 0.91 31.8 0.231
-1T - 25% GR + rice straw @5 t ha 9.1 0.92 39.3 0.252-1T - 25% GR + GM @5 t ha 9.0 0.94 38.8 0.263-1T - 25% GR + GM @5 t ha + Microbial culture 8.9 0.91 37.5 0.304
-1 T - 25% GR + Poultry manure @3 t ha 8.9 0.92 35.2 0.325-1 T - 25% GR + City Waste Manure @5 t ha 9.0 0.93 38.1 0.286
T - Control 9.4 0.95 46.4 0.227
Initial Soil Status 9.5 0.94 48.2 0.21
selected and installed. For subsurface drip treatment, the inline lateral was buried in soil at a depth of 0.15 m facing emitters upward and collecting sub mains for �ushing of laterals were given with vacuum breakers. The nine observation wells were installed at each treatment to know the effect of different methods of irrigation technique on water table. The soil samples were collected before sowing to know the initial soil EC , pH and N, e
P, K distribution. According to the fertigation schedule, the soluble fertilizers were given through venturi. The soil samples were collected at regular interval for soil moisture analysis. The initial surface (0-15 cm) soil pH and EC varied from 8.20 to 8.52 and 4.18 to 6.0
-1dS m . The mean bulk density and soil porosity of the experimental site ranged between -11.46 to 1.61 gm cc and 42.8% to 47.2% respectively. The average hydraulic conductivity
-1of the experiment block was 0.23 m day . The water table depth measured through observation wells weekly for twelve months in all the treatment blocks and the data revealed that, the mean depth of water below ground level (bgl) varied 1.13 (M2S2) to 0.76 m (M3S3) during summer season (March to July) i.e. in canal off period and the mean depth of water bgl varied from 0.99 (M2S1) to 0.56 m (M3S3) during the monsoon (August to December) i.e. in canal on period.
Soil moisture content: Among surface and subsurface drip irrigation methods, the higher soil moisture content (27.4 %) was observed in surface drip with 1.2 ET at 0-15 cm depth at the end of irrigation. In case of 15-30, 30-45 and 45-60 cm depth of soil, the highest soil moisture content (34.5, 29.7 and 22.2 %) was observed in subsurface drip with 1.2 ET.
Yield attributes and yield: Signi�cantly higher cane weight was recorded in subsurface drip (1495 g) compared to furrow irrigation (1248 g) irrigation method and signi�cantly higher weight was recorded at 1.2 ET (1425 g) compared to 0.8 ET (1319 g) in irrigation levels. Among irrigation methods, signi�cantly higher cane yield (131.0 t ha ) was -1
recorded in subsurface drip followed by surface drip method (124.4 t ha ) and least in -1
furrow irrigation (105.0 t ha ) method. Among irrigation levels, signi�cantly higher yield -1
(124.7 t ha ) was recorded at 1.2 ET irrigation level followed by 1.0 ET (121.0 t ha ) and least -1 -1
in case of 0.8 ET (114.7 t ha ). The interaction effect between irrigation methods and levels -1
was found non-signi�cant (Table 108).
Water use efficiency, Brix percentage and sugar water use efficiency: Among -1 -1irrigation methods, signi�cantly higher water use efficiency (WUE) of 83.0 kg ha mm
-1 -1was recorded in subsurface drip irrigation followed by surface drip (78.6 kg ha mm ) and -1 -1least in furrow irrigation (66.4 kg ha mm ) methods. Among irrigation levels, signi�cantly
-1 -1 -1 -1higher WUE (83.2 kg ha mm ) was recorded at 0.8 ET followed by 1.0 ET (75.9 kg ha mm ) -1 -1and least in case of 1.2 ET (68.9 kg ha mm ). The interaction effect between irrigation
methods and levels was found non-signi�cant (Table 108). Among irrigation method, signi�cantly higher brix percentage was recorded in subsurface drip method and least in
193
AIC
RP o
n M
anag
emen
t of S
alt A
ffect
ed S
oils
and
use
of S
alin
e W
ater
in A
gric
ultu
reA
nnua
l Rep
ort 2
018-
19
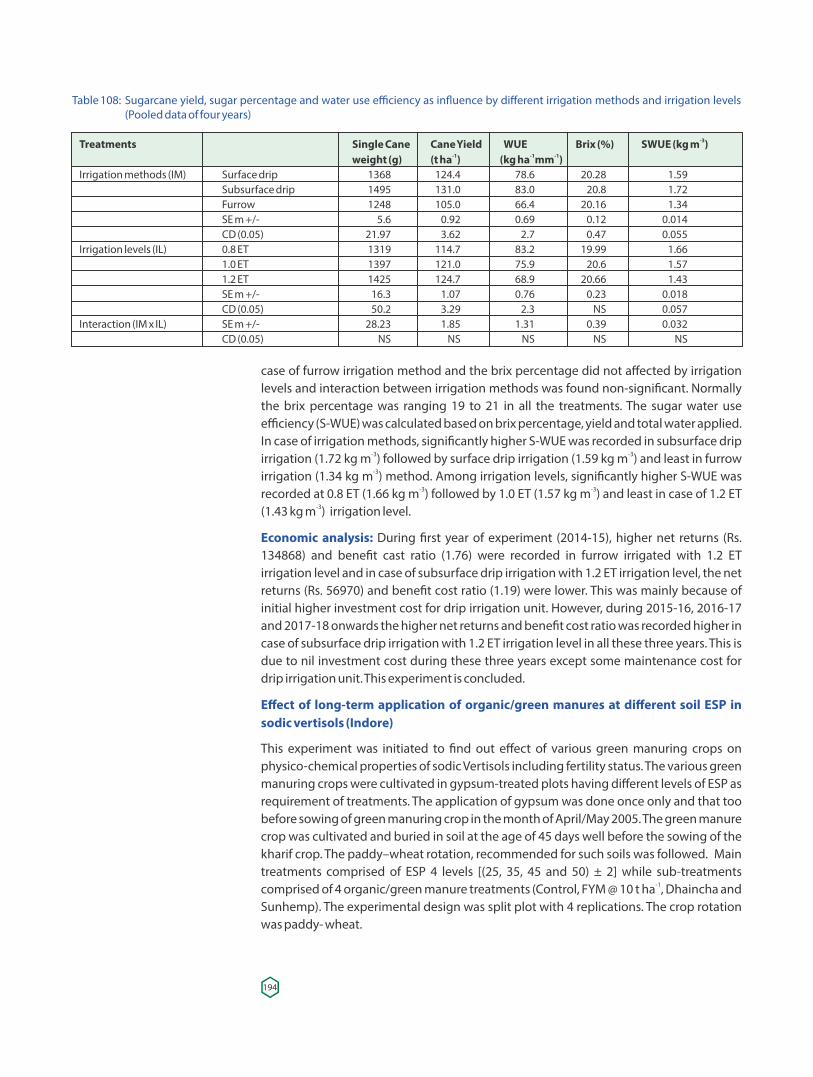
case of furrow irrigation method and the brix percentage did not affected by irrigation levels and interaction between irrigation methods was found non-signi�cant. Normally the brix percentage was ranging 19 to 21 in all the treatments. The sugar water use efficiency (S-WUE) was calculated based on brix percentage, yield and total water applied. In case of irrigation methods, signi�cantly higher S-WUE was recorded in subsurface drip
-3 -3irrigation (1.72 kg m ) followed by surface drip irrigation (1.59 kg m ) and least in furrow -3irrigation (1.34 kg m ) method. Among irrigation levels, signi�cantly higher S-WUE was
-3 -3recorded at 0.8 ET (1.66 kg m ) followed by 1.0 ET (1.57 kg m ) and least in case of 1.2 ET -3(1.43 kg m ) irrigation level.
Economic analysis: During �rst year of experiment (2014-15), higher net returns (Rs. 134868) and bene�t cast ratio (1.76) were recorded in furrow irrigated with 1.2 ET irrigation level and in case of subsurface drip irrigation with 1.2 ET irrigation level, the net returns (Rs. 56970) and bene�t cost ratio (1.19) were lower. This was mainly because of initial higher investment cost for drip irrigation unit. However, during 2015-16, 2016-17 and 2017-18 onwards the higher net returns and bene�t cost ratio was recorded higher in case of subsurface drip irrigation with 1.2 ET irrigation level in all these three years. This is due to nil investment cost during these three years except some maintenance cost for drip irrigation unit. This experiment is concluded.
Effect of long-term application of organic/green manures at different soil ESP in sodic vertisols (Indore)
This experiment was initiated to �nd out effect of various green manuring crops on physico-chemical properties of sodic Vertisols including fertility status. The various green manuring crops were cultivated in gypsum-treated plots having different levels of ESP as requirement of treatments. The application of gypsum was done once only and that too before sowing of green manuring crop in the month of April/May 2005. The green manure crop was cultivated and buried in soil at the age of 45 days well before the sowing of the kharif crop. The paddy–wheat rotation, recommended for such soils was followed. Main treatments comprised of ESP 4 levels [(25, 35, 45 and 50) ± 2] while sub-treatments comprised of 4 organic/green manure treatments (Control, FYM @ 10 t ha , Dhaincha and -1
Sunhemp). The experimental design was split plot with 4 replications. The crop rotation was paddy- wheat.
Table 108: Sugarcane yield, sugar percentage and water use efficiency as in�uence by different irrigation methods and irrigation levels (Pooled data of four years)
-3Treatments Single Cane Cane Yield WUE Brix (%) SWUE (kg m )-1 -1 -1 weight (g) (t ha ) (kg ha mm )
Irrigation methods (IM) Surface drip 1368 124.4 78.6 20.28 1.59 Subsurface drip 1495 131.0 83.0 20.8 1.72 Furrow 1248 105.0 66.4 20.16 1.34 SE m +/- 5.6 0.92 0.69 0.12 0.014 CD (0.05) 21.97 3.62 2.7 0.47 0.055Irrigation levels (IL) 0.8 ET 1319 114.7 83.2 19.99 1.66 1.0 ET 1397 121.0 75.9 20.6 1.57 1.2 ET 1425 124.7 68.9 20.66 1.43 SE m +/- 16.3 1.07 0.76 0.23 0.018 CD (0.05) 50.2 3.29 2.3 NS 0.057Interaction (IM x IL) SE m +/- 28.23 1.85 1.31 0.39 0.032 CD (0.05) NS NS NS NS NS
194
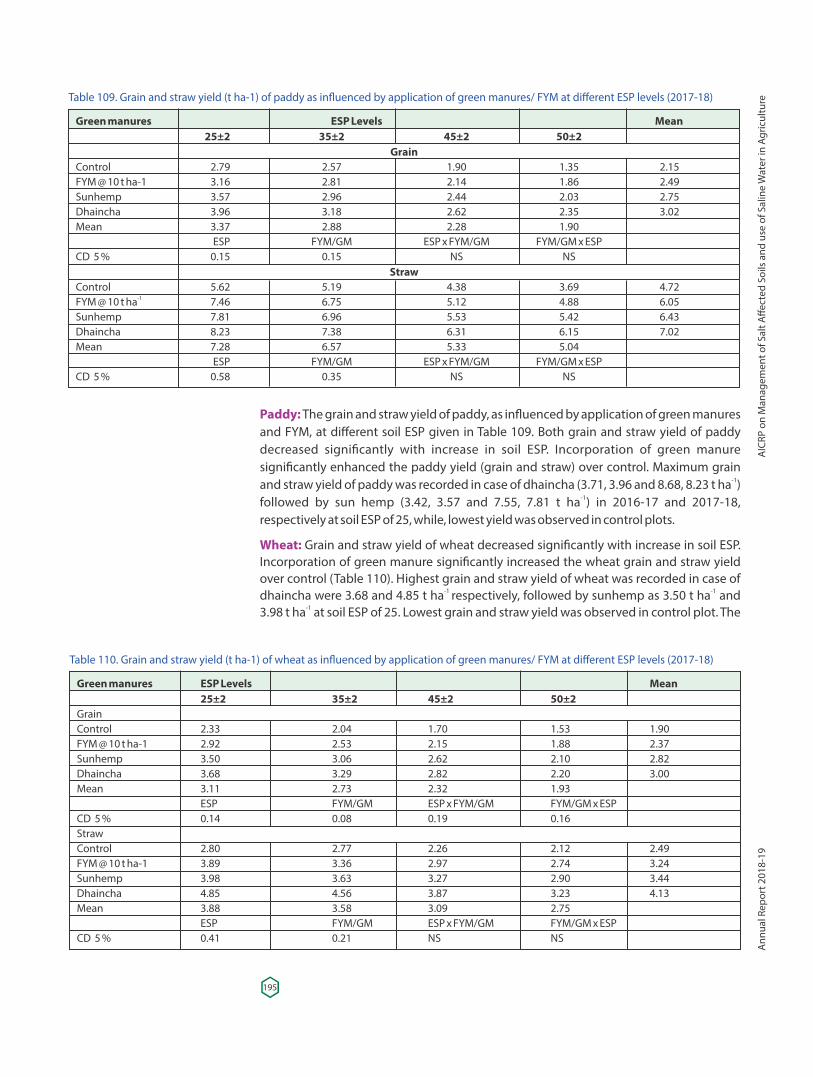
Paddy: The grain and straw yield of paddy, as in�uenced by application of green manures and FYM, at different soil ESP given in Table 109. Both grain and straw yield of paddy decreased signi�cantly with increase in soil ESP. Incorporation of green manure signi�cantly enhanced the paddy yield (grain and straw) over control. Maximum grain
-1and straw yield of paddy was recorded in case of dhaincha (3.71, 3.96 and 8.68, 8.23 t ha ) -1followed by sun hemp (3.42, 3.57 and 7.55, 7.81 t ha ) in 2016-17 and 2017-18,
respectively at soil ESP of 25, while, lowest yield was observed in control plots.
Wheat: Grain and straw yield of wheat decreased signi�cantly with increase in soil ESP. Incorporation of green manure signi�cantly increased the wheat grain and straw yield over control (Table 110). Highest grain and straw yield of wheat was recorded in case of dhaincha were 3.68 and 4.85 t ha respectively, followed by sunhemp as 3.50 t ha and -1 -1
3.98 t ha at soil ESP of 25. Lowest grain and straw yield was observed in control plot. The -1
Table 109. Grain and straw yield (t ha-1) of paddy as in�uenced by application of green manures/ FYM at different ESP levels (2017-18)
Green manures ESP Levels Mean 25±2 35±2 45±2 50±2
GrainControl 2.79 2.57 1.90 1.35 2.15FYM @ 10 t ha-1 3.16 2.81 2.14 1.86 2.49Sunhemp 3.57 2.96 2.44 2.03 2.75Dhaincha 3.96 3.18 2.62 2.35 3.02Mean 3.37 2.88 2.28 1.90 ESP FYM/GM ESP x FYM/GM FYM/GM x ESP CD 5 % 0.15 0.15 NS NS
StrawControl 5.62 5.19 4.38 3.69 4.72
-1FYM @ 10 t ha 7.46 6.75 5.12 4.88 6.05Sunhemp 7.81 6.96 5.53 5.42 6.43Dhaincha 8.23 7.38 6.31 6.15 7.02Mean 7.28 6.57 5.33 5.04 ESP FYM/GM ESP x FYM/GM FYM/GM x ESP CD 5 % 0.58 0.35 NS NS
Table 110. Grain and straw yield (t ha-1) of wheat as in�uenced by application of green manures/ FYM at different ESP levels (2017-18)
Green manures ESP Levels Mean 25±2 35±2 45±2 50±2 GrainControl 2.33 2.04 1.70 1.53 1.90FYM @ 10 t ha-1 2.92 2.53 2.15 1.88 2.37Sunhemp 3.50 3.06 2.62 2.10 2.82Dhaincha 3.68 3.29 2.82 2.20 3.00Mean 3.11 2.73 2.32 1.93 ESP FYM/GM ESP x FYM/GM FYM/GM x ESP CD 5 % 0.14 0.08 0.19 0.16 StrawControl 2.80 2.77 2.26 2.12 2.49FYM @ 10 t ha-1 3.89 3.36 2.97 2.74 3.24Sunhemp 3.98 3.63 3.27 2.90 3.44Dhaincha 4.85 4.56 3.87 3.23 4.13Mean 3.88 3.58 3.09 2.75 ESP FYM/GM ESP x FYM/GM FYM/GM x ESP CD 5 % 0.41 0.21 NS NS
195
AIC
RP o
n M
anag
emen
t of S
alt A
ffect
ed S
oils
and
use
of S
alin
e W
ater
in A
gric
ultu
reA
nnua
l Rep
ort 2
018-
19
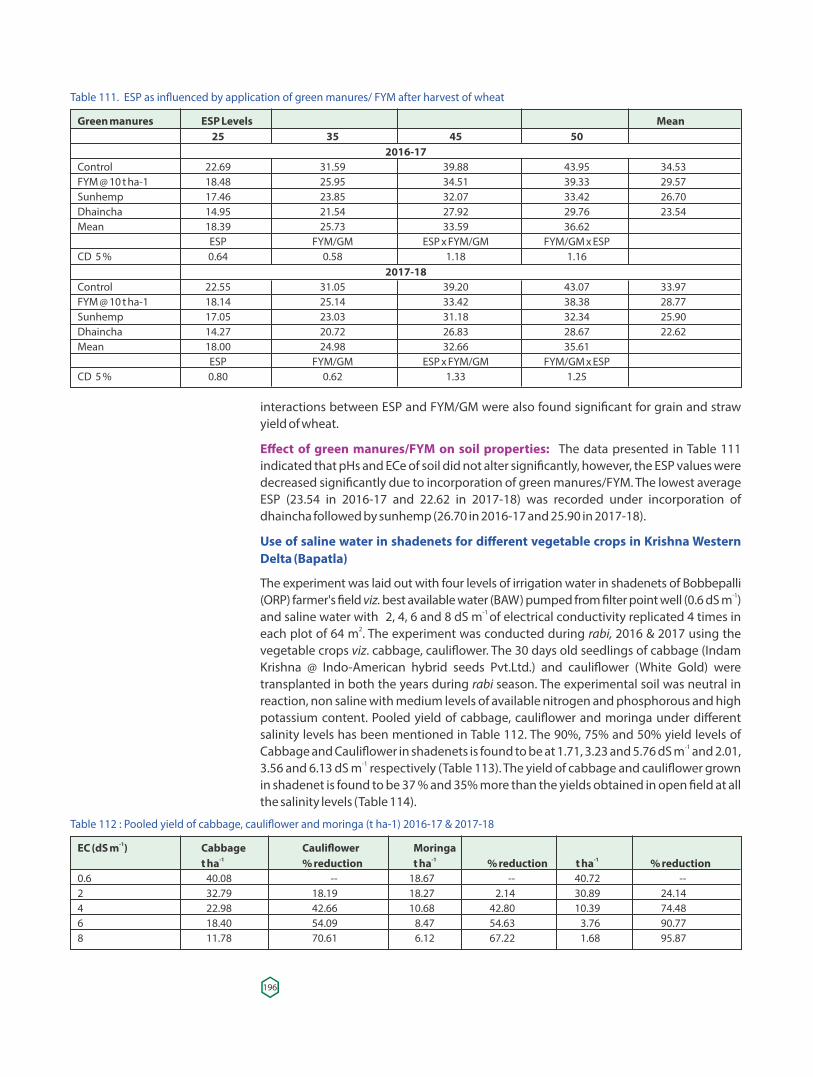
interactions between ESP and FYM/GM were also found signi�cant for grain and straw yield of wheat.
Effect of green manures/FYM on soil properties: The data presented in Table 111 indicated that pHs and ECe of soil did not alter signi�cantly, however, the ESP values were decreased signi�cantly due to incorporation of green manures/FYM. The lowest average ESP (23.54 in 2016-17 and 22.62 in 2017-18) was recorded under incorporation of dhaincha followed by sunhemp (26.70 in 2016-17 and 25.90 in 2017-18).
Use of saline water in shadenets for different vegetable crops in Krishna Western Delta (Bapatla)
The experiment was laid out with four levels of irrigation water in shadenets of Bobbepalli -1(ORP) farmer's �eld best available water (BAW) pumped from �lter point well (0.6 dS m ) viz.
-1 and saline water with 2, 4, 6 and 8 dS m of electrical conductivity replicated 4 times in 2each plot of 64 m . The experiment was conducted during 2016 & 2017 using the rabi,
vegetable crops . cabbage, cauli�ower. The 30 days old seedlings of cabbage (Indam vizKrishna @ Indo-American hybrid seeds Pvt.Ltd.) and cauli�ower (White Gold) were transplanted in both the years during season. The experimental soil was neutral in rabi reaction, non saline with medium levels of available nitrogen and phosphorous and high potassium content. Pooled yield of cabbage, cauli�ower and moringa under different salinity levels has been mentioned in Table 112. The 90%, 75% and 50% yield levels of
-1Cabbage and Cauli�ower in shadenets is found to be at 1.71, 3.23 and 5.76 dS m and 2.01, -13.56 and 6.13 dS m respectively (Table 113). The yield of cabbage and cauli�ower grown
in shadenet is found to be 37 % and 35% more than the yields obtained in open �eld at all the salinity levels (Table 114).
Table 111. ESP as in�uenced by application of green manures/ FYM after harvest of wheat
Green manures ESP Levels Mean 25 35 45 50
2016-17Control 22.69 31.59 39.88 43.95 34.53FYM @ 10 t ha-1 18.48 25.95 34.51 39.33 29.57Sunhemp 17.46 23.85 32.07 33.42 26.70Dhaincha 14.95 21.54 27.92 29.76 23.54Mean 18.39 25.73 33.59 36.62 ESP FYM/GM ESP x FYM/GM FYM/GM x ESP CD 5 % 0.64 0.58 1.18 1.16
2017-18Control 22.55 31.05 39.20 43.07 33.97FYM @ 10 t ha-1 18.14 25.14 33.42 38.38 28.77Sunhemp 17.05 23.03 31.18 32.34 25.90Dhaincha 14.27 20.72 26.83 28.67 22.62Mean 18.00 24.98 32.66 35.61 ESP FYM/GM ESP x FYM/GM FYM/GM x ESP CD 5 % 0.80 0.62 1.33 1.25
Table 112 : Pooled yield of cabbage, cauli�ower and moringa (t ha-1) 2016-17 & 2017-18
-1EC (dS m ) Cabbage Cauli�ower Moringa-1 -1 -1 t ha % reduction t ha % reduction t ha % reduction
0.6 40.08 -- 18.67 -- 40.72 --2 32.79 18.19 18.27 2.14 30.89 24.144 22.98 42.66 10.68 42.80 10.39 74.486 18.40 54.09 8.47 54.63 3.76 90.778 11.78 70.61 6.12 67.22 1.68 95.87
196
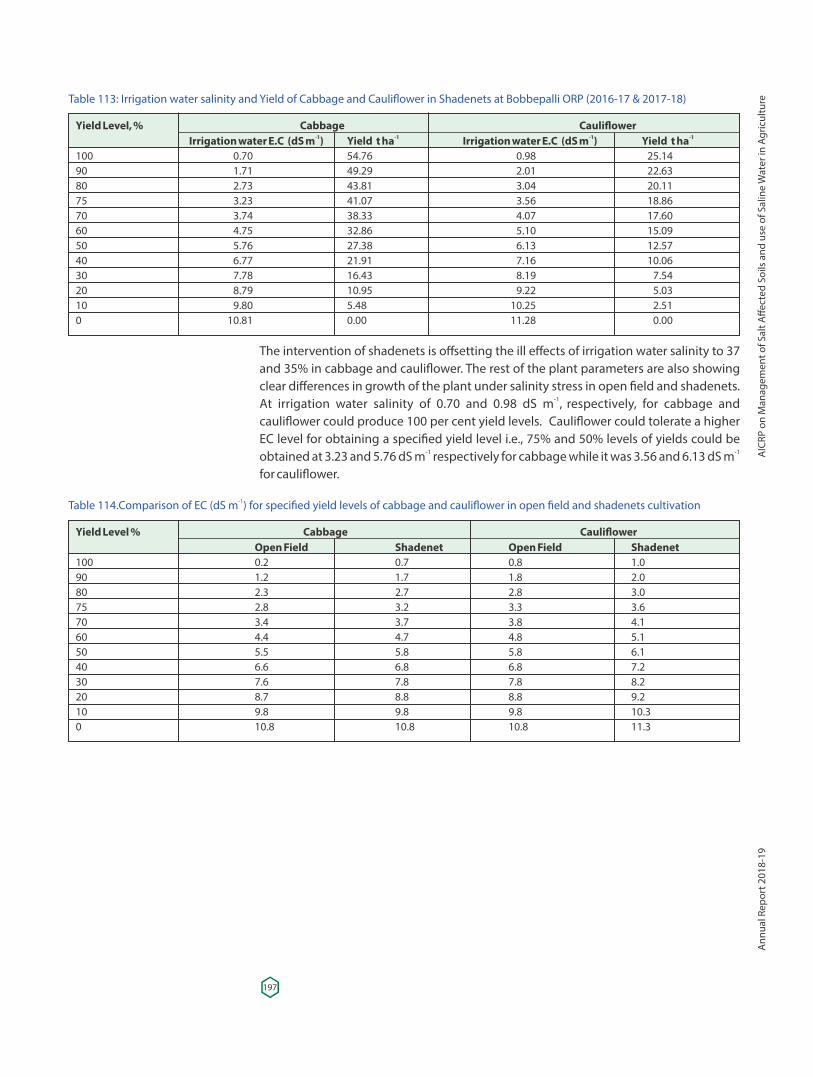
Table 113: Irrigation water salinity and Yield of Cabbage and Cauli�ower in Shadenets at Bobbepalli ORP (2016-17 & 2017-18)
Yield Level, % Cabbage Cauli�ower-1 -1 -1 -1 Irrigation water E.C (dS m ) Yield t ha Irrigation water E.C (dS m ) Yield t ha
100 0.70 54.76 0.98 25.1490 1.71 49.29 2.01 22.6380 2.73 43.81 3.04 20.1175 3.23 41.07 3.56 18.8670 3.74 38.33 4.07 17.6060 4.75 32.86 5.10 15.0950 5.76 27.38 6.13 12.5740 6.77 21.91 7.16 10.0630 7.78 16.43 8.19 7.5420 8.79 10.95 9.22 5.0310 9.80 5.48 10.25 2.510 10.81 0.00 11.28 0.00
-1Table 114. Comparison of EC (dS m ) for speci�ed yield levels of cabbage and cauli�ower in open �eld and shadenets cultivation
Yield Level % Cabbage Cauli�ower Open Field Shadenet Open Field Shadenet100 0.2 0.7 0.8 1.090 1.2 1.7 1.8 2.080 2.3 2.7 2.8 3.075 2.8 3.2 3.3 3.670 3.4 3.7 3.8 4.160 4.4 4.7 4.8 5.150 5.5 5.8 5.8 6.140 6.6 6.8 6.8 7.230 7.6 7.8 7.8 8.220 8.7 8.8 8.8 9.210 9.8 9.8 9.8 10.30 10.8 10.8 10.8 11.3
The intervention of shadenets is offsetting the ill effects of irrigation water salinity to 37 and 35% in cabbage and cauli�ower. The rest of the plant parameters are also showing clear differences in growth of the plant under salinity stress in open �eld and shadenets.
-1At irrigation water salinity of 0.70 and 0.98 dS m , respectively, for cabbage and
cauli�ower could produce 100 per cent yield levels. Cauli�ower could tolerate a higher EC level for obtaining a speci�ed yield level i.e., 75% and 50% levels of yields could be
-1 -1obtained at 3.23 and 5.76 dS m respectively for cabbage while it was 3.56 and 6.13 dS m for cauli�ower.
197
AIC
RP o
n M
anag
emen
t of S
alt A
ffect
ed S
oils
and
use
of S
alin
e W
ater
in A
gric
ultu
reA
nnua
l Rep
ort 2
018-
19
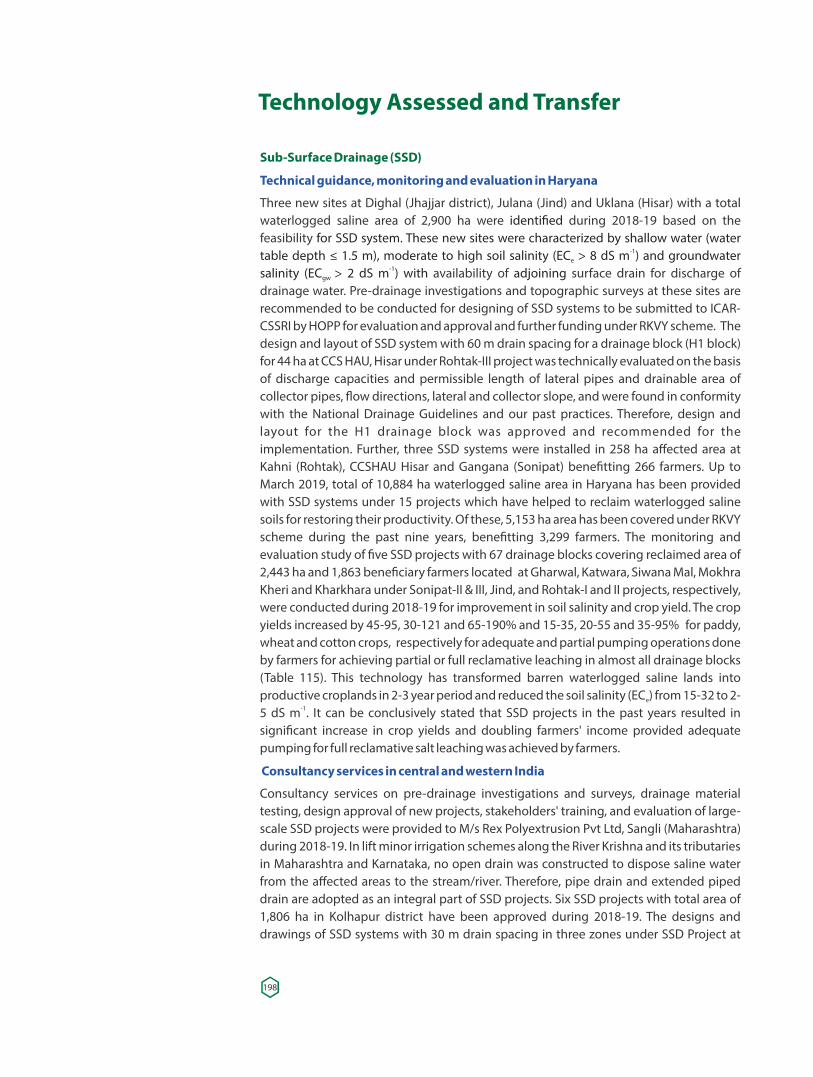
Technology Assessed and Transfer
Sub-Surface Drainage (SSD)
Technical guidance, monitoring and evaluation in Haryana
Three new sites at Dighal (Jhajjar district), Julana (Jind) and Uklana (Hisar) with a total waterlogged saline area of 2,900 ha were during 2018-19 based on the identi�edfeasibility for SSD system. These new sites were characterized by shallow water (water
-1table depth ≤ 1.5 m), moderate to high soil salinity (EC > 8 dS m ) and groundwater e-1salinity (EC > 2 dS m ) with adjoining gw availability of surface drain for discharge of
drainage water. Pre-drainage investigations and topographic surveys at these sites are recommended to be conducted for designing of SSD systems to be submitted to ICAR-CSSRI by HOPP for evaluation and approval and further funding under RKVY scheme. The design and layout of SSD system with 60 m drain spacing for a drainage block (H1 block) for 44 ha at CCS HAU, Hisar under Rohtak-III project was technically evaluated on the basis of discharge capacities and permissible length of lateral pipes and drainable area of collector pipes, �ow directions, lateral and collector slope, and were found in conformity with the National Drainage Guidelines and our past practices. Therefore, design and layout for the H1 drainage block was approved and recommended for the implementation. Further, three SSD systems were installed in 258 ha affected area at Kahni (Rohtak), CCSHAU Hisar and Gangana (Sonipat) bene�tting 266 farmers. Up to March 2019, total of 10,884 ha waterlogged saline area in Haryana has been provided with SSD systems under 15 projects which have helped to reclaim waterlogged saline soils for restoring their productivity. Of these, 5,153 ha area has been covered under RKVY scheme during the past nine years, bene�tting 3,299 farmers. The monitoring and evaluation study of �ve SSD projects with 67 drainage blocks covering reclaimed area of 2,443 ha and 1,863 bene�ciary farmers located at Gharwal, Katwara, Siwana Mal, Mokhra Kheri and Kharkhara under Sonipat-II & III, Jind, and Rohtak-I and II projects, respectively, were conducted during 2018-19 for improvement in soil salinity and crop yield. The crop yields increased by 45-95, 30-121 and 65-190% and 15-35, 20-55 and 35-95% for paddy, wheat and cotton crops, respectively for adequate and partial pumping operations done by farmers for achieving partial or full reclamative leaching in almost all drainage blocks (Table 115). This technology has transformed barren waterlogged saline lands into productive croplands in 2-3 year period and reduced the soil salinity (EC ) from 15-32 to 2-e
5 dS m . It can be conclusively stated that SSD projects in the past years resulted in -1
signi�cant increase in crop yields and doubling farmers' income provided adequate pumping for full reclamative salt leaching was achieved by farmers.
Consultancy services in central and western India
Consultancy services on pre-drainage investigations and surveys, drainage material testing, design approval of new projects, stakeholders' training, and evaluation of large-scale SSD projects were provided to M/s Rex Polyextrusion Pvt Ltd, Sangli (Maharashtra) during 2018-19. In lift minor irrigation schemes along the River Krishna and its tributaries in Maharashtra and Karnataka, no open drain was constructed to dispose saline water from the affected areas to the stream/river. Therefore, pipe drain and extended piped drain are adopted as an integral part of SSD projects. Six SSD projects with total area of 1,806 ha in Kolhapur district have been approved during 2018-19. The designs and drawings of SSD systems with 30 m drain spacing in three zones under SSD Project at
198
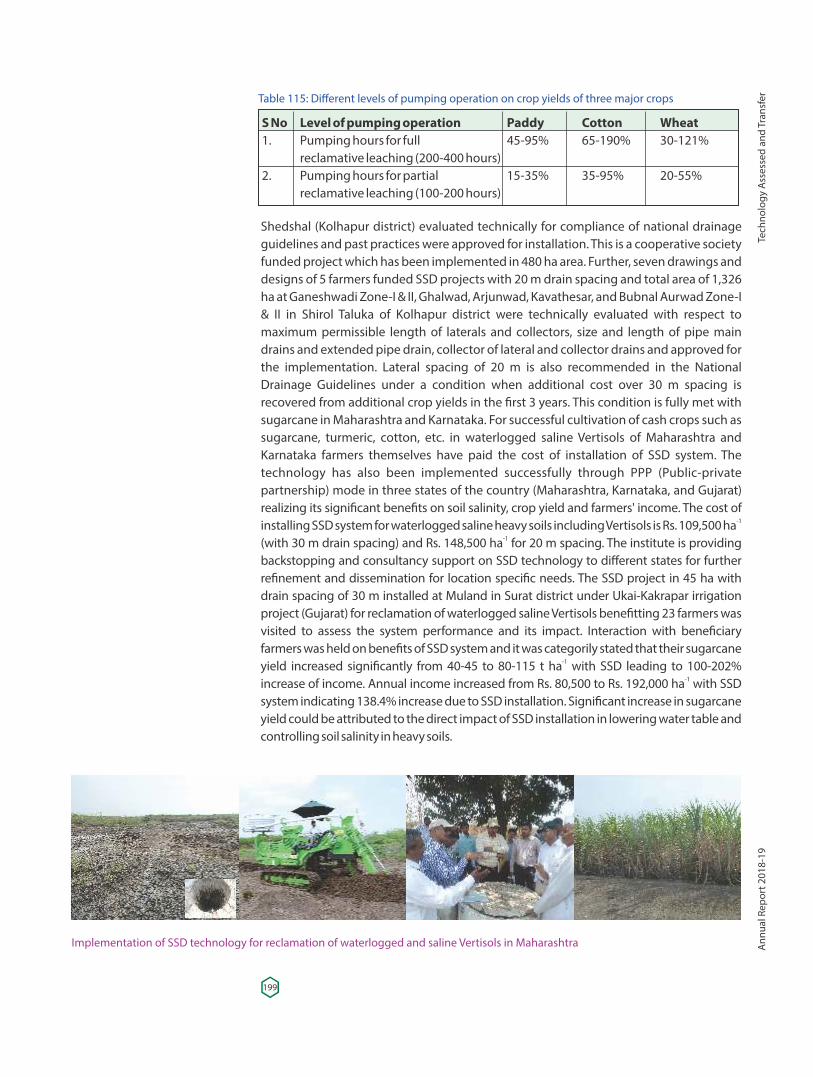
Table 115: Different levels of pumping operation on crop yields of three major crops
S No Level of pumping operation Paddy Cotton Wheat1. Pumping hours for full 45-95% 65-190% 30-121% reclamative leaching (200-400 hours)2. Pumping hours for partial 15-35% 35-95% 20-55% reclamative leaching (100-200 hours)
Shedshal (Kolhapur district) evaluated technically for compliance of national drainage guidelines and past practices were approved for installation. This is a cooperative society funded project which has been implemented in 480 ha area. Further, seven drawings and designs of 5 farmers funded SSD projects with 20 m drain spacing and total area of 1,326 ha at Ganeshwadi Zone-I & II, Ghalwad, Arjunwad, Kavathesar, and Bubnal Aurwad Zone-I & II in Shirol Taluka of Kolhapur district were technically evaluated with respect to maximum permissible length of laterals and collectors, size and length of pipe main drains and extended pipe drain, collector of lateral and collector drains and approved for the implementation. Lateral spacing of 20 m is also recommended in the National Drainage Guidelines under a condition when additional cost over 30 m spacing is recovered from additional crop yields in the �rst 3 years. This condition is fully met with sugarcane in Maharashtra and Karnataka. For successful cultivation of cash crops such as sugarcane, turmeric, cotton, etc. in waterlogged saline Vertisols of Maharashtra and Karnataka farmers themselves have paid the cost of installation of SSD system. The technology has also been implemented successfully through PPP (Public-private partnership) mode in three states of the country (Maharashtra, Karnataka, and Gujarat) realizing its signi�cant bene�ts on soil salinity, crop yield and farmers' income. The cost of
-1installing SSD system for waterlogged saline heavy soils including Vertisols is Rs. 109,500 ha -1(with 30 m drain spacing) and Rs. 148,500 ha for 20 m spacing. The institute is providing
backstopping and consultancy support on SSD technology to different states for further re�nement and dissemination for location speci�c needs. The SSD project in 45 ha with drain spacing of 30 m installed at Muland in Surat district under Ukai-Kakrapar irrigation project (Gujarat) for reclamation of waterlogged saline Vertisols bene�tting 23 farmers was visited to assess the system performance and its impact. Interaction with bene�ciary farmers was held on bene�ts of SSD system and it was categorily stated that their sugarcane
-1yield increased signi�cantly from 40-45 to 80-115 t ha with SSD leading to 100-202% -1increase of income. Annual income increased from Rs. 80,500 to Rs. 192,000 ha with SSD
system indicating 138.4% increase due to SSD installation. Signi�cant increase in sugarcane yield could be attributed to the direct impact of SSD installation in lowering water table and controlling soil salinity in heavy soils.
Implementation of SSD technology for reclamation of waterlogged and saline Vertisols in Maharashtra
199
Tech
nolo
gy A
sses
sed
and
Tran
sfer
Ann
ual R
epor
t 201
8-19
Impact assessment of SSD technology in Karnataka
The canal command areas in Belgaum district (Karnataka) are affected by waterlogging and soil salinity, which threaten the land productivity and reduce the farm incomes. The farmers of village Ugar Budruk faced severe problem of waterlogging and soil salinity over the decades and majority of the lands were left barren. With the funding from Central government (60%), State government (20%) and farmers contribution (20%), the SSD systems were installed in the years 2009-10 to 2011-12. After installation there was a signi�cant improvement in the land productivity in the project area. While seeing the good performance of the technology, the individual farmers (whose lands were affected with waterlogging and soil salinity) came forward for installation of SSD on their farm by investing their own amount though it is a capital intensive technology. This study was undertaken to assess the impact of the technology on yield, farm income and employment in the project area. For impact assessment, the study used both primary as well as secondary data collected from different sources. The impact study envisaged comparison between SSD schemes systems installed under government with farmers' scheme. Yield advantage was about 17.5 per cent higher in farmers' scheme as compared to govt. scheme (Table 116). The gross and net returns were also higher in farmers' scheme (Rs. 301134/- and Rs. 116186/-) as compared to govt. scheme (Rs. 255964/- and Rs. 80956/-). The higher yield obtained infarmers' scheme revealed lesser cost of production (Rs. 1605 t ) compared to govt. scheme (Rs. 1786 t ). The input-output ratios were 1.46 -1 -1
and 1.63 for sugarcane produced under govt. scheme and farmers' scheme, respectively. The per hectare per annum employment generation was about 186 and 195 person days, respectively under govt. scheme and farmers' scheme due to which the resource poor farmers' respective earnings were Rs. 46500/- and Rs. 48750/- on account of farm employment due to reclamation of waterlogged and salinity affected lands. Estimation of economic viability of the project considering its life span gives a clear idea about the investment activity. The study reveals that the investment on SSD technology in both the cases (Govt. and farmers' scheme) are economically viable. The net present worth which is positive, bene�t-cost ratio of more than one, internal rate of returns more than the existing interest rate of bank and the least payback period indicates the economic viability of SSD projects in the region. Constraint analysis was carried out to examine the difficulties faced by the farmers in adoption of SSD technology in Belgaum district of Karnataka. Majority of the farmers in the study region informed that the lack of institutional support either in terms of providing credit facility from �nancial institutes or subsidy from the Government for the SSD technology is the major resource constraint
Table 116: Economics of sugarcane cultivation under different SSD schemes
Particulars Govt. Scheme Farmers’ Scheme % Change-1Yield (t ha ) 98 115 17.35
-1Gross Returns (Rs.ha ) 255964 301134 17.65-1Cost of cultivation (Rs. ha ) 175008 184948 5.68
-1Net Returns (Rs. ha ) 80956 116186 43.52-1Cost of production (Rs t ) 1786 1605 -10.13
Input-Output Ratio 1.46 1.63 11.32-1 -1Employment generated (Person days ha annum ) 186 195 4.84
-1 -1Wage earnings from farm employment (Rs. ha annum ) 46500 48750 4.84
200
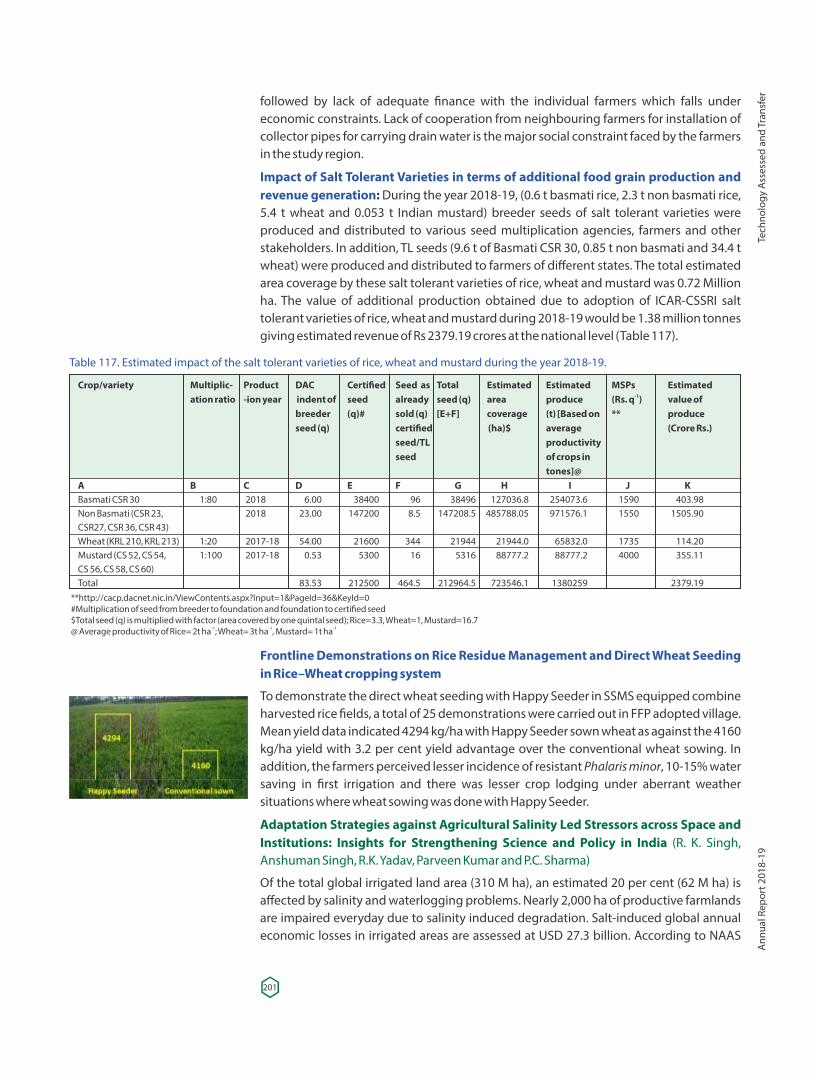
followed by lack of adequate �nance with the individual farmers which falls under economic constraints. Lack of cooperation from neighbouring farmers for installation of collector pipes for carrying drain water is the major social constraint faced by the farmers in the study region.
Impact of Salt Tolerant Varieties in terms of additional food grain production and revenue generation: During the year 2018-19, (0.6 t basmati rice, 2.3 t non basmati rice, 5.4 t wheat and 0.053 t Indian mustard) breeder seeds of salt tolerant varieties were produced and distributed to various seed multiplication agencies, farmers and other stakeholders. In addition, TL seeds (9.6 t of Basmati CSR 30, 0.85 t non basmati and 34.4 t wheat) were produced and distributed to farmers of different states. The total estimated area coverage by these salt tolerant varieties of rice, wheat and mustard was 0.72 Million ha. The value of additional production obtained due to adoption of ICAR-CSSRI salt tolerant varieties of rice, wheat and mustard during 2018-19 would be 1.38 million tonnes giving estimated revenue of Rs 2379.19 crores at the national level (Table 117).
Table 117. Estimated impact of the salt tolerant varieties of rice, wheat and mustard during the year 2018-19.
Crop/variety Multiplic- Product DAC Certi�ed Seed as Total Estimated Estimated MSPs Estimated -1 ation ratio -ion year indent of seed already seed (q) area produce (Rs. q ) value of
breeder (q)# sold (q) [E+F] coverage (t) [Based on ** produce seed (q) certi�ed (ha)$ average (Crore Rs.) seed/TL productivity seed of crops in tones]@A B C D E F G H I J K Basmati CSR 30 1:80 2018 6.00 38400 96 38496 127036.8 254073.6 1590 403.98Non Basmati (CSR 23, 2018 23.00 147200 8.5 147208.5 485788.05 971576.1 1550 1505.90CSR27, CSR 36, CSR 43)Wheat (KRL 210, KRL 213) 1:20 2017-18 54.00 21600 344 21944 21944.0 65832.0 1735 114.20Mustard (CS 52, CS 54, 1:100 2017-18 0.53 5300 16 5316 88777.2 88777.2 4000 355.11CS 56, CS 58, CS 60)Total 83.53 212500 464.5 212964.5 723546.1 1380259 2379.19
**http://cacp.dacnet.nic.in/ViewContents.aspx?Input=1&PageId=36&KeyId=0 #Multiplication of seed from breeder to foundation and foundation to certi�ed seed $Total seed (q) is multiplied with factor (area covered by one quintal seed); Rice=3.3, Wheat=1, Mustard=16.7
-1 -1 -1@ Average productivity of Rice= 2t ha ; Wheat= 3t ha , Mustard= 1t ha
Frontline Demonstrations on Rice Residue Management and Direct Wheat Seeding in Rice–Wheat cropping system
To demonstrate the direct wheat seeding with Happy Seeder in SSMS equipped combine harvested rice �elds, a total of 25 demonstrations were carried out in FFP adopted village. Mean yield data indicated 4294 kg/ha with Happy Seeder sown wheat as against the 4160 kg/ha yield with 3.2 per cent yield advantage over the conventional wheat sowing. In addition, the farmers perceived lesser incidence of resistant Phalaris minor, 10-15% water saving in �rst irrigation and there was lesser crop lodging under aberrant weather situations where wheat sowing was done with Happy Seeder.
Adaptation Strategies against Agricultural Salinity Led Stressors across Space and Institutions: Insights for Strengthening Science and Policy in India (R. K. Singh, Anshuman Singh, R.K. Yadav, Parveen Kumar and P.C. Sharma)
Of the total global irrigated land area (310 M ha), an estimated 20 per cent (62 M ha) is affected by salinity and waterlogging problems. Nearly 2,000 ha of productive farmlands are impaired everyday due to salinity induced degradation. Salt-induced global annual economic losses in irrigated areas are assessed at USD 27.3 billion. According to NAAS
201
Tech
nolo
gy A
sses
sed
and
Tran
sfer
Ann
ual R
epor
t 201
8-19
(2017), 120.72 M ha land constituting roughly 36.5 per cent of the total geographical area of India are affected by erosion, salinity/alkalinity, acidity, water logging and other degrading factors. Further, lack of a sustainable land use policy has led to pervasive land use by industry, infrastructure and housing sectors usurping a sizeable portion of arable lands and hampering the sustainable natural resource management and agricultural production. Salinity and sodicity stresses diminish the productivity of about 6.74 M ha croplands in 240 districts of 14 states of India. Different types of knowledge and technologies exist which are applicable to manage soil and water sodicity and salinity. The society which is affected by marginal salinity/sodcity still adapt autonomous strategies, while for the same problem resource-rich farmers can follow the planned knowledge. Some time policy-centric and autonomous strategies are hybridized together to enhance efficacy and rationalize the resources required in managing soil and water sodicity and salinity. Looking to this idea into view, this study was conducted with the objectives: (i) to know the trends in autonomous adaptation strategies against salinity led stressors across space and institutional level; and (ii) to know the synergy and variations in autonomous local and planned adaptations across space, available in secondary data.
Trends in autonomous adaptation strategies against salinity led stressors across scales
A critical review indicated that virtual absence or poor dissemination of planned knowledge often compels the material resource-poor farmers to devise their own adaptation strategies termed as 'autonomous' to manage the environmental risks including salinity. It is claimed that poor and marginalized people are the most vulnerable to climate change. Given the fact that location speci�c issues greatly in�uence the decision making and �nal outcome in soil reclamation, one-size-�ts-all approach is unlikely to bring desired results implying that farmers need to develop their own means (autonomous) in tune with the existing conditions followed at individual and community scales. The results indicated that farmers have developed autonomous strategies at individual and community scales so that they can pool and exchange their resources required in managing salinity stress (Table 118).
A variety of knowledge being applied by farmers at their level to manage salinity and sodicity stressors. Indian policy such as NAPCC (2008) and National Action Plan (2001) emphasized to strengthen the adaptation to abiotic stressors with local solutions as reported here also. These policies emphasize to integrate such knowledge with planned knowledge for sustainable outcomes. These policies also suggest to draw the insights from such strategies after tuning with planned knowledge to provide valuable insights to the scientists and policy makers in shaping their research and policies to address the ground realities.
Synergy and overlaps between autonomous and planned adaptations
The results indicated that out of broad seven dimensions of managing and adapting salinity induced abiotic stressors (saline and sodic soils and waters) through autonomous and planned strategies, the planned knowledge was dominant with its presence and weight. However, in some cases such as cultural dimensions (exchange of resources and creating knowledge network), the planned knowledge was found to be relatively weak as compared to the autonomous adaptation. In most of the cases, both the knowledge had synergy, but the difference was in terms of weightage of each. Interestingly, despite the difference in power of knowledge, in some cases both the knowledge were almost equal in terms of weightage. This can lead to provide more inclusive knowledge required for managing salinity.
202
The study indicated that challenges of reclaiming and managing salt affected lands are dynamic and require multi-level planning and policies, designing and action. Different salinity stressors need different kinds of knowledge and management strategies. They need location speci�c approaches enabled with planned knowledge and robust policy supports. Research institution(s) in India have developed plethora of scienti�c (planned) knowledge for reclaiming and managing salt affected soils. The issue of salinity management is manifold linked with geogenic, anthropogenic and political dimensions. Targeting only at the landscape or individual farmers level will be rather a scanty approach. This requires multi-scale action with a regional scale planning by involving all the concerned holders including policy makers on one platform. A variety of national and state policies framed by different agencies have more potential to impact the rate and sustainability of reclamation and management strategies, but they seem to work in isolation. Both, knowledge developers and policy makers may be oriented towards plural knowledge and polycentric policies in which concerns, resources (both physical, and social-cultural and institutional) and conditions of end users and enablers are well appreciated and integrated to make reclamation and management outcomes more sustainable.
Empowering farmers through selective interventions in salt affected agroecosystems of Ghaghar Plains (Parvender Sheoran, R.K. Singh, Satyendra Kumar, Arvind Kumar, R. Raju, Arijit Burman, Kailash Prajapat, Yusuf Jafar Dar, K. Punnusamy and Sohanvir Singh)
The Farmer FIRST Programme (FFP) is an ICAR initiative with main focus on farmer's Farm, Innovations, Resources, Science and Technology (FIRST) to privilege the smallholder agriculture and complex, diverse and risk prone realities of farmers. Enhancing Farmer–Scientist Interface; Technology Assemblage, Application and Feedback; Partnership and Institution Building and Content Mobilization are the main components of FFP keeping farmer in a centric role for research problem identi�cation, prioritization and conduct of experiments and its management in farmers' conditions.
Five villages namely Mundri, Geong, Kathwar, Sampli Kheri and Bhaini Majra in Kaithal district of Haryana state were purposefully selected to ful�ll the objectives of FFP operative at CSSRI, Karnal. This region is dominated by rice-wheat cropping system. Sodic
-1soils (pH>8.2) and high residual alkalinity in irrigation water (RSC>2.5 meq l ) are the characteristic features of the region. Focused group discussion and transcend walk were held with the famers to diagnose their socio-economic and agro-ecological stressors vis-a-vis general, agriculture and livestock related problems.
Drainage-cum-recharge structure for augmenting groundwater and improving its quality by harvesting excess rain water into aquifer
The periodic observation taken from point source revealed that a declining trend for water table depth was observed at all locations, probably due to lesser monsoon rain and groundwater exploitation for cultivation of rice crop during Kharif 2018. In general, groundwater table depth from the surface was maximum during Sept-Oct 2018 months, however, slight rise in groundwater was recorded during Dec 2018-Mar 2019. The good winter rain received might have facilitated groundwater recharge as well as ful�lled
-1wheat crop water requirement. A reduction in RSC in the tune of 2-3 meq l was recorded beneath the installed structure at each site from the peak values. In order to assess the impact of recharge structure on groundwater spatially, periodic observation on water table depth and quality ware taken from the points 10, 30, 60, 90 m away (through
203
Tech
nolo
gy A
sses
sed
and
Tran
sfer
Ann
ual R
epor
t 201
8-19
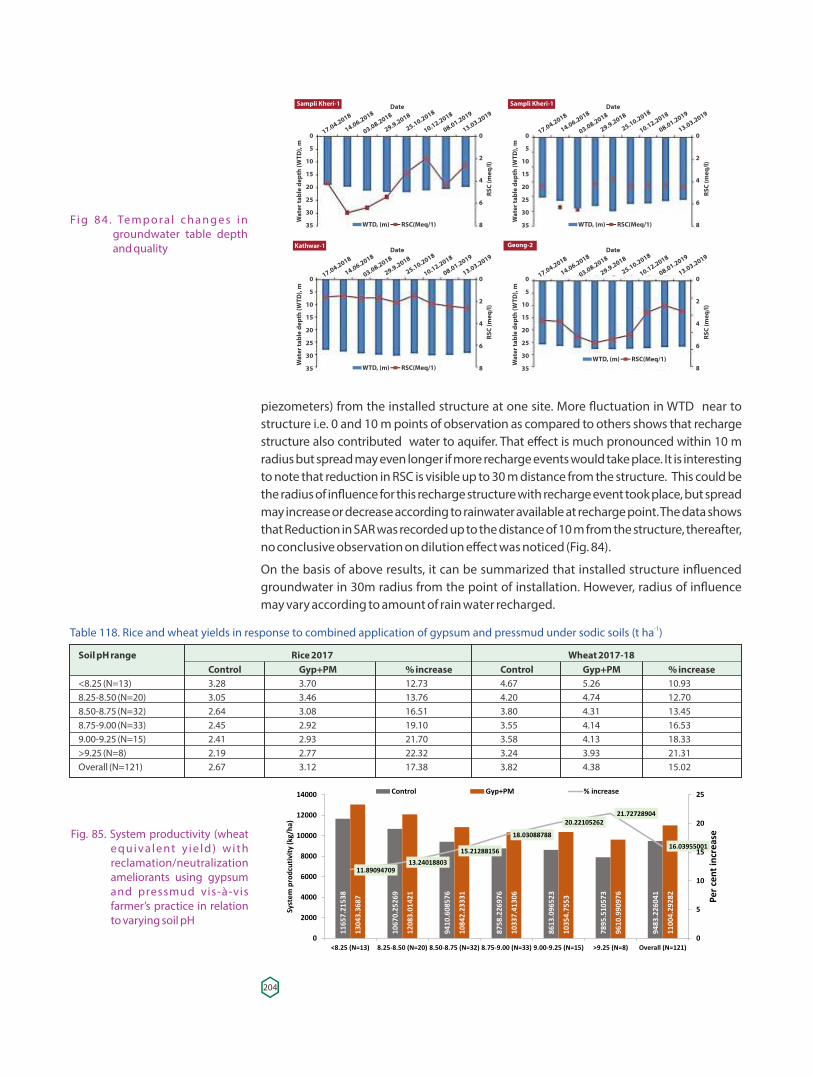
Fi g 8 4 . Te m p o r a l c h a n g e s i n groundwater table depth and quality
piezometers) from the installed structure at one site. More �uctuation in WTD near to structure i.e. 0 and 10 m points of observation as compared to others shows that recharge structure also contributed water to aquifer. That effect is much pronounced within 10 m radius but spread may even longer if more recharge events would take place. It is interesting to note that reduction in RSC is visible up to 30 m distance from the structure. This could be the radius of in�uence for this recharge structure with recharge event took place, but spread may increase or decrease according to rainwater available at recharge point. The data shows that Reduction in SAR was recorded up to the distance of 10 m from the structure, thereafter, no conclusive observation on dilution effect was noticed (Fig. 84).
On the basis of above results, it can be summarized that installed structure in�uenced groundwater in 30m radius from the point of installation. However, radius of in�uence may vary according to amount of rain water recharged.
-1Table 118. Rice and wheat yields in response to combined application of gypsum and pressmud under sodic soils (t ha )
Soil pH range Rice 2017 Wheat 2017-18 Control Gyp+PM % increase Control Gyp+PM % increase<8.25 (N=13) 3.28 3.70 12.73 4.67 5.26 10.938.25-8.50 (N=20) 3.05 3.46 13.76 4.20 4.74 12.708.50-8.75 (N=32) 2.64 3.08 16.51 3.80 4.31 13.458.75-9.00 (N=33) 2.45 2.92 19.10 3.55 4.14 16.539.00-9.25 (N=15) 2.41 2.93 21.70 3.58 4.13 18.33>9.25 (N=8) 2.19 2.77 22.32 3.24 3.93 21.31Overall (N=121) 2.67 3.12 17.38 3.82 4.38 15.02
Fig. 85. System productivity (wheat e q u i va l e nt y i e l d ) w i t h reclamation/neutralization ameliorants using gypsum and pressmud vis-à-vis farmer’s practice in relation to varying soil pH
204
Date
17.04.2018
14.06.2018
03.08.2018
29.9.2018
25.10.2018
10.12.2018
08.01.2019
13.03.2019
0
5
10
15
20
25
30
35
Wat
er ta
ble
dept
h (W
TD),
m
WTD, (m) RSC(Meq/1)
Date
17.04.2018
14.06.2018
03.08.2018
29.9.2018
25.10.2018
10.12.2018
08.01.2019
13.03.2019
0
5
10
15
20
25
30
35
Wat
er ta
ble
dept
h (W
TD),
m
WTD, (m) RSC(Meq/1)
RSC
(meq
/l)
0
2
4
6
8
0
2
4
6
8
RSC
(meq
/l)
Date
17.04.2018
14.06.2018
03.08.2018
29.9.2018
25.10.2018
10.12.2018
08.01.2019
13.03.2019
0
5
10
15
20
25
30
35
Wat
er ta
ble
dept
h (W
TD),
m
WTD, (m) RSC(Meq/1)
Date
17.04.2018
14.06.2018
03.08.2018
29.9.2018
25.10.2018
10.12.2018
08.01.2019
13.03.2019
0
5
10
15
20
25
30
35
Wat
er ta
ble
dept
h (W
TD),
m
RSC
(meq
/l)
0
2
4
6
8
0
2
4
6
8
RSC
(meq
/l)
Kathwar-1 Geong-2
Sampli Kheri-1Sampli Kheri-1
WTD, (m) RSC(Meq/1)
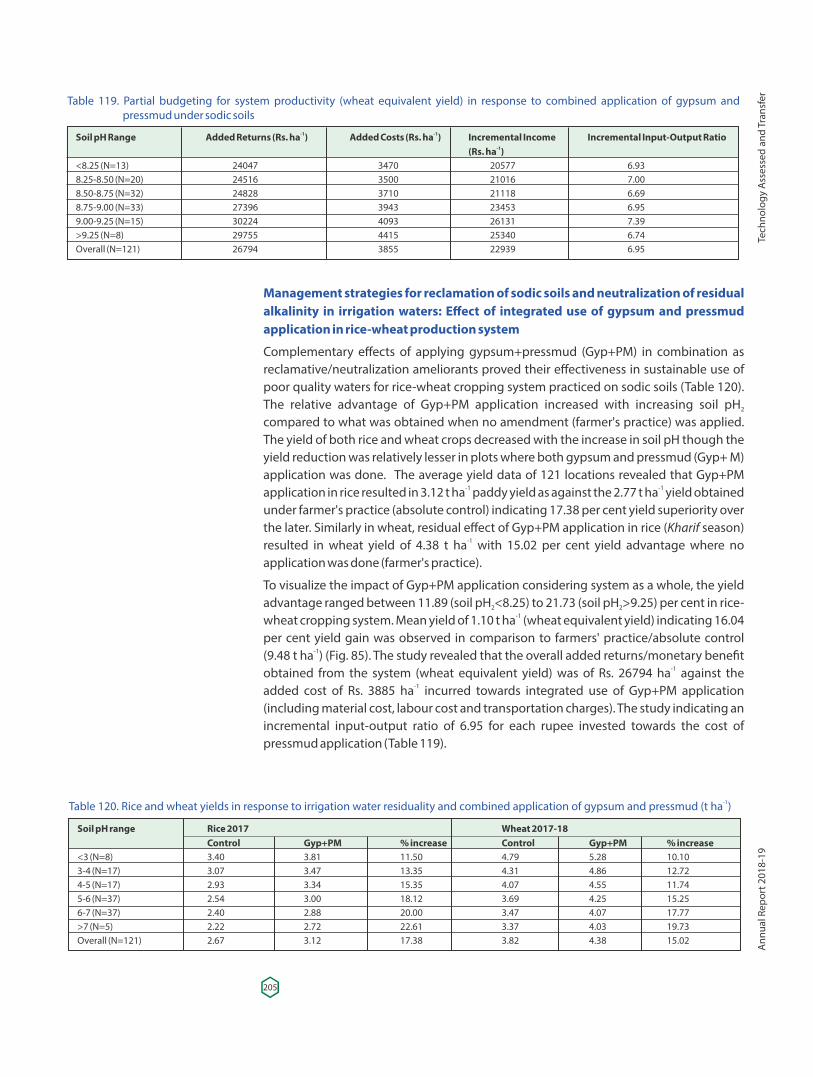
Management strategies for reclamation of sodic soils and neutralization of residual alkalinity in irrigation waters: Effect of integrated use of gypsum and pressmud application in rice-wheat production system
Complementary effects of applying gypsum+pressmud (Gyp+PM) in combination as reclamative/neutralization ameliorants proved their effectiveness in sustainable use of poor quality waters for rice-wheat cropping system practiced on sodic soils (Table 120). The relative advantage of Gyp+PM application increased with increasing soil pH 2
compared to what was obtained when no amendment (farmer's practice) was applied. The yield of both rice and wheat crops decreased with the increase in soil pH though the yield reduction was relatively lesser in plots where both gypsum and pressmud (Gyp+ M) application was done. The average yield data of 121 locations revealed that Gyp+PM
-1 -1application in rice resulted in 3.12 t ha paddy yield as against the 2.77 t ha yield obtained under farmer's practice (absolute control) indicating 17.38 per cent yield superiority over the later. Similarly in wheat, residual effect of Gyp+PM application in rice (Kharif season)
-1resulted in wheat yield of 4.38 t ha with 15.02 per cent yield advantage where no application was done (farmer's practice).
To visualize the impact of Gyp+PM application considering system as a whole, the yield advantage ranged between 11.89 (soil pH <8.25) to 21.73 (soil pH >9.25) per cent in rice-2 2
-1wheat cropping system. Mean yield of 1.10 t ha (wheat equivalent yield) indicating 16.04 per cent yield gain was observed in comparison to farmers' practice/absolute control
-1(9.48 t ha ) (Fig. 85). The study revealed that the overall added returns/monetary bene�t -1obtained from the system (wheat equivalent yield) was of Rs. 26794 ha against the
-1added cost of Rs. 3885 ha incurred towards integrated use of Gyp+PM application (including material cost, labour cost and transportation charges). The study indicating an incremental input-output ratio of 6.95 for each rupee invested towards the cost of pressmud application (Table 119).
Table 119. Partial budgeting for system productivity (wheat equivalent yield) in response to combined application of gypsum and pressmud under sodic soils
-1 -1Soil pH Range Added Returns (Rs. ha ) Added Costs (Rs. ha ) Incremental Income Incremental Input-Output Ratio-1 (Rs. ha )
<8.25 (N=13) 24047 3470 20577 6.938.25-8.50 (N=20) 24516 3500 21016 7.008.50-8.75 (N=32) 24828 3710 21118 6.698.75-9.00 (N=33) 27396 3943 23453 6.959.00-9.25 (N=15) 30224 4093 26131 7.39>9.25 (N=8) 29755 4415 25340 6.74Overall (N=121) 26794 3855 22939 6.95
-1Table 120. Rice and wheat yields in response to irrigation water residuality and combined application of gypsum and pressmud (t ha )
Soil pH range Rice 2017 Wheat 2017-18 Control Gyp+PM % increase Control Gyp+PM % increase<3 (N=8) 3.40 3.81 11.50 4.79 5.28 10.103-4 (N=17) 3.07 3.47 13.35 4.31 4.86 12.724-5 (N=17) 2.93 3.34 15.35 4.07 4.55 11.745-6 (N=37) 2.54 3.00 18.12 3.69 4.25 15.256-7 (N=37) 2.40 2.88 20.00 3.47 4.07 17.77>7 (N=5) 2.22 2.72 22.61 3.37 4.03 19.73Overall (N=121) 2.67 3.12 17.38 3.82 4.38 15.02
205
Tech
nolo
gy A
sses
sed
and
Tran
sfer
Ann
ual R
epor
t 201
8-19
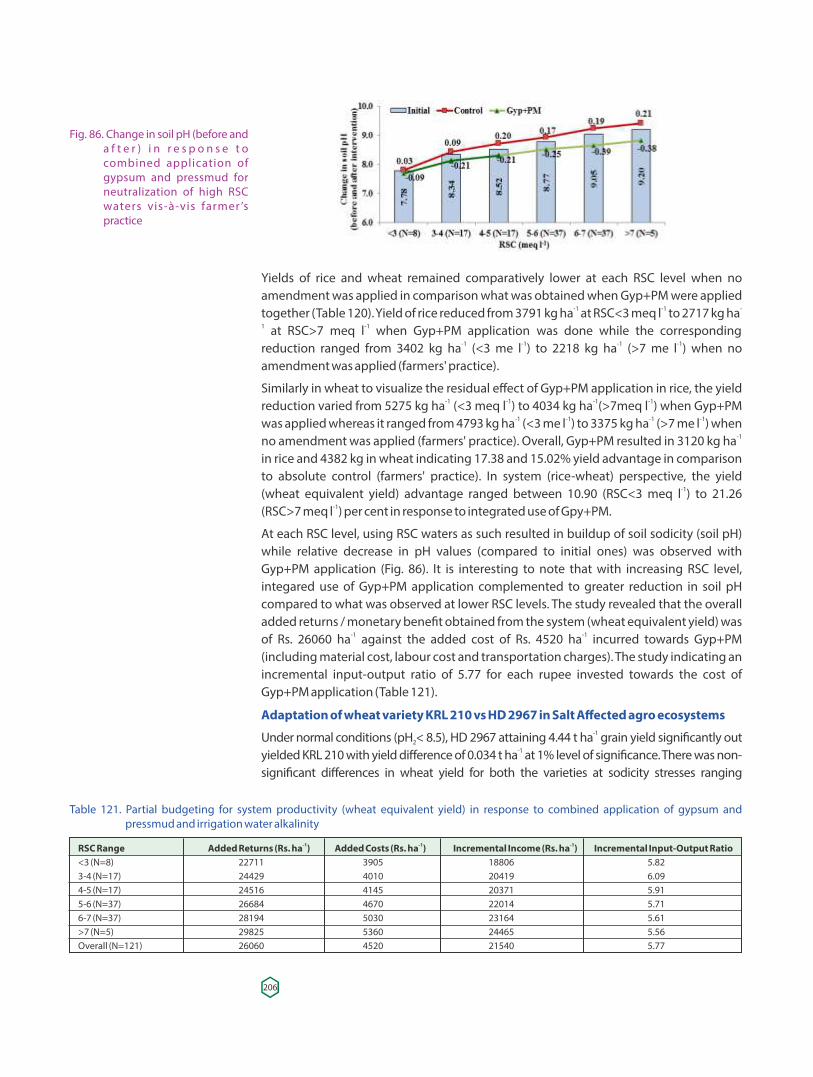
Yields of rice and wheat remained comparatively lower at each RSC level when no amendment was applied in comparison what was obtained when Gyp+PM were applied
-1 -1 -together (Table 120). Yield of rice reduced from 3791 kg ha at RSC<3 meq l to 2717 kg ha1 -1 at RSC>7 meq l when Gyp+PM application was done while the corresponding
-1 -1 -1 -1reduction ranged from 3402 kg ha (<3 me l ) to 2218 kg ha (>7 me l ) when no amendment was applied (farmers' practice).
Similarly in wheat to visualize the residual effect of Gyp+PM application in rice, the yield -1 -1 -1 -1reduction varied from 5275 kg ha (<3 meq l ) to 4034 kg ha (>7meq l ) when Gyp+PM
-1 -1 -1 -1was applied whereas it ranged from 4793 kg ha (<3 me l ) to 3375 kg ha (>7 me l ) when -1no amendment was applied (farmers' practice). Overall, Gyp+PM resulted in 3120 kg ha
in rice and 4382 kg in wheat indicating 17.38 and 15.02% yield advantage in comparison to absolute control (farmers' practice). In system (rice-wheat) perspective, the yield
-1(wheat equivalent yield) advantage ranged between 10.90 (RSC<3 meq l ) to 21.26 -1(RSC>7 meq l ) per cent in response to integrated use of Gpy+PM.
At each RSC level, using RSC waters as such resulted in buildup of soil sodicity (soil pH) while relative decrease in pH values (compared to initial ones) was observed with Gyp+PM application (Fig. 86). It is interesting to note that with increasing RSC level, integared use of Gyp+PM application complemented to greater reduction in soil pH compared to what was observed at lower RSC levels. The study revealed that the overall added returns / monetary bene�t obtained from the system (wheat equivalent yield) was
-1 -1of Rs. 26060 ha against the added cost of Rs. 4520 ha incurred towards Gyp+PM (including material cost, labour cost and transportation charges). The study indicating an incremental input-output ratio of 5.77 for each rupee invested towards the cost of Gyp+PM application (Table 121).
Adaptation of wheat variety KRL 210 vs HD 2967 in Salt Affected agro ecosystems-1Under normal conditions (pH < 8.5), HD 2967 attaining 4.44 t ha grain yield signi�cantly out 2
-1yielded KRL 210 with yield difference of 0.034 t ha at 1% level of signi�cance. There was non-signi�cant differences in wheat yield for both the varieties at sodicity stresses ranging
Fig. 86. Change in soil pH (before and a f t e r ) i n r e s p o n s e t o combined application of gypsum and pressmud for neutralization of high RSC waters vis-à-vis farmer ’s practice
Table 121. Partial budgeting for system productivity (wheat equivalent yield) in response to combined application of gypsum and pressmud and irrigation water alkalinity
-1 -1 -1RSC Range Added Returns (Rs. ha ) Added Costs (Rs. ha ) Incremental Income (Rs. ha ) Incremental Input-Output Ratio<3 (N=8) 22711 3905 18806 5.823-4 (N=17) 24429 4010 20419 6.094-5 (N=17) 24516 4145 20371 5.915-6 (N=37) 26684 4670 22014 5.716-7 (N=37) 28194 5030 23164 5.61>7 (N=5) 29825 5360 24465 5.56Overall (N=121) 26060 4520 21540 5.77
206
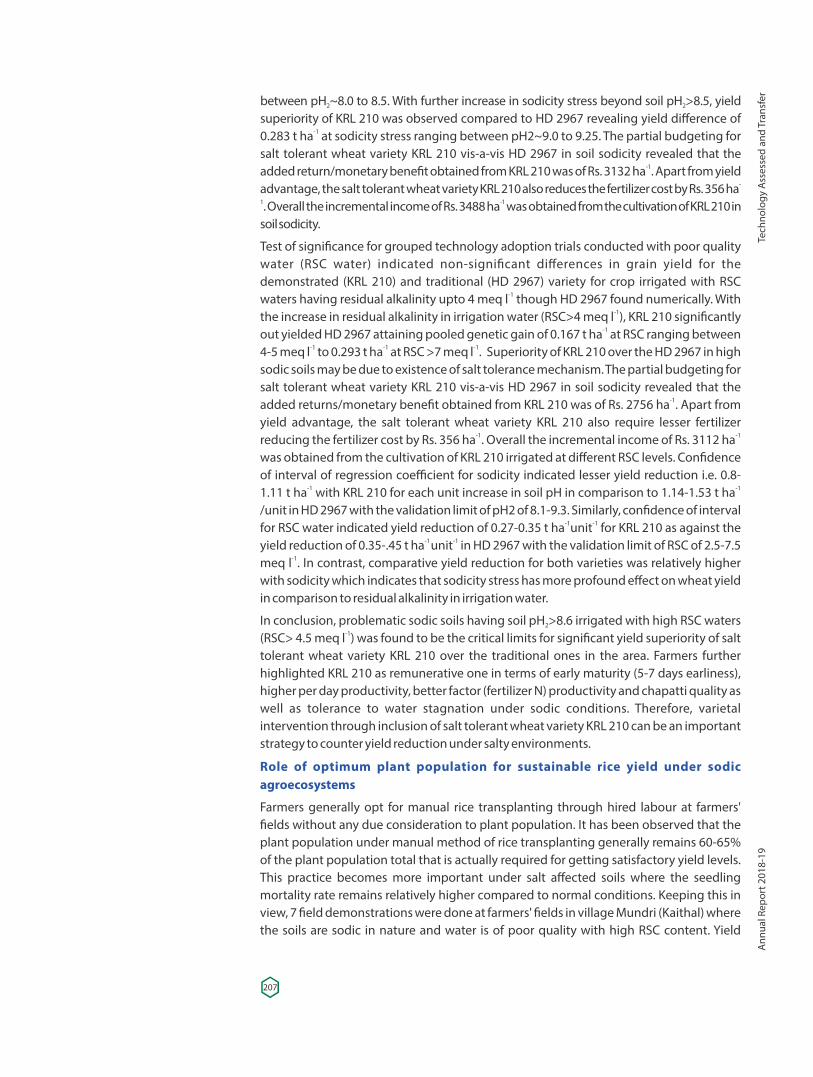
between pH ~8.0 to 8.5. With further increase in sodicity stress beyond soil pH >8.5, yield 2 2
superiority of KRL 210 was observed compared to HD 2967 revealing yield difference of -10.283 t ha at sodicity stress ranging between pH2~9.0 to 9.25. The partial budgeting for
salt tolerant wheat variety KRL 210 vis-a-vis HD 2967 in soil sodicity revealed that the -1added return/monetary bene�t obtained from KRL 210 was of Rs. 3132 ha . Apart from yield
-advantage, the salt tolerant wheat variety KRL 210 also reduces the fertilizer cost by Rs. 356 ha1 -1. Overall the incremental income of Rs. 3488 ha was obtained from the cultivation of KRL 210 in soil sodicity.
Test of signi�cance for grouped technology adoption trials conducted with poor quality water (RSC water) indicated non-signi�cant differences in grain yield for the demonstrated (KRL 210) and traditional (HD 2967) variety for crop irrigated with RSC
-1waters having residual alkalinity upto 4 meq l though HD 2967 found numerically. With -1the increase in residual alkalinity in irrigation water (RSC>4 meq l ), KRL 210 signi�cantly
-1out yielded HD 2967 attaining pooled genetic gain of 0.167 t ha at RSC ranging between -1 -1 -14-5 meq l to 0.293 t ha at RSC >7 meq l . Superiority of KRL 210 over the HD 2967 in high
sodic soils may be due to existence of salt tolerance mechanism. The partial budgeting for salt tolerant wheat variety KRL 210 vis-a-vis HD 2967 in soil sodicity revealed that the
-1added returns/monetary bene�t obtained from KRL 210 was of Rs. 2756 ha . Apart from yield advantage, the salt tolerant wheat variety KRL 210 also require lesser fertilizer
-1 -1reducing the fertilizer cost by Rs. 356 ha . Overall the incremental income of Rs. 3112 ha was obtained from the cultivation of KRL 210 irrigated at different RSC levels Con�dence . of interval of regression coefficient for sodicity indicated lesser yield reduction i.e. 0.8-
-1 -11.11 t ha with KRL 210 for each unit increase in soil pH in comparison to 1.14-1.53 t ha /unit in HD 2967 with the validation limit of pH2 of 8.1-9.3. Similarly, con�dence of interval
-1 -1for RSC water indicated yield reduction of 0.27-0.35 t ha unit for KRL 210 as against the -1 -1yield reduction of 0.35-.45 t ha unit in HD 2967 with the validation limit of RSC of 2.5-7.5
-1meq l . In contrast, comparative yield reduction for both varieties was relatively higher with sodicity which indicates that sodicity stress has more profound effect on wheat yield in comparison to residual alkalinity in irrigation water.
In conclusion, problematic sodic soils having soil pH >8.6 irrigated with high RSC waters 2-1(RSC> 4.5 meq l ) was found to be the critical limits for signi�cant yield superiority of salt
tolerant wheat variety KRL 210 over the traditional ones in the area. Farmers further highlighted KRL 210 as remunerative one in terms of early maturity (5-7 days earliness), higher per day productivity, better factor (fertilizer N) productivity and chapatti quality as well as tolerance to water stagnation under sodic conditions. Therefore, varietal intervention through inclusion of salt tolerant wheat variety KRL 210 can be an important strategy to counter yield reduction under salty environments.
Role of optimum plant population for sustainable rice yield under sodic agroecosystems
Farmers generally opt for manual rice transplanting through hired labour at farmers' �elds without any due consideration to plant population. It has been observed that the plant population under manual method of rice transplanting generally remains 60-65% of the plant population total that is actually required for getting satisfactory yield levels. This practice becomes more important under salt affected soils where the seedling mortality rate remains relatively higher compared to normal conditions. Keeping this in view, 7 �eld demonstrations were done at farmers' �elds in village Mundri (Kaithal) where the soils are sodic in nature and water is of poor quality with high RSC content. Yield
207
Tech
nolo
gy A
sses
sed
and
Tran
sfer
Ann
ual R
epor
t 201
8-19
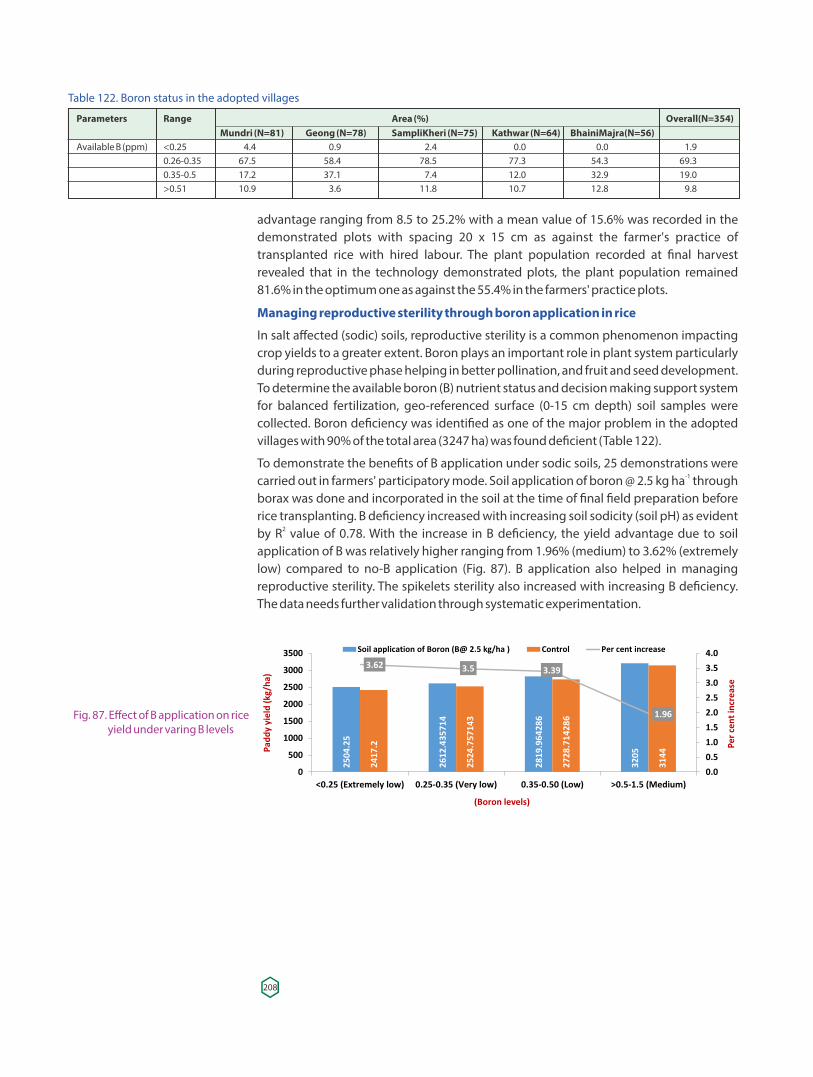
advantage ranging from 8.5 to 25.2% with a mean value of 15.6% was recorded in the demonstrated plots with spacing 20 x 15 cm as against the farmer's practice of transplanted rice with hired labour. The plant population recorded at �nal harvest revealed that in the technology demonstrated plots, the plant population remained 81.6% in the optimum one as against the 55.4% in the farmers' practice plots.
Managing reproductive sterility through boron application in rice
In salt affected (sodic) soils, reproductive sterility is a common phenomenon impacting crop yields to a greater extent. Boron plays an important role in plant system particularly during reproductive phase helping in better pollination, and fruit and seed development. To determine the available boron (B) nutrient status and decision making support system for balanced fertilization, geo-referenced surface (0-15 cm depth) soil samples were collected. Boron de�ciency was identi�ed as one of the major problem in the adopted villages with 90% of the total area (3247 ha) was found de�cient (Table 122).
To demonstrate the bene�ts of B application under sodic soils, 25 demonstrations were -1carried out in farmers' participatory mode. Soil application of boron @ 2.5 kg ha through
borax was done and incorporated in the soil at the time of �nal �eld preparation before rice transplanting. B de�ciency increased with increasing soil sodicity (soil pH) as evident
2by R value of 0.78. With the increase in B de�ciency, the yield advantage due to soil application of B was relatively higher ranging from 1.96% (medium) to 3.62% (extremely low) compared to no-B application (Fig. 87). B application also helped in managing reproductive sterility. The spikelets sterility also increased with increasing B de�ciency. The data needs further validation through systematic experimentation.
Fig. 87. Effect of B application on rice yield under varing B levels
Table 122. Boron status in the adopted villages
Parameters Range Area (%) Overall(N=354) Mundri (N=81) Geong (N=78) SampliKheri (N=75) Kathwar (N=64) BhainiMajra(N=56) Available B (ppm) <0.25 4.4 0.9 2.4 0.0 0.0 1.9 0.26-0.35 67.5 58.4 78.5 77.3 54.3 69.3 0.35-0.5 17.2 37.1 7.4 12.0 32.9 19.0 >0.51 10.9 3.6 11.8 10.7 12.8 9.8
208
MIS
CELL
AN
EOU
S
209
MIS
CELL
AN
EOU
SA
nnua
l Rep
ort 2
018-
19
210
Trainings in India and AbroadSr.No.Name and Designation Subject Duration Place1. Dr. R.K. Singh Rigorous Impact Evaluations 02.04.2018-06.04.2018 Srinagar Principal Scientist in Agriculture (Jammu & Kashmir) Dr. Parvender Sheoran Principal Scientist Dr. Raju, R, Scientist2. Dr. Arvind Kumar, Scientist International Training Course 10.04.2018-02.05.2018 ICARDA, Rabat, on Classical and Molecular Morocco Approaches in Wheat Breeding3. Dr. V. K. Mishra Oryza Training Program for 23.04.2018- 27.04.2018 IRRI, Los Principal Scientist Basic Application Banos Philippines4. Dr. S.K. Sanwal International Training Course on 29.04.2018 11.05.2018 Tel Aviv, Israel. Principal Scientist Seed Production & Treatments for Field and Vegetable Crops 5. Dr. D. Burman Mid-term Review Workshop 29.07.2018- 02.07.2018 Khulna, Bangladesh Principal Scientist of ACIAR funded project Dr. U. K. Mandal Principal Scientist Dr. S. K. Sarangi Principal Scientist Dr. S. Mandal Principal Scientist Dr. K. K. Mahanta Sr. Scientist 6. Dr. S. Mandal Developing Business Proposalf 06.08.2018-10.08.2018 ICAR-NAARM, Principal Scientist or Farmers Producer Companies’ Hyderabad7. Dr. Bisweswar Gorain SAARC Regional Training on 05.09.2018-10.09.2018 ICAR-IISS, Bhopal, Scientist Integrated Nutrient Managem- M.P., India -ent for Improving Soil Health and Crop Productivity 8. Dr. Raju, R. Scientist Innovative Practices in Extension 24.09.2018-29.09.2018 ICAR-NAARM, Research and Evaluation Hyderabad 9 Sh. B. G. Damor Motivation, Positive Thinking 04.10.2018-10.10.2018 ICAR-NAARM, Sr. Technical Assistant and Communication Skill for Hyderabad Technical staff10 Dr. Anshuman Singh Seminar on Human Resource 28.10.2018-03.11.2018 Beijing, China Scientist in Agricultural and Rural Development 11 Dr. Kiran Kumara T M Impact Assessment of 04.12.2018-07 .12.2018 ICAR-NAARM, Scientist Agricultural Research and Hyderabad. Technology 12 Parveen Kumar Management Development 17.12.2018-22.12.2018 ICAR-NAARM, Principal Scientist Program on ‘Priority setting, Hyderabad Monitoring and Evaluation of Agricultural Research Projects’ 13. Dr. S. K. Sarangi Electromagnetic (EM) Soil 13.01.2019- 19.01.2019 Khulna, Bangladesh Principal Scientist Survey of the Project ‘Cropping systems Intensi�cations in the salt-Affected Coastal Zone of Bangladesh and West Bengal, India’14. Dr. Awtar Singh, Scientist “Capacity Building for 29.01.2019-31.01.2019 ICAR-IIWBR, Karnal ICAR Scienti�c Staff” “Precision Nitrogen Nutrition in 07.03.2019- 12.03.2019 BISA-CIMMYT, Wheat: Integrating Genetics, Ludhiana Root Phenotyping and Precision Agronomy for Improving Nitrogen Use Efficiency” 15. Sh. Vinod Kumar Motivation, Positive Thinking 13.03.2019-19.03.2019 ICAR-IISWC Technical Officer and Communication Skill for Dehradun Technical staff
211
Trai
ning
s in
Indi
a an
d A
broa
dA
nnua
l Rep
ort 2
018-
19
Deputation of Scientists AbroadSr.No.Name and Designation Subject Duration Place1. Dr. H.S. Jat Sustainable Intensi�cation 5 years July Mexico and India Principal Scientist Program of CIMMYT 2013 - July 2018 2. Dr. Arvind Kumar International Training Course 10.04.2018-02.05.2018 ICARDA, Rabat, Scientist on Classical and Molecular Morocco Approaches in Wheat Breeding3. Dr. V. K. Mishra Oryza Training Program for 23.04.2018- 27.04.2018 IRRI, Los Banos Principal Scientist Basic Application Philippines4. Dr. S.K. Sanwal International Training Course 29.04.2018 11.05.2018 Tel Aviv, Israel Principal Scientist on Seed Production & Treatments for Field and Vegetable Crops5. Dr. P.C. Sharma, Director International Rice Conference 14.10.2018- 19.10.2018 Singapore6. Dr. Anshuman Singh 2018 Seminar on Human 28.10.2018-03.11.2018 Beijing, China Scientist Resource in Agricultural and Rural Development 7. Dr. R.K. Singh International Conference 09.11.2018-11.11.2018 University of Principal Scientist on Sustainability and Michigan Ann Development Arbor, USA 8. Dr. S. K. Sarangi, Electromagnetic (EM) 13.01.2019- 19.01.2019 Bangladesh and Principal Scientst Soil Survey of the project Khulna, ‘Cropping Systems Bangladesh Intensi�cations in the Salt-Affected Coastal Zone of West Bengal, India’
212
Awards and Recognitions
· Dr. R.K. Yadav, Head, S&CM received ICAR-CSSRI, Excellence Award 2016.
· Dr. Parveen Kumar, Principal Scientist received ICAR-CSSRI, Excellence Award 2017
· Dr. S.K. Sanwal, Principal Scientist, conferred Fellowship of the Indian Society of Vegetable Science (ISVS) 2017.
· Dr. S.K. Sanwal, got MASHAV Scholarship for an International Training on “Seed th thProduction & Treatments for Field and Vegetable Crops” from April 29 to May 11 ,
2018 held at Tel Aviv, Israel.
· Dr. Bhaskar Narjary and Dr. Madhu Chaudhry Conferred Young Scientist Award, 2018-19 by Indian Society of Soil Salinity and Water Quality (ISSSWQ), ICAR-Central Soil Salinity Research Institute, Karnal.
· Drs. Awtar Singh, R.K. Yadav, A.K. Rai and Madhu Choudhary received Best Poster Award in the GJISC-2019 during 7-9 Feb. 2019 for the paper titled “Isolation and Evaluation of Rhizospheric Bacteria for Zinc Solubilisation under Alkaline Condition”.
· Dr. Raju R., Kiran Kumara TM, Krishnamurthy S.L., P.C. Sharma, Anil Kumar, Parveen Kumar, Parvender Sheoran and RK Singh “Best Poster Award” for “Economic Bene�ts from adoption of Salt Tolerant Rice Variety Basmati CSR 30 in India” in GJISC-2019 held
that ICAR-CSSRI, Karnal during 7-9 February 2019.
· Dr. Ranjay K. Singh got Travel Fellowship Award from SE&RB, DST (Govt of India) for thattending Sustainability Conference held at University of Michigan, USA during 8-11
Nov. 2018
· Dr. Ranjay K. Singh Awarded with Honorary Charles Darwin University Fellowship
· Dr. Ranjay K. Singh Selected as Member, IUCN Committee on Ecosystem Management (Human Dimension).
· Dr. Ranjay K. Singh was elected Fellow (Social Sciences: Agricultural Extension) of the National Academy of Agricultural Sciences (NAAS), New Delhi.
· Dr. Parvender Sheoran received Dr. P.S. Deshmukh Young Agronomist Award of the Indian Society of Agronomy, New Delhi.
· Dr. Anshuman Singh was confermed the fellowship of Society of Biological Sciences and Rural Development, Paryagraj.
213
Awar
ds a
nd R
ecog
nitio
ns
Ann
ual R
epor
t 201
8-19
Linkages and collaborations
Collaborative Programmes at Main Institute, Karnal
International Collaboration
· Stress Tolerant Rice for Poor Farmers of Africa and South Asia (funding IRRI-BMGF)
· Marker Assisted Breeding of Abiotic Stress Tolerant Rice Varieties with Major QTL for Drought, Submergence and Salt Tolerance ( funding DBT, India)
· Developing of Sustainable Resource Management System in the Water-Vulnerable Area in India (Funding JIRCAS)
· CV Raman Fellow visiting scientist from Soil and Water Department, Faculty of Agriculture, Cairo University, Egypt
National Collaborations
· Transgenics in Crops- Salinity Tolerance in Rice: Functional Genomics Component (funding ICAR, New Delhi)
· Monitoring and Evaluation of Large-Scale Subsurface Drainage Projects in the State of Haryana (funding by Haryana Operational Pilot Project, Department of Agriculture, Haryana)
· Multi-locational Evaluation of Bread Wheat Germplasm (funding by NBPGR, New Delhi)
· AMAAS-Application of Micro-organism in Agriculture and Allied Sectors (funding by ICAR, New Delhi)
· Intellectual Property Management and Transfer/Commercialization of Agricultural Technology System (funding by ICAR, New Delhi)
· Inter-institutional Collaborative Project on Evaluation of Salinity Tolerance of Coriander, Fennel and Fenugreek Seed Spices (funding by NRCSS, Rajasthan).
· Development and validation of Multi-Trait allele speci�c SNP panel for high throughput genotyping of breeding populations in soybean (Collaborative project between ICAR-CSSRI and ICAR-IISR, Indore).
· QTL mapping and identi�cation of markers linked to salinity tolerance in chickpea (Cicer arietinum L.) (ICAR-JAU, Junagadh– CSSRI, Karnal Collaboration Project)
· Enhancement of genetic potential of moongbean and lentil in multi season- and different cropping system adaptation (Collaborative project between ICAR-CSSRI and ICAR-IARI, Pusa, New Delhi).
· ICAR-NRRI, Cuttack and ICAR-IASRI, New Delhi partners in NASF funded project.
· ICAR-IIWBR, Karnal, ICAR-NBPGR, New Delhi
· DST Funded Project “North Indian Centre for Water Technology Research in Agriculture” with PAU and WTC, ICAR-IARI, ICAR-CSSRI, HPKV, HP, SKUAST-J, Jammu as collaborative Institutes.
· Methodology for real-time assessment of salt affected soils in Ghaghar Plain of Haryana using hyper-spectral remote sensing (SERB+DST Funded)
214
Link
ages
and
col
labo
ratio
nsA
nnua
l Rep
ort 2
018-
19
Collaborative Programmes at Regional Research Station, Canning Town
International Collaborations
· IRRI: Development of crop and nutrient management practices in rice
· IRRI-STRASA Project on stress tolerant rice for poor farmers in Africa and South Asia
· CSIRO, Murdoch University, Australia–Project on cropping system intensi�cation in the salt affected coastal zones of Bangladesh and West Bengal, India
National Collaborations
· Coastal salinity tolerant variety trial (CSTVT) with ICAR-IIRR, Hyderabad.
· Bidhan Chandra Krishi Viswavidyalaya (BCKV), West Bengal.
· ICAR-National Bureau of Soil Survey and Land Use Planning (NBSS&LUP), Kolkata Centre
· ICAR-Central Research Institute for Jute and Allied Fibres (CRIJAF), Barrackpore
· Department of Agriculture, Government of West Bengal
· Department of Soil Conservation, Government of West Bengal
· Tagore Society for Rural Deveopment (TSRD), West Bengal.
· World Wide Fund (WWF)
Collaborative Programmes at Regional Research Station, Lucknow International Collaborations
· Future Rainfed Lowland Rice Systems in Eastern India ( Development of Crop and Nutrient Management Practices in Rice) (ICAR –W3) (IRRI funded).
National Collaborations
· Utilization of Fly Ash for Increasing Crop Productivity by Improving Hydro-Physical Behavior of Sodic Soils of Uttar Pradesh (DST Funded)
· Assessment of Municipal Solid Waste in Conjunction with Chemical Amendments for Harnessing Productivity Potential of Salt Affected Soils (UPCAR funded).
Collaborative programmes at Regional Research Station, Bharuch
National CollaborationS
• Navsari Agricultural University, Navsari
• Anand Agricultural University, Anand
• Junagadh Agricultural University, Junagadh
• ICAR-Central Institute of Cotton Research, Nagpur
• Gujarat Narmada Valley Fertilizer and Chemicals ltd. Bharuch
• VIKAS-NGO, Ahmedabad.
• ATAPI Seva Foundation, NGO Jambusar
• ICAR-Indian Institute of Water Management, Bhubaneshwar
• Bidhan Chandra Krishi Visva Vidyalaya, Kalyani (West Bengal)
215
• Water Technology Centre, TNAU, Coimbatore (TN)
• Krishi Vigyan Kendra, Surat
• Krishi Vigyan Kendra, Dediapada (Narmada)
• Krishi Vigyan Kendra, Chaswad (Bharuch)
• Krishi Vigyan Kendra, Vyara (Tapi)
• ICAR- Indian Institute of Wheat and Barley Research, Karnal
• All India Coordinated Cotton Improvement project , Coimbatore
• Sardar Sarovar Narmada Nigam Limited, Gandhinagar
NEW LINKAGES WITH NATIONAL AND INTERNATIONAL AGENCIES
· Recent Space Technologies and Image Interpretations for Mapping and Characterizing Salinity Affected Areas with Higher Accuracies with National Remote Sensing Centre (NRSC), Hyderabad, State Remote Sensing Application Centres (RSAC) and ICAR-NBSS&LUP, Nagpur
· Academic linkages with Institute of Environmental Studies, Kurukshetra University, Kurukshetra, Haryana; Department of Biotechnology, Maharishi Markandeshwer University, Mullana, Haryana; Deenbandhu Chhotu Ram University of Science & Technology, Murthal, Haryana and ICAR-NDRI, Karnal, Haryana for Post Graduate teaching and research
· For collaborative research on seed spices with ICAR-National Research Centre on Seed Spices, Ajmer, Rajasthan
· Project Director, NCP, IGBP, IIRS, NRSA, Department of Space, Dehradun, Uttrakhand
· CCSHAU, Hisar, Haryana for collaborative research
· Research Institute of Theoretical & Applied Physical Chemistry (INIFTA), La Plata, Argentina (funding from UNESCO-TWAS-CONICETS) for collaborative research.
· Development of efficient and cost effective materials for remediation of salt-affected soils with Centre for Environmental Science and Engineering (CESE), Indian Institute of Technology, Kanpur, India.
· SHIATS, Allahabad (U.P.)
· JIRCAS, Tsukuba, Japan
216
Link
ages
and
col
labo
ratio
nsA
nnua
l Rep
ort 2
018-
19
Publications
Research Paper
Arora, Sanjay and Mehta, R. 2018. Characteristics of coastal saline soils inhabiting halophytes and salt tolerant plants. Journal of Soil and Water Conservation, 17:107-110.
Bandana, Kumar, D., Kumar, P., Rawal, S., Saini, N. and Sharma, V. 2018. In�uence of source of nutrition on potato (Solanum tuberosum) tuber quality in elevated temperature storage. Indian Journal of Agricultural Sciences, 88: 1371-1377.
Banyal, R., Yadav, R.K., Sheoran, P. and Bhardwaj, A.K. 2018. Managing Saline Soils of Indo-Gangetic Plains with Eucalyptus and Melia based Agroforestry Systems. Indian Journal of Ecology, 45:841-849.
Basak, N. and Mandal, B. 2019. Soil quality management through carbon farming under intensive agriculture s y s t e m s . I n d i a n J o u r n a l o f Fertilisers,14: 54-64.
Bhandari, G., Chandra, S., Gupta, M., Katiyar, R., Ravi, Y. and Gorain, B. 2018. Factors stalling agricultural growth- micro-level evidence from Karsanda Village of Uttar Pradesh. International Journal of Pure Applied Bioscience, 6: 72-79.
Camus, D., Chinchmalatpure, A.R., Kumar, Shrvan, Prasad, Indivar and Vibhute, Sagar. 2018. Pruning, irrigation and nitrogen interactions on guava yield and quality in saline vertisols. Journal of Soil Salinity and Water Quality, 10: 212-217.
Chaitanya, A.K., Majumder, S.P., Padhan, D., Badole, S., Datta, A., Mandal, B., Reddy, G.K. 2018. Carbon dynamics, potential and cost of c sequestration in double rice. Journal of Soil Science and Plant Nutrition 18: 418-434.
Chandra, Priyanka, Arora, D. S., Pal, M. and Sharma, R. K. 2019. Antioxidant
Potential and Extracellular Auxin Production by White Rot Fungi. A p p l l i e d B i o c h e m s t r y a n d Biotechnology, https://doi.org/ 10.1007/s12010-018-2842-z.
Chandra, P., Tripathi, P. and Chandra, A. 2018. Isolation and molecular characterization of plant growth promoting Bacillus spp. and their impact on sugarcane (Saccharumsps. hybrids) growth. Acta Physiologiae Plantarum 40: 199.
Chinchmalatpure, A.R. , Camus, D. , Vaibhav, R., Vibhute, S., Kumar, S., Prasad I . and Shuk la M.2018. A s s e s s i n g g r o u n d w a t e r contamination due to heavy metals and their spatial distribution in an industrial area of Western India. Journal of Soil Salinity and Water Quality, 10:178-185.
Chinchmalatpure, A.R., Kumar, S., Rao, G.G., Nikam, V., Prasad, I., Camus, D. and Sharma D.K. 2018. Impact of irrigation on soil characteristics in saline Vertisols of Bara tract under Sardar Sarovar Canal Command of Gujarat. Journal of the Indian Society of Soil Science, 66:4.
Choudhary, K.M., Jat, H.S., Nandal, D.P., B i s h n o i , D. K . , S u t a l i y a , J . M . , Choudhary, M., Sharma, P.C. and Jat, M.L. 2018. Evaluating alternatives to rice-wheat system in western Indo-Gangetic Plains: crop yields, water p r o d u c t i v i t y a n d e c o n o m i c pro�tability. Field Crops Research, 218: 1-10.
Choudhary, M., Datta, A., Jat, H. S., Yadav, A. K., Gathala, M. K., Sapkota, T. B., Das, A.K., Sharma, P. C., Jat, M. L., Singh, R. and Ladha, J. K. 2018. Changes in soil b i o l o g y u n d e r c o n s e r v a t i o n agr iculture based sustainable intensi�cation of cereal systems in Indo-Gangetic Plains. Geoderma, 313: 193–204.
Choudhary, M., Jat, H.S., Datta, A., Yadav A.K., Sapkota, T.B., Mondal, S., Meena, R.P., Sharma, P.C. and Jat, M.L. 2018. S u s t a i n a b l e i n t e n s i � c a t i o n in�uences soil quality, biota, and p r o d u c t i v i t y i n c e r e a l - b a s e d a g ro e c o s y s t e m s. A p p l i e d S o i l Ecology, 126:189-198.
Choudhary, M., Sharma, P.C. Jat, H.S., McDonald, A., Jat, M.L., Choudhary, S. and Garg, M. 2018. Soil biological properties and fungal diversity under conservation agriculture in Indo-Gangetic plains of India. Journal of Soil Science and Plant Nutrition, 18: 1142-1156.
Choudhary, M., Sharma, P.C., Jat, H.S., Dash, A., Rajashekar, B., McDonald, A . J . , a n d J a t , M . L . 2 0 1 8 . S o i l b a c t e r i a l d i v e r s i t y u n d e r conservation agriculture-based cereal systems in Indo-Gangetic Plains. 3 Biotech, 8: 304.
Choudhary, M., Jat, H.S., Sharma, P.C. and Garg, M. 2018. Microbial diversity under conservation agriculture (CA) based management scenarios in re c l a i m e d s a l t - a ffe c te d s o i l s : Metagenomic approach. Journal of Soil Salinity and Water Quality, 10: 87-94.
Damodaran T, Rajan, S., Mishra,V.K., Jha, S.K., Gopal, R. and Ahmad, Israr. 2018. First report of fusarium wilt in b a n a n a c a u s e d b y F u s a r i u m oxysporum f.sp.cubense Tropical Race 4 in India. Plant Disease , https://doi.org/10.1094/PDIS -07-18-1263-PDN
Damodaran, T., Mishra,V. K., Jha, S.K., Pankaj, Umesh, Gupta, Garima, Gopal, R. 2018. Identi�cation of rhizosphere bacterial diversity with promising 3 salt tolerance, PGP traits and their txploitation for seed 4 germination enhancement in sodic soil. Agricultural Research, 8: 36-43.
217
Damodaran,T., Rajan, S., Mishra,V.K., Jha, S.K. and Sahu, A.K. 2018. Screening polyembryonic mango accessions for salt tolerance and assessing
+dynamics of sodium (Na ) potassium +(K ) and antioxidants. Fruits,73:
228–235.
Das, J. and Raju, R. 2018. Determinants of consumption and willingness to pay for fermented probiotic dair y products in metropolitan Delhi. Indian Journal of Economics and Development, 14: 247-251.
Das, J., Raju, R., Sirohi, S., Chandel, B.S., Raju, P.N. and Meena, B.S. 2019. Consumption pattern of fermented p r o b i o t i c d a i r y P r o d u c t s i n metropolitan Delhi. Journal of Pharmacognosy and Phytochemistry, 1: 45-49.
Das, M.M., Singh, K. K., Rai, A. K. and Mahanta, S. K. 2018. Effect of feeding micronutrient fertilized sorghum hay based diet on nutrient utilization and mineral balance in sheep. Indian Journal of Animal Sciences , 88: 944–948
Datta, A. and Mandal, B. 2018. Production (via N‐fertilization) and correction (by l iming) of acidity in soi ls contribute a huge efflux of CO to 2
atmosphere: real or arbitrary? Global Change Biology, 24: 3280–3281.
Datta, A., Jat, H.S., Yadav, A.K., Choudhary, M., Sharma, P.C., Rai, M., Singh, L. K., Majumder, S.P., Choudhary, V. and Jat, M.L. 2019. Carbon mineralization in soil as in�uenced by crop residue type and placement in an Al�sol of N o r t h w e s t I n d i a . C a r b o n M a n a g e m e n t , (https://doi.org/10.1080/17583004.2018.1544830).
Datta, A., Mandal, A.K. and Yadav, R.K. 2019. Proper measurement of electrical conductivity and other parameters in�uence pro�le salinity and sodicity under different land uses. Ecological Indicators, 101: 1004–1006.
Datta, A., Mandal, B., Badole, S., Chaitanya
A.K., Majumder, S.P., Padhan, D., Basak, N., Barman, A., Kundu, R. and N a r k h e d e , W . N . 2 0 1 8 . Interrelationship of biomass yield, carbon input, aggregation, carbon pools and its sequestration in Vertisols under long-term sorghum-wheat cropping system in semi-arid tropics. Soil and Tillage Research,184: 164–175.
Devi, J., Mishra, G.P., Sanwal, S.K., Dubey, R.K., Singh, P.M. and Singh, B. 2018. Development and characterization of penta-�ower ing and tr ip le �owering genotypes in garden pea (Pisum sativum L. var. hortense). PLoS ONE 13:e0201235. https://doi.org/ 10.1371.
Devi, J., Sanwal, S.K., Koley, T. K., Mishra, G. P., Karmakar, P., Singh., P.M. and Singh, B. 2019. Variations in the total phenolics and antioxidant activities among garden pea (Pisum sativum L.) genotypes differing for maturity duration, seed and flower traits and their association with the yield. Scientia Horticulturae, 244: 141–150.
Dixit, A.K., Agrawal, R.K., Das, S.K., Sahay, C.S., Choudhary, M., Rai, A. K., Kumar, Sunil, Kantwa, S.R. and Palsaniya, D. R . 2018. Soi l proper t ies, crop productivity, and energetics under different tillage practices in fodder sorghum+ cowpea – wheat cropping system. Archives of Agronomy and S o i l S c i e n c e , D O I : 1 0 . 1 0 8 0 / 03650340.2018.1507024
D u b e y, R . , Pa t h a k , H . , S i n g h , S . , Chakravarti, B., Thakur, A.K. and Fagodiya, R.K. 2019. Impact of sowing dates on terminal heat tolerance of different wheat (Triticum aestivum L.) Cultivars. National A c a d e m y S c i e n c e L e t t e r s https://doi.org/10.1007/s40009-019-0786-7.
Ganie, P.A., Yousuf, D.J., Bhat, R.A.H., Bhat, I.A., Kunal, K., Pandey, P.K. and Sharma, D. 2018. Investigation of acute toxic ity and behavioral response of Indian major carp, Cirrhinus mrigala (Hamilton, 1822) in
response to Cypermethrin (25% EC). Journal of Entomology and Zoology Studies, 6: 194-199.
Gorain, B., Ramakrishna, Parama, V. R. and P a u l , S . 2 0 1 8 . H e a v y m e t a l s contamination in Madiwala and L a l b a g h L a k e s o f B e n g a l u r u , Karnataka: Effect of idol immersion activities. International Journal Current Microbial Applied Science, 7: 2254-2263.
Gorain, B., Ramakrishna, Parama, V.R. and Pa u l , S . 2 0 1 8 . I m p a c t o f i d o l immersion activities on the water quality of Hebbal and Bellandur Lakes of Bengaluru in Karnataka. Journal of Soil Salinity and Water Quality,10:112-117.
Gulati, I.J., Yadava, N.S., Singh, A.K., Gupta, D e e p a k , M e e n a , R . L . a n d Kaledhonkar, M.J. 2018. Feasibility of wheat cult ivat ion with sal ine groundwater irrigation using drip in arid climate of Rajasthan. Journal of Soil Salinity and Water Quality, 10: 192-199.
Jaffer, Y.D., Kumar, Vinoth, Irfan, R., Ishfaq, A.B., Ganie, N.M., Bhat, P.A., R.A.H. and Vennila, A. 2019. Isolation and characterization of thermophilic bacteria from Maharashtra hot s p r i n g s : B a c i l l u s s p . a n d S t a p h y l o c o c c u s s p . J o u r n a l o f Entomology and Zoology Studies, 7: 691-695.
Jasrotia, P., Kashyap, P.L., Bhardwaj, A.K., Kumar,S.and Singh, G.P. 2018. N a n o t e c h n o l o g y s c o p e a n d applications for wheat production: A review of recent advances. Wheat and Barley Research, 10:137-150.
Jat, H.S., Datta, A., Choudhary, M., Yadav, A.K., Choudhary, V., Sharma, P.C., G a t h a l a , M . K . , J a t , M . L . a n d McDonald, A. 2019. Effects of tillage, c r o p e s t a b l i s h m e n t a n d diversi�cation on soil organic carbon, aggregation, aggregate associated carbon and productivity in cereal systems of semi-arid Northwest India. Soil and Tillage Research, 190: 128-138.
218
Publ
icat
ions
Ann
ual R
epor
t 201
8-19
Jat, H.S., Datta, A., Sharma, P.C., Kumar, V., Ya d a v, A . K . , C h o u d h a r y , M . , Choudhary, V., Gathala, M.K., Sharma, D.K., Jat, M.L., Yaduvanshi, N.P.S., Singh, G. and McDonald, A. 2018. Assessing soi l proper t ies and n u t r i e n t a v a i l a b i l i t y u n d e r conservation agriculture practices in a reclaimed sodic soil in cereal-based systems of North-West India. A rchives of Agronomy and S oil Science, 64: 531-545.
Jat , H.S . , S ingh, G. , S ingh, R . and Choudhar y, M. 2018. Effect of planting and ex-situ mulching on growth, productivity, pro�tability and nutrient uptake in maize-wheat cropping sequence. Journal of Soil Salinity and Water Quality, 10: 95-103.
Jat, M.L., Stirling, C.M., Jat, H.S., Tetarwal, J.P., Jat, R.K., Singh, R., Lopez-Ridaura, S. and Shirsath, P.B., 2018. Soil processes and wheat cropping under emerging climate change scenarios in South Asia. Advances in Agronomy, 148: 111-171.
Jat, R.D., Jat, H.S., Nanwal, R.K., Yadav, A.K., Bana, A., Choudhary, K.M., Kakraliya, S.K., Sutaliya, J.M., Sapkota, T.B. and J a t , M . L . 2 0 1 8 . C o n s e r v a t i o n agriculture and precision nutrient management practices in maize-wheat system: Effects on crop and water productivity and economic pro�tability. Field Crops Research, 222: 111-120.
Jat, R.K., Singh, P., Jat, M.L., Dia, M., Sidhu, H.S., Jat, S.L., Bijarniya, D., Jat, H.S., Parihar, C.M., Kumar, U. and Ridaura, S.L. 2018. Heat stress and yield stability of wheat genotypes under different sowing dates across agro-ecosystems in India. Field Crops Research, 218: 33-50.
Kakraliya, S.K., Jat, H.S., Singh, I., Sapkota, T.B., Singh, L.K., Sutaliya, J.M., Sharma, P.C., Jat, R.D., Choudhary, M., Lopez-Ridaura, S. and Jat, M.L. 2018. Performance of portfolios of climate smart agriculture practices in a rice-wheat system of western Indo-
Gangetic plains. Agricultural Water Management, 202: 122-133.
Kakraliya, S.K., Singh, I., Dadarwal, R.S., Singh, L.K., Jat, R.D., Jat, H.S. and Jat, M.L. 2018. Impact of climate-smart agricultural practices on growth and crop yields of rice (Oryza sativa)-wheat (Triticumaestivum) system in north-western Indo-Gangetic Plains. I n d i a n J o u r n a l o f A g r i c u l t u r a l Sciences, 88: 1543-1551.
Kiran Kumara, T.M., Kumar, Shiv, Singh, D.R. a n d I m m a n u e l r a j , K . 2 0 1 8 . Participation in community based tank irrigation system in a rainfed region of India. Indian Journal of Agricultural Sciences, 88: 596–600.
Koganti, T., Narjary, B., Zare, E., Pathan, A.L., Huang, J. and Trianta�lis., J. 2018. Quantitative mapping of soil salinity using the DUALEM 21S instrument and EM inversion software. Land Degradation and Development, 29: 1768-1781.
Krishan, G., Chandniha, S.K., Lohani, A.K., Yadav, B.K., Arora, N.K., Singh, S., Kumar, C.P. , Sharma, L .M. and Bhardwaj, A.K. 2018. Assessment of heavy metals in relation to soil pollution at Mewat, Haryana, India. Current World Environment, 13: 299-306.
Kumar, A., Kumar, A., Lata, Charu, Kumar, S., M., Shamsudheen, Singh, J.P., Mishra, A.K. and Dayal, Devi. 2018. Effect of salinity and alkalinity on responses of halophytic grasses Sporobolus marginatus and Urochondra setulosa. I n d i a n J o u r n a l o f A g r i c u l t u r a l Sciences, 88: 1296-1304.
Kumar, A., Mandal, A.B. and Sarangi, S.K . 2018. Genetic divergence and PCA for salinity tolerance in rice at reproductive stage. Oryza, 55: 342-348.
Kumar, A., Mandal, A.B., Sarangi, S.K., Verma, R.L. and Singh, O.N. 2018. Standardization of technique and screening for salinity tolerance in rice (Oryza sativa L.). Oryza, 55: 425-437.
Kumar, A., Sharma, S. K., Lata, Charu, Devi, Ritu, Kulshrestha, N. Krishnamurthy, S.L. Singh, Kailash and Yadav, R.K. 2018. Impact of water de�cit (salt and drought) stress on physiological, biochemical and yield attributes on wheat (Triticum aestivum) varieties. I n d i a n J o u r n a l o f A g r i c u l t u r a l Sciences, 88: 1624-1632.
Kumar, A., Sharma, P. C., Singh, R. and Kumar i , J . 2018. Bread wheat germplasm evaluation for soil moisture stress tolerance under rainfed condition. International Journal of Bio-resource and Stress Management, 9:754-761.
Kumar, A., Kumar, A., Kumar, P., Lata, Charu and Kumar, S . 2018. Effec t of individual and interactive alkalinity and sal inity on physiological , biochemical and nutritional traits of Marvel grass. Indian Journal of Experimental Biology,56: 573-581.
Kumar, M. and Kumar, S. 2018. Sprouting and survival of cactus pear as in�uenced by moisture loss of cladode in Arid Region, India. Multilogic in Science, 8: 14-18.
Kumar, M., Kumar, S., Uthappa, A.R. and S h i r a n k a l a p p u r a k k a l . 2 0 1 8 . In�uence of Prosopis cineraria L. on microclimate conditions under agroforestry system in arid region, India. Indian Journal of Agroforestry, 20: 35-39.
Kumar, M., Narayan, Dev, Yadav, R.S., Kumar, P., Ranjan, R., Pramanik, Monalisha and Rajkumar. 2018. Performance of aonla with in-situ moisture conservation techniques for sustainable produc tion in Bundelkhand. Indian Journal of Ecology, 45: 654-658.
Kumar, P., Mishra, A.K., Chaudhari, S.K., Basak, N., Rai, P., Singh, K., Singh, R. Pandey, C.B. and Sharma, D. 2018. Carbon pools and nutrient dynamics under eucalyptus-based agroforestry system in semi-arid region of North-west India. Journal of the Indian Society of Soil Science, 66: 188-199.
219
Kumar, R., Mehta, H., Kaushal, R., Banyal, R. and Kumar, M. 2018. In�uence of provenance variation on seedling characteristics of Celtisaustralis in nursery environment. Indian Journal of Ecology, 45: 797-801.
Kumar, S., Narjary, B., Kumar, K., Jat, H.S., Kamra, S.K. and Yadav, R.K. 2019. Developing soil matric potential based irrigation strategies of direct seeded rice for improving yield and water productivity. Agricultural Water Management, 215: 8-15.
Kumar, V., Jat, H.S., Sharma, P.C., Gathala, M.K., Malik, R.K., Kamboj, B.R., Yadav, A.K., Ladha, J.K., Anitha, Raman, Sharma, D.K., McDonald, A., 2018. Can productivity and pro�tability be enhanced in intensively managed cereal systems while reducing the environmental footprint of production? Assessing sustainable intensi�cation options in the breadbasket of India. A g r i c u l t u r e , E c o s y s t e m s & Environment, 252: 132-147.
Lohan, S.K., Jat, H.S., Yadav, A.K., Sidhu, H.S., Jat, M.L., Choudhary, M., Peter, J.K. and Sharma, P.C., 2018. Burning i s s u e s o f p a d d y r e s i d u e management in north-west states of India. Renewable and Sustainable Energy Reviews, 81: 693-706.
Mahanta, K. K., Mishra, G. C. 2018. D e v e l o p m e n t o f a s o d i c s o i l reclamation model based on electric double layer theory. Journal of Crop and Weed, 14: 1-8.
Makarana, G., Yadav, R.K., Kumar, R. and Sheoran, P. 2018. Morphological and y ield response of pearl mil let (Pennisetum Glaucum L.) as in�uenced by different accessions and cutting management under saline irrigation water in North Western Region of India. Chemecal Science Review and Letters, 7: 616-624.
Mandal, A.K. 2018. Modern tools and techniques for d iagnosis and prognosis of salt affected soils and p o o r q u a l i t y w a t e r s . C u r r e n t
Investigations in Agriculture and C u r r e n t R e s e a r c h 2 : 5 C I A C R . MS.IS.000149.
Mandal, S., Raju, R., Kumar, Anil, Kumar, Parveen and Sharma, P.C. 2018. C u r r e n t s t a t u s o f r e s e a r c h , technology response and policy needs of salt-affected soils in India – a review. Journal of Indian Society of Coastal Agricultural Research, 36: 40-53.
Mandal, S., Sah, K. D., Das, K., Sahoo, A. K., Reza, S. K., Nayak, D. C., Singh, S. K. B u r m a n , D . , S h a r m a , P. C . , Chakraborty, P. P. and Sarkar, S. 2018. Increasing small-holder farmers' income through alternate land-use options in coastal salt-affected areas of West Bengal. Journal of Soil Salinity and Water Quality, 10: 268-278.
Mandal, U.K., Burman, D., Bhardwaj, A.K., Nayak, D.B., Samui, A., Mullick, S., Mahanta, K.K., Lama, T.D., Maji, B., Mandal, S., Raut, S. and Sarangi, S.K. 2019. Waterlogging and coastal salinity management through land shaping and cropping intensi�cation in climatically vulnerable Indian Sundarbans. Agricultural Water Management, 216:12–26.
Mandal, U.K., Nayak, D. B., Samui, A., Jana, A.K., Mullick, S., Lama, T.D., Bhardwaj, A.K., Mahanta, K. K., Mandal, S., Raut, S. Sarangi, S. K. and Burman, D. 2019. Trend of sea-level rise in West Bengal coast. Journal of the Indian Society of Coastal Agricultural Research, 36: 64-73.
Mandal, U.K., Sarangi, S.K., and Burman, D. 2019. Scope of adaptat ion of conservation agriculture technology in degraded coastal soils of West Bengal. SATSA Mukhapatra - Annual -Technical Issue, 23: 47-59.
Mann, A., Kaur, Gurpreet, Kumar, A., Sanwal, S. K., Singh, J. and Sharma, P.C. 2018. Physiological response of chickpea (Cicer arietinum L.) at early seedling stage under salt stress conditions. Legume Research, doi: 10.18805/LR-4059
Mann, A., Kumar, Naresh, Lata, Charu, Kumar, A., Kumar, Arvind and Meena, B.L. 2019. Functional annotation of differentially expressed genes under salt stress in Dichanthium annulatum. Indian Journal of Plant Physiology, doi. org / 10. 1007 /s40502-019-0434-8
Mann, A., Singh, A.L., Kumar, A., Parvender, Oza, S., Goswami, N., Chaudhari, V., Patel, C.B. and Zala, P.V. 2018. Exploiting genetic variation for lime-induced iron-de�ciency chlorosis in groundnut (Arachis hypogaea L.). I n d i a n J o u r n a l o f A g r i c u l t u r a l Sciences, 88: 482-488.
Mathew, S., Zeng, B., Zander, K.K. and Singh, Ranjay, K. 2018. Exploring agricultural development and adaptation in northern Australia under climatic risks. The Rangeland Journal 40: 353-364.
Meena, B.L., Datta, S.P., Rattan, R.K., Singh, S., Kumar, A., Kaledhonkar, M.J. and Meena, R.L. 2018. A new soil testing programme for the evaluation of intensity and quantity factors of iron. National Academy Science Letters, doi.org/10.1007/s40009-018-0713-3.
Meena, B.L., Kumar, P., Kumar, A., Meena, R.L., Kaledhonkar, M.J. and Sharma, P.C. 2018. Zinc and iron nutrition to increase the productivity of pearl millet-mustard cropping system in salt affected soils. International Journal Current Microbiol. Applied Science, 7: 3201-3211.
Meena, M.D., Narjary B., Sheoran P., Jat H.S., Joshi P.K., Chinchmalatpure A.R., Yadav Gajender, Yadav, R.K. and Meena, M.K. 2018. Effect of rice straw compost and mineral fertilizers on yield and nutrient uptake by Indian mustard in saline soil. Journal of Oilseed Brassica, 9: 10-16
Meena, M.D., Narjary, B., Sheoran, P., Jat, H.S., Joshi, P.K., Chinchmalatpure, A.R., Yadav, Gajender, Yadav, R.K. and Meena, M.K. 2018. Changes of phosphorus fractions in saline soil amended with municipal solid waste
220
Publ
icat
ions
Ann
ual R
epor
t 201
8-19
compost and mineral fertilizers in a mustard-pearl millet cropping system. Catena, 160: 32–40
Meena, M.D., Yadav, R.K., Narjary, B., Yadav, G., Jat, H.S., Sheoran, P., Meena, M.K., Antil, R.S., Meena, B.L., Singh, H.V., Meena, V.S., Rai, P.K., Ghosh, A., and Moharana, P. C. 2019. Municipal Solid Waste (MSW): Strategies to i m p r o v e s a l t a ff e c t e d s o i l sustainability. Waste Management, 84: 38-53.
Meghwal, P.R., Kumar, A. and Kumar, S. 2018. Performance of cactus pear at two geographical locations in Indian a r i d z o n e . I n d i a n J o u r n a l o f Horticulture, 75: 157-160
Mehta, H., Kumar, R., Dar, M.A., Juyal, G. P., Patra, S., Dobhal, S., Rathore, A.C., Kaushal, R., and Mishra, P.K. 2018. Effect of geojute technique on density, diversity and carbon stock of plant species in landslide site of North West Himalaya. Journal of Mountain Science, 15: 1961-1971.
Minhas,P.S., Qadir, Manzoor, Yadav, R.K. 2018. Groundwater i r r igat ion induced soi l sodi�cat ion and response options. Agricultural Water Management, 2015: 74-85.
Mishra, P., Jain, A., Takabe, T., Tanaka, Y., Negi, M., Singh, N. Jain, N., Mishra,V., Maniraj, R., Krishnamurthy S. L., Sreevathsa, R., Singh, N., Kumar, Rai, Va n d n a . 2 0 1 9 . H e t e r o l o g o u s expression of serine hydroxyl methyl transferase3 from rice confers tolerance to salinity stress in E coli and Arabidopsis. Frontiers in Plant S c i e n c e , d o i : 10.3389/fpls.2019.00217.
Mishra, V.K., Jha, S. K., Damodaran, T., Singh, Y. P., Srivastawa, S., Sharma, D. K. and Prasad, J. Feasibility of coal combustion �y ash alone and in combination with gypsum and green manure for reclamation of d e g r a d e d s o d i c s o i l s o f t h e Indo‐Gangetic Plains: a mechanism evaluation. Land Degradation and Development. .
Nagaraja, M.S. and Bhardwaj, A.K. 2018. Biomass turnover interactions with soil C sequestration among the land uses in the Western Ghats. Current Science, 115: 213-216.
Nagaraja, M.S., Champa, B.V. Meti, S. and Bhardwaj A.K. 2018. CO sink source 2
potentials of manmade landuse systems (LUS) of western ghats with l a n d u s e c h a n g e s ( L U C ) . Contemporary Research in India, 1: 226-230.
Naraboli, V.C., Srikanth, S., Bhardwaj, A.K., Meti, S., Alur and A.S., Nagraja, M.S. 2019. Simple estimates for o p t i m i z a t i o n o f p o t a s s i u m nutrition in vineyards. Current Science. 116: 30-32.
Narjary, B., Meena, M.D., Kumar, S., Kamra, S .K . , Sharma, D.K . and Trainta�lis, J. 2019. Digital mapping of soil salinity at various depths using an EM38. Soil Use and Management, doi: 10.1111/sum.12468.
Nikam, V., Chinchmalatpure, A.R., Rao, G.G., Kad, S. and Sharma, D.K. 2018. Farmers perception, economic viability and constraints in desi cotton cultivation in dryland salinity of Gujarat. Journal of Soil Salinity and Water Quality, 10: 118-125.
Ojha, R.P., Verma, C. L., Denis, D.M. and Arora, S. 2018. Modi�cation of existing inverse auger hole method for measurement of saturated hydraulic conductivity. Journal of Soil Salinity and Water Quality, 10: 168-177.
Paray, P.A., Banyal, R., Mugloo and J.A., Bhat, A.F. 2018. Effect of pre -t re a t m e n t s a n d p o o t c u t t i n g thickness on germination and growth of sour cherr y. Indian Forester, 144: 758-761.
Parihar, C. M., Jat, S.L., Singh, A.K., Datta, A. , Parihar, M.D. , Varghese, E. , Bandyopadhyay, K.K., Nayak, H.S., Kuri, B.R. and Jat, M.L. 2018. Changes in carbon pools and biological activities of a sandy loam soil under
m e d i u m - t e r m c o n s e r v a t i o n agriculture and diversi�ed cropping systems. European Journal of Soil Science, 69: 902-912.
Prajapat, K., Yadav, R.K., Kumar, A. and Charu, Lata. 2018. In�uence of sowing methods and mulching on soil salt dynamics and performance of fodder sorghum irrigated with saline water. Journal of Soil Salinity and Water Quality 10: 225-233.
P., Chandra, Tripathi, P. and Chandra, A. 2018. Isolation and molecular characterization of plant growth promoting Bacillus spp. and their impact on sugarcane (Saccharum s p s . h y b r i d s ) g r o w t h . A c t a Physiologiae Plantarum, 40: 199.
Raghavendra, P., Kumar, B.M., Dushyantha, Kumar, Sachin, H.M., Madhuri, R., Gangaprasad, S., Krishnamurthy, S.L., Dhananjaya, B.C., Halingali, B.I. and H i t t a l m a n i , S h a i l a j a . 2 0 1 8 . Exploration of genetic diversity in traditional landraces of rice for yield and its attributing traits under saline stress condition. International Journal Current Microbial Applied Science, 7: 3359-3366.
R a j k u m a r, R . H . , V i s h w a n a t h a , J . , Karegoudar, A.V., Anand, S.R. and Kaledhonkar, M.J. 2018. Response of cotton to drip and sur face irrigation in saline vertisols of tungabhadra command area under c o n s e r v a t i o n a g r i c u l t u r a l practices. Journal of Soil Salinity and Water Quality, 10: 246-253.
Sahay, R., Singh, A.K., Arora, S., Singh, A., Tiwari, D.K. 2018. Effect of halophilic bioformulations on soil fertility and productivity of salt tolerant varieties of paddy in sodic soil. International Journal of Current Microbiology and Applied Sciences 7: 1174-1179.
Sanwal, C.S., Dhakate, P.M., Joshi, K.K., Kumar, R. and Dobhal, S. 2018. I n n o v a t i v e a g r o f o r e s t r y i n t e r v e n t i o n s fo r a l t e r n a t i v e economically viable livelihood development to support climate
221
resilient mountain agriculture. S u s t a i n a b l e F o r e s t r y , 10.24294/sf.v1i2.965.
Sanwal, C.S., Kumar, R. and Dobhal, S. 2 0 1 8 . E ff e c t o f t r e e c a n o p y, topographic aspect and tillage practices on growth and yield of ocimumbasilicum in mid hills of Indian Himalaya. International Journal of Forestry and Horticulture, 4: 12-21.
Sharma, A., Kumar, S., Lal, S., Malik, G., Sharma, O.C., Mir, J.I., Singh, D.B., Raja, W.H. and Arora, S. 2018. Nutrient saving and yield enhancement through fertigation in apple growing cold humid regions of North-west Himalayas. Journal of the Indian Society of Soil Science, 66: 96-102.
Sharma, P.C., Datta, A., Yadav, A.K., Choudhar y, M. , Jat , H .S . , and McDonald A., 2018. Effect of crop management practices on crop growth, productivity and pro�tability of rice–wheat system in western Indo-Gangetic Plains. PNAS Section B: Biological Sciences, pp.1-13.
Sharma, S., Sharma, V., Arora, S., Kumar, V., Arya, V.M. and Sharma, K.R. 2018. Forms of potassium in mango, citrus and guava orchard soils under rainfed foothill region of Jammu. Journal of the Indian Society of Soil Science, 66: 336-340.
Sharma, S.K., Kulshreshtha, N., Kumar, A., Yaduvanshi, N.P.S., Singh, Monika, P r a s a d , K . R . K . a n d B a s a k , Nirmalendu. 2018. Waterlogging effects on elemental composition of wheat genotypes in sodic soils. Journal of Plant Nutrition , DOI: 10.1080/01904167.2018.1434541.
Sheoran, P., Sardana, V., Chander, S., Kumar, A. Meena, M.D., Bali, A. and Sharma, P.C. 2018. Sulphur, boron and zinc nutrit ion to improve productivity, pro�tability and oil quality in sun�ower. Indian Journal of Agricultural Sciences, 88: 1746-54.
Sheoran, P., Singh, R.K., Yadav, R.K., Kumar,
S., Sanwal, S.K., Kumar, A., Barman, A., Raju, R., Ponnuswamy, K., Singh, S., Singh, A. and Sharma, P.C. 2018. Salinity expert: enabled decision support system for sodic agro-ecosystems. Journal of Soil Salinity and Water Quality, 10: 289-291.
Singh, A., Kumar, A., Rajkumar, Sheoran, P. and Yadav, R. K. 2018. Effects of sodic w a t e r i r r i g a t i o n o n g r o w t h , physiological relations and ion uptake in two Ziziphus rootstocks. I n d i a n J o u r n a l o f A g r i c u l t u r a l Sciences, 88: 1413-18.
Singh, A.K., Arora, S., Singh, Y. P., Verma, C. L., Bhardwaj, A. K., and Sharma, N. 2018. Water use in rice crop through different methods of irrigation in s o d i c s o i l . P a d d y a n d W a t e r Environment, 16: 587-593.
Singh, A.K., Rai, A., Banyal, R., Chauhan, P.S., Singh, N. 2018. Plant community regulates soil multi-functionality in a tropical dr y forest. Ecological Indicators, 95: 953-963.
Singh, A., Kumar, A., Datta, A. and Yadav, R. K. 2018. Evaluation of guava (Psidium guajava) and bael (Aegle marmelos) under shallow saline watertable c o n d i t i o n s . I n d i a n J o u r n a l Agricultural Science, 88: 720-725.
Singh, A., Sharma, P. C., Meena, M. D. and Sharma, D.K . 2018. I mpac t of different salt-stressed conditions on growth, mineral nutrit ion and fruiting of bael (Aegle marmelos) cultivars. Journal of Soil Salinity and Water Quality, 10: 80-86.
Singh, A., Singh, R. K., Kumar, N., Kumar, S., Upadhyay, A., Goswami, A., and Sharma, P. C. 2018. Genetic erosion of crop landraces : t rends in the conservation of locally adapted 'Newar' radish in Jaunpur district, Uttar Pradesh, India. Indian Journal Trading Knowledge, 17: 344-352.
Singh, A., Singh, A. P. and Purakayastha, T. J. 2018. Characterization of biochar and their in�uence on microbial activities and potassium availability
in an acid soil. Archives of Agronomy a n d S o i l S c i e n c e , D O I : 10.1080/03650340.2018.1563291.
Singh, D., Singh, C.K., Singh, Y.P., Singh, V., Singh, R., Tomar, R.S.S. and Sanwal, S.K. 2018. Evaluation of cultivated and wild genotypes of Lens species under alkalinity stress and their m o l e c u l a r c o l l o c a t i o n u s i n g microsatellite markers. PLoS ONE. 1 3 : e 0 1 9 9 9 3 3 . h t t p s : / / d o i . org/10.1371/ journal.pone.0199933
Singh, J., Sharma, P.C., Satyavan, Singh, Y.P., Chauhan, S.K., Singh, V. and Neeraj. 2018. Noti�cation of crop varieties and registration of germplasm: Indian Mustard Variety CS 60. Indian Journal of Genetic, 78: 398-399.
Singh, J., Singh, V. and Sharma, P.C. 2018. Elucidating the role of osmotic, ionic and major salt responsive transcript co m p o n e nt s towa rd s s a l i n i t y tolerance in contrasting chickpea (Cicer arietinum L.) genotypes. Physiology and Molecular Biology of Plants. 24: 441–453.
Singh, J., Singh, V., Vineeth, T.V., Kumar, Parveen, Kumar, N. and Sharma, P.C. 2018. Differential response of Indian mustard (Brassica juncea L., Czern a n d C o s s ) u n d e r s a l i n i t y : photosynthetic traits and gene expression. Physiology and Molecular B i o l o g y o f P l a n t s https://doi.org/10.1007/s12298-018-0631-3.
Singh, R.B., Kaledhonkar, M.J., Chaudhari, S.K., Shishodia, P.K. and Meena, B.L. 2018. Effect of saline and alkaline water on mustard yield under sprinkler irrigation. Journal of Soil Salinity and Water Quality, 10:246-253.
Singh, R.K., Hussain, S.M., Riba,T., Singh, A., Padung, E., Rallen, O., Lego, Y.J. and Bhardwaj, A.K. 2018. Classi�cation and management of community forests in Indian Eastern Himalayas: implications on ecosystem services, conser vation and l ivel ihoods. Ecological Processes. 7: 27.
222
Publ
icat
ions
Ann
ual R
epor
t 201
8-19
Singh, R.r, Serawat, M., Singh, A. and Babli. 2 0 1 8 . E ff e c t o f c r o p r e s i d u e management and tillage on soil physical properties. Journal of Soil Salinity and water Quality, 10: 200-206.
Singh, S., Bawa, S.S., Singh, S., Sharma, S.C., Sheoran, P., Sardana, V. and Salaria, A. 2019. Long-term tillage and nitrogen m a n a g e m e n t f o r i m p r o v i n g productivity and pro�tability of a rainfed maize-wheat system in north we s te r n H i m a l aya . J o u r n a l o f Environmental Biology, 40: 36-44.
Singh, U.B. , Singh, S. , Malviya, D. , K a r t h i k e y a n , N . , I m r a n , M . , Chaurasia, R., Alam, M., Singh, P., Sharma, B. K., Rai, J. P., Damodaran, T., Tripathi, J. K., Kumar, S., and Sharma, A.K. 2019. Integration of anti-penetrant tricyclazole, signaling molecule salicylic acid and root associated Pseudomonas �uorescens enhances suppression of Bipolaris sorokiniana in bread wheat (Triticum aestivum L . ) . J ournal of Plant P a t h o l o g y . h t t p s : / / d o i . o r g /10.1007/s42161-019-00296-5
Singh, V., Singh, A.P., Bhadoria, J., Giri, J., Singh, J., Vineeth, T.V. and Sharma, P.C. 2018. Differential expression of salt-responsive genes to salinity stress in salt-tolerant and salt-
sensitive rice (Oryza sativa L.) at seedling stage. Protoplasma. 255: 1667–1681.
Singh, Y. P., Mishra,V.K., Dixit, H., Gupta, R . K . 2 0 1 9 . J a t r o p h a b a s e d intercropping system: an alternate land use for rehabi l i tat ion of degraded sodic lands. Indian Journal of Agricultural Science, 89: 9-15.
Singh, Y. P., Arora, S., Mishra, V.K., Dixit, H., Gupta, R.K. 2018. Effect of organic and inorganic amendments on amelioration of sodic soil and rice-wheat productivity. Indian Journal of Agricultural Science, 88: 1455-62.
Singh, Y.,P., Singh, Gurbachan, Mishra, V.K. and Arora, S. 2018. Evaluating multipurpose tree species for b i o m a s s p r o d u c t i o n a n d amelioration potential of sodic soil. Journal of the Indian Society of Soil Science, 66: 399-405.
Singh,Y. P., Arora, S., Mishra, V.K., Dixit, H., Gupta, R.K. 2018. Conjoint use of c h e m i c a l a m e n d m e n t s a n d municipal solid waste compost for amelioration of degraded sodic soil. Journal of the Indian Society of Soil Science, 66: 392-398.
Sundha, P., Basak, N., Rai, A.K., Yadav, R.K. and Sharma, D.K. 2018. Utilization of
municipal solid waste compost in reclamation of saline-sodic soil irrigated with poor quality water. Journal of the Indian Society of Soil Science, 66: 28-39.
Thimmappa, K. and Raju, R. 2018. Analysis of zero tillage method of wheat c u l t i v a t i o n i n H a r y a n a : A discriminant function approach. Journal of Soil Salinity and Water Quality, 10: 126-131.
Verma, A. K., Sindhu, S. S., Singh, A., Kumar, A., Singh, A. and Chauhan, V. B. S. 2019. Condit ioning effec ts of biodegradable superabsorbent polymer and vermiproducts on media properties and growth of gerbera. Ecological Engineering, 132: 23-30.
Yadav, A.S. and Arora, S. 2018. Crop residue management in diverse agro -ecosystems for improving soil health – An overview. Journal of Soil and Water Conservation, 17: 387-392.
Yadav, G. and Ellis R. H. 2018. Longevity of 285 seed lots of wheat in hermetic storage compared with independent estimates from the seed viability e q u a t i o n . S e e d S c i e n c e a n d Technology. 46:341-347
223
Conference/ Seminar/ Symposia/Workshop papers
A l a g e s a n , A . , B a s k a r , M . , B a l a s u b r a m a n i a m , P. , a n d Kaledhonkar, M J. 2019. Rice Based Integrated Farming System Suitable for Irrigated Sodic Soil Areas of Tamil Nadu. In: Abstracts GJISC on Resilient Agriculture in Saline Environments under Changing Climate: Challenges and Opportunities, held at ICAR-CSSRI, Karnal, during 7-9 February, 2019, pp. 164.
Balasuramaniam, P., Baskar, M., Alagesan, A. and Kaledhonkar, M.J. 2019. Conjunctive use of canal and alkali water in rice-vegetable cropping system. In: Abstracts GJISC on Resilient Agriculture in Saline Environments under Changing Climate: Challenges and Opportunities, held at ICAR-CSSRI, Karnal, during 7-9 February, 2019, pp. 90.
Bali, A., Singh, A., Minhas, P.S. and Yadav, R.K. 2019. Response of paddy (Oryza sativa ) to bioregulators under i r r igat ion water with res idual alkalinity. In: Abstracts GJISC on R e s i l i e n t A g r i c u l t u r e i n S a l i n e E n v i r o n m e n t s u n d e r C h a n g i n g C l i m a t e : C h a l l e n g e s a n d Opportunities, held at ICAR-CSSRI, Karnal, during 7-9 February, 2019, pp. 94.
Bhardwaj, A.K., Rajwar, D., Narjary, B., Chandra, P., Chaudhari, S.K., Yadav, R.K. and Sharma, P.C. 2019. Nitrogen use efficiency in rice-wheat systems and its relations to fertilizer sources, C and N mineralization rates, and water regime. In: XIV Agricultural Science Congress,held at New Delhi during 20-23, February,2019. pp. 218-219.
Bhardwaj, A.K., Rajwar, D., Thakur, R., Basak, N., Narjary, B., Chandra, P., Chaudhar i , S .K . , Sharma, D.K . , S h a r m a , P. C . 2 0 1 9 . A c r i t i c a l assessment of nutrient management
strategies for rice-wheat cropping systems in partially reclaimed sodic soils. In: Abstracts GJISC on Resilient Agriculture in Saline Environments under Changing Climate: Challenges and Opportunities, held at ICAR-CSSRI, Karnal, during 7-9 February, 2019,pp.49.
Bhardwaj, A.K., Rajwar, D., Ahamad, S., Kaphaliya, B., Banyal, R., Singh, R., Chaudhari, S.K. 2019. Carbon accrual trend and its relat ion to crop productivity in major integrated management systems for rice-wheat cropping in marginally reclaimed sodic soils. In: Abstracts GJISC on R e s i l i e n t A g r i c u l t u r e i n S a l i n e E n v i r o n m e n t s u n d e r C h a n g i n g C l i m a t e : C h a l l e n g e s a n d Opportunities, held at ICAR-CSSRI, K a r n a l , d u r i n g 7 - 9 Fe b r u a r y, 2019,pp.196.
Barman, A. 2019. Rapid characterization of sodium salts dominated soil via Visible-Near Infrared re�ectance s p e c t r o s c o p y : A l a b o r a t o r y
thexperiment. In: Proceedings of 106 Indian Science Congress, held at LPU, Jalandhar, during 3–7 January, 2019, pp.4.
Barman, A., Pandey, R.N., Singh, B. and Chandra, S. 2019. Screening of Wheat ( Tr i t i c u m S p p . ) G e n o t y p e s fo r Manganese Efficiency Based on Graphical and De�ciency Tolerance Index. In: Abstracts GJISC on Resilient Agriculture in Saline Environments under Changing Climate: Challenges and Opportunities, held at ICAR-CSSRI, Karnal, during 7-9 February, 2019, pp.116.
Barman, A., Sheoran, P., Yadav, R.K., Singh R.K., and Chahal, V.P. 2019. Spatial variability assessment of salt affected soils in Ghaghar Plain of Haryana. . In: Abstracts GJISC on Resilient Agriculture
i n S a l i n e E n v i r o n m e n t s u n d e r Changing Climate: Challenges and Opportunities, held at ICAR-CSSRI, Karnal, during 7-9 February, 2019, pp. 25-26.
Barman, A., Srivastava, R., Mandal, A.K. and Yadav, R.K. 2019. Hyperspectral Characterization of salt-affected Soil: PCR vs. PLSR technique. In: Abstracts GJISC on Resilient Agriculture in Saline E n v i r o n m e n t s u n d e r C h a n g i n g Climate: Challenges and Opportunities organized by ISSSWQ, held at ICAR-CSSRI, Karnal, Haryana, India, during 7-9 February, 2019, pp. 3-4.
Basak, N., Gupta, P.S., Rai, A.K., Sundha, P., Narjary, B., Gajender, Kumar, S., Yadav, R.K. and Kumar, P. 2019. Changes in soil microbial biomass C, N and soil chemical properties in sorghum-wheat rotation in Northwest India as affected by tillage, mulch and de�cit saline irrigation. In: Abstracts GJISC on Resilient Agriculture in Saline E n v i r o n m e n t s u n d e r C h a n g i n g C l i m a t e : C h a l l e n g e s a n d Opportunities, held at ICAR-CSSRI, K a r n a l , d u r i n g 7 - 9 Fe b r u a r y, 2019,,pp. 47
Basak, N., Rai, A.K., Meena, R.L., Sundha, P., Yadav, R.K., Sharma, P.C., Dambiwal, D., Patel, S., Goswami, A., Jha, S.K., Khandkar, U.R., Jasra, R.V., Kalpana, G., Kumar, P., Sidhpuria, K., Rawalekar, S., Kumpatla, J. and Katti, H. 2019. Characterization of sodic soils in soil pro�le of Deccan Plateau, India. In: Abstracts GJISC on Resilient Agriculture i n S a l i n e E n v i r o n m e n t s u n d e r Changing Climate: Challenges and Opportunities organized by ISSSWQ, held at ICAR-CSSRI, Karnal, Haryana, India, during 7-9 February, 2019, pp. 6
Bundela, D.S., Kaledhonkar, M.J. and Sharma, P.C. 2019. Sub surface drainage technology and policy
224
Conf
eren
ce/ S
emin
ar/ S
ympo
sia/
Wor
ksho
p pa
pers
Ann
ual R
epor
t 201
8-19
initiatives for large scale reclamation of waterlogged saline lands in India. In: Abstracts GJISC on Resi l ient Agriculture in Saline Environments under Changing Climate: Challenges and Opportunities, held at ICAR-CSSRI, Karnal, during 7-9 February, 2019, pp. 219.
Burman, D., Mandal, U.K., Sarangi, S.K., Mandal, S., Mahanta, K.K., Raut, S., Maji, B., Lama, T.D. and Pal, D. 2018. Land Shaping: Technique for improving soi l and water q u a l i t y a n d p r o d u c t i v i t y o f degraded land in coastal region.
t hIn: Abstracts of 12 National Symposium of Indian Society of Coastal Agricultural Research on C o a s t a l A g r i c u l t u r e : B o o s t i n g P r o d u c t i o n P o t e n t i a l u n d e r Stressed Environment held at Dr. B S K K V, D a p o l i , M a h a r a s h t r a , during 28 September – 1 October, 2018. pp. 6-7.
Burman, D., Mondal M.K., Khan, Z.H., Sutradhar, A.K., Kamal, F.A., Mandal, U.K., Lama, T.D., Mandal, S., Sarangi, S.K., Mahanta, K.K. and Sharma, P.C. 2019. Soil and water resources of sundarbans in India and Bangladesh and its management for higher agricultural productivity. . In: Abstracts GJISC on Resilient Agriculture in Saline Environments under Changing Climate: Challenges and Opportunities, held at ICAR-CSSRI, Karnal, during 7-9 February, 2019, pp.51.
Camus, D. David, Chinchmalatpure, Anil R., Kumar, Shrvan, Shukla, Monika, Prasad, Indiver, Vibhute, Sagar, and G o r a i n , B i s w e s w a r . 2 0 1 9 . Management practices for guava production in saline Vertisols. . In: Abstracts GJISC on Resilient Agriculture in Saline Environments under Changing Climate: Challenges and Opportunities, held at ICAR-CSSRI, Karnal, during 7-9 February, 2019, pp. 168.
Chinchmalatpure, A. R., K. Thimappa, Mandal, A. K., Chaudhari, S.K. and Sharma, D. K. 2018. Impact of soil s a l i n i t y o n c r o p p r o d u c t i o n production and monetary lossess in
rdGujarat. In: 83 Annual Convention on
"Developments in Soil Science - 2018" of ISSS, held at New Delhi, during 27-30, November, 2018.
Chinchmalatpure, A. R., Prasad, Indivar, Kumar, Shrvan, Vibhute, Sagar, Camus, David D. and Sharma, P.C. 2019. Use of treated industrial effluent on growth and yield of maize crop in Vertisols. . In: Abstracts GJISC on R e s i l i e n t A g r i c u l t u r e i n S a l i n e Environments under Changing Climate: Challenges and Opportunities, held at ICAR-CSSRI, Karnal, during 7-9 February, 2019, pp. 95.
Chauhan, S.K., Kaledhonkar, M.J., Meena, R.L. 2019. Performance of Mustard Genotype in Saline Water Irrigation Condition in Western Part of Uttar Pradesh. In: Abstracts GJISC on R e s i l i e n t A g r i c u l t u r e i n S a l i n e E n v i r o n m e n t s u n d e r C h a n g i n g C l i m a t e : C h a l l e n g e s a n d Opportunities, held at ICAR-CSSRI, Karnal, during 7-9 February, 2019, pp.123.
Choudhary, M., Jat, H.S., Datta, A., Jat, M.L. and Sharma, P.C. 2019. In�uence of climate smart agriculture (CSA) practices on soil biological activities in wheat crop under rice-wheat system In: Abstracts GJISC on Resilient Agriculture in Saline Environments under Changing Climate: Challenges and Opportunities, held at ICAR-CSSRI, Karnal, during 7-9 February, 2019, pp.192.
Dar, Jaffer Yousuf, Saraswathy, R., Antony, Jose., Bundela, D.S. , Kumar, P. , Sharma, P.C. 2019 Effect on growth performance of the Paci�c white shr imp (Pe n a e u s va n n a m e i ) in different saline waters. In: Abstracts GJISC on Resilient Agriculture in Saline Environments under Changing Climate: Challenges and Opportunities, held at ICAR-CSSRI, Karnal, during 7-9 February, 2019,pp. 172.
Darshan, H., Lodaya, Chinchmalatpure, A.R. and Basak, B.B. 2019. Growth, yield and bioactive principle of senna (Cassia angustifolia Vahl.) under salinity stress. In: Abstracts GJISC on R e s i l i e n t A g r i c u l t u r e i n S a l i n e E n v i r o n m e n t s u n d e r C h a n g i n g
C l i m a t e : C h a l l e n g e s a n d Opportunities, held at ICAR-CSSRI, Karnal, during 7-9 February, 2019, pp.159.
Das, J., Raju, R. and Horo, Aniketa. 2019. A study on Consumer Preference for Fermented Probiotic Dairy Products i n M e t r o p o l i t a n D e l h i . I n : International Seminar on Sustainable D e v e l o p m e n t i n I n d i a : I s s u e s , Opportunities and Challenges held at Shri Mata Vaishno Devi University,
thKatra, (Jammu & Kashmir) on 9 March, 2019. pp. 19.
Datta, A., Basak, N., Chinchmalatpure, A.R. and Banyal, R . 2019 Land Use In�uences Physico-Chemical and Biological Properties of Saline-Sodic Soil of Northwest India. . In: Abstracts GJISC on Resilient Agriculture in Saline E n v i r o n m e n t s u n d e r C h a n g i n g C l i m a t e : C h a l l e n g e s a n d Opportunities, held at ICAR-CSSRI, Karnal, during 7-9 February, 2019, pp. 176.
David Camus, D., Chinchmalatpure, A.R., Kumar, S., Shukla, M., Prasad, I., Vibhute, S. and Gorain, B. 2019. Management practices for guava production in saline Vertisols. . In: Abstracts GJISC on Resilient Agriculture i n S a l i n e E n v i r o n m e n t s u n d e r Changing Climate: Challenges and Opportunities, held at ICAR-CSSRI, Karnal, during 7-9 February, 2019, pp. 168.
Fagodiya, R.K., Bundela, D.S., Kaledhonkar, M.J., Meena, B.L., Meena, R.L. and Sharma, P.C. 2019. Crop production function, salt accumulation and leaching requirement for cauli�ower under surface and drip irrigation. In: Abstracts GJISC on Resilient Agriculture i n S a l i n e E n v i r o n m e n t s u n d e r Changing Climate: Challenges and Opportunities organized by ISSSWQ, held at ICAR-CSSRI, Karnal, Haryana, India, during 7-9 February, 2019. pp.74.
Fagodiya, R.K., Pathak, H., Bhatia, A. Jain, N. 2019. Nitrous Oxide Emission factors Est imat ion f rom M aize -Wheat Cropping System under Alternative Nitrogen Management. In: Abstracts
225
GJISC on Resilient Agriculture in Saline E n v i r o n m e n t s u n d e r C h a n g i n g C l i m a t e : C h a l l e n g e s a n d Opportunities, held at ICAR-CSSRI, Karnal, during 7-9 February, 2019, pp.210.
Gorain, B., Mandal, B. and Mandal, U.K. 2 0 1 8 . S o i l p h y s i c o c h e m i c a l properties, primary nutrients content and microbial activity in coastal saline soils of West Bengal: effect of
thland use systems. In: 12 National Symposium of Indian Society of Coastal Agricultural Research (ISCAR) from 28 September to 01 October, 2018.
Gorain, B., Mandal, B. and Mandal, U.K. 2019. Lability of organic carbon in coastal saline soils of West Bengal under different land use systems. . In: Abstracts GJISC on Resi l ient Agriculture in Saline Environments under Changing Climate: Challenges and Opportunities, held at ICAR-CSSRI, Karnal, during 7-9 February, 2019,pp.167.
Gupta, P.S., Rai, A.K., Kumar, P., Basak, N., Sundha, P., Yadav, R.K., Kumar, R. and Kushwaha, M. 2019. Yield and fodder quality of sorghum and wheat in�uenced by different tillage, mulch and de�cit saline irrigation in saline soil of Northwest India. . In: Abstracts GJISC on Resilient Agriculture in Saline Environments under Changing Climate: Challenges and Opportunities, held at ICAR-CSSRI, Karnal, during 7-9 February, 2019, pp. 56
Jat, H.S., Sharma, P.C., and Jat, M.L. 2019. Layering sub-surface drip fertigation with conservation agriculture in maize and rice systems in North-West India: A game changer for enhancing crop productivity with dramatically
thless water use. In: 13 Asian Maize Conference and Expert Consultation on “Maize for Food, Feed, Nutrition and Environmental Security' ' held at Ludhiana during 8‐10, October 2018.pp. 16.
Jat, H.S., Sharma, P.C., Rolaniya, L.K., Sidhu, H.S. and Jat, M.L. 2019. Newer a p p r o a c h e s f o r s u s t a i n a b l e
production intensi�cation in cereal based systems of North-West India. In: Abstracts GJISC on Resi l ient Agriculture in Saline Environments under Changing Climate: Challenges and Opportunities, held at ICAR-CSSRI, Karnal, during 7-9 February, 2019,pp.65.
Jat, M.L., Jat, H.S., Sidhu, H.S., Gupta, N., Sharma, P.C., Rolaniya, L.K., Jat, R.K., Choudhary, K.M., Bijarniya, D., Saini, K.S., Kakraliya, S.K. and Singh, Y. 2018. N e w H o r i z o n s o f S u s t a i n a b l e Intensi�cation in Maize Systems in
thSouth Asia. In: 13 Asian Maize Conference and Expert Consultation on Maize for Food, Feed, Nutrition and Environmental Security. held at Ludhiana, India during 8–10 October, 2018. pp. 38-46.
K., Kumara, T.M., Kandpal, A., and Pal, S.. 2019. Meta-analysis of bene�ts of conser vat ion agr iculture over conventional system in South Asia. In: Abstracts GJISC on Resilient Agriculture i n S a l i n e E n v i r o n m e n t s u n d e r Changing Climate: Challenges and Opportunities, held at ICAR-CSSRI, Karnal, during 7-9 February, 2019, pp. 222.
Kad, S. V., Vibhute, S., Singh, R.K., Raju, R., Chinchmalatpure, A.R. and Bundela, D.S. 2019. Subsurface drainage technology for reclamation of water logged saline soils in Maharashtra: An impact on farmers. In: Abstracts GJISC on Resilient Agriculture in Saline Environments under Changing Climate: Challenges and Opportunities, held at ICAR-CSSRI, Karnal, during 7-9 February, 2019, pp. 218.
Kaledhonkar, M.J. 2019. Role of micro irrigation in management of poor quality waters and salt affected soils. In: Abstracts GJISC on Resi l ient Agriculture in Saline Environments under Changing Climate: Challenges and Opportunities, held at ICAR-CSSRI, Karnal, during 7-9 February, 2019, pp. 75.
Karegoudar, A.V., Viswanath J, Rajkumar, R.H., Anand, S.R. and Kaledhonkar, M.J. 2019. Effects of controlled
drainage on non point source discharge from paddy �eld in TBP command area of Karnataka. In: Abstracts GJISC on Resilient Agriculture i n S a l i n e E n v i r o n m e n t s u n d e r Changing Climate: Challenges and Opportunities, held at ICAR-CSSRI, Karnal, during 7-9 February, 2019, pp.61.
Karegoudar, A.V., Viswanath J, Rajkumar, R.H., Anand, S.R. and Kaledhonkar, M.J. 2019. Performance evaluation of conventional and controlled sub surface drainage system in saline ver tisols of TBP Command. In: A b s t r a c t s G J I S C o n R e s i l i e n t Agriculture in Saline Environments under Changing Climate: Challenges and Opportunities, held at ICAR-CSSRI, Karnal, during 7-9 February, 2019, pp. 62.
Kaur, G., Mann, A., Singh, J., Sanwal, S.K. and Sharma, P.C. 2019. Evaluation of c h i c k p e a ( C i c e r a r i e t i n u m L . ) progenies for salt tolerance. In: Abstracts GJISC on Resilient Agriculture i n S a l i n e E n v i r o n m e n t s u n d e r Changing Climate: Challenges and Opportunities, held at ICAR-CSSRI, Karnal, during 7-9 February, 2019, pp.139
Kumar, A., Lata, C., Mann, A., Kumar, A., and Meena, B.L. 2019. Mineral nutrient analysis of three Halophytic Grasses under sodic and saline stresses. In: Abstracts GJISC on Resilient Agriculture i n S a l i n e E n v i r o n m e n t s u n d e r Changing Climate: Challenges and Opportunities, held at ICAR-CSSRI, Karnal, during 7-9 February, 2019, pp.130.
Kumar, A., Mann, A., Lata, C., Kumar, A. and Meena, B.L. 2019. Halophytes: miracle plants/potential resource for salt tolerance. In: International Symposium on “Innopreneurship: A need of Sustainable Agriculture” held at CCSHAU, H isar, dur ing 2-3 , February 2019, pp.137.
Kumar, A., Sharma, P. C., Kulshreshtha, N., Singh, Y. P. and Prasad, Indiver. 2019. Spatial statistical analysis to improve �eld trial result of bread wheat
226
Conf
eren
ce/ S
emin
ar/ S
ympo
sia/
Wor
ksho
p pa
pers
Ann
ual R
epor
t 201
8-19
g e n o t y p e s u n d e r a l k a l i n e environment. . In: Abstracts GJISC on R e s i l i e n t A g r i c u l t u r e i n S a l i n e E n v i r o n m e n t s u n d e r C h a n g i n g C l i m a t e : C h a l l e n g e s a n d Opportunities, held at ICAR-CSSRI, K a r n a l , d u r i n g 7 - 9 Fe b r u a r y, 2019,pp.145.
Kumar, A., Sharma, P.C., Singh, R., Kumar, G., Kumari, J. and Kulshreshtha N. 2019. Bread wheat germplasm screening for alkalinity tolerance
t hu n d e r � e l d c o n d i t i o n . I n : 4 International Group Meeting on “Wheat productivity enhancement through climate smart practices” held at Palampur, HP, during 14-16, February, 2019, pp.98.
Kumar, A.l., Prajapat, K. Vijayan, B. and Kumar, P. 2019. Good agricultural practices for management of salt affected soils. In: Abstracts GJISC on R e s i l i e n t A g r i c u l t u r e i n S a l i n e Environments under Changing Climate: Challenges and Opportunities, held at ICAR-CSSRI, Karnal, during 7-9 February, 2019, pp. 235.
Kumar, N., Mann, A. Lata, C., Kumar, A., Kumar, Arvind and Meena, B.L. 2019. SSR Marker analysis in Halophyte Grass (Dichanthiumannulatum) by using next generation sequencing. In: Abstracts GJISC on Resi l ient Agriculture in Saline Environments under Changing Climate: Challenges and Opportunities, held at ICAR-CSSRI, Karnal, during 7-9 February, 2019, pp.138.
Kumar, P. , Chahal, Shiwani, Roohi, Manisha, Mann, A., Banyal, R., Raju, R., Narjary, B., and Sharma, P.C. 2019. R o l e o f i n t e l l e c t u a l p ro p e r t y management in commercialization o f t e c h n o l o g i e s t o m e e t t h e challenges in salt affected soils. In: Abstracts GJISC on Resilient Agriculture i n S a l i n e E n v i r o n m e n t s u n d e r Changing Climate: Challenges and Opportunities, held at ICAR-CSSRI, Karnal, during 7-9 February, 2019, pp. 233-234.
Kumar, P., Sharma, P.C., Chaudhari, S.K. and Sharma, D.K. 2018. Optimizing irrigation and planting schedules of
salt tolerant rice and wheat for higher yield and water productivity in partially reclaimed sodic soils of northwestern plains. In: Souvenir of XXI Biennial National Symposium of Indian Society of Agronomy held at MPUAT, Udaipur, Rajasthan during 24–26 October, 2018.pp. 227-228.
Kumar, P., Sharma, P.C., Chaudhari, S.K., and Sharma, D.K. 2019. Scheduling of Irrigation and Planting Date of Salt Tolerant Basmati Rice and Wheat for Higher Productivity and Pro�tability in Partially Reclaimed Sodic Soils. In: A b s t r a c t s G J I S C o n R e s i l i e n t Agriculture in Saline Environments under Changing Climate: Challenges and Opportunities, held at ICAR-CSSRI, Karnal, during 7-9 February, 2019. pp. 189.
Kumar, S., Das, A. and Chinchmalatpure, A . R . 2 0 1 8 . P h o s p h a t a s e a n d dehydrogenase enzyme activities under irrigated and rainfed �elds of cotton on saline Vertisols of Bara tract
rdof Bharuch district (Gujarat). In: 83 Annual Convention on "Developments in Soil Science - 2018" of Indian Society of Soil Science held at AAU, Anand, G u j a r a t , I n d i a , d u r i n g 2 7 - 3 0 November, 2018.
Kumar, S., Das, A., Chinchmalatpure, A.R., David Camus, D, Vibhute, Sagar and Gorain, Bisweswar. 2019. Assessment o f w a t e r - s t a b l e a g g r e g a t e s distribution in irrigated and rainfed soils of saline Vertisols of Bara Tract in
thGujarat. In: Abstract 12 National Symposium on Coastal agriculture: Boosting Production Potential under Stressed Environment held at Dr. B.S.
stKKV, Dapoli, during 28- October to 1 September, 2018. pp. 18.
Kumar, S., Raju, R., Sheoran, P., Singh, R.K., Yadav R.K., and Chahal, V.P. 2019. A localized drainage option to avoid c r o p s u b m e r g e n c e i n s o d i c environment under climate change scenario. In: Abstracts GJISC on R e s i l i e n t A g r i c u l t u r e i n S a l i n e Environments under Changing Climate: Challenges and Opportunities, held at ICAR-CSSRI, Karnal, during 7-9 February, 2019.pp. 191.
Kumawat, G., Singh, V., Shivakumar, M., Sanwal, S. K., Singh, Jogendra, Gupta, Sanjay, Satpute, G. K., and Bhatia, V.S. 2 0 1 9 . S N P h a p l o t y p e b a s e d s c r e e n i n g a n d p h e n o t y p i c characterization of salt tolerance in soybean germplasm accession. In: Abstracts GJISC on Resilient Agriculture i n S a l i n e E n v i r o n m e n t s u n d e r Changing Climate: Challenges and Opportunities, held at ICAR-CSSRI, K a r n a l , d u r i n g 7 - 9 Fe b r u a r y, 2019,pp.123.
Lama, T.D., Burman, D., Sarangi, S.K. Mahanta, K.K. and Maji, B. 2019. Effect of saline water irrigation on salt dynamics and productivity of maize (Zea mays) in a heavy textured coastal saline soil. In: Abstracts GJISC on R e s i l i e n t A g r i c u l t u r e i n S a l i n e E n v i r o n m e n t s u n d e r C h a n g i n g C l i m a t e : C h a l l e n g e s a n d Opportunities, held at ICAR-CSSRI, Karnal, during 7-9 February, 2019,
Lama, T.D., Burman, D., Sarangi, S.K. Mahanta, K.K. and Mandal, U.K. 2018. An assessment of water requirement of Rabi rice under projected climate change scenario in the Sundarbans,
t hWest Bengal. In: Abstrac ts 12 National Symposium of ISCAR on C o a s t a l a g r i c u l t u r e : B o o s t i n g Production Potential under Stressed Environment, held at Dr. BSKKV,
thDapoli, Maharashtra, during 28 stSeptember to 1 October 2018.
Lata, C., Kumar, A., Rani, S., Mann, A. 2019. Molecular expression analysis of NHX1 and SOS1 under salinity stress in Kallar Grass (Leptochloafusca). . In: Abstracts GJISC on Resilient Agriculture i n S a l i n e E n v i r o n m e n t s u n d e r Changing Climate: Challenges and Opportunities, held at ICAR-CSSRI, Karnal, during 7-9 February, 2019, pp.137.
Lodaya, D., H., Chinchmalatpure, A. R., and Basak, B.B. 2019. Growth, Yield and Bioactive Principle of Senna (Cassia angustifolia Vahl.) under Salinity Stress. In: Abstracts GJISC on Resilient Agriculture in Saline Environments under Changing Climate: Challenges and Opportunities, held at ICAR-
227
CSSRI, Karnal, during 7-9 February, 2019, pp. 159.
Mahanta, K.K. 2019. Comparison of an e l e c t r i c d o u b l e l a y e r b a s e d reclamation model for salt affected soils with Van der Molen's Model. In: Abstracts GJISC on Resilient Agriculture i n S a l i n e E n v i r o n m e n t s u n d e r Changing Climate: Challenges and Opportunities, held at ICAR-CSSRI, Karnal, during 7-9 February, 2019, pp.20.
Mahanta, K.K., Burman, D., Sarangi, S.K., Mandal, U. K. and Maji, B. 2018. Performance evaluation of rabi crops under solar drip Irrigation system in coastal salt affected soils of West Bengal. In: Abstract, International Conference on Livelihood Promotion, Bio-diversity Conservation and Social Security in Indian Sundarbans, held at Jharkhali during 7-9 December, 2018. pp. 23-24.
Mahanta, K.K., Burman, D., Sarangi, S.K., Mandal, U. K. and Maji, B. 2018. Performance of Drip Irrigated Okra under Stressed Environment of
thCoastal West Bengal, In: Abstracts 12 National Symposium of ISCAR on C o a s t a l a g r i c u l t u r e : B o o s t i n g Production Potential under Stressed Environment, held at Dr. BSKKV,
thDapoli, Maharashtra, during 28 s tSeptember to 1 October 2018.
pp.31.
Mandal, A.K., Joshi, P.K., Singh, R., Sharma, D . K . 2 0 1 8 . M a p p i n g a n d characterization of salt affected soils in Ambala district of central Haryana using remote sensing. In: National Seminar on “Developments in Soil Science 2018”Annual Convention of the Indian Society of Soil Science, held at AAU Anand, Gujarat during 27-30 Nov. 2018, pp. 307.
Mandal, A.K., Sethi, M., Chinchmalatpure, Anil, Yadav, R.K. and Sharma, P.C. 2019. Mapping and Characterization of Salt Affected Soils Data in Haryana for Reclamation and Management. In: Abstracts GJISC on Resi l ient Agriculture in Saline Environments under Changing Climate: Challenges
and Opportunities, held at ICAR-CSSRI, Karnal, during 7-9 February, 2019, pp. 27.
Mandal, S., Mandal, U.K., Lama, T.D., Burman, D., and Sharma, P.C. 2018. Farm-level agricultural risks under coastal region of west bengal – a
t hsocio-economic analysis. In: 12 National Symposium of ISCAR on C o a s t a l A g r i c u l t u r e : B o o s t i n g Production Potential under Stressed Environment, held at Dr. BSKKV,
thDapoli, Maharashtra, during 28 stSeptember to 1 October 2018.pp.
99.
Mandal, U.K., Nayak, D.B., Samui, A., Mullick, S., Mahanta, K.K., Raut, S., and Bhardwaj, A.K. 2019. Climate change mitigation and adaptation strategies for Indian Sundarbans. In: Abstracts GJISC on Resilient Agriculture in Saline E n v i r o n m e n t s u n d e r C h a n g i n g C l i m a t e : C h a l l e n g e s a n d Opportunities, held at ICAR-CSSRI, K a r n a l , d u r i n g 7 - 9 Fe b r u a r y, 2019.pp.207.
Mandal, U.K., Samui, A., Mullick, S., Nayak, D.B., Burman, D., Sarangi, S.K ., Lama,T.D., Maji, B. and Bhardwaj, A.K. 2018. GHGs emissions, carbon footprints and energy budget on conservation tillage practices under rice based cropping system in coastal
t hs a l i n e s o i l s . I n : 1 2 N a t i o n a l Symposium of ISCAR on Coastal Agriculture: Boosting Production Potential under Stressed Environment, h e l d a t D r . B S K K V , D a p o l i ,
thMaharashtra, during 28 September stto 1 October 2018.pp……
Mann, A., Kumar, A., Kumar, Arvind, Meena, B. L., Kumar, Naresh and Lata Charu. 2018. Differentially expressed genes in Dichanthium annulatum
thunder salt stress. In: 4 International Plant Physiology Congress held at NBRI, Lucknow during 2-5 December 2018, pp. 216.
Mann, A., Kumar, Ashwani, Kumar, Arvind, Meena, B. L., Kumar, Naresh and Lata, Charu. 2019. Differentially expressed genes in Urochondra setulosa under
thsalt stress. In: 12 National Symposium
of ISCAR on Coastal Agriculture: Boosting Production Potential under Stressed Environment, held at Dr. BSKKV, Dapoli, Maharashtra, during
t h s t28 September to 1 October 2018.pp. 137
Meena, B.L., Meena, R.L., Kaledhonkar, M.J., Kumar, P. and Kumar, A. 2019. Effect of zinc and iron fertilization on mustard yield under salt affected soil.
thIn: 12 National Symposium of ISCAR on Coastal Agriculture: Boosting Production Potential under Stressed Environment, held at Dr. BSKKV,
thDapoli, Maharashtra, during 28 stSeptember to 1 October 2018.pp.66.
Meena, B.L., Meena, R.L., Kumar, P., Kumar, A. and Kaledhonkar, M.J. 2017. O p t i m i z i n g z i n c a n d i r o n requirement of pearl millet-mustard cropping system on a salt affected soil. In: Annual Convention of the Indian Society of Soil Science, held at AAU Anand, Gujarat during 27-30 Nov. 2018.pp.83.
Meena, R.L., Meena, B.L., Singh, A., Sanwal, S.K., Kaledhonkar, M.J. and Kumar, Ashwani. 2019. Response of tomato under saline water drip irrigation in naturally ventilated polyhouse Structures. In: Abstracts GJISC on R e s i l i e n t A g r i c u l t u r e i n S a l i n e E n v i r o n m e n t s u n d e r C h a n g i n g C l i m a t e : C h a l l e n g e s a n d Opportunities, held at ICAR-CSSRI, K a r n a l , d u r i n g 7 - 9 Fe b r u a r y, 2019.pp.78.
Mukhopadhyay, R., Manjaiah, K.M. and Datta, S.C. 2018. Modi�ed clays: A potential immobilizing agent of arsenic in soil and water. In: Annual Convention of the Clay Minerals society of India & National conference on “Advances in Clay science towards A g r i c u l t u r e , E n v i r o n m e n t a n d Industry” held at NBSS&LUP, Kolkata, during 14-15 September, 2018.
Mukopadhyay, R. and Adhikari, T. 2019. N a n o i ro n ox i d e : A p o t e n t i a l adsor bent for remediat ion of bicarbonate in aqueous system. In: Abstracts GJISC on Resilient Agriculture i n S a l i n e E n v i r o n m e n t s u n d e r
228
Conf
eren
ce/ S
emin
ar/ S
ympo
sia/
Wor
ksho
p pa
pers
Ann
ual R
epor
t 201
8-19
Changing Climate: Challenges and Opportunities, held at ICAR-CSSRI, K a r n a l , d u r i n g 7 - 9 Fe b r u a r y, 2019,pp. 46.
Narjary, B., Jangra, P., Pathan, A.L., Raju, R., Thimmappa, K., Meena, R.L., Kumar, P., Chinchmalatpure, A.R., Kumar, S., Bundela, D.S. and Kamra, S.K. 2019. Performance Evaluation of SSD Project (Siwanamal, Jind) Using E l e c t r o m a g n e t i c I n d u c t i o n Techniques. In: Abstracts GJISC on R e s i l i e n t A g r i c u l t u r e i n S a l i n e E n v i r o n m e n t s u n d e r C h a n g i n g Climate: Challenges and Opportunities, held at ICAR-CSSRI, Karnal, during 7-9 February, 2019, pp. 16.
Palkar, J.J., Dodake, S.B., Patil, K.D., Khobragade, S.S., Vanave, P.B. and Kaledhonkar, M.J. 2019. Assessment of groundwater quality of irrigation water in coastal districts of Konkan Region of Maharashtra. In: Abstracts GJISC on Resilient Agriculture in Saline Environments under Changing Climate: Challenges and Opportunities, held at ICAR-CSSRI, Karnal, during 7-9 February, 2019.pp. 22.
Palkar, J.J., Dodake, S.B., Patil, K.D., Parte, P. R., Khobragade,S.S., Vanave, P.B. and Kaledhonkar, M.J. 2019. Integrated farming system in coastal saline soils of Konkan region for sustainable income generation. In: Abstracts GJISC on Resilient Agriculture in Saline Environments under Changing Climate: Challenges and Opportunities, held at ICAR-CSSRI, Karnal, during 7-9 February, 2019, pp. 221.
Ponnusamy, K., Singh, S., Chakravarty, R., and Sheoran, P. 2019. Building resilience of dairy farmers in saline environment under extreme climatic conditions. In: Abstracts GJISC on R e s i l i e n t A g r i c u l t u r e i n S a l i n e E n v i r o n m e n t s u n d e r C h a n g i n g C l i m a t e : C h a l l e n g e s a n d Opportunities, held at ICAR-CSSRI, Karnal, during 7-9 February, 2019, pp. 202-203.
Pooja, G.S., Rai, A.K., Basak, N., Kumar, P., Sundha, P., Narjary, B., Gajender, Kumar, S., Makrana, G., and Yadav, R.K.
2019. Impact of tillage, mulch and de�cit saline irrigation on improving soil quality under sorghum-wheat rotation in Northwest India. In: XIV A g r i c u l t u ra l S c i e n c e C o n g r e s s - I n n o v a t i o n s f o r A g r i c u l t u r a l Transformation, held at NASC, New Delhi during 20-23 Feb., 2019, pp.194-195.
Prajapat, K., Sanwal, S.K. and Sharma, P.C. 2018. Prospects of Quinoa for assured production and enhancing income under saline soils of India. In : Extended summaries of XXI Biennial National Symposium of Indian Society of Agronomy, held at MPUAT, Udaipur, Rajasthan during 24–26 October, 2018. pp. 303-304.
Prajapat, K., Sanwal, S.K. and Sharma, P.C. 2 0 1 9 . E v a l u a t i o n o f Q u i n o a G e r m p l a s m u n d e r S a l i n e Environment. In: Abstracts GJISC on R e s i l i e n t A g r i c u l t u r e i n S a l i n e E n v i r o n m e n t s u n d e r C h a n g i n g C l i m a t e : C h a l l e n g e s a n d Opportunities, held at ICAR-CSSRI, Karnal, during 7-9 February, 2019. pp.116.
Rai, A.K., Basak, N., Kaur, H., Sundha, P., Meena, R.L., Yadav, R.K., Sharma, P.C., Jha, S.K., Khandkar, U.R., Patel, S., Jasra, R.V., Chudasama, C., Kumar, P., Kalpesh, S., Rawalekar, S., Kumpatla, J. and Katti, H. 2019. Isolation of S-oxidisers from native soils and S-rich hotspots in different agroecology. In: Abstracts GJISC on Resilient Agriculture i n S a l i n e E n v i r o n m e n t s u n d e r Changing Climate: Challenges and Opportunities, held at ICAR-CSSRI, K a r n a l , d u r i n g 7 - 9 Fe b r u a r y, 2019.pp.46
Rai, A.K., Basak, N., Sundha, P., Meena, R.L., Yadav, R.K. , Sharma, P.C., Patel, S., Dambiwal, D., Goswami, A., Jha, S.K., Khandkar, U.R., Jasra, R.V., Kalpana, G., Kumar, P., Kalpesh, S., Sachin, R., Kumpatla, J. and Katti, H. 2019. Characterization of sodic soils in soil pro�le of Indo-Gangatic Plain. Characterization of sodic soils in soil pro�le of Deccan Plateau, India. In: Abstracts GJISC on Resilient Agriculture i n S a l i n e E n v i r o n m e n t s u n d e r
Changing Climate: Challenges and Opportunities, held at ICAR-CSSRI, Karnal, during 7-9 February, 2019. pp. 7
Rai, A.K., Gupta, P.S., Basak, N., Sundha, P., Narjary, B., Gajender, Kumar, S, and Yadav, R.K. 2019. A seasonal variation in soil enzymes activities in sorghum-wheat rotation in Northwest India as affected by tillage, mulch and de�cit saline irrigation. In: Abstracts GJISC on R e s i l i e n t A g r i c u l t u r e i n S a l i n e Environments under Changing Climate: Challenges and Opportunities, held at ICAR-CSSRI, Karnal, during 7-9 February, 2019. pp. 48
Rajkumar, R.H., Vishwanath, J., Anand, S.R., Karegoudar, A.V., Dandekar, A.T. and Kaledhonkar, M.J. 2019. Effect of subsurface drip irrigation on soil physico-chemical properties and yield of sugarcane in saline Vertisols. In: Abstracts GJISC on Resi l ient Agriculture in Saline Environments under Changing Climate: Challenges and Oppor tunities organized by ISSSWQ, held at ICAR-CSSRI, Karnal, Haryana, India, during 7-9 February, 2019. pp.82.
Raju, R, Thimmappa, K. and Pathan, A.L. 2019. Economic Impact Analysis of Saline Soil Reclamation through Subsurface Drainage in Karnataka. In: Abstracts GJISC on Resilient Agriculture in Saline Environments under Changing Climate: Challenges and Opportunities, held at ICAR-CSSRI, Karnal, during 7-9 February, 2019. pp. 224.
Raju, R. and Kiran Kumar, T.M. 2019. Reclamation of salt affected soils for Sustainable Crop Production in India: An Economic Impact Analysis. In: Proceedings on International Seminar on Sustainable Rural Development in India: Issues, Oppor tunities and Challenges, held at SMVDU, Katra
th(Jammu) on 9 March 2019. pp. 3-13.
Raju, R., K. Kumara, T.M., Krishnamurthy, S.L., Sharma, P.C., Kumar, A., Kumar, P., Sheoran, P. and Singh, R.K. 2019. Economic bene�ts from adoption of salt tolerant rice variety Basmati CSR 30 in India. In: Abstracts GJISC on R e s i l i e n t A g r i c u l t u r e i n S a l i n e
229
E n v i r o n m e n t s u n d e r C h a n g i n g C l i m a t e : C h a l l e n g e s a n d Opportunities, held at ICAR-CSSRI, Karnal, during 7-9 February, 2019, pp. 226.
Raut, Shishir, Maji, B. and Lama T.D. 2018. Study of soi l physicochemical parameters and humic components in relation to salinity in different landforms in a coastal soil of West
thBengal” In: Abstract 12 National Symposium on “Coastal agriculture: Boosting Production Potential under Stressed Environment” held at Dr. B.S. KKV, Dapoli, during September 28-
stOctober 1 , 2018. pp………
Rajwar, D., Thakur, R., Bhardwaj, A.K. 2019. Micronutrient availability in soil and plant uptake in rice-wheat cropping systems under partially reclaimed sodic soils. In: Abstracts GJISC on R e s i l i e n t A g r i c u l t u r e i n S a l i n e E n v i r o n m e n t s u n d e r C h a n g i n g C l i m a t e : C h a l l e n g e s a n d Opportunities, held at ICAR-CSSRI, Karnal, during 7-9 February, 2019, pp.
Sambaiah, K., Anny, Mrudhula, Y., Sudha, Rani, P., Mohana, Rao, P., Prasauna, Rani, V., Sailaja. 2019. Study of soil physicochemical parameters and organic matter humic components in relation to salinity in different landforms under different cropping sequence in coastal West Bengal. In: Abstracts GJISC on Resilient Agriculture i n S a l i n e E n v i r o n m e n t s u n d e r Changing Climate: Challenges and Opportunities, held at ICAR-CSSRI, Karnal, during 7-9 February, 2019, pp.
Sanwal, S.K, Singh, J., Mann, A., Kaur, G., Bharadwaj, C. and Sharma, P.C. 2019. Genotypic variation in salinity response of chickpea (Cicer arietinum L). In: Abstracts GJISC on Resilient Agriculture in Saline Environments under Changing Climate: Challenges and Opportunities, held at ICAR-CSSRI, Karnal, during 7-9 February, 2019, pp.14.
Sanwal, S.K., Singh, A.B., Mann, A., Sharma, P.C., Kumar, R., Rai, A.K., Kumar, N. and Kaur, G. 2019. Induced tolerance of tomato plants through grafting on
salt tolerant brinjal rootstock. In: Abstracts GJISC on Resilient Agriculture i n S a l i n e E n v i r o n m e n t s u n d e r Changing Climate: Challenges and Opportunities organized by ISSSWQ, held at ICAR-CSSRI, Karnal, Haryana, India, during 7-9 February, 2019.pp. 141.
Sarangi, S.K., Maji, B., Burman, D., Mandal, S., Krishnamurthy, S.L., Sharma, P.C., Singh, S., Srivastava, A.K., Singh, U.S. and Ismail, A.M. 2018. Responses of S U B 1 g e n e i n t r o g r e s s e d r i c e genotypes to stagnant and �ash �ooding in coastal rainfed low land
t he c o s y s t e m . I n : 1 2 N a t i o n a l Symposium of Indian Society of Coastal Agricultural Research on C o a s t a l A g r i c u l t u r e : B o o s t i n g Production Potential under Stressed Environment held, 2018 held at Dr. BSKKV, Dapoli, Maharashtra, India during 28 September to 01 October, 2018, pp. 31-32.
Sarangi, S.K., Maji, B., Digar, S., Mahanta, K .K., Mandal, U.K., Burman, D., M a n d a l , S . , S h a r m a , P. C . a n d Mainuddin, M. 2018. Zero tillage potato cultivation with paddy straw mulching increase yield, water productivity and income in the coastal saline soils. In: XXI Biennial National Symposium of Indian Society of Agronomy: Doubling Farmers' I n c o m e t h r o u g h A g r o n o m i c I n t e r v e n t i o n s u n d e r C h a n g i n g Scenario held during 24-26 October, 2018 at MPUAT, Udaipur, pp. 402-403.
Sarangi, S.K., Maji, B., Mahanta, K.K., Mandal, U.K., Digar, S., Burman, D., M a n d a l , S . , S h a r m a , P. C . a n d Mainuddin, M. 2019. New cropping systems and management options to face the emerging challenges in the salt affected coastal zones. In: A b s t r a c t s G J I S C o n R e s i l i e n t Agriculture in Saline Environments under Changing Climate: Challenges and Opportunities, held at ICAR-CSSRI, Karnal, during 7-9 February, 2019, pp. 70.
Sharma, P.C., Jat, H.S.,Yadav, A.K. and Jat, M.L. 2018. Portfolio of sub-surface micro-irrigation and conservation
agriculture: A game changer for e n h a n c i n g c r o p a n d w a t e r productivity of rice-wheat system in
t h India . In : 5 I n t e r n a t i o n a l R i ce Congress (IRC) held at the Marina Bay Sands Hotel, Singapore during 14-17, October 2018, pp……
Sharma, N., Bhardwaj, A.K. 2019. Nano-Zinc fertilizers for efficient crop Zn u p t a k e u n d e r s a l t a ff e c t e d co n d i t i o n s : I n te r a c t i o n s w i t h rhizospheric and phylospheric microbial communities. In: Abstracts GJISC on Resilient Agriculture in Saline E n v i r o n m e n t s u n d e r C h a n g i n g C l i m a t e : C h a l l e n g e s a n d Opportunities, held at ICAR-CSSRI, Karnal during 7-9 February, 2019, pp.
Sheoran, P., Basak, N., Yadav, R.K., Singh, R., K u m a r , S . , S i n g h , R . K . , a n d Thimmappa, K. 2019. Quantifying yield response and management strategies to continuous use of sodic irrigation in rice-wheat production system. In: Abstracts GJISC on Resilient Agriculture in Saline Environments under Changing Climate: Challenges and Opportunities, held at ICAR-CSSRI, Karnal during 7-9 February, 2019, pp. 82-83.
Sheoran, P., Kumar, A., Sanwal, S.K., Parjapat, K., Raju, R., Barman, A., Kumar, S., Singh, R.K., Yadav, R.K. and Sharma, P.C. 2019. Dissection of salt tolerance in wheat: Mainstreaming soil sodicity and residual alkalinity in irrigation water for agricultural
thsustainability. In: Proceedings of 4 International Group Meeting on Wheat Productivity Enhancement through Climate Smart Practices held at CSKHPKV, Palampur during 14–16, February, 2019. pp. 81.
Shukla, M., Chinchmalatpure, A.R., Kumar, S. and David, Camus D. 2019. Crop r e s i d u e m a n a g e m e n t f o r improving crop production and soil health in saline soils. In: Abstracts GJISC on Resilient Agriculture in S a l i n e E n v i r o n m e n t s u n d e r Changing Climate: Challenges and Opportunities, held at ICAR-CSSRI, Karnal, during 7-9 February, 2019. pp. 200.
230
Conf
eren
ce/ S
emin
ar/ S
ympo
sia/
Wor
ksho
p pa
pers
Ann
ual R
epor
t 201
8-19
Singh, A.K., Bhardwaj, A.K., Verma, C.L., Mishra, V.K., Singh, A.K., Arora, S. 2 0 1 9 . S o i l m o i s t u r e s e n s i n g techniques for scheduling irrigation and their limitations in salt affected soils. In: Abstracts GJISC on Resilient Agriculture in Saline Environments under Changing Climate: Challenges and Opportunities, held at ICAR-CSSRI, Karnal, during 7-9 February, 2019. pp. 200.
Singh, A., Yadav, R.K., Rai, A.K. and Choudhary, M. 2019. Isolation and evaluation of rhizospheric bacteria for zinc solubilisation under alkaline Condition. In: Abstracts GJISC on R e s i l i e n t A g r i c u l t u r e i n S a l i n e E n v i r o n m e n t s u n d e r C h a n g i n g Climate: Challenges and Opportunities organized by ISSSWQ, held at ICAR-CSSRI, Karnal, Haryana, India, during 7-9 February, 2019. pp.42.
Singh, J., Sharma, P.C. and Singh ,V. 2019. Development of salt tolerant Indian Mustard (Brassica juncea): Current achievements and way forward. In:
thAbstract 12 National Symposium on “ C o a s t a l a g r i c u l t u r e : B o o s t i n g Production Potential under Stressed Environment” held at Dr. B.S. KKV,
stDapoli, during Sept. 28 to Oct. 1 , 2018.pp…….
Singh, J., Sharma, P.C. and Singh, V. 2018. “Development of salt tolerant Indian Mustard (Brassica juncea): Current status and future strategies”. In: DAE-BRNS Life Sciences Symposium (LSS-2018) on Frontiers in Sustainable Agriculture held at Bhabha Atomic Research Centre (BARC), Trombay, Mumbai during 26-28 April, 2018, pp……
Singh, R., Sharma, D.K., Chaudhari, S.K., Joshi, P.K., Tripathi, R.S., Thimmappa, K., Kumar, S., Rai, A.K. and Singh, A. 2019. Impact of tillage and crop residue management on water productivity, natural resource saving, and soil health under rice-w h e a t c r o p p i n g s e q u e n c e i n reclaimed sodic soil environment. In: Abstracts GJISC on Resil ient Agriculture in Saline Environments under Changing Climate: Challenges
and Opportunities, held at ICAR-CSSRI, Karnal, during 7-9 February, 2019.pp. 55.
Singh, R.K. 2018. Co-production of s u s t a i n a b l e k n o w l e d g e w i t h marginal communities of India to adapt to environmental stressors: Policy gaps and lessons learnt from local knowledge. In: International Conference Sustainable Development held at University of Michigan, MI, USA during 8-11 Nov. 2018.
Singh, S.V., Deshpande, A., Yallappa, M . S . , a n d S h e o r a n , P. 2 0 1 9 . Enhancement of reproduc tive performance during heat stress using proven bul l semen and supplanting mineral mixture to cattle and buffaloes in salt affected v i l l a g e s u n d e r Fa r m e r F I R S T Programme In: Abstracts GJISC on R e s i l i e n t A g r i c u l t u r e i n S a l i n e E n v i r o n m e n t s u n d e r C h a n g i n g Climate: Challenges and Opportunities, held at ICAR-CSSRI, Karnal, during 7-9 February, 2019. pp. 229.
Singh,V., Sanwal, S.K., Singh, J., Kumawat, G., Shivakumar, M, Kuchlan, M.K., Satpute, G.K., Gill, B.S., Verma, S.K. Neeraj and Sharma, P.C. 2019. Performance of Soybean under salinity and alkalinity Stress. In: Abstracts GJISC on Resilient Agriculture i n S a l i n e E n v i r o n m e n t s u n d e r Changing Climate: Challenges and Opportunities, held at ICAR-CSSRI, Karnal, during 7-9 February, 2019. pp.120.
Sreelatha, A.K., Greeshma Suresh K Manju R o s h n i , V A r y a L e k s h m i , a n d Kaledhonkar, M.J. 2019. Integrated Farming System on Pokkali Lands of Kochi, Kerala for Sustainable Land Use. In: Abstracts GJISC on Resilient Agriculture in Saline Environments under Changing Climate: Challenges and Opportunities, held at ICAR-CSSRI, Karnal, during 7-9 February, 2019. pp. 163.
Sundha, P., Basak, N., Rai, A.K. and Yadav, R.K. 2019. Water quality in�uences ionic selectivity co-efficient and r e c l a m a t i o n o f c i t y c o m p o s t
amended sal ine -sodic soi l . In: Abstracts GJISC on Resilient Agriculture i n S a l i n e E n v i r o n m e n t s u n d e r Changing Climate: Challenges and Opportunities, held at ICAR-CSSRI, Karnal, during 7-9 February, 2019. pp.58.
Sundha, P., Basak, N., Rai, A.K., Yadav, R.K., and Sharma, D.K. 2018. Reclaiming saline-sodic soil through municipal solid waste compost in conjunction with gypsum leached with SAR water. In: National conference on Organic Waste Management for Food and Environmental Security held at ICAR-I I S S , B h o p a l , M P d u r i n g 8 - 1 0 February, 2018.pp…
Thimmappa, K., Damodaran, T. and Raju, R. 2019. Impact of Eco-Friendly Bio-Growth Enhancer on Horticultural Crops, Abstract In: Agricultural Science Congress, Innovations for Agricultural Transformation held at New Delhi, during 20-23 Feb.2019. India. pp. 131.
Thimmappa, K., Raju, R. and Singh, Y. 2019. R educing far m income losses through sodic land reclamation in Indo-Gangetic plains, In: Abstract A g r i c u l t u r a l S c i e n c e C o n g r e s s , I n n o v a t i o n s f o r A g r i c u l t u r a l Transformation. held at New Delhi, during 20-23 Feb.2019. pp. 397.
Vaibhav, R.,Chinchmalatpure, A.R., David Camus, D., Kumar, S., Vibhute, S. and Gorain B. 2019. Seasonal Variation of Groundwater Quality in Ankleswar and Hansot Taluka of Bharuch District, Gujarat. In: Abstracts GJISC on Resilient Agriculture in Saline Environments under Changing Climate: Challenges and Opportunities, held at ICAR-CSSRI, Karnal, during 7-9 February, 2019.pp 30.
Vibhute, S., Chinchmalatpure, A.R., Camus, David, D., Kaledhonkar, M.J., Kumar, Shrvan and Gorain, Bisweswar 2019. Agricultural Drainage in Vertisols of Gujarat: Past Accomplishments and Future Prospects. In: Abstracts GJISC on R e s i l i e n t A g r i c u l t u r e i n S a l i n e Environments under Changing Climate: Challenges and Opportunities, held at ICAR-CSSRI, Karnal, during 7-9 February, 2019.pp.60.
231
Vijayan, B., Kumar, A., Raju, R. and Aswathy, C.K. 2019. Rede�ning Agriculture D e v e l o p m e n t P r o g r a m m e s incorporating Land Degradation parameters. In: Abstracts GJISC on R e s i l i e n t A g r i c u l t u r e i n S a l i n e E n v i r o n m e n t s u n d e r C h a n g i n g C l i m a t e : C h a l l e n g e s a n d Opportunities, held at ICAR-CSSRI, Karnal, during 7-9 February, 2019. pp.223.
Y. Radha Krishna, Naidu, M.V.S. and Kaledhonkar, M.J. 2019. Performance of Cabbage under Drip Irrigation Using Different Levels of Saline Water in Coastal Sandy Loam Soils In: Abstracts GJISC on Resilient Agriculture i n S a l i n e E n v i r o n m e n t s u n d e r Changing Climate: Challenges and
Opportunities, held at ICAR-CSSRI, K a r n a l , d u r i n g 7 - 9 Fe b r u a r y, 2019.pp.68.
Yadav, G., Raju, R., Yadav, R.K., Rai, A.K., Chodhary, M., Rajkumar, Kumar, A. and Kadian, K .S. 2019. Farmer par t ic ipator y mult i - enterpr ise farming system for sustainable livelihood security of small farmers in salt affected areas. In: Abstracts GJISC on Resilient Agriculture in Saline E n v i r o n m e n t s u n d e r C h a n g i n g C l i m a t e : C h a l l e n g e s a n d Opportunities, held at ICAR-CSSRI, K a r n a l , d u r i n g 7 - 9 Fe b r u a r y, 2019.pp.232-233
Yadav, R.K., Yadav, G. and Barman, A. 2018. U t i l i z i n g d e g r a d e d s o i l s f o r
improving farmers' income. In: Souvenir of XXI Biennial National Symposium of Indian Society of Agronomy held at MPUAT, Udaipur, Rajasthan during 24–26 October, 2018. pp. 41-48.
Yadav, T., Yadav, G., Yadav, R.K., Kumar, Jat, H.R., Kumar, A. and Rai, A.K. 2019. Effect of salicylic acid and thiourea in mitigating matric and osmotic stresses in pear l mil let-wheat system. In : A b s t ra c t s G J I SC o n R e s i l i e n t A g r i c u l t u r e i n S a l i n e E n v i r o n m e n t s u n d e r C h a n g i n g C l i m a t e : C h a l l e n g e s a n d Opportunities, held at ICAR-CSSRI, Karnal, during 7-9 February, 2019. pp.41.
232
Conf
eren
ce/ S
emin
ar/ S
ympo
sia/
Wor
ksho
p pa
pers
Ann
ual R
epor
t 201
8-19
Technical Bulletin/Popular Article/FolderBalasubramaniam, P, Baskar, M., Sherene
Jenita Rajammal, T., Alagesan, A., M a n o j k u m a r, M . , S u g u n a , S . , Masilamani, P., Kaledhonkar, M. J. 2019 . G ro u n d Wa te r Q ua l i t y i n Selected Coastal Districts of Tamil Nadu. pp. 51.
Chinchmalatpure, A.R, Kumar S., Vibhuti, S., Kamas, D., and Gorai, B., 2018-19. Lavania kali mirdha mai upaj evam a a y h a t u u n n a t fa s a l o u t p a d a n taknikaya, Krishi Kiran, pp.1-9.
Datta, A. and Mandal, A.K. 2018. Nitrogen and its impact on inorganic C- stocks in soil environment. Fertilizers and Environment News, 4:5-6.
Dar, J. Y., Bhat, I. A., Rasool, I., Nazir, I. and Ganie, P. A. 2018. Beyond the land: Marine Snow. Aquaculture Times, 4:4, 2018.
Dar, J. Y., Fagodiya, R.K. and Bundela, D.S. 2018-19. Anthasthaliye lavaniya machali utpadan ki sambhavnayen. matsyapalan, Krishi Kiran, 85-88.
Gorain, B., Mandal, B., Mandal, U.K. and Chinchmalatpure, A.R. 2018. Lability of soil organic carbon pools in coastal saline soils: effect of land use systems. Salinity News, 24: 4.
Ishfaq N., Mir, I., Bhat, A., N-Sushila, Dar, J.Y., Murilidhar, A.P. 2018. Utilization of exogenous enzymes in aquafeed. Aquaculture Times, 4:3.
Khandkar, U.R., Tiwari, S.C., Kumawat, N.K., Kaledhonkar, M.J. 2018. Effect of long-term application of organic/ green manures in rice-wheat rotaion on sodic Vertisols of Madhya Pradesh. Salinity News, January-June, 2018, vol. 23, No.1.
Kumar, A., Mann, A., Meena, B.L., Pooja, Lata, Charu, Kumar, A. and Sanwal, S.K. 2017-18. Jaiv-upchar phayto- Remediation dwara lavania mirdao ka
parbhandhan. Krishi kiran, pp.77.
Kumar, N., Lata C., Kumar, A. and Kumar, A. 2018. Halophytes-Miracle Plants to S u r v i v e i n E x t r e m e S a l i n e Environment. Open Access Journal of Agricultural Research. 3: 000176.
Kumar, Raj, Shamet G.S. and Dobhal S. 2018. Anthropogenic disturbances affected chilgoza pine (Pinusgerardiana Wall.) in dry temperate forests of Indian Himalaya. Field Forester
Mandal, A.K., Datta, A., Kumar, M., Singh, J., Singh, V and Singh, R.K. (2018). Basmati-CSR-30: Doubling farmer's income in sodic soils. ICAR-News.
Meena, R.K., Singh, M., Fagodiya, R.K., Prajapat, K., Meena, V.K. 2018. Dhan ke samekit poshak tatv prabandhan mein Azola ka mahatv. Dugdh Ganga, pp. 57-59.
Mandal, Subhasis, Burman, D., Maitra, N. J., Ghoshal,T. K . , Velmurugan, A. , Mandal, B. and Mahanta, K. K. 2018. Doubling farmers' income through land-shaping technologies in coastal-salt affected areas. Indian Farming, 68:31-34.
Pande, V.C., Bhatnagar, P.R., Kumar, Raj and D i n e s h , D. 2 0 1 8 . M a h i r a v i n e e c o s y s t e m s e r v i c e s - f a r m e r s ' perception, services and incentives for m a n a g e m e n t . I C A R - I I S W C , Dehradun.
Parshad, I., and Chinchmalatpure, A.R. 2017-18. Gujarat mai Lavania kali mirdha hatu upukt rabi makai ki parjatiya. Krishi Kiran, pp.33-37
Pooja, Kumar A., Meena, B.L., Goyal, Vishal, Mann, A. and Kulshesrtha, N. 2017-18. Lavangrasth mirdao mai ganne ki safal kheti, Krishi Kiran, pp.72-76.
Sanwal, S.K., Kaur, Gurpreet, Mann, Anita and Kumar, Ashwani. 2018-19.
Lavangarasth mirdao mai sabjioo ki unnat kheti, krishi kiran, pp. 61-66.
Sanwal, S.K., Kumar, Arvind and Singh Jogindra. 2018-19. Lavangarasth mirdao kai liya dhan, ghahoo evam sarsoo ki unnat parjatiya, Krishi kiran, pp. 34-39.
Sarangi, S.K., Maji, B., Digar, S., Mahanta, K.K., Sharma, P.C. and Mainuddin, M. 2 0 1 8 . Z e r o t i l l a g e p o t a t o c u l t i v a t i o n – a n i n n o v a t i v e technology for coastal saline soils. Indian Farming, 68:23-26.
S h u k l a , M . , S a d h u , A . C . , Chinchmalatpure, A.R. Prasad, I., Kumar, S., and David Camus, D., 2 0 1 8 . F e r t i g a t i o n - M o d e r n Technique of Fertilizer Application. Indian Farmer 5: 1062-1071
Singh,Y.P., Arora, Sanjay, Mishra,V.K. and Dixit, H. 2018. On-farm composting of municipal solid waste for restoration o f d e g r a d e d s o d i c l a n d s a n d s u s t a i n i n g c r o p p r o d u c t i v i t y . Technical Bulletin: ICAR- CSSRI/ Lucknow/ 2018/1, pp. 51.
Singh, Dheeraj and Jat, H.S. 2017-18. Maru cheter mai bahuupyogi gundya ki viganik kheti. Kirishi kiran.pp.88-93.
Singh, Dheeraj, Meena, M.L., Chaudhri, S.K., Kumar, Chadan, Jat, H.S. and Yadav, Gajender. 2017-18. Paschami Rajasthan mai ber ki vaganik kheti sai a d h i k l a b h k a m a n a . K i r i s h i kiran.pp.81-87.
Singh, J., Sharma, P.C. and Singh, Vijeyata. 2018. Lavangrasth bhumi mai sarso ki kheti. ICAR/Karnal/Folder/2018/08.
Sreelatha, A.K. Kaledhonkar, M.J. and Meena, B.L . 2018. R ice -prawn integration on Pokkali �elds in Kerala. Salinity News, July-Dec. 2018, vol. 24, No.2 pp4.
233
Book/Manual /Chapter
Arora, Sanjay and Vanza, M. 2018. Halophilic Microbial Ecology for Agricultural Production in Salt Affected Lands. In: Eric Lichtfouse, Sustainable Agriculture Reviews 33, Springer Nature, 978-3-319-99075-0
B a r m a n A . 2 0 1 8 . A p p l i c a t i o n o f hyperspectral imaging for appraisal and characterization of salt-affected soils-practical. Advances in salinity and society management under different agro-climatic regions for enhancing farmers' income, ( Eds. Kaledhonkar et al. ). ICAR-ICAR-CSSRI, Karnal, India.pp 99 – 104.
Bhan, S. and Arora, Sanjay. 2018 Soil and Water Conservation in Ravinous Watersheds: Case Studies from Uttar Pradesh in India. (Eds. Dagar, J.C. and Singh A.K..) Ravine Lands: Greening for Livelihood and Environmental Security, Springer Nature, Singapore, pp.309-333.
Chinchmalatpure, A.R., 2018. Salt affected Vertisols and associated soils of G u j a r a t : I n t e r v e n t i o n s a n d
rdmanagement. In: Souvenir of 83 Annual Convention and National Seminar of Indian Society of Soil Science, New Delhi (Eds. Patel, K.P., Ramani, V.P., Rathod, P.H., Patel, K.C., Dileep Kumar, Patel, B.K., Parmar, J.K. and Jadav, N.J.) Anand Agricultural University, Anand held during Nov 27-30, 2018 pp. 1-269
Datta, A., Setia, R., Barman, A., Guo, Y. and Basak, N. 2019.Carbon Dynamics in S a l t - A ff e c t e d S o i l s . R e s e a r c h Developments in Saline Agriculture, (Eds. Dagar et al.) Springer Nature Singapore Pte Ltd.
Jat, H.S., Jat, M.L.,Yadvinder Singh, Sharma, R.K., Chhokar, R.S. and Jat, R.K. 2018. Conservation Agriculture: Global Status and Recent Trends in S o u t h A s i a . I n : S y s t e m B a s e d Conservation Agriculture (Eds. V.K. Singh and B. Gangwar). Westville
Publishing House, New Delhi. pp 1-19. (ISBN: 978-93-83491-88-9)
Kaledhonkar, M.J. 2018. Conjunctive water use of canal and saline/sodic groundwater for crop production: Modeling Approaches.In: Special p u b l i c a t i o n o n r e s a e r c h a n d development in soil science (Eds. Patel, K.P., Ramani, V.P., Rathod, P.S., Kumar, Dileep, Patel, K.C., Patel, B.K.). Anand Chapter of ISSS, AAU, Anand. pp. 87-109.
Kumar, Neeraj, Lamba, Shubham, Kumar, Ashwani, Kumar, Pratima, Mann, Anita, Devi, Sarita, Pooja, Kumari, Anita and R ani , Babita . 2019. Antioxidant defence in halophytes under high salinity. In: Halophytes a n d C l i m a t e C h a n g e : Ad a p t i ve Mechanisms and Potential Uses (Eds: M. Hasanuzzaman, S. Shabala and M. Fujita). pp. 196-208.
Kumar, Parveen and Gupta, P.G. 2018. Optimizing irrigation and planting schedules of salt tolerant rice and wheat varieties for higher system and water productivity. In: Advances in salinity and sodicity management under different agro-climatic regions for enhancing farmer's income, (Eds. Kaledhonkar, M.J. et al). pp. 112-114.
Meena, B.L., Fagodiya, R.K., Prajapat, K., Dotaniya, M,L., Kaledhonkar, M.J., Sharma, P.C., Meena, R.S., Mitran, T., and Kumar, S. 2018. Legume green manur ing: An opt ion for so i l sustainability. In: Legumes for Soil H e a l t h a n d S u s t a i n a b l e Management ( Eds. R.S. Meena et al.) Springer Nature Singapore Pte Ltd., pp. 389-408.
Meena, B.L., Meena, R.L., Kaledhonkar, M.J., Kumar, P., Kumar, A. 2018. Efficient Management of Micro-nutrients in Salt Affected Soils. In: I C A R-Wi n te r S c h o o l M a nua l o n “Advances in Salinity and Sodicity Management under Different Agro-
Climatic Regions for Enhancing F a r m e r s ' I n c o m e ” ( E d s . M . J . Kaledhonkar et al.), ICAR-CSSRI, Karnal, pp.280-287.
Meena, M.D., Yadav, R.K., Narjary, B., Yadav, Gajender, Jat, H.S., Sheoran, P., Meena, M.K., Antil, R.S., Meena, B.L., Singh, H.V. and Meena, V.S. 2019. Municipal sol id waste (MSW ): Strategies to improve salt affected soil sustainability: A review, Waste Management, 84: 38-53.
Mandal, S., Sarkar, B., Mukhopadhyay, R., Biswas, J.K., Manjaiah, K.M. 2019. M i c r o p a r t i c l e - S u p p o r t e d n a n o c o m p o s i t e s f o r s a f e environmental applications. In: N a n o m a t e r i a l s : E c o t o x i c i t y , Safety, and Public Perception (Eds. Rai, M. and Biswas, J.K.),. Springer. pp. 305-317.
Manjaiah, K. M., Mukhopadhyay, R., Paul, R., Datta, S.C., Kumararaja, P., Sarkar, B. 2019. Clay minerals and zeolites for e n v i r o n m e n t a l l y s u s t a i n a b l e agriculture. In: Modi�ed Clay and Zeolite Nanocomposite Materials: Environmental and Pharmaceutical Applications. (Eds. Mercurio, M., Sarkar, B., Langella, A.), Elsevier. pp. 309-329.
Manjaiah, K.M., Mukhopadhyay, R., Narayanan, N., Sarkar, B., Datta, S.C. 2 0 1 8 . C l a y A m e n d m e n t s f o r Environmental Clean-Up. In: Soil Amendments for Sustainability: Challenges and Perspectives. (Eds Rakshit, A., Sarkar, B. and Abhilash, P.), CRC Press, Taylor and Francis. pp. 19-29.
Rai, A.K., Basak, N., Kumar, K., Sundha, P., Dixit, A.K., Yadav, R.K. 2018. Forage production in problematic soil: Indian perspectives. (Eds. Ghosh, P.K., Mahanta, S.K., Singh, J.B., Vijay, D., Kumar, R.V., Yadav, V.K. and Kumar, Sunil. Approaches Towards Fodder Security in India. Studera Press, New
234
Book
/Man
ual /
Chap
ter
Ann
ual R
epor
t 201
8-19
Delhi. pp. 151-172.
Sarita, Devi, Kumar, Ashwani, Mann, Anita, Arya, S.S., Chand, Gurdev, Kumar, Neeraj, Kumari, Pooja, Anita, Rani, Babita and Kumar, Arvind. 2019. Intra-habitat variability of halophytic � o ra o f n o r t h -we s t I n d i a . I n : Halophytes and climate change: Adaptive mechanisms and potential Uses (Eds: M. Hasanuzzaman, S. Shabala and M. Fujita). pp. 38-54.
Sarkar, B., Rusmin, R., Ugochukwu, U.C., Mukhopadhyay, R., Manjaiah, K.M. 2019. Modi�ed clay minerals for e n v i r o n m e n t a l a p p l i c a t i o n s . I n : M o d i � e d C l a y a n d Ze o l i t e N a n o c o m p o s i t e M a t e r i a l s : Environmental and Pharmaceutical Applications. (Eds. Mercurio, M., Sarkar, B., Langella, A.), Elsevier. pp. 113-127.
Sharma, P. C. and Singh, Anshuman .2019. Strategies for Developing Salt Tolerant Rootstocks in Fruit Crops. In: Shaping the Future of Horticulture (Eds.K. L. Chadha, S. K. Singh, Jai Prakash and V. B. Patel), Kruger Brentt Publishers, Middlesex, UK.pp. 475-494.
Sharma, P.C., Datta, A., Choudhary, M. and J a t , H . S . 2 0 1 8 . C o n s e r v a t i o n agriculture, carbon sequestration and soil quality. (Eds.Patel et al. Eds). Special publication on research and development in soil science (ISBN:
978-93-5346-075-4).
Sharma, P.C., Datta, A., Yadav, A.K., C h o u d h a r y, M . , J a t , H . S . a n d McDonald, A., 2018. Effect of crop management practices on crop g r o w t h , p r o d u c t i v i t y a n d pro�tability of rice–wheat system in Western Indo-Gangetic Plains. Proceedings of the National Academy of Sciences, India Section B: Biological Sciences, pp.1-13.
Sharma, R.K., Chhokar, R.S.and Jat, H.S. and J a y , M . L . 2 0 1 8 . R e l e v a n c e o f Conservation Technologies in Black Soils. In: System Based Conservation Agriculture (eds. V.K. Singh and B. Gangwar). Westville Publishing House, New Delhi. pp. 168-182. ISBN: 978-93-83491-88-9.
Sheoran, P., Kumar, A., Barman, A., Kumar, S., Sanwal, S.K., Singh, R.K. and Yadav, R . K . 2 0 1 8 . N R M a n d v a r i e t a l inter ventions to address crop productivity constraints in Ghaghar Plains. Advances in Salinity and S o d i c i t y M a n a g e m e n t u n d e r Different Agro-Climatic Regions for Enhancing Farmers Income, (Eds. Kaledhonkaret, M.J. al.) CSSRI, Karnal, pp. 159-164.
Singh, Anshuman, Sharma, D.K., Rajkumar, Kumar, A., Yadav, R.K. and Gupta, S.K. 2018. Soil salinity management in fruit crops: a review of options and challenges. In: Engineering Practices
for Management of Soil Salinity, Agricultural, Physiological, and Adaptive Approaches (Eds. S. K. Gupta et al.), Apple Academic Press Inc., pp. 39-85.
Singh, Anshuman. 2018. Soi l and water management prac t ices f o r f r u i t c u l t i v a t i o n i n s a l t affected soils. In: Advances in s a l i n i t y a n d s o d i c i t y management under d ifferent A g r o - C l i m a t i c R e g i o n s f o r e n h a n c i n g f a r m e r s ' i n c o m e (Eds.M. J. Kaledhonkar et. al.). ICAR-CSSRI, Karnal. pp. 171-181.
S i n g h , Aw t a r, C h a n d ra , Pr i y a n k a , Chaudhary, Madhu,Yadav, R.K., Bali, Aradhana and Singh, Singh, Vijayata. 2018. Shariya Bhumi kai liya mirdha sudharko ka uchit unyog. Krishi Kiran, 11:10-13.
Singh, R. K . and Agrawal, A. 2018. Perceived weather anomalies and climate change: Community based adaptation in sustaining natural resources and livelihoods by Adi and Monpa communities of Arunachal Pradesh, eastern Himalaya. (Eds. Pandey C.B., Kumar M.K. and Aaur, M.K . and Goyal, R .K . ) Cl imate C h a n g e a n d A g r o f o r e s t r y A d a p t a t i o n , M i t i g a t i o n a n d Livelihood Security, NIPA, New Delhi, pp. 21-58
235
Books/Training Mannual/Chapter
Bhardwaj, A.K., Hamed, L.M.M., Sharma, N., Rajwar, D., Meti, S., Nagaraja, M.S. 2019. Engineered polymeric and nano-materials for taming salty soils and waters used for crop production. In: Research Developments in Saline Agriculture (eds J.C. Dagar, R.K. Yadav, P.C. Sharma), Springer.ISBN: 978-981-13-5831-9.
Bhardwaj, A.K., Rajwar, D., Nagaraja, M.S. 2019. Soil Fertility Problems and Their Management in Salt-affected Soils. In: Resilient agriculture in salinity afflicted soils (Eds. P.S. Minhas, R.K. Yadav, P.C. Sharma), Indian Council of Agricultural Research, New Delhi.
Chinchmalatpure, A.R. 2018. Salt affected Vertisols and associated soils of G u j a r a t : I n t e r v e n t i o n s a n d
rdmanagement. In: Souvenir of 83 Annual Convention and National Seminar of Indian Society of Soil Science, New Delhi (Eds. Patel KP, Ramani, VP, Rathod, P.H., Patel, K.C., Dileep Kumar, Patel, B.K., Parmar, J.K. and Jadav NJ) at Anand Agricultural University, Anand held during Nov 27-30, 2018 pp. 1-269.
Gupta, S.K., Goyal, M.R. and Singh, Anshuman. 2018. Engineering Practices for Management of Soil Salinity: Agricultural, Physiological, and Adaptive Approaches. Apple Academic Press, pp. 420.
Kaledhonkar, M.J., Meena, R.L., Meena, B.L., Basak, N. and Sharma, P.C. 2018. Advances in salinity and sodicity management under different Agro-
Climatic Regions for enhancing farmers' income. ICAR-Winter School Manual, pp. 328.
Kaledhonkar, M.J., R.L., Meena and B.L., Meena. 2019. Biennial Report 2016-18. ICAR-AICRP on Management of Salt Affected Soils and Use of Saline Water in Agriculture ICAR-CSSRI, Karnal,pp. 282.
Krishnamurthy, S.L., Rathor, Suman A. S. Warraich, P. C. Sharma. 2018. SSRs and SNPs for crop improvement. In: Compendium of Lectures: Mann A., Sanwal S. K. and Kumar A. 2018. Advancement of physiological strategies for Crop Improvement against abiotic stresses. Training M a n u a l , I C A R - C S S R I , K a r n a l , Haryana, India, pp. 200.
Kumar, Anil, Singh, R.K., Prajapat, K., Kumnara, Kiran ,Vijayan, Bhagya, Sheoran, P., and Sharma, P.C. 2018. Maharashtra ke Lawangrast mardaon e v a m n i m n g u n w a t t a j a l k e p r a b a n d h a n h e t u k r i s h a k prashikashan. Training Manual, ICAR-CSSRI, Karnal. 68 p.
Kumar, Arvind, Sharma, P.C. and Kumar Ashwani. 2018. Wheat Improvement f o r S a l i n i t y a n d A l k a l i n i t y Environments. In: Advances in Salinity and Sodicity Management under Different Agro-Climatic Regions for Enhancing Farmers' Income (Eds. Kaledhonkar, M.J., Meena, R.L., Meena, B.L., Basak, N., Sharma, P.C.)ICAR-CSSRI, Karnal, India. pp. 328.
Mann, A., Sanwal, S.K., and Kumar, A. 2018. Advancement of physiological strategies for crop improvement against abiotic stresses. Training Manual, ICAR-CSSRI, Karnal, Haryana, India, pp. 200.
Mann, Anita, Meena, B.L., Kumar, Ashwani, Sheoran,Parvender, Yadav, R.K. and Sharma, P.C. 2018. Mirda swasthay c a r d a p n a i s a n t u l i t u r v a r k parbandhan fasal utpathan badai, ICAR-CSSRI/Training Mannual, pp. 28.
Sharma, P.C., Yadav, R.K., Bundela, D.S., Kumar, A., Sanwal, S.K., Meena, R.L., Banyal, R., Singh, J., Kumar, R., Fagodiya, R.K., Barman, A., Singh, A., Datta, A., Chandra, P. and Singh, A. (Eds.). 2019. In: Abstract: Golden Jubi lee I nter nat ional S a l in i t y Conference on Resilient Agriculture in Sal ine Environments under Changing Climate: Challenges and Opportunities. Indian society of soil salinity and water quality, Karnal, Haryana. pp.251.
Sheoran, P., Parjapat, Kailash, Ashwani Kumar,Mann, Anta, Kumar, Naveen and Sharma, P.C. 2018. Krishi aay D o guna karne hatu unnat b eej utpadhan evam fasal sangikaran ki t a k n i k i y a , I C A R - C S S R I / Tr a i n g Mannual, pp.49.
Singh, R.K., Singh, A. and Sharma P.C. 2019. Successful adaptations in salt affected agroecosystems of India. ICAR-CSSRI, Karnal 132001, Haryana, India, pp 118.
236
Book
s/Tr
aini
ng M
annu
al/C
hapt
erA
nnua
l Rep
ort 2
018-
19
Participation In Conference/Seminar/Symposium/WorkshopName Title Place Period
rdDr. Krishnamurthy S. L., Scientist 53 All India Annual Rice Group Meetings Hyderabad 14.04.2018-16.04. 2018Dr. Anil R. Chinchmalatpure Vibrant Saurashtra Expo Summit Rajkot 19.04.2018 08.04.2018Principal Scientist Dr. Shrvan Kumar Asia-Paci�c and Regional Workshop jointly organized by United Nations New Delhi 24.04.2018-27.04.20182Scientist convention to combat deserti�cation (UNCCD) and ministry of environment, forest and climate change (MoEF&CC), Govt. of India Dr. Anil R. Chinchmalatpure Farmers training at ATMA promises Bharuch 25.04. 2018Principal Scientist Dr. Jogendra Singh Participated in DAE-BRNS Life Sciences Symposium (LSS-2018) ’ BARC, Trombay, 26.04.2018-28.04.2018Sr.Scientist on ‘Frontiers in Sustainable Agriculture Mumbai Dr. Y.P. Singh, Principal Scientist Stress Tolerance Rice for poor farmers of Asia and South Africa New Delhi 30.04.2018-04.05.2018Dr. Krishnamurthy, S. L. - Review and planning Scientist Dr. S.K. Sanwal XXXVI Annual Group Meeting of AICRP (VC) RARI, Durgapura, 18.05.2018-21.05.2018Principal Scientist JaipurDr. Anil R. Chinchmalatpure Workshop on Carp polyculture in village pond Rajpipla 24.05.2018Principal Scientist Workshop on Doubling Farmers Income organised by Department Anand 01.06.2018 02.06.2018 of Agriculture, Cooperation and Farmers Welfare Govt. of Gujarat Dr. RK Fagodiya Scientist National Network Workshop on Contaminated Sites: IIT, Delhi 12.07.2018-13.07.2018 Subsurface Investigations and Remediation
thDr. Arvind Kumar Scientist 57 All India Wheat and Barley Research Workers’ Meet at Ranchi Jharkhand 24.08.2018-26.08.2018 Birsa Agricultural University (BAU) Dr. Y.P. Singh Brain Storming Session on Strategies for enhancing productivity Lucknow 01.09.2018Principal Scientist of Kharif Cereals and Pulses in the Context of Doubling Farmers Income in Uttar PradeshDr. Sanjay Arora, Principal Scientist Agriculture Conclave, 4th India International Science Festival, 2018 Lucknow 05.09.2018-08.09. 2018Dr. P.C. Sharma, Director National Workshop on “Sustainability of Indian Agriculture” NASC Complex, 08.09.2018 Dr. M.J. Kaledhonkar New DelhiPrincipal ScientistDr. R Mukhopadhyay Annual Convention & National conference on “ Advances in ICAR - NBSS & 14.09.2018-15.09.2018 Clay science towards Agriculture, Environment and Industry” LUP, RRS Kolkata of the Clay Minerals society of India.Dr. M.J. Kaledhonkar National Workshop on Sustainability of Indian Agriculture: IIWM, Bhubaneswar 11.10.2018 Principal Scientist National Resource Perspective with special reference to Water OdishaDr. D.S. BundelaPrincipal Scientist Dr. Sanjay Arora National Conference on Role of Modern Biological Sciences for Lucknow 12.11.2018-13.12. 2018Principal Scientist Enhancing Farmers’ Economy & Welfare of the Society
thDr. P.C. Sharma Director 83 Annual Convention of Indian Society of Soil Science AAU, Anand 27.11.2018-30.11.2018Dr.M.J. Kaledhonkar,Principal Scientist Dr.B.L. Meena Scientist Dr. Ashim Dutta Scientist
thDr. Anita Mann, Sr. Scientist 4 International Plant Physiology Congress NBRI, Lucknow 02.12.2018-05.12.2018stDr. Krishnamurthy, S. L. 1 National Genetics Congress on Genetics for Sustainable Food, IARI New Delhi. 14.12.2018-16.12.2018
Scientist Health and Nutrition Security, Dr. D.S. Bundela Principal Scientist National Workshop on Land Degradation Neutrality Target MoEFCC, New Delhi 04.12.2018-05.12.2018 Setting Programme (LDN-TSP) Dr. Sagar D. Vibhute, Scientist Winter School on “Recent Advances in Micro-Irrigation and Fertigation ICAR-CIAE, Bhopal 03-01.2019 23.01.2019 Systems for Improved Input Use Efficiency of Open and Covered Cultivation through Engineering Interventions”
237
Dr. M.J. Kaledhonkar Seminar on Waterlogging and Salinity at Organized by Agriculture Chandigarh 11.01.2019Principal Scientist Department, HaryanaDr. P.C. Sharma, Director Annual Conference of Vice Chancellors of Agricultural Univiersities NASC Complex, 31.01.2019-01.02. 2019Dr. M.J. Kaledhonkar & Directors of ICAR Institutes Pusa, New Delhi Principal Scientist Dr. Ashwani Kumar , Scientist International Symposium “Innopreneurship: A need of CCS HAU, Hisar 02.02.2019-03.02. 2019 Sustainable Agriculture”
thDr. M.J. Kaledhonkar 26 Biennial Workshop of AICRP on SAS&USW ICAR-CSSRI, Karnal 05.02.2019-06.02.2019Principal ScientistDr.R.L. Meena, Principal ScientistDr. BL Meena Scientist All Scientists Golden Jubilee International Salinity Conference Karnal 07.02.2019-09.02.2019 Dr.M.J. Kaledhonka Two days Training-Cum-Workshop on Unit Level Data Repository ICAR-IASRI, 25.02.2019-26.02. 2019Principal Scientist for AICRP New Delhi Dr. B.L. Meena
238
Part
icip
atio
n In
Con
fere
nce/
Sem
inar
/Sym
posi
um/W
orks
hop
Ann
ual R
epor
t 201
8-19
List of On-going Projects
Institute Funded Projects
Priority area - Data Base on Salt Affected Soils & Poor Quality Waters
1. NRMACSSRISIL201700500929. Spectral characterizations of saline soil located at Nain experimental farm of ICAR-CSSRI in Panipat district of Haryana. (Arijit Burman, R. Srivastava, A.K. Mandal, Jogendra Singh and R.K. Yadav)
2. NRMACSSRISIL201800100954. Mapping and characterization of salt affected soils in Uttar Pradesh using remote sensing and GIS. (A.K. Mandal, Arijit Barman, R.K. Yadav V.K. Mishra, Sanjay Arora, S.K. Jha, M.J. Kaledhonkar and P.C. Sharma)
Priority Area - Reclamation and Management of Alkali Soils
3. NRMACSSRISIL201501300889. Impact of secondary salinization and other stressors on agricultural systems: constraints analysis in South-Western Punjab. (R.K. Singh, Satyendra Kumar, Anshuman Singh and Nirmalendu Basak)
4. NRMACSSRISIL201600400902. Farmer participatory enterprise mix diversi�cation on reclaimed sodic land (Gajender, R. Raju, A.K. Rai, R.K. Yadav, Madhu Choudhary, Raj Kumar, Anil Kumar, Dar Jaffer Yusuf and K.S. Kadian)
5. NRMACSSRISIL201600100899. Characterization and application of sewage sludge and municipal solid waste compost for reclamation of sodic soils. (Parul Sundha, A.K. Rai, Gajender, Nirmalendu Basak and Priyanka Chandra)
6. NRMACSSRISIL201700100925. Isolation, identi�cation and assessment of salt tolerant zinc solubilising bacteria for enhancing availability and use efficiency of zinc in salt affected soils. (Awtar Singh, R.K. Yadav, A.K. Rai and Madhu Choudhary)
7. NRMACSSRISIL201700200926.Dynamics of nitrogen and organic matter fractions in soils under long-term conservation agriculture in reclaimed sodic soil. (Ashim Datta, Madhu Choudhary and P.C. Sharma)
8. NRMACSSRISIL201700300927.Sustainable nutrient management strategies for partially reclaimed salt affected soils. (Ajay Kumar Bhardwaj, Priyanka Chandra and Bhaskar Narjary)
9. NRMACSSRISIL201700600930. Development of endo-rhizospheric fungal consortia to increase salt tolerance in crops. (Priyanka Chandra, Awtar Singh and Kailash Prajapat)
10. NRMACSSRISIL201701500939. Planned adaptations and co-production of adaptive knowledge to agro-ecological stressors: Perspectives of multi-stakeholders of North-Western India. (Ranjay K. Singh, Anshuman Singh, R.K. Yadav, Parveen Kumar and P.C. Sharma)
11. NRMACSSRISIL201800200955. Amelioration of iron de�ciency in direct seeded/aerobic rice in reclaimed sodic s soils. (Babu Lal Meena, Ram Kishor Fagodiya, R.L. Meena, M.J. Kaledhonkar and P.C. Sharma)
12. NRMACSSRISIL201801700969. Developing of soil quality indices for sodic soil under different reclamation strategies (Nirmalendu Basak, Arvind Kumar Rai, Parul Sundha, R.L. Meena, R.K. Yadav and P.C. Sharma)
13. NRMACSSRISIL201802200974. Rice-wheat system performances and dynamics of salt and water under contrasting tillage, residue and irrigation management practices. (H.S. Jat, Ashim Datta, Madhu Choudhary, Satyendra Kumar and P.C. Sharma)
Priority Area - Drainage Investigations and Performance Studies
14. NRMACSSRISIL2014001000868. Impact assessment of subsurface drainage technology in canal command areas of Karnataka. [(R. Raju, Aslam Latif Pathan and Thimmappa K.]
239
15. NRMACSSRISIL201501400890. Performance evaluation of subsurface drainage systems in Haryana and to implement interventions for improving operational performance and impact. (D.S. Bundela, Bhaskar Narjary Aslam Latif Pathan and R. Raju )
16. NRMACSSRISIL201701000934. Developing guidelines for suitability of geosynthetic �lter materials for Sub-Surface Drainage systems in different agro-climatic. (A.L. Pathan, R.S. Tolia and D.S. Bundela)
17. NRMACSSRISIL201701100935. Studies on salt load dynamics of drainage water and improvement in soil salinity in sub surface sites in Haryana, (R.S. Tolia, A.L. Pathan, Kailash Prajapat and D.S. Bundela)
Priority Area - Management of Marginal Quality Waters
18. NRMACSSRISIL201400700865. Conjunctive water use strategies with conservation tillage and mulching for improving productivity of salt affected soils under limited fresh water irrigation.(Arvind Kumar Rai, Nirmalendu Basak, Satyendra Kumar, Bhaskar Narjari and Gajender)
19. NRMACSSRISIL201501500891 Assessing use of press mud/press mud compost in gypsum . beds for neutralization of RSC in irrigation water. (R.K. Yadav, Satyendra Kumar, Parul Sundha and Madhu Choudhary)
20. NRMACSSRISIL201502100897 Isolation, identi�cation and evaluation of plant growth . promoting bacteria for mitigating salinity stress in crops. (Madhu Choudhary, Gajender, Awtar Singh and T. Damodaran)
21. NRMACSSRISIL201700900933. Development of salinity yield relations for different crops under micro-irrigation for updating water quality guidelines. (Ram Kishor Fagodiya, B.L. Meena, R.L. Meena, M.J. Kaledhonkar, D.S. Bundela and P.C. Sharma)
22. NRMACSSRISIL201802100973. Salinity management and modeling under drip Irrigation, raised bed and mulch for optimum yield. (Bhaskar Narjary, Satyendra Kumar and R.K Fagodiya)
Priority Area - Crop Improvement for Salinity, Alkalinity and Waterlogging Stresses
23. NRMACSSRISIL201500800884 Identi�cation of high yielding and salt tolerant genotypes in . pomegranate. (Raj Kumar, R.K. Yadav, Anita Mann and Anshuman Singh)
24. NRMACSSRISIL201501100887. Development of rice genotypes for salt tolerance in rice: Conventional and Molecular approaches. (Krishnamurthy, S.L., P.C. Sharma,Y.P. Singh and S.K. Sarangi)
25. NRMACSSRISIL201700400928. Development of Soybean [Glycine max (l.) Merrillis] genotypes for higher yield under Salt Stress. (Vijayata Singh and S.K. Sanwal)
26. NRMACSSRISIL201700700931. Development of salt tolerant and high yielding Indian Mustard (Brassica juncea L.Czern & Coss) genotypes using Classical and Modern breeding approaches. (Jogendra Singh, P.C. Sharma and Vijayata Singh)
27. NRMACSSRISIL201700800932. Morpho-physiological characterization and standardization of agronomic practices of quinoa (Chenopoium quinoa) for salt affected ecosystems. (Kailash Prajapat, S. K. Sanwal and P.C. Sharma)
28. NRMACSSRISIL201701300937. Wheat improvement for salt and waterlogging tolerance thorugh conventional and molecular approaches. (Arvind Kumar, P.C. Sharma, Ashwani Kumar, Indivar Prasad and Y.P. Singh)
29. NRMACSSRISIL201800300956. Identi�cation of salt tolerant genotypes in jamun (Syzygium cumini L. Skeels) (Anshuman Singh and Ashwani Kumar)
30. NRMACSSRISIL201801800970. Genetic improvement of chickpea for salt tolerance through conventional and molecular breeding approaches. (S.K. Sanwal, Vijayata Singh and Anita Maan)
240
List
of O
n-go
ing
Proj
ects
A
nnua
l Rep
ort 2
018-
19
31. NRMACSSRISIL201802300975. Screening of potato genotypes for higher tuber yield under salinity stress- (Parveen Kumar, V.K. Gupta, PS (VB), CPRS, Modipuram)
Priority Area - Agroforestry in Salt Affected Soils
32. NRMACSSRISIL201701200936. Evaluation of potential Olive germplasm for salt affected soils. (Manish Kumar and Rakesh Banyal)
33. NRMACSSRISIL201701300938 Enhancing productivity potential of saline soils through agroforestry interventions. (R. Banyal, A.K. Bhardwaj, Parveen Kumar, Raj Kumar and Rahul Singh Tolia)
34. NRMACSSRISIL201800400957. Improvement of Melia dubia for salt tolerance through selection approach. (Raj Kumar, Rakesh Banyal and Awtar Sing)
Priority Area - Reclamation and Management of Coastal Saline Soils
35. NRMACSSRISIL201401100869. Long term impact of land shaping techniques on soil and water quality and productivity of coastal degraded land. (D. Burman, U.K. Mandal, S.K. Sarangi, S. Mandal, K.K. Mahanta and S. Raut)
36. NRMACSSRISIL201600500903. Conservation agriculture for rice-maize cropping system in coastal saline region. (S.K. Sarangi, U.K. Mandal, K.K. Mahanta and T.D. Lama)
37. NRMACSSRISIL201600600904. Role of soil salinity and land uses on status and characteristics of organic matter under different landforms in coastal ecosystem. (Shishir Raut and T.D. Lama)
38. NRMACSSRISIL201600700905. Assessment and coping strategies of agricultural risk under coastal region of West Bengal – a social-economic analysis. (Subhasis Mandal, U.K. Mandal and T.D. Lama)
39. NRMACSSRISIL201600800906. Assessing carbon sequestration potential of conservation tillage practices under rice based cropping systems in coastal saline soils. (U.K. Mandal, D. Burman, S.K. Sarangi and T.D. Lama)
40. NRMACSSRISIL201600900907. Impact of de�cit irrigation on salt dynamics and crop productivity in coastal saline soils. (T. D. Lama, D. Burman, S. K. Sarangi and K.K. Mahanta)
41. NRMACSSRISIL201801100964. Evaluation of different micro-irrigation systems for rabi rice in coastal salt affected soils. (K.K. Mahanta, S.K. Sarangi, U.K. Mandal, D. Burman and S.Mandal)
Priority Area - Reclamation and Management of Salt Affected Vertisols
42. NRMACSSRISIL201601000908. Cost effective drainage in waterlogged saline Vertisols for improving crop productivity in Gujarat. (Sagar Vibhute D., Anil R. Chinchmalatpure, David Camus. D and M.J. Kaledhonkar)
43. NRMACSSRISIL201601100909. Maximization of yield and factor productivity through integrated nutrient management in desi cotton based cropping systems in saline vertisols. (Shrvan Kumar, David Camus. D, Bisweswar Gorain and Anil R. Chinchmalatpure)
44. NRMACSSRISIL201800500958. Conjunctive use of saline groundwater and surface water in Vertisols for improving water productivity under drip irrigated wheat. (Sagar D. Vibhute, Anil R. Chinchmalatpure, Shrvan Kumar and Bisweswar Gorain)
45. NRMACSSRISIL201800600959. Pulpwood-based silvipastoral systems for saline Vertisols. (David Camus D, Shrvan Kumar and Bisweswar Gorain)
46. NRMACSSRISIL201800700960. Assessment and mapping of salt affected soils of Gujarat using remote sensing and GIS. (Anil R. Chinchmalatpure, Shrvan Kumar, Bisweswar Gorain, A.K. Mandal, M.J. Kaledhonkar, Arijit Barman and scientist from AICRP –Indore centre)
47. NRMACSSRISIL201800800961.Development of Desi cotton genotypes (G. herbaceum and G. arboreum) for salt affected Vertisols. (Shrvan Kumar, Anil R. Chinchmalatpure and P.C. Sharma)
241
Priority Area - Reclamation and Management of Alkali Soils of Central and Eastern Gangetic Plains
48. NRMACSSRISIL201601200910. Breeding of salt tolerant polyembryony mango rootstocks and assessment of bio-efficacy of the microbial formulations in control of Fusarium wilt of banana and guava.{(T. Damodaran (PI), V.K. Mishra and S.K. Jha, S. Rajan and Umesh. (CISH, Lucknow)}
49. NRMACSSRISIL201601300911. Bio-augmenting crop residues degradation for nutrient cycling through efficient microbes to enhance productivity of salt affected soils. (Sanjay Arora, Y.P. Singh and A.K. Singh)
50. NRMACSSRISIL201601400912. Feasibility of marine gypsum an alternative source of mineral gypsum for the reclamation of sodic soils. (S. K. Jha, V.K. Mishra T. Damodaran and Y.P. Singh)
51. NRMACSSRISIL201800900962. Development of soil moisture sensor to automate solar PV based irrigation system in salt affected soils. (Atul Kumar Singh, C.L. Verma A.K. Bhardwaj, V.K. Mishra and Anju Kumari Singh (GBPP, Lucknow))
52. NRMACSSRISIL201801900971. Managing soil sodicity and waterlogging problems in permanent land modi�cation modules under Sarada Sahyak canal command area. (V.K. Mishra, C.L. Verma, Y.P. Singh S.K. Jha, T. Damodran, M.J. Kaledhonkar and P.C. Sharma)
Externally Funded Research Projects
1. Stress tolerant rice for poor farmers in Africa and South Asia (STRASA Phase 3). Krishnamurthy S.L, P.C. Sharma, D. Burman, S.K. Sarangi, S. Mandal, Vinay Kumar Mishra and Y.P. Singh)- BMGF
2. Intellectual property management transfer/commercialization of agricultural technologies renamed as NAIF. (Parveen Kumar, Anita Mann, Rakesh Banyal, Raju R. and Bhaskar Narjary) – ICAR
3. NRMACSSRICOP201500400880. Climate change mitigation and adaptation strategies for salt affected soils. (Ajay K. Bhardwaj, Ranbir Singh, R.K. Singh, Rakesh Banyal, R.K. Fagodiya, U.K. Mandal, Shishir Raut, K.K. Mahanta and V.K. Mishra )-NICRA, ICAR
4. NRMACSSRISOL201501600892 Molecular genetic analysis of resistance/tolerance in rice, . wheat, chickpea and mustard including sheath blight complex genomics. [(Rice: component 1): Krishnamurthy, S.L. and P.C. Sharma, (Chickpea: component 3): P.C. Sharma, Anita Mann and Jogendra Singh, (Mustard: component 4): P.C. Sharma, Jogendra Singh and Vijayata Singh)] – ICAR, New Delhi
5. NRMACSSRISOL201502200898. CRP on Conservation Agriculture 'Productive utilization of salt affected soils through conservation agriculture”. (Ranbir Singh, Arvind Kumar Rai, Parvender and Aslam Latif Pathan)-ICAR
6. NRMACSSRISOL201601500913. Strategic Research Platform on Climate Smart Agriculture “Developing and de�ning climate smart agricultural practices portfolios in South Asia”. (P.C. Sharma, Ashim Datta and Madhu Chaudhary) ICAR-CCAFS
7. NRMACSSRISOL201601600914. Perceived climatic variability & agricultural adaptations by material resource-poor farmers in salt affected agro-ecosystems: Implications for food & livelihood security. [Ranjay K. Singh, Anshuman Singh, Satyendra Kumar, Pervender and Dheeraj Singh, KVK, Pali (CAZRI)]-ICAR
8. NRMACSSRISOL201601800916. Efficient groundwater management for enhancing adaptive capacity to climate change in sugarcane based farming system. [Satyendra Kumar(CCPI) and Aslam Latif Pathan]-ICAR
9. NRMACSSRISOL201602000918. CRP on water “Evaluation of Irrigation System and Improvement Strategies for Higher Water Productivity in Canal Command”. (Chhedi Lal Verma, A.K. Singh, Dr. Y.P. Singh, Sanjay Arora, T. Damodaran, V. K. Mishra S.K. Jha and C.S. Singh)
242
List
of O
n-go
ing
Proj
ects
A
nnua
l Rep
ort 2
018-
19
10. NRMACSSRICOP201602100919. CRP on water “Groundwater contamination due to geogenic factors and industrial effluents and its impact on food chain” (Anil R. Chinchmalatpure, David Camus D. and Shrvan Kumar)-ICAR
11. NRMACSSRICOP201602200920. Cropping System intensi�cation in the salt-affected coastal zones of Bangladesh and West Bengal, India (LWR/2014/73/KGF). (S. K. Sarangi, D. Burman, U. K. Mandal, Subhasis Mandal and K.K. Mahanta)- . ACIAR
12. NRMACSSRICOP201602300921. Piloting and up-scaling an innovative underground approach for mitigating urban �oods and improving rural water security in South Asia (V.K. Mishra, C.L. Verma and S.K. Jha) –IWMI
13. NRMACSSRICOL201602400922. Developing the alternate strategies for reclamation of sodic soils. [Arvind Kumar Rai, Nirmalendu Basak, R. L. Meena, R. K. Yadav, P.C. Sharma, Parul Sundha, S.K. Jha and U.R. Khandkar, AICRP (MSUSWA), Indore]- RIL
14. NRMACSSRISOL201602500923.Mineral nutrient diagnostic and site speci�c nutrient management demonstrations to improve agricultural productivity of salt affected soils in Haryana.(Anita Mann, R.K Yadav, Parvender, Ashwani Kumar and B.L. Meena) -RKVY
15. NRMACSSRISOL201602600924. Empowering farmers through selective interventions in salt affected agroecosystems of Ghaghar Plains. {(Parvender, R.K. Singh, Satyendra Kumar, Arvind Kumar, R. Raju, Arijit Burman, Kailash Prajapat, Dar Jaffer Yusuf and K. Punnusamy (NDRI)}- Farmer FIRST ICAR
16. NRMACSSRICOL201701600940. Developing low cost ameliorating amendments for reclamation of sodic soils by suing municipal solid waste. (Gajender, R.K. Yadav, Madhu Choudhary, Bhaskar Narjary, Ashim Datta and Parul Sundha) -DST
17. NRMACSSRICOL201701700941. Potential gene mining from salt tolerant grasses for improvement of stress tolerance in crops. {(Anita Mann, Ashwani Kumar, Arvind Kumar, B.L. Meena, Monendra Grover & D.C. Mishra (IASRI, New Delhi), and Parameswaran C. (NRRI, Cuttack)}-NASF-ICAR
18. NRMACSSRICOL201701800942. Developing alternatives to gypsum using nanotechnology-based approaches for efficient and cost-effective reclamation of sodic soils. (Ajay Kumar Bhardwaj)-LBS Award
19. NRMACSSRICOL201701900943. Agricultural livelihood in Eastern coastal region of India under climate and environmental Risk (Subhasis Mandal) --LBS Award project
20. NRMACSSRICOL201702000944. Phyto-remediation potential of selected halophytes for salt affected lands of Haryana. (Ashwani Kumar, Arvind Kumar, B.L. Meena and Anita Mann) –RKVY
21. NRMACSSRICOL201702100945. Identi�cation of salt tolerant scion and rootstocks in mango and low chill temperate fruits. (Rajkumar, Anshuman Singh, Ashwani Kumar, R.K. Yadav and P.C. Sharma)- RKVY
22. NRMACSSRICOL201702200946. CRP on Agro-Biodiversity- Sub. Project 1. Characterization, Multiplication and evaluation for important biotic and abiotic traits of plant genetic resources of selected crops (NBPGR) Component II (Biotic and abiotic evaluation) under sub-project-I (Arvind Kumar and P.C. Sharma)-ICAR
23. NRMACSSRICOL201702300947. Network project on Functional Genomics and genetic modi�cation in crops (NPFGGM) salt tolerance in rice. (S.L. Krishnamurthy and P.C. Sharma) – ICAR- NPTC, New Delhi
24. NRMACSSRICOL201702400948. CRP on Agro-Biodiversity—Component 2 -Evaluation of rice germplasm accessions against biotic/abiotic stresses. (Krishnamurthy S.L. and P.C. Sharma)-ICAR
25. NRMACSSRICOL201702500949. Development of High Zinc rice varieties.(Krishnamurthy S.L. and P.C. Sharma)-IRRI
26. NRMACSSRISIL201600200900. Impact of Eucalyptus plantations in waterlogged saline ecologies in Indo Gangetic plains. (R. Banyal, Ajay K. Bhardwaj, R.K. Singh, Gajender and Ashlam Latif Pathan)
243
27. NRMACSSRICOL201702600950. HOPP Project “Technical guidance on monitoring & evaluation of large scale SSD projects in Haryana”{Team Leader: PC Sharma, D.S. Bundela (PI) Team A: Satyendra Kumar, Aslam Pathan, Arijit Barman and Kailash Prajapat and Team B: R.L. Meena, Bhaskar Narjary, R. Raju, and Rahul Singh Tolia, R.K. Fagodiya, Raj Mukhopadhyay and Dar Jaffer Yusuf)
28. NRMACSSRICOL201702700951. Network project on AMAAS “Harnessing the rhizosphere diversity with dynamic substrate to inccduce tolerance to biotic and biotic stress for commercial cultivation of agri-horticultural crops in partially reclaimed sodic soils. (T. Damodaran, V.K. Mishra and S.K. Jha)
29. NRMACSSRICOL201702800952. Management of harvested rainwater for enhancing water productivity and revival of village pond through scienti�c interventions in saline vertisol area of Gujarat. (Anil R. Chinchmalatpure, Shrvan Kumar and Sagar Vibhute D.)-DST
30. NRMACSSRICOL201801000963. Assessing potential of microbial enriched municipal solid waste compost for improving soil health and sustaining productivity of sodic soils. (Y.P. Singh, Sanjay Arora, V.K. Mishra and Atul K. Singh)- CST,UP
31. NRMACSSRISOL201801200964. From QTL to Variety: Genomics assisted introgression and �eld evaluation of rice varieties with genes/QTLs for yield under Drought, Flood and Salt stress. (Krishnamurthy S.L. and P.C. Sharma)
32. NRMACSSRISOL201801300965. Development of sustainable resource management systems in water vulnerable regions of India. ( (Team Leader; P.C. Sharma, Dr. R.K. Yadav (PI), D.S. Bundela, Satyendra Kumar, Bhaskar Narjary, Gajender and A.K. Rai) Funded by ICAR-JIRCAS, Japan
33. NRMACSSRISOL201801600968. Development of Energy Efficient and Environment Protective Aquaculture Technologies for Degraded Soil. (D.S. Bundela, Raj Mukhopadhyay and Dar Jaffer Yusuf ) (Funded by NAHEP) Lead Center is CIFE Mumbai.
34. NRMACSSRISOL201802000972. Identi�cation of traits, genes, physiological mechanisms to develop climate smart varieties for unfavourable environment. (Krishnamurthy S.L. and P.C. Sharma) -ICAR-IRRI
Collaborative Projects
1. Land use options for enhancing productivity and improving livelihood in Bali Island of Sundarbans. [(S. Mandal) (NBSSLUP-Kolkata, CSSRI, RRS-Canning Town and CIFA – Kalyani)]
2. Characterization and mining genetic variability in sugarcane germplasm against abiotic stress (Salinity/Alkalinity and low temperature) under subtropical India (Karnal). [(Ashwani Kumar, Co-PI) collaboration with ICAR-SBI,RRS, Karnal)]
3. Exploration of medicinal and aromatic plants cultivation under different cropping systems and on marginal and degraded lands of semi-arid regions of India. {(Anil R. Chinchmalatpure, Co-PI) collaboration with ICAR-DMAPR, Anand, Gujarat)
4. Studies on bio-optical response of rice genotypes under varying levels of soil salinity [T. D. Lama, S.K. Sarangi and K. Chandrasekar (NRSA-Regional Remote Sensing Centre – East, Kolkata)]-ISRO
Consultancy
1. Subsurface Drainage for Heavy Soils of Maharashtra, Karnataka, Gujarat, AP & Telangana (Team Leader: Dr. PC Sharma DS Bundela (PI), Satyendra Kumar, Anil Chinchmalatpure, R. Raju, Aslam Pathan, Sagar Vibhute and Rahul Singh Tolia )
2. Evaluation of BAYER rice hybrids under salinity stress phase II. (P.C. Sharma and Krishnamurthy, S.L.)
244
List
of O
n-go
ing
Proj
ects
A
nnua
l Rep
ort 2
018-
19
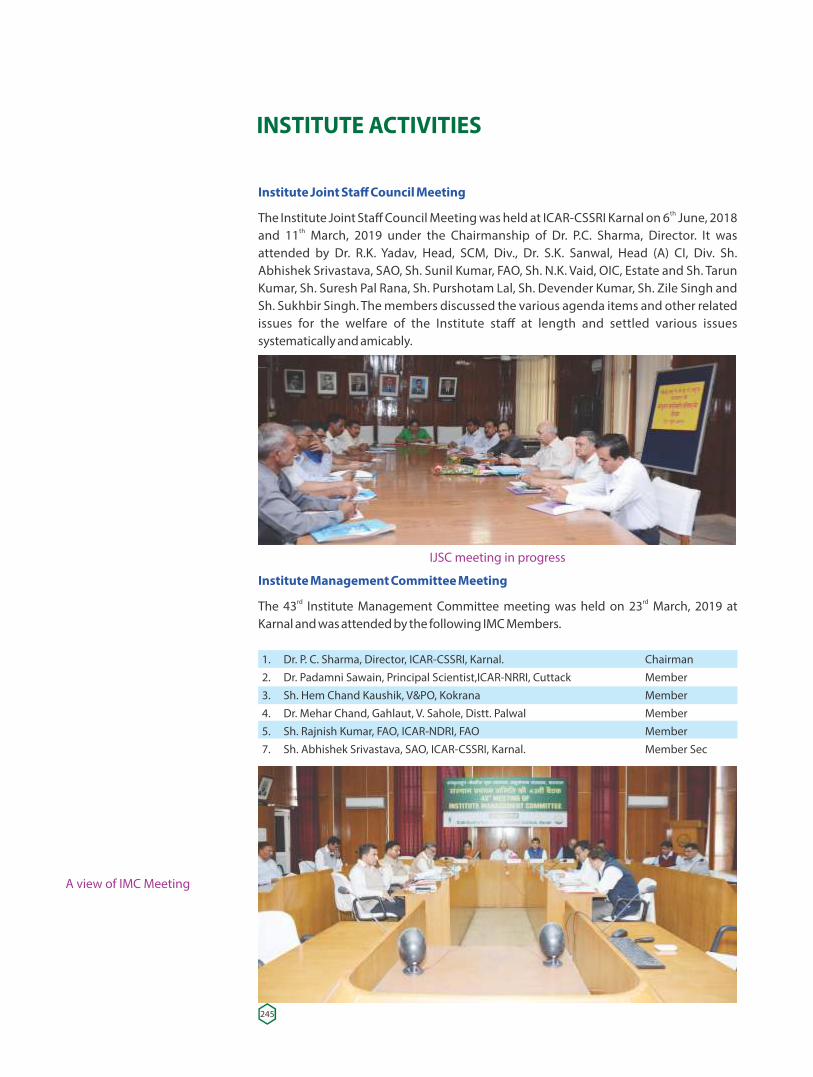
INSTITUTE ACTIVITIES
Institute Joint Staff Council MeetingthThe Institute Joint Staff Council Meeting was held at ICAR-CSSRI Karnal on 6 June, 2018
thand 11 March, 2019 under the Chairmanship of Dr. P.C. Sharma, Director. It was attended by Dr. R.K. Yadav, Head, SCM, Div., Dr. S.K. Sanwal, Head (A) CI, Div. Sh. Abhishek Srivastava, SAO, Sh. Sunil Kumar, FAO, Sh. N.K. Vaid, OIC, Estate and Sh. Tarun Kumar, Sh. Suresh Pal Rana, Sh. Purshotam Lal, Sh. Devender Kumar, Sh. Zile Singh and Sh. Sukhbir Singh. The members discussed the various agenda items and other related issues for the welfare of the Institute staff at length and settled various issues systematically and amicably.
IJSC meeting in progress
Institute Management Committee Meetingrd rdThe 43 Institute Management Committee meeting was held on 23 March, 2019 at
Karnal and was attended by the following IMC Members.
1. Dr. P. C. Sharma, Director, ICAR-CSSRI, Karnal. Chairman2. Dr. Padamni Sawain, Principal Scientist,ICAR-NRRI, Cuttack Member3. Sh. Hem Chand Kaushik, V&PO, Kokrana Member4. Dr. Mehar Chand, Gahlaut, V. Sahole, Distt. Palwal Member5. Sh. Rajnish Kumar, FAO, ICAR-NDRI, FAO Member7. Sh. Abhishek Srivastava, SAO, ICAR-CSSRI, Karnal. Member Sec
A view of IMC Meeting
245
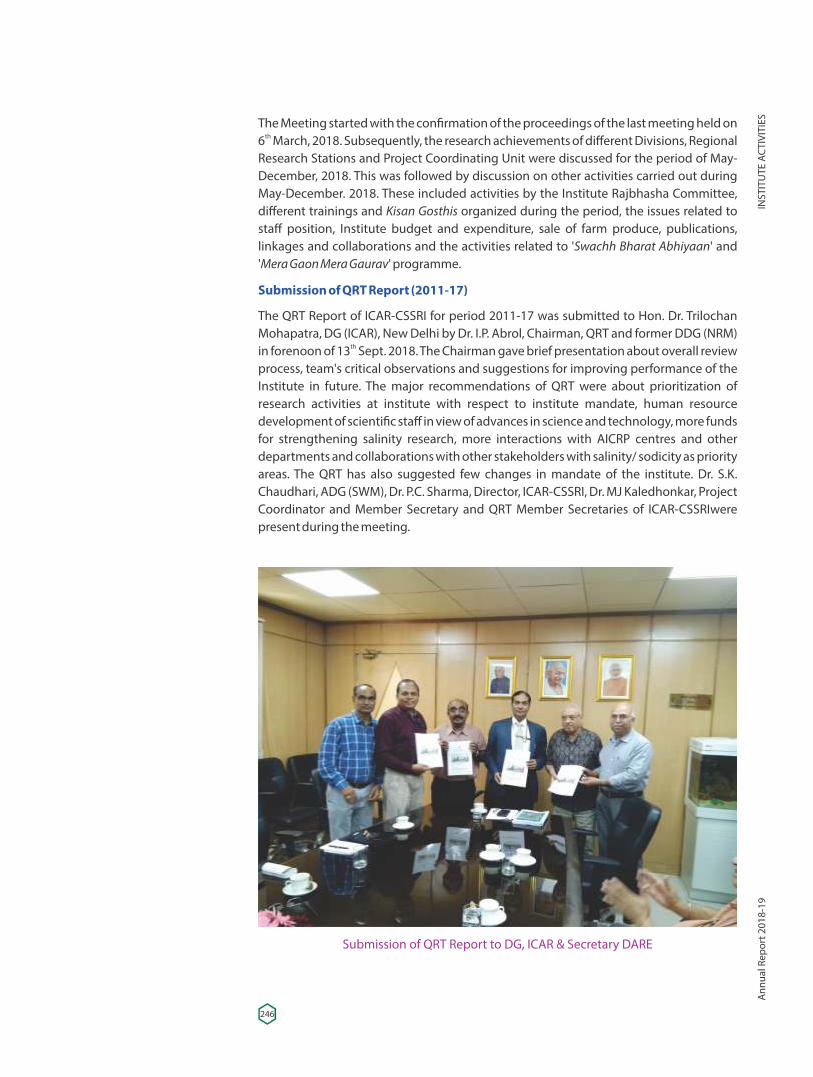
The Meeting started with the con�rmation of the proceedings of the last meeting held on th6 March, 2018. Subsequently, the research achievements of different Divisions, Regional
Research Stations and Project Coordinating Unit were discussed for the period of May-December, 2018. This was followed by discussion on other activities carried out during May-December. 2018. These included activities by the Institute Rajbhasha Committee, different trainings and Kisan Gosthis organized during the period, the issues related to staff position, Institute budget and expenditure, sale of farm produce, publications, linkages and collaborations and the activities related to 'Swachh Bharat Abhiyaan' and 'Mera Gaon Mera Gaurav' programme.
Submission of QRT Report (2011-17)
The QRT Report of ICAR-CSSRI for period 2011-17 was submitted to Hon. Dr. Trilochan Mohapatra, DG (ICAR), New Delhi by Dr. I.P. Abrol, Chairman, QRT and former DDG (NRM)
thin forenoon of 13 Sept. 2018. The Chairman gave brief presentation about overall review process, team's critical observations and suggestions for improving performance of the Institute in future. The major recommendations of QRT were about prioritization of research activities at institute with respect to institute mandate, human resource development of scienti�c staff in view of advances in science and technology, more funds for strengthening salinity research, more interactions with AICRP centres and other departments and collaborations with other stakeholders with salinity/ sodicity as priority areas. The QRT has also suggested few changes in mandate of the institute. Dr. S.K. Chaudhari, ADG (SWM), Dr. P.C. Sharma, Director, ICAR-CSSRI, Dr. MJ Kaledhonkar, Project Coordinator and Member Secretary and QRT Member Secretaries of ICAR-CSSRIwere present during the meeting.
Submission of QRT Report to DG, ICAR & Secretary DARE
246
INST
ITU
TE A
CTI
VITI
ESA
nnua
l Rep
ort 2
018-
19
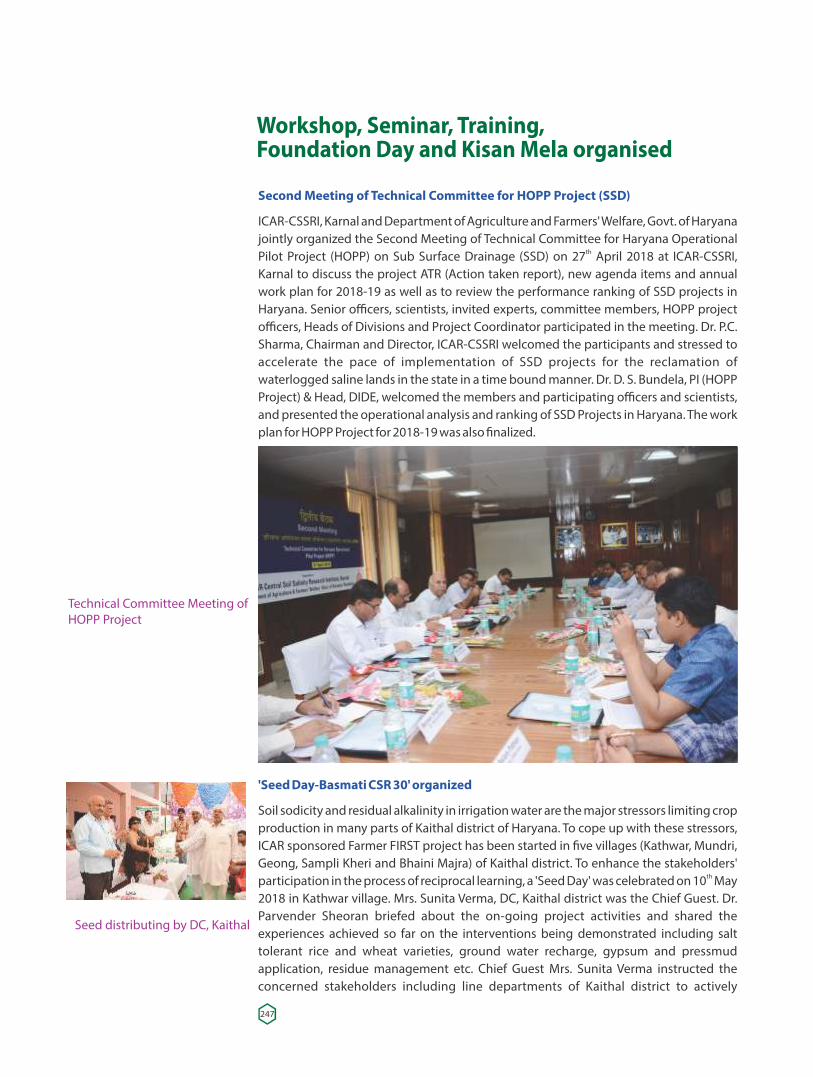
Second Meeting of Technical Committee for HOPP Project (SSD)
ICAR-CSSRI, Karnal and Department of Agriculture and Farmers' Welfare, Govt. of Haryana jointly organized the Second Meeting of Technical Committee for Haryana Operational
thPilot Project (HOPP) on Sub Surface Drainage (SSD) on 27 April 2018 at ICAR-CSSRI, Karnal to discuss the project ATR (Action taken report), new agenda items and annual work plan for 2018-19 as well as to review the performance ranking of SSD projects in Haryana. Senior officers, scientists, invited experts, committee members, HOPP project officers, Heads of Divisions and Project Coordinator participated in the meeting. Dr. P.C. Sharma, Chairman and Director, ICAR-CSSRI welcomed the participants and stressed to accelerate the pace of implementation of SSD projects for the reclamation of waterlogged saline lands in the state in a time bound manner. Dr. D. S. Bundela, PI (HOPP Project) & Head, DIDE, welcomed the members and participating officers and scientists, and presented the operational analysis and ranking of SSD Projects in Haryana. The work plan for HOPP Project for 2018-19 was also �nalized.
'Seed Day-Basmati CSR 30' organized
Soil sodicity and residual alkalinity in irrigation water are the major stressors limiting crop production in many parts of Kaithal district of Haryana. To cope up with these stressors, ICAR sponsored Farmer FIRST project has been started in �ve villages (Kathwar, Mundri, Geong, Sampli Kheri and Bhaini Majra) of Kaithal district. To enhance the stakeholders'
thparticipation in the process of reciprocal learning, a 'Seed Day' was celebrated on 10 May 2018 in Kathwar village. Mrs. Sunita Verma, DC, Kaithal district was the Chief Guest. Dr. Parvender Sheoran briefed about the on-going project activities and shared the experiences achieved so far on the interventions being demonstrated including salt tolerant rice and wheat varieties, ground water recharge, gypsum and pressmud application, residue management etc. Chief Guest Mrs. Sunita Verma instructed the concerned stakeholders including line departments of Kaithal district to actively
Workshop, Seminar, Training,Foundation Day and Kisan Mela organised
Seed distributing by DC, Kaithal
Technical Committee Meeting ofHOPP Project
247
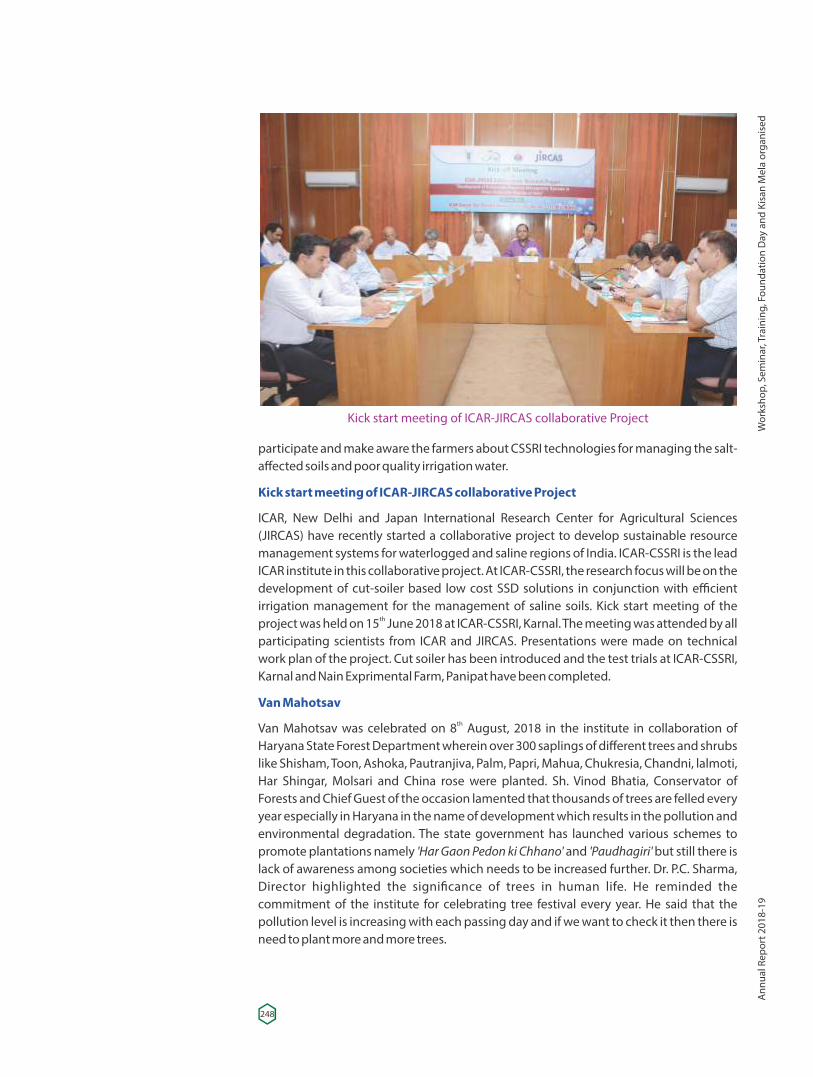
participate and make aware the farmers about CSSRI technologies for managing the salt-affected soils and poor quality irrigation water.
Kick start meeting of ICAR-JIRCAS collaborative Project
ICAR, New Delhi and Japan International Research Center for Agricultural Sciences (JIRCAS) have recently started a collaborative project to develop sustainable resource management systems for waterlogged and saline regions of India. ICAR-CSSRI is the lead ICAR institute in this collaborative project. At ICAR-CSSRI, the research focus will be on the development of cut-soiler based low cost SSD solutions in conjunction with efficient irrigation management for the management of saline soils. Kick start meeting of the
thproject was held on 15 June 2018 at ICAR-CSSRI, Karnal. The meeting was attended by all participating scientists from ICAR and JIRCAS. Presentations were made on technical work plan of the project. Cut soiler has been introduced and the test trials at ICAR-CSSRI, Karnal and Nain Exprimental Farm, Panipat have been completed.
Van Mahotsav thVan Mahotsav was celebrated on 8 August, 2018 in the institute in collaboration of
Haryana State Forest Department wherein over 300 saplings of different trees and shrubs like Shisham, Toon, Ashoka, Pautranjiva, Palm, Papri, Mahua, Chukresia, Chandni, lalmoti, Har Shingar, Molsari and China rose were planted. Sh. Vinod Bhatia, Conservator of Forests and Chief Guest of the occasion lamented that thousands of trees are felled every year especially in Haryana in the name of development which results in the pollution and environmental degradation. The state government has launched various schemes to promote plantations namely 'Har Gaon Pedon ki Chhano' and 'Paudhagiri' but still there is lack of awareness among societies which needs to be increased further. Dr. P.C. Sharma, Director highlighted the signi�cance of trees in human life. He reminded the commitment of the institute for celebrating tree festival every year. He said that the pollution level is increasing with each passing day and if we want to check it then there is need to plant more and more trees.
Kick start meeting of ICAR-JIRCAS collaborative Project
248
Wor
ksho
p, S
emin
ar, T
rain
ing,
Fou
ndat
ion
Day
and
Kis
an M
ela
orga
nise
dA
nnua
l Rep
ort 2
018-
19
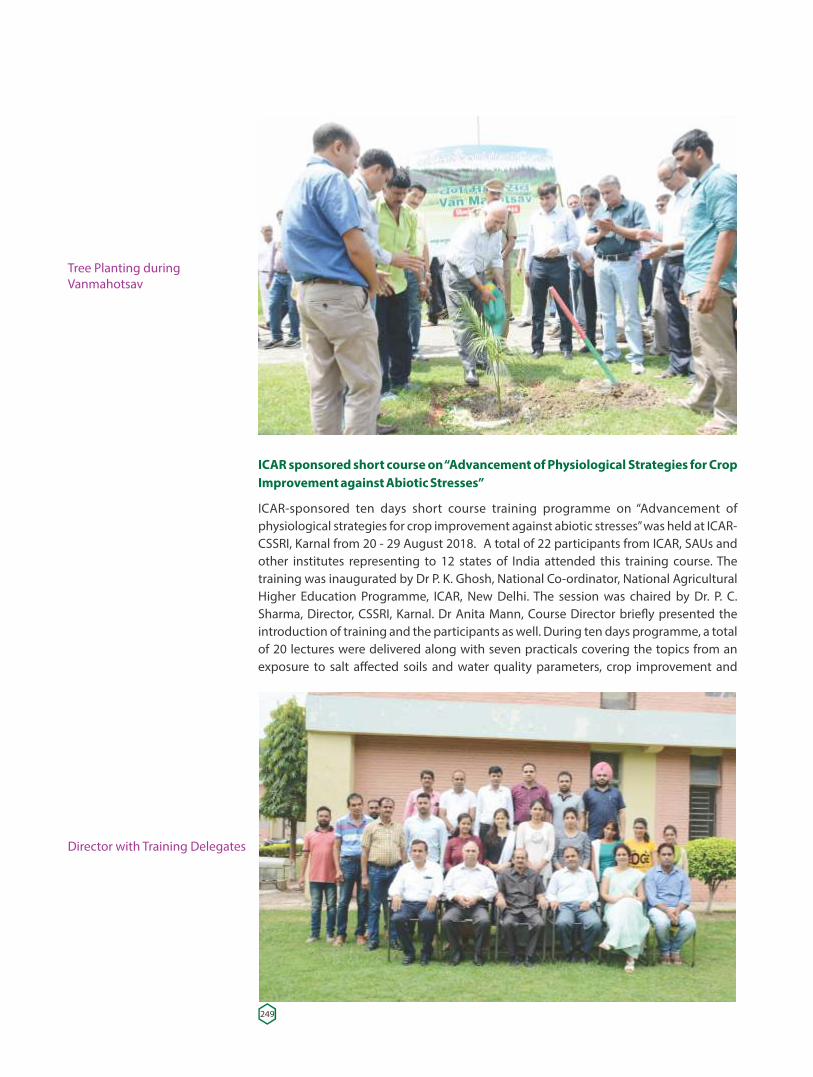
ICAR sponsored short course on “Advancement of Physiological Strategies for Crop Improvement against Abiotic Stresses”
ICAR-sponsored ten days short course training programme on “Advancement of physiological strategies for crop improvement against abiotic stresses” was held at ICAR-CSSRI, Karnal from 20 - 29 August 2018. A total of 22 participants from ICAR, SAUs and other institutes representing to 12 states of India attended this training course. The training was inaugurated by Dr P. K. Ghosh, National Co-ordinator, National Agricultural Higher Education Programme, ICAR, New Delhi. The session was chaired by Dr. P. C. Sharma, Director, CSSRI, Karnal. Dr Anita Mann, Course Director brie�y presented the introduction of training and the participants as well. During ten days programme, a total of 20 lectures were delivered along with seven practicals covering the topics from an exposure to salt affected soils and water quality parameters, crop improvement and
Tree Planting duringVanmahotsav
Director with Training Delegates
249
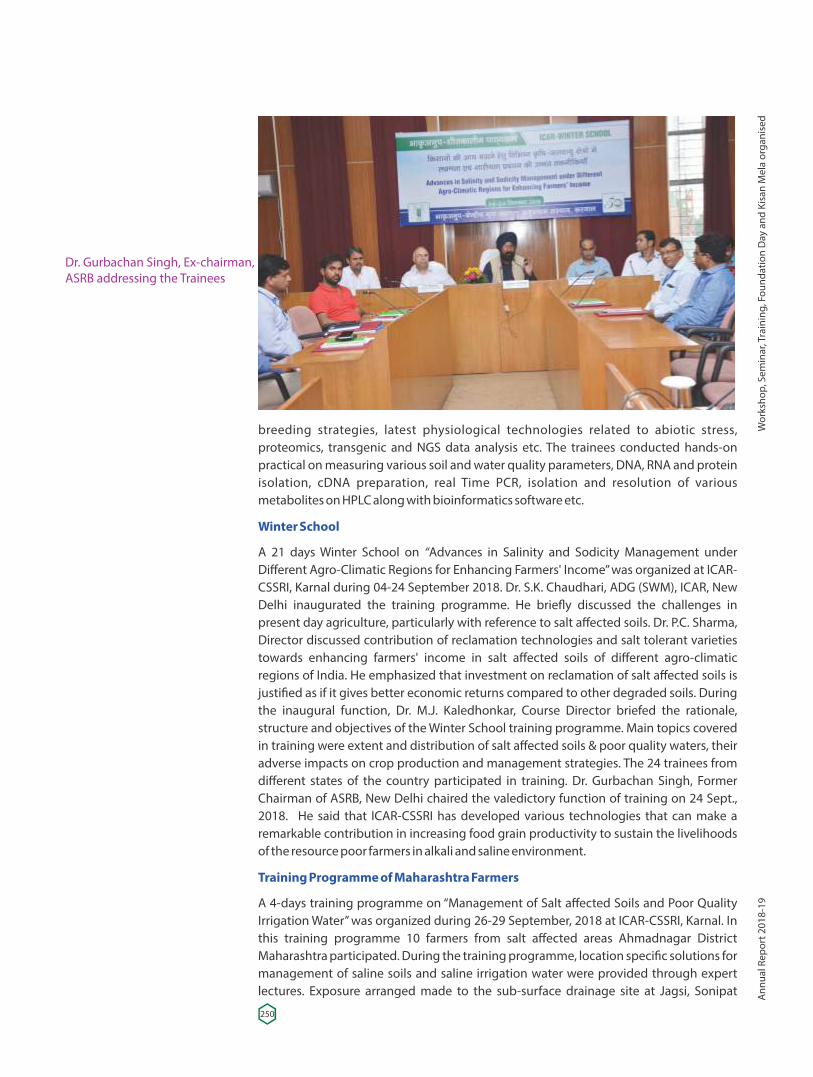
breeding strategies, latest physiological technologies related to abiotic stress, proteomics, transgenic and NGS data analysis etc. The trainees conducted hands-on practical on measuring various soil and water quality parameters, DNA, RNA and protein isolation, cDNA preparation, real Time PCR, isolation and resolution of various metabolites on HPLC along with bioinformatics software etc.
Winter School
A 21 days Winter School on “Advances in Salinity and Sodicity Management under Different Agro-Climatic Regions for Enhancing Farmers' Income” was organized at ICAR-CSSRI, Karnal during 04-24 September 2018. Dr. S.K. Chaudhari, ADG (SWM), ICAR, New Delhi inaugurated the training programme. He brie�y discussed the challenges in present day agriculture, particularly with reference to salt affected soils. Dr. P.C. Sharma, Director discussed contribution of reclamation technologies and salt tolerant varieties towards enhancing farmers' income in salt affected soils of different agro-climatic regions of India. He emphasized that investment on reclamation of salt affected soils is justi�ed as if it gives better economic returns compared to other degraded soils. During the inaugural function, Dr. M.J. Kaledhonkar, Course Director briefed the rationale, structure and objectives of the Winter School training programme. Main topics covered in training were extent and distribution of salt affected soils & poor quality waters, their adverse impacts on crop production and management strategies. The 24 trainees from different states of the country participated in training. Dr. Gurbachan Singh, Former Chairman of ASRB, New Delhi chaired the valedictory function of training on 24 Sept., 2018. He said that ICAR-CSSRI has developed various technologies that can make a remarkable contribution in increasing food grain productivity to sustain the livelihoods of the resource poor farmers in alkali and saline environment.
Training Programme of Maharashtra Farmers
A 4-days training programme on “Management of Salt affected Soils and Poor Quality Irrigation Water” was organized during 26-29 September, 2018 at ICAR-CSSRI, Karnal. In this training programme 10 farmers from salt affected areas Ahmadnagar District Maharashtra participated. During the training programme, location speci�c solutions for management of saline soils and saline irrigation water were provided through expert lectures. Exposure arranged made to the sub-surface drainage site at Jagsi, Sonipat
Dr. Gurbachan Singh, Ex-chairman,ASRB addressing the Trainees
250
Wor
ksho
p, S
emin
ar, T
rain
ing,
Fou
ndat
ion
Day
and
Kis
an M
ela
orga
nise
dA
nnua
l Rep
ort 2
018-
19
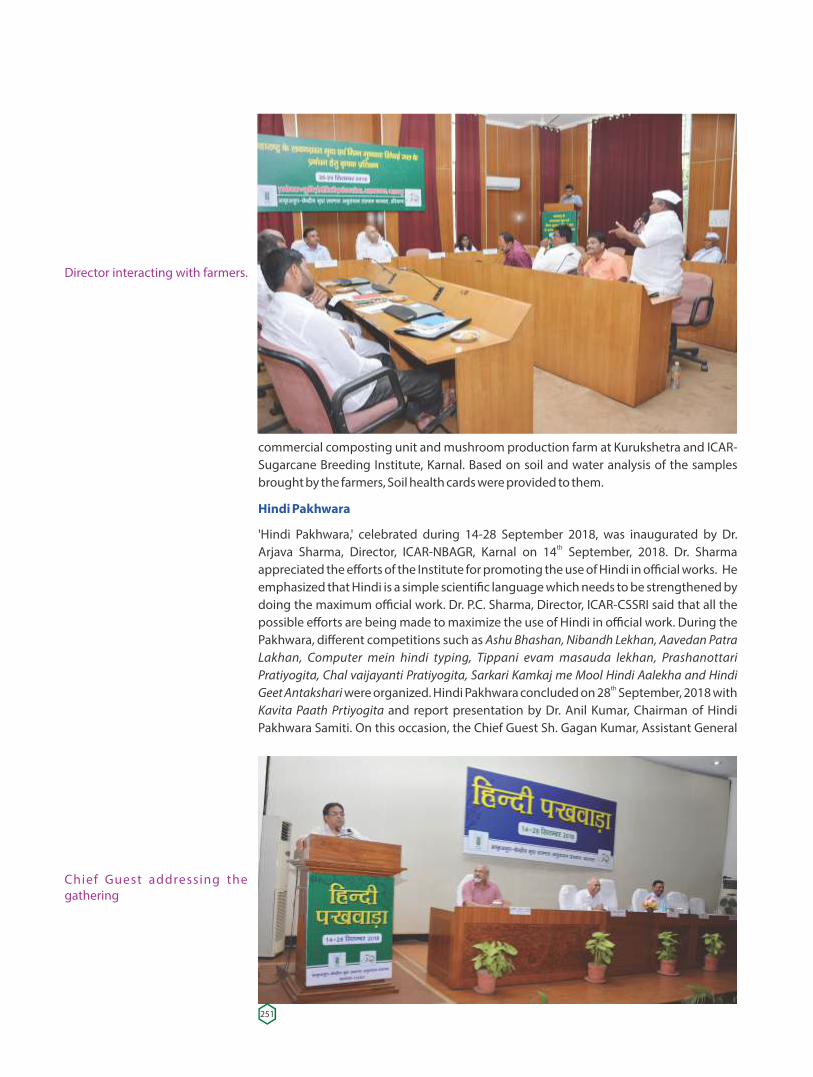
commercial composting unit and mushroom production farm at Kurukshetra and ICAR- Sugarcane Breeding Institute, Karnal. Based on soil and water analysis of the samples brought by the farmers, Soil health cards were provided to them.
Hindi Pakhwara
'Hindi Pakhwara,' celebrated during 14-28 September 2018, was inaugurated by Dr. thArjava Sharma, Director, ICAR-NBAGR, Karnal on 14 September, 2018. Dr. Sharma
appreciated the efforts of the Institute for promoting the use of Hindi in official works. He emphasized that Hindi is a simple scienti�c language which needs to be strengthened by doing the maximum official work. Dr. P.C. Sharma, Director, ICAR-CSSRI said that all the possible efforts are being made to maximize the use of Hindi in official work. During the Pakhwara, different competitions such as Ashu Bhashan, Nibandh Lekhan, Aavedan Patra Lakhan, Computer mein hindi typing, Tippani evam masauda lekhan, Prashanottari Pratiyogita, Chal vaijayanti Pratiyogita, Sarkari Kamkaj me Mool Hindi Aalekha and Hindi
thGeet Antakshari were organized. Hindi Pakhwara concluded on 28 September, 2018 with Kavita Paath Prtiyogita and report presentation by Dr. Anil Kumar, Chairman of Hindi Pakhwara Samiti. On this occasion, the Chief Guest Sh. Gagan Kumar, Assistant General
Director interacting with farmers.
Chief Guest addressing the gathering
251
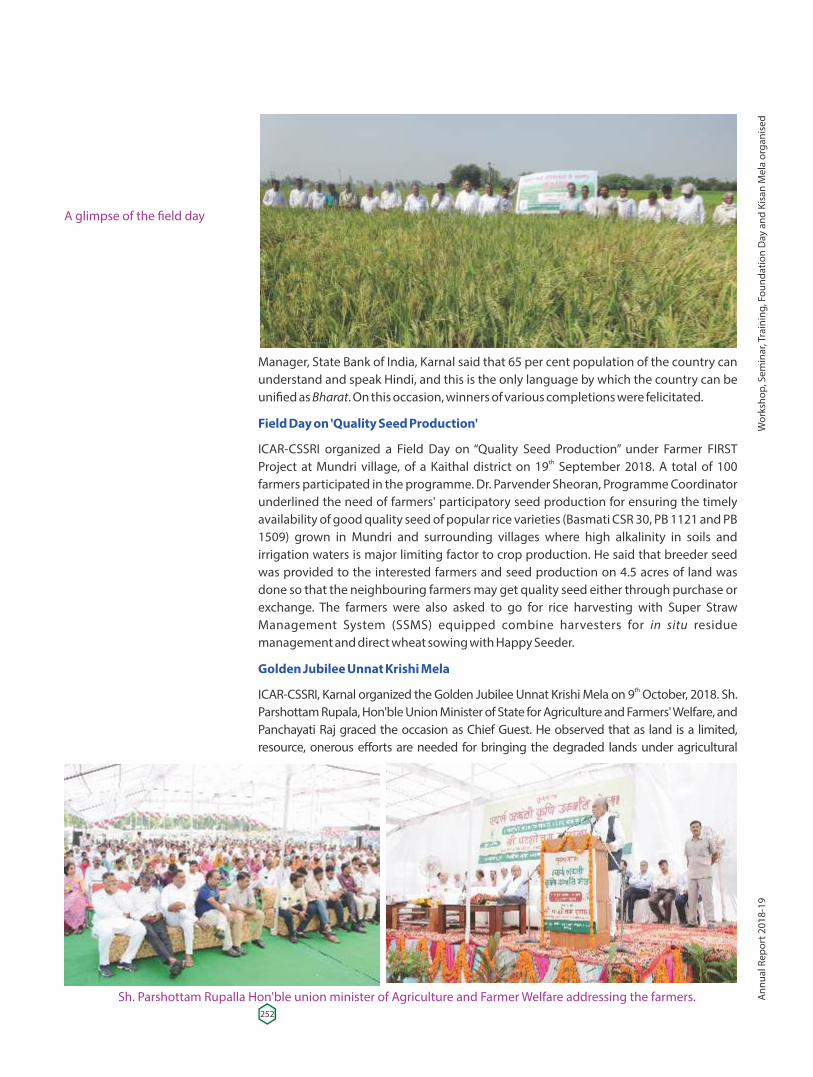
Manager, State Bank of India, Karnal said that 65 per cent population of the country can understand and speak Hindi, and this is the only language by which the country can be uni�ed as Bharat. On this occasion, winners of various completions were felicitated.
Field Day on 'Quality Seed Production'
ICAR-CSSRI organized a Field Day on “Quality Seed Production” under Farmer FIRST thProject at Mundri village, of a Kaithal district on 19 September 2018. A total of 100
farmers participated in the programme. Dr. Parvender Sheoran, Programme Coordinator underlined the need of farmers' participatory seed production for ensuring the timely availability of good quality seed of popular rice varieties (Basmati CSR 30, PB 1121 and PB 1509) grown in Mundri and surrounding villages where high alkalinity in soils and irrigation waters is major limiting factor to crop production. He said that breeder seed was provided to the interested farmers and seed production on 4.5 acres of land was done so that the neighbouring farmers may get quality seed either through purchase or exchange. The farmers were also asked to go for rice harvesting with Super Straw Management System (SSMS) equipped combine harvesters for in situ residue management and direct wheat sowing with Happy Seeder.
Golden Jubilee Unnat Krishi MelathICAR-CSSRI, Karnal organized the Golden Jubilee Unnat Krishi Mela on 9 October, 2018. Sh.
Parshottam Rupala, Hon'ble Union Minister of State for Agriculture and Farmers' Welfare, and Panchayati Raj graced the occasion as Chief Guest. He observed that as land is a limited, resource, onerous efforts are needed for bringing the degraded lands under agricultural
A glimpse of the �eld day
Sh. Parshottam Rupalla Hon'ble union minister of Agriculture and Farmer Welfare addressing the farmers.252
Wor
ksho
p, S
emin
ar, T
rain
ing,
Fou
ndat
ion
Day
and
Kis
an M
ela
orga
nise
dA
nnua
l Rep
ort 2
018-
19
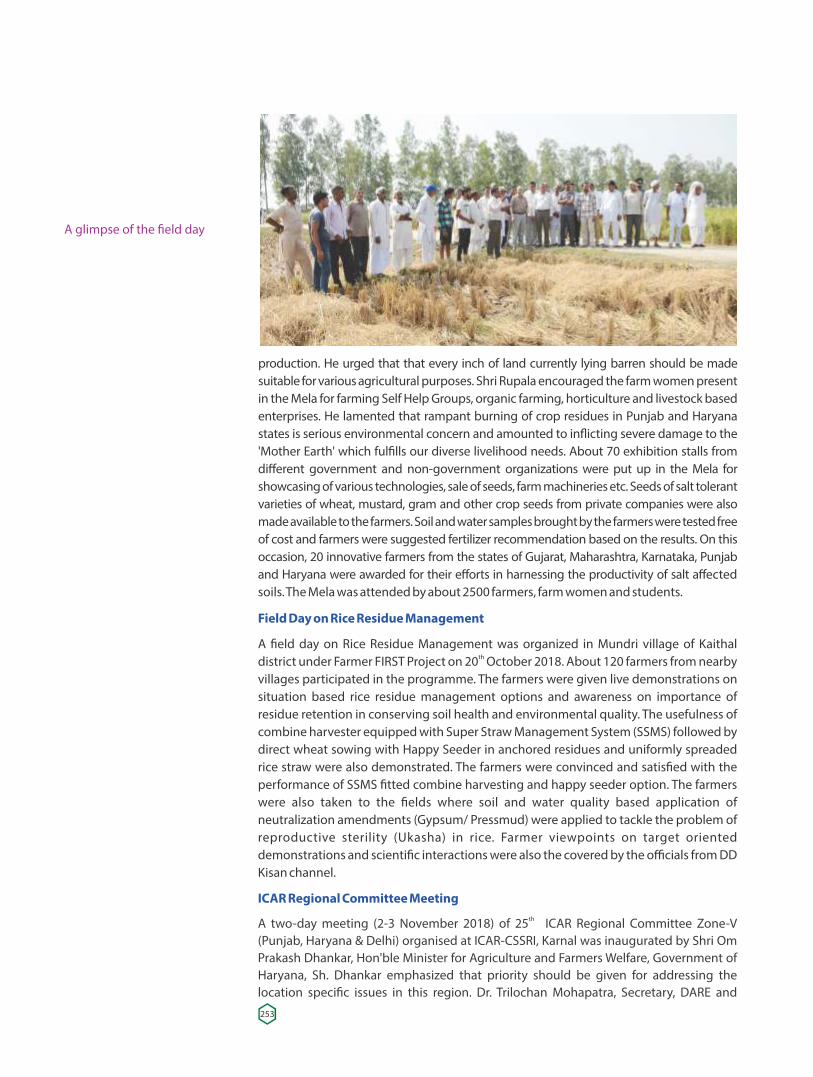
production. He urged that that every inch of land currently lying barren should be made suitable for various agricultural purposes. Shri Rupala encouraged the farm women present in the Mela for farming Self Help Groups, organic farming, horticulture and livestock based enterprises. He lamented that rampant burning of crop residues in Punjab and Haryana states is serious environmental concern and amounted to in�icting severe damage to the 'Mother Earth' which ful�lls our diverse livelihood needs. About 70 exhibition stalls from different government and non-government organizations were put up in the Mela for showcasing of various technologies, sale of seeds, farm machineries etc. Seeds of salt tolerant varieties of wheat, mustard, gram and other crop seeds from private companies were also made available to the farmers. Soil and water samples brought by the farmers were tested free of cost and farmers were suggested fertilizer recommendation based on the results. On this occasion, 20 innovative farmers from the states of Gujarat, Maharashtra, Karnataka, Punjab and Haryana were awarded for their efforts in harnessing the productivity of salt affected soils. The Mela was attended by about 2500 farmers, farm women and students.
Field Day on Rice Residue Management
A �eld day on Rice Residue Management was organized in Mundri village of Kaithal thdistrict under Farmer FIRST Project on 20 October 2018. About 120 farmers from nearby
villages participated in the programme. The farmers were given live demonstrations on situation based rice residue management options and awareness on importance of residue retention in conserving soil health and environmental quality. The usefulness of combine harvester equipped with Super Straw Management System (SSMS) followed by direct wheat sowing with Happy Seeder in anchored residues and uniformly spreaded rice straw were also demonstrated. The farmers were convinced and satis�ed with the performance of SSMS �tted combine harvesting and happy seeder option. The farmers were also taken to the �elds where soil and water quality based application of neutralization amendments (Gypsum/ Pressmud) were applied to tackle the problem of reproductive sterility (Ukasha) in rice. Farmer viewpoints on target oriented demonstrations and scienti�c interactions were also the covered by the officials from DD Kisan channel.
ICAR Regional Committee MeetingthA two-day meeting (2-3 November 2018) of 25 ICAR Regional Committee Zone-V
(Punjab, Haryana & Delhi) organised at ICAR-CSSRI, Karnal was inaugurated by Shri Om Prakash Dhankar, Hon'ble Minister for Agriculture and Farmers Welfare, Government of Haryana, Sh. Dhankar emphasized that priority should be given for addressing the location speci�c issues in this region. Dr. Trilochan Mohapatra, Secretary, DARE and
A glimpse of the �eld day
253
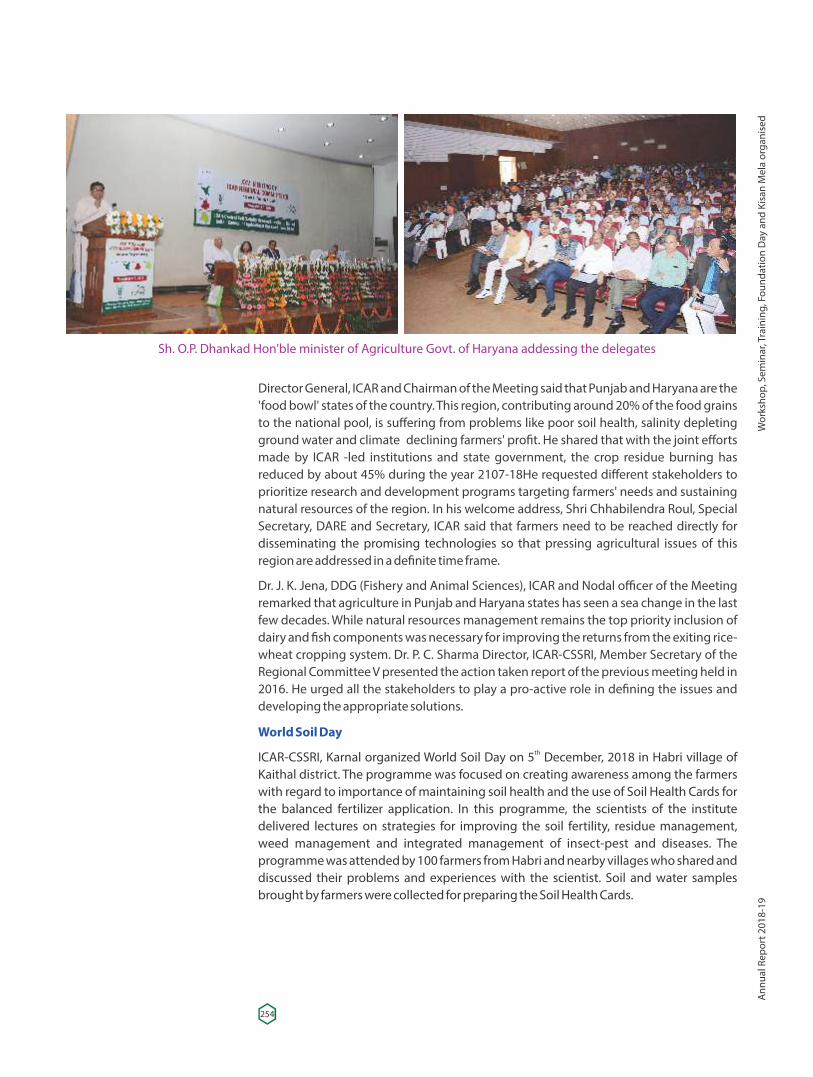
Director General, ICAR and Chairman of the Meeting said that Punjab and Haryana are the 'food bowl' states of the country. This region, contributing around 20% of the food grains to the national pool, is suffering from problems like poor soil health, salinity depleting ground water and climate declining farmers' pro�t. He shared that with the joint efforts made by ICAR -led institutions and state government, the crop residue burning has reduced by about 45% during the year 2107-18He requested different stakeholders to prioritize research and development programs targeting farmers' needs and sustaining natural resources of the region. In his welcome address, Shri Chhabilendra Roul, Special Secretary, DARE and Secretary, ICAR said that farmers need to be reached directly for disseminating the promising technologies so that pressing agricultural issues of this region are addressed in a de�nite time frame.
Dr. J. K. Jena, DDG (Fishery and Animal Sciences), ICAR and Nodal officer of the Meeting remarked that agriculture in Punjab and Haryana states has seen a sea change in the last few decades. While natural resources management remains the top priority inclusion of dairy and �sh components was necessary for improving the returns from the exiting rice-wheat cropping system. Dr. P. C. Sharma Director, ICAR-CSSRI, Member Secretary of the Regional Committee V presented the action taken report of the previous meeting held in 2016. He urged all the stakeholders to play a pro-active role in de�ning the issues and developing the appropriate solutions.
World Soil DaythICAR-CSSRI, Karnal organized World Soil Day on 5 December, 2018 in Habri village of
Kaithal district. The programme was focused on creating awareness among the farmers with regard to importance of maintaining soil health and the use of Soil Health Cards for the balanced fertilizer application. In this programme, the scientists of the institute delivered lectures on strategies for improving the soil fertility, residue management, weed management and integrated management of insect-pest and diseases. The programme was attended by 100 farmers from Habri and nearby villages who shared and discussed their problems and experiences with the scientist. Soil and water samples brought by farmers were collected for preparing the Soil Health Cards.
Sh. O.P. Dhankad Hon'ble minister of Agriculture Govt. of Haryana addessing the delegates
254
Wor
ksho
p, S
emin
ar, T
rain
ing,
Fou
ndat
ion
Day
and
Kis
an M
ela
orga
nise
dA
nnua
l Rep
ort 2
018-
19
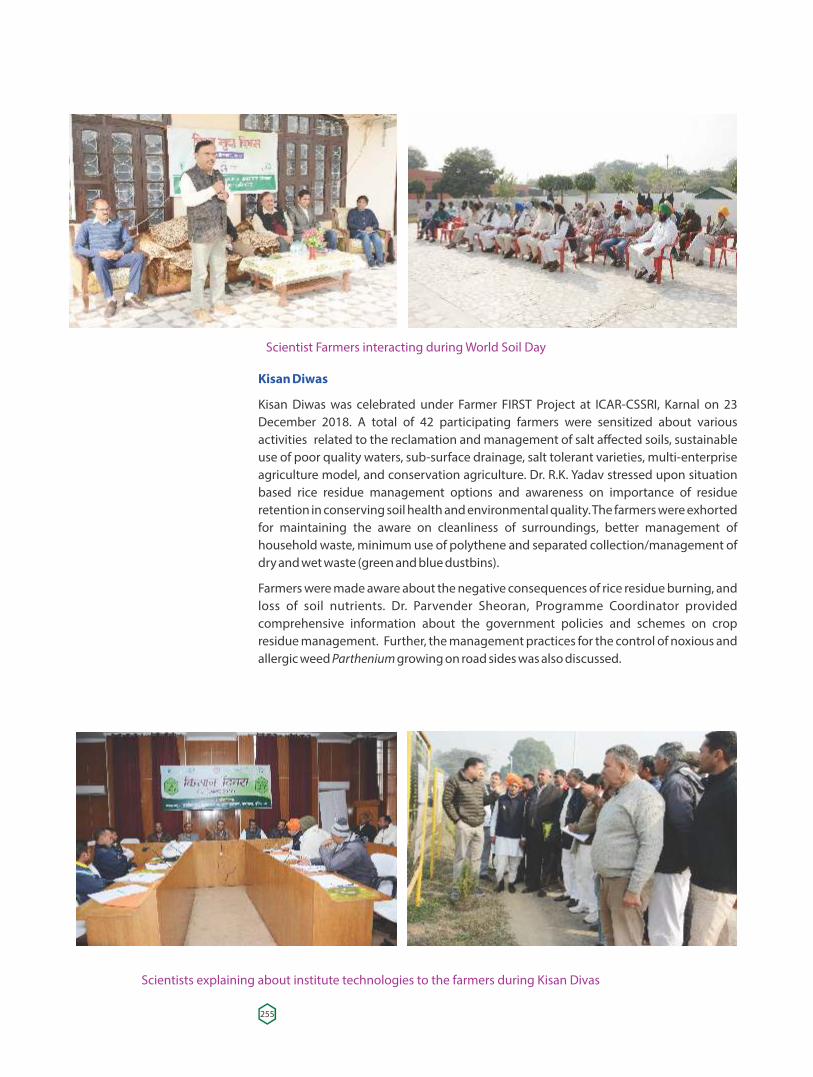
Kisan Diwas
Kisan Diwas was celebrated under Farmer FIRST Project at ICAR-CSSRI, Karnal on 23 December 2018. A total of 42 participating farmers were sensitized about various activities related to the reclamation and management of salt affected soils, sustainable use of poor quality waters, sub-surface drainage, salt tolerant varieties, multi-enterprise agriculture model, and conservation agriculture. Dr. R.K. Yadav stressed upon situation based rice residue management options and awareness on importance of residue retention in conserving soil health and environmental quality. The farmers were exhorted for maintaining the aware on cleanliness of surroundings, better management of household waste, minimum use of polythene and separated collection/management of dry and wet waste (green and blue dustbins).
Farmers were made aware about the negative consequences of rice residue burning, and loss of soil nutrients. Dr. Parvender Sheoran, Programme Coordinator provided comprehensive information about the government policies and schemes on crop residue management. Further, the management practices for the control of noxious and allergic weed Parthenium growing on road sides was also discussed.
Scientists explaining about institute technologies to the farmers during Kisan Divas
Scientist Farmers interacting during World Soil Day
255
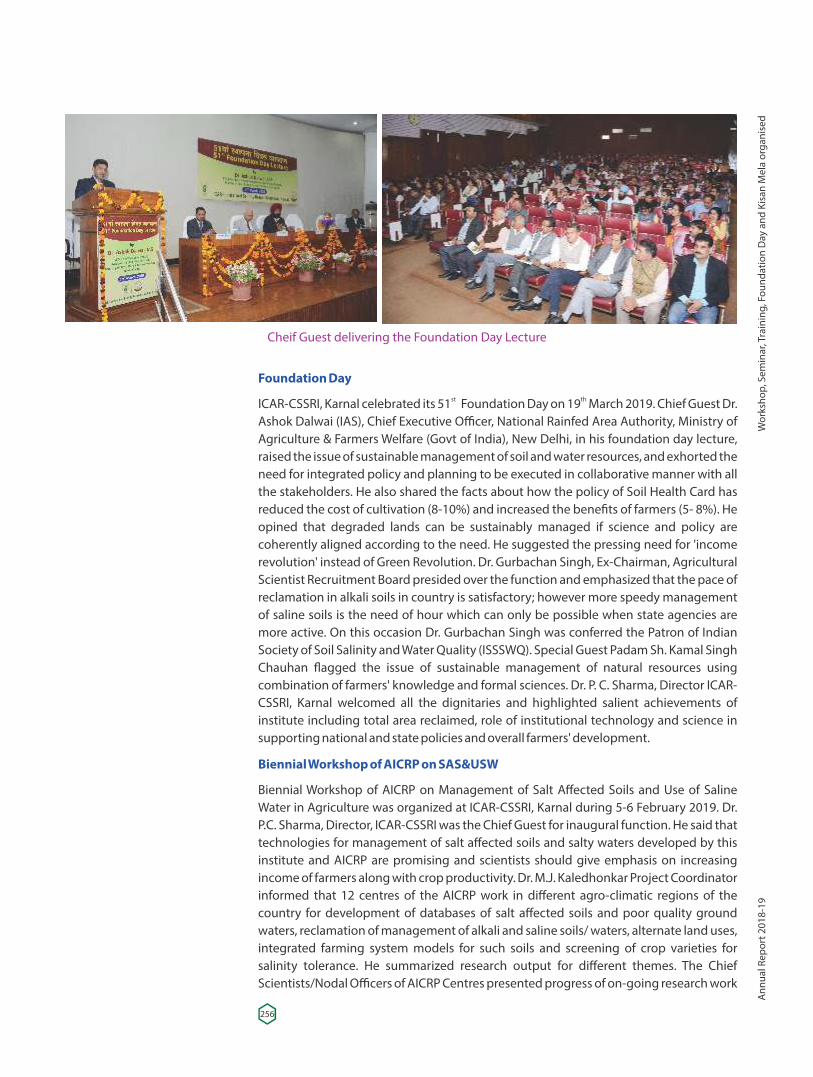
Foundation Dayst thICAR-CSSRI, Karnal celebrated its 51 Foundation Day on 19 March 2019. Chief Guest Dr.
Ashok Dalwai (IAS), Chief Executive Officer, National Rainfed Area Authority, Ministry of Agriculture & Farmers Welfare (Govt of India), New Delhi, in his foundation day lecture, raised the issue of sustainable management of soil and water resources, and exhorted the need for integrated policy and planning to be executed in collaborative manner with all the stakeholders. He also shared the facts about how the policy of Soil Health Card has reduced the cost of cultivation (8-10%) and increased the bene�ts of farmers (5- 8%). He opined that degraded lands can be sustainably managed if science and policy are coherently aligned according to the need. He suggested the pressing need for 'income revolution' instead of Green Revolution. Dr. Gurbachan Singh, Ex-Chairman, Agricultural Scientist Recruitment Board presided over the function and emphasized that the pace of reclamation in alkali soils in country is satisfactory; however more speedy management of saline soils is the need of hour which can only be possible when state agencies are more active. On this occasion Dr. Gurbachan Singh was conferred the Patron of Indian Society of Soil Salinity and Water Quality (ISSSWQ). Special Guest Padam Sh. Kamal Singh Chauhan �agged the issue of sustainable management of natural resources using combination of farmers' knowledge and formal sciences. Dr. P. C. Sharma, Director ICAR-CSSRI, Karnal welcomed all the dignitaries and highlighted salient achievements of institute including total area reclaimed, role of institutional technology and science in supporting national and state policies and overall farmers' development.
Biennial Workshop of AICRP on SAS&USW
Biennial Workshop of AICRP on Management of Salt Affected Soils and Use of Saline Water in Agriculture was organized at ICAR-CSSRI, Karnal during 5-6 February 2019. Dr. P.C. Sharma, Director, ICAR-CSSRI was the Chief Guest for inaugural function. He said that technologies for management of salt affected soils and salty waters developed by this institute and AICRP are promising and scientists should give emphasis on increasing income of farmers along with crop productivity. Dr. M.J. Kaledhonkar Project Coordinator informed that 12 centres of the AICRP work in different agro-climatic regions of the country for development of databases of salt affected soils and poor quality ground waters, reclamation of management of alkali and saline soils/ waters, alternate land uses, integrated farming system models for such soils and screening of crop varieties for salinity tolerance. He summarized research output for different themes. The Chief Scientists/Nodal Officers of AICRP Centres presented progress of on-going research work
Cheif Guest delivering the Foundation Day Lecture
256
Wor
ksho
p, S
emin
ar, T
rain
ing,
Fou
ndat
ion
Day
and
Kis
an M
ela
orga
nise
dA
nnua
l Rep
ort 2
018-
19
and discussed future research programmes during the workshop. Dr. D.K. Sharma, Ex. Director, ICAR-CSSRI and Dr. S.K. Gupta, Former Project Coordinator gave valuable
thcomments as ICAR nominated experts. In concluding session on 6 Feb., 2019. Dr. S.K. Chaudhari, ADG (SWM), Chief Guest appreciated good work done by AICRP centres and advised to work hard to ful�ll farmers' expectations as bene�t cost ratio for management of salt affected soils is relatively higher compared to other degraded soils. Besides, scientists from AICRP centres, heads and scientists from ICAR-CSSRI attended the workshop.
Golden Jubilee International Salinity Conferance
Golden Jubilee International Salinity Conference was held at ICAR-Central Soil Salinity Research Institute, Karnal during 7-9 February 2019. Prof. Ramesh Chand, Hon'ble Member, NITI Aayog delivered the valedictory address. He complimented ICAR-CSSRI for its illustrious journey of �ve decades leading to the productive use of about 2.14 Million ha salt affected area in environmentally harsh conditions. He said that although ICAR-CSSRI continues to be one of the global leaders in agricultural salinity management, its glorious achievements should not lead to complacence; especially at a time when natural resources are shrinking at a rapid rate while food demands are growing and diversifying.. He opined that consistent with the national priorities, all possible efforts should be made for converting the waste into wealth (i.e. conversion of municipal solid wastes into compost) for enhancing soil resilience and crop productivity. He noted that rampant burning of rice residues in the North-Western India is a major concern which needs to be
Biennial Workshop of AICRPon SAS&USW
Dr. Ramesh Chand delivering the valedictory address257
managed by developing doable technologies. He said that integrated farming systems comprising of crop, horticulture, �sh and livestock components could be the keys to enhancing farmers' incomes while ensuring environmental sustainability. Dr. S. K. Chaudhari, ADG (SWM), ICAR, New Delhi opined that ICAR-CSSRI has made outstanding contributions to applied research leading to the huge impact of technologies like gypsum based package and salt tolerant cultivars. Dr. P. C. Sharma, Director, ICAR-CSSRI, Karnal and President, ISSSWQ in his welcome address said that large scale promotion of sub-surface drainage and land shaping technologies, development of multiple stress tolerant crop cultivars and management of sub-surface sodicity and high pH in the reclaimed sodic areas through conservation agriculture based sustainable intensi�cation practices will be the major focus of salinity research in the coming years. Recommendations of different technical sessions of GJISC-2019 were presented and some publications released on this occasion. A total of 275 delegates from 17 countries, CGAIR institutions, ICAR institutes, SAUs, State Line Departments and Farmers participated in this event.
AARDO International Training Programme
AARDO sponsored International training programme on “Use of poor quality water in agriculture” was organized at ICAR-Central Soil Salinity Research Institute, Karnal, India during 07-02-2019 to 20-02-2019. This training programme was attended by the ten participants from countries like Morocco, Tunisia, Zordon, Oman, Malasyia, Taiwan and Srilanka. The training programme started concurrently with International Salinity Conference on 07-02-2019 in which Mr Tomio Shichiri, FAO representative to India was the Chief Guest, while Er. Wass� Hassan El-Sreihin, Secretary General AARDO and Dr. Ismahane Eloua�, Director General ICBA was the Guest of Honour. During initial three days, participant attended the International Salinity Conference in which they were made aware about the global salinization and poor quality water status, issues, technological solutions and possible future directions. After completion of the conference, lectures and technological information on soil salinization mitigation, water quality improvement, agronomic practices for salinity management, Crop improvement approaches, Agroforestry, Horticulture, Sub-surface drainage, Ground water recharge, GSI and Remote sensing, water management including use of sewage and industrial water and bioremediation techniques for management of poor quality water was provided to the participants. Beside this, various �eld visits were also conducted to improve participants’ skill and knowledge on management of poor quality water.
258
Wor
ksho
p, S
emin
ar, T
rain
ing,
Fou
ndat
ion
Day
and
Kis
an M
ela
orga
nise
dA
nnua
l Rep
ort 2
018-
19
Director with AARDO Tranees
Participant’ Feedback at the end of training showed that there was 80-90 % improvement in their skill and knowledge on Use of poor quality water.
National Productivity Week
The ICAR-CSSRI, Karnal celebrated the 'National Productivity Week' during 12-18 February, 2019 with the aim to enhance agricultural productivity by facilitating adoption of appropriate technologies developed by the institute and use of more efficient crop production practices. In this regard, a group of 10 agriculture officers of different state departments of north India and a group of 50 farmers Uttar Pradesh were sensitized on adoption of farming system practices through one day training on February 13, 2019. In this training, aspects like resource conservation, resource recycling, integrated nutrient and pest management, entrepreneurship and cooperative marketing as well as the constraints faced by the farmers were discussed.
Since value creation and improvement in quality of work also fall in the domain of productivity and sustainability, the institute organized a special talk on “Value Creation at
thWork Place” for all the Institute employees on 18 February 2019 by Prof. Radhey Shyam Sharma, ex-Vice Chancellor of Ch. Devi Lal University, Sirsa (Haryana). Prof. Sharma informed that values increase knowledge and understanding and create unity in the country. He emphasized upon identi�cation of suitable Role Models for the society to inculcate good value system among the people. He cited several examples of successful personalities known to him who still adopt the traditional value system inspite of their busy schedule. Prof. Sharma covered the topics like role clarity and self con�dence, integrity and honesty, responsibility and discipline, time and mind management, team work and feedback, etc.Dr. P.C. Sharma, Director of ICAR-CSSRI, Karnal called upon the employees of the Institute to adopt good value system at work place in order to improve organizational efficiency and work output.
Kharif Kisan MelathThe Institute organized Kharif Kisan Mela on 16 March 2019 at Habri village in Kaithal
District of Haryana in which 500 farmers from Habri and adjoining villages (Saanch, Hazwana, Barsana and Sikander Kheri) participated. These villages have been adopted by the Institute under Mera Gaon Mera Gaurav programme. The Mela was inaugurated by Dr. Samar Singh, Regional Director, Uchani Centre of Haryana Agriculture University, Hisar. In his address, Dr. Singh emphasized on conservation of soil and water for
259
A Glimpses of National Productivity Week
environmental safety. He advised the farmers to use balanced fertilizers and green manuers for maintaining soil health and obtaining optimum crop yields. He also urged the farmers to adopt integrated farming system through crop diversi�cation and use of micro-irrigation techniques.
Dr. P.C. Sharma, Director ICAR-CSSRI, Karnal apprised the farmers about the achievements and technologies of CSSRI. He informed that about 2.14 Mha of land area has been reclaimed out of total 6.74 Mha salt affected areas in the country. The reclaimed lands are contributing around 16 million tons of foodgrains to the national food basket. Dr. Sharma urged the farmers to adopt the salt tolerant varieties developed by the Institute for higher yields in salt affected soils. On this occasion, a Kisan Gosthi was also organized in which experts delivered the lectures on control of Phalaris minor weed, management of sodic soil and water, pest control in rice crop and salt tolerant rice and wheat varieties. The Mela witnessed 18 exhibition stalls put up by local pesticide and farm machinery �rms. Farmers' producer organizations displayed their respective products to the visiting farmers. On this occasion ICAR-CSSRI also put up its exhibition stalls and organized free-of-cost on-the-spot testing of soil and water samples. On this occasion, 11 progressive farmers of the area were felicitated.
A view of Kisan Mela
Wor
ksho
p, S
emin
ar, T
rain
ing,
Fou
ndat
ion
Day
and
Kis
an M
ela
orga
nise
dA
nnua
l Rep
ort 2
018-
19
260
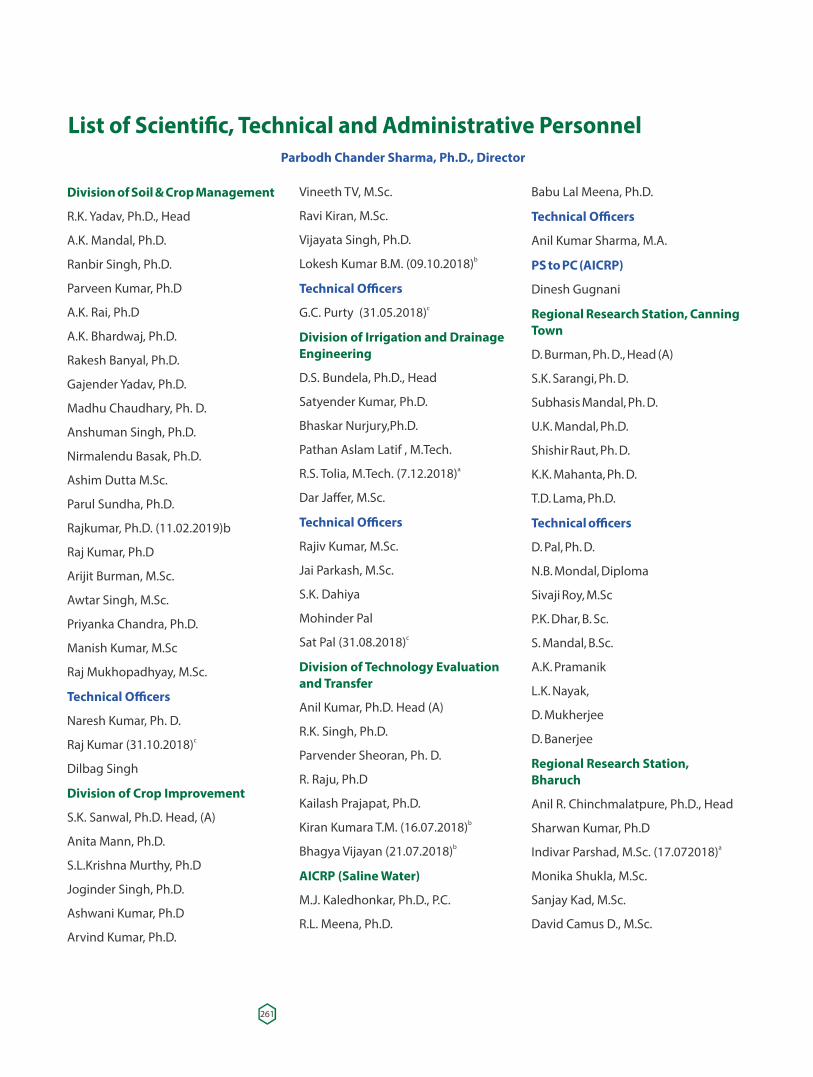
Division of Soil & Crop Management
R.K. Yadav, Ph.D., Head
A.K. Mandal, Ph.D.
Ranbir Singh, Ph.D.
Parveen Kumar, Ph.D
A.K. Rai, Ph.D
A.K. Bhardwaj, Ph.D.
Rakesh Banyal, Ph.D.
Gajender Yadav, Ph.D.
Madhu Chaudhary, Ph. D.
Anshuman Singh, Ph.D.
Nirmalendu Basak, Ph.D.
Ashim Dutta M.Sc.
Parul Sundha, Ph.D.
Rajkumar, Ph.D. (11.02.2019)b
Raj Kumar, Ph.D
Arijit Burman, M.Sc.
Awtar Singh, M.Sc.
Priyanka Chandra, Ph.D.
Manish Kumar, M.Sc
Raj Mukhopadhyay, M.Sc.
Technical Officers
Naresh Kumar, Ph. D. cRaj Kumar (31.10.2018)
Dilbag Singh
Division of Crop Improvement
S.K. Sanwal, Ph.D. Head, (A)
Anita Mann, Ph.D.
S.L.Krishna Murthy, Ph.D
Joginder Singh, Ph.D.
Ashwani Kumar, Ph.D
Arvind Kumar, Ph.D.
Vineeth TV, M.Sc.
Ravi Kiran, M.Sc.
Vijayata Singh, Ph.D. bLokesh Kumar B.M. (09.10.2018)
Technical OfficerscG.C. Purty (31.05.2018)
Division of Irrigation and Drainage Engineering
D.S. Bundela, Ph.D., Head
Satyender Kumar, Ph.D.
Bhaskar Nurjury,Ph.D.
Pathan Aslam Latif , M.Tech.aR.S. Tolia, M.Tech. (7.12.2018)
Dar Jaffer, M.Sc.
Technical Officers
Rajiv Kumar, M.Sc.
Jai Parkash, M.Sc.
S.K. Dahiya
Mohinder PalcSat Pal (31.08.2018)
Division of Technology Evaluation and Transfer
Anil Kumar, Ph.D. Head (A)
R.K. Singh, Ph.D.
Parvender Sheoran, Ph. D.
R. Raju, Ph.D
Kailash Prajapat, Ph.D.bKiran Kumara T.M. (16.07.2018)
bBhagya Vijayan (21.07.2018)
AICRP (Saline Water)
M.J. Kaledhonkar, Ph.D., P.C.
R.L. Meena, Ph.D.
Babu Lal Meena, Ph.D.
Technical Officers
Anil Kumar Sharma, M.A.
PS to PC (AICRP)
Dinesh Gugnani
Regional Research Station, Canning Town
D. Burman, Ph. D., Head (A)
S.K. Sarangi, Ph. D.
Subhasis Mandal, Ph. D.
U.K. Mandal, Ph.D.
Shishir Raut, Ph. D.
K.K. Mahanta, Ph. D.
T.D. Lama, Ph.D.
Technical officers
D. Pal, Ph. D.
N.B. Mondal, Diploma
Sivaji Roy, M.Sc
P.K. Dhar, B. Sc.
S. Mandal, B.Sc.
A.K. Pramanik
L.K. Nayak,
D. Mukherjee
D. Banerjee
Regional Research Station, Bharuch
Anil R. Chinchmalatpure, Ph.D., Head
Sharwan Kumar, Ph.DaIndivar Parshad, M.Sc. (17.072018)
Monika Shukla, M.Sc.
Sanjay Kad, M.Sc.
David Camus D., M.Sc.
List of Scienti�c, Technical and Administrative PersonnelParbodh Chander Sharma, Ph.D., Director
261
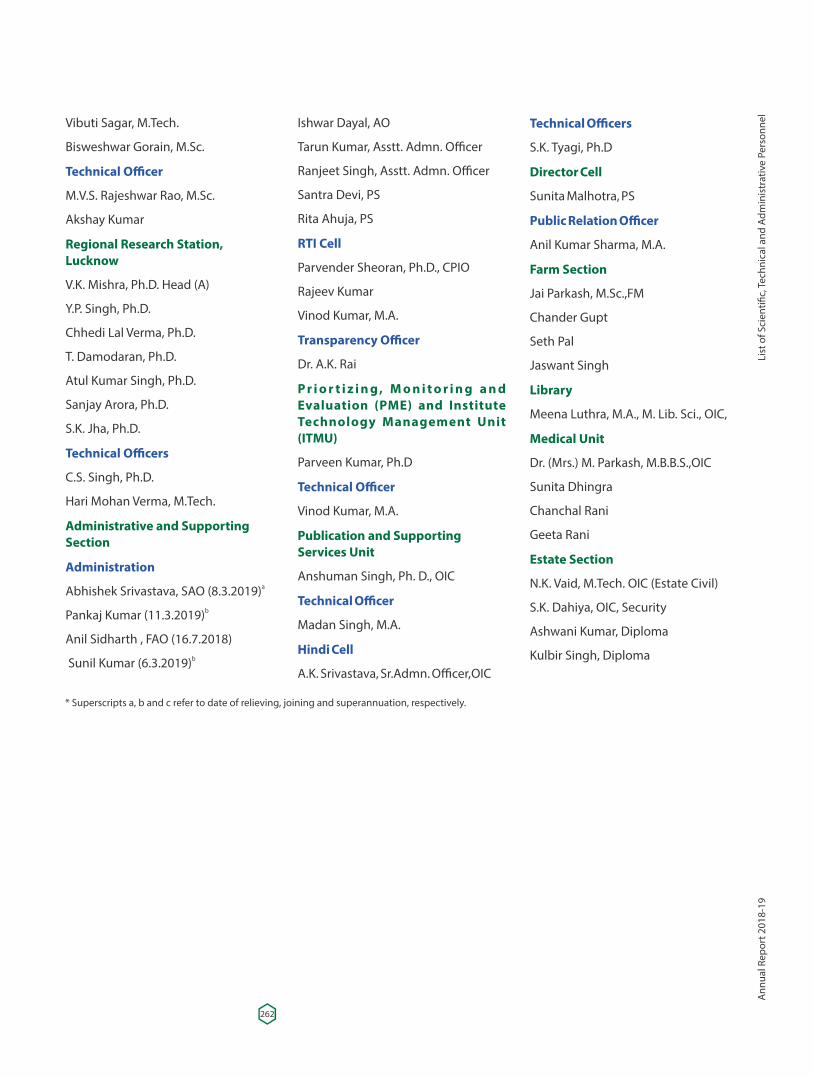
Vibuti Sagar, M.Tech.
Bisweshwar Gorain, M.Sc.
Technical Officer
M.V.S. Rajeshwar Rao, M.Sc.
Akshay Kumar
Regional Research Station, Lucknow
V.K. Mishra, Ph.D. Head (A)
Y.P. Singh, Ph.D.
Chhedi Lal Verma, Ph.D.
T. Damodaran, Ph.D.
Atul Kumar Singh, Ph.D.
Sanjay Arora, Ph.D.
S.K. Jha, Ph.D.
Technical Officers
C.S. Singh, Ph.D.
Hari Mohan Verma, M.Tech.
Administrative and Supporting Section
Administration aAbhishek Srivastava, SAO (8.3.2019)
bPankaj Kumar (11.3.2019)
Anil Sidharth , FAO (16.7.2018) b Sunil Kumar (6.3.2019)
Ishwar Dayal, AO
Tarun Kumar, Asstt. Admn. Officer
Ranjeet Singh, Asstt. Admn. Officer
Santra Devi, PS
Rita Ahuja, PS
RTI Cell
Parvender Sheoran, Ph.D., CPIO
Rajeev Kumar
Vinod Kumar, M.A.
Transparency Officer
Dr. A.K. Rai
P r i o r t i z i n g , M o n i t o r i n g a n d Evaluation (PME) and Institute Technology Management Unit (ITMU)
Parveen Kumar, Ph.D
Technical Officer
Vinod Kumar, M.A.
Publication and Supporting Services Unit
Anshuman Singh, Ph. D., OIC
Technical Officer
Madan Singh, M.A.
Hindi Cell A.K. Srivastava, Sr.Admn. Officer,OIC
Technical Officers
S.K. Tyagi, Ph.D
Director Cell
Sunita Malhotra, PS
Public Relation Officer
Anil Kumar Sharma, M.A.
Farm Section
Jai Parkash, M.Sc.,FM
Chander Gupt
Seth Pal
Jaswant Singh
Library
Meena Luthra, M.A., M. Lib. Sci., OIC,
Medical Unit
Dr. (Mrs.) M. Parkash, M.B.B.S.,OIC
Sunita Dhingra
Chanchal Rani
Geeta Rani
Estate Section
N.K. Vaid, M.Tech. OIC (Estate Civil)
S.K. Dahiya, OIC, Security
Ashwani Kumar, Diploma
Kulbir Singh, Diploma
* Superscripts a, b and c refer to date of relieving, joining and superannuation, respectively.
262
List
of S
cien
ti�c,
Tech
nica
l and
Adm
inis
trat
ive
Pers
onne
lA
nnua
l Rep
ort 2
018-
19
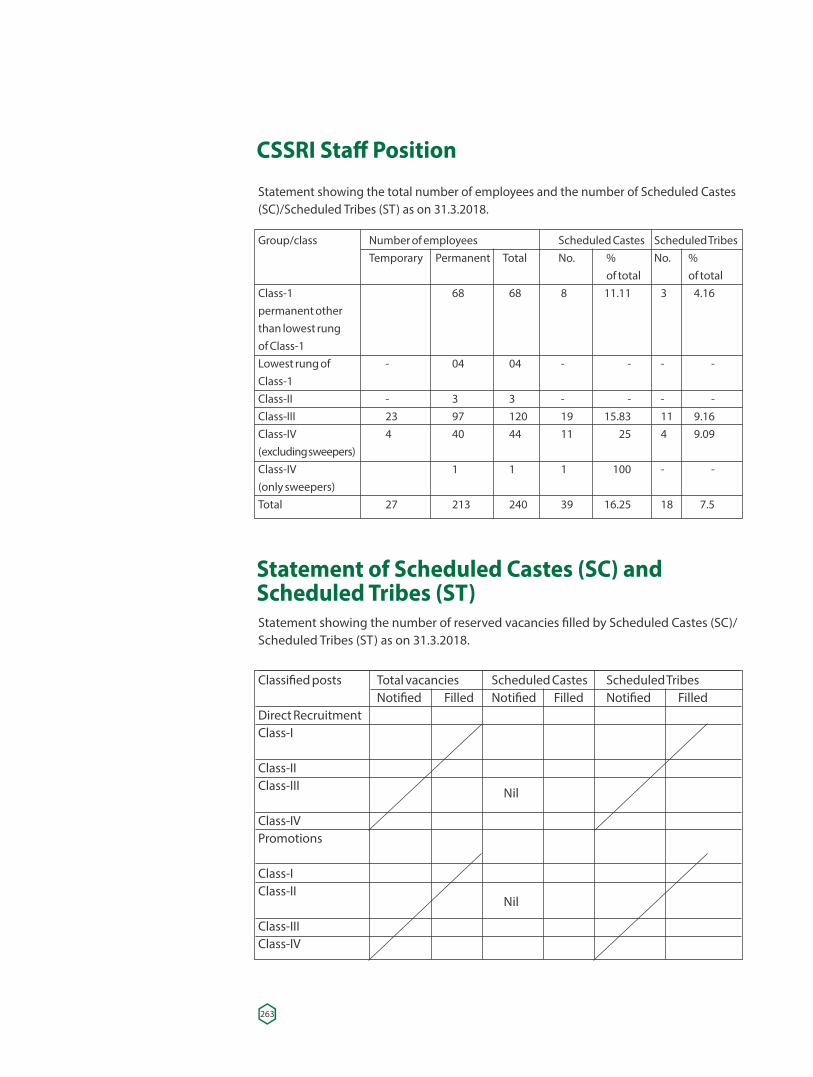
CSSRI Staff Position
Statement showing the total number of employees and the number of Scheduled Castes (SC)/Scheduled Tribes (ST) as on 31.3.2018.
Group/class Number of employees Scheduled Castes Scheduled Tribes Temporary Permanent Total No. % No. % of total of totalClass-1 68 68 8 11.11 3 4.16permanent other than lowest rungof Class-1 Lowest rung of - 04 04 - - - - Class-1 Class-II - 3 3 - - - - Class-III 23 97 120 19 15.83 11 9.16 Class-IV 4 40 44 11 25 4 9.09(excluding sweepers) Class-IV 1 1 1 100 - -(only sweepers) Total 27 213 240 39 16.25 18 7.5
Statement of Scheduled Castes (SC) andScheduled Tribes (ST) Statement showing the number of reserved vacancies �lled by Scheduled Castes (SC)/Scheduled Tribes (ST) as on 31.3.2018.
Classi�ed posts Total vacancies Scheduled Castes Scheduled Tribes Noti�ed Filled Noti�ed Filled Noti�ed FilledDirect RecruitmentClass-I
Class-II Class-III Class-IVPromotions
Class-IClass-II Class-IIIClass-IV
Nil
Nil
263
Weather Report 2018
Main Institute, Karnal
During the year 2018, a total rainfall of 1380.3 mm was recorded at Agro-met Observatory at Karnal as compared to the mean annual rainfall of 738.6 mm (for the last 47 years). The year was anexcess rainfall year (187% of the long-term mean annual rainfall) whereas the year 2017 was a normal rainfall year (107% of the long-term mean annual rainfall). The maximum monthly rainfall of 549.0 mm was recorded during July. During the monsoon season, the highest rainstorm of 142.0mm was recorded on
th th 24 September and the second highest of 130.0 on 6 June. During January and February, there was a good amount of rainfall of 34.2mm and 29.0 mm which substantially met the irrigation demand of Rabi crops leading to bumper Rabi crop growth. There was no winter rainfall (March) as compared to the last year winter rainfall (7.8 mm). Scantywinter rainfall resulted in increase o�rrigation demands for different Rabi crops during February and March, which were eithermet from canal water or groundwater or both, particularly for wheat crop. There were 59 rainy days as compared to 44 days during the last year.
thThe minimum and maximum air temperatures, 2.2° and 44.2 °C were recorded on 10 thJanuary and 7 May, respectively. The air relative humidity was lowest (5%) on 24th
Maywhile the highest (100%) was recorded on several occasions during the year. The ndhighest soil temperatures at 5, 10 and 20 cm depths were 46.0, 45.0 and 44.0 on 22 May.
The lowest values at same depths were recorded as 6.5, 7.0 and 8.5 °C on 16thJan. (5, 10 and20 cm). The total open pan evaporation during the year was 1523.7 mm, which is more than 1.07%than the annual rainfall. The lowest evaporation of 0.6 mm was
th threcorded on 14 December and the highest of 13.0mm was on 4 June. The average sunshine hours per day were 7.8. The highest and lowest vapour pressure values were
th th28.2 mm 15 August and5.6 mm on 10 January, respectively. The average wind speed was 6.8km per hour. The monthly weather parameters recorded at agro-meteorological observatory, ICAR-CSSRI, Karnal for the year 2018arepresented in Table 1.
Regional Research Station, Bharuach
Agro-meteorological observations (Table 2) recorded at Regional Cotton Research Station, NAU, Bharuch during 2018 revealed that this region received normal rainfall of 680 mm spread over 44 days. Season's highest rainfall 459.7 mm was received during July followed by 124.2 mm, 49.9 mm and 46.4 mm during August, June and September 2018,
o orespectively. Maximum air temperature ranged from 28.6 C (Dec) to 40.1 C (May) and o ominimum air temperature varied from 13.4 C (Dec) to 28.1 C (Jun). Pan evaporation
-1 -1varied from 3.6 mm day during January to 17.0 mm day during May. The average bright sunshine hours varied from 1.8 during July to 9.1 hr/day during May. Mean relative humidity varied from 40 per cent during March to 88 per cent in July. The average wind speed varied from 1.2 kmph during October to 13.4 kmph during June 2018.
Regional Research Station, Canning TownthThe onset of southwest monsoon was on 1st June, 2018. Total annual rainfall of 1598.0
mm recorded by the meteorological unit of this institute during 2018, the maximum of 446.4 mm rainfall and 22 rainy days was recorded in the month of July. Rainfall received in the month of July was signi�cantly higher compared to normal (49 years average rainfall for the month of July is 372 mm), causing �ooding in the rice �elds in the coastal areas of
264
Wea
ther
Rep
ort 2
018
Ann
ual R
epor
t 201
8-19
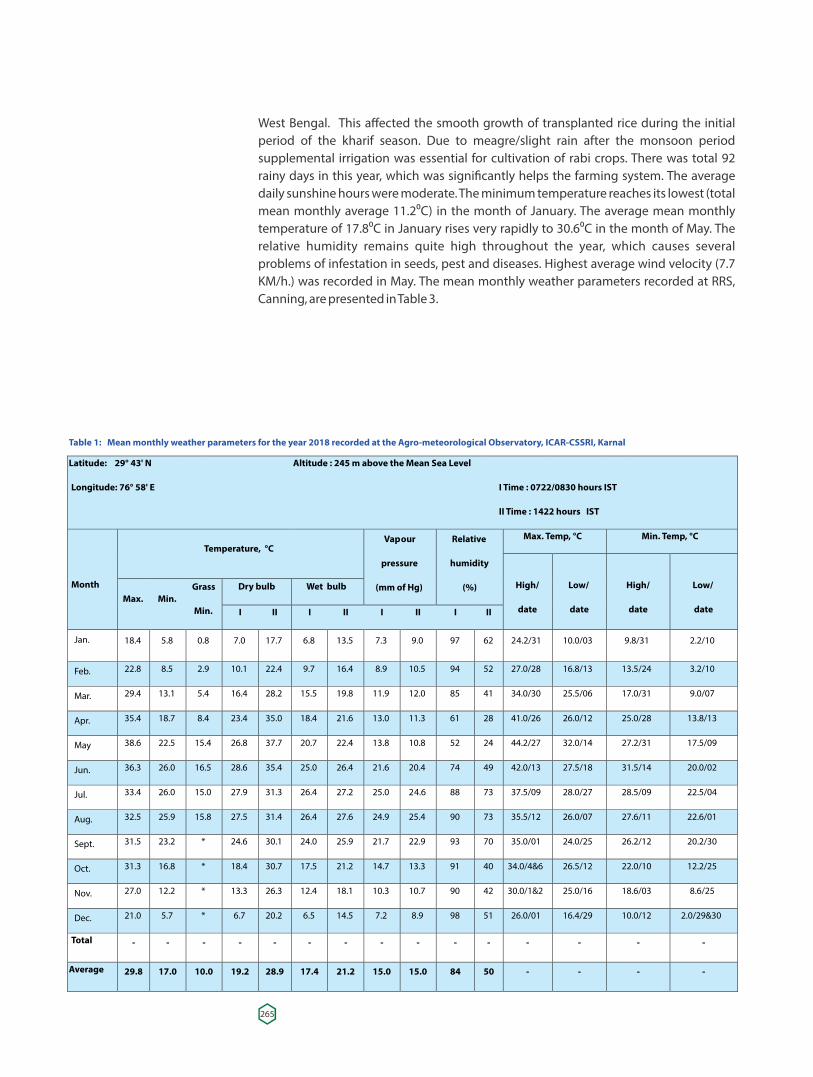
Table 1: Mean monthly weather parameters for the year 2018 recorded at the Agro-meteorological Observatory, ICAR-CSSRI, Karnal
Latitude: 29° 43' N
Longitude: 76° 58' E
Altitude : 245 m above the Mean Sea Level
I Time : 0722/0830 hours IST
II Time : 1422 hours IST
Month
Temperature, °C Vapour
pressure
(mm of Hg)
Relative
humidity
(%)
Max. Temp, °C
Min. Temp, °C
High/
date
Low/
date
High/
date
Low/
dateMax.
Min.
Grass
Min.
Dry bulb
Wet bulb
I
II
I
II
I
II
I
II
Jan. 18.4
5.8
0.8
7.0
17.7
6.8
13.5
7.3
9.0
97
62
24.2/31
10.0/03
9.8/31 2.2/10
Feb. 22.8
8.5
2.9
10.1
22.4
9.7
16.4
8.9
10.5
94
52
27.0/28
16.8/13
13.5/24 3.2/10
Mar. 29.4
13.1
5.4
16.4
28.2
15.5
19.8
11.9
12.0
85
41
34.0/30
25.5/06
17.0/31 9.0/07
Apr. 35.4
18.7
8.4
23.4
35.0
18.4
21.6
13.0
11.3
61
28
41.0/26
26.0/12
25.0/28 13.8/13
May 38.6
22.5
15.4
26.8
37.7
20.7
22.4
13.8
10.8
52
24
44.2/27
32.0/14
27.2/31 17.5/09
Jun. 36.3
26.0
16.5
28.6
35.4
25.0
26.4
21.6
20.4
74
49
42.0/13
27.5/18
31.5/14 20.0/02
Jul. 33.4
26.0
15.0
27.9
31.3
26.4
27.2
25.0
24.6
88
73
37.5/09
28.0/27
28.5/09 22.5/04
Aug. 32.5
25.9
15.8
27.5
31.4
26.4
27.6
24.9
25.4
90
73
35.5/12
26.0/07
27.6/11 22.6/01
Sept. 31.5
23.2
*
24.6
30.1
24.0
25.9
21.7
22.9
93
70
35.0/01
24.0/25
26.2/12 20.2/30
Oct. 31.3
16.8
*
18.4
30.7
17.5
21.2
14.7
13.3
91
40
34.0/4&6
26.5/12
22.0/10 12.2/25
Nov. 27.0 12.2 * 13.3 26.3 12.4 18.1 10.3 10.7 90 42 30.0/1&2 25.0/16 18.6/03 8.6/25
Dec. 21.0 5.7 * 6.7 20.2 6.5 14.5 7.2 8.9 98 51 26.0/01 16.4/29 10.0/12 2.0/29&30
Total - - - - - - - - - - - - - - -
Average 29.8 17.0 10.0 19.2 28.9 17.4 21.2 15.0 15.0 84 50 - - - -
West Bengal. This affected the smooth growth of transplanted rice during the initial period of the kharif season. Due to meagre/slight rain after the monsoon period supplemental irrigation was essential for cultivation of rabi crops. There was total 92 rainy days in this year, which was signi�cantly helps the farming system. The average daily sunshine hours were moderate. The minimum temperature reaches its lowest (total mean monthly average 11.2⁰C) in the month of January. The average mean monthly temperature of 17.8⁰C in January rises very rapidly to 30.6⁰C in the month of May. The relative humidity remains quite high throughout the year, which causes several problems of infestation in seeds, pest and diseases. Highest average wind velocity (7.7 KM/h.) was recorded in May. The mean monthly weather parameters recorded at RRS, Canning, are presented in Table 3.
265
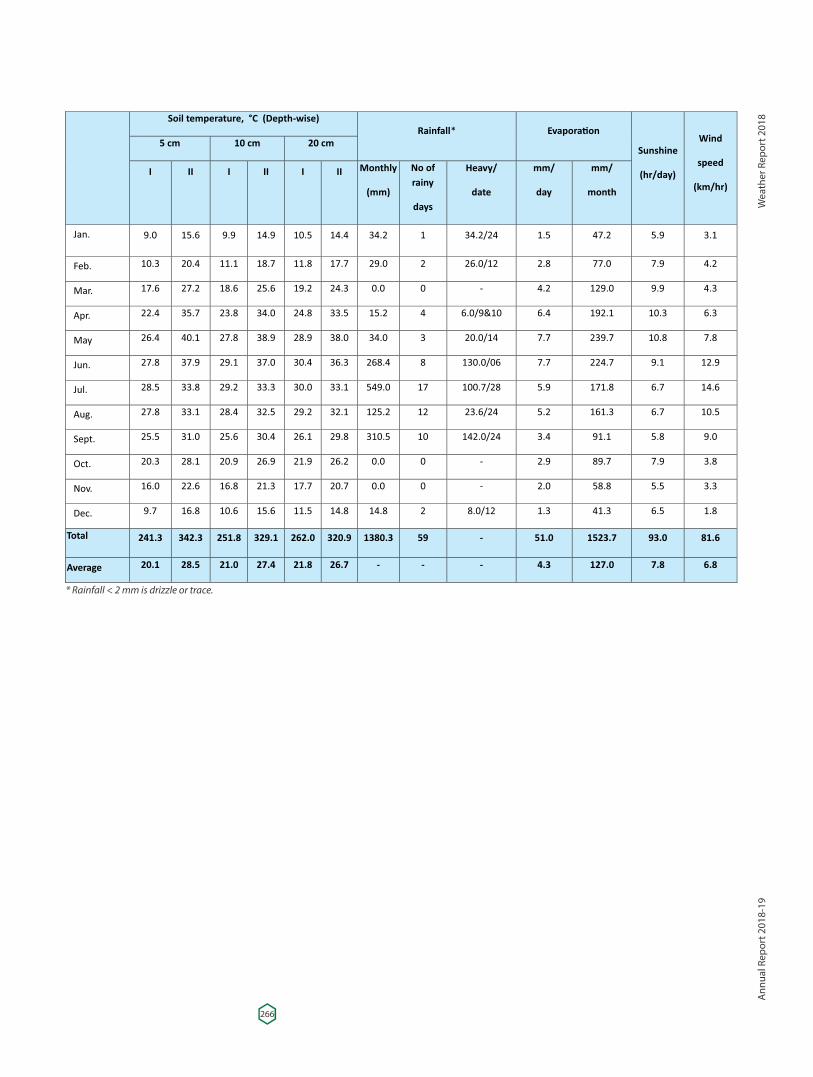
Month
Soil temperature, °C (Depth-wise)Rainfall* Evapora�on
Sunshine
(hr/day)
Wind
speed
(km/hr)
5 cm 10 cm 20 cm
I II
I
II
I
II
Monthly
(mm)
No of
rainy
days
Heavy/
date
mm/
day
mm/
month
Jan. 9.0 15.6
9.9
14.9
10.5
14.4
34.2
1
34.2/24
1.5
47.2
5.9 3.1
Feb. 10.3 20.4
11.1
18.7
11.8
17.7
29.0
2
26.0/12
2.8
77.0
7.9 4.2
Mar. 17.6 27.2 18.6 25.6 19.2 24.3 0.0 0 - 4.2 129.0 9.9 4.3
Apr. 22.4 35.7
23.8
34.0
24.8
33.5
15.2
4
6.0/9&10
6.4
192.1
10.3 6.3
May 26.4 40.1
27.8
38.9
28.9
38.0
34.0
3
20.0/14
7.7
239.7
10.8 7.8
Jun. 27.8 37.9
29.1
37.0
30.4
36.3
268.4
8
130.0/06
7.7
224.7
9.1 12.9
Jul. 28.5 33.8
29.2
33.3
30.0
33.1
549.0
17
100.7/28
5.9
171.8
6.7 14.6
Aug. 27.8 33.1
28.4
32.5
29.2
32.1
125.2
12
23.6/24
5.2
161.3
6.7 10.5
Sept. 25.5 31.0
25.6
30.4
26.1
29.8
310.5
10
142.0/24
3.4
91.1
5.8 9.0
Oct. 20.3 28.1
20.9
26.9
21.9
26.2
0.0
0
-
2.9
89.7
7.9 3.8
Nov. 16.0 22.6
16.8
21.3
17.7
20.7
0.0
0
-
2.0
58.8
5.5 3.3
Dec. 9.7 16.8 10.6 15.6 11.5 14.8 14.8 2 8.0/12 1.3 41.3 6.5 1.8
Total 241.3 342.3 251.8 329.1 262.0 320.9 1380.3 59 - 51.0 1523.7 93.0 81.6
Average 20.1 28.5 21.0 27.4 21.8 26.7 - - - 4.3 127.0 7.8 6.8
* Rainfall < 2 mm is drizzle or trace.
266
Wea
ther
Rep
ort 2
018
Ann
ual R
epor
t 201
8-19
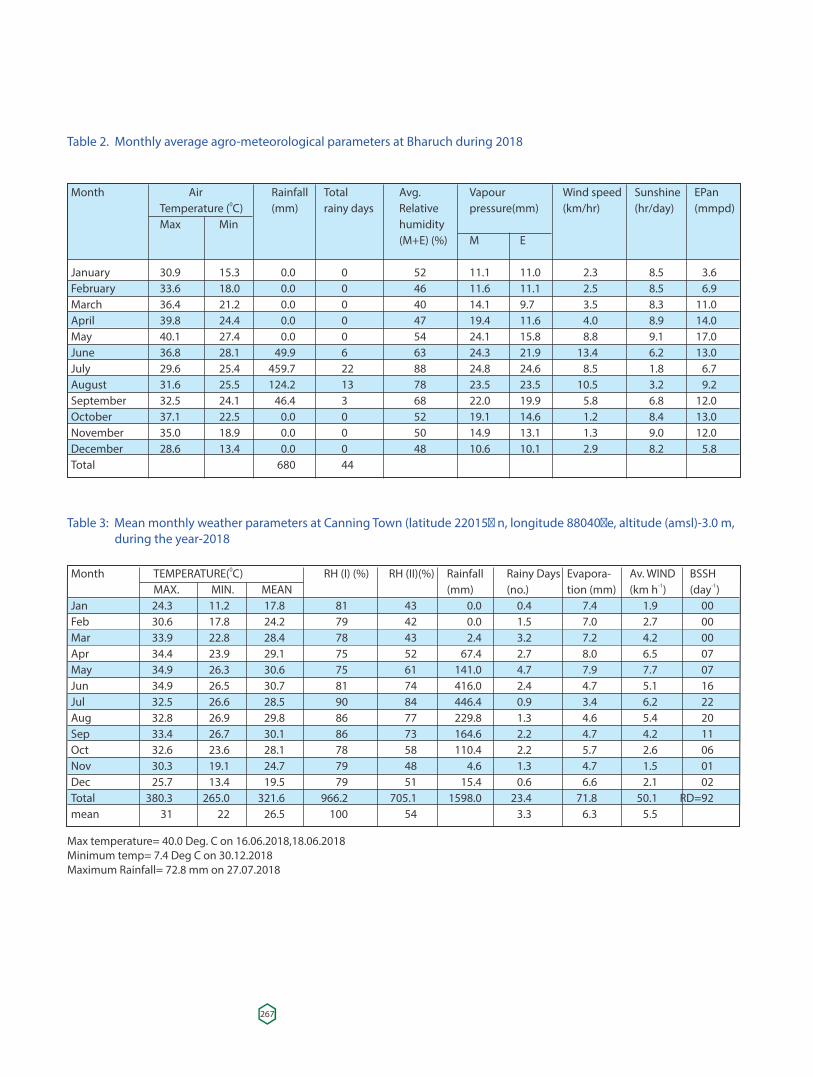
Table 2. Monthly average agro-meteorological parameters at Bharuch during 2018
Month Air Rainfall Total Avg. Vapour Wind speed Sunshine EPan 0 Temperature ( C) (mm) rainy days Relative pressure(mm) (km/hr) (hr/day) (mmpd)
Max Min humidity (M+E) (%) M E January 30.9 15.3 0.0 0 52 11.1 11.0 2.3 8.5 3.6February 33.6 18.0 0.0 0 46 11.6 11.1 2.5 8.5 6.9March 36.4 21.2 0.0 0 40 14.1 9.7 3.5 8.3 11.0April 39.8 24.4 0.0 0 47 19.4 11.6 4.0 8.9 14.0May 40.1 27.4 0.0 0 54 24.1 15.8 8.8 9.1 17.0June 36.8 28.1 49.9 6 63 24.3 21.9 13.4 6.2 13.0July 29.6 25.4 459.7 22 88 24.8 24.6 8.5 1.8 6.7August 31.6 25.5 124.2 13 78 23.5 23.5 10.5 3.2 9.2September 32.5 24.1 46.4 3 68 22.0 19.9 5.8 6.8 12.0October 37.1 22.5 0.0 0 52 19.1 14.6 1.2 8.4 13.0November 35.0 18.9 0.0 0 50 14.9 13.1 1.3 9.0 12.0December 28.6 13.4 0.0 0 48 10.6 10.1 2.9 8.2 5.8Total 680 44
Table 3: Mean monthly weather parameters at Canning Town (latitude 22015� n, longitude 88040�e, altitude (amsl)-3.0 m, during the year-2018
0Month TEMPERATURE( C) RH (I) (%) RH (II)(%) Rainfall Rainy Days Evapora- Av. WIND BSSH-1 -1 MAX. MIN. MEAN (mm) (no.) tion (mm) (km h ) (day )
Jan 24.3 11.2 17.8 81 43 0.0 0.4 7.4 1.9 00Feb 30.6 17.8 24.2 79 42 0.0 1.5 7.0 2.7 00Mar 33.9 22.8 28.4 78 43 2.4 3.2 7.2 4.2 00Apr 34.4 23.9 29.1 75 52 67.4 2.7 8.0 6.5 07May 34.9 26.3 30.6 75 61 141.0 4.7 7.9 7.7 07Jun 34.9 26.5 30.7 81 74 416.0 2.4 4.7 5.1 16Jul 32.5 26.6 28.5 90 84 446.4 0.9 3.4 6.2 22Aug 32.8 26.9 29.8 86 77 229.8 1.3 4.6 5.4 20Sep 33.4 26.7 30.1 86 73 164.6 2.2 4.7 4.2 11Oct 32.6 23.6 28.1 78 58 110.4 2.2 5.7 2.6 06Nov 30.3 19.1 24.7 79 48 4.6 1.3 4.7 1.5 01Dec 25.7 13.4 19.5 79 51 15.4 0.6 6.6 2.1 02Total 380.3 265.0 321.6 966.2 705.1 1598.0 23.4 71.8 50.1 RD=92mean 31 22 26.5 100 54 3.3 6.3 5.5
Max temperature= 40.0 Deg. C on 16.06.2018,18.06.2018Minimum temp= 7.4 Deg C on 30.12.2018Maximum Rainfall= 72.8 mm on 27.07.2018
267